shortages related to the gulf coast hurricanes (see the chart on page 28). To address fluctuating resin prices, we have pass-through or cost-sharing agreements covering about 65% of our sales, but many have a 90-day lag. We have implemented price increases for customers that are currently not subject to pass-through arrangements. Most new customer contracts contain resin pass-through arrangements.
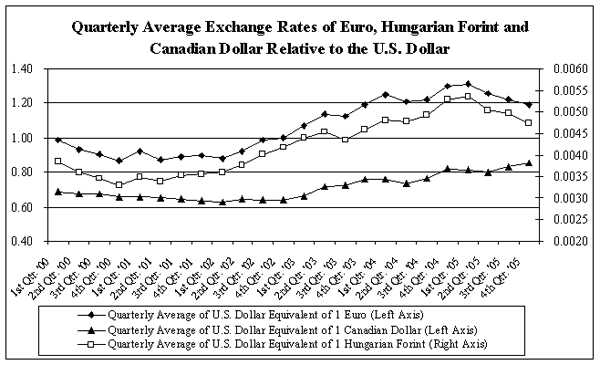
Identifiable assets in Film Products increased to $472.8 million at December 31, 2004, from $422.3 million at December 31, 2003, due primarily to capital expenditures in excess of depreciation of $22.9 million (see the depreciation, amortization and capital expenditures section below for more information), higher accounts receivable and inventories supporting higher sales and appreciation of the Euro and Hungarian Forint relative to the U.S. Dollar.
Capital expenditures in Film Products in 2005 totaled $50.5 million and reflect the normal replacement of machinery and equipment and:
Capital expenditures in Film Products in 2004 totaled $44.8 million and reflect the normal replacement of machinery and equipment and:
See the executive summary beginning on page 16 for further discussion of historical and projected capital expenditures (including information on related capital indemnification, take-or-pay or similar arrangements) for Film Products.
Aluminum Extrusions
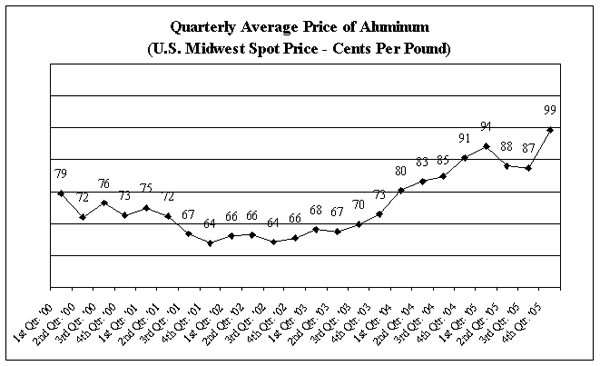
Net Sales and Operating Profit. Net sales in Aluminum Extrusions were $471.7 million in 2005, up 11% from $425.1 million in 2004 primarily due to higher selling prices driven by higher raw material and energy costs. Annual volume increased to 246.4 million pounds in 2005 from 243.4 million pounds in 2004, as stronger shipments in commercial construction and hurricane protection products were offset by lower shipments in other end markets (see our market segments in the table on page 2). Operating profit from ongoing operations declined 15% to $19.3 million in 2005 from $22.6 million in 2004 due mainly to higher energy costs (approximately $7 million) and strength of the Canadian Dollar (about $3.5 million), partially offset by price increases, higher volume and an energy surcharge.
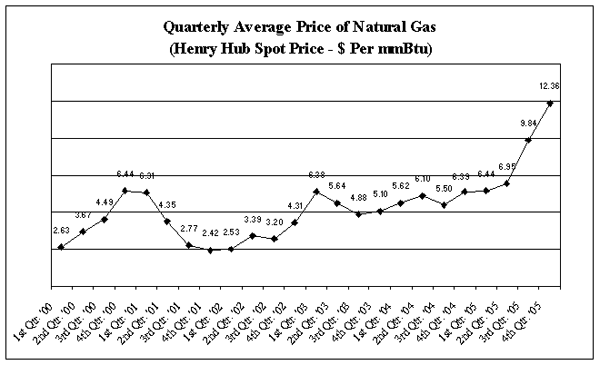
The average costs for natural gas (the principal energy source used to operate our casting furnaces), electricity and diesel fuel were significantly higher in 2005 compared with 2004 (see the natural gas price chart on page 29). For every $1 per mmBtu change in the price of natural gas, the company expects a corresponding operating profit impact in Aluminum Extrusions of approximately $150,000 per month.
During 2005, we announced price increases in April and September. In September 2005, we also announced an energy surcharge in the U.S. to be applied when the previous quarter’s NYMEX natural gas average settlement price is in excess of $8.85 per mmBtu.
Profit growth in 2006 is expected to be driven by focusing on improving volume for the company’s operations in Canada, higher volume anticipated from hurricane-related rebuilding, price increases, the energy surcharge and cost reductions from productivity enhancements.
Net sales in Aluminum Extrusions increased by 20% in 2004 compared with 2003 primarily due to higher raw material-driven selling prices and higher volume. Annual volume was 243.4 million pounds in 2004 compared with 228.2 million pounds in 2003. Operating profit from ongoing operations increased to $22.6 million in 2004 from $15.1 million in 2003. The $7.5 million or 50% increase in operating profit on 6.7% volume growth was primarily due to operating leverage and pricing improvements, partially offset by the adverse effects of appreciation of the Canadian Dollar (about $2.4 million). Volume in 2004 was up in most markets after declining by about 30% from the last cyclical peak around 1999. Volume in our largest market, commercial construction, improved by about 13% in 2004 compared with 2003. Historically, cyclical upturns in the aluminum extrusions industry last several years with overall cross-cycle volume growth in the 3% range.
Identifiable Assets. Identifiable assets in Aluminum Extrusions increased to $214.4 million at December 31, 2005, from $210.9 million at December 31, 2004, due primarily to higher accounts receivable. See discussion regarding assets on page 24 for further information.
Identifiable assets in Aluminum Extrusions increased to $210.9 million at December 31, 2004, from $185.3 million at December 31, 2003, due primarily to higher accounts receivable and inventories supporting higher sales and appreciation of the Canadian Dollar relative to the U.S. Dollar.
Depreciation, Amortization and Capital Expenditures. Depreciation and amortization for Aluminum Extrusions was $11.5 million in 2005, $10.9 million in 2004 and $10.9 million in 2003. The increase in 2005 is primarily due to the start of depreciation of capital expenditures associated with moving and upgrading the largest extrusions press at the facility shut down in Aurora, Ontario to the plant in Pickering, Ontario, and enlargement of the Pickering facility. We expect depreciation and amortization expense for Aluminum Extrusions to increase to about $12 million in 2006.
Capital expenditures totaled $12.0 million in 2005, $10 million in 2004 and $8.3 million in 2003, and reflect the normal replacement of machinery and equipment plus capital expenditures associated with the plant in Pickering, Ontario described above. Capital expenditures are expected to be approximately $10 million in 2006.
33
On November 21, 2003, we announced the acquisition of Apolo Tool and Die Manufacturing Inc. (“Apolo”) of Woodbridge, Ontario. The purchase price consisted of cash consideration of $1.6 million (including transaction costs of $110,000 and net cash acquired of $343,000). Apolo’s key capabilities include bending, CNC machining, drilling, mitering, punching, riveting, sawing and welding of aluminum extrusions and other materials. The company also has in-house tool and die design and manufacturing capability to support its fabrication services.
AFBS
On June 30, 2005, substantially all of the assets of AFBS, Inc. (formerly known as Therics, Inc.), a wholly-owned subsidiary of Tredegar, were sold or assigned to a newly-created limited liability company, Therics, LLC, controlled and managed by an individual not affiliated with Tredegar. AFBS received a 17.5% equity interest in Therics, LLC, valued at $170,000 and a 3.5% interest in Theken Spine, LLC, valued at $800,000, along with potential future payments based on the sale of certain products by Therics, LLC. AFBS retained substantially all of its liabilities in the transaction, which included customary indemnification provisions for pre-transaction liabilities. Tredegar has no obligation or intent to fund any future losses that may occur at Therics, LLC or Theken Spine, LLC. The ownership interest in Therics, LLC is accounted for under the equity method of accounting with losses limited to its initial carrying value of $170,000. The ownership interest in Theken Spine, LLC is accounted for under the cost method, with an impairment loss recognized and a new cost basis established for any write-down to estimated fair value, if necessary. The potential future payments due from Therics, LLC based on the sale of certain products will be recognized as income when earned. AFBS had operating losses of $3.5 million during the first six months of 2005 and $9.8 million in 2004.
Molecumetics
Operations at Molecumetics, a healthcare-related biotech company, ceased on July 2, 2002, and results have been reported as discontinued operations. Discontinued operations in 2003 include a gain from the sale of intellectual property of $1.4 million ($891,000 after taxes). Cash flows relating to Molecumetics have not been separately disclosed in the consolidated statements of cash flows.
Venture Capital Investment Activities
On March 7, 2003, Tredegar Investments reached definitive agreements to sell substantially all of its portfolio of private equity partnership interests to GS Vintage Funds II, which are investment partnerships managed by Goldman Sachs Asset Management’s Private Equity Group. On the same date and in a separate transaction, Tredegar Investments also agreed to sell to W Capital Partners, an independent private equity manager, the subsidiary funds that hold substantially all of Tredegar Investments’ direct venture capital investments. The sale of these fund interests included the assumption by the buyer of Tredegar Investments’ obligations to make additional capital contributions to those funds in the future.
The sale to W Capital Partners of the subsidiary funds that hold the direct investments occurred on March 7, 2003. The sale of the private equity fund interests occurred in a series of closings.
Net proceeds from the sales totaled approximately $21.5 million. Additionally, in the first quarter of 2004 we received income tax recoveries of approximately $55 million from the carry-back of 2003 capital losses generated by these sales against gains realized in 2000 by Tredegar Investments.
�� The agreements governing these transactions contain customary contingent indemnification provisions that Tredegar believes will not have a material effect on its financial position or results of operations.
34
The operating results from venture capital investment activities have been reported as discontinued operations. Cash flows from venture capital investment activities have not been separately disclosed in the consolidated statements of cash flows. A summary of venture capital investment activities through disposal in 2003 is provided below:
| | | | |
|
(In Thousands) | | 2003 | |
|
Carrying value of venture capital investments, beginning of period | | $ | 93,765 | |
Venture capital investment activity for period: | | | | |
(pre-tax amounts): | | | | |
New investments | | | 2,807 | |
Proceeds from the sale of investments, including broker receivables at end of period | | | (21,504 | ) |
Realized gains | | | — | |
Realized losses, write-offs and write-downs | | | (70,256 | ) |
(Decrease) increase in unrealized gain on available-for-sale securities | | | (917 | ) |
Carrying value of public securities retained by Tredegar Investments* | | | (3,895 | ) |
|
Carrying value of venture capital investments, end of period | | $ | — | |
|
Summary of amounts reported as discontinued operations in the consolidated statements of income: | | | | |
Pretax gains (losses), net | | $ | (70,256 | ) |
Operating expenses (primarily management fee expenses) | | | (599 | ) |
|
Loss before income taxes | | | (70,855 | ) |
Income tax benefits | | | 24,286 | |
|
Loss from venture capital investment activities | | $ | (46,569 | ) |
|
| |
* | At December 31,2003, Tredegar Investments held 596,492 shares of Vascular Solutions, Inc. (NASDAQ: VASC) and 265,955 shares of Illumina, Inc. (NASDAQ: ILMN). These securities, which were related to Tredegar Investments' earlier venture capital investment activities, were sold in 2004 for $7.2 million, including gains recognized of $6.1 million ($4 million after taxes). |
Discontinued operations in 2004 include an after-tax gain associated with venture capital investment activities of $2.9 million primarily related to the reversal of business and occupancy tax contingency accruals upon favorable resolution.
| |
Item 7A. | QUANTITATIVE AND QUALITATIVE DISCLOSURES ABOUT MARKET RISK |
See discussion of quantitative and qualitative disclosures about market risk beginning on page 28 in Management’s Discussion and Analysis.
| |
Item 8. | FINANCIAL STATEMENTS AND SUPPLEMENTARY DATA |
See the index on page 39 for references to management’s report on internal control over financial reporting, report of the independent registered public accounting firm, the consolidated financial statements and selected quarterly financial data.
| |
Item 9. | CHANGES IN AND DISAGREEMENTS WITH ACCOUNTANTS ON ACCOUNTING AND FINANCIAL DISCLOSURE |
None.
35
| |
Item 9A. | CONTROLS AND PROCEDURES |
Evaluation of Disclosure Controls and Procedures
Pursuant to Rule 13a-15(b) under the Securities Exchange Act of 1934, we carried out an evaluation, with the participation of our management, including our principal executive officer and principal financial officer, of the effectiveness of our disclosure controls and procedures (as defined under Rule 13a-15(e) under the Securities Exchange Act of 1934) as of the end of the period covered by this report. Based upon that evaluation, our principal executive officer and principal financial officer concluded that our disclosure controls and procedures are effective to ensure that information required to be disclosed by us in the reports that we file or submit under the Exchange Act, is recorded, processed, summarized and reported, within the time periods specified in the SEC’s rules and forms, and that such information is accumulated and communicated to our management, including our principal executive officer and principal financial officer, as appropriate, to allow timely decisions regarding required disclosure.
There has been no change in our internal control over financial reporting during the quarter ended December 31, 2005, that has materially affected, or is reasonably likely to materially affect, our internal control over financial reporting.
Management’s Report on Internal Control Over Financial Reporting
Our management is responsible for establishing and maintaining adequate internal control over financial reporting, as such term is defined in Exchange Act Rule 13a-15(f) under the Securities Exchange Act of 1934, as amended. The Company’s internal control over financial reporting is designed to provide reasonable assurance to the Company’s management and board of directors regarding the reliability of financial reporting and the preparation and fair presentation of published financial statements in accordance with generally accepted accounting principles in the United States of America and includes policies and procedures that:
| |
• | Pertain to the maintenance of records that, in reasonable detail, accurately and fairly reflect the transactions and dispositions of our assets; |
| |
• | Provide reasonable assurance that transactions are recorded as necessary to permit preparation of financial statements in accordance with generally accepted accounting principles in the United States of America, and that our receipts and expenditures are being made only in accordance with authorization of our management and directors; and |
| |
• | Provide reasonable assurance regarding prevention or timely detection of unauthorized acquisition, use or disposition of our assets that could have a material effect on the consolidated financial statements. |
Internal control over financial reporting includes the controls themselves, monitoring (including internal auditing practices) and actions taken to correct deficiencies as identified.
Because of its inherent limitations, internal control over financial reporting may not prevent or detect misstatements. Also, projections of any evaluation of effectiveness to future periods are subject to the risk that controls may become inadequate because of changes in conditions, or that the degree of compliance with the policies or procedures may deteriorate.
Management conducted an evaluation of the effectiveness of our internal control over financial reporting based on the framework inInternal Control - Integrated Framework issued by the Committee of Sponsoring Organizations of the Treadway Commission. Based on their evaluation under the framework inInternal Control — Integrated Framework, our management concluded that our internal control over financial reporting was effective as of December 31, 2005.
Our management’s assessment of the effectiveness of our internal control over financial reporting as of December 31, 2005, has been audited by PricewaterhouseCoopers LLP, an independent registered public accounting firm, as stated in their report which is included on pages 39-40.
36
| |
Item 9B. | OTHER INFORMATION |
None.
PART III
| |
Item 10. | DIRECTORS AND EXECUTIVE OFFICERS OF TREDEGAR |
The information concerning directors and persons nominated to become directors of Tredegar included in the Proxy Statement under the heading “Election of Directors” is incorporated herein by reference.
The information included in the Proxy Statement under the heading “Stock Ownership” and the subheading “Audit Committee Matters” (under the “Board Committees” heading) is incorporated herein by reference.
Set forth below are the names, ages and titles of our executive officers:
| | |
Name | Age | Title |
|
|
|
John D. Gottwald | 51 | President and Chief Executive Officer effective March 1, 2006 |
| | |
Norman A. Scher | 68 | President and Chief Executive Officer until March 1, 2006 |
| | |
Nancy M. Taylor | 46 | President, Tredegar Film Products and Corporate Senior Vice President |
| | |
Tammy H. Cummings | 42 | Vice President, Human Resources |
| | |
D. Andrew Edwards | 47 | Vice President, Chief Financial Officer and Treasurer |
| | |
Larry J. Scott | 55 | Vice President, Audit |
| | |
W. Hildebrandt Surgner, Jr. | 40 | Vice President, General Counsel and Corporate Secretary |
John D. Gottwald. On January 16, 2006, Mr. Gottwald was elected President and Chief Executive Officer effective March 1, 2006. Mr. Gottwald had served as Chairman of the Board of Directors since September 10, 2001. Mr. Gottwald served as President and Chief Executive Officer from July 10, 1989 until September 10, 2001.
Norman A. Scher. On March 1, 2006, Mr. Scher retired as President and Chief Executive Officer and became Vice Chairman of the Board of Directors. He continues to serve on the Executive Committee of the Board of Directors. Mr. Scher will remain an employee (non-executive) and assist with special projects throughout 2006. Mr. Scher had served as President and Chief Executive Officer since September 10, 2001. Mr. Scher served as Executive Vice President and Chief Financial Officer from July 10, 1989 until September 10, 2001. From July 10, 1989 until May 22, 1997, he also served as Treasurer.
Nancy M. Taylor. Ms. Taylor was elected President of Tredegar Film Products effective April 5, 2005. She was elected Senior Vice President effective November 1, 2004. Ms. Taylor served as Senior Vice President, Strategy and Special Projects from November 1, 2004 until April 5, 2005. Ms. Taylor served as Managing Director, European Operations, of Tredegar Film Products from January 1, 2003 until November 1, 2004. Ms. Taylor served as Vice President, Administration and Corporate Development from September 10, 2001 until February 12, 2003. Ms. Taylor served as Secretary from February 24, 1994 until February 12, 2003. She served as Vice President, Law, from November 18, 1998 until September 10, 2001, and served as General Counsel from May 22, 1997 until July 25, 2000.
Tammy H. Cummings.Ms. Cummings was elected Vice President, Human Resources, on August 28, 2003. Ms. Cummings served as Director of Human Resources from June 1, 2002 until August 28, 2003. Prior to her employment with Tredegar, she served as Vice President, Human Resources/Organization Development for Luck Stone Corporation from 1998 until 2002 and served as Human Resources Director of Luck Stone Corporation from 1996 until 1998.
37
D. Andrew Edwards. Mr. Edwards was elected Vice President, Chief Financial Officer and Treasurer on August 28, 2003. Mr. Edwards has served as Vice President, Finance since November 18, 1998. Mr. Edwards has served as Treasurer since May 22, 1997. From October 19, 1992 until July 10, 2000, Mr. Edwards served as Controller.
Larry J. Scott. Mr. Scott was elected Vice President, Audit, on May 24, 2000. Mr. Scott served as Director of Internal Audit from February 24, 1994 until May 24, 2000.
W. Hildebrandt Surgner, Jr.Mr. Surgner was elected Corporate Secretary on February 12, 2003. He was elected Vice President and General Counsel on December 16, 2002. Prior to his employment with Tredegar, he served as Senior Counsel to Philip Morris U.S.A. in 2002 and served as Counsel to Philip Morris U.S.A. from 1999 until 2001. In this capacity, Mr. Surgner was employed by Philip Morris Management Corporation. He was an Associate at the law firm of Hunton & Williams LLP from 1994 until 1999.
We have adopted a Code of Conduct that applies to all of our directors, officers and employees (including our Chief Executive Officer, Chief Financial Officer and principal accounting officer) and have posted the Code of Conduct on our web site. We intend to satisfy the disclosure requirement under Item 10 of Form 8-K relating to amendments to or waivers from any provision of our Code of Conduct applicable to Chief Executive Officer, Chief Financial Officer and principal accounting officer by posting this information on our website. Our Internet address iswww.tredegar.com.The information on our website is not, and shall not be deemed to be, a part of this report or incorporated into other filings we make with the SEC.
Because our common stock is listed on the NYSE, our chief executive officer is required to make, and he has made, an annual certification to the NYSE stating that he was not aware of any violation by us of the corporate governance listing standards of the NYSE. Our chief executive officer made his annual certification to that effect to the NYSE as of May 17, 2005. In addition, we have filed, as exhibits to this Annual Report on Form 10-K, the certifications of our principal executive officer and principal financial officer required under Section 302 of the Sarbanes Oxley Act of 2002 to be filed with the SEC regarding the quality of our public disclosure.
The information included in the Proxy Statement under the heading “Section 16(a) Beneficial Ownership Reporting Requirements” is incorporated herein by reference.
| |
Item 11. | EXECUTIVE COMPENSATION |
The information included in the Proxy Statement under the headings “Compensation of Directors” and “Compensation of Executive Officers” is incorporated herein by reference.
| |
Item 12. | SECURITY OWNERSHIP OF CERTAIN BENEFICIAL OWNERS AND MANAGEMENT AND RELATED STOCKHOLDER MATTERS |
The information included in the Proxy Statement under the heading “Stock Ownership” and “Equity Compensation Plan Table” is incorporated herein by reference.
| |
Item 13. | CERTAIN RELATIONSHIPS AND RELATED TRANSACTIONS |
Mr. Thomas G. Slater, Jr., a member of our board of directors, is married to Mr. John D. Gottwald’s sister-in-law and is a partner of the law firm of Hunton & Williams LLP, which provides legal services to Tredegar on a variety of matters.
| |
Item 14. | PRINCIPAL ACCOUNTING FEES AND SERVICES |
The following is incorporated herein by reference:
| |
• | Information on accounting fees and services included in the Proxy Statement under the heading “Audit Fees;” and |
| |
• | Information on the Audit Committee’s procedures for pre-approving certain audit and non-audit services included in the Proxy Statement under the subheading “Audit Committee Matters” (under the “Board Committees” heading). |
38
PART IV
| | | | |
Item 15. | EXHIBITS AND FINANCIAL STATEMENT SCHEDULES |
| | | |
| | (a) | List of documents filed as a part of the report: |
| | | |
| | | (1) | Financial statements: |
Tredegar Corporation
Index to Financial Statements and Supplementary Data
| | | | |
| | | (2) | Financial statement schedules: |
| | | | |
| | | | None. |
| | | | |
| | | (3) | Exhibits: |
| | | | |
| | | | See Exhibit Index on pages 78-79. |
|
REPORT OF INDEPENDENT REGISTERED PUBLIC ACCOUNTING FIRM |
|
To the Board of Directors and Shareholders of
Tredegar Corporation
We have completed integrated audits of Tredegar Corporation’s 2005 and 2004 consolidated financial statements and of its internal control over financial reporting as of December 31, 2005, and an audit of its 2003 consolidated financial statements in accordance with the standards of the Public Company Accounting Oversight Board (United States). Our opinions, based on our audits, are presented below.
Consolidated Financial Statements
In our opinion, the consolidated financial statements listed in the index appearing under Item 15(a)(1) present fairly, in all material respects, the financial position of Tredegar Corporation and its subsidiaries at December 31, 2005 and 2004, and the results of their operations and their cash flows for each of the three years in the period ended December 31, 2005 in conformity with accounting principles generally accepted in the United States of America.
39
These financial statements are the responsibility of the Company’s management. Our responsibility is to express an opinion on these financial statements based on our audits. We conducted our audits of these statements in accordance with the standards of the Public Company Accounting Oversight Board (United States). Those standards require that we plan and perform the audit to obtain reasonable assurance about whether the financial statements are free of material misstatement. An audit of financial statements includes examining, on a test basis, evidence supporting the amounts and disclosures in the financial statements, assessing the accounting principles used and significant estimates made by management, and evaluating the overall financial statement presentation. We believe that our audits provide a reasonable basis for our opinion.
Internal Control Over Financial Reporting
Also, in our opinion, management’s assessment, included in Management’s Report on Internal Control Over Financial Reporting appearing under Item 9A, that the Company maintained effective internal control over financial reporting as of December 31, 2005 based on criteria established inInternal Control – Integrated Framework issued by the Committee of Sponsoring Organizations of the Treadway Commission (COSO), is fairly stated, in all material respects, based on those criteria. Furthermore, in our opinion, the Company maintained, in all material respects, effective internal control over financial reporting as of December 31, 2005 based on criteria established inInternal Control – Integrated Framework issued by the COSO. The Company’s management is responsible for maintaining effective internal control over financial reporting and for its assessment of the effectiveness of internal control over financial reporting. Our responsibility is to express opinions on management’s assessment and on the effectiveness of the Company’s internal control over financial reporting based on our audit. We conducted our audit of internal control over financial reporting in accordance with the standards of the Public Company Accounting Oversight Board (United States). Those standards require that we plan and perform the audit to obtain reasonable assurance about whether effective internal control over financial reporting was maintained in all material respects. An audit of internal control over financial reporting includes obtaining an understanding of internal control over financial reporting, evaluating management’s assessment, testing and evaluating the design and operating effectiveness of internal control, and performing such other procedures as we consider necessary in the circumstances. We believe that our audit provides a reasonable basis for our opinions.
A company’s internal control over financial reporting is a process designed to provide reasonable assurance regarding the reliability of financial reporting and the preparation of financial statements for external purposes in accordance with generally accepted accounting principles. A company’s internal control over financial reporting includes those policies and procedures that (i) pertain to the maintenance of records that, in reasonable detail, accurately and fairly reflect the transactions and dispositions of the assets of the company; (ii) provide reasonable assurance that transactions are recorded as necessary to permit preparation of financial statements in accordance with generally accepted accounting principles, and that receipts and expenditures of the company are being made only in accordance with authorizations of management and directors of the company; and (iii) provide reasonable assurance regarding prevention or timely detection of unauthorized acquisition, use, or disposition of the company’s assets that could have a material effect on the financial statements.
Because of its inherent limitations, internal control over financial reporting may not prevent or detect misstatements. Also, projections of any evaluation of effectiveness to future periods are subject to the risk that controls may become inadequate because of changes in conditions, or that the degree of compliance with the policies or procedures may deteriorate.
PricewaterhouseCoopers LLP
Richmond, Virginia
March 1, 2006
40
|
CONSOLIDATED STATEMENTS OF INCOME |
|
Tredegar Corporation and Subsidiaries |
| | | | | | | | | | |
Years Ended December 31 | | 2005 | | 2004 | | 2003 | |
|
(In Thousands, Except Per-Share Data) | | | | | | | | | | |
| | | | | | | | | | |
Revenues and other: | | | | | | | | | | |
Sales | | $ | 956,969 | | $ | 861,165 | | $ | 738,651 | |
Other income (expense), net | | | (544 | ) | | 15,604 | | | 7,853 | |
|
| | | 956,425 | | | 876,769 | | | 746,504 | |
|
| | | | | | | | | | |
Costs and expenses: | | | | | | | | | | |
Cost of goods sold | | | 810,621 | | | 717,120 | | | 606,242 | |
Freight | | | 24,691 | | | 22,398 | | | 18,557 | |
Selling, general and administrative | | | 64,723 | | | 60,030 | | | 53,341 | |
Research and development | | | 8,982 | | | 15,265 | | | 18,774 | |
Amortization of intangibles | | | 299 | | | 330 | | | 268 | |
Interest | | | 4,573 | | | 3,171 | | | 6,785 | |
Asset impairments and costs associated with exit and disposal activities | | | 16,334 | | | 22,973 | | | 11,426 | |
Unusual items | | | — | | | — | | | 1,067 | |
|
Total | | | 930,223 | | | 841,287 | | | 716,460 | |
|
Income from continuing operations before income taxes | | | 26,202 | | | 35,482 | | | 30,044 | |
Income taxes | | | 9,973 | | | 9,222 | | | 10,717 | |
|
Income from continuing operations | | | 16,229 | | | 26,260 | | | 19,327 | |
|
Discontinued operations: | | | | | | | | | | |
Gain (loss) from venture capital investment activities (including an after-tax gain on a tax-related item of $2,275 in 2004 and an after-tax loss on the sale of the venture capital investment portfolio of $46,269 in 2003) | | | — | | | 2,921 | | | (46,569 | ) |
Income (loss) from operations of Molecumetics | | | — | | | — | | | 891 | |
|
Income (loss) from discontinued operations | | | — | | | 2,921 | | | (45,678 | ) |
|
Net income (loss) | | $ | 16,229 | | $ | 29,181 | | $ | (26,351 | ) |
|
Earnings (loss) per share: | | | | | | | | | | |
Basic: | | | | | | | | | | |
Continuing operations | | $ | .42 | | $ | .69 | | $ | .51 | |
Discontinued operations | | | — | | | .08 | | | (1.20 | ) |
|
Net income (loss) | | $ | .42 | | $ | .77 | | $ | (.69 | ) |
|
| | | | | | | | | | |
Diluted: | | | | | | | | | | |
Continuing operations | | $ | .42 | | $ | .68 | | $ | .50 | |
Discontinued operations | | | — | | | .08 | | | (1.19 | ) |
|
Net income (loss) | | $ | .42 | | $ | .76 | | $ | (.69 | ) |
|
See accompanying notes to financial statements.
41
|
CONSOLIDATED BALANCE SHEETS |
|
Tredegar Corporation and Subsidiaries |
| | | | | | | |
December 31 | | 2005 | | 2004 | |
|
|
|
|
|
|
(In Thousands, Except Share Data) | | | | | | | |
| | | | | | | |
Assets | | | | | | | |
Current assets: | | | | | | | |
Cash and cash equivalents | | $ | 23,434 | | $ | 22,994 | |
Accounts and notes receivable, net of allowance for doubtful accounts and sales returns of $5,423 in 2005 and $5,313 in 2004 | | | 119,330 | | | 117,314 | |
Income taxes recoverable | | | 7,163 | | | — | |
Inventories | | | 62,438 | | | 65,360 | |
Deferred income taxes | | | 7,778 | | | 10,181 | |
Prepaid expenses and other | | | 4,224 | | | 4,689 | |
|
|
|
|
|
|
|
|
Total current assets | | | 224,367 | | | 220,538 | |
|
|
|
|
|
|
|
|
Property, plant and equipment, at cost: | | | | | | | |
Land and land improvements | | | 12,496 | | | 12,637 | |
Buildings | | | 91,400 | | | 90,830 | |
Machinery and equipment | | | 528,821 | | | 518,258 | |
|
|
|
|
|
|
|
|
Total property, plant and equipment | | | 632,717 | | | 621,725 | |
Less accumulated depreciation | | | 309,841 | | | 305,033 | |
|
|
|
|
|
|
|
|
Net property, plant and equipment | | | 322,876 | | | 316,692 | |
Other assets and deferred charges | | | 96,527 | | | 89,261 | |
Goodwill and other intangibles (other intangibles of $712 in 2005 and $1,939 in 2004) | | | 137,988 | | | 142,983 | |
|
|
|
|
|
|
|
|
Total assets | | $ | 781,758 | | $ | 769,474 | |
|
|
|
|
|
|
|
|
| | | | | | | |
Liabilities and Shareholders’ Equity | | | | | | | |
Current liabilities: | | | | | | | |
Accounts payable | | $ | 61,731 | | $ | 63,852 | |
Accrued expenses | | | 36,031 | | | 38,141 | |
Income taxes payable | | | — | | | 1,446 | |
Current portion of long-term debt | | | — | | | 13,125 | |
|
|
|
|
|
|
|
|
Total current liabilities | | | 97,762 | | | 116,564 | |
Long-term debt | | | 113,050 | | | 90,327 | |
Deferred income taxes | | | 74,287 | | | 71,141 | |
Other noncurrent liabilities | | | 11,297 | | | 11,000 | |
|
|
|
|
|
|
|
|
Total liabilities | | | 296,396 | | | 289,032 | |
|
|
|
|
|
|
|
|
Commitments and contingencies (Notes 13 and 16) | | | | | | | |
Shareholders’ equity: | | | | | | | |
Common stock (no par value): | | | | | | | |
Authorized 150,000,000 shares; | | | | | | | |
Issued and outstanding - 38,737,016 shares in 2005 and 38,597,522 in 2004 (including restricted stock) | | | 110,706 | | | 109,450 | |
| | | | | | | |
Common stock held in trust for savings restoration plan (58,156 shares in 2005 and 57,489 in 2004) | | | (1,284 | ) | | (1,274 | ) |
| | | | | | | |
Unearned compensation on restricted stock (109,000 shares in 2005 and
120,000 in 2004) | | | (966 | ) | | (1,402 | ) |
Accumulated other comprehensive income (loss): | | | | | | | |
Unrealized gain on available-for-sale securities | | | 23 | | | — | |
Foreign currency translation adjustment | | | 14,114 | | | 19,562 | |
Gain on derivative financial instruments | | | 776 | | | 884 | |
Minimum pension liability | | | (2,434 | ) | | (1,156 | ) |
Retained earnings | | | 364,427 | | | 354,378 | |
|
|
|
|
|
|
|
|
Total shareholders’ equity | | | 485,362 | | | 480,442 | |
|
|
|
|
|
|
|
|
Total liabilities and shareholders’ equity | | $ | 781,758 | | $ | 769,474 | |
|
|
|
|
|
|
|
|
See accompanying notes to financial statements.
42
|
CONSOLIDATED STATEMENTS OF CASH FLOWS |
|
Tredegar Corporation and Subsidiaries |
| | | | | | | | | | |
Years Ended December 31 | | 2005 | | 2004 | | 2003 | |
|
|
|
|
|
|
|
|
(In Thousands) | | | | | | | | | | |
| | | | | | | | | | |
Cash flows from operating activities: | | | | | | | | | | |
Net income (loss) | | $ | 16,229 | | $ | 29,181 | | $ | (26,351 | ) |
Adjustments for noncash items: | | | | | | | | | | |
Depreciation | | | 38,490 | | | 34,092 | | | 32,354 | |
Amortization of intangibles | | | 299 | | | 330 | | | 268 | |
Deferred income taxes | | | 9,217 | | | 1,947 | | | 37,370 | |
Accrued pension income and postretirement benefits | | | (1,979 | ) | | (3,999 | ) | | (4,812 | ) |
Loss from write-down of investment in Novalux | | | 5,000 | | | — | | | — | |
Loss on venture capital investments | | | — | | | — | | | 70,256 | |
Gain on sale of assets | | | (4,174 | ) | | (7,560 | ) | | (5,155 | ) |
Loss on asset impairments and divestitures | | | 9,378 | | | 13,811 | | | 2,456 | |
Changes in assets and liabilities, net of effects from acquisitions and divestitures: | | | | | | | | | | |
Accounts and notes receivable | | | (3,361 | ) | | (31,711 | ) | | 14,649 | |
Inventories | | | 2,803 | | | (13,962 | ) | | (2,294 | ) |
Income taxes recoverable | | | (12,966 | ) | | 61,538 | | | (48,737 | ) |
Prepaid expenses and other | | | 530 | | | (258 | ) | | (763 | ) |
Accounts payable and accrued expenses | | | (3,590 | ) | | 12,269 | | | 7,801 | |
Other, net | | | (2,173 | ) | | (1,858 | ) | | (661 | ) |
|
|
|
|
|
|
|
|
|
|
|
Net cash provided by operating activities | | | 53,703 | | | 93,820 | | | 76,381 | |
|
|
|
|
|
|
|
|
|
|
|
Cash flows from investing activities: | | | | | | | | | | |
Capital expenditures | | | (62,543 | ) | | (55,651 | ) | | (65,808 | ) |
Acquisitions (net of cash acquired of $343 in 2003) | | | — | | | (1,420 | ) | | (1,579 | ) |
Novalux investment in 2005 and 2004 and venture capital investments in 2003 | | | (1,095 | ) | | (5,000 | ) | | (2,807 | ) |
Proceeds from the sale of venture capital investments | | | — | | | — | | | 21,504 | |
Proceeds from the sale of assets and property disposals | | | 8,018 | | | 10,209 | | | 9,602 | |
Other, net | | | 636 | | | (310 | ) | | 630 | |
|
|
|
|
|
|
|
|
|
|
|
Net cash used in investing activities | | | (54,984 | ) | | (52,172 | ) | | (38,458 | ) |
|
|
|
|
|
|
|
|
|
|
|
Cash flows from financing activities: | | | | | | | | | | |
Dividends paid | | | (6,190 | ) | | (6,154 | ) | | (6,103 | ) |
Debt principal payments and financing costs | | | (147,846 | ) | | (72,750 | ) | | (255,000 | ) |
Borrowings | | | 156,500 | | | 36,573 | | | 135,349 | |
Repurchases of Tredegar common stock | | | — | | | — | | | (5,170 | ) |
Proceeds from exercise of stock options | | | 1,130 | | | 1,871 | | | 1,046 | |
|
|
|
|
|
|
|
|
|
|
|
Net cash provided by (used in) financing activities | | | 3,594 | | | (40,460 | ) | | (129,878 | ) |
|
|
|
|
|
|
|
|
|
|
|
Effect of exchange rate changes on cash | | | (1,873 | ) | | 1,863 | | | 1,970 | |
|
|
|
|
|
|
|
|
|
|
|
Increase (decrease) in cash and cash equivalents | | | 440 | | | 3,051 | | | (89,985 | ) |
| | | | | | | |
Cash and cash equivalents at beginning of period | | | 22,994 | | | 19,943 | | | 109,928 | |
|
|
|
|
|
|
|
|
|
|
|
Cash and cash equivalents at end of period | | $ | 23,434 | | $ | 22,994 | | $ | 19,943 | |
|
|
|
|
|
|
|
|
|
|
|
| | | | | | | |
Supplemental cash flow information: | | | | | | | | | | |
Interest payments (net of amount capitalized) | | $ | 4,388 | | $ | 3,264 | | $ | 6,709 | |
Income tax payments (refunds), net | | $ | 14,915 | | $ | (50,006 | ) | $ | (1,701 | ) |
|
|
|
|
|
|
|
|
|
|
|
See accompanying notes to financial statements.
43
|
CONSOLIDATED STATEMENTS OF SHAREHOLDERS’ EQUITY |
|
Tredegar Corporation and Subsidiaries |
| | | | | | | | | | | | | | | | | | |
| | Common Stock | |
Retained
Earnings
| | Trust for
Savings
Restora-
tion Plan | | Unearned
Restricted
Stock
Compensation | |
| |
| | | | |
| | Shares | | Amount | | | | |
|
|
|
|
|
|
|
|
|
|
|
|
(In Thousands, Except Share and Per-Share Data)
| | | | | | | | | | | | | | | | | | |
Balance December 31, 2002 | | | 38,323,025 | | $ | 108,389 | | $ | 363,743 | | $ | (1,212 | ) | | $ | — | | |
|
|
|
|
|
|
|
|
|
|
|
|
|
|
|
|
|
|
|
Comprehensive income (loss): | | | | | | | | | | | | | | | | | | |
Net loss | | | — | | | — | | | (26,351 | ) | | — | | | | — | | |
Other comprehensive income (loss): | | | | | | | | | | | | | | | | | | |
Available-for-sale securities adjustment, net of reclassification adjustment (net of tax of $1,228) | | | — | | | — | | | — | | | — | | | | — | | |
Foreign currency translation adjustment (net of tax of $7,788) | | | — | | | — | | | — | | | — | | | | — | | |
Derivative financial instruments adjustment (net of tax of $715) | | | — | | | — | | | — | | | — | | | | — | | |
Minimum pension liability adjustment (net of tax of $1,347) | | | — | | | — | | | — | | | — | | | | — | | |
Comprehensive loss | | | | | | | | | | | | | | | | | | |
Cash dividends declared ($.16 per share) | | | — | | | — | | | (6,103 | ) | | — | | | | — | | |
Repurchases of Tredegar common stock | | | (406,400 | ) | | (5,170 | ) | | — | | | — | | | | — | | |
Issued upon exercise of stock options (including related income tax benefits of $726) & other | | | 260,196 | | | 1,772 | | | — | | | — | | | | — | | |
|
|
|
|
|
|
|
|
|
|
|
|
|
|
|
|
|
|
|
Balance December 31, 2003 | | | 38,176,821 | | | 104,991 | | | 331,289 | | | (1,212 | ) | | | — | | |
|
|
|
|
|
|
|
|
|
|
|
|
|
|
|
|
|
|
|
Comprehensive income (loss): | | | | | | | | | | | | | | | | | | |
Net income | | | — | | | — | | | 29,181 | | | — | | | | — | | |
Other comprehensive income (loss): | | | | | | | | | | | | | | | | | | |
Available-for-sale securities adjustment, net of reclassification adjustment (net of tax of $1,556) | | | — | | | — | | | — | | | — | | | | — | | |
Foreign currency translation adjustment (net of tax of $4,500) | | | — | | | — | | | — | | | — | | | | — | | |
Reclassification of foreign currency translation loss realized on the sale of the films business in Argentina (net of tax of $625) | | | — | | | — | | | — | | | — | | | | — | | |
Derivative financial instruments adjustment (net of tax of $247) | | | — | | | — | | | — | | | — | | | | — | | |
Minimum pension liability adjustment (net of tax of $149) | | | — | | | — | | | — | | | — | | | | — | | |
Comprehensive income | | | | | | | | | | | | | | | | | | |
Cash dividends declared ($.16 per share) | | | — | | | — | | | (6,154 | ) | | — | | | | — | | |
Restricted stock grant, net of forfeitures | | | 120,000 | | | 1,674 | | | — | | | — | | | | (1,674 | ) | |
Restricted stock amortization | | | — | | | — | | | — | | | — | | | | 272 | | |
Issued upon exercise of stock options (including related income tax benefits of $868) & other | | | 300,701 | | | 2,785 | | | — | | | — | | | | — | | |
Tredegar common stock purchased by trust for savings restoration plan | | | — | | | — | | | 62 | | | (62 | ) | | | — | | |
|
|
|
|
|
|
|
|
|
|
|
|
|
|
|
|
|
|
|
Balance December 31, 2004 | | | 38,597,522 | | | 109,450 | | | 354,378 | | | (1,274 | ) | | | (1,402 | ) | |
|
|
|
|
|
|
|
|
|
|
|
|
|
|
|
|
|
|
|
Comprehensive income (loss): | | | | | | | | | | | | | | | | | | |
Net income | | | — | | | — | | | 16,229 | | | — | | | | — | | |
Other comprehensive income (loss): | | | | | | | | | | | | | | | | | | |
Available-for-sale securities adjustment, net of reclassification adjustment (net of tax of $13) | | | — | | | — | | | — | | | — | | | | — | | |
Foreign currency translation adjustment (net of tax of $2,933) | | | — | | | — | | | — | | | — | | | | — | | |
Derivative financial instruments adjustment (net of tax of $60) | | | — | | | — | | | — | | | — | | | | — | | |
Minimum pension liability adjustment (net of tax of $630) | | | — | | | — | | | — | | | — | | | | — | | |
Comprehensive income | | | | | | | | | | | | | | | | | | |
Cash dividends declared ($.16 per share) | | | — | | | — | | | (6,190 | ) | | — | | | | — | | |
Restricted stock grant, net of forfeitures and vested shares | | | (11,000 | ) | | (49 | ) | | — | | | — | | | | 49 | | |
Restricted stock amortization | | | — | | | — | | | — | | | — | | | | 387 | | |
Issued upon exercise of stock options (including related income tax benefits of $175) & other | | | 150,494 | | | 1,305 | | | — | | | — | | | | — | | |
Tredegar common stock purchased by trust for savings restoration plan | | | — | | | — | | | 10 | | | (10 | ) | | | — | | |
|
|
|
|
|
|
|
|
|
|
|
|
|
|
|
|
|
|
|
Balance December 31, 2005 | | | 38,737,016 | | $ | 110,706 | | $ | 364,427 | | $ | (1,284 | ) | | $ | (966 | ) | |
|
|
|
|
|
|
|
|
|
|
|
|
|
|
|
|
|
|
|
| | | | | | | | | | | | | | | | | | | | | | |
| | Accumulated Other
Comprehensive Income (Loss) | | Total
Share-
holders’
Equity | |
| |
| | |
| | Unrealized
Gain on
Available-
for-Sale
Securities | | Foreign
Currency
Trans-
lation | | Gain
(Loss) on
Derivative
Financial
Instruments | | Minimum
Pension
Liability | | |
|
|
|
|
|
|
|
|
|
|
|
|
(In Thousands, Except Share and Per-Share Data) | | | | | | | | | | | | | | | | | | | | | | |
|
Balance December 31, 2002 | | | $ | 586 | | | $ | (4,422 | ) | | $ | (842 | ) | | | $ | (3,310 | ) | | $ | 462,932 | |
|
|
|
|
|
|
|
|
|
|
|
|
|
|
|
|
|
|
|
|
|
|
|
Comprehensive income (loss): | | | | | | | | | | | | | | | | | | | | | | |
Net loss | | | | — | | | | — | | | | — | | | | | — | | | | (26,351 | ) |
Other comprehensive income (loss): | | | | | | | | | | | | | | | | | | | | | | |
Available-for-sale securities adjustment, net of reclassification adjustment (net of tax of $1,228) | | | | 2,184 | | | | — | | | | — | | | | | — | | | | 2,184 | |
Foreign currency translation adjustment (net of tax of $7,788) | | | | — | | | | 14,419 | | | | — | | | | | — | | | | 14,419 | |
Derivative financial instruments adjustment (net of tax of $715) | | | | — | | | | — | | | | 1,286 | | | | | — | | | | 1,286 | |
Minimum pension liability adjustment (net of tax of $1,347) | | | | — | | | | — | | | | — | | | | | 2,430 | | | | 2,430 | |
| | | | | | | | | | | | | | | | | | | |
|
| |
Comprehensive loss | | | | | | | | | | | | | | | | | | | | | (6,032 | ) |
Cash dividends declared ($.16 per share) | | | | — | | | | — | | | | — | | | | | — | | | | (6,103 | ) |
Repurchases of Tredegar common stock | | | | — | | | | — | | | | — | | | | | — | | | | (5,170 | ) |
Issued upon exercise of stock options (including related income tax benefits of $726) & other | | | | — | | | | — | | | | — | | | | | — | | | | 1,772 | |
|
|
|
|
|
|
|
|
|
|
|
|
|
|
|
|
|
|
|
|
|
|
|
Balance December 31, 2003 | | | | 2,770 | | | | 9,997 | | | | 444 | | | | | (880 | ) | | | 447,399 | |
|
|
|
|
|
|
|
|
|
|
|
|
|
|
|
|
|
|
|
|
|
|
|
Comprehensive income (loss): | | | | | | | | | | | | | | | | | | | | | | |
Net income | | | | — | | | | — | | | | — | | | | | — | | | | 29,181 | |
Other comprehensive income (loss): | | | | | | | | | | | | | | | | | | | | | | |
Available-for-sale securities adjustment, net of reclassification adjustment (net of tax of $1,556) | | | | (2,770 | ) | | | — | | | | — | | | | | — | | | | (2,770 | ) |
Foreign currency translation adjustment (net of tax of $4,500) | | | | — | | | | 8,404 | | | | — | | | | | — | | | | 8,404 | |
Reclassification of foreign currency translation loss realized on the sale of the films business in Argentina (net of tax of $625) | | | | — | | | | 1,161 | | | | — | | | | | — | | | | 1,161 | |
Derivative financial instruments adjustment (net of tax of $247) | | | | — | | | | — | | | | 440 | | | | | — | | | | 440 | |
Minimum pension liability adjustment (net of tax of $149) | | | | — | | | | — | | | | — | | | | | (276 | ) | | | (276 | ) |
| | | | | | | | | | | | | | | | | | | |
|
| |
Comprehensive income | | | | | | | | | | | | | | | | | | | | | 36,140 | |
Cash dividends declared ($.16 per share) | | | | — | | | | — | | | | — | | | | | — | | | | (6,154 | ) |
Restricted stock grant, net of forfeitures | | | | — | | | | — | | | | — | | | | | — | | | | — | |
Restricted stock amortization | | | | — | | | | — | | | | — | | | | | — | | | | 272 | |
Issued upon exercise of stock options (including related income tax benefits of $868) & other | | | | — | | | | — | | | | — | | | | | — | | | | 2,785 | |
Tredegar common stock purchased by trust for savings restoration plan | | | | — | | | | — | | | | — | | | | | — | | | | — | |
|
|
|
|
|
|
|
|
|
|
|
|
|
|
|
|
|
|
|
|
|
|
|
Balance December 31, 2004 | | | | — | | | | 19,562 | | | | 884 | | | | | (1,156 | ) | | | 480,442 | |
|
|
|
|
|
|
|
|
|
|
|
|
|
|
|
|
|
|
|
|
|
|
|
Comprehensive income (loss): | | | | | | | | | | | | | | | | | | | | | | |
Net income | | | | — | | | | — | | | | — | | | | | — | | | | 16,229 | |
Other comprehensive income (loss): | | | | | | | | | | | | | | | | | | | | | | |
Available-for-sale securities adjustment, net of reclassification adjustment (net of tax of $13) | | | | 23 | | | | — | | | | — | | | | | — | | | | 23 | |
Foreign currency translation adjustment (net of tax of $2,933) | | | | — | | | | (5,448 | ) | | | — | | | | | — | | | | (5,448 | ) |
Derivative financial instruments adjustment (net of tax of $60) | | | | — | | | | — | | | | (108 | ) | | | | — | | | | (108 | ) |
Minimum pension liability adjustment (net of tax of $630) | | | | — | | | | — | | | | — | | | | | (1,278 | ) | | | (1,278 | ) |
| | | | | | | | | | | | | | | | | | | |
|
| |
Comprehensive income | | | | | | | | | | | | | | | | | | | | | 9,418 | |
Cash dividends declared ($.16 per share) | | | | — | | | | — | | | | — | | | | | — | | | | (6,190 | ) |
Restricted stock grant, net of forfeitures and vested shares | | | | — | | | | — | | | | — | | | | | — | | | | — | |
Restricted stock amortization | | | | — | | | | — | | | | — | | | | | — | | | | 387 | |
Issued upon exercise of stock options (including related income tax benefits of $175) & other | | | | — | | | | — | | | | — | | | | | — | | | | 1,305 | |
Tredegar common stock purchased by trust for savings restoration plan | | | | — | | | | — | | | | — | | | | | — | | | | — | |
|
|
|
|
|
|
|
|
|
|
|
|
|
|
|
|
|
|
|
|
|
|
|
Balance December 31, 2005 | | | $ | 23 | | | $ | 14,114 | | | $ | 776 | | | | $ | (2,434 | ) | | $ | 485,362 | |
|
|
|
|
|
|
|
|
|
|
|
|
|
|
|
|
|
|
|
|
|
|
|
See accompanying notes to financial statements.
44
|
NOTES TO FINANCIAL STATEMENTS |
|
Tredegar Corporation and Subsidiaries
(In thousands, except Tredegar share and per-share amounts and unless otherwise stated) |
1 SUMMARY OF SIGNIFICANT ACCOUNTING POLICIES
Organization and Nature of Operations. Tredegar Corporation and subsidiaries (“Tredegar”) are engaged in the manufacture of plastic films and aluminum extrusions. See Note 17 regarding discontinued operations.
Basis of Presentation. The consolidated financial statements include the accounts and operations of Tredegar and all of its majority-owned subsidiaries. Intercompany accounts and transactions have been eliminated. Certain previously reported amounts have been reclassified to conform to the 2005 presentation.
The preparation of financial statements in conformity with generally accepted accounting principles requires us to make estimates and assumptions that affect the reported amounts of revenues, expenses, assets and liabilities and disclosure of contingent assets and liabilities at the date of the financial statements. Actual results could differ from those estimates.
Foreign Currency Translation. The financial statements of foreign subsidiaries, where the local currency is the functional currency, are translated into U.S. Dollars using exchange rates in effect at the period end for assets and liabilities and average exchange rates during each reporting period for results of operations. Adjustments resulting from the translation of these financial statements are reflected as a separate component of shareholders’ equity. We have no foreign subsidiaries where the U.S. Dollar is the functional currency.
Transaction and remeasurement gains or losses included in income were not material in 2005, 2004 and 2003. These amounts do not include the effects between reporting periods that exchange rate changes have on income of our foreign locations that result from translation into U.S. Dollars.
Cash and Cash Equivalents. Cash and cash equivalents consist of cash on hand in excess of daily operating requirements and highly liquid investments with original maturities of three months or less. At December 31, 2005 and 2004, Tredegar had cash and cash equivalents of $23,434 and $22,994, respectively, including funds held in foreign locations of $14,890 and $21,410, respectively.
Our policy permits investment of excess cash in marketable securities that have the highest credit ratings and maturities of less than one year. The primary objectives of the policy are safety of principal and liquidity.
Accounts and Notes Receivable. Accounts receivable are stated at cash due from customers less allowances for doubtful accounts and sales returns. Accounts receivable are non-interest bearing and arise from the sale of product to customers under typical industry trade terms. Notes receivable are not significant. Past due amounts are determined based on established terms and charged-off when deemed uncollectible. The allowance for doubtful accounts is determined based on our assessment of probable losses taking into account past due amounts, customer credit profile, historical experience and current economic conditions. Other receivables include insurance recoveries due within one year and value-added taxes related to certain foreign subsidiaries.
Inventories. Inventories are stated at the lower of cost or market, with cost determined on the last-in, first-out (“LIFO”) basis, the weighted average cost or the first-in, first-out basis. Cost elements included in work-in-process and finished goods inventories are raw materials, direct labor and manufacturing overhead.
Property, Plant and Equipment. Accounts include costs of assets constructed or purchased, related delivery and installation costs and interest incurred on significant capital projects during their construction periods. Expenditures for renewals and betterments also are capitalized, but expenditures for repairs and maintenance are expensed as incurred. The cost and accumulated depreciation applicable to assets retired or sold are removed from the respective accounts, and gains or losses thereon are included in income.
45
Property, plant and equipment include capitalized interest of $1,387 in 2005, $762 in 2004 and $593 in 2003.
Depreciation is computed primarily by the straight-line method based on the estimated useful lives of the assets, which range from 15 to 40 years for buildings and land improvements and 3 to 25 years for machinery and equipment. The average depreciation period for machinery and equipment is approximately 13 years in Film Products and 15 years in Aluminum Extrusions.
Goodwill and Other Intangibles. The excess of the purchase price over the fair value of identifiable net assets of acquired companies is allocated to goodwill. We assess goodwill for impairment when events or circumstances indicate the carrying value may not be recoverable, or, at a minimum, on an annual basis as of December 1 of each year. Impairment reviews may result in recognition of losses. We have made determinations as to what our reporting units are and what amounts of goodwill, intangible assets, other assets and liabilities should be allocated to those reporting units.
The components of goodwill and other intangibles at December 31, 2005 and 2004, and related amortization periods are as follows:
|
|
|
|
|
|
|
|
December 31 | | 2005 | | 2004 | | Amortization Periods | |
|
|
|
|
|
|
|
|
Carrying value of goodwill: | | | | | | | | | | |
Film Products | | $ | 102,732 | | $ | 103,788 | | | Not amortized | |
Aluminum Extrusions | | | 34,544 | | | 33,764 | | | Not amortized | |
AFBS (formerly Therics) | | | — | | | 3,492 | | | Not amortized | |
|
|
|
|
|
|
|
|
|
|
|
Total carrying value of goodwill | | | 137,276 | | | 141,044 | | | | |
|
|
|
|
|
|
|
|
|
|
|
Carrying value of other intangibles: | | | | | | | | | | |
Film Products (cost basis of $1,575 in 2005 and 2004) | | | 712 | | | 990 | | | Not more than 17 yrs. | |
AFBS (formerly Therics) (cost basis of $2,236 in 2004) | | | — | | | 949 | | | 10 years | |
|
|
|
|
|
|
|
|
|
|
|
Total carrying value of other intangibles | | | 712 | | | 1,939 | | | | |
|
|
|
|
|
|
|
|
|
|
|
Total carrying value of goodwill and other intangibles | | $ | 137,988 | | $ | 142,983 | | | | |
|
|
|
|
|
|
|
|
|
|
|
A reconciliation of the beginning and ending balances of goodwill and other intangibles for each of the three years in the period ended December 31, 2005 is as follows:
|
|
|
|
|
|
|
|
| | 2005 | | 2004 | | 2003 | |
|
|
|
|
|
|
|
|
Goodwill and other intangibles: | | | | | | | | | | |
Net carrying value, beginning of year | | $ | 142,983 | | $ | 140,548 | | $ | 137,339 | |
Amortization | | | (299 | ) | | (330 | ) | | (268 | ) |
Decrease due to sale of AFBS (formerly Therics) assets | | | (4,329 | ) | | — | | | — | |
(Decrease) increase due to foreign currency translation and other | | | (367 | ) | | 2,765 | | | 3,477 | |
|
|
|
|
|
|
|
|
|
|
|
Total carrying value of goodwill and other intangibles | | $ | 137,988 | | $ | 142,983 | | $ | 140,548 | |
|
|
|
|
|
|
|
|
|
|
|
Impairment of Long-Lived Assets. We review long-lived assets for possible impairment when events indicate that impairment may exist. For assets to be held and used in operations, if events indicate that an asset may be impaired, we estimate the future unlevered pre-tax cash flows expected to result from the use of the asset and its eventual disposition. Assets are grouped for this purpose at the lowest level for which there are identifiable and independent cash flows. If the sum of these undiscounted pre-tax cash flows is less than the carrying amount of the asset, an impairment loss is recognized. Measurement of the impairment loss is based on the estimated fair value of the asset, generally determined on a discounted after-tax cash flow basis.
Assets to be disposed of are reported at the lower of their carrying amount or estimated fair value less cost to sell, with an impairment loss recognized for any writedown required.
Pension Costs and Postretirement Benefit Costs Other than Pensions. Pension costs and postretirement benefit costs other than pensions are accrued over the period employees provide service to the company. Our policy is to fund our pension plans at amounts not less than the minimum requirements of the Employee Retirement Income Security Act of
46
1974 and to fund postretirement benefits other than pensions when claims are incurred.
Postemployment Benefits. We periodically provide certain postemployment benefits purely on a discretionary basis. Related costs for these programs are accrued when it is probable that benefits will be paid and amounts can be reasonably estimated. All other postemployment benefits are either accrued under current benefit plans or are not material to our financial position or results of operations.
Revenue Recognition. Revenue from the sale of products, which is shown net of estimated sales returns and allowances, is recognized when delivery of product to the customer has occurred, the price of the product is fixed and determinable, and collectibility is reasonably assured. Amounts billed to customers related to freight have been classified as sales in the accompanying consolidated statements of income. The cost of freight has been classified as a separate line in the accompanying consolidated statements of income.
Research & Development (“R&D”) Costs. R&D costs are expensed as incurred and include primarily salaries, wages, employee benefits, equipment depreciation, facility costs and the cost of materials consumed relating to R&D efforts. R&D costs include a reasonable allocation of indirect costs.
Income Taxes. Income taxes are recognized during the period in which transactions enter into the determination of income for financial reporting purposes, with deferred income taxes being provided at enacted statutory tax rates on the differences between the financial reporting and tax bases of assets and liabilities (see Note 14). We accrue U.S. federal income taxes on unremitted earnings of our foreign subsidiaries.
Earnings Per Share. Basic earnings per share is computed using the weighted average number of shares of common stock outstanding. Diluted earnings per share is computed using the weighted average common and potentially dilutive common equivalent shares outstanding, determined as follows:
|
|
|
|
|
|
|
|
| | 2005 | | 2004 | | 2003 | |
|
|
|
|
|
|
|
|
Weighted average shares outstanding used to compute basic earnings (loss) per share | | | 38,471,348 | | | 38,294,996 | | | 38,096,001 | |
Incremental shares attributable to stock options and restricted stock | | | 125,356 | | | 211,688 | | | 345,009 | |
|
|
|
|
|
|
|
|
|
|
|
Shares used to compute diluted earnings (loss) per share | | | 38,596,704 | | | 38,506,684 | | | 38,441,010 | |
|
|
|
|
|
|
|
|
|
|
|
Incremental shares attributable to stock options and restricted stock are computed using the average market price during the related period. During 2005, 2004 and 2003, 2,024,690, 2,073,990 and 2,425,575 of average out-of-the-money options to purchase shares were excluded from the calculation of incremental shares attributable to stock options and restricted stock.
Stock-Based Employee Compensation Plans. Stock options, stock appreciation rights (“SARs”) and restricted stock grants are accounted for using the intrinsic value method under APB Opinion No. 25, “Accounting for Stock Issued to Employees,” and related interpretations whereby:
| |
• | No compensation cost is recognized for fixed stock option or restricted stock grants unless the quoted market price of the stock at the measurement date (ordinarily the date of grant or award) is in excess of the amount the employee is required to pay; and |
| |
• | Compensation cost for SARs is recognized and adjusted up through the date of exercise or forfeiture based on the estimated number of SARs expected to be exercised multiplied by the difference between the market price of our stock and the amount the employee is required to pay (there were no SARs outstanding at December 31, 2005). |
47
Had compensation cost for stock option grants been determined in 2005, 2004 and 2003 based on the fair value at the grant dates, our income and diluted earnings per share from continuing operations would have been reduced to the pro forma amounts indicated below:
| | | | | | | | | | |
|
|
|
|
|
|
|
|
|
|
|
| | 2005 | | 2004 | | 2003 | |
|
|
|
|
|
|
|
|
|
|
|
Income from continuing operations: | | | | | | | | | | |
As reported | | $ | 16,229 | | $ | 26,260 | | $ | 19,327 | |
Stock option-based employee compensation cost, net of tax, based on the fair value method | | | (1,073 | ) | | (2,133 | ) | | (2,194 | ) |
|
|
|
|
|
|
|
|
|
|
|
Pro forma income from continuing operations | | $ | 15,156 | | $ | 24,127 | | $ | 17,133 | |
|
|
|
|
|
|
|
|
|
|
|
Basic earnings per share from continuing operations: | | | | | | | | | | |
As reported | | $ | .42 | | $ | .69 | | $ | .51 | |
Pro forma | | | .39 | | | .63 | | | .45 | |
|
|
|
|
|
|
|
|
|
|
|
Diluted earnings per share from continuing operations: | | | | | | | | | | |
As reported | | $ | .42 | | $ | .68 | | $ | .50 | |
Pro forma | | | .39 | | | .63 | | | .45 | |
|
|
|
|
|
|
|
|
|
|
|
Compensation cost related to stock-based compensation (restricted stock grants) included in determining net income from continuing operations was $298 in 2005, $272 in 2004 and $95 in 2003.
The fair value of each option was estimated as of the grant date using the Black-Scholes options-pricing model. The assumptions used in this model for valuing Tredegar stock options granted in 2004 and 2003 are as follows (there were no Tredegar stock options granted in 2005):
| | | | | | | |
|
|
|
|
|
|
| | 2004 | | 2003 | |
|
|
|
|
|
|
Dividend yield | | | 1.2 | % | | 1.0 | % |
Volatility percentage | | | 45.0 | % | | 45.0 | % |
Weighted average risk-free interest rate | | | 3.1 | % | | 4.0 | % |
Holding period (years): | | | | | | | |
Officers | | | n/a | | | 7.0 | |
Management | | | 5.0 | | | 5.0 | |
Other employees | | | 3.0 | | | n/a | |
Weighted average market prices at date of grant (market price equals exercise price): | | | | | | | |
Officers and management | | $ | 13.97 | | $ | 16.44 | |
Other employees | | | 13.95 | | | n/a | |
|
|
|
|
|
|
|
|
48
Tredegar Stock options granted during 2004 and 2003 (there were no Tredegar stock options granted in 2005), and related estimated fair value at the date of grant, are as follows:
| | | | | | | |
|
|
|
|
|
|
| | 2004 | | 2003 | |
|
|
|
|
|
|
Stock options granted (number of shares): | | | | | | | |
Officers | | | n/a | | | 10,000 | |
Management | | | 176,950 | | | 5,000 | |
Other employees | | | 161,675 | | | n/a | |
|
|
|
|
|
|
|
|
Total | | | 338,625 | | | 15,000 | |
|
|
|
|
|
|
|
|
Estimated weighted average fair value of options per share at date of grant (exercise price equaled market price on date of grant) | | | | | | | |
Officers | | | n/a | | $ | 7.93 | |
Management | | $ | 5.54 | | | 6.51 | |
Other employees | | | 4.32 | | | n/a | |
|
|
|
|
|
|
|
|
Total estimated fair value of stock options granted | | $ | 1,679 | | $ | 112 | |
|
|
|
|
|
|
|
|
The table above excludes stock options granted to a consultant in 2004. The estimated fair value related to that grant of $50 was expensed in 2004 in conjunction with services rendered. Additional disclosure of Tredegar stock options is included in Note 10.
AFBS (formerly Therics) stock options granted in 2004 and assumptions used in determining related pro forma compensation expense are as follows (there were no significant grants of AFBS stock options in 2005 and 2003):
| | | | |
|
Assumptions Used in Determining Pro Forma Comp. Expense for AFBS Stock Options Granted in 2004 & Other Data |
|
|
Assumptions used in Black-Scholes options-pricing model: | | | | |
Dividend yield | | | 0.0 | % |
Volatility percentage (a) | | | 95 | % |
Weighted average risk-free interest rate | | | 4.1 | % |
Holding period (years) | | | 7.0 | |
| | | | |
Weighted average estimated fair value per share of underlying stock at date of grant (b) | | $ | .090 | |
Weighted average estimated fair value of options per share at date of grant | | $ | .074 | |
| | | | |
Other assumptions and items: | | | | |
Vesting period (years) | | | 0.4 - 4 | |
AFBS stock options granted: | | | | |
3rd quarter 2004 | | | 7,906,149 | |
1st quarter 2004 | | | 30,809,000 | |
Aggregate estimated fair value of options at date of grant: | | | | |
3rd quarter 2004 | | $ | 584 | |
1st quarter 2004 | | $ | 2,271 | |
| |
|
|
| |
(a) | Volatility estimated for AFBS based on Orthovita, Inc. (NASDAQ: VITA), a comparable company. |
| |
(b) | Estimated fair value of underlying stock equaled the stock option exercise price at date of grant. |
49
Financial Instruments.We use derivative financial instruments for the purpose of hedging aluminum price volatility and interest rate exposures that exist as part of ongoing business operations. Our derivative financial instruments are designated as and qualify as cash flow hedges and are recognized in the balance sheet at fair value. A change in the fair value of the derivative that is highly effective as and that is designated and qualifies as a cash flow hedge is recorded in other comprehensive income. Gains and losses reported in other comprehensive income are reclassified to earnings in the periods in which earnings are affected by the variability of cash flows of the hedged transaction. Such gains and losses are reported on the same line as the underlying hedged item. Any hedge ineffectiveness (which represents the amount by which the changes in the fair value of the derivative exceed the variability in the cash flows of the forecasted transaction) is recorded in current period earnings. There was no hedge ineffectiveness recognized in earnings.
Our policy requires that we formally document all relationships between hedging instruments and hedged items, as well as our risk management objective and strategy for undertaking various hedge transactions. We also formally assess (both at the hedge’s inception and on an ongoing basis) whether the derivatives that are used in hedging transactions have been highly effective in offsetting changes in the fair value or cash flows of hedged items and whether those derivatives may be expected to remain highly effective in future periods. When it is determined that a derivative is not (or has ceased to be) highly effective as a hedge, we discontinue hedge accounting prospectively.
As a policy, we do not engage in speculative or leveraged transactions, nor do we hold or issue financial instruments for trading purposes.
The cash flows related to financial instruments are classified in the statements of cash flows in a manner consistent with those of the transactions being hedged.
Comprehensive Income.Comprehensive income, which is included in the consolidated statement of shareholders’ equity, is defined as net income and other comprehensive income. Other comprehensive income includes changes in unrealized gains and losses on available-for-sale securities, foreign currency translation adjustments, unrealized gains and losses on derivative financial instruments and minimum pension liability adjustments, all recorded net of deferred income taxes directly in shareholders’ equity.
The available-for-sale securities adjustment included in the consolidated statement of shareholders’ equity is comprised of the following components:
| | | | | | | | | | |
|
|
|
|
|
|
|
|
| | 2005 | | 2004 | | 2,003 | |
|
|
|
|
|
|
|
|
Available-for-sale securities adjustment: | | | | | | | | | | |
Unrealized net holding gains (losses) arising during the period | | $ | 36 | | $ | 1,872 | | $ | 7,294 | |
Income taxes | | | (13 | ) | | (655 | ) | | (2,626 | ) |
Reclassification adjustment for net losses (gains) realized in income | | | — | | | (6,134 | ) | | (3,851 | ) |
Income taxes | | | — | | | 2,147 | | | 1,367 | |
|
|
|
|
|
|
|
|
|
|
|
Available-for-sale securities adjustment | | $ | 23 | | $ | (2,770 | ) | $ | 2,184 | |
|
|
|
|
|
|
|
|
|
|
|
Recently Issued Accounting Standards. In May 2005, the Financial Accounting Standards Board (“FASB”) issued Statement of Financial Accounting Standards (“SFAS”) No. 154,Accounting Changes and Error Corrections - a replacement of APB Opinion No. 20 and FASB Statement No. 3. This statement provides guidance on the accounting for and reporting of changes in accounting principles and error corrections. It requires retrospective application to prior periods’ financial statements of changes in accounting principle, unless it is impracticable to determine either the period-specific effects or the cumulative effect of the change. The statement is effective for accounting changes and corrections of errors made in fiscal years beginning after December 15, 2005. Early adoption is permitted. The adoption of this standard will have no impact on cash flow, and we do not expect it to have an impact on amounts reported in the consolidated statement of income and balance sheet.
In December 2004, the FASB revised SFAS No. 123,Share-Based Payment. This statement requires that the
50
cost of employee services received in exchange for equity instruments be measured based on the fair value of the award on the grant date. The statement also requires that the cost be recognized over the employee service period required to receive the award. The statement applies to awards granted after the effective date and to awards modified, repurchased or cancelled after that date. The statement is effective beginning the first fiscal year that begins after June 15, 2005. Early adoption is permitted. The adoption of this standard will have no impact on cash flow. The primary impact of adoption on Tredegar will be the recognition of compensation expense for stock options granted. Currently, we disclose the pro forma effects of treating stock option grants as compensation expense under the fair value-based method (see pages 47-49). We will transition to the new standard during the first quarter of 2006 using the modified prospective method and continue to use the Black-Scholes options-pricing model to determine the estimated fair value of option grants. We believe that the pro forma effects that have been disclosed are not materially different from compensation expense that would have been recognized if this standard had been previously adopted.
In November 2004, the FASB issued SFAS No. 151,Inventory Costs – An Amendment of ARB No. 43, Chapter 4. This statement clarifies that abnormal amounts of idle facility expense, freight, handling costs and wasted material (spoilage) should be expensed as current-period charges. In addition, this statement requires that allocation of fixed production overheads to the costs of conversion be based on the normal capacity of the production facilities. The statement is effective for inventory costs incurred during the fiscal years beginning after June 15, 2005. Early adoption is permitted. The adoption of this standard will have no impact on cash flow, and we do not expect it to have a significant impact on amounts reported in the consolidated statement of income and balance sheet.
In October 2004, the American Jobs Creation Act of 2004 (“AJCA”) was signed into law. In December 2004, the FASB issued Staff Position No. 109-1 (“FSP 109-1”),Application of FASB Statement No. 109, Accounting for Income Taxes, to the Tax Deduction on Qualified Production Activities Provided by the American Jobs Creation Act of 2004 and Staff Position No. 109-2 (“FSP 109-2”),Accounting and Disclosure Guidance for the Foreign Earnings Repatriation Provision within the American Jobs Creation Act of 2004. FSP 109-1 clarifies that the manufacturer’s tax deduction provided for under the AJCA should be accounted for as a special deduction in accordance with SFAS No. 109 and not as a tax rate reduction. FSP 109-2 provides accounting and disclosure guidance for the repatriation of certain foreign earnings to a U.S. taxpayer as provided for in the AJCA. We do not expect that the tax benefits resulting from the AJCA will have a material impact on our financial statements.
51
|
2 ACQUISITIONS AND INVESTMENTS |
|
On July 23, 2004, a subsidiary of Tredegar purchased the assets of Yaheng Perforated Film Material Co., Ltd. (“Yaheng”) for approximately $1,420. Yaheng, based in Shanghai, China, had 21 employees at the acquisition date and manufactures apertured nonwovens used primarily in personal care markets. The purchase price was allocated to accounts receivable ($26), inventories ($45), property, plant and equipment ($288), patents ($822), employment agreements ($150), goodwill ($215), deferred income tax liabilities ($56) and accrued expenses ($70). Property, plant and equipment is being depreciated on a straight-line basis over approximately 10 years, patents are being amortized on a straight-line basis over approximately 7 years, and employment agreements are being amortized on a straight-line basis over approximately 3 years.
On November 21, 2003, Tredegar announced that its aluminum extrusions subsidiary, the William L. Bonnell Company, had acquired Apolo Tool and Die Manufacturing Inc. (“Apolo”) of Woodbridge, Ontario. The purchase price consisted of cash consideration of $1,579 (including transaction costs of $110 and net cash acquired of $343). Apolo’s key capabilities include bending, CNC machining, drilling, mitering, punching, riveting, sawing and welding of aluminum extrusions and other materials. The company also has in-house tool and die design and manufacturing capability to support its fabrication services. There was no goodwill (the excess of the purchase price over the estimated fair value of identifiable net assets acquired) associated with the Apolo acquisition.
The operating results for the acquired businesses have been included in the consolidated statements of income since the date acquired. Pro forma results for these acquisitions are immaterial.
In August of 2004, we invested $5,000 in Novalux, Inc. In October 2005, we invested an additional $1,095 in a new convertible secured bridge financing for Novalux bringing our aggregate investment to $6,095. As of December 31, 2005, the investment in Novalux was written down to estimated fair value of $1,095. Novalux is a developer of laser technology for potential use in a variety of applications. The reduction in estimated fair value was due to longer than anticipated delays both in bringing the company’s technology to market and in obtaining key development partnerships as well as liquidity issues. The loss from the write-down is included in “Other income (expense), net” in the consolidated statements of income and separately shown in the operating profit by segment table in Note 3.
In conjunction with our most recent investment, we entered into a forbearance agreement with Novalux pursuant to which we have agreed to forbear our ability to vote that number of shares which accounts for more than 19.5% of the total voting shares of Novalux (our voting interest in Novalux prior to the new financing was approximately 18% on an issued and outstanding basis and 15% on a fully diluted basis). We do not have a seat on the board of directors. We believe that our investment in Novalux does not provide us significant influence over its operating and financial policies. The investment in Novalux, which is included in “Other assets and deferred charges” in the consolidated balance sheet, is being accounted for under the cost method, with any impairment loss recognized and a new cost basis established for write-downs to estimated fair value.
52
Information by business segment and geographic area for the last three years is provided below. There are no accounting transactions between segments and no allocations to segments. Net sales (sales less freight) and operating profit from ongoing operations are the measures of sales and operating profit used by the chief operating decision maker for purposes of assessing performance. Film Products’ net sales to The Procter & Gamble Company (“P&G”) totaled $236,554 in 2005, $226,122 in 2004 and $207,049 in 2003. These amounts include plastic film sold to others that convert the film into materials used in products manufactured by P&G.
| | | | | | | | | | |
|
|
|
|
| | Net Sales | |
| | 2005 | | 2004 | | 2003 | |
|
|
|
|
|
|
|
|
|
|
|
Film Products | | $ | 460,277 | | $ | 413,257 | | $ | 365,501 | |
Aluminum Extrusions | | | 471,749 | | | 425,130 | | | 354,593 | |
AFBS (formerly Therics) | | | 252 | | | 380 | | | — | |
|
|
|
|
|
|
|
|
|
|
|
Total net sales | | | 932,278 | | | 838,767 | | | 720,094 | |
Add back freight | | | 24,691 | | | 22,398 | | | 18,557 | |
|
|
|
|
|
|
|
|
Sales as shown in consolidated statements of income | | $ | 956,969 | | $ | 861,165 | | $ | 738,651 | |
|
|
|
|
|
|
|
|
|
|
|
| | | | | | | | | | |
|
|
|
|
|
|
|
|
|
|
|
| | Operating Profit | |
| | 2005 | | 2004 | | 2003 | |
|
|
|
|
|
|
|
|
Film Products: | | | | | | | | | | |
Ongoing operations | | $ | 44,946 | | $ | 43,259 | | $ | 45,676 | |
Plant shutdowns, asset impairments and restructurings, net of gains on the sale of assets (a) | | | (3,955 | ) | | (10,438 | ) | | (5,746 | ) |
|
|
|
|
|
|
|
|
|
|
|
Aluminum Extrusions: | | | | | | | | | | |
Ongoing operations | | | 19,302 | | | 22,637 | | | 15,117 | |
Plant shutdowns, asset impairments and restructurings, net of gains on the sale of assets (a) | | | 122 | | | (10,553 | ) | | (644 | ) |
Gain on sale of land (a) | | | — | | | — | | | 1,385 | |
Other (a) | | | — | | | 7,316 | | | — | |
|
|
|
|
|
|
|
|
|
|
|
AFBS (formerly Therics): | | | | | | | | | | |
Ongoing operations | | | (3,467 | ) | | (9,763 | ) | | (11,651 | ) |
Loss on investment in Therics, LLC | | | (145 | ) | | — | | | — | |
Restructurings (a) | | | (10,318 | ) | | (2,041 | ) | | (3,855 | ) |
Unusual items (a) | | | — | | | — | | | (1,067 | ) |
|
|
|
|
|
|
|
|
|
|
|
Total | | | 46,485 | | | 40,417 | | | 39,215 | |
Interest income | | | 586 | | | 350 | | | 1,183 | |
Interest expense | | | 4,573 | | | 3,171 | | | 6,785 | |
Gain on sale of corporate assets (a) | | | 61 | | | 7,560 | | | 5,155 | |
Loss from write-down of investment in Novalux (a) | | | 5,000 | | | — | | | — | |
Corporate expenses, net (a) | | | 11,357 | | | 9,674 | | | 8,724 | |
|
|
|
|
|
|
|
|
|
|
|
Income from continuing operations before income taxes | | | 26,202 | | | 35,482 | | | 30,044 | |
Income taxes (a) | | | 9,973 | | | 9,222 | | | 10,717 | |
|
|
|
|
|
|
|
|
|
|
|
Income from continuing operations | | | 16,229 | | | 26,260 | | | 19,327 | |
Income (loss) from discontinued operations (a) | | | — | | | 2,921 | | | (45,678 | ) |
|
|
|
|
|
|
|
|
|
|
|
Net income (loss) | | $ | 16,229 | | $ | 29,181 | | $ | (26,351 | ) |
|
|
|
|
|
|
|
|
|
|
|
| |
(a) | See Notes 2 and 15 for more information on losses associated with plant shutdowns, asset impairments and restructurings, unusual items, gains from sale of assets, investment write-down and other items, and Note 17 for more information on discontinued operations. |
| |
(b) | The difference between total consolidated sales as reported in the consolidated statements of income and segment and geographic net sales reported in this note is freight of $24,691 in 2005, $22,398 in 2004 and $18,557 in 2003. |
| |
(c) | Information on exports and foreign operations are provided on the next page. Cash and cash equivalents includes funds held in foreign locations of $14,890, $21,410 and $16,188 at December 31, 2005, 2004, and 2003, respectively. Export sales relate almost entirely to Film Products. Foreign operations in The Netherlands, Hungary, China, Italy, Brazil and Argentina (operations in Argentina were sold in the third quarter of 2004) also relate to Film Products. Sales from our locations in The Netherlands, Hungary and Italy are primarily to customers located in Europe. Sales from our locations in China (Guangzhou and Shanghai) are primarily to customers located in China, but also include other customers in Asia. Foreign operations in Canada relate to Aluminum Extrusions. Sales from our locations in Canada are primarily to customers located in the U.S. and Canada. |
53
| | | | | | | | | | |
|
|
|
|
| | Identifiable Assets | |
December 31 | | 2005 | | 2004 | | 2003 | |
|
|
|
|
|
|
|
|
Film Products | | $ | 479,286 | | $ | 472,810 | | $ | 422,321 | |
Aluminum Extrusions | | | 214,374 | | | 210,894 | | | 185,336 | |
AFBS (formerly Therics) | | | 2,759 | | | 8,613 | | | 8,917 | |
|
|
|
|
|
|
|
|
|
|
|
Subtotal | | | 696,419 | | | 692,317 | | | 616,574 | |
General corporate | | | 61,905 | | | 54,163 | | | 61,508 | |
Income taxes recoverable from sale of venture capital investment portfolio | | | — | | | — | | | 55,000 | |
Cash and cash equivalents (c) | | | 23,434 | | | 22,994 | | | 19,943 | |
|
|
|
|
|
|
|
|
|
|
|
Total | | $ | 781,758 | | $ | 769,474 | | $ | 753,025 | |
|
|
|
|
|
|
|
|
|
|
|
| | | | | | | | | | | | | | | | | | | |
|
|
|
|
|
|
| | Depreciation and Amortization | | Capital Expenditures | |
| | 2005 | | 2004 | | 2003 | | 2005 | | 2004 | | 2003 | |
|
|
|
|
|
|
|
|
|
|
|
|
|
|
Film Products | | $ | 26,673 | | $ | 21,967 | | $ | 19,828 | | $ | 50,466 | | $ | 44,797 | | $ | 57,203 | |
Aluminum Extrusions | | | 11,484 | | | 10,914 | | | 10,883 | | | 11,968 | | | 10,007 | | | 8,293 | |
AFBS (formerly Therics) | | | 437 | | | 1,300 | | | 1,641 | | | 36 | | | 275 | | | 219 | |
|
|
|
|
|
|
|
|
|
|
|
|
|
|
|
|
|
|
|
|
Subtotal | | | 38,594 | | | 34,181 | | | 32,352 | | | 62,470 | | | 55,079 | | | 65,715 | |
General corporate | | | 195 | | | 241 | | | 270 | | | 73 | | | 572 | | | 93 | |
|
|
|
|
|
|
|
|
|
|
|
|
|
|
|
|
|
|
|
|
Total | | $ | 38,789 | | $ | 34,422 | | $ | 32,622 | | $ | 62,543 | | $ | 55,651 | | $ | 65,808 | |
|
|
|
|
|
|
|
|
|
|
|
|
|
|
|
|
|
|
|
|
| | | | | | | | | | |
|
|
|
|
|
| | | Net Sales by Geographic Area (c) | |
| | 2005 | | 2004 | | 2003 | |
|
|
|
|
|
|
|
|
|
|
|
United States | | $ | 495,900 | | $ | 441,891 | | $ | 383,204 | |
Exports from the United States to: | | | | | | | | | | |
Canada | | | 44,870 | | | 27,663 | | | 25,188 | |
Latin America | | | 9,428 | | | 16,668 | | | 17,915 | |
Europe | | | 8,311 | | | 15,768 | | | 25,157 | |
Asia | | | 40,476 | | | 31,617 | | | 21,510 | |
Foreign operations: | | | | | | | | | | |
Canada | | | 144,090 | | | 147,145 | | | 125,347 | |
The Netherlands | | | 83,649 | | | 66,856 | | | 43,954 | |
Hungary | | | 33,573 | | | 34,721 | | | 32,204 | |
China | | | 36,823 | | | 25,291 | | | 17,426 | |
Italy | | | 15,866 | | | 12,423 | | | 12,698 | |
Brazil and Argentina | | | 19,292 | | | 18,724 | | | 15,491 | |
|
|
|
|
|
|
|
|
|
|
|
Total (b) | | $ | 932,278 | | $ | 838,767 | | $ | 720,094 | |
|
|
|
|
|
|
|
|
|
|
|
| | | | | | | | | | | | | | | | | | | |
|
|
|
|
|
|
|
|
|
|
|
|
|
|
|
|
|
|
|
|
| | Identifiable Assets by
Geographic Area (c) | | Property, Plant & Equipment,
Net by Geographic Area (c) | |
December 31 | | 2005 | | 2004 | | 2003 | | 2005 | | 2004 | | 2003 | |
|
|
|
|
|
|
|
|
|
|
|
|
|
|
|
|
|
|
|
|
United States | | $ | 444,144 | | $ | 427,240 | | $ | 394,415 | | $ | 178,154 | | $ | 163,383 | | $ | 159,127 | |
Foreign operations: | | | | | | | | | | | | | | | | | | | |
Canada | | | 92,328 | | | 92,290 | | | 86,564 | | | 41,208 | | | 38,610 | | | 44,179 | |
The Netherlands | | | 67,683 | | | 75,449 | | | 47,809 | | | 54,331 | | | 58,370 | | | 38,956 | |
Hungary | | | 18,505 | | | 27,308 | | | 26,815 | | | 12,787 | | | 19,371 | | | 20,449 | |
China | | | 40,599 | | | 38,713 | | | 29,233 | | | 26,104 | | | 25,684 | | | 22,577 | |
Italy | | | 17,997 | | | 20,785 | | | 20,951 | | | 3,093 | | | 3,991 | | | 3,826 | |
Brazil and Argentina | | | 15,163 | | | 10,532 | | | 10,787 | | | 5,205 | | | 5,037 | | | 5,295 | |
General corporate | | | 61,905 | | | 54,163 | | | 61,508 | | | 1,994 | | | 2,246 | | | 3,067 | |
Income taxes recoverable | | | | | | | | | | | | | | | | | | | |
from sale of venture | | | | | | | | | | | | | | | | | | | |
capital investment portfolio | | | — | | | — | | | 55,000 | | | n/a | | | n/a | | | n/a | |
Cash and cash equivalents (c) | | | 23,434 | | | 22,994 | | | 19,943 | | | n/a | | | n/a | | | n/a | |
|
|
|
|
|
|
|
|
|
|
|
|
|
|
|
|
|
|
|
|
Total | | $ | 781,758 | | $ | 769,474 | | $ | 753,025 | | $ | 322,876 | | $ | 316,692 | | $ | 297,476 | |
|
|
|
|
|
|
|
|
|
|
|
|
|
|
|
|
|
|
|
|
See footnotes on prior page and a reconciliation of net sales to sales as shown in the consolidated statements of income.
54
| |
4 | ACCOUNTS AND NOTES RECEIVABLE |
|
|
Accounts and notes receivable consist of the following:
| | | | | | | |
|
|
|
|
|
|
December 31 | | 2005 | | 2004 | |
|
|
|
|
|
|
Trade, less allowance for doubtful accounts and sales returns of $5,423 in 2005 and $5,313 in 2004 | | $ | 112,968 | | $ | 109,347 | |
Other | | | 6,362 | | | 7,967 | |
|
|
|
|
|
|
|
|
Total | | $ | 119,330 | | $ | 117,314 | |
|
|
|
|
|
|
|
|
The allowance for doubtful accounts and sales returns increased by $110 in 2005 and $865 in 2004 and declined by $1,594 in 2003. The changes in 2005, 2004 and 2003 were comprised of increases to the allowance for charges to expense of $612 and $956 and a decrease to the allowance for income from changes in estimates of $483, respectively, decreases in the allowance for income from recoveries of $15, $5 and none, respectively, decreases in the allowance for write-offs of $403, $413 and $1,150, respectively, and foreign exchange and other adjustments to the allowance of minus $84, plus $327 and plus $39, respectively.
Inventories consist of the following:
| | | | | | | |
|
|
|
|
|
|
|
|
December 31 | | 2005 | | 2004 | |
|
|
|
|
|
|
|
|
Finished goods | | $ | 12,838 | | $ | 13,452 | |
Work-in-process | | | 3,685 | | | 3,097 | |
Raw materials | | | 33,043 | | | 36,567 | |
Stores, supplies and other | | | 12,872 | | | 12,244 | |
|
|
|
|
|
|
|
|
Total | | $ | 62,438 | | $ | 65,360 | |
|
|
|
|
|
|
|
|
Inventories stated on the LIFO basis amounted to $19,843 at December 31, 2005 and $20,837 at December 31, 2004, which are below replacement costs by approximately $29,164 at December 31, 2005 and $20,867 at December 31, 2004. During 2005, inventories accounted for on a LIFO basis declined, which resulted in cost of goods sold being stated at below current replacement costs by approximately $2,300 ($2,100 in Film Products and $200 in Aluminum Extrusions).
In the normal course of business, we enter into fixed-price forward sales contracts with certain customers for the sale of fixed quantities of aluminum extrusions at scheduled intervals. In order to hedge our exposure to aluminum price volatility under these fixed-price arrangements, which generally have a duration of not more than 12 months, we enter into a combination of forward purchase commitments and futures contracts to acquire or hedge aluminum, based on the scheduled deliveries. The futures contracts are designated as and accounted for as cash flow hedges. These contracts involve elements of credit and market risk that are not reflected on our balance sheet, including the risk of dealing with counterparties and their ability to meet the terms of the contracts. The counterparties to our forward purchase commitments are major aluminum brokers and suppliers, and the counterparties to our futures contracts are major financial institutions. Fixed-price forward sales contracts are only made available to our best and most credit-worthy customers. The amount of aluminum futures contracts that hedged fixed-price forward sales contracts was $5,367 (6,393 pounds of aluminum) at December 31, 2005 and $11,253 (14,410 pounds of aluminum) at December 31, 2004.
We use interest rate swaps to manage interest rate exposure. There were no interest rate swaps outstanding at December 31, 2005 and 2004. Interest rate swaps outstanding during 2003 (there were none outstanding in 2005 and 2004) were designated as and accounted for as cash flow hedges (see Note 8). Counterparties to our interest rate swaps consisted of large major financial institutions.
55
After-tax gains of $939 in 2005, $1,230 in 2004 and $395 in 2003 were reclassified from other comprehensive income to earnings and were offset by losses, respectively, from transactions relating to the underlying hedged item. As of December 31, 2005, we expect $776 of unrealized after-tax gains on derivative instruments reported in accumulated other comprehensive income to be reclassified to earnings within the next twelve months. We also expect that these gains will be offset by losses from transactions relating to the underlying hedged item.
Accrued expenses consist of the following:
| | | | | | | |
|
|
|
|
|
|
|
|
December 31 | | 2005 | | 2004 | |
|
|
|
|
|
|
|
|
Payrolls, related taxes and medical and other benefits | | $ | 6,687 | | $ | 7,946 | |
Workmen's compensation and disabilities | | | 4,226 | | | 3,806 | |
Vacation | | | 4,488 | | | 4,560 | |
Plant shutdowns and divestitures | | | 6,972 | | | 8,485 | |
Other | | | 13,658 | | | 13,344 | |
|
|
|
|
|
|
|
|
Total | | $ | 36,031 | | $ | 38,141 | |
|
|
|
|
|
|
|
|
A reconciliation of the beginning and ending balances of accrued expenses associated with plant shutdowns and divestitures for each of the three years in the period ended December 31, 2005 is as follows:
| | | | | | | | | | | | | | | | |
|
|
|
|
|
|
|
|
|
|
|
|
|
|
|
|
|
| | Severance | | Asset
Impairments | | Accelerated
Depreciation* | | | Other | | | Total | |
|
|
|
|
|
|
|
|
|
|
|
|
|
|
Balance at December 31, 2002 | | $ | 374 | | $ | — | | $ | — | | $ | 1,034 | | $ | 1,408 | |
2003: | | | | | | | | | | | | | | | | |
Charges | | | 5,505 | | | 1,051 | | | 1,733 | | | 3,137 | | | 11,426 | |
Cash spent | | | (3,773 | ) | | — | | | — | | | (1,085 | ) | | (4,858 | ) |
Charged against assets | | | — | | | (1,051 | ) | | (1,733 | ) | | — | | | (2,784 | ) |
Reversed to income | | | — | | | — | | | — | | | — | | | — | |
|
|
|
|
|
|
|
|
|
|
|
|
|
|
|
|
|
Balance at December 31, 2003 | | | 2,106 | | | — | | | — | | | 3,086 | | | 5,192 | |
2004: | | | | | | | | | | | | | | | | |
Charges | | | 6,456 | | | 11,554 | | | 2,572 | | | 2,450 | | | 23,032 | |
Cash spent | | | (3,732 | ) | | — | | | — | | | (2,112 | ) | | (5,844 | ) |
Charged against assets | | | — | | | (11,554 | ) | | (2,572 | ) | | — | | | (14,126 | ) |
Foreign currency translation | | | 261 | | | — | | | — | | | — | | | 261 | |
Reversed to income | | | — | | | — | | | — | | | (30 | ) | | (30 | ) |
|
|
|
|
|
|
|
|
|
|
|
|
|
|
|
|
|
Balance at December 31, 2004 | | | 5,091 | | | — | | | — | | | 3,394 | | | 8,485 | |
2005: | | | | | | | | | | | | | | | | |
Charges | | | 3,620 | | | 8,198 | | | 353 | | | 6,553 | | | 18,724 | |
Cash spent | | | (6,182 | ) | | — | | | — | | | (4,290 | ) | | (10,472 | ) |
Charged against assets | | | — | | | (8,198 | ) | | (353 | ) | | — | | | (8,551 | ) |
Foreign currency translation | | | (8 | ) | | — | | | — | | | — | | | (8 | ) |
Reversed to income | | | (1,036 | ) | | — | | | — | | | (170 | ) | | (1,206 | ) |
|
|
|
|
|
|
|
|
|
|
|
|
|
|
|
|
|
Balance at December 31, 2005 | | $ | 1,485 | | $ | — | | $ | — | | $ | 5,487 | | $ | 6,972 | |
|
|
|
|
|
|
|
|
|
|
|
|
|
|
|
|
|
* Represents depreciation accelerated due to plant shutdowns based on a remaining useful life of less than one year.
The amount reversed to income in 2005 relates primarily to changes in estimates for severance and shutdown-related costs at our aluminum extrusions facility in Aurora, Ontario and in connection with the restructuring of the research and development operations in Film Products. See Note 15 for more information on plant shutdowns, asset impairments and restructurings.
56
| |
8 | DEBT AND CREDIT AGREEMENTS |
|
|
| |
On December 15, 2005, we refinanced our debt with a new $300,000, five-year unsecured revolving credit agreement (the “Credit Agreement”). At December 31, 2005, available credit under the Credit Agreement was approximately $154,300. Total debt due and outstanding at December 31, 2005 is summarized below:
| | | | | | | | | | |
|
Debt Due and Outstanding at December 31, 2005 |
|
|
|
|
|
|
|
Year
Due | | Credit
Agreement | | Other | | Total Debt
Due |
|
|
|
|
|
|
|
2006 | | $ | — | | $ | — | | $ | — | |
2007 | | | — | | | 4,720 | | | 4,720 | |
2008 | | | — | | | 381 | | | 381 | |
2009 | | | — | | | 391 | | | 391 | |
2010 | | | 107,000 | | | 243 | | | 107,243 | |
Remainder | | | — | | | 315 | | | 315 | |
|
|
|
|
|
|
|
|
|
|
|
Total | | $ | 107,000 | | $ | 6,050 | | $ | 113,050 | |
|
|
|
|
|
|
|
|
|
|
|
The credit spread over LIBOR and commitment fees charged on the unused amount under the Credit Agreement at various indebtedness-to-adjusted EBITDA levels are as follows:
| | | | | | | |
|
|
|
|
|
|
|
|
Pricing Under Credit Agreement (Basis Points) |
|
| | Credit Spread
Over LIBOR | | | | |
| |
| | | | |
Indebtedness-to-
Adjusted EBITDA
Ratio | | ($107 Million
Outstanding
at 12/31/05) | | Commitment
Fee | |
|
|
|
|
|
|
> 2.50x but <= 3x | | 125 | | | 25 | | |
> 1.75x but <= 2.50x | | 100 | | | 20 | | |
> 1x but <= 1.75x | | 87.5 | | | 17.5 | | |
<= 1x | | 75 | | | 15 | | |
|
|
|
|
|
|
|
|
At December 31, 2005, the interest cost on debt was priced at one-month LIBOR plus the applicable credit spread of 87.5 basis points.
The most restrictive covenants in the Credit Agreement include:
| |
• | Maximum aggregate dividends over the term of the Credit Agreement of $100,000 plus, beginning October 1, 2005, 50% of net income ($100,445 million as of December 31, 2005); |
| |
• | Minimum shareholders’ equity ($352,363 as of December 31, 2005); |
| |
• | Maximum indebtedness-to-adjusted EBITDA through December 31, 2008 of 3x and 2.75x thereafter (2.5x on a pro forma basis for acquisitions); and |
| |
• | Minimum adjusted EBIT-to-interest expense of 2.5x. |
We believe we were in compliance with all of our debt covenants as of December 31, 2005. Noncompliance with any one or more of the debt covenants may have a material adverse effect on financial condition or liquidity in the event such noncompliance cannot be cured or should we be unable to obtain a waiver from the lenders. Renegotiation of the covenant through an amendment to the Credit Agreement may effectively cure the noncompliance, but may have an effect on financial condition or liquidity depending upon how the covenant is renegotiated.
On April 27, 2001, we entered into a two-year interest rate swap agreement, with a notional amount of $50,000, under which we paid to a counterparty a fixed interest rate of 4.85% and the counterparty paid us a variable interest rate based on one-month LIBOR reset each month. This swap was designated as and accounted for as a cash flow hedge. It effectively fixed the rate on $50,000 of our $250,000 term loan then outstanding at 4.85% plus the applicable credit spread (generally 62.5 basis points at that time).
57
On June 22, 2001, we entered into another two-year interest rate swap agreement, with a notional amount of $25,000, under which we paid to a counterparty a fixed interest rate of 4.64% and the counterparty paid us a variable interest rate based on one-month LIBOR reset each month. This swap was designated as and accounted for as a cash flow hedge. It effectively fixed the rate on $25,000 of our $250,000 term loan then outstanding at 4.64% plus the applicable credit spread (generally 62.5 basis points at that time).
| |
9 | SHAREHOLDER RIGHTS AGREEMENT |
|
|
Pursuant to a Rights Agreement dated as of June 30, 1999 (as amended), between Tredegar and National City Bank as Rights Agent, one Right is attendant to each share of our common stock. Each Right entitles the registered holder to purchase from Tredegar one one-hundredth of a share of Participating Cumulative Preferred Stock, Series A (the “Preferred Stock”), at an exercise price of $150 (the “Purchase Price”). The Rights will become exercisable, if not earlier redeemed, only if a person or group acquires 10% or more of the outstanding shares of our common stock or announces a tender offer which would result in ownership by a person or group of 10% or more of our common stock. Any action by a person or group whose beneficial ownership is reported on Amendment No. 4 to the Schedule 13D filed with respect to Tredegar on March 20, 1997, cannot cause the Rights to become exercisable.
Each holder of a Right, upon the occurrence of certain events, will become entitled to receive, upon exercise and payment of the Purchase Price, Preferred Stock (or in certain circumstances, cash, property or other securities of Tredegar or a potential acquirer) having a value equal to twice the amount of the Purchase Price.
The Rights will expire on June 30, 2009.
58
| |
10 | STOCK OPTION AND STOCK AWARD PLANS |
|
|
We have two stock option plans under which stock options may be granted to purchase a specified number of shares of common stock at a price no lower than the fair market value on the date of grant and for a term not to exceed 10 years. One of those option plans is a directors’ stock plan. In addition, we have three other stock option plans under which there are options that remain outstanding, but no future grants can be made. Employee options ordinarily vest one to two years from the date of grant. The outstanding options granted to directors vest over three years. The option plans also permit the grant of stock appreciation rights (“SARs”), stock, restricted stock, stock unit awards and incentive awards. No SARs have been granted since 1992. All SARs outstanding at December 31, 2001, were exercised during 2002.
A summary of our stock options outstanding at December 31, 2005, 2004 and 2003, and changes during those years, is presented below:
| | | | | | | | | | | | | | | | | | |
|
|
|
|
|
| | | | Option Exercise Price/Share |
| | Number of Shares | |
|
|
|
|
|
| |
|
|
|
| | | | Wgted. | |
| | Options | | SARs | | Range | | Ave. | |
|
|
|
|
|
|
|
|
|
|
|
|
Outstanding at 12/31/02 | | 3,160,880 | | | — | | $ | 3.37 | | | to | | $ | 46.63 | | $ | 20.16 | |
Granted in 2003 | | 15,000 | | | — | | | 16.19 | | | to | | | 16.57 | | | 16.44 | |
Lapsed in 2003 | | (179,970 | ) | | — | | | 16.55 | | | to | | | 46.63 | | | 24.75 | |
Exercised in 2003 | | (273,300 | ) | | — | | | 3.37 | | | to | | | 8.38 | | | 4.68 | |
|
|
|
|
|
|
|
|
|
|
|
|
|
|
|
|
|
|
|
Outstanding at 12/31/03 | | 2,722,610 | | | — | | | 3.37 | | | to | | | 46.63 | | | 21.39 | |
Granted in 2004 | | 348,425 | | | — | | | 13.95 | | | to | | | 14.50 | | | 13.97 | |
Lapsed in 2004 | | (102,175 | ) | | — | | | 7.38 | | | to | | | 46.63 | | | 23.28 | |
Exercised in 2004 | | (306,870 | ) | | — | | | 3.37 | | | to | | | 19.75 | | | 6.99 | |
|
|
|
|
|
|
|
|
|
|
|
|
|
|
|
|
|
|
|
Outstanding at 12/31/04 | | 2,661,990 | | | — | | | 4.17 | | | to | | | 46.63 | | | 22.01 | |
Granted in 2005 | | — | | | — | | | n/a | | | to | | | n/a | | | n/a | |
Lapsed in 2005 | | (274,575 | ) | | — | | | 13.95 | | | to | | | 46.63 | | | 21.90 | |
Exercised in 2005 | | (137,075 | ) | | — | | | 4.17 | | | to | | | 16.55 | | | 7.51 | |
|
|
|
|
|
|
|
|
|
|
|
|
|
|
|
|
|
|
|
Outstanding at 12/31/05 | | 2,250,340 | | | — | | $ | 7.38 | | | to | | $ | 46.63 | | $ | 22.90 | |
|
|
|
|
|
|
|
|
|
|
|
|
|
|
|
|
|
|
|
The following table summarizes additional information about stock options outstanding and exercisable at December 31, 2005:
| | | | | | | | | | | | | | | | | | | |
|
|
|
|
|
|
|
|
|
|
|
|
|
|
|
|
|
|
|
|
| | | | | | | | Options Outstanding at
December 31, 2005 | | Options Exercisable at
December 31, 2005 |
| | | | | | | |
| |
|
| | | | | | | | | | Weighted Average | | | | | | |
| | | | | | | | | |
| | | | | | |
Range of
Exercise Prices | | Shares | | Remaining
Contract-
ual Life
(Years) | | Exercise
Price | | Shares | | Weighted
Average
Exercise
Price | |
|
|
|
|
|
|
|
|
|
|
|
|
$ | 7.38 | | to | | $ | 9.67 | | 64,460 | | 0.1 | | $ | 8.70 | | 64,460 | | $ | 8.70 | |
| 9.68 | | to | | | 17.88 | | 555,775 | | 3.5 | | | 15.23 | | 288,875 | | | 16.39 | |
| 17.89 | | to | | | 19.75 | | 716,650 | | 2.2 | | | 19.22 | | 716,650 | | | 19.22 | |
| 19.76 | | to | | | 25.65 | | 348,800 | | 0.8 | | | 22.93 | | 348,800 | | | 22.93 | |
| 25.66 | | to | | | 34.97 | | 322,655 | | 0.6 | | | 31.51 | | 322,655 | | | 31.51 | |
| 34.98 | | to | | | 46.63 | | 242,000 | | 0.0 | | | 43.72 | | 242,000 | | | 43.72 | |
|
|
|
|
|
|
|
|
|
|
|
|
|
|
|
|
|
|
|
|
$ | 7.38 | | to | | $ | 46.63 | | 2,250,340 | | 1.8 | | $ | 22.90 | | 1,983,440 | | $ | 24.11 | |
|
|
|
|
|
|
|
|
|
|
|
|
|
|
|
|
|
|
|
|
Stock options exercisable totaled 2,316,390 shares at December 31, 2004 and 2,127,610 shares at December 31, 2003. Stock options available for grant totaled 1,998,300 shares at December 31, 2005, 2,030,300 shares at December 31, 2004 and 642,625 shares at December 31, 2003.
During 2005, we granted 19,000 shares of restricted Tredegar common stock to senior management. During the first quarter of 2004, we granted 125,000 shares of restricted Tredegar common stock to senior management
59
(15,000 shares were cancelled in connection with employees leaving the company prior to full vesting). The weighted average price was $12.60 per share for grants in 2005 and $13.95 per share for grants in 2004. Compensation expense of approximately $240 for grants in 2005 and $1,535 for grants in 2004 (net of shares cancelled) is being amortized over weighted average vesting periods of approximately two years for grants in 2005 and five years for grants in 2004, subject to accelerated vesting based on meeting certain financial targets.
| |
11 | RETIREMENT PLANS AND OTHER POSTRETIREMENT BENEFITS |
|
|
We have noncontributory and contributory defined benefit (pension) plans covering most employees. The plans for salaried and hourly employees currently in effect are based on a formula using the participant’s years of service and compensation or using the participant’s years of service and a dollar amount.
In addition to providing pension benefits, we provide postretirement life insurance and health care benefits for certain groups of employees. Tredegar and retirees share in the cost of postretirement health care benefits, with employees retiring after July 1, 1993, receiving a fixed subsidy to cover a portion of their health care premiums. On December 8, 2003, the Medicare Prescription Drug Improvement and Modernization Act of 2003 (the “Act”) was signed into law. Our prescription drug benefits are not actuarially equivalent to the Act and therefore we do not expect that any federal subsidies will apply.
Assumptions used for financial reporting purposes to compute net benefit income or cost and benefit obligations, and the components of net periodic benefit income or cost, are as follows:
| | | | | | | | | | | | | | | | | | | |
|
|
|
|
|
|
|
|
|
|
|
|
|
|
|
|
|
|
|
|
| | Pension Benefits | | Other Post-
Retirement Benefits | |
| |
| |
|
|
| | 2005 | | 2004 | | 2003 | | 2005 | | 2004 | | 2003 | |
|
|
|
|
|
|
|
|
|
|
|
|
|
|
Weighted-average assumptions used to determine benefit obligations: | | | | | | | | | | | | | | | | | | | |
Discount rate | | | 5.70 | % | | 6.00 | % | | 6.25 | % | | 5.70 | % | | 6.00 | % | | 6.25 | % |
Rate of compensation increases | | | 4.00 | % | | 4.00 | % | | 4.00 | % | | 4.00 | % | | 4.00 | % | | 4.00 | % |
Weighted-average assumptions used to determine net periodic benefit cost: | | | | | | | | | | | | | | | | | | | |
Discount rate | | | 6.00 | % | | 6.25 | % | | 6.75 | % | | 6.00 | % | | 6.25 | % | | 6.75 | % |
Rate of compensation increases | | | 4.00 | % | | 4.00 | % | | 4.50 | % | | 4.00 | % | | 4.00 | % | | 4.50 | % |
Expected long-term return on plan assets, during the year | | | 8.40 | % | | 8.40 | % | | 8.60 | % | | n/a | | | n/a | | | n/a | |
Rate of increase in per-capita cost of covered health care benefits: | | | | | | | | | | | | | | | | | | | |
Indemnity plans, end of year | | | n/a | | | n/a | | | n/a | | | 6.00 | % | | 6.00 | % | | 6.00 | % |
Managed care plans, end of year | | | n/a | | | n/a | | | n/a | | | 6.00 | % | | 6.00 | % | | 6.00 | % |
Components of net periodic benefit income (cost): | | | | | | | | | | | | | | | | | | | |
Service cost | | $ | (6,469 | ) | $ | (5,519 | ) | $ | (5,851 | ) | $ | (109 | ) | $ | (115 | ) | $ | (101 | ) |
Interest cost | | | (12,661 | ) | | (12,283 | ) | | (11,842 | ) | | (576 | ) | | (562 | ) | | (584 | ) |
Employee contributions | | | 468 | | | 443 | | | 323 | | | — | | | — | | | — | |
Other | | | 12 | | | (212 | ) | | (98 | ) | | — | | | — | | | — | |
Expected return on plan assets | | | 22,050 | | | 22,678 | | | 23,003 | | | — | | | — | | | — | |
Amortization of: | | | | | | | | | | | | | | | | | | | |
Net transition asset | | | — | | | 7 | | | 8 | | | — | | | — | | | — | |
Prior service costs and gains or losses | | | (738 | ) | | (491 | ) | | (89 | ) | | 2 | | | 53 | | | 43 | |
|
|
|
|
|
|
|
|
|
|
|
|
|
|
|
|
|
|
|
|
Net periodic benefit income (cost) | | $ | 2,662 | | $ | 4,623 | | $ | 5,454 | | $ | (683 | ) | $ | (624 | ) | $ | (642 | ) |
|
|
|
|
|
|
|
|
|
|
|
|
|
|
|
|
|
|
|
|
60
The following tables reconcile the changes in benefit obligations and plan assets in 2005 and 2004, and reconcile the funded status to prepaid or accrued cost at December 31, 2005 and 2004:
| | | | | | | | | | | | | |
|
|
|
|
|
|
|
|
|
|
|
|
|
|
| | Pension Benefits | | Other Post-
Retirement Benefits | |
| |
| |
|
| | 2005 | | 2004 | | 2005 | | 2004 | |
|
|
|
|
|
|
|
|
|
|
Change in benefit obligation: | | | | | | | | | | | | | |
Benefit obligation, beginning of year | | $ | 214,037 | | $ | 196,460 | | $ | 9,994 | | $ | 9,440 | |
Service cost | | | 6,469 | | | 5,519 | | | 109 | | | 115 | |
Interest cost | | | 12,661 | | | 12,283 | | | 576 | | | 562 | |
Plan amendments | | | 1,372 | | | 88 | | | — | | | — | |
Effect of discount rate change | | | 10,424 | | | 6,997 | | | 326 | | | 377 | |
Employee contributions | | | 468 | | | 443 | | | — | | | — | |
Other | | | 3,500 | | | 2,087 | | | (290 | ) | | 25 | |
Benefits paid | | | (10,398 | ) | | (9,840 | ) | | (645 | ) | | (525 | ) |
|
|
|
|
|
|
|
|
|
|
|
|
|
|
Benefit obligation, end of year | | $ | 238,533 | | $ | 214,037 | | $ | 10,070 | | $ | 9,994 | |
|
|
|
|
|
|
|
|
|
|
|
|
|
|
Change in plan assets: | | | | | | | | | | | | | |
Plan assets at fair value, beginning of year | | $ | 247,505 | | $ | 233,759 | | $ | — | | $ | — | |
Actual return on plan assets | | | 18,487 | | | 22,428 | | | — | | | — | |
Employee contributions | | | 468 | | | 443 | | | — | | | — | |
Employer contributions | | | 1,158 | | | 830 | | | 645 | | | 525 | |
Other | | | (119 | ) | | (115 | ) | | — | | | — | |
Benefits paid | | | (10,398 | ) | | (9,840 | ) | | (645 | ) | | (525 | ) |
|
|
|
|
|
|
|
|
|
|
|
|
|
|
Plan assets at fair value, end of year | | $ | 257,101 | | $ | 247,505 | | $ | — | | $ | — | |
|
|
|
|
|
|
|
|
|
|
|
|
|
|
Reconciliation of prepaid (accrued) cost: | | | | | | | | | | | | | |
Funded status of the plans | | $ | 18,568 | | $ | 33,468 | | $ | (10,070 | ) | $ | (9,993 | ) |
Unrecognized net transition (asset) obligation | | | — | | | — | | | — | | | — | |
Unrecognized prior service cost | | | 4,303 | | | 3,421 | | | — | | | — | |
Unrecognized net (gain) loss | | | 62,776 | | | 44,859 | | | (8 | ) | | (20 | ) |
|
|
|
|
|
|
|
|
|
|
|
|
|
|
Prepaid (accrued) cost, end of year | | $ | 85,647 | | $ | 81,748 | | $ | (10,078 | ) | $ | (10,013 | ) |
|
|
|
|
|
|
|
|
|
|
|
|
|
|
Amounts recognized in the consolidated balance sheets: | | | | | | | | | | | | | |
Prepaid benefit cost | | $ | 85,647 | | $ | 81,748 | | $ | — | | $ | — | |
Accrued benefit liability | | | (4,832 | ) | | (3,000 | ) | | (10,078 | ) | | (10,013 | ) |
Intangible asset | | | 1,145 | | | 1,222 | | | — | | | — | |
Deferred tax liability | | | 1,253 | | | 622 | | | — | | | — | |
Accumulated other comprehensive loss | | | 2,434 | | | 1,156 | | | — | | | — | |
|
|
|
|
|
|
|
|
|
|
|
|
|
|
Net amount recognized | | $ | 85,647 | | $ | 81,748 | | $ | (10,078 | ) | $ | (10,013 | ) |
|
|
|
|
|
|
|
|
|
|
|
|
|
|
Net benefit income or cost is determined using assumptions at the beginning of each year. Funded status is determined using assumptions at the end of each year.
At December 31, 2005, the effect of a 1% change in the health care cost trend rate assumptions would be immaterial.
61
Expected benefit payments over the next five years and in the aggregate for 2011-2015 are as follows:
| | | | | | | |
|
|
|
|
|
|
|
|
Years | | Pension
Benefits | | Other
Post-
Retirement
Benefits | |
|
|
|
|
|
|
2006 | | $ | 10,600 | | $ | 481 | |
2007 | | | 11,063 | | | 516 | |
2008 | | | 11,934 | | | 551 | |
2009 | | | 12,535 | | | 589 | |
2010 | | | 13,038 | | | 630 | |
2011 - 2015 | | | 75,632 | | | 3,542 | |
|
|
|
|
|
|
|
|
Prepaid pension cost of $85,647 at December 31, 2005 and $81,748 at December 31, 2004, is included in “Other assets and deferred charges” in the consolidated balance sheets. The accrued benefit liability of $4,832 and the intangible asset of $1,145 at December 31, 2005, and the accrued benefit liability of $3,000 and the intangible asset of $1,222 at December 31, 2004, are also included in “Other assets and deferred charges” in the consolidated balance sheets. Accrued postretirement benefit cost of $10,078 at December 31, 2005 and $10,013 at December 31, 2004, is included in “Other noncurrent liabilities” in the consolidated balance sheets.
The percentage composition of assets held by pension plans at December 31, 2005 and 2004, and the current expected long-term return on assets are as follows:
| | | | | | | | | | |
|
|
|
|
|
|
|
|
|
|
|
| | % Composition
of Plan Assets | | Expected |
| |
| | Long-term |
December 31 | | 2005 | | 2004 | | Return % |
|
|
|
|
|
|
|
|
Pension plans related to operations in the U.S.: | | | | | | | | | | |
Low-risk fixed income securities | | | 14.1 | % | | 18.1 | % | | 5.0 | % |
|
|
|
|
|
|
|
|
|
|
|
Large capitalization equity securities | | | 19.1 | | | 19.6 | | | 9.2 | |
Mid-capitalization equity securities | | | 7.3 | | | 7.3 | | | 9.8 | |
Small-capitalization equity securities | | | 4.3 | | | 4.1 | | | 10.4 | |
International equity securities | | | 22.4 | | | 19.1 | | | 10.4 | |
|
|
|
|
|
|
|
|
|
|
|
Total equity securities | | | 53.1 | | | 50.1 | | | 9.9 | |
|
|
|
|
|
|
|
|
|
|
|
Hedge and private equity funds | | | 21.0 | | | 20.9 | | | 7.8 | |
Other assets | | | 2.3 | | | 2.5 | | | 4.0 | |
|
|
|
|
|
|
|
|
|
|
|
Total for pension plans related to operations in the U.S. | | | 90.5 | | | 91.6 | | | 8.5 | |
|
|
|
|
|
|
|
|
|
|
|
Pension plans related to operations in Canada | | | 9.5 | | | 8.4 | | | 7.0 | |
|
|
|
|
|
|
|
|
|
|
|
Total | | | 100.0 | % | | 100.0 | % | | 8.4 | % |
|
|
|
|
|
|
|
|
|
|
|
Our targeted allocation percentage for pension plan assets is in the range of the percentage composition that existed at December 31, 2005. Expected long-term returns are estimated by asset class and generally are based on inflation-adjusted historical returns, volatilities and risk premiums. For pension plans related to operations in the U.S., the portfolio of fixed income securities is structured with maturities that generally match estimated benefit payments over the next three years. We believe that over the long term a diversified portfolio of equity securities, hedge funds and private equity funds have a better risk-return profile than fixed income securities. The average remaining duration of benefit payments for our pension plans is about 14 years. We expect our required contributions to approximate $800 in 2006.
The accumulated benefit obligation was $223,821 at December 31, 2005 and $196,715 at December 31, 2004. The projected benefit obligation, accumulated benefit obligation and fair value of plan assets for plans with accumulated benefit obligations in excess of plan assets were $13,200, $13,200 and $10,607, respectively, at December 31, 2005, and $10,132, $10,132 and $8,199, respectively, at December 31, 2004.
We also have a non-qualified supplemental pension plan covering certain employees. Effective December 31, 2005, further participation in this plan was terminated and benefit accruals for existing participants were frozen. The
62
plan was designed to restore all or a part of the pension benefits that would have been payable to designated participants from our principal pension plans if it were not for limitations imposed by income tax regulations. The projected benefit obligation relating to this unfunded plan was $2,655 at December 31, 2005 and $2,081 at December 31, 2004. Pension expense recognized was $256 in 2005, $275 in 2004 and $249 in 2003. This information has been included in the preceding pension benefit tables.
Approximately 150 employees at our films manufacturing facility in Kerkrade, The Netherlands are covered by a collective bargaining agreement that includes participation in a multi-employer pension plan. Pension expense recognized for participation in this plan, which is equal to required contributions, was $364 in 2005, $281 in 2004 and $216 in 2003. This information has been excluded from the preceding pension benefit tables.
We have a savings plan that allows eligible employees to voluntarily contribute a percentage (generally up to 10%) of their compensation. Under the provisions of the plan, we match a portion (generally 50%) of the employee’s contribution to the plan with shares of our common stock. We also have a non-qualified plan that restores matching benefits for employees suspended from the savings plan due to certain limitations imposed by income tax regulations. Charges recognized for these plans were $1,889 in 2005, $2,716 in 2004 and $2,697 in 2003. Our liability under the restoration plan was $782 at December 31, 2005 (consisting of 60,674 phantom shares of common stock) and $1,288 at December 31, 2004 (consisting of 63,730 phantom shares of common stock) valued at the closing market price on those dates.
The Tredegar Corporation Benefits Plan Trust (the “Trust”) purchased 7,200 shares of our common stock in 1998 for $192 and 46,671 shares of our common stock in 1997 for $1,020, as a partial hedge against the phantom shares held in the restoration plan. There have been no shares purchased since 1997 except for re-invested dividends. The cost of the shares held by the Trust is shown as a reduction to shareholders’ equity in the consolidated balance sheets.
| |
13 | RENTAL EXPENSE AND CONTRACTUAL COMMITMENTS |
|
|
Rental expense for continuing operations was $3,987 in 2005, $4,549 in 2004 and $3,822 in 2003. Rental commitments under all non-cancelable operating leases as of December 31, 2005, are as follows:
| | | | |
|
|
|
|
|
Year | | Amount | |
|
|
|
|
2006 | | $ | 3,608 | |
2007 | | | 3,475 | |
2008 | | | 3,088 | |
2009 | | | 2,070 | |
2010 | | | 2,073 | |
Remainder | | | 1,920 | |
|
|
|
|
|
Total | | $ | 16,234 | |
|
|
|
|
|
AFBS, Inc. (formerly known as Therics, Inc.), a wholly-owned subsidiary of Tredegar, has future rental commitments under noncancelable operating leases through 2011 (most of which contain sublease options) totaling $8,338. These future rental commitments are included in the above table. Sublease rental commitments relating to excess space at AFBS total about $1,300 (excluded from the above table).
Contractual obligations for plant construction and purchases of real property and equipment amounted to $14,628 at December 31, 2005 and $16,108 at December 31, 2004.
63
Income from continuing operations before income taxes and income taxes are as follows:
| | | | | | | | | | |
|
|
|
|
|
|
|
|
|
|
|
| | 2005 | | 2004 | | 2003 | |
|
|
|
|
|
|
|
|
Income from continuing operations before income taxes: | | | | | | | | | | |
Domestic | | $ | 19,709 | | $ | 27,875 | | $ | 16,605 | |
Foreign | | | 6,493 | | | 7,607 | | | 13,439 | |
|
|
|
|
|
|
|
|
|
|
|
Total | | $ | 26,202 | | $ | 35,482 | | $ | 30,044 | |
|
|
|
|
|
|
|
|
|
|
|
Current income taxes: | | | | | | | | | | |
Federal | | $ | 1,853 | | $ | (2 | ) | $ | 4,345 | |
State | | | 811 | | | 1,105 | | | 368 | |
Foreign | | | (1,908 | ) | | 6,996 | | | 2,689 | |
|
|
|
|
|
|
|
|
|
|
|
Total | | | 756 | | | 8,099 | | | 7,402 | |
|
|
|
|
|
|
|
|
|
|
|
Deferred income taxes: | | | | | | | | | | |
Federal | | | 7,900 | | | 3,385 | | | 649 | |
State | | | 600 | | | 1,198 | | | 936 | |
Foreign | | | 717 | | | (3,460 | ) | | 1,730 | |
|
|
|
|
|
|
|
|
|
|
|
Total | | | 9,217 | | | 1,123 | | | 3,315 | |
|
|
|
|
|
|
|
|
|
|
|
Total income taxes | | $ | 9,973 | | $ | 9,222 | | $ | 10,717 | |
|
|
|
|
|
|
|
|
|
|
|
The decline in foreign income from continuing operations is primarily due to higher intercompany royalty charges. Operating profit from foreign operations excluding intercompany transactions increased in 2005 and 2004.
The significant differences between the U.S. federal statutory rate and the effective income tax rate for continuing operations are as follows:
| | | | | | | | | | |
|
|
|
|
|
|
|
|
|
|
|
| | Percent of Income Before Income
Taxes for Continuing Operations | |
| |
|
|
| | 2005 | | 2004 | | 2003 | |
|
|
|
|
|
|
|
|
Income tax expense at federal statutory rate | | | 35.0 | | | 35.0 | | | 35.0 | |
State taxes, net of federal income tax benefit | | | 3.5 | | | 4.2 | | | 2.8 | |
Unremitted earnings from foreign operations | | | 2.3 | | | (.1 | ) | | 1.5 | |
Valuation allowance for capital loss carry-forwards | | | 2.2 | | | — | | | — | |
Valuation allowance for foreign operating loss carry-forwards | | | 1.6 | | | 1.7 | | | — | |
Non-deductible expenses | | | .6 | | | .8 | | | 1.0 | |
Foreign rate differences | | | — | | | 1.0 | | | — | |
Research and development tax credit | | | (1.6 | ) | | (1.9 | ) | | (1.7 | ) |
Tax-exempt income | | | (1.6 | ) | | — | | | (1.0 | ) |
Extraterritorial Income Exclusion | | | (2.4 | ) | | (2.3 | ) | | (2.8 | ) |
Reversal of income tax contingency accruals | | | — | | | (11.3 | ) | | — | |
Other | | | (1.5 | ) | | (1.1 | ) | | .9 | |
|
|
|
|
|
|
|
|
|
|
|
Effective income tax rate | | | 38.1 | | | 26.0 | | | 35.7 | |
|
|
|
|
|
|
|
|
|
|
|
64
Deferred tax liabilities and deferred tax assets at December 31, 2005 and 2004, are as follows:
| | | | | | | |
|
|
|
|
|
|
December 31 | | 2005 | | 2004 | |
|
|
|
|
|
|
Deferred tax liabilities: | | | | | | | |
Depreciation | | $ | 37,438 | | $ | 37,057 | |
Pensions | | | 30,595 | | | 29,885 | |
Foreign currency translation gain adjustment | | | 7,686 | | | 10,619 | |
Amortization of goodwill | | | 11,627 | | | 7,975 | |
Unrealized gain on available-for-sale securities | | | 12 | | | — | |
Derivative financial instruments | | | 437 | | | 497 | |
Other | | | 351 | | | 779 | |
|
|
|
|
|
|
|
|
Total deferred tax liabilities | | | 88,146 | | | 86,812 | |
|
|
|
|
|
|
|
|
Deferred tax assets: | | | | | | | |
Employee benefits | | | 5,244 | | | 5,810 | |
Tax benefit on U.S. foreign and R&D tax credits and NOL carryforwards | | | 7,895 | | | 10,979 | |
Asset write-offs, divestitures and environmental accruals | | | 2,602 | | | 4,547 | |
Allowance for doubtful accounts and sales returns | | | 1,086 | | | 1,119 | |
Tax in excess of book basis for venture capital and other investments (net of valuation allowance of $577 in 2005) | | | 1,863 | | | 638 | |
Inventory | | | 329 | | | 131 | |
Other (net of valuation allowance of $1,020 in 2005 and $600 in 2004) | | | 2,618 | | | 2,628 | |
|
|
|
|
|
|
|
|
Total deferred tax assets | | | 21,637 | | | 25,852 | |
|
|
|
|
|
|
|
|
Net deferred tax liability | | $ | 66,509 | | $ | 60,960 | |
|
|
|
|
|
|
|
|
Included in the balance sheet: | | | | | | | |
Noncurrent deferred tax liabilities in excess of assets | | $ | 74,287 | | $ | 71,141 | |
Current deferred tax assets in excess of liabilities | | | 7,778 | | | 10,181 | |
|
|
|
|
|
|
|
|
Net deferred tax liability | | $ | 66,509 | | $ | 60,960 | |
|
|
|
|
|
|
|
|
As of December 31, 2005, Tredegar had net operating loss, foreign tax credit and R&D tax credit carry-forwards in the U.S. that expire as follows:
| | | | | | | | | | | | | | | | | | | |
|
|
U.S. Tax Carry-Forward Items at December 31, 2005 by Year of Expiration | |
|
|
| | Deferred Income Tax Assets | | Estimated Minimum Future Taxable
Income Required to Realize Deferred
Income Tax Assets | |
| |
| |
| |
Year of
Expiration | | Foreign
Tax
Credits | | R&D Tax
Credits | | Total | | Foreign
Tax
Credits | | R&D Tax
Credits | | Total | |
|
|
|
|
|
|
|
|
|
|
|
|
|
|
2013 | | $ | 205 | | $ | — | | $ | 205 | | $ | 586 | | $ | — | | $ | 586 | |
2014 | | | 2,917 | | | — | | | 2,917 | | | 8,334 | | | — | | | 8,334 | |
2021 | | | — | | | 1,403 | | | 1,403 | | | — | | | 4,009 | | | 4,009 | |
2022 | | | — | | | 1,185 | | | 1,185 | | | — | | | 3,386 | | | 3,386 | |
2023 | | | — | | | 690 | | | 690 | | | — | | | 1,971 | | | 1,971 | |
2024 | | | — | | | 551 | | | 551 | | | — | | | 1,574 | | | 1,574 | |
2025 | | | — | | | 415 | | | 415 | | | — | | | 1,186 | | | 1,186 | |
|
|
|
|
|
|
|
|
|
|
|
|
|
|
|
|
|
|
|
|
Total | | $ | 3,122 | | $ | 4,244 | | $ | 7,366 | | $ | 8,920 | | $ | 12,126 | | $ | 21,046 | |
|
|
|
|
|
|
|
|
|
|
|
|
|
|
|
|
|
|
|
|
The table above excludes U.S. federal alternative minimum tax credit carry-forwards and state income tax carry-forwards totaling $529. We believe that it is more likely than not that the timing of future taxable income in the U.S. will be sufficient to cover future tax deductible amounts related to the deferred income tax assets for carry-forward items. Accordingly, no valuation allowance has been recognized for these items. However, a valuation allowance of approximately $1,020 is included in other deferred tax assets that offsets an amount included in that line item relating to
65
possible future tax benefits on operating losses generated by certain foreign subsidiaries that may not be recoverable in the carry-forward period. In addition, a valuation allowance of $577 was established in 2005 in conjunction with the write-down of our investment in Novalux (see Note 2) for expected limitations on the utilization of assumed capital losses. At December 31, 2005, we had current and non-current income taxes recoverable of $7,163 and $5,803, respectively. The current portion primarily relates to income taxes recoverable at Film Products’ subsidiary in The Netherlands. The non-current portion, included in “Other assets and deferred charges” in the consolidated balance sheets, primarily relates to U.S. federal income taxes receivable resulting from filing various refund claims for foreign tax credit, capital loss and net operating loss carry backs to prior years still under review by the U.S. Internal Revenue Service. We do not expect the review to be completed before 2007. Accordingly, this portion of our income taxes recoverable has been classified as non-current.
| |
15 | LOSSES ASSOCIATED WITH PLANT SHUTDOWNS, ASSET IMPAIRMENTS AND RESTRUCTURINGS, UNUSUAL ITEMS, GAINS FROM SALE OF ASSETS AND OTHER ITEMS |
|
|
Losses associated with plant shutdowns, asset impairments and restructurings, net of gains on sale of related assets, in 2005 totaled $14,606 ($9,372 after taxes) and include:
| |
• | A fourth-quarter charge of $269 ($174 after taxes) and a second-quarter charge of $10,049 ($6,532 after taxes) related to the sale or assignment of substantially all of AFBS’ (formerly Therics) assets, including asset impairment charges of $5,638, lease-related losses of $3,326 and severance (31 people) and other transaction-related costs of $1,354 (see below for additional information on the transaction); |
| |
• | Fourth-quarter charges of $397 ($256 after taxes), third-quarter charges of $906 ($570 after taxes), second-quarter charges of $500 ($317 after taxes) and first-quarter charges of $418 ($266 after taxes) related to severance and other employee-related costs associated with restructurings in Film Products ($1,118 before taxes) and Aluminum Extrusions ($648 before taxes) and at corporate headquarters ($455 before taxes; included in “Corporate expenses, net” in the operating profit by segment table in Note 3) (an aggregate of 21 people were affected by these restructurings); |
| |
• | A fourth-quarter charge of $2,101 ($1,263 after taxes) related to the planned shutdown of the films manufacturing facility in LaGrange, Georgia, including asset impairment charges of $1,615 and severance (15 people) and other costs of $486 (we anticipate recognizing additional shutdown-related costs of about $1,700 in the first half of 2006); |
| |
• | A fourth-quarter gain of $1,862 ($1,193 after taxes), a third-quarter charge of $198 ($127 after taxes), a second-quarter net gain of $71 ($46 after taxes) and a first-quarter charge of $470 ($301 after taxes) related to the shutdown of the aluminum extrusions facility in Aurora, Ontario, including a $1,667 gain on the sale of the facility (included in “Other income (expense), net” in the consolidated statements of income) and $1,111 of shutdown-related costs partially offset by the reversal to income of certain accruals associated with severance and other costs of $709; |
| |
• | A second-quarter charge of $27 ($16 after taxes) and a first-quarter gain of $1,618 ($973 after taxes) related to the shutdown of the films manufacturing facility in New Bern, North Carolina, including a $1,816 gain on the sale of the facility (included in “Other income (expense), net” in the consolidated statements of income), partially offset by shutdown-related expenses of $225; |
| |
• | A first-quarter charge of $1,019 ($653 after taxes) for process reengineering costs associated with the implementation of a global information system in Film Products (included in “Costs of goods sold” in the consolidated statements of income); |
| |
• | Fourth-quarter charges of $118 ($72 after taxes), third-quarter charges of $595 ($359 after taxes), second-quarter charges of $250 ($150 after taxes) partially offset by a net first-quarter gain of $120 ($72 after taxes) related to severance and other employee-related accruals associated with the restructuring of the research and development operations in Film Products (of this amount, $1,366 in pretax charges for employee relocation and recruitment is included in SG&A expenses in the consolidated statements of income); |
| |
• | A second-quarter gain of $653 ($392 after taxes) related to the shutdown of the films manufacturing facility in Carbondale, Pennsylvania, including a $630 gain on the sale of the facility (included in “Other income (expense), net” in the consolidated statements on income), and the reversal to income of certain shutdown-related accruals of $23. |
| |
| |
• | Fourth-quarter charges of $583 ($351 after taxes) for asset impairments in Film Products; |
66
| |
• | A net fourth-quarter charge of $495 ($310 after taxes) in Aluminum Extrusions, including an asset impairment of $597, partially offset by the reversal to income of certain shutdown-related accruals of $102; |
| |
• | Fourth-quarter charges of $31 ($19 after taxes), third-quarter charges of $117 ($70 after taxes), second-quarter charges of $105 ($63 after taxes) and first-quarter charges of $100 ($60 after taxes) for accelerated depreciation related to restructurings in Film Products; and |
| |
• | A fourth-quarter charge of $182 ($119 after taxes) in Film Products related to the write-off of an investment. |
On June 30, 2005, substantially all of the assets of AFBS, Inc. (formerly known as Therics, Inc.), a wholly-owned subsidiary of Tredegar, were sold or assigned to a newly-created limited liability company, Therics, LLC, controlled and managed by an individual not affiliated with Tredegar. AFBS received a 17.5% equity interest in Therics, LLC, valued at $170 and a 3.5% interest in Theken Spine, LLC, valued at $800, along with potential future payments based on the sale of certain products by Therics, LLC. AFBS retained substantially all of its liabilities in the transaction, which included customary indemnification provisions for pre-transaction liabilities. Tredegar has no obligation or intent to fund any future losses that may occur at Therics, LLC or Theken Spine, LLC. The ownership interest in Therics, LLC is accounted for under the equity method of accounting with losses limited to its initial carrying value of $170. The ownership interest in Theken Spine, LLC is accounted for under the cost method, with an impairment loss recognized and a new cost basis established for any write-down to estimated fair value, if necessary. The potential future payments due from Therics, LLC based on the sale of certain products will be recognized as income when earned. AFBS had operating losses of $3,467 during the first six months of 2005 and $9,763 in 2004.
See Note 2 for information regarding the write-down in 2005 of our investment in Novalux, Inc.
Gain on sale of corporate assets in 2005 includes a pretax gain of $61 related to the sale of corporate real estate. This gain is included in “Other income (expense), net” in the consolidated statements of income and separately shown in the operating profit by segment table in Note 3.
During the first quarter of 2005, we recognized a pretax gain for interest receivable on tax refund claims of $508 ($327 after taxes) (included in “Other income (expense), net” in the consolidated statements of income and “Corporate expenses, net” in the operating profit by segment table in Note 3).
Losses associated with plant shutdowns, asset impairments and restructurings in 2004 totaled $23,032 ($15,192 after taxes) and include:
| |
• | A fourth-quarter charge of $84 ($56 after taxes), a third-quarter charge of $828 ($537 after taxes), a second-quarter charge of $994 ($647 after taxes) and a first-quarter charge of $666 ($432 after taxes) related to accelerated depreciation from plant shutdowns and restructurings in Film Products; |
| |
• | A fourth-quarter charge of $569 (of this amount, $59 for employee relocation is included in selling, general and administrative expenses in the consolidated statements of income) ($369 after taxes) and a third-quarter charge of $709 ($461 after taxes) related to severance for 30 people and other employee-related costs associated with the restructuring of the R&D operations in Film Products, including costs associated with relocating R&D functions to Richmond, Virginia; |
| |
• | A fourth-quarter charge of $639 ($415 after taxes), a third-quarter charge of $617 ($401 after taxes), a second-quarter charge of $300 ($195 after taxes) and a first-quarter charge of $537 ($349 after taxes) primarily related to severance (63 people) and other employee-related costs associated with the shutdown of the films manufacturing facility in New Bern, North Carolina (the shut down was completed in the fourth quarter of 2004); |
| |
• | A third-quarter charge of $357 ($329 after taxes) and a second-quarter charge of $2,665 ($1,858 after taxes) for the loss on the sale of the films business in Argentina (proceeds net of transaction costs were $803 ($401 net of cash included in business sold)); |
| |
• | A fourth-quarter charge of $352 ($228 after taxes), a third-quarter charge of $195 ($127 after taxes) and a first-quarter charge of $9,580 ($6,228 after taxes) related to the planned shutdown of an aluminum extrusions facility in Aurora, Ontario, including asset impairment charges of $7,130 and severance and other employee-related costs of $2,450 (these costs were contractually-related for about 100 people and have been immediately accrued); |
| |
• | A third-quarter charge of $170 ($111 after taxes) for additional costs incurred related to a plant shutdown in Film Products; |
| |
• | A second-quarter charge of $300 ($195 after taxes), partially offset by a fourth-quarter gain of $104 ($68 after |
67
| |
| taxes), related to the loss on the sale of the previously shutdown films manufacturing facility in Manchester, Iowa; |
| |
• | A fourth-quarter charge of $427 ($277 after taxes) and a second-quarter charge of $879 ($571 after taxes) related to the estimated loss on the sub-lease of a portion of the AFBS facility in Princeton, New Jersey; |
| |
• | Second-quarter charges of $575 ($374 after taxes) in Film Products and $146 ($95 after taxes) in Aluminum Extrusions related to asset impairments; and |
| |
• | Fourth-quarter charges of $1,402 ($912 after taxes) related to severance and other employee-related costs associated with restructurings in Therics ($590 before taxes), Film Products ($532 before taxes) and Aluminum Extrusions ($280 before taxes) and a second-quarter charge of $145 ($94 after taxes) related to severance at AFBS (an aggregate of 24 people were affected by these restructurings). |
Gain on sale of corporate assets in 2004 includes a fourth-quarter gain on the sale of land of $1,013 ($649 after taxes and proceeds of $1,271), a second-quarter gain on the sale of land of $413 ($268 after taxes and proceeds of $647) and a first-quarter gain on the sale of public equity securities of $6,134 ($3,987 after taxes and proceeds of $7,182). These gains are included in “Other income (expense), net” in the consolidated statements of income and separately shown in the operating profit by segment table in Note 3.
Income taxes in 2004 include a third-quarter tax benefit of $4,000 related to the reversal of income tax contingency accruals upon the favorable conclusion of IRS and state examinations through 2000.
The other gain of $7,316 ($4,756 after taxes) included in the Aluminum Extrusions section of the operating profit by segment table in Note 3 is comprised of the present value of an insurance settlement of $8,357 (future value of $8,455) associated with environmental matters related to prior years, partially offset by accruals for expected future environmental costs of $1,041. The company received $5,143 of the $8,455 insurance settlement in September of 2004 and recognized receivables at present value for future amounts due ($1,497 received in February of 2005 and $1,717 received in February 2006). The gain from the insurance settlement is included in “Other income (expense), net” in the consolidated statements of income, while the accruals for expected future environmental costs are included in “Cost of goods sold.”
In 2003, losses associated with plant shutdowns, asset impairments and restructurings totaling $11,426 ($7,350 after taxes) included:
| |
• | A fourth-quarter charge of $875 ($560 after taxes) for asset impairments in the films business, including charges of $466 ($298 after taxes) relating to accelerated depreciation of assets at the films manufacturing facility in New Bern, North Carolina; |
| |
• | A fourth-quarter charge of $611 ($391 after taxes) for approximately 50% of the total severance costs for 63 people and other employee-related costs in connection with the shutdown of the films manufacturing facility in New Bern, North Carolina; |
| |
• | A third-quarter charge of $945 ($605 after taxes) relating to accelerated depreciation of assets at the films manufacturing facility in New Bern, North Carolina; |
| |
• | A third-quarter charge of $299, a second-quarter charge of $53 and a first-quarter charge of $85 (collectively $280 after taxes) for additional costs incurred related to the shutdown of the films plants in Tacoma, Washington, Carbondale, Pennsylvania and Manchester, Iowa; |
| |
• | A third-quarter charge of $322 ($206 after taxes) for additional severance and other employee-related costs in connection with a previously announced restructuring in Film Products; |
| |
• | A third-quarter charge of $2,151 ($1,398 after taxes) and a second-quarter charge of $549 ($357 after taxes) related to the estimated loss on the sub-lease of a portion of the AFBS facility in Princeton, New Jersey; |
| |
• | A third-quarter charge of $256 ($163 after taxes) for severance for seven people and other employee-related costs in connection with restructurings in Aluminum Extrusions; |
| |
• | A second-quarter charge of $3,936 ($2,530 after taxes) for severance for 47 people and other employee-related costs in connection with restructurings in Film Products ($1,600 before taxes), corporate headquarters ($1,181 before taxes and included in “Corporate expenses, net” in the operating profit by segment table in Note 3) and AFBS ($1,155 before taxes); |
| |
• | A second-quarter charge of $956 ($612 after taxes) for asset impairments in the films business, including charges of $312 ($200 after taxes) related to accelerated depreciation of assets at the films manufacturing facility in New Bern, North Carolina; and |
| |
• | A second-quarter charge of $388 ($248 after taxes) related to an early retirement program for 10 people in |
68
The loss from unusual items in 2003 of $1,067 ($694 after taxes) relates to a first-quarter charge to adjust depreciation and amortization at AFBS based on Tredegar's decision to suspend divestiture efforts. Results for 2003 also included a fourth-quarter gain of $1,385 ($886 after taxes) on the sale of land at the facility in Richmond Hill, Ontario (total proceeds of approximately $1,800), and gains totaling $5,155 ($3,325 after taxes) on the sale of corporate assets. The gains from the sale of corporate assets included:
| |
• | A fourth-quarter gain of $2,554 ($1,647 after taxes) from the sale of 547,500 shares of Illumina, Inc. common stock (NASDAQ: ILMN) for total proceeds of $3,791; |
| |
• | A fourth-quarter gain of $355 ($229 after taxes) from the sale of 64,150 shares of Vascular Solutions, Inc. common stock (NASDAQ: VASC) for total proceeds of $403; |
| |
• | A third-quarter gain of $942 ($608 after taxes) from the sale of 200,000 shares of VASC for total proceeds of $1,092; and |
| |
• | A third-quarter gain of $1,289 and fourth-quarter gain of $15 (collectively $841 after taxes) from the sale of corporate real estate (total proceeds of approximately $1,800). |
The gains from the sale of land and corporate assets are included in “Other income (expense), net” in the consolidated statements of income and separately shown in the segment operating profit table in Note 3.
We are involved in various stages of investigation and remediation relating to environmental matters at certain current and former plant locations. Where we have determined the nature and scope of any required environmental remediation activity, estimates of cleanup costs have been obtained and accrued. As we continue efforts to maintain compliance with applicable environmental laws and regulations, additional contingencies may be identified. If additional contingencies are identified, our practice is to determine the nature and scope of those contingencies, obtain and accrue estimates of the cost of remediation, and perform remediation. We do not believe that additional costs that could arise from those activities will have a material adverse effect on our financial position. However, those costs could have a material adverse effect on quarterly or annual operating results at that time.
We are involved in various other legal actions arising in the normal course of business. After taking into consideration legal counsels’ evaluation of these actions, we believe that we have sufficiently accrued for probable losses and that the actions will not have a material adverse effect on our financial position. However, the resolution of the actions in a future period could have a material adverse effect on quarterly or annual operating results at that time.
From time to time, we enter into transactions with third parties in connection with the sale of assets or businesses in which we agree to indemnify the buyers or third parties involved in the sale for certain liabilities or risks related to the assets or business. Also, in the ordinary course of our business, we may enter into agreements with third parties for the sale of goods or services that may contain indemnification provisions. In the event that an indemnification claim is asserted, liability for indemnification would be subject to an assessment of the underlying facts and circumstances under the terms of the applicable agreement. Further, any indemnification payments may be limited or barred by a monetary cap, a time limitation, or a deductible or basket. For these reasons, we are unable to estimate the maximum potential amount of the potential future liability under the indemnity provisions of these agreements. We do, however, accrue for losses for any known contingent liability, including those that may arise from indemnification provisions, when future payment is probable. We disclose contingent liabilities if the probability of loss is reasonably possible and significant.
| |
17 | DISCONTINUED OPERATIONS |
|
|
On March 7, 2003, Tredegar Investments, Inc. (“Tredegar Investments”) reached definitive agreements to sell substantially all of its portfolio of private equity partnership interests to GS Vintage Funds II, which are investment partnerships managed by Goldman Sachs Asset Management’s Private Equity Group. On the same date and in a separate transaction, Tredegar Investments also agreed to sell to W Capital Partners, an independent private equity manager, the
69
subsidiary funds that hold substantially all of Tredegar Investments’ direct venture capital investments. The sale of these fund interests included the assumption by the buyer of Tredegar Investments’ obligations to make additional capital contributions to those funds in the future.
The sale to W Capital Partners of the subsidiary funds that hold the direct investments occurred on March 7, 2003. The sale of the private equity fund interests occurred in a series of closings. Net proceeds from the sales totaled $21,504. Additionally, in the first quarter of 2004 we received income tax recoveries of approximately $55,000 from the carry-back of 2003 capital losses generated by these sales against gains realized in 2000 by Tredegar Investments.
The agreements governing these transactions contain customary contingent indemnification provisions that Tredegar believes will not have a material effect on its financial position or results of operations.
The operating results associated with venture capital investment activities have been reported as discontinued operations. A summary of venture capital investment activities through disposal in 2003 is provided below:
| | | | |
|
|
|
|
(In Thousands) | | 2003 | |
|
|
|
|
Carrying value of venture capital investments, beginning of period | | $ | 93,765 | |
Venture capital investment activity for period: | | | | |
(pre-tax amounts): | | | | |
New investments | | | 2,807 | |
Proceeds from the sale of investments, including broker receivables at end of period | | | (21,504 | ) |
Realized gains | | | — | |
Realized losses, write-offs and write-downs | | | (70,256 | ) |
(Decrease) increase in unrealized gain on available-for-sale securities | | | (917 | ) |
Carrying value of public securities retained by Tredegar Investments* | | | (3,895 | ) |
|
|
|
|
|
Carrying value of venture capital investments, end of period | | $ | — | |
|
|
|
|
|
Summary of amounts reported as discontinued operations in the consolidated statements of income: | | | | |
Pretax gains (losses), net | | $ | (70,256 | ) |
Operating expenses (primarily management fee expenses) | | | (599 | ) |
|
|
|
|
|
Loss before income taxes | | | (70,855 | ) |
Income tax benefits | | | 24,286 | |
|
|
|
|
|
Loss from venture capital investment activities | | $ | (46,569 | ) |
|
|
|
|
|
| |
* | At December 31, 2003, Tredegar Investments held 596,492 shares of Vascular Solutions, Inc. (NASDAQ: VASC) and 265,955 shares of Illumina, Inc. (NASDAQ: ILMN). These securities, which were related to Tredegar Investments' earlier venture capital investment activities, were sold in 2004 for $7,182, including gains recognized of $6,134 ($3,987 after taxes). |
Loss from venture capital investment activities in 2003 of $70,855 ($46,569 after taxes) includes a loss on the sale of $70,256 ($46,269 after taxes). Discontinued operations in 2004 include an after-tax gain associated with venture capital investment activities of $2,921 primarily related to the reversal of business and occupancy tax contingency accruals upon favorable resolution.
On July 2, 2002, the operations at Molecumetics, a healthcare-related biotech company, ceased. The operating results of Molecumetics have been reported as discontinued operations. Discontinued operations include a gain of $1,393 ($891 after taxes) in 2003 on the sale of intellectual property of Molecumetics.
Cash flows for discontinued operations have not been separately disclosed in the accompanying statement of cash flows.
70
|
SELECTED QUARTERLY FINANCIAL DATA |
|
Tredegar Corporation and Subsidiaries |
(In thousands, except per-share amounts) |
(Unaudited) |
| | | | | | | | | | | | | | | | |
|
|
|
|
|
|
|
|
|
|
|
|
|
| | First | | Second | | Third | | Fourth | | | | |
| | Quarter | | Quarter | | Quarter | | Quarter | | Year | |
|
|
|
|
|
|
|
|
|
|
|
|
2005 | | | | | | | | | | | | | | | | |
|
|
|
|
|
|
|
|
|
|
|
|
|
|
|
|
|
Sales | | $ | 232,757 | | $ | 243,724 | | $ | 240,716 | | $ | 239,772 | | $ | 956,969 | |
Gross profit | | | 28,462 | | | 33,245 | | | 32,518 | | | 27,432 | | | 121,657 | |
Income from continuing operations | | | 5,550 | | | 2,132 | | | 7,657 | | | 890 | | | 16,229 | |
Income (loss) from discontinued operations | | | — | | | — | | | — | | | — | | | — | |
|
|
|
|
|
|
|
|
|
|
|
|
|
|
|
|
|
Net income (loss) | | | 5,550 | | | 2,132 | | | 7,657 | | | 890 | | | 16,229 | |
Earnings (loss) per share: | | | | | | | | | | | | | | | | |
Basic: | | | | | | | | | | | | | | | | |
Continuing operations | | | .14 | | | .05 | | | .20 | | | .02 | | | .42 | |
Discontinued operations | | | — | | | — | | | — | | | — | | | — | |
|
|
|
|
|
|
|
|
|
|
|
|
|
|
|
|
|
Net income (loss) | | | .14 | | | .05 | | | .20 | | | .02 | | | .42 | |
Diluted: | | | | | | | | | | | | | | | | |
Continuing operations | | | .14 | | | .05 | | | .20 | | | .02 | | | .42 | |
Discontinued operations | | | — | | | — | | | — | | | — | | | — | |
|
|
|
|
|
|
|
|
|
|
|
|
|
|
|
|
|
Net income (loss) | | | .14 | | | .05 | | | .20 | | | .02 | | | .42 | |
Shares used to compute earnings (loss) per share: | | | | | | | | | | | | | | | | |
Basic | | | 38,440 | | | 38,453 | | | 38,465 | | | 38,527 | | | 38,471 | |
Diluted | | | 38,636 | | | 38,592 | | | 38,565 | | | 38,594 | | | 38,597 | |
|
|
|
|
|
|
|
|
|
|
|
|
|
|
|
|
|
2004 | | | | | | | | | | | | | | | | |
|
|
|
|
|
|
|
|
|
|
|
|
|
|
|
|
|
Sales | | $ | 195,919 | | $ | 216,053 | | $ | 222,515 | | $ | 226,678 | | $ | 861,165 | |
Gross profit | | | 27,348 | | | 33,102 | | | 31,669 | | | 29,528 | | | 121,647 | |
Income from continuing operations | | | 2,429 | | | 5,179 | | | 15,292 | | | 3,360 | | | 26,260 | |
Income (loss) from discontinued operations | | | — | | | — | | | — | | | 2,921 | | | 2,921 | |
|
|
|
|
|
|
|
|
|
|
|
|
|
|
|
|
|
Net income (loss) | | | 2,429 | | | 5,179 | | | 15,292 | | | 6,281 | | | 29,181 | |
Earnings (loss) per share: | | | | | | | | | | | | | | | | |
Basic: | | | | | | | | | | | | | | | | |
Continuing operations | | | .06 | | | .14 | | | .40 | | | .09 | | | .69 | |
Discontinued operations | | | — | | | — | | | — | | | .08 | | | .08 | |
|
|
|
|
|
|
|
|
|
|
|
|
|
|
|
|
|
Net income (loss) | | | .06 | | | .14 | | | .40 | | | .17 | | | .77 | |
Diluted: | | | | | | | | | | | | | | | | |
Continuing operations | | | .06 | | | .14 | | | .40 | | | .09 | | | .68 | |
Discontinued operations | | | — | | | — | | | — | | | .07 | | | .08 | |
|
|
|
|
|
|
|
|
|
|
|
|
|
|
|
|
|
Net income (loss) | | | .06 | | | .14 | | | .40 | | | .16 | | | .76 | |
Shares used to compute earnings (loss) per share: | | | | | | | | | | | | | | | | |
Basic | | | 38,229 | | | 38,235 | | | 38,317 | | | 38,398 | | | 38,295 | |
Diluted | | | 38,435 | | | 38,427 | | | 38,519 | | | 38,655 | | | 38,507 | |
|
|
|
|
|
|
|
|
|
|
|
|
|
|
|
|
|
71
SIGNATURES
Pursuant to the requirements of Section 13 or 15(d) of the Securities Exchange Act of 1934, the registrant has duly caused this report to be signed on its behalf by the undersigned, thereunto duly authorized.
| | |
| TREDEGAR CORPORATION
(Registrant) |
| | |
Dated: March 1, 2006 | By | /s/ John D. Gottwald |
| |
|
| | John D. Gottwald |
| | President and Chief Executive Officer |
Pursuant to the requirements of the Securities Exchange Act of 1934, this report has been signed below by the following persons on behalf of the registrant and in the capacities indicated on March 1, 2006.
| | |
Signature | | Title |
| |
|
| | |
/s/ John D. Gottwald | | President, Chief Executive Officer and Director |
| | (Principal Executive Officer) |
(John D. Gottwald) | | |
| | |
/s/ D. Andrew Edwards | | Vice President, Chief Financial Officer and Treasurer |
| | (Principal Financial and Accounting Officer) |
(D. Andrew Edwards) | | |
| | |
/s/ Richard L. Morrill | | Chairman of the Board of Directors |
| | |
(Richard L. Morrill) | | |
| | |
/s/ William M. Gottwald | | Vice Chairman of the Board of Directors |
| | |
(William M. Gottwald) | | |
| | |
/s/ N. A. Scher | | Vice Chairman of the Board of Directors |
| | |
(Norman A. Scher) | | |
| | |
/s/ Horst R. Adam | | Director |
| | |
(Horst R. Adam) | | |
| | |
/s/ Austin Brockenbrough, III | | Director |
| | |
(Austin Brockenbrough, III) | | |
| | |
/s/ Donald T. Cowles | | Director |
| | |
(Donald T. Cowles) | | |
72
| | |
/s/ Thomas G. Slater, Jr. | | Director |
| | |
(Thomas G. Slater, Jr.) | | |
| | |
/s/ R. Gregory Williams | | Director |
| | |
(R. Gregory Williams) | | |
73
EXHIBIT INDEX
| |
3.1 | Amended and Restated Articles of Incorporation of Tredegar (filed as Exhibit 3.1 to Tredegar’s Annual Report on Form 10-K for the year ended December 31, 2004, and incorporated herein by reference) |
| |
3.2 | Amended By-laws of Tredegar (filed as Exhibit 3.01 to Tredegar’s Current Report on Form 8-K, filed January 17, 2006, and incorporated herein by reference) |
| |
3.3 | Articles of Amendment (filed as Exhibit 3.3 to Tredegar’s Annual Report on Form 10-K for the year ended December 31, 2004, and incorporated herein by reference) |
| |
4.1 | Form of Common Stock Certificate (filed as Exhibit 4.1 to Tredegar’s Annual Report on Form 10-K for the year ended December 31, 2004, and incorporated herein by reference) |
| |
4.2 | Rights Agreement, dated as of June 30, 1999, by and between Tredegar and American Stock Transfer & Trust Company, as Rights Agent (filed as Exhibit 4.2 to Tredegar’s Annual Report on Form 10-K for the year ended December 31, 2004, and incorporated herein by reference) |
| |
4.2.1 | Amendment and Substitution Agreement (Rights Agreement) dated as of December 11, 2002, by and among Tredegar, American Stock Transfer and Trust Company and National City Bank (filed as Exhibit 4.2.1 to Tredegar’s Annual Report on Form 10-K for the year ended December 31, 2002, and incorporated herein by reference) |
| |
4.3 | Credit Agreement among Tredegar Corporation, as borrower, the domestic subsidiaries of Tredegar that from time to time become parties thereto, as guarantors, the several banks and other financial institutions as may from time to time become parties thereto, Wachovia Bank, National Association, as administrative agent, SunTrust Bank, as syndication agent, and Bank of America, N.A., KeyBank National Association, and JPMorgan Chase Bank, N.A., as documentation agents, dated as of December 15, 2005 (filed as Exhibit 10.16 to Tredegar’s Current Report on Form 8-K, filed December 20, 2005, and incorporated herein by reference) |
| |
10.1 | Reorganization and Distribution Agreement dated as of June 1, 1989, between Tredegar and Ethyl (filed as Exhibit 10.1 to Tredegar’s Annual Report on Form 10-K for the year ended December 31, 2004, and incorporated herein by reference) |
| |
*10.2 | Employee Benefits Agreement dated as of June 1, 1989, between Tredegar and Ethyl (filed as Exhibit 10.2 to Tredegar’s Annual Report on Form 10-K for the year ended December 31, 2004, and incorporated herein by reference) |
| |
10.3 | Tax Sharing Agreement dated as of June 1, 1989, between Tredegar and Ethyl (filed as Exhibit 10.3 to Tredegar’s Annual Report on Form 10-K for the year ended December 31, 2004, and incorporated herein by reference) |
| |
10.4 | Indemnification Agreement dated as of June 1, 1989, between Tredegar and Ethyl (filed as Exhibit 10.4 to Tredegar’s Annual Report on Form 10-K for the year ended December 31, 2004, and incorporated herein by reference) |
| |
*10.5 | Tredegar 1989 Incentive Stock Option Plan (filed as Exhibit 10.5 to Tredegar’s Annual Report on Form 10-K for the year ended December 31, 2004, and incorporated herein by reference) |
| |
*10.5.1 | Amendment to the Tredegar 1989 Incentive Stock Option Plan (filed as Exhibit 10.5.1 to Tredegar’s Annual Report on Form 10-K for the year ended December 31, 2004, and incorporated herein by reference) |
| |
*10.6 | Tredegar 1992 Omnibus Stock Incentive Plan (filed as Exhibit 10.6 to Tredegar’s Annual Report on Form 10-K for the year ended December 31, 2004, and incorporated herein by reference) |
| |
*10.6.1 | Amendment to the Tredegar 1992 Omnibus Incentive Plan (filed as Exhibit 10.6.1 to Tredegar’s Annual Report on Form 10-K for the year ended December 31, 2004, and incorporated herein by reference) |
| |
*10.7 | Tredegar Industries, Inc. Retirement Benefit Restoration Plan (filed as Exhibit 10.7 to Tredegar’s Annual Report on Form 10-K for the year ended December 31, 2004, and incorporated herein by reference) |
| |
*10.7.1 | Amendment to the Tredegar Retirement Benefit Restoration Plan (filed as Exhibit 10.7.1 to Tredegar’s Annual Report on Form 10-K for the year ended December 31, 2004, and incorporated herein by reference) |
| |
*10.8 | Tredegar Industries, Inc. Savings Plan Benefit Restoration Plan (filed as Exhibit 10.8 to Tredegar’s Annual Report on Form 10-K for the year ended December 31, 2004, and incorporated herein by reference) |
| |
*10.8.1 | Resolutions of the Executive Committee of the Board of Directors of Tredegar Corporation adopted on December 28, 2004 (effective as of December 31, 2004) amending the Tredegar Corporation Retirement Savings Plan Benefit Restoration Plan (filed as Exhibit 10.9.1 to Tredegar’s Current Report on Form 8-K, filed on December 30, 2004, and incorporated herein by reference) |
74
| |
*10.9 | Tredegar Industries, Inc. Amended and Restated Incentive Plan (previously included as Exhibit 99.2 to the Form S-8 Registration Statement No. 333-88177, filed on September 30, 1999, and refiled herewith) |
| |
*10.10 | Tredegar Industries, Inc. Directors’ Stock Plan (filed as Exhibit 10.11 to Tredegar’s Annual Report on Form 10-K for the year ended December 31, 2004, and incorporated herein by reference) |
| |
*10.11 | Tredegar Corporation’s 2004 Equity Incentive Plan (filed as Exhibit 10.13 to the Form S-8 Registration Statement No. 333-115423, filed on May 12, 2004 (incorporating from the Annex to Tredegar Corporation’s Definitive Proxy Statement on Schedule 14A filed on March 4, 2004 (No. 1-10258) and incorporated herein by reference) |
| |
*10.12 | Leave of Absence, Separation and Non-Competition Agreement, dated May 16, 2005, between Tredegar Film Products Corporation and Thomas G. Cochran (filed as Exhibit 10.16 to Tredegar’s Current Report on Form 8-K, filed May 18, 2005, and incorporated herein by reference) |
| |
*10.13 | Transfer Agreement, by and between Old Therics and New Therics, dated as of June 30, 2005 (filed as Exhibit 10.17 to Tredegar’s Current Report on Form 8-K, filed July 1, 2005, and incorporated herein by reference) |
| |
10.14 | Intellectual Property Transfer Agreement, by and between Old Therics and New Therics, dated as of June 30, 2005 (filed as Exhibit 10.18 to Tredegar’s Current Report on Form 8-K, filed July 1, 2005, and incorporated herein by reference) |
| |
10.15 | Unit Purchase Agreement, by and between Old Therics, New Therics and Randall R. Theken, dated as of June 30, 2005 (filed as Exhibit 10.19 to Tredegar’s Current Report on Form 8-K, filed July 1, 2005, and incorporated herein by reference) |
| |
10.16 | Payment Agreement, by and between Old Therics and New Therics, dated as of June 30, 2005 (filed as Exhibit 10.20 to Tredegar’s Current Report on Form 8-K, filed July 1, 2005, and incorporated herein by reference) |
| |
*10.17 | Form of Stock Award Agreement (filed as Exhibit 10.21 to Tredegar’s Current Report on Form 8-K, filed September 1, 2005, and incorporated herein by reference) |
| |
*10.18 | Summary of Compensation for the President and Chief Executive Officer and each of the Named Executive Officers for Fiscal 2006 (filed as Item 1.01 to Tredegar’s Current Report on Form 8-K, filed on February 22, 2006, and incorporated herein by reference) |
| |
*10.19 | Description of Cash Incentive Plans for fiscal 2006 (filed as Item 1.01 to Tredegar’s Current Report on Form 8-K, filed on February 22, 2006, and incorporated herein by reference) |
| |
*10.20 | Summary of Director Compensation for Fiscal 2006 |
| |
21 | Subsidiaries of Tredegar |
| |
23.1 | Consent of Independent Registered Public Accounting Firm |
| |
31.1 | Section 302 Certification of Principal Executive Officer |
| |
31.2 | Section 302 Certification of Principal Financial Officer |
| |
32.1 | Section 906 Certification of Principal Executive Officer |
| |
32.2 | Section 906 Certification of Principal Financial Officer |
* Denotes compensatory plans or arrangements or management contracts.
75