Asset Quality
Asset quality is an important factor in the successful operation of a financial institution. The loss of interest income and principal that may result from nonperforming assets has an adverse effect on earnings, while the resolution of those assets requires the use of capital and managerial resources.At March 31, 2005, total non-performing assets, consisting of non-performing loans and repossessed automobiles, were $548,000 or .14% of total assets compared to $1,734,000 or .51% at March 31, 2004. Non-performing assets at March 31, 2005 were comprised primarily of single family residential properties delinquent 90 days or more. At March 31, 2005, the largest property in non-performing assets was a residential construction loan with an approximate value of $141,000. Based on current market values of the collateral securing these loans, management anticipates no significant losses in excess of the reserves for losses previously recorded. Due to an uncertain real estate market and the economy in general, no assurances can be given that our level of non-performing assets may not increase in the future. We maintain an allowance for loan lossesto provide for estimated potential losses in our loan portfolio. We determine the level of reserves based on loan performance, the value of the collateral, economic and market conditions, and previous experience. We review the adequacy of the allowance at least quarterly, utilizing our internal loan classifications system. During fiscal 2005, we increased our allowance for loan losses $376,000, to $3,021,000. Management believes that the loan loss allowance is adequate. We had net charge-offs of $494,000, $140,000, and $186,000, for the years ended March 31, 2005, 2004 and 2003, respectively. The increase in net chargeoffs from 2004 to 2005 is related primarily to the charge-off of one loan in the amount of $230,000. While consumer loans provide a greater yield they generally have a higher rate of charge-offs than mortgage loans. Although management believes it uses the best information available, future adjustments to the allowance may be necessary. Financial Condition
Total assets increased $62.7 million to $399.6 million at March 31, 2005 as a result of increases in both investment securities of $4.5 million and in loans of | | $57.5 million. These increases were funded by both a $15.2 million increase indeposits and a $45.2 million increase in borrowings. Management elected to fund asset growth in fiscal 2005 primarily with borrowings due to the lower relative interest rate cost. The average balance of borrowings increased from $28.2 million and an average interest rate of 1.27% for fiscal 2004 to $68.2 million and 2.10% for fiscal 2005. The increase in deposits is reflected primarily in increased demand deposits of $4.5 million and time deposits of $27.8 million offset by a $17.1 million decrease in savings and money market accounts. The change in deposits is related primarily to rising interest rates and customers preference for higher rate timedeposits. Management believes the increase in time and demand deposits is primarily attributable to maintaining competitive pricing. The increase in loans receivable was due to both a lower rate environment and competitive pric ing on both mortgage and consumer loans. The Hampton Roads region of the Bank experienced growth of $22 million in primarily real estate loans for the fiscal year ended 2005. The Shenandoah Valley region of the Bank had loan growth of approximately $35.5 million in primarily non-mortgage loans including an increase of $17.0 million in automobile dealer loans. Management anticipates slower loan growth in both regions for the 2006 fiscal year due to rising interest rates, increased competitive loan pricing and regulatory capital considerations. Management anticipates the primary source of funding for loan growth during fiscal 2006 to be from time deposits due to customers' preference for these higher rate products as interest rates increase and the increase in borrowing costs. Management also anticpates a continuing decrease in savings and money market accounts as interest rates are expected to increase during fiscal 2006. Stockholders' equity increased $2.1 million to $31.3 million at March 31, 2005 compared to March 31, 2004. The increase was the result of $3.8 million of net income and proceeds from option exercises offset by dividends paid to stockholders of $874,000 and a decrease in the unrealized gain on equity securities of $937,000. Results of Operations
Our results of operations depend primarily on the level of our net interest income and noninterest income and the | | level of our operating expenses. Net interest income depends upon the value of interest-earning assets and interest-bearing liabilities and the interest rate earned or paid on them. Comparison of Years ended
March 31, 2005 and 2004 General. Net income for the year ended March 31, 2005 was $3,806,000 or $1.76 diluted earnings per share compared to $3,482,000 or $1.63 diluted earnings per share for the year ended March 31, 2004. Net income increased due primarily to an increase in net interest income of $1.8 million. Interest Income.
Total interest income increased to $20,038,000 for the year ended March 31, 2005 as compared to $17,524,000 for the year ended March 31, 2004. The increase in total interest income can be attributed to an increase in the average dollar volume of interest-earning assets, primarily $44.4 million in loans receivable offset by a decrease in the yield on interest earning assets. Average yields on total interest-earning assets decreased from 5.83% in fiscal 2004 to 5.72% for the current fiscal year due primarily to a lower interest rate environment. Interest Expense.
Total interest expense increased to $6,281,000 for the year ended March 31, 2005 from $5,542,000 for the year ended March 31, 2004. The increase in total interest expense is primarily attributable an increase in the average dollar volume of interest-bearing liabilities, primarily $39.3 million in borrowings offset by a decrease in the cost of interest bearing liabilities. The cost of funds decreased from 1.97% for the year ended March 31, 2004 to 1.88% for the current year. The increase in deposit balances was due primarily to increases in time deposits for the current fiscal year. Provision for Loan Losses.
The provision for loan losses increased to $870,000 for the fiscal year ended March 31, 2005 from $846,000 for the fiscal year ended March 31, 2004 due both to an increase in loan growth offset by a decrease in allowances for certain mortgage loans for fiscal 2005. We monitor our loan loss allowance on a quarterly basis and make allocations as necessary. Management believes that the level of our loan loss allowance is adequate. As of March 31, 2005, the total allowance for loan losses amounted to $3,021,000. At |


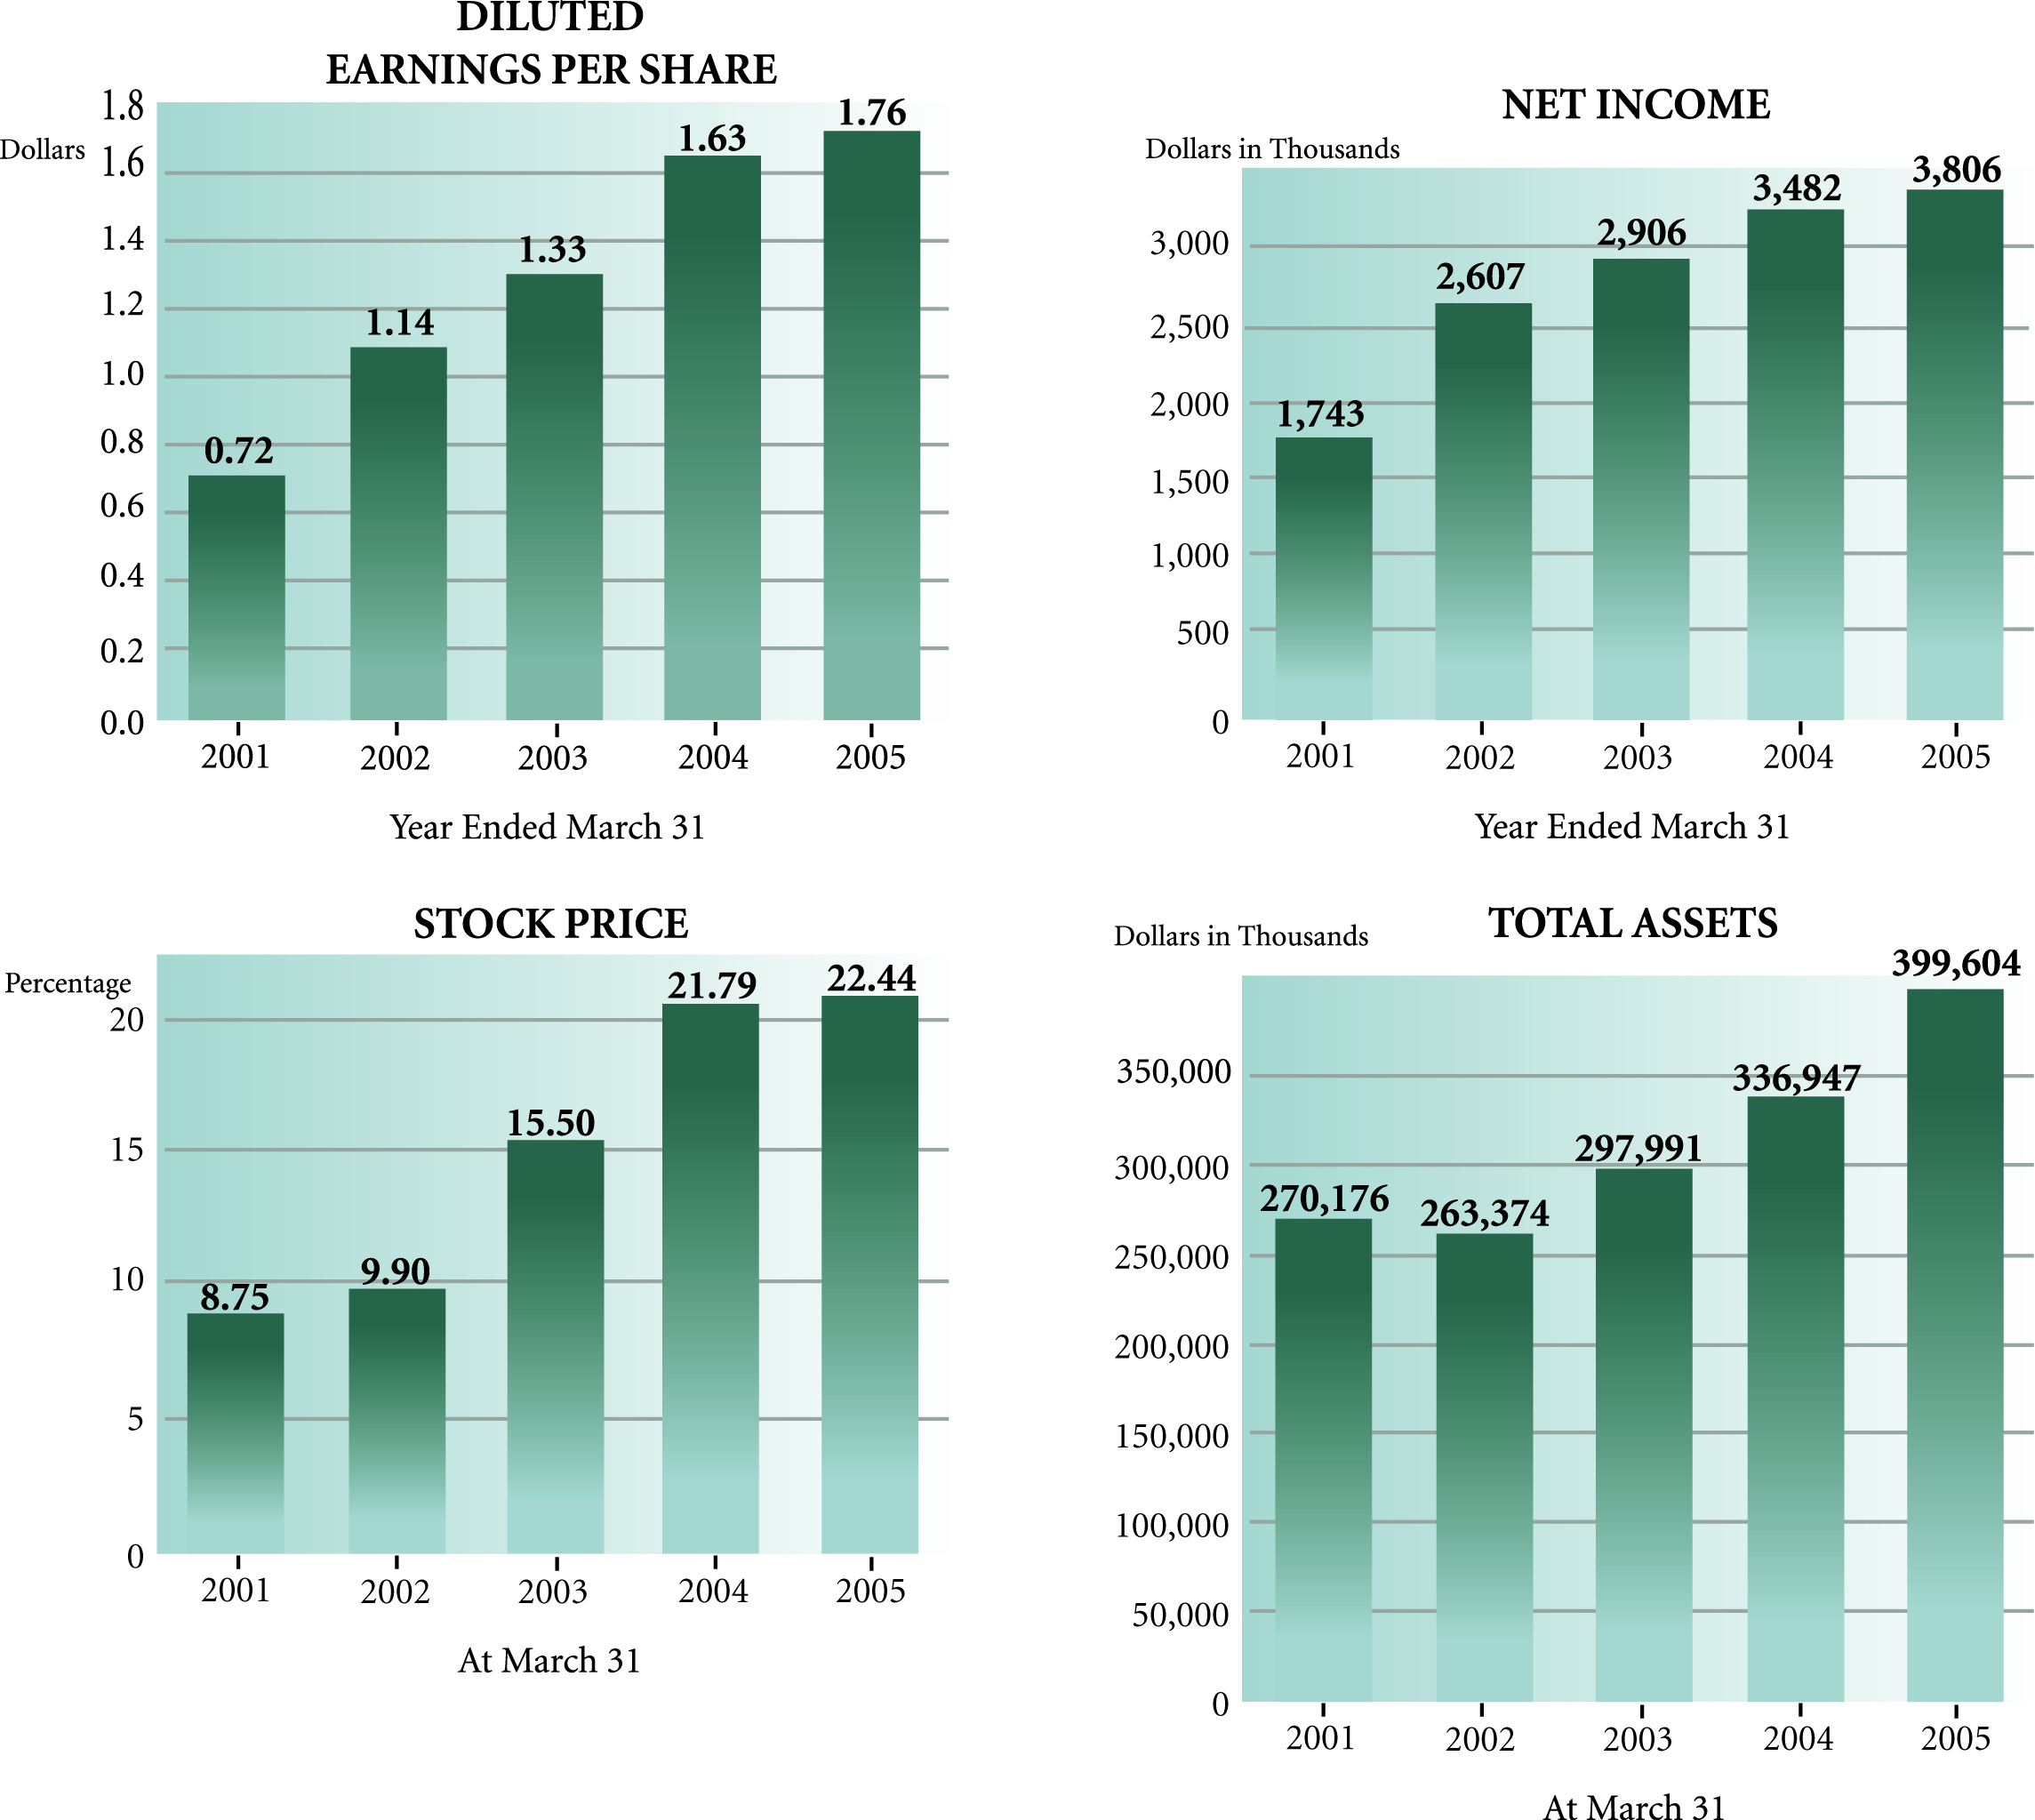
 from the prior year. More significantly, over the past five years, not including payment of dividends, the price of our stock has appreciated over 133% or an average of 26.6% per year. In addition to the stock appreciation, our stockholders also benefited from a 10% increase in our quarterly dividend from $.10 per share to $.11 per share effective for


 Dianne F. Campbell, our mortgage specialist, is leading our team's effort to expand our mortgage products and services.Community Bank has helped thousands of people since 1928 obtain the best mortgage to suit their needs.We can provide our customers with solid advice based on our solid experience.We now offer: