| | | |
| Underwritten Replacement Reserves | | | S-108 |
| Unrestricted Servicer Reports | | | S-185 |
| Voting Rights | | | S-188 |
| WA | | | S-108 |
| Wachovia | | | S-82, S-111 |
| Wachovia Mortgage Loans | | | S-122 |
| Wachovia Securities | | | S-206 |
| Weighted Average Net Mortgage Rate | | | S-161 |
| Wells Fargo Bank | | | S-189 |
| Whole Loan | | | S-91 |
| Whole Loans | | | S-91 |
| Workout Fee | | | S-146 |
| Workout-Delayed Reimbursement Amount | | | S-179 |
| Year Built | | | S-108 |
| Yield Maintenance Charges | | | S-173 |
|
S-216
WACHOVIA BANK COMMERCIAL MORTGAGE TRUST SERIES 2006-C29
ANNEX A-1
CERTAIN CHARACTERISTICS OF THE MORTGAGE LOANS AND MORTGAGED PROPERTIES
LOAN
MORTGAGE LOAN GROUP
NUMBER NUMBER PROPERTY NAME ADDRESS
- ------------------------------------------------------------------------------------------------------------------------------------
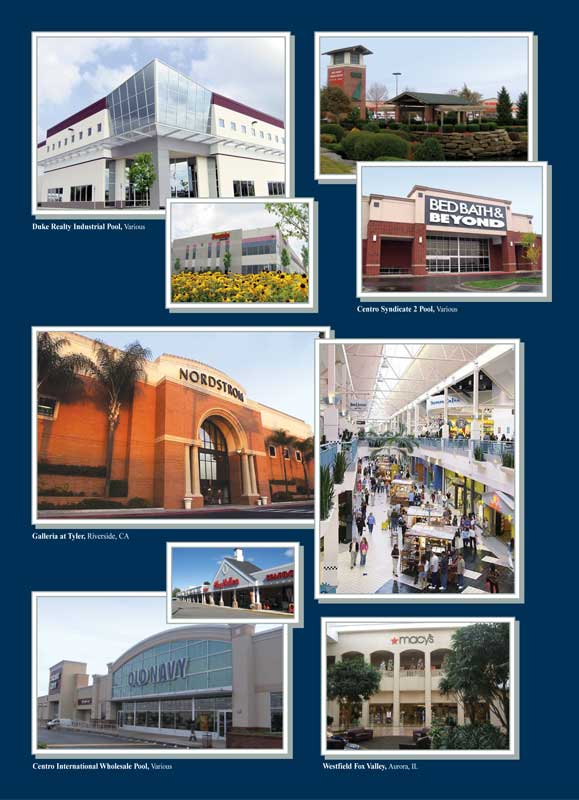
1 1 Duke Realty Industrial Pool Various
1.01 400 South Enterprise Boulevard 400 South Enterprise Boulevard
1.02 2425 East Hadley Road(1) 2425 East Hadley Road
1.03 250 Declaration Drive 250 Declaration Drive
1.04 2209-2233 Stafford Road 2209-2233 Stafford Road
1.05 500-520 South Enterprise Boulevard 500-520 South Enterprise Boulevard
1.06 163 Portside Court 163 Portside Court
1.07 3201 Centre Parkway 3201 Centre Parkway
1.08 1581 South Perry Road 1581 South Perry Road
1.09 1551 South Perry Road 1551 South Perry Road
1.10 185 North Mount Zion Road 185 North Mount Zion Road
1.11 1390 South Perry Road 1390 South Perry Road
1.12 322 South Enterprise Boulevard 322 South Enterprise Boulevard
1.13 4200 North Commerce Drive 4200 North Commerce Drive
1.14 6655 Sugarloaf Parkway 6655 Sugarloaf Parkway
1.15 420 East Enterprise Boulevard 420 East Enterprise Boulevard
1.16 3079 Premiere Parkway 3079 Premiere Parkway
1.17 175 Alcovy Industrial Boulevard 175 Alcovy Industrial Boulevard
1.18 2850 Premiere Parkway 2850 Premiere Parkway
1.19 3800 Centre Parkway - Building 1400 3800 Centre Parkway, Building 1400
1.20 2855 Premiere Parkway 2855 Premiere Parkway
1.21 3900 North Commerce Drive 3900 North Commerce Drive
1.22 2775 Premiere Parkway 2775 Premiere Parkway
1.23 198 Gulfstream Road 198 Gulfstream Road
1.24 3800 Centre Parkway - Building 1800 3800 Centre Parkway, Building 1800
1.25 3800 Centre Parkway - Building 2400 3800 Centre Parkway, Building 2400
1.26 3800 Centre Parkway - Building 2600 3800 Centre Parkway, Building 2600
1.27 3800 Centre Parkway - Building 2000 3800 Centre Parkway, Building 2000
2 1 Centro Syndicate 2 Pool Various
2.01 College Plaza Middle Country Road and Boyle Road
2.02 Oakwood Commons 4642-4724 Lebanon Pike
2.03 Parkway Plaza 217 Glen Cove Road
2.04 Rutland Plaza 1 Ruthland Plaza
2.05 Spradlin Farm Retail Center 110 Conston Avenue
2.06 Torrington Plaza 1 South Main Street
2.07 Tri-City Plaza Tri-City Road and High Street
2.08 Watson Glen 209 South Royal Oaks Boulevard
2.09 Westgate Plaza 231 East Main Street
2.10 Dalewood Shopping Center 353-425 N. Central Avenue
2.11 Grand Traverse Crossing 2522 - 2664 Crossing Circle
2.12 Lehigh Shopping Center West Union Boulevard at Pennsylvania Avenue
2.13 Northern Hills 95 and 105 Buckland Hills Drive
2.14 Southport Centre I-VI 15050-15300 Cedar Avenue
2.15 Trinity Commons South Hulen Street & Bellaire Drive
2.16 Wendover Place 1210 Bridford Parkway
3 1 Galleria at Tyler(1) 1299 Galleria at Tyler
4 1 Centro International Wholesale Pool Various
4.01 Falcaro's Plaza 294 Burnside Avenue
4.02 Hale Road 169-179 Hale Road
4.03 Innes Street Market 343 Faith Road
4.04 Kings Park Shopping Center 38-66 Indian Head Road
4.05 Lynn Marketplace 43 State Street
4.06 Morris Hills Shopping Center Parsippany Boulevard (Route 202) and Bloomfield Avenue (Route 46)
4.07 New Centre Market 4711 New Centre Drive
4.08 Rockville Centre 150-156 North Village Avenue
4.09 Suffolk Plaza 4042-4088 Nesconset Highway
4.10 Three Village Shopping Center Route 25A & Ridgeway Avenue
4.11 Venetian Isles 3700 North Federal Highway
4.12 Berkshire Crossing 555 Hubbard Avenue
4.13 County Line Plaza 1053 East County Line Road
5 1 Westfield Fox Valley 195 Fox Valley Center Drive
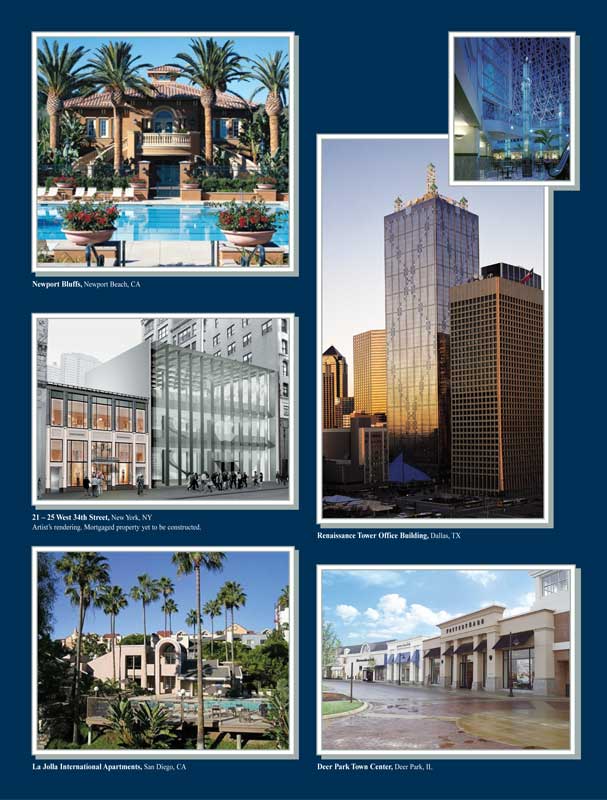
6 1 Newport Bluffs(2) 100 Vilaggio
7 1 Renaissance Tower Office Building 1201 Elm Street
8 1 21-25 West 34th Street(1)(3) 21-25 West 34th Street
9 2 La Jolla International Apartments 3415, 3425, 3435, 3445, 3455 and 3465 Lebon Drive
10 1 Deer Park Town Center(4) 20530 North Rand Road
11 1 Dakota Square Mall(1) 2400 10th Street SW
12 2 La Scala Apartments 3833, 3845, 3855 & 3899 Nobel Drive
13 2 Pennwood Crossing MHP 1201 Adler Drive
14 1 Alhambra Towers 121 Alhambra Plaza
15 2 AMLI at Riverbend 8850 Riverbend Parkway
16 1 Hilton - Providence, RI(1) 21 Atwells Avenue
17 1 New Market Pool Various
17.01 New Market 2161 2161 Newmarket Parkway
17.02 New Market 2211 2211 New Market Parkway
17.03 New Market 2221 2221 New Market Parkway
17.04 New Market 2121 2121 Newmarket Parkway
17.05 New Market 2250 2250 New Market Parkway
17.06 New Market 2110 2110 New Market Parkway
18 1 Crossroads Technology Park 3200 & 3280 Whipple Road
19 1 Gateway Chula Vista II(1)(5) 333 H Street
20 2 Village on University Apartments 1655 East University Drive
21 1 Shoppes of Wellington Green 10500 Forest Hill Boulevard
22 2 The Fairways Apartments(1) 777 West Chandler Boulevard
23 1 Barry Woods Crossings Shopping Center 8121-8341 N.W. Roanridge Road
24 1 Weston One 1001 Winstead Drive
25 1 Lakeland Commons Shopping Center 200-250 Ridge Way
26 1 Las Colinas Corporate Center II 6363 North State Highway 161
27 2 Raveneaux Apartments(6) 14500 Cutten Road
28 2 Gramercy Apartments 9054 Gramercy Drive
29 2 Rancho Solana Apartments 2400-2444 Alvarado Street
30 1 Concourse Office Plaza I & II 4709 - 4711 Golf Road
31 2 Napa Valley Apartments 1349 West Horizon Ridge Parkway
32 1 SanTan Village Phase III(1)(5) 2716, 2720, 2756 and 2810 South Market Street; 2711, 2721 and
2757 South SanTan Village Parkway
33 2 Pinnacle Grove Apartments(1) 701 West Grove Parkway
34 1 Boulder Crossing Shopping Center 5500 Boulder Way
35 1 Sono Corporate Center 50 Washington Street
36 1 Reads Way 11, 13, & 15 Reads Way
37 1 Professional Center at Pembroke Lakes Mall 400-700 North Hiatus Road
38 1 Chestnut Run 4250 Lancaster Pike
39 2 Melody Lakes Country Club Estates 1045 North West End Boulevard
40 2 Treybrooke Apartments 701 Treybrooke Circle
41 2 Smoky Crossing I Apartments 11647 Chapman Highway
42 1 Cost Plus Plaza 2552 Taylor Street
43 1 Las Colinas Corporate Center I 6333 North State Highway 161
44 1 The Forum at Ashley Park, Phase I 100 Newnan Crossing Bypass
45 1 Warner Crossings 8260 & 8312 South Hardy Drive
46 1 Professional Centre at Gardens Mall 11601-11641 Kew Gardens Avenue
47 1 Driftwood Village Shopping Center 2238-2252 South Euclid Avenue
48 1 Embassy Suites Tucson-Broadway 5335 East Broadway Boulevard
49 2 Heritage Lake at Westland Apartments 1105 Lake Heritage Way
50 1 Aetna Building - Fresno, CA 1333-1385 East SHaw Avenue
51 1 345 Inverness Building(5) 345 Inverness Drive South
52 2 Andorra Apartments 81-720 Avenue 46
53 1 West Sahara Promenade 8145 West Sahara Avenue
54 2 Eagle Pointe Apartments 8608 Eagle Pointe Drive
55 1 Twelve Oaks 5500 Abercorn Street
56 1 Northdale Executive Center I & II 3810 & 3820 Northdale Boulevard
57 1 Arcadia Gateway Center - Office SWC Huntington Drive & 5th Avenue
58 2 Silver Lakes Heights Apartments 2020 Lake Heights Drive
59 2 The Place at Greenway Apartments 3333 Cummins Street
60 1 The Crescent at Ballantyne 15110 John J. Delaney Drive
61 2 River Ranch Apartments 6152 West Oakland Street
62 1 Cambridge Center 38777 West Six Mile Road
63 2 M Street Towers 1112 M Street NW
64 1 Time Warner Call Center 3140 West Arrowood Road
65 1 Attic Self Storage Pool Various
65.01 Attic Storage of Olathe 11675 South Strang Line Road
65.02 Attic Storage of Belton 715 North Scott Avenue
65.03 Attic Storage of Platte City 2700 N.W. Prairie View Road
65.04 Attic Storage of Kansas City 2806 South 44th Street
65.05 Attic Storage of Knobtown 13824 Blue Parkway
65.06 407Attic Storage of Needmore 1702 East Kansas City Road
66 1 Arcadia Gateway Center - Retail SWC Huntington Drive & 5th Avenue
67 2 Tudor Heights Apartments 10505 Evans Plaza
68 1 Avenues North 9357 and 9365 Philips Highway
69 2 Belleau Woods 4000, 4002, 4004, 4006, 4008, 4010, 4014, 4016, 4018, 4020, 4022
& 4024 Northwest Avenue
70 1 Riveredge Pool Various
70.01 Riveredge II 42 Lukens Drive
70.02 Riveredge III 59 Lukens Drive
70.03 Riveredge IV 19 Lukens Drive
71 1 Academy Square Retail 1600 North Main Street
72 1 100 Carillon Parkway 100 Carillon Parkway
73 1 PNC Bank Plaza 200 West Vine Street
74 2 Avalon Park Apartments 17000 SW Pacific Highway
75 1 T-Mobile - Nashville, TN 695 Grassmere Park
76 2 Arbors at Fairview Apartments 1000 Arbor Keats Drive
77 1 Residence Inn - Virginia Beach, VA 3217 Atlantic Avenue
78 1 Arcadia Gateway Center - Medical Office SWC Huntington Drive & 5th Avenue
79 1 Southtowne Plaza 3100 Oakland Avenue
80 1 FBI - Albany, NY 200 McCarty Avenue
81 2 Forest Ridge I Apartments 9706 Smoky Ridge Way
82 1 MAC I and MAC II 828 and 801 Royal Parkway
83 1 Lowe's - Auburn, NY 299 Grant Avenue
84 1 SHPS Building 9305 East Via de Ventura
85 2 The Grove at White Oak Apartments 1710 West TC Jester Boulevard
86 1 Dick's Sporting Goods - Sterling, VA 21070 Dulles Town Center
87 2 Beechwood Apartments 2700 Cottage Place
88 1 Llanerch Shopping Center 365-403 West Chester Pike (PA Route 3)
89 1 Best Western - Everett, WA(5) 10210 Evergreen Way
90 1 Heritage Place 227 French Landing Drive
91 1 Atrium Crest 18333 Egret Bay Boulevard
92 1 Woodberry Square Shopping Center 7065 Allentown Road
93 1 Camp Creek Center 8120 Camp Creek Boulevard
94 1 Shops at Volente 11416 RR 620 North
95 1 Big Dog Distribution Facility 519 Lincoln County Parkway Extension
96 2 Jefferson Trace Apartments 2506 Atwell Drive
97 2 The Venterra at Waters Edge Apartments 12330 Metric Boulevard
98 1 Davis and Oak(1) 1100-1118 Davis Street
99 1 Landmark Village 2301 North Collins Street
100 2 Village at Baker Creek(5) 3820, 3844, 3832, 3856, 3868, 3924, 3936, 3948, 3960 & 3972
Primrose Lane
101 1 Holiday Inn - Bangor, ME 404 Odlin Road
102 1 Summit Square 8410-8472 Federal Boulevard
103 1 Parker Crossroads 10831 & 10841 South Crossroads Drive
104 2 Park Manor Apartments 22 Forest Circle
105 1 43-45 Crossways Park Drive 43-45 Crossways Park Drive
106 2 Cougar Court Apartments 697 Trejo Street
107 1 St. Pete Post Office 3135 1st Avenue
108 1 Center Building 7825 Baymeadows Way
109 1 First Commons Industrial Buildings 4625 & 4635 West McDowell Road
110 1 Abbotts Bridge Office 10700 Abbotts Bridge Road
111 1 543 - 561 Lincoln Avenue(1) 543 - 561 Lincoln Avenue; 743-749 Elm Street
112 1 1900 West New Hampshire Street 1900 West New Hampshire Street
113 1 Rodeo Park Plaza 1659 & 1661 South Val Vista Drive 1663 East Ray Road
114 2 The Hamilton 1025 Hancock Street
115 2 Hinton Hollow Apartments 2812 Bakertown Road
116 1 1 Derby Street 1 Derby Street
117 1 Armitage and California 2820 West Armitage Avenue & 2020 North California Avenue
118 2 Taylor Apartments 1660 & 1670 North 21st Road
119 1 Courthouse Square 2124, 2126 and 2128 Jefferson Davis Highway
120 1 4349 Duke Street 4349 Duke Street
121 1 Wingate Inn - Birmingham, AL(5) 800 Corporate Ridge Drive
122 1 Walgreens - Edgewater, MD 3106 Solomons Island Road
123 1 501 - 507 Chestnut Court(1) 501-507 Chestnut Court
124 1 715-729 Elm Street(1) 715 - 729 Elm Street
125 2 Chelsea Court Apartments(5) 7206 & 7208 NE 182nd Street
126 2 Autumn Woods Apartments 9801 Autumnwood Circle
127 1 Staples - Miami, FL 9801 South Dixie Highway
128 1 Liberty Mutual 9489 Interline Avenue
129 2 Dempster and Judson(1) 1243-1249 Judson Avenue
130 1 Care Free Mini Storage Pool Various
130.01 Care Free Mini Storage North 1264 Hadleyview Court NE
130.02 Care Free Mini Storage South 2907 South Broadway
131 1 Fox Mill Centre Outparcels 2B and 5 6822-6826 Walton Lane; 6709-6723 Walton Lane
132 1 CVS - San Antonio, TX 9838 Potranco Road
133 1 President Plaza 13310 - 13334 Ramona Boulevard
134 2 Southern Woods Apartments 9100 Jenny Cook Circle
135 1 788 Fairview 788 Fairview Drive
136 1 Grand Oaks Plaza 6310 20th Street
137 1 874-878 Green Bay(1) 874 - 878 Green Bay Road
138 1 Dollar General - Livingston, TN 118 Tom Davis Road
139 1 Walgreens - Houston, TX 3900 Reveille Street
140 1 25 West Anapamu Street 25 West Anapamu Street
141 1 Family Dollar Pool Various
141.01 Catalina Springs Shopping Center 9955-9975 Fuqua Street
141.02 Family Dollar - Houston, TX 5005 East Crosstimbers
142 1 Advance Auto Grand Forks, ND 3805 Gateway Drive
MORTGAGE LOAN CROSS COLLATERALIZED AND CROSS LOAN MORTGAGE
NUMBER CITY STATE ZIP CODE DEFAULTED LOAN FLAG PURPOSE LOAN SELLER
- ---------------------------------------------------------------------------------------------------------------------------------
1 Various Various Various Refinance Wachovia
1.01 Lebanon IN 46052
1.02 Plainfield IN 46168
1.03 McDonough GA 30253
1.04 Plainfield IN 46168
1.05 Lebanon IN 46052
1.06 Savannah GA 31407
1.07 East Point GA 30344
1.08 Plainfield IN 46168
1.09 Plainfield IN 46168
1.10 Lebanon IN 46052
1.11 Plainfield IN 46168
1.12 Lebanon IN 46052
1.13 East Point GA 30344
1.14 Duluth GA 30097
1.15 Lebanon IN 46052
1.16 Duluth GA 30097
1.17 Dacula GA 30019
1.18 Duluth GA 30097
1.19 Atlanta GA 30331
1.20 Duluth GA 30097
1.21 Atlanta GA 30344
1.22 Duluth GA 30097
1.23 Savannah GA 31408
1.24 Atlanta GA 30331
1.25 Atlanta GA 30331
1.26 Atlanta GA 30331
1.27 Atlanta GA 30331
2 Various Various Various Acquisition Wachovia
2.01 Selden NY 11784
2.02 Hermitage TN 37076
2.03 Carle Place NY 11514
2.04 Rutland VT 05701
2.05 Christiansburg VA 24073
2.06 Torrington CT 06790
2.07 Somersworth NH 03878
2.08 Franklin TN 37064
2.09 Westfield MA 01085
2.10 Hartsdale NY 10530
2.11 Traverse City MI 49684
2.12 Bethlehem PA 18018
2.13 South Windsor CT 06074
2.14 Apple Valley MN 55124
2.15 Fort Worth TX 76109
2.16 Greensboro NC 27409
3 Riverside CA 92503 Refinance Wachovia
4 Various Various Various Acquisition Wachovia
4.01 Lawrence NY 11559
4.02 Manchester CT 06042
4.03 Salisbury NC 28146
4.04 Kings Park NY 11754
4.05 Lynn MA 01901
4.06 Parsippany NJ 07054
4.07 Wilmington NC 28405
4.08 Rockville Centre NY 11570
4.09 East Setauket NY 11733
4.10 East Setauket NY 11733
4.11 Lighthouse Point FL 33064
4.12 Pittsfield MA 01201
4.13 Jackson MS 39211
5 Aurora IL 60504 Refinance Wachovia
6 Newport Beach CA 92660 Refinance Wachovia
7 Dallas TX 75270 Acquisition Wachovia
8 New York NY 10001 Refinance Wachovia
9 San Diego CA 92122 Refinance Artesia
10 Deer Park IL 60010 Refinance Wachovia
11 Minot ND 58701 Refinance Wachovia
12 San Diego CA 92122 Refinance Artesia
13 Morrisville PA 19067 Acquisition Wachovia
14 Coral Gables FL 33134 Refinance Wachovia
15 Indianapolis IN 46250 Acquisition Wachovia
16 Providence RI 02903 Refinance Wachovia
17 Marietta GA 30067 Refinance Wachovia
17.01 Marietta GA 30067
17.02 Marietta GA 30067
17.03 Marietta GA 30067
17.04 Marietta GA 30067
17.05 Marietta GA 30067
17.06 Marietta GA 30067
18 Union City CA 94587 Refinance Wachovia
19 Chula Vista CA 91910 Refinance Artesia
20 Tempe AZ 85281 Acquisition Wachovia
21 Wellington FL 33414 Refinance Wachovia
22 Chandler AZ 85225 Acquisition Wachovia
23 Kansas City MO 64155 Acquisition Wachovia
24 Cary NC 27513 Acquisition Wachovia
25 Flowood MS 39232 Acquisition Wachovia
26 Irving TX 75038 Las Colinas Portfolio Refinance Wachovia
27 Houston TX 77069 Acquisition Wachovia
28 San Diego CA 92123 Refinance Wachovia
29 Oxnard CA 93036 Refinance Wachovia
30 Skokie IL 60076 Acquisition Wachovia
31 Henderson NV 89012 Acquisition Wachovia
32 Gilbert AZ 85296 Refinance Artesia
33 Tempe AZ 85283 Acquisition Wachovia
34 Las Vegas NV 89122 Refinance Wachovia
35 Norwalk CT 06854 Refinance Wachovia
36 New Castle DE 19720 Refinance Wachovia
37 Pembroke Pines FL 33026 Refinance Wachovia
38 Wilmington DE 19720 Refinance Wachovia
39 Quakertown PA 18951 Refinance Wachovia
40 Greenville NC 27834 Refinance Wachovia
41 Seymour TN 37865 Refinance Wachovia
42 San Francisco CA 94133 Acquisition Wachovia
43 Irving TX 75038 Las Colinas Portfolio Refinance Wachovia
44 Newnan GA 30265 Refinance Wachovia
45 Tempe AZ 85284 Acquisition Artesia
46 Palm Beach Gardens FL 33410 Refinance Wachovia
47 Ontario CA 91762 Acquisition Wachovia
48 Tucson AZ 85711 Refinance Wachovia
49 Knoxville TN 37922 Acquisition Wachovia
50 Fresno CA 93710 Acquisition Wachovia
51 Englewood CO 80112 Refinance Artesia
52 Indio CA 92201 Acquisition Wachovia
53 Las Vegas NV 89117 Refinance Wachovia
54 Knoxville TN 37931 Refinance Wachovia
55 Savannah GA 31405 Refinance Wachovia
56 Tampa FL 33624 Acquisition Wachovia
57 Arcadia CA 91006 Arcadia Gateway Center Portfolio Refinance Wachovia
58 Everett WA 98208 Acquisition Wachovia
59 Houston TX 77036 Acquisition Wachovia
60 Charlotte NC 28277 Refinance Wachovia
61 Chandler AZ 85226 Acquisition Wachovia
62 Livonia MI 48152 Refinance Wachovia
63 Washington DC 20005 Refinance Wachovia
64 Charlotte NC 28273 Acquisition Wachovia
65 Various Various Various Acquisition Wachovia
65.01 Olathe KS 66062
65.02 Belton MO 64012
65.03 Platte City MO 64079
65.04 Kansas City KS 66106
65.05 Kansas City MO 64139
65.06 Olathe KS 66061
66 Arcadia CA 91006 Arcadia Gateway Center Portfolio Refinance Wachovia
67 Omaha NE 68134 Acquisition Wachovia
68 Jacksonville FL 32256 Acquisition Artesia
69 Bellingham WA 98226 Refinance Artesia
70 New Castle DE 19720 Refinance Wachovia
70.01 New Castle DE 19720
70.02 New Castle DE 19720
70.03 New Castle DE 19720
71 Logan UT 84341 Refinance Artesia
72 Saint Petersburg FL 33716 Acquisition Wachovia
73 Lexington KY 40507 Refinance Wachovia
74 Tigard OR 97224 Acquisition Wachovia
75 Nashville TN 37211 Acquisition Wachovia
76 Simpsonville SC 29680 Acquisition Wachovia
77 Virginia Beach VA 23451 Refinance Wachovia
78 Arcadia CA 91006 Arcadia Gateway Center Portfolio Refinance Wachovia
79 Indiana PA 15701 Refinance Wachovia
80 Albany NY 14202 Acquisition Wachovia
81 Knoxville TN 37931 Refinance Wachovia
82 Nashville TN 37214 Acquisition Wachovia
83 Auburn NY 13021 Acquisition Artesia
84 Scottsdale AZ 85258 Acquisition Artesia
85 Houston TX 77008 Acquisition Wachovia
86 Sterling VA 20166 Refinance Wachovia
87 Greensboro NC 27455 Acquisition Wachovia
88 Haverford Township PA 19083 Refinance Wachovia
89 Everett WA 98204 Refinance Artesia
90 Nashville TN 37228 Acquisition Wachovia
91 Houston TX 77058 Acquisition Wachovia
92 Temple Hills MD 20748 Refinance Wachovia
93 Olive Branch MS 38654 Acquisition Wachovia
94 Austin TX 78726 Refinance Wachovia
95 Lincolnton NC 28093 Refinance Wachovia
96 Richmond VA 23234 Refinance Wachovia
97 Austin TX 78758 Refinance Wachovia
98 Evanston IL 60201 Refinance Wachovia
99 Arlington TX 76011 Acquisition Artesia
100 Bellingham WA 98226 Refinance Artesia
101 Bangor ME 04401 Refinance Wachovia
102 Westminster CO 80031 Acquisition Wachovia
103 Parker CO 80134 Refinance Wachovia
104 Newnan GA 30265 Acquisition Wachovia
105 Woodbury NY 11797 Refinance Artesia
106 Rexburg ID 83440 Refinance Artesia
107 Saint Petersburg FL 33730 Refinance Wachovia
108 Jacksonville FL 32256 Refinance Wachovia
109 Phoenix AZ 85035 Refinance Wachovia
110 Duluth GA 30097 Acquisition Artesia
111 Winnetka IL 60093 Refinance Wachovia
112 Orlando FL 32804 Acquisition Wachovia
113 Gilbert AZ 85296 Refinance Artesia
114 Quincy MA 02169 Refinance Wachovia
115 Knoxville TN 37931 Autumnwood/Hinton Hollow/Southern Woods Portfolio Refinance Wachovia
116 Hingham MA 02043 Refinance Wachovia
117 Chicago IL 60647 Refinance Wachovia
118 Arlington VA 22209 Refinance Wachovia
119 Stafford VA 22554 Refinance Wachovia
120 Alexandria VA 22304 Refinance Wachovia
121 Birmingham AL 35242 Refinance Artesia
122 Edgewater MD 21037 Acquisition Wachovia
123 Winnetka IL 60093 Refinance Wachovia
124 Winnetka IL 60093 Refinance Wachovia
125 Kenmore WA 98028 Refinance Artesia
126 Knoxville TN 37932 Autumnwood/Hinton Hollow/Southern Woods Portfolio Refinance Wachovia
127 Miami FL 33156 Acquisition Wachovia
128 Baton Rouge LA 70809 Acquisition Artesia
129 Evanston IL 60201 Refinance Wachovia
130 Rochester MN Various Acquisition Artesia
130.01 Rochester MN 55906
130.02 Rochester MN 55904
131 Gloucester VA 23061 Refinance Wachovia
132 San Antonio TX 78251 Acquisition Wachovia
133 Baldwin Park CA 91706 Refinance Artesia
134 Knoxville TN 37923 Autumnwood/Hinton Hollow/Southern Woods Portfolio Refinance Wachovia
135 Carson City NV 89701 Acquisition Artesia
136 Vero Beach FL 32966 Acquisition Wachovia
137 Winnetka IL 60093 Refinance Wachovia
138 Livingston TN 38570 Acquisition Wachovia
139 Houston TX 77087 Acquisition Artesia
140 Santa Barbara CA 93101 Refinance Artesia
141 Houston TX Various Refinance Artesia
141.01 Houston TX 77075
141.02 Houston TX 77016
142 Grand Forks ND 58203 Acquisition Wachovia
% OF AGGREGATE % OF AGGREGATE
MORTGAGE LOAN GENERAL SPECIFIC ORIGINAL LOAN CUT-OFF DATE CUT-OFF DATE CUT-OFF DATE
NUMBER PROPERTY TYPE PROPERTY TYPE BALANCE ($) LOAN BALANCE ($) BALANCE GROUP 1 BALANCE
- -----------------------------------------------------------------------------------------------------------------------------
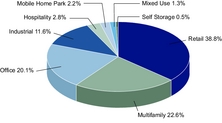
1 Industrial Various 318,976,000.00 318,976,000.00 9.46% 11.94%
1.01 Industrial Distribution/Warehouse 25,840,000.00
1.02 Industrial Distribution/Warehouse 22,960,000.00
1.03 Industrial Distribution/Warehouse 20,800,000.00
1.04 Industrial Distribution/Warehouse 20,080,000.00
1.05 Industrial Distribution/Warehouse 19,360,000.00
1.06 Industrial Distribution/Warehouse 18,696,000.00
1.07 Industrial Distribution/Warehouse 18,600,000.00
1.08 Industrial Distribution/Warehouse 17,760,000.00
1.09 Industrial Distribution/Warehouse 16,080,000.00
1.10 Industrial Distribution/Warehouse 15,120,000.00
1.11 Industrial Distribution/Warehouse 14,160,000.00
1.12 Industrial Distribution/Warehouse 12,800,000.00
1.13 Industrial Distribution/Warehouse 10,400,000.00
1.14 Industrial Distribution 9,740,000.00
1.15 Industrial Distribution/Warehouse 9,120,000.00
1.16 Industrial Distribution 9,000,000.00
1.17 Industrial Distribution/Warehouse 8,520,000.00
1.18 Industrial Distribution 7,680,000.00
1.19 Industrial Distribution 6,240,000.00
1.20 Industrial Distribution 6,100,000.00
1.21 Industrial Distribution/Warehouse 5,720,000.00
1.22 Industrial Distribution 5,240,000.00
1.23 Industrial Distribution/Warehouse 4,280,000.00
1.24 Industrial Distribution 4,240,000.00
1.25 Industrial Distribution 3,520,000.00
1.26 Industrial Distribution 3,520,000.00
1.27 Industrial Distribution 3,400,000.00
2 Retail Various 233,977,430.00 233,977,430.00 6.94% 8.76%
2.01 Retail Anchored 10,932,308.44
2.02 Retail Anchored 14,316,118.20
2.03 Retail Anchored 14,055,825.14
2.04 Retail Anchored 14,003,766.53
2.05 Retail Anchored 16,919,048.78
2.06 Retail Anchored 8,902,022.59
2.07 Retail Anchored 7,652,615.91
2.08 Retail Anchored 12,103,627.21
2.09 Retail Anchored 5,674,388.67
2.10 Retail Anchored 31,755,753.10
2.11 Retail Anchored 17,960,221.01
2.12 Retail Anchored 15,981,993.77
2.13 Retail Unanchored 2,811,165.03
2.14 Retail Anchored 13,014,652.91
2.15 Retail Anchored 15,617,583.49
2.16 Retail Anchored 32,276,339.21
3 Retail Anchored 205,000,000.00 205,000,000.00 6.08% 7.67%
4 Retail Anchored 161,039,673.00 161,039,673.00 4.78% 6.03%
4.01 Retail Anchored 7,577,082.03
4.02 Retail Anchored 10,671,946.52
4.03 Retail Anchored 24,011,879.67
4.04 Retail Anchored 7,683,801.50
4.05 Retail Anchored 5,229,253.80
4.06 Retail Anchored 17,341,913.10
4.07 Retail Anchored 11,899,220.37
4.08 Retail Anchored 5,335,973.26
4.09 Retail Anchored 6,509,887.38
4.10 Retail Anchored 10,405,147.86
4.11 Retail Anchored 13,873,530.48
4.12 Retail Anchored 19,156,144.00
4.13 Retail Anchored 21,343,893.04
5 Retail Anchored 150,000,000.00 150,000,000.00 4.45% 5.61%
6 Multifamily Conventional 132,000,000.00 132,000,000.00 3.92% 4.94%
7 Office CBD 129,000,000.00 129,000,000.00 3.83% 4.83%
8 Retail Single Tenant 100,000,000.00 100,000,000.00 2.97% 3.74%
9 Multifamily Conventional 65,050,000.00 65,050,000.00 1.93%
10 Retail Anchored 60,000,000.00 60,000,000.00 1.78% 2.25%
11 Retail Anchored 58,000,000.00 58,000,000.00 1.72% 2.17%
12 Multifamily Conventional 57,150,000.00 57,150,000.00 1.70%
13 Mobile Home Park Mobile Home Park 56,800,000.00 56,800,000.00 1.68%
14 Office Suburban 52,000,000.00 52,000,000.00 1.54% 1.95%
15 Multifamily Conventional 50,000,000.00 50,000,000.00 1.48%
16 Hospitality Full Service 49,000,000.00 49,000,000.00 1.45% 1.83%
17 Office Suburban 37,000,000.00 37,000,000.00 1.10% 1.38%
17.01 Office Suburban 9,860,000.00
17.02 Office Suburban 9,150,000.00
17.03 Office Suburban 5,770,000.00
17.04 Office Suburban 4,800,000.00
17.05 Office Suburban 4,190,000.00
17.06 Office Suburban 3,230,000.00
18 Industrial Light Industrial 35,000,000.00 35,000,000.00 1.04% 1.31%
19 Office Suburban 33,300,000.00 33,300,000.00 0.99% 1.25%
20 Multifamily Student Housing 33,150,000.00 33,150,000.00 0.98%
21 Retail Anchored 30,750,000.00 30,750,000.00 0.91% 1.15%
22 Multifamily Conventional 30,315,000.00 30,315,000.00 0.90%
23 Retail Anchored 28,275,000.00 28,275,000.00 0.84% 1.06%
24 Office Suburban 28,200,000.00 28,200,000.00 0.84% 1.06%
25 Retail Shadow Anchored 25,600,000.00 25,600,000.00 0.76% 0.96%
26 Office Suburban 25,025,000.00 25,025,000.00 0.74% 0.94%
27 Multifamily Conventional 24,475,000.00 24,475,000.00 0.73%
28 Multifamily Conventional 23,000,000.00 23,000,000.00 0.68%
29 Multifamily Conventional 23,000,000.00 23,000,000.00 0.68%
30 Office Suburban 22,600,000.00 22,600,000.00 0.67% 0.85%
31 Multifamily Conventional 22,400,000.00 22,400,000.00 0.66%
32 Retail Shadow Anchored 22,400,000.00 22,400,000.00 0.66% 0.84%
33 Multifamily Conventional 22,100,000.00 22,100,000.00 0.66%
34 Retail Anchored 21,000,000.00 21,000,000.00 0.62% 0.79%
35 Office Suburban 20,000,000.00 20,000,000.00 0.59% 0.75%
36 Office Suburban 18,800,000.00 18,800,000.00 0.56% 0.70%
37 Office Suburban 18,750,000.00 18,750,000.00 0.56% 0.70%
38 Office Suburban 18,400,000.00 18,400,000.00 0.55% 0.69%
39 Mobile Home Park Mobile Home Park 18,080,000.00 18,080,000.00 0.54%
40 Multifamily Conventional 18,000,000.00 18,000,000.00 0.53%
41 Multifamily Conventional 17,600,000.00 17,600,000.00 0.52%
42 Mixed Use Retail/Office 17,500,000.00 17,500,000.00 0.52% 0.65%
43 Office Suburban 17,500,000.00 17,500,000.00 0.52% 0.65%
44 Retail Anchored 17,500,000.00 17,500,000.00 0.52% 0.65%
45 Office Suburban 17,300,000.00 17,300,000.00 0.51% 0.65%
46 Office Suburban 17,250,000.00 17,250,000.00 0.51% 0.65%
47 Retail Anchored 17,000,000.00 17,000,000.00 0.50% 0.64%
48 Hospitality Limited Service 17,000,000.00 17,000,000.00 0.50% 0.64%
49 Multifamily Conventional 16,185,000.00 16,185,000.00 0.48%
50 Office Suburban 16,043,000.00 16,043,000.00 0.48% 0.60%
51 Office Suburban 15,500,000.00 15,500,000.00 0.46% 0.58%
52 Multifamily Conventional 15,500,000.00 15,500,000.00 0.46%
53 Retail Anchored 15,500,000.00 15,500,000.00 0.46% 0.58%
54 Multifamily Conventional 15,200,000.00 15,200,000.00 0.45%
55 Retail Anchored 15,120,000.00 15,120,000.00 0.45% 0.57%
56 Office Suburban 14,950,000.00 14,950,000.00 0.44% 0.56%
57 Office Suburban 14,880,000.00 14,880,000.00 0.44% 0.56%
58 Multifamily Conventional 14,700,000.00 14,700,000.00 0.44%
59 Multifamily Conventional 14,700,000.00 14,700,000.00 0.44%
60 Office Medical 14,450,000.00 14,450,000.00 0.43% 0.54%
61 Multifamily Conventional 14,050,000.00 14,050,000.00 0.42%
62 Office Suburban 13,375,000.00 13,375,000.00 0.40% 0.50%
63 Multifamily Conventional 13,300,000.00 13,300,000.00 0.39%
64 Office Suburban 13,025,000.00 13,025,000.00 0.39% 0.49%
65 Self Storage Self Storage 13,000,000.00 13,000,000.00 0.39% 0.49%
65.01 Self Storage Self Storage 3,563,000.00
65.02 Self Storage Self Storage 2,312,000.00
65.03 Self Storage Self Storage 2,160,000.00
65.04 Self Storage Self Storage 2,085,000.00
65.05 Self Storage Self Storage 1,781,000.00
65.06 Self Storage Self Storage 1,099,000.00
66 Retail Unanchored 12,820,000.00 12,820,000.00 0.38% 0.48%
67 Multifamily Conventional 12,500,000.00 12,500,000.00 0.37%
68 Retail Unanchored 12,300,000.00 12,300,000.00 0.36% 0.46%
69 Multifamily Conventional 12,200,000.00 12,200,000.00 0.36%
70 Industrial Warehouse/Distribution 12,160,000.00 12,160,000.00 0.36% 0.46%
70.01 Industrial Warehouse/Distribution 6,000,000.00
70.02 Industrial Warehouse/Distribution 3,120,000.00
70.03 Industrial Warehouse/Distribution 3,040,000.00
71 Retail Anchored 12,000,000.00 12,000,000.00 0.36% 0.45%
72 Office Suburban 11,500,000.00 11,500,000.00 0.34% 0.43%
73 Office CBD 11,350,000.00 11,350,000.00 0.34% 0.42%
74 Multifamily Conventional 11,000,000.00 11,000,000.00 0.33%
75 Office Suburban 10,885,000.00 10,885,000.00 0.32% 0.41%
76 Multifamily Conventional 10,500,000.00 10,500,000.00 0.31%
77 Hospitality Extended Stay 10,500,000.00 10,500,000.00 0.31% 0.39%
78 Office Medical 10,300,000.00 10,300,000.00 0.31% 0.39%
79 Retail Anchored 10,200,000.00 10,200,000.00 0.30% 0.38%
80 Office Suburban 10,137,000.00 10,137,000.00 0.30% 0.38%
81 Multifamily Conventional 9,800,000.00 9,800,000.00 0.29%
82 Office Suburban 9,800,000.00 9,800,000.00 0.29% 0.37%
83 Retail Single Tenant 9,500,000.00 9,500,000.00 0.28% 0.36%
84 Office Suburban 9,400,000.00 9,400,000.00 0.28% 0.35%
85 Multifamily Conventional 9,000,000.00 9,000,000.00 0.27%
86 Retail Single Tenant 9,000,000.00 8,982,796.47 0.27% 0.34%
87 Multifamily Conventional 8,625,000.00 8,625,000.00 0.26%
88 Retail Anchored 8,450,000.00 8,450,000.00 0.25% 0.32%
89 Hospitality Limited Service 8,400,000.00 8,400,000.00 0.25% 0.31%
90 Office Suburban 8,240,000.00 8,240,000.00 0.24% 0.31%
91 Office Suburban 8,150,000.00 8,150,000.00 0.24% 0.30%
92 Retail Unanchored 8,000,000.00 8,000,000.00 0.24% 0.30%
93 Retail Unanchored 7,800,000.00 7,800,000.00 0.23% 0.29%
94 Retail Unanchored 7,680,600.00 7,680,600.00 0.23% 0.29%
95 Industrial Distribution 7,630,000.00 7,630,000.00 0.23% 0.29%
96 Multifamily Conventional 7,250,000.00 7,250,000.00 0.22%
97 Multifamily Conventional 7,100,000.00 7,100,000.00 0.21%
98 Multifamily Conventional 7,030,000.00 7,030,000.00 0.21% 0.26%
99 Retail Unanchored 7,000,000.00 7,000,000.00 0.21% 0.26%
100 Multifamily Conventional 7,000,000.00 7,000,000.00 0.21%
101 Hospitality Full Service 6,700,000.00 6,700,000.00 0.20% 0.25%
102 Retail Anchored 6,700,000.00 6,700,000.00 0.20% 0.25%
103 Mixed Use Retail/Office 6,650,000.00 6,650,000.00 0.20% 0.25%
104 Multifamily Conventional 6,500,000.00 6,500,000.00 0.19%
105 Office Suburban 6,400,000.00 6,400,000.00 0.19% 0.24%
106 Multifamily Student Housing 6,250,000.00 6,250,000.00 0.19%
107 Industrial Distribution 6,250,000.00 6,250,000.00 0.19% 0.23%
108 Office Suburban 6,200,000.00 6,200,000.00 0.18% 0.23%
109 Industrial Flex 6,200,000.00 6,200,000.00 0.18% 0.23%
110 Office Suburban 5,671,000.00 5,671,000.00 0.17% 0.21%
111 Mixed Use Retail/Office/Multifamily 5,640,000.00 5,640,000.00 0.17% 0.21%
112 Industrial Flex 5,400,000.00 5,400,000.00 0.16% 0.20%
113 Retail Unanchored 5,000,000.00 5,000,000.00 0.15% 0.19%
114 Multifamily Conventional 5,000,000.00 5,000,000.00 0.15%
115 Multifamily Conventional 4,840,000.00 4,840,000.00 0.14%
116 Mixed Use Office/Retail 4,750,000.00 4,750,000.00 0.14% 0.18%
117 Retail Unanchored 4,750,000.00 4,750,000.00 0.14% 0.18%
118 Multifamily Conventional 4,600,000.00 4,600,000.00 0.14%
119 Office Suburban 4,400,000.00 4,400,000.00 0.13% 0.16%
120 Retail Unanchored 4,150,000.00 4,150,000.00 0.12% 0.16%
121 Hospitality Limited Service 4,000,000.00 4,000,000.00 0.12% 0.15%
122 Retail Single Tenant 3,800,000.00 3,795,971.97 0.11% 0.14%
123 Mixed Use Retail/Multifamily 3,620,000.00 3,620,000.00 0.11% 0.14%
124 Mixed Use Retail/Multifamily/Office 3,590,000.00 3,590,000.00 0.11% 0.13%
125 Multifamily Conventional 3,500,000.00 3,496,468.82 0.10%
126 Multifamily Conventional 3,220,000.00 3,220,000.00 0.10%
127 Retail Single Tenant 3,200,000.00 3,196,721.89 0.09% 0.12%
128 Office Suburban 3,040,000.00 3,040,000.00 0.09% 0.11%
129 Multifamily Conventional 2,915,000.00 2,915,000.00 0.09%
130 Self Storage Self Storage 2,900,000.00 2,900,000.00 0.09% 0.11%
130.01 Self Storage Self Storage
130.02 Self Storage Self Storage
131 Retail Shadow Anchored 2,800,000.00 2,800,000.00 0.08% 0.10%
132 Retail Single Tenant 2,690,000.00 2,690,000.00 0.08% 0.10%
133 Retail Unanchored 2,500,000.00 2,497,511.24 0.07% 0.09%
134 Multifamily Conventional 2,460,000.00 2,460,000.00 0.07%
135 Office Suburban 2,300,000.00 2,300,000.00 0.07% 0.09%
136 Retail Unanchored 2,142,000.00 2,142,000.00 0.06% 0.08%
137 Mixed Use Office/Retail 2,100,000.00 2,100,000.00 0.06% 0.08%
138 Retail Single Tenant 1,856,000.00 1,856,000.00 0.06% 0.07%
139 Retail Single Tenant 1,732,000.00 1,732,000.00 0.05% 0.06%
140 Office CBD 1,600,000.00 1,600,000.00 0.05% 0.06%
141 Retail Various 1,500,000.00 1,500,000.00 0.04% 0.06%
141.01 Retail Unanchored 1,032,258.00
141.02 Retail Single Tenant 467,742.00
142 Retail Single Tenant 840,000.00 840,000.00 0.02% 0.03%
INTEREST
% OF AGGREGATE MATURITY LOAN INTEREST ACCRUAL
MORTGAGE LOAN CUT-OFF DATE ORIGINATION DATE ADMINISTRATIVE ACCRUAL METHOD
NUMBER GROUP 2 BALANCE DATE FIRST PAY DATE OR ARD MORTGAGE RATE COST RATE METHOD DURING IO
- ----------------------------------------------------------------------------------------------------------------------------
1 11/07/06 12/11/06 11/11/16 5.9140% 0.02062% 30/360 30/360
1.01
1.02
1.03
1.04
1.05
1.06
1.07
1.08
1.09
1.10
1.11
1.12
1.13
1.14
1.15
1.16
1.17
1.18
1.19
1.20
1.21
1.22
1.23
1.24
1.25
1.26
1.27
2 12/01/06 01/09/07 12/09/16 5.4400% 0.02062% Actual/360 Actual/360
2.01
2.02
2.03
2.04
2.05
2.06
2.07
2.08
2.09
2.10
2.11
2.12
2.13
2.14
2.15
2.16
3 09/29/06 11/11/06 10/11/11 5.3050% 0.02062% Actual/360 Actual/360
4 12/01/06 01/09/07 12/09/13 5.4200% 0.02062% Actual/360 Actual/360
4.01
4.02
4.03
4.04
4.05
4.06
4.07
4.08
4.09
4.10
4.11
4.12
4.13
5 11/10/06 12/11/06 11/11/16 5.3700% 0.02062% Actual/360 Actual/360
6 10/05/06 11/11/06 10/11/16 6.1040% 0.02062% 30/360 30/360
7 11/09/06 12/11/06 11/11/16 5.8500% 0.02062% Actual/360 Actual/360
8 11/21/06 01/11/07 12/11/16 5.7600% 0.02062% Actual/360 Actual/360
9 9.31% 11/30/06 01/11/07 12/11/16 5.4900% 0.02062% Actual/360 Actual/360
10 09/29/06 11/11/06 10/11/11 5.5900% 0.02062% 30/360 30/360
11 11/09/06 12/11/06 11/11/16 5.889093% 0.02062% Actual/360 Actual/360
12 8.18% 11/30/06 01/11/07 12/11/16 5.4900% 0.02062% Actual/360 Actual/360
13 8.13% 11/08/06 12/11/06 11/11/16 5.7900% 0.02062% Actual/360 Actual/360
14 11/10/06 12/11/06 11/11/16 5.8800% 0.02062% Actual/360 Actual/360
15 7.15% 09/28/06 11/11/06 10/11/16 5.7000% 0.02062% Actual/360 Actual/360
16 12/04/06 01/11/07 12/11/16 6.2000% 0.03562% Actual/360 Actual/360
17 10/24/06 12/11/06 11/11/16 6.1200% 0.02062% Actual/360 Actual/360
17.01
17.02
17.03
17.04
17.05
17.06
18 11/01/06 12/11/06 11/11/16 5.6600% 0.03062% Actual/360 Actual/360
19 10/13/06 12/11/06 11/11/16 6.0200% 0.02062% Actual/360 Actual/360
20 4.74% 12/05/06 01/11/07 12/11/16 5.9200% 0.02062% Actual/360 Actual/360
21 11/21/06 01/11/07 12/11/16 5.5700% 0.02062% Actual/360 Actual/360
22 4.34% 11/14/06 01/11/07 12/11/11 6.0500% 0.02062% Actual/360 Actual/360
23 06/08/06 07/11/06 06/11/16 5.3800% 0.02062% Actual/360 Actual/360
24 10/06/06 11/11/06 10/11/16 5.4850% 0.02062% Actual/360 Actual/360
25 11/10/06 12/11/06 11/11/16 5.7800% 0.05062% Actual/360 Actual/360
26 10/02/06 11/11/06 10/11/16 5.7000% 0.02062% Actual/360 Actual/360
27 3.50% 08/23/06 10/11/06 09/11/16 6.2850% 0.02062% Actual/360 Actual/360
28 3.29% 10/11/06 11/11/06 10/11/16 5.7600% 0.02062% Actual/360 Actual/360
29 3.29% 10/31/06 12/11/06 11/11/16 5.8500% 0.02062% Actual/360 Actual/360
30 11/01/06 12/11/06 11/11/16 5.5300% 0.05062% Actual/360 Actual/360
31 3.20% 11/21/06 01/11/07 12/11/11 5.5800% 0.02062% Actual/360 Actual/360
32 10/30/06 01/01/07 12/01/16 6.1025% 0.02062% Actual/360 Actual/360
33 3.16% 11/15/06 01/11/07 12/11/11 6.0900% 0.02062% Actual/360 Actual/360
34 11/08/06 12/11/06 11/11/16 5.7900% 0.02062% Actual/360 Actual/360
35 11/03/06 12/11/06 11/11/16 6.1600% 0.02062% Actual/360 Actual/360
36 11/02/06 12/11/06 11/11/16 5.6100% 0.02062% Actual/360 Actual/360
37 11/16/06 01/11/07 12/11/16 5.8400% 0.02062% Actual/360 Actual/360
38 11/02/06 12/11/06 11/11/16 5.6100% 0.02062% Actual/360 Actual/360
39 2.59% 11/08/06 12/11/06 11/11/16 5.7900% 0.02062% Actual/360 Actual/360
40 2.58% 11/01/06 12/11/06 11/11/16 5.7600% 0.02062% Actual/360 Actual/360
41 2.52% 09/29/06 11/11/06 10/11/16 6.0200% 0.02062% Actual/360 Actual/360
42 10/11/06 11/11/06 10/11/16 5.6500% 0.02062% Actual/360 Actual/360
43 10/02/06 11/11/06 10/11/16 5.7000% 0.02062% Actual/360 Actual/360
44 10/10/06 11/11/06 10/11/16 5.6400% 0.02062% Actual/360 Actual/360
45 11/20/06 01/11/07 12/11/11 5.7000% 0.02062% Actual/360 Actual/360
46 11/16/06 01/11/07 12/11/16 5.8400% 0.02062% Actual/360 Actual/360
47 11/09/06 12/11/06 11/11/16 5.7900% 0.05062% Actual/360 Actual/360
48 12/01/06 01/11/07 12/11/16 5.9700% 0.02062% Actual/360
49 2.32% 11/21/06 01/11/07 12/11/16 5.2600% 0.02062% Actual/360 Actual/360
50 11/13/06 01/11/07 12/11/16 5.6300% 0.02062% Actual/360 Actual/360
51 11/15/06 01/11/07 12/11/16 5.8500% 0.02062% Actual/360 Actual/360
52 2.22% 08/24/06 10/11/06 09/11/11 6.5050% 0.02062% Actual/360 Actual/360
53 11/15/06 01/11/07 12/11/16 5.8000% 0.02062% Actual/360 Actual/360
54 2.17% 09/29/06 11/11/06 10/11/16 6.0200% 0.02062% Actual/360 Actual/360
55 12/05/06 01/11/07 12/11/16 5.6300% 0.02062% Actual/360 Actual/360
56 11/22/06 01/11/07 12/11/16 5.6200% 0.02062% Actual/360 Actual/360
57 11/09/06 12/11/06 11/11/16 6.0700% 0.02062% Actual/360 Actual/360
58 2.10% 10/30/06 12/11/06 11/11/11 5.8000% 0.02062% Actual/360 Actual/360
59 2.10% 11/30/06 01/11/07 12/11/11 5.6100% 0.06062% Actual/360 Actual/360
60 10/19/06 12/11/06 11/11/16 5.7600% 0.02062% Actual/360 Actual/360
61 2.01% 12/01/06 01/11/07 12/11/11 6.4200% 0.02062% Actual/360 Actual/360
62 11/01/06 12/11/06 11/11/16 5.7300% 0.02062% Actual/360 Actual/360
63 1.90% 11/15/06 01/11/07 12/11/16 5.6200% 0.02062% Actual/360 Actual/360
64 11/03/06 12/11/06 11/11/16 5.5700% 0.02062% Actual/360 Actual/360
65 10/30/06 12/11/06 11/11/16 5.9100% 0.02062% Actual/360 Actual/360
65.01
65.02
65.03
65.04
65.05
65.06
66 11/09/06 12/11/06 11/11/16 6.0700% 0.02062% Actual/360 Actual/360
67 1.79% 11/03/06 12/11/06 11/11/16 5.7200% 0.02062% Actual/360 Actual/360
68 08/14/06 10/11/06 09/11/16 6.2900% 0.02062% Actual/360 Actual/360
69 1.75% 11/13/06 01/11/07 12/11/16 5.7500% 0.02062% Actual/360
70 11/03/06 12/11/06 11/11/16 5.6100% 0.02062% Actual/360 Actual/360
70.01
70.02
70.03
71 11/17/06 01/11/07 12/11/16 5.4500% 0.02062% Actual/360 Actual/360
72 11/02/06 12/11/06 11/11/16 5.9000% 0.02062% Actual/360 Actual/360
73 11/21/06 01/11/07 12/11/16 5.6700% 0.02062% Actual/360 Actual/360
74 1.57% 11/15/06 01/11/07 12/11/16 5.8900% 0.02062% Actual/360 Actual/360
75 11/20/06 01/11/07 12/11/16 5.5900% 0.02062% Actual/360 Actual/360
76 1.50% 10/12/06 12/11/06 11/11/16 5.7140% 0.02062% Actual/360 Actual/360
77 10/26/06 12/11/06 11/11/16 5.8800% 0.02062% Actual/360 Actual/360
78 11/09/06 12/11/06 11/11/16 6.0700% 0.02062% Actual/360 Actual/360
79 12/08/06 01/11/07 12/11/16 5.7200% 0.02062% Actual/360
80 10/25/06 12/11/06 11/11/16 5.5000% 0.02062% Actual/360 Actual/360
81 1.40% 09/29/06 11/11/06 10/11/16 6.0200% 0.02062% Actual/360 Actual/360
82 11/21/06 01/11/07 12/11/16 5.6800% 0.02062% Actual/360 Actual/360
83 11/01/06 12/11/06 11/11/16 5.6000% 0.02062% Actual/360 Actual/360
84 11/10/06 01/11/07 12/11/16 5.9500% 0.02062% Actual/360
85 1.29% 09/28/06 11/11/06 10/11/16 5.3400% 0.02062% Actual/360 Actual/360
86 10/06/06 11/11/06 10/11/16 5.8000% 0.02062% Actual/360
87 1.23% 11/17/06 01/11/07 12/11/16 5.5500% 0.02062% Actual/360 Actual/360
88 10/06/06 11/11/06 10/11/16 5.9100% 0.02062% Actual/360 Actual/360
89 11/01/06 12/11/06 11/11/16 6.0500% 0.02062% Actual/360 Actual/360
90 11/16/06 01/11/07 12/11/16 5.6800% 0.02062% Actual/360 Actual/360
91 11/01/06 12/11/06 11/11/16 5.7000% 0.06062% Actual/360 Actual/360
92 11/15/06 01/11/07 12/11/16 5.9200% 0.02062% Actual/360 Actual/360
93 10/30/06 12/11/06 11/11/16 5.7500% 0.02062% Actual/360 Actual/360
94 08/07/06 09/11/06 08/11/16 6.1300% 0.07062% Actual/360 Actual/360
95 11/22/06 01/11/07 12/11/11 6.4000% 0.02062% Actual/360
96 1.04% 11/29/06 01/11/07 12/11/16 5.4800% 0.02062% Actual/360 Actual/360
97 1.02% 09/29/06 11/11/06 10/11/11 5.8200% 0.06062% Actual/360 Actual/360
98 10/26/06 12/11/06 11/11/16 5.8800% 0.02062% Actual/360 Actual/360
99 10/25/06 12/11/06 11/11/16 5.8800% 0.07062% Actual/360 Actual/360
100 1.00% 11/13/06 01/11/07 12/11/26 5.8300% 0.02062% Actual/360
101 11/30/06 01/11/07 12/11/16 5.8000% 0.02062% Actual/360
102 10/11/06 11/11/06 10/11/16 5.8500% 0.02062% Actual/360 Actual/360
103 11/21/06 01/11/07 12/11/16 5.6000% 0.07062% Actual/360 Actual/360
104 0.93% 10/25/06 12/11/06 11/11/16 5.7500% 0.06062% Actual/360 Actual/360
105 10/10/06 11/11/06 10/11/16 6.1900% 0.02062% Actual/360 Actual/360
106 0.89% 11/06/06 12/11/06 11/11/16 5.7500% 0.02062% Actual/360 Actual/360
107 11/13/06 01/11/07 12/11/16 5.8000% 0.02062% Actual/360
108 11/08/06 12/11/06 11/11/16 5.8800% 0.02062% Actual/360 Actual/360
109 10/30/06 12/11/06 11/11/16 5.8100% 0.07062% Actual/360 Actual/360
110 08/14/06 10/11/06 09/11/16 6.4500% 0.02062% Actual/360 Actual/360
111 10/30/06 12/11/06 11/11/16 5.8800% 0.02062% Actual/360 Actual/360
112 10/03/06 11/11/06 10/11/16 5.7100% 0.02062% Actual/360 Actual/360
113 11/09/06 01/11/07 12/11/16 5.6900% 0.02062% Actual/360 Actual/360
114 0.72% 11/28/06 01/11/07 12/11/16 5.6700% 0.02062% Actual/360 Actual/360
115 0.69% 09/29/06 11/11/06 10/11/16 6.0200% 0.02062% Actual/360 Actual/360
116 11/17/06 01/11/07 12/11/16 5.9900% 0.02062% Actual/360
117 11/21/06 01/11/07 12/11/16 5.7500% 0.02062% Actual/360 Actual/360
118 0.66% 11/01/06 12/11/06 11/11/16 5.6900% 0.02062% Actual/360 Actual/360
119 11/03/06 12/11/06 11/11/16 5.8300% 0.02062% Actual/360 Actual/360
120 12/04/06 01/11/07 12/11/16 5.8300% 0.02062% Actual/360 Actual/360
121 11/13/06 01/11/07 12/11/16 6.1400% 0.09062% Actual/360
122 11/03/06 12/11/06 11/11/16 5.6700% 0.02062% Actual/360
123 10/30/06 12/11/06 11/11/16 5.8800% 0.02062% Actual/360 Actual/360
124 10/30/06 12/11/06 11/11/16 5.8800% 0.02062% Actual/360 Actual/360
125 0.50% 10/16/06 12/11/06 11/11/16 5.9300% 0.02062% Actual/360
126 0.46% 09/29/06 11/11/06 10/11/16 6.0200% 0.02062% Actual/360 Actual/360
127 10/31/06 12/11/06 11/11/16 5.8500% 0.02062% Actual/360
128 10/26/06 12/11/06 11/11/16 5.9300% 0.02062% Actual/360 Actual/360
129 0.42% 10/26/06 12/11/06 11/11/16 5.8800% 0.02062% Actual/360 Actual/360
130 11/10/06 01/11/07 12/11/16 5.9700% 0.02062% Actual/360
130.01
130.02
131 11/29/06 01/11/07 12/11/16 5.6800% 0.02062% Actual/360
132 08/02/06 09/11/06 08/11/16 5.2800% 0.02062% Actual/360 Actual/360
133 10/17/06 12/11/06 11/11/16 6.0000% 0.02062% Actual/360
134 0.35% 09/29/06 11/11/06 10/11/16 6.0200% 0.02062% Actual/360 Actual/360
135 10/20/06 12/11/06 11/11/16 5.9200% 0.02062% Actual/360 Actual/360
136 11/30/06 01/11/07 12/11/16 5.7200% 0.02062% Actual/360 Actual/360
137 10/30/06 12/11/06 11/11/16 5.8800% 0.02062% Actual/360 Actual/360
138 06/12/06 08/11/06 07/11/16 5.7900% 0.02062% Actual/360 Actual/360
139 11/28/06 01/11/07 12/11/16 6.0400% 0.02062% Actual/360
140 10/25/06 01/11/07 12/11/16 5.9800% 0.02062% Actual/360 Actual/360
141 11/28/06 01/11/07 12/11/16 6.0400% 0.02062% Actual/360
141.01
141.02
142 08/15/06 10/11/06 09/11/16 5.8700% 0.02062% Actual/360 Actual/360
ORIGINAL REMAINING
TERM TO TERM TO MATURITY DATE OR
MORTGAGE LOAN MATURITY OR MATURITY OR REMAINING IO ORIGINAL AMORT REMAINING AMORT MONTHLY P&I ARD BALLOON
NUMBER ARD (MOS.) ARD (MOS.) PERIOD (MOS.) TERM (MOS.) TERM (MOS.) PAYMENTS ($) BALANCE ($) ARD LOAN
- ---------------------------------------------------------------------------------------------------------------------------------
1 120 119 119 IO IO IO 318,976,000.00 N
1.01
1.02
1.03
1.04
1.05
1.06
1.07
1.08
1.09
1.10
1.11
1.12
1.13
1.14
1.15
1.16
1.17
1.18
1.19
1.20
1.21
1.22
1.23
1.24
1.25
1.26
1.27
2 120 120 120 IO IO IO 233,977,430.00 N
2.01
2.02
2.03
2.04
2.05
2.06
2.07
2.08
2.09
2.10
2.11
2.12
2.13
2.14
2.15
2.16
3 60 58 58 IO IO IO 205,000,000.00 N
4 84 84 84 IO IO IO 161,039,673.00 N
4.01
4.02
4.03
4.04
4.05
4.06
4.07
4.08
4.09
4.10
4.11
4.12
4.13
5 120 119 119 IO IO IO 150,000,000.00 N
6 120 118 118 IO IO IO 132,000,000.00 N
7 120 119 59 360 360 761,023.81 120,447,303.01 N
8 120 120 120 IO IO IO 100,000,000.00 N
9 120 120 120 IO IO IO 65,050,000.00 N
10 60 58 58 IO IO IO 60,000,000.00 N
11 120 119 23 360 360 343,614.49 51,266,667.28 N
12 120 120 120 IO IO IO 57,150,000.00 N
13 120 119 119 IO IO IO 56,800,000.00 N
14 120 119 119 IO IO IO 52,000,000.00 N
15 120 118 58 360 360 290,200.21 46,590,577.09 N
16 120 120 36 360 360 300,109.80 44,450,487.92 N
17 120 119 59 360 360 224,696.28 34,671,985.41 N
17.01
17.02
17.03
17.04
17.05
17.06
18 120 119 119 IO IO IO 35,000,000.00 N
19 120 119 59 420 420 190,320.64 31,846,310.12 N
20 120 120 120 IO IO IO 33,150,000.00 Y
21 120 120 120 IO IO IO 30,750,000.00 N
22 60 60 60 IO IO IO 30,315,000.00 N
23 120 114 114 IO IO IO 28,275,000.00 Y
24 120 118 118 IO IO IO 28,200,000.00 N
25 120 119 59 360 360 149,882.89 23,879,844.63 N
26 120 118 118 IO IO IO 25,025,000.00 N
27 120 117 81 360 360 151,254.36 23,636,816.63 N
28 120 118 118 IO IO IO 23,000,000.00 N
29 120 119 119 IO IO IO 23,000,000.00 N
30 120 119 119 IO IO IO 22,600,000.00 N
31 60 60 60 IO IO IO 22,400,000.00 N
32 120 120 48 360 360 135,779.01 20,645,345.21 N
33 60 60 60 IO IO IO 22,100,000.00 N
34 120 119 119 IO IO IO 21,000,000.00 N
35 120 119 59 360 360 121,975.15 18,751,453.42 N
36 120 119 35 360 360 108,045.43 16,857,261.61 N
37 120 120 120 IO IO IO 18,750,000.00 N
38 120 119 35 360 360 105,746.59 16,498,596.48 N
39 120 119 119 IO IO IO 18,080,000.00 N
40 120 119 119 IO IO IO 18,000,000.00 N
41 120 118 118 IO IO IO 17,600,000.00 N
42 120 118 118 IO IO IO 17,500,000.00 N
43 120 118 118 IO IO IO 17,500,000.00 N
44 120 118 118 IO IO IO 17,500,000.00 N
45 60 60 60 IO IO IO 17,300,000.00 N
46 120 120 120 IO IO IO 17,250,000.00 N
47 120 119 119 IO IO IO 17,000,000.00 N
48 120 120 360 360 101,595.93 14,405,820.95 N
49 120 120 120 IO IO IO 16,185,000.00 N
50 120 120 120 IO IO IO 16,043,000.00 N
51 120 120 36 360 360 91,440.84 13,965,928.06 N
52 60 57 57 IO IO IO 15,500,000.00 N
53 120 120 120 IO IO IO 15,500,000.00 N
54 120 118 118 IO IO IO 15,200,000.00 N
55 120 120 120 IO IO IO 15,120,000.00 N
56 120 120 120 IO IO IO 14,950,000.00 N
57 120 119 119 IO IO IO 14,880,000.00 N
58 60 59 59 IO IO IO 14,700,000.00 N
59 60 60 60 IO IO IO 14,700,000.00 N
60 120 119 59 360 360 84,418.10 13,475,344.82 Y
61 60 60 60 IO IO IO 14,050,000.00 N
62 120 119 59 360 360 77,883.02 12,467,690.84 N
63 120 120 60 360 360 76,520.32 12,379,175.01 N
64 120 119 119 IO IO IO 13,025,000.00 N
65 120 119 119 IO IO IO 13,000,000.00 N
65.01
65.02
65.03
65.04
65.05
65.06
66 120 119 119 IO IO IO 12,820,000.00 N
67 120 119 59 360 360 72,708.56 11,650,435.49 N
68 120 117 69 360 360 76,053.49 11,719,287.03 N
69 120 120 360 360 71,195.89 10,270,508.83 N
70 120 119 35 360 360 69,884.70 10,903,420.28 N
70.01
70.02
70.03
71 120 120 120 IO IO IO 12,000,000.00 N
72 120 119 35 360 360 68,210.70 10,371,523.68 Y
73 120 120 36 360 360 65,659.83 10,189,959.09 N
74 120 120 120 IO IO IO 11,000,000.00 N
75 120 120 36 360 360 62,419.88 9,756,640.24 N
76 120 119 47 360 360 61,035.23 9,615,220.09 N
77 120 119 23 300 300 66,883.53 8,697,836.80 N
78 120 119 119 IO IO IO 10,300,000.00 N
79 120 120 300 300 63,984.07 7,824,363.56 N
80 120 119 119 IO IO IO 10,137,000.00 Y
81 120 118 118 IO IO IO 9,800,000.00 N
82 120 120 60 360 360 56,755.10 9,129,149.76 N
83 120 119 119 IO IO IO 9,500,000.00 N
84 120 120 420 420 53,282.57 8,416,303.00 N
85 120 118 58 360 360 50,201.21 8,343,513.37 N
86 120 118 360 358 52,807.77 7,588,209.57 Y
87 120 120 48 360 360 49,242.72 7,876,411.65 N
88 120 118 22 360 360 50,174.12 7,473,164.00 N
89 120 119 11 300 300 54,378.35 6,760,913.15 N
90 120 120 60 360 360 47,720.61 7,675,938.17 N
91 120 119 59 360 360 47,302.63 7,593,978.31 N
92 120 120 36 360 360 47,553.35 7,218,158.18 N
93 120 119 119 IO IO IO 7,800,000.00 N
94 120 116 20 360 360 46,692.97 6,826,643.21 N
95 60 60 360 360 47,726.10 7,174,619.19 Y
96 120 120 60 360 360 41,073.77 6,734,688.52 N
97 60 58 58 IO IO IO 7,100,000.00 N
98 120 119 119 IO IO IO 7,030,000.00 N
99 120 119 47 360 360 41,430.02 6,427,980.50 N
100 240 240 240 240 49,807.44 0.00 N
101 120 120 120 120 73,712.60 46,107.30 N
102 120 118 34 360 360 39,526.04 6,036,967.96 N
103 120 120 120 IO IO IO 6,650,000.00 N
104 120 119 119 IO IO IO 6,500,000.00 N
105 120 118 58 360 360 39,156.49 6,003,077.55 N
106 120 119 23 360 360 36,473.30 5,506,729.84 N
107 120 120 240 240 44,058.81 4,066,391.07 Y
108 120 119 59 360 360 36,695.16 5,791,301.11 N
109 120 119 119 IO IO IO 6,200,000.00 N
110 120 117 57 360 360 35,658.30 5,336,866.17 N
111 120 119 119 IO IO IO 5,640,000.00 N
112 120 118 34 360 360 31,375.85 4,852,057.58 N
113 120 120 120 IO IO IO 5,000,000.00 N
114 120 120 60 360 360 28,925.04 4,657,080.58 N
115 120 118 118 IO IO IO 4,840,000.00 N
116 120 120 360 360 28,448.12 4,027,533.39 N
117 120 120 60 360 360 27,719.71 4,429,138.77 N
118 120 119 59 360 360 26,669.28 4,285,576.57 N
119 120 119 23 360 360 25,901.25 3,883,922.05 N
120 120 120 120 IO IO IO 4,150,000.00 N
121 120 120 300 300 26,115.45 3,112,427.01 N
122 120 119 360 359 21,983.03 3,191,001.88 Y
123 120 119 119 IO IO IO 3,620,000.00 N
124 120 119 119 IO IO IO 3,590,000.00 N
125 120 119 360 359 20,827.01 2,962,146.31 N
126 120 118 118 IO IO IO 3,220,000.00 N
127 120 119 360 359 18,878.11 2,701,802.46 N
128 120 119 35 360 360 18,089.75 2,743,301.95 N
129 120 119 119 IO IO IO 2,915,000.00 N
130 120 120 360 360 17,331.07 2,457,463.75 N
130.01
130.02
131 120 120 360 360 16,215.74 2,352,162.32 N
132 120 116 116 IO IO IO 2,690,000.00 Y
133 120 119 360 359 14,988.76 2,120,199.91 N
134 120 118 118 IO IO IO 2,460,000.00 N
135 120 119 35 360 360 13,671.59 2,075,118.18 N
136 120 120 60 360 360 12,459.34 1,996,480.13 N
137 120 119 119 IO IO IO 2,100,000.00 N
138 120 115 115 IO IO IO 1,856,000.00 Y
139 120 120 360 360 10,428.80 1,470,727.58 N
140 120 120 24 360 360 9,572.24 1,417,268.02 N
141 120 120 360 360 9,031.87 1,273,724.87 N
141.01
141.02
142 120 117 117 IO IO IO 840,000.00 Y
MORTGAGE LOAN
NUMBER PREPAYMENT PROVISIONS APPRAISED VALUE ($)
- ----------------------------------------------------------------------------------------------------------------------------------
1 GRTR1%orYM(113),O(7) 398,720,000
1.01 32,300,000
1.02 28,700,000
1.03 26,000,000
1.04 25,100,000
1.05 24,200,000
1.06 23,370,000
1.07 23,250,000
1.08 22,200,000
1.09 20,100,000
1.10 18,900,000
1.11 17,700,000
1.12 16,000,000
1.13 13,000,000
1.14 12,175,000
1.15 11,400,000
1.16 11,250,000
1.17 10,650,000
1.18 9,600,000
1.19 7,800,000
1.20 7,625,000
1.21 7,150,000
1.22 6,550,000
1.23 5,350,000
1.24 5,300,000
1.25 4,400,000
1.26 4,400,000
1.27 4,250,000
2 L(24),D(92),O(4) 449,450,000
2.01 21,000,000
2.02 27,500,000
2.03 27,000,000
2.04 26,900,000
2.05 32,500,000
2.06 17,100,000
2.07 14,700,000
2.08 23,250,000
2.09 10,900,000
2.10 61,000,000
2.11 34,500,000
2.12 30,700,000
2.13 5,400,000
2.14 25,000,000
2.15 30,000,000
2.16 62,000,000
3 L(26),D(21),O(13) 457,000,000
4 L(24),D(56),O(4) 301,800,000
4.01 14,200,000
4.02 20,000,000
4.03 45,000,000
4.04 14,400,000
4.05 9,800,000
4.06 32,500,000
4.07 22,300,000
4.08 10,000,000
4.09 12,200,000
4.10 19,500,000
4.11 26,000,000
4.12 35,900,000
4.13 40,000,000
5 L(25),D(88)orGRTR1%orYM(88),O(7) 259,000,000
6 L(26),D(90),O(4) or GRTR1%orYM(116),O(4) 371,900,000
7 GRTR2%orYM(116),O(4) 161,355,000
8 L(24),D(93),O(3) 125,000,000
9 L(36),GRTR1%orYM(81),O(3) or L(24),D(93),O(3) 92,000,000
10 L(26),D(27),O(7) or GRTR1%orYM(53),O(7) 129,000,000
11 L(25),D(91),O(4) 72,500,000
12 L(36),GRTR1%orYM(81),O(3) or L(24),D(93),O(3) 81,500,000
13 L(25),D(92),O(3) 71,000,000
14 L(25),D(90),O(5) or GRTR1%orYM(115),O(5) 65,000,000
15 L(26),D(90),O(4) 69,550,000
16 L(7),GRTR1%orYM(110),O(3) 67,000,000
17 L(25),D(92),O(3) 47,210,000
17.01 11,600,000
17.02 11,000,000
17.03 6,790,000
17.04 7,950,000
17.05 6,070,000
17.06 3,800,000
18 L(25),D(90),O(5) 58,400,000
19 L(36),D(81),O(3) 43,500,000
20 L(24),GRTR1%orYM(93),O(3) 51,450,000
21 L(24),D(93),O(3) 38,900,000
22 L(24),GRTR1%orYM(32),O(4) 43,700,000
23 L(48),D(68),O(4) 45,100,000
24 L(37),GRTR1%orYM(76),O(7) 41,000,000
25 L(25),D(92),O(3) 35,200,000
26 GRTR1%orYM(116),O(4) 36,500,000
27 L(27),D(89),O(4) 36,100,000
28 L(26),D(90),O(4) 33,600,000
29 GRTR1%orYM1%(117),O(3) 28,800,000
30 L(25),D(92),O(3) 40,000,000
31 GRTR1%orYM(56),O(4) 32,800,000
32 L(36),D(81),O(3) 34,500,000
33 GRTR1%orYM(35),O(25) 28,200,000
34 GRTR1%orYM(116),O(4) 26,700,000
35 L(25),D(92),O(3) 32,800,000
36 L(25),D(91),O(4) 23,500,000
37 L(24),D(93),O(3) 23,700,000
38 L(25),D(91),O(4) 23,000,000
39 L(25),D(92),O(3) 22,600,000
40 L(25),D(92),O(3) 27,900,000
41 L(24),GRTR1%orYM(93),O(3) 22,000,000
42 L(26),D(90),O(4) 29,200,000
43 GRTR1%orYM(116),O(4) 25,000,000
44 L(23),GRTR1%orYM(36),LSR5%orYM(12),LSR4%orYM(12),LSR3%orYM(12),LSR2%orYM(12),LSR1%orYM(7),O(6) 25,450,000
45 L(36),GRTR1%orYM(21),O(3) 23,000,000
46 L(24),D(93),O(3) 22,700,000
47 L(25),D(92),O(3) 21,250,000
48 L(48),D(69),O(3) 23,060,000
49 L(24),D(93),O(3) 25,000,000
50 L(24),D(93),O(3) 25,200,000
51 L(24),D(93),O(3) 20,700,000
52 GRTR1%orYM(36),O(24) 19,400,000
53 GRTR1%orYM(116),O(4) 19,400,000
54 L(24),GRTR1%orYM(93),O(3) 19,000,000
55 L(24),D(93),O(3) 18,900,000
56 L(24),D(93),O(3) 20,500,000
57 L(25),D(91),O(4) 18,600,000
58 L(25),D(31),O(4) 21,500,000
59 L(24),D(33),O(3) 19,625,000
60 L(49),GRTR1%orYM(68),O(3) 20,400,000
61 L(24),GRTR1%orYM(32),O(4) 17,600,000
62 L(25),D(92),O(3) 17,000,000
63 L(36),GRTR2%orYM(71),YM(10),O(3) 18,300,000
64 L(25),D(92),O(3) 18,350,000
65 L(25),D(92),O(3) 17,150,000
65.01 4,700,000
65.02 3,050,000
65.03 2,850,000
65.04 2,750,000
65.05 2,350,000
65.06 1,450,000
66 L(25),D(91),O(4) 17,500,000
67 L(25),D(92),O(3) 15,650,000
68 L(27),D(89),O(4) 20,000,000
69 L(24),D(93),O(3) 21,900,000
70 L(25),D(91),O(4) 15,200,000
70.01 7,500,000
70.02 3,900,000
70.03 3,800,000
71 L(24),D(93),O(3) 17,300,000
72 L(25),D(92),O(3) 16,300,000
73 L(48),D(69),O(3) 15,600,000
74 GRTR1%orYM(116),O(4) 15,300,000
75 L(24),D(93),O(3) 15,550,000
76 L(25),D(91),O(4) 14,100,000
77 L(25),D(92),O(3) 14,100,000
78 L(25),D(91),O(4) 13,200,000
79 L(24),D(92),O(4) 24,700,000
80 L(25),D(92),O(3) 16,600,000
81 L(24),GRTR1%orYM(93),O(3) 12,250,000
82 L(24),D(93),O(3) 12,400,000
83 L(25),D(92),O(3) 14,000,000
84 L(24),D(93),O(3) 12,420,000
85 L(48),D(69),O(3) 11,300,000
86 L(26),D(91),O(3) 11,900,000
87 L(24),D(92),O(4) 11,500,000
88 L(26),D(90),O(4) 11,850,000
89 L(36),GRTR1%orYM(81),O(3) 12,400,000
90 L(24),D(93),O(3) 10,600,000
91 L(25),D(92),O(3) 10,200,000
92 GRTR1%orYM(116),O(4) 11,400,000
93 L(25),D(92),O(3) 9,750,000
94 L(28),D(89),O(3) 9,620,000
95 L(24),D(33),O(3) 10,300,000
96 L(24),D(93),O(3) 9,100,000
97 L(26),D(31),O(3) 9,075,000
98 L(25),D(92),O(3) 10,650,000
99 L(25),D(92),O(3) 8,700,000
100 L(24),D(213),O(3) 12,500,000
101 L(24),D(93),O(3) 14,000,000
102 L(26),D(90),O(4) 8,500,000
103 L(24),D(93),O(3) 9,150,000
104 L(25),D(92),O(3) 8,500,000
105 L(26),D(89),O(5) 8,200,000
106 L(25),D(92),O(3) 8,000,000
107 L(24),D(93),O(3) 11,200,000
108 L(25),D(90),O(5) or GRTR1%orYM(115),O(5) 11,000,000
109 L(25),D(92),O(3) 8,500,000
110 L(27),D(89),O(4) 8,400,000
111 L(25),D(92),O(3) 8,100,000
112 L(26),D(91),O(3) 7,400,000
113 L(24),D(93),O(3) 7,100,000
114 L(36),GRTR1%orYM(77),O(7) 7,100,000
115 L(24),GRTR1%orYM(93),O(3) 6,050,000
116 L(24),D(93),O(3) 6,100,000
117 L(24),D(92),O(4) 6,100,000
118 GRTR2%orYM(117),O(3) 6,300,000
119 L(25),D(92),O(3) 6,150,000
120 L(24),D(93),O(3) 6,500,000
121 L(24),D(93),O(3) 5,850,000
122 L(25),D(91),O(4) 4,800,000
123 L(25),D(92),O(3) 5,310,000
124 L(25),D(92),O(3) 5,120,000
125 L(25),D(92),O(3) 5,540,000
126 L(24),GRTR1%orYM(93),O(3) 4,025,000
127 L(25),D(92),O(3) 4,150,000
128 L(25),D(92),O(3) 4,000,000
129 L(25),D(92),O(3) 4,630,000
130 L(24),D(93),O(3) 3,830,000
130.01 1,940,000
130.02 1,890,000
131 L(24),D(93),O(3) 4,400,000
132 L(48),D(68),O(4) 4,200,000
133 L(25),D(92),O(3) 4,100,000
134 L(24),GRTR1%orYM(93),O(3) 3,075,000
135 L(25),D(92),O(3) 3,800,000
136 L(24),D(93),O(3) 2,700,000
137 L(25),D(92),O(3) 3,140,000
138 L(48),D(68),O(4) 2,830,000
139 L(24),D(93),O(3) 2,330,000
140 L(60),GRTR1%orYM(57),O(3) 3,950,000
141 L(24),D(93),O(3) 2,700,000
141.01 1,830,000
141.02 870,000
142 L(48),D(68),O(4) 1,400,000
MORTGAGE LOAN CUT-OFF DATE LTV RATIO AT YEAR UNIT OF
NUMBER APPRAISAL DATE DSCR (X) LTV RATIO MATURITY OR ARD BUILT YEAR RENOVATED NUMBER OF UNITS MEASURE
- -------------------------------------------------------------------------------------------------------------------------
1 Various 1.39 80.00% 80.00% Various 8,324,477 Sq. Ft.
1.01 08/23/06 2002 842,000 Sq. Ft.
1.02 06/01/07 2006 650,760 Sq. Ft.
1.03 08/29/06 2001 759,300 Sq. Ft.
1.04 08/23/06 2002 600,576 Sq. Ft.
1.05 08/23/06 2004 689,009 Sq. Ft.
1.06 08/25/06 2004 200,000 Sq. Ft.
1.07 08/29/06 2003 607,650 Sq. Ft.
1.08 08/23/06 2000 481,874 Sq. Ft.
1.09 08/23/06 2000 450,000 Sq. Ft.
1.10 08/23/06 2000 418,400 Sq. Ft.
1.11 08/23/06 2004 426,326 Sq. Ft.
1.12 08/23/06 1999 395,679 Sq. Ft.
1.13 08/29/06 2005 301,200 Sq. Ft.
1.14 08/25/06 1998 250,000 Sq. Ft.
1.15 08/23/06 2003 250,000 Sq. Ft.
1.16 08/25/06 1998 101,600 Sq. Ft.
1.17 08/25/06 2004 108,400 Sq. Ft.
1.18 08/25/06 1997 86,000 Sq. Ft.
1.19 08/25/06 1988 60,177 Sq. Ft.
1.20 08/25/06 1999 89,636 Sq. Ft.
1.21 08/29/06 2005 129,842 Sq. Ft.
1.22 08/25/06 1997 79,110 Sq. Ft.
1.23 08/25/06 1997 150,000 Sq. Ft.
1.24 08/25/06 1990 44,306 Sq. Ft.
1.25 08/25/06 1988 61,318 Sq. Ft.
1.26 08/25/06 1990 57,168 Sq. Ft.
1.27 08/25/06 1990 34,146 Sq. Ft.
2 Various 2.39 52.06% 52.06% Various Various 3,281,027 Sq. Ft.
2.01 09/01/06 1977 1994 175,086 Sq. Ft.
2.02 09/01/06 1988 278,017 Sq. Ft.
2.03 09/01/06 1973 89,704 Sq. Ft.
2.04 09/01/06 1960 1996 224,514 Sq. Ft.
2.05 09/01/06 2000 181,055 Sq. Ft.
2.06 09/01/06 1975 125,710 Sq. Ft.
2.07 09/01/06 1968 1992 146,947 Sq. Ft.
2.08 09/01/06 1988 264,360 Sq. Ft.
2.09 09/01/06 1969 1996 103,903 Sq. Ft.
2.10 09/01/06 1970 2005 191,085 Sq. Ft.
2.11 07/31/06 1996 387,273 Sq. Ft.
2.12 09/01/06 1962 2003 372,243 Sq. Ft.
2.13 09/01/06 2002 12,000 Sq. Ft.
2.14 07/31/06 1992 124,937 Sq. Ft.
2.15 07/31/06 1998 197,424 Sq. Ft.
2.16 09/01/06 1997 406,769 Sq. Ft.
3 03/01/08 1.97 44.86% 44.86% 1970 1991 564,247 Sq. Ft.
4 Various 2.31 53.36% 53.36% Various Various 1,777,884 Sq. Ft.
4.01 09/01/06 1968 61,295 Sq. Ft.
4.02 09/01/06 2001 103,931 Sq. Ft.
4.03 09/01/06 1999 349,433 Sq. Ft.
4.04 09/01/06 1963 1988 71,940 Sq. Ft.
4.05 09/01/06 1962 1993 78,092 Sq. Ft.
4.06 09/01/06 1959 1990 159,454 Sq. Ft.
4.07 09/01/06 1998 143,763 Sq. Ft.
4.08 09/01/06 1975 44,131 Sq. Ft.
4.09 09/01/06 1967 1998 84,480 Sq. Ft.
4.10 09/01/06 1964 1988 77,458 Sq. Ft.
4.11 09/01/06 1959 1992 183,867 Sq. Ft.
4.12 09/01/06 1996 198,473 Sq. Ft.
4.13 07/31/06 1997 2000 221,567 Sq. Ft.
5 09/20/06 2.15 57.92% 57.92% 1975 1998 552,388 Sq. Ft.
6 07/26/06 1.35 70.99% 70.99% 1999 1,052 Units
7 10/19/06 1.34 79.95% 74.65% 1974 1991 1,729,294 Sq. Ft.
8 01/01/08 1.04 80.00% 80.00% 2008 27,900 Sq. Ft.
9 11/14/06 1.22 70.71% 70.71% 1986 400 Units
10 09/01/06 2.44 46.51% 46.51% 2000 340,369 Sq. Ft.
11 10/01/07 1.30 80.00% 70.71% 1979 2004 593,626 Sq. Ft.
12 11/14/06 1.23 70.12% 70.12% 1989 354 Units
13 10/03/06 1.33 80.00% 80.00% 1971 1,079 Pads
14 09/08/06 1.21 80.00% 80.00% 2002 174,310 Sq. Ft.
15 08/24/06 1.20 71.89% 66.99% 1983 2001 996 Units
16 01/01/08 1.33 73.13% 66.34% 1969 2006 274 Rooms
17 08/11/06 1.25 78.37% 73.44% Various 469,667 Sq. Ft.
17.01 08/11/06 1984 109,837 Sq. Ft.
17.02 08/11/06 1985 108,004 Sq. Ft.
17.03 08/11/06 1985 68,991 Sq. Ft.
17.04 08/11/06 1981 86,006 Sq. Ft.
17.05 08/11/06 1986 57,903 Sq. Ft.
17.06 08/11/06 1981 38,926 Sq. Ft.
18 09/20/06 2.17 59.93% 59.93% 2000 322,318 Sq. Ft.
19 07/26/06 1.21 76.55% 73.21% 2005 129,315 Sq. Ft.
20 08/28/06 1.57 64.43% 64.43% 1998 288 Units
21 10/14/06 1.41 79.05% 79.05% 2002 130,838 Sq. Ft.
22 10/17/07 1.40 69.37% 69.37% 1985 1996 352 Units
23 03/15/06 1.74 62.69% 62.69% 1997 245,590 Sq. Ft.
24 09/07/06 1.58 68.78% 68.78% 1987 212,267 Sq. Ft.
25 09/21/06 1.30 72.73% 67.84% 2005 211,749 Sq. Ft.
26 09/12/06 1.68 68.56% 68.56% 1998 226,904 Sq. Ft.
27 06/28/06 1.25 67.80% 65.48% 1999 382 Units
28 09/22/06 1.34 68.45% 68.45% 1979 184 Units
29 09/29/06 1.21 79.86% 79.86% 1973 2003 168 Units
30 09/28/06 1.36 56.50% 56.50% 1972 2003 293,643 Sq. Ft.
31 10/19/06 1.29 68.29% 68.29% 1998 2006 240 Units
32 04/01/07 1.19 64.93% 59.84% 2006 102,777 Sq. Ft.
33 12/01/08 1.39 78.37% 78.37% 1987 247 Units
34 09/02/06 1.43 78.65% 78.65% 2000 107,705 Sq. Ft.
35 08/17/06 1.40 60.98% 57.17% 1970 1999 185,532 Sq. Ft.
36 10/09/06 1.23 80.00% 71.73% 1997 126,935 Sq. Ft.
37 10/06/06 1.47 79.11% 79.11% 2001 91,845 Sq. Ft.
38 10/09/06 1.31 80.00% 71.73% 2002 98,500 Sq. Ft.
39 10/03/06 1.36 80.00% 80.00% 1965 356 Pads
40 09/15/06 1.59 64.52% 64.52% 1987 457 Units
41 08/31/06 1.32 80.00% 80.00% 1997 222 Units
42 09/12/06 1.38 59.93% 59.93% 1986 1997 88,338 Sq. Ft.
43 09/12/06 1.53 70.00% 70.00% 1997 159,212 Sq. Ft.
44 09/25/06 1.55 68.76% 68.76% 2006 110,178 Sq. Ft.
45 10/19/06 1.31 75.22% 75.22% 1999 137,484 Sq. Ft.
46 10/04/06 1.48 75.99% 75.99% 2000 85,022 Sq. Ft.
47 10/01/06 1.22 80.00% 80.00% 1982 2004 95,420 Sq. Ft.
48 10/17/06 1.30 73.72% 62.47% 1975 2004 142 Rooms
49 10/20/06 1.94 64.74% 64.74% 2001 262 Units
50 12/01/06 1.62 63.66% 63.66% 1968 1999 122,605 Sq. Ft.
51 10/04/06 1.28 74.88% 67.47% 2001 175,213 Sq. Ft.
52 07/05/06 1.25 79.90% 79.90% 1987 2003 186 Units
53 09/02/06 1.47 79.90% 79.90% 1999 88,455 Sq. Ft.
54 08/31/06 1.34 80.00% 80.00% 1987 226 Units
55 09/19/06 1.25 80.00% 80.00% 1985 1995 105,084 Sq. Ft.
56 09/28/06 1.45 72.93% 72.93% 1986 1997 138,772 Sq. Ft.
57 09/11/06 1.20 80.00% 80.00% 1988 64,828 Sq. Ft.
58 10/11/06 1.35 68.37% 68.37% 1989 1999 200 Units
59 09/20/06 1.46 74.90% 74.90% 1968 1997 219 Units
60 09/22/06 1.28 70.83% 66.06% 2006 59,472 Sq. Ft.
61 07/25/06 1.29 79.83% 79.83% 1986 186 Units
62 09/27/06 1.35 78.68% 73.34% 1986 116,339 Sq. Ft.
63 10/03/06 1.23 72.68% 67.65% 1965 2000 124 Units
64 10/06/06 1.67 70.98% 70.98% 2001 113,600 Sq. Ft.
65 Various 1.35 75.80% 75.80% Various Various 533,653 Sq. Ft.
65.01 09/11/06 2000 117,725 Sq. Ft.
65.02 09/12/06 1964 2003 123,733 Sq. Ft.
65.03 09/11/06 2001 2003 73,600 Sq. Ft.
65.04 09/13/06 2002 71,085 Sq. Ft.
65.05 09/12/06 2003 111,010 Sq. Ft.
65.06 09/11/06 1997 36,500 Sq. Ft.
66 09/11/06 1.20 73.26% 73.26% 1988 43,456 Sq. Ft.
67 09/26/06 1.25 79.87% 74.44% 1972 418 Units
68 05/22/06 1.38 61.50% 58.60% 2004 98,749 Sq. Ft.
69 10/13/06 1.26 55.71% 46.90% 2003 234 Units
70 10/09/06 1.37 80.00% 71.73% Various 244,158 Sq. Ft.
70.01 10/09/06 1987 120,300 Sq. Ft.
70.02 10/09/06 1989 62,000 Sq. Ft.
70.03 10/09/06 1989 61,858 Sq. Ft.
71 10/17/06 1.85 69.36% 69.36% 2006 124,900 Sq. Ft.
72 09/28/06 1.38 70.55% 63.63% 1987 2005 79,660 Sq. Ft.
73 09/13/06 1.23 72.76% 65.32% 1972 92,815 Sq. Ft.
74 10/10/06 1.33 71.90% 71.90% 1990 192 Units
75 11/10/06 1.41 70.00% 62.74% 2002 69,287 Sq. Ft.
76 09/08/06 1.20 74.47% 68.19% 2002 168 Units
77 09/19/06 1.30 74.47% 61.69% 2005 72 Rooms
78 09/11/06 1.24 78.03% 78.03% 1988 48,455 Sq. Ft.
79 10/10/06 1.90 41.30% 31.68% 1995 236,345 Sq. Ft.
80 10/06/06 1.75 61.07% 61.07% 1998 95,500 Sq. Ft.
81 08/31/06 1.37 80.00% 80.00% 1996 140 Units
82 10/17/06 1.30 79.03% 73.62% 1996 125,290 Sq. Ft.
83 10/05/06 1.70 67.86% 67.86% 1997 130,316 Sq. Ft.
84 09/20/06 1.22 75.68% 67.76% 2005 64,835 Sq. Ft.
85 09/13/06 1.29 79.65% 73.84% 1985 2005 156 Units
86 09/12/06 1.32 75.49% 63.77% 2005 75,000 Sq. Ft.
87 10/13/06 1.32 75.00% 68.49% 1985 208 Units
88 09/15/06 1.29 71.31% 63.06% 1960 1999 41,151 Sq. Ft.
89 09/13/06 1.68 67.74% 54.52% 1999 2006 103 Rooms
90 10/17/06 1.21 77.74% 72.41% 1984 2005 107,782 Sq. Ft.
91 09/05/06 1.31 79.90% 74.45% 1984 2004 106,320 Sq. Ft.
92 09/21/06 1.21 70.18% 63.32% 1988 2001 53,110 Sq. Ft.
93 09/08/06 1.50 80.00% 80.00% 2002 56,004 Sq. Ft.
94 06/20/06 1.15 79.84% 70.96% 2005 30,868 Sq. Ft.
95 09/28/06 1.22 74.08% 69.66% 2006 229,000 Sq. Ft.
96 09/18/06 1.22 79.67% 74.01% 1947 2005 224 Units
97 09/18/06 1.26 78.24% 78.24% 1985 184 Units
98 04/01/07 1.41 66.01% 66.01% 1918 2001 52 Units
99 09/25/06 1.35 80.46% 73.88% 1984 72,112 Sq. Ft.
100 10/13/06 1.17 56.00% 0.00% 2000 134 Units
101 07/01/06 1.76 47.86% 0.33% 1969 1999 207 Rooms
102 09/18/06 1.21 78.82% 71.02% 1979 2003 96,153 Sq. Ft.
103 10/09/06 1.71 72.68% 72.68% 1984 2004 52,328 Sq. Ft.
104 09/18/06 1.59 76.47% 76.47% 2001 114 Units
105 07/11/06 1.21 78.05% 73.21% 1966 1997 35,011 Sq. Ft.
106 10/04/06 1.24 78.13% 68.83% 2003 149 Units
107 07/10/06 1.28 55.80% 36.31% 1956 159,494 Sq. Ft.
108 09/07/06 1.52 56.36% 52.65% 1976 1994 95,739 Sq. Ft.
109 10/02/06 1.30 72.94% 72.94% 2002 99,436 Sq. Ft.
110 02/19/06 1.21 67.51% 63.53% 2001 68,888 Sq. Ft.
111 04/01/07 1.43 69.63% 69.63% 1926 24,650 Sq. Ft.
112 09/05/06 1.29 72.97% 65.57% 1962 144,889 Sq. Ft.
113 10/03/06 1.60 70.42% 70.42% 2001 24,503 Sq. Ft.
114 09/19/06 1.21 70.42% 65.59% 1964 2004 48 Units
115 08/31/06 1.36 80.00% 80.00% 1991 76 Units
116 09/06/06 1.23 77.87% 66.03% 2006 16,206 Sq. Ft.
117 09/28/06 1.20 77.87% 72.61% 2005 18,275 Sq. Ft.
118 10/04/06 1.25 73.02% 68.03% 1953 1998 28 Units
119 08/29/06 1.41 71.54% 63.15% 1989 26,783 Sq. Ft.
120 09/22/06 1.51 63.85% 63.85% 1960 1987 21,578 Sq. Ft.
121 01/01/07 1.64 68.38% 53.20% 1997 100 Rooms
122 03/31/06 1.22 79.08% 66.48% 2006 14,820 Sq. Ft.
123 04/01/07 1.41 68.17% 68.17% 1929 20,700 Sq. Ft.
124 04/01/07 1.37 70.12% 70.12% 1933 20,475 Sq. Ft.
125 09/27/06 1.21 63.11% 53.47% 2006 41 Units
126 08/31/06 1.33 80.00% 80.00% 1985 60 Units
127 09/28/06 1.47 77.03% 65.10% 1994 16,827 Sq. Ft.
128 08/14/06 1.28 76.00% 68.58% 1986 2006 24,000 Sq. Ft.
129 04/01/07 1.40 62.96% 62.96% 1910 2001 19 Units
130 09/29/06 1.29 75.72% 64.16% Various 72,213 Sq. Ft.
130.01 09/29/06 1994 30,713 Sq. Ft.
130.02 09/29/06 1998 41,500 Sq. Ft.
131 08/11/06 1.50 63.64% 53.46% 2006 14,990 Sq. Ft.
132 06/17/06 1.98 64.05% 64.05% 2004 13,813 Sq. Ft.
133 09/17/06 1.43 60.91% 51.71% 1989 24,621 Sq. Ft.
134 08/31/06 1.38 80.00% 80.00% 1987 41 Units
135 10/03/06 1.21 60.53% 54.61% 1982 1999 30,000 Sq. Ft.
136 09/20/06 1.20 79.33% 73.94% 2006 7,200 Sq. Ft.
137 04/01/07 1.26 66.88% 66.88% 1930 12,900 Sq. Ft.
138 04/25/06 1.91 65.58% 65.58% 2006 24,341 Sq. Ft.
139 10/10/06 1.20 74.33% 63.12% 1993 12,915 Sq. Ft.
140 09/29/06 1.34 40.51% 35.88% 1922 1995 10,548 Sq. Ft.
141 Various 1.44 55.56% 47.17% 2005 24,748 Sq. Ft.
141.01 09/27/06 2005 15,568 Sq. Ft.
141.02 10/14/06 2005 9,180 Sq. Ft.
142 06/12/06 2.01 60.00% 60.00% 2005 7,000 Sq. Ft.
CUT-OFF DATE OCCUPANCY MOST MOST
MORTGAGE LOAN LOAN AMOUNT OCCUPANCY "AS OF" MOST RECENT MOST RECENT RECENT RECENT
NUMBER PER (UNIT) ($) RATE(7) DATE MOST RECENT PERIOD REVENUES ($) EXPENSES ($) NOI ($) NCF ($)
- -----------------------------------------------------------------------------------------------------------------------------------
1 38.32 95.53% 11/01/06
1.01 100.00% 11/01/06
1.02 61.50% 11/01/06
1.03 90.04% 11/01/06
1.04 100.00% 11/01/06
1.05 96.37% 11/01/06
1.06 100.00% 11/01/06
1.07 100.00% 11/01/06
1.08 100.00% 11/01/06
1.09 100.00% 11/01/06
1.10 100.00% 11/01/06
1.11 100.00% 11/01/06
1.12 100.00% 11/01/06
1.13 100.00% 11/01/06
1.14 100.00% 11/01/06
1.15 100.00% 11/01/06
1.16 100.00% 11/01/06
1.17 100.00% 11/01/06
1.18 100.00% 11/01/06
1.19 100.00% 11/01/06
1.20 100.00% 11/01/06
1.21 100.00% 11/01/06
1.22 80.63% 11/01/06
1.23 100.00% 11/01/06
1.24 100.00% 11/01/06
1.25 90.77% 11/01/06
1.26 100.00% 11/01/06
1.27 100.00% 11/01/06
2 71.31 97.45% Various TTM June 2006 44,817,910 12,831,740 31,986,170 31,329,965
2.01 97.12% 08/01/06 TTM June 2006 2,290,565 826,671 1,463,894 1,428,877
2.02 97.96% 08/01/06 TTM June 2006 2,956,146 979,838 1,976,308 1,920,705
2.03 93.96% 08/01/06 TTM June 2006 2,954,023 1,134,820 1,819,203 1,801,262
2.04 97.77% 08/01/06 TTM June 2006 2,768,399 820,820 1,947,579 1,902,676
2.05 100.00% 08/01/06 TTM June 2006 2,565,142 295,101 2,270,041 2,233,830
2.06 96.01% 08/01/06 TTM June 2006 1,706,822 376,114 1,330,708 1,305,566
2.07 97.96% 08/01/06 TTM June 2006 1,451,419 337,887 1,113,532 1,084,143
2.08 100.00% 08/01/06 TTM June 2006 2,349,638 480,116 1,869,522 1,816,650
2.09 88.34% 08/01/06 TTM June 2006 1,319,013 396,334 922,679 901,898
2.10 98.43% 10/30/06 TTM June 2006 5,975,921 2,071,864 3,904,057 3,865,840
2.11 97.86% 08/01/06 TTM June 2006 3,294,075 671,556 2,622,519 2,545,064
2.12 95.10% 08/01/06 TTM June 2006 2,644,366 679,280 1,965,086 1,890,637
2.13 100.00% 08/01/06 TTM June 2006 338,323 64,164 274,159 271,759
2.14 97.84% 08/01/06 TTM June 2006 2,499,845 686,350 1,813,495 1,788,508
2.15 94.87% 08/01/06 TTM June 2006 4,588,316 2,152,269 2,436,047 2,396,562
2.16 100.00% 08/01/06 TTM June 2006 5,115,897 858,556 4,257,341 4,175,987
3 363.32 90.71% 08/11/06 TTM 7/06 27,275,603 8,721,829 18,553,774 18,440,925
4 90.58 98.93% 08/01/06 TTM June 2006 29,134,103 6,841,377 22,292,726 21,937,149
4.01 100.00% 08/01/06 TTM June 2006 1,578,604 557,504 1,021,100 1,008,841
4.02 100.00% 08/01/06 TTM June 2006 1,395,754 303,279 1,092,475 1,071,689
4.03 98.61% 08/01/06 TTM June 2006 3,884,789 617,246 3,267,543 3,197,656
4.04 100.00% 08/01/06 TTM June 2006 1,546,894 453,614 1,093,280 1,078,892
4.05 100.00% 08/01/06 TTM June 2006 1,116,434 390,420 726,014 710,396
4.06 93.96% 08/01/06 TTM June 2006 3,167,165 732,625 2,434,540 2,402,649
4.07 100.00% 08/01/06 TTM June 2006 1,914,493 244,928 1,669,565 1,640,812
4.08 100.00% 08/01/06 TTM June 2006 1,243,177 488,151 755,026 746,200
4.09 100.00% 08/01/06 TTM June 2006 1,259,415 433,415 826,000 809,104
4.10 100.00% 08/01/06 TTM June 2006 1,527,292 405,917 1,121,375 1,105,883
4.11 99.28% 08/01/06 TTM June 2006 2,398,175 669,217 1,728,958 1,692,185
4.12 100.00% 08/01/06 TTM June 2006 4,409,800 835,129 3,574,671 3,534,976
4.13 98.52% 08/01/06 TTM June 2006 3,692,111 709,932 2,982,179 2,937,866
5 271.55 86.40% 11/10/06 1/06-9/06 Ann. 28,070,266 10,422,584 17,647,682 17,537,204
6 250,950.57 94.30% 09/25/06 T-12 8/2006 26,640,962 6,829,967 19,810,995 19,573,243
7 74.60 72.44% 10/02/06 2005 31,158,631 16,720,589 14,438,042 14,092,183
8 3,584.23 100.00% 09/01/06
9 162,625.00 99.25% 11/15/06 Trailing 12 (10/05-9/06) 6,423,824 2,582,769 3,841,055 3,841,055
10 176.28 93.83% 08/15/06 Trailing 12 11,727,930 3,542,784 8,185,146 8,151,109
11 97.70 90.01% 09/01/06 T-12 8,373,262 3,520,964 4,852,298 4,739,602
12 161,440.68 98.59% 11/15/06 Trailing 12 (10/05-9/06) 5,751,422 2,515,945 3,235,477 3,235,477
13 52,641.33 92.77% 10/25/06 1/06-7/06 Ann. 6,280,598 2,507,545 3,773,053 3,762,263
14 298.32 95.43% 10/10/06 2005 4,874,420 2,500,861 2,373,559 2,356,128
15 50,200.80 93.27% 09/12/06 T-12 Mos 08/06 7,788,935 3,541,514 4,247,421 4,023,321
16 178,832.12 43.34% 10/31/06
17 78.78 81.23% 10/03/06 T12 Ending 8/06 4,948,580 1,556,017 3,392,563 3,322,113
17.01 95.94% 10/03/06 T12 Ending 8/06 1,355,968 339,287 1,016,681 1,000,205
17.02 53.07% 10/03/06 T12 Ending 8/06 1,242,676 331,286 911,390 895,189
17.03 95.74% 10/03/06 T12 Ending 8/06 630,408 206,990 423,418 413,069
17.04 77.21% 10/03/06 T12 Ending 8/06 644,734 254,191 390,543 377,642
17.05 81.92% 10/03/06 T12 Ending 8/06 519,770 151,652 368,118 359,433
17.06 100.00% 10/03/06 T12 Ending 8/06 555,024 272,611 282,413 276,574
18 108.59 100.00% 09/22/06 2006 (Ann. 9/06) 6,072,558 1,047,650 5,024,908 4,992,676
19 257.51 73.13% 09/28/06
20 115,104.17 99.24% 10/18/06 T-12 Sep 2006 4,954,561 1,844,984 3,109,577 2,994,827
21 235.02 95.81% 11/01/06 09/2006 Ann. 2,835,434 895,282 1,940,153 1,927,069
22 86,122.16 92.05% 11/07/06 T3 Colls/UW Exp. 3,466,416 1,250,969 2,215,447 2,133,431
23 115.13 96.91% 11/01/06 2005 4,088,013 1,197,053 2,890,960 2,866,402
24 132.85 96.18% 10/05/06
25 120.90 100.00% 09/01/06
26 110.29 83.10% 09/15/06 7 Months 2006 Annualized 4,733,904 2,080,678 2,653,226 2,625,997
27 64,070.68 90.84% 08/18/06 T-12 (8/05-7/06) 4,295,235 1,986,097 2,309,138 2,309,138
28 125,000.00 94.02% 10/10/06 T-3 Jul 2006 2,564,268 934,544 1,629,724 1,583,724
29 136,904.76 98.81% 10/23/06 T12 9/06-10/05 2,489,624 1,057,287 1,432,337 1,390,337
30 76.96 74.68% 10/23/06
31 93,333.33 97.50% 10/31/06 T-6 Mos Jul-06 2,448,472 892,508 1,555,964 1,488,284
32 217.95 83.95% 10/25/06
33 89,473.68 91.90% 10/03/06 T-12 (11/05-10/06) 2,064,310 809,409 1,254,901 1,254,901
34 194.98 94.38% 11/01/06 1/06-9/06 Ann. 2,244,151 520,823 1,723,328 1,712,556
35 107.80 85.13% 10/18/06 2005 3,922,289 1,783,058 2,139,231 2,111,398
36 148.11 100.00% 10/25/06 2005 2,428,099 725,549 1,702,550 1,689,857
37 204.15 96.52% 10/01/06 2006 (Ann. 1/06-9/06) 2,419,451 920,495 1,498,956 1,489,772
38 186.80 100.00% 10/25/06 2005 2,469,659 582,224 1,887,435 1,877,585
39 50,786.52 99.72% 10/03/06 1/06-9/06 Ann. 2,082,636 525,751 1,556,885 1,547,885
40 39,387.31 96.50% 10/26/06 T-12 ending 9/06 3,520,126 1,461,398 2,058,728 1,944,478
41 79,279.28 97.75% 08/08/06 T-12 ending July 06 2,123,425 637,790 1,485,635 1,430,135
42 198.10 100.00% 08/01/06 2006 Ann. 8/06 2,229,492 629,007 1,600,485 1,576,634
43 109.92 96.53% 09/15/06 YTD 2006 3,160,802 1,600,270 1,560,531 1,541,426
44 158.83 89.64% 10/05/06
45 125.83 100.00% 10/06/06 Annualized 2006 (1/1-8/31) 2,042,578 619,418 1,423,160 1,423,160
46 202.89 98.31% 09/26/06 2006 Ann. 8/06 2,360,042 731,205 1,628,837 1,620,335
47 178.16 98.53% 09/30/06 1/06-9/06 Ann. 1,659,109 495,406 1,163,703 1,150,344
48 119,718.31 83.10% 10/31/06 T12 Oct-06 5,019,014 3,293,554 1,725,460 1,596,715
49 61,774.81 91.98% 10/03/06 2005 2,554,933 981,765 1,573,168 1,507,930
50 130.85 100.00% 10/19/06
51 88.46 82.93% 11/03/06 Annualized 2006 (1/1-8/31) 1,160,681 301,911 858,770 858,770
52 83,333.33 85.48% 07/25/06 T-6 6/2006 Ann. 1,948,316 841,128 1,107,188 1,060,688
53 175.23 100.00% 09/15/06 1/06-9/06 Ann. 2,127,035 333,820 1,793,215 1,784,370
54 67,256.64 96.02% 08/09/06 T-12 ending July 06 1,990,907 704,403 1,286,504 1,230,004
55 143.88 95.62% 10/26/06 Ann'l (thru 9/06) 1,692,283 568,522 1,123,761 1,047,880
56 107.73 100.00% 11/30/06 07/06 YTD Annualized 2,517,781 1,087,387 1,430,394 1,410,946
57 229.53 95.09% 10/03/06
58 73,500.00 96.50% 10/03/06 T12 Thru Sept 2006 1,920,823 824,677 1,096,146 1,056,146
59 67,123.29 92.69% 11/17/06 T12 2,240,328 1,081,058 1,159,270 1,104,520
60 242.97 100.00% 09/20/06
61 75,537.63 94.09% 08/03/06 Annualized (1/06-7/06) 1,612,992 740,513 872,479 825,979
62 114.97 80.46% 10/01/06 2006 5 Mos. 2,275,480 906,073 1,369,407 1,343,812
63 107,258.06 99.19% 11/13/06 Roll 3 Annlzd 1,757,204 728,288 1,028,916 1,004,116
64 114.66 100.00% 10/01/06
65 24.36 73.31% 09/30/06 01-09 2006 Ann'l 2,139,348 1,232,099 907,249 907,249
65.01 80.87% 09/30/06 01-09 2006 Ann'l 556,806 278,564 278,242 278,242
65.02 79.65% 09/30/06 01-09 2006 Ann'l 456,689 313,244 143,445 143,445
65.03 72.95% 09/30/06 01-09 2006 Ann'l 307,887 169,242 138,645 138,645
65.04 70.60% 09/30/06 01-09 2006 Ann'l 288,331 195,486 92,845 92,845
65.05 55.37% 09/30/06 01-09 2006 Ann'l 284,889 151,812 133,077 133,077
65.06 87.95% 09/30/06 01-09 2006 Ann'l 244,746 123,751 120,995 120,995
66 295.01 100.00% 10/03/06
67 29,904.31 89.71% 10/09/06 T12 8/30/06 2,347,821 1,245,411 1,102,410 997,910
68 124.56 91.84% 11/29/06
69 52,136.75 99.57% 10/27/06
70 49.80 100.00% 10/25/06 2005 1,549,630 405,612 1,144,018 1,124,842
70.01 100.00% 10/25/06
70.02 100.00% 10/25/06
70.03 100.00% 10/25/06
71 96.08 97.25% 09/30/06 Annualized 2006 (1/1-9/30) 723,740 27,861 695,880 695,880
72 144.36 100.00% 08/31/06 06/06 Annualized YTD 1,642,034 735,658 906,376 888,054
73 122.29 96.31% 10/27/06 2005 1,718,203 628,089 1,090,114 1,076,192
74 57,291.67 96.35% 11/14/06 TTM Thru 9/06 1,499,904 788,797 711,107 711,107
75 157.10 100.00% 11/12/06
76 62,500.00 97.02% 09/18/06 T-12 Mos 8/2006 1,618,763 797,986 820,777 787,177
77 145,833.33 83.31% 07/31/06 Ann'l T-9 (ending 9/06) 3,433,596 1,903,242 1,530,354 1,394,111
78 212.57 100.00% 10/03/06
79 43.16 96.38% 09/22/06 2005 2,250,976 559,637 1,691,339 1,608,618
80 106.15 100.00% 10/20/06 2005 1,718,055 529,827 1,188,228 1,178,678
81 70,000.00 95.00% 08/09/06 T-12 ending July 2006 1,238,764 417,903 820,861 785,861
82 78.22 95.31% 11/28/06
83 72.90 100.00% 09/26/06 Annualized 2006 (1/1-9/20) 1,177,966 204,063 973,904 973,904
84 144.98 100.00% 07/13/06
85 57,692.31 95.51% 09/02/06
86 119.77 100.00% 09/22/06
87 41,466.35 92.79% 11/14/06 T-12 Jul-06 1,406,155 614,330 791,825 739,825
88 205.34 100.00% 10/01/06 1/06-9/06 Ann. 1,239,514 342,493 897,021 890,025
89 81,553.40 94.56% 08/31/06 Statement 2006 1,494,337 806,906 687,431 687,431
90 76.45 99.69% 11/28/06
91 76.66 96.73% 09/01/06 5 Mos 2006 Annualized 1,502,554 739,174 763,380 747,432
92 150.63 100.00% 10/23/06 1/06-8/06 Ann. 1,230,292 373,510 856,782 850,940
93 139.28 92.19% 11/19/06
94 248.82 92.80% 06/16/06
95 33.32 100.00% 11/21/06
96 32,366.07 98.21% 11/22/06 T-12 ending 10/06 1,428,634 844,718 583,916 527,916
97 38,586.96 95.65% 09/12/06 T6 1,304,418 814,876 489,542 443,542
98 135,192.31 100.00% 10/23/06 2006 Annualized 755,400 195,285 560,115 544,865
99 97.07 93.09% 10/01/06 Trailing 12 (08/05-07/06) 1,011,022 204,161 806,861 782,673
100 52,238.81 94.03% 11/20/06 Trailing 12 (09/05-08/06) 1,245,189 380,859 864,330 864,330
101 32,367.15 78.85% 08/31/06 T12 Ending 8/06 5,557,186 3,837,517 1,719,669 1,719,669
102 69.68 98.73% 08/11/06 Aug 2006 Ann 968,743 344,031 624,712 585,375
103 127.08 100.00% 11/01/06 1/06-8/06 Ann. 869,921 317,455 552,466 544,617
104 57,017.54 97.37% 09/19/06 2006 8 Mos. Annualized 892,973 424,995 467,978 439,478
105 182.80 100.00% 10/10/06 Trailing 12 (06/05-05/06) 1,004,155 335,206 668,949 668,949
106 41,946.31 93.96% 09/28/06
107 39.19 100.00% 11/08/06
108 64.76 95.16% 10/31/06 09/06 YTD Annualized 1,447,144 743,334 703,810 669,344
109 62.35 93.57% 08/31/06 TTM Thru 8/06 819,907 252,315 567,592 557,648
110 82.32 82.09% 07/31/06 Annualized 2006 (1/1-7/31) 787,318 174,056 613,262 613,262
111 228.80 93.91% 10/25/06
112 37.27 100.00% 08/23/06
113 204.06 100.00% 11/01/06 Annualized 2006 (1/1-8/31) 580,711 138,458 442,253 442,253
114 104,166.67 95.83% 10/01/06
115 63,684.21 98.68% 08/09/06 T-12 ending July 06 645,793 228,687 417,106 398,106
116 293.10 100.00% 11/06/06
117 259.92 85.78% 10/17/06 WB As Is (Nov) 562,760 153,408 409,352 398,387
118 164,285.71 96.43% 10/04/06 T6 09.31.06 502,900 123,064 379,836 374,236
119 164.28 83.20% 11/01/06 As-Is-10/06 554,662 158,256 396,406 357,263
120 192.33 100.00% 11/01/06 1/06-8/06 Ann. 451,908 64,038 387,870 383,986
121 40,000.00 62.39% 08/31/06 Trailing 12 (9/05-8/06) 1,760,178 1,295,549 464,629 464,629
122 256.14 100.00% 07/25/05
123 174.88 87.92% 10/25/06
124 175.34 98.29% 10/25/06
125 85,279.73 100.00% 10/17/06
126 53,666.67 95.00% 08/08/06 T-12 ending Jul 06 438,779 151,628 287,151 272,151
127 189.98 100.00% 10/31/06
128 126.67 100.00% 08/22/06
129 153,421.05 100.00% 10/23/06 2006 Annualized 321,552 90,789 230,763 226,963
130 40.16 89.44% Various 2005 365,903 67,037 298,866 298,866
130.01 95.85% 08/31/06 2005 202,077 30,553 171,524 171,524
130.02 84.70% 08/23/06 2005 163,826 36,484 127,342 127,342
131 186.79 100.00% 11/13/06
132 194.74 100.00% 07/31/06
133 101.44 96.75% 10/24/06 Annualized 2006 (1/1-8/21) 406,234 109,722 296,512 296,512
134 60,000.00 97.56% 08/09/06 T-12 ending July 06 342,744 125,587 217,157 206,907
135 76.67 90.00% 10/18/06 Trailing 12 (07/05-06/06) 385,955 124,774 261,181 261,181
136 297.50 100.00% 11/03/06
137 162.79 73.45% 10/25/06 2006 Annualized 249,418 69,104 180,314 178,250
138 76.25 100.00% 05/31/06
139 134.11 100.00% 10/19/06 Annualized 2006 (1/1-9/30) 172,491 7,118 165,373 165,373
140 151.69 100.00% 11/03/06 Annualized 2006 (1/1-3/31) 208,068 33,268 174,800 174,800
141 60.61 84.95% 10/01/06
141.01 76.07% 10/01/06
141.02 100.00% 10/01/06
142 120.00 100.00% 01/17/06
UW NET
MORTGAGE LOAN MOST RECENT MOST RECENT OPERATING UW NET
NUMBER NOI ($) NCF ($) UW REVENUES ($) UW EXPENSES ($) INCOME ($) CASH FLOW ($)
- ----------------------------------------------------------------------------------------------------
1 33,284,537 5,302,909 27,981,628 26,216,318
1.01 2,474,031 254,520 2,219,511 2,051,441
1.02 1,998,894 152,467 1,846,427 1,656,177
1.03 2,458,031 584,413 1,873,618 1,723,442
1.04 1,959,357 301,661 1,657,696 1,538,416
1.05 2,001,351 252,413 1,748,938 1,612,340
1.06 1,557,253 46,718 1,510,536 1,467,659
1.07 1,831,050 414,306 1,416,745 1,291,432
1.08 2,328,721 330,005 1,998,717 1,903,020
1.09 1,783,421 329,286 1,454,135 1,362,884
1.10 1,423,288 70,059 1,353,229 1,269,124
1.11 1,145,799 182,922 962,877 878,269
1.12 1,256,006 88,985 1,167,021 1,087,882
1.13 1,016,320 244,827 771,493 709,166
1.14 1,131,600 221,422 910,178 834,616
1.15 1,011,041 104,354 906,687 856,023
1.16 1,111,047 277,932 833,115 812,293
1.17 844,562 141,458 703,104 675,063
1.18 922,189 158,171 764,018 746,549
1.19 776,016 190,710 585,306 573,123
1.20 755,599 134,341 621,258 603,496
1.21 575,951 138,833 437,118 410,910
1.22 653,974 131,696 522,278 505,405
1.23 403,371 12,101 391,270 361,359
1.24 518,362 103,199 415,163 406,216
1.25 433,491 121,475 312,016 299,182
1.26 447,661 104,866 342,795 331,368
1.27 466,148 209,772 256,376 249,463
2 31,986,170 31,329,965 48,361,352 15,130,445 33,230,907 30,439,034
2.01 1,463,894 1,428,877 2,404,437 937,149 1,467,288 1,291,918
2.02 1,976,308 1,920,705 3,115,084 949,069 2,166,015 1,880,893
2.03 1,819,203 1,801,262 3,132,351 1,277,236 1,855,116 1,737,500
2.04 1,947,579 1,902,676 2,903,523 911,363 1,992,161 1,817,242
2.05 2,270,041 2,233,830 2,750,657 429,276 2,321,381 2,145,996
2.06 1,330,708 1,305,566 1,957,704 475,625 1,482,079 1,357,556
2.07 1,113,532 1,084,143 1,518,032 362,968 1,155,063 982,349
2.08 1,869,522 1,816,650 2,442,678 537,243 1,905,434 1,679,661
2.09 922,679 901,898 1,356,007 445,081 910,926 826,534
2.10 3,904,057 3,865,840 6,812,345 2,726,551 4,085,794 3,897,460
2.11 2,622,519 2,545,064 3,425,207 882,689 2,542,517 2,389,239
2.12 1,965,086 1,890,637 3,293,073 810,633 2,482,440 2,185,356
2.13 274,159 271,759 463,337 72,981 390,356 377,177
2.14 1,813,495 1,788,508 2,641,581 777,123 1,864,458 1,734,766
2.15 2,436,047 2,396,562 4,850,059 2,470,029 2,380,031 2,175,689
2.16 4,257,341 4,175,987 5,295,276 1,065,429 4,229,846 3,959,697
3 18,553,774 18,440,925 33,390,777 11,199,266 22,191,512 21,465,294
4 22,292,726 21,937,149 30,365,113 8,634,383 21,730,730 20,202,659
4.01 1,021,100 1,008,841 1,627,552 656,708 970,844 887,978
4.02 1,092,475 1,071,689 1,851,948 483,172 1,368,776 1,322,129
4.03 3,267,543 3,197,656 4,060,455 785,133 3,275,321 3,090,190
4.04 1,093,280 1,078,892 1,510,953 487,502 1,023,451 933,894
4.05 726,014 710,396 1,132,743 430,371 702,371 612,429
4.06 2,434,540 2,402,649 3,390,686 842,004 2,548,682 2,374,402
4.07 1,669,565 1,640,812 1,988,588 342,045 1,646,542 1,472,830
4.08 755,026 746,200 1,207,901 554,975 652,927 615,662
4.09 826,000 809,104 1,303,248 478,175 825,073 731,608
4.10 1,121,375 1,105,883 1,801,428 516,857 1,284,570 1,220,395
4.11 1,728,958 1,692,185 3,049,918 1,162,301 1,887,617 1,733,985
4.12 3,574,671 3,534,976 3,611,910 961,272 2,650,638 2,536,213
4.13 2,982,179 2,937,866 3,827,786 933,867 2,893,919 2,670,945
5 17,647,682 17,537,204 28,306,064 10,309,406 17,996,658 17,316,719
6 19,810,995 19,573,243 28,343,179 6,324,731 22,018,448 21,780,696
7 14,438,042 14,092,183 28,717,301 15,335,906 13,381,395 12,282,034
8 6,071,126 60,711 6,010,414 6,006,229
9 3,841,055 3,841,055 6,719,925 2,198,258 4,521,667 4,432,467
10 8,185,146 8,151,109 12,056,964 3,538,030 8,518,934 8,171,330
11 4,852,298 4,739,602 9,219,291 3,421,560 5,797,731 5,348,106
12 3,235,477 3,235,477 6,044,341 2,069,218 3,975,123 3,901,491
13 3,773,053 3,762,263 6,498,856 2,130,243 4,368,613 4,357,823
14 2,373,559 2,356,128 6,613,781 2,660,350 3,953,431 3,688,758
15 4,247,421 4,023,321 7,835,004 3,432,788 4,402,216 4,178,116
16 15,576,032 10,157,448 5,418,584 4,795,543
17 3,392,563 3,322,113 5,315,896 1,502,862 3,813,035 3,372,449
17.01 1,016,681 1,000,205 1,419,291 324,753 1,094,538 977,337
17.02 911,390 895,189 1,189,494 321,082 868,413 785,337
17.03 423,418 413,069 779,003 206,351 572,652 516,117
17.04 390,543 377,642 742,257 249,170 493,087 414,702
17.05 368,118 359,433 572,457 155,059 417,397 355,382
17.06 282,413 276,574 613,395 246,447 366,948 323,573
18 5,024,908 4,992,676 5,590,803 1,009,942 4,580,861 4,292,653
19 3,914,856 1,125,322 2,789,534 2,629,688
20 3,109,577 2,994,827 5,063,623 1,861,631 3,201,992 3,087,242
21 1,940,153 1,927,069 3,581,193 1,136,706 2,444,487 2,411,245
22 2,215,447 2,133,431 3,921,988 1,264,637 2,657,351 2,575,335
23 2,890,960 2,866,402 4,099,043 1,323,337 2,775,706 2,646,731
24 4,315,183 1,532,019 2,783,163 2,446,089
25 3,155,741 734,735 2,421,006 2,339,139
26 2,653,226 2,625,997 4,530,388 1,923,448 2,606,941 2,394,499
27 2,309,138 2,309,138 4,416,110 2,151,997 2,264,113 2,264,113
28 1,629,724 1,583,724 2,730,702 906,362 1,824,340 1,778,340
29 1,432,337 1,390,337 2,626,038 954,311 1,671,727 1,629,727
30 5,482,531 3,427,831 2,054,700 1,700,334
31 1,555,964 1,488,284 2,569,936 883,869 1,686,067 1,618,387
32 2,489,790 673,575 1,816,216 1,766,723
33 1,254,901 1,254,901 2,580,066 709,459 1,870,607 1,870,607
34 1,723,328 1,712,556 2,308,847 513,766 1,795,081 1,735,392
35 2,139,231 2,111,398 4,149,834 1,797,041 2,352,793 2,055,391
36 1,702,550 1,689,857 2,442,005 738,959 1,703,046 1,591,456
37 1,498,956 1,489,772 2,650,494 916,211 1,734,283 1,607,972
38 1,887,435 1,877,585 2,425,218 625,237 1,799,981 1,667,440
39 1,556,885 1,547,885 2,069,002 631,191 1,437,811 1,428,811
40 2,058,728 1,944,478 3,390,514 1,627,101 1,763,413 1,649,163
41 1,485,635 1,430,135 2,078,563 620,039 1,458,524 1,403,024
42 1,600,485 1,576,634 2,333,507 844,326 1,489,181 1,367,277
43 1,560,531 1,541,426 3,195,770 1,541,741 1,654,029 1,524,133
44 1,990,844 404,993 1,585,851 1,525,340
45 1,423,160 1,423,160 2,109,377 640,440 1,468,937 1,309,007
46 1,628,837 1,620,335 2,399,027 789,726 1,609,301 1,489,133
47 1,163,703 1,150,344 1,894,857 614,040 1,280,817 1,204,003
48 1,725,460 1,596,715 5,033,568 3,294,110 1,739,459 1,588,452
49 1,573,168 1,507,930 2,751,166 1,031,971 1,719,195 1,653,957
50 2,891,482 1,286,565 1,604,918 1,464,887
51 858,770 858,770 2,046,306 564,908 1,481,398 1,316,499
52 1,107,188 1,060,688 2,115,050 810,746 1,304,305 1,257,805
53 1,793,215 1,784,370 1,751,544 347,828 1,403,716 1,317,060
54 1,286,504 1,230,004 1,979,484 697,745 1,281,739 1,225,239
55 1,123,761 1,047,880 1,692,698 555,447 1,137,251 1,062,043
56 1,430,394 1,410,946 2,573,575 1,178,527 1,395,047 1,221,805
57 1,948,222 823,423 1,124,800 1,080,208
58 1,096,146 1,056,146 1,986,837 796,837 1,189,999 1,149,999
59 1,159,270 1,104,520 2,309,623 1,048,817 1,260,806 1,206,056
60 1,313,588 13,136 1,300,452 1,294,505
61 872,479 825,979 1,821,974 614,306 1,207,668 1,161,168
62 1,369,407 1,343,812 2,243,484 902,558 1,340,925 1,262,377
63 1,028,916 1,004,116 1,877,862 720,854 1,157,008 1,132,208
64 1,319,102 13,191 1,305,911 1,214,576
65 907,249 907,249 2,198,904 1,110,481 1,088,423 1,035,059
65.01 278,242 278,242 571,638 273,595 298,043 286,275
65.02 143,445 143,445 476,430 219,664 256,765 244,390
65.03 138,645 138,645 318,021 158,753 159,268 151,908
65.04 92,845 92,845 338,114 203,559 134,556 127,447
65.05 133,077 133,077 249,855 136,156 113,699 102,599
65.06 120,995 120,995 244,846 118,754 126,091 122,441
66 1,318,243 376,773 941,470 930,021
67 1,102,410 997,910 2,423,317 1,226,636 1,196,681 1,092,181
68 1,774,784 450,123 1,324,661 1,257,585
69 1,776,895 655,845 1,121,050 1,074,250
70 1,144,018 1,124,842 1,590,751 369,037 1,221,715 1,152,253
70.01
70.02
70.03
71 695,880 695,880 1,556,948 288,770 1,268,178 1,224,359
72 906,376 888,054 1,966,864 815,392 1,151,472 1,127,153
73 1,090,114 1,076,192 1,695,969 619,300 1,076,670 972,121
74 711,107 711,107 1,615,949 756,830 859,119 859,119
75 1,427,782 286,860 1,140,921 1,054,529
76 820,777 787,177 1,675,718 761,230 914,488 880,888
77 1,530,354 1,394,111 2,990,138 1,831,330 1,158,808 1,040,099
78 1,314,859 529,130 785,730 777,492
79 1,691,339 1,608,618 2,198,552 530,010 1,668,542 1,457,408
80 1,188,228 1,178,678 1,638,612 566,511 1,072,101 978,145
81 820,861 785,861 1,267,960 423,088 844,872 809,872
82 1,845,853 902,381 943,472 888,103
83 973,904 973,904 1,178,205 239,814 938,391 918,843
84 1,404,521 570,829 833,692 779,915
85 1,524,101 705,007 819,094 780,094
86 849,998 8,500 841,498 833,998
87 791,825 739,825 1,446,711 616,445 830,266 778,266
88 897,021 890,025 1,158,595 341,078 817,517 775,118
89 687,431 687,431 2,444,267 1,421,153 1,023,114 925,344
90 1,620,774 858,603 762,171 692,317
91 763,380 747,432 1,542,676 678,209 864,467 742,292
92 856,782 850,940 1,054,322 309,323 744,999 691,174
93 940,215 233,380 706,835 672,621
94 987,296 328,904 658,392 643,696
95 728,955 7,290 721,665 698,765
96 583,916 527,916 1,450,231 790,678 659,553 603,553
97 489,542 443,542 1,366,344 797,822 568,522 522,522
98 560,115 544,865 774,513 175,885 598,627 583,377
99 806,861 782,673 1,128,823 411,218 717,605 670,982
100 864,330 864,330 1,042,377 356,513 685,863 659,063
101 1,719,669 1,719,669 5,557,075 3,776,553 1,780,522 1,558,239
102 624,712 585,375 913,285 282,089 631,195 576,139
103 552,466 544,617 1,009,461 328,873 680,588 637,418
104 467,978 439,478 1,029,587 405,031 624,556 596,056
105 668,949 668,949 977,647 361,484 616,162 566,576
106 874,386 292,982 581,404 544,154
107 1,005,112 312,427 692,685 676,735
108 703,810 669,344 1,511,996 744,803 767,193 669,302
109 567,592 557,648 760,031 229,053 530,979 469,150
110 613,262 613,262 901,890 317,191 584,699 516,883
111 635,785 154,125 481,660 475,497
112 769,785 206,694 563,091 484,284
113 442,253 442,253 652,293 165,473 486,821 462,636
114 752,601 321,524 431,077 419,077
115 417,106 398,106 646,899 230,780 416,119 397,119
116 531,514 80,334 451,180 420,076
117 409,352 398,387 558,355 149,112 409,244 398,677
118 379,836 374,236 529,000 122,809 406,191 400,591
119 396,406 357,263 637,064 158,623 478,441 439,299
120 387,870 383,986 503,990 116,205 387,786 365,072
121 464,629 464,629 1,769,015 1,249,854 519,161 448,393
122 512,000 189,120 322,880 321,398
123 409,171 101,329 307,842 299,355
124 412,229 108,095 304,170 288,719
125 438,041 144,379 293,663 285,463
126 287,151 272,151 431,185 159,121 272,064 257,064
127 580,393 238,250 342,143 332,215
128 453,133 155,148 297,985 278,241
129 230,763 226,963 316,949 72,471 244,478 240,678
130 298,866 298,866 397,538 120,701 276,837 267,677
130.01 171,524 171,524 204,912 57,983 146,929 142,909
130.02 127,342 127,342 192,626 62,717 129,908 124,768
131 368,496 57,042 311,454 291,407
132 285,344 2,853 282,491 281,109
133 296,512 296,512 427,165 137,231 289,933 257,720
134 217,157 206,907 342,295 127,798 214,497 204,247
135 261,181 261,181 372,600 129,218 243,382 198,870
136 293,902 111,477 182,424 178,973
137 180,314 178,250 238,974 74,333 164,640 156,199
138 214,200 4,284 209,916 205,048
139 165,373 165,373 169,383 9,828 159,555 150,403
140 174,800 174,800 250,812 85,069 165,744 153,404
141 275,745 108,618 167,127 156,313
141.01 177,237 74,997 102,240 94,994
141.02 98,508 33,621 64,887 61,319
142 101,056 1,011 100,046 99,346
MORTGAGE LOAN LARGEST TENANT LARGEST TENANT LARGEST TENANT
NUMBER LARGEST TENANT NAME SQ. FT. % OF NRA EXP. DATE
- ------------------------------------------------------------------------------------------------------------
1 Various Various Various Various
1.01 Case LLC 842,000 100.00% 05/31/15
1.02 Ozburn-Hessey Logistics, LLC 400,225 61.50% 07/31/11
1.03 Rheem Sales Company, Inc. 354,000 46.62% 05/14/11
1.04 Quaker Sales & Distribution 300,529 50.04% 11/30/07
1.05 Aurora Parts & Accessories LLC 306,397 44.47% 02/29/12
1.06 Wal-mart Stores East, LP 200,000 100.00% 06/30/14
1.07 The Clorox Sales Company 607,650 100.00% 07/07/14
1.08 Q-Edge 259,260 53.80% 04/11/11
1.09 NAL Worldwide LLC 450,000 100.00% 03/31/10
1.10 Pamida, Inc 418,400 100.00% 06/30/15
1.11 Nice-Pak Products, Inc. 426,326 100.00% 08/31/12
1.12 Hachete Book Group, USA, Inc 395,679 100.00% 04/30/12
1.13 Hartsfield Warehouse Co. , Inc. 301,200 100.00% 03/21/13
1.14 Innotrac Corporation 250,000 100.00% 10/31/08
1.15 Case LLC 250,000 100.00% 10/31/14
1.16 Honeywell, Inc. 41,229 40.58% 01/31/09
1.17 Weyerhaeuser Company 108,400 100.00% 01/09/15
1.18 Data General 86,000 100.00% 11/30/07
1.19 Sto Corporation 18,902 31.41% 03/31/09
1.20 TransDyn Controls, Inc. 29,731 33.17% 11/30/07
1.21 Moore Wallace North AM, Inc. 129,842 100.00% 06/14/15
1.22 Innovative Product Achievement 26,752 33.82% 11/14/09
1.23 American Port Services, Inc. 150,000 100.00% 11/30/12
1.24 Atlanta Classic Realty Assoc. 15,125 34.14% 08/31/10
1.25 Senior Care Pharmacy of GA LLC 9,771 15.93% 02/09/10
1.26 Gemu Valves, Inc. 46,700 81.69% 06/30/12
1.27 General Services Admin 34,146 100.00% 05/19/08
2 Various Various Various Various
2.01 Bob's Stores 60,873 34.77% 03/31/10
2.02 Publix Supermarkets 61,000 21.94% 01/31/09
2.03 T.J. Maxx 31,600 35.23% 11/30/07
2.04 Wal-Mart 76,135 33.91% 01/28/12
2.05 Goody's Family Clothing 35,000 19.33% 01/31/11
2.06 T.J. Maxx 25,092 19.96% 01/31/10
2.07 Demoulas Supermarkets 58,920 40.10% 11/30/09
2.08 K-Mart 86,479 32.71% 10/30/13
2.09 Stop & Shop/Staples/OSJ 50,268 48.38% 11/30/15
2.10 Bed Bath & Beyond 38,233 20.01% 01/31/27
2.11 Wal-Mart 125,137 32.31% 10/18/26
2.12 Wells Fargo 78,783 21.16% 12/31/10
2.13 The Men's Wearhouse 6,000 50.00% 02/28/13
2.14 Best Buy 36,714 29.39% 01/31/09
2.15 Tom Thumb 63,828 32.33% 08/15/18
2.16 Kohl's 86,584 21.29% 01/31/19
3 AMC Theatres 70,000 12.41% 02/28/23
4 Various Various Various Various
4.01 Office Max 29,887 48.76% 01/29/08
4.02 Babies "R" Us 30,681 29.52% 01/31/17
4.03 Lowe's Home Centers 114,734 32.83% 05/31/17
4.04 T.J. Maxx 25,608 35.60% 11/30/08
4.05 Shaw's Supermarket 52,620 67.38% 05/23/08
4.06 Marshalls Mega 52,432 32.88% 08/31/09
4.07 Marshalls 30,000 20.87% 05/31/08
4.08 Homegoods 27,781 62.95% 11/30/09
4.09 Waldbaum's 56,759 67.19% 12/31/08
4.10 King Kullen Grocery 38,955 50.29% 02/28/25
4.11 Publix Supermarkets 42,112 22.90% 01/31/12
4.12 Price Chopper 82,172 41.40% 06/30/20
4.13 Haverty's Furniture 43,012 19.41% 04/30/13
5 Steve & Barry's 24,914 4.51% 01/31/13
6
7 Blockbuster Inc. 247,862 14.33% 06/30/17
8 Apple Computer, Inc. 27,900 100.00% 01/31/22
9
10 Century Theatre 48,280 14.18% 06/30/19
11 J.C. Penney 105,870 17.83% 03/31/10
12
13
14 INBM 59,041 33.87% 06/30/12
15
16
17 Various Various Various Various
17.01 Matria Healthcare, Inc. 71,863 65.43% 04/30/11
17.02 Aderans Research Institute 21,069 19.51% 06/30/10
17.03 West Assest MGMT, LLC 54,388 78.83% 05/31/10
17.04 Cork-Howard Construction 12,979 15.09% 08/31/10
17.05 Primedia Special Interest 23,702 40.93% 12/31/07
17.06 H&R Block Mortgage Corporation 15,863 40.75% 03/31/08
18 Molecular Devices 96,489 29.94% 02/16/11
19 PSM, LLC 19,580 15.14% 03/31/16
20
21 Linens 'n Things 35,522 27.15% 01/31/18
22
23 AMC Theatres 89,290 36.36% 12/31/17
24 R.H. Donnelley Inc. 89,128 41.99% 06/30/15
25 Hobby Lobby 55,004 25.98% 08/01/20
26 Deloitte & Touche USA LLP 55,480 24.45% 02/28/11
27
28
29
30 Reznick Group, P.C. 33,157 11.29% 10/31/16
31
32 CL Home Furnishings 19,290 18.77% 10/31/18
33
34 Albertson's Store 59,158 54.93% 08/16/24
35 Equilease Financial Services, Inc. 14,454 7.79% 05/31/13
36 Applied Extrusion Technologies 50,304 39.63% 04/30/11
37 GSA US Government 15,090 16.43% 09/06/11
38 E.I. Du Pont De Nemours & Co. 98,500 100.00% 10/14/08
39
40
41
42 Barnes & Noble Superstore 28,822 32.63% 01/31/11
43 H.D. Vest, Inc. 81,069 50.92% 12/31/12
44 Newnan Cinema Consolidated Theatre 50,580 45.91% 11/30/24
45 Honeywell International 62,234 45.27% 06/30/10
46 WCI Communities 37,248 43.81% Multiple Spaces
47 Food 4 Less of Calif., Inc. 46,564 48.80% 11/30/11
48
49
50 Aetna Life Insurance Company 122,605 100.00% 11/30/16
51 Nestle 46,054 26.28% 05/31/12
52
53 Stein Mart 34,000 38.44% 05/07/09
54
55 Publix Supermarket 47,955 45.63% 04/30/15
56 Pulte Home Corp. 27,568 19.87% 12/31/12
57 National Childhood Cancer 41,274 63.67% 11/30/07
58
59
60 The Charlotte-Mecklenburg Hospital Authority 59,472 100.00% 05/03/26
61
62 Eastern Michigan University 22,453 19.30% 06/30/09
63
64 Time Warner Entertainment 13,600 11.97% 05/31/16
65
65.01
65.02
65.03
65.04
65.05
65.06
66 Olive Garden 9,250 21.29% 09/30/10
67
68 Bassett 26,186 26.52% 02/28/14
69
70 Various Various Various Various
70.01 Avalon 98,018 81.48% 10/31/07
70.02 J&L Building Materials, Inc. 38,400 61.94% 02/29/12
70.03 Intelco of Delaware Valley, Inc. 16,896 27.31% 01/31/07
71 Kohl's Department Stores, Inc. 88,800 71.10% 10/31/25
72 First Advantage 74,065 92.98% 03/31/18
73 PNC Bank 36,218 39.02% 09/30/15
74
75 T-Mobile 69,287 100.00% 01/24/17
76
77
78 Healthcare Partners, LLC 48,455 100.00% 12/31/15
79 Wal-Mart Supercenter 199,026 84.21% 06/20/15
80 FBI 95,500 100.00% 09/27/26
81
82 ACS Commercial Solutions, Inc. 51,535 41.13% 09/15/11
83 Lowe's 130,316 100.00% 10/27/18
84 SHPS, Inc. 64,835 100.00% 07/31/16
85
86 Dick's Sporting Goods 75,000 100.00% 03/31/21
87
88 LA Fitness 26,662 64.79% 02/28/15
89
90 State of Tennessee Department of Health 45,734 42.43% 05/31/16
91 Atrium Crest Executive Suites 9,499 8.93% 12/31/10
92 AutoZone 8,700 16.38% 09/30/07
93 Dollar Tree 6,000 10.71% 09/30/07
94 Shooters Billiards and Sports Bar 7,287 23.61% 12/31/10
95 Big Dog Holdings 229,000 100.00% 11/15/16
96
97
98
99 Aspen Fitness 15,036 20.85% 09/30/20
100
101
102 Safeway 53,986 56.15% 03/12/15
103 Anytime Fitness 6,331 12.10% 12/31/11
104
105 Nationwide Mutual Life Insurance 25,365 72.45% 02/29/12
106
107 USPS 159,494 100.00% 12/31/17
108 Fla Department of Environmental Protection 37,139 38.79% 08/31/09
109 Custom Bilt Materials 19,873 19.99% 08/31/08
110 ITT Educational Services, Inc. 31,568 45.83% 01/22/13
111 Steven Poulos 2,250 9.13% MTM
112 Precise Transportation 70,889 48.93% 12/31/11
113 Tulies Family Restaurant & Sports Lounge 5,184 21.16% 09/30/11
114
115
116 Guardian 8,432 52.03% 09/30/11
117 Accelerated Rehab 3,186 17.43% 03/31/12
118
119 Stafford County 11,374 42.47% Multiple Spaces
120 Pier 1 Imports 8,998 41.70% 03/31/12
121
122 Walgreens 14,820 100.00% 01/30/31
123 La Bella Winnetka 3,900 18.84% MTM
124 Neapolitan, LLC 6,000 29.30% 08/31/16
125
126
127 Staples 16,827 100.00% 11/27/18
128 Liberty Mutual 24,000 100.00% 09/30/12
129
130
130.01
130.02
131 Blockbuster 5,000 33.36% 04/30/16
132 CVS 13,813 100.00% 10/01/23
133 Ramona Adult Daycare 5,355 21.75% 07/31/08
134
135 State of Nevada 27,000 90.00% Multiple Spaces
136 Cingular 2,000 27.78% 10/11/11
137 Quizno 2,500 19.38% 05/31/07
138 Dollar General 24,341 100.00% 05/31/20
139 Walgreens 12,915 100.00% 02/28/54
140 Counsel on Alcoholism & Drug Abuse 10,548 100.00% Multiple Spaces
141 Family Dollar Various Various Various
141.01 Family Dollar 8,000 51.39% 12/31/14
141.02 Family Dollar 9,180 100.00% 06/30/15
142 Advance Auto 7,000 100.00% 12/31/20
2ND
2ND LARGEST LARGEST
MORTGAGE LOAN 2ND LARGEST TENANT TENANT
NUMBER 2ND LARGEST TENANT NAME TENANT SQ. FT. % OF NRA EXP. DATE
- ------------------------------------------------------------------------------------------------------------------------------------
1 Various Various Various Various
1.01
1.02
1.03 Genco I, Inc. 329,700 43.42% 07/31/11
1.04 The Bombay Company, Inc. 300,047 49.96% 12/13/13
1.05 National Distribution Centers 153,111 22.22% 12/31/10
1.06
1.07
1.08 NSK Corporation 136,240 28.27% 11/30/10
1.09
1.10
1.11
1.12
1.13
1.14
1.15
1.16 Konica Minolta Bus. Solutions 22,390 22.04% 01/31/10
1.17
1.18
1.19 Fleet Services Corporation 12,853 21.36% 01/31/08
1.20 GE Supply Logistics, LLC 24,000 26.77% 08/31/09
1.21
1.22 Walman Optical Co. 20,358 25.73% 01/31/08
1.23
1.24 ADT Security Services, Inc. 14,628 33.02% 12/31/08
1.25 Southern Automatic Machinery 9,770 15.93% 08/31/11
1.26 Triad Construction Co., Inc. 5,234 9.16% 06/30/08
1.27
2 Various Various Various Various
2.01 Marshalls 30,895 17.65% 01/31/09
2.02 Peebles 44,800 16.11% 01/31/09
2.03 Minado 12,000 13.38% 05/31/12
2.04 Price Chopper 58,000 25.83% 05/31/14
2.05 T.J. Maxx 30,000 16.57% 10/31/10
2.06 Staples 16,945 13.48% 07/31/09
2.07 T.J. Maxx 26,000 17.69% 01/31/08
2.08 Bi-Lo 51,600 19.52% 11/08/08
2.09 T.J. Maxx 27,500 26.47% 10/31/08
2.10 Pathmark Stores 36,989 19.36% 02/28/11
2.11 Home Depot 111,847 28.88% 01/31/27
2.12 Giant Food 57,695 15.50% 10/31/23
2.13 The Vitamin Shoppe 4,000 33.33% 02/29/12
2.14 Dollar Tree 18,804 15.05% 11/10/12
2.15 DSW Designer Shoe Warehouse 20,400 10.33% 02/28/09
2.16 Harris-Teeter/Michaels/Ross 58,876 14.47% 10/31/17
3 Barnes & Noble 25,000 4.43% 01/31/12
4 Various Various Various Various
4.01 Hollywood Video 7,500 12.24% 12/15/07
4.02 Bed Bath & Beyond 30,000 28.87% 01/31/18
4.03 Tinsletown 44,225 12.66% 06/30/18
4.04 Key Foods 23,262 32.34% 04/30/09
4.05 Fashion Bug 8,000 10.24% 01/31/07
4.06 Clearview Cinema Group 34,329 21.53% 11/17/15
4.07 Petsmart 26,040 18.11% 01/31/14
4.08 Eckerd Drugs 6,600 14.96% 01/31/16
4.09 Washington Mutual Bank 3,760 4.45% 12/12/14
4.10 Ace Hardware & Variety 7,800 10.07% 12/31/06
4.11 T.J. Maxx 28,000 15.23% 01/31/12
4.12 Staples 24,611 12.40% 05/31/10
4.13 Office Depot 36,000 16.25% 04/30/12
5 H&M 20,000 3.62% 01/31/15
6
7 Winstead Sechrest 200,348 11.59% 12/31/12
8
9
10 Prudential Master Lease 23,871 7.01% 10/31/11
11 Sears 81,296 13.69% 10/31/08
12
13
14 Cisneros Group 25,553 14.66% 12/31/16
15
16
17 Various Various Various Various
17.01 Travelers Bank & Trust 18,157 16.53% 07/31/07
17.02 Greenhorn & O'Mara, Inc. 13,898 12.87% 03/31/07
17.03 Ocmulgee Medical Pathology 6,725 9.75% 03/31/11
17.04 Carrier Corporation 11,208 13.03% 04/30/10
17.05 Varian Medical Systems, Inc. 16,743 28.92% 02/28/10
17.06 Thyssenkrupp Elevator 9,116 23.42% 12/31/07
18 Abaxis Inc. 91,124 28.27% 12/31/10
19 City of Chula Vista 17,250 13.34% 04/06/09
20
21 Circuit City 33,000 25.22% 01/31/18
22
23 Bed Bath & Beyond 36,572 14.89% 01/31/13
24 United Healthcare Services, Inc. 44,114 20.78% 03/31/09
25 Ross 30,208 14.27% 01/01/16
26 The Feld Group 44,016 19.40% 02/29/08
27
28
29
30 Thomson Financial, Inc. 23,106 7.87% 01/31/09
31
32 Creative Leather Furniture 18,748 18.24% 09/30/18
33
34 Dollar Tree 7,150 6.64% 01/31/10
35 Silvester Taufero Design 14,353 7.74% 06/30/09
36 Christiana Care Health Service 26,528 20.90% Multiple Spaces
37 Kelson Physician Partners of SE Florida 7,596 8.27% 07/17/11
38
39
40
41
42 Cost Plus, Inc. 23,708 26.84% 09/30/13
43 Standard Pacific of Texas, LP 21,693 13.63% 04/30/10
44 Best Buy Stores, LP 30,000 27.23% 01/31/16
45 Compass Bank 40,916 29.76% 01/31/10
46 Home Banc Mortgage Corp. 13,444 15.81% 09/30/09
47 Albertson's 8,067 8.45% 01/31/09
48
49
50
51 Luzenac America, Inc. 29,865 17.04% 08/31/13
52
53 Family Music Center & School 13,730 15.52% 04/04/09
54
55 Pier 1 Imports 9,600 9.14% 12/31/09
56 Global Imaging Systems 24,562 17.70% 12/31/08
57 Countrywide Home Loans 5,875 9.06% 01/31/11
58
59
60
61
62 Broadspire Services 17,187 14.77% 02/28/10
63
64
65
65.01
65.02
65.03
65.04
65.05
65.06
66 BJ's Pizza-Bennigans (Subleased from Steak and Ale of California, Inc.) 7,341 16.89% 07/01/08
67
68 Sofa Express 25,000 25.32% 10/31/20
69
70 Various Various Various Various
70.01 Image First Prof. Apparel 22,282 18.52% 02/28/07
70.02 Avalon 23,600 38.06% Multiple Spaces
70.03 Mike's Famous Harley Davidson 16,562 26.77% 06/30/08
71 Bed Bath & Beyond 23,000 18.41% 04/30/16
72 Byrd Corporation 5,595 7.02% 04/01/11
73 Woodward, Hobson & Fulton 19,221 20.71% 12/31/13
74
75
76
77
78
79 Fashion Bug 9,200 3.89% 01/31/11
80
81
82 Hartford Fire Insurance Company 26,165 20.88% 04/30/10
83
84
85
86
87
88 Hollywood Entertainment 4,944 12.01% 07/31/10
89
90 New Horizons Computer Learning Center 19,475 18.07% 02/28/09
91 Houston Community Management Services Expansion 9,272 8.72% 12/31/07
92 Family Dollar Stores 7,500 14.12% 12/31/09
93 Cato 4,160 7.43% 01/31/08
94 LA Boxing 3,500 11.34% 05/31/11
95
96
97
98
99 Arlington Medical / Neighborhood Doctor 7,673 10.64% 05/31/07
100
101
102 Adams County - DMV 5,660 5.89% Multiple Spaces
103 Treads Bicycle Outfitters 5,462 10.44% 11/30/16
104
105 Myodoc, Inc. 9,646 27.55% 01/31/16
106
107
108 Viterra Energy Services, Inc 19,568 20.44% 12/01/09
109 Epic Custom Kitchens 14,308 14.39% 02/29/08
110 Coldwell Banker Residential 11,318 16.43% 07/31/08
111 Marjorie Kujawinski 1,450 5.88% MTM
112 McCollisters 46,500 32.09% Multiple Spaces
113 Water & Ice 2,740 11.18% 09/30/11
114
115
116 Scituate Federal 3,000 18.51% 07/30/16
117 US Cellular 2,360 12.91% 07/31/10
118
119 AT&T 4,500 16.80% 07/31/11
120 Blockbuster 6,628 30.72% 02/28/10
121
122
123 B&G Cuisine, LLC 2,500 12.08% MTM
124 Winnetka Food, Inc. 4,500 21.98% 04/30/11
125
126
127
128
129
130
130.01
130.02
131 Mattress Warehouse 3,500 23.35% 02/28/11
132
133 Fiesta Del Mariachi Grill 3,660 14.87% 12/31/09
134
135
136 Electronics Boutique 1,600 22.22% 10/01/11
137 Adams School 1,100 8.53% 04/30/07
138
139
140
141 Various Various Various Various
141.01 OST Cleaners 1,500 9.64% 10/20/10
141.02
142
3RD
3RD LARGEST LARGEST
MORTGAGE LOAN 3RD LARGEST TENANT TENANT
NUMBER 3RD LARGEST TENANT NAME TENANT SQ. FT. % OF NRA EXP. DATE LOCKBOX
- ----------------------------------------------------------------------------------------------------------------------
1 Various Various Various Various
1.01
1.02
1.03
1.04
1.05 Gander Mountain Company 127,500 18.50% 02/28/07
1.06
1.07
1.08 Global Transport Logistics Inc. 86,374 17.92% 01/31/13
1.09
1.10
1.11
1.12
1.13
1.14
1.15
1.16 Cirronet Inc. 19,175 18.87% 02/28/11
1.17
1.18
1.19 C.H. Robinson Company 10,693 17.77% 05/19/09
1.20 Sanyo Denki America, Inc. 23,731 26.47% 11/30/09
1.21
1.22 American Standard Inc. 10,274 12.99% 09/30/11
1.23
1.24 Nat'l Credit System, Inc. 7,913 17.86% 06/30/08
1.25 SIPA North America, Inc. 9,712 15.84% 03/31/12
1.26 Wiggins Scale Company 5,234 9.16% 08/15/10
1.27
2 Various Various Various Various Day 1
2.01 Eckerd Drugs 18,000 10.28% 01/31/16
2.02 Ross Dress For Less 30,187 10.86% 01/31/16
2.03 Eastern Mountain Sports 9,093 10.14% 10/31/09
2.04 T.J. Maxx 25,726 11.46% 01/31/11
2.05 Barnes & Noble 20,925 11.56% 02/01/14
2.06 Fashion Bug 12,700 10.10% 01/28/11
2.07 Ben Franklin 14,804 10.07% 09/30/07
2.08 Goody's Family Clothing 40,000 15.13% 12/31/09
2.09 Rentway 3,780 3.64% 08/31/11
2.10 T.J. Maxx 28,361 14.84% 01/31/09
2.11 Borders 28,146 7.27% 01/31/27
2.12 Marshalls Mega 53,150 14.28% 10/31/09
2.13 Omni Fitness 2,000 16.67% 03/31/12
2.14 Walgreens 12,032 9.63% 08/31/11
2.15 Ulta 3 12,024 6.09% 04/30/10
2.16 Dick's Sporting Goods 45,000 11.06% 01/31/16
3 Tuesday Morning 15,399 2.73% 01/15/07 Day 1
4 Various Various Various Various Day 1
4.01 Auto Barn 7,448 12.15% 11/30/08
4.02 A.C.Moore Arts & Crafts 21,540 20.73% 02/29/12
4.03 Food Lion 40,000 11.45% 07/29/17
4.04 The Bank of New York 4,050 5.63% 12/31/09
4.05 Bank of America 5,000 6.40% 12/31/15
4.06 Michaels 22,400 14.05% 01/31/09
4.07 Office Max 23,500 16.35% 07/31/13
4.08 Paradiso Restaurant & Pizza 3,700 8.38% 06/30/13
4.09 Strathmore Bagels 3,500 4.14% 08/31/07
4.10 The Bank of New York 3,600 4.65% 12/31/11
4.11 Staples 24,000 13.05% 02/26/17
4.12 Michaels 17,500 8.82% 02/28/11
4.13 Barnes & Noble 25,050 11.31% 07/31/12
5 Abercrombie & Fitch 17,264 3.13% Multiple Spaces Day 1
6
7 Southwest Securities 165,411 9.57% Multiple Spaces Day 1
8 Day 1
9
10 GAP 20,000 5.88% 11/30/10
11 Miracle Mart 52,778 8.89% 12/31/08 Day 1
12
13
14 PSEG Global USA, Inc. 22,522 12.92% 07/13/12
15 Springing
16
17 Various Various Various Various Day 1
17.01 Pomeroy IT Solutions Sale 5,543 5.05% 09/30/08
17.02 Brinks Home Security, Inc. 7,352 6.81% 07/31/08
17.03 Ecolab, Inc. 4,940 7.16% 05/31/10
17.04 Cinema Screen Media, Inc. 9,984 11.61% 12/31/06
17.05 Nalley Lexus 6,989 12.07% 10/31/09
17.06 HTH Building Services, Inc 2,949 7.58% 04/30/11
18 Telogy, Inc. 89,020 27.62% 04/30/11
19 Prudential 16,091 12.44% 04/08/16
20 Day 1
21 Barnes & Noble 24,243 18.53% 03/31/17
22 Springing
23 Stein Mart, Inc. 34,022 13.85% 09/30/12 Springing
24 Phillips Electronics North America Corporation 25,029 11.79% 08/31/08
25 Master Lease 25,375 11.98% 04/09/08 Springing
26 EDS 16,746 7.38% MTM
27 Springing
28
29
30 High Tower, Inc. 12,135 4.13% 09/30/16
31
32 Sedona Patio Furnishings 17,442 16.97% 01/31/17
33
34 Hollywood Video 5,550 5.15% 12/20/09
35 SoNo Corporate Suites 14,100 7.60% 08/31/10
36 Wesley College 25,255 19.90% 08/31/10 Day 1
37 Revier Real Estate Corporation 5,800 6.31% 04/02/13
38 Day 1
39
40
41
42 Starbucks 21,408 24.23% 10/31/08
43 Austin Consolidated Holdings 16,622 10.44% 10/01/10
44 La Parillia 5,400 4.90% 11/30/15
45 TSYS Acquiring Solutions 34,334 24.97% 02/28/08 Springing
46 Proudfoot Consulting Group 11,487 13.51% 09/30/11
47 Angel's Clothing 5,600 5.87% 10/31/11
48
49
50 Day 1
51 Tetrad/Gore 20,086 11.46% 05/31/11
52
53 Dollar Tree 10,080 11.40% 12/31/11
54
55 Luxothca Retail Center 5,883 5.60% 07/31/09
56 Cemex, Inc. 21,900 15.78% 04/30/14
57 Arroyo Insurance Services, Inc. 5,187 8.00% 04/30/10 Springing
58
59
60 Springing
61 Springing
62 Fidelity National Title 9,134 7.85% 02/28/08
63
64 Day 1
65
65.01
65.02
65.03
65.04
65.05
65.06
66 American Premier Bank 5,427 12.49% 06/30/11 Springing
67
68 DBSI Housing, Inc 11,612 11.76% 11/30/08
69 Springing
70 Various Various Various Various Day 1
70.01
70.02
70.03 AAA Mid-Atlantic 15,000 24.25% 09/30/12
71 Men's Warehouse 3,800 3.04% 05/31/16
72 Day 1
73 Baker, Kriz, Jenkins and Prewitt 6,415 6.91% 12/31/09
74 Springing
75 Day 1
76 Springing
77
78 Springing
79 Famous Footwear 6,000 2.54% 07/31/07
80 Springing
81
82 Flake-Wilkerson Market Insights 13,229 10.56% 02/28/11
83 Day 1
84 Springing
85
86 Springing
87 Springing
88 Sovereign Bank 4,600 11.18% 04/30/14 Springing
89
90 Dual Diagnosis Management 14,954 13.87% 04/30/09 Springing
91 Innovative Alternatives, Inc. 4,585 4.31% 04/30/09
92 Blockbuster, Inc. 6,400 12.05% 03/31/09
93 Blockbuster Video 4,000 7.14% 10/31/13
94 Doctor's Office 3,000 9.72% 07/31/11
95 Springing
96
97
98
99 Rack Dady 7,124 9.88% 08/31/11
100 Springing
101
102 Panda Buffett 5,463 5.68% Multiple Spaces Springing
103 Keller Brothers Automotive, Inc. 4,800 9.17% 12/31/11
104
105
106
107
108 GSA - Small Business 10,475 10.94% 10/01/12
109 Multimedia Fabrications, Inc. 13,468 13.54% 03/31/09
110 Corvel Corporation 5,704 8.28% 01/31/08
111 North Shore Optical 1,400 5.68% MTM
112 Universal Map, Inc. 30,000 20.71% 03/31/11
113 Meridian Cleaners 2,550 10.41% 09/30/11
114 Springing
115
116 Verge Jewelry 1,837 11.34% 08/31/16
117 7-Eleven 2,196 12.02% 10/31/15
118
119 Solution Focused 2,250 8.40% 10/31/11
120 Sherwin Williams 5,952 27.58% 11/30/10
121
122 Springing
123 The Corner Cooks, Inc 1,800 8.70% MTM
124 The Chocolate Box 800 3.91% 05/31/09
125
126
127
128 Day 1
129
130
130.01
130.02
131 Best Cuts 1,500 10.01% 12/31/10
132 Springing
133 Ace Launderland 1,944 7.90% 11/30/11
134
135
136 Great Clips 1,200 16.67% 10/01/11
137 Kiesler, Mitch/Nilsson 925 7.17% 03/31/07
138 Springing
139 Springing
140
141 Various Various Various Various Springing
141.01 MD Hair Salon 1,200 7.71% 10/15/10
141.02
142 Springing
MORTGAGE LOAN LARGEST AFFILIATED SPONSOR FLAG MORTGAGE LOAN
NUMBER (> THAN 4% OF POOL, LOAN GROUP 1 OR LOAN GROUP 2) NUMBER
- ----------------------------------------------------------------------------------------------------------------------
1 1
1.01 1.01
1.02 1.02
1.03 1.03
1.04 1.04
1.05 1.05
1.06 1.06
1.07 1.07
1.08 1.08
1.09 1.09
1.10 1.10
1.11 1.11
1.12 1.12
1.13 1.13
1.14 1.14
1.15 1.15
1.16 1.16
1.17 1.17
1.18 1.18
1.19 1.19
1.20 1.20
1.21 1.21
1.22 1.22
1.23 1.23
1.24 1.24
1.25 1.25
1.26 1.26
1.27 1.27
2 Centro Properties Group 2
2.01 2.01
2.02 2.02
2.03 2.03
2.04 2.04
2.05 2.05
2.06 2.06
2.07 2.07
2.08 2.08
2.09 2.09
2.10 2.10
2.11 2.11
2.12 2.12
2.13 2.13
2.14 2.14
2.15 2.15
2.16 2.16
3 GGP-TRS L.L.C. 3
4 Centro Properties Group 4
4.01 4.01
4.02 4.02
4.03 4.03
4.04 4.04
4.05 4.05
4.06 4.06
4.07 4.07
4.08 4.08
4.09 4.09
4.10 4.10
4.11 4.11
4.12 4.12
4.13 4.13
5 Westfield America, Inc. 5
6 The Irvine Company 6
7 Joseph Moinian, Henry Shahery 7
8 SL Green 8
9 La Terraza, LLC 9
10 Prudential Insurance Company of America and DDR Corporation 10
11 Lightsone Holdings, LLC 11
12 La Terraza, LLC & Scala GP, Inc. 12
13 Frank T. Perano 13
14 W. Allen Morris 14
15 John R. Saunders 15
16 James Procaccianti The Procaccianti Group 16
17 James R. Heistand 17
17.01 17.01
17.02 17.02
17.03 17.03
17.04 17.04
17.05 17.05
17.06 17.06
18 Nearon Enterprises, LLC and Syme Family Partners, L.P. 18
19 James V. Pieri & D. Gregory Scott 19
20 SCI Gateway at Tempe Fund LLC and related TIC entities 20
21 Robert Schmier 21
22 Thomas B. Brenneke, Jr. 22
23 Equity Fund Advisors, Inc. 23
24 Capital Associates 24
25 Covington Realty Partners, LLC 25
26 Wells REIT 26
27 William H. Winn; Passco Companies, LLC 27
28 Major Acquisition Corp 28
29 Kennedy Wilson & Wachovia Development Corporation 29
30 30
31 Jeff & Lisa Mazzarella 31
32 Michael Gregory; Brian Scott Weisenburger; Lubertus H. Hayenga 32
33 Redhill Realty Investors LP 33
34 Milton Bilak 34
35 Lloyd Amster 35
36 Brock J. Vinton 36
37 Richard D. Gertz 37
38 Brock J. Vinton 38
39 Frank T. Perano 39
40 John J. Ferebee 40
41 Steven D. Bell & Company 41
42 Dan M. Perlmutter and Sandra G. Perlmutter 42
43 Wells Real Estate Investment Trust, Inc. 43
44 Stanley E. Thomas 44
45 Thomas E. Donahue & Jeffrey J. Krajewski 45
46 Richard D. Gertz 46
47 Sunny Bhullar 47
48 Michael J. Hanson 48
49 Resource Real Estate Holdings, Inc. 49
50 Capital Lease Funding 50
51 SVN Equities, LLC 51
52 Sol L. Rabin 52
53 Milton Bilak 53
54 Steven D. Bell & Company 54
55 David Garfunkel 55
56 56
57 Stanley W. Gribble 57
58 Blackrock Realty Advisors 58
59 59
60 John Harris 60
61 61
62 James Blain 62
63 Gary Squire & Claude Keener 63
64 Prescott Capital Management, LLC 64
65 Kurt E. O'Brien 65
65.01 65.01
65.02 65.02
65.03 65.03
65.04 65.04
65.05 65.05
65.06 65.06
66 Stanley W. Gribble 66
67 Dean A. Allara; Christian V. Young; Danuel R. Stanger 67
68 Douglas L. Swenson & DBSI Housing Inc. 68
69 Michael A. Carey & Timothy M. Carey, as Trustee of the Timothy Michael Carey 1995 Trust, 69
dated August 16, 1995
70 Brock J Vinton 70
70.01 70.01
70.02 70.02
70.03 70.03
71 Dell Loy Hansen 71
72 Peter Gardner 72
73 Farra Alford 73
74 Mark Hamilton 74
75 Capital Lease Funding 75
76 Triple Net Properties, LLC 76
77 Thomas J. Lyons 77
78 Stanley W. Gribble 78
79 E. Stanley Kroenke 79
80 Capital Lease Funding 80
81 Steven D. Bell & Company 81
82 Richard Fownes 82
83 Winston Plaza Associates & David Goldstein 83
84 Irving A. Smokler 84
85 Resource Real Estate 85
86 Oscar H. Plotkin 86
87 Triple Net Properties, LLC 87
88 Lewis J. Brandolini, III 88
89 Nizar Damji & 360 Degree Hotel Group, Ltd. 89
90 Richard Fownes 90
91 John L. Cole 91
92 Robert K. Barth 92
93 Michael E. Calandra 93
94 Stanford Aron 94
95 Keith Real Estate Associates 95
96 David Falk, Sr. 96
97 Walter J. Ruloff 97
98 Donal P. Barry Jr. 98
99 John S. Navai & R. Nader Ghadimi 99
100 Michael A. Carey & Timothy M. Carey, as Trustee of the Timothy Michael Carey 1995 Trust, 100
dated August 16, 1995
101 Kevin Mahaney 101
102 NewMark Merrill Companies LLC 102
103 Michael Buschell 103
104 Andrew Stewart 104
105 Howard L. Parnes; Craig L. Koenigsberg; James J. Houlihan 105
106 Sohrob Pourtahmassebi; Holly Badham-VanKomen; Christine Pourtahmassebi 106
107 Joseph Seravalli 107
108 W. Allen Morris 108
109 Harry J. O'Donnell 109
110 Douglas L. Swenson & DBSI Housing, Inc. 110
111 Donal P. Barry 111
112 David Novoseller, Michael Kanoff, Peter Veres 112
113 John B. Bertram 113
114 Harold Brown 114
115 Steven D. Bell & Company 115
116 Tom Naughton 116
117 W. Harris Smith 117
118 Gary Squire & Claude Keener 118
119 Mike Amann 119
120 Edmund Spivack 120
121 Kirit F. Patel 121
122 David & Susan Wilstein 122
123 Donal P. Barry Jr. 123
124 Donal P. Barry 124
125 William M. Gustavson; Irfan Pardhan; Tahira Pardhan 125
126 Steven D. Bell & Company 126
127 Michael Comras 127
128 Paul A. Gardner & Alan D. Moore 128
129 Donal P. Barry 129
130 Ardath K. Solsrud 130
130.01 130.01
130.02 130.02
131 Robert Kubicki 131
132 Cole Capital Advisors 132
133 Kam W. Liew 133
134 Steven D. Bell & Company 134
135 Ian Rogoff 135
136 Richard Rosenfield 136
137 Donal P. Barry 137
138 Cole Credit Property Trust II, Inc. 138
139 Eshagh Malekan 139
140 Alan R. Porter 140
141 Eshagh Malekan & David Sohayegh 141
141.01 141.01
141.02 141.02
142 Cole Credit Property Trust II, Inc. 142
See "DESCRIPTION OF THE MORTGAGED POOL - Additional Mortgage Loan Information"
in the prospectus supplement.
(1) For purposes of determining the loan-to-value ratios for 15 Mortgaged
Properties (loan numbers 1.02, 3, 8, 11, 16, 19, 22, 32, 33, 98, 111, 123, 124,
129 and 137), representing, by allocated loan amount, 16.8% of the Cut-Off Date
Pool Balance by allocated loan amount (12 Mortgaged Properties in Loan Group 1
or 19.2% of the Cut-Off Date Group 1 Balance and 3 Mortgaged Properties in Loan
Group 2 or 7.9% of the Cut-Off Date Group 2 Balance), such ratios were
calculated using "as-stabilized" appraised values as opposed to "as-is" values.
(2) One Mortgage Loan (loan number 6), representing 3.9% of the Cut-Off Date
Pool Balance or 4.9% of the Cut-Off Date Group 1 Balance, is part of a split
loan structure and the related pari passu companion loan is not included in the
Trust Fund with respect to the Mortgage Loan, unless otherwise specified.
(3) With respect to the 21-25 West 34th Street loan (loan number 8),
representing 3.0% of the Cut-Off Date Pool Balance or 3.7% of the Cut-Off Date
Group 1 Balance, the year built is based on the planned completion date for
collateral improvements of January 1, 2008, according to the appraisal.
(4) With respect to the Deer Park Town Center loan (loan number 10),
representing 1.8% of the Cut-Off Date Pool Balance or 2.2% of the Cut-Off Date
Group 1 Balance, a maximum of $3,500,000 of the loan amount is freely prepayable
without premium.
(5) For purposes of determining the debt service coverage ratios for 7 Mortgage
Loans (loan numbers 19, 32, 51, 89, 100, 121 and 125), representing 2.8% of the
Cut-Off Date Pool Balance (5 Mortgage Loans in Loan Group 1 or 3.1% of the
Cut-Off Date Group 1 Balance and 2 Mortgage Loans in Loan Group 2 or 1.5% of the
Cut-Off Date Group 2 Balance), such ratios were adjusted by taking into account
amounts available under certain letters of credit and/or cash reserves. For a
description of how the debt service coverage ratios for the Mortgage Loans are
determined, see "DESCRIPTION OF THE MORTGAGE POOL--Additional Mortgage Loan
Information" and "RISK FACTORS--Risks Relating to Net Cash Flow" in the
Prospectus Supplement.
(6) With respect to the Raveneaux Apartments loan (loan number 27), representing
0.7% of the Cut-Off Date Pool Balance or 3.5% of the Cut-Off Date Group 2
Balance, the rate varies throughout the IO term of the loan.
(7) In certain cases, occupancy includes space for which leases have been
executed, but the tenant has not taken occupancy.
WACHOVIA BANK COMMERCIAL MORTGAGE TRUST SERIES 2006-C29
ANNEX A-2
CERTAIN INFORMATION REGARDING MULTIFAMILY MORTGAGED PROPERTIES
MORTGAGE
LOAN LOAN GROUP
NUMBER NUMBER PROPERTY NAME PROPERTY ADDRESS
- ------------------------------------------------------------------------------------------------------------------------------------
6 1 Newport Bluffs 100 Vilaggio
9 2 La Jolla International Apartments 3415, 3425, 3435, 3445, 3455 and 3465 Lebon Drive
12 2 La Scala Apartments 3833, 3845, 3855 & 3899 Nobel Drive
15 2 AMLI at Riverbend 8850 Riverbend Parkway
20 2 Village on University Apartments 1655 East University Drive
22 2 The Fairways Apartments 777 West Chandler Boulevard
27 2 Raveneaux Apartments 14500 Cutten Road
28 2 Gramercy Apartments 9054 Gramercy Drive
29 2 Rancho Solana Apartments 2400-2444 Alvarado Street
31 2 Napa Valley Apartments 1349 West Horizon Ridge Parkway
33 2 Pinnacle Grove Apartments 701 West Grove Parkway
40 2 Treybrooke Apartments 701 Treybrooke Circle
41 2 Smoky Crossing I Apartments 11647 Chapman Highway
49 2 Heritage Lake at Westland Apartments 1105 Lake Heritage Way
52 2 Andorra Apartments 81-720 Avenue 46
54 2 Eagle Pointe Apartments 8608 Eagle Pointe Drive
58 2 Silver Lakes Heights Apartments 2020 Lake Heights Drive
59 2 The Place at Greenway Apartments 3333 Cummins Street
61 2 River Ranch Apartments 6152 West Oakland Street
63 2 M Street Towers 1112 M Street NW
67 2 Tudor Heights Apartments 10505 Evans Plaza
69 2 Belleau Woods 4000, 4002, 4004, 4006, 4008, 4010, 4014, 4016, 4018, 4020, 4022 &
4024 Northwest Avenue
74 2 Avalon Park Apartments 17000 SW Pacific Highway
76 2 Arbors at Fairview Apartments 1000 Arbor Keats Drive
81 2 Forest Ridge I Apartments 9706 Smoky Ridge Way
85 2 The Grove at White Oak Apartments 1710 West TC Jester Boulevard
87 2 Beechwood Apartments 2700 Cottage Place
96 2 Jefferson Trace Apartments 2506 Atwell Drive
97 2 The Venterra at Waters Edge Apartments 12330 Metric Boulevard
98 1 Davis and Oak 1100-1118 Davis Street
100 2 Village at Baker Creek 3820, 3844, 3832, 3856, 3868, 3924, 3936, 3948, 3960 & 3972
Primrose Lane
104 2 Park Manor Apartments 22 Forest Circle
106 2 Cougar Court Apartments 697 Trejo Street
111 1 543 - 561 Lincoln Avenue 543 - 561 Lincoln Avenue; 743-749 Elm Street
114 2 The Hamilton 1025 Hancock Street
115 2 Hinton Hollow Apartments 2812 Bakertown Road
118 2 Taylor Apartments 1660 & 1670 North 21st Road
123 1 501 - 507 Chestnut Court 501-507 Chestnut Court
124 1 715-729 Elm Street 715 - 729 Elm Street
125 2 Chelsea Court Apartments 7206 & 7208 NE 182nd Street
126 2 Autumn Woods Apartments 9801 Autumnwood Circle
129 2 Dempster and Judson 1243-1249 Judson Avenue
134 2 Southern Woods Apartments 9100 Jenny Cook Circle
MORTGAGE
LOAN PROPERTY PROPERTY GENERAL ELEVATOR
NUMBER PROPERTY CITY STATE ZIP CODE COUNTY PROPERTY TYPE SPECIFIC PROPERTY TYPE BUILDINGS
- ----------------------------------------------------------------------------------------------------------------------
6 Newport Beach CA 92660 Orange Multifamily Conventional N
9 San Diego CA 92122 San Diego Multifamily Conventional Y
12 San Diego CA 92122 San Diego Multifamily Conventional Y
15 Indianapolis IN 46250 Marion Multifamily Conventional N
20 Tempe AZ 85281 Maricopa Multifamily Student Housing N
22 Chandler AZ 85225 Maricopa Multifamily Conventional N
27 Houston TX 77069 Harris Multifamily Conventional N
28 San Diego CA 92123 San Diego Multifamily Conventional N
29 Oxnard CA 93036 Ventura Multifamily Conventional N
31 Henderson NV 89012 Clark Multifamily Conventional N
33 Tempe AZ 85283 Maricopa Multifamily Conventional N
40 Greenville NC 27834 Pitt Multifamily Conventional N
41 Seymour TN 37865 Sevier Multifamily Conventional N
49 Knoxville TN 37922 Knox Multifamily Conventional N
52 Indio CA 92201 Riverside Multifamily Conventional N
54 Knoxville TN 37931 Knox Multifamily Conventional N
58 Everett WA 98208 Snohomish Multifamily Conventional N
59 Houston TX 77036 Harris Multifamily Conventional N
61 Chandler AZ 85226 Maricopa Multifamily Conventional N
63 Washington DC 20005 District Of Columbia Multifamily Conventional Y
67 Omaha NE 68134 Douglas Multifamily Conventional N
69 Bellingham WA 98226 Whatcom Multifamily Conventional Y
74 Tigard OR 97224 Washington Multifamily Conventional N
76 Simpsonville SC 29680 Greenville Multifamily Conventional N
81 Knoxville TN 37931 Knox Multifamily Conventional N
85 Houston TX 77008 Harris Multifamily Conventional N
87 Greensboro NC 27455 Guilford Multifamily Conventional N
96 Richmond VA 23234 City of Richmond Multifamily Conventional N
97 Austin TX 78758 Travis Multifamily Conventional N
98 Evanston IL 60201 Cook Multifamily Conventional N
100 Bellingham WA 98226 Whatcom Multifamily Conventional N
104 Newnan GA 30265 Coweta Multifamily Conventional N
106 Rexburg ID 83440 Madison Multifamily Student Housing N
111 Winnetka IL 60093 Cook Mixed Use Retail/Office/Multifamily N
114 Quincy MA 02169 Norfolk Multifamily Conventional Y
115 Knoxville TN 37931 Knox Multifamily Conventional N
118 Arlington VA 22209 Arlington Multifamily Conventional N
123 Winnetka IL 60093 Cook Mixed Use Retail/Multifamily N
124 Winnetka IL 60093 Cook Mixed Use Retail/Multifamily/Office Y
125 Kenmore WA 98028 King Multifamily Conventional N
126 Knoxville TN 37932 Knox Multifamily Conventional N
129 Evanston IL 60201 Cook Multifamily Conventional N
134 Knoxville TN 37923 Knox Multifamily Conventional N
MORTGAGE AVERAGE RENT; AVERAGE RENT; AVERAGE RENT;
LOAN UTILITIES NUMBER OF NUMBER OF NUMBER OF NUMBER OF NUMBER OF RENT RANGES - RENT RANGES - RENT RANGES -
NUMBER TENANT PAYS STUDIO UNITS 1 BR UNITS 2 BR UNITS 3 BR UNITS 4+ BR UNITS STUDIO UNITS 1 BR UNITS 2 BR UNITS
- ------------------------------------------------------------------------------------------------------------------------------------
6 E 33 391 471 157 1483;1300-1665 1928;1470-2385 2345;1750-3300
9 E 200 200 1270;1270-1270 1664;1630-1770
12 E 18 164 172 1175;1175-1175 1330;1330-1330 1724;1710-1730
15 E,G 544 452 659;595-708 757;670-1071
20 E 18 54 72 144 805;805-805 1166;1150-1198
22 E,W,S 76 232 44 747;700-850 856;815-950
27 W 232 114 36 918;795-1161 1294;1140-1414
28 E,W,S,T 1 55 80 48 895;895-895 1053;1053-1053 1277;1253-1333
29 E,G 26 110 32 1050;1050-1050 1375;1375-1375
31 E,W,T 112 112 16 851;820-875 993;960-1025
33 E,G,W,S,T 167 80 776;723-855 930;928-935
40 E,G,W,S,T 229 228 644;625-670 708;680-745
41 E,W 22 140 60 635;635-635 795;795-795
49 E,W,S 78 146 38 770;731-788 921;888-927
52 E,W,S,T 186 951;935-1000
54 E,W 181 45 739;655-915
58 E,W,S,T 68 84 48 752;752-752 876;867-883
59 E,W 78 141 695;659-704 882;813-1190
61 E,W,S,T 98 88 665;630-695 772;750-815
63 E 75 30 19 1098;1050-1150 1380;1150-1495 2116;1995-2250
67 E,G 252 166 475;475-475 637;610-730
69 E 30 72 132 575;575-575 675;675-675 802;775-825
74 E 96 96 638;565-675 743;720-790
76 E 18 126 24 646;627-680 757;743-782
81 E,W 54 42 44 727;727-727 817;817-817
85 E,W,S,T 104 52 843;765-915 950;950-950
87 E,G 76 52 80 553;545-585 649;649-649
96 E 5 214 5 550;550-550 580;580-580
97 E,W 28 80 76 626;626-626 758;678-808 901;897-911
98 E 22 16 10 4 810;810-810 1045;1045-1045 1250;1250-1250
100 E 11 123 625;625-625 750;750-750
104 E,W,S 18 70 26 710;710-710 795;795-795
106 E,G 149 513;500-550
111 E 1 3 3 615;615-615 760;695-800 850;825-875
114 E 32 16 1175;1175-1175 1375;1375-1375
115 E,W 52 24 694;670-850
118 E 12 12 4 1425;1400-1450 1933;1900-1950
123 E 6 6 2 735;735-735 775;775-775 800;800-800
124 E 4 2 911;690-1019 903;825-980
125 E,W,T 2 39 888;875-900 950;925-975
126 E,W 60 636;636-636
129 E 3 1 15 1045;1045-1045 1250;1250-1250
134 E,W 30 11 733;655-745
MORTGAGE AVERAGE RENT; AVERAGE RENT; MORTGAGE
LOAN RENT RANGES - RENT RANGES - LOAN
NUMBER 3 BR UNITS 4+ BR UNITS NUMBER
- --------------------------------------------------
6 3037;2540-3710 6
9 9
12 12
15 15
20 1365;1335-1425 1738;1580-1820 20
22 1068;1000-1150 22
27 1654;1614-1682 27
28 1551;1551-1551 28
29 1550;1550-1550 29
31 1150;1150-1150 31
33 33
40 40
41 900;900-900 41
49 1097;1097-1097 49
52 52
54 881;710-1310 54
58 979;979-979 58
59 59
61 61
63 63
67 67
69 69
74 74
76 928;919-945 76
81 927;927-927 81
85 85
87 669;669-669 87
96 725;725-725 96
97 97
98 1638;1375-1900 98
100 100
104 915;915-915 104
106 106
111 111
114 114
115 780;780-780 115
118 2200;2200-2200 118
123 123
124 124
125 125
126 126
129 1565;1525-1575 129
134 760;600-975 134
WACHOVIA BANK COMMERCIAL MORTGAGE TRUST SERIES 2006-C29
ANNEX A-3
RESERVE ACCOUNT INFORMATION
MORTGAGE LOAN MONTHLY MONTHLY
LOAN GROUP GENERAL PROPERTY TAX INSURANCE
NUMBER NUMBER PROPERTY NAME TYPE SPECIFIC PROPERTY TYPE ESCROW ESCROW
- ------------------------------------------------------------------------------------------------------------------------------
1 1 Duke Realty Industrial Pool Industrial Various
2 1 Centro Syndicate 2 Pool Retail Various
3 1 Galleria at Tyler Retail Anchored
4 1 Centro International Wholesale Pool Retail Anchored
5 1 Westfield Fox Valley Retail Anchored
6 1 Newport Bluffs Multifamily Conventional
7 1 Renaissance Tower Office Building Office CBD 301,999 25,551
8 1 21-25 West 34th Street Retail Single Tenant
9 2 La Jolla International Apartments Multifamily Conventional 30,472 15,193
10 1 Deer Park Town Center Retail Anchored
11 1 Dakota Square Mall Retail Anchored 110,763 12,206
12 2 La Scala Apartments Multifamily Conventional 28,521 11,319
13 2 Pennwood Crossing MHP Mobile Home Park Mobile Home Park 61,468 2,513
14 1 Alhambra Towers Office Suburban
15 2 AMLI at Riverbend Multifamily Conventional 57,140 22,464
16 1 Hilton - Providence, RI(2) Hospitality Full Service 41,527 8,894
17 1 New Market Pool Office Suburban 27,220 13,706
18 1 Crossroads Technology Park Industrial Light Industrial 47,279
19 1 Gateway Chula Vista II Office Suburban 9,921 4,300
20 2 Village on University Apartments Multifamily Student Housing 19,475 6,106
21 1 Shoppes of Wellington Green Retail Anchored
22 2 The Fairways Apartments Multifamily Conventional 19,521 6,510
23 1 Barry Woods Crossings Shopping Center Retail Anchored
24 1 Weston One Office Suburban 25,364
25 1 Lakeland Commons Shopping Center Retail Shadow Anchored 27,583 5,765
26 1 Las Colinas Corporate Center II Office Suburban
27 2 Raveneaux Apartments Multifamily Conventional 64,167 12,428
28 2 Gramercy Apartments Multifamily Conventional 8,098
29 2 Rancho Solana Apartments Multifamily Conventional 22,273 3,246
30 1 Concourse Office Plaza I & II Office Suburban
31 2 Napa Valley Apartments Multifamily Conventional 15,080
32 1 SanTan Village Phase III(3) Retail Shadow Anchored 1,847 1,398
33 2 Pinnacle Grove Apartments Multifamily Conventional 8,587
34 1 Boulder Crossing Shopping Center Retail Anchored 11,749 1,954
35 1 Sono Corporate Center Office Suburban 19,779 4,843
36 1 Reads Way Office Suburban 10,499
37 1 Professional Center at Pembroke Lakes Mall Office Suburban 23,993 11,610
38 1 Chestnut Run Office Suburban 8,664
39 2 Melody Lakes Country Club Estates Mobile Home Park Mobile Home Park 24,973 1,371
40 2 Treybrooke Apartments Multifamily Conventional 21,630
41 2 Smoky Crossing I Apartments(4) Multifamily Conventional 6,352
42 1 Cost Plus Plaza Mixed Use Retail/Office
43 1 Las Colinas Corporate Center I Office Suburban
44 1 The Forum at Ashley Park, Phase I Retail Anchored
45 1 Warner Crossings Office Suburban 24,485 1,398
46 1 Professional Centre at Gardens Mall Office Suburban 25,414 12,020
47 1 Driftwood Village Shopping Center Retail Anchored 10,456 2,549
48 1 Embassy Suites Tucson-Broadway(5) Hospitality Limited Service 14,216 2,890
49 2 Heritage Lake at Westland Apartments Multifamily Conventional 11,130 4,855
50 1 Aetna Building - Fresno, CA Office Suburban 13,941 5,871
51 1 345 Inverness Building Office Suburban 20,438 1,880
52 2 Andorra Apartments Multifamily Conventional 16,442 4,306
53 1 West Sahara Promenade Retail Anchored 10,531 2,400
54 2 Eagle Pointe Apartments(6) Multifamily Conventional 11,140
55 1 Twelve Oaks Retail Anchored 9,808 2,767
56 1 Northdale Executive Center I & II Office Suburban 21,684 13,728
57 1 Arcadia Gateway Center - Office Office Suburban 16,316 2,225
58 2 Silver Lakes Heights Apartments(7) Multifamily Conventional 14,516 3,078
59 2 The Place at Greenway Apartments Multifamily Conventional
60 1 The Crescent at Ballantyne Office Medical
61 2 River Ranch Apartments Multifamily Conventional 6,033 2,582
62 1 Cambridge Center Office Suburban 22,412 1,990
63 2 M Street Towers Multifamily Conventional 5,923 1,743
64 1 Time Warner Call Center Office Suburban
65 1 Attic Self Storage Pool Self Storage Self Storage 30,318 3,792
66 1 Arcadia Gateway Center - Retail Retail Unanchored 9,261 1,513
67 2 Tudor Heights Apartments Multifamily Conventional 21,171 5,297
68 1 Avenues North Retail Unanchored 12,386
69 2 Belleau Woods Multifamily Conventional 12,500 2,532
70 1 Riveredge Pool Industrial Warehouse/Distribution 7,789
71 1 Academy Square Retail Retail Anchored 8,912 975
72 1 100 Carillon Parkway Office Suburban 13,893 21,073
73 1 PNC Bank Plaza Office CBD 7,183 2,215
74 2 Avalon Park Apartments Multifamily Conventional 11,068 2,328
75 1 T-Mobile - Nashville, TN Office Suburban 16,225 1,109
76 2 Arbors at Fairview Apartments Multifamily Conventional 10,867 1,348
77 1 Residence Inn - Virginia Beach, VA Hospitality Extended Stay 6,130
78 1 Arcadia Gateway Center - Medical Office Office Medical 7,868 1,478
79 1 Southtowne Plaza Retail Anchored
80 1 FBI - Albany, NY Office Suburban 20,886 2,014
81 2 Forest Ridge I Apartments(8) Multifamily Conventional 6,639
82 1 MAC I and MAC II Office Suburban 19,205 3,272
83 1 Lowe's - Auburn, NY Retail Single Tenant
84 1 SHPS Building(9) Office Suburban 13,521 844
85 2 The Grove at White Oak Apartments(10) Multifamily Conventional 13,784 5,478
86 1 Dick's Sporting Goods - Sterling, VA Retail Single Tenant
87 2 Beechwood Apartments Multifamily Conventional 9,403 1,415
88 1 Llanerch Shopping Center Retail Anchored 9,191 765
89 1 Best Western - Everett, WA Hospitality Limited Service 4,897 3,789
90 1 Heritage Place Office Suburban 10,860 3,390
91 1 Atrium Crest Office Suburban 8,432
92 1 Woodberry Square Shopping Center Retail Unanchored 5,665 1,771
93 1 Camp Creek Center Retail Unanchored 7,399 1,355
94 1 Shops at Volente Retail Unanchored 949 650
95 1 Big Dog Distribution Facility Industrial Distribution
96 2 Jefferson Trace Apartments Multifamily Conventional 4,416 4,006
97 2 The Venterra at Waters Edge Apartments Multifamily Conventional 14,524
98 1 Davis and Oak Multifamily Conventional 9,099 1,410
99 1 Landmark Village Retail Unanchored 16,421 1,126
100 2 Village at Baker Creek Multifamily Conventional 6,390 1,997
101 1 Holiday Inn - Bangor, ME(11) Hospitality Full Service 9,889 3,915
102 1 Summit Square Retail Anchored 6,611
103 1 Parker Crossroads Mixed Use Retail/Office 9,668 457
104 2 Park Manor Apartments Multifamily Conventional 5,753
105 1 43-45 Crossways Park Drive Office Suburban 18,926
106 2 Cougar Court Apartments Multifamily Student Housing 7,669 1,869
107 1 St. Pete Post Office Industrial Distribution 4,037 11,308
108 1 Center Building Office Suburban
109 1 First Commons Industrial Buildings(12) Industrial Flex 12,673
110 1 Abbotts Bridge Office Office Suburban 9,870
111 1 543 - 561 Lincoln Avenue Mixed Use Retail/Office/Multifamily 9,618 637
112 1 1900 West New Hampshire Street Industrial Flex 4,718 5,000
113 1 Rodeo Park Plaza Retail Unanchored 5,371 688
114 2 The Hamilton Multifamily Conventional 7,735
115 2 Hinton Hollow Apartments(13) Multifamily Conventional 3,592
116 1 1 Derby Street Mixed Use Office/Retail 772 1,976
117 1 Armitage and California Retail Unanchored 3,365
118 2 Taylor Apartments Multifamily Conventional 2,990 952
119 1 Courthouse Square Office Suburban 1,974 640
120 1 4349 Duke Street Retail Unanchored 3,772 786
121 1 Wingate Inn - Birmingham, AL Hospitality Limited Service 5,191 3,345
122 1 Walgreens - Edgewater, MD Retail Single Tenant 1,824
123 1 501 - 507 Chestnut Court Mixed Use Retail/Multifamily 5,838 575
124 1 715-729 Elm Street Mixed Use Retail/Multifamily/Office 6,525 349
125 2 Chelsea Court Apartments Multifamily Conventional 4,636 1,169
126 2 Autumn Woods Apartments(14) Multifamily Conventional 2,313
127 1 Staples - Miami, FL Retail Single Tenant
128 1 Liberty Mutual Office Suburban 3,696 723
129 2 Dempster and Judson Multifamily Conventional 3,443 625
130 1 Care Free Mini Storage Pool Self Storage Self Storage 2,485 410
131 1 Fox Mill Centre Outparcels 2B and 5 Retail Shadow Anchored 1,507
132 1 CVS - San Antonio, TX Retail Single Tenant
133 1 President Plaza Retail Unanchored 3,486 1,385
134 2 Southern Woods Apartments(15) Multifamily Conventional 1,990
135 1 788 Fairview Office Suburban 707 524
136 1 Grand Oaks Plaza Retail Unanchored 544 3,927
137 1 874-878 Green Bay Mixed Use Office/Retail 3,435 371
138 1 Dollar General - Livingston, TN Retail Single Tenant
139 1 Walgreens - Houston, TX Retail Single Tenant 617
140 1 25 West Anapamu Street Office CBD
141 1 Family Dollar Pool Retail Various 4,698 383
142 1 Advance Auto Grand Forks, ND Retail Single Tenant
INITIAL DEPOSIT
MORTGAGE TO CAPITAL
LOAN ANNUAL DEPOSIT TO IMPROVEMENTS INITIAL ONGOING MORTGAGE LOAN
NUMBER REPLACEMENT RESERVES RESERVE TI/LC ESCROW TI/LC FOOTNOTE NUMBER
- -------------------------------------------------------------------------------------------------
1 1
2 2
3 3
4 4
5 5
6 6
7 10,000,000 7
8 8
9 9
10 10
11 83,334 (1) 11
12 12
13 10,790 13
14 250,000 (1) 14
15 15
16 623,049 16
17 131,299 (1) 17
18 12,893 350,000 (1) 18
19 (1) 19
20 83,480 79,000 20
21 21
22 82,016 22
23 24,558 900,000 (1) 23
24 24
25 21,175 250,000 (1) 25
26 26
27 27
28 45,684 240,000 28
29 37,968 67,875 29
30 30
31 67,680 31
32 10,284 (1) 32
33 33
34 34
35 27,833 11,000 35
36 10,405 300,000 (1) 36
37 13,777 (1) 37
38 2,117 1,000,000 38
39 9,000 39
40 40
41 55,500 41
42 42
43 43
44 44
45 27,497 (1) 45
46 12,753 (1) 46
47 13,359 (1) 47
48 151,007 48
49 4,375 49
50 12,261 600,000 50
51 26,282 (1) 51
52 46,140 52
53 53
54 56,500 54
55 10,508 345,730 55
56 11,102 150,000 (1) 56
57 9,724 400,000 57
58 30,000 690,000 58
59 59
60 60
61 46,128 61
62 25,595 100,000 (1) 62
63 28,272 63
64 (1) 64
65 53,363 65
66 5,215 200,000 66
67 104,500 213,781 67
68 68
69 46,800 69
70 76,270 21,063 1,300,000 (1) 70
71 71
72 18,322 20,625 (1) 72
73 13,922 (1) 73
74 18,094 74
75 10,393 (1) 75
76 23,352 76
77 4.0% Yearly Gross Revenue 77
78 8,237 400,000 78
79 79
80 9,550 80
81 35,000 81
82 17,541 250,000 82
83 19,547 83
84 12,972 150,000 (1) 84
85 22,152 85
86 86
87 51,376 87
88 6,996 (1) 88
89 95,796 89
90 16,167 300,000 90
91 15,948 (1) 91
92 5,842 21,000 92
93 6,162 (1) 93
94 3,087 (1) 94
95 95
96 56,000 6,563 96
97 46,000 30,500 97
98 11,100 (1) 98
99 10,817 28,125 100,000 (1) 99
100 26,800 31,250 100
101 222,000 101
102 102
103 7,849 (1) 103
104 28,500 64,000 104
105 12,254 (1) 105
106 37,250 106
107 107
108 34,466 23,038 200,000 (1) 108
109 9,936 (1) 109
110 110
111 6,188 (1) 111
112 32,426 26,000 225,000 (1) 112
113 (1) 113
114 114
115 19,000 115
116 1,621 (1) 116
117 1,827 (1) 117
118 6,972 118
119 5,089 119
120 120
121 70,768 121
122 122
123 3,816 (1) 123
124 10,180 (1) 124
125 8,200 125
126 15,000 126
127 127
128 3,600 (1) 128
129 3,800 129
130 9,160 130
131 1,499 (1) 131
132 132
133 8,617 (1) 133
134 10,250 134
135 8,700 135
136 720 (1) 136
137 2,064 (1) 137
138 138
139 2,600 (1) 139
140 140
141 3,712 (1) 141
142 142
(1) In addition to any escrows funded at loan closing for potential TI/LC
expenses, the related Mortgage Loan requires funds to be escrowed during
some or all of the loan terms for TI/LC expenses, which may be incurred
during the term of the related Mortgage Loans. In certain instances,
escrowed funds may be released to the borrower upon satisfaction of certain
leasing conditions.
(2) Annual Deposit to Replacement Reserves is $623,049 through December 11,
2007 and 4.0% of yearly gross revenues thereafter.
(3) Commencing April 1, 2007, Monthly Deposit to Tax Reserves is $1,847.
(4) Commencing November 11, 2011, Annual Deposit to Replacement Reserves is
$55,500.
(5) Annual Deposit to Replacement Reserves is $151,007 through December 11,
2007 and 3.0% of yearly gross revenues thereafter.
(6) Commencing November 11, 2011, Annual Deposit to Replacement Reserves is
$56,500.
(7) Commencing December 11, 2009, Annual Deposit to Replacement Reserves is
$30,000.
(8) Commencing November 11, 2011, Annual Deposit to Replacement Reserves is
$35,000.
(9) Commencing December 11, 2009, Annual Deposit to Replacement Reserves is
$12,972.
(10) Commencing November 11, 2008, Annual Deposit to Replacement Reserves is
$22,152.
(11) Annual Deposit to Replacement Reserves is the greater of $222,000 or 4.0%
of yearly gross revenue.
(12) Annual Deposit to Replacement Reserves is $9,936 through November 11, 2009.
(13) Commencing November 11, 2011, Annual Deposit to Replacement Reserves is
$19,000.
(14) Commencing November 11, 2011, Annual Deposit to Replacement Reserves is
$15,000.
(15) Commencing November 11, 2011, Annual Deposit to Replacement Reserves is
$10,250.
WACHOVIA BANK COMMERCIAL MORTGAGE TRUST SERIES 2006-C29
ANNEX A-4
COMMERCIAL TENANT SCHEDULE
LOAN GENERAL
MORTGAGE LOAN GROUP PROPERTY CUT-OFF DATE LOAN
NUMBER NUMBER PROPERTY NAME TYPE SPECIFIC PROPERTY TYPE BALANCE ($)
- --------------------------------------------------------------------------------------------------------------------------------
1 1 Duke Realty Industrial Pool Industrial Various 318,976,000.00
1.01 400 South Enterprise Boulevard Industrial Distribution/Warehouse
1.02 2425 East Hadley Road Industrial Distribution/Warehouse
1.03 250 Declaration Drive Industrial Distribution/Warehouse
1.04 2209-2233 Stafford Road Industrial Distribution/Warehouse
1.05 500-520 South Enterprise Boulevard Industrial Distribution/Warehouse
1.06 163 Portside Court Industrial Distribution/Warehouse
1.07 3201 Centre Parkway Industrial Distribution/Warehouse
1.08 1581 South Perry Road Industrial Distribution/Warehouse
1.09 1551 South Perry Road Industrial Distribution/Warehouse
1.10 185 North Mount Zion Road Industrial Distribution/Warehouse
1.11 1390 South Perry Road Industrial Distribution/Warehouse
1.12 322 South Enterprise Boulevard Industrial Distribution/Warehouse
1.13 4200 North Commerce Drive Industrial Distribution/Warehouse
1.14 6655 Sugarloaf Parkway Industrial Distribution
1.15 420 East Enterprise Boulevard Industrial Distribution/Warehouse
1.16 3079 Premiere Parkway Industrial Distribution
1.17 175 Alcovy Industrial Boulevard Industrial Distribution/Warehouse
1.18 2850 Premiere Parkway Industrial Distribution
1.19 3800 Centre Parkway - Building 1400 Industrial Distribution
1.20 2855 Premiere Parkway Industrial Distribution
1.21 3900 North Commerce Drive Industrial Distribution/Warehouse
1.22 2775 Premiere Parkway Industrial Distribution
1.23 198 Gulfstream Road Industrial Distribution/Warehouse
1.24 3800 Centre Parkway - Building 1800 Industrial Distribution
1.25 3800 Centre Parkway - Building 2400 Industrial Distribution
1.26 3800 Centre Parkway - Building 2600 Industrial Distribution
1.27 3800 Centre Parkway - Building 2000 Industrial Distribution
2 1 Centro Syndicate 2 Pool Retail Various 233,977,430.00
2.01 College Plaza Retail Anchored
2.02 Oakwood Commons Retail Anchored
2.03 Parkway Plaza Retail Anchored
2.04 Rutland Plaza Retail Anchored
2.05 Spradlin Farm Retail Center Retail Anchored
2.06 Torrington Plaza Retail Anchored
2.07 Tri-City Plaza Retail Anchored
2.08 Watson Glen Retail Anchored
2.09 Westgate Plaza Retail Anchored
2.10 Dalewood Shopping Center Retail Anchored
2.11 Grand Traverse Crossing Retail Anchored
2.12 Lehigh Shopping Center Retail Anchored
2.13 Northern Hills Retail Unanchored
2.14 Southport Centre I-VI Retail Anchored
2.15 Trinity Commons Retail Anchored
2.16 Wendover Place Retail Anchored
3 1 Galleria at Tyler Retail Anchored 205,000,000.00
4 1 Centro International Wholesale Pool Retail Anchored 161,039,673.00
4.01 Falcaro's Plaza Retail Anchored
4.02 Hale Road Retail Anchored
4.03 Innes Street Market Retail Anchored
4.04 Kings Park Shopping Center Retail Anchored
4.05 Lynn Marketplace Retail Anchored
4.06 Morris Hills Shopping Center Retail Anchored
4.07 New Centre Market Retail Anchored
4.08 Rockville Centre Retail Anchored
4.09 Suffolk Plaza Retail Anchored
4.10 Three Village Shopping Center Retail Anchored
4.11 Venetian Isles Retail Anchored
4.12 Berkshire Crossing Retail Anchored
4.13 County Line Plaza Retail Anchored
5 1 Westfield Fox Valley Retail Anchored 150,000,000.00
7 1 Renaissance Tower Office Building Office CBD 129,000,000.00
8 1 21-25 West 34th Street Retail Single Tenant 100,000,000.00
10 1 Deer Park Town Center Retail Anchored 60,000,000.00
11 1 Dakota Square Mall Retail Anchored 58,000,000.00
14 1 Alhambra Towers Office Suburban 52,000,000.00
17 1 New Market Pool Office Suburban 37,000,000.00
17.01 New Market 2161 Office Suburban
17.02 New Market 2211 Office Suburban
17.03 New Market 2221 Office Suburban
17.04 New Market 2121 Office Suburban
17.05 New Market 2250 Office Suburban
17.06 New Market 2110 Office Suburban
18 1 Crossroads Technology Park Industrial Light Industrial 35,000,000.00
19 1 Gateway Chula Vista II Office Suburban 33,300,000.00
21 1 Shoppes of Wellington Green Retail Anchored 30,750,000.00
23 1 Barry Woods Crossings Shopping Center Retail Anchored 28,275,000.00
24 1 Weston One Office Suburban 28,200,000.00
25 1 Lakeland Commons Shopping Center Retail Shadow Anchored 25,600,000.00
26 1 Las Colinas Corporate Center II Office Suburban 25,025,000.00
30 1 Concourse Office Plaza I & II Office Suburban 22,600,000.00
32 1 SanTan Village Phase III Retail Shadow Anchored 22,400,000.00
34 1 Boulder Crossing Shopping Center Retail Anchored 21,000,000.00
35 1 Sono Corporate Center Office Suburban 20,000,000.00
36 1 Reads Way Office Suburban 18,800,000.00
37 1 Professional Center at Pembroke Lakes Mall Office Suburban 18,750,000.00
38 1 Chestnut Run Office Suburban 18,400,000.00
42 1 Cost Plus Plaza Mixed Use Retail/Office 17,500,000.00
43 1 Las Colinas Corporate Center I Office Suburban 17,500,000.00
44 1 The Forum at Ashley Park, Phase I Retail Anchored 17,500,000.00
45 1 Warner Crossings Office Suburban 17,300,000.00
46 1 Professional Centre at Gardens Mall Office Suburban 17,250,000.00
47 1 Driftwood Village Shopping Center Retail Anchored 17,000,000.00
50 1 Aetna Building - Fresno, CA Office Suburban 16,043,000.00
51 1 345 Inverness Building Office Suburban 15,500,000.00
53 1 West Sahara Promenade Retail Anchored 15,500,000.00
55 1 Twelve Oaks Retail Anchored 15,120,000.00
56 1 Northdale Executive Center I & II Office Suburban 14,950,000.00
57 1 Arcadia Gateway Center - Office Office Suburban 14,880,000.00
60 1 The Crescent at Ballantyne Office Medical 14,450,000.00
62 1 Cambridge Center Office Suburban 13,375,000.00
64 1 Time Warner Call Center Office Suburban 13,025,000.00
66 1 Arcadia Gateway Center - Retail Retail Unanchored 12,820,000.00
68 1 Avenues North Retail Unanchored 12,300,000.00
70 1 Riveredge Pool Industrial Warehouse/Distribution 12,160,000.00
70.01 Riveredge II Industrial Warehouse/Distribution
70.02 Riveredge III Industrial Warehouse/Distribution
70.03 Riveredge IV Industrial Warehouse/Distribution
71 1 Academy Square Retail Retail Anchored 12,000,000.00
72 1 100 Carillon Parkway Office Suburban 11,500,000.00
73 1 PNC Bank Plaza Office CBD 11,350,000.00
75 1 T-Mobile - Nashville, TN Office Suburban 10,885,000.00
78 1 Arcadia Gateway Center - Medical Office Office Medical 10,300,000.00
79 1 Southtowne Plaza Retail Anchored 10,200,000.00
80 1 FBI - Albany, NY Office Suburban 10,137,000.00
82 1 MAC I and MAC II Office Suburban 9,800,000.00
83 1 Lowe's - Auburn, NY Retail Single Tenant 9,500,000.00
84 1 SHPS Building Office Suburban 9,400,000.00
86 1 Dick's Sporting Goods - Sterling, VA Retail Single Tenant 8,982,796.47
88 1 Llanerch Shopping Center Retail Anchored 8,450,000.00
90 1 Heritage Place Office Suburban 8,240,000.00
91 1 Atrium Crest Office Suburban 8,150,000.00
92 1 Woodberry Square Shopping Center Retail Unanchored 8,000,000.00
93 1 Camp Creek Center Retail Unanchored 7,800,000.00
94 1 Shops at Volente Retail Unanchored 7,680,600.00
95 1 Big Dog Distribution Facility Industrial Distribution 7,630,000.00
99 1 Landmark Village Retail Unanchored 7,000,000.00
102 1 Summit Square Retail Anchored 6,700,000.00
103 1 Parker Crossroads Mixed Use Retail/Office 6,650,000.00
105 1 43-45 Crossways Park Drive Office Suburban 6,400,000.00
107 1 St. Pete Post Office Industrial Distribution 6,250,000.00
108 1 Center Building Office Suburban 6,200,000.00
109 1 First Commons Industrial Buildings Industrial Flex 6,200,000.00
110 1 Abbotts Bridge Office Office Suburban 5,671,000.00
111 1 543 - 561 Lincoln Avenue Mixed Use Retail/Office/Multifamily 5,640,000.00
112 1 1900 West New Hampshire Street Industrial Flex 5,400,000.00
113 1 Rodeo Park Plaza Retail Unanchored 5,000,000.00
116 1 1 Derby Street Mixed Use Office/Retail 4,750,000.00
117 1 Armitage and California Retail Unanchored 4,750,000.00
119 1 Courthouse Square Office Suburban 4,400,000.00
120 1 4349 Duke Street Retail Unanchored 4,150,000.00
122 1 Walgreens - Edgewater, MD Retail Single Tenant 3,795,971.97
123 1 501 - 507 Chestnut Court Mixed Use Retail/Multifamily 3,620,000.00
124 1 715-729 Elm Street Mixed Use Retail/Multifamily/Office 3,590,000.00
127 1 Staples - Miami, FL Retail Single Tenant 3,196,721.89
128 1 Liberty Mutual Office Suburban 3,040,000.00
131 1 Fox Mill Centre Outparcels 2B and 5 Retail Shadow Anchored 2,800,000.00
132 1 CVS - San Antonio, TX Retail Single Tenant 2,690,000.00
133 1 President Plaza Retail Unanchored 2,497,511.24
135 1 788 Fairview Office Suburban 2,300,000.00
136 1 Grand Oaks Plaza Retail Unanchored 2,142,000.00
137 1 874-878 Green Bay Mixed Use Office/Retail 2,100,000.00
138 1 Dollar General - Livingston, TN Retail Single Tenant 1,856,000.00
139 1 Walgreens - Houston, TX Retail Single Tenant 1,732,000.00
140 1 25 West Anapamu Street Office CBD 1,600,000.00
141 1 Family Dollar Pool Retail Various 1,500,000.00
141.01 Catalina Springs Shopping Center Retail Unanchored
141.02 Family Dollar - Houston, TX Retail Single Tenant
142 1 Advance Auto Grand Forks, ND Retail Single Tenant 840,000.00
MORTGAGE LOAN NUMBER OF UNITS UNIT OF LARGEST TENANT LARGEST TENANT
NUMBER (UNITS) MEASURE LARGEST TENANT % OF NRA EXP. DATE
- ---------------------------------------------------------------------------------------------------------------------------
1 8,324,477 Sq. Ft. Various Various Various
1.01 842,000 Sq. Ft. Case LLC 100.00% 05/31/15
1.02 650,760 Sq. Ft. Ozburn-Hessey Logistics, LLC 61.50% 07/31/11
1.03 759,300 Sq. Ft. Rheem Sales Company, Inc. 46.62% 05/14/11
1.04 600,576 Sq. Ft. Quaker Sales & Distribution 50.04% 11/30/07
1.05 689,009 Sq. Ft. Aurora Parts & Accessories LLC 44.47% 02/29/12
1.06 200,000 Sq. Ft. Wal-mart Stores East, LP 100.00% 06/30/14
1.07 607,650 Sq. Ft. The Clorox Sales Company 100.00% 07/07/14
1.08 481,874 Sq. Ft. Q-Edge 53.80% 04/11/11
1.09 450,000 Sq. Ft. NAL Worldwide LLC 100.00% 03/31/10
1.10 418,400 Sq. Ft. Pamida, Inc 100.00% 06/30/15
1.11 426,326 Sq. Ft. Nice-Pak Products, Inc. 100.00% 08/31/12
1.12 395,679 Sq. Ft. Hachete Book Group, USA, Inc 100.00% 04/30/12
1.13 301,200 Sq. Ft. Hartsfield Warehouse Co., Inc. 100.00% 03/21/13
1.14 250,000 Sq. Ft. Innotrac Corporation 100.00% 10/31/08
1.15 250,000 Sq. Ft. Case LLC 100.00% 10/31/14
1.16 101,600 Sq. Ft. Honeywell, Inc. 40.58% 01/31/09
1.17 108,400 Sq. Ft. Weyerhaeuser Company 100.00% 01/09/15
1.18 86,000 Sq. Ft. Data General 100.00% 11/30/07
1.19 60,177 Sq. Ft. Sto Corporation 31.41% 03/31/09
1.20 89,636 Sq. Ft. TransDyn Controls, Inc. 33.17% 11/30/07
1.21 129,842 Sq. Ft. Moore Wallace North AM, Inc. 100.00% 06/14/15
1.22 79,110 Sq. Ft. Innovative Product Achievement 33.82% 11/14/09
1.23 150,000 Sq. Ft. American Port Services, Inc. 100.00% 11/30/12
1.24 44,306 Sq. Ft. Atlanta Classic Realty Assoc. 34.14% 08/31/10
1.25 61,318 Sq. Ft. Senior Care Pharmacy of GA LLC 15.93% 02/09/10
1.26 57,168 Sq. Ft. Gemu Valves, Inc. 81.69% 06/30/12
1.27 34,146 Sq. Ft. General Services Admin 100.00% 05/19/08
2 3,281,027 Sq. Ft. Various Various Various
2.01 175,086 Sq. Ft. Bob's Stores 34.77% 03/31/10
2.02 278,017 Sq. Ft. Publix Supermarkets 21.94% 01/31/09
2.03 89,704 Sq. Ft. T.J. Maxx 35.23% 11/30/07
2.04 224,514 Sq. Ft. Wal-Mart 33.91% 01/28/12
2.05 181,055 Sq. Ft. Goody's Family Clothing 19.33% 01/31/11
2.06 125,710 Sq. Ft. T.J. Maxx 19.96% 01/31/10
2.07 146,947 Sq. Ft. Demoulas Supermarkets 40.10% 11/30/09
2.08 264,360 Sq. Ft. K-Mart 32.71% 10/30/13
2.09 103,903 Sq. Ft. Stop & Shop/Staples/OSJ 48.38% 11/30/15
2.10 191,085 Sq. Ft. Bed Bath & Beyond 20.01% 01/31/27
2.11 387,273 Sq. Ft. Wal-Mart 32.31% 10/18/26
2.12 372,243 Sq. Ft. Wells Fargo 21.16% 12/31/10
2.13 12,000 Sq. Ft. The Men's Wearhouse 50.00% 02/28/13
2.14 124,937 Sq. Ft. Best Buy 29.39% 01/31/09
2.15 197,424 Sq. Ft. Tom Thumb 32.33% 08/15/18
2.16 406,769 Sq. Ft. Kohl's 21.29% 01/31/19
3 564,247 Sq. Ft. AMC Theatres 12.41% 02/28/23
4 1,777,884 Sq. Ft. Various Various Various
4.01 61,295 Sq. Ft. Office Max 48.76% 01/29/08
4.02 103,931 Sq. Ft. Babies "R" Us 29.52% 01/31/17
4.03 349,433 Sq. Ft. Lowe's Home Centers 32.83% 05/31/17
4.04 71,940 Sq. Ft. T.J. Maxx 35.60% 11/30/08
4.05 78,092 Sq. Ft. Shaw's Supermarket 67.38% 05/23/08
4.06 159,454 Sq. Ft. Marshalls Mega 32.88% 08/31/09
4.07 143,763 Sq. Ft. Marshalls 20.87% 05/31/08
4.08 44,131 Sq. Ft. Homegoods 62.95% 11/30/09
4.09 84,480 Sq. Ft. Waldbaum's 67.19% 12/31/08
4.10 77,458 Sq. Ft. King Kullen Grocery 50.29% 02/28/25
4.11 183,867 Sq. Ft. Publix Supermarkets 22.90% 01/31/12
4.12 198,473 Sq. Ft. Price Chopper 41.40% 06/30/20
4.13 221,567 Sq. Ft. Haverty's Furniture 19.41% 04/30/13
5 552,388 Sq. Ft. Steve & Barry's 4.51% 01/31/13
7 1,729,294 Sq. Ft. Blockbuster Inc. 14.33% 06/30/17
8 27,900 Sq. Ft. Apple Computer, Inc. 100.00% 01/31/22
10 340,369 Sq. Ft. Century Theatre 14.18% 06/30/19
11 593,626 Sq. Ft. J.C. Penney 17.83% 03/31/10
14 174,310 Sq. Ft. INBM 33.87% 06/30/12
17 469,667 Sq. Ft. Various Various Various
17.01 109,837 Sq. Ft. Matria Healthcare, Inc. 65.43% 04/30/11
17.02 108,004 Sq. Ft. Aderans Research Institute 19.51% 06/30/10
17.03 68,991 Sq. Ft. West Assest MGMT, LLC 78.83% 05/31/10
17.04 86,006 Sq. Ft. Cork-Howard Construction 15.09% 08/31/10
17.05 57,903 Sq. Ft. Primedia Special Interest 40.93% 12/31/07
17.06 38,926 Sq. Ft. H&R Block Mortgage Corporation 40.75% 03/31/08
18 322,318 Sq. Ft. Molecular Devices 29.94% 02/16/11
19 129,315 Sq. Ft. PSM, LLC 15.14% 03/31/16
21 130,838 Sq. Ft. Linens 'n Things 27.15% 01/31/18
23 245,590 Sq. Ft. AMC Theatres 36.36% 12/31/17
24 212,267 Sq. Ft. R.H. Donnelley Inc. 41.99% 06/30/15
25 211,749 Sq. Ft. Hobby Lobby 25.98% 08/01/20
26 226,904 Sq. Ft. Deloitte & Touche USA LLP 24.45% 02/28/11
30 293,643 Sq. Ft. REZNICK GROUP, P.C. 11.29% 10/31/16
32 102,777 Sq. Ft. CL Home Furnishings 18.77% 10/31/18
34 107,705 Sq. Ft. Albertson's Store 54.93% 08/16/24
35 185,532 Sq. Ft. Equilease Financial Services, Inc. 7.79% 05/31/13
36 126,935 Sq. Ft. Applied Extrusion Technologies 39.63% 04/30/11
37 91,845 Sq. Ft. GSA US Government 16.43% 09/06/11
38 98,500 Sq. Ft. E.I. Du Pont De Nemours & Co. 100.00% 10/14/08
42 88,338 Sq. Ft. Barnes & Noble Superstore 32.63% 01/31/11
43 159,212 Sq. Ft. H.D. Vest, Inc. 50.92% 12/31/12
44 110,178 Sq. Ft. Newnan Cinema Consolidated Theatre 45.91% 11/30/24
45 137,484 Sq. Ft. Honeywell International 45.27% 06/30/10
46 85,022 Sq. Ft. WCI Communities 43.81% Multiple Spaces
47 95,420 Sq. Ft. Food 4 Less of Calif., Inc. 48.80% 11/30/11
50 122,605 Sq. Ft. Aetna Life Insurance Company 100.00% 11/30/16
51 175,213 Sq. Ft. Nestle 26.28% 05/31/12
53 88,455 Sq. Ft. Stein Mart 38.44% 05/07/09
55 105,084 Sq. Ft. Publix Supermarket 45.63% 04/30/15
56 138,772 Sq. Ft. Pulte Home Corp. 19.87% 12/31/12
57 64,828 Sq. Ft. National Childhood Cancer 63.67% 11/30/07
60 59,472 Sq. Ft. The Charlotte-Mecklenburg Hospital Authority 100.00% 05/03/26
62 116,339 Sq. Ft. Eastern Michigan University 19.30% 06/30/09
64 113,600 Sq. Ft. Time Warner Entertainment 11.97% 05/31/16
66 43,456 Sq. Ft. Olive Garden 21.29% 09/30/10
68 98,749 Sq. Ft. Bassett 26.52% 02/28/14
70 244,158 Sq. Ft. Various Various Various
70.01 120,300 Sq. Ft. Avalon 81.48% 10/31/07
70.02 62,000 Sq. Ft. J&L Building Materials, Inc. 61.94% 02/29/12
70.03 61,858 Sq. Ft. Intelco of Delaware Valley, Inc. 27.31% 01/31/07
71 124,900 Sq. Ft. Kohl's Department Stores, Inc. 71.10% 10/31/25
72 79,660 Sq. Ft. First Advantage 92.98% 03/31/18
73 92,815 Sq. Ft. PNC Bank 39.02% 09/30/15
75 69,287 Sq. Ft. T-Mobile 100.00% 01/24/17
78 48,455 Sq. Ft. Healthcare Partners, LLC 100.00% 12/31/15
79 236,345 Sq. Ft. Wal-Mart Supercenter 84.21% 06/20/15
80 95,500 Sq. Ft. FBI 100.00% 09/27/26
82 125,290 Sq. Ft. ACS Commercial Solutions, Inc. 41.13% 09/15/11
83 130,316 Sq. Ft. Lowe's 100.00% 10/27/18
84 64,835 Sq. Ft. SHPS, Inc. 100.00% 07/31/16
86 75,000 Sq. Ft. Dick's Sporting Goods 100.00% 03/31/21
88 41,151 Sq. Ft. LA Fitness 64.79% 02/28/15
90 107,782 Sq. Ft. State of Tennessee Department of Health 42.43% 05/31/16
91 106,320 Sq. Ft. Atrium Crest Executive Suites 8.93% 12/31/10
92 53,110 Sq. Ft. AutoZone 16.38% 09/30/07
93 56,004 Sq. Ft. Dollar Tree 10.71% 09/30/07
94 30,868 Sq. Ft. Shooters Billiards and Sports Bar 23.61% 12/31/10
95 229,000 Sq. Ft. Big Dog Holdings 100.00% 11/15/16
99 72,112 Sq. Ft. Aspen Fitness 20.85% 09/30/20
102 96,153 Sq. Ft. Safeway 56.15% 03/12/15
103 52,328 Sq. Ft. Anytime Fitness 12.10% 12/31/11
105 35,011 Sq. Ft. Nationwide Mutual Life Insurance 72.45% 02/29/12
107 159,494 Sq. Ft. USPS 100.00% 12/31/17
108 95,739 Sq. Ft. Fla Department of Environmental Protection 38.79% 08/31/09
109 99,436 Sq. Ft. Custom Bilt Materials 19.99% 08/31/08
110 68,888 Sq. Ft. ITT Educational Services, Inc. 45.83% 01/22/13
111 24,650 Sq. Ft. Steven Poulos 9.13% MTM
112 144,889 Sq. Ft. Precise Transportation 48.93% 12/31/11
113 24,503 Sq. Ft. Tulies Family Restaurant & Sports Lounge 21.16% 09/30/11
116 16,206 Sq. Ft. Guardian 52.03% 09/30/11
117 18,275 Sq. Ft. Accelerated Rehab 17.43% 03/31/12
119 26,783 Sq. Ft. Stafford County 42.47% Multiple Spaces
120 21,578 Sq. Ft. Pier 1 Imports 41.70% 03/31/12
122 14,820 Sq. Ft. Walgreens 100.00% 01/30/31
123 20,700 Sq. Ft. La Bella Winnetka 18.84% MTM
124 20,475 Sq. Ft. Neapolitan, LLC 29.30% 08/31/16
127 16,827 Sq. Ft. Staples 100.00% 11/27/18
128 24,000 Sq. Ft. Liberty Mutual 100.00% 09/30/12
131 14,990 Sq. Ft. Blockbuster 33.36% 04/30/16
132 13,813 Sq. Ft. CVS 100.00% 10/01/23
133 24,621 Sq. Ft. Ramona Adult Daycare 21.75% 07/31/08
135 30,000 Sq. Ft. State of Nevada 90.00% Multiple Spaces
136 7,200 Sq. Ft. Cingular 27.78% 10/11/11
137 12,900 Sq. Ft. Quizno 19.38% 05/31/07
138 24,341 Sq. Ft. Dollar General 100.00% 05/31/20
139 12,915 Sq. Ft. Walgreens 100.00% 02/28/54
140 10,548 Sq. Ft. Counsel on Alcoholism & Drug Abuse 100.00% Multiple Spaces
141 24,748 Sq. Ft. Family Dollar Various Various
141.01 15,568 Sq. Ft. Family Dollar 51.39% 12/31/14
141.02 9,180 Sq. Ft. Family Dollar 100.00% 06/30/15
142 7,000 Sq. Ft. Advance Auto 100.00% 12/31/20
2ND 2ND
MORTGAGE LOAN LARGEST TENANT LARGEST TENANT
NUMBER 2ND LARGEST TENANT NAME % OF NRA EXP. DATE
- --------------------------------------------------------------------------------------------------------------------------
1 Various Various Various
1.01
1.02
1.03 Genco I, Inc. 43.42% 07/31/11
1.04 The Bombay Company, Inc. 49.96% 12/13/13
1.05 National Distribution Centers 22.22% 12/31/10
1.06
1.07
1.08 NSK Corporation 28.27% 11/30/10
1.09
1.10
1.11
1.12
1.13
1.14
1.15
1.16 Konica Minolta Bus. Solutions 22.04% 01/31/10
1.17
1.18
1.19 Fleet Services Corporation 21.36% 01/31/08
1.20 GE Supply Logistics, LLC 26.77% 08/31/09
1.21
1.22 Walman Optical Co. 25.73% 01/31/08
1.23
1.24 ADT Security Services, Inc. 33.02% 12/31/08
1.25 Southern Automatic Machinery 15.93% 08/31/11
1.26 Triad Construction Co., Inc. 9.16% 06/30/08
1.27
2 Various Various Various
2.01 Marshalls 17.65% 01/31/09
2.02 Peebles 16.11% 01/31/09
2.03 Minado 13.38% 05/31/12
2.04 Price Chopper 25.83% 05/31/14
2.05 T.J. Maxx 16.57% 10/31/10
2.06 Staples 13.48% 07/31/09
2.07 T.J. Maxx 17.69% 01/31/08
2.08 Bi-Lo 19.52% 11/08/08
2.09 T.J. Maxx 26.47% 10/31/08
2.10 Pathmark Stores 19.36% 02/28/11
2.11 Home Depot 28.88% 01/31/27
2.12 Giant Food 15.50% 10/31/23
2.13 The Vitamin Shoppe 33.33% 02/29/12
2.14 Dollar Tree 15.05% 11/10/12
2.15 DSW Designer Shoe Warehouse 10.33% 02/28/09
2.16 Harris-Teeter/Michaels/Ross 14.47% 10/31/17
3 Barnes & Noble 4.43% 01/31/12
4 Various Various Various
4.01 Hollywood Video 12.24% 12/15/07
4.02 Bed Bath & Beyond 28.87% 01/31/18
4.03 Tinsletown 12.66% 06/30/18
4.04 Key Foods 32.34% 04/30/09
4.05 Fashion Bug 10.24% 01/31/07
4.06 Clearview Cinema Group 21.53% 11/17/15
4.07 Petsmart 18.11% 01/31/14
4.08 Eckerd Drugs 14.96% 01/31/16
4.09 Washington Mutual Bank 4.45% 12/12/14
4.10 Ace Hardware & Variety 10.07% 12/31/06
4.11 T.J. Maxx 15.23% 01/31/12
4.12 Staples 12.40% 05/31/10
4.13 Office Depot 16.25% 04/30/12
5 H&M 3.62% 01/31/15
7 Winstead Sechrest 11.59% 12/31/12
8
10 Prudential Master Lease 7.01% 10/31/11
11 Sears 13.69% 10/31/08
14 Cisneros Group 14.66% 12/31/16
17 Various Various Various
17.01 Travelers Bank & Trust 16.53% 07/31/07
17.02 Greenhorn & O'Mara, Inc. 12.87% 03/31/07
17.03 Ocmulgee Medical Pathology 9.75% 03/31/11
17.04 Carrier Corporation 13.03% 04/30/10
17.05 Varian Medical Systems, Inc. 28.92% 02/28/10
17.06 Thyssenkrupp Elevator 23.42% 12/31/07
18 Abaxis Inc. 28.27% 12/31/10
19 City of Chula Vista 13.34% 04/06/09
21 Circuit City 25.22% 01/31/18
23 Bed Bath & Beyond 14.89% 01/31/13
24 United Healthcare Services, Inc. 20.78% 03/31/09
25 Ross 14.27% 01/01/16
26 The Feld Group 19.40% 02/29/08
30 Thomson Financial, Inc. 7.87% 01/31/09
32 Creative Leather Furniture 18.24% 09/30/18
34 Dollar Tree 6.64% 01/31/10
35 Silvester Taufero Design 7.74% 06/30/09
36 Christiana Care Health Service 20.90% Multiple Spaces
37 Kelson Physician Partners of SE Florida 8.27% 07/17/11
38
42 Cost Plus, Inc. 26.84% 09/30/13
43 Standard Pacific of Texas, LP 13.63% 04/30/10
44 Best Buy Stores, LP 27.23% 01/31/16
45 Compass Bank 29.76% 01/31/10
46 Home Banc Mortgage Corp. 15.81% 09/30/09
47 Albertson's 8.45% 01/31/09
50
51 Luzenac America, Inc. 17.04% 08/31/13
53 Family Music Center & School 15.52% 04/04/09
55 Pier 1 Imports 9.14% 12/31/09
56 Global Imaging Systems 17.70% 12/31/08
57 Countrywide Home Loans 9.06% 01/31/11
60
62 Broadspire Services 14.77% 02/28/10
64
66 BJ's Pizza-Bennigans (Subleased from Steak and Ale of California, Inc.) 16.89% 07/01/08
68 Sofa Express 25.32% 10/31/20
70 Various Various Various
70.01 Image First Prof. Apparel 18.52% 02/28/07
70.02 Avalon 38.06% Multiple Spaces
70.03 Mike's Famous Harley Davidson 26.77% 06/30/08
71 Bed Bath & Beyond 18.41% 04/30/16
72 Byrd Corporation 7.02% 04/01/11
73 Woodward, Hobson & Fulton 20.71% 12/31/13
75
78
79 Fashion Bug 3.89% 01/31/11
80
82 Hartford Fire Insurance Company 20.88% 04/30/10
83
84
86
88 Hollywood Entertainment 12.01% 07/31/10
90 New Horizons Computer Learning Center 18.07% 02/28/09
91 Houston Community Management Services Expansion 8.72% 12/31/07
92 Family Dollar Stores 14.12% 12/31/09
93 Cato 7.43% 01/31/08
94 LA Boxing 11.34% 05/31/11
95
99 Arlington Medical / Neighborhood Doctor 10.64% 05/31/07
102 Adams County - DMV 5.89% Multiple Spaces
103 Treads Bicycle Outfitters 10.44% 11/30/16
105 Myodoc, Inc. 27.55% 01/31/16
107
108 Viterra Energy Services, Inc 20.44% 12/01/09
109 Epic Custom Kitchens 14.39% 02/29/08
110 Coldwell Banker Residential 16.43% 07/31/08
111 Marjorie Kujawinski 5.88% MTM
112 McCollisters 32.09% Multiple Spaces
113 Water & Ice 11.18% 09/30/11
116 Scituate Federal 18.51% 07/30/16
117 US Cellular 12.91% 07/31/10
119 AT&T 16.80% 07/31/11
120 Blockbuster 30.72% 02/28/10
122
123 B&G Cuisine, LLC 12.08% MTM
124 Winnetka Food, Inc. 21.98% 04/30/11
127
128
131 Mattress Warehouse 23.35% 02/28/11
132
133 Fiesta Del Mariachi Grill 14.87% 12/31/09
135
136 Electronics Boutique 22.22% 10/01/11
137 Adams School 8.53% 04/30/07
138
139
140
141 Various Various Various
141.01 OST Cleaners 9.64% 10/20/10
141.02
142
3RD 3RD
MORTGAGE LOAN LARGEST TENANT LARGEST TENANT MORTGAGE LOAN
NUMBER 3RD LARGEST TENANT NAME % OF NRA EXP. DATE NUMBER
- -----------------------------------------------------------------------------------------------------------------
1 Various Various Various 1
1.01 1.01
1.02 1.02
1.03 1.03
1.04 1.04
1.05 Gander Mountain Company 18.50% 02/28/07 1.05
1.06 1.06
1.07 1.07
1.08 Global Transport Logistics Inc. 17.92% 01/31/13 1.08
1.09 1.09
1.10 1.1
1.11 1.11
1.12 1.12
1.13 1.13
1.14 1.14
1.15 1.15
1.16 Cirronet Inc. 18.87% 02/28/11 1.16
1.17 1.17
1.18 1.18
1.19 C.H. Robinson Company 17.77% 05/19/09 1.19
1.20 Sanyo Denki America, Inc. 26.47% 11/30/09 1.2
1.21 1.21
1.22 American Standard Inc. 12.99% 09/30/11 1.22
1.23 1.23
1.24 Nat'l Credit System, Inc. 17.86% 06/30/08 1.24
1.25 SIPA North America, Inc. 15.84% 03/31/12 1.25
1.26 Wiggins Scale Company 9.16% 08/15/10 1.26
1.27 1.27
2 Various Various Various 2
2.01 Eckerd Drugs 10.28% 01/31/16 2.01
2.02 Ross Dress For Less 10.86% 01/31/16 2.02
2.03 Eastern Mountain Sports 10.14% 10/31/09 2.03
2.04 T.J. Maxx 11.46% 01/31/11 2.04
2.05 Barnes & Noble 11.56% 02/01/14 2.05
2.06 Fashion Bug 10.10% 01/28/11 2.06
2.07 Ben Franklin 10.07% 09/30/07 2.07
2.08 Goody's Family Clothing 15.13% 12/31/09 2.08
2.09 Rentway 3.64% 08/31/11 2.09
2.10 T.J. Maxx 14.84% 01/31/09 2.1
2.11 Borders 7.27% 01/31/27 2.11
2.12 Marshalls Mega 14.28% 10/31/09 2.12
2.13 Omni Fitness 16.67% 03/31/12 2.13
2.14 Walgreens 9.63% 08/31/11 2.14
2.15 Ulta 3 6.09% 04/30/10 2.15
2.16 Dick's Sporting Goods 11.06% 01/31/16 2.16
3 Tuesday Morning 2.73% 01/15/07 3
4 Various Various Various 4
4.01 Auto Barn 12.15% 11/30/08 4.01
4.02 A.C.Moore Arts & Crafts 20.73% 02/29/12 4.02
4.03 Food Lion 11.45% 07/29/17 4.03
4.04 The Bank of New York 5.63% 12/31/09 4.04
4.05 Bank of America 6.40% 12/31/15 4.05
4.06 Michaels 14.05% 01/31/09 4.06
4.07 Office Max 16.35% 07/31/13 4.07
4.08 Paradiso Restaurant & Pizza 8.38% 06/30/13 4.08
4.09 Strathmore Bagels 4.14% 08/31/07 4.09
4.10 The Bank of New York 4.65% 12/31/11 4.1
4.11 Staples 13.05% 02/26/17 4.11
4.12 Michaels 8.82% 02/28/11 4.12
4.13 Barnes & Noble 11.31% 07/31/12 4.13
5 Abercrombie & Fitch 3.13% Multiple Spaces 5
7 Southwest Securities 9.57% Multiple Spaces 7
8 8
10 GAP 5.88% 11/30/10 10
11 Miracle Mart 8.89% 12/31/08 11
14 PSEG Global USA, Inc. 12.92% 07/13/12 14
17 Various Various Various 17
17.01 Pomeroy IT Solutions Sale 5.05% 09/30/08 17.01
17.02 Brinks Home Security, Inc. 6.81% 07/31/08 17.02
17.03 Ecolab, Inc. 7.16% 05/31/10 17.03
17.04 Cinema Screen Media, Inc. 11.61% 12/31/06 17.04
17.05 Nalley Lexus 12.07% 10/31/09 17.05
17.06 HTH Building Services, Inc 7.58% 04/30/11 17.06
18 Telogy, Inc. 27.62% 04/30/11 18
19 Prudential 12.44% 04/08/16 19
21 Barnes & Noble 18.53% 03/31/17 21
23 Stein Mart, Inc. 13.85% 09/30/12 23
24 Phillips Electronics North America Corporation 11.79% 08/31/08 24
25 Master Lease 11.98% 04/09/08 25
26 EDS 7.38% MTM 26
30 HIGH TOWER, INC. 4.13% 09/30/16 30
32 Sedona Patio Furnishings 16.97% 01/31/17 32
34 Hollywood Video 5.15% 12/20/09 34
35 SoNo Corporate Suites 7.60% 08/31/10 35
36 Wesley College 19.90% 08/31/10 36
37 Revier Real Estate Corporation 6.31% 04/02/13 37
38 38
42 Starbucks 24.23% 10/31/08 42
43 Austin Consolidated Holdings 10.44% 10/01/10 43
44 La Parillia 4.90% 11/30/15 44
45 TSYS Acquiring Solutions 24.97% 02/28/08 45
46 Proudfoot Consulting Group 13.51% 09/30/11 46
47 Angel's Clothing 5.87% 10/31/11 47
50 50
51 Tetrad/Gore 11.46% 05/31/11 51
53 Dollar Tree 11.40% 12/31/11 53
55 Luxothca Retail Center 5.60% 07/31/09 55
56 Cemex, Inc. 15.78% 04/30/14 56
57 Arroyo Insurance Services, Inc. 8.00% 04/30/10 57
60 60
62 Fidelity National Title 7.85% 02/28/08 62
64 64
66 American Premier Bank 12.49% 06/30/11 66
68 DBSI Housing, Inc 11.76% 11/30/08 68
70 Various Various Various 70
70.01 70.01
70.02 70.02
70.03 AAA Mid-Atlantic 24.25% 09/30/12 70.03
71 Men's Warehouse 3.04% 05/31/16 71
72 72
73 Baker, Kriz, Jenkins and Prewitt 6.91% 12/31/09 73
75 75
78 78
79 Famous Footwear 2.54% 07/31/07 79
80 80
82 Flake-Wilkerson Market Insights 10.56% 02/28/11 82
83 83
84 84
86 86
88 Sovereign Bank 11.18% 04/30/14 88
90 Dual Diagnosis Management 13.87% 04/30/09 90
91 Innovative Alternatives, Inc. 4.31% 04/30/09 91
92 Blockbuster, Inc. 12.05% 03/31/09 92
93 Blockbuster Video 7.14% 10/31/13 93
94 Doctor's Office 9.72% 07/31/11 94
95 95
99 Rack Dady 9.88% 08/31/11 99
102 Panda Buffett 5.68% Multiple Spaces 102
103 Keller Brothers Automotive, Inc. 9.17% 12/31/11 103
105 105
107 107
108 GSA - Small Business 10.94% 10/01/12 108
109 Multimedia Fabrications, Inc. 13.54% 03/31/09 109
110 Corvel Corporation 8.28% 01/31/08 110
111 North Shore Optical 5.68% MTM 111
112 Universal Map, Inc. 20.71% 03/31/11 112
113 Meridian Cleaners 10.41% 09/30/11 113
116 Verge Jewelry 11.34% 08/31/16 116
117 7-Eleven 12.02% 10/31/15 117
119 Solution Focused 8.40% 10/31/11 119
120 Sherwin Williams 27.58% 11/30/10 120
122 122
123 The Corner Cooks, INC 8.70% MTM 123
124 The Chocolate Box 3.91% 05/31/09 124
127 127
128 128
131 Best Cuts 10.01% 12/31/10 131
132 132
133 Ace Launderland 7.90% 11/30/11 133
135 135
136 Great Clips 16.67% 10/01/11 136
137 Kiesler, Mitch/Nilsson 7.17% 03/31/07 137
138 138
139 139
140 140
141 Various Various Various 141
141.01 MD Hair Salon 7.71% 10/15/10 141.01
141.02 141.02
142 142
WACHOVIA BANK COMMERCIAL MORTGAGE TRUST SERIES 2006-C29
ANNEX A-5
CERTAIN CHARACTERISTICS OF THE MORTGAGE LOANS AND MORTGAGED PROPERTIES (CROSSED
& PORTFOLIOS)
Mortgage Loan
Loan Group
Number Number Property Name City State
- --------------------------------------------------------------------------------------------------
1 1 Duke Realty Industrial Pool Various Various
1.01 400 South Enterprise Boulevard Lebanon IN
1.02 2425 East Hadley Road Plainfield IN
1.03 250 Declaration Drive McDonough GA
1.04 2209-2233 Stafford Road Plainfield IN
1.05 500-520 South Enterprise Boulevard Lebanon IN
1.06 163 Portside Court Savannah GA
1.07 3201 Centre Parkway East Point GA
1.08 1581 South Perry Road Plainfield IN
1.09 1551 South Perry Road Plainfield IN
1.10 185 North Mount Zion Road Lebanon IN
1.11 1390 South Perry Road Plainfield IN
1.12 322 South Enterprise Boulevard Lebanon IN
1.13 4200 North Commerce Drive East Point GA
1.14 6655 Sugarloaf Parkway Duluth GA
1.15 420 East Enterprise Boulevard Lebanon IN
1.16 3079 Premiere Parkway Duluth GA
1.17 175 Alcovy Industrial Boulevard Dacula GA
1.18 2850 Premiere Parkway Duluth GA
1.19 3800 Centre Parkway - Building 1400 Atlanta GA
1.20 2855 Premiere Parkway Duluth GA
1.21 3900 North Commerce Drive Atlanta GA
1.22 2775 Premiere Parkway Duluth GA
1.23 198 Gulfstream Road Savannah GA
1.24 3800 Centre Parkway - Building 1800 Atlanta GA
1.25 3800 Centre Parkway - Building 2400 Atlanta GA
1.26 3800 Centre Parkway - Building 2600 Atlanta GA
1.27 3800 Centre Parkway - Building 2000 Atlanta GA
2 1 Centro Syndicate 2 Pool Various Various
- -----------------------------------------------------------------------------------------------------
2.01 College Plaza Selden NY
2.02 Oakwood Commons Hermitage TN
2.03 Parkway Plaza Carle Place NY
2.04 Rutland Plaza Rutland VT
2.05 Spradlin Farm Retail Center Christiansburg VA
2.06 Torrington Plaza Torrington CT
2.07 Tri-City Plaza Somersworth NH
2.08 Watson Glen Franklin TN
2.09 Westgate Plaza Westfield MA
2.10 Dalewood Shopping Center Hartsdale NY
2.11 Grand Traverse Crossing Traverse City MI
2.12 Lehigh Shopping Center Bethlehem PA
2.13 Northern Hills South Windsor CT
2.14 Southport Centre I-VI Apple Valley MN
2.15 Trinity Commons Fort Worth TX
2.16 Wendover Place Greensboro NC
4 1 Centro International Wholesale Pool Various Various
- -----------------------------------------------------------------------------------------------------
4.01 Falcaro's Plaza Lawrence NY
4.02 Hale Road Manchester CT
4.03 Innes Street Market Salisbury NC
4.04 Kings Park Shopping Center Kings Park NY
4.05 Lynn Marketplace Lynn MA
4.06 Morris Hills Shopping Center Parsippany NJ
4.07 New Centre Market Wilmington NC
4.08 Rockville Centre Rockville Centre NY
4.09 Suffolk Plaza East Setauket NY
4.10 Three Village Shopping Center East Setauket NY
4.11 Venetian Isles Lighthouse Point FL
4.12 Berkshire Crossing Pittsfield MA
4.13 County Line Plaza Jackson MS
Various 1 Las Colinas Portfolio Irving TX
- -----------------------------------------------------------------------------------------------------
26 1 Las Colinas Corporate Center II Irving TX
43 1 Las Colinas Corporate Center I Irving TX
Various 1 Arcadia Gateway Center Portfolio Arcadia CA
- -----------------------------------------------------------------------------------------------------
57 1 Arcadia Gateway Center - Office Arcadia CA
66 1 Arcadia Gateway Center - Retail Arcadia CA
78 1 Arcadia Gateway Center - Medical Office Arcadia CA
17 1 New Market Pool(1) Marietta GA
- -----------------------------------------------------------------------------------------------------
17.01 New Market 2161 Marietta GA
17.02 New Market 2211 Marietta GA
17.03 New Market 2221 Marietta GA
17.04 New Market 2121 Marietta GA
17.05 New Market 2250 Marietta GA
17.06 New Market 2110 Marietta GA
65 1 Attic Self Storage Pool Various Various
- -----------------------------------------------------------------------------------------------------
65.01 Attic Storage of Olathe Olathe KS
65.02 Attic Storage of Belton Belton MO
65.03 Attic Storage of Platte City Platte City MO
65.04 Attic Storage of Kansas City Kansas City KS
65.05 Attic Storage of Knobtown Kansas City MO
65.06 407Attic Storage of Needmore Olathe KS
70 1 Riveredge Pool New Castle DE
- -----------------------------------------------------------------------------------------------------
70.01 Riveredge II New Castle DE
70.02 Riveredge III New Castle DE
70.03 Riveredge IV New Castle DE
Various 2 Autumnwood/Hinton Hollow/Southern Woods Portfolio Knoxville TN
- -----------------------------------------------------------------------------------------------------
115 2 Hinton Hollow Apartments Knoxville TN
126 2 Autumn Woods Apartments Knoxville TN
134 2 Southern Woods Apartments Knoxville TN
130 1 Care Free Mini Storage Pool Rochester MN
- -----------------------------------------------------------------------------------------------------
130.01 Care Free Mini Storage North Rochester MN
130.02 Care Free Mini Storage South Rochester MN
141 1 Family Dollar Pool Houston TX
- -----------------------------------------------------------------------------------------------------
141.01 Catalina Springs Shopping Center Houston TX
141.02 Family Dollar - Houston, TX Houston TX
Original
Mortgage % of Aggregate Term to
Loan Original Loan Cut-Off Date Cut-Off Date Maturity or
Number Cross Collateralized and Cross Defaulted Loan Flag Balance ($) Loan Balance ($) Balance ARD (Mos.)
- --------------------------------------------------------------------------------------------------------------------------------
1 318,976,000.00 318,976,000.00 9.46% 120
1.01 25,840,000.00
1.02 22,960,000.00
1.03 20,800,000.00
1.04 20,080,000.00
1.05 19,360,000.00
1.06 18,696,000.00
1.07 18,600,000.00
1.08 17,760,000.00
1.09 16,080,000.00
1.10 15,120,000.00
1.11 14,160,000.00
1.12 12,800,000.00
1.13 10,400,000.00
1.14 9,740,000.00
1.15 9,120,000.00
1.16 9,000,000.00
1.17 8,520,000.00
1.18 7,680,000.00
1.19 6,240,000.00
1.20 6,100,000.00
1.21 5,720,000.00
1.22 5,240,000.00
1.23 4,280,000.00
1.24 4,240,000.00
1.25 3,520,000.00
1.26 3,520,000.00
1.27 3,400,000.00
2 233,977,430.00 233,977,430.00 6.94% 120
- --------------------------------------------------------------------------------------------------------------------------------
2.01 10,932,308.44
2.02 14,316,118.20
2.03 14,055,825.14
2.04 14,003,766.53
2.05 16,919,048.78
2.06 8,902,022.59
2.07 7,652,615.91
2.08 12,103,627.21
2.09 5,674,388.67
2.10 31,755,753.10
2.11 17,960,221.01
2.12 15,981,993.77
2.13 2,811,165.03
2.14 13,014,652.91
2.15 15,617,583.49
2.16 32,276,339.21
4 161,039,673.00 161,039,673.00 4.78% 84
- --------------------------------------------------------------------------------------------------------------------------------
4.01 7,577,082.03
4.02 10,671,946.52
4.03 24,011,879.67
4.04 7,683,801.50
4.05 5,229,253.80
4.06 17,341,913.10
4.07 11,899,220.37
4.08 5,335,973.26
4.09 6,509,887.38
4.10 10,405,147.86
4.11 13,873,530.48
4.12 19,156,144.00
4.13 21,343,893.04
Various Las Colinas Portfolio 42,525,000.00 42,525,000.00 1.26% 120
- --------------------------------------------------------------------------------------------------------------------------------
26 Las Colinas Portfolio 25,025,000.00 25,025,000.00 0.74% 120
43 Las Colinas Portfolio 17,500,000.00 17,500,000.00 0.52% 120
Various Arcadia Gateway Center Portfolio 38,000,000.00 38,000,000.00 1.13% 120
- --------------------------------------------------------------------------------------------------------------------------------
57 Arcadia Gateway Center Portfolio 14,880,000.00 14,880,000.00 0.44% 120
66 Arcadia Gateway Center Portfolio 12,820,000.00 12,820,000.00 0.38% 120
78 Arcadia Gateway Center Portfolio 10,300,000.00 10,300,000.00 0.31% 120
17 37,000,000.00 37,000,000.00 1.10% 120
- --------------------------------------------------------------------------------------------------------------------------------
17.01 9,860,000.00
17.02 9,150,000.00
17.03 5,770,000.00
17.04 4,800,000.00
17.05 4,190,000.00
17.06 3,230,000.00
65 13,000,000.00 13,000,000.00 0.39% 120
- --------------------------------------------------------------------------------------------------------------------------------
65.01 3,563,000.00
65.02 2,312,000.00
65.03 2,160,000.00
65.04 2,085,000.00
65.05 1,781,000.00
65.06 1,099,000.00
70 12,160,000.00 12,160,000.00 0.36% 120
- --------------------------------------------------------------------------------------------------------------------------------
70.01 6,000,000.00
70.02 3,120,000.00
70.03 3,040,000.00
Various Autumnwood/Hinton Hollow/Southern Woods Portfolio 10,520,000.00 10,520,000.00 0.31% 120
- --------------------------------------------------------------------------------------------------------------------------------
115 Autumnwood/Hinton Hollow/Southern Woods Portfolio 4,840,000.00 4,840,000.00 0.14% 120
126 Autumnwood/Hinton Hollow/Southern Woods Portfolio 3,220,000.00 3,220,000.00 0.10% 120
134 Autumnwood/Hinton Hollow/Southern Woods Portfolio 2,460,000.00 2,460,000.00 0.07% 120
130 2,900,000.00 2,900,000.00 0.09% 120
- --------------------------------------------------------------------------------------------------------------------------------
130.01
130.02
141 1,500,000.00 1,500,000.00 0.04% 120
- --------------------------------------------------------------------------------------------------------------------------------
141.01 1,032,258.00
141.02 467,742.00
Remaining Maturity
Mortgage Term to Original Remaining Date or
Loan Maturity or Remaining IO Amort Amort Monthly P&I ARD Balloon Appraised
Number ARD (Mos.) Period (Mos.) Term (Mos.) Term (Mos.) Payments ($) Balance ($) Value ($) DSCR (x)
- ------------------------------------------------------------------------------------------------------------------------------
1 119 119 IO IO IO 318,976,000.00 398,720,000.00 1.39
1.01 32,300,000.00
1.02 28,700,000.00
1.03 26,000,000.00
1.04 25,100,000.00
1.05 24,200,000.00
1.06 23,370,000.00
1.07 23,250,000.00
1.08 22,200,000.00
1.09 20,100,000.00
1.10 18,900,000.00
1.11 17,700,000.00
1.12 16,000,000.00
1.13 13,000,000.00
1.14 12,175,000.00
1.15 11,400,000.00
1.16 11,250,000.00
1.17 10,650,000.00
1.18 9,600,000.00
1.19 7,800,000.00
1.20 7,625,000.00
1.21 7,150,000.00
1.22 6,550,000.00
1.23 5,350,000.00
1.24 5,300,000.00
1.25 4,400,000.00
1.26 4,400,000.00
1.27 4,250,000.00
2 120 120 IO IO IO 233,977,430.00 449,450,000.00 2.39
- ------------------------------------------------------------------------------------------------------------------------------
2.01 21,000,000.00
2.02 27,500,000.00
2.03 27,000,000.00
2.04 26,900,000.00
2.05 32,500,000.00
2.06 17,100,000.00
2.07 14,700,000.00
2.08 23,250,000.00
2.09 10,900,000.00
2.10 61,000,000.00
2.11 34,500,000.00
2.12 30,700,000.00
2.13 5,400,000.00
2.14 25,000,000.00
2.15 30,000,000.00
2.16 62,000,000.00
4 84 84 IO IO IO 161,039,673.00 301,800,000.00 2.31
- ------------------------------------------------------------------------------------------------------------------------------
4.01 14,200,000.00
4.02 20,000,000.00
4.03 45,000,000.00
4.04 14,400,000.00
4.05 9,800,000.00
4.06 32,500,000.00
4.07 22,300,000.00
4.08 10,000,000.00
4.09 12,200,000.00
4.10 19,500,000.00
4.11 26,000,000.00
4.12 35,900,000.00
4.13 40,000,000.00
Various 118 118 IO IO IO 42,525,000.00 61,500,000.00 1.62
- ------------------------------------------------------------------------------------------------------------------------------
26 118 118 IO IO IO 25,025,000.00 36,500,000.00 1.68
43 118 118 IO IO IO 17,500,000.00 25,000,000.00 1.53
Various 119 119 IO IO IO 38,000,000.00 49,300,000.00 1.21
- ------------------------------------------------------------------------------------------------------------------------------
57 119 119 IO IO IO 14,880,000.00 18,600,000.00 1.20
66 119 119 IO IO IO 12,820,000.00 17,500,000.00 1.20
78 119 119 IO IO IO 10,300,000.00 13,200,000.00 1.24
17 119 59 360 360 224,696.28 34,671,985.41 47,210,000.00 1.25
- ------------------------------------------------------------------------------------------------------------------------------
17.01 11,600,000.00
17.02 11,000,000.00
17.03 6,790,000.00
17.04 7,950,000.00
17.05 6,070,000.00
17.06 3,800,000.00
65 119 119 IO IO IO 13,000,000.00 17,150,000.00 1.35
- ------------------------------------------------------------------------------------------------------------------------------
65.01 4,700,000.00
65.02 3,050,000.00
65.03 2,850,000.00
65.04 2,750,000.00
65.05 2,350,000.00
65.06 1,450,000.00
70 119 35 360 360 69,884.70 10,903,420.28 15,200,000.00 1.37
- ------------------------------------------------------------------------------------------------------------------------------
70.01 7,500,000.00
70.02 3,900,000.00
70.03 3,800,000.00
Various 118 118 IO IO IO 10,520,000.00 13,150,000.00 1.36
- ------------------------------------------------------------------------------------------------------------------------------
115 118 118 IO IO IO 4,840,000.00 6,050,000.00 1.36
126 118 118 IO IO IO 3,220,000.00 4,025,000.00 1.33
134 118 118 IO IO IO 2,460,000.00 3,075,000.00 1.38
130 120 360 360 17,331.07 2,457,463.75 3,830,000.00 1.29
- ------------------------------------------------------------------------------------------------------------------------------
130.01 1,940,000.00
130.02 1,890,000.00
141 120 360 360 9,031.87 1,273,724.87 2,700,000.00 1.44
- ------------------------------------------------------------------------------------------------------------------------------
141.01 1,830,000.00
141.02 870,000.00
Cut-Off
Mortgage Cut-off LTV Ratio Date Loan UW Mortgage
Loan Date LTV at Maturity Number of Unit of Amount Per Net Cash Loan
Number Ratio or ARD Units (Units) Measure (Unit) ($) Flow ($) Number
- ---------------------------------------------------------------------------------------------------
1 80.00% 80.00% 8,324,477 Sq. Ft. 38.32 26,216,317.63 1
1.01 842,000 Sq. Ft. 2,051,441.42 1.01
1.02 650,760 Sq. Ft. 1,656,176.68 1.02
1.03 759,300 Sq. Ft. 1,723,442.22 1.03
1.04 600,576 Sq. Ft. 1,538,415.92 1.04
1.05 689,009 Sq. Ft. 1,612,340.19 1.05
1.06 200,000 Sq. Ft. 1,467,658.70 1.06
1.07 607,650 Sq. Ft. 1,291,432.31 1.07
1.08 481,874 Sq. Ft. 1,903,019.55 1.08
1.09 450,000 Sq. Ft. 1,362,884.13 1.09
1.10 418,400 Sq. Ft. 1,269,124.26 1.10
1.11 426,326 Sq. Ft. 878,269.16 1.11
1.12 395,679 Sq. Ft. 1,087,881.51 1.12
1.13 301,200 Sq. Ft. 709,165.62 1.13
1.14 250,000 Sq. Ft. 834,615.50 1.14
1.15 250,000 Sq. Ft. 856,023.26 1.15
1.16 101,600 Sq. Ft. 812,292.96 1.16
1.17 108,400 Sq. Ft. 675,062.68 1.17
1.18 86,000 Sq. Ft. 746,548.89 1.18
1.19 60,177 Sq. Ft. 573,122.93 1.19
1.20 89,636 Sq. Ft. 603,495.93 1.20
1.21 129,842 Sq. Ft. 410,909.86 1.21
1.22 79,110 Sq. Ft. 505,405.24 1.22
1.23 150,000 Sq. Ft. 361,358.82 1.23
1.24 44,306 Sq. Ft. 406,216.21 1.24
1.25 61,318 Sq. Ft. 299,182.24 1.25
1.26 57,168 Sq. Ft. 331,368.28 1.26
1.27 34,146 Sq. Ft. 249,463.16 1.27
2 52.06% 52.06% 3,281,027 Sq. Ft. 71.31 30,439,033.51 2
- ---------------------------------------------------------------------------------------------------
2.01 175,086 Sq. Ft. 1,291,918.37 2.01
2.02 278,017 Sq. Ft. 1,880,893.32 2.02
2.03 89,704 Sq. Ft. 1,737,500.03 2.03
2.04 224,514 Sq. Ft. 1,817,241.59 2.04
2.05 181,055 Sq. Ft. 2,145,996.26 2.05
2.06 125,710 Sq. Ft. 1,357,556.27 2.06
2.07 146,947 Sq. Ft. 982,348.80 2.07
2.08 264,360 Sq. Ft. 1,679,661.20 2.08
2.09 103,903 Sq. Ft. 826,534.43 2.09
2.10 191,085 Sq. Ft. 3,897,460.38 2.10
2.11 387,273 Sq. Ft. 2,389,238.55 2.11
2.12 372,243 Sq. Ft. 2,185,355.92 2.12
2.13 12,000 Sq. Ft. 377,176.63 2.13
2.14 124,937 Sq. Ft. 1,734,765.95 2.14
2.15 197,424 Sq. Ft. 2,175,688.86 2.15
2.16 406,769 Sq. Ft. 3,959,696.95 2.16
4 53.36% 53.36% 1,777,884 Sq. Ft. 90.58 20,202,659.02 4
- ---------------------------------------------------------------------------------------------------
4.01 61,295 Sq. Ft. 887,977.62 4.01
4.02 103,931 Sq. Ft. 1,322,128.70 4.02
4.03 349,433 Sq. Ft. 3,090,190.34 4.03
4.04 71,940 Sq. Ft. 933,893.79 4.04
4.05 78,092 Sq. Ft. 612,429.16 4.05
4.06 159,454 Sq. Ft. 2,374,402.12 4.06
4.07 143,763 Sq. Ft. 1,472,830.21 4.07
4.08 44,131 Sq. Ft. 615,661.55 4.08
4.09 84,480 Sq. Ft. 731,607.96 4.09
4.10 77,458 Sq. Ft. 1,220,395.22 4.10
4.11 183,867 Sq. Ft. 1,733,984.59 4.11
4.12 198,473 Sq. Ft. 2,536,212.79 4.12
4.13 221,567 Sq. Ft. 2,670,944.97 4.13
Various 69.15% 69.15% 386,116.00 Sq. Ft. 110.14 3,918,632.00 Various
- ---------------------------------------------------------------------------------------------------
26 68.56% 68.56% 226,904 Sq. Ft. 110.29 2,394,499.00 26
43 70.00% 70.00% 159,212 Sq. Ft. 109.92 1,524,133.00 43
Various 77.08% 77.08% 156,739 Sq. Ft. 242.44 2,787,720.92 Various
- ---------------------------------------------------------------------------------------------------
57 80.00% 80.00% 64,828 Sq. Ft. 229.53 1,080,207.87 57
66 73.26% 73.26% 43,456 Sq. Ft. 295.01 930,020.78 66
78 78.03% 78.03% 48,455 Sq. Ft. 212.57 777,492.27 78
17 78.37% 73.44% 469,667 Sq. Ft. 78.78 3,372,448.61 17
- ---------------------------------------------------------------------------------------------------
17.01 109,837 Sq. Ft. 977,337.29 17.01
17.02 108,004 Sq. Ft. 785,337.24 17.02
17.03 68,991 Sq. Ft. 516,116.86 17.03
17.04 86,006 Sq. Ft. 414,702.46 17.04
17.05 57,903 Sq. Ft. 355,382.11 17.05
17.06 38,926 Sq. Ft. 323,572.65 17.06
65 75.80% 75.80% 533,653 Sq. Ft. 24.36 1,035,059.37 65
- ---------------------------------------------------------------------------------------------------
65.01 117,725 Sq. Ft. 286,274.58 65.01
65.02 123,733 Sq. Ft. 244,389.75 65.02
65.03 73,600 Sq. Ft. 151,907.52 65.03
65.04 71,085 Sq. Ft. 127,446.58 65.04
65.05 111,010 Sq. Ft. 102,599.49 65.05
65.06 36,500 Sq. Ft. 122,441.45 65.06
70 80.00% 71.73% 244,158 Sq. Ft. 49.80 1,152,253.18 70
- ---------------------------------------------------------------------------------------------------
70.01 120,300 Sq. Ft. 618,094.70 70.01
70.02 62,000 Sq. Ft. 275,475.40 70.02
70.03 61,858 Sq. Ft. 258,683.08 70.03
Various 80.00% 80.00% 177 Units 59,435.03 858,429.84 Various
- ---------------------------------------------------------------------------------------------------
115 80.00% 80.00% 76 Units 63,684.21 397,119.04 115
126 80.00% 80.00% 60 Units 53,666.67 257,063.60 126
134 80.00% 80.00% 41 Units 60,000.00 204,247.20 134
130 75.72% 64.16% 72,213 Sq. Ft. 40.16 267,677.37 130
- ---------------------------------------------------------------------------------------------------
130.01 30,713 Sq. Ft. 142,908.98 130.01
130.02 41,500 Sq. Ft. 124,768.39 130.02
141 55.56% 47.17% 24,748 Sq. Ft. 60.61 156,312.75 141
- ---------------------------------------------------------------------------------------------------
141.01 15,568 Sq. Ft. 94,994.15 141.01
141.02 9,180 Sq. Ft. 61,318.60 141.02
(1) Mortgage Loan documents permit the related borrower to transfer Mortgaged
Properties to a buyer that will assume the allocated loan amount for each
transferred property, resulting in the termination of the
cross-collateralization and cross-default provisions with respect to the
portion of the Mortgaged Properties being assumed.
WACHOVIA BANK COMMERCIAL MORTGAGE TRUST SERIES 2006-C29
ANNEX A-6
DEBT SERVICE PAYMENT SCHEDULE FOR THE RAVENEAUX APARTMENTS LOAN
LOAN MONTHLY LOAN MONTHLY
PAY PRINCIPAL DEBT MORTGAGE PAY DEBT MORTGAGE
PERIOD ($) INTEREST ($) SERVICE ($) RATE (%) PERIOD PRINCIPAL ($) INTEREST ($) SERVICE ($) RATE (%)
- ----------------------------------------------------------------------------------------------------------------------
1 -- 102,693.02 102,693.02 5.0350% 61 -- 120,539.38 120,539.38 5.9100%
2 -- 106,116.12 106,116.12 5.0350% 62 -- 124,557.35 124,557.35 5.9100%
3 -- 102,693.02 102,693.02 5.0350% 63 -- 120,539.38 120,539.38 5.9100%
4 -- 106,116.12 106,116.12 5.0350% 64 -- 124,557.35 124,557.35 5.9100%
5 -- 106,116.12 106,116.12 5.0350% 65 -- 124,557.35 124,557.35 5.9100%
6 -- 95,846.82 95,846.82 5.0350% 66 -- 116,521.40 116,521.40 5.9100%
7 -- 106,116.12 106,116.12 5.0350% 67 -- 124,557.35 124,557.35 5.9100%
8 -- 102,693.02 102,693.02 5.0350% 68 -- 120,539.38 120,539.38 5.9100%
9 -- 106,116.12 106,116.12 5.0350% 69 -- 124,557.35 124,557.35 5.9100%
10 -- 102,693.02 102,693.02 5.0350% 70 -- 120,539.38 120,539.38 5.9100%
11 -- 106,116.12 106,116.12 5.0350% 71 -- 124,557.35 124,557.35 5.9100%
12 -- 106,116.12 106,116.12 5.0350% 72 -- 124,557.35 124,557.35 5.9100%
13 -- 107,791.98 107,791.98 5.2850% 73 -- 123,088.85 123,088.85 6.0350%
14 -- 111,385.05 111,385.05 5.2850% 74 -- 127,191.82 127,191.82 6.0350%
15 -- 107,791.98 107,791.98 5.2850% 75 -- 123,088.85 123,088.85 6.0350%
16 -- 111,385.05 111,385.05 5.2850% 76 -- 127,191.82 127,191.82 6.0350%
17 -- 111,385.05 111,385.05 5.2850% 77 -- 127,191.82 127,191.82 6.0350%
18 -- 104,198.91 104,198.91 5.2850% 78 -- 114,882.93 114,882.93 6.0350%
19 -- 111,385.05 111,385.05 5.2850% 79 -- 127,191.82 127,191.82 6.0350%
20 -- 107,791.98 107,791.98 5.2850% 80 -- 123,088.85 123,088.85 6.0350%
21 -- 111,385.05 111,385.05 5.2850% 81 -- 127,191.82 127,191.82 6.0350%
22 -- 107,791.98 107,791.98 5.2850% 82 -- 123,088.85 123,088.85 6.0350%
23 -- 111,385.05 111,385.05 5.2850% 83 -- 127,191.82 127,191.82 6.0350%
24 -- 111,385.05 111,385.05 5.2850% 84 -- 127,191.82 127,191.82 6.0350%
25 -- 110,341.46 110,341.46 5.4100% 85 23,066.55 128,187.81 151,254.36 6.2850%
26 -- 114,019.51 114,019.51 5.4100% 86 18,918.46 132,335.90 151,254.36 6.2850%
27 -- 110,341.46 110,341.46 5.4100% 87 23,286.44 127,967.92 151,254.36 6.2850%
28 -- 114,019.51 114,019.51 5.4100% 88 19,146.87 132,107.49 151,254.36 6.2850%
29 -- 114,019.51 114,019.51 5.4100% 89 19,250.50 132,003.86 151,254.36 6.2850%
30 -- 102,985.36 102,985.36 5.4100% 90 32,119.17 119,135.19 151,254.36 6.2850%
31 -- 114,019.51 114,019.51 5.4100% 91 19,528.52 131,725.84 151,254.36 6.2850%
32 -- 110,341.46 110,341.46 5.4100% 92 23,880.02 127,374.34 151,254.36 6.2850%
33 -- 114,019.51 114,019.51 5.4100% 93 19,763.45 131,490.91 151,254.36 6.2850%
34 -- 110,341.46 110,341.46 5.4100% 94 24,108.60 127,145.76 151,254.36 6.2850%
35 -- 114,019.51 114,019.51 5.4100% 95 20,000.89 131,253.47 151,254.36 6.2850%
36 -- 114,019.51 114,019.51 5.4100% 96 20,109.13 131,145.23 151,254.36 6.2850%
37 -- 112,890.94 112,890.94 5.5350% 97 24,444.95 126,809.41 151,254.36 6.2850%
38 -- 116,653.97 116,653.97 5.5350% 98 20,350.26 130,904.10 151,254.36 6.2850%
39 -- 112,890.94 112,890.94 5.5350% 99 24,679.56 126,574.80 151,254.36 6.2850%
40 -- 116,653.97 116,653.97 5.5350% 100 20,593.97 130,660.39 151,254.36 6.2850%
41 -- 116,653.97 116,653.97 5.5350% 101 20,705.42 130,548.94 151,254.36 6.2850%
42 -- 105,364.88 105,364.88 5.5350% 102 33,440.41 117,813.95 151,254.36 6.2850%
43 -- 116,653.97 116,653.97 5.5350% 103 20,998.47 130,255.89 151,254.36 6.2850%
44 -- 112,890.94 112,890.94 5.5350% 104 25,310.25 125,944.11 151,254.36 6.2850%
45 -- 116,653.97 116,653.97 5.5350% 105 21,249.09 130,005.27 151,254.36 6.2850%
46 -- 112,890.94 112,890.94 5.5350% 106 25,554.10 125,700.26 151,254.36 6.2850%
47 -- 116,653.97 116,653.97 5.5350% 107 21,502.40 129,751.96 151,254.36 6.2850%
48 -- 116,653.97 116,653.97 5.5350% 108 21,618.77 129,635.59 151,254.36 6.2850%
49 -- 117,989.90 117,989.90 5.7850% 109 25,913.79 125,340.57 151,254.36 6.2850%
50 -- 121,922.89 121,922.89 5.7850% 110 21,876.02 129,378.34 151,254.36 6.2850%
51 -- 117,989.90 117,989.90 5.7850% 111 26,164.09 125,090.27 151,254.36 6.2850%
52 -- 121,922.89 121,922.89 5.7850% 112 22,136.02 129,118.34 151,254.36 6.2850%
53 -- 121,922.89 121,922.89 5.7850% 113 22,255.82 128,998.54 151,254.36 6.2850%
54 -- 110,123.90 110,123.90 5.7850% 114 30,690.98 120,563.38 151,254.36 6.2850%
55 -- 121,922.89 121,922.89 5.7850% 115 22,542.37 128,711.99 151,254.36 6.2850%
56 -- 117,989.90 117,989.90 5.7850% 116 26,812.44 124,441.92 151,254.36 6.2850%
57 -- 121,922.89 121,922.89 5.7850% 117 22,809.48 128,444.88 151,254.36 6.2850%
58 -- 117,989.90 117,989.90 5.7850% 118 27,072.33 124,182.03 151,254.36 6.2850%
59 -- 121,922.89 121,922.89 5.7850% 119 23,079.45 128,174.91 151,254.36 6.2850%
60 -- 121,922.89 121,922.89 5.7850% 120 23,660,020.98 128,050.01 23,788,070.99 6.2850%
WACHOVIA BANK COMMERCIAL MORTGAGE TRUST SERIES 2006-C29
ANNEX B
MORTGAGED PROPERTIES BY PROPERTY TYPE FOR ALL MORTGAGE LOANS (1)
% OF WTD. AVG.
CUT-OFF AVERAGE MAXIMUM CUT-OFF
NUMBER OF AGGREGATE DATE CUT-OFF CUT-OFF DATE
MORTGAGED CUT-OFF POOL DATE DATE LTV
PROPERTY TYPE PROPERTIES DATE BALANCE BALANCE BALANCE BALANCE RATIO
- ---------------------------------------------------------------------------------------------------------
Retail 69 $1,309,545,705 38.8% $18,978,923 $205,000,000 60.0%
Retail - Anchored 43 1,047,700,938 31.1 $24,365,138 $205,000,000 56.5%
Retail - Single Tenant 10 133,061,232 3.9 $13,306,123 $100,000,000 77.9%
Retail - Unanchored 13 77,983,534 2.3 $ 5,998,733 $ 12,820,000 71.4%
Retail - Shadow Anchored(4) 3 50,800,000 1.5 $16,933,333 $ 25,600,000 68.8%
Multifamily 40 763,161,469 22.6 $19,079,037 $132,000,000 71.7%
Office 42 676,721,000 20.1 $16,112,405 $129,000,000 74.5%
Industrial 35 391,616,000 11.6 $11,189,029 $ 35,000,000 77.5%
Hospitality 6 95,600,000 2.8 $15,933,333 $ 49,000,000 70.9%
Mobile Home Park 2 74,880,000 2.2 $37,440,000 $ 56,800,000 80.0%
Mixed Use 7 43,850,000 1.3 $ 6,264,286 $ 17,500,000 66.9%
Self Storage 8 15,900,000 0.5 $ 1,987,500 $ 3,563,000 75.8%
--- -------------- -----
209 $3,371,274,173 100.0% $16,130,498 $205,000,000 68.5%
=== ============== =====
WTD. AVG.
STATED WTD. AVG. MINIMUM MAXIMUM
WTD. AVG. REMAINING CUT-OFF CUT-OFF CUT-OFF
LTV TERM TO DATE DATE DATE WTD. AVG. WTD. AVG.
RATIO AT MATURITY DSC DSC DSC OCCUPANCY MORTGAGE
PROPERTY TYPE MATURITY (2) (MOS.) (2) RATIO RATIO RATIO RATE (3) RATE
- -----------------------------------------------------------------------------------------------------------
Retail 58.9% 103 1.89x 1.04x 2.44x 94.6% 5.544%
Retail - Anchored 55.8% 98 2.05x 1.21x 2.44x 94.0% 5.469%
Retail - Single Tenant 76.3% 120 1.16x 1.04x 2.01x 100.0% 5.747%
Retail - Unanchored 67.9% 119 1.36x 1.15x 2.39x 95.3% 5.955%
Retail - Shadow Anchored(4) 63.5% 119 1.26x 1.19x 1.50x 92.9% 5.917%
Multifamily 70.0% 109 1.33x 1.17x 1.94x 95.5% 5.838%
Office 71.2% 118 1.36x 1.20x 1.75x 88.4% 5.813%
Industrial 76.7% 118 1.45x 1.22x 2.17x 96.6% 5.885%
Hospitality 58.9% 120 1.40x 1.30x 1.76x NA 6.080%
Mobile Home Park 80.0% 119 1.34x 1.33x 1.36x 94.4% 5.790%
Mixed Use 65.6% 119 1.42x 1.23x 1.71x 96.8% 5.758%
Self Storage 73.7% 119 1.34x 1.29x 1.35x 77.6% 5.921%
66.6% 110 1.57x 1.04x 2.44x 93.7% 5.729%
- ----------
(1) Because this table presents information relating to the Mortgaged
Properties and not the Mortgage Loans, the information for Mortgage Loans
secured by more than one Mortgaged Property is based on allocated amounts
(allocating the Mortgage Loan principal balance to each of those properties
by the appraised values of the Mortgaged Properties or the allocated loan
amount (or specific release prices) as detailed in the related Mortgage
Loan documents).
(2) Calculated with respect to the Anticipated Repayment Date for ARD Loans.
(3) Occupancy Rates were calculated based upon rent rolls made available to the
applicable Mortgage Loan Seller by the related borrowers as of the rent
roll date set forth on Annex A-1 to this prospectus supplement. Occupancy
Rates exclude 6 hospitality properties, representing 2.8% of the Cut-Off
Date Pool Balance.
(4) A Mortgaged Property is classified as "shadow anchored" if it is located in
close proximity to an anchored retail property.
The sum of aggregate percentage calculations may not equal 100% due to rounding.
B-1
WACHOVIA BANK COMMERCIAL MORTGAGE TRUST SERIES 2006-C29
ANNEX B
MORTGAGED PROPERTIES BY PROPERTY TYPE FOR LOAN GROUP 1 MORTGAGE LOANS (1)
% OF WTD. AVG.
CUT-OFF AVERAGE MAXIMUM CUT-OFF
NUMBER OF AGGREGATE DATE CUT-OFF CUT-OFF DATE
MORTGAGED CUT-OFF GROUP 1 DATE DATE LTV
PROPERTY TYPE PROPERTIES DATE BALANCE BALANCE BALANCE BALANCE RATIO
- ---------------------------------------------------------------------------------------------------------
Retail 69 $1,309,545,705 49.0% $18,978,923 $205,000,000 60.0%
Retail - Anchored 43 1,047,700,938 39.2 $24,365,138 $205,000,000 56.5%
Retail - Single Tenant 10 133,061,232 5.0 $13,306,123 $100,000,000 77.9%
Retail - Unanchored 13 77,983,534 2.9 $ 5,998,733 $ 12,820,000 71.4%
Retail - Shadow Anchored(4) 3 50,800,000 1.9 $16,933,333 $ 25,600,000 68.8%
Office 42 676,721,000 25.3 $16,112,405 $129,000,000 74.5%
Industrial 35 391,616,000 14.7 $11,189,029 $ 35,000,000 77.5%
Multifamily 2 139,030,000 5.2 $69,515,000 $132,000,000 70.7%
Hospitality 6 95,600,000 3.6 $15,933,333 $ 49,000,000 70.9%
Mixed Use 7 43,850,000 1.6 $ 6,264,286 $ 17,500,000 66.9%
Self Storage 8 15,900,000 0.6 $ 1,987,500 $ 3,563,000 75.8%
--- -------------- -----
169 $2,672,262,705 100.0% $15,812,205 $205,000,000 67.4%
=== ============== =====
WTD. AVG.
STATED WTD. AVG. MINIMUM MAXIMUM
WTD. AVG. REMAINING CUT-OFF CUT-OFF CUT-OFF
LTV TERM TO DATE DATE DATE WTD. AVG. WTD. AVG.
RATIO AT MATURITY DSC DSC DSC OCCUPANCY MORTGAGE
PROPERTY TYPE MATURITY (2) (MOS.) (2) RATIO RATIO RATIO RATE (3) RATE
- -----------------------------------------------------------------------------------------------------------
Retail 58.9% 103 1.89x 1.04x 2.44x 94.6% 5.544%
Retail - Anchored 55.8% 98 2.05x 1.21x 2.44x 94.0% 5.469%
Retail - Single Tenant 76.3% 120 1.16x 1.04x 2.01x 100.0% 5.747%
Retail - Unanchored 67.9% 119 1.36x 1.15x 2.39x 95.3% 5.955%
Retail - Shadow Anchored(4) 63.5% 119 1.26x 1.19x 1.50x 92.9% 5.917%
Office 71.2% 118 1.36x 1.20x 1.75x 88.4% 5.813%
Industrial 76.7% 118 1.45x 1.22x 2.17x 96.6% 5.885%
Multifamily 70.7% 118 1.35x 1.35x 1.41x 94.6% 6.093%
Hospitality 58.9% 120 1.40x 1.30x 1.76x NA 6.080%
Mixed Use 65.6% 119 1.42x 1.23x 1.71x 96.8% 5.758%
Self Storage 73.7% 119 1.34x 1.29x 1.35x 77.6% 5.921%
65.4% 110 1.63x 1.04x 2.44x 93.2% 5.715%
- ----------
(1) Because this table presents information relating to the Mortgaged
Properties and not the Mortgage Loans, the information for Mortgage Loans
secured by more than one Mortgaged Property is based on allocated amounts
(allocating the Mortgage Loan principal balance to each of those properties
by the appraised values of the Mortgaged Properties or the allocated loan
amount (or specific release prices) as detailed in the related Mortgage
Loan documents).
(2) Calculated with respect to the Anticipated Repayment Date for ARD Loans.
(3) Occupancy Rates were calculated based upon rent rolls made available to the
applicable Mortgage Loan Seller by the related borrowers as of the rent
roll date set forth on Annex A-1 to this prospectus supplement. Occupancy
Rates exclude 6 hospitality properties, representing 3.6% of the Cut-Off
Date Group 1 Balance.
(4) A Mortgaged Property is classified as "shadow anchored" if it is located in
close proximity to an anchored retail property.
B-2
WACHOVIA BANK COMMERCIAL MORTGAGE TRUST SERIES 2006-C29
ANNEX B
MORTGAGED PROPERTIES BY PROPERTY TYPE FOR LOAN GROUP 2 MORTGAGE LOANS (1)
% OF WTD. AVG.
CUT-OFF AVERAGE MAXIMUM CUT-OFF WTD. AVG.
NUMBER OF AGGREGATE DATE CUT-OFF CUT-OFF DATE LTV
MORTGAGED CUT-OFF GROUP 2 DATE DATE LTV RATIO AT
PROPERTY TYPE PROPERTIES DATE BALANCE BALANCE BALANCE BALANCE RATIO MATURITY (2)
- --------------------------------------------------------------------------------------------------------
Multifamily 38 $624,131,469 89.3% $ 16,424,512 $ 65,050,000 71.9% 69.8%
Mobile Home Park 2 74,880,000 10.7 $ 37,440,000 $ 56,800,000 80.0% 80.0%
--- ------------ -----
40 $699,011,469 100.0% $ 17,475,287 $ 65,050,000 72.8% 70.9%
=== ============ =====
WTD. AVG.
STATED WTD. AVG. MINIMUM MAXIMUM
REMAINING CUT-OFF CUT-OFF CUT-OFF
TERM TO DATE DATE DATE WTD. AVG. WTD. AVG.
MATURITY DSC DSC DSC OCCUPANCY MORTGAGE
PROPERTY TYPE (MOS.) (2) RATIO RATIO RATIO RATE RATE
- -------------------------------------------------------------------------------
Multifamily 107 1.32x 1.17x 1.94x 95.7% 5.781%
Mobile Home Park 119 1.34x 1.33x 1.36x 94.4% 5.790%
108 1.32x 1.17x 1.94x 95.6% 5.782%
- ----------
(1) Because this table presents information relating to the Mortgaged
Properties and not the Mortgage Loans, the information for Mortgage Loans
secured by more than one Mortgaged Property is based on allocated amounts
(allocating the Mortgage Loan principal balance to each of those properties
by the appraised values of the Mortgaged Properties or the allocated
allocated loan amount (or specific release prices) as detailed in the
related Mortgage Loan documents).
(2) Calculated with respect to the Anticipated Repayment Date for ARD Loans.
B-3
WACHOVIA BANK COMMERCIAL MORTGAGE TRUST SERIES 2006-C29
ANNEX B
RANGE OF CUT-OFF DATE BALANCES FOR ALL MORTGAGE LOANS
% OF
AGGREGATE CUT-OFF AVERAGE MAXIMUM
NUMBER OF CUT-OFF DATE CUT-OFF CUT-OFF
RANGE OF CUT-OFF MORTGAGE DATE POOL DATE DATE
DATE BALANCES ($) LOANS BALANCE BALANCE BALANCE BALANCE
- ----------------------------------------------------------------------------------------
840,000 - 2,000,000 5 $ 7,528,000 0.2% $ 1,505,600 $ 1,856,000
2,000,001 - 3,000,000 9 22,804,511 0.7 $ 2,533,835 $ 2,915,000
3,000,001 - 4,000,000 8 27,959,163 0.8 $ 3,494,895 $ 4,000,000
4,000,001 - 5,000,000 8 37,490,000 1.1 $ 4,686,250 $ 5,000,000
5,000,001 - 6,000,000 3 16,711,000 0.5 $ 5,570,333 $ 5,671,000
6,000,001 - 7,000,000 11 71,850,000 2.1 $ 6,531,818 $ 7,000,000
7,000,001 - 8,000,000 7 52,490,600 1.6 $ 7,498,657 $ 8,000,000
8,000,001 - 9,000,000 7 59,847,796 1.8 $ 8,549,685 $ 9,000,000
9,000,001 - 10,000,000 4 38,500,000 1.1 $ 9,625,000 $ 9,800,000
10,000,001 - 15,000,000 25 310,782,000 9.2 $ 12,431,280 $ 14,950,000
15,000,001 - 20,000,000 21 359,728,000 10.7 $ 17,129,905 $ 20,000,000
20,000,001 - 25,000,000 8 180,975,000 5.4 $ 22,621,875 $ 24,475,000
25,000,001 - 30,000,000 4 107,100,000 3.2 $ 26,775,000 $ 28,275,000
30,000,001 - 35,000,000 5 162,515,000 4.8 $ 32,503,000 $ 35,000,000
35,000,001 - 40,000,000 1 37,000,000 1.1 $ 37,000,000 $ 37,000,000
45,000,001 - 50,000,000 2 99,000,000 2.9 $ 49,500,000 $ 50,000,000
50,000,001 - 55,000,000 1 52,000,000 1.5 $ 52,000,000 $ 52,000,000
55,000,001 - 60,000,000 4 231,950,000 6.9 $ 57,987,500 $ 60,000,000
65,000,001 - 70,000,000 1 65,050,000 1.9 $ 65,050,000 $ 65,050,000
80,000,001 - 318,976,000 8 1,429,993,103 42.4 $178,749,138 $318,976,000
--- -------------- -----
142 $3,371,274,173 100.0% $ 23,741,367 $318,976,000
=== ============== =====
WTD. AVG.
STATED
WTD. AVG. REMAINING WTD. AVG.
CUT-OFF WTD. AVG. TERM TO CUT-OFF WTD. AVG.
RANGE OF CUT-OFF DATE LTV LTV RATIO MATURITY DATE DSC MORTGAGE
DATE BALANCES ($) RATIO AT MATURITY * (MOS.) * RATIO RATE
- -----------------------------------------------------------------------------------
840,000 - 2,000,000 59.6% 54.4% 118 1.54x 5.947%
2,000,001 - 3,000,000 68.1% 63.2% 119 1.42x 5.813%
3,000,001 - 4,000,000 72.5% 65.3% 119 1.37x 5.913%
4,000,001 - 5,000,000 73.3% 68.9% 120 1.34x 5.807%
5,000,001 - 6,000,000 70.0% 66.2% 118 1.31x 6.018%
6,000,001 - 7,000,000 68.5% 54.0% 131 1.39x 5.831%
7,000,001 - 8,000,000 75.5% 71.7% 102 1.28x 5.916%
8,000,001 - 9,000,000 75.3% 67.2% 119 1.35x 5.715%
9,000,001 - 10,000,000 75.7% 72.4% 119 1.40x 5.813%
10,000,001 - 15,000,000 71.6% 68.1% 111 1.38x 5.801%
15,000,001 - 20,000,000 73.7% 71.8% 114 1.41x 5.798%
20,000,001 - 25,000,000 70.3% 69.3% 104 1.31x 5.878%
25,000,001 - 30,000,000 68.1% 66.9% 117 1.58x 5.578%
30,000,001 - 35,000,000 69.6% 68.9% 108 1.56x 5.843%
35,000,001 - 40,000,000 78.4% 73.4% 119 1.25x 6.120%
45,000,001 - 50,000,000 72.5% 66.7% 119 1.26x 5.947%
50,000,001 - 55,000,000 80.0% 80.0% 119 1.21x 5.880%
55,000,001 - 60,000,000 68.9% 66.6% 103 1.58x 5.689%
65,000,001 - 70,000,000 70.7% 70.7% 120 1.22x 5.490%
80,000,001 - 318,976,000 64.2% 63.8% 106 1.79x 5.637%
68.5% 66.6% 110 1.57x 5.729%
- ----------
* Calculated with respect to the Anticipated Repayment Date for ARD Loans.
B-4
WACHOVIA BANK COMMERCIAL MORTGAGE TRUST SERIES 2006-C29
ANNEX B
RANGE OF CUT-OFF DATE BALANCES FOR LOAN GROUP 1 MORTGAGE LOANS
% OF
AGGREGATE CUT-OFF AVERAGE MAXIMUM
NUMBER OF CUT-OFF DATE CUT-OFF CUT-OFF
RANGE OF CUT-OFF MORTGAGE DATE GROUP 1 DATE DATE
DATE BALANCES ($) LOANS BALANCE BALANCE BALANCE BALANCE
- ----------------------------------------------------------------------------------------
840,000 - 2,000,000 5 $ 7,528,000 0.3% $ 1,505,600 $ 1,856,000
2,000,001 - 3,000,000 7 17,429,511 0.7 $ 2,489,930 $ 2,900,000
3,000,001 - 4,000,000 6 21,242,694 0.8 $ 3,540,449 $ 4,000,000
4,000,001 - 5,000,000 5 23,050,000 0.9 $ 4,610,000 $ 5,000,000
5,000,001 - 6,000,000 3 16,711,000 0.6 $ 5,570,333 $ 5,671,000
6,000,001 - 7,000,000 8 52,100,000 1.9 $ 6,512,500 $ 7,000,000
7,000,001 - 8,000,000 5 38,140,600 1.4 $ 7,628,120 $ 8,000,000
8,000,001 - 9,000,000 5 42,222,796 1.6 $ 8,444,559 $ 8,982,796
9,000,001 - 10,000,000 3 28,700,000 1.1 $ 9,566,667 $ 9,800,000
10,000,001 - 15,000,000 17 207,832,000 7.8 $ 12,225,412 $ 14,950,000
15,000,001 - 20,000,000 15 259,163,000 9.7 $ 17,277,533 $ 20,000,000
20,000,001 - 25,000,000 3 66,000,000 2.5 $ 22,000,000 $ 22,600,000
25,000,001 - 30,000,000 4 107,100,000 4.0 $ 26,775,000 $ 28,275,000
30,000,001 - 35,000,000 3 99,050,000 3.7 $ 33,016,667 $ 35,000,000
35,000,001 - 40,000,000 1 37,000,000 1.4 $ 37,000,000 $ 37,000,000
45,000,001 - 50,000,000 1 49,000,000 1.8 $ 49,000,000 $ 49,000,000
50,000,001 - 55,000,000 1 52,000,000 1.9 $ 52,000,000 $ 52,000,000
55,000,001 - 60,000,000 2 118,000,000 4.4 $ 59,000,000 $ 60,000,000
80,000,001 - 318,976,000 8 1,429,993,103 53.5 $178,749,138 $318,976,000
--- -------------- -----
102 $2,672,262,705 100.0% $ 26,198,654 $318,976,000
=== ============== =====
WTD. AVG.
STATED
WTD. AVG. REMAINING WTD. AVG.
CUT-OFF WTD. AVG. TERM TO CUT-OFF WTD. AVG.
RANGE OF CUT-OFF DATE LTV LTV RATIO MATURITY DATE DSC MORTGAGE
DATE BALANCES ($) RATIO AT MATURITY * (MOS.) * RATIO RATE
- -----------------------------------------------------------------------------------
840,000 - 2,000,000 59.6% 54.4% 118 1.54x 5.947%
2,000,001 - 3,000,000 67.2% 60.9% 119 1.43x 5.773%
3,000,001 - 4,000,000 72.9% 65.0% 119 1.40x 5.894%
4,000,001 - 5,000,000 72.5% 67.4% 120 1.39x 5.816%
5,000,001 - 6,000,000 70.0% 66.2% 118 1.31x 6.018%
6,000,001 - 7,000,000 68.0% 56.7% 119 1.42x 5.850%
7,000,001 - 8,000,000 74.1% 70.0% 107 1.30x 6.016%
8,000,001 - 9,000,000 74.4% 65.5% 119 1.36x 5.829%
9,000,001 - 10,000,000 74.2% 69.8% 120 1.41x 5.742%
10,000,001 - 15,000,000 71.2% 67.6% 119 1.42x 5.792%
15,000,001 - 20,000,000 73.4% 70.7% 115 1.39x 5.765%
20,000,001 - 25,000,000 66.4% 64.7% 119 1.32x 5.807%
25,000,001 - 30,000,000 68.1% 66.9% 117 1.58x 5.578%
30,000,001 - 35,000,000 71.5% 70.3% 119 1.61x 5.753%
35,000,001 - 40,000,000 78.4% 73.4% 119 1.25x 6.120%
45,000,001 - 50,000,000 73.1% 66.3% 120 1.33x 6.200%
50,000,001 - 55,000,000 80.0% 80.0% 119 1.21x 5.880%
55,000,001 - 60,000,000 63.0% 58.4% 88 1.88x 5.737%
80,000,001 - 318,976,000 64.2% 63.8% 106 1.79x 5.637%
67.4% 65.4% 110 1.63x 5.715%
- ----------
* Calculated with respect to the Anticipated Repayment Date for ARD Loans.
B-5
WACHOVIA BANK COMMERCIAL MORTGAGE TRUST SERIES 2006-C29
ANNEX B
RANGE OF CUT-OFF DATE BALANCES FOR LOAN GROUP 2 MORTGAGE LOANS
% OF
AGGREGATE CUT-OFF AVERAGE MAXIMUM
NUMBER OF CUT-OFF DATE CUT-OFF CUT-OFF
RANGE OF CUT-OFF MORTGAGE DATE GROUP 2 DATE DATE
DATE BALANCES ($) LOANS BALANCE BALANCE BALANCE BALANCE
- ------------------------------------------------------------------------------------
2,460,000 - 3,000,000 2 $ 5,375,000 0.8% $ 2,687,500 $ 2,915,000
3,000,001 - 4,000,000 2 6,716,469 1.0 $ 3,358,234 $ 3,496,469
4,000,001 - 5,000,000 3 14,440,000 2.1 $ 4,813,333 $ 5,000,000
6,000,001 - 7,000,000 3 19,750,000 2.8 $ 6,583,333 $ 7,000,000
7,000,001 - 8,000,000 2 14,350,000 2.1 $ 7,175,000 $ 7,250,000
8,000,001 - 9,000,000 2 17,625,000 2.5 $ 8,812,500 $ 9,000,000
9,000,001 - 10,000,000 1 9,800,000 1.4 $ 9,800,000 $ 9,800,000
10,000,001 - 15,000,000 8 102,950,000 14.7 $12,868,750 $14,700,000
15,000,001 - 20,000,000 6 100,565,000 14.4 $16,760,833 $18,080,000
20,000,001 - 25,000,000 5 114,975,000 16.4 $22,995,000 $24,475,000
30,000,001 - 35,000,000 2 63,465,000 9.1 $31,732,500 $33,150,000
45,000,001 - 50,000,000 1 50,000,000 7.2 $50,000,000 $50,000,000
55,000,001 - 60,000,000 2 113,950,000 16.3 $56,975,000 $57,150,000
60,000,001 - 65,050,000 1 65,050,000 9.3 $65,050,000 $65,050,000
--- ------------- -----
40 $ 699,011,469 100.0% $17,475,287 $65,050,000
=== ============= =====
WTD. AVG.
STATED
WTD. AVG. REMAINING WTD. AVG.
CUT-OFF WTD. AVG. TERM TO CUT-OFF WTD. AVG.
RANGE OF CUT-OFF DATE LTV LTV RATIO MATURITY DATE DSC MORTGAGE
DATE BALANCES ($) RATIO AT MATURITY * (MOS.) * RATIO RATE
- ----------------------------------------------------------------------------------
2,460,000 - 3,000,000 70.8% 70.8% 119 1.39x 5.944%
3,000,001 - 4,000,000 71.2% 66.2% 119 1.27x 5.973%
4,000,001 - 5,000,000 74.5% 71.2% 119 1.27x 5.794%
6,000,001 - 7,000,000 69.7% 47.0% 162 1.33x 5.778%
7,000,001 - 8,000,000 79.0% 76.1% 89 1.24x 5.648%
8,000,001 - 9,000,000 77.4% 71.2% 119 1.30x 5.443%
9,000,001 - 10,000,000 80.0% 80.0% 118 1.37x 6.020%
10,000,001 - 15,000,000 72.3% 69.3% 94 1.30x 5.819%
15,000,001 - 20,000,000 74.8% 74.8% 109 1.47x 5.885%
20,000,001 - 25,000,000 72.5% 72.0% 96 1.29x 5.918%
30,000,001 - 35,000,000 66.8% 66.8% 91 1.49x 5.982%
45,000,001 - 50,000,000 71.9% 67.0% 118 1.20x 5.700%
55,000,001 - 60,000,000 75.0% 75.0% 120 1.28x 5.640%
60,000,001 - 65,050,000 70.7% 70.7% 120 1.22x 5.490%
72.8% 70.9% 108 1.32x 5.782%
- ----------
* Calculated with respect to the Anticipated Repayment Date for ARD Loans.
B-6
WACHOVIA BANK COMMERCIAL MORTGAGE TRUST SERIES 2006-C29
ANNEX B
MORTGAGED PROPERTIES BY STATE FOR ALL MORTGAGE LOANS (1)
% OF
AGGREGATE CUT-OFF AVERAGE MAXIMUM
NUMBER OF CUT-OFF DATE CUT-OFF CUT-OFF
MORTGAGED DATE POOL DATE DATE
STATE PROPERTIES BALANCE BALANCE BALANCE BALANCE
- --------------------------------------------------------------------------------
CA 17 $ 681,640,511 20.2% $ 40,096,501 $205,000,000
Southern (3) 14 613,097,511 18.2 $ 43,792,679 $205,000,000
Northern (3) 3 68,543,000 2.0 $ 22,847,667 $ 35,000,000
TX 15 271,170,183 8.0 $ 18,078,012 $129,000,000
IL 10 262,245,000 7.8 $ 26,224,500 $150,000,000
GA 27 227,487,000 6.7 $ 8,425,444 $ 20,800,000
IN 11 223,280,000 6.6 $ 20,298,182 $ 50,000,000
NY 12 220,292,779 6.5 $ 18,357,732 $100,000,000
FL 13 194,562,252 5.8 $ 14,966,327 $ 52,000,000
AZ 10 176,915,000 5.2 $ 17,691,500 $ 33,150,000
NC 9 158,117,439 4.7 $ 17,568,604 $ 32,276,339
TN 13 126,505,745 3.8 $ 9,731,211 $ 17,600,000
PA 5 109,511,994 3.2 $ 21,902,399 $ 56,800,000
NV 4 61,200,000 1.8 $ 15,300,000 $ 22,400,000
VA 8 59,601,845 1.8 $ 7,450,231 $ 16,919,049
ND 2 58,840,000 1.7 $ 29,420,000 $ 58,000,000
MS 3 54,743,893 1.6 $ 18,247,964 $ 25,600,000
DE 5 49,360,000 1.5 $ 9,872,000 $ 18,800,000
RI 1 49,000,000 1.5 $ 49,000,000 $ 49,000,000
WA 5 45,796,469 1.4 $ 9,159,294 $ 14,700,000
CT 4 42,385,134 1.3 $ 10,596,284 $ 20,000,000
MA 5 39,809,786 1.2 $ 7,961,957 $ 19,156,144
MO 4 34,528,000 1.0 $ 8,632,000 $ 28,275,000
MI 2 31,335,221 0.9 $ 15,667,611 $ 17,960,221
CO 3 28,850,000 0.9 $ 9,616,667 $ 15,500,000
NJ 1 17,341,913 0.5 $ 17,341,913 $ 17,341,913
MN 3 15,914,653 0.5 $ 5,304,884 $ 13,014,653
VT 1 14,003,767 0.4 $ 14,003,767 $ 14,003,767
DC 1 13,300,000 0.4 $ 13,300,000 $ 13,300,000
NE 1 12,500,000 0.4 $ 12,500,000 $ 12,500,000
UT 1 12,000,000 0.4 $ 12,000,000 $ 12,000,000
MD 2 11,795,972 0.3 $ 5,897,986 $ 8,000,000
KY 1 11,350,000 0.3 $ 11,350,000 $ 11,350,000
OR 1 11,000,000 0.3 $ 11,000,000 $ 11,000,000
SC 1 10,500,000 0.3 $ 10,500,000 $ 10,500,000
NH 1 7,652,616 0.2 $ 7,652,616 $ 7,652,616
KS 3 6,747,000 0.2 $ 2,249,000 $ 3,563,000
ME 1 6,700,000 0.2 $ 6,700,000 $ 6,700,000
ID 1 6,250,000 0.2 $ 6,250,000 $ 6,250,000
AL 1 4,000,000 0.1 $ 4,000,000 $ 4,000,000
LA 1 3,040,000 0.1 $ 3,040,000 $ 3,040,000
--- -------------- -----
209 $3,371,274,173 100.0% $ 16,130,498 $205,000,000
=== ============== =====
WTD. AVG.
STATED
WTD. AVG. REMAINING WTD. AVG.
CUT-OFF WTD. AVG. TERM TO CUT-OFF WTD. AVG.
DATE LTV LTV RATIO MATURITY DATE DSC MORTGAGE
STATE RATIO AT MATURITY (2) (MOS.) (2) RATIO RATE
- -----------------------------------------------------------------------------
CA 63.2% 62.9% 99 1.54x 5.682%
Southern (3) 63.4% 63.2% 97 1.50x 5.686%
Northern (3) 60.8% 60.8% 119 1.84x 5.650%
TX 74.9% 71.3% 114 1.44x 5.812%
IL 56.5% 56.4% 105 2.06x 5.489%
GA 78.5% 77.6% 119 1.37x 5.916%
IN 78.2% 77.1% 119 1.35x 5.866%
NY 66.8% 66.7% 114 1.67x 5.613%
FL 73.5% 71.7% 117 1.43x 5.788%
AZ 71.3% 69.2% 92 1.37x 6.001%
NC 62.3% 61.3% 108 1.86x 5.572%
TN 70.9% 69.5% 119 1.64x 5.713%
PA 71.6% 70.1% 119 1.54x 5.742%
NV 74.5% 74.3% 98 1.38x 5.721%
VA 67.3% 61.1% 119 1.63x 5.663%
ND 79.7% 70.6% 119 1.31x 5.889%
MS 66.2% 63.9% 105 1.72x 5.635%
DE 80.0% 71.7% 119 1.29x 5.610%
RI 73.1% 66.3% 120 1.33x 6.200%
WA 62.6% 48.5% 119 1.35x 5.847%
CT 56.6% 54.8% 110 1.90x 5.775%
MA 58.2% 56.2% 98 2.05x 5.522%
MO 65.1% 65.1% 115 1.67x 5.476%
MI 63.4% 61.1% 120 1.95x 5.564%
CO 75.3% 69.5% 120 1.36x 5.792%
NJ 53.4% 53.4% 84 2.31x 5.420%
MN 56.4% 54.3% 120 2.19x 5.537%
VT 52.1% 52.1% 120 2.39x 5.440%
DC 72.7% 67.6% 120 1.23x 5.620%
NE 79.9% 74.4% 119 1.25x 5.720%
UT 69.4% 69.4% 120 1.85x 5.450%
MD 73.0% 64.3% 120 1.21x 5.840%
KY 72.8% 65.3% 120 1.23x 5.670%
OR 71.9% 71.9% 120 1.33x 5.890%
SC 74.5% 68.2% 119 1.20x 5.714%
NH 52.1% 52.1% 120 2.39x 5.440%
KS 75.8% 75.8% 119 1.35x 5.910%
ME 47.9% 0.3% 120 1.76x 5.800%
ID 78.1% 68.8% 119 1.24x 5.750%
AL 68.4% 53.2% 120 1.64x 6.140%
LA 76.0% 68.6% 119 1.28x 5.930%
68.5% 66.6% 110 1.57x 5.729%
- ----------
(1) Because this table presents information relating to the Mortgaged
Properties and not the Mortgage Loans, the information for Mortgage Loans
secured by more than one Mortgaged Property is based on allocated amounts
(allocating the Mortgage Loan principal balance to each of these properties
by the appraised values of the Mortgaged Properties allocated loan amount
(or specific release prices) as detailed in the related Mortgage Loan
documents).
(2) Calculated with respect to the Anticipated Repayment Date for ARD Loans.
(3) For purposes of determining whether a Mortgaged Property is in Northern
California or Southern California, Mortgaged Properties north of San Luis
Obispo County, Kern County and San Bernardino County were included in
Northern California and Mortgaged Properties in or south of such counties
were included in Southern California.
B-7
WACHOVIA BANK COMMERCIAL MORTGAGE TRUST SERIES 2006-C29
ANNEX B
MORTGAGED PROPERTIES BY STATE FOR LOAN GROUP 1 MORTGAGE LOANS (1)
% OF
AGGREGATE CUT-OFF AVERAGE MAXIMUM
NUMBER OF CUT-OFF DATE CUT-OFF CUT-OFF
MORTGAGED DATE GROUP 1 DATE DATE
STATE PROPERTIES BALANCE BALANCE BALANCE BALANCE
- --------------------------------------------------------------------------------
CA 12 $ 497,940,511 18.6% $ 41,495,043 $205,000,000
Southern (3) 9 429,397,511 16.1 $ 47,710,835 $205,000,000
Northern (3) 3 68,543,000 2.6 $ 22,847,667 $ 35,000,000
IL 9 259,330,000 9.7 $ 28,814,444 $150,000,000
GA 26 220,987,000 8.3 $ 8,499,500 $ 20,800,000
NY 12 220,292,779 8.2 $ 18,357,732 $100,000,000
TX 11 215,895,183 8.1 $ 19,626,835 $129,000,000
FL 13 194,562,252 7.3 $ 14,966,327 $ 52,000,000
IN 10 173,280,000 6.5 $ 17,328,000 $ 25,840,000
NC 7 131,492,439 4.9 $ 18,784,634 $ 32,276,339
AZ 6 77,300,000 2.9 $ 12,883,333 $ 22,400,000
ND 2 58,840,000 2.2 $ 29,420,000 $ 58,000,000
TN 6 57,200,745 2.1 $ 9,533,458 $ 14,316,118
MS 3 54,743,893 2.0 $ 18,247,964 $ 25,600,000
DE 5 49,360,000 1.8 $ 9,872,000 $ 18,800,000
RI 1 49,000,000 1.8 $ 49,000,000 $ 49,000,000
VA 6 47,751,845 1.8 $ 7,958,641 $ 16,919,049
CT 4 42,385,134 1.6 $ 10,596,284 $ 20,000,000
NV 3 38,800,000 1.5 $ 12,933,333 $ 21,000,000
MA 4 34,809,786 1.3 $ 8,702,447 $ 19,156,144
PA 3 34,631,994 1.3 $ 11,543,998 $ 15,981,994
MO 4 34,528,000 1.3 $ 8,632,000 $ 28,275,000
MI 2 31,335,221 1.2 $ 15,667,611 $ 17,960,221
CO 3 28,850,000 1.1 $ 9,616,667 $ 15,500,000
NJ 1 17,341,913 0.6 $ 17,341,913 $ 17,341,913
MN 3 15,914,653 0.6 $ 5,304,884 $ 13,014,653
VT 1 14,003,767 0.5 $ 14,003,767 $ 14,003,767
UT 1 12,000,000 0.4 $ 12,000,000 $ 12,000,000
MD 2 11,795,972 0.4 $ 5,897,986 $ 8,000,000
KY 1 11,350,000 0.4 $ 11,350,000 $ 11,350,000
WA 1 8,400,000 0.3 $ 8,400,000 $ 8,400,000
NH 1 7,652,616 0.3 $ 7,652,616 $ 7,652,616
KS 3 6,747,000 0.3 $ 2,249,000 $ 3,563,000
ME 1 6,700,000 0.3 $ 6,700,000 $ 6,700,000
AL 1 4,000,000 0.1 $ 4,000,000 $ 4,000,000
LA 1 3,040,000 0.1 $ 3,040,000 $ 3,040,000
--- -------------- -----
169 $2,672,262,705 100.0% $ 15,812,205 $205,000,000
=== ============== =====
WTD. AVG.
STATED
WTD. AVG. REMAINING WTD. AVG.
CUT-OFF WTD. AVG. TERM TO CUT-OFF WTD. AVG.
DATE LTV LTV RATIO MATURITY DATE DSC MORTGAGE
STATE RATIO AT MATURITY (2) (MOS.) (2) RATIO RATE
- -----------------------------------------------------------------------------
CA 59.8% 59.5% 94 1.65x 5.693%
Southern (3) 59.7% 59.3% 90 1.62x 5.700%
Northern (3) 60.8% 60.8% 119 1.84x 5.650%
IL 56.4% 56.3% 105 2.07x 5.485%
GA 78.5% 77.6% 119 1.37x 5.921%
NY 66.8% 66.7% 114 1.67x 5.613%
TX 75.4% 71.4% 119 1.47x 5.792%
FL 73.5% 71.7% 117 1.43x 5.788%
IN 80.0% 80.0% 119 1.39x 5.914%
NC 61.2% 60.4% 106 1.93x 5.548%
AZ 71.5% 66.6% 106 1.28x 5.915%
ND 79.7% 70.6% 119 1.31x 5.889%
TN 64.2% 61.2% 120 1.83x 5.556%
MS 66.2% 63.9% 105 1.72x 5.635%
DE 80.0% 71.7% 119 1.29x 5.610%
RI 73.1% 66.3% 120 1.33x 6.200%
VA 64.9% 58.5% 119 1.73x 5.688%
CT 56.6% 54.8% 110 1.90x 5.775%
NV 78.1% 77.7% 119 1.43x 5.802%
MA 56.5% 54.9% 95 2.18x 5.501%
PA 53.6% 48.7% 120 1.98x 5.637%
MO 65.1% 65.1% 115 1.67x 5.476%
MI 63.4% 61.1% 120 1.95x 5.564%
CO 75.3% 69.5% 120 1.36x 5.792%
NJ 53.4% 53.4% 84 2.31x 5.420%
MN 56.4% 54.3% 120 2.19x 5.537%
VT 52.1% 52.1% 120 2.39x 5.440%
UT 69.4% 69.4% 120 1.85x 5.450%
MD 73.0% 64.3% 120 1.21x 5.840%
KY 72.8% 65.3% 120 1.23x 5.670%
WA 67.7% 54.5% 119 1.68x 6.050%
NH 52.1% 52.1% 120 2.39x 5.440%
KS 75.8% 75.8% 119 1.35x 5.910%
ME 47.9% 0.3% 120 1.76x 5.800%
AL 68.4% 53.2% 120 1.64x 6.140%
LA 76.0% 68.6% 119 1.28x 5.930%
67.4% 65.4% 110 1.63x 5.715%
- ----------
(1) Because this table presents information relating to the Mortgaged
Properties and not the Mortgage Loans, the information for Mortgage Loans
secured by more than one Mortgaged Property is based on allocated amounts
(allocating the Mortgage Loan principal balance to each of these properties
by the appraised values of the Mortgaged Properties allocated loan amount
(or specific release prices) as detailed in the related Mortgage Loan
documents).
(2) Calculated with respect to the Anticipated Repayment Date for ARD Loans.
(3) For purposes of determining whether a Mortgaged Property is in Northern
California or Southern California, Mortgaged Properties north of San Luis
Obispo County, Kern County and San Bernardino County were included in
Northern California and Mortgaged Properties in or south of such counties
were included in Southern California.
B-8
WACHOVIA BANK COMMERCIAL MORTGAGE TRUST SERIES 2006-C29
ANNEX B
MORTGAGED PROPERTIES BY STATE FOR LOAN GROUP 2 MORTGAGE LOANS (1)
% OF
AGGREGATE CUT-OFF AVERAGE MAXIMUM
NUMBER OF CUT-OFF DATE CUT-OFF CUT-OFF
MORTGAGED DATE GROUP 2 DATE DATE
STATE PROPERTIES BALANCE BALANCE BALANCE BALANCE
- ----------------------------------------------------------------------------
CA 5 $183,700,000 26.3% $36,740,000 $65,050,000
Southern (3) 5 183,700,000 26.3 $36,740,000 $65,050,000
AZ 4 99,615,000 14.3 $24,903,750 $33,150,000
PA 2 74,880,000 10.7 $37,440,000 $56,800,000
TN 7 69,305,000 9.9 $ 9,900,714 $17,600,000
TX 4 55,275,000 7.9 $13,818,750 $24,475,000
IN 1 50,000,000 7.2 $50,000,000 $50,000,000
WA 4 37,396,469 5.3 $ 9,349,117 $14,700,000
NC 2 26,625,000 3.8 $13,312,500 $18,000,000
NV 1 22,400,000 3.2 $22,400,000 $22,400,000
DC 1 13,300,000 1.9 $13,300,000 $13,300,000
NE 1 12,500,000 1.8 $12,500,000 $12,500,000
VA 2 11,850,000 1.7 $ 5,925,000 $ 7,250,000
OR 1 11,000,000 1.6 $11,000,000 $11,000,000
SC 1 10,500,000 1.5 $10,500,000 $10,500,000
GA 1 6,500,000 0.9 $ 6,500,000 $ 6,500,000
ID 1 6,250,000 0.9 $ 6,250,000 $ 6,250,000
MA 1 5,000,000 0.7 $ 5,000,000 $ 5,000,000
IL 1 2,915,000 0.4 $ 2,915,000 $ 2,915,000
--- ------------ -----
40 $699,011,469 100.0% $17,475,287 $65,050,000
=== ============ =====
WTD. AVG.
STATED
WTD. AVG. REMAINING WTD. AVG.
CUT-OFF WTD. AVG. TERM TO CUT-OFF WTD. AVG.
DATE LTV LTV RATIO MATURITY DATE DSC MORTGAGE
STATE RATIO AT MATURITY (2) (MOS.) (2) RATIO RATE
- -----------------------------------------------------------------------------
CA 72.2% 72.2% 114 1.24x 5.655%
Southern (3) 72.2% 72.2% 114 1.24x 5.655%
AZ 71.2% 71.2% 80 1.44x 6.068%
PA 80.0% 80.0% 119 1.34x 5.790%
TN 76.4% 76.4% 118 1.48x 5.843%
TX 73.0% 71.0% 94 1.31x 5.892%
IN 71.9% 67.0% 118 1.20x 5.700%
WA 61.4% 47.2% 118 1.27x 5.801%
NC 67.9% 65.8% 119 1.50x 5.692%
NV 68.3% 68.3% 60 1.29x 5.580%
DC 72.7% 67.6% 120 1.23x 5.620%
NE 79.9% 74.4% 119 1.25x 5.720%
VA 77.1% 71.7% 120 1.23x 5.562%
OR 71.9% 71.9% 120 1.33x 5.890%
SC 74.5% 68.2% 119 1.20x 5.714%
GA 76.5% 76.5% 119 1.59x 5.750%
ID 78.1% 68.8% 119 1.24x 5.750%
MA 70.4% 65.6% 120 1.21x 5.670%
IL 63.0% 63.0% 119 1.40x 5.880%
72.8% 70.9% 108 1.32x 5.782%
- ----------
(1) Because this table presents information relating to the Mortgaged
Properties and not the Mortgage Loans, the information for Mortgage Loans
secured by more than one Mortgaged Property is based on allocated amounts
(allocating the Mortgage Loan principal balance to each of these properties
by the appraised values of the Mortgaged Properties allocated loan amount
(or specific release prices) as detailed in the related Mortgage Loan
documents).
(2) Calculated with respect to the Anticipated Repayment Date for ARD Loans.
(3) For purposes of determining whether a Mortgaged Property is in Northern
California or Southern California, Mortgaged Properties north of San Luis
Obispo County, Kern County and San Bernardino County were included in
Northern California and Mortgaged Properties in or south of such counties
were included in Southern California.
B-9
WACHOVIA BANK COMMERCIAL MORTGAGE TRUST SERIES 2006-C29
ANNEX B
RANGE OF UNDERWRITTEN DSC RATIOS FOR ALL MORTGAGE LOANS AS OF THE CUT-OFF DATE
% OF
AGGREGATE CUT-OFF AVERAGE MAXIMUM
NUMBER OF CUT-OFF DATE CUT-OFF CUT-OFF
RANGE OF UNDERWRITTEN MORTGAGE DATE POOL DATE DATE
DSC RATIOS (X) LOANS BALANCE BALANCE BALANCE BALANCE
- --------------------------------------------------------------------------------------
1.04 - 1.14 1 $ 100,000,000 3.0% $100,000,000 $100,000,000
1.15 - 1.19 3 37,080,600 1.1 $ 12,360,200 $ 22,400,000
1.20 - 1.24 31 482,957,441 14.3 $ 15,579,272 $ 65,050,000
1.25 - 1.29 19 232,035,000 6.9 $ 12,212,368 $ 37,000,000
1.30 - 1.34 20 494,977,796 14.7 $ 24,748,890 $129,000,000
1.35 - 1.39 17 635,981,000 18.9 $ 37,410,647 $318,976,000
1.40 - 1.44 12 140,552,511 4.2 $ 11,712,709 $ 30,750,000
1.45 - 1.49 6 84,346,722 2.5 $ 14,057,787 $ 18,750,000
1.50 - 1.54 5 38,450,000 1.1 $ 7,690,000 $ 17,500,000
1.55 - 1.59 5 103,350,000 3.1 $ 20,670,000 $ 33,150,000
1.60 - 1.64 3 25,043,000 0.7 $ 8,347,667 $ 16,043,000
1.65 - 1.69 3 46,450,000 1.4 $ 15,483,333 $ 25,025,000
1.70 - 1.74 3 44,425,000 1.3 $ 14,808,333 $ 28,275,000
1.75 - 1.79 2 16,837,000 0.5 $ 8,418,500 $ 10,137,000
1.85 - 1.89 1 12,000,000 0.4 $ 12,000,000 $ 12,000,000
1.90 - 1.94 3 28,241,000 0.8 $ 9,413,667 $ 16,185,000
1.95 - 1.99 2 207,690,000 6.2 $103,845,000 $205,000,000
2.00 - 2.04 1 840,000 0.0 $ 840,000 $ 840,000
2.15 - 2.19 2 185,000,000 5.5 $ 92,500,000 $150,000,000
2.30 - 2.44 3 455,017,103 13.5 $151,672,368 $233,977,430
--- -------------- -----
142 $3,371,274,173 100.0% $ 23,741,367 $318,976,000
=== ============== =====
WTD. AVG.
STATED
WTD. AVG. REMAINING WTD. AVG.
CUT-OFF WTD. AVG. TERM TO CUT-OFF WTD. AVG.
RANGE OF UNDERWRITTEN DATE LTV LTV RATIO MATURITY DATE DSC MORTGAGE
DSC RATIOS (x) RATIO AT MATURITY * (MOS.) * RATIO RATE
- --------------------------------------------------------------------------------
1.04 - 1.14 80.0% 80.0% 120 1.04x 5.760%
1.15 - 1.19 66.3% 50.8% 142 1.18x 6.057%
1.20 - 1.24 74.8% 72.0% 118 1.22x 5.762%
1.25 - 1.29 73.5% 69.4% 104 1.27x 5.935%
1.30 - 1.34 77.3% 72.4% 117 1.32x 5.866%
1.35 - 1.39 75.7% 75.2% 115 1.38x 5.932%
1.40 - 1.44 71.2% 69.6% 107 1.41x 5.855%
1.45 - 1.49 76.7% 76.3% 110 1.47x 5.754%
1.50 - 1.54 68.7% 67.4% 119 1.52x 5.752%
1.55 - 1.59 67.1% 67.1% 119 1.57x 5.715%
1.60 - 1.64 65.8% 63.3% 120 1.62x 5.723%
1.65 - 1.69 69.1% 66.7% 118 1.68x 5.727%
1.70 - 1.74 65.3% 65.3% 116 1.73x 5.460%
1.75 - 1.79 55.8% 36.9% 119 1.75x 5.619%
1.85 - 1.89 69.4% 69.4% 120 1.85x 5.450%
1.90 - 1.94 56.3% 52.9% 120 1.92x 5.461%
1.95 - 1.99 45.1% 45.1% 59 1.97x 5.305%
2.00 - 2.04 60.0% 60.0% 117 2.01x 5.870%
2.15 - 2.19 58.3% 58.3% 119 2.15x 5.425%
2.30 - 2.44 51.8% 51.8% 99 2.37x 5.453%
68.5% 66.6% 110 1.57x 5.729%
- ----------
* Calculated with respect to the Anticipated Repayment Date for ARD Loans.
B-10
WACHOVIA BANK COMMERCIAL MORTGAGE TRUST SERIES 2006-C29
ANNEX B
RANGE OF UNDERWRITTEN DSC RATIOS FOR LOAN GROUP 1 MORTGAGE LOANS AS OF THE
CUT-OFF DATE
% OF
AGGREGATE CUT-OFF AVERAGE MAXIMUM
NUMBER OF CUT-OFF DATE CUT-OFF CUT-OFF
RANGE OF UNDERWRITTEN MORTGAGE DATE GROUP 1 DATE DATE
DSC RATIOS (x) LOANS BALANCE BALANCE BALANCE BALANCE
- -------------------------------------------------------------------------------------
1.04 - 1.14 1 $ 100,000,000 3.7% $100,000,000 $100,000,000
1.15 - 1.19 2 30,080,600 1.1 $ 15,040,300 $ 22,400,000
1.20 - 1.24 21 241,960,972 9.1 $ 11,521,951 $ 52,000,000
1.25 - 1.29 10 110,210,000 4.1 $ 11,021,000 $ 37,000,000
1.30 - 1.34 13 359,532,796 13.5 $ 27,656,369 $129,000,000
1.35 - 1.39 11 564,001,000 21.1 $ 51,272,818 $318,976,000
1.40 - 1.44 10 107,322,511 4.0 $ 10,732,251 $ 30,750,000
1.45 - 1.49 5 69,646,722 2.6 $ 13,929,344 $ 18,750,000
1.50 - 1.54 5 38,450,000 1.4 $ 7,690,000 $ 17,500,000
1.55 - 1.59 2 45,700,000 1.7 $ 22,850,000 $ 28,200,000
1.60 - 1.64 3 25,043,000 0.9 $ 8,347,667 $ 16,043,000
1.65 - 1.69 3 46,450,000 1.7 $ 15,483,333 $ 25,025,000
1.70 - 1.74 3 44,425,000 1.7 $ 14,808,333 $ 28,275,000
1.75 - 1.79 2 16,837,000 0.6 $ 8,418,500 $ 10,137,000
1.85 - 1.89 1 12,000,000 0.4 $ 12,000,000 $ 12,000,000
1.90 - 1.94 2 12,056,000 0.5 $ 6,028,000 $ 10,200,000
1.95 - 1.99 2 207,690,000 7.8 $103,845,000 $205,000,000
2.00 - 2.04 1 840,000 0.0 $ 840,000 $ 840,000
2.15 - 2.19 2 185,000,000 6.9 $ 92,500,000 $150,000,000
2.30 - 2.44 3 455,017,103 17.0 $151,672,368 $233,977,430
--- -------------- -----
102 $2,672,262,705 100.0% $ 26,198,654 $318,976,000
=== ============== =====
WTD. AVG.
STATED
WTD. AVG. REMAINING WTD. AVG.
CUT-OFF WTD. AVG. TERM TO CUT-OFF WTD. AVG.
RANGE OF UNDERWRITTEN DATE LTV LTV RATIO MATURITY DATE DSC MORTGAGE
DSC RATIOS (x) RATIO AT MATURITY * (MOS.) * RATIO RATE
- ----------------------------------------------------------------------------------
1.04 - 1.14 80.0% 80.0% 120 1.04x 5.760%
1.15 - 1.19 68.7% 62.7% 119 1.18x 6.110%
1.20 - 1.24 77.3% 73.8% 117 1.21x 5.923%
1.25 - 1.29 74.7% 68.7% 119 1.27x 5.900%
1.30 - 1.34 77.4% 70.8% 116 1.32x 5.877%
1.35 - 1.39 75.5% 75.0% 119 1.38x 5.931%
1.40 - 1.44 71.9% 69.8% 119 1.41x 5.799%
1.45 - 1.49 77.1% 76.5% 120 1.47x 5.784%
1.50 - 1.54 68.7% 67.4% 119 1.52x 5.752%
1.55 - 1.59 68.8% 68.8% 118 1.57x 5.544%
1.60 - 1.64 65.8% 63.3% 120 1.62x 5.723%
1.65 - 1.69 69.1% 66.7% 118 1.68x 5.727%
1.70 - 1.74 65.3% 65.3% 116 1.73x 5.460%
1.75 - 1.79 55.8% 36.9% 119 1.75x 5.619%
1.85 - 1.89 69.4% 69.4% 120 1.85x 5.450%
1.90 - 1.94 45.0% 36.9% 119 1.90x 5.731%
1.95 - 1.99 45.1% 45.1% 59 1.97x 5.305%
2.00 - 2.04 60.0% 60.0% 117 2.01x 5.870%
2.15 - 2.19 58.3% 58.3% 119 2.15x 5.425%
2.30 - 2.44 51.8% 51.8% 99 2.37x 5.453%
67.4% 65.4% 110 1.63x 5.715%
- ----------
* Calculated with respect to the Anticipated Repayment Date for ARD Loans.
B-11
WACHOVIA BANK COMMERCIAL MORTGAGE TRUST SERIES 2006-C29
ANNEX B
RANGE OF UNDERWRITTEN DSC RATIOS FOR LOAN GROUP 2 MORTGAGE LOANS AS OF THE
CUT-OFF DATE
% OF
AGGREGATE CUT-OFF AVERAGE MAXIMUM
NUMBER OF CUT-OFF DATE CUT-OFF CUT-OFF
RANGE OF UNDERWRITTEN MORTGAGE DATE GROUP 2 DATE DATE
DSC RATIOS (X) LOANS BALANCE BALANCE BALANCE BALANCE
- -----------------------------------------------------------------------------------
1.17 - 1.19 1 $ 7,000,000 1.0% $ 7,000,000 $ 7,000,000
1.20 - 1.24 10 240,996,469 34.5 $24,099,647 $65,050,000
1.25 - 1.29 9 121,825,000 17.4 $13,536,111 $24,475,000
1.30 - 1.34 7 135,445,000 19.4 $19,349,286 $56,800,000
1.35 - 1.39 6 71,980,000 10.3 $11,996,667 $22,100,000
1.40 - 1.44 2 33,230,000 4.8 $16,615,000 $30,315,000
1.45 - 1.49 1 14,700,000 2.1 $14,700,000 $14,700,000
1.55 - 1.59 3 57,650,000 8.2 $19,216,667 $33,150,000
1.90 - 1.94 1 16,185,000 2.3 $16,185,000 $16,185,000
--- ------------ -----
40 $699,011,469 100.0% $17,475,287 $65,050,000
=== ============ =====
WTD. AVG.
STATED
WTD. AVG. REMAINING WTD. AVG.
CUT-OFF WTD. AVG. TERM TO CUT-OFF WTD. AVG.
RANGE OF UNDERWRITTEN DATE LTV LTV RATIO MATURITY DATE DSC MORTGAGE
DSC RATIOS (x) RATIO AT MATURITY * (MOS.) * RATIO RATE
- --------------------------------------------------------------------------------
1.17 - 1.19 56.0% 0.0% 240 1.17x 5.830%
1.20 - 1.24 72.3% 70.1% 119 1.22x 5.601%
1.25 - 1.29 72.5% 70.0% 90 1.27x 5.968%
1.30 - 1.34 77.1% 76.6% 119 1.33x 5.839%
1.35 - 1.39 77.1% 77.1% 88 1.37x 5.939%
1.40 - 1.44 68.8% 68.8% 65 1.40x 6.035%
1.45 - 1.49 74.9% 74.9% 60 1.46x 5.610%
1.55 - 1.59 65.8% 65.8% 120 1.58x 5.851%
1.90 - 1.94 64.7% 64.7% 120 1.94x 5.260%
72.8% 70.9% 108 1.32x 5.782%
- ----------
* Calculated with respect to the Anticipated Repayment Date for ARD Loans.
B-12
WACHOVIA BANK COMMERCIAL MORTGAGE TRUST SERIES 2006-C29
ANNEX B
RANGE OF LTV RATIOS FOR ALL MORTGAGE LOANS AS OF THE CUT-OFF DATE
% OF
AGGREGATE CUT-OFF AVERAGE MAXIMUM
NUMBER OF CUT-OFF DATE CUT-OFF CUT-OFF
RANGE OF CUT-OFF DATE MORTGAGE DATE POOL DATE DATE
LTV RATIOS (%) LOANS BALANCE BALANCE BALANCE BALANCE
- -------------------------------------------------------------------------------------
40.51 - 50.00 5 $ 283,500,000 8.4% $ 56,700,000 $205,000,000
50.01 - 55.00 2 395,017,103 11.7 $197,508,552 $233,977,430
55.01 - 60.00 10 259,090,000 7.7 $ 25,909,000 $150,000,000
60.01 - 65.00 16 197,338,980 5.9 $ 12,333,686 $ 33,150,000
65.01 - 70.00 20 273,817,000 8.1 $ 13,690,850 $ 30,315,000
70.01 - 75.00 32 624,672,000 18.5 $ 19,521,000 $132,000,000
75.01 - 80.00 56 1,330,839,090 39.5 $ 23,764,984 $318,976,000
80.01 - 80.46 1 7,000,000 0.2 $ 7,000,000 $ 7,000,000
--- -------------- -----
142 $3,371,274,173 100.0% $ 23,741,367 $318,976,000
=== ============== =====
WTD. AVG.
STATED
WTD. AVG. REMAINING WTD. AVG.
CUT-OFF WTD. AVG. TERM TO CUT-OFF WTD. AVG.
RANGE OF CUT-OFF DATE DATE LTV LTV RATIO MATURITY DATE DSC MORTGAGE
LTV RATIOS (%) RATIO AT MATURITY * (MOS.) * RATIO RATE
- --------------------------------------------------------------------------------
40.51 - 50.00 45.1% 43.6% 62 2.06x 5.396%
50.01 - 55.00 52.6% 52.6% 105 2.36x 5.432%
55.01 - 60.00 57.9% 55.4% 122 1.92x 5.500%
60.01 - 65.00 63.3% 61.7% 119 1.56x 5.783%
65.01 - 70.00 68.6% 67.4% 104 1.47x 5.792%
70.01 - 75.00 71.9% 68.9% 117 1.30x 5.823%
75.01 - 80.00 79.4% 77.2% 116 1.31x 5.867%
80.01 - 80.46 80.5% 73.9% 119 1.35x 5.880%
68.5% 66.6% 110 1.57x 5.729%
- ----------
* Calculated with respect to the Anticipated Repayment Date for ARD Loans.
B-13
WACHOVIA BANK COMMERCIAL MORTGAGE TRUST SERIES 2006-C29
ANNEX B
RANGE OF LTV RATIOS FOR LOAN GROUP 1 MORTGAGE LOANS AS OF THE CUT-OFF DATE
% OF
AGGREGATE CUT-OFF AVERAGE MAXIMUM
NUMBER OF CUT-OFF DATE CUT-OFF CUT-OFF
RANGE OF CUT-OFF DATE MORTGAGE DATE GROUP 1 DATE DATE
LTV RATIOS (%) LOANS BALANCE BALANCE BALANCE BALANCE
- -------------------------------------------------------------------------------------
40.51 - 50.00 5 $ 283,500,000 10.6% $ 56,700,000 $205,000,000
50.01 - 55.00 2 395,017,103 14.8 $197,508,552 $233,977,430
55.01 - 60.00 8 239,890,000 9.0 $ 29,986,250 $150,000,000
60.01 - 65.00 11 123,592,511 4.6 $ 11,235,683 $ 28,275,000
65.01 - 70.00 15 158,927,000 5.9 $ 10,595,133 $ 28,200,000
70.01 - 75.00 22 384,747,000 14.4 $ 17,488,500 $132,000,000
75.01 - 80.00 38 1,079,589,090 40.4 $ 28,410,239 $318,976,000
80.01 - 80.46 1 7,000,000 0.3 $ 7,000,000 $ 7,000,000
--- -------------- -----
102 $2,672,262,705 100.0% $ 26,198,654 $318,976,000
=== ============== =====
WTD. AVG.
STATED
WTD. AVG. REMAINING WTD. AVG.
CUT-OFF WTD. AVG. TERM TO CUT-OFF WTD. AVG.
RANGE OF CUT-OFF DATE DATE LTV LTV RATIO MATURITY DATE DSC MORTGAGE
LTV RATIOS (%) RATIO AT MATURITY * (MOS.) * RATIO RATE
- --------------------------------------------------------------------------------
40.51 - 50.00 45.1% 43.6% 62 2.06x 5.396%
50.01 - 55.00 52.6% 52.6% 105 2.36x 5.432%
55.01 - 60.00 58.1% 57.5% 119 1.98x 5.478%
60.01 - 65.00 62.7% 60.4% 118 1.51x 5.812%
65.01 - 70.00 68.7% 67.0% 118 1.58x 5.701%
70.01 - 75.00 72.1% 68.5% 118 1.34x 5.970%
75.01 - 80.00 79.4% 76.9% 118 1.31x 5.855%
80.01 - 80.46 80.5% 73.9% 119 1.35x 5.880%
67.4% 65.4% 110 1.63x 5.715%
- ----------
* Calculated with respect to the Anticipated Repayment Date for ARD Loans.
B-14
WACHOVIA BANK COMMERCIAL MORTGAGE TRUST SERIES 2006-C29
ANNEX B
RANGE OF LTV RATIOS FOR LOAN GROUP 2 MORTGAGE LOANS AS OF THE CUT-OFF DATE
% OF
AGGREGATE CUT-OFF AVERAGE MAXIMUM
NUMBER OF CUT-OFF DATE CUT-OFF CUT-OFF
RANGE OF CUT-OFF DATE MORTGAGE DATE GROUP 2 DATE DATE
LTV RATIOS (%) LOANS BALANCE BALANCE BALANCE BALANCE
- ---------------------------------------------------------------------------------
55.71 - 60.00 2 $ 19,200,000 2.7% $ 9,600,000 $12,200,000
60.01 - 65.00 5 73,746,469 10.6 $14,749,294 $33,150,000
65.01 - 70.00 5 114,890,000 16.4 $22,978,000 $30,315,000
70.01 - 75.00 10 239,925,000 34.3 $23,992,500 $65,050,000
75.01 - 80.00 18 251,250,000 35.9 $13,958,333 $56,800,000
--- ------------ -----
40 $699,011,469 100.0% $17,475,287 $65,050,000
=== ============ =====
WTD. AVG.
STATED
WTD. AVG. REMAINING WTD. AVG.
CUT-OFF WTD. AVG. TERM TO CUT-OFF WTD. AVG.
RANGE OF CUT-OFF DATE DATE LTV LTV RATIO MATURITY DATE DSC MORTGAGE
LTV RATIOS (%) RATIO AT MATURITY * (MOS.) * RATIO RATE
- --------------------------------------------------------------------------------
55.71 - 60.00 55.8% 29.8% 164 1.23x 5.779%
60.01 - 65.00 64.4% 63.9% 120 1.63x 5.735%
65.01 - 70.00 68.5% 68.0% 84 1.33x 5.918%
70.01 - 75.00 71.6% 69.6% 116 1.24x 5.586%
75.01 - 80.00 79.6% 78.7% 105 1.32x 5.920%
72.8% 70.9% 108 1.32x 5.782%
- ----------
* Calculated with respect to the Anticipated Repayment Date for ARD Loans.
B-15
WACHOVIA BANK COMMERCIAL MORTGAGE TRUST SERIES 2006-C29
ANNEX B
RANGE OF LTV RATIOS FOR ALL MORTGAGE LOANS AS OF THE MATURITY DATE OR
ANTICIPATED REPAYMENT DATE
% OF
AGGREGATE CUT-OFF AVERAGE MAXIMUM
NUMBER OF CUT-OFF DATE CUT-OFF CUT-OFF
RANGE OF MATURITY DATE MORTGAGE DATE POOL DATE DATE
OR ARD LTV RATIOS (%) LOANS BALANCE BALANCE BALANCE BALANCE
- -------------------------------------------------------------------------------------
0.00 - 5.00 2 $ 13,700,000 0.4% $ 6,850,000 $ 7,000,000
30.01 - 40.00 3 18,050,000 0.5 $ 6,016,667 $ 10,200,000
40.01 - 50.00 4 278,700,000 8.3 $69,675,000 $205,000,000
50.01 - 55.00 9 424,711,083 12.6 $47,190,120 $233,977,430
55.01 - 60.00 8 280,640,000 8.3 $35,080,000 $150,000,000
60.01 - 65.00 20 221,565,796 6.6 $11,078,290 $ 33,150,000
65.01 - 70.00 35 496,248,694 14.7 $14,178,534 $ 50,000,000
70.01 - 75.00 32 751,782,600 22.3 $23,493,206 $132,000,000
75.01 - 80.00 29 885,876,000 26.3 $30,547,448 $318,976,000
--- -------------- -----
142 $3,371,274,173 100.0% $23,741,367 $318,976,000
=== ============== =====
WTD. AVG.
STATED
WTD. AVG. REMAINING WTD. AVG.
CUT-OFF WTD. AVG. TERM TO CUT-OFF WTD. AVG.
RANGE OF MATURITY DATE DATE LTV LTV RATIO MATURITY DATE DSC MORTGAGE
OR ARD LTV RATIOS (%) RATIO AT MATURITY * (MOS.) * RATIO RATE
- ---------------------------------------------------------------------------------
0.00 - 5.00 52.0% 0.2% 181 1.46x 5.815%
30.01 - 40.00 46.2% 33.7% 120 1.64x 5.771%
40.01 - 50.00 45.7% 45.3% 61 2.04x 5.390%
50.01 - 55.00 53.3% 52.7% 106 2.30x 5.469%
55.01 - 60.00 59.1% 58.3% 119 1.88x 5.593%
60.01 - 65.00 67.1% 63.4% 119 1.53x 5.732%
65.01 - 70.00 71.0% 67.7% 110 1.37x 5.811%
70.01 - 75.00 75.6% 72.3% 118 1.31x 5.816%
75.01 - 80.00 79.6% 79.6% 114 1.32x 5.881%
68.5% 66.6% 110 1.57x 5.729%
- ----------
* Calculated with respect to the Anticipated Repayment Date for ARD Loans.
B-16
WACHOVIA BANK COMMERCIAL MORTGAGE TRUST SERIES 2006-C29
ANNEX B
RANGE OF LTV RATIOS FOR LOAN GROUP 1 MORTGAGE LOANS AS OF THE MATURITY DATE
OR ANTICIPATED REPAYMENT DATE
% OF
AGGREGATE CUT-OFF AVERAGE MAXIMUM
NUMBER OF CUT-OFF DATE CUT-OFF CUT-OFF
RANGE OF MATURITY DATE MORTGAGE DATE GROUP 1 DATE DATE
OR ARD LTV RATIOS (%) LOANS BALANCE BALANCE BALANCE BALANCE
- -------------------------------------------------------------------------------------
0.33 - 5.00 1 $ 6,700,000 0.3% $ 6,700,000 $ 6,700,000
30.01 - 40.00 3 18,050,000 0.7 $ 6,016,667 $ 10,200,000
40.01 - 50.00 3 266,500,000 10.0 $88,833,333 $205,000,000
50.01 - 55.00 8 421,214,614 15.8 $52,651,827 $233,977,430
55.01 - 60.00 8 280,640,000 10.5 $35,080,000 $150,000,000
60.01 - 65.00 16 151,315,796 5.7 $ 9,457,237 $ 28,275,000
65.01 - 70.00 23 283,083,694 10.6 $12,307,987 $ 49,000,000
70.01 - 75.00 25 575,132,600 21.5 $23,005,304 $132,000,000
75.01 - 80.00 15 669,626,000 25.1 $44,641,733 $318,976,000
--- -------------- -----
102 $2,672,262,705 100.0% $26,198,654 $318,976,000
=== ============== =====
WTD. AVG.
STATED
WTD. AVG. REMAINING WTD. AVG.
CUT-OFF WTD. AVG. TERM TO CUT-OFF WTD. AVG.
RANGE OF MATURITY DATE DATE LTV LTV RATIO MATURITY DATE DSC MORTGAGE
OR ARD LTV RATIOS (%) RATIO AT MATURITY * (MOS.) * RATIO RATE
- ---------------------------------------------------------------------------------
0.33 - 5.00 47.9% 0.3% 120 1.76x 5.800%
30.01 - 40.00 46.2% 33.7% 120 1.64x 5.771%
40.01 - 50.00 45.3% 45.2% 58 2.07x 5.373%
50.01 - 55.00 53.3% 52.6% 106 2.31x 5.465%
55.01 - 60.00 59.1% 58.3% 119 1.88x 5.593%
60.01 - 65.00 68.4% 62.9% 118 1.47x 5.736%
65.01 - 70.00 71.4% 67.7% 117 1.43x 5.813%
70.01 - 75.00 76.6% 72.5% 119 1.32x 5.903%
75.01 - 80.00 79.5% 79.5% 118 1.32x 5.851%
67.4% 65.4% 110 1.63x 5.715%
- ----------
* Calculated with respect to the Anticipated Repayment Date for ARD Loans.
B-17
WACHOVIA BANK COMMERCIAL MORTGAGE TRUST SERIES 2006-C29
ANNEX B
RANGE OF LTV RATIOS FOR LOAN GROUP 2 MORTGAGE LOANS AS OF THE MATURITY DATE
OR ANTICIPATED REPAYMENT DATE
% OF
AGGREGATE CUT-OFF AVERAGE MAXIMUM
NUMBER OF CUT-OFF DATE CUT-OFF CUT-OFF
RANGE OF MATURITY DATE MORTGAGE DATE GROUP 2 DATE DATE
OR ARD LTV RATIOS (%) LOANS BALANCE BALANCE BALANCE BALANCE
- -----------------------------------------------------------------------------------
0.00 - 5.00 1 $ 7,000,000 1.0% $ 7,000,000 $ 7,000,000
40.01 - 50.00 1 12,200,000 1.7 $12,200,000 $12,200,000
50.01 - 55.00 1 3,496,469 0.5 $3,496,469 $ 3,496,469
60.01 - 65.00 4 70,250,000 10.0 $17,562,500 $33,150,000
65.01 - 70.00 12 213,165,000 30.5 $17,763,750 $50,000,000
70.01 - 75.00 7 176,650,000 25.3 $25,235,714 $65,050,000
75.01 - 80.00 14 216,250,000 30.9 $15,446,429 $56,800,000
--- ------------ -----
40 $699,011,469 100.0% $17,475,287 $65,050,000
=== ============ =====
WTD. AVG.
STATED
WTD. AVG. REMAINING WTD. AVG.
CUT-OFF WTD. AVG. TERM TO CUT-OFF WTD. AVG.
RANGE OF MATURITY DATE DATE LTV LTV RATIO MATURITY DATE DSC MORTGAGE
OR ARD LTV RATIOS (%) RATIO AT MATURITY * (MOS.) * RATIO RATE
- ---------------------------------------------------------------------------------
0.00 - 5.00 56.0% 0.0% 240 1.17x 5.830%
40.01 - 50.00 55.7% 46.9% 120 1.26x 5.750%
50.01 - 55.00 63.1% 53.5% 119 1.21x 5.930%
60.01 - 65.00 64.5% 64.5% 120 1.65x 5.725%
65.01 - 70.00 70.5% 67.7% 100 1.28x 5.808%
70.01 - 75.00 72.4% 71.5% 115 1.26x 5.533%
75.01 - 80.00 79.6% 79.6% 102 1.33x 5.976%
72.8% 70.9% 108 1.32x 5.782%
- ----------
* Calculated with respect to the Anticipated Repayment Date for ARD Loans.
B-18
WACHOVIA BANK COMMERCIAL MORTGAGE TRUST SERIES 2006-C29
ANNEX B
RANGE OF MORTGAGE RATES FOR ALL MORTGAGE LOANS
% OF
AGGREGATE CUT-OFF AVERAGE MAXIMUM
NUMBER OF CUT-OFF DATE CUT-OFF CUT-OFF
RANGE OF MORTGAGE DATE POOL DATE DATE
MORTGAGE RATES (%) LOANS BALANCE BALANCE BALANCE BALANCE
- ---------------------------------------------------------------------------------
5.260 - 5.499 13 $ 975,817,103 28.9% $75,062,854 $233,977,430
5.500 - 5.749 40 610,722,972 18.1 $15,268,074 $ 60,000,000
5.750 - 5.999 59 1,235,662,987 36.7 $20,943,440 $318,976,000
6.000 - 6.249 24 469,445,111 13.9 $19,560,213 $132,000,000
6.250 - 6.499 5 64,126,000 1.9 $12,825,200 $ 24,475,000
6.500 - 6.505 1 15,500,000 0.5 $15,500,000 $ 15,500,000
--- -------------- -----
142 $3,371,274,173 100.0% $23,741,367 $318,976,000
=== ============== =====
WTD. AVG.
STATED
WTD. AVG. REMAINING WTD. AVG.
CUT-OFF WTD. AVG. TERM TO CUT-OFF WTD. AVG.
RANGE OF DATE LTV LTV RATIO MATURITY DATE DSC MORTGAGE
MORTGAGE RATES (%) RATIO AT MATURITY* (MOS.)* RATIO RATE
- ----------------------------------------------------------------------------
5.260 - 5.499 55.7% 55.6% 101 2.03x 5.399%
5.500 - 5.749 68.5% 66.0% 108 1.54x 5.637%
5.750 - 5.999 76.6% 73.7% 119 1.33x 5.855%
6.000 - 6.249 73.3% 70.9% 112 1.32x 6.095%
6.250 - 6.499 69.9% 67.6% 98 1.28x 6.344%
6.500 - 6.505 79.9% 79.9% 57 1.25x 6.505%
68.5% 66.6% 110 1.57x 5.729%
- ----------
* Calculated with respect to the Anticipated Repayment Date for ARD Loans.
B-19
WACHOVIA BANK COMMERCIAL MORTGAGE TRUST SERIES 2006-C29
ANNEX B
RANGE OF MORTGAGE RATES FOR LOAN GROUP 1 MORTGAGE LOANS
% OF
AGGREGATE CUT-OFF AVERAGE MAXIMUM
NUMBER OF CUT-OFF DATE CUT-OFF CUT-OFF
RANGE OF MORTGAGE DATE GROUP 1 DATE DATE
MORTGAGE RATES (%) LOANS BALANCE BALANCE BALANCE BALANCE
- ----------------------------------------------------------------------------------
5.280 - 5.499 8 $ 821,182,103 30.7% $102,647,763 $233,977,430
5.500 - 5.749 31 469,097,972 17.6 $ 15,132,193 $ 60,000,000
5.750 - 5.999 44 992,471,518 37.1 $ 22,556,171 $318,976,000
6.000 - 6.249 16 363,910,111 13.6 $ 22,744,382 $132,000,000
6.250 - 6.450 3 25,601,000 1.0 $ 8,533,667 $ 12,300,000
--- -------------- -----
102 $2,672,262,705 100.0% $ 26,198,654 $318,976,000
=== ============== =====
WTD. AVG.
STATED
WTD. AVG. REMAINING WTD. AVG.
CUT-OFF WTD. AVG. TERM TO CUT-OFF WTD. AVG.
RANGE OF DATE LTV LTV RATIO MATURITY DATE DSC MORTGAGE
MORTGAGE RATES (%) RATIO AT MATURITY* (MOS.)* RATIO RATE
- ----------------------------------------------------------------------------
5.280 - 5.499 52.8% 52.8% 97 2.17x 5.389%
5.500 - 5.749 67.3% 65.1% 109 1.63x 5.631%
5.750 - 5.999 77.8% 74.7% 119 1.32x 5.864%
6.000 - 6.249 72.4% 69.2% 119 1.31x 6.110%
6.250 - 6.450 66.6% 63.0% 100 1.29x 6.358%
67.4% 65.4% 110 1.63x 5.715%
- ----------
* Calculated with respect to the Anticipated Repayment Date for ARD Loans.
B-20
WACHOVIA BANK COMMERCIAL MORTGAGE TRUST SERIES 2006-C29
ANNEX B
RANGE OF MORTGAGE RATES FOR LOAN GROUP 2 MORTGAGE LOANS
% OF
AGGREGATE CUT-OFF AVERAGE MAXIMUM
NUMBER OF CUT-OFF DATE CUT-OFF CUT-OFF
RANGE OF MORTGAGE DATE GROUP 2 DATE DATE
MORTGAGE RATES (%) LOANS BALANCE BALANCE BALANCE BALANCE
- ------------------------------------------------------------------------------
5.260 - 5.499 5 $154,635,000 22.1% $30,927,000 $65,050,000
5.500 - 5.749 9 141,625,000 20.3 $15,736,111 $50,000,000
5.750 - 5.999 15 243,191,469 34.8 $16,212,765 $56,800,000
6.000 - 6.249 8 105,535,000 15.1 $13,191,875 $30,315,000
6.250 - 6.499 2 38,525,000 5.5 $19,262,500 $24,475,000
6.500 - 6.505 1 15,500,000 2.2 $15,500,000 $15,500,000
--- ------------ -----
40 $699,011,469 100.0% $17,475,287 $65,050,000
=== ============ =====
WTD. AVG.
STATED
WTD. AVG. REMAINING WTD. AVG.
CUT-OFF WTD. AVG. TERM TO CUT-OFF WTD. AVG.
RANGE OF DATE LTV LTV RATIO MATURITY DATE DSC MORTGAGE
MORTGAGE RATES (%) RATIO AT MATURITY* (MOS.)* RATIO RATE
- ----------------------------------------------------------------------------
5.260 - 5.499 70.8% 70.2% 120 1.30x 5.457%
5.500 - 5.749 72.8% 68.9% 103 1.26x 5.656%
5.750 - 5.999 72.0% 69.6% 117 1.37x 5.814%
6.000 - 6.249 76.6% 76.6% 89 1.37x 6.043%
6.250 - 6.499 72.2% 70.7% 96 1.26x 6.334%
6.500 - 6.505 79.9% 79.9% 57 1.25x 6.505%
72.8% 70.9% 108 1.32x 5.782%
- ----------
* Calculated with respect to the Anticipated Repayment Date for ARD Loans.
B-21
WACHOVIA BANK COMMERCIAL MORTGAGE TRUST SERIES 2006-C29
ANNEX B
RANGE OF ORIGINAL TERMS TO MATURITY OR ANTICIPATED REPAYMENT DATE FOR ALL
MORTGAGE LOANS
% OF
AGGREGATE CUT-OFF AVERAGE MAXIMUM
RANGE OF ORIGINAL TERMS TO NUMBER OF CUT-OFF DATE CUT-OFF CUT-OFF
MATURITY OR ANTICIPATED MORTGAGE DATE POOL DATE DATE
REPAYMENT DATE (MONTHS) LOANS BALANCE BALANCE BALANCE BALANCE
- ------------------------------------------------------------------------------------------
0 - 60 12 $ 430,795,000 12.8% $ 35,899,583 $205,000,000
61 - 84 1 161,039,673 4.8 $161,039,673 $161,039,673
109 - 120 128 2,772,439,500 82.2 $ 21,659,684 $318,976,000
229 - 240 1 7,000,000 0.2 $ 7,000,000 $ 7,000,000
--- -------------- -----
142 $3,371,274,173 100.0% $ 23,741,367 $318,976,000
=== ============== =====
WTD. AVG.
STATED
WTD. AVG. WTD. AVG. REMAINING WTD. AVG.
RANGE OF ORIGINAL TERMS TO CUT-OFF LTV RATIO TERM TO CUT-OFF WTD. AVG.
MATURITY OR ANTICIPATED DATE LTV AT MATURITY DATE DSC MORTGAGE
REPAYMENT DATE (MONTHS) RATIO MATURITY * (MOS.) * RATIO RATE
- ----------------------------------------------------------------------------------
0 - 60 56.3% 56.2% 59 1.79x 5.602%
61 - 84 53.4% 53.4% 84 2.31x 5.420%
109 - 120 71.3% 69.1% 119 1.49x 5.767%
229 - 240 56.0% 0.0% 240 1.17x 5.830%
68.5% 66.6% 110 1.57x 5.729%
- ----------
* Calculated with respect to the Anticipated Repayment Date for ARD Loans.
B-22
WACHOVIA BANK COMMERCIAL MORTGAGE TRUST SERIES 2006-C29
ANNEX B
RANGE OF ORIGINAL TERMS TO MATURITY OR ANTICIPATED REPAYMENT DATE FOR LOAN GROUP
1 MORTGAGE LOANS
% OF
AGGREGATE CUT-OFF AVERAGE MAXIMUM
RANGE OF ORIGINAL TERMS TO NUMBER OF CUT-OFF DATE CUT-OFF CUT-OFF
MATURITY OR ANTICIPATED MORTGAGE DATE GROUP 1 DATE DATE
REPAYMENT DATE (MONTHS) LOANS BALANCE BALANCE BALANCE BALANCE
- ------------------------------------------------------------------------------------------
0 - 60 4 $ 289,930,000 10.8% $ 72,482,500 $205,000,000
61 - 84 1 161,039,673 6.0 $161,039,673 $161,039,673
109 - 120 97 2,221,293,032 83.1 $ 22,899,928 $318,976,000
--- -------------- -----
102 $2,672,262,705 100.0% $ 26,198,654 $318,976,000
=== ============== =====
WTD. AVG.
STATED
WTD. AVG. WTD. AVG. REMAINING WTD. AVG.
RANGE OF ORIGINAL TERMS TO CUT-OFF LTV RATIO TERM TO CUT-OFF WTD. AVG.
MATURITY OR ANTICIPATED DATE LTV AT MATURITY DATE DSC MORTGAGE
REPAYMENT DATE (MONTHS) RATIO MATURITY * (MOS.) * RATIO RATE
- ----------------------------------------------------------------------------------
0 - 60 47.8% 47.7% 58 2.01x 5.416%
61 - 84 53.4% 53.4% 84 2.31x 5.420%
109 - 120 71.0% 68.6% 119 1.54x 5.776%
67.4% 65.4% 110 1.63x 5.715%
- ----------
* Calculated with respect to the Anticipated Repayment Date for ARD Loans.
B-23
WACHOVIA BANK COMMERCIAL MORTGAGE TRUST SERIES 2006-C29
ANNEX B
RANGE OF ORIGINAL TERMS TO MATURITY OR ANTICIPATED REPAYMENT DATE FOR LOAN GROUP
2 MORTGAGE LOANS
% OF
AGGREGATE CUT-OFF AVERAGE MAXIMUM
RANGE OF ORIGINAL TERMS TO NUMBER OF CUT-OFF DATE CUT-OFF CUT-OFF
MATURITY OR ANTICIPATED MORTGAGE DATE GROUP 2 DATE DATE
REPAYMENT DATE (MONTHS) LOANS BALANCE BALANCE BALANCE BALANCE
- --------------------------------------------------------------------------------------
0 - 60 8 $140,865,000 20.2% $17,608,125 $30,315,000
109 - 120 31 551,146,469 78.8 $17,778,918 $65,050,000
229 - 240 1 7,000,000 1.0 $ 7,000,000 $ 7,000,000
--- ------------ -----
40 $699,011,469 100.0% $17,475,287 $65,050,000
=== ============ =====
WTD. AVG.
STATED
WTD. AVG. WTD. AVG. REMAINING WTD. AVG.
RANGE OF ORIGINAL TERMS TO CUT-OFF LTV RATIO TERM TO CUT-OFF WTD. AVG.
MATURITY OR ANTICIPATED DATE LTV AT MATURITY DATE DSC MORTGAGE
REPAYMENT DATE (MONTHS) RATIO MATURITY * (MOS.) * RATIO RATE
- ----------------------------------------------------------------------------------
0 - 60 73.7% 73.7% 59 1.35x 5.985%
109 - 120 72.7% 71.1% 119 1.32x 5.729%
229 - 240 56.0% 0.0% 240 1.17x 5.830%
72.8% 70.9% 108 1.32x 5.782%
- ----------
* Calculated with respect to the Anticipated Repayment Date for ARD Loans.
B-24
WACHOVIA BANK COMMERCIAL MORTGAGE TRUST SERIES 2006-C29
ANNEX B
RANGE OF REMAINING TERMS TO MATURITY OR ANTICIPATED REPAYMENT DATE FOR ALL
MORTGAGE LOANS AS OF THE CUT-OFF DATE
% OF
RANGE OF REMAINING AGGREGATE CUT-OFF AVERAGE MAXIMUM
TERMS TO MATURITY OR NUMBER OF CUT-OFF DATE CUT-OFF CUT-OFF
ANTICIPATED REPAYMENT MORTGAGE DATE POOL DATE DATE
DATE (MONTHS) LOANS BALANCE BALANCE BALANCE BALANCE
- -------------------------------------------------------------------------------------
0 - 60 12 $ 430,795,000 12.8% $ 35,899,583 $205,000,000
61 - 84 1 161,039,673 4.8 $161,039,673 $161,039,673
109 - 120 128 2,772,439,500 82.2 $ 21,659,684 $318,976,000
229 - 240 1 7,000,000 0.2 $ 7,000,000 $ 7,000,000
--- -------------- -----
142 $3,371,274,173 100.0% $ 23,741,367 $318,976,000
=== ============== =====
WTD. AVG.
STATED
RANGE OF REMAINING WTD. AVG. WTD. AVG. REMAINING WTD. AVG.
TERMS TO MATURITY OR CUT-OFF LTV RATIO TERM TO CUT-OFF WTD. AVG.
ANTICIPATED REPAYMENT DATE LTV AT MATURITY DATE DSC MORTGAGE
DATE (MONTHS) RATIO MATURITY * (MOS.) * RATIO RATE
- ------------------------------------------------------------------------------
0 - 60 56.3% 56.2% 59 1.79x 5.602%
61 - 84 53.4% 53.4% 84 2.31x 5.420%
109 - 120 71.3% 69.1% 119 1.49x 5.767%
229 - 240 56.0% 0.0% 240 1.17x 5.830%
68.5% 66.6% 110 1.57x 5.729%
- ----------
* Calculated with respect to the Anticipated Repayment Date for ARD Loans.
B-25
WACHOVIA BANK COMMERCIAL MORTGAGE TRUST SERIES 2006-C29
ANNEX B
RANGE OF REMAINING TERMS TO MATURITY OR ANTICIPATED REPAYMENT DATE FOR LOAN
GROUP 1 MORTGAGE LOANS AS OF THE CUT-OFF DATE
% OF
RANGE OF REMAINING AGGREGATE CUT-OFF AVERAGE MAXIMUM
TERMS TO MATURITY OR NUMBER OF CUT-OFF DATE CUT-OFF CUT-OFF
ANTICIPATED REPAYMENT MORTGAGE DATE GROUP 1 DATE DATE
DATE (MONTHS) LOANS BALANCE BALANCE BALANCE BALANCE
- ------------------------------------------------------------------------------------------
0 - 60 4 $ 289,930,000 10.8% $ 72,482,500 $205,000,000
61 - 84 1 161,039,673 6.0 $161,039,673 $161,039,673
109 - 120 97 2,221,293,032 83.1 $ 22,899,928 $318,976,000
--- -------------- -----
102 $2,672,262,705 100.0% $ 26,198,654 $318,976,000
=== ============== =====
WTD. AVG.
STATED
RANGE OF REMAINING WTD. AVG. REMAINING WTD. AVG.
TERMS TO MATURITY OR CUT-OFF WTD. AVG. TERM TO CUT-OFF WTD. AVG.
ANTICIPATED REPAYMENT DATE LTV LTV RATIO MATURITY DATE DSC MORTGAGE
DATE (MONTHS) RATIO AT MATURITY* (MOS.) * RATIO RATE
- ------------------------------------------------------------------------------------
0 - 60 47.8% 47.7% 58 2.01x 5.416%
61 - 84 53.4% 53.4% 84 2.31x 5.420%
109 - 120 71.0% 68.6% 119 1.54x 5.776%
67.4% 65.4% 110 1.63x 5.715%
- ----------
* Calculated with respect to the Anticipated Repayment Date for ARD Loans.
B-26
WACHOVIA BANK COMMERCIAL MORTGAGE TRUST SERIES 2006-C29
ANNEX B
RANGE OF REMAINING TERMS TO MATURITY OR ANTICIPATED REPAYMENT DATE FOR LOAN
GROUP 2 MORTGAGE LOANS AS OF THE CUT-OFF DATE
% OF
RANGE OF REMAINING AGGREGATE CUT-OFF AVERAGE MAXIMUM
TERMS TO MATURITY OR NUMBER OF CUT-OFF DATE CUT-OFF CUT-OFF
ANTICIPATED REPAYMENT MORTGAGE DATE GROUP 2 DATE DATE
DATE (MONTHS) LOANS BALANCE BALANCE BALANCE BALANCE
- --------------------------------------------------------------------------------------
0 - 60 8 $140,865,000 20.2% $17,608,125 $30,315,000
109 - 120 31 551,146,469 78.8 $17,778,918 $65,050,000
229 - 240 1 7,000,000 1.0 $ 7,000,000 $ 7,000,000
--- ------------ -----
40 $699,011,469 100.0% $17,475,287 $65,050,000
=== ============ =====
WTD. AVG.
STATED
RANGE OF REMAINING WTD. AVG. REMAINING WTD. AVG.
TERMS TO MATURITY OR CUT-OFF WTD. AVG. TERM TO CUT-OFF WTD. AVG.
ANTICIPATED REPAYMENT DATE LTV LTV RATIO MATURITY DATE DSC MORTGAGE
DATE (MONTHS) RATIO AT MATURITY * (MOS.) * RATIO RATE
- -------------------------------------------------------------------------------------
0 - 60 73.7% 73.7% 59 1.35x 5.985%
109 - 120 72.7% 71.1% 119 1.32x 5.729%
229 - 240 56.0% 0.0% 240 1.17x 5.830%
72.8% 70.9% 108 1.32x 5.782%
- ----------
* Calculated with respect to the Anticipated Repayment Date for ARD Loans.
B-27
WACHOVIA BANK COMMERCIAL MORTGAGE TRUST SERIES 2006-C29
ANNEX B
RANGE OF REMAINING AMORTIZATION TERMS FOR ALL MORTGAGE LOANS AS OF THE CUT-OFF
DATE
% OF
AGGREGATE CUT-OFF AVERAGE MAXIMUM
RANGE OF REMAINING NUMBER OF CUT-OFF DATE CUT-OFF CUT-OFF
AMORTIZATION TERMS MORTGAGE DATE POOL DATE DATE
(MONTHS) (1) LOANS BALANCE BALANCE BALANCE BALANCE
- --------------------------------------------------------------------------------------
0 - 120 1 $ 6,700,000 0.2% $ 6,700,000 $ 6,700,000
229 - 264 2 13,250,000 0.4 $ 6,625,000 $ 7,000,000
265 - 300 4 33,100,000 1.0 $ 8,275,000 $ 10,500,000
349 - 360 59 809,625,070 24.0 $13,722,459 $129,000,000
361 - 420 2 42,700,000 1.3 $21,350,000 $ 33,300,000
Non-Amortizing 74 2,465,899,103 73.1 $33,322,961 $318,976,000
--- -------------- -----
142 $3,371,274,173 100.0% $23,741,367 $318,976,000
=== ============== =====
WTD. AVG.
STATED
WTD. AVG. REMAINING WTD. AVG.
RANGE OF REMAINING CUT-OFF WTD. AVG. TERM TO CUT-OFF WTD. AVG.
AMORTIZATION TERMS DATE LTV LTV RATIO MATURITY DATE DSC MORTGAGE
(MONTHS) (1) RATIO AT MATURITY (2) (MOS.) (2) RATIO RATE
- -------------------------------------------------------------------------------------
0 - 120 47.9% 0.3% 120 1.76x 5.800%
229 - 264 55.9% 17.1% 183 1.22x 5.816%
265 - 300 61.8% 49.6% 119 1.62x 5.905%
349 - 360 74.5% 68.2% 118 1.29x 5.875%
361 - 420 76.4% 72.0% 119 1.21x 6.005%
Non-Amortizing 66.6% 66.6% 106 1.67x 5.674%
68.5% 66.6% 110 1.57x 5.729%
- ----------
The weighted average remaining amortization term for all Mortgage Loans
(excluding non-amortizing loans and the loan that varies) is 357 months.
(1) The remaining amortization term shown for any Mortgage Loan that is
interest-only for part of its term does not include the number of months
during which it is interest-only, but rather is the number of months
remaining at the end of such interest-only period.
(2) Calculated with respect to the Anticipated Repayment Date for ARD Loans.
B-28
WACHOVIA BANK COMMERCIAL MORTGAGE TRUST SERIES 2006-C29
ANNEX B
RANGE OF REMAINING AMORTIZATION TERMS FOR LOAN GROUP 1 MORTGAGE LOANS AS OF THE
CUT-OFF DATE