Wells Fargo Commercial Mortgage Securities
Filed: 29 Mar 17, 12:00am
| FREE WRITING PROSPECTUS | ||
| FILED PURSUANT TO RULE 433 | ||
| REGISTRATION FILE NO.: 333-206677-15 | ||

Free Writing Prospectus
Structural and Collateral Term Sheet
$1,008,188,843
(Approximate Initial Pool Balance)
$826,084,000
(Approximate Aggregate Certificate Balance of Offered Certificates)
BANK 2017-BNK4
as Issuing Entity
Wells Fargo Commercial Mortgage Securities, Inc.
as Depositor
Bank of America, National Association
Morgan Stanley Mortgage Capital Holdings LLC
Wells Fargo Bank, National Association
as Sponsors and Mortgage Loan Sellers
Commercial Mortgage Pass-Through Certificates
Series 2017-BNK4
March 28, 2017
| WELLS FARGO SECURITIES | BofA MERRILL | MORGAN |
Co-Lead Manager and | Co-Lead Manager and | Co-Lead Manager and |
Academy Securities
|
STATEMENT REGARDING THIS FREE WRITING PROSPECTUS
The depositor has filed a registration statement (including a prospectus) with the Securities and Exchange Commission (‘‘SEC’’) (SEC File No. 333-206677) for the offering to which this communication relates. Before you invest, you should read the prospectus in the registration statement and other documents the depositor has filed with the SEC for more complete information about the depositor, the issuing entity and this offering. You may get these documents for free by visiting EDGAR on the SEC Web site at www.sec.gov. Alternatively, the depositor, any underwriter, or any dealer participating in the offering will arrange to send you the prospectus after filing if you request it by calling toll free 1-800-745-2063 (8 a.m. – 5 p.m. EST) or by emailing wfs.cmbs@wellsfargo.com.
Nothing in this document constitutes an offer of securities for sale in any jurisdiction where the offer or sale is not permitted. The information contained herein is preliminary as of the date hereof, supersedes any such information previously delivered to you and will be superseded by any such information subsequently delivered and ultimately by the final prospectus relating to the securities. These materials are subject to change, completion, supplement or amendment from time to time.
This free writing prospectus has been prepared by the underwriters for information purposes only and does not constitute, in whole or in part, a prospectus for the purposes of Directive 2003/71/EC (as amended) and/or Part VI of the Financial Services and Markets Act 2000, as amended, or other offering document.
STATEMENT REGARDING ASSUMPTIONS AS TO SECURITIES, PRICING ESTIMATES AND OTHER INFORMATION
The attached information contains certain tables and other statistical analyses (the “Computational Materials”) which have been prepared in reliance upon information furnished by the Mortgage Loan Sellers. Numerous assumptions were used in preparing the Computational Materials, which may or may not be reflected herein. As such, no assurance can be given as to the Computational Materials’ accuracy, appropriateness or completeness in any particular context; or as to whether the Computational Materials and/or the assumptions upon which they are based reflect present market conditions or future market performance. The Computational Materials should not be construed as either projections or predictions or as legal, tax, financial or accounting advice. You should consult your own counsel, accountant and other advisors as to the legal, tax, business, financial and related aspects of a purchase of these securities. Any weighted average lives, yields and principal payment periods shown in the Computational Materials are based on prepayment and/or loss assumptions, and changes in such prepayment and/or loss assumptions may dramatically affect such weighted average lives, yields and principal payment periods. In addition, it is possible that prepayments or losses on the underlying assets will occur at rates higher or lower than the rates shown in the attached Computational Materials. The specific characteristics of the securities may differ from those shown in the Computational Materials due to differences between the final underlying assets and the preliminary underlying assets used in preparing the Computational Materials. The principal amount and designation of any security described in the Computational Materials are subject to change prior to issuance. None of Wells Fargo Securities, LLC, Merrill Lynch, Pierce, Fenner & Smith Incorporated, Morgan Stanley & Co. LLC, Academy Securities, Inc., or any of their respective affiliates, make any representation or warranty as to the actual rate or timing of payments or losses on any of the underlying assets or the payments or yield on the securities. The information in this presentation is based upon management forecasts and reflects prevailing conditions and management’s views as of this date, all of which are subject to change. In preparing this presentation, we have relied upon and assumed, without independent verification, the accuracy and completeness of all information available from public sources or which was provided to us by or on behalf of the Mortgage Loan Sellers or which was otherwise reviewed by us.
This free writing prospectus contains certain forward-looking statements. If and when included in this free writing prospectus, the words “expects”, “intends”, “anticipates”, “estimates” and analogous expressions and all statements that are not historical facts, including statements about our beliefs or expectations, are intended to identify forward-looking statements. Any forward-looking statements are made subject to risks and uncertainties which could cause actual results to differ materially from those stated. Those risks and uncertainties include, among other things, declines in general economic and business conditions, increased competition, changes in demographics, changes in political and social conditions, regulatory initiatives and changes in customer preferences, many of which are beyond our control and the control of any other person or entity related to this offering. The forward-looking statements made in this free writing prospectus are made as of the date stated on the cover. We have no obligation to update or revise any forward-looking statement.
Wells Fargo Securities is the trade name for the capital markets and investment banking services of Wells Fargo & Company and its subsidiaries, including but not limited to Wells Fargo Securities, LLC, a member of NYSE, FINRA, NFA and SIPC, Wells Fargo Prime Services, LLC, a member of FINRA, NFA and SIPC, and Wells Fargo Bank, N.A. Wells Fargo Securities, LLC and Wells Fargo Prime Services, LLC are distinct entities from affiliated banks and thrifts.
IMPORTANT NOTICE REGARDING THE OFFERED CERTIFICATES
The information herein is preliminary and may be supplemented or amended prior to the time of sale. In addition, the Offered Certificates referred to in these materials and the asset pool backing them are subject to modification or revision (including the possibility that one or more classes of certificates may be split, combined or eliminated at any time prior to issuance or availability of a final prospectus) and are offered on a “when, as and if issued” basis.
The underwriters described in these materials may from time to time perform investment banking services for, or solicit investment banking business from, any company named in these materials. The underwriters and/or their affiliates or respective employees may from time to time have a long or short position in any security or contract discussed in these materials.
The information contained herein supersedes any previous such information delivered to any prospective investor and will be superseded by information delivered to such prospective investor prior to the time of sale.
IMPORTANT NOTICE RELATING TO AUTOMATICALLY-GENERATED EMAIL DISCLAIMERS
Any legends, disclaimers or other notices that may appear at the bottom of any email communication to which this free writing prospectus is attached relating to (1) these materials not constituting an offer (or a solicitation of an offer), (2) any representation that these materials are accurate or complete and may not be updated or (3) these materials possibly being confidential, are not applicable to these materials and should be disregarded. Such legends, disclaimers or other notices have been automatically generated as a result of these materials having been sent via Bloomberg or another system.
THE INFORMATION IN THIS STRUCTURAL AND COLLATERAL TERM SHEET IS NOT COMPLETE AND MAY BE AMENDED PRIOR TO THE TIME OF SALE. THIS TERM SHEET IS NOT AN OFFER TO SELL THESE SECURITIES AND IT IS NOT A SOLICITATION OF AN OFFER TO BUY THESE SECURITIES IN ANY JURISDICTION WHERE THE OFFER OR SALE IS NOT PERMITTED.
| 2 |
| BANK 2017-BNK4 | Certificate Structure |
I. Certificate Structure
| Class | Expected Ratings (Fitch/KBRA/Moody’s)(1) | Approximate Initial Certificate Balance or Notional Amount(2) | Approx. Initial Credit Support(3) | Pass-Through Rate Description | Weighted Average Life (Years)(4) | Expected Principal Window(4) | Certificate Principal to Value Ratio(5) | Certificate Principal U/W NOI Debt Yield(6) | ||||||||
| Offered Certificates | ||||||||||||||||
| A-1 | AAAsf/AAA(sf)/Aaa(sf) | $33,805,000 | 30.000% | (7) | 2.68 | 05/17 – 02/22 | 41.4% | 16.1% | ||||||||
| A-2 | AAAsf/AAA(sf)/Aaa(sf) | $88,384,000 | 30.000% | (7) | 4.82 | 02/22 – 02/22 | 41.4% | 16.1% | ||||||||
| A-3 | AAAsf/AAA(sf)/Aaa(sf) | $235,000,000 | 30.000% | (7) | 9.74 | 10/26 – 02/27 | 41.4% | 16.1% | ||||||||
| A-4 | AAAsf/AAA(sf)/Aaa(sf) | $268,432,000 | 30.000% | (7) | 9.85 | 02/27 – 03/27 | 41.4% | 16.1% | ||||||||
| A-SB | AAAsf/AAA(sf)/Aaa(sf) | $44,824,000 | 30.000% | (7) | 7.24 | 02/22 – 10/26 | 41.4% | 16.1% | ||||||||
| A-S | AAAsf/AAA(sf)/Aa3(sf) | $67,045,000 | 23.000% | (7) | 9.91 | 03/27 – 03/27 | 45.5% | 14.7% | ||||||||
| X-A | AAAsf/AAA(sf)/Aaa(sf) | $670,445,000(8) | N/A | Variable(9) | N/A | N/A | N/A | N/A | ||||||||
| X-B | A-sf/AAA(sf)/NR | $155,639,000(10) | N/A | Variable(11) | N/A | N/A | N/A | N/A | ||||||||
| B | AA-sf/AA-(sf)/NR | $43,100,000 | 18.500% | (7) | 9.91 | 03/27 – 03/27 | 48.1% | 13.9% | ||||||||
| C | A-sf/A-(sf)/NR | $45,494,000 | 13.750% | (7) | 9.91 | 03/27 – 03/27 | 51.0% | 13.1% | ||||||||
| Non-Offered Certificates | ||||||||||||||||
| X-D | BBB-sf/BBB-(sf)/NR | $56,270,000(12) | N/A | Variable(13) | N/A | N/A | N/A | N/A | ||||||||
| X-E | BB-sf/BB-(sf)/NR | $21,550,000(14) | N/A | Variable(15) | N/A | N/A | N/A | N/A | ||||||||
| X-F | B-sf/B-(sf)/NR | $10,775,000(16) | N/A | Variable(17) | N/A | N/A | N/A | N/A | ||||||||
| X-G | NR/NR/NR | $43,100,400(18) | N/A | Variable(19) | N/A | N/A | N/A | N/A | ||||||||
| D | BBB-sf/BBB-(sf)/NR | $56,270,000 | 7.875% | (7) | 9.92 | 03/27 – 04/27 | 54.4% | 12.3% | ||||||||
| E | BB-sf/BB-(sf)/NR | $21,550,000 | 5.625% | (7) | 9.99 | 04/27 – 04/27 | 55.8% | 12.0% | ||||||||
| F | B-sf/B-(sf)/NR | $10,775,000 | 4.500% | (7) | 9.99 | 04/27 – 04/27 | 56.4% | 11.8% | ||||||||
| G | NR/NR/NR | $43,100,400 | 0.000% | (7) | 9.99 | 04/27 – 04/27 | 59.1% | 11.3% | ||||||||
| Non-Offered Eligible Vertical Interest | ||||||||||||||||
| RR Interest | NR/NR/NR | $50,409,442.16 | N/A | WAC(20) | 9.01 | 05/17 – 04/27 | N/A | N/A | ||||||||
| Notes: | |
| (1) | The expected ratings presented are those of Fitch Ratings, Inc. (“Fitch”), Kroll Bond Rating Agency, Inc. (“KBRA”) and Moody’s Investors Service, Inc. (“Moody’s”), which the depositor hired to rate the Offered Certificates. One or more other nationally recognized statistical rating organizations that were not hired by the depositor may use information they receive pursuant to Rule 17g-5 under the Securities Exchange Act of 1934, as amended (the “Exchange Act”) or otherwise, to rate or provide market reports and/or published commentary related to the Offered Certificates. We cannot assure you as to what ratings a non-hired nationally recognized statistical rating organization would assign or that its reports will not express differing, possibly negative, views of the mortgage loans and/or the Offered Certificates. The ratings of each Class of Offered Certificates address the likelihood of the timely distribution of interest and, except in the case of the Class X-A and X-B Certificates, the ultimate distribution of principal due on those Classes on or before the Rated Final Distribution Date. See “Risk Factors—Other Risks Relating to the Certificates—Nationally Recognized Statistical Rating Organizations May Assign Different Ratings to the Certificates; Ratings of the Certificates Reflect Only the Views of the Applicable Rating Agencies as of the Dates Such Ratings Were Issued; Ratings May Affect ERISA Eligibility; Ratings May Be Downgraded” and “Ratings” in the Preliminary Prospectus, expected to be dated March 28, 2017 (the “Preliminary Prospectus”). Fitch, KBRA and Moody’s have informed us that the “sf” designation in their ratings represents an identifier for structured finance product ratings. |
| (2) | The certificate balances and notional amounts set forth in the table are approximate. The actual initial certificate balances and notional amounts may be larger or smaller depending on the initial pool balance of the mortgage loans definitively included in the pool of mortgage loans, which aggregate cut-off date balance may be as much as 5% larger or smaller than the amount presented in the Preliminary Prospectus. |
| (3) | The approximate initial credit support with respect to the Class A-1, A-2, A-3, A-4 and A-SB Certificates represents the approximate credit enhancement for the Class A-1, A-2, A-3, A-4 and A-SB Certificates in the aggregate. The RR Interest only provides credit support to the limited extent that losses incurred on the underlying mortgage loans are allocated to it, on the one hand, and to the Offered Certificates and the Non-Offered Certificates, on the other hand,pro rata, in accordance with their respective Percentage Allocation Entitlements. |
| (4) | Weighted Average Lives and Expected Principal Windows are calculated based on an assumed prepayment rate of 0% CPR and the “Structuring Assumptions” described under “Yield and Maturity Considerations—Weighted Average Life” in the Preliminary Prospectus. |
| (5) | The Certificate Principal to Value Ratio for each Class of Certificates (other than the Class A-1, A-2, A-3, A-4 and A-SB Certificates) is calculated as the product of (a) the weighted average Cut-off Date LTV Ratio for the mortgage loans and (b) a fraction, the numerator of which is the total initial Certificate Balance of such Class of Certificates and all Classes of Principal Balance Certificates senior to such Class of Certificates and the denominator of which is the total initial Certificate Balance of all of the Principal Balance Certificates (other than the RR Interest). The Certificate Principal to Value Ratio for each of the Class A-1, A-2, A-3, A-4 and A-SB Certificates is calculated in the aggregate for those Classes as if they were a single Class and is calculated as the product of (a) the weighted average Cut-off Date LTV Ratio for the mortgage loans and (b) a fraction, the numerator of which is the total initial aggregate Certificate Balances of such Classes of Certificates and the denominator of which is the total initial Certificate Balance of all of the Principal Balance Certificates (other than the RR Interest). In any event, however, excess mortgaged property value associated with a mortgage loan will not be available to offset losses on any other mortgage loan. |
| (6) | The Certificate Principal U/W NOI Debt Yield for each Class of Certificates (other than the Class A-1, A-2, A-3, A-4 and A-SB Certificates) is calculated as the product of (a) the weighted average U/W NOI Debt Yield for the mortgage loans and (b) a fraction, the numerator of which is the total initial Certificate Balance of all of the Classes of Principal Balance Certificates (other than the RR Interest) and the denominator of which is the total initial Certificate Balance for such Class of Certificates and all Classes of Principal Balance Certificates senior to such Class of Certificates. The Certificate Principal U/W NOI Debt Yield for each of the Class A-1, A-2, A-3, A-4 and A-SB Certificates is calculated in the aggregate for those Classes as if they were a single Class and is calculated as the product of (a) the weighted average U/W NOI Debt Yield for the mortgage loans and (b) a fraction, the numerator of which is the total initial Certificate Balance of all of the Classes of Principal Balance Certificates (other than the RR Interest) and the denominator of which is the total aggregate initial Certificate Balances for the Class A-1, A-2, A-3, A-4 and A-SB Certificates. In any event, however, cash flow from each mortgaged property supports only the related mortgage loan and will not be available to support any other mortgage loan. |
THE INFORMATION IN THIS STRUCTURAL AND COLLATERAL TERM SHEET IS NOT COMPLETE AND MAY BE AMENDED PRIOR TO THE TIME OF SALE. THIS TERM SHEET IS NOT AN OFFER TO SELL THESE SECURITIES AND IT IS NOT A SOLICITATION OF AN OFFER TO BUY THESE SECURITIES IN ANY JURISDICTION WHERE THE OFFER OR SALE IS NOT PERMITTED.
| 3 |
| BANK 2017-BNK4 | Certificate Structure |
| (7) | The pass-through rates for the Class A-1, A-2, A-3, A-4, A-SB, A-S, B, C, D, E, F and G Certificates in each case will be one of the following: (i) a fixed rateper annum, (ii) a variable rate per annum equal to the weighted average of the net mortgage interest rates on the mortgage loans for the related distribution date, (iii) a variable rateper annum equal to the lesser of (a) a fixed rate and (b) the weighted average of the net mortgage interest rates on the mortgage loans for the related distribution date or (iv) a variable rateper annum equal to the weighted average of the net mortgage interest rates on the mortgage loans for the related distribution date minus a specified percentage. For purposes of the calculation of the weighted average of the net mortgage interest rates on the mortgage loans for each distribution date, the mortgage interest rates will be adjusted as necessary to a 30/360 basis. |
| (8) | The Class X-A Certificates are notional amount certificates. The Notional Amount of the Class X-A Certificates will be equal to the aggregate Certificate Balance of the Class A-1, A-2, A-3, A-4 and A-SB Certificates outstanding from time to time. The Class X-A Certificates will not be entitled to distributions of principal. |
| (9) | The pass-through rate for the Class X-A Certificates for any distribution date will be aper annum rate equal to the excess, if any, of (a) the weighted average of the net mortgage interest rates on the mortgage loans for the related distribution date, over (b) the weighted average of the pass-through rates on the Class A-1, A-2, A-3, A-4 and A-SB Certificates for the related distribution date, weighted on the basis of their respective Certificate Balances outstanding immediately prior to that distribution date. For purposes of the calculation of the weighted average of the net mortgage interest rates on the mortgage loans for each distribution date, the mortgage interest rates will be adjusted as necessary to a 30/360 basis. |
| (10) | The Class X-B Certificates are notional amount certificates. The Notional Amount of the Class X-B Certificates will be equal to the aggregate Certificate Balance of the Class A-S, B and C Certificates outstanding from time to time. The Class X-B Certificates will not be entitled to distributions of principal. |
| (11) | The pass-through rate for the Class X-B Certificates for any distribution date will be aper annum rate equal to the excess, if any, of (a) the weighted average of the net mortgage interest rates on the mortgage loans for the related distribution date, over (b) the weighted average of the pass-through rates on the Class A-S, B and C Certificates for the related distribution date, weighted on the basis of their respective Certificate Balances outstanding immediately prior to that distribution date. For purposes of the calculation of the weighted average of the net mortgage interest rates on the mortgage loans for each distribution date, the mortgage interest rates will be adjusted as necessary to a 30/360 basis. |
| (12) | The Class X-D Certificates are notional amount certificates. The Notional Amount of the Class X-D Certificates will be equal to the Certificate Balance of the Class D Certificates outstanding from time to time. The Class X-D Certificates will not be entitled to distributions of principal. |
| (13) | The pass-through rate for the Class X-D Certificates for any distribution date will be aper annum rate equal to the excess, if any, of (a) the weighted average of the net mortgage interest rates on the mortgage loans for the related distribution date, over (b) the pass-through rate on the Class D Certificates for the related distribution date. For purposes of the calculation of the weighted average of the net mortgage interest rates on the mortgage loans for each distribution date, the mortgage interest rates will be adjusted as necessary to a 30/360 basis. |
| (14) | The Class X-E Certificates are notional amount certificates. The Notional Amount of the Class X-E Certificates will be equal to the Certificate Balance of the Class E Certificates outstanding from time to time. The Class X-E Certificates will not be entitled to distributions of principal. |
| (15) | The pass-through rate for the Class X-E Certificates for any distribution date will be aper annum rate equal to the excess, if any, of (a) the weighted average of the net mortgage interest rates on the mortgage loans for the related distribution date, over (b) the pass-through rate on the Class E Certificates for the related distribution date. For purposes of the calculation of the weighted average of the net mortgage interest rates on the mortgage loans for each distribution date, the mortgage interest rates will be adjusted as necessary to a 30/360 basis. |
| (16) | The Class X-F Certificates are notional amount certificates. The Notional Amount of the Class X-F Certificates will be equal to the Certificate Balance of the Class F Certificates outstanding from time to time. The Class X-F Certificates will not be entitled to distributions of principal. |
| (17) | The pass-through rate for the Class X-F Certificates for any distribution date will be aper annum rate equal to the excess, if any, of (a) the weighted average of the net mortgage interest rates on the mortgage loans for the related distribution date, over (b) the pass-through rate on the Class F Certificates for the related distribution date. For purposes of the calculation of the weighted average of the net mortgage interest rates on the mortgage loans for each distribution date, the mortgage interest rates will be adjusted as necessary to a 30/360 basis. |
| (18) | The Class X-G Certificates are notional amount certificates. The Notional Amount of the Class X-G Certificates will be equal to the Certificate Balance of the Class G Certificates outstanding from time to time. The Class X-G Certificates will not be entitled to distributions of principal. |
| (19) | The pass-through rate for the Class X-G Certificates for any distribution date will be aper annum rate equal to the excess, if any, of (a) the weighted average of the net mortgage interest rates on the mortgage loans for the related distribution date, over (b) the pass-through rate on the Class G Certificates for the related distribution date. For purposes of the calculation of the weighted average of the net mortgage interest rates on the mortgage loans for each distribution date, the mortgage interest rates will be adjusted as necessary to a 30/360 basis. |
| (20) | The effective interest rate for the RR Interest will be the weighted average of the net mortgage interest rates on the mortgage loans for the related distribution date, the mortgage interest rates will be adjusted as necessary to a 30/360 basis. |
THE INFORMATION IN THIS STRUCTURAL AND COLLATERAL TERM SHEET IS NOT COMPLETE AND MAY BE AMENDED PRIOR TO THE TIME OF SALE. THIS TERM SHEET IS NOT AN OFFER TO SELL THESE SECURITIES AND IT IS NOT A SOLICITATION OF AN OFFER TO BUY THESE SECURITIES IN ANY JURISDICTION WHERE THE OFFER OR SALE IS NOT PERMITTED.
| 4 |
| BANK 2017-BNK4 | Transaction Highlights |
II. Transaction Highlights
Mortgage Loan Sellers:
| Mortgage Loan Seller | Number of Mortgage Loans | Number of Mortgaged Properties | Aggregate Cut-off Date Balance | % of Initial Pool Balance | |||||
| Bank of America, National Association(1) | 17 | 20 | $427,856,282 | 42.4 | % | ||||
| Morgan Stanley Mortgage Capital Holdings LLC(2) | 17 | 28 | 296,069,149 | 29.4 | |||||
| Wells Fargo Bank, National Association(3) | 14 | 16 | 284,263,413 | 28.2 | |||||
| Total | 48 | 64 | $1,008,188,843 | 100.0 | % | ||||
| (1) | The mortgage loan secured by the mortgaged property identified on Annex A-1 to the Preliminary Prospectus as The Summit Birmingham, representing approximately 6.1% of the aggregate principal balance of the pool of mortgage loans as of the cut-off date, is part of a whole loan that was co-originated by Barclays Bank PLC (“Barclays”) and BANA. The mortgage loan secured by the mortgaged property identified on Annex A-1 to the Preliminary Prospectus as Key Center Cleveland, representing approximately 4.0% of the aggregate principal balance of the pool of mortgage loans as of the cut-off date, is part of a whole loan that was co-originated by Citi Real Estate Funding Inc. (“Citi”), Deutsche Bank AG, New York Branch (“DB”) and BANA. |
| (2) | The mortgage loan secured by the mortgaged property identified on Annex A-1 to the Preliminary Prospectus as Pentagon Center, representing approximately 5.5% of the aggregate principal balance of the pool of mortgage loans as of the cut-off date, is part of a whole loan that was co-originated by Goldman Sachs Mortgage Company (“GSMC”) and Morgan Stanley Bank, N.A. (“MSBNA”). The mortgage loan, consisting of Note A-4, Note A-5 and Note A-6, is expected to be acquired by MSMCH prior to the closing date, and will be sold by MSMCH into the BANK 2017-BNK4 securitization. The mortgage loan secured by the mortgaged property identified on Annex A-1 to the Preliminary Prospectus as Merrill Lynch Drive, representing approximately 4.1% of the aggregate principal balance of the pool of mortgage loans as of the cut-off date, is part of a whole loan that was co-originated by Barclays and MSBNA. The mortgage loan, consisting of Note A-3, is expected to be acquired by MSMCH prior to the closing date, and will be sold by MSMCH into the BANK 2017-BNK4 securitization. |
| (3) | The mortgage loan secured by the mortgaged property identified on Annex A-1 to the Preliminary Prospectus as One West 34th Street, representing approximately 6.0% of the aggregate principal balance of the pool of mortgage loans as of the cut-off date, is part of a whole loan that was co-originated by GSMC and WFB. |
Loan Pool:
| Initial Pool Balance: | $1,008,188,843 |
| Number of Mortgage Loans: | 48 |
| Average Cut-off Date Balance per Mortgage Loan: | $21,003,934 |
| Number of Mortgaged Properties: | 64 |
| Average Cut-off Date Balance per Mortgaged Property(1): | $15,752,951 |
| Weighted Average Mortgage Interest Rate: | 4.848% |
| Ten Largest Mortgage Loans as % of Initial Pool Balance: | 52.5% |
| Weighted Average Original Term to Maturity or ARD (months): | 114 |
| Weighted Average Remaining Term to Maturity or ARD (months): | 113 |
| Weighted Average Original Amortization Term (months)(2): | 336 |
| Weighted Average Remaining Amortization Term (months)(2): | 335 |
| Weighted Average Seasoning (months): | 2 |
| (1) | Information regarding mortgage loans secured by multiple properties is based on an allocation according to relative appraised values or the allocated loan amounts or property-specific release prices set forth in the related loan documents or such other allocation as the related mortgage loan seller deemed appropriate. |
| (2) | Excludes any mortgage loan that does not amortize. |
Credit Statistics:
| Weighted Average U/W Net Cash Flow DSCR(1): | 1.83x |
| Weighted Average U/W Net Operating Income Debt Yield(1): | 11.3% |
| Weighted Average Cut-off Date Loan-to-Value Ratio(1): | 59.1% |
| Weighted Average Balloon or ARD Loan-to-Value Ratio(1): | 53.8% |
| % of Mortgage Loans with Additional Subordinate Debt(2): | 21.5% |
| % of Mortgage Loans with Single Tenants(3): | 19.4% |
| (1) | With respect to any mortgage loan that is part of a whole loan, loan-to-value ratio, debt service coverage ratio and debt yield calculations include the relatedpari passucompanion loan(s) but exclude any related subordinate secured loan(s) (unless otherwise stated). The debt service coverage ratio, debt yield and loan-to-value ratio information do not take into account any subordinate debt (whether or not secured by the related mortgaged property), that currently exists or is allowed under the terms of any mortgage loan. The information for each mortgaged property that relates to a mortgage loan that is cross-collateralized or cross-defaulted with one or more other mortgage loans is based upon the principal balance of that mortgage loan, except that the applicable loan-to-value ratio, debt service coverage ratio, and debt yield for each such mortgage loan is based upon the ratio or yield (as applicable) for the aggregate indebtedness evidenced by all loans in the group (without regard to any limitation on the amount of indebtedness secured by any mortgaged property in such cross-collateralized group). On an individual basis, without regard to the cross-collateralization feature, any mortgage loan that is part of a cross-collateralized group of mortgage loans may have a higher loan-to-value ratio, lower debt service coverage ratio and/or lower debt yield than is presented herein. With respect to the mortgage loan secured by the mortgaged property identified on Annex A-1 to the Preliminary Prospectus as D.C. Office Portfolio, all loan-to-value and debt yield calculations are net of the $5,000,000 earnout reserve. See “Description of the Mortgage Pool—Mortgage Pool Characteristics” in the Preliminary Prospectus and Annex A-1 to the Preliminary Prospectus. |
| (2) | The percentage figure expressed as “% of Mortgage Loans with Additional Subordinate Debt” is determined as a percentage of the initial pool balance and does not take into account any future subordinate debt (whether or not secured by the mortgaged property), if any, that may be permitted under the terms of any mortgage loan or the pooling and servicing agreement. See “Description of the Mortgage Pool—Additional Indebtedness—Other Unsecured Indebtedness” in the Preliminary Prospectus. |
| (3) | Excludes mortgage loans that are secured by multiple single tenant properties. |
THE INFORMATION IN THIS STRUCTURAL AND COLLATERAL TERM SHEET IS NOT COMPLETE AND MAY BE AMENDED PRIOR TO THE TIME OF SALE. THIS TERM SHEET IS NOT AN OFFER TO SELL THESE SECURITIES AND IT IS NOT A SOLICITATION OF AN OFFER TO BUY THESE SECURITIES IN ANY JURISDICTION WHERE THE OFFER OR SALE IS NOT PERMITTED.
| 5 |
| BANK 2017-BNK4 | Transaction Highlights |
Loan Structural Features:
Amortization:Based on the Initial Pool Balance, 51.3% of the mortgage pool (35 mortgage loans) has scheduled amortization, as follows:
32.1% (22 mortgage loans) requires amortization during the entire loan term; and
19.2% (13 mortgage loans) provides for an interest-only period followed by an amortization period.
Interest-Only:Based on the Initial Pool Balance, 48.7% of the mortgage pool (13 mortgage loans) provides for interest-only payments during the entire loan term. The weighted average Cut-off Date Loan-to-Value Ratio and weighted average U/W Net Cash Flow DSCR for those mortgage loans are 56.7% and 2.00x, respectively.
Hard Lockboxes: Based on the Initial Pool Balance, 69.9% of the mortgage pool (22 mortgage loans) has hard lockboxes in place.
Reserves:The mortgage loans require amounts to be escrowed monthly as follows (excluding any mortgage loans with springing provisions):
| Real Estate Taxes: | 68.8% of the pool |
| Insurance: | 40.9% of the pool |
| Capital Replacements: | 61.4% of the pool |
| TI/LC: | 60.3% of the pool(1) |
| (1) | The percentage of Initial Pool Balance for mortgage loans with TI/LC reserves is based on the aggregate principal balance allocable to loans that include office, retail, industrial and mixed-use properties. |
Call Protection/Defeasance: Based on the Initial Pool Balance, the mortgage pool has the following call protection and defeasance features:
91.0% of the mortgage pool (44 mortgage loans) features a lockout period, then defeasance only until an open period;
4.9% of the mortgage pool (three mortgage loans) features a lockout period, then the greater of a prepayment premium or yield maintenance until an open period; and
4.1% of the mortgage pool (one mortgage loan) features no lockout period, but requires the greater of a prepayment premium or yield maintenance until an open period.
Prepayment restrictions for each mortgage loan reflect the entire life of the mortgage loan. Please refer to Annex A-1 to the Preliminary Prospectus and the footnotes related thereto for further information regarding individual loan call protection applicable to each mortgage loan.
THE INFORMATION IN THIS STRUCTURAL AND COLLATERAL TERM SHEET IS NOT COMPLETE AND MAY BE AMENDED PRIOR TO THE TIME OF SALE. THIS TERM SHEET IS NOT AN OFFER TO SELL THESE SECURITIES AND IT IS NOT A SOLICITATION OF AN OFFER TO BUY THESE SECURITIES IN ANY JURISDICTION WHERE THE OFFER OR SALE IS NOT PERMITTED.
| 6 |
| BANK 2017-BNK4 | Issue Characteristics |
| III. | Issue Characteristics |
| Securities Offered: | $826,084,000 approximate monthly pay, multi-class, commercial mortgage REMIC pass-through certificates consisting of ten classes (Classes A-1, A-2, A-3, A-4, A-SB, A-S, B, C, X-A and X-B), which are offered pursuant to a registration statement filed with the SEC (such classes of certificates, the “Offered Certificates”). |
| Mortgage Loan Sellers: | Bank of America, National Association (“BANA”) Morgan Stanley Mortgage Capital Holdings LLC (“MSMCH”) and Wells Fargo Bank, National Association (“WFB”). |
| Joint Bookrunners and Co-Lead Managers: | Wells Fargo Securities, LLC, Merrill Lynch, Pierce, Fenner & Smith Incorporated and Morgan Stanley & Co. LLC |
| Co-Manager: | Academy Securities Inc. |
| Rating Agencies: | Fitch Ratings, Inc., Kroll Bond Rating Agency, Inc. and Moody’s Investors Service, Inc. |
| Master Servicer: | Wells Fargo Bank, National Association |
| Special Servicer: | Rialto Capital Advisors, LLC |
| Certificate Administrator: | Wells Fargo Bank, National Association |
| Trustee: | Wilmington Trust, National Association |
| Operating Advisor: | Pentalpha Surveillance LLC |
| Asset Representations Reviewer: | Pentalpha Surveillance LLC |
| U.S. Credit Risk Retention: | For a discussion of the manner in which the U.S. credit risk retention requirements are being addressed by Wells Fargo Bank, National Association, as the retaining sponsor, see “Credit Risk Retention” in the Preliminary Prospectus. |
| EU Risk Retention: | For a discussion of the manner in which each of Bank of America, National Association, Morgan Stanley Bank, N.A. and Wells Fargo Bank, National Association will covenant and represent to each other, the issuing entity and the trustee to retain a material net economic interest in the securitization for the purpose of the EU risk retention requirements and due diligence requirements, see “EU Securitization Risk Retention Requirements” in the Preliminary Prospectus. |
| Risk Retention Consultation Party: | Wells Fargo Bank, National Association |
| Initial Majority Controlling Class Certificateholder: | RREF III Debt AIV, LP or another affiliate of Rialto Capital Advisors, LLC. |
| Cut-off Date: | The Cut-off Date with respect to each mortgage loan is the due date for the monthly debt service payment that is due in April 2017 (or, in the case of any mortgage loan that has its first due date in May 2017, the date that would have been its due date in April 2017 under the terms of that mortgage loan if a monthly debt service payment were scheduled to be due in that month). |
| Expected Closing Date: | On or about April 19, 2017. |
| Determination Dates: | The 11th day of each month (or if that day is not a business day, the next succeeding business day), commencing in May 2017. |
| Distribution Dates: | The fourth business day following the Determination Date in each month, commencing in May 2017. |
| Rated Final Distribution Date: | The Distribution Date in May 2050. |
| Interest Accrual Period: | With respect to any Distribution Date, the calendar month immediately preceding the month in which such Distribution Date occurs. |
| Day Count: | The Offered Certificates will accrue interest on a 30/360 basis. |
| Minimum Denominations: | $10,000 for each Class of Offered Certificates (other than the Class X-A and X-B Certificates) and $1,000,000 for the Class X-A and X-B Certificates. Investments may also be made in any whole dollar denomination in excess of the applicable minimum denomination. |
THE INFORMATION IN THIS STRUCTURAL AND COLLATERAL TERM SHEET IS NOT COMPLETE AND MAY BE AMENDED PRIOR TO THE TIME OF SALE. THIS TERM SHEET IS NOT AN OFFER TO SELL THESE SECURITIES AND IT IS NOT A SOLICITATION OF AN OFFER TO BUY THESE SECURITIES IN ANY JURISDICTION WHERE THE OFFER OR SALE IS NOT PERMITTED.
| 7 |
| BANK 2017-BNK4 | Issue Characteristics |
| Clean-up Call: | 1.0% |
| Delivery: | DTC, Euroclear and Clearstream Banking |
| ERISA/SMMEA Status: | Each Class of Offered Certificates is expected to be eligible for exemptive relief under ERISA. No Class of Offered Certificates will be SMMEA eligible. |
| Risk Factors: | THE CERTIFICATES INVOLVE CERTAIN RISKS AND MAY NOT BE SUITABLE FOR ALL INVESTORS. SEE THE “RISK FACTORS” SECTION OF THE PRELIMINARY PROSPECTUS. |
| Bond Analytics Information: | The Certificate Administrator will be authorized to make distribution date statements, CREFC® reports and certain supplemental reports (other than confidential information) available to certain financial modeling and data provision services, including Bloomberg, L.P., Trepp, LLC, Intex Solutions, Inc., Markit Group Limited, Interactive Data Corp., BlackRock Financial Management, Inc., CMBS.com, Inc., Moody’s Analytics and Thomson Reuters Corporation. |
THE INFORMATION IN THIS STRUCTURAL AND COLLATERAL TERM SHEET IS NOT COMPLETE AND MAY BE AMENDED PRIOR TO THE TIME OF SALE. THIS TERM SHEET IS NOT AN OFFER TO SELL THESE SECURITIES AND IT IS NOT A SOLICITATION OF AN OFFER TO BUY THESE SECURITIES IN ANY JURISDICTION WHERE THE OFFER OR SALE IS NOT PERMITTED.
| 8 |
| BANK 2017-BNK4 | Characteristics of the Mortgage Pool |
| IV. | Characteristics of the Mortgage Pool(1) |
| A. | Ten Largest Mortgage Loans |
| Mortgage Loan Seller | Mortgage Loan Name | City | State | Number of Mortgage Loans / Mortgaged Properties | Mortgage Loan Cut-off Date Balance ($) | % of Initial Pool Balance (%) | Property Type | Number of SF/Rooms | Cut-off Date Balance Per SF/Room | Cut-off Date LTV Ratio (%)(2)(3) | Balloon or ARD LTV Ratio (%)(2)(3) | U/W NCF DSCR (x) | U/W NOI Debt Yield (%)(2) | |||||||||||
| BANA | D.C. Office Portfolio | Washington | DC | 1 / 3 | $70,000,000 | 6.9 | % | Office | 328,319 | $320 | 53.5 | % | 53.5 | % | 1.71 | x | 9.3 | % | ||||||
| BANA | The Summit Birmingham | Birmingham | AL | 1 / 1 | 61,875,000 | 6.1 | Retail | 681,245 | 305 | 54.3 | 54.3 | 1.68 | 8.7 | |||||||||||
| WFB | One West 34th Street | New York | NY | 1 / 1 | 60,000,000 | 6.0 | Office | 210,338 | 713 | 53.6 | 53.6 | 1.63 | 7.6 | |||||||||||
| MSMCH | Pentagon Center | Arlington | VA | 1 / 1 | 55,000,000 | 5.5 | Office | 911,818 | 230 | 55.3 | 55.3 | 2.75 | 12.1 | |||||||||||
| MSMCH | JW Marriott Desert Springs | Palm Desert | CA | 1 / 1 | 54,863,232 | 5.4 | Hospitality | 884 | 129,767 | 71.3 | 66.0 | 2.31 | 20.3 | |||||||||||
| WFB | The Davenport | Cambridge | MA | 1 / 1 | 50,000,000 | 5.0 | Office | 230,864 | 455 | 49.1 | 49.1 | 1.86 | 8.6 | |||||||||||
| BANA | Plaza 500 | Alexandria | VA | 1 / 1 | 48,750,000 | 4.8 | Industrial | 502,807 | 97 | 65.0 | 65.0 | 1.79 | 8.7 | |||||||||||
| BANA | U.S. Grant Hotel | San Diego | CA | 1 / 1 | 47,000,000 | 4.7 | Hospitality | 270 | 174,074 | 47.9 | 42.0 | 1.66 | 14.0 | |||||||||||
| MSMCH | Merrill Lynch Drive | Hopewell | NJ | 1 / 1 | 41,440,000 | 4.1 | Office | 553,841 | 187 | 67.7 | 67.7 | 2.95 | 11.8 | |||||||||||
| BANA | Key Center Cleveland | Cleveland | OH | 1 / 1 | 40,000,000 | 4.0 | Mixed Use | 1,369,980 | 161 | 60.8 | 49.6 | 1.59 | 12.3 | |||||||||||
| Top Three Total/Weighted Average | 3 / 5 | $191,875,000 | 19.0 | % | 53.8 | % | 53.8 | % | 1.68 | x | 8.6 | % | ||||||||||||
| Top Five Total/Weighted Average | 5 / 7 | $301,738,232 | 29.9 | % | 57.2 | % | 56.3 | % | 1.99 | x | 11.3 | % | ||||||||||||
| Top Ten Total/Weighted Average | 10 / 12 | $528,928,232 | 52.5 | % | 57.4 | % | 55.5 | % | 1.97 | x | 11.2 | % | ||||||||||||
| Non-Top Ten Total/Weighted Average | 38 / 52 | $479,260,611 | 47.5 | % | 60.9 | % | 52.0 | % | 1.68 | x | 11.4 | % | ||||||||||||
| (1) | With respect to any mortgage loan that is part of a whole loan, Cut-off Date Balance Per SF/Room, loan-to-value ratio, debt service coverage ratio and debt yield calculations include the relatedpari passu companion loan(s) but exclude any related subordinate secured loan(s) (unless otherwise stated). With respect to each mortgage loan, debt service coverage ratio, debt yield and loan-to-value ratio information do not take into account subordinate debt (whether or not secured by the related mortgaged property), if any, that currently exists or is allowed under the terms of such mortgage loan. |
| (2) | With respect to the mortgage loan secured by the mortgaged property identified on Annex A-1 to the Preliminary Prospectus as D.C. Office Portfolio, all loan-to-value and debt yield calculations are net of the $5,000,000 earnout reserve. |
| (3) | With respect to the mortgage loans secured by the mortgaged properties identified on Annex A-1 to the Preliminary Prospectus as The Davenport and Key Center Cleveland, all loan-to-value calculations are based off as-stabilized appraised values. The Cut-off Date LTV Ratio and the Balloon or ARD LTV Ratio based on the as-is appraised values are 51.5% and 51.5%, and 72.3% and 59.0%, respectively for The Davenport and Key Center Cleveland, respectively. |
THE INFORMATION IN THIS STRUCTURAL AND COLLATERAL TERM SHEET IS NOT COMPLETE AND MAY BE AMENDED PRIOR TO THE TIME OF SALE. THIS TERM SHEET IS NOT AN OFFER TO SELL THESE SECURITIES AND IT IS NOT A SOLICITATION OF AN OFFER TO BUY THESE SECURITIES IN ANY JURISDICTION WHERE THE OFFER OR SALE IS NOT PERMITTED.
| 9 |
| BANK 2017-BNK4 | Characteristics of the Mortgage Pool |
| B. | Summary of the Whole Loans |
| Property Name(1) | Note(s) | Related Notes in Loan Group (Original Balance) | Holder of Note / Anticipated Securitization | Lead Servicer for | Current Master Servicer Under Related Securitization Servicing Agreement | Current Special Servicer Under Related Securitization Servicing Agreement |
| D.C. Office Portfolio | A-1 | $70,000,000 | BANK 2017-BNK4 | Yes | Wells Fargo Bank, National Association | Rialto Capital Advisors, LLC |
| A-2 | $35,000,000 | BANA(2) | No | TBD | TBD | |
| The Summit Birmingham | A-1 | $61,875,000 | BANK 2017-BNK4 | No | Wells Fargo Bank, National Association | Rialto Capital Advisors, LLC |
| A-2 | $73,325,000 | BACM 2017-BNK3 | Yes | Wells Fargo Bank, National Association | Midland Loan Services, a Division of PNC Bank, National Association | |
| A-3 | $50,000,000 | BBCMS 2017-C1 | No | Wells Fargo Bank, National Association | Rialto Capital Advisors, LLC | |
| A-4 | $22,800,000 | WFCM 2017-RB1(3) | No | Wells Fargo Bank, National Association | C-III Asset Management LLC | |
| One West 34th Street | A-1 | $60,000,000 | BANK 2017-BNK4 | Yes | Wells Fargo Bank, National Association | Rialto Capital Advisors, LLC |
| A-2 | $30,000,000 | WFB(4) | No | TBD | TBD | |
| A-3 | $60,000,000 | GSMC(5) | No | TBD | TBD | |
| Pentagon Center | A-1 | $25,000,000 | GSMS 2017-GS5 | (6) | Midland Loan Services, a Division of PNC Bank, National Association | Rialto Capital Advisors, LLC |
| A-2 | $80,000,000 | GSMC(7) | (6) | TBD | TBD | |
| A-3 | $50,000,000 | MSBNA(8) | No | TBD | TBD | |
| A-4, A-5 & A-6 | $55,000,000 | BANK 2017-BNK4 | No | Wells Fargo Bank, National Association | Rialto Capital Advisors, LLC | |
| JW Marriott Desert Springs | A-1 | $60,000,000 | BACM 2017-BNK3 | Yes | Wells Fargo Bank, National Association | Midland Loan Services, a Division of PNC Bank, National Association |
| A-2 & A-3 | $55,000,000 | BANK 2017-BNK4 | No | Wells Fargo Bank, National Association | Rialto Capital Advisors, LLC | |
| The Davenport | A-1 | $55,000,000 | WFCM 2017-RB1(3) | Yes | Wells Fargo Bank, National Association | C-III Asset Management LLC |
| A-2 | $50,000,000 | BANK 2017-BNK4 | No | Wells Fargo Bank, National Association | Rialto Capital Advisors, LLC | |
| Merrill Lynch Drive | A-1 | $41,500,000 | BBCMS 2017-C1 | Yes | Wells Fargo Bank, National Association | Rialto Capital Advisors, LLC |
| A-2 | $20,660,000 | WFCM 2017-RB1(3) | No | Wells Fargo Bank, National Association | C-III Asset Management LLC | |
| A-3 | $41,440,000 | BANK 2017-BNK4 | No | Wells Fargo Bank, National Association | Rialto Capital Advisors, LLC | |
| Key Center Cleveland | A-1 | $50,000,000 | CGCMT 2017-P7(9) | Yes | Wells Fargo Bank, National Association | Rialto Capital Advisors, LLC |
| A-2 | $40,000,000 | BANK 2017-BNK4 | No | Wells Fargo Bank, National Association | Rialto Capital Advisors, LLC | |
| A-3 & A-6 | $60,000,000 | JPMDB 2017-C5(10) | No | Midland Loan Services, a Division of PNC Bank, National Association | LNR Partners, LLC | |
| A-4 | $30,000,000 | Citi(11) | No | TBD | TBD | |
| A-5 | $40,000,000 | BANA(12) | No | TBD | TBD | |
| American Greetings HQ | A-1-1 | $38,000,000 | BANK 2017-BNK4 | Yes | Wells Fargo Bank, National Association | Rialto Capital Advisors, LLC |
| A-1-2 | $27,000,000 | MSC 2016-BNK2 | No | Wells Fargo Bank, National Association | C-III Asset Management LLC | |
| A-2 | $27,000,000 | MSBAM 2016-C32 | No | Wells Fargo Bank, National Association | Midland Loan Services, a Division of PNC Bank, National Association | |
| Ralph’s Food Warehouse Portfolio | A-1 | $25,000,000 | BANK 2017-BNK4 | Yes | Wells Fargo Bank, National Association | Rialto Capital Advisors, LLC |
| A-2 | $17,000,000 | MSBNA(13) | No | Wells Fargo Bank, National Association | Rialto Capital Advisors, LLC |
THE INFORMATION IN THIS STRUCTURAL AND COLLATERAL TERM SHEET IS NOT COMPLETE AND MAY BE AMENDED PRIOR TO THE TIME OF SALE. THIS TERM SHEET IS NOT AN OFFER TO SELL THESE SECURITIES AND IT IS NOT A SOLICITATION OF AN OFFER TO BUY THESE SECURITIES IN ANY JURISDICTION WHERE THE OFFER OR SALE IS NOT PERMITTED.
| 10 |
| BANK 2017-BNK4 | Characteristics of the Mortgage Pool |
| (1) | The mortgage loans secured by the mortgaged properties identified on Annex A-1 to the Preliminary Prospectus as D.C. Office Portfolio, The Summit Birmingham, Key Center Cleveland and American Greetings HQ are being contributed to the securitization by BANA. The mortgage loans secured by the mortgaged properties identified on Annex A-1 to the Preliminary Prospectus as One West 34th Street and The Davenport are being contributed to the securitization by WFB. The mortgage loans secured by the mortgaged properties identified on Annex A-1 to the Preliminary Prospectus as Pentagon Center, JW Marriott Desert Springs, Merrill Lynch Drive and Ralph’s Food Warehouse Portfolio are being contributed to the securitization by MSMCH. |
| (2) | The relatedpari passuNote A-2 is currently held by BANA and is expected to be contributed to one or more future securitizations. No assurance can be provided that Note A-2 will not be split further. |
| (3) | The WFCM 2017-RB1 securitization has not yet closed, however, based on a publicly available preliminary prospectus for such securitization, it is expected that (i) the non-controlling Note A-4 of the Summit Birmingham whole loan will be included in that securitization by Barclays, (ii) the controlling Note A-1 of The Davenport whole loan will be included in that securitization by WFB, (iii) the non-controlling Note A-2 of the Merrill Lynch Drive whole loan will be included in that securitization by Barclays and (iv) that securitization will close prior to this transaction. |
| (4) | The relatedpari passuNote A-2 is currently held by WFB and is expected to be contributed to one or more future securitizations. No assurance can be provided that Note A-2 will not be split further. |
| (5) | The relatedpari passuNote A-3 is currently held by GSMC and is expected to be contributed to one or more future securitizations. No assurance can be provided that Note A-3 will not be split further. |
| (6) | The Pentagon Center whole loan is currently being serviced under the GSMS 2017-GS5 pooling and servicing agreement, however, upon the securitization of Note A-2, servicing will shift to the servicing agreement governing the securitization of Note A-2 (the “Pentagon Center Note A-2 Securitization Servicing Agreement”). |
| (7) | The relatedpari passuNote A-2 is currently held by GSMC and is expected to be contributed to one or more future securitizations. No assurance can be provided that Note A-2 will not be split further. |
| (8) | The relatedpari passuNote A-3 is currently held by MSBNA and is expected to be contributed to one or more future securitizations. No assurance can be provided that Note A-3 will not be split further. |
| (9) | The CGCMT 2017-P7 securitization has not yet closed, however, based on a publicly available preliminary prospectus for such securitization, it is expected that (i) the controlling Note A-1 of the Key Center Cleveland whole loan will be included in that securitization by Citi and (ii) that securitization will close prior to this transaction. |
| (10) | The JPMDB 2017-C5 securitization has not yet closed, however, based on a publicly available preliminary prospectus for such securitization, it is expected that (i) the non-controlling Notes A-3 and A-6 of the Key Center Cleveland whole loan will be included in that securitization by DB and (ii) that securitization will close prior to this transaction. |
| (11) | The relatedpari passuNote A-4 is currently held by Citi and is expected to be contributed to one or more future securitizations. No assurance can be provided that Note A-4 will not be split further. |
| (12) | The relatedpari passuNote A-5 is currently held by BANA and is expected to be contributed to one or more future securitizations. No assurance can be provided that Note A-5 will not be split further. |
| (13) | The relatedpari passuNote A-2 is currently held by MSBNA and is expected to be contributed to one or more future securitizations. No assurance can be provided that Note A-2 will not be split further. |
| C. | Mortgage Loans with Additional Secured and Mezzanine Financing |
| Loan No. | Mortgage Loan Seller | Mortgage Loan Name | Mortgage Loan Cut-off Date Balance ($) | % of Initial Pool Balance (%) | Subordinate Debt Cut-off Date Balance ($) | Mezzanine Debt Cut-off Date Balance ($) | Total Debt Interest Rate (%)(1) | Mortgage Loan U/W NCF DSCR (x)(2) | Total Debt U/W NCF DSCR (x) | Mortgage Loan Cut- off Date U/W NOI Debt Yield (%)(2)(3) | Total Debt Cut-off Date U/W NOI Debt Yield (%)(3) | Mortgage Loan Cut-off Date LTV Ratio (%)(2)(3)(4) | Total Debt Cut-off Date LTV Ratio (%)(3)(4) |
| 1 | BANA | D.C. Office Portfolio | $70,000,000 | 6.9% | NAP | $25,000,000 | 5.141% | 1.71x | 1.28x | 9.3% | 7.4% | 53.5% | 66.9% |
| 5 | MSMCH | JW Marriott Desert Springs | 54,863,232 | 5.4 | NAP | 16,000,000 | 5.791 | 2.31 | 1.89 | 20.3 | 17.8 | 71.3 | 81.2 |
| 10 | BANA | Key Center Cleveland | 40,000,000 | 4.0 | NAP | 42,500,000 | 6.515 | 1.59 | 1.17 | 12.3 | 10.3 | 60.8 | 72.5 |
| 12 | BANA | American Greetings HQ(5) | $37,669,589 | 3.7 | $14,708,996 | NAP | 4.755 | 1.45 | 1.11 | 10.8 | 9.3 | 61.3 | 71.2 |
| 25 | MSMCH | Plaza at Milltown Commercial Center | 13,849,834 | 1.4 | NAP | 1,200,000 | 5.732 | 1.28 | 1.07 | 8.5 | 7.8 | 68.0 | 73.9 |
| Total/Weighted Average | $216,382,655 | 21.5% | $14,708,996 | $84,700,000 | 5.530% | 1.77x | 1.37x | 12.9% | 10.9% | 61.6% | 72.8% | ||
| (1) | Total Debt Interest Rate for any specified mortgage loan reflects the weighted average of the interest rates on the respective components of the total debt. |
| (2) | With respect to the D.C. Office Portfolio mortgage loan, The JW Marriott Desert Springs mortgage loan and the Key Center Cleveland mortgage loan, which are each part of a whole loan, the loan-to-value ratio, debt service coverage ratio and debt yield calculations include the relatedpari passu companion loan(s). |
| (3) | With respect to the D.C. Office Portfolio mortgage loan, all loan-to-value and debt yield calculations are net of the $5,000,000 earnout reserve. |
| (4) | With respect to the Key Center Cleveland mortgage loan, all loan-to-value calculations are based off the as-stabilized appraised value. The Cut-off Date LTV Ratio and the Balloon or ARD LTV Ratio percent based on the as-is appraised values are 72.3% and 59.0%, respectively. |
| (5) | For information regarding the American Greetings HQ State of Ohio Subordinate Secured Loan see the description of the American Greetings HQ mortgage loan herein and see also “Description of the Mortgage Pool—Additional Indebtedness—Other Secured Indebtedness” in the Preliminary Prospectus. |
THE INFORMATION IN THIS STRUCTURAL AND COLLATERAL TERM SHEET IS NOT COMPLETE AND MAY BE AMENDED PRIOR TO THE TIME OF SALE. THIS TERM SHEET IS NOT AN OFFER TO SELL THESE SECURITIES AND IT IS NOT A SOLICITATION OF AN OFFER TO BUY THESE SECURITIES IN ANY JURISDICTION WHERE THE OFFER OR SALE IS NOT PERMITTED.
| 11 |
| BANK 2017-BNK4 | Characteristics of the Mortgage Pool |
D. Previous Securitization History(1)
| Loan No. | Mortgage Loan Seller | Mortgage Loan or Mortgaged Property Name | City | State | Property Type | Mortgage Loan or Mortgaged Property Cut-off Date Balance ($) | % of Initial Pool Balance (%) | Previous Securitization | |||||||||
| 1 | BANA | D.C. Office Portfolio | Washington | DC | Office | $70,000,000 | 6.9 | % | WBCMT 2007-C31 | ||||||||
| 4 | MSMCH | Pentagon Center | Arlington | VA | Office | 55,000,000 | 5.5 | (2) | |||||||||
| 13 | WFB | The Shoppes at South Bay | Torrance | CA | Retail | 37,000,000 | 3.7 | CD 2007-CD4 | |||||||||
| 16 | WFB | Preferred Freezer Philadelphia | Philadelphia | PA | Industrial | 24,000,000 | 2.4 | CWCI 2007-C3 | |||||||||
| 19.01 | WFB | SpringHill Suites Boca Raton | Boca Raton | FL | Hospitality | 9,250,000 | 0.9 | LBUBS 2003-C8 | |||||||||
| 19.02 | WFB | TownePlace Suites Boca Raton | Boca Raton | FL | Hospitality | 5,750,000 | 0.6 | LBUBS 2003-C8 | |||||||||
| 19.03 | WFB | TownePlace Suites Ft Lauderdale West | Fort Lauderdale | FL | Hospitality | 5,000,000 | 0.5 | LBUBS 2003-C8 | |||||||||
| 24 | BANA | King Plaza Center | Daly City | CA | Retail | 16,000,000 | 1.6 | MSC 2007-T27 | |||||||||
| 25 | MSMCH | Plaza at Milltown Commercial Center | Waipahu | HI | Mixed Use | 13,849,834 | 1.4 | UBSBB 2012-C4 | |||||||||
| 27 | WFB | Hilton Garden Inn Chattanooga Downtown | Chattanooga | TN | Hospitality | 11,986,732 | 1.2 | BACM 2007-3 | |||||||||
| 29 | WFB | Crossroads Shopping Center- Bakersfield | Bakersfield | CA | Retail | 8,853,000 | 0.9 | CGCMT 2007-C6 | |||||||||
| 32 | BANA | Alameda Apartments | Alameda | CA | Multifamily | 7,165,372 | 0.7 | MSC 2006-IQ12 | |||||||||
| 33 | WFB | North Main Self Storage | Manteca | CA | Self Storage | 6,982,307 | 0.7 | BSCMS 2007-T26 | |||||||||
| 37 | BANA | Best Western – Hannaford, OH | Cincinnati | OH | Hospitality | 6,440,508 | 0.6 | CSMC 2007-C3 | |||||||||
| 38 | WFB | Huntsville Commons | Huntsville | AL | Retail | 6,375,000 | 0.6 | WBCMT 2007-C30 | |||||||||
| 40 | MSMCH | Kingwood Forest Apartments | Shreveport | LA | Multifamily | 5,500,000 | 0.5 | BACM 2007-2 | |||||||||
| 42 | MSMCH | Barry Plaza | Chicago | IL | Retail | 5,200,000 | 0.5 | GSMS 2012-GCJ9 | |||||||||
| 43 | WFB | 301-333 S Abbot Avenue | Milpitas | CA | Retail | 4,986,466 | 0.5 | MLCFC 2007-7 | |||||||||
| 45 | WFB | Walgreens Bluffton | Bluffton | SC | Retail | 4,054,908 | 0.4 | CWCI 2007-C2 | |||||||||
| 47 | WFB | Phenix Square | Phenix City | AL | Retail | 2,025,000 | 0.2 | CD 2007-CD4 | |||||||||
| Total | $305,419,126 | 30.3 | % | ||||||||||||||
| (1) | The table above represents the most recent securitization with respect to the mortgaged property securing the related mortgage loan, based on information provided by the related borrower or obtained through searches of a third-party database. While loans secured by the above mortgaged properties may have been securitized multiple times in prior transactions, mortgage loans in this securitization are only listed in the above chart if the mortgage loan paid off a loan in another securitization. The information has not otherwise been confirmed by the mortgage loan sellers. |
| (2) | With respect to the Pentagon Center mortgage loan, the related mortgaged property was previously securitized in the MSC 2007-IQ14, BSCMS 2007-PWR16, WBCMT 2007-C32, WBCMT 2007-C31, BACM 2007-2 and MSC 2007-HQ12 transactions. The Pentagon Center Property was previously financed as part of a 20-property office portfolio financing which was modified and extended in December 2010 by the previous lender. See “Description of the Mortgage Pool — Loan Purpose; Default History, Bankruptcy Issues and Other Proceedings” in the Preliminary Prospectus. |
THE INFORMATION IN THIS STRUCTURAL AND COLLATERAL TERM SHEET IS NOT COMPLETE AND MAY BE AMENDED PRIOR TO THE TIME OF SALE. THIS TERM SHEET IS NOT AN OFFER TO SELL THESE SECURITIES AND IT IS NOT A SOLICITATION OF AN OFFER TO BUY THESE SECURITIES IN ANY JURISDICTION WHERE THE OFFER OR SALE IS NOT PERMITTED.
| 12 |
| BANK 2017-BNK4 | Characteristics of the Mortgage Pool |
E. Mortgage Loans with Scheduled Balloon Payments and Related Classes
Class A-2(1)
| Loan No. | Mortgage Loan Seller | Mortgage Loan Name | State | Property Type | Mortgage Loan Cut-off Date Balance ($) | % of Initial Pool Balance (%) | Mortgage Loan Balance at Maturity ($) | % of Class A-2 Certificate Principal Balance (%)(2) | Rooms /SF | Loan Per Room / SF ($) | U/W NCF DSCR (x) | U/W NOI Debt Yield (%) | Cut-off Date LTV Ratio (%) | Balloon LTV Ratio (%) | Rem. IO Period (mos.) | Rem. Term to Maturity (mos.) | ||||||||||||||||||||||
| 5 | MSMCH | JW Marriott Desert Springs | CA | Hospitality | $54,863,232 | 5.4 | % | $50,832,722 | 57.5 | % | 884 | $129,767 | 2.31 | x | 20.3 | % | 71.3 | % | 66.0 | % | 0 | 58 | ||||||||||||||||
| 9 | MSMCH | Merrill Lynch Drive | NJ | Office | 41,440,000 | 4.1 | 41,440,000 | 46.9 | 553,841 | 187 | 2.95 | 11.8 | 67.7 | 67.7 | 58 | 58 | ||||||||||||||||||||||
| Total/Weighted Average | $96,303,232 | 9.6 | % | $92,272,722 | 104.4 | % | 2.59 | x | 16.6 | % | 69.8 | % | 66.7 | % | 25 | 58 | ||||||||||||||||||||||
| (1) | The table above presents the mortgage loan(s) whose balloon payments would be applied to pay down the principal balance of the Class A-2 Certificates, assuming a 0% CPR and applying the “Structuring Assumptions” described in the Preliminary Prospectus, including the assumptions that (i) none of the mortgage loans in the pool experience prepayments prior to maturity, defaults or losses; (ii) there are no extensions of maturity dates of any mortgage loans in the pool; and (iii) each mortgage loan in the pool is paid in full on its stated maturity date. Each Class of Certificates evidences undivided ownership interests in the entire pool of mortgage loans. Debt service coverage ratio, debt yield and loan-to-value ratio information do not take into account subordinate debt (whether or not secured by the related mortgaged property), if any, that currently exists or is allowed under the terms of any mortgage loan. See Annex A-1 to the Preliminary Prospectus. |
| (2) | Reflects the percentage equal to the Balloon Balance divided by the initial Class A-2 Certificate Balance. |
THE INFORMATION IN THIS STRUCTURAL AND COLLATERAL TERM SHEET IS NOT COMPLETE AND MAY BE AMENDED PRIOR TO THE TIME OF SALE. THIS TERM SHEET IS NOT AN OFFER TO SELL THESE SECURITIES AND IT IS NOT A SOLICITATION OF AN OFFER TO BUY THESE SECURITIES IN ANY JURISDICTION WHERE THE OFFER OR SALE IS NOT PERMITTED.
| 13 |
| BANK 2017-BNK4 | Characteristics of the Mortgage Pool |
F. Property Type Distribution(1)
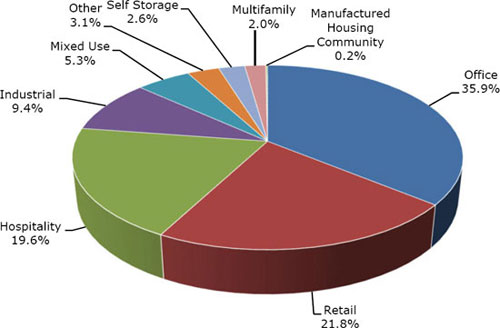
| Property Type | Number of Mortgaged Properties | Aggregate Cut-off Date Balance ($) | % of Initial Pool Balance (%) | Weighted Average Cut-off Date LTV Ratio (%) | Weighted Average Balloon or ARD LTV Ratio (%) | Weighted Average U/W NCF DSCR (x) | Weighted Average U/W NOI Debt Yield (%) | Weighted Average U/W NCF Debt Yield (%) | Weighted Average Mortgage Rate (%) | |||||||||||||||||
| Office | 10 | $362,109,589 | 35.9 | % | 58.0 | % | 55.2 | % | 1.96 | x | 9.9 | % | 9.4 | % | 4.498 | % | ||||||||||
| Suburban | 5 | 182,109,589 | 18.1 | 63.6 | 58.1 | 2.18 | 11.3 | 10.9 | 4.536 | |||||||||||||||||
| CBD | 5 | 180,000,000 | 17.9 | 52.3 | 52.3 | 1.73 | 8.5 | 8.0 | 4.459 | |||||||||||||||||
| Retail | 28 | 220,206,846 | 21.8 | 59.3 | 54.4 | 1.66 | 10.0 | 9.5 | 4.975 | |||||||||||||||||
| Anchored | 12 | 94,592,143 | 9.4 | 60.3 | 54.6 | 1.74 | 10.7 | 10.1 | 5.044 | |||||||||||||||||
| Lifestyle Center | 1 | 61,875,000 | 6.1 | 54.3 | 54.3 | 1.68 | 8.7 | 8.1 | 4.762 | |||||||||||||||||
| Single Tenant | 11 | 40,473,067 | 4.0 | 59.7 | 51.3 | 1.47 | 10.3 | 10.1 | 5.315 | |||||||||||||||||
| Shadow Anchored | 2 | 13,080,171 | 1.3 | 73.7 | 62.7 | 1.43 | 10.0 | 9.1 | 4.902 | |||||||||||||||||
| Unanchored | 2 | 10,186,466 | 1.0 | 59.4 | 54.4 | 1.90 | 10.2 | 9.5 | 4.380 | |||||||||||||||||
| Hospitality | 10 | 197,646,602 | 19.6 | 59.6 | 50.8 | 1.96 | 16.2 | 13.1 | 5.202 | |||||||||||||||||
| Full Service | 5 | 165,706,094 | 16.4 | 60.3 | 52.5 | 1.95 | 16.2 | 12.9 | 5.201 | |||||||||||||||||
| Limited Service | 5 | 31,940,508 | 3.2 | 55.6 | 41.9 | 1.97 | 16.1 | 14.1 | 5.203 | |||||||||||||||||
| Industrial | 6 | 94,502,199 | 9.4 | 63.8 | 61.9 | 1.77 | 9.6 | 9.0 | 4.776 | |||||||||||||||||
| Flex | 4 | 66,002,199 | 6.5 | 64.9 | 63.0 | 1.70 | 9.1 | 8.6 | 4.699 | |||||||||||||||||
| Cold Storage | 1 | 24,000,000 | 2.4 | 60.9 | 60.9 | 2.01 | 10.6 | 10.2 | 4.990 | |||||||||||||||||
| Light Industrial | 1 | 4,500,000 | 0.4 | 63.4 | 51.7 | 1.56 | 10.6 | 9.8 | 4.770 | |||||||||||||||||
| Mixed Use | 2 | 53,849,834 | 5.3 | 62.7 | 51.3 | 1.51 | 11.3 | 10.7 | 5.234 | |||||||||||||||||
| Office/Hospitality/Parking | 1 | 40,000,000 | 4.0 | 60.8 | 49.6 | 1.59 | 12.3 | 11.5 | 5.310 | |||||||||||||||||
| Retail/Office | 1 | 13,849,834 | 1.4 | 68.0 | 56.1 | 1.28 | 8.5 | 8.3 | 5.016 | |||||||||||||||||
| Other | 1 | 31,397,064 | 3.1 | 54.9 | 42.0 | 1.52 | 11.5 | 11.3 | 5.520 | |||||||||||||||||
| Parking Garage | 1 | 31,397,064 | 3.1 | 54.9 | 42.0 | 1.52 | 11.5 | 11.3 | 5.520 | |||||||||||||||||
| Self Storage | 2 | 25,982,307 | 2.6 | 54.0 | 50.9 | 2.06 | 10.0 | 9.8 | 4.538 | |||||||||||||||||
| Self Storage | 2 | 25,982,307 | 2.6 | 54.0 | 50.9 | 2.06 | 10.0 | 9.8 | 4.538 | |||||||||||||||||
| Multifamily | 4 | 20,656,902 | 2.0 | 52.5 | 43.9 | 1.63 | 10.9 | 10.4 | 4.892 | |||||||||||||||||
| Garden | 2 | 12,665,372 | 1.3 | 54.9 | 46.2 | 1.74 | 11.8 | 11.0 | 4.813 | |||||||||||||||||
| Mid Rise | 2 | 7,991,531 | 0.8 | 48.8 | 40.2 | 1.45 | 9.6 | 9.4 | 5.016 | |||||||||||||||||
| Manufactured Housing Community | 1 | 1,837,500 | 0.2 | 69.3 | 59.1 | 1.53 | 10.5 | 10.3 | 5.363 | |||||||||||||||||
| Manufactured Housing Community | 1 | 1,837,500 | 0.2 | 69.3 | 59.1 | 1.53 | 10.5 | 10.3 | 5.363 | |||||||||||||||||
| Total/Weighted Average: | 64 | $1,008,188,843 | 100.0 | % | 59.1 | % | 53.8 | % | 1.83 | x | 11.3 | % | 10.3 | % | 4.848 | % | ||||||||||
Because this table presents information relating to the mortgaged properties and not the mortgage loans, (a) the information for mortgage loans secured by more than one mortgaged property (other than through cross-collateralization with other mortgage loans) is based on allocated amounts (allocating the principal balance of the mortgage loan to each of those properties according to the relative appraised values of the mortgaged properties or the allocated loan amounts or property-specific release prices set forth in the related mortgage loan documents or such other allocation as the related mortgage loan seller deemed appropriate) and (b) the information for each mortgaged property that relates to a mortgage loan that is cross-collateralized or cross-defaulted with other mortgage loans is based upon the principal balance of that mortgage loan, except that the applicable loan-to-value ratio, debt service coverage ratio and debt yield for each such mortgage loan is based upon the ratio or yield (as applicable) for the aggregate indebtedness evidenced by all loans in the group (without regard to any limitation on the amount of indebtedness secured by any mortgaged property in such cross-collateralized group). On an individual basis, without regard to the cross-collateralization feature, any mortgage loan that is part of a cross-collateralized group of mortgage loans may have a higher loan-to-value ratio, lower debt service coverage ratio and/or lower debt yield than is presented herein. With respect to any mortgage loan that is part of a whole loan, the loan-to-value ratio, debt service coverage ratio and debt yield calculations include the relatedpari passu companion loan(s) but exclude any related subordinate secured loan(s) (unless otherwise stated). With respect to each mortgage loan, debt service coverage ratio, debt yield and loan-to-value ratio information do not take into account of any subordinate debt (whether or not secured by the related mortgaged property) that currently exists or is allowed under the terms of such mortgage loan. With respect to the mortgage loan secured by the mortgaged property identified on Annex A-1 to the Preliminary Prospectus as D.C. Office Portfolio, all loan-to-value and debt yield calculations are net of the $5,000,000 earnout reserve. See Annex A-1 to the Preliminary Prospectus.
THE INFORMATION IN THIS STRUCTURAL AND COLLATERAL TERM SHEET IS NOT COMPLETE AND MAY BE AMENDED PRIOR TO THE TIME OF SALE. THIS TERM SHEET IS NOT AN OFFER TO SELL THESE SECURITIES AND IT IS NOT A SOLICITATION OF AN OFFER TO BUY THESE SECURITIES IN ANY JURISDICTION WHERE THE OFFER OR SALE IS NOT PERMITTED.
| 14 |
| BANK 2017-BNK4 | Characteristics of the Mortgage Pool |
G. Geographic Distribution(1)(2)
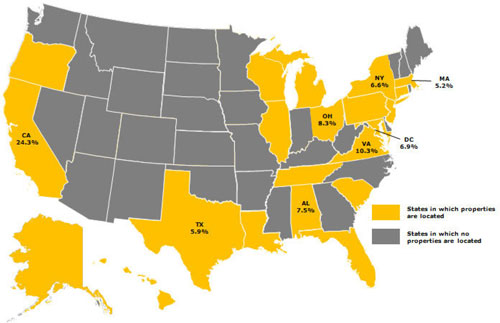
| Location | Number of Mortgaged Properties | Aggregate Cut-off Date Balance ($) | % of Initial Pool Balance (%) | Weighted Average Cut-off Date LTV Ratio (%) | Weighted Average Balloon or ARD LTV Ratio (%) | Weighted Average U/W NCF DSCR (x) | Weighted Average U/W NOI Debt Yield (%) | Weighted Average U/W NCF Debt Yield (%) | Weighted Average Mortgage Rate (%) | |||||||||||||||||
| California | 13 | $244,616,906 | 24.3 | % | 59.8 | % | 55.0 | % | 1.83 | x | 12.8 | % | 10.9 | % | 4.989 | % | ||||||||||
| Southern | 6 | 182,491,232 | 18.1 | 62.3 | 57.3 | 1.79 | 13.8 | 11.2 | 5.118 | |||||||||||||||||
| Northern | 7 | 62,125,674 | 6.2 | 52.5 | 48.3 | 1.92 | 10.2 | 9.8 | 4.610 | |||||||||||||||||
| Virginia | 2 | 103,750,000 | 10.3 | 59.9 | 59.9 | 2.30 | 10.5 | 10.3 | 4.438 | |||||||||||||||||
| Ohio | 3 | 84,110,097 | 8.3 | 61.4 | 47.9 | 1.55 | 11.8 | 11.0 | 5.039 | |||||||||||||||||
| Alabama | 4 | 75,750,000 | 7.5 | 56.9 | 55.4 | 1.62 | 8.9 | 8.3 | 4.830 | |||||||||||||||||
| District of Columbia | 3 | 70,000,000 | 6.9 | 53.5 | 53.5 | 1.71 | 9.3 | 8.7 | 4.758 | |||||||||||||||||
| New York | 2 | 66,825,000 | 6.6 | 54.8 | 54.3 | 1.59 | 7.6 | 7.2 | 4.410 | |||||||||||||||||
| Texas | 6 | 59,441,478 | 5.9 | 62.0 | 51.6 | 1.80 | 13.4 | 11.7 | 5.056 | |||||||||||||||||
| Massachusetts | 2 | 52,295,000 | 5.2 | 49.1 | 49.1 | 1.88 | 8.7 | 8.2 | 4.243 | |||||||||||||||||
| Other(3) | 29 | 251,400,362 | 24.9 | 62.0 | 53.2 | 1.90 | 12.2 | 11.5 | 5.040 | |||||||||||||||||
| Total/Weighted Average | 64 | $1,008,188,843 | 100.0 | % | 59.1 | % | 53.8 | % | 1.83 | x | 11.3 | % | 10.3 | % | 4.848 | % | ||||||||||
| (1) | The mortgaged properties are located in 21 states, the District of Columbia and Puerto Rico. |
| (2) | Because this table presents information relating to the mortgaged properties and not the mortgage loans, (a) the information for mortgage loans secured by more than one mortgaged property (other than through cross-collateralization with other mortgage loans) is based on allocated amounts (allocating the principal balance of the mortgage loan to each of those properties according to the relative appraised values of the mortgaged properties or the allocated loan amounts or property-specific release prices set forth in the related mortgage loan documents or such other allocation as the related mortgage loan seller deemed appropriate), and (b) the information for each mortgaged property that relates to a mortgage loan that is cross-collateralized or cross-defaulted with other mortgage loans is based upon the principal balance of that mortgage loan, except that the applicable loan-to-value ratio, debt service coverage ratio and debt yield for each such mortgage loan is based upon the ratio or yield (as applicable) for the aggregate indebtedness evidenced by all loans in the group (without regard to any limitation on the amount of indebtedness secured by any mortgaged property in such cross-collateralized group). On an individual basis, without regard to the cross-collateralization feature, any mortgage loan that is part of a cross-collateralized group of mortgage loans may have a higher loan-to-value ratio, lower debt service coverage ratio and/or lower debt yield than is presented herein. With respect to any mortgage loan that is part of a whole loan, the loan-to-value ratio, debt service coverage ratio and debt yield calculations include the relatedpari passucompanion loan(s) but exclude any related subordinate secured loan(s) (unless otherwise stated). With respect to each mortgage loan, debt service coverage ratio, debt yield and loan-to-value ratio information do not take into account of any subordinate debt (whether or not secured by the related mortgaged property) that currently exists or is allowed under the terms of such mortgage loan. With respect to the mortgage loan secured by the mortgaged property identified on Annex A-1 to the Preliminary Prospectus as D.C. Office Portfolio, all loan-to-value and debt yield calculations are net of the $5,000,000 earnout reserve. See Annex A-1 to the Preliminary Prospectus. |
| (3) | Includes 14 other states and Puerto Rico. |
THE INFORMATION IN THIS STRUCTURAL AND COLLATERAL TERM SHEET IS NOT COMPLETE AND MAY BE AMENDED PRIOR TO THE TIME OF SALE. THIS TERM SHEET IS NOT AN OFFER TO SELL THESE SECURITIES AND IT IS NOT A SOLICITATION OF AN OFFER TO BUY THESE SECURITIES IN ANY JURISDICTION WHERE THE OFFER OR SALE IS NOT PERMITTED.
| 15 |
| BANK 2017-BNK4 | Characteristics of the Mortgage Pool |
| H. | Characteristics of the Mortgage Pool(1) |
| CUT-OFF DATE BALANCE | |||||||||
| Range of Cut-off Date Balances ($) | Number of Mortgage Loans | Aggregate Cut- off Date Balance | % of Initial Pool Balance | ||||||
| 1,837,500 - 2,000,000 | 1 | $1,837,500 | 0.2 | % | |||||
| 2,000,001 - 3,000,000 | 2 | 4,320,000 | 0.4 | ||||||
| 3,000,001 - 5,000,000 | 3 | 13,541,374 | 1.3 | ||||||
| 5,000,001 - 6,000,000 | 5 | 27,035,000 | 2.7 | ||||||
| 6,000,001 - 7,000,000 | 7 | 46,670,380 | 4.6 | ||||||
| 7,000,001 - 8,000,000 | 4 | 30,578,254 | 3.0 | ||||||
| 8,000,001 - 9,000,000 | 1 | 8,853,000 | 0.9 | ||||||
| 9,000,001 - 15,000,000 | 4 | 49,566,114 | 4.9 | ||||||
| 15,000,001 - 20,000,000 | 3 | 55,000,000 | 5.5 | ||||||
| 20,000,001 - 30,000,000 | 4 | 96,890,754 | 9.6 | ||||||
| 30,000,001 - 50,000,000 | 9 | 372,158,236 | 36.9 | ||||||
| 50,000,001 - 70,000,000 | 5 | 301,738,232 | 29.9 | ||||||
| Total: | 48 | $1,008,188,843 | 100.0 | % | |||||
| Average: | $21,003,934 | ||||||||
| UNDERWRITTEN NOI DEBT SERVICE COVERAGE RATIO | |||||||||
| Range of U/W NOI DSCRs (x) | Number of Mortgage Loans | Aggregate Cut- off Date Balance | % of Initial Pool Balance | ||||||
| 1.21 - 1.30 | 4 | $23,904,908 | 2.4 | % | |||||
| 1.31 - 1.40 | 3 | 31,607,141 | 3.1 | ||||||
| 1.41 - 1.50 | 1 | 7,991,531 | 0.8 | ||||||
| 1.51 - 1.60 | 7 | 114,134,695 | 11.3 | ||||||
| 1.61 - 1.70 | 6 | 88,714,466 | 8.8 | ||||||
| 1.71 - 1.80 | 6 | 193,662,105 | 19.2 | ||||||
| 1.81 - 1.90 | 3 | 125,227,199 | 12.4 | ||||||
| 1.91 - 2.00 | 2 | 19,819,744 | 2.0 | ||||||
| 2.01 - 2.50 | 13 | 251,823,823 | 25.0 | ||||||
| 2.51 - 3.00 | 2 | 96,440,000 | 9.6 | ||||||
| 3.01 - 3.10 | 1 | 54,863,232 | 5.4 | ||||||
| Total: | 48 | $1,008,188,843 | 100.0 | % | |||||
| Weighted Average: | 2.00x | ||||||||
| UNDERWRITTEN NCF DEBT SERVICE COVERAGE RATIO | |||||||||
| Range of U/W NCF DSCRs (x) | Number of Mortgage Loans | Aggregate Cut- off Date Balance | % of Initial Pool Balance | ||||||
| 1.20 | 3 | $19,850,000 | 2.0 | % | |||||
| 1.21 - 1.30 | 3 | 28,679,742 | 2.8 | ||||||
| 1.31 - 1.40 | 2 | 30,982,307 | 3.1 | ||||||
| 1.41 - 1.50 | 8 | 97,291,662 | 9.7 | ||||||
| 1.51 - 1.60 | 7 | 99,445,381 | 9.9 | ||||||
| 1.61 - 1.70 | 7 | 250,197,500 | 24.8 | ||||||
| 1.71 - 1.80 | 2 | 118,750,000 | 11.8 | ||||||
| 1.81 - 1.90 | 4 | 102,207,287 | 10.1 | ||||||
| 1.91 - 2.00 | 1 | 20,000,000 | 2.0 | ||||||
| 2.01 - 2.50 | 9 | 144,344,964 | 14.3 | ||||||
| 2.51 - 2.95 | 2 | 96,440,000 | 9.6 | ||||||
| Total: | 48 | $1,008,188,843 | 100.0 | % | |||||
| Weighted Average: | 1.83x | ||||||||
| LOAN PURPOSE | |||||||||
| Loan Purpose | Number of Mortgage Loans | Aggregate Cut- off Date Balance | % of Initial Pool Balance | ||||||
| Refinance | 27 | $489,628,965 | 48.6 | % | |||||
| Acquisition | 20 | 471,559,878 | 46.8 | ||||||
| Recapitalization | 1 | 47,000,000 | 4.7 | ||||||
| Total: | 48 | $1,008,188,843 | 100.0 | % | |||||
| MORTGAGE RATE | |||||||||
| Range of Mortgage Rates (%) | Number of Mortgage Loans | Aggregate Cut- off Date Balance | % of Initial Pool Balance | ||||||
| 3.930 - 4.000 | 1 | $41,440,000 | 4.1 | % | |||||
| 4.001 - 4.250 | 2 | 55,200,000 | 5.5 | ||||||
| 4.251 - 4.500 | 4 | 150,000,000 | 14.9 | ||||||
| 4.501 - 4.750 | 7 | 143,066,251 | 14.2 | ||||||
| 4.751 - 5.000 | 11 | 233,331,626 | 23.1 | ||||||
| 5.001 - 5.250 | 11 | 183,290,648 | 18.2 | ||||||
| 5.251 - 5.500 | 9 | 98,572,500 | 9.8 | ||||||
| 5.501 - 5.750 | 2 | 78,397,064 | 7.8 | ||||||
| 6.251 - 6.290 | 1 | 24,890,754 | 2.5 | ||||||
| Total: | 48 | $1,008,188,843 | 100.0 | % | |||||
| Weighted Average: | 4.848% | ||||||||
| UNDERWRITTEN NOI DEBT YIELD | |||||||||
| Range of U/W NOI Debt Yields (%) | Number of Mortgage Loans | Aggregate Cut- off Date Balance | % of Initial Pool Balance | ||||||
| 7.6 - 8.0 | 4 | $79,850,000 | 7.9 | % | |||||
| 8.1 - 9.0 | 8 | 233,287,049 | 23.1 | ||||||
| 9.1 - 10.0 | 5 | 113,896,701 | 11.3 | ||||||
| 10.1 - 11.0 | 11 | 135,746,927 | 13.5 | ||||||
| 11.1 - 12.0 | 5 | 107,003,415 | 10.6 | ||||||
| 12.1 - 13.0 | 5 | 110,367,395 | 10.9 | ||||||
| 13.1 - 14.0 | 3 | 65,454,548 | 6.5 | ||||||
| 14.1 - 15.0 | 2 | 50,888,315 | 5.0 | ||||||
| 15.1 - 16.0 | 2 | 31,331,262 | 3.1 | ||||||
| 16.1 - 17.0 | 1 | 20,000,000 | 2.0 | ||||||
| 17.1 - 18.0 | 1 | 5,500,000 | 0.5 | ||||||
| 20.1 - 20.3 | 1 | 54,863,232 | 5.4 | ||||||
| Total: | 48 | $1,008,188,843 | 100.0 | % | |||||
| Weighted Average: | 11.3% | ||||||||
| UNDERWRITTEN NCF DEBT YIELD | |||||||||
| Range of U/W NCF Debt Yields (%) | Number of Mortgage Loans | Aggregate Cut- off Date Balance | % of Initial Pool Balance | ||||||
| 7.1 - 8.0 | 7 | $170,904,908 | 17.0 | % | |||||
| 8.1 - 9.0 | 7 | 236,232,141 | 23.4 | ||||||
| 9.1 - 10.0 | 12 | 134,806,128 | 13.4 | ||||||
| 10.1 - 11.0 | 5 | 54,733,851 | 5.4 | ||||||
| 11.1 - 12.0 | 8 | 188,429,006 | 18.7 | ||||||
| 12.1 - 13.0 | 3 | 99,401,583 | 9.9 | ||||||
| 13.1 - 14.0 | 3 | 38,427,240 | 3.8 | ||||||
| 14.1 - 15.0 | 1 | 24,890,754 | 2.5 | ||||||
| 15.1 - 15.4 | 2 | 60,363,232 | 6.0 | ||||||
| Total: | 48 | $1,008,188,843 | 100.0 | % | |||||
| Weighted Average: | 10.3% | ||||||||
| (1) | Information regarding mortgage loans that are cross-collateralized or cross-defaulted with other mortgage loans is based upon the individual loan balances, except that the applicable loan-to-value ratio, debt service coverage ratio and debt yield for each such mortgage loan is based upon the ratio or yield (as applicable) for the aggregate indebtedness evidenced by all loans in the group (without regard to any limitation on the amount of indebtedness secured by any mortgaged property in such cross-collateralized group). On an individual basis, without regard to the cross-collateralization feature, any mortgage loan that is part of a cross-collateralized group of mortgage loans may have a higher loan-to-value ratio, lower debt service coverage ratio and/or lower debt yield than is presented herein. With respect to any mortgage loan that is part of a whole loan, the loan-to-value ratio, debt service coverage ratio and debt yield calculations include the relatedpari passu companion loan(s) but exclude any related subordinate secured loan(s) (unless otherwise stated). With respect to each mortgage loan, debt service coverage ratio, debt yield and loan-to-value ratio information do not take into account any subordinate debt (whether or not secured by the related mortgaged property), that currently exists or is allowed under the terms of such mortgage loan. Prepayment provisions for each mortgage loan reflects the entire life of the loan (from origination to maturity or ARD). With respect to the mortgage loan secured by the mortgaged property identified on Annex A-1 to the Preliminary Prospectus as D.C. Office Portfolio, all loan-to-value and debt yield calculations are net of the $5,000,000 earnout reserve. See Annex A-1 to the Preliminary Prospectus. |
THE INFORMATION IN THIS STRUCTURAL AND COLLATERAL TERM SHEET IS NOT COMPLETE AND MAY BE AMENDED PRIOR TO THE TIME OF SALE. THIS TERM SHEET IS NOT AN OFFER TO SELL THESE SECURITIES AND IT IS NOT A SOLICITATION OF AN OFFER TO BUY THESE SECURITIES IN ANY JURISDICTION WHERE THE OFFER OR SALE IS NOT PERMITTED.
| 16 |
| BANK 2017-BNK4 | Characteristics of the Mortgage Pool |
| ORIGINAL TERM TO MATURITY OR ARD | |||||||||
| Original Terms to Maturity or ARD (months) | Number of Mortgage Loans | Aggregate Cut- off Date Balance | % of Initial Pool Balance | ||||||
| 60 | 2 | $96,303,232 | 9.6 | % | |||||
| 120 | 45 | 856,885,611 | 85.0 | ||||||
| 121 | 1 | 55,000,000 | 5.5 | ||||||
| Total: | 48 | $1,008,188,843 | 100.0 | % | |||||
| Weighted Average: | 114 months | ||||||||
| REMAINING TERM TO MATURITY OR ARD | |||||||||
| Range of Remaining Terms to Maturity or ARD (months) | Number of Mortgage Loans | Aggregate Cut- off Date Balance | % of Initial Pool Balance | ||||||
| 58 | 2 | $96,303,232 | 9.6 | % | |||||
| 84 - 120 | 46 | 911,885,611 | 90.4 | ||||||
| Total: | 48 | $1,008,188,843 | 100.0 | % | |||||
| Weighted Average: | 113 months | ||||||||
| ORIGINAL AMORTIZATION TERM(3) | |||||||||
| Original Amortization Terms (months) | Number of Mortgage Loans | Aggregate Cut- off Date Balance | % of Initial Pool Balance | ||||||
| Non-Amortizing | 13 | $490,560,000 | 48.7 | % | |||||
| 240 | 1 | 24,890,754 | 2.5 | ||||||
| 300 | 8 | 155,986,708 | 15.5 | ||||||
| 360 | 26 | 336,751,381 | 33.4 | ||||||
| Total: | 48 | $1,008,188,843 | 100.0 | % | |||||
| Weighted Average(4): | 336 months | ||||||||
(3) The original amortization term shown for any mortgage loan that is interest-only for part of its term does not include the number of months in its interest-only period and reflects only the number of months as of the commencement of amortization remaining from the end of such interest-only period. (4) Excludes the non-amortizing mortgage loans. | |||||||||
| REMAINING AMORTIZATION TERM(5) | |||||||||
| Range of Remaining Amortization Terms (months) | Number of Mortgage Loans | Aggregate Cut- off Date Balance | % of Initial Pool Balance | ||||||
| Non-Amortizing | 13 | $490,560,000 | 48.7 | % | |||||
| 238 - 240 | 1 | 24,890,754 | 2.5 | ||||||
| 241 - 300 | 8 | 155,986,708 | 15.5 | ||||||
| 301 - 360 | 26 | 336,751,381 | 33.4 | ||||||
| Total: | 48 | $1,008,188,843 | 100.0 | % | |||||
| Weighted Average(6): | 335 months | ||||||||
(5) The remaining amortization term shown for any mortgage loan that is interest-only for part of its term does not include the number of months in its interest-only period and reflects only the number of months as of the commencement of amortization remaining from the end of such interest-only period. (6) Excludes the non-amortizing mortgage loans. | |||||||||
| LOCKBOXES | |||||||||
| Type of Lockbox | Number of Mortgage Loans | Aggregate Cut- off Date Balance | % of Initial Pool Balance | ||||||
| Hard/Springing Cash Management | 16 | $482,626,995 | 47.9 | % | |||||
| Springing | 23 | 268,489,863 | 26.6 | ||||||
Hard/Upfront Cash Management | 6 | 222,193,986 | 22.0 | ||||||
| Soft/Springing Cash Management | 1 | 24,000,000 | 2.4 | ||||||
Soft/Upfront Cash Management | 1 | 8,853,000 | 0.9 | ||||||
| None | 1 | 2,025,000 | 0.2 | ||||||
| Total: | 48 | $1,008,188,843 | 100.0 | % | |||||
| PREPAYMENT PROVISION SUMMARY | |||||||||
| Prepayment Provision | Number of Mortgage Loans | Aggregate Cut- off Date Balance | % of Initial Pool Balance | ||||||
| Lockout/Def/Open | 44 | $917,308,335 | 91.0 | % | |||||
| Lockout/GRTR 1% or YM/Open | 3 | 49,440,508 | 4.9 | ||||||
| GRTR 0.5% or YM/Open | 1 | 41,440,000 | 4.1 | ||||||
| Total: | 48 | $1,008,188,843 | 100.0 | % | |||||
| CUT-OFF DATE LOAN-TO-VALUE RATIO | |||||||||
| Range of Cut-off Date LTV Ratios (%) | Number of Mortgage Loans | Aggregate Cut- off Date Balance | % of Initial Pool Balance | ||||||
| 47.8 - 50.0 | 7 | $140,317,099 | 13.9 | % | |||||
| 50.1 - 55.0 | 7 | 284,162,818 | 28.2 | ||||||
| 55.1 - 60.0 | 5 | 90,427,746 | 9.0 | ||||||
| 60.1 - 65.0 | 15 | 287,981,479 | 28.6 | ||||||
| 65.1 - 70.0 | 8 | 103,941,392 | 10.3 | ||||||
| 70.1 - 74.9 | 6 | 101,358,310 | 10.1 | ||||||
| Total: | 48 | $1,008,188,843 | 100.0 | % | |||||
| Weighted Average: | 59.1% | ||||||||
| BALLOON OR ARD LOAN-TO-VALUE RATIO | |||||||||
| Range of Balloon or ARD LTV Ratios (%) | Number of Mortgage Loans | Aggregate Cut- off Date Balance | % of Initial Pool Balance | ||||||
| 35.5 - 40.0 | 4 | $58,921,322 | 5.8 | % | |||||
| 40.1 - 45.0 | 5 | 104,843,142 | 10.4 | ||||||
| 45.1 - 50.0 | 8 | 172,378,295 | 17.1 | ||||||
| 50.1 - 55.0 | 9 | 268,155,241 | 26.6 | ||||||
| 55.1 - 60.0 | 9 | 130,347,441 | 12.9 | ||||||
| 60.1 - 65.0 | 10 | 153,240,171 | 15.2 | ||||||
| 65.1 - 67.7 | 3 | 120,303,232 | 11.9 | ||||||
| Total: | 48 | $1,008,188,843 | 100.0 | % | |||||
| Weighted Average: | 53.8% | ||||||||
| AMORTIZATION TYPE | |||||||||
| Type of Amortization | Number of Mortgage Loans | Aggregate Cut- off Date Balance | % of Initial Pool Balance | ||||||
| Interest-only, Balloon | 12 | $449,120,000 | 44.5 | % | |||||
| Amortizing Balloon | 22 | 324,078,343 | 32.1 | ||||||
| Interest-only, Amortizing Balloon | 13 | 193,550,500 | 19.2 | ||||||
| Interest-only, ARD | 1 | 41,440,000 | 4.1 | ||||||
| Total: | 48 | $1,008,188,843 | 100.0 | % | |||||
| ORIGINAL TERM OF INTEREST-ONLY PERIOD FOR PARTIAL IO LOANS | |||||||||
| IO Terms (months) | Number of Mortgage Loans | Aggregate Cut- off Date Balance | % of Initial Pool Balance | ||||||
| 12 | 1 | $1,837,500 | 0.2 | % | |||||
| 24 | 4 | $116,500,000 | 11.6 | ||||||
| 36 | 4 | $44,588,000 | 4.4 | ||||||
| 60 | 4 | $30,625,000 | 3.0 | ||||||
| Total: | 13 | $193,550,500 | 19.2 | % | |||||
| Weighted Average: | 32 months | ||||||||
| SEASONING | |||||||||
| Seasoning (months) | Number of Mortgage Loans | Aggregate Cut- off Date Balance | % of Initial Pool Balance | ||||||
| 0 | 6 | $98,400,000 | 9.8 | % | |||||
| 1 | 10 | 270,648,942 | 26.8 | ||||||
| 2 | 20 | 463,468,860 | 46.0 | ||||||
| 3 | 7 | 113,270,884 | 11.2 | ||||||
| 4 | 3 | 19,530,568 | 1.9 | ||||||
| 5 | 1 | 37,669,589 | 3.7 | ||||||
| 6 | 1 | 5,200,000 | 0.5 | ||||||
| Total: | 48 | $1,008,188,843 | 100.0 | % | |||||
| Weighted Average: | 2 months | ||||||||
THE INFORMATION IN THIS STRUCTURAL AND COLLATERAL TERM SHEET IS NOT COMPLETE AND MAY BE AMENDED PRIOR TO THE TIME OF SALE. THIS TERM SHEET IS NOT AN OFFER TO SELL THESE SECURITIES AND IT IS NOT A SOLICITATION OF AN OFFER TO BUY THESE SECURITIES IN ANY JURISDICTION WHERE THE OFFER OR SALE IS NOT PERMITTED.
| 17 |
| BANK 2017-BNK4 | Certain Terms and Conditions |
V. Certain Terms and Conditions
| Allocation Between the RR Interest and the Non- Retained Certificates: | Amounts available for distributions to the holders of the Certificates (including the RR Interest) will be allocated between amounts available for distribution to the holders of the RR Interest, on the one hand, and to all other Certificates, referred to herein as the “Non-Retained Certificates”, on the other hand. The portion of such amount allocable to (a) the RR Interest will at all times be the product of such amount multiplied by 5% and (b) the Non-Retained Certificates will at all times be the product of such amount multiplied by the difference between 100% and the percentage referenced in clause (a) (each, the respective “Percentage Allocation Entitlement”). |
| Interest Entitlements: | The interest entitlement of each Class of Non-Retained Certificates on each Distribution Date generally will be the interest accrued during the related Interest Accrual Period on the related Certificate Balance or Notional Amount at the related pass-through rate, net of any prepayment interest shortfalls allocated to that Class for such Distribution Date as described below. If prepayment interest shortfalls arise from voluntary prepayments (without Master Servicer consent) on particular non-specially serviced loans during any collection period, the Master Servicer is required to make a compensating interest payment to offset those shortfalls, generally up to an amount equal to the portion of its master servicing fees that accrue at 0.25 basis pointsper annum. The remaining amount of prepayment interest shortfalls will be allocated between the RR Interest, on one hand, and the Non-Retained Certificates, on the other hand, in accordance with their respective Percentage Allocation Entitlements. The prepayment interest shortfalls allocated to the Non-Retained Certificates (other than the Class V and Class R Certificates) will be allocated among such Classes of Certificates entitled to interest, on apro ratabasis, based on their respective amounts of accrued interest for the related Distribution Date, to reduce the interest entitlement on each such Class of Certificates. If a Class receives less than the entirety of its interest entitlement on any Distribution Date, then the shortfall (excluding any shortfall due to prepayment interest shortfalls), together with interest thereon, will be added to its interest entitlement for the next succeeding Distribution Date. |
| Aggregate Principal Distribution Amount: | The Aggregate Principal Distribution Amount for each Distribution Date generally will be the aggregate amount of principal received or advanced in respect of the mortgage loans, net of any non-recoverable advances and interest thereon and workout-delayed reimbursement amounts that are reimbursed to the Master Servicer, the Special Servicer or the Trustee during the related collection period. Non-recoverable advances and interest thereon are reimbursable from principal collections and advances before reimbursement from other amounts. Workout-delayed reimbursement amounts are reimbursable from principal collections. The Non-Retained Certificates will be entitled to the portion of the Aggregate Principal Distribution Amount equal to their Percentage Allocation Entitlement, which is referred to herein as the “Principal Distribution Amount”. |
| Subordination, Allocation of Losses and Certain Expenses | The chart below describes the manner in which the payment rights of certain Classes of Non-Retained Certificates will be senior or subordinate, as the case may be, to the payment rights of other Classes of Non-Retained Certificates. The chart also shows the allocation between the RR Interest and the Non-Retained Certificates and the corresponding entitlement to receive principal and/or interest of certain Classes of Non-Retained Certificates (other than excess interest that accrues on each mortgage loan that has an anticipated repayment date) on any distribution date in descending order. It also shows the manner in which losses are allocated between the RR Interest and the Non-Retained Certificates and the manner in which the Non-Retained Certificate allocations are further allocated to certain Classes of those Certificates in ascending order (beginning with the Non-Offered Certificates, other than the Class V and Class R certificates and the RR Interest) to reduce the balance of each such class to zero;provided that no principal payments or mortgage loan losses will be allocated to the Class X-A, Class X-B, Class X-D, Class X-E, Class X-F, Class X-G, Class R or Class V Certificates, although principal payments and losses may reduce the notional amounts of the Class X-A, Class X-B, Class X-D, Class X-E, Class X-F and Class X-G certificates and, therefore, the amount of interest they accrue. |
THE INFORMATION IN THIS STRUCTURAL AND COLLATERAL TERM SHEET IS NOT COMPLETE AND MAY BE AMENDED PRIOR TO THE TIME OF SALE. THIS TERM SHEET IS NOT AN OFFER TO SELL THESE SECURITIES AND IT IS NOT A SOLICITATION OF AN OFFER TO BUY THESE SECURITIES IN ANY JURISDICTION WHERE THE OFFER OR SALE IS NOT PERMITTED.
| 18 |
| BANK 2017-BNK4 | Certain Terms and Conditions |
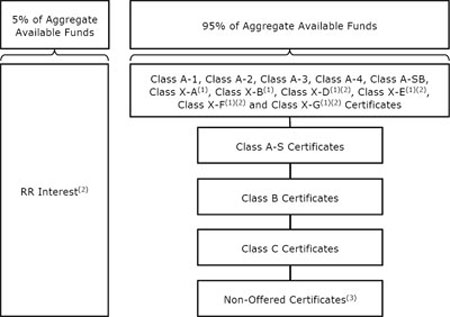 | ||
| (1) | The Class X-A, Class X-B, Class X-D, Class X-E, Class X-F and Class X-G Certificates are interest-only certificates. | |
| (2) | The Class X-D, Class X-E, Class X-F and Class X-G Certificates and the RR Interest are Non-Offered Certificates. | |
| (3) | Other than the Class X-D, Class X-E, Class X-F, Class X-G, Class R and Class V Certificates and the RR Interest. |
| Distributions: | On each Distribution Date, funds available for distribution from the mortgage loans, net of specified trust fees, expenses and reimbursements that are allocable to the Non-Retained Certificates will generally be distributed in the following amounts and order of priority (in each case to the extent of remaining available funds): |
| 1. Class A-1, A-2, A-3, A-4, A-SB, X-A, X-B, X-D, X-E, X-F and X-G Certificates: To interest on the Class A-1, A-2, A-3, A-4, A-SB, X-A, X-B, X-D, X-E, X-F and X-G Certificates,pro rata, according to their respective interest entitlements. | |
| 2. Class A-1, A-2, A-3, A-4 and A-SB Certificates: To principal on the Class A-1, A-2, A-3, A-4 and A-SB Certificates in the following amounts and order of priority: (i) first, to principal on the Class A-SB Certificates, in an amount up to the Principal Distribution Amount for such Distribution Date until their Certificate Balance is reduced to the Class A-SB Planned Principal Balance for such Distribution Date; (ii) second, to principal on the Class A-1 Certificates until their Certificate Balance is reduced to zero, up to the remainder of the Principal Distribution Amount for such Distribution Date; (iii) third, to principal on the Class A-2 Certificates until their Certificate Balance is reduced to zero, up to the remainder of the Principal Distribution Amount for such Distribution Date; (iv) fourth, to principal on the Class A-3 Certificates, until their Certificate Balance is reduced to zero, up to the remainder of the Principal Distribution Amount for such Distribution Date; (v) fifth, to principal on the Class A-4 Certificates, until their Certificate Balance is reduced to zero, up to the remainder of the Principal Distribution Amount for such Distribution Date; and (vi) sixth, to principal on the Class A-SB Certificates until their Certificate Balance is reduced to zero, up to the remainder of the Principal Distribution Amount for such Distribution Date. However, if the Certificate Balance of each and every Class of Principal Balance Certificates, other than the Class A-1, A-2, A-3, A-4 and A-SB Certificates and the RR Interest, has been reduced to zero as a result of the allocation of Mortgage Loan losses and expenses and any of the Class A-1, A-2, A-3, A-4 and A-SB Certificates remains outstanding, then the Principal Distribution Amount will be distributed to the Class A-1, A-2, A-3, A-4 and A-SB Certificates,pro rata, based on their respective outstanding Certificate Balances, until their Certificate Balances have been reduced to zero. | |
| 3. Class A-1, A-2, A-3, A-4 and A-SB Certificates: To reimburse the holders of the Class A-1, A-2, A-3, A-4 and A-SB Certificates,pro rata, on the basis of previously allocated unreimbursed losses, for any previously unreimbursed losses (plus interest thereon) on the mortgage loans that were previously allocated in reduction of the Certificate |
THE INFORMATION IN THIS STRUCTURAL AND COLLATERAL TERM SHEET IS NOT COMPLETE AND MAY BE AMENDED PRIOR TO THE TIME OF SALE. THIS TERM SHEET IS NOT AN OFFER TO SELL THESE SECURITIES AND IT IS NOT A SOLICITATION OF AN OFFER TO BUY THESE SECURITIES IN ANY JURISDICTION WHERE THE OFFER OR SALE IS NOT PERMITTED.
| 19 |
| BANK 2017-BNK4 | Certain Terms and Conditions |
| Balances of such Classes. | |
4. Class A-S Certificates: To make distributions on the Class A-S Certificates as follows: (a) first, to interest on the Class A-S Certificates in the amount of the interest entitlement for that Class; (b) next, to the extent of the portion of the Principal Distribution Amount remaining after distributions in respect of principal to each Class with a higher distribution priority (in this case, the Class A-1, A-2, A-3, A-4 and A-SB Certificates), to principal on the Class A-S Certificates until their Certificate Balance is reduced to zero; and (c) next, to reimburse the holders of the Class A-S Certificates for any previously unreimbursed losses (plus interest thereon) on the mortgage loans that were previously allocated to that Class in reduction of their Certificate Balance. 5. Class B Certificates: To make distributions on the Class B Certificates as follows: (a) first, to interest on the Class B Certificates in the amount of the interest entitlement for that Class; (b) next, to the extent of the portion of the Principal Distribution Amount remaining after distributions in respect of principal to each Class with a higher distribution priority (in this case, the Class A-1, A-2, A-3, A-4, A-SB and A-S Certificates), to principal on the Class B Certificates until their Certificate Balance is reduced to zero; and (c) next, to reimburse the holders of the Class B Certificates for any previously unreimbursed losses (plus interest thereon) on the mortgage loans that were previously allocated to that Class in reduction of their Certificate Balance. 6. Class C Certificates: To make distributions on the Class C Certificates as follows: (a) first, to interest on the Class C Certificates in the amount of the interest entitlement for that Class; (b) next, to the extent of the portion of the Principal Distribution Amount remaining after distributions in respect of principal to each Class with a higher distribution priority (in this case, the Class A-1, A-2, A-3, A-4, A-SB, A-S and B Certificates), to principal on the Class C Certificates until their Certificate Balance is reduced to zero; and (c) next, to reimburse the holders of the Class C Certificates for any previously unreimbursed losses (plus interest thereon) on the mortgage loans that were previously allocated to that Class in reduction of their Certificate Balance. 7. After the Class A-1, A-2, A-3, A-4, A-SB, A-S, B and C Certificates are paid all amounts to which they are entitled, the remaining funds available for distribution will be used to pay interest, principal and loss reimbursement amounts on the Class D, E, F and G Certificates sequentially in that order in a manner analogous to the Class C Certificates. | |
| Allocation of Yield Maintenance and Prepayment Premiums: | If any yield maintenance charge or prepayment premium is collected during any particular collection period with respect to any mortgage loan, then on the Distribution Date corresponding to that collection period, the certificate administrator will pay that yield maintenance charge or prepayment premium (net of liquidation fees payable therefrom) in the following manner: (x)(1) to each of the Class A-1, A-2, A-3, A-4, A-SB, A-S, B, C and D Certificates, the product of (a) the Non-Retained Certificates’ Percentage Allocation Entitlement of the yield maintenance charge or prepayment premium, (b) the related Base Interest Fraction (as defined in the Preliminary Prospectus) for such Class, and (c) a fraction, the numerator of which is equal to the amount of principal distributed to such Class for that Distribution Date, and the denominator of which is the total amount of principal distributed to all Principal Balance Certificates (other than the RR Interest) for that Distribution Date, (2) to the Class X-A Certificates, the excess, if any, of (a) the product of (i) the Non-Retained Certificates’ Percentage Allocation Entitlement of such yield maintenance charge or prepayment premium and (ii) a fraction, the numerator of which is equal to the amount of principal distributed to the Class A-1, A-2, A-3, A-4 and A-SB Certificates for that Distribution Date, and the denominator of which is the total amount of principal distributed to all Principal Balance Certificates (other than the RR Interest) for that Distribution Date, over (b) the amount of such yield maintenance charge or prepayment premium distributed to the Class A-1, A-2, A-3, A-4 and A-SB Certificates as described above, and (3) to the Class X-B Certificates, any remaining portion of the Non-Retained Percentage of such yield maintenance charge or prepayment premium not distributed as described above, and (y) to the RR Interest, its Percentage Allocation Entitlement of the yield maintenance charge or prepayment premium. No prepayment premiums or yield maintenance charges will be distributed to the holders of the Class X-D, X-E, X-F, X-G, E, F, G, V or R Certificates. For a description of when prepayment premiums and yield maintenance charges are generally required on the mortgage loans, see Annex A-1 to the Preliminary Prospectus. See also “Risk Factors—Risks Relating to the Mortgage Loans—Risks Relating to Enforceability of Yield Maintenance Charges, Prepayment Premiums or Defeasance Provisions” and “Risk Factors—Other Risks Relating to the Certificates—Your Yield May Be Affected by Defaults, Prepayments and Other Factors” in the Preliminary Prospectus. Prepayment premiums and yield maintenance charges will be distributed on each Distribution Date only to the extent they are actually received on the |
THE INFORMATION IN THIS STRUCTURAL AND COLLATERAL TERM SHEET IS NOT COMPLETE AND MAY BE AMENDED PRIOR TO THE TIME OF SALE. THIS TERM SHEET IS NOT AN OFFER TO SELL THESE SECURITIES AND IT IS NOT A SOLICITATION OF AN OFFER TO BUY THESE SECURITIES IN ANY JURISDICTION WHERE THE OFFER OR SALE IS NOT PERMITTED.
| 20 |
| BANK 2017-BNK4 | Certain Terms and Conditions |
| mortgage loans as of the related Determination Date. | |
| Realized Losses: | The Certificate Balances of the Class A-1, A-2, A-3, A-4, A-SB, A-S, B, C, D, E, F and G Certificates, will be reduced without distribution on any Distribution Date as a write-off to the extent of the Non-Retained Certificates’ Percentage Allocation Entitlement of any losses realized on the mortgage loans allocated to such Class on such Distribution Date. Such losses will be applied in the following order, in each case until the related Certificate Balance is reduced to zero: first, to the Class G Certificates; second, to the Class F Certificates; third, to the Class E Certificates; fourth, to the Class D Certificates; fifth, to the Class C Certificates; sixth, to the Class B Certificates; seventh, to the Class A-S Certificates; and, finally,pro rata, to the Class A-1, A-2, A-3, A-4 and A-SB Certificates based on their outstanding Certificate Balances. The notional amount of the Class X-A Certificates will be reduced by the amount of all losses that are allocated to the Class A-1, A-2, A-3, A-4 or A-SB Certificates as write-offs in reduction of their Certificate Balances. The notional amount of the Class X-B Certificates will be reduced by the amount of all losses that are allocated to the Class A-S, B or C Certificates as write-offs in reduction of their Certificate Balances. The notional amount of the Class X-D Certificates will be reduced by the amount of all losses that are allocated to the Class D Certificates as write-offs in reduction of their Certificate Balance. The notional amount of the Class X-E Certificates will be reduced by the amount of all losses that are allocated to the Class E Certificates as write-offs in reduction of their Certificate Balance. The notional amount of the Class X-F Certificates will be reduced by the amount of all losses that are allocated to the Class F Certificates as write-offs in reduction of their Certificate Balance. The notional amount of the Class X-G Certificates will be reduced by the amount of all losses that are allocated to the Class G Certificates as write-offs in reduction of their Certificate Balance. |
| P&I Advances: | The Master Servicer or, if the Master Servicer fails to do so, the Trustee, will be obligated to advance delinquent debt service payments (other than balloon payments, excess interest and default interest) and assumed debt service payments on mortgage loans with delinquent balloon payments (excluding any related companion loan), except to the extent any such advance is deemed non-recoverable from collections on the related mortgage loan. In addition, if an Appraisal Reduction Amount exists for a given mortgage loan, the interest portion of any P&I advance for such mortgage loan will be reduced, which will have the effect of reducing the amount of interest available for distribution to the Certificates, which with respect to the Non-Retained Certificates will be applied in reverse alphabetical order of their Class designations (except that interest payments on the Class A-1, A-2, A-3, A-4, A-SB, X-A, X-B, X-D, X-E, X-F and X-G Certificates would be affected on apari passu basis). |
| Servicing Advances: | The Master Servicer or, if the Master Servicer fails to do so, the Trustee, will be obligated to make servicing advances, including the payment of delinquent property taxes, insurance premiums and ground rent, except to the extent that those advances are deemed non-recoverable from collections on the related mortgage loan. The Master Servicer or the Trustee, as applicable, will have the primary obligation to make any required servicing advances with respect to the Serviced Whole Loans. The master servicer or trustee, as applicable, under the BACM 2017-BNK3 securitization will have the primary obligation to make any required servicing advances with respect to The Summit Birmingham whole loan and the JW Marriott Desert Springs whole loan. The master servicer or trustee, as applicable, under the GSMS 2017-GS5 securitization (prior to the securitization of Note A-2 of the Pentagon Center Whole Loan) or the Pentagon Center Note A-2 Securitization Servicing Agreement (following the securitization of note A-2 of the Pentagon Center Whole Loan) will have the primary obligation to make any required servicing advances with respect to the Pentagon Center whole loan. The master servicer or trustee, as applicable, under the WFCM 2017-RB1 securitization will have the primary obligation to make any required servicing advances with respect to The Davenport whole loan. The master servicer or trustee, as applicable, under the BBCMS 2017-C1 securitization will have the primary obligation to make any required servicing advances with respect to the Merrill Lynch Drive whole loan. The master servicer or trustee, as applicable, under the CGCMT 2017-P7 securitization will have the primary obligation to make any required servicing advances with respect to the Key Center Cleveland whole loan. The Special Servicer will have no obligation to make servicing advances but may do so in an emergency situation. |
| Appraisal Reduction Amounts and Collateral Deficiency Amounts: | An Appraisal Reduction Amount generally will be created in the amount, if any, by which the principal balance of a required appraisal loan (which is a mortgage loan with respect to which certain defaults, modifications or insolvency events have occurred as further described in the Preliminary Prospectus) plus other amounts overdue or advanced in connection with such mortgage loan exceeds 90% of the appraised value of the related mortgaged property plus certain escrows and reserves (including letters of credit) held with respect to the mortgage loan. With respect to any whole loan, any Appraisal Reduction Amount will be allocated first to the related subordinate secured loan, if any, and then to the related mortgage loan and the relatedpari passu companion loan(s). |
| A mortgage loan will cease to be a required appraisal loan when the same has ceased to be a specially serviced loan (if applicable), has been brought current for at least three consecutive |
THE INFORMATION IN THIS STRUCTURAL AND COLLATERAL TERM SHEET IS NOT COMPLETE AND MAY BE AMENDED PRIOR TO THE TIME OF SALE. THIS TERM SHEET IS NOT AN OFFER TO SELL THESE SECURITIES AND IT IS NOT A SOLICITATION OF AN OFFER TO BUY THESE SECURITIES IN ANY JURISDICTION WHERE THE OFFER OR SALE IS NOT PERMITTED.
| 21 |
| BANK 2017-BNK4 | Certain Terms and Conditions |
| months and no other circumstances exist that would cause such mortgage loan to be a required appraisal loan. | |
A Collateral Deficiency Amount will exist with respect to any mortgage loan that is modified into an AB loan structure and remains a corrected mortgage loan and will generally equal the excess of (i) the stated principal balance of such AB modified loan (taking into account the related junior note(s) and anypari passu notes included therein), over (ii) the sum of (in the case of a whole loan, solely to the extent allocable to the subject mortgage loan) (x) the most recent appraised value of the related mortgaged property plus (y) solely to the extent not reflected or taken into account in such appraised value (or in the calculation of any related Appraisal Reduction Amount) and to the extent on deposit with, or otherwise under the control of, the lender as of the date of such determination, any capital or additional collateral contributed by the related borrower at the time the mortgage loan (and as part of the modification thereto) became an AB modified loan plus (z) any other escrows or reserves (in addition to any amounts set forth in the immediately preceding clause (y) and solely to the extent not reflected or taken into account in the calculation of any related Appraisal Reduction Amount) held by the lender with respect to the mortgage loan as of the date of such determination. A Cumulative Appraisal Reduction Amount with respect to any mortgage loan will be the sum of any Appraisal Reduction Amount and any Collateral Deficiency Amount. Appraisal Reduction Amounts will affect the amount of debt service advances in respect of the related mortgage loan. Additionally, Cumulative Appraisal Reduction Amounts will be taken into account in the determination of the identity of the Class whose majority constitutes the “majority controlling class certificateholder” and is entitled to appoint the directing certificateholder. | |
Clean-Up Call and Exchange Termination: | On each Distribution Date occurring after the aggregate unpaid principal balance of the pool of mortgage loans is less than 1.0% of the principal balance of the mortgage loans as of the cut-off date, certain specified persons will have the option to purchase all of the remaining mortgage loans (and the trust’s interest in all property acquired through exercise of remedies in respect of any mortgage loan) at the price specified in the Preliminary Prospectus. Exercise of the option will terminate the trust and retire the then-outstanding certificates. If the aggregate Certificate Balances of each of the Class A-1, A-2, A-3, A-4, A-SB, A-S, B, C and D Certificates have been reduced to zero, the trust may also be terminated in connection with an exchange of all the then-outstanding certificates (other than the Class R Certificates and the RR Interest) for the mortgage loans and REO properties then remaining in the issuing entity, subject to payment of a price specified in the Preliminary Prospectus, but all of the holders of those outstanding Classes (other than the Class V, Class R Certificates and the RR Interest) of certificates would have to voluntarily participate in the exchange. |
| Liquidation Loan Waterfall: | Following the liquidation of any loan or property, the net liquidation proceeds generally will be applied (after reimbursement of advances and certain trust fund expenses), first, as a recovery of accrued interest, other than delinquent interest that was not advanced as a result of Appraisal Reduction Amounts, second, as a recovery of principal until all principal has been recovered, and then as a recovery of delinquent interest that was not advanced as a result of Appraisal Reduction Amounts. Please see “Description of the Certificates—Distributions—Application Priority of Mortgage Loan Collections or Whole Loan Collections” in the Preliminary Prospectus. |
| Majority Controlling Class Certificateholder and Directing Certificateholder: | A directing certificateholder may be appointed by the “majority controlling class certificate-holder”, which will be the holder(s) of a majority of the “controlling class”, which means the most subordinate class among the Class F and G Certificates that has a Certificate Balance, as notionally reduced by any Cumulative Appraisal Reduction Amounts allocable to that class, that is at least equal to 25% of its total initial Certificate Balance; provided that if at any time the Certificate Balances of the Certificates (other than the Class F and G Certificates and the RR Interest) have been reduced to zero as a result of principal payments on the mortgage loans, then the “controlling class” will be the most subordinate class of Class F and G Certificates that has a Certificate Balance greater than zero without regard to any Cumulative Appraisal Reduction Amounts. The majority controlling class certificateholder will have a continuing right to appoint, remove or replace the directing certificateholder in its sole discretion. This right may be exercised at any time and from time to time. See “Pooling and Servicing Agreement—The Directing Certificateholder” in the Preliminary Prospectus. |
| Control and Consultation: | The rights of various parties to replace the Special Servicer and approve or consult with respect to major actions of the Special Servicer will vary according to defined periods. A “Control Termination Event” occurs if the Class F Certificates have a Certificate Balance, net of any Cumulative Appraisal Reduction Amounts allocable to that Class, that is less than 25% of the initial Certificate Balance of that Class or, while the Class F Certificates are the controlling class, the majority (by Certificate Balance) of the holders of the Class F Certificates irrevocably waived its right, in writing, to exercise any of the rights of the majority controlling class certificateholder and such rights have not been reinstated to a successor majority controlling |
THE INFORMATION IN THIS STRUCTURAL AND COLLATERAL TERM SHEET IS NOT COMPLETE AND MAY BE AMENDED PRIOR TO THE TIME OF SALE. THIS TERM SHEET IS NOT AN OFFER TO SELL THESE SECURITIES AND IT IS NOT A SOLICITATION OF AN OFFER TO BUY THESE SECURITIES IN ANY JURISDICTION WHERE THE OFFER OR SALE IS NOT PERMITTED.
| 22 |
| BANK 2017-BNK4 | Certain Terms and Conditions |
| class certificateholder. | |
A “Consultation Termination Event” occurs if the Class F Certificates and Class G Certificates each have a Certificate Balance, without regard to any Cumulative Appraisal Reduction Amounts allocable to that Class, that is less than 25% of the initial Certificate Balance of that Class or, while the Class F Certificates are the controlling class, the majority (by Certificate Balance) of the holders of the Class F Certificates irrevocably waived its right, in writing, to exercise any of the rights of the majority controlling class certificateholder and such rights have not been reinstated to a successor majority controlling class certificateholder. If no Control Termination Event has occurred and is continuing, except with respect to the Excluded Loans (as defined below) as to such party, (i) the directing certificateholder will be entitled to grant or withhold approval of asset status reports prepared, and material servicing actions proposed, by the Special Servicer, and (ii) the directing certificateholder will be entitled to terminate and replace the Special Servicer with or without cause, and appoint itself or another person as the successor special servicer. It will be a condition to such appointment that Fitch, KBRA and Moody’s (and any Rating Agency rating any securities backed by anypari passu companion loan(s) serviced under this transaction) confirm that the appointment would not result in a qualification, downgrade or withdrawal of any of their then-current ratings of certificates (and any certificates backed by anypari passu companion loan(s) serviced under this transaction). If a Control Termination Event has occurred and is continuing but no Consultation Termination Event has occurred and is continuing, the Special Servicer will be required to consult with the directing certificateholder (other than with respect to Excluded Loans as to such party) and the Operating Advisor in connection with asset status reports and material special servicing actions. If a Consultation Termination Event has occurred and is continuing, the Special Servicer must seek to consult with the Operating Advisor in connection with asset status reports and material special servicing actions, and, in general, no directing certificateholder will be recognized or have any right to terminate the Special Servicer or approve, direct or consult with respect to servicing matters. With respect to the Serviced Whole Loans, the rights of the directing certificateholder described above will be subject to the consultation rights of the holder of the relatedpari passu companion loan(s) as described below. Notwithstanding any contrary description set forth above, with respect to the mortgage loans relating to the Serviced Whole Loans, the holder of thepari passu companion loan(s) in the related Serviced Whole Loan (or its representative, including any directing certificateholder under any securitization of suchpari passu companion loan(s)) will have consultation rights with respect to asset status reports and material special servicing actions involving the related whole loan, as provided for in the related intercreditor agreement and as described in the Preliminary Prospectus, and those rights will be in addition to the rights of the directing certificateholder in this transaction described above. For purposes of the servicing of the Serviced Whole Loans, the occurrence and continuance of a Control Termination Event or Consultation Termination Event under this securitization will not limit the consultation and other rights of the holder of thepari passu companion loan(s). Notwithstanding any contrary description set forth above, with respect to each of The Summit Birmingham mortgage loan and the JW Marriott Desert Springs mortgage loan, in general the related whole loan will be serviced under the BACM 2017-BNK3 pooling and servicing agreement, which grants the directing certificateholder under the BACM 2017-BNK3 securitization control rights that may include the right to approve or disapprove various material servicing actions involving the related whole loan. The directing certificateholder for this securitization (so long as no Consultation Termination Event has occurred and is occurring) will nonetheless have the right to be consulted on a non-binding basis with respect to such actions. For purposes of the servicing each of The Summit Birmingham whole loan and the JW Marriott Desert Springs whole loan, the occurrence and continuance of a Control Termination Event or Consultation Termination Event under this securitization will not limit the control or other rights of the directing certificateholder (or equivalent) under the BACM 2017-BNK3 securitization. | |
| Notwithstanding any contrary description set forth above, with respect to the Pentagon Center mortgage loan, in general the related whole loan will be serviced, (i) prior to the securitization of Note A-2, under the GSMS 2017-GS5 pooling and servicing agreement, and (ii) following the securitization of Note A-2, under the Pentagon Center Note A-2 Securitization Servicing Agreement, each of which grants (or is expected to grant) the controlling noteholder of the Pentagon Center whole loan control rights that may include the right to approve or disapprove various material servicing actions involving the related whole loan. The directing certificateholder for this securitization (so long as no Consultation Termination Event has occurred and is occurring) will nonetheless have the right to be consulted on a non-binding basis with respect to such actions. For purposes of the servicing of the Pentagon Center whole |
THE INFORMATION IN THIS STRUCTURAL AND COLLATERAL TERM SHEET IS NOT COMPLETE AND MAY BE AMENDED PRIOR TO THE TIME OF SALE. THIS TERM SHEET IS NOT AN OFFER TO SELL THESE SECURITIES AND IT IS NOT A SOLICITATION OF AN OFFER TO BUY THESE SECURITIES IN ANY JURISDICTION WHERE THE OFFER OR SALE IS NOT PERMITTED.
| 23 |
| BANK 2017-BNK4 | Certain Terms and Conditions |
loan, the occurrence and continuance of a Control Termination Event or Consultation Termination Event under this securitization will not limit the control or other rights of the controlling noteholder of the Pentagon Center whole loan. Notwithstanding any contrary description set forth above, with respect to The Davenport mortgage loan, in general the related whole loan is expected to be serviced under the WFCM 2017-RB1 pooling and servicing agreement, which grants the directing certificateholder under the WFCM 2017-RB1 securitization control rights that may include the right to approve or disapprove various material servicing actions involving the related whole loan. The directing certificateholder for this securitization (so long as no Consultation Termination Event has occurred and is occurring) will nonetheless have the right to be consulted on a non-binding basis with respect to such actions. For purposes of the servicing of The Davenport whole loan, the occurrence and continuance of a Control Termination Event or Consultation Termination Event under this securitization will not limit the control or other rights of the directing certificateholder (or equivalent) under the WFCM 2017-RB1 securitization. Notwithstanding any contrary description set forth above, with respect to the Merrill Lynch Drive mortgage loan, in general the related whole loan will be serviced under the BBCMS 2017-C1 pooling and servicing agreement, which grants the directing certificateholder under the BBCMS 2017-C1 securitization control rights that may include the right to approve or disapprove various material servicing actions involving the related whole loan. The directing certificateholder for this securitization (so long as no Consultation Termination Event has occurred and is occurring) will nonetheless have the right to be consulted on a non-binding basis with respect to such actions. For purposes of the servicing of the Merrill Lynch Drive whole loan, the occurrence and continuance of a Control Termination Event or Consultation Termination Event under this securitization will not limit the control or other rights of the directing certificateholder (or equivalent) under the BBCMS 2017-C1 securitization. Notwithstanding any contrary description set forth above, with respect to the Key Center Cleveland mortgage loan, in general the related whole loan is expected to be serviced under the CGCMT 2017-P7 pooling and servicing agreement, which grants the directing certificateholder under the CGCMT 2017-P7 securitization control rights that may include the right to approve or disapprove various material servicing actions involving the related whole loan. The directing certificateholder for this securitization (so long as no Consultation Termination Event has occurred and is occurring) will nonetheless have the right to be consulted on a non-binding basis with respect to such actions. For purposes of the servicing of the Key Center Cleveland whole loan, the occurrence and continuance of a Control Termination Event or Consultation Termination Event under this securitization will not limit the control or other rights of the directing certificateholder (or equivalent) under the CGCMT 2017-P7 securitization. Notwithstanding any contrary description set forth above, the majority controlling class certificateholder and the directing certificateholder will have no right to receive asset status reports or such other information as may be specified in the pooling and servicing agreement, to grant or withhold approval of, or consult with respect to, asset status reports prepared, and material servicing actions proposed, by the Special Servicer, with respect to an Excluded Loan as to the directing certificateholder. Additionally, the risk retention consultation party will have no right to consult with respect to, asset status reports prepared, and material servicing actions proposed, by the Special Servicer, with respect to an Excluded Loan as to the risk retention consultation party. In addition, notwithstanding any contrary description set forth above, in the event that, with respect to any mortgage loan, a controlling class certificateholder is a Borrower Party, such controlling class certificateholder will have no right to receive asset status reports or such other information as may be specified in the pooling and servicing agreement with respect to such mortgage loan, and such controlling class certificateholder will be referred to as an “excluded controlling class holder”. “Excluded Loan” means (i) with respect to the directing certificateholder, a mortgage loan with respect to which the majority controlling class certificateholder or the directing certificateholder is a Borrower Party and (ii) with respect to the risk retention consultation party, a mortgage loan with respect to which the risk retention consultation party or the holder of the majority of the RR Interest is a Borrower Party. “Borrower Party” means a borrower, a mortgagor or a manager of a mortgaged property, an Accelerated Mezzanine Loan Lender, or any Borrower Party Affiliate. “Accelerated Mezzanine Loan Lender” means a mezzanine lender under a mezzanine loan that has been accelerated or as to which foreclosure or enforcement proceedings have been commenced against the equity collateral pledged to secure such mezzanine loan. “Borrower Party Affiliate” means, with respect to a borrower, a mortgagor, a manager of a Mortgaged Property or an Accelerated Mezzanine Loan Lender, (x) any other person controlling or controlled by or under common control with such borrower, mortgagor, manager or |
THE INFORMATION IN THIS STRUCTURAL AND COLLATERAL TERM SHEET IS NOT COMPLETE AND MAY BE AMENDED PRIOR TO THE TIME OF SALE. THIS TERM SHEET IS NOT AN OFFER TO SELL THESE SECURITIES AND IT IS NOT A SOLICITATION OF AN OFFER TO BUY THESE SECURITIES IN ANY JURISDICTION WHERE THE OFFER OR SALE IS NOT PERMITTED.
| 24 |
| BANK 2017-BNK4 | Certain Terms and Conditions |
| Accelerated Mezzanine Loan Lender, as applicable, or (y) any other person owning, directly or indirectly, 25% or more of the beneficial interests in such borrower, mortgagor, manager or Accelerated Mezzanine Loan Lender. | |
| Risk Retention Consultation Party: | A risk retention consultation party may be appointed by the holder or holders of more than 50% of the RR Interest, by Certificate Balance. The majority RR Interest holder will have a continuing right to appoint, remove or replace the risk retention consultation party in its sole discretion. This right may be exercised at any time and from time to time. Except with respect to an Excluded Loan as to such party, the risk retention consultation party will be entitled to consult with the Special Servicer, upon request of the risk retention consultation party, with respect to certain material servicing actions proposed by the Special Servicer. |
| Replacement of Special Servicer by General Vote of Certificateholders: | If a Control Termination Event has occurred and is continuing, the Special Servicer may be removed and replaced without cause upon the affirmative direction of certificate owners holding not less than 66-2/3% of a certificateholder quorum, following a proposal from certificate owners holding not less than 25% of the appraisal-reduced voting rights of all Principal Balance Certificates other than the RR Interest. The certificateholders who initiate a vote on a termination and replacement of the Special Servicer without cause must cause Fitch, KBRA and Moody’s to confirm the then-current ratings of the certificates (or decline to review the matter) and cause the payment of the fees and expenses incurred in the replacement. If no Control Termination Event has occurred and is continuing, the Special Servicer may be replaced by the directing certificateholder, subject to Fitch, KBRA and Moody’s (and any Rating Agency rating any securities backed by anypari passu companion loan(s) serviced under this transaction) confirming the then-current ratings of the Certificates (and any certificates backed by anypari passucompanion loans serviced under this transaction) or declining to review the matter. |
| Excluded Special Servicer: | In the event that, with respect to any mortgage loan, the Special Servicer is a Borrower Party, the Special Servicer will be required to resign as special servicer of such mortgage loan (referred to as an “excluded special servicer loan”). If no Control Termination Event has occurred and is continuing, the directing certificateholder will be entitled to appoint (and may replace with or without cause) a separate special servicer that is not a Borrower Party (referred to as an “excluded special servicer”) with respect to such excluded special servicer loan unless such excluded special servicer loan is also an excluded loan. Otherwise, upon resignation of the Special Servicer with respect to an excluded special servicer loan, the resigning Special Servicer will be required to appoint the excluded special servicer. |
| Appraisal Remedy: | If the Class of Certificates comprising the controlling class loses its status as controlling class because of the application of an Appraisal Reduction Amount or Collateral Deficiency Amount, the holders of a majority of the voting rights of such Class may require the Special Servicer to order a second appraisal for any mortgage loan in respect of which an Appraisal Reduction Amount or Collateral Deficiency Amount has been applied. The Special Servicer must thereafter determine whether, based on its assessment of such second appraisal, any recalculation of the Appraisal Reduction Amount or Collateral Deficiency Amount is warranted, and if so warranted, the Special Servicer will recalculate such Appraisal Reduction Amount or Collateral Deficiency Amount. Such Class will not be able to exercise any direction, control, consent and/or similar rights of the controlling class unless and until reinstated as the controlling class through such determination; and pending such determination, the rights of the controlling class will be exercised by the control eligible certificates (which may only be any one of Class F and G), if any, that would be the controlling class taking into account the subject appraisal reduction amount. |
| Sale of Defaulted Assets: | There will be no “fair value” purchase option. Instead, the pooling and servicing agreement will authorize the Special Servicer to sell defaulted mortgage loans to the highest bidder in a manner generally similar to sales of REO properties. The sale of a defaulted loan (other than with respect to The Summit Birmingham whole loan, the Pentagon Center whole loan, the JW Marriott Desert Springs whole loan, The Davenport whole loan, the Merrill Lynch Drive whole loan and the Key Center Cleveland whole loan) for less than par plus accrued interest and certain other fees and expenses owed on the loan will be subject to consent or consultation rights of the directing certificateholder and/or Operating Advisor and, in the case of the Serviced Whole Loans, consultation rights of the holders of the relatedpari passu companion loan(s), as described in the Preliminary Prospectus. In the case of each of the Serviced Whole Loans, pursuant to the related intercreditor agreement and the pooling and servicing agreement, if the Special Servicer offers to sell to any person (or offers to purchase) for cash such mortgage loan during such time as the related whole loan constitutes a defaulted mortgage loan, then in connection with any such sale, the Special Servicer is required to sell both the mortgage loan and the relatedpari passu companion loan(s) as a single whole loan In the case of The Summit Birmingham mortgage loan, the JW Marriott Desert Springs mortgage loan, the Pentagon Center mortgage loan, The Davenport mortgage loan, the Merrill |
THE INFORMATION IN THIS STRUCTURAL AND COLLATERAL TERM SHEET IS NOT COMPLETE AND MAY BE AMENDED PRIOR TO THE TIME OF SALE. THIS TERM SHEET IS NOT AN OFFER TO SELL THESE SECURITIES AND IT IS NOT A SOLICITATION OF AN OFFER TO BUY THESE SECURITIES IN ANY JURISDICTION WHERE THE OFFER OR SALE IS NOT PERMITTED.
| 25 |
| BANK 2017-BNK4 | Certain Terms and Conditions |
| Lynch Drive mortgage loan, and the Key Center mortgage loan pursuant to the BACM 2017-BNK3 pooling and servicing agreement, the GSMS 2017-GS5 pooling and servicing agreement (prior to the securitization of Note A-2 of the Pentagon Center whole loan), the Pentagon Center Note A-2 Securitization Servicing Agreement (following the securitization of Note A-2 of the Pentagon Center whole loan), the WFCM 2017-RB1 pooling and servicing agreement, the BBCMS 2017-C1 pooling and servicing agreement, or the CGCMT 2017-P7 pooling and servicing agreement, as applicable, the related special servicer may offer to sell to any person (or may offer to purchase) for cash the related whole loan during such time as the applicable companion loan(s) constitute a defaulted mortgage loan under the related pooling and servicing agreement, and, in connection with any such sale, the related special servicer is required to sell both the mortgage loan and the relatedpari passu companion loan(s) as a whole loan. The directing certificateholder for this securitization will have consultation rights as the holder of an interest in the related mortgage loan, as described in the Preliminary Prospectus. | |
| “As-Is” Appraisals: | Appraisals must be conducted on an “as-is” basis, and must be no more than 9 months old, for purposes of determining Appraisal Reduction Amounts and market value in connection with REO sales. Required appraisals may consist of updates of prior appraisals. Internal valuations by the Special Servicer are permitted if the principal balance of a mortgage loan is less than $2,000,000. |
| Operating Advisor: | The Operating Advisor will perform certain review duties if a Control Termination Event has occurred and is continuing, which will generally include a limited annual review of, and the delivery of a report regarding, certain actions of the Special Servicer with respect to the resolution and/or liquidation of specially serviced loans to the Certificate Administrator. The review and report generally will be based on any asset status reports and additional information delivered to the Operating Advisor by the Special Servicer. In addition, if a Control Termination Event has occurred and is continuing, the Special Servicer must seek to consult with the Operating Advisor (in addition to the directing certificateholder if no Consultation Termination Event has occurred and is continuing) in connection with material special servicing actions with respect to specially serviced loans serviced by the Special Servicer. Furthermore, under certain circumstances, but only if a Consultation Termination Event has occurred and is continuing, the Operating Advisor may recommend the replacement of the Special Servicer, in which case the Certificate Administrator will deliver notice of such recommendation to the certificateholders, and certificateholders with specified percentages of the voting rights may direct the replacement of the Special Servicer at their expense. If a Consultation Termination Event has occurred and is continuing, the Operating Advisor may be removed and replaced without cause upon the affirmative direction of certificate owners holding not less than 75% of the appraisal-reduced voting rights of all Certificates, following a proposal from certificate owners holding not less than 25% of the appraisal-reduced voting rights of all certificates. The certificateholders who initiate a vote on a termination and replacement of the Operating Advisor without cause must cause Fitch, KBRA and Moody’s to confirm the then-current ratings of the certificates (or decline to review the matter) and cause the payment of the fees and expenses incurred in the replacement. The Operating Advisor generally may be discharged from its duties if and when the Class A-1, A-2, A-3, A-4, A-SB, A-S, B, C, D and E Certificates are retired. |
| Asset Representations Reviewer: | The Asset Representations Reviewer will be required to review certain delinquent mortgage loans after a specified delinquency threshold has been exceeded (an “Asset Review Trigger”) and the required percentage of certificateholders vote to direct a review of such delinquent loans. An Asset Review Trigger will occur when either (1) mortgage loans with an aggregate outstanding principal balance of 25.0% or more of the aggregate outstanding principal balance of all of the mortgage loans (including any REO loans (or a portion of any REO loan in the case of a whole loan) held by the issuing entity as of the end of the applicable collection period are delinquent loans or (2) at least 15 mortgage loans are delinquent loans as of the end of the applicable collection period and the outstanding principal balance of such delinquent loans in the aggregate constitutes at least 20.0% of the aggregate outstanding principal balance of all of the mortgage loans (including any REO loans (or a portion of any REO loan in the case of a whole loan)) held by the issuing entity as of the end of the applicable collection period. See “Pooling and Servicing Agreement—The Asset Representations Reviewer—Asset Review” in the Preliminary Prospectus. The Asset Representations Reviewer may be terminated and replaced without cause. Upon (i) the written direction of certificateholders evidencing not less than 25% of the voting rights (without regard to the application of any Appraisal Reduction Amounts) requesting a vote to terminate and replace the Asset Representations Reviewer with a proposed successor Asset Representations Reviewer that is an eligible asset reviewer, and (ii) payment by such holders to the certificate administrator of the reasonable fees and expenses to be incurred by the certificate administrator in connection with administering such vote, the certificate administrator will promptly provide notice to all certificateholders and the Asset Representations Reviewer of such request by posting such notice on its internet website, and by mailing such notice to all certificateholders and the Asset Representations Reviewer. Upon |
THE INFORMATION IN THIS STRUCTURAL AND COLLATERAL TERM SHEET IS NOT COMPLETE AND MAY BE AMENDED PRIOR TO THE TIME OF SALE. THIS TERM SHEET IS NOT AN OFFER TO SELL THESE SECURITIES AND IT IS NOT A SOLICITATION OF AN OFFER TO BUY THESE SECURITIES IN ANY JURISDICTION WHERE THE OFFER OR SALE IS NOT PERMITTED.
| 26 |
| BANK 2017-BNK4 | Certain Terms and Conditions |
| the written direction of certificateholders evidencing at least 75% of a certificateholder quorum (without regard to the application of any Appraisal Reduction Amounts), the Trustee will terminate all of the rights and obligations of the Asset Representations Reviewer under the pooling and servicing agreement by written notice to the Asset Representations Reviewer, and the proposed successor Asset Representations Reviewer will be appointed. See “Pooling and Servicing Agreement—The Asset Representations Reviewer” in the Preliminary Prospectus. | |
| Dispute Resolution Provisions: | The mortgage loan sellers will be subject to the dispute resolution provisions set forth in the pooling and servicing agreement to the extent those provisions are triggered with respect to any mortgage loan sold to the depositor by a mortgage loan seller and such mortgage loan seller will be obligated under the related mortgage loan purchase agreement to comply with all applicable provisions and to take part in any mediation or arbitration proceedings that may result. Generally, in the event that a Repurchase Request (as defined in the Preliminary Prospectus) is not “Resolved” (as defined below) within 180 days after the related mortgage loan seller receives such Repurchase Request, then the enforcing servicer will be required to send a notice to the “Initial Requesting Certificateholder” (if any) and the Certificate Administrator indicating the enforcing servicer’s intended course of action with respect to the Repurchase Request. If (a) the enforcing servicer’s intended course of action with respect to the Repurchase Request does not involve pursuing further action to exercise rights against the related mortgage loan seller with respect to the Repurchase Request and the Initial Requesting Certificateholder, if any, or any other certificateholder or certificate owner wishes to exercise its right to refer the matter to mediation (including non-binding arbitration) or arbitration, or (b) the enforcing servicer’s intended course of action is to pursue further action to exercise rights against the related mortgage loan seller with respect to the Repurchase Request but the Initial Requesting Certificateholder, if any, or any other certificateholder or certificate owner does not agree with the dispute resolution method selected by the enforcing servicer, then the Initial Requesting Certificateholder, if any, or such other certificateholder or certificate owner may deliver a written notice to the Special Servicer indicating its intent to exercise its right to refer the matter to either mediation or arbitration. “Resolved” means, with respect to a Repurchase Request, (i) that the related Material Defect has been cured, (ii) the related mortgage loan has been repurchased in accordance with the related mortgage loan purchase agreement, (iii) a mortgage loan has been substituted for the related mortgage loan in accordance with the related mortgage loan purchase agreement, (iv) the applicable mortgage loan seller has made a Loss of Value Payment (as defined in the Preliminary Prospectus), (v) a contractually binding agreement is entered into between the enforcing servicer, on behalf of the issuing entity, and the related mortgage loan seller that settles the related mortgage loan seller’s obligations under the related mortgage loan purchase agreement, or (vi) the related mortgage loan is no longer property of the issuing entity as a result of a sale or other disposition in accordance with the pooling and servicing agreement. See “Pooling and Servicing Agreement—Dispute Resolution Provisions” in the Preliminary Prospectus. |
| Investor Communications: | The certificate administrator is required to include on any Form 10–D any request received from a certificateholder to communicate with other certificateholders related to certificateholders exercising their rights under the terms of the pooling and servicing agreement. Any certificateholder wishing to communicate with other certificateholders regarding the exercise of its rights under the terms of the Pooling and Servicing Agreement will be able to deliver a written request signed by an authorized representative of the requesting investor to the certificate administrator. |
| Certain Fee Offsets: | If a workout fee is earned by the Special Servicer following a loan default with respect to any mortgage loan that it services, then certain limitations will apply based on modification fees paid by the borrower. The modification fee generally must not exceed 1% of the principal balance of the loan as modified in any 12-month period. In addition, if the loan re-defaults, any subsequent workout fee on that loan must be reduced by a portion of the modification fees paid by the borrower in the previous 12-months. Likewise, liquidation fees collected in connection with a liquidation or partial liquidation of a mortgage loan must be reduced by a portion of the modification fees paid by the borrower in the previous 12 months. |
| Deal Website: | The Certificate Administrator will be required to maintain a deal website, which will include, among other items: (a) summaries of asset status reports prepared by the Special Servicer, (b) inspection reports, (c) appraisals, (d) various “special notices” described in the Preliminary Prospectus, (e) the “Investor Q&A Forum”, (f) a voluntary “Investor Registry” and (g) the “Risk Retention” tab. Investors may access the deal website following execution of a certification and confidentiality agreement. |
| Initial Majority Controlling Class Certificateholder: | It is expected that RREF III Debt AIV, LP or another affiliate of Rialto Capital Advisors, LLC will be the initial majority controlling class certificateholder. |
THE INFORMATION IN THIS STRUCTURAL AND COLLATERAL TERM SHEET IS NOT COMPLETE AND MAY BE AMENDED PRIOR TO THE TIME OF SALE. THIS TERM SHEET IS NOT AN OFFER TO SELL THESE SECURITIES AND IT IS NOT A SOLICITATION OF AN OFFER TO BUY THESE SECURITIES IN ANY JURISDICTION WHERE THE OFFER OR SALE IS NOT PERMITTED.
| 27 |
| BANK 2017-BNK4 | Certain Terms and Conditions |
| Whole Loans: | The mortgaged properties identified on Annex A-1 to the Preliminary Prospectus as D.C. Office Portfolio, The Summit Birmingham, One West 34th Street, Pentagon Center, JW Marriott Desert Springs, The Davenport, Merrill Lynch Drive, Key Center Cleveland, American Greetings HQ and Ralph’s Food Warehouse Portfolio, secure both a mortgage loan to be included in the trust fund and one or more other mortgage loans that will not be included in the trust fund, which will bepari passu or subordinate in right of payment with the mortgage loan included in the trust fund. We refer to each such group of mortgage loans as a “whole loan”. The D.C. Office Portfolio whole loan, the One West 34thStreet whole loan, the American Greetings HQ whole loan and the Ralph’s Food Warehouse Portfolio whole loan are collectively referred to as the “Serviced Whole Loans” and will be principally serviced under the pooling and servicing agreement for this securitization. The Summit Birmingham whole loan and the JW Marriott Desert Springs whole loan will be principally serviced under the pooling and servicing agreement for the BACM 2017-BNK3 securitization. The Pentagon Center whole loan will be principally serviced (i) prior to the securitization of Note A-2, under the pooling and servicing agreement for the GSMS 2017-GS5 securitization, and (ii) following the securitization of Note A-2, under the Pentagon Center Note A-2 Securitization Servicing Agreement. The Davenport whole loan will be principally serviced under the pooling and servicing agreement for the WFCM 2017-RB1 securitization. The Merrill Lynch Drive whole loan will be principally serviced under the pooling and servicing agreement for the BBCMS 2017-C1 securitization. The Key Center Cleveland whole loan will be principally serviced under the pooling and servicing agreement for the CGCMT 2017-P7 securitization. As of the closing date, the companion loans in the whole loans will be held by the party identified above under “IV. Characteristics of the Mortgage Pool—B. Summary of the Whole Loans”. |
THE INFORMATION IN THIS STRUCTURAL AND COLLATERAL TERM SHEET IS NOT COMPLETE AND MAY BE AMENDED PRIOR TO THE TIME OF SALE. THIS TERM SHEET IS NOT AN OFFER TO SELL THESE SECURITIES AND IT IS NOT A SOLICITATION OF AN OFFER TO BUY THESE SECURITIES IN ANY JURISDICTION WHERE THE OFFER OR SALE IS NOT PERMITTED.
| 28 |
(THIS PAGE INTENTIONALLY LEFT BLANK)
| 29 |
D.C. OFFICE PORTFOLIO
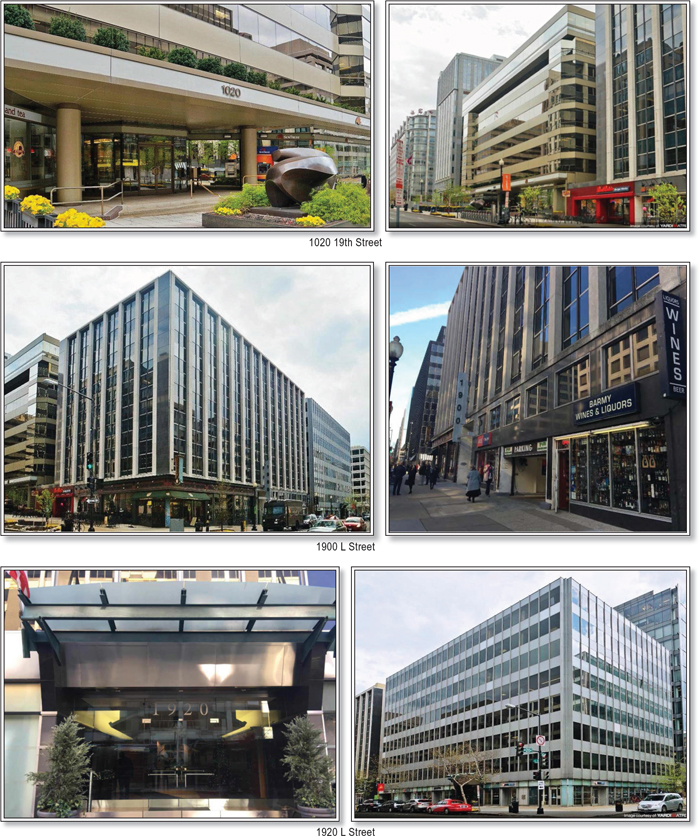
THE INFORMATION IN THIS STRUCTURAL AND COLLATERAL TERM SHEET IS NOT COMPLETE AND MAY BE AMENDED PRIOR TO THE TIME OF SALE. THIS TERM SHEET IS NOT AN OFFER TO SELL THESE SECURITIES AND IT IS NOT A SOLICITATION OF AN OFFER TO BUY THESE SECURITIES IN ANY JURISDICTION WHERE THE OFFER OR SALE IS NOT PERMITTED.
| 30 |
D.C. OFFICE PORTFOLIO
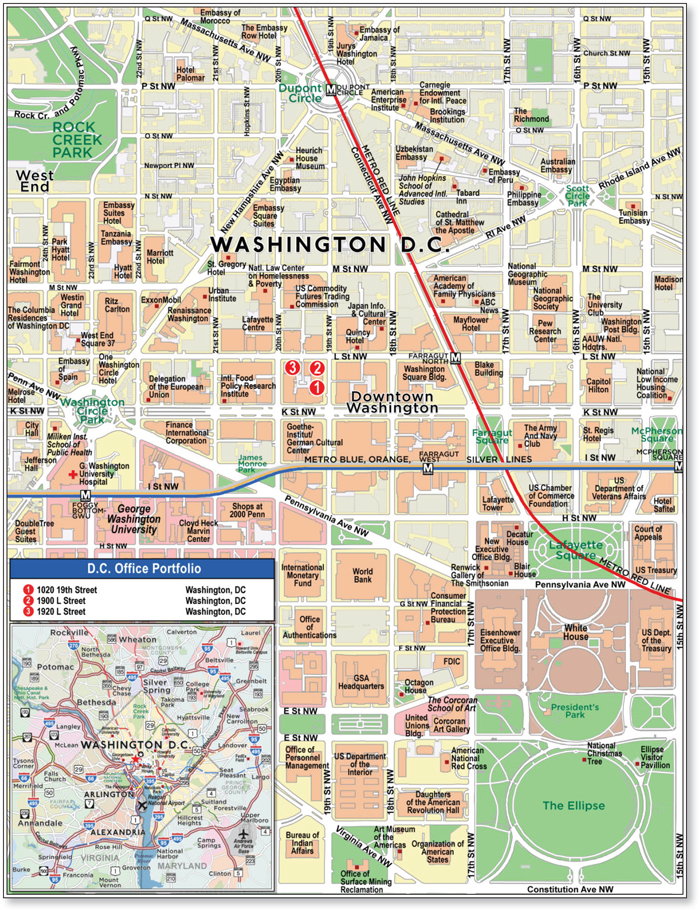
THE INFORMATION IN THIS STRUCTURAL AND COLLATERAL TERM SHEET IS NOT COMPLETE AND MAY BE AMENDED PRIOR TO THE TIME OF SALE. THIS TERM SHEET IS NOT AN OFFER TO SELL THESE SECURITIES AND IT IS NOT A SOLICITATION OF AN OFFER TO BUY THESE SECURITIES IN ANY JURISDICTION WHERE THE OFFER OR SALE IS NOT PERMITTED.
| 31 |
| No. 1 – D.C. Office Portfolio | ||||||||
| Loan Information | Property Information | |||||||
| Mortgage Loan Seller: | Bank of America, N.A. | Single Asset/Portfolio: | Portfolio | |||||
| Credit Assessment (Fitch/KBRA/Moody’s): | NR/NR/NR | Property Type: | Office | |||||
| Original Principal Balance(1): | $70,000,000 | Specific Property Type: | CBD | |||||
| Cut-off Date Balance(1): | $70,000,000 | Location: | Washington, D.C. | |||||
| % of Initial Pool Balance: | 6.9% | Size: | 328,319 SF | |||||
| Loan Purpose: | Refinance | Cut-off Date Balance Per SF(1): | $319.81 | |||||
| Borrower Names: | ZG 1900 L Street, LLC; ZG 1920 L Street, LLC; ZG 1020 19th Street, LLC | Year Built/Renovated: | Various/Various | |||||
| Sponsors: | Charles Gravely; Shelton Zuckerman | Title Vesting: | Fee | |||||
| Mortgage Rate: | 4.7579% | Property Manager: | Self-managed | |||||
| Note Date: | February 13, 2017 | 4thMost Recent Occupancy (As of): | 93.8% (12/31/2013) | |||||
| Anticipated Repayment Date: | NAP | 3rdMost Recent Occupancy (As of): | 92.7% (12/31/2014) | |||||
| Maturity Date: | March 1, 2027 | 2ndMost Recent Occupancy (As of): | 91.0% (12/31/2015) | |||||
| IO Period: | 120 months | Most Recent Occupancy (As of): | 94.4% (12/31/2016) | |||||
| Loan Term (Original): | 120 months | Current Occupancy (As of)(5): | 89.4% (Various) | |||||
| Seasoning: | 1 month | |||||||
| Amortization Term (Original): | NAP | Underwriting and Financial Information: | ||||||
| Loan Amortization Type: | Interest-only, Balloon | |||||||
| Interest Accrual Method: | Actual/360 | 4thMost Recent NOI (As of): | $9,670,234 (12/31/2013) | |||||
| Call Protection(2): | L(25),D(90),O(5) | 3rdMost Recent NOI (As of): | $9,553,851 (12/31/2014) | |||||
| Lockbox Type: | Hard/Springing Cash Management | 2ndMost Recent NOI (As of): | $9,384,675 (12/31/2015) | |||||
| Additional Debt(1)(3): | Yes | Most Recent NOI (As of): | $8,856,380 (12/31/2016) | |||||
| Additional Debt Type(1)(3): | Pari Passu; Mezzanine | |||||||
| U/W Revenues: | $15,106,635 | |||||||
| U/W Expenses: | $5,846,676 | |||||||
| Escrows and Reserves(4): | U/W NOI: | $9,259,959 | ||||||
| Type: | Initial | Monthly | Cap (If Any) | U/W NCF: | $8,652,568 | |||
| Taxes | $1,614,433 | $230,633 | NAP | U/W NOI DSCR(1): | 1.83x | |||
| Insurance | $0 | Springing | NAP | U/W NCF DSCR(1): | 1.71x | |||
| Replacement Reserve | $0 | $4,925 | $237,000 | U/W NOI Debt Yield(1)(6): | 9.3% | |||
| TI/LC Reserve | $0 | $41,040 | $1,970,000 | U/W NCF Debt Yield(1)(6): | 8.7% | |||
| Free Rent Reserve | $806,797 | $0 | NAP | As-Is Appraised Value: | $186,800,000 | |||
| Rent Reserve | $310,546 | $0 | NAP | As-Is Appraisal Valuation Date: | December 22, 2016 | |||
| Existing TI/LC Reserve | $816,325 | $0 | NAP | Cut-off Date LTV Ratio(1)(6)(7): | 53.5% | |||
| Earnout Reserve | $5,000,000 | $0 | NAP | LTV Ratio at Maturity or ARD(1)(6)(7): | 53.5% | |||
| (1) | The D.C. Office Portfolio Whole Loan (as defined below), which had an original principal balance of $105,000,000, is comprised of twopari passu promissory notes. The controlling D.C. Office Portfolio Mortgage Loan (as defined below) had an original principal balance of $70,000,000, has an outstanding principal balance of $70,000,000 as of the Cut-off Date and will be contributed to the BANK 2017-BNK4 trust. The Cut-off Date Balance Per SF and U/W NOI DSCR and U/W NCF DSCR are based on the D.C. Office Portfolio Whole Loan. |
| (2) | The defeasance lockout period will be at least 25 payment dates beginning with and including the first payment date of April 1, 2017. Defeasance of the D.C. Office Portfolio Whole Loan is permitted after the date that is the earlier to occur of (i) two years after the closing date of the securitization that includes the last note to be securitized, and (ii) March 1, 2020. The assumed lockout period of 25 payments is based on the expected BANK 2017-BNK4 trust closing date in April 2017. |
| (3) | See “Subordinate and Mezzanine Indebtedness” section. |
| (4) | See “Escrows” section. |
| (5) | Current Occupancy includes one new tenant with a signed lease effective February 15, 2017 and three tenants (3.1% of NRA) with executed leases that will not be in occupancy at the D.C. Office Portfolio Property until June 1, 2017, July 15, 2017 and October 1, 2017. The lender has reserved six months’ rent associated with each of the four tenants. The Current Occupancy excluding these four tenants is 85.9%. See “Escrows” below for further details. |
| (6) | The D.C. Office Portfolio Whole Loan included the funding of a $5,000,000 earnout reserve, which may be released to the borrower in partial disbursements provided among other conditions a 6.73% debt yield is achieved. Any amounts not disbursed within the later of the second year following securitization of the last note and 30 months of the closing date of the D.C. Office Portfolio Whole Loan will be used to pay down the D.C. Office Portfolio Whole Loan with the borrower’s payment of a yield maintenance premium. The U/W NOI Debt Yield, U/W NCF Debt Yield, Cut-off Date LTV Ratio and LTV Ratio at Maturity or ARD as shown are based on the D.C. Office Portfolio Whole Loan net of the $5,000,000 earnout reserve. The U/W NOI Debt Yield, U/W NCF Debt Yield and Cut-off Date LTV Ratio based on the D.C. Office Portfolio Whole Loan amount of $105,000,000 are 8.8%, 8.2% and 56.2%, respectively. |
| (7) | The D.C. Office Portfolio Property was given an “As-Is” appraised assemblage land value of $203,000,000 as of December 22, 2016 resulting in a Cut-off Date LTV ratio of 51.7% based on the D.C. Office Portfolio Whole Loan. |
The Mortgage Loan.The mortgage loan (the “D.C. Office Portfolio Mortgage Loan”) is part of a whole loan (“D.C. Office Portfolio Whole Loan”) evidenced by twopari passu notes, including Note A-1 and Note A-2, both secured by a first lien mortgage encumbering three office buildings located in Washington, D.C. (the “D.C. Office Portfolio Property” or the “D.C. Office Portfolio Properties”). The D.C. Office Portfolio Whole Loan was originated on February 13, 2017 by Bank of America, N.A. The D.C. Office Portfolio Whole Loan had an original principal balance of $105,000,000, has an outstanding principal balance as of the Cut-off Date of $105,000,000 and accrues interest at an interest rate of approximately 4.7579%per annum. The D.C. Office Portfolio Whole Loan
THE INFORMATION IN THIS STRUCTURAL AND COLLATERAL TERM SHEET IS NOT COMPLETE AND MAY BE AMENDED PRIOR TO THE TIME OF SALE. THIS TERM SHEET IS NOT AN OFFER TO SELL THESE SECURITIES AND IT IS NOT A SOLICITATION OF AN OFFER TO BUY THESE SECURITIES IN ANY JURISDICTION WHERE THE OFFER OR SALE IS NOT PERMITTED.
| 32 |
D.C. OFFICE PORTFOLIO
had an initial term of 120 months, has a remaining term of 119 months as of the Cut-off Date and requires payments of interest only through the term of the D.C. Office Portfolio Whole Loan. The D.C. Office Portfolio Whole Loan matures on March 1, 2027.
The D.C. Office Portfolio Mortgage Loan is evidenced by Note A-1, had an original principal balance of $70,000,000, has an outstanding principal balance as of the Cut-off Date of $70,000,000, represents the controlling interest in the D.C. Office Portfolio Whole Loan and will be contributed to the BANK 2017-BNK4 trust. The D.C. Office Portfolio Companion Loan is evidenced by Note A-2, had an original principal balance of $35,000,000, has an outstanding principal balance as of the Cut-off Date of $35,000,000, is currently held by Bank of America, N.A. and is expected to be contributed to one or more future securitization trusts. See “Description of the Mortgage Pool—The Whole Loans—The Serviced Pari Passu Whole Loans” in the Preliminary Prospectus.
Note Summary
| Notes | Original Balance | Note Holder | Controlling Interest |
| A-1 | $70,000,000 | BANK 2017-BNK4 | Yes |
| A-2 | $35,000,000 | Bank of America, N.A. | No |
| Total | $105,000,000 |
Following the lockout period, the borrower has the right to defease the D.C. Office Portfolio Whole Loan in whole or in part on any date before November 1, 2026. The D.C. Office Portfolio Whole Loan is prepayable without penalty on or after November 1, 2026. The lockout period will expire on the earlier to occur of (i) two years after the closing date of the securitization that includes the last note to be securitized and (ii) March 1, 2020.
Sources and Uses(1)(2)
| Sources | Uses | |||||||
| Original whole loan amount | $105,000,000 | 80.8% | Loan Payoff | $107,197,954 | 82.5% | |||
| Mezzanine loan | 25,000,000 | 19.2 | Reserves | 8,548,101 | 6.6 | |||
| Closing costs | 1,091,974 | 0.8 | ||||||
| Return of equity | 13,161,971 | 10.1 | ||||||
| Total Sources | $130,000,000 | 100.0% | Total Uses | $130,000,000 | 100.0% |
| (1) | The D.C. Office Portfolio sponsors purchased the D.C. Office Portfolio Properties between 2001 and 2007 for an aggregate purchase price of $112,100,000 and maintain a total cost basis of approximately $140,564,075. |
| (2) | The D.C. Office Portfolio Property was previously securitized in the WBCMT 2007-C31 transaction. |
The Property.The D.C. Office Portfolio Properties consists of the fee interests in three Class “B” office buildings, the “1020 19th Street Property”, “1900 L Street Property” and “1920 L Street Property”, totaling 328,319 square feet in the Washington, D.C. central business district.
The following table presents certain information relating to the D.C. Office Portfolio Properties:
Property Schedule
| Property Name/Location | Allocated Cut-Off Date Balance | % of Portfolio Cut-Off Date Balance | Allocated Loan Amount | Occupancy(1) | Year Built/ Renovated | Net Rentable Area (SF)(1) | Appraised Value | Allocated LTV(2) |
1020 19th Street Property 1020 19th Street Northwest Washington, D.C., 20036 | $23,646,667 | 33.8% | $35,470,000 | 93.9% | 1982/1999 | 115,737 | $63,100,000 | 53.5% |
1900 L Street Property 1900 L Street Northwest Washington, D.C., 20036 | $23,233,333 | 33.2% | $34,850,000 | 91.4% | 1965/2002 | 104,859 | $62,000,000 | 53.5% |
1920 L Street Property 1920 L Street Northwest Washington, D.C., 20036 | $23,120,000 | 33.0% | $34,680,000 | 82.6% | 1963/1999 | 107,723 | $61,700,000 | 53.5% |
| Total/Weighted Average | $70,000,000 | 100.0% | $105,000,000 | 89.4% | 328,319 | $186,800,000(3) |
| (1) | Information obtained from the underwritten rent roll, which includes one new tenant with a signed lease effective February 15, 2017 and three tenants (3.1% of NRA) with executed leases that will not be in occupancy at the D.C. Office Portfolio Property until June 1, 2017, July 15, 2017 and October 1, 2017.. |
| (2) | The Allocated LTV as shown is based on the D.C. Office Portfolio Whole Loan net of the $5,000,000 earnout reserve. |
| (3) | The D.C. Office Portfolio Property was given an “As-Is” appraised assemblage land value of $203,000,000 as of December 22, 2016. |
The 1020 19th Street Property is an eight-story office building located mid-block on the west side of 19th Street NW, between L Street NW and K Street NW. The 1020 19th Street Property was built in 1982 and most recently renovated in 1999 to include a new lobby and elevator updates. The D.C. Office Portfolio sponsor acquired the 1020 19th Street Property in 2007 for $48 million and has spent an additional $3,258,550 in capital improvements and approximately $5,516,725 in tenant improvements and leasing costs since acquisition. The 1020 19th Street Property contains 115,737 square feet of rentable area and 90 subterranean garage spaces. As of the February 8, 2017 borrower rent roll, the 1020 19th Street Property was 85.6% occupied.
The 1900 L Street Property is an eight-story office building located at the southwest corner of L Street NW and 19th Street NW. The 1900 L Street Property was built in 1965 and most recently renovated in 2002 to include a new lobby and updates to the elevators, common areas, restrooms, building systems, garage and exterior storefronts and entrance. The D.C. Office Portfolio sponsor
THE INFORMATION IN THIS STRUCTURAL AND COLLATERAL TERM SHEET IS NOT COMPLETE AND MAY BE AMENDED PRIOR TO THE TIME OF SALE. THIS TERM SHEET IS NOT AN OFFER TO SELL THESE SECURITIES AND IT IS NOT A SOLICITATION OF AN OFFER TO BUY THESE SECURITIES IN ANY JURISDICTION WHERE THE OFFER OR SALE IS NOT PERMITTED.
| 33 |
D.C. OFFICE PORTFOLIO
acquired the 1900 L Street Property in 2001 for $16.6 million and has spent an additional $4,831,096 in capital improvements and approximately $4,388,351 in tenant improvements and leasing costs since acquisition. The 1900 L Street Property contains 104,859 square feet of rentable area and 144 subterranean garage spaces. 90 spaces are leased to Avis Budget Car Rental, LLC on a lease expiring February 28, 2026. As of the February 8, 2017 borrower rent roll, the 1900 L Street Property was 88.6% occupied.
The 1920 L Street Property is an eight-story office building located at the southeast corner of L Street NW and 20th Street NW. The 1920 L Street Property was built in 1963 and most recently renovated in 1999 to include a new lobby and updates to the elevators, common areas, restrooms, building systems, garage and exterior storefronts and entrance. The D.C. Office Portfolio sponsor acquired the 1920 L Street Property in 2006 for $47.5 million and has spent an additional $1,879,570 in capital improvements and approximately $3,551,550 in tenant improvements and leasing costs since acquisition. The 1920 L Street Property contains 107,723 square feet of rentable area and 143 subterranean garage spaces. As of the February 8, 2017 borrower rent roll, the 1920 L Street Property was 92.9% occupied.
The following table presents certain information relating to the tenancy at the D.C. Office Portfolio Property:
Major Tenants(1)
| Tenant Name | Tenant NRSF | % of NRSF | Annual U/W Base Rent PSF(2) | Annual U/W Base Rent | % of Total Annual U/W Base Rent | Lease Expiration Date | ||
| 1020 19th Street Property | ||||||||
| Major Tenant | ||||||||
| Farr, Miller & Washington | 7,661 | 6.6% | $47.10 | $360,796 | 7.4% | 3/31/2018 | ||
| Strategic Marketing Innovations | 6,045 | 5.2% | $50.90 | $307,662 | 6.3% | 5/31/2021 | ||
| Community Action Partnership | 6,291 | 5.4% | $40.42 | $254,272 | 5.2% | 4/30/2026 | ||
| Major Tenant Total | 19,997 | 17.3% | $46.14 | $922,730 | 18.9% | |||
| Other Tenants(3) | 88,656 | 76.6% | $45.45 | $3,958,134 | 81.1% | |||
| Total Occupied Space | 108,653 | (4) | 93.9% | (4) | $45.58 | $4,880,864 | 100.0% | |
| Vacant Space | 7,084 | 6.1% | ||||||
| Collateral Total | 115,737 | 100.0% | ||||||
| 1900 L Street Property | ||||||||
| Major Tenant | ||||||||
| Questex Media Group, LLC | 12,513 | 11.9% | $44.15 | $552,480 | 12.3% | 5/31/2020 | ||
| Change to Win(5) | 12,711 | 12.1% | $42.43 | $539,280 | 12.0% | 9/30/2020 | ||
| Potbelly Sandwich Works | 2,333 | 2.2% | $97.65 | $227,826 | 5.1% | 1/31/2023 | ||
| Major Tenant Total | 27,557 | 26.3% | $47.89 | $1,319,586 | 29.3% | |||
| Other Tenants(6) | 68,273 | 65.1% | $46.76 | $3,182,618 | 70.7% | |||
| Total Occupied Space | 95,830 | (7) | 91.4% | (7) | $47.08 | $4,502,204 | 100.0% | |
| Vacant Space | 9,029 | 8.6% | ||||||
| Collateral Total | 104,859 | 100.0% | ||||||
| 1920 L Street Property | ||||||||
| Major Tenant | ||||||||
| Liquidity Services, Inc. | 27,347 | 25.4% | $48.60 | $1,329,069 | 30.9% | 9/30/2019 | ||
| League of Conservation Voters(8) | 13,030 | 12.1% | $53.49 | $696,986 | 16.2% | 12/31/2017 | ||
| PNC Bank | 5,304 | 4.9% | $71.29 | $378,120 | 8.8% | 12/31/2018 | ||
| Major Tenant Total | 45,681 | 42.4% | $52.63 | $2,404,174 | 55.8% | |||
| Other Tenants | 43,342 | 40.2% | $46.40 | $1,903,380 | 44.2% | |||
| Total Occupied Space | 89,023 | (9) | 82.6% | (9) | $49.68 | $4,307,554 | 100.0% | |
| Vacant Space | 18,700 | 17.4% | ||||||
| Collateral Total | 107,723 | 100.0% |
| (1) | Information based on the underwritten rent roll. |
| (2) | Annual U/W Base Rent PSF for “Other Tenants” excludes conference room/storage space that attracts $0 rent. |
| (3) | Includes Breastfeeding Coalition (3,885 square feet) with a signed lease commencing July 15, 2017 and Consortium of Universities (3,567 square feet) with a signed lease commencing October 1, 2017. |
| (4) | Total Occupied Space includes a 1,571 square foot conference room. |
| (5) | Change to Win is entitled to a two month rent abatement commencing April 2017. |
| (6) | Includes NRI Staffing, Inc (2,772 square feet) with a signed lease commencing June 1, 2017. |
| (7) | Total Occupied Space includes 208 square feet of storage space. |
| (8) | The League of Conservation Voters has given notice of the exercise of its termination option effective December 31, 2017 but will remain in occupancy and paying rent until that date. |
| (9) | Total Occupied Space includes 2,323 square feet of storage space |
THE INFORMATION IN THIS STRUCTURAL AND COLLATERAL TERM SHEET IS NOT COMPLETE AND MAY BE AMENDED PRIOR TO THE TIME OF SALE. THIS TERM SHEET IS NOT AN OFFER TO SELL THESE SECURITIES AND IT IS NOT A SOLICITATION OF AN OFFER TO BUY THESE SECURITIES IN ANY JURISDICTION WHERE THE OFFER OR SALE IS NOT PERMITTED.
| 34 |
D.C. OFFICE PORTFOLIO
The following table presents certain information relating to the lease rollover schedule at the D.C. Office Portfolio Property:
Lease Expiration Schedule(1)(2)(3)
| Year Ending December 31, | No. of Leases Expiring | Expiring NRSF | % of Total NRSF | Cumulative Expiring NRSF | Cumulative % of Total NRSF | Annual U/W Base Rent | % of Total Annual U/W Base Rent | Annual U/W Base Rent PSF(4) |
| 1020 19th Street Property | ||||||||
| MTM | 1 | 2,598 | 2.3% | 2,598 | 2.3% | 77,992 | 1.6% | $30.02 |
| 2017 | 4 | 8,178 | 7.2% | 10,776 | 9.4% | 392,785 | 8.0% | $48.03 |
| 2018 | 3 | 11,300 | 9.9% | 22,076 | 19.3% | 519,207 | 10.6% | $45.95 |
| 2019 | 4 | 9,197 | 8.1% | 31,273 | 27.4% | 407,086 | 8.3% | $44.26 |
| 2020 | 2 | 5,707 | 5.0% | 36,980 | 32.4% | 260,202 | 5.3% | $45.59 |
| 2021 | 11 | 31,824 | 27.9% | 68,804 | 60.3% | 1,431,229 | 29.3% | $44.97 |
| 2022 | 5 | 15,615 | 13.7% | 84,419 | 73.9% | 757,866 | 15.5% | $48.53 |
| 2023 | 2 | 5,369 | 4.7% | 89,788 | 78.6% | 246,623 | 5.1% | $45.93 |
| 2024 | 0 | 0 | 0.0% | 89,788 | 78.6% | 0 | 0.0% | $0.00 |
| 2025 | 0 | 0 | 0.0% | 89,788 | 78.6% | 0 | 0.0% | $0.00 |
| 2026 | 1 | 6,291 | 5.5% | 96,079 | 84.2% | 254,272 | 5.2% | $40.42 |
| 2027(5) | 4 | 11,003 | 9.6% | 107,082 | 93.8% | 533,602 | 10.9% | $48.50 |
| Thereafter | 0 | 0 | 0.0% | 107,082 | 93.8% | 0 | 0.0% | $0.00 |
| Vacant | 0 | 7,084 | 6.2% | 114,166 | 100.0% | 0 | 0.0% | $0.00 |
| Total/Weighted Average(6) | 37 | 114,166 | 100.0% | $4,880,864 | 100.0% | $45.58 | ||
| 1900 L Street Property | ||||||||
| MTM | 1 | 649 | 0.6% | 649 | 0.6% | 7200 | 0.2% | $11.09 |
| 2017 | 8 | 12,171 | 11.6% | 12,820 | 12.3% | 563,988 | 12.5% | $46.34 |
| 2018 | 2 | 3,278 | 3.1% | 16,098 | 15.4% | 151,307 | 3.4% | $46.16 |
| 2019 | 11 | 18,811 | 18.0% | 34,909 | 33.4% | 816,576 | 18.1% | $43.41 |
| 2020 | 5 | 29,475 | 28.2% | 64,384 | 61.5% | 1,281,683 | 28.5% | $43.48 |
| 2021 | 2 | 3,059 | 2.9% | 67,443 | 64.4% | 132,205 | 2.9% | $43.22 |
| 2022(7) | 6 | 11,398 | 10.9% | 78,841 | 75.3% | 582,713 | 12.9% | $51.12 |
| 2023 | 1 | 2,333 | 2.2% | 81,174 | 77.6% | 227,826 | 5.1% | $97.65 |
| 2024 | 0 | 0 | 0.0% | 81,174 | 77.6% | 0 | 0.0% | $0.00 |
| 2025 | 2 | 3,374 | 3.2% | 84,548 | 80.8% | 147,711 | 3.3% | $43.78 |
| 2026 | 5 | 9,862 | 9.4% | 94,410 | 90.2% | 494,035 | 11.0% | $50.09 |
| 2027 | 1 | 1,212 | 1.2% | 95,622 | 91.4% | 96,960 | 2.2% | $80.00 |
| Thereafter | 0 | 0 | 0.0% | 95,622 | 91.4% | 0 | 0.0% | $0.00 |
| Vacant | 0 | 9,029 | 8.6% | 104,651 | 100.0% | 0 | 0.0% | $0.00 |
| Total/Weighted Average(8) | 44 | 104,651 | 100.0% | $4,502,204 | 100.0% | $47.08 | ||
| 1920 L Street Property | ||||||||
| MTM | 0 | 0 | 0.0% | 0 | 0.0% | 0 | 0.0% | $0.00 |
| 2017 | 2 | 16,723 | 15.9% | 16,723 | 15.9% | 870,395 | 20.2% | $52.05 |
| 2018 | 4 | 11,308 | 10.7% | 28,031 | 26.6% | 655,570 | 15.2% | $57.97 |
| 2019 | 4 | 32,659 | 31.0% | 60,690 | 57.6% | 1,563,185 | 36.3% | $47.86 |
| 2020 | 3 | 8,860 | 8.4% | 69,550 | 66.0% | 426,793 | 9.9% | $48.17 |
| 2021 | 0 | 0 | 0.0% | 69,550 | 66.0% | 0 | 0.0% | $0.00 |
| 2022 | 1 | 2,599 | 2.5% | 72,149 | 68.5% | 129,203 | 3.0% | $49.71 |
| 2023 | 0 | 0 | 0.0% | 72,149 | 68.5% | 0 | 0.0% | $0.00 |
| 2024 | 1 | 2,857 | 2.7% | 75,006 | 71.2% | 135,770 | 3.2% | $47.52 |
| 2025 | 2 | 10,609 | 10.1% | 85,615 | 81.2% | 477,087 | 11.1% | $44.97 |
| 2026 | 0 | 0 | 0.0% | 85,615 | 81.2% | 0 | 0.0% | $0.00 |
| 2027 | 1 | 1,085 | 1.0% | 86,700 | 82.3% | 49,552 | 1.2% | $45.67 |
| Thereafter | 0 | 0 | 0.0% | 86,700 | 82.3% | 0 | 0.0% | $0.00 |
| Vacant | 0 | 18,700 | 17.7% | 105,400 | 100.0% | 0 | 0.0% | $0.00 |
| Total/Weighted Average(9) | 18 | 105,400 | 100.0% | $4,307,554 | 100.0% | $49.68 |
| (1) | Information obtained from the underwritten rent roll. |
| (2) | Certain tenants may have lease termination or contraction options that are exercisable prior to the originally stated expiration date of the subject lease and that are not considered in the Lease Expiration Schedule. |
| (3) | Certain tenants may have multiple leases that are combined for purposes of this rollover schedule. |
| (4) | Weighted Average Annual U/W Base Rent PSF excludes vacant space. |
| (5) | Includes Breastfeeding Coalition (3,885 square feet) with a signed lease commencing July 15, 2017 and Consortium of Universities (3,567 square feet) with a signed lease commencing October 1, 2017. |
| (6) | Total NRSF excludes a 1,571 square foot conference room. |
| (7) | Includes NRI Staffing, Inc (2,772 square feet) with a signed lease commencing June 1, 2017. |
| (8) | Total NRSF excludes 208 square feet of storage space. |
| (9) | Total NRSF excludes 2,323 square feet of storage space. |
THE INFORMATION IN THIS STRUCTURAL AND COLLATERAL TERM SHEET IS NOT COMPLETE AND MAY BE AMENDED PRIOR TO THE TIME OF SALE. THIS TERM SHEET IS NOT AN OFFER TO SELL THESE SECURITIES AND IT IS NOT A SOLICITATION OF AN OFFER TO BUY THESE SECURITIES IN ANY JURISDICTION WHERE THE OFFER OR SALE IS NOT PERMITTED.
| 35 |
D.C. OFFICE PORTFOLIO
The following table presents historical occupancy percentages at the D.C. Office Portfolio Property:
Historical Occupancy(1)
2009 | 2010 | 2011 | 2012 | 2013 | 2014 | 2015 | 2016 | |
| 1020 19th Street Property | 92.0% | 86.0% | 92.0% | N/A | 86.0% | 93.0% | 91.0% | 97.2% |
| 1900 L Street Property | 94.0% | 90.0% | 94.0% | 94.0% | 97.0% | 94.0% | 89.0% | 92.8% |
| 1920 L Street Property | 85.0% | 85.0% | 98.0% | 98.0% | 99.0% | 91.0% | 93.0% | 92.9% |
| Weighted Average | 90.3% | 86.9% | 94.6% | N/A | 93.8% | 92.7% | 91.0% | 94.4% |
| (1) | Information obtained from the borrower. |
Operating History and Underwritten Net Cash Flow. The following table presents certain information relating to the historical operating performance and the underwritten net cash flow at the D.C. Office Portfolio Property:
Cash Flow Analysis(1)
| 2012 | 2013 | 2014 | 2015 | 2016 | U/W | % of U/W Effective Gross Income | U/W $ per SF | |
| Base Rent | $14,063,490 | $14,462,883 | $14,775,631 | $15,038,036 | $15,026,439 | $13,690,622 | 90.6% | $41.70 |
| Grossed Up Vacant Space | 0 | 0 | 0 | 0 | 0 | 1,556,782 | 10.3 | 4.74 |
| Total Reimbursables | 535,905 | 621,234 | 504,022 | 698,655 | 566,870 | 462,308 | 3.1 | 1.41 |
| Other Income | 65,730 | 28,828 | 38,823 | 52,518 | 69,896 | 49,362 | 0.3 | 0.15 |
| Parking Income | 632,383 | 586,674 | 527,370 | 564,016 | 851,269 | 904,277 | 6.0 | 2.75 |
| Less Vacancy & Credit Loss | (554,630) | (676,242) | (719,443) | (1,115,671) | (1,873,727) | (1,556,716) | (10.3) | (9.9%) |
| Effective Gross Income | $14,742,878 | $15,023,377 | $15,126,403 | $15,237,554 | $14,640,747 | $15,106,635 | 100.0% | $46.01 |
| Total Operating Expenses | 5,158,468 | 5,353,143 | 5,572,552 | 5,852,879 | 5,784,367 | 5,846,676 | 38.7 | 17.81 |
| Net Operating Income | $9,584,410 | $9,670,234 | $9,553,851 | $9,384,675 | $8,856,380 | $9,259,959 | 61.3% | $28.20 |
| TI/LC | 0 | 0 | 0 | 0 | 0 | 541,727 | 3.6 | 1.65 |
| Capital Expenditures | 0 | 0 | 0 | 0 | 0 | 65,664 | 0.4 | 0.20 |
| Net Cash Flow | $9,584,410 | $9,670,234 | $9,553,851 | $9,384,675 | $8,856,380 | $8,652,568 | 57.3% | $26.35 |
| NOI DSCR(2) | 1.89x | 1.91x | 1.89x | 1.85x | 1.75x | 1.83x | ||
| NCF DSCR(2) | 1.89x | 1.91x | 1.89x | 1.85x | 1.75x | 1.71x | ||
| NOI DY(3) | 9.6% | 9.7% | 9.6% | 9.4% | 8.9% | 9.3% | ||
| NCF DY(3) | 9.6% | 9.7% | 9.6% | 9.4% | 8.9% | 8.7% |
| (1) | U/W Base Rent includes income from three tenants who are not yet in occupancy:Breastfeeding Coalition (3,885 square feet) with a signed lease commencing July 15, 2017, Consortium of Universities (3,567 square feet) with a signed lease commencing October 1, 2017, and NRI Staffing, Inc (2,772 square feet) with a signed lease commencing June 1, 2017. For each of the three tenants, lender reserved six months of their respective rent. |
| (2) | The debt service coverage ratios are based on the D.C. Office Portfolio Whole Loan. |
| (3) | The debt yields are based on the D.C. Office Portfolio Whole Loan net of the $5,000,000 earnout reserve. |
Appraisal. As of the appraisal valuation date of December 22, 2016, the D.C. Office Portfolio Property had a total “as-is” appraised value of $186,800,000 and an assemblage land value of $203,000,000.
Environmental Matters. According to Phase I environmental assessments dated December 28, 2016 to December 30, 2016, recommendations were made to implement O&M programs relating to asbestos and lead based paint at the each D.C. Office Portfolio Property, and to implement an O&M program relating to a UST at the 1900 L Street Property.
Market Overview and Competition.The D.C. Office Portfolio Property is located in the Central Business District (“CBD”) of Washington, D.C., situated prominently one block from the Farragut West Metrorail station and two blocks from the Farragut North Metrorail station, approximately two blocks east of George Washington University Hospital, between DuPont Circle to the north and the White House to the south. The D.C. Office Portfolio Property is immediately surrounded by Class “A” office buildings with street-level retail shops and restaurants. The Executive Buildings, Blair House and the Department of Treasury are located just southeast, and the World Bank Headquarters, George Washington University campus and hospital center are located south of the D.C. Office Portfolio Property. The D.C. Office Portfolio Property abuts Foggy Bottom, an area dominated by the U.S. Department of State.
The Federal Government, Defense, and High Technology sectors are the primary economic drivers in the Washington, D.C. metropolitan statistical area (“MSA”) and Washington, D.C. continues to be a popular tourist destination. According to the appraisal, the Washington, D.C. MSA has continued to expand as the private sector, particularly the leisure and hospitality and education and health services industries, continues to make up for federal payroll losses. The region’s gross metro product rose by 2.2% in 2015 and is projected to rise an estimated 2.6% annually over the next five years. Employment grew 1.8% in 2015 and is projected to grow 2.0% in 2016.
THE INFORMATION IN THIS STRUCTURAL AND COLLATERAL TERM SHEET IS NOT COMPLETE AND MAY BE AMENDED PRIOR TO THE TIME OF SALE. THIS TERM SHEET IS NOT AN OFFER TO SELL THESE SECURITIES AND IT IS NOT A SOLICITATION OF AN OFFER TO BUY THESE SECURITIES IN ANY JURISDICTION WHERE THE OFFER OR SALE IS NOT PERMITTED.
| 36 |
D.C. OFFICE PORTFOLIO
The Washington, D.C. MSA has one of the most well-educated and well-paid populations in the country. Approximately 47.3% of the region’s residents hold a four-year degree or higher with approximately 22.6% of the region’s population having received or is pursuing, an advanced degree. According to the appraisal, the 2016 estimated population within a one-, three-, and five-mile radius was 62,231, 363,451 and 777,025, respectively and the 2016 average household income within the same radii was $143,208, $130,898 and $126,916, respectively.
The D.C. Office Portfolio Property is located within the CBD submarket of the District of Columbia office market. According to the appraisal, the CBD submarket has the lowest vacancy rate in the city with a direct vacancy at pre-recession low of 8.7% with weighted average rents of $54.10 PSF at the end of 2016 Q3. For the same period, the CBD submarket had approximately 33.5 million square feet of inventory with positive absorption of 372,715 square feet. According to a market report, the third quarter 2016 vacancy rate for “3 Star” buildings within the CBD submarket was 6.5% with asking rents of $46.11 PSF.
According to the appraisal, there are five properties currently under construction or under renovation in the CBD submarket totaling approximately 1.55 million square feet of net rentable area, of which 57% has been preleased.
The following table presents certain information relating to comparable office leases for the D.C. Office Portfolio Property:
Comparable Leases(1)
| Property Name/Location | Year Renov. | Total GLA (SF) | Total Occ. | Distance from Subject | Tenant Name | Lease Date/Term | Lease Area (SF) | Annual Base Rent PSF | Lease Type |
| 1220 19th Street NW | 1976/NA | 102,304 | 99.1% | 0.5 miles | Ankura Consulting Group LLC | Nov-16/4 Yrs | 5,968 | $49.00 | FSG |
Air Line Pilots Association Building 1625 Massachusetts Avenue NW | 1972/NA | 111,546 | 100% | 0.9 miles | International Organization for Migration | Oct-16/8 Yrs | 5,240 | $48.00 | FSG |
Marshall Coyne Building 1156 15th Street NW | NAV | NAV | NAV | 0.9 miles | American Jewish Committee | Sep-16/7 Yrs | 6,354 | $47.00 | FSG |
Barr Building 910 17th Street NW | 1927/1997 | 100,644 | 85.7% | 0.5 miles | Sparks Personnel Services Inc. | Aug-16/8 Yrs | 2,930 | $43.00 | FSG |
The Ring Building 1200 18th Street NW | 1947/NA | 198,492 | 95.8% | 0.6 miles | National Council for Community & Education Partnerships | Aug-16/10 Yrs | 4,500 | $37.50 | FSG |
The Ring Building 1200 18th Street NW | 1947/NA | 198,492 | 95.8% | 0.6 miles | Chorus America | Aug-16/10 Yrs | 2,530 | $39.00 | FSG |
1220 19th Street NW | 1976/NA | 102,304 | 99.1% | 0.5 miles | Geosyntec Consultants | Jun-16/5 Yrs | 2,728 | $46.00 | FSG |
1350 Connecticut Avenue NW | 1938/1988 | 190,389 | 93.7% | 0.8 miles | Oceana Inc | Apr-16/2 Yrs | 3,325 | $44.00 | FSG |
| (1) | Information obtained from the appraisals. |
The Borrower.The borrowers are ZG 1900 L Street, LLC, ZG 1920 L Street, LLC and ZG 1020 19th Street, LLC, each a single purpose Delaware limited liability company with two independent directors. Legal counsel to the borrower delivered a non-consolidation opinion in connection with the origination of the D.C. Office Portfolio Whole Loan.
The Sponsor.The sponsors and nonrecourse carveout guarantors are Charles Gravely and Shelton Zuckerman, each a principal of Zuckerman Gravely Development, Inc., a full service real estate company specializing in property management, development, leasing, finance and construction. Zuckerman Gravely Development, Inc. has a portfolio of approximately 1.7 million square feet of commercial office and retail space that is currently over 95% leased, and approximately 1,700 apartment units in the Washington, D.C. metropolitan area.
Escrows.The borrower deposited at closing $1,614,433 for taxes and is required to deposit on each monthly payment date (i) an amount equal to one-twelfth of the taxes the lender estimates will be payable in the next 12 months and (ii) an amount equal to one-twelfth of the insurance premiums the lender estimates will be payable in the next 12 months;provided that the requirement to deposit insurance premiums will be suspended if the borrower provides satisfactory evidence to the lender that the insurance coverage required by the D.C. Office Portfolio Whole Loan documents is being provided under acceptable blanket insurance policies.
The borrower is required to deposit on each monthly payment date $4,925 to a replacement reserve subject to a cap of $237,000 and $41,040 to a leasing reserve subject to a cap of $1,970,000.
The borrower has deposited at closing $806,797 to a rent reserve for abated rent periods through March 31, 2022 relating to 21 various tenants, $310,546 to a rent reserve relating to six various tenants with signed leases or letters of intent who are not yet in occupancy, and $816,325 to an existing tenant improvement and leasing reserve for landlord obligations relating to nine various tenants.
THE INFORMATION IN THIS STRUCTURAL AND COLLATERAL TERM SHEET IS NOT COMPLETE AND MAY BE AMENDED PRIOR TO THE TIME OF SALE. THIS TERM SHEET IS NOT AN OFFER TO SELL THESE SECURITIES AND IT IS NOT A SOLICITATION OF AN OFFER TO BUY THESE SECURITIES IN ANY JURISDICTION WHERE THE OFFER OR SALE IS NOT PERMITTED.
| 37 |
D.C. OFFICE PORTFOLIO
The borrower has deposited at closing $5,000,000 to an earnout reserve, which borrower may not more than one time per quarter request a partial disbursement of provided that certain conditions are satisfied,inter alia(i) no event of default is continuing; and (ii) following the partial disbursement, the Earn Out Debt Yield (as defined below) shall be no less than 6.73%. On the later of (1) 30 months after the closing date of the D.C. Office Portfolio Whole Loan and (2) the end of the lockout period, any amount remaining in the earnout reserve shall be applied to prepay the D.C. Office Portfolio Whole Loan and borrower will be required to pay a yield maintenance premium.
The “Earn Out Debt Yield” shall be calculated based on (a)(i) annualized in-place base rents (including expense reimbursements and contractual rent steps occurring within the next twelve months received under bona fide leases for tenants in occupancy or in occupancy within 60 days and excluding rent due from leases expiring within 60 days) and actual percentage rents and recurring operating income received for the preceding twelve months, (ii) less operating expenses for the last 12 months (excluding non-recurring items) adjusted to assume a vacancy rate of the greater of 6% or actual vacancy, management fees of 3% of effective gross income, capital expenditures of $0.18 PSF and tenant improvement and leasing costs equal to $1.60 PSF, divided by (b) the principal amount outstanding on the D.C. Office Portfolio Whole Loan plus the proposed earnout partial disbursement, plus the principal amount outstanding on the D.C. Office Mezzanine Loan.
Lockbox and Cash Management.The D.C. Office Portfolio Whole Loan is structured with a lender-controlled lockbox, which is already in place. The D.C. Office Portfolio Whole Loan documents require the borrower to direct all tenants to pay rent directly into such lockbox account, and also require that all rents received by the borrower or the property manager be deposited into the lockbox account. Prior to the occurrence of a Cash Sweep Period (as defined below), all funds in the lockbox account are distributed to the borrower. During a Cash Sweep Period, all funds in the lockbox account are swept to a lender-controlled cash management account and applied as provided in the loan documents. Also during the continuation of a Cash Sweep Period, all excess cash flow shall be retained and held by lender as additional security for the D.C. Office Portfolio Whole Loan.
A “Cash Sweep Period” will commence upon the earlier of (i) a D.C. Office Portfolio Mezzanine Loan default or (ii) upon the debt service coverage ratio being less than 1.10x for two consecutive calendar quarters, and will end upon as applicable (y) the cure of such D.C. Office Portfolio Mezzanine Loan default, and (z) the debt service coverage ratio being at least 1.15x for the trailing six months.
Property Management. The D.C. Office Portfolio Property is managed by Zuckerman Gravely Management, Inc., an affiliate of the borrower.
Assumption. The borrower has the right to transfer the D.C. Office Portfolio Property provided that certain conditions are satisfied,inter alia (i) no event of default is continuing; (ii) lender has approved of the transferee based on factors including its underwriting and credit requirements, the experience, track record and financial strength of the transferee and its principals; (iii) if required by lender, lender has received rating agency confirmation; and (iv) if required by the D.C. Office Portfolio Mezzanine Loan documents, the transferee shall have assumed the obligations of the D.C. Office Portfolio Mezzanine Loan borrower.
Partial Release.Following the lockout period, the D.C. Office Portfolio borrower is permitted to release any individual property provided that certain conditions are satisfied,inter alia (i) no event of default is continuing; (ii) if required by lender rating agency confirmation has been received; (iii) the D.C. Office Portfolio Mezzanine Loan borrower shall have defeased the applicable portion of the D.C. Office Portfolio Mezzanine Loan; and (iv) the D.C. Office Whole Loan shall be prepaid by an amount equal to the Release Amount.
The “Release Amount” means (I) in connection with a property release pursuant to an arm’s length sale, an amount equal to the greater of (i) 110% of the allocated loan amount for such individual property being released and (ii) an amount such that (a) the loan to value ratio excluding the individual property being released is no more than (1) 69.59%, and (2) the loan to value ratio immediately prior to the release; (b) the debt service coverage ratio excluding the individual property being released is no less than (1) 1.25x and (2) the debt service coverage ratio immediately prior to the release; and (c) the debt yield excluding the individual property being released is no less than (1) 6.7267%, and (2) the debt yield immediately prior to the release (the amount determined in the foregoing clause the “Base Release Amount”); or (II) in connection with any other property release, an amount equal to the greater of (i) 125% of the allocated loan amount for such individual property being released and (ii) the Base Release Amount for such individual property.
Real Estate Substitution.Not permitted.
Subordinate and Mezzanine Indebtedness.Bank of America, N.A. has made a $25,000,000 mezzanine loan (the “D.C. Office Portfolio Mezzanine Loan”) to ZG Walker Holdings, LLC and 1900 L Holding, LLC, the sole members of the borrower under the D.C. Office Portfolio Whole Loan. The D.C. Office Portfolio Mezzanine Loan accrues interest at an interest rate of 6.75%per annum, requires payments of interest only through its 120-month term, and matures on March 1, 2027. The Cut-off Date LTV Ratio, U/W NCF DSCR and U/W NCF DY based on the combined D.C. Office Portfolio Whole Loan including the D.C. Office Portfolio Mezzanine Loan are 69.6%, 1.28x and 6.7%, respectively.
Ground Lease.None.
Terrorism Insurance. The loan documents require that the “all risk” insurance policy required to be maintained by the borrower provides coverage for terrorism in an amount equal to the full replacement cost of the D.C. Office Portfolio Property, provided, however, that borrower will not be required to pay annual terrorism insurance premiums greater than two times the premium for a stand-alone policy for only the D.C. Office Portfolio Property. The loan documents also require business interruption insurance covering no less than the 18-month period following the occurrence of a casualty event, together with a 12-month extended period of indemnity.
THE INFORMATION IN THIS STRUCTURAL AND COLLATERAL TERM SHEET IS NOT COMPLETE AND MAY BE AMENDED PRIOR TO THE TIME OF SALE. THIS TERM SHEET IS NOT AN OFFER TO SELL THESE SECURITIES AND IT IS NOT A SOLICITATION OF AN OFFER TO BUY THESE SECURITIES IN ANY JURISDICTION WHERE THE OFFER OR SALE IS NOT PERMITTED.
| 38 |
(THIS PAGE INTENTIONALLY LEFT BLANK)
| 39 |
THE SUMMIT BIRMINGHAM

THE INFORMATION IN THIS STRUCTURAL AND COLLATERAL TERM SHEET IS NOT COMPLETE AND MAY BE AMENDED PRIOR TO THE TIME OF SALE. THIS TERM SHEET IS NOT AN OFFER TO SELL THESE SECURITIES AND IT IS NOT A SOLICITATION OF AN OFFER TO BUY THESE SECURITIES IN ANY JURISDICTION WHERE THE OFFER OR SALE IS NOT PERMITTED.
| 40 |
THE SUMMIT BIRMINGHAM
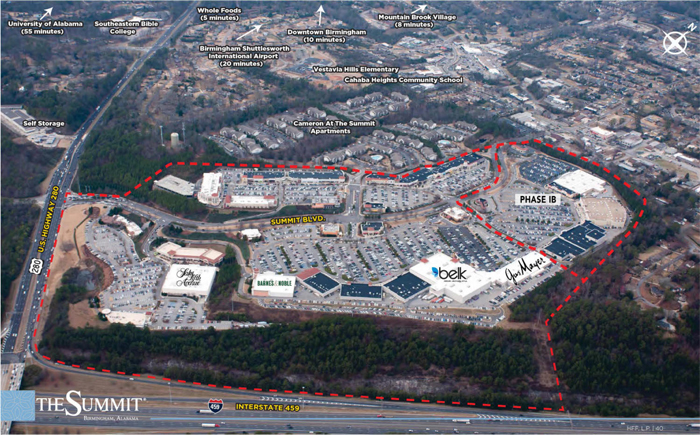
THE INFORMATION IN THIS STRUCTURAL AND COLLATERAL TERM SHEET IS NOT COMPLETE AND MAY BE AMENDED PRIOR TO THE TIME OF SALE. THIS TERM SHEET IS NOT AN OFFER TO SELL THESE SECURITIES AND IT IS NOT A SOLICITATION OF AN OFFER TO BUY THESE SECURITIES IN ANY JURISDICTION WHERE THE OFFER OR SALE IS NOT PERMITTED.
| 41 |
THE SUMMIT BIRMINGHAM
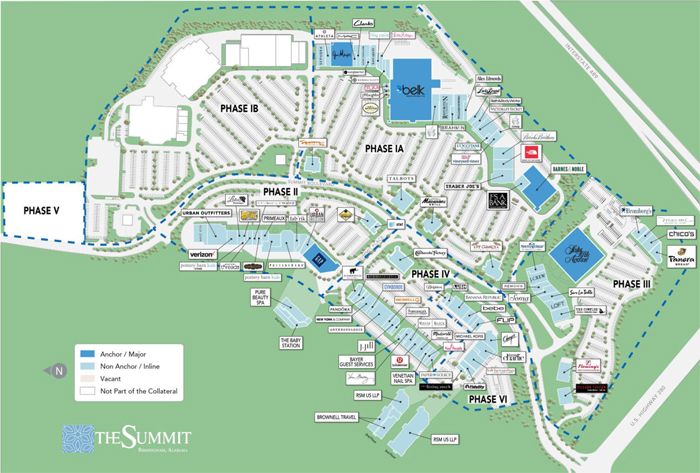
THE INFORMATION IN THIS STRUCTURAL AND COLLATERAL TERM SHEET IS NOT COMPLETE AND MAY BE AMENDED PRIOR TO THE TIME OF SALE. THIS TERM SHEET IS NOT AN OFFER TO SELL THESE SECURITIES AND IT IS NOT A SOLICITATION OF AN OFFER TO BUY THESE SECURITIES IN ANY JURISDICTION WHERE THE OFFER OR SALE IS NOT PERMITTED.
| 42 |
THE SUMMIT BIRMINGHAM
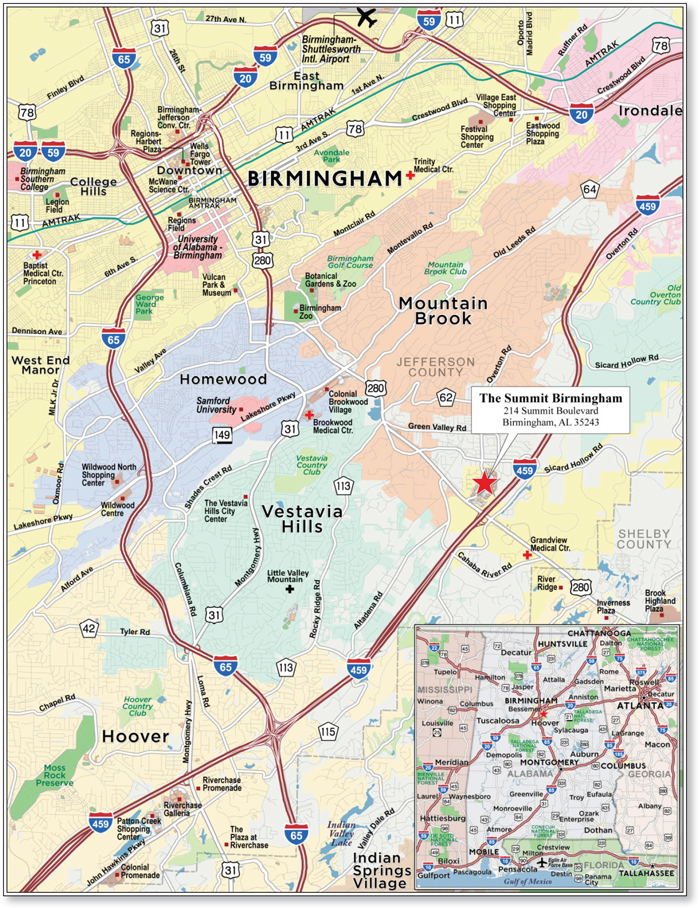
THE INFORMATION IN THIS STRUCTURAL AND COLLATERAL TERM SHEET IS NOT COMPLETE AND MAY BE AMENDED PRIOR TO THE TIME OF SALE. THIS TERM SHEET IS NOT AN OFFER TO SELL THESE SECURITIES AND IT IS NOT A SOLICITATION OF AN OFFER TO BUY THESE SECURITIES IN ANY JURISDICTION WHERE THE OFFER OR SALE IS NOT PERMITTED.
| 43 |
| No. 2– The Summit Birmingham | |||||||
| Loan Information | Property Information | ||||||
| Mortgage Loan Seller: | Bank of America, N.A. | Single Asset/Portfolio: | Single Asset | ||||
Credit Assessment (Fitch/KBRA/Moody’s): | NR/NR/NR | Property Type: | Retail | ||||
| Original Principal Balance(1): | $61,875,000 | Specific Property Type: | Lifestyle Center | ||||
| Cut-off Date Balance(1): | $61,875,000 | Location: | Birmingham, AL | ||||
| % of Initial Pool Balance: | 6.1% | Size: | 681,245 SF | ||||
| Loan Purpose: | Refinance | Cut-off Date Balance Per SF(1): | $305.32 | ||||
| Borrower Name: | BRC Holding Company, L.L.C. | Year Built/Renovated: | 1997/2009 | ||||
| Sponsors: | JDJ Birmingham Company, L.L.C.; Institutional Mall Investors LLC | Title Vesting: | Fee | ||||
| Mortgage Rate: | 4.762% | Property Manager: | Bayer Properties, L.L.C. | ||||
| Note Date: | December 20, 2016 | 4thMost Recent Occupancy (As of): | NAV | ||||
| Anticipated Repayment Date: | NAP | 3rdMost Recent Occupancy (As of)(4): | 98.9% (12/31/2013) | ||||
| Maturity Date: | January 1, 2027 | 2ndMost Recent Occupancy (As of)(4): | 96.4% (12/31/2014) | ||||
| IO Period: | 120 months | Most Recent Occupancy (As of)(4): | 97.8% (12/31/2015) | ||||
| Loan Term (Original): | 120 months | Current Occupancy (As of)(5): | 98.5% (12/14/2016) | ||||
| Seasoning: | 3 months | ||||||
| Amortization Term (Original): | NAP | Underwriting and Financial Information: | |||||
| Loan Amortization Type: | Interest-only, Balloon | ||||||
| Interest Accrual Method: | Actual/360 | 4thMost Recent NOI (As of)(6): | $19,160,179 (12/31/2013) | ||||
| Call Protection(2): | L(27),D(86),O(7) | 3rdMost Recent NOI (As of)(6): | $19,415,127 (12/31/2014) | ||||
| Lockbox Type: | Hard/Springing Cash Management | 2ndMost Recent NOI (As of)(6): | $19,589,778 (12/31/2015) | ||||
| Additional Debt(1): | Yes | Most Recent NOI (As of): | $17,296,891 (12/31/2016) | ||||
| Additional Debt Type(1): | Pari Passu | ||||||
| U/W Revenues: | $24,205,097 | ||||||
| U/W Expenses: | $6,134,767 | ||||||
| U/W NOI: | $18,070,330 | ||||||
| U/W NCF: | $16,883,902 | ||||||
| Escrows and Reserves(3): | U/W NOI DSCR(1): | 1.80x | |||||
| Type: | Initial | Monthly | Cap (If Any) | U/W NCF DSCR(1): | 1.68x | ||
| Taxes | $0 | Springing | NAP | U/W NOI Debt Yield(1): | 8.7% | ||
| Insurance | $0 | Springing | NAP | U/W NCF Debt Yield(1): | 8.1% | ||
| Replacement Reserves | $0 | Springing | $225,984 | As-Is Appraised Value: | $383,000,000 | ||
| TI/LC Reserve | $1,989,285 | Springing | $2,146,872 | As-Is Appraisal Valuation Date: | November 7, 2016 | ||
| Gap Rent Reserve | $346,727 | $0 | NAP | Cut-off Date LTV Ratio(1): | 54.3% | ||
| Overage Rent Reserve | $506,123 | $0 | NAP | LTV Ratio at Maturity or ARD(1): | 54.3% | ||
| (1) | The Summit Birmingham Whole Loan (as defined below) is comprised of fourpari passu promissory notes with an aggregate original principal balance of $208,000,000. The non-controlling The Summit Birmingham Mortgage Loan (as defined below) had an original principal balance of $61,875,000, has an outstanding principal balance of $61,875,000 as of the Cut-off Date and will be contributed to the BANK 2017-BNK4 trust. All statistical financial information related to balances per square foot, loan-to-value ratios, debt service coverage ratios and debt yields are based on The Summit Birmingham Whole Loan. |
| (2) | The defeasance lockout period will be at least 27 payment dates beginning with and including the first payment date of February 1, 2017. Defeasance of The Summit Birmingham Whole Loan is permitted after the date that is the earlier to occur of (i) two years after the closing date of the securitization that includes the last note to be securitized, and (ii) February 1, 2020. The assumed lockout period of 27 payments is based on the expected BANK 2017-BNK4 trust closing date in April 2017. |
| (3) | See “Escrows” section. |
| (4) | Historical occupancy includes tenants at Phase IB (non-collateral) of The Summit. |
| (5) | Current Occupancy includes three tenants (2.0% of NRA) with executed leases but who are not yet in occupancy at The Summit Birmingham Property. The lender has reserved 100.0% of the rent associated with each tenant from the Note Date through each lease’s scheduled commencement date. See “Escrows” below for further details. |
| (6) | Historical NOI includes income and expenses from Phase IB (non-collateral) of The Summit. |
The Mortgage Loan. The mortgage loan (“The Summit Birmingham Mortgage Loan”) is part of a whole loan (“The Summit Birmingham Whole Loan”) evidenced by fourpari passu promissory notes, secured by the fee interest in a 681,245 square foot portion of The Summit, an upscale mixed-use development in Birmingham, Alabama (the “The Summit Birmingham Property”). The Summit Birmingham Whole Loan was co-originated on December 20, 2016 by Bank of America, N.A. and Barclays Bank PLC. The Summit Birmingham Whole Loan had an original principal balance of $208,000,000, has an outstanding principal balance as of the Cut-off Date of $208,000,000 and accrues interest at an interest rate of 4.762%per annum. The Summit Birmingham Whole Loan had an initial term of 120 months, has a remaining term of 117 months as of the Cut-off Date and requires payments of interest-only through its term. The Summit Birmingham Whole Loan matures on January 1, 2027.
The Summit Birmingham Mortgage Loan, evidenced by Note A-1 will be contributed to the BANK 2017-BNK4 trust, had an original principal balance of $61,875,000, has an outstanding principal balance as of the Cut-off Date of $61,875,000 and represents apari passu non-controlling interest in The Summit Birmingham Whole Loan. The controlling Note A-2 had an original principal balance of $73,325,000 and was contributed to the BACM 2017-BNK3 trust. The non-controlling Note A-3 had an original principal balance of
THE INFORMATION IN THIS STRUCTURAL AND COLLATERAL TERM SHEET IS NOT COMPLETE AND MAY BE AMENDED PRIOR TO THE TIME OF SALE. THIS TERM SHEET IS NOT AN OFFER TO SELL THESE SECURITIES AND IT IS NOT A SOLICITATION OF AN OFFER TO BUY THESE SECURITIES IN ANY JURISDICTION WHERE THE OFFER OR SALE IS NOT PERMITTED.
| 44 |
THE SUMMIT BIRMINGHAM
$50,000,000 and was contributed to the BBCMS 2017-C1 trust, and the non-controlling Note A-4 had an original principal balance of $22,800,000, is currently held by Barclays Bank PLC and is expected to be contributed to the WFCM 2017-RB1 trust. The lender provides no assurances that any non-securitized notes will not be split further. See “Description of the Mortgage Pool—The Whole Loans—The Non-Serviced Whole Loans” in the Preliminary Prospectus.
Note Summary
| Notes | Original Balance | Note Holder | Controlling Interest |
| A-1 | $61,875,000 | BANK 2017-BNK4 | No |
| A-2 | $73,325,000 | BACM 2017-BNK3 | Yes |
| A-3 | $50,000,000 | BBCMS 2017-C1 | No |
| A-4 | $22,800,000 | WFCM 2017-RB1 | No |
| Total | $208,000,000 |
Following the lockout period, on any date before July 1, 2026, the borrower has the right to defease The Summit Birmingham Whole Loan in whole, but not in part. In addition, The Summit Birmingham Whole Loan is prepayable without penalty on or after July 1, 2026. The lockout period will expire on the earlier to occur of (i) two years after the closing date of the securitization that includes the last note to be securitized and (ii) February 1, 2020.
Sources and Uses
| Sources | Uses | |||||||
| Original whole loan amount | $208,000,000 | 100.0% | Loan payoff | $155,905,651 | 75.0% | |||
| Reserves | 2,842,135 | 1.4 | ||||||
| Closing costs | 2,260,319 | 1.1 | ||||||
| Return of equity | 46,991,895 | 22.6 | ||||||
| Total Sources | $208,000,000 | 100.0% | Total Uses | $208,000,000 | 100.0% |
The Property. The Summit Birmingham Property consists of a 681,245 square foot portion of The Summit. The Summit is an upscale mixed-use development comprised of a total of 1,036,240 square feet of retail and office space, built in phases between 1997 and 2009. Phases IA and IB (non-collateral) were opened in 1997 with over 400,000 square feet featuring tenants including Barnes & Noble, Banana Republic, Williams-Sonoma, Ann Taylor, Victoria’s Secret, P.F. Chang’s and Macaroni Grill. Phase II was opened in 2000 and brought new-to-the-market retailers including California Pizza Kitchen, Everything But Water, Pottery Barn and Pottery Barn Kids and also allowed Gap to relocate and add Gap Kids and Gap Body to its offerings. Phase III opened in 2001, bringing Saks Fifth Avenue to open its first and only store in the state of Alabama, adding J. Crew, Fleming’s and Panera Bread, and allowing Chico’s and Talbots to expand its stores. Phase IV opened in 2005 bringing The Cheesecake Factory, Anthropologie, Vera Bradley and Swoozie’s as first-time retailers in the state of Alabama. Phase VI opened in 2009 with 50,000 square feet of office and 50,000 square feet of retail space including tenants Banana Republic, Charming Charlie and Michael Kors. Phase V (non-collateral) is an unimproved 2.1 acre parcel which as with Phase IB (non-collateral) may be developed or redeveloped in the future by The Summit Birmingham Mortgage Loan sponsor.
Access to The Summit is available from seven points of ingress and eight points of egress all controlled by stop signs or traffic lights. The Summit is located at the intersection of Highway 280 (73,970 average daily traffic count) leading northwest through the suburbs of Mountain Brook, Vestavia Hills and Homewood to the Birmingham central business district, and I-459 (101,020 average daily traffic count) leading southwest to the suburb of Hoover. Highway 280 and I-459 are the area’s primary commercial thoroughfares and, according to the appraiser, the intersection of these roadways is the center of the growth corridor of the Birmingham metropolitan area.
The Summit is Birmingham’s single largest generator of sales tax revenue, comprising over 10% of the city’s sales tax revenues. Due to this success, the City of Birmingham has continued to support the development of The Summit and has invested an additional $7.5 million in infrastructure improvements and expansions through tax sharing arrangements. Approximately 50 of The Summit’s retailers are exclusive to the property in Alabama or Birmingham including Saks Fifth Avenue, Trader Joe’s, Art of Shaving, Apple, Pottery Barn, Restoration Hardware and lululemon athletica. Historical occupancy at The Summit has averaged 97.6% for the period 2012 to 2015.
The Summit Birmingham Property is contained across 19 buildings. Included in the collateral are 3,474 parking spaces (approximately 5.10 spaces per 1,000 SF). The Summit Birmingham Property is anchored by Belk and Saks Fifth Avenue (non-collateral), with other large retail tenants including Gap, Barnes & Noble, Trader Joe’s and Gus Mayer. No other retail tenant occupies more than 1.8% of NRA or represents more than 2.0% of base rent. Other noteworthy tenants include: Apple, Anthropologie, The Cheesecake Factory, J Crew, lululemon athletica, Madewell, Pottery Barn, Restoration Hardware, Sephora, Vineyard Vines and West Elm. The two office tenants representing 7.5% of NRA and 8.2% of base rent are RSM US LLP, an audit, tax and consulting firm, and Brownell Travel, a luxury travel agency.
The Summit Birmingham Property was 98.5% leased as of December 2016 to 102 retail, restaurant and office tenants. Total inline sales at The Summit Birmingham Property for the trailing 12 months ending August 31, 2016 were approximately $213.8 million with an average of $603 PSF ($513 PSF excluding Apple), resulting in an occupancy cost of 8.0% (9.4% excluding Apple).
THE INFORMATION IN THIS STRUCTURAL AND COLLATERAL TERM SHEET IS NOT COMPLETE AND MAY BE AMENDED PRIOR TO THE TIME OF SALE. THIS TERM SHEET IS NOT AN OFFER TO SELL THESE SECURITIES AND IT IS NOT A SOLICITATION OF AN OFFER TO BUY THESE SECURITIES IN ANY JURISDICTION WHERE THE OFFER OR SALE IS NOT PERMITTED.
| 45 |
THE SUMMIT BIRMINGHAM
The following table presents certain information relating to the tenancy at The Summit Birmingham Property:
Major Tenants(1)
| Tenant Name | Credit Rating (Fitch/Moody’s/ S&P)(2) | Tenant NRSF(3) | % of NRSF | Annual U/W Base Rent PSF(3)(4) | Annual U/W Base Rent(4) | % of Total Annual U/W Base Rent | Sales PSF(5)(6) | Occupancy Cost(5) | Lease Expiration Date |
| Major Retail Tenants | |||||||||
| Belk | NR/B2/B | 163,480 | 24.0% | $6.41 | $1,047,986 | 5.3% | $245 | 3.2% | 1/31/2018 |
| Gap | BB+/Baa2/BB+ | 17,522 | 2.6% | $40.09 | $702,507 | 3.6% | $267 | 17.5% | 3/31/2020 |
| Barnes & Noble | NR/NR/NR | 25,397 | 3.7% | $20.97 | $532,575 | 2.7% | N/A | N/A | 2/1/2018 |
| Trader Joe’s | NR/NR/NR | 12,922 | 1.9% | $36.00 | $465,192 | 2.4% | N/A | N/A | 9/30/2025 |
| Gus Mayer | NR/NR/NR | 16,410 | 2.4% | $23.39 | $383,760 | 2.0% | $711 | 5.2% | 1/31/2019 |
| Total Major Retail Tenants | 235,731 | 34.6% | $13.29 | $3,132,020 | 15.9% | ||||
| Other Retail Tenants | 384,236 | 56.4% | $38.83 | $14,920,610 | 75.9% | ||||
| Occupied Retail Collateral Total | 619,967 | 91.0% | $29.12 | $18,052,630 | 91.8% | ||||
| Vacant Retail Space | 10,428 | 1.5% | |||||||
| Retail Collateral Total | 630,395 | 92.5% | |||||||
| Office Tenants | |||||||||
| RSM US LLP | 35,724 | 5.2% | $33.84 | $1,208,900 | 6.2% | 10/31/2021 | |||
| Brownell Travel | 15,126 | 2.2% | $26.00 | $393,276 | 2.0% | 3/31/2018 | |||
| Occupied Office Total | 50,850 | 7.5% | $31.51 | $1,602,176 | 8.2% | ||||
| Vacant Office | 0 | 0.0% | |||||||
| Office Collateral Total | 50,850 | 7.5% | |||||||
| Collateral Total | 681,245 | 100.0% | |||||||
| (1) | Information obtained from the underwritten rent roll. |
| (2) | Certain ratings are those of the parent company whether or not the parent company guarantees the lease. |
| (3) | Tenant NRSF includes storage space. |
| (4) | Total Annual U/W Base Rent PSF excludes vacant space. |
| (5) | Sales PSF and Occupancy Costs are for the trailing 12-month period ending August 31, 2016. |
| (6) | Sales PSF excludes storage space. |
The following table presents certain information relating to the historical sales and occupancy costs at The Summit Birmingham Property:
Historical Tenant Sales (PSF) and Occupancy Costs(1)
Historical Tenant Sales (PSF) | ||||
| 2014 | 2015 | 8/31/2016 TTM | 8/31/2016 Occupancy Cost | |
| Total In-Line | ||||
| Comparable Sales PSF w/Apple | $601 | $604 | $603 | 8.0% |
| Comparable Sales PSF w/o Apple | $516 | $518 | $513 | 9.4% |
| (1) | Historical Tenant Sales (PSF) and Occupancy Costs obtained from the underwritten rent roll. |
THE INFORMATION IN THIS STRUCTURAL AND COLLATERAL TERM SHEET IS NOT COMPLETE AND MAY BE AMENDED PRIOR TO THE TIME OF SALE. THIS TERM SHEET IS NOT AN OFFER TO SELL THESE SECURITIES AND IT IS NOT A SOLICITATION OF AN OFFER TO BUY THESE SECURITIES IN ANY JURISDICTION WHERE THE OFFER OR SALE IS NOT PERMITTED.
| 46 |
THE SUMMIT BIRMINGHAM
The following table presents certain information relating to the lease rollover schedule at The Summit Birmingham Property:
Lease Expiration Schedule(1)(2)
| Year Ending December 31, | No. of Leases Expiring(3) | Expiring NRSF | % of Total NRSF | Cumulative Expiring NRSF | Cumulative % of Total NRSF | Annual U/W Base Rent | % of Total Annual U/W Base Rent | Annual U/W Base Rent PSF(4) |
| MTM | 3 | 3,486 | 0.5% | 3,486 | 0.5% | $94,217 | 0.5% | $27.03 |
| 2017 | 13 | 47,241 | 6.9% | 50,727 | 7.4% | $1,567,170 | 8.0% | $33.17 |
| 2018 | 12 | 235,982 | 34.6% | 286,709 | 42.1% | $3,159,659 | 16.1% | $13.39 |
| 2019 | 12 | 65,570 | 9.6% | 352,279 | 51.7% | $2,301,694 | 11.7% | $35.10 |
| 2020 | 6 | 40,535 | 6.0% | 392,814 | 57.7% | $1,612,627 | 8.2% | $39.78 |
| 2021 | 9 | 78,078 | 11.5% | 470,892 | 69.1% | $2,825,302 | 14.4% | $36.19 |
| 2022 | 7 | 25,290 | 3.7% | 496,182 | 72.8% | $1,067,334 | 5.4% | $42.20 |
| 2023 | 11 | 55,727 | 8.2% | 551,909 | 81.0% | $2,060,614 | 10.5% | $36.98 |
| 2024 | 10 | 39,789 | 5.8% | 591,698 | 86.9% | $1,651,661 | 8.4% | $41.51 |
| 2025 | 8 | 37,072 | 5.4% | 628,770 | 92.3% | $1,586,300 | 8.1% | $42.79 |
| 2026 | 4 | 7,295 | 1.1% | 636,065 | 93.4% | $392,140 | 2.0% | $53.75 |
| 2027 | 6 | 32,752 | 4.8% | 668,817 | 98.2% | $1,242,087 | 6.3% | $37.92 |
| 2028 & Beyond | 1 | 2,000 | 0.3% | 670,817 | 98.5% | $94,000 | 0.5% | $47.00 |
| Vacant | 0 | 10,428 | 1.5% | 681,245 | 100.0% | $0 | 0.0% | $0.00 |
| Total/Wtd. Avg. | 102 | 681,245 | 100.0% | $19,654,807 | 100.0% | $29.30 |
| (1) | Information obtained from the underwritten rent roll. |
| (2) | Certain tenants may have lease termination or contraction options that are exercisable prior to the originally stated expiration date of the subject lease and that are not considered in the Lease Expiration Schedule. |
| (3) | Certain tenants may have leases for storage space, which are not counted as separate leases for purposes of this Lease Expiration Schedule. |
| (4) | Weighted Average Annual U/W Base Rent PSF excludes vacant space. |
The following table presents historical occupancy percentages at The Summit Birmingham Property:
Historical Occupancy(1)
12/31/2013(2) | 12/31/2014(2) | 12/31/2015(2) | 12/14/2016(3) |
| 98.9% | 96.4% | 97.8% | 98.5% |
| (1) | Information obtained from the borrower. |
| (2) | Historical occupancy includes tenants at Phase IB (non-collateral) of The Summit. |
| (3) | December 14, 2016 occupancy includes three tenants (2.0% of NRA) with executed leases but who are not yet in occupancy at The Summit Birmingham Property. The lender has reserved 100.0% of the rent associated with each tenant from the Note Date through each lease’s scheduled commencement date. |
THE INFORMATION IN THIS STRUCTURAL AND COLLATERAL TERM SHEET IS NOT COMPLETE AND MAY BE AMENDED PRIOR TO THE TIME OF SALE. THIS TERM SHEET IS NOT AN OFFER TO SELL THESE SECURITIES AND IT IS NOT A SOLICITATION OF AN OFFER TO BUY THESE SECURITIES IN ANY JURISDICTION WHERE THE OFFER OR SALE IS NOT PERMITTED.
| 47 |
THE SUMMIT BIRMINGHAM
Operating History and Underwritten Net Cash Flow. The following table presents certain information relating to the historical operating performance and underwritten net cash flow at The Summit Birmingham Property:
Cash Flow Analysis
| 2013(1) | 2014(1) | 2015(1) | 2016 | U/W | % of U/W Effective Gross Income | U/W $ per SF | |||||||||
| Base Rent(2) | $20,815,763 | $21,292,859 | $21,886,070 | $19,370,283 | $20,333,193(3) | 84.0% | $29.85 | ||||||||
| Grossed Up Vacant Space | 0 | 0 | 0 | 0 | 557,813 | 2.3 | 0.82 | ||||||||
| Total Reimbursables | 4,613,871 | 4,492,764 | 4,656,167 | 3,878,724 | 4,075,464 | 16.8 | 5.98 | ||||||||
| Specialty Leasing | 163,190 | 162,542 | 178,150 | 168,497 | 120,292 | 0.5 | 0.18 | ||||||||
| Other Income(4) | 460,762 | 417,690 | 405,592 | 357,847 | 366,658 | 1.5 | 0.54 | ||||||||
| Less Vacancy & Credit Loss | (79,446) | 15,402 | (191,313) | (479,711) | (1,248,324)(5) | (5.2) | (5.0%) | ||||||||
| Effective Gross Income | $25,974,140 | $26,381,257 | $26,934,666 | $23,295,640 | $24,205,097 | 100.0% | $35.53 | ||||||||
| Total Operating Expenses | 6,813,961 | 6,966,130 | 7,344,888 | 5,998,750 | 6,134,767 | 25.3 | 9.01 | ||||||||
| Net Operating Income | $19,160,179 | $19,415,127 | $19,589,778 | $17,296,891 | $18,070,330 | 74.7% | $26.53 | ||||||||
| TI/LC | 0 | 0 | 0 | 0 | 1,073,437 | 4.4 | 1.58 | ||||||||
| Capital Expenditures | 0 | 0 | 0 | 0 | 112,991 | 0.5 | 0.17 | ||||||||
| Net Cash Flow | $19,160,179 | $19,415,127 | $19,589,778 | $17,296,891 | $16,883,902 | 69.8% | $24.78 | ||||||||
| NOI DSCR(6) | 1.91x | 1.93x | 1.95x | 1.72x | 1.80x | ||||||||||
| NCF DSCR(6) | 1.91x | 1.93x | 1.95x | 1.72x | 1.68x | ||||||||||
| NOI DY(6) | 9.2% | 9.3% | 9.4% | 8.3% | 8.7% | ||||||||||
| NCF DY(6) | 9.2% | 9.3% | 9.4% | 8.3% | 8.1% |
| (1) | Historical NOI includes income and expenses from Phase IB (non-collateral) of The Summit. |
| (2) | Base Rent includes percentage rent. |
| (3) | U/W Base Rent includes contractual rent steps through January 2018. |
| (4) | Other Income includes income from media, events, sponsorships, gift card fees and other miscellaneous income. |
| (5) | U/W Vacancy is 5.0%. As of December 14, 2016, The Summit Birmingham Property was 98.5% occupied. |
| (6) | The debt service coverage ratios and debt yields are based on The Summit Birmingham Whole Loan. |
Appraisal.As of the appraisal valuation date of November 7, 2016, The Summit Birmingham Property had an “as-is” appraised value of $383,000,000.
Environmental Matters.According to the Phase I environmental report dated November 10, 2016, there was no evidence of any recognized environmental conditions at The Summit Birmingham Property.
Market Overview and Competition.The Summit Birmingham Property is located in Birmingham, Alabama. According to the Birmingham business alliance, the Birmingham metropolitan area has a current population of over 1.1 million and contains over 70% of the total jobs in North Central Alabama. Corporations headquartered in the Birmingham metropolitan area include Alabama Power, Associated Grocers of the South, Inc., BBVA Compass, Books-A-Million, Cadence Bank, Hibbett Sports, Liberty National Life Insurance Company, Ready Mix USA, Regions and Thompson/CAT. There are over 23 universities, colleges, technical and professional schools in the Birmingham metropolitan area employing nearly 20,000 and enrolling nearly 100,000 people, with higher education generating an economic impact of more than $1 billion annually to the area. The 2015 unemployment rate for the Birmingham metropolitan area was 5.5%, the lowest rate since 2008.
The Summit Birmingham Property is located approximately five miles southeast of the Birmingham central business district (“CBD”). The Birmingham CBD is home to the four largest area employers including the University of Alabama at Birmingham (23,000 employees), Regions Bank (7,000 employees), St. Vincent’s Health System (4,644 employees) and Children’s of Alabama (4,578 employees). Just west of the Birmingham CBD and adjacent to The Summit Birmingham Property lay the three Birmingham suburbs of Mountain Brook, Vestavia Hills and Homewood, with the city of Hoover to the south.
According to the appraisal, the estimated 2016 population within a three-, five- and ten-mile radius around The Summit Birmingham Property was 38,765, 134,309 and 403,058, respectively. The estimated 2016 average household income within a three-, five- and ten-mile radius was $115,309, $114,008 and $81,258, respectively.
According to the appraisal, as of the third quarter 2016, the Birmingham retail market consisted of 100,229,766 square feet with a vacancy rate of 5.5%, the lowest rate in the last ten years. There is no proposed new competitive supply noted by the appraisal.
THE INFORMATION IN THIS STRUCTURAL AND COLLATERAL TERM SHEET IS NOT COMPLETE AND MAY BE AMENDED PRIOR TO THE TIME OF SALE. THIS TERM SHEET IS NOT AN OFFER TO SELL THESE SECURITIES AND IT IS NOT A SOLICITATION OF AN OFFER TO BUY THESE SECURITIES IN ANY JURISDICTION WHERE THE OFFER OR SALE IS NOT PERMITTED.
| 48 |
THE SUMMIT BIRMINGHAM
The following table presents certain information relating to competitive properties for The Summit Birmingham Property:
Competitive Properties(1)
| Property | Year Built/ Renovated | Total GLA (SF) | Est. Sales PSF | Total Occupancy | Distance from Subject | Major/Anchor Tenants | |||
| The Summit Birmingham (Subject) | 1997/2009 | 681,245 | $603(2) | 98.5%(3) | -- | Saks (non-collateral), Belk, Restoration Hardware, Apple, Trader Joe’s
| |||
| Riverchase Galleria Hoover, AL | 1986/2014 | 762,541 | $450 | 92% | 8.1 miles | Belk, JCPenney (non-collateral), Macy’s (non-collateral), Sears (non-collateral), Von Maur
| |||
Colonial Brookwood Village
| 1973/2002 | 688,000 | N/A | 89% | 3.9 miles | Macy’s, Belk, Books A Million | |||
Shoppes at East Chase
| 2002/N/A | 431,635 | $245 | 98% | 97.4 miles | DSW Shoe Warehouse, Books A Million, Versona | |||
Bridge Street Town Centre(4)
| 2007/N/A | 622,862 | $565 | 98% | 104.0 miles | Belk, Barnes & Noble, Apple, Bed Bath & Beyond | |||
| Avalon Alpharetta, GA | 2014/2017 | 495,907 | $490 | 99% | 167.0 miles | Regal, Whole Foods, Crate & Barrel, Anthropologie | |||
| (1) | Information obtained from the appraisal and underwritten rent roll. |
| (2) | Comparable inline sales shown as of August 31, 2016. Comparable inline sales excluding Apple for that period were $513 per SF. |
| (3) | Occupancy as of December 14, 2016 including three tenants (2.0% of NRA) with executed leases but who are not yet in occupancy at The Summit Birmingham Property. |
| (4) | Bridge Street Town Centre is also owned by Bayer Properties, LLC, one of The Summit Birmingham sponsors. |
The Borrower.The borrower is BRC Holding Company, L.L.C. (“The Summit Birmingham Borrower”), a single-purpose Delaware limited liability company, with at least two independent managers. Legal counsel to the borrower delivered a non-consolidation opinion in connection with the origination of The Summit Birmingham Whole Loan. The nonrecourse carveout guarantors are Jeffery A. Bayer, David L. Silverstein and Jon W. Rotenstreich (collectively, the “Bayer Guarantor”) and Institutional Mall Investors LLC (the “IMI Guarantor”). The obligations of the Bayer Guarantor and the IMI Guarantor under the non-recourse carveout guaranty are several (not joint and several); provided that, among the individuals comprising the Bayer Guarantor, the obligations of such individuals are joint and several. See “Description of the Mortgage Pool–Certain Terms of the Mortgage Loans—Non-Recourse Obligations” in the Preliminary Prospectus.
The Sponsors.The loan sponsors are JDJ Birmingham Company, L.L.C. and Institutional Mall Investors LLC.
JDJ Birmingham Company, L.L.C. is an entity indirectly owned by Jeffery A. Bayer, David L. Silverstein and Jon W. Rotenstreich, and their family trusts. Jeffery A. Bayer is CEO and President and David Silverstein and Jon Rotenstreich are Principals of Bayer Properties, LLC. Bayer Properties, LLC is a Birmingham, Alabama based real estate management and development firm with a national portfolio of over 22 properties comprising approximately 10 million square feet, with seven properties in Alabama, including The Summit Birmingham Property. Certain entities and affiliates indirectly owned by Bayer Properties, LLC were involved in two prior discounted payoffs. See “Description of the Mortgage Pool–Loan Purpose; Default History, Bankruptcy Issues and Other Proceedings” in the Preliminary Prospectus.
Institutional Mall Investors LLC (“IMI”) is 99% owned by California Public Employees’ Retirement System (“CalPERS”), the nation’s largest public pension fund. IMI is an investment platform focused on high quality, market dominant, fashion oriented retail properties. As of October 2016, IMI’s portfolio included approximately 20.1 million square feet of retail space and over 1.1 million square feet of prime office space.
Escrows.The Summit Birmingham Borrower deposited at closing (i) $1,989,285 to a TI/LC reserve, (ii) $346,727 to a gap rent reserve relating to three tenants, to be released provided no event of default is continuing upon the respective tenants commencing full rental payments, and (iii) $506,123 to an overage rent reserve, to be released provided no event of default is continuing upon receipt of evidence of resolution of any disputed overage rent from the tenant Gap, Inc.
So long as real estate taxes are paid prior to any assessment of late payments and delinquency, monthly reserves for real estate taxes will not be required, however, during a Collection Reserve Period (as defined below) or during the continuance of an event of default, The Summit Birmingham Borrower is required to deposit monthly 1/12th of the estimated annual real estate taxes. Also during a Collection Reserve Period or during the continuance of an event of default, The Summit Birmingham Borrower is required to deposit monthly (i) 1/12th of the estimated annual insurance premiums, except to the extent that the insurance required is maintained under a blanket insurance policy, (ii) $9,416, subject to a cap of $225,984, for replacement reserves, and (iii) $89,453, subject to an aggregate reserve cap of $2,146,872, for TI/LC reserves, provided The Summit Birmingham Whole Loan guarantors may guaranty the amount due to the rollover reserve in lieu of making monthly deposits as long as no event of default is continuing and no DSCR Trigger Period exists.
THE INFORMATION IN THIS STRUCTURAL AND COLLATERAL TERM SHEET IS NOT COMPLETE AND MAY BE AMENDED PRIOR TO THE TIME OF SALE. THIS TERM SHEET IS NOT AN OFFER TO SELL THESE SECURITIES AND IT IS NOT A SOLICITATION OF AN OFFER TO BUY THESE SECURITIES IN ANY JURISDICTION WHERE THE OFFER OR SALE IS NOT PERMITTED.
| 49 |
THE SUMMIT BIRMINGHAM
A “Collection Reserve Period” will commence upon the debt service coverage ratio based on the trailing four calendar quarters being less than 1.50x for two consecutive quarters and will end upon the debt service coverage ratio based on the trailing four calendar quarters being at least 1.50x for two consecutive quarters.
Lockbox and Cash Management.A hard lockbox is in place with respect to The Summit Birmingham Whole Loan. Upon the occurrence of a Lockbox Event (as defined below), The Summit Birmingham Borrower is required to establish a cash management account under the sole control of the lender, to which all amounts in the lockbox account shall be automatically transferred weekly for the payment of, among other things, debt service, monthly escrows and operating expenses pursuant to an approved annual budget, with all excess cash being deposited to an excess cash reserve to be held as additional collateral for The Summit Birmingham Whole Loan, until the Lockbox Event is cured.
A “Lockbox Event” will occur upon (i) an event of default, (ii) a bankruptcy action involving The Summit Birmingham Borrower or Bayer Retail Company, L.L.C., Bayer Retail Company II, L.L.C., Bayer Retail Company III, L.L.C., Bayer Retail Company IV, L.L.C., or Bayer Retail Company VI, L.L.C. (collectively, the “Loan Parties”), (iii) a bankruptcy action involving Bayer Properties, L.L.C. (iv) a DSCR Trigger Period, or (v) a Belk Trigger Event (as defined below).
A Lockbox Event will end, provided no event of default shall be continuing, upon (i) the lender’s acceptance of a cure of the event of default (ii) Bayer Properties, L.L.C. being replaced within 60 days with a qualified manager or the bankruptcy action involving Bayer Properties, L.L.C. being discharged or dismissed within 90 days (iv) the end of a DSCR Trigger Period, or (v) the end of a Belk Trigger Event. A Lockbox Event may not be cured more than a total of five times during The Summit Birmingham Whole Loan term and may not be cured if triggered by a bankruptcy action of the Loan Parties.
A “DSCR Trigger Period” will occur upon the debt service coverage ratio based on the trailing four calendar quarter period being less than 1.30x for two consecutive quarters and will end upon the debt service coverage ratio based on the trailing four calendar quarter period being at least 1.30x for two consecutive quarters.
A “Belk Trigger Event” will occur upon the earliest of Belk (i) vacating or giving notice to vacate or terminate its lease (a “Belk Termination Trigger”), (ii) failing to exercise its option to extend its lease term by the latest date required under its lease (a “Belk Extension Option Trigger”), (iii) defaulting in rent or (iv) being subject to any bankruptcy proceeding.
A Belk Trigger Event will end upon (i) if caused by a Belk Termination Trigger or Belk Extension Option Trigger, either Belk’s space being leased to a replacement tenant or the excess cash flow reserve account being at least $1,634,800, (ii) if caused by a Belk Extension Trigger, Belk exercising its extension option or extending its lease through a lease amendment prior to its lease expiration, (iii) Belk curing its payment default, or (iv) if caused by a Belk bankruptcy proceeding, the Belk lease being assumed or Belk’s assets no longer being subject to the jurisdiction of bankruptcy court with the Belk lease remaining unaltered.
Property Management.The Summit Birmingham Property is managed by Bayer Properties, L.L.C., an affiliate of the borrower.
Assumption.The borrower has the right to transfer The Summit Birmingham Propertyprovided that certain conditions are satisfied, including (i) no event of default has occurred and is continuing; (ii) in the event that in connection with such transfer, the manager will not thereafter continue to manage The Summit Birmingham Property, then a replacement management agreement with a qualified manager must be executed acceptable to lender; (iii) the transferee must not have been a party to any bankruptcy action within the previous seven years and there is no material litigation or regulatory action pending against the transferee unreasonable to lender; and (iv) the transferee is a qualified transferee meeting the requirements set forth in the loan documents or the lender receives rating agency confirmation that the sale and assumption will not result in a downgrade, withdrawal or qualification of the respective ratings assigned to the Series 2017-BNK4 certificates and similar confirmations from each rating agency rating any securities backed by any of The Summit Birmingham Companion Loans with respect to the ratings of such securities.
Partial Release.Not permitted.
Real Estate Substitution.Not permitted.
Subordinate and Mezzanine Indebtedness. Not permitted.
Ground Lease. None.
Terrorism Insurance.The Summit Birmingham Borrower is required to obtain and maintain property insurance, public liability insurance and rental loss and/or business interruption insurance that covers perils of terrorism and acts of terrorism, provided that The Summit Birmingham Whole Loan documents provide for an annual terrorism premium cap of two times the cost of the premiums for property insurance required under the related The Summit Birmingham Whole Loan documents (on a stand-alone basis), but excluding the wind, flood and earthquake components of such premiums.
THE INFORMATION IN THIS STRUCTURAL AND COLLATERAL TERM SHEET IS NOT COMPLETE AND MAY BE AMENDED PRIOR TO THE TIME OF SALE. THIS TERM SHEET IS NOT AN OFFER TO SELL THESE SECURITIES AND IT IS NOT A SOLICITATION OF AN OFFER TO BUY THESE SECURITIES IN ANY JURISDICTION WHERE THE OFFER OR SALE IS NOT PERMITTED.
| 50 |
(THIS PAGE INTENTIONALLY LEFT BLANK)
| 51 |
ONE WEST 34TH STREET
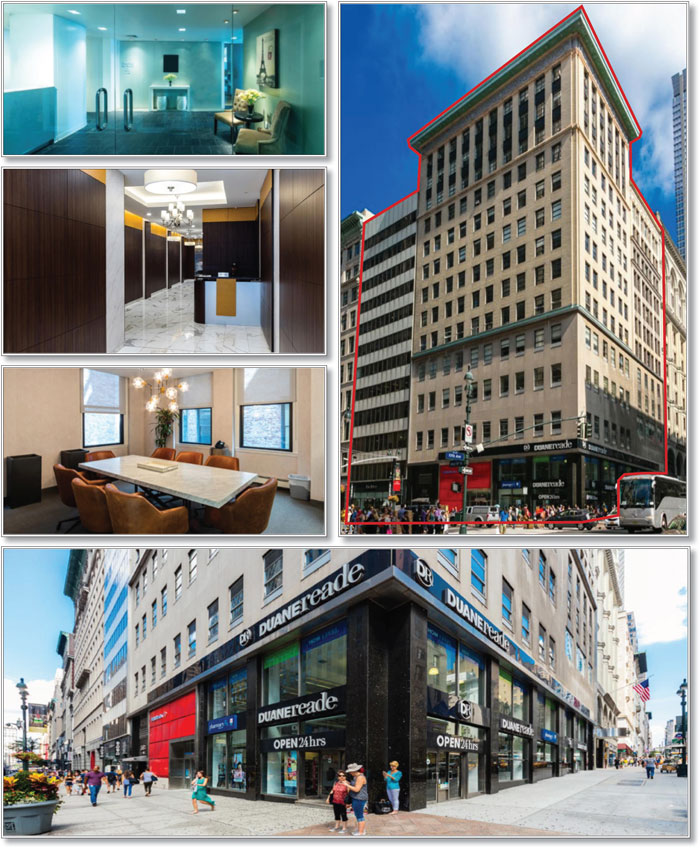
THE INFORMATION IN THIS STRUCTURAL AND COLLATERAL TERM SHEET IS NOT COMPLETE AND MAY BE AMENDED PRIOR TO THE TIME OF SALE. THIS TERM SHEET IS NOT AN OFFER TO SELL THESE SECURITIES AND IT IS NOT A SOLICITATION OF AN OFFER TO BUY THESE SECURITIES IN ANY JURISDICTION WHERE THE OFFER OR SALE IS NOT PERMITTED.
| 52 |
ONE WEST 34TH STREET
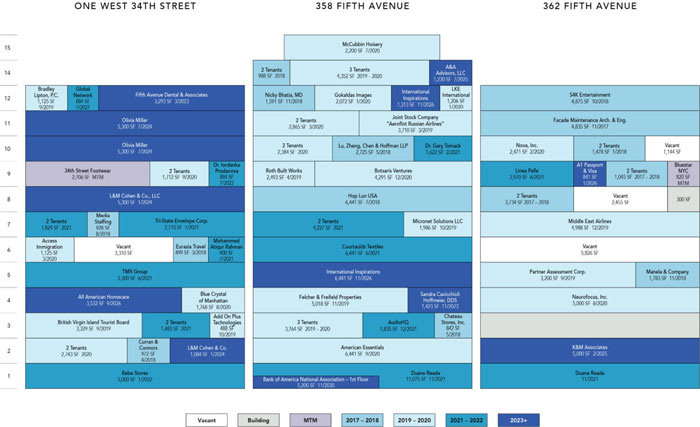
THE INFORMATION IN THIS STRUCTURAL AND COLLATERAL TERM SHEET IS NOT COMPLETE AND MAY BE AMENDED PRIOR TO THE TIME OF SALE. THIS TERM SHEET IS NOT AN OFFER TO SELL THESE SECURITIES AND IT IS NOT A SOLICITATION OF AN OFFER TO BUY THESE SECURITIES IN ANY JURISDICTION WHERE THE OFFER OR SALE IS NOT PERMITTED.
| 53 |
ONE WEST 34TH STREET
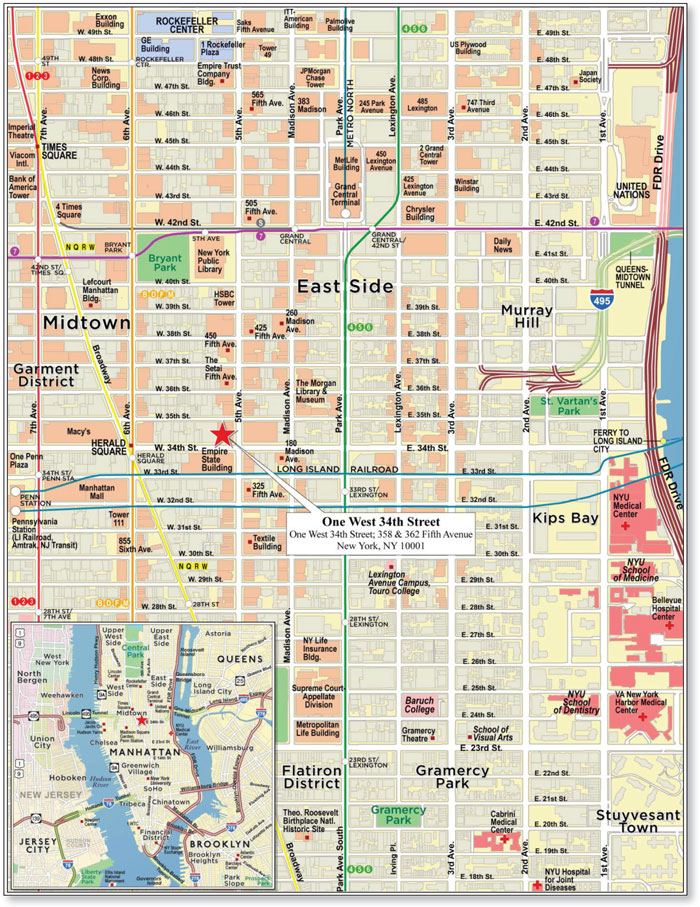
THE INFORMATION IN THIS STRUCTURAL AND COLLATERAL TERM SHEET IS NOT COMPLETE AND MAY BE AMENDED PRIOR TO THE TIME OF SALE. THIS TERM SHEET IS NOT AN OFFER TO SELL THESE SECURITIES AND IT IS NOT A SOLICITATION OF AN OFFER TO BUY THESE SECURITIES IN ANY JURISDICTION WHERE THE OFFER OR SALE IS NOT PERMITTED.
| 54 |
| No. 3 – One West 34th Street | |||||||
| Loan Information | Property Information | ||||||
| Mortgage Loan Seller: | Wells Fargo Bank, National Association | Single Asset/Portfolio: | Single Asset | ||||
Credit Assessment (Fitch/KBRA/Moody’s): | NR/NR/NR | Property Type: | Office | ||||
| Original Principal Balance(1): | $60,000,000 | Specific Property Type: | CBD | ||||
| Cut-off Date Balance(1): | $60,000,000 | Location: | New York, NY | ||||
| % of Initial Pool Balance: | 6.0% | Size: | 210,338 SF | ||||
| Loan Purpose: | Refinance | Cut-off Date Balance Per SF(1): | $713.14 | ||||
| Borrower Name: | Jacob’s First, LLC | Year Built/Renovated: | 1906/2016 | ||||
| Borrower Sponsors: | Lloyd Goldman; Stanley Chera | Title Vesting: | Fee | ||||
| Mortgage Rate: | 4.310% | Property Manager: | Self-managed | ||||
| Note Date: | March 15, 2017 | 4thMost Recent Occupancy (As of): | 96.7% (12/31/2013) | ||||
| Anticipated Repayment Date: | NAP | 3rdMost Recent Occupancy (As of): | 97.1% (12/31/2014) | ||||
| Maturity Date: | April 6, 2027 | 2ndMost Recent Occupancy (As of): | 95.6% (12/31/2015) | ||||
| IO Period: | 120 months | Most Recent Occupancy (As of): | 96.1% (12/31/2016) | ||||
| Loan Term (Original): | 120 months | Current Occupancy (As of): | 95.0% (3/10/2017) | ||||
| Seasoning: | 0 months | ||||||
| Amortization Term (Original): | NAP | Underwriting and Financial Information: | |||||
| Loan Amortization Type: | Interest-only, Balloon | ||||||
| Interest Accrual Method: | Actual/360 | 4thMost Recent NOI: | NAV | ||||
| Call Protection: | L(24),D(92),O(4) | 3rdMost Recent NOI (As of)(3): | $9,090,300 (12/31/2014) | ||||
| Lockbox Type: | Hard/Springing Cash Management | 2ndMost Recent NOI (As of)(3): | $7,822,025 (12/31/2015) | ||||
| Additional Debt(1): | Yes | Most Recent NOI (As of)(3): | $10,848,191 (12/31/2016) | ||||
| Additional Debt Type(1): | Pari Passu | ||||||
| U/W Revenues: | $18,910,259 | ||||||
| U/W Expenses: | $7,507,032 | ||||||
| U/W NOI(3): | $11,403,227 | ||||||
| U/W NCF: | $10,709,671 | ||||||
| Escrows and Reserves(2): | U/W NOI DSCR(1): | 1.74x | |||||
| U/W NCF DSCR(1): | 1.63x | ||||||
| Type: | Initial | Monthly | Cap (If Any) | U/W NOI Debt Yield(1): | 7.6% | ||
| Taxes | $315,500 | $315,500 | NAP | U/W NCF Debt Yield(1): | 7.1% | ||
| Insurance | $0 | Springing | NAP | As-Is Appraised Value: | $280,000,000 | ||
| Replacement Reserves | $0 | $7,390 | $266,036 | As-Is Appraisal Valuation Date: | January 5, 2017 | ||
| TI/LC Reserve | $0 | $52,785 | $1,900,260 | Cut-off Date LTV Ratio(1): | 53.6% | ||
| Deferred Maintenance | $366,740 | $0 | NAP | LTV Ratio at Maturity(1): | 53.6% | ||
| (1) | See “The Mortgage Loan” section. All statistical financial information related to balances per square foot, loan-to-value ratios, debt service coverage ratios and debt yields are based on the One West 34th Street Whole Loan (as defined below). |
| (2) | See “Escrows” section. |
| (3) | See “Cash Flow Analysis” section. |
The Mortgage Loan. The mortgage loan (the “One West 34th Street Mortgage Loan”) is part of a whole loan (the “One West 34th Street Whole Loan”) that is evidenced by threepari passu promissory notes (Notes A-1, A-2 and A-3) secured by a first mortgage encumbering an office building located in New York, New York (the “One West 34th Street Property”). The One West 34th Street Whole Loan was co-originated on March 15, 2017 by Wells Fargo Bank, National Association and Goldman Sachs Mortgage Company. The One West 34th Street Whole Loan had an original principal balance of $150,000,000, has an outstanding principal balance as of the Cut-off Date of $150,000,000 and accrues interest at an interest rate of 4.310%per annum. The One West 34th Street Whole Loan had an initial term of 120 months, has a remaining term of 120 months as of the Cut-off Date and requires payments of interest-only through the term of the One West 34th Street Whole Loan. The One West 34th Street Whole Loan matures on April 6, 2027.
The One West 34th Street Mortgage Loan, evidenced by the controlling Note A-1, which will be contributed to the BANK 2017-BNK4 trust, had an original principal balance of $60,000,000 and has an outstanding principal balance as of the Cut-off Date of $60,000,000. The non-controlling Note A-2, with an original principal balance of $30,000,000, is currently held by Wells Fargo Bank, National Association and is expected to be contributed to a future trust or trusts. The non-controlling Note A-3, with an original principal balance of $60,000,000, is currently held by Goldman Sachs Mortgage Company and is expected to be contributed to a future trust or trusts. The lender provides no assurances that any non-securitizedpari passu note will not be split further. See “Description of the Mortgage Pool—The Whole Loans—The Serviced Pari Passu Whole Loans” and “Pooling and Servicing Agreement” in the Preliminary Prospectus.
THE INFORMATION IN THIS STRUCTURAL AND COLLATERAL TERM SHEET IS NOT COMPLETE AND MAY BE AMENDED PRIOR TO THE TIME OF SALE. THIS TERM SHEET IS NOT AN OFFER TO SELL THESE SECURITIES AND IT IS NOT A SOLICITATION OF AN OFFER TO BUY THESE SECURITIES IN ANY JURISDICTION WHERE THE OFFER OR SALE IS NOT PERMITTED.
| 55 |
ONE WEST 34TH STREET
Note Summary
| Notes | Original Balance | Note Holder | Controlling Interest | |
| A-1 | $60,000,000 | BANK 2017-BNK4 | Yes | |
| A-2 | $30,000,000 | Wells Fargo Bank, National Association | No | |
| A-3 | $60,000,000 | Goldman Sachs Mortgage Company | No | |
| Total | $150,000,000 |
Following the lockout period, the borrower has the right to defease the One West 34th Street Whole Loan in whole, but not in part, on any date before January 6, 2027. In addition, the One West 34th Street Whole Loan is prepayable without penalty on or after January 6, 2027. The lockout period will expire on the earlier to occur of (i) two years after the closing date of the securitization that includes the last note to be securitized and (ii) March 15, 2020.
Sources and Uses
| Sources | Uses | |||||||
| Original whole loan amount | $150,000,000 | 100.0% | Loan payoff | $101,727,466 | 67.8% | |||
| Reserves | 682,240 | 0.5 | ||||||
| Closing costs | 1,612,096 | 1.1 | ||||||
| Return of equity | 45,978,197 | 30.7 | ||||||
| Total Sources | $150,000,000 | 100.0% | Total Uses | $150,000,000 | 100.0% |
The Property. The One West 34th Street Property consists of three adjoining class B office buildings totaling approximately 210,338 square feet located in New York, New York. The One West 34th Street Property is situated in Midtown Manhattan at the northwest corner of Fifth Avenue and 34th Street. Constructed from 1906 to 1920, the One West 34th Street Property comprises 189,063 square feet of office space (89.9% of net rentable area; 49.2% of underwritten base rent) and 21,275 square feet of retail space (10.1% of net rentable area; 50.8% of underwritten base rent) within three buildings ranging from 12 to 15 floors. The One West 34th Street Property is situated on a 0.4-acre site, situated directly across the street from the Empire State Building and benefits from approximately 150 feet of frontage along West 34th Street and 112 feet along Fifth Avenue.
The ground floor of the One West 34th Street Property is occupied by three retail tenants, which account for 50.8% of the underwritten base rent. Bank of America National Association (“Bank of America”; rated A/Baa1/BBB+ by Fitch, Moody’s and S&P) represents 2.5% of the net rentable area and 20.0% of the underwritten base rent; Duane Reade (rated BBB/Baa2/BBB by Fitch, Moody’s and S&P) represents 5.3% of the net rentable area and 11.3% of the underwritten base rent; and Bebe Stores, Inc. (“Bebe Stores”) represents 2.4% of the net rentable area and 19.5% of the underwritten base rent. In March 2017, it was reported by various news sources that Bebe Stores plans to close all physical store locations and focus on its online sales. Official store closures have not been formally announced. See “Description of the Mortgage Pool—Mortgage Pool Characteristics—Property Types—Retail Properties” in the Preliminary Prospectus. The remainder of the rent roll comprises granular office tenants, with no one tenant representing more than 5.0% of net rentable area or 2.7% of underwritten base rent.
The One West 34th Street Property has experienced strong tenant retention with approximately 78.5% of expiring square footage having renewed since 2011. Further, the One West 34th Street Property has not fallen below 95.0% occupancy since 2007 and has averaged 97.3% occupancy over the past 10 years. As of March 10, 2017, the One West 34th Street Property was 95.0% occupied by 80 tenants.
THE INFORMATION IN THIS STRUCTURAL AND COLLATERAL TERM SHEET IS NOT COMPLETE AND MAY BE AMENDED PRIOR TO THE TIME OF SALE. THIS TERM SHEET IS NOT AN OFFER TO SELL THESE SECURITIES AND IT IS NOT A SOLICITATION OF AN OFFER TO BUY THESE SECURITIES IN ANY JURISDICTION WHERE THE OFFER OR SALE IS NOT PERMITTED.
| 56 |
ONE WEST 34TH STREET
The following table presents certain information relating to the tenancies at the One West 34th Street Property:
Major Tenants
| Tenant Name | Credit Rating (Fitch/Moody’s/ S&P)(1) | Tenant NRSF | % of NRSF | Annual U/W Base Rent PSF(2) | Annual U/W Base Rent(2) | % of Total Annual U/W Base Rent | Lease Expiration Date |
| Major Tenants | |||||||
| Bank of America (Retail)(3) | A/Baa1/BBB+ | 5,200 | 2.5% | $664.90(3) | $3,457,469(3) | 20.0% | 11/30/2030 |
| Bebe Stores (Retail)(4) | NR/NR/NR | 5,000 | 2.4% | $671.96 | $3,359,800 | 19.5% | 1/31/2022 |
| Duane Reade (Retail) | BBB/Baa2/BBB | 11,075 | 5.3% | $176.07 | $1,950,000 | 11.3% | 11/30/2021(5) |
| Olivia Miller, Inc. (Office) | NR/NR/NR | 10,600 | 5.0% | $44.03 | $466,718 | 2.7% | 7/31/2024 |
| Hop Lun, U.S.A., Inc. (Office) | NR/NR/NR | 6,441 | 3.1% | $59.01 | $380,083 | 2.2% | 7/31/2018 |
| Total Major Tenants | 38,316 | 18.2% | $250.92 | $9,614,070 | 55.7% | ||
| Non-Major Tenants | 161,609 | 76.8% | $47.33(6) | $7,648,597 | 44.3% | ||
| Occupied Collateral Total(7) | 199,925 | 95.0% | $86.35(6) | $17,262,667 | 100.0% | ||
| Vacant Space | 10,413 | 5.0% | |||||
| Collateral Total | 210,338 | 100.0% | |||||
| (1) | Certain ratings are those of the parent company whether or not the parent guarantees the lease. |
| (2) | Annual U/W Base Rent PSF and Annual U/W Base Rent include contractual rent steps through March 2018 totaling $318,099. |
| (3) | Bank of America’s Annual U/W Base Rent represents their straight line average rent through the One West 34th Street Whole Loan term. Bank of America’s current rental rate is $596.15 per square foot. |
| (4) | In March 2017, it was reported by various news sources that Bebe Stores plans to close all physical store locations and focus on its online sales. Official store closures have not been formally announced. See “Description of the Mortgage Pool—Mortgage Pool Characteristics—Property Types—Retail Properties” in the Preliminary Prospectus. |
| (5) | Duane Reade has one, 5-year lease renewal option at fair market rental value. |
| (6) | Includes one unit occupied as a management office (300 square feet), with no attributed underwritten base rent. The Non-Major Tenants Annual U/W Base Rent PSF and Occupied Collateral Total Annual U/W Base Rent PSF excluding this space is $47.42 per square foot and $86.48 per square foot, respectively. |
| (7) | The average Annual U/W Base Rent PSF for office and retail tenants at the One West 34thStreet Property is $47.55 and $412.09, respectively. |
The following table presents certain information relating to the lease rollover schedule at the One West 34th Street Property:
Lease Expiration Schedule(1)(2)
| Year Ending December 31, | No. of Leases Expiring | Expiring NRSF | % of Total NRSF | Cumulative Expiring NRSF | Cumulative % of Total NRSF | Annual U/W Base Rent | % of Total Annual U/W Base Rent | Annual U/W Base Rent PSF(3) |
| MTM | 2 | 3,526 | 1.7% | 3,526 | 1.7% | $143,213 | 0.8% | $40.62 |
| 2017 | 3 | 7,180 | 3.4% | 10,706 | 5.1% | $418,181 | 2.4% | $58.24 |
| 2018 | 15 | 25,556 | 12.1% | 36,262 | 17.2% | $1,284,830 | 7.4% | $50.28 |
| 2019 | 11 | 27,806 | 13.2% | 64,068 | 30.5% | $1,278,726 | 7.4% | $45.99 |
| 2020 | 21 | 42,925 | 20.4% | 106,993 | 50.9% | $1,994,274 | 11.6% | $46.46 |
| 2021 | 15 | 40,771 | 19.4% | 147,764 | 70.3% | $3,383,803 | 19.6% | $83.00 |
| 2022 | 2 | 5,884 | 2.8% | 153,648 | 73.0% | $3,400,773 | 19.7% | $577.97 |
| 2023 | 2 | 4,716 | 2.2% | 158,364 | 75.3% | $226,191 | 1.3% | $47.96 |
| 2024 | 2 | 17,704 | 8.4% | 176,068 | 83.7% | $817,748 | 4.7% | $46.19 |
| 2025 | 2 | 6,230 | 3.0% | 182,298 | 86.7% | $283,152 | 1.6% | $45.45 |
| 2026 | 3 | 12,127 | 5.8% | 194,425 | 92.4% | $574,307 | 3.3% | $47.36 |
| 2027 | 0 | 0 | 0.0% | 194,425 | 92.4% | $0 | 0.0% | $0.00 |
| Thereafter(4) | 2 | 5,500 | 2.6% | 199,925 | 95.0% | $3,457,469 | 20.0% | $628.63 |
| Vacant | 0 | 10,413 | 5.0% | 210,338 | 100.0% | $0 | 0.0% | $0.00 |
| Total/Weighted Average(4) | 80 | 210,338 | 100.0% | $17,262,667 | 100.0% | $86.35 |
| (1) | Information obtained from the underwritten rent roll. |
| (2) | Certain tenants may have lease termination options that are exercisable prior to the stated expiration date of the subject lease and that are not considered in the Lease Expiration Schedule. |
| (3) | Weighted Average Annual U/W Base Rent PSF excludes vacant space. |
| (4) | Includes one unit occupied as a management office (300 square feet), with no attributed underwritten base rent. The Total Annual U/W Base Rent PSF excluding this space is $86.48 per square foot. |
THE INFORMATION IN THIS STRUCTURAL AND COLLATERAL TERM SHEET IS NOT COMPLETE AND MAY BE AMENDED PRIOR TO THE TIME OF SALE. THIS TERM SHEET IS NOT AN OFFER TO SELL THESE SECURITIES AND IT IS NOT A SOLICITATION OF AN OFFER TO BUY THESE SECURITIES IN ANY JURISDICTION WHERE THE OFFER OR SALE IS NOT PERMITTED.
| 57 |
ONE WEST 34TH STREET
The following table presents historical occupancy percentages at the One West 34th Street Property:
Historical Occupancy
12/31/2013(1) | 12/31/2014(1) | 12/31/2015(1) | 12/31/2016(1) | 3/10/2017(2) |
| 96.7% | 97.1% | 95.6% | 96.1% | 95.0% |
| (1) | Information obtained from the borrower. |
| (2) | Information obtained from the underwritten rent roll. |
Operating History and Underwritten Net Cash Flow.The following table presents certain information relating to the historical operating performance and the underwritten net cash flow at the One West 34th Street Property:
Cash Flow Analysis
| 2014(1)(2) | 2015(2) | 2016(2) | U/W | %of U/W Effective Gross Income | U/W $ per SF | ||||||||
| Base Rent | $13,514,993 | $13,170,627 | $16,156,656 | $16,894,151(3)(4) | 89.3% | $80.32 | |||||||
| Grossed Up Vacant Space | 0 | 0 | 0 | 889,166 | 4.7 | 4.23 | |||||||
| Total Reimbursables | 1,635,334 | 1,738,708 | 1,835,796 | 1,943,343 | 10.3 | 9.24 | |||||||
| Other Income | 308,414 | 50,225 | 72,765 | 72,765 | 0.4 | 0.35 | |||||||
| Less Vacancy & Credit Loss | 0 | 0 | 0 | (889,166)(5) | (4.7) | (4.23) | |||||||
| Effective Gross Income | $15,458,741 | $14,959,560 | $18,065,217 | $18,910,259 | 100.0% | $89.90 | |||||||
| Total Operating Expenses | 6,368,441 | 7,137,535 | 7,217,026 | 7,507,032 | 39.7 | 35.69 | |||||||
| Net Operating Income | $9,090,300 | $7,822,025 | $10,848,191 | $11,403,227 | 60.3% | $54.21 | |||||||
| TI/LC | 0 | 0 | 0 | 605,214 | 3.2 | 2.88 | |||||||
| Capital Expenditures | 0 | 0 | 0 | 88,342 | 0.5 | 0.42 | |||||||
| Net Cash Flow | $9,090,300 | $7,822,025 | $10,848,191 | $10,709,671 | 56.6% | $50.92 | |||||||
| NOI DSCR(6) | 1.39x | 1.19x | 1.66x | 1.74x | |||||||||
| NCF DSCR(6) | 1.39x | 1.19x | 1.66x | 1.63x | |||||||||
| NOI DY(6) | 6.1% | 5.2% | 7.2% | 7.6% | |||||||||
| NCF DY(6) | 6.1% | 5.2% | 7.2% | 7.1% |
| (1) | Historical cash flow information was not available prior to 2014. |
| (2) | The decline in Net Operating Income from 2014 to 2015 and the increase in Net Operating Income from 2015 to 2016 were due to the Bank of America lease, which commenced June 15, 2015 and included five months of free rent. |
| (3) | U/W Base Rent includes contractual rent steps through March 2018 totaling $318,099. |
| (4) | U/W Base Rent includes Bank of America’s straight line average rent through the One West 34th Street Whole Loan term. |
| (5) | The underwritten economic vacancy is 5.0%. The One West 34th Street Property was 95.0% physically occupied as of March 10, 2017. |
| (6) | The debt service coverage ratios and debt yields are based on the One West 34th Street Whole Loan. |
Appraisal.As of the appraisal valuation date of January 5, 2017, the One West 34th Street Property had an “as-is” appraised value of $280,000,000. The appraisal also concluded to a land value for the One West 34th Street Property of $165,000,000, as of January 5, 2017.
Environmental Matters. According to the Phase I environmental site assessment dated December 16, 2016, there are no recognized environmental conditions at the One West 34th Street Property.
Market Overview and Competition. The One West 34th Street Property is located at the northwest corner of the intersection of Fifth Avenue and 34th Street in Midtown Manhattan. The One West 34th Street Property is situated across West 34th Street from the Empire State Building, three blocks away from Penn Station, which serves as the Manhattan terminus of Long Island Railroad, NJ Transit and Amtrak and is considered to be the busiest rail station in North America. Penn Station is currently undergoing an approximately $3.0 billion renovation and redevelopment that will increase capacity and transform the train station into a modern commuter hub. The renovations and redevelopment are expected to be complete within two years. The One West 34th Street Property is located within three blocks of three 34th Street subway stations, which carry an estimated 94 million passengers annually and have direct access to the 1/2/3/A/C/E/B/D/F/M/N/Q/R/W subway lines. Additionally, on the same block as the One West 34th Street Property is Amazon’s approximately 470,000-square-foot corporate offices and first Manhattan retail distribution center, located at 7 West 34th Street.
The appraiser identified 31 competitive office buildings along Fifth Avenue and Madison Avenue, along with class B buildings along 34th Street. The competitive buildings totaled approximately 7.5 million square feet and exhibited a rental range of $49.00 per square foot to $77.00 per square foot, gross, and a weighted average occupancy rate of approximately 94.0% for direct space. Of the 31 buildings, 8 were determined by the appraiser to be directly competitive with the One West 34th Street Property—these buildings exhibited a rental range of $49.00 per square foot to $62.00 per square foot, gross, and a weighted average occupancy of approximately 93.6% for direct space. According to a third party market report, the One West 34th Street Property is located in the Penn Plaza/Garment submarket of both the New York office market and the New York retail market. As of year-end 2016, the Penn Plaza/Garment office submarket contained 435 buildings comprising approximately 72.6 million square feet (13.0% of the New York office market and the second largest submarket in the United States) and reported a vacancy rate of 7.1% and an average asking rent of $73.35 per square foot, gross. For 2016, the Penn Plaza/Garment submarket reported positive net absorption of 1.3 million square feet.
THE INFORMATION IN THIS STRUCTURAL AND COLLATERAL TERM SHEET IS NOT COMPLETE AND MAY BE AMENDED PRIOR TO THE TIME OF SALE. THIS TERM SHEET IS NOT AN OFFER TO SELL THESE SECURITIES AND IT IS NOT A SOLICITATION OF AN OFFER TO BUY THESE SECURITIES IN ANY JURISDICTION WHERE THE OFFER OR SALE IS NOT PERMITTED.
| 58 |
ONE WEST 34TH STREET
As of year-end 2016, the Penn Plaza/Garment retail submarket contained 163 buildings comprising approximately 5.5 million square feet (11.0% of the New York retail market) and reported a vacancy rate of 1.8%. According to the appraisal, the One West 34th Street Property’s immediate area (West 34th Street from 5th Avenue to 7th Avenue) has an average retail asking rent of $745.00 per square foot, gross, with numerous spaces garnering ground floor rents of $1,000 per square foot, gross.
The following tables present certain information relating to comparable leases for the One West 34th Street Property:
Comparable Office Leases(1)
| Property Name/Location | Year Built/ Renovated | Stories | Total GLA (SF) | Distance from Subject | Tenant Name | Lease Date/Term | Lease Area (SF) | Annual Base Rent PSF | Lease Type |
| 256 West 36th Street New York, NY | 1917/NAP | 12 | 36,500 | 0.4 miles | Tower Enterprises of NY | October 2016 / 5.0 Yrs | 3,400 | $44.00 | Gross |
| 25 West 45th Street New York, NY | 1913/NAP | 17 | 160,000 | 0.7 miles | Morris visitor Publications | October 2016 / 10.0 Yrs | 5,342 | $51.50 | Gross |
| 1359 Broadway New York, NY | 1924/NAP | 22 | 412,127 | 0.3 miles | Sisense | September 2016 / 10.0 Yrs | 24,169 | $59.00 | Gross |
| 389 Fifth Avenue New York, NY | 1922/NAP | 12 | 105,000 | 0.1 miles | OK Originals | September 2016 / 5.0 Yrs | 5,951 | $47.00 | Gross |
| 385 Fifth Avenue New York, NY | 1929/NAP | 15 | 85,000 | 0.1 miles | Metal Dynamics | September 2016 / 10.0 Yrs | 2,000 | $52.50 | Gross |
| 141 West 36th Street New York, NY | 1911/NAP | 22 | 132,000 | 0.3 miles | Smart Apparel | July 2016 / 7.0 Yrs | 3,200 | $50.00 | Gross |
| 1375 Broadway New York, NY | 1929/NAP | 25 | 265,000 | 0.4 miles | Toy Industry Association | June 2016 / 10.0 Yrs | 18,342 | $56.00 | Gross |
| 22 West 38th Street New York, NY | 1912/NAP | 12 | 60,000 | 0.3 miles | Knotel | July 2016 / 15.0 Yrs | 35,286 | $49.00 | Gross |
| 225 West 34th Street New York, NY | 1924/NAP | 22 | 394,145 | 0.4 miles | Bohler Engineering | May 2016 / 7.0 Yrs | 8,838 | $51.00 | Gross |
| 16 East 34th Street New York, NY | 1925/NAP | 22 | 336,500 | 0.0 miles | Echante | May 2016 / 6.0 Yrs | 19,355 | $49.00 | Gross |
| (1) | Information obtained from the appraisal and a third party market report. |
Comparable Retail Leases(1)
| Property Name/Location | Year Built/ Renovated | Distance from Subject | Tenant Name | Lease Date/Term | Lease Area (SF) | Level | Annual Base Rent PSF | Lease Type |
| 134 West 34th Street New York, NY | 1910/NAP | 0.3 miles | Skechers USA | March 2016 / 15.0 Yrs | 2,500 | Ground | $1,000.00 | Gross |
| 5 Penn Plaza New York, NY | 1915/2016 | 0.5 miles | TD Bank | May 2015 / 10.0 Yrs | 3,882 | Ground | $400.00 | Gross |
| 112 West 34th Street New York, NY | 1954/NAP | 0.2 miles | Foot Locker | February 2015 / 10.0 Yrs | 30,541 | Ground, Second | (2) | Gross |
| 112 West 34th Street New York, NY | 1954/NAP | 0.2 miles | Sephora | January 2015 / 10.0 Yrs | 10,304 | Ground | $925.00 | Gross |
| 1293 Broadway New York, NY | 1902/2015 | 0.2 miles | Verizon | December 2014 / 10.0 Yrs | 4,500 | Ground | $1,000.00 | Gross |
| 1293 Broadway New York, NY | 1902/2015 | 0.2 miles | H&M | October 2013 / 25.0 Yrs | 50,456 | Lower, Ground, Second | (3) | Gross |
| 32 West 34th Street New York, NY | 1978/NAP | 0.0 miles | Journey’s | November 2013 / 10.0 Yrs | 7,200 | Lower, Ground | (4) | Gross |
| (1) | Information obtained from the appraisal and a third party market report. |
| (2) | Foot Locker has a blended Annual Base Rent PSF of $188.53, which represents $850.00 per square foot on its ground floor space (1,890 square feet) and $147.00 per square foot on its second floor space (28,651 square feet). |
| (3) | H&M has a blended Annual Base Rent PSF of $297.29, which represents $800.00 per square foot on its ground floor space (8,000 square feet), $200.00 per square foot on its lower level space (21,219 square feet) and $200.00 per square foot on its second floor space (21,237 square feet). |
| (4) | Journey’s has a blended Annual Base Rent PSF of $316.11, which represents $525.00 per square foot on its ground floor space (3,000 square feet), $45.00 per square foot on its lower level space (3,000 square feet). Journey’s lease also includes 1,200 square feet of sub-lower level space that has no attributed rent. |
The Borrower.The borrower is Jacob’s First, LLC, a New York limited liability company and single purpose entity with two independent directors. Legal counsel to the borrower delivered a non-consolidation opinion in connection with the origination of the One West 34th Street Whole Loan. Lloyd Goldman and Stanley Chera are the guarantors of certain nonrecourse carveouts under the One West 34th Street Whole Loan.
The Borrower Sponsors.The borrower sponsors are Lloyd Goldman and Stanley Chera. Mr. Goldman is President of BLDG Management Co. (“BLDG”), a private, multi-generational family real estate investment, development and operating company which owns and manages a portfolio in excess of 300 properties, including more than 8,000 residential units (the majority of which are located in New York City), and over 20 million square feet of commercial properties across the United States. In addition to BLDG, Mr. Goldman is the Managing Member of a partnership that owns a 50% interest in The World Trade Center leasehold interest. Mr. Chera is co-founder of Crown Acquisitions, a company that has notable holdings in North America, including Olympic Tower, The World Trade Center, 645 North Michigan Avenue, 666 Fifth Avenue, 598 Madison Avenue, 1 Beacon Street and 101 Bloor Street.
THE INFORMATION IN THIS STRUCTURAL AND COLLATERAL TERM SHEET IS NOT COMPLETE AND MAY BE AMENDED PRIOR TO THE TIME OF SALE. THIS TERM SHEET IS NOT AN OFFER TO SELL THESE SECURITIES AND IT IS NOT A SOLICITATION OF AN OFFER TO BUY THESE SECURITIES IN ANY JURISDICTION WHERE THE OFFER OR SALE IS NOT PERMITTED.
| 59 |
ONE WEST 34TH STREET
Escrows.The loan documents provide for upfront escrows at closing in the amount of $366,740 for deferred maintenance and $315,500 for real estate taxes. The loan documents require ongoing monthly reserve deposits in the amount of $315,500 for real estate taxes, $7,390 for replacement reserves (capped at $266,036) and $52,785 for tenant improvement and leasing commissions (“TI/LC”)(capped at $1,900,260). The loan documents do not require ongoing monthly deposits for insurance premiums as long as (i) no event of default has occurred or is continuing; (ii) the One West 34th Street Property is insured via an acceptable blanket insurance policy; and (iii) the borrower provides the lender with timely proof of payment of insurance premiums and renewals.
Lockbox and Cash Management.The One West 34th Street Whole Loan requires a lender-controlled lockbox account, which is already in place, and that the borrower direct all tenants to pay their rents directly into such lockbox account. The loan documents also require that all rents received by the borrower or the property manager be deposited into the lockbox account within two business days of receipt. Prior to the occurrence of Cash Trap Event Period (as defined below), all funds are required to be distributed to the borrower. During a Cash Trap Event Period, all rents are required to be swept to a lender-controlled cash management account and excess cash flow shall be held by the lender.
A “Cash Trap Event Period” will commence upon the earlier of (i) the occurrence and continuance of an event of default or (ii) the debt service coverage ratio being less than 1.35x at the end of any calendar quarter. A Cash Trap Event Period will end, with respect to clause (i), upon the cure of such event of default; or, with respect to clause (ii), upon the debt service coverage ratio being at least 1.35x for two consecutive calendar quarters.
Property Management.The One West 34th Street Property is managed by an affiliate of the borrower.
Assumption.The borrower has the right to transfer the One West 34th Street Property, provided that certain other conditions are satisfied, including, but not limited to: (i) no event of default has occurred and is continuing; (ii) the lender’s reasonable determination that the proposed transferee and guarantor satisfy the lender’s credit review and underwriting standards, taking into consideration transferee experience, financial strength and general business standing; and (iii) if requested by the lender, rating agency confirmation from Fitch, KBRA and Moody’s that the transfer will not result in a downgrade, withdrawal or qualification of the respective ratings assigned to the Series 2017-BNK4 Certificates and similar confirmations from each rating agency rating any securities backed by the One West 34th Street companion loans with respect to the ratings of such securities.
Partial Release.Not permitted.
Real Estate Substitution.Not permitted.
Subordinate and Mezzanine Indebtedness.Not permitted.
Ground Lease.None.
Terrorism Insurance.The loan documents require that the “all risk” insurance policy required to be maintained by the borrower provide coverage for terrorism in an amount equal to the full replacement cost of the One West 34th Street Property, subject to a premium cap of two times the insurance premium payable for “all risk” insurance on a stand-alone basis the time any terrorism coverage is excluded from the policy, as well as business interruption insurance covering no less than the 18-month period following the occurrence of a casualty event, together with a six-month extended period of indemnity.
THE INFORMATION IN THIS STRUCTURAL AND COLLATERAL TERM SHEET IS NOT COMPLETE AND MAY BE AMENDED PRIOR TO THE TIME OF SALE. THIS TERM SHEET IS NOT AN OFFER TO SELL THESE SECURITIES AND IT IS NOT A SOLICITATION OF AN OFFER TO BUY THESE SECURITIES IN ANY JURISDICTION WHERE THE OFFER OR SALE IS NOT PERMITTED.
| 60 |
(THIS PAGE INTENTIONALLY LEFT BLANK)
| 61 |
| PENTAGON CENTER |
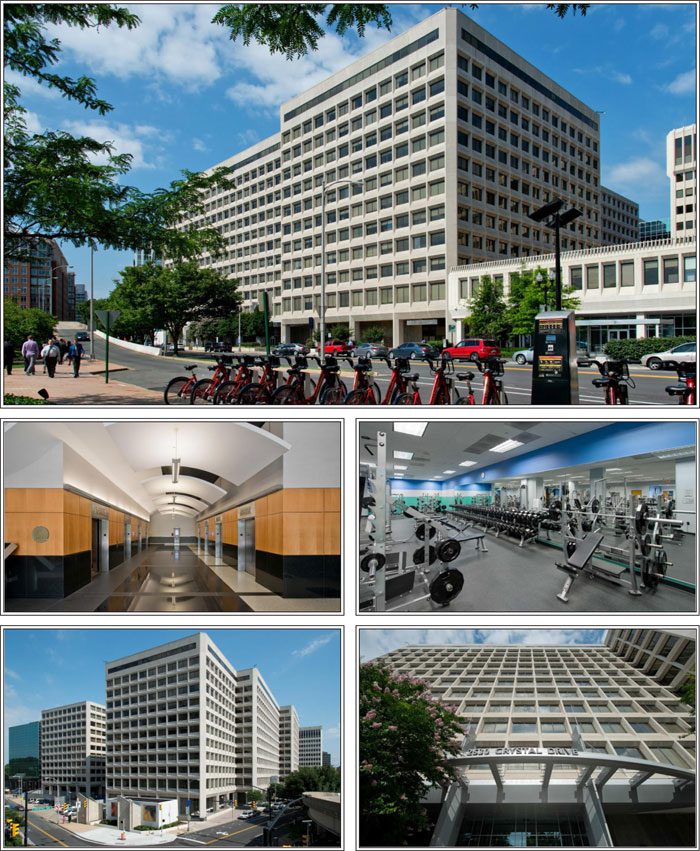
THE INFORMATION IN THIS STRUCTURAL AND COLLATERAL TERM SHEET IS NOT COMPLETE AND MAY BE AMENDED PRIOR TO THE TIME OF SALE. THIS TERM SHEET IS NOT AN OFFER TO SELL THESE SECURITIES AND IT IS NOT A SOLICITATION OF AN OFFER TO BUY THESE SECURITIES IN ANY JURISDICTION WHERE THE OFFER OR SALE IS NOT PERMITTED.
| 62 |
| PENTAGON CENTER |
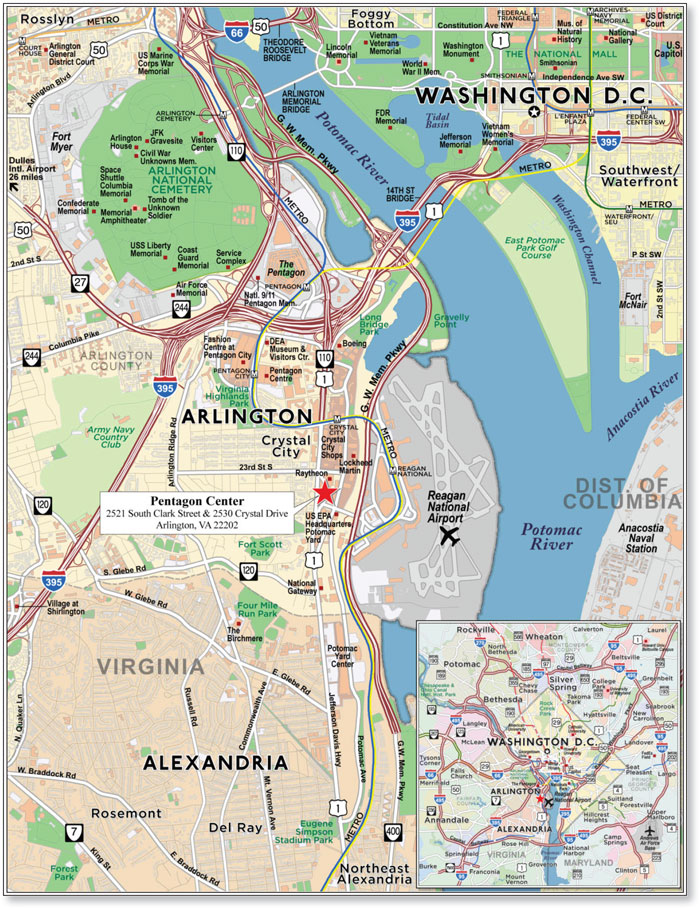
THE INFORMATION IN THIS STRUCTURAL AND COLLATERAL TERM SHEET IS NOT COMPLETE AND MAY BE AMENDED PRIOR TO THE TIME OF SALE. THIS TERM SHEET IS NOT AN OFFER TO SELL THESE SECURITIES AND IT IS NOT A SOLICITATION OF AN OFFER TO BUY THESE SECURITIES IN ANY JURISDICTION WHERE THE OFFER OR SALE IS NOT PERMITTED.
| 63 |
| No. 4 – Pentagon Center | |||||||
| Loan Information | Property Information | ||||||
| Mortgage Loan Seller: | Morgan Stanley Mortgage Capital Holdings LLC | Single Asset/Portfolio: | Single Asset | ||||
| Credit Assessment (Fitch/KBRA/Moody’s): | NR/NR/NR | Property Type: | Office | ||||
| Original Principal Balance(1): | $55,000,000 | Specific Property Type: | Suburban | ||||
| Cut-off Date Balance(1): | $55,000,000 | Location: | Arlington, VA | ||||
| % of Initial Pool Balance: | 5.5% | Size: | 911,818 SF | ||||
| Loan Purpose: | Acquisition | Cut-off Date Balance Per SF(1): | $230.31 | ||||
| Borrower Name: | LCPC Pentagon Property LLC | Year Built/Renovated: | 1970/2002 | ||||
| Sponsor: | DC REIT Pentagon LLC | Title Vesting: | Fee | ||||
| Mortgage Rate: | 4.326% | Property Manager: | LCPC Property Manager LLC and LAZ Parking Mid-Atlantic, LLC (borrower affiliated)
| ||||
| Note Date: | February 21, 2017 | 4thMost Recent Occupancy: | 100.0% (12/31/2013) | ||||
| Anticipated Repayment Date: | NAP | 3rdMost Recent Occupancy: | 100.0% (12/31/2014) | ||||
| Maturity Date: | March 6, 2027 | 2ndMost Recent Occupancy (As of): | 100.0% (12/31/2015) | ||||
| IO Period: | 121 months | Most Recent Occupancy (As of): | 100.0% (12/31/2016) | ||||
| Loan Term (Original): | 121 months | Current Occupancy (As of): | 100.0% (2/21/2017) | ||||
| Seasoning: | 2 months | ||||||
| Amortization Term (Original): | NAP | Underwriting and Financial Information: | |||||
| Loan Amortization Type: | Interest-only, Balloon | ||||||
| Interest Accrual Method: | Actual/360 | 4thMost Recent NOI: | $21,564,110 (12/31/2013) | ||||
| Call Protection(2): | L(26),D(90),O(5) | 3rdMost Recent NOI: | $23,862,555 (12/31/2014) | ||||
| Lockbox Type: | Hard/Springing Cash Management | 2ndMost Recent NOI (As of): | $25,517,267 (12/31/2015) | ||||
| Additional Debt(1): | Yes | Most Recent NOI (As of): | $25,674,656 (TTM 9/30/2016) | ||||
| Additional Debt Type(1): | Pari Passu | ||||||
| U/W Revenues: | $36,352,465 | ||||||
| U/W Expenses: | $10,939,034 | ||||||
| U/W NOI: | $25,413,431 | ||||||
| Escrows and Reserves(3): | U/W NCF: | $25,354,347 | |||||
| U/W NOI DSCR(1): | 2.76x | ||||||
| Type: | Initial | Monthly | Cap (If Any) | U/W NCF DSCR(1): | 2.75x | ||
| Taxes | $0 | Springing | NAP | U/W NOI Debt Yield(1): | 12.1% | ||
| Insurance | $0 | Springing | NAP | U/W NCF Debt Yield(1): | 12.1% | ||
| Replacement Reserves | $0 | Springing | NAP | As-Is Appraised Value: | $379,800,000 | ||
| TI/LC Reserve | $0 | Springing | NAP | As-Is Appraisal Valuation Date: | December 22, 2016 | ||
| Unfunded Obligations | $16,959,724 | Springing | NAP | Cut-off Date LTV Ratio(1): | 55.3% | ||
| 2023 & 2025 Government Tenant Leasing Reserve | $0 | Springing | NAP | LTV Ratio at Maturity or ARD(1): | 55.3% | ||
| (1) | The Pentagon Center Whole Loan (as defined below), with an original principal balance of $210,000,000, is comprised of sixpari passu notes (Notes A-1, A-2, A-3, A-4, A-5 and A-6). The non-controlling Note A-4 had an original principal balance of $20,000,000 and has an outstanding principal balance of $20,000,000 as of the Cut-off Date, the non-controlling Note A-5 had an original principal balance of $20,000,000 and has an outstanding principal balance of $20,000,000 as of the Cut-off Date and the non-controlling Note A-6 had an original principal balance of $15,000,000 and has an outstanding principal balance of $15,000,000 as of the Cut-off Date. Note A-4, Note A-5 and Note A-6 will be contributed to the BANK 2017-BNK4 trust. The controlling Note A-2 had an original principal balance of $80,000,000, is currently being held by Goldman Sachs Mortgage Company, and is expected to be contributed to one or more future securitization trusts. The non-controlling Note A-3 had an original principal balance of $50,000,000 and is currently being held by Morgan Stanley Bank, N.A., and is expected to be contributed to one or more future securitization trusts. The non-controlling Note A-1 had an original principal balance of $25,000,000 and was contributed to the GSMS 2017-GS5 securitization trust. All statistical information related to balances per square foot, loan-to-value ratios, debt service coverage ratios and debt yields are based on the Pentagon Center Whole Loan. |
| (2) | The defeasance lockout period will be at least 26 payment dates beginning with and including the first payment date of March 6, 2017. Defeasance of the Pentagon Center Whole Loan is permitted on or after the date that is the earlier to occur of (i) two years after the closing date of the securitization that includes the last note to be securitized, and (ii) February 21, 2020. The assumed lockout period of 26 payments is based on the expected BANK 2017-BNK4 trust closing date in April 2017. |
| (3) | See “Escrows” section. |
The Mortgage Loan.The mortgage loan (the “Pentagon Center Mortgage Loan”) is part of a whole loan (the “Pentagon Center Whole Loan”) that is evidenced by sixpari passu promissory notes (Notes A-1, A-2, A-3, A-4, A-5 and A-6) and secured by a first lien mortgage encumbering an office property located in Arlington, Virginia (the “Pentagon Center Property”). The Pentagon Center Whole Loan was co-originated on February 21, 2017 by Morgan Stanley Bank, N.A. and Goldman Sachs Mortgage Company. The Pentagon Center Whole Loan had an original principal balance of $210,000,000, has an outstanding principal balance as of the Cut-off Date of $210,000,000 and accrues interest at an interest rate of 4.326%per annum. The Pentagon Center Whole Loan had an initial term of 121 months, has a remaining term of 119 months as of the Cut-off Date and requires interest-only payments through the term of the Pentagon Center Whole Loan. The Pentagon Center Whole Loan matures on March 6, 2027. See “Description of the Mortgage Pool—The Whole Loans—The Non-Serviced Whole Loans” in the Preliminary Prospectus.
THE INFORMATION IN THIS STRUCTURAL AND COLLATERAL TERM SHEET IS NOT COMPLETE AND MAY BE AMENDED PRIOR TO THE TIME OF SALE. THIS TERM SHEET IS NOT AN OFFER TO SELL THESE SECURITIES AND IT IS NOT A SOLICITATION OF AN OFFER TO BUY THESE SECURITIES IN ANY JURISDICTION WHERE THE OFFER OR SALE IS NOT PERMITTED.
| 64 |
| PENTAGON CENTER |
The Pentagon Center Mortgage Loan is evidenced by the non-controlling Note A-4, which had an original principal balance of $20,000,000 and has an outstanding principal balance as of the Cut-off Date of $20,000,000, the non-controlling Note A-5, which had an original principal balance of $20,000,000 and has an outstanding principal balance as of the Cut-off Date of $20,000,000 and the non-controlling Note A-6, which had an original principal balance of $15,000,000 and has an outstanding principal balance as of the Cut-off Date of $15,000,000. The non-controlling Note A-4, Note A-5 and Note A-6 will be contributed to the BANK 2017-BNK4 trust. The controlling Note A-2, which had an original principal balance of $80,000,000, is being held by Goldman Sachs Mortgage Company, and is expected to be contributed to one or more future securitization trusts. The non-controlling Note A-3, which had an original principal balance of $50,000,000 is being held by Morgan Stanley Bank, N.A. and is expected to be contributed to one or more future securitization trusts. The non-controlling Note A-1, which had an original principal balance of $25,000,000, was contributed to the GSMS 2017-GS5 securitization trust. Each of the mortgage loans evidenced by Notes A-1, A-2 and A-3 are referred to herein as the “Pentagon Center Companion Loans”.
Note Summary
| Notes | Original Balance | Note Holder(1) | Controlling Interest | |
| A-1 | $25,000,000 | GSMS 2017-GS5 | No | |
| A-2 | $80,000,000 | GSMC | Yes | |
| A-3 | $50,000,000 | MSBNA | No | |
| A-4 | $20,000,000 | BANK 2017-BNK4 | No | |
| A-5 | $20,000,000 | BANK 2017-BNK4 | No | |
| A-6 | $15,000,000 | BANK 2017-BNK4 | No | |
| Total | $210,000,000 |
| (1) | MSBNA – “Morgan Stanley Bank, N.A.”; GSMC – “Goldman Sachs Mortgage Company” |
Following the lockout period, the borrower has the right to defease the Pentagon Center Whole Loan on any date before November 6, 2026. In addition, the Pentagon Center Whole Loan is prepayable without penalty on and after November 6, 2026. The lockout period will expire on the earlier to occur of (i) two years after the closing date of the securitization that includes the last note to be securitized and (ii) February 21, 2020. The Pentagon Center Whole Loan may be defeased in full (or partially defeased solely to cause the debt yield to equal 9.50% to avoid or end a Pentagon Center Trigger Period as described below under “Lockbox and Cash Management”).
Sources and Uses
| Sources | Uses | |||||||
| Original Whole Loan Amount | $210,000,000 | 52.9% | Purchase Price(1) | $379,500,000 | 95.7% | |||
| Sponsor’s new cash contribution | 186,684,633 | 47.1 | Reserves | 16,959,724 | 4.3 | |||
| Closing costs | 224,909 | 0.1 | ||||||
| Total Sources | $396,684,633 | 100.0% | Total Uses | $396,684,633 | 100.0% |
| (1) | The Pentagon Center Property was previously securitized in the MSC 2007-IQ14, BSCMS 2007-PWR16, WBCMT 2007-C32, WBCMT 2007-C31, BACM 2007-2 and MSC 2007-HQ12 transactions. The Pentagon Center Property was previously financed as part of a 20-property office portfolio financing which was modified and extended in December 2010 by the previous lender. See “Description of the Mortgage Pool — Loan Purpose; Default History, Bankruptcy Issues and Other Proceedings” in the Preliminary Prospectus. |
The Property.The Pentagon Center Property consists of the fee interest in two office buildings (the “Polk Building” and the “Taylor Building”) on approximately four acres in the Crystal City sub-market of Arlington, Virginia. The Polk Building was built in 1970 and the Taylor Building was built in 1971, and both buildings were most recently renovated in 2002. The Polk Building is 12 stories tall and is LEED Gold certified. The Taylor Building is 13 stories tall and is LEED Silver certified.
The Pentagon Center Property is 100.0% leased to the United States General Services Administration (“GSA”) on behalf of the Department of Defense (“DoD”). The GSA has leased the property since 1993, and the DoD has been the sole occupant since 2003. The Pentagon Center Property is a Level IV secure office facility with a securable underground parking garage and dark fiber access to the Pentagon and DoD network, a key infrastructure requirement that is estimated to cost approximately $200 PSF to replicate. Approximately 5,500 employees working for several DoD agencies are based at the Pentagon Center Property, and employees are able to move freely between buildings once entering through security at either entrance. The two buildings are connected and share amenities, including a fitness center, and an on-site deli, as well as Potomac River views.
The Pentagon Center Property is located approximately one mile south of the Pentagon with a free shuttle option for employees operated by the DoD that runs every 15 minutes during the work day and stops throughout Crystal City. The Pentagon Center Property is three blocks from the Crystal City Metro Station via underground walkway, providing access to downtown Washington, DC and suburban Virginia and Maryland via the Blue and Yellow lines, and is four blocks from the Virginia Railway Express (VRE), which provides a direct commute for employees traveling from the suburbs. Additionally, the Pentagon Center Property is located directly off of US Route 1 (Jefferson Davis Highway) and adjacent to the Ronald Reagan Washington National Airport.
An affiliate of a fund sponsored by Beacon Capital Partners, LLC (“Beacon”) acquired the Pentagon Center Property in 2007 and has since managed the Pentagon Center Property. The borrower utilized the proceeds of the Pentagon Center Whole Loan to acquire the Pentagon Center Property from an affiliate of Beacon. An affiliate of Beacon retained an equity interest in the borrower and is expected to continue to manage the Pentagon Center Property. See “—The Borrower” below.
THE INFORMATION IN THIS STRUCTURAL AND COLLATERAL TERM SHEET IS NOT COMPLETE AND MAY BE AMENDED PRIOR TO THE TIME OF SALE. THIS TERM SHEET IS NOT AN OFFER TO SELL THESE SECURITIES AND IT IS NOT A SOLICITATION OF AN OFFER TO BUY THESE SECURITIES IN ANY JURISDICTION WHERE THE OFFER OR SALE IS NOT PERMITTED.
| 65 |
| PENTAGON CENTER |
The following table presents certain information relating to the tenancy at the Pentagon Center Property:
Major Tenants
| Tenant Name | Credit Rating (Fitch/Moody’s/S&P)(1) | Tenant NRSF | % of NRSF | Annual U/W Base | Annual U/W Base Rent | % of Total Annual U/W Base Rent | Lease Expiration Date |
| Major Tenants(2) | |||||||
| GSA (DoD) Pentagon II (Taylor)(3) | AAA / Aaa / AA+ | 558,187 | 61.2% | $37.16 | $20,740,439 | 60.5% | 4/30/2023(4) |
| GSA (DoD) Pentagon I (Polk)(3) | AAA / Aaa / AA+ | 353,631 | 38.8% | $38.25 | $13,526,386 | 39.5% | 9/14/2025 |
| Occupied Collateral Total | 911,818 | 100.0% | $37.58 | $34,266,825 | 100.0% | ||
| Vacant Space | 0 | 0.0% | |||||
| Collateral Total | 911,818 | 100.0% | |||||
| (1) | The ratings are those of the United States. |
| (2) | If the Pentagon Center Property is transferred, the GSA and the transferee must enter into a novation agreement. The obligation of the GSA to pay rent to the transferee is suspended until the transferee has followed certain government transfer procedures, and the United States has determined that recognizing the transferee is in its interest (which determination is required to be prompt and not unreasonably withheld). See “Description of the Mortgage Pool-Office Properties” in the Preliminary Prospectus. |
| (3) | GSA leases the space on behalf of the DoD. |
| (4) | The initial lease term expires in 2018; however, the tenant executed an early renewal extending its term to 2023. GSA (DoD) Pentagon II (Taylor) has one 5 year renewal option in May 2023 with base rent increasing to $41.66, which has been pre-approved by Congress. |
The following table presents certain information relating to the lease rollover schedule at the Pentagon Center Property:
Lease Expiration Schedule(1)
| Year Ending December 31, | No. of Leases Expiring | Expiring NRSF | % of Total NRSF | Cumulative Expiring NRSF | Cumulative % of Total NRSF | Annual U/W Base Rent | % of Total Annual U/W Base Rent | Annual U/W Base Rent PSF(3) |
| MTM | 0 | 0 | 0.0% | 0 | 0.0% | $0 | 0.0% | $0.00 |
| 2017 | 0 | 0 | 0.0% | 0 | 0.0% | $0 | 0.0% | $0.00 |
| 2018 | 0 | 0 | 0.0% | 0 | 0.0% | $0 | 0.0% | $0.00 |
| 2019 | 0 | 0 | 0.0% | 0 | 0.0% | $0 | 0.0% | $0.00 |
| 2020 | 0 | 0 | 0.0% | 0 | 0.0% | $0 | 0.0% | $0.00 |
| 2021 | 0 | 0 | 0.0% | 0 | 0.0% | $0 | 0.0% | $0.00 |
| 2022 | 0 | 0 | 0.0% | 0 | 0.0% | $0 | 0.0% | $0.00 |
| 2023 | 1 | 558,187 | 61.2% | 558,187 | 61.2% | $20,740,439 | 60.5% | $37.16 |
| 2024 | 0 | 0 | 0.0% | 558,187 | 61.2% | $0 | 0.0% | $0.00 |
| 2025 | 1 | 353,631 | 38.8% | 911,818 | 100.0% | $13,526,386 | 39.5% | $38.25 |
| 2026 | 0 | 0 | 0.0% | 911,818 | 100.0% | $0 | 0.0% | $0.00 |
| 2027 | 0 | 0 | 0.0% | 911,818 | 100.0% | $0 | 0.0% | $0.00 |
| Thereafter | 0 | 0 | 0.0% | 911,818 | 100.0% | $0 | 0.0% | $0.00 |
| Vacant | 0 | 0 | 0.0% | 911,818 | 100.0% | $0 | 0.0% | $0.00 |
| Total/Weighted Average | 2 | 911,818 | 100.0% | $34,266,825 | 100.0% | $37.58 |
| (1) | Information obtained from the underwritten rent roll. |
The following table presents historical occupancy percentages at the Pentagon Center Property:
Historical Occupancy
12/31/2013(1) | 12/31/2014(1) | 12/31/2015(1) | 12/31/2016(1) | 2/21/2017(2) | ||||
| 100.0% | 100.0% | 100.0% | 100.0% | 100.0% |
| (1) | Information obtained from the borrower. |
| (2) | Information obtained from the underwritten rent roll. |
THE INFORMATION IN THIS STRUCTURAL AND COLLATERAL TERM SHEET IS NOT COMPLETE AND MAY BE AMENDED PRIOR TO THE TIME OF SALE. THIS TERM SHEET IS NOT AN OFFER TO SELL THESE SECURITIES AND IT IS NOT A SOLICITATION OF AN OFFER TO BUY THESE SECURITIES IN ANY JURISDICTION WHERE THE OFFER OR SALE IS NOT PERMITTED.
| 66 |
| PENTAGON CENTER |
Operating History and Underwritten Net Cash Flow. The following table presents certain information relating to the historical operating performance and the underwritten net cash flow at the Pentagon Center Property:
Cash Flow Analysis
2013 | 2014 | 2015 | TTM 9/30/2016 | U/W(1) | % of U/W Effective Gross Income | U/W $ per SF | |||||||||
| Base Rent | $30,518,317 | $31,397,149 | $33,528,046 | $34,251,362 | $34,266,825 | 94.3 | % | $37.58 | |||||||
| Contractual Rent Steps(2) | 0 | 0 | 0 | 0 | 874,264 | 2.4 | 0.96 | ||||||||
| Total Reimbursement Revenue | (1,194,178) | 314,589 | 723,098 | 584,798 | 633,821 | 1.7 | 0.70 | ||||||||
| Parking Revenue | 1,352,704 | 1,401,403 | 1,466,590 | 1,465,079 | 1,620,117 | 4.5 | 1.78 | ||||||||
| Tenant Service Income | 1,704,791 | 1,046,401 | 1,012,019 | 3,802,353 | 870,726 | 2.4 | 0.95 | ||||||||
| Less Vacancy & Credit Loss | 0 | 0 | 0 | 0 | (1,913,288)(3) | (5.3 | ) | (2.10 | ) | ||||||
| Effective Gross Income | $32,381,634 | $34,159,542 | $36,729,753 | $40,103,592 | $36,352,465 | 100.0 | % | $39.87 | |||||||
| Total Operating Expenses | 10,817,524 | 10,296,987 | 11,212,486 | 14,428,936 | 10,939,034 | 30.1 | 12.00 | ||||||||
| Net Operating Income | $21,564,110 | $23,862,555 | $25,517,267 | $25,674,656 | $25,413,431 | 69.9 | % | $27.87 | |||||||
| TI/LC | 0 | 0 | 0 | 0 | 0 | 0.0 | 0.00 | ||||||||
| Capital Expenditures | 0 | 0 | 0 | 0 | 59,084 | 0.2 | 0.06 | ||||||||
| Net Cash Flow | $21,564,110 | $23,862,555 | $25,517,267 | $25,674,656 | $25,354,347 | 69.7 | % | $27.81 | |||||||
| NOI DSCR(4) | 2.34x | 2.59x | 2.77x | 2.79x | 2.76x | ||||||||||
| NCF DSCR(4) | 2.34x | 2.59x | 2.77x | 2.79x | 2.75x | ||||||||||
| NOI DY(4) | 10.3% | 11.4% | 12.2% | 12.2% | 12.1% | ||||||||||
| NCF DY(4) | 10.3% | 11.4% | 12.2% | 12.2% | 12.1% |
| (1) | U/W cash flow based on contractual rents as of February 21, 2017. |
| (2) | Based on net present value of future contractual rent steps for the GSA tenants through the end of their lease terms, using a discount rate of 7.0%, which includes executed renewal for Pentagon II (Taylor) through 2023. |
| (3) | The underwritten economic vacancy is 5.0%. As of February 21, 2017, the Pentagon Center Property was 100.0% physically occupied. |
| (4) | The debt service coverage ratios and debt yields are based on the Pentagon Center Whole Loan. |
Appraisal.As of the appraisal valuation date of December 22, 2016, the Pentagon Center Property had an “as-is” appraised value of $379,800,000.
Environmental Matters. According to a Phase I environmental site assessment dated December 29, 2016, there was no evidence of any recognized environmental conditions at the Pentagon Center Property.
Market Overview and Competition.The Pentagon Center Property is located in the Crystal City sub-market of Arlington, Virginia, one mile south of the Pentagon. According to a third party report, for the third quarter of 2016, vacancy in the 10.8-million-square foot Crystal City submarket was 17.5%, up 10 basis points from the quarter prior and down 60 basis points over 12 months. Average asking rents were $40.24 PSF as of the same period. According to the appraisal, as Base Realignment and Closures began to occur, vacancy in the submarket increased from 7.6% in 2010 to a high of 23.3% in 2013, which was down to 19.0% as of the third quarter 2016. Since 1997, only three projects have been delivered in the Crystal City submarket, totaling approximately 1.7 million square feet, and no further new projects are planned.
Since 2014, there has been an increase in government spending, including specifically in the District of Columbia region, which has driven job growth in the surrounding Washington, DC market. The DoD accounts for $578 billion of the overall 2016 national $1.15 trillion budget, a $24 billion increase from their 2015 budget. Crystal City offers an affordable and Metro-accessible location for government agencies, contractors and nonprofits. Crystal City is more affordable than other core Northern Virginia and Washington, DC submarkets, offering a 5% discount to Rosslyn rents and a 25% discount to DC rents. Eighteen tenants have signed leases to relocate from Washington, D.C. to Crystal City since 2013.
THE INFORMATION IN THIS STRUCTURAL AND COLLATERAL TERM SHEET IS NOT COMPLETE AND MAY BE AMENDED PRIOR TO THE TIME OF SALE. THIS TERM SHEET IS NOT AN OFFER TO SELL THESE SECURITIES AND IT IS NOT A SOLICITATION OF AN OFFER TO BUY THESE SECURITIES IN ANY JURISDICTION WHERE THE OFFER OR SALE IS NOT PERMITTED.
| 67 |
| PENTAGON CENTER |
The following table presents certain information relating to comparable office sales for the Pentagon Center Property:
Comparable Sales(1)
| Property Name/Location | Sale Date | Year Built | Total GLA (SF) | Total Occupancy | Sale Price | Sales Price PSF | OAR |
| Confidential | Oct-2016 | 1992 | 605,897 | 100.0% | $375,000,000 | $618.92 | 5.5% |
4001 North Fairfax Drive Arlington, VA | Aug-2016 | 1989 | 182,304 | 95.0% | $62,300,000 | $398.59 | 6.1% |
Tysons Overlook (LMI Condominium) McLean, VA | Dec-2015 | 2014 | 157,021 | 100.0% | $92,500,000 | $589.09 | 5.9% |
Suffolk Building Falls Church, VA | Mar-2015 | 1964 / 2003 | 258,248 | 100.0% | $96,712,497 | $374.49 | 6.9% |
| 3 White Flint North (NRC HQ) North Bethesda, MD | Feb-2014 | 2012 | 358,440 | 100.0% | $195,000,000 | $544.02 | 6.3% |
| (1) | Information obtained from the appraisal. |
The following tables present certain information relating to comparable leases for the Pentagon Center Property:
Comparable Office Leases(1)
| Property Name/Location | Year Built/ Renovated | Total GLA (SF) | Tenant Name | Lease Date/Term | Lease Area (SF) | Annual Base Rent PSF | Reimbursements |
Two Potomac Yard - North Tower 2733 Crystal Drive, Arlington, VA | 2006/NAV | 310,741 | MWAA | March 2017 / 11.0 Yrs | 74,248 | $38.18 | Full Service |
One Potomac Yard 2777 Crystal Drive, Arlington, VA | 2006/NAV | 315,231 | GSA - EPA | March 2016 / 5.1 Yrs | 326,057 | $37.00 | Full Service |
Crystal Gateway 3 1215 S. Clark Street, Arlington, VA | 1983/NAV | 352,700 | GSA - U.S. Marshalls | June 2016 / 15.0 Yrs | 332,970 | $32.00 | Full Service |
TSA Buildings 601 & 701 S. 12th Street, Arlington, VA | 1983/NAV | 550,806 | GSA - TSA | April 2016 / 5.0 Yrs | 545,747 | $38.85 | Full Service |
Presidential Tower 2511 Jefferson Davis Highway, Arlington, VA | 1968/2014 | 339,221 | Cherokee Nation Prop. Man. (Spec) | September 2016 / 5.4 Yrs | 5,973 | $34.00 | Full Service |
| (1) | Information obtained from the appraisal |
The Borrower.The borrower is LCPC Pentagon Property LLC, a single-purpose, single-asset entity. Legal counsel to the borrower delivered a non-consolidation opinion in connection with the origination of the Pentagon Center Whole Loan. Other than the borrower, no person or entity guarantees the non-recourse carveouts with respect to the Pentagon Center Whole Loan.
The borrower is indirectly wholly-owned by a joint venture between and among affiliates of Beacon, affiliates of GIC Private Limited (“GIC”), and Korea Investment Corporation, a corporation organized under the laws of the Republic of Korea (“KIC”). Affiliates of Beacon indirectly own an approximately 2.5% interest in the borrower, affiliates of GIC indirectly own an approximately 48.75% interest in the borrower, and KIC owns (indirectly) an approximately 48.75% interest in the borrower. GIC is a global investment firm with over $100 billion of assets under management in more than 40 countries worldwide. KIC is a global investment firm with over $91.8 billion of assets under management in more than 50 countries worldwide.
The Sponsor.The borrower sponsor is DC REIT Pentagon LLC, the owner of the borrower.
Escrows.On the origination date, the borrower funded an unfunded obligations account in the amount of $16,959,724 in connection with approximately $13,409,488 of tenant improvements and approximately $3,550,236 of free rent at the Polk Building.
On each due date during the continuance of a Pentagon Center Trigger Period, the borrower is required to fund (i) a tax and insurance reserve in an amount equal to one-twelfth of the amount that the lender reasonably estimates will be necessary to pay taxes and insurance premiums over the then succeeding 12-month period, unless in the case of insurance premiums, the borrower is maintaining a blanket policy in accordance with the related loan documents and there is no continuing event of default, and upon request of the lender, the borrower provides evidence of renewals of such policies and payment of related premiums, (ii) a capital expenditure reserve in an amount equal to $18,996 and (iii) a tenant improvements and leasing commissions reserve in an amount equal to $151,970.
In addition, the borrower is required to deposit into the unfunded obligations account $1,800,000 within five business days following the date on which the tenant under the Government 2025 Lease (as defined below) notifies the borrower that it wishes for the borrower to commence the tenant improvements set forth in such lease.
THE INFORMATION IN THIS STRUCTURAL AND COLLATERAL TERM SHEET IS NOT COMPLETE AND MAY BE AMENDED PRIOR TO THE TIME OF SALE. THIS TERM SHEET IS NOT AN OFFER TO SELL THESE SECURITIES AND IT IS NOT A SOLICITATION OF AN OFFER TO BUY THESE SECURITIES IN ANY JURISDICTION WHERE THE OFFER OR SALE IS NOT PERMITTED.
| 68 |
| PENTAGON CENTER |
In addition, on each due date during the continuance of a Pentagon Center Trigger Period, the related loan documents require an excess cash flow reserve (see “Lockbox and Cash Management” section).
Lockbox and Cash Management.The Pentagon Center Whole Loan is structured with a hard lockbox and springing cash management. The related loan documents require the borrower to direct tenants to pay rent directly to a lender-controlled lockbox account and all cash revenues relating to the Pentagon Center Property and all other money received by the borrower or the property manager with respect to the Pentagon Center Property (other than tenant termination fees and tenant security deposits) be deposited into such lockbox account by the end of the second business day following receipt (provided that cash receipts from the parking garage may be first deposited into a local bank account owned by the borrower so long as they are deposited into the lockbox account by the end of such second business day). At the end of each business day, all funds in the lockbox account are required to be swept into (a) if no Pentagon Center Trigger Period or event of default under the Pentagon Center Whole Loan is continuing, the borrower’s operating account, or (b) during the continuance of a Pentagon Center Trigger Period or event of default under the Pentagon Center Whole Loan, the cash management account. Upon termination of a Pentagon Center Trigger Period, so long as no event of default is continuing under the Pentagon Center Whole Loan, all funds in the cash management account (other than any funds required to be held in reserve by the lender) are required to be transferred into a borrower-controlled operating account.
On each due date during the continuance of a Pentagon Center Trigger Period or, at the lender’s discretion, during an event of default under the Pentagon Center Whole Loan, the related loan documents require that all amounts on deposit in the cash management account be used to fund the required reserves deposits described above under “Escrows,” to pay debt service on the Pentagon Center Whole Loan, and to disburse monthly operating expenses in an amount equal to the greater of (x) budgeted monthly operating expenses as set forth in the annual budget and (y) actual operating expenses (but not in excess of 105% of budgeted operating expenses unless consented to by the lender or for non-discretionary or emergency items), and that all remaining amounts be reserved in (i) an excess cash flow reserve account with respect to a Pentagon Center Trigger Period other than a Government 2023 Lease Trigger Period or a Government 2025 Lease Trigger Period, and (ii) a government tenant leasing reserve with respect to a Government 2023 Lease Trigger Period or a Government 2025 Lease Trigger Period.
A “Government 2023 Lease Trigger Period” means, unless the borrower has entered into qualifying replacement leases and/or a lease renewal acceptable to the lender of at least 458,000 square feet at the Pentagon Center Property (each, a “Government 2023 Re-Leasing Condition”), the period commencing on the date that is 30 months prior to the termination of the government lease that expires in 2023 (the “Government 2023 Lease”), whether at its scheduled expiration in 2023 or upon such earlier termination as may be agreed to by the parties to such lease, and ending on the earlier to occur of (i) the date on which the sum of (x) the aggregate amount deposited into the government tenant leasing reserve account without taking into account amounts previously disbursed from such account (but excluding (a) all amounts deposited in and disbursed from a subaccount to be established for free rent under any qualifying replacement or renewal leases and (b) all amounts deposited into such account that have been disbursed in respect of leases of space covered by the Government 2025 Lease), plus (y) equity paid by the borrower pursuant to the loan documents for qualifying replacement leases and/or a lease renewal acceptable to the lender with respect to the space leased under the Government 2023 Lease, equals $40 million, giving credit for the amount contained in the tenant improvements and leasing commissions reserve account or (ii) the date the Government 2023 Re-Leasing Condition has been satisfied.
A “Government 2025 Lease Trigger Period” means, unless the borrower has entered into qualifying replacement leases and/or a lease renewal acceptable to the lender of at least 303,000 square feet at the Pentagon Center Property (each, a “Government 2025 Re-Leasing Condition”), the period commencing on the date that is 18 months prior to the termination of the government lease that expires in 2025 (the “Government 2025 Lease”), whether at its scheduled expiration in 2025 or upon such earlier termination as may be agreed to by the parties to such lease, and ending on the earlier to occur of (i) the date on which the sum of (x) the aggregate amount deposited into the government tenant leasing reserve account without taking into account amounts previously disbursed from such account (but excluding all amounts deposited into such account that have been disbursed in respect of leases of space covered by the Government 2023 Lease), plus (y) equity paid by the borrower pursuant to the loan documents for qualifying replacement leases and/or a lease renewal acceptable to the lender with respect to the space leased under the Government 2025 Lease plus (z) all amounts deposited into such account that have been disbursed in respect of qualifying replacement leases and/or a lease renewal acceptable to the lender with respect to the space leased under the Government 2023 Lease, equals $17.5 million, giving credit for the amount contained in the tenant improvements and leasing commissions reserve account or (ii) the date the Government 2025 Re-Leasing Condition has been satisfied.
A “Pentagon Center Trigger Period” means (i) commencing with the fiscal quarter ending December 2017, any period commencing as of the last day of the second of any two consecutive fiscal quarters during which the debt yield based on net operating income (as calculated under the related loan documents) is less than 9.50%, and ending at the conclusion of the second consecutive fiscal quarter for which the debt yield for each such fiscal quarter is equal to or greater than 9.50%, (ii) commencing 15 business days following the borrower’s receipt of written notice of its failure to deliver monthly, quarterly or annual financial reports and ending when such reports are delivered and they indicate that no other Pentagon Center Trigger Period is ongoing, (iii) a Government 2023 Lease Trigger Period and/or a Government 2025 Lease Trigger Period and (iv) commencing on the date the borrower fails to comply with its requirement to deposit into the unfunded obligations account $1,800,000 within five business days following notification from the tenant under the Government 2025 Lease that it wishes for the borrower to commence with the tenant improvements set forth in the related lease and ending on the earlier to occur of (x) the date on which the amount contained in the excess cash flow reserve account equals $1,800,000 (such amount to be transferred to the unfunded obligations account) or (y) the date on which the borrower otherwise deposits $1,800,000 into the unfunded obligations account.
The Pentagon Center Whole Loan may be partially defeased with direct, non-callable obligations of the United States of America in the least amount necessary to cause the debt yield to equal 9.50% when taking into account only the undefeased note, in order to avoid or end a Pentagon Center Trigger Period.
THE INFORMATION IN THIS STRUCTURAL AND COLLATERAL TERM SHEET IS NOT COMPLETE AND MAY BE AMENDED PRIOR TO THE TIME OF SALE. THIS TERM SHEET IS NOT AN OFFER TO SELL THESE SECURITIES AND IT IS NOT A SOLICITATION OF AN OFFER TO BUY THESE SECURITIES IN ANY JURISDICTION WHERE THE OFFER OR SALE IS NOT PERMITTED.
| 69 |
| PENTAGON CENTER |
Property Management. The Pentagon Center Property is managed by LCPC Pentagon Property Manager LLC, which is an affiliate of the borrower and LAZ Parking Mid-Atlantic, LLC, which is not an affiliate of the borrower, pursuant to separate management agreements. Under the related loan documents, the Pentagon Center Property is required to remain managed by LCPC Pentagon Property Manager LLC and LAZ Parking Mid-Atlantic, LLC or any other management company specified in the related loan documents or otherwise approved by the lender in accordance with the related loan documents and (in the case of replacement of LCPC Pentagon Property Manager LLC with a management company requiring the lender’s approval) with respect to which a rating agency confirmation has been received. The lender has the right to replace, or require the borrower to replace, the property manager and require the borrower to engage a property manager selected by the borrower and (unless otherwise provided in the related loan documents) reasonably approved by the lender (i) during the continuance of an event of default under the Pentagon Center Whole Loan, (ii) following any foreclosure, conveyance in lieu of foreclosure or other similar transaction, (iii) during the continuance of a material default by the property manager under the management agreement (after the expiration of any applicable notice and/or cure periods), (iv) if the property manager files or is the subject of a petition in bankruptcy or (v) if a trustee or receiver is appointed for the property manager’s assets or the property manager makes an assignment for the benefit of its creditors or is adjudicated insolvent.
Assumption.The borrower has the right to transfer the Pentagon Center Property provided that no event of default exists under the Pentagon Center Whole Loan, and certain other conditions are satisfied, including but not limited to: (i) the borrower continues to be controlled by one or more qualified control parties (as defined in the loan documents) and at least 51% owned by one or more qualified equityholders (as defined in the loan documents), and (ii) the lender has received confirmation from each rating agency rating the BANK 2017-BNK4 Certificates and any securities backed by any Pentagon Center Companion Loans that the legal structure of the successor borrower, the documentation of the assumption and the related legal opinions will not result in a downgrade, withdrawal or qualification of the respective ratings assigned to such securities.
Partial Release. Not permitted.
Real Estate Substitution.Not permitted.
Subordinate and Mezzanine Indebtedness.Not permitted.
Ground Lease.None.
Terrorism Insurance. So long as TRIPRA or a similar or similar subsequent statute is in effect, the borrower is required to maintain terrorism insurance for foreign and domestic acts (as those terms are defined in TRIPRA or a similar or similar subsequent statute) in an amount equal to the full replacement cost of the Pentagon Center Property (plus 18 months of business interruption coverage). If TRIPRA or a similar or subsequent statute is not in effect, then provided that terrorism insurance is commercially available, the borrower is required to carry terrorism insurance throughout the term of the Pentagon Center Whole Loan as described in the preceding sentence, but in that event the borrower is not required to spend more than two times the amount of the insurance premium that is payable at that time in respect of the property and business interruption/rental loss insurance required under the related loan documents (without giving effect to the cost of terrorism, flood and earthquake components of such property and business interruption/rental loss insurance), and if the cost of terrorism insurance exceeds such amount, then the borrower is required to purchase the maximum amount of terrorism insurance available with funds equal to such amount. In either such case, terrorism insurance may not have a deductible in excess of $100,000. See “Risk Factors— Risks Related to the Mortgage Loans—Terrorism Insurance May Not Be Available for All Mortgaged Properties” in the Preliminary Prospectus.
THE INFORMATION IN THIS STRUCTURAL AND COLLATERAL TERM SHEET IS NOT COMPLETE AND MAY BE AMENDED PRIOR TO THE TIME OF SALE. THIS TERM SHEET IS NOT AN OFFER TO SELL THESE SECURITIES AND IT IS NOT A SOLICITATION OF AN OFFER TO BUY THESE SECURITIES IN ANY JURISDICTION WHERE THE OFFER OR SALE IS NOT PERMITTED.
| 70 |
(THIS PAGE INTENTIONALLY LEFT BLANK)
| 71 |
JW MARRIOTT DESERT SPRINGS |

THE INFORMATION IN THIS STRUCTURAL AND COLLATERAL TERM SHEET IS NOT COMPLETE AND MAY BE AMENDED PRIOR TO THE TIME OF SALE. THIS TERM SHEET IS NOT AN OFFER TO SELL THESE SECURITIES AND IT IS NOT A SOLICITATION OF AN OFFER TO BUY THESE SECURITIES IN ANY JURISDICTION WHERE THE OFFER OR SALE IS NOT PERMITTED.
| 72 |
JW MARRIOTT DESERT SPRINGS |
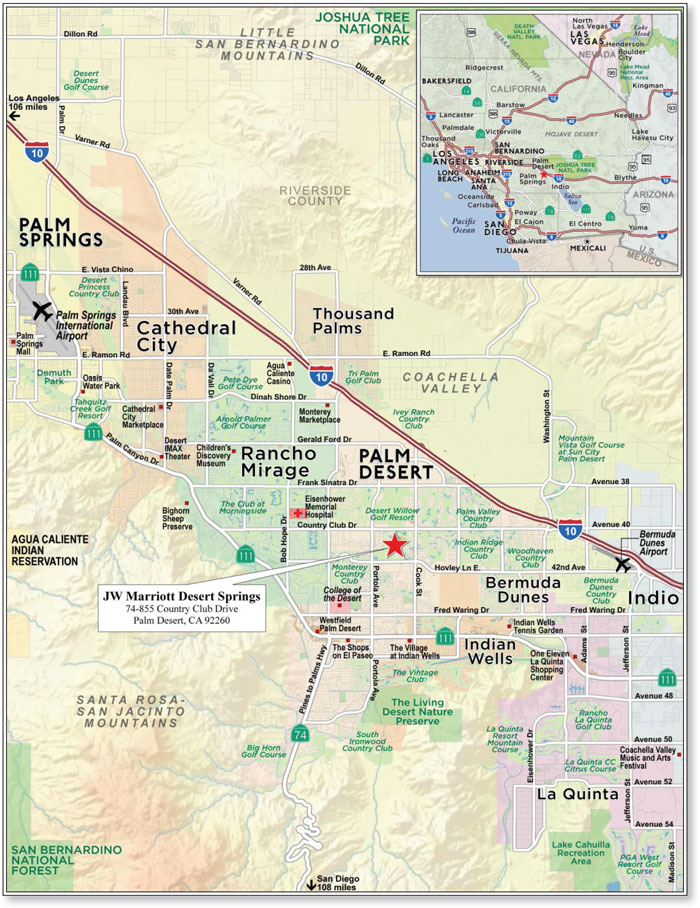
THE INFORMATION IN THIS STRUCTURAL AND COLLATERAL TERM SHEET IS NOT COMPLETE AND MAY BE AMENDED PRIOR TO THE TIME OF SALE. THIS TERM SHEET IS NOT AN OFFER TO SELL THESE SECURITIES AND IT IS NOT A SOLICITATION OF AN OFFER TO BUY THESE SECURITIES IN ANY JURISDICTION WHERE THE OFFER OR SALE IS NOT PERMITTED.
| 73 |
| No. 5 – JW Marriott Desert Springs | |||||||
| Loan Information | Property Information | ||||||
| Mortgage Loan Seller: | Morgan Stanley Mortgage Capital Holdings LLC | Single Asset/Portfolio: | Single Asset | ||||
| Credit Assessment (Fitch/KBRA/Moody’s): | NR/NR/NR | Property Type: | Hospitality | ||||
| Original Principal Balance(1): | $55,000,000 | Specific Property Type: | Full Service | ||||
| Cut-off Date Balance(1): | $54,863,232 | Location: | Palm Desert, CA | ||||
| % of Initial Pool Balance: | 5.4% | Size: | 884 rooms | ||||
| Loan Purpose: | Acquisition | Cut-off Date Balance Per Room(1): | $129,767 | ||||
| Borrower Name: | Newage Desert Springs, LLC | Year Built/Renovated: | 1987/2017 | ||||
| Sponsor(2): | Kam Sang Company | Title Vesting: | Fee/Leasehold | ||||
| Mortgage Rate: | 5.150% | Property Manager: | Marriott Hotel Services, Inc. | ||||
| Note Date: | January 11, 2017 | 4thMost Recent Occupancy (As of): | 62.9% (12/31/2013) | ||||
| Anticipated Repayment Date: | NAP | 3rdMost Recent Occupancy (As of): | 61.5% (12/31/2014) | ||||
| Maturity Date: | February 1, 2022 | 2ndMost Recent Occupancy (As of): | 60.8% (12/31/2015) | ||||
| IO Period: | None | Most Recent Occupancy (As of): | 65.8% (11/30/2016) | ||||
| Loan Term (Original): | 60 months | Current Occupancy (As of): | 65.8% (11/30/2016) | ||||
| Seasoning: | 2 months | ||||||
| Amortization Term (Original): | 360 months | Underwriting and Financial Information: | |||||
| Loan Amortization Type: | Amortizing Balloon | ||||||
| Interest Accrual Method: | Actual/360 | 4thMost Recent NOI (As of): | $16,196,989 (12/31/2013) | ||||
| Call Protection: | L(26),D(30),O(4) | 3rdMost Recent NOI (As of): | $16,490,495 (12/31/2014) | ||||
| Lockbox Type: | Hard/Upfront Cash Management | 2ndMost Recent NOI (As of)(6): | $17,274,307 (12/31/2015) | ||||
| Additional Debt(1)(3): | Yes | Most Recent NOI (As of)(6): | $24,283,061 (TTM 11/30/2016) | ||||
| Additional Debt Type(1)(3): | Pari Passu; Mezzanine | ||||||
| U/W Revenues: | $107,162,999 | ||||||
| U/W Expenses: | $83,834,818 | ||||||
| U/W NOI: | $23,328,182 | ||||||
| U/W NCF: | $17,434,217 | ||||||
| U/W NOI DSCR(1): | 3.10x | ||||||
| U/W NCF DSCR(1): | 2.31x | ||||||
| Escrows and Reserves(4): | U/W NOI Debt Yield(1): | 20.3% | |||||
| U/W NCF Debt Yield(1): | 15.2% | ||||||
| Type: | Initial | Monthly | Cap (If Any) | As-Is Appraised Value: | $161,000,000 | ||
| Taxes | $0 | Springing | NAP | As-Is Appraisal Valuation Date: | November 10, 2016 | ||
| Insurance | $0 | Springing | NAP | Cut-off Date LTV Ratio(1): | 71.3% | ||
| FF&E Reserve | $0 | Springing | NAP | LTV Ratio at Maturity or ARD(1): | 66.0% | ||
| PIP Funds | $12,000,000 | Springing | NAP | ||||
| Seasonality Reserve Funds | $0 | Springing | $3,073,550(5) | ||||
| (1) | The JW Marriott Desert Springs Whole Loan (as defined below), which had an original principal balance of $115,000,000, is comprised of threepari passu notes (Notes A-1, A-2 and A-3). The non-controlling Note A-2 and non-controlling Note A-3 had an aggregate original balance of $55,000,000, have an aggregate outstanding principal balance of $54,863,232 as of the Cut-off Date and will be contributed to the BANK 2017-BNK4 trust. The controlling Note A-1 had an original principal balance of $60,000,000 and was contributed to the BACM 2017-BNK3 trust. All statistical information related to balances per room, loan-to-value ratios, debt service coverage ratios and debt yields are based on the JW Marriott Desert Springs Whole Loan. The Cut-off Date Balance per Room, Cut-off Date LTV Ratio, LTV Ratio at Maturity or ARD, U/W NOI DSCR, U/W NCF DSCR, U/W NOI Debt Yield and U/W NCF Debt Yield based on the combined JW Marriott Desert Springs Whole Loan and JW Marriott Desert Springs Mezzanine Loan (as defined under the “Subordinate and Mezzanine Indebtedness” section) aggregate principal amount of $131.0 million are $147,867, 81.2%, 76.0%, 2.53x,1.89x, 17.8% and 13.3%, respectively. |
| (2) | See “The Sponsor” section. |
| (3) | See “Subordinate and Mezzanine Indebtedness” section. |
| (4) | See “Escrows” section. |
| (5) | The Seasonality Reserve Funds Cap will be adjusted to an amount equal to (1) for the period commencing on the monthly payment date in January of each calendar year through but excluding the monthly payment date in October of such calendar year, an amount equal to the sum of (a) four months of debt service on the JW Marriott Desert Springs Whole Loan, plus (b) four months of debt service on the mezzanine loan, and (2) for the remainder of each such calendar year, an amount equal to the sum of (a) two months of debt service on the JW Marriott Desert Springs Whole Loan, plus (b) two months of debt service on the mezzanine loan. |
| (6) | The increase in Net Operating Income in the TTM 11/30/2016 over 2015 is attributable to an increase in Occupancy and ADR at the JW Marriott Desert Springs Property during 2016. |
The Mortgage Loan. The mortgage loan (the “JW Marriott Desert Springs Mortgage Loan”) is part of a whole loan (the “JW Marriott Desert Springs Whole Loan”) that is evidenced by threepari passu promissory notes (Notes A-1, A-2 and A-3) secured by a first mortgage encumbering the fee and leasehold interest in the 884 room JW Marriott Desert Springs Resort & Spa located in Palm Desert, California (the “JW Marriott Desert Springs Property”). The JW Marriott Desert Springs Whole Loan was originated on January 11, 2017 by Morgan Stanley Bank, N.A. The JW Marriott Desert Springs Whole Loan had an original principal balance of $115,000,000, has an outstanding principal balance as of the Cut-off Date of $114,714,030 and accrues interest at an interest rate
THE INFORMATION IN THIS STRUCTURAL AND COLLATERAL TERM SHEET IS NOT COMPLETE AND MAY BE AMENDED PRIOR TO THE TIME OF SALE. THIS TERM SHEET IS NOT AN OFFER TO SELL THESE SECURITIES AND IT IS NOT A SOLICITATION OF AN OFFER TO BUY THESE SECURITIES IN ANY JURISDICTION WHERE THE OFFER OR SALE IS NOT PERMITTED.
| 74 |
JW MARRIOTT DESERT SPRINGS |
of 5.150%per annum. The JW Marriott Desert Springs Whole Loan had an initial term of 60 months, has a remaining term of 58 months as of the Cut-off Date and requires payments of principal and interest based on a 30-year amortization schedule. The JW Marriott Desert Springs Whole Loan matures on February 1, 2022.
The JW Marriott Desert Springs Mortgage Loan is evidenced by the non-controlling Note A-2 and non-controlling Note A-3, which will be contributed to the BANK 2017-BNK4 trust, had an aggregate original principal balance of $55,000,000 and have an aggregate outstanding principal balance of $54,863,232 as of the Cut-off Date. The controlling Note A-1, which had an original principal balance of $60,000,000, referred to herein as the “JW Marriott Desert Springs Pari Passu Companion Loan”, was contributed to the BACM 2017-BNK3 securitization trust. See “Description of the Mortgage Pool—The Whole Loans—The Non-Serviced Whole Loans” in the Preliminary Prospectus.
Pari Passu Note Summary
| Original Balance | Note Holder | Controlling Piece | ||
| Note A-1 | $60,000,000 | BACM 2017-BNK3 | Yes | |
| Note A-2 | $30,000,000 | BANK 2017-BNK4 | No | |
| Note A-3 | $25,000,000 | BANK 2017-BNK4 | No | |
| Total | $115,000,000 |
Following the lockout period, the borrower has the right to defease the JW Marriott Desert Springs Whole Loan in whole, but not in part, on any date before November 1, 2021. In addition, the JW Marriott Desert Springs Whole Loan is prepayable without penalty on or after November 1, 2021.
Sources and Uses
| Sources | Uses | |||||||
| Original loan amount | $115,000,000 | 66.2% | Purchase Price | $160,000,000 | 92.1% | |||
| Borrower Equity | 42,708,329 | 24.6 | Reserves | 12,000,000 | 6.9 | |||
| Mezzanine Loan | 16,000,000 | 9.2 _ | Closing Costs | 1,708,329 | 1.0 | |||
| Total Sources | $173,708,329 | 100.0% | Total Uses | $173,708,329 | 100.0% |
The Property.The JW Marriott Desert Springs Property is a golf resort and spa located between California State Route 111 and Interstate 10 in Palm Desert, California. The JW Marriott Desert Springs Property sits on an approximately 280-acre site, of which all but the 18-hole Valley Golf Course comprising 25 acres is fee-owned. The JW Marriott Desert Springs Property offers 884 guestrooms, including 422 king rooms, 411 queen/queen rooms, and 51 one-bedroom suites. The JW Marriott Desert Springs Property offers a variety of resort-style amenities and services, including four restaurants, two lounges, a nightclub, a coffee shop, five swimming pools, two outdoor whirlpools, two 18-hole golf courses, twenty tennis courts, a fitness center, a full-service spa, a leased salon, leased gift-shop, leased retail outlets and 1,232 surface and garage parking spaces. The JW Marriott Desert Springs Property offers 142,954 square feet of meeting and function space, comprised of approximately 68,854 square feet of indoor meeting and banquet facilities and 74,100 square feet of outdoor space. Indoor meeting and banquet space includes four ballrooms, which are divisible into several smaller separate rooms, and several Directors’ Suites. The outdoor function space includes both lawn and patio space.
The JW Marriott Desert Springs Property was initially constructed in 1987 and has undergone approximately $100 million ($113,122 per room) in capital expenditures since 2004, $42 million ($47,511 per room) of which were completed between 2011 and 2016. Recent renovations include improvements to the lobby, spa and health club, elevators and escalators, golf courses, food and beverage outlets and guestrooms. The JW Marriott Desert Springs Borrower purchased the JW Marriott Desert Springs Property in January 2017 for $160 million and plans to invest approximately $12 million for a franchisor-mandated property improvement plan (the “PIP”) to be completed by 2019, all of which was escrowed at closing. The PIP primarily includes guestroom renovations and upgrades. Negotiations for the PIP budget are ongoing and may include significant additional items that have not been reserved for. See “Description of the Mortgage Pool—Property Types—Hotel Properties” in the Preliminary Prospectus.
The JW Marriott Desert Springs Property is brand-managed by Marriott Hotel Services, Inc. (“Marriott”) under its JW Marriott flag and operates under a management agreement with Marriott through 2032 with four 10-year renewal options.
A portion of the JW Marriott Desert Springs Property encompassing the 25-acre, 18-hole Valley Golf Course is comprised of a leasehold interest with Marriott’s Desert Springs Development Corporation under a fully extended term through December 2061. The initial 24-year term initially expired December 31, 2011 and has five 10-year extension options with flat annual ground rent payments of $100,000.
THE INFORMATION IN THIS STRUCTURAL AND COLLATERAL TERM SHEET IS NOT COMPLETE AND MAY BE AMENDED PRIOR TO THE TIME OF SALE. THIS TERM SHEET IS NOT AN OFFER TO SELL THESE SECURITIES AND IT IS NOT A SOLICITATION OF AN OFFER TO BUY THESE SECURITIES IN ANY JURISDICTION WHERE THE OFFER OR SALE IS NOT PERMITTED.
| 75 |
JW MARRIOTT DESERT SPRINGS |
The following table presents certain information relating to the historical operating performance and the underwritten net cash flow at the JW Marriott Desert Springs Property:
Cash Flow Analysis
| 2013(1) | 2014(1) | 2015(1) | TTM 11/30/2016 | U/W | % of U/W Total Revenue | U/W $ per Room | |
| Occupancy | 62.9% | 61.5% | 60.8% | 65.8% | 65.8% | ||
| ADR | $189.33 | $197.46 | $200.78 | $210.31 | $210.31 | ||
| RevPAR | $119.09 | $121.47 | $122.14 | $138.40 | $138.40 | ||
| Room Revenue | $38,427,054 | $39,192,103 | $39,411,054 | $44,777,440 | $44,655,098 | 41.7% | $50,515 |
| F&B Revenue | 40,755,889 | 39,300,867 | 38,836,779 | 46,521,906 | 46,394,797 | 43.3 | 52,483 |
| Golf Revenue | 6,408,007 | 6,563,373 | 6,061,199 | 6,027,797 | 6,011,328 | 5.6 | 6,800 |
| Spa Revenue | 5,025,497 | 5,017,055 | 4,237,485 | 4,625,640 | 4,613,001 | 4.3 | 5,218 |
| Other Revenue(2) | 4,589,917 | 4,264,893 | 5,353,078 | 5,503,814 | 5,488,776 | 5.1 | 6,209 |
| Total Revenue | $95,206,364 | $94,338,291 | $93,899,595 | $107,456,596 | $107,162,999 | 100.0% | $121,225 |
| Total Department Expenses | 52,061,188 | 50,673,378 | 48,641,733 | 52,265,991 | 52,123,188 | 48.6 | 58,963 |
| Gross Operating Profit | $43,145,176 | $43,664,913 | $45,257,862 | $55,190,605 | $55,039,811 | 51.4% | $62,262 |
| Total Undistributed Expenses | 20,527,239 | 20,489,064 | 21,597,960 | 24,084,058 | 24,018,254 | 22.4 | 27,170 |
| Profit Before Fixed Charges | $22,617,937 | $23,175,849 | $23,659,902 | $31,106,547 | $31,021,557 | 28.9% | $35,092 |
| Total Fixed Charges | 6,420,948 | 6,685,354 | 6,385,595 | 6,823,486 | 7,693,375 | 7.2 | 8,703 |
| Net Operating Income | $16,196,989 | $16,490,495 | $17,274,307 | $24,283,061(3) | $23,328,182 | 21.8% | $26,389 |
| FF&E | 5,253,377 | 5,197,956 | 5,160,790 | 5,910,113 | 5,893,965 | 5.5 | 6,667 |
| Net Cash Flow | $10,943,612 | $11,292,539 | $12,113,517 | $18,372,949 | $17,434,217 | 16.3% | $19,722 |
| NOI DSCR(4) | 2.15x | 2.19x | 2.29x | 3.22x | 3.10x | ||
| NCF DSCR(4) | 1.45x | 1.50x | 1.61x | 2.44x | 2.31x | ||
| NOI DY(4) | 14.1% | 14.4% | 15.1% | 21.2% | 20.3% | ||
| NCF DY(4) | 9.5% | 9.8% | 10.6% | 16.0% | 15.2% | ||
| (1) | Occupancy, ADR and RevPAR figures are based on the underwriting, which have been taken from financial statements provided by the JW Marriott Desert Springs Borrower. Variances between the underwriting, the appraisal and the Historical Occupancy, ADR, RevPAR table with respect to Occupancy, ADR and RevPAR at the JW Marriott Desert Springs Property are attributable to variances in reporting methodologies and/or timing differences. |
| (2) | Other Revenue includes parking garage, telephone, leisure/recreational income, business center, tennis, retail and other miscellaneous items. Retail revenue is inclusive of reimbursements associated with shared common area maintenance, tax and marketing expenses. Related expenses attributable to the retail component are included in undistributed Operating Expenses for the overall property. |
| (3) | The increase in Net Operating Income in the TTM 11/30/2016 over 2015 is attributable to an increase in Occupancy and ADR at the subject during 2016. |
| (4) | Debt service coverage ratios and debt yields shown are based on the JW Marriott Desert Springs Whole Loan. |
Appraisal.As of the appraisal valuation date of November 10, 2016, the JW Marriott Desert Springs Property had an “as-is” appraised value of $161,000,000.
Environmental Matters. According to a Phase I environmental assessment dated January 18, 2017, there was no evidence of any recognized environmental conditions at the JW Marriott Desert Springs Property.
Market Overview and Competition.The JW Marriott Desert Springs Property is located in Palm Desert, Riverside County, California within the Riverside-San Bernardino-Ontario, California Metropolitan Statistical Area, approximately two and a half miles south of Interstate 10. The JW Marriott Desert Springs Property is located approximately 13 miles from the Palm Springs Convention Center and the Palm Springs International Airport, the primary airport serving the local market. Palm Desert, a resort community located within the 45-mile region known as Coachella Valley, is approximately 120 miles east of downtown Los Angeles and approximately 125 miles northeast of San Diego, California. Coachella Valley is a popular tourist destination with multiple resorts, spas, cultural venues, golf courses, restaurants, retail and recreational attractions. Coachella is host to numerous signature events such as major tennis and golf tournaments and music and arts festivals that serve as some of the major demand drivers for the market. The Coachella Valley experiences increased demand during the months of January through May, when the warmer desert temperatures attract both tourists and retirees who own second homes in the region. According to the appraisal, many resorts and resort-related businesses remain open year-round supporting a more stable local labor market and economy. According to the appraisal the estimated number of households in the San Bernardino/Riverside market increased approximately 1.2% from 2014 to 2015 to 1.40 million and is projected to grow approximately 1.5% annually over the next five years. Palm Desert and Riverside County experienced a declining unemployment rate since 2010, following the same trend at the state and national level according to the appraisal. The unemployment rate for Palm Desert in 2015 was 4.8%, below the unemployment rate of 6.7% for Riverside County and 6.2% for the state of California.
The Coachella Valley lodging market encompasses approximately 11,500 guestrooms in nearly 170 properties. Within the larger Coachella Valley market, the JW Marriott Desert Springs Property competes within a submarket comprised of Palm Desert, Rancho Mirage, La Quinta and Indian Wells. The appraisal has identified 1,292 rooms under construction in the broader Palm Springs market, with 260 rooms under construction in Palm Desert. The appraiser does not consider the new supply directly competitive with the JW Marriott Desert Springs Property, as the new supply largely consists of smaller, non-flagged, non-resort style facilities with fewer amenities.
THE INFORMATION IN THIS STRUCTURAL AND COLLATERAL TERM SHEET IS NOT COMPLETE AND MAY BE AMENDED PRIOR TO THE TIME OF SALE. THIS TERM SHEET IS NOT AN OFFER TO SELL THESE SECURITIES AND IT IS NOT A SOLICITATION OF AN OFFER TO BUY THESE SECURITIES IN ANY JURISDICTION WHERE THE OFFER OR SALE IS NOT PERMITTED.
| 76 |
JW MARRIOTT DESERT SPRINGS |
The following table presents certain information relating to the JW Marriott Desert Springs Property’s competitive sets:
Subject and Market Historical Occupancy, ADR and RevPAR(2)
Competitive Set(3) | JW Marriott Desert Springs(3) | Penetration Factor(4) | |||||||
Year | Occupancy | ADR | RevPAR | Occupancy | ADR | RevPAR | Occupancy | ADR | RevPAR |
| 2013 | 56.0% | $192.60 | $107.88 | 62.9% | $189.33 | $119.09 | 112.3% | 98.3% | 110.4% |
| 2014 | 56.7% | $198.76 | $112.63 | 61.5% | $197.46 | $121.47 | 108.6% | 99.3% | 107.8% |
| 2015 | 57.8% | $218.51 | $126.38 | 60.8% | $200.78 | $122.14 | 105.2% | 91.9% | 96.6% |
| 11/30/2016 TTM(1) | 60.7% | $230.82 | $140.12 | 65.8% | $210.31 | $138.40 | 108.4% | 91.1% | 98.8% |
| (1) | Information obtained from a third party hospitality research report dated December 19, 2016. The competitive set includes Omni Rancho Las Palmas Resort & Spa, Waldorf Astoria La Quinta Resort & Club, Renaissance Indian Wells Resort & Spa, Westin Mission Hills Golf Resort & Spa, Hyatt Regency Indian Wells Resort & Spa and Ritz-Carlton Rancho Mirage (owned by the borrower sponsor). |
| (2) | Variances between the underwriting, the appraisal and the above table with respect to Occupancy, ADR and RevPAR at the JW Marriott Desert Springs Property are attributable to variances in reporting methodologies and/or timing differences. |
| (3) | Based on operating statements provided by the JW Marriott Desert Springs Borrower. |
| (4) | Penetration Factor is calculated based on data provided by an industry report for the competitive set and borrower-provided operating statements for the JW Marriott Desert Springs Property. |
The following table presents certain information relating to the primary competitive properties to the JW Marriott Desert Springs Property:
Competitive Properties(1)(2)
| Property Name | No. of Rooms | Year Built | Transient | Meeting & Group | Estimated 2016 Occupancy | Estimated 2016 ADR | Estimated 2016 RevPAR | RevPAR Penetration |
| JW Marriott Desert Springs (Subject)(3) | 884 | 1987 | 45% | 55% | 65.0% | $205.00 | $133.25 | 98.4% |
| Primary Competitors | ||||||||
| Renaissance Esmeralda Indian Wells Resort & Spa | 560 | 1989 | 50% | 50% | 55.0%-60.0% | $180.00-$190.00 | $105-110 | 75-80% |
| Omni Rancho Las Palmas Resort & Spa | 444 | 1979 | 55% | 45% | 60.0%-65.0% | $190.00-$200.00 | $120-125 | 85-90% |
| Westin Mission Hills Resort & Spa | 512 | 1991 | 45% | 55% | 55.0%-60.0% | $180.00-$190.00 | $110-115 | 80-85% |
| Total/Wtd. Avg. | 2,400 | 48% | 52% | 61.6% | $194.56 | $119.94 | 88.6% | |
| Secondary Competitors(4) | 1,570 | 56% | 44% | 60.6% | $275.30 | $166.95 | 123.3% | |
| Total/Wtd. Avg. | 3,970 | 51% | 49% | 61.3% | $220.84 | $135.41 | 100.0% |
| (1) | Information obtained from the appraisal. |
| (2) | Variances between the underwriting, the appraisal and the above table with respect to Occupancy, ADR and RevPAR at the JW Marriott Desert Springs Property are attributable to variances in reporting methodologies and/or timing differences. |
| (3) | Estimated 2016 Occupancy, Estimated 2016 ADR and Estimated 2016 RevPAR are based on the appraisal’s estimated 2016 year-end figures. |
| (4) | Secondary Competitors, as identified by the appraiser, include Hyatt Regency Indian Wells Resort & Spa, La Quinta Resort & Club, A Waldorf Astoria Resort, and Ritz-Carlton Rancho Mirage (owned by the borrower sponsor). |
The Borrower.The borrower is Newage Desert Springs, LLC, a Delaware limited liability company with two independent directors. Legal counsel to the borrower delivered a non-consolidation opinion in connection with the origination of the JW Marriott Desert Springs Whole Loan. The JW Marriott Desert Springs Borrower is 53.5% owned by Newage JWDS, LLC, which is controlled by Ronnie Lam, the nonrecourse carve-out guarantor.
The Sponsor.The sponsor is Kam Sang Company. Ronnie Lam founded Kam Sang Company, a privately held real estate development, construction and management firm, in 1979 and serves as both President and CEO. Ronnie Lam and Kam Sang Company have a portfolio of $500 million of real estate holdings throughout California. Ronnie Lam has thirty seven years of real estate experience with investments including commercial, retail shopping centers, malls, and apartment buildings. Ronnie Lam also owns and manages the Ritz-Carlton Rancho Mirage, located approximately 6.5 miles from the JW Marriott Desert Springs Property, which opened in May 2014.
Escrows.The JW Marriott Desert Springs Borrower deposited $12,000,000 at closing for renovations, repairs and improvements required to be made pursuant to a property improvement plan imposed by the property manager (“PIP”). Negotiations for the PIP budget are ongoing and may include significant additional items that have not been reserved for. See “Description of the Mortgage Pool—Property Types—Hotel Properties” in the Preliminary Prospectus.
The requirement for the JW Marriott Desert Springs Borrower to make monthly deposits to a tax escrow is waived so long as the JW Marriott Desert Springs Borrower has reserved such amounts with the property manager pursuant to the management agreement. In the event that the JW Marriott Desert Springs Borrower is no longer required to reserve such amounts with the property manager, on each payment date the JW Marriott Desert Springs Borrower will be required to deposit 1/12 of annual estimated taxes.
The requirement for the JW Marriott Desert Springs Borrower to make monthly deposits to an insurance escrow is waived so long as the JW Marriott Desert Springs Borrower has reserved such amounts with the property manager pursuant to the management agreement. In the event that the JW Marriott Desert Springs Borrower is no longer required to reserve such amounts with the property manager, on each payment date the JW Marriott Desert Springs Borrower will be required to deposit 1/12 of annual estimated insurance premiums upon the occurrence of (i) an event of default under the JW Marriott Desert Springs Whole Loan, (ii)
THE INFORMATION IN THIS STRUCTURAL AND COLLATERAL TERM SHEET IS NOT COMPLETE AND MAY BE AMENDED PRIOR TO THE TIME OF SALE. THIS TERM SHEET IS NOT AN OFFER TO SELL THESE SECURITIES AND IT IS NOT A SOLICITATION OF AN OFFER TO BUY THESE SECURITIES IN ANY JURISDICTION WHERE THE OFFER OR SALE IS NOT PERMITTED.
| 77 |
JW MARRIOTT DESERT SPRINGS |
the liability and casualty policies maintained by the JW Marriott Desert Springs Borrower are not part of a blanket or umbrella policy approved by the lender in its reasonable discretion, (iii) the JW Marriott Desert Springs Borrower does not provide the lender with evidence of renewal of certain insurance policies or (iv) the JW Marriott Desert Springs Borrower does not provide the lender with paid receipts for the payment of the insurance premiums within ten days prior to the expiration dates of the policies.
The requirement for the JW Marriott Desert Springs Borrower to make monthly deposits for furniture, fixtures and equipment (“FF&E”) is waived so long as the JW Marriott Desert Springs Borrower has reserved such amounts with the property manager pursuant to the management agreement. In the event the JW Marriott Desert Springs Borrower is no longer required to reserve such amounts with the property manager, the JW Marriott Desert Springs Borrower will be required to make monthly deposits into an FF&E escrow equal to the greater of (i) 1/12 of 5.50% of the gross operating income for the JW Marriott Desert Springs Property for the preceding calendar year; provided that, starting with the first full fiscal year following completion of all replacements, repairs or improvements required to be made pursuant to any PIP, such percentage shall be adjusted as follows: Year 1: 3.50%, Year 2: 4.0%, Year 3: 4.5%; Year 4: 5.0%, and Year 5 and thereafter: 5.50%; and (ii) the amount (if any) of the deposit required by the property manager for the JW Marriott Desert Springs Property on account of FF&E pursuant to the related management agreement.
On each payment date when the amount on deposit in a seasonality reserve account (the “Seasonality Reserve”) is less than the Seasonality Reserve Cap (as defined below), excess cash flow, to the extent available, is required to be deposited into the Seasonality Reserve in an amount sufficient to cause the balance in the Seasonality Reserve to equal the then applicable Seasonality Reserve Cap. To the extent that the balance in the Seasonality Reserve is less than the Seasonality Reserve Cap as of May 30 of each year, the JW Marriott Desert Springs Borrower is required to deposit with the lender by June 30 of such year an amount sufficient to bring the balance on deposit equal to the then applicable Seasonality Reserve Cap. Provided no event of default has occurred and is continuing, the lender is required to disburse amounts from the Seasonality Reserve Funds to the JW Marriott Desert Springs Borrower for payment of debt service or for distribution to the mezzanine borrower for payment on the mezzanine loan. At the end of each calendar year, at the request of the JW Marriott Desert Springs Borrower, any remaining amounts constituting Seasonality Reserve Funds are required to be released to the JW Marriott Desert Springs Borrower.
“Seasonality Reserve Cap” means, (A) for calendar year 2017, for the period (1) from the loan closing date to but excluding the monthly payment date in October 2017, an amount equal to the sum of (a) four months of debt service on the JW Marriott Desert Springs Whole Loan, plus (b) four months of debt service on the mezzanine loan, and (2) for the remainder of calendar year 2017, an amount equal to the sum of (a) two months of debt service on the JW Marriott Desert Springs Whole Loan, plus (b) two months of debt service on the mezzanine loan, and (B) for each calendar year thereafter, for the period commencing on the monthly payment date in January of such calendar year through but excluding the monthly payment date in October of such calendar year, an amount equal to the sum of (a) four months of debt service on the JW Marriott Desert Springs Whole Loan, plus (b) four months of debt service on the mezzanine loan, and (2) for the remainder of each such calendar year, an amount equal to the sum of (a) two months of debt service on the JW Marriott Desert Springs Whole Loan, plus (b) two months of debt service on the mezzanine loan.
Lockbox and Cash Management.The loan is structured with a hard lockbox and upfront cash management. For so long as Marriott is providing property management services for the JW Marriott Desert Springs Property pursuant to the property management agreement, funds shall first be deposited into accounts maintained by Marriott for the JW Marriott Desert Springs Borrower (as to which the JW Marriott Desert Springs Borrower, Marriott, and the bank maintaining such accounts have executed a control agreement with the lender), and Marriott is required to deposit into a lockbox account for the benefit of the lender (the “Deposit Account”) the funds that remain after Marriott has paid all operating expenses of the JW Marriott Desert Springs Property, including without limitation management fees, working capital reserves and other amounts payable pursuant to the terms of the management agreement (“Remaining Revenues”). All Remaining Revenues (or if Marriott is no longer providing property management services, all revenues) are required to be deposited into the Deposit Account. All revenues in the Deposit Account are required to be deposited into an account established by the lender (the “Cash Management Account”). The cash management bank will be required to apply funds in the Cash Management Account to fund the required reserves deposits described above under “Escrows and Reserves,” debt service on the JW Marriott Desert Springs Whole Loan, to disburse monthly operating expenses as referenced in the approved annual budget, to pay extraordinary expenses not referenced in the approved annual budget and approved by the lender, to pay debt service on the related mezzanine loan, and all remaining cash shall be distributed (i) if no Cash Sweep Event Period (as defined below) is in effect, and (a) the lender has received notice of an event of default under the related mezzanine loan, to the mezzanine lender, or (b) if the lender has not received such notice, but the Seasonality Reserve Cap has not been met, to the Seasonality Reserve until the Seasonality Reserve Cap has been met, (ii) if a Cash Sweep Event Period is in effect, first into the Seasonality Reserve until the Seasonality Reserve Cap has been met, with any remaining funds deposited into an excess cash flow account to be held as security for the JW Marriott Desert Springs Whole Loan during the continuance of such Cash Sweep Event Period, and (iii) if any funds remain thereafter and no Cash Sweep Event Period is in effect, to the JW Marriott Desert Springs Borrower.
A “Cash Sweep Event Period” will commence upon the occurrence of any of the following: (i) an event of default; (ii) if, as of any calculation date, the aggregate debt service coverage ratio under the JW Marriott Desert Springs Whole Loan and the related mezzanine loan is less than 1.20x for 12 consecutive calendar months tested quarterly (a “DSCR Event”); (iii) a management agreement default event where there has been a default by the JW Marriott Desert Springs Borrower under the management agreement or that the property is not being operated and maintained in accordance with the manager’s standards, resulting in the JW Marriott Desert Springs Borrower no longer being in good standing with the manager and such default is not cured within the later of 30 days and the grace/cure period in the management agreement or as otherwise provided for in writing by the franchisor, (iv) a management agreement termination event; and (v) JW Marriott Desert Springs Borrower’s failure to comply with the terms of Section 6.5.1 of the loan agreement for the JW Marriott Desert Spring Whole Loan requiring funding in connection with a PIP (a “6.5.1 Event”) and continuing until such time, if any, as the lender gives notice to the cash management bank that the Cash Sweep Event Period has ended.
THE INFORMATION IN THIS STRUCTURAL AND COLLATERAL TERM SHEET IS NOT COMPLETE AND MAY BE AMENDED PRIOR TO THE TIME OF SALE. THIS TERM SHEET IS NOT AN OFFER TO SELL THESE SECURITIES AND IT IS NOT A SOLICITATION OF AN OFFER TO BUY THESE SECURITIES IN ANY JURISDICTION WHERE THE OFFER OR SALE IS NOT PERMITTED.
| 78 |
JW MARRIOTT DESERT SPRINGS |
The lender is required to give notice that a Cash Sweep Event Period has ended if (A) with respect to a Cash Sweep Event Period described in clause (i) above, such event of default has been cured and accepted by the lender in its sole and absolute discretion, (B) with respect to a DSCR Event, the lender has determined that the JW Marriott Desert Springs Property has achieved an aggregate debt service coverage ratio under the JW Marriott Desert Springs Whole Loan and the related mezzanine loan of at least 1.30x for the immediately preceding 12 consecutive calendar months, (C) with respect to a management agreement default event, (x) such default has been remedied to the satisfaction of the lender and manager as evidenced by an estoppel certificate delivered to the lender from the manager, in form and substance reasonably acceptable to the lender and (y) there has been no default by the JW Marriott Desert Springs Borrower under the management agreement for 60 consecutive days, (D) with respect to a management agreement termination event, (x) the JW Marriott Desert Springs Borrower has entered into a new management agreement (or franchise agreement) with a hotel operator (“Replacement Management Agreement”) each acceptable to the lender in its sole discretion, and (y) the hotel operations at the JW Marriott Desert Springs Property have been operating for 60 consecutive days under the Replacement Management Agreement, without the occurrence of any default by the JW Marriott Desert Springs Borrower or manager thereunder or (E) with respect to a 6.5.1 Event, the lender has confirmed that the JW Marriott Desert Springs Borrower is in compliance with the terms of Section 6.5.1 of the loan agreement.
Property Management. The JW Marriott Desert Springs Property is brand-managed by Marriott Hotel Services, Inc.
Assumption.The borrower has a two-time right to transfer the JW Marriott Desert Springs Propertyprovided that certain conditions are satisfied, including (i) no event of default has occurred and is continuing; (ii) the lender reasonably approves the proposed transferee based on the proposed transferee’s experience, financial strength and general business standing; (iii) an affiliate of the transferee acceptable to the lender executes a recourse guaranty and environmental indemnity identical in form and substance to those executed at loan closing; and (iv) if required by the lender, the lender has received confirmation from each rating agency rating the Certificates and any rating agency rating any securities backed by the JW Marriott Desert Springs Pari Passu Companion Loan that such assumption will not result in a downgrade, withdrawal or qualification of the respective ratings assigned to the Certificates and such other securities.
Right of First Refusal.The property manager, Marriott Hotel Services, Inc., has a right of first refusal to purchase the JW Marriott Desert Springs Property. A Subordination, Non-Disturbance and Attornment Agreement was entered into with Marriott, which states that the right of first refusal does not apply to a foreclosure, including judicial and nonjudicial foreclosure and deed-in-lieu of foreclosure, but will apply to subsequent transfers.
Partial Release.Not permitted.
Real Estate Substitution.Not permitted.
Subordinate and Mezzanine Indebtedness.The “JW Marriott Desert Springs Mezzanine Loan” refers to a loan in the original principal amount of $16,000,000 made to Newage Desert Springs Holding, LLC, a Delaware limited liability company, by Morgan Stanley Mortgage Capital Holdings LLC, secured by 100% of the direct or indirect equity interest in the JW Marriott Desert Springs Borrower and put in place simultaneously with the origination of the JW Marriott Desert Springs Whole Loan. The JW Marriott Desert Springs Mezzanine Loan has an interest rate of 10.390%, is interest-only, and is coterminous with the JW Marriott Desert Springs Whole Loan. The JW Marriott Desert Springs Mezzanine Loan and the JW Marriott Desert Springs Whole Loan are subject to an intercreditor agreement between Morgan Stanley Bank, National Association, as senior lender, and Morgan Stanley Mortgage Capital Holdings LLC, as the initial mezzanine lender. The mezzanine loan was sold to an unaffiliated third party and securitized in the JWM 2017 Mezzanine Trust.
Ground Lease.A portion of the JW Marriott Desert Springs Property consisting of one of two 18-hole golf courses is comprised of a ground leasehold interest.
Terrorism Insurance.The JW Marriott Desert Springs Whole Loan documents require that the “all risk” insurance policy required to be maintained by the JW Marriott Desert Springs Borrower provide coverage for terrorism in an amount determined by the lender, but in no event more than the full replacement cost of the JW Marriott Desert Springs Property and 18 months of business interruption insurance; provided that if the Terrorism Risk Insurance Program Reauthorization Act of 2015 or subsequent statute, extension or reauthorization thereof (“TRIPRA”) is in effect and continues to cover both foreign and domestic acts of terrorism, the lender is required to accept terrorism insurance with coverage against “covered acts” within the meaning of TRIPRA.
THE INFORMATION IN THIS STRUCTURAL AND COLLATERAL TERM SHEET IS NOT COMPLETE AND MAY BE AMENDED PRIOR TO THE TIME OF SALE. THIS TERM SHEET IS NOT AN OFFER TO SELL THESE SECURITIES AND IT IS NOT A SOLICITATION OF AN OFFER TO BUY THESE SECURITIES IN ANY JURISDICTION WHERE THE OFFER OR SALE IS NOT PERMITTED.
| 79 |
THE DAVENPORT

THE INFORMATION IN THIS STRUCTURAL AND COLLATERAL TERM SHEET IS NOT COMPLETE AND MAY BE AMENDED PRIOR TO THE TIME OF SALE. THIS TERM SHEET IS NOT AN OFFER TO SELL THESE SECURITIES AND IT IS NOT A SOLICITATION OF AN OFFER TO BUY THESE SECURITIES IN ANY JURISDICTION WHERE THE OFFER OR SALE IS NOT PERMITTED.
| 80 |
THE DAVENPORT

THE INFORMATION IN THIS STRUCTURAL AND COLLATERAL TERM SHEET IS NOT COMPLETE AND MAY BE AMENDED PRIOR TO THE TIME OF SALE. THIS TERM SHEET IS NOT AN OFFER TO SELL THESE SECURITIES AND IT IS NOT A SOLICITATION OF AN OFFER TO BUY THESE SECURITIES IN ANY JURISDICTION WHERE THE OFFER OR SALE IS NOT PERMITTED.
| 81 |
| No. 6 - The Davenport |
| Loan Information | Property Information | ||||||
| Mortgage Loan Seller: | Wells Fargo Bank, National Association | Single Asset/Portfolio: | Single Asset | ||||
Credit Assessment (Fitch/KBRA/Moody’s): | NR/NR/NR | Property Type: | Office | ||||
| Original Principal Balance(1): | $50,000,000 | Specific Property Type: | CBD | ||||
| Cut-off Date Balance(1): | $50,000,000 | Location: | Cambridge, MA | ||||
| % of Initial Pool Balance: | 5.0% | Size: | 230,864 SF | ||||
| Loan Purpose: | Acquisition | Cut-off Date Balance Per SF(1): | $454.81 | ||||
| Borrower Name: | Davenport Owner (DE) LLC | Year Built/Renovated: | 1888/2015 | ||||
| Borrower Sponsors(2): | Various | Title Vesting: | Fee | ||||
| Mortgage Rate: | 4.220% | Property Manager: | Self-managed | ||||
| Note Date: | February 6, 2017 | 4thMost Recent Occupancy (As of): | 100.0% (12/31/2013) | ||||
| Anticipated Repayment Date: | NAP | 3rdMost Recent Occupancy (As of): | 100.0% (12/31/2014) | ||||
| Maturity Date: | February 11, 2027 | 2ndMost Recent Occupancy (As of)(4): | 71.5% (12/31/2015) | ||||
| IO Period: | 120 months | Most Recent Occupancy (As of): | 100.0% (12/31/2016) | ||||
| Loan Term (Original): | 120 months | Current Occupancy (As of)(4): | 93.2% (1/31/2017) | ||||
| Seasoning: | 2 months | ||||||
| Amortization Term (Original): | NAP | Underwriting and Financial Information: | |||||
| Loan Amortization Type: | Interest-only, Balloon | ||||||
| Interest Accrual Method: | Actual/360 | 4thMost Recent NOI(5): | NAV | ||||
| Call Protection: | L(26),D(89),O(5) | 3rdMost Recent NOI(5): | NAV | ||||
| Lockbox Type: | Hard/Springing Cash Management | 2ndMost Recent NOI (As of)(5): | $6,085,945 (12/31/2015) | ||||
| Additional Debt(1): | Yes | Most Recent NOI (As of)(5): | $5,850,147 (Annualized 11 11/30/2016) | ||||
| Additional Debt Type(1): | Pari Passu; Future Mezzanine | ||||||
| U/W Revenues: | $13,321,827 | ||||||
| Escrows and Reserves(3): | U/W Expenses: | $4,276,442 | |||||
| U/W NOI(5): | $9,045,386 | ||||||
| Type: | Initial | Monthly | Cap (If Any) | U/W NCF: | $8,368,772 | ||
| Taxes | $0 | Springing | NAP | U/W NOI DSCR(1): | 2.01x | ||
| Insurance | $0 | Springing | NAP | U/W NCF DSCR(1): | 1.86x | ||
| Replacement Reserves | $0 | Springing | NAP | U/W NOI Debt Yield(1): | 8.6% | ||
| Deferred Maintenance | $5,225 | $0 | NAP | U/W NCF Debt Yield(1): | 8.0% | ||
| TI/LC Reserve | $0 | Springing | (3) | As-Stabilized Appraised Value(6): | $214,000,000 | ||
| Rent Abatement Reserve | $2,030,190 | $78,177 | $938,123 | As-Stabilized Appraisal Valuation Date(6): | November 1, 2018 | ||
| HubSpot TI/LC Reserve | $7,938,810 | $181,108 | $2,173,299 | Cut-off Date LTV Ratio(1): | 49.1% | ||
| HubSpot Basement Reserve | $94,633 | $94,633 | $1,135,600 | LTV Ratio at Maturity(1): | 49.1% | ||
| (1) | See “The Mortgage Loan” section. All statistical financial information related to balance per square foot, loan-to-value ratios, debt service coverage ratios and debt yields are based on the funded outstanding principal balance of The Davenport Whole Loan (as defined below) as of the Cut-off Date. |
| (2) | See “The Borrower Sponsors” section. |
| (3) | See “Escrows” section. |
| (4) | See “Historical Occupancy” section. |
| (5) | See “Cash Flow Analysis” section. |
| (6) | See “Appraisal” section. The Davenport Property (as defined below) has an “As-is” Appraised Value of $204,000,000, resulting in an As-is Cut-off Date LTV Ratio and LTV Ratio at Maturity of 51.5%. |
The Mortgage Loan. The mortgage loan (“The Davenport Mortgage Loan”) is part of a whole loan (“The Davenport Whole Loan”) that is evidenced by twopari passu promissory notes (Note A-1 and Note A-2) secured by a first mortgage encumbering a class A office property located in Cambridge, Massachusetts (“The Davenport Property”). The Davenport Whole Loan was originated on February 6, 2017 by Wells Fargo Bank, National Association. The Davenport Whole Loan had an original principal balance of $105,000,000, has an outstanding principal balance as of the Cut-off Date of $105,000,000 and accrues interest at an interest rate of 4.220%per annum. The Davenport Whole Loan had an initial term of 120 months, has a remaining term of 118 months as of the Cut-off Date and requires interest-only payments. The Davenport Whole Loan matures on February 11, 2027.
Note A-2, which will be contributed to the BANK 2017-BNK4 trust, had an original principal balance of $50,000,000, has an outstanding principal balance as of the Cut-off Date of $50,000,000 and represents the non-controlling interest in The Davenport Whole Loan. The controlling Note A-1, which had an original principal balance of $55,000,000, is expected to be contributed to the WFCM 2017-RB1 trust. See “Description of the Mortgage Pool—The Whole Loans—The Non-Serviced Whole Loans” in the Preliminary Prospectus.
THE INFORMATION IN THIS STRUCTURAL AND COLLATERAL TERM SHEET IS NOT COMPLETE AND MAY BE AMENDED PRIOR TO THE TIME OF SALE. THIS TERM SHEET IS NOT AN OFFER TO SELL THESE SECURITIES AND IT IS NOT A SOLICITATION OF AN OFFER TO BUY THESE SECURITIES IN ANY JURISDICTION WHERE THE OFFER OR SALE IS NOT PERMITTED.
| 82 |
THE DAVENPORT
Note Summary(1)
| Notes | Original Balance | Note Holder | Controlling Interest | |
| A-1 | $55,000,000 | WFCM 2017-RB1 | Yes | |
| A-2 | $50,000,000 | BANK 2017-BNK4 | No | |
| Total | $105,000,000 |
Following the lockout period, the borrower has the right to defease The Davenport Whole Loan in whole, but not in part, on any date before October 11, 2026. In addition, The Davenport Whole Loan is prepayable without penalty on or after October 11, 2026. The lockout period will expire on the earlier to occur of (i) two years after the closing date of the securitization that includes the last note to be securitized and (ii) March 11, 2019.
Sources and Uses
| Sources | Uses | |||||||
| Original whole loan amount | $105,000,000 | 49.0% | Purchase price | $202,500,000 | 94.5% | |||
| Borrower Sponsor’s new cash contribution | 109,393,255 | 51.0 | Reserves | 10,068,858 | 4.7 | |||
| Closing costs | 1,824,397 | 0.9 | ||||||
| Total Sources | $214,393,255 | 100.0% | Total Uses | $214,393,255 | 100.0% |
The Property.The Davenport Property is a four story, class A office building totaling 230,864 square feet and located in Cambridge, Massachusetts, approximately 1.4 miles northwest of the Boston central business district. Built in 1888 and renovated in 2015, The Davenport Property is situated on a full 1.6-acre city block. The previous owners invested approximately $26.7 million into The Davenport Property including $11.0 million of capital expenditures, $7.8 million in prior tenant improvement and leasing commissions (“TI/LC”), and $7.9 million in current TI/LCs, which have been reserved upfront. The capital expenditures include a completely redesigned and upgraded lobby, elevator modernization and cab upgrade, roof replacement and repairs, façade improvements, and building system upgrades to the HVAC and fire alarm. The Davenport Property also has Wired Certified Gold internet infrastructure and connectivity and features many amenities for the younger, tech-oriented workforce including nap rooms, common areas for collaborative work and an employee cafeteria and conference center.
The Davenport Property serves as the global headquarters of HubSpot, a provider of cloud-based marketing and sales software for small and mid-size businesses. HubSpot uses integrated applications, such as social media, search engine optimization, blogging, website content management, marketing automation, email, and analytics and reporting, which enable businesses to attract visitors to their websites, convert visitors into leads, and close leads into customers. HubSpot’s products allow its customers to easily execute, manage and analyze sophisticated email marketing campaigns. According to a third party industry research report, HubSpot is a leader in the marketing automation industry and controls approximately 50% of global market share and approximately 29% of U.S. market share. HubSpot has over 23,000 customers in more than 90 countries and strong customer relationships as evidenced by its monthly subscription retention rate of over 90%. HubSpot is a publicly traded company on the New York Stock Exchange (HUBS) and had a market capitalization of $2.2 billion as of March 1, 2017.
HubSpot has been in occupancy since 2010 and has gradually expanded within The Davenport Property. In 2015, in order to facilitate its rapid growth, HubSpot executed a long-term lease renewal through October 2027 for its 118,561 square feet of space and added 66,887 square feet of expansion space. HubSpot currently occupies 185,448 square feet (80.3% of net rentable area). Further, HubSpot’s lease has contractual phased-in expansions to lease 100% of the net rentable area at The Davenport Property by May 2018. The first expansion will commence on January 1, 2018 and encompass 18,674 square feet (8.1% of net rentable area), and the second expansion will occur on May 1, 2018 where HubSpot will take over 11,064 square feet (4.8% of net rentable area). After the second expansion, HubSpot is contractually obligated to lease the 15,678 square feet (6.8% of net rentable area) of basement space. These three spaces are collectively referred to as the “Put Premises” (see “Major Tenants” section). On December 1, 2020, HubSpot’s below market rent on its original 118,561 square feet of space will be re-set to $57.00 per square foot, triple net, bringing its rent in-line with the expansion spaces. The Davenport Property will benefit from the December 2020 rent re-set, which will equate to an increase in effective gross income of approximately $4.7 million by year-end 2021.
The Davenport Property does not offer on-site parking but has a long-term 99-year parking agreement with the City of Cambridge, which was executed on November 18, 1985, to lease up to 250 parking spaces at the adjacent parking garage, resulting in a parking ratio of 1.1 spaces per 1,000 square feet of rentable area. HubSpot is contractually obligated to lease a minimum of 202 parking spaces. As of January 31, 2017, The Davenport Property was 93.2% occupied by three tenants (see “Major Tenants” section).
THE INFORMATION IN THIS STRUCTURAL AND COLLATERAL TERM SHEET IS NOT COMPLETE AND MAY BE AMENDED PRIOR TO THE TIME OF SALE. THIS TERM SHEET IS NOT AN OFFER TO SELL THESE SECURITIES AND IT IS NOT A SOLICITATION OF AN OFFER TO BUY THESE SECURITIES IN ANY JURISDICTION WHERE THE OFFER OR SALE IS NOT PERMITTED.
| 83 |
THE DAVENPORT
The following table presents certain information relating to the tenancy at The Davenport Property:
Major Tenants
| Tenant Name | Credit Rating (Fitch/Moody’s/ S&P) | Tenant NRSF | % of NRSF | Annual U/W Base Rent PSF(1) | Annual U/W Base Rent(1) | % of Total Annual U/W Base Rent | Lease Expiration Date |
| Major Tenants | |||||||
| HubSpot(2)(3) | NR/NR/NR | 185,448 | 80.3% | $42.54 | $7,889,432 | 84.2% | 10/31/2027(7) |
| Atlas Venture(4) | NR/NR/NR | 18,674 | 8.1% | $54.00 | $1,008,396 | 10.8% | 10/31/2017 |
| Nature Publishing Group(5) | NR/NR/NR | 11,064 | 4.8% | $43.00 | $475,752 | 5.1% | 4/30/2018 |
| Total Major Tenants | 215,186 | 93.2% | $43.56 | $9,373,580 | 100.0% | ||
| Non-Major Tenants | 0 | 0.0% | $0.00 | $0 | 0.0% | ||
| Occupied Collateral Total | 215,186 | 93.2% | $43.56 | $9,373,580 | 100.0% | ||
| Vacant Space(6) | 15,678 | 6.8% | |||||
| Collateral Total | 230,864 | 100.0% | |||||
| (1) | Annual U/W Base Rent PSF and Annual U/W Base Rent include contractual rent steps through March 2018 totaling $448,637. |
| (2) | HubSpot occupies eight office spaces totaling 185,448 square feet. The office spaces have Annual U/W Base Rent PSFs of $36.15 (four spaces totaling 112,930 square feet), $34.65 (one space totaling 5,631 square feet), and $54.00 (three spaces totaling 66,887 square feet). |
| (3) | HubSpot is receiving six months free rent through June 2017 on 15,910 square feet (6.9% of net rentable area) and eight months free rent through August 2017 on 42,834 square feet (18.6% of net rentable area). This free rent amount has been reserved upfront at closing. |
| (4) | “Put Premise A” and “Put Premise B” are currently occupied by Atlas Venture through October 31, 2017. HubSpot is contractually obligated to take possession of these spaces by January 1, 2018. Annual U/W Base Rent PSF of $54.00 is based on HubSpot’s contractual rent beginning on January 1, 2018. Atlas Venture currently leases Put Premise A for $35.78 per square foot and Put Premise B for $49.00 per square foot. |
| (5) | “Put Premise C” is currently occupied by Nature Publishing Group through April 30, 2018. HubSpot is contractually obligated to take possession of Put Premise C by May 1, 2018 at a rental rate of $55.00 per square foot. Annual U/W Base Rent PSF of $43.00 is based on Nature Publishing Group’s May 2017 contractual rent step. |
| (6) | Vacant Space is comprised of 5,678 square feet of basement office space and 10,000 square feet of basement storage space. Upon the commencement of Put Premise C, HubSpot is contractually obligated to lease the basement office space for $48.00 per square foot and the basement storage space for $15.00 per square foot. Both spaces were underwritten as vacant, but HubSpot will likely use this space for a tenant amenity. |
| (7) | HubSpot has two, 5-year lease renewal options. |
The following table presents certain information relating to the lease rollover schedule at The Davenport Property:
Lease Expiration Schedule(1)
| Year Ending December 31, | No. of Leases Expiring | Expiring NRSF | % of Total NRSF | Cumulative Expiring NRSF | Cumulative % of Total NRSF | Annual U/W Base Rent | % of Total Annual U/W Base Rent | Annual U/W Base Rent PSF(2) |
| MTM | 0 | 0 | 0.0% | 0 | 0.0% | $0 | 0.0% | $0.00 |
| 2017 | 2(3) | 18,674 | 8.1% | 18,674 | 8.1% | $1,008,396 | 10.8% | $54.00 |
| 2018 | 1(4) | 11,064 | 4.8% | 29,738 | 12.9% | $475,752 | 5.1% | $43.00 |
| 2019 | 0 | 0 | 0.0% | 29,738 | 12.9% | $0 | 0.0% | $0.00 |
| 2020 | 0 | 0 | 0.0% | 29,738 | 12.9% | $0 | 0.0% | $0.00 |
| 2021 | 0 | 0 | 0.0% | 29,738 | 12.9% | $0 | 0.0% | $0.00 |
| 2022 | 0 | 0 | 0.0% | 29,738 | 12.9% | $0 | 0.0% | $0.00 |
| 2023 | 0 | 0 | 0.0% | 29,738 | 12.9% | $0 | 0.0% | $0.00 |
| 2024 | 0 | 0 | 0.0% | 29,738 | 12.9% | $0 | 0.0% | $0.00 |
| 2025 | 0 | 0 | 0.0% | 29,738 | 12.9% | $0 | 0.0% | $0.00 |
| 2026 | 0 | 0 | 0.0% | 29,738 | 12.9% | $0 | 0.0% | $0.00 |
| 2027 | 8 | 185,448 | 80.3% | 215,186 | 93.2% | $7,889,432 | 84.2% | $42.54 |
| Thereafter | 0 | 0 | 0.0% | 215,186 | 93.2% | $0 | 0.0% | $0.00 |
| Vacant(5) | 0 | 15,678 | 6.8% | 230,864 | 100.0% | $0 | 0.0% | $0.00 |
| Total/Weighted Average | 11(6) | 230,864 | 100.0% | $9,373,580 | 100.0% | $43.56 |
| (1) | Information obtained from the underwritten rent roll. |
| (2) | Weighted Average Annual U/W Base Rent PSF excludes vacant space. |
| (3) | Put Premise A and Put Premise B are currently occupied by Atlas Venture through October 31, 2017. HubSpot is contractually obligated to take possession of these spaces by January 1, 2018. Annual U/W Base Rent PSF of $54.00 is based on HubSpot’s contractual rent beginning on January 1, 2018. Atlas Venture currently leases Put Premise A for $35.78 per square foot and Put Premise B for $49.00 per square foot. |
| (4) | Put Premise C is currently occupied by Nature Publishing Group through April 30, 2018. HubSpot is contractually obligated to take possession of Put Premise C by May 1, 2018 at a rental rate of $55.00 per square foot. |
| (5) | Vacant Space is comprised of 5,678 square feet of basement office space and 10,000 square feet of basement storage space. Upon the commencement of Put Premise C, HubSpot is contractually obligated to lease the basement office space for $48.00 per square foot and the basement storage space for $15.00 per square foot. |
| (6) | The Davenport Property is occupied by three tenants subject to 11 leases. |
THE INFORMATION IN THIS STRUCTURAL AND COLLATERAL TERM SHEET IS NOT COMPLETE AND MAY BE AMENDED PRIOR TO THE TIME OF SALE. THIS TERM SHEET IS NOT AN OFFER TO SELL THESE SECURITIES AND IT IS NOT A SOLICITATION OF AN OFFER TO BUY THESE SECURITIES IN ANY JURISDICTION WHERE THE OFFER OR SALE IS NOT PERMITTED.
| 84 |
THE DAVENPORT
The following table presents historical occupancy percentages at The Davenport Property:
Historical Occupancy
12/31/2013(1) | 12/31/2014(1) | 12/31/2015(1)(2) | 12/31/2016(1)(2) | 1/31/2017(3) | ||||
| 100.0% | 100.0% | 71.5% | 100.0% | 93.2% |
| (1) | Information obtained from the borrower. |
| (2) | HubSpot expanded into the space formerly occupied by Sonos and Zipcar, which vacated in 2015. |
| (3) | Information obtained from the underwritten rent roll. |
Operating History and Underwritten Net Cash Flow. The following table presents certain information relating to the historical operating performance and the underwritten net cash flow at The Davenport Property:
Cash Flow Analysis(1)
| 2015 | Annualized 11 11/30/2016 | U/W | % of U/W Effective Gross Income | U/W $ per SF | Year 4 12/31/2021(2) | ||||||||
| Base Rent | $8,832,174 | $6,853,343 | $9,373,580(3) | 70.4% | $40.60 | $13,152,367 | |||||||
| Grossed Up Vacant Space | 0 | 0 | 422,544 | 3.2 | 1.83 | 0 | |||||||
| Total Reimbursables | 785,719 | 2,535,443 | 3,524,376 | 26.5 | 15.27 | 4,300,986 | |||||||
| Other Income | 778,407 | 476,360 | 491,134 | 3.7 | 2.13 | 557,924 | |||||||
| Less Vacancy & Credit Loss | 0 | 0 | (489,806) | (3.7) | (2.12) | 0 | |||||||
| Effective Gross Income | $10,396,300 | $9,865,147 | $13,321,827 | 100.0% | $57.70 | $18,011,277 | |||||||
| Total Operating Expenses | 4,310,355 | 4,014,999 | 4,276,442 | 32.1 | 18.52 | 4,975,245 | |||||||
| Net Operating Income | $6,085,945(4) | $5,850,147(4) | $9,045,386(4) | 67.9% | $39.18 | $13,036,032 | |||||||
| TI/LC | 0 | 0 | 630,441 | 4.7 | 2.73 | 0 | |||||||
| Capital Expenditures | 0 | 0 | 46,173 | 0.3 | 0.20 | 66,862 | |||||||
| Net Cash Flow | $6,085,945 | $5,850,147 | $8,368,772 | 62.8% | $36.25 | $12,969,170 | |||||||
| NOI DSCR(5) | 1.35x | 1.30x | 2.01x | 2.90x | |||||||||
| NCF DSCR(5) | 1.35x | 1.30x | 1.86x | 2.89x | |||||||||
| NOI DY(5) | 5.8% | 5.6% | 8.6% | 12.4% | |||||||||
| NCF DY(5) | 5.8% | 5.6% | 8.0% | 12.4% |
| (1) | Historical financials prior to 2015 are not available as The Davenport Property was acquired in February 2017 and the seller did not provide historical cash flows. |
| (2) | Year 4 12/31/2021 is based on the appraiser’s as-stabilized discounted cash flow analysis when HubSpot will be leasing 100.0% of The Davenport Property at $58.00 per square foot for the office space (see “Appraisal” section). |
| (3) | In addition to the HubSpot expansion spaces, Base Rent includes contractual rent steps through March 2018 totaling $448,637 (see “Major Tenants” section). |
| (4) | U/W Net Operating Income is greater than 2015 and Annualized 11 11/30/2016 due to HubSpot leasing the three expansion spaces, Put Premise A and Put Premise B. HubSpot had not yet commenced paying rent on those spaces. |
| (5) | The debt service coverage ratios and debt yields are based on The Davenport Whole Loan. |
Appraisal.As of the appraisal valuation date of January 19, 2017, The Davenport Property had an “as-is” appraised value of $204,000,000, which equates to an “as-is” Cut-off Date LTV Ratio of 51.5%. The appraiser also concluded to an “as-stabilized” value of $214,000,000 as of November 1, 2018, which equates to an “as-stabilized” Cut-off Date LTV Ratio of 49.1%. The appraiser also concluded to a dark value of $162,000,000, which equates to a loan to dark value of 64.8%.
Environmental Matters. According to a Phase I environmental site assessment dated January 18, 2017, there was no evidence of any recognized environmental conditions at The Davenport Property.
Market Overview and Competition.The Davenport Property is located in Cambridge, Massachusetts, approximately 1.4 miles northwest of the central business district of Boston one block from the MBTA Lechmere Green Line station and 3.4 miles west of Boston Logan International Airport. The Davenport Property is located within the East Cambridge neighborhood of the Kendall Square area of Boston, which is known for its concentration of life science, pharmaceutical, technology firms and its proximity to the Massachusetts Institute of Technology (“MIT”), which is located approximately 1.0 mile southwest of The Davenport Property. Additional businesses in the Kendall Square area include Google, Biogen Idec, Camp, Dresser, McKee, Whitehead Institute for Biomedical Research, Genzyme, Novartis, Vertex, and the John A. Volpe National Transportation Systems Center.
According to a third-party report, the Boston area is home to 35 colleges and universities, including Harvard and MIT and serves as a hub for life sciences research and technology companies. Cambridge is home to 14 innovative incubators and co-working spaces, including the Cambridge Innovation Center (“CIC”), which was founded in 1999 and has been home to over 3,500 companies. Companies originally founded at CIC have created over $3.9 billion in publicly disclosed exit value since 2001 and have raised approximately $2.7 billion in venture capital and strategic investment since 2001. Additionally, Cambridge-based companies raised approximately $1.0 billion in 21 venture capital placements in 2016. According to a third party market research report, the 2016 estimated population within a one-, three- and five- mile radius of The Davenport Property was 45,036, 455,360 and 977,515. The 2016 estimated average household income within the same radii was $117,803, $98,958 and $92,307.
According to a third party market research report, the most significant impact on commercial real estate, particularly in Boston, comes from shifting demographic preferences like access to collaborative space, live/work/play environments and proximity to urban amenities, which drive corporate site selection. Cambridge has benefited from this as rents continue to grow and availability remains limited. In addition, The Davenport Property is located within the East Cambridge/Kendall Square submarket of the Boston office
THE INFORMATION IN THIS STRUCTURAL AND COLLATERAL TERM SHEET IS NOT COMPLETE AND MAY BE AMENDED PRIOR TO THE TIME OF SALE. THIS TERM SHEET IS NOT AN OFFER TO SELL THESE SECURITIES AND IT IS NOT A SOLICITATION OF AN OFFER TO BUY THESE SECURITIES IN ANY JURISDICTION WHERE THE OFFER OR SALE IS NOT PERMITTED.
| 85 |
THE DAVENPORT
market. As of the fourth quarter of 2016, the class A office submarket reported an inventory of 58 buildings totaling approximately 13.0 million square feet with a 2.9% vacancy rate, an asking rental rate of $78.01 per square foot, gross, and positive absorption of 120,373 square feet.
The appraiser concluded to market rents for The Davenport Property of $71.00 per square foot, gross, for office space on floors 1-4; $48.00 per square foot, gross, for basement office space; and $15.00 per square foot, gross, for storage space. Overall, the appraiser concluded that the in-place rents at The Davenport Property are below market levels, but are expected to increase to market levels by December 2020 due to HubSpot’s contractual rent increases of $1.00 per square foot per year.
The following table presents certain information relating to comparable office leases for The Davenport Property:
Comparable Leases(1)
| Property Name/Location | Year Built/ Renovated | Stories | Total GLA (SF) | Total Occupancy | Distance from Subject | Tenant Name | Lease Date/ Term | Lease Area (SF) | Annual Base Rent PSF | Lease Type |
55 Cambridge Pky Cambridge, MA | 1985/NAP | 9 | 275,968 | 100% | 0.4 miles | Flagship Ventures | October 2016 / 12.0 Years | 20,623 | $73.00 | Gross |
| One Broadway Cambridge, MA | 1969/2000 | 16 | 312,000 | 100% | 0.7 miles | Facebook, Inc. | September 2016 / 5.0 Years | 18,768 | $79.00 | Modified Gross |
55 Cambridge Pky Cambridge, MA | 1985/NAP | 9 | 275,968 | 100% | 0.4 miles | CarGurus | September 2016 / 6.3 Years | 30,534 | $73.00 | Gross |
One Kendall Square Cambridge, MA | 1887/1985 | 3 | 19,821 | 100% | 0.9 miles | Toyota | July 2016 / 7.0 Years | 13,000 | $74.00 | Gross |
Canal Park Cambridge, MA | 1983/2015 | 4 | 101,457 | 100% | 180 feet | HubSpot | April 2016 / 6.8 Years | 8,562 | $69.00 | Modified Gross |
One Memorial Cambridge, MA | 1985/2007 | 17 | 352,905 | 100% | 0.8 miles | Microsoft | February 2016 / 10.5 Years | 156,000 | $67.50 | Net |
Riverfront Office Park Cambridge, MA | 1986/NAP | 14 | 305,589 | 98.2% | 0.6 miles | MIT | June 2015 / 6.0 Years | 45,868 | $69.00 | Gross |
450 Kendall St Cambridge, MA | 2014/NAP | 5 | 64,000 | 100% | 0.6 miles | MPM Capital | January 2015 / 7.0 Years | 14,700 | $59.00 | Net |
| (1) | Information obtained from the appraisal and underwritten rent roll. |
The Borrower.The borrower is Davenport Owner (DE) LLC, a Delaware limited liability company and single purpose entity with one independent director. Legal counsel to the borrower delivered a non-consolidation opinion in connection with the origination of The Davenport Whole Loan.
The Borrower Sponsors.The borrower sponsors are OPG Investment Holdings US Inc. (“OPG”) and Alony-Hetz Properties & Investments Ltd. (“Alony-Hetz”). Alony-Hetz was established in 1989 and is one of Israel’s largest real estate investment holding companies, with assets in Israeli and overseas. Alony-Hetz primarily focuses on real estate with long-term leases and quality tenant rosters. OPG, also known as Oxford Properties Group, is the real estate arm of the Ontario Municipal Employees Retirement System (“OMERS”). OMERS is one of Canada’s largest pension funds with net assets of $85.2 billion as of year-end 2016, representing an $8.1 billion increase over 2015. OPG is a global platform for real estate investment, development and management with over 2,000 employees and over $40 billion of real assets under management, including seven office properties in Boston totaling more than 4.0 million square feet.
Escrows.The loan documents provide for an upfront escrow at closing in the amount of $5,225 for deferred maintenance, $2,030,190 for rent abatements (excluding the Put Premises), $7,938,810 for TI/LC obligations related to HubSpot, and $94,633 for HubSpot’s basement reserve.
The loan documents provide for ongoing monthly escrows of $78,177 for rent abatements related to the Put Premises (subject to a cap of $938,123), $181,108 for HubSpot TI/LCs (subject to a cap of $2,173,299), and $94,633 for HubSpot’s basement reserve (subject to a cap of $1,135,600). The loan documents do not require ongoing monthly escrows for taxes, replacements reserves, and TI/LCs as long as no Cash Trap Event Period (as defined below) has occurred and is continuing, or with regard to insurance premiums, as long as (i) no Cash Trap Event Period (as defined below) has occurred and is continuing, (ii) borrower provides the lender with evidence that The Davenport Property is insured via an acceptable blanket insurance policy and such policy is in full force and effect and (iii) borrower provides the lender with evidence of renewal of the insurance policies and timely proof of payment of insurance premiums. During a Cash Trap Event Period, TI/LC reserves will be capped at $25.00 multiplied by the net rentable area of The Davenport Property.
THE INFORMATION IN THIS STRUCTURAL AND COLLATERAL TERM SHEET IS NOT COMPLETE AND MAY BE AMENDED PRIOR TO THE TIME OF SALE. THIS TERM SHEET IS NOT AN OFFER TO SELL THESE SECURITIES AND IT IS NOT A SOLICITATION OF AN OFFER TO BUY THESE SECURITIES IN ANY JURISDICTION WHERE THE OFFER OR SALE IS NOT PERMITTED.
| 86 |
THE DAVENPORT
Lockbox and Cash Management.The Davenport Whole Loan requires a lender-controlled lockbox account, which is already in place, and that the borrower direct tenants to pay all rents directly into such lockbox account. The loan documents also require that all rents received by the borrower or the property manager be deposited into the lockbox account within one business day of receipt. Prior to the occurrence of a Cash Trap Event Period (as defined below), all excess cash flow is required to be distributed to the borrower. During a Cash Trap Event Period, all rents are required to be swept to a lender-controlled cash management account and excess cash flow is held by lender as additional collateral unless the Cash Trap Event Period is triggered by clause (iii) in the paragraph below, in which event all excess funds will be swept to a subaccount for the payment of potential re-leasing expenses related to the HubSpot space (the “HubSpot Reserve Subaccount”).
A “Cash Trap Event Period” will commence upon the earliest of (i) the occurrence and continuance of an event of default; (ii) the debt service coverage ratio falling below 1.25x for two consecutive quarters; or (iii) the occurrence of a HubSpot Trigger Event (as defined below).
A Cash Trap Event Period will end, with respect to clause (i), upon the cure of such event of default; with respect to clause (ii), upon the debt service coverage ratio being equal to or greater than 1.25x for two consecutive calendar quarters; and with respect to clause (iii), upon the earlier of (a) the date on which the aggregate amount of funds deposited in the HubSpot Reserve Subaccount equals or exceeds the applicable HubSpot Reserve Cap (as defined below); (b) HubSpot’s space is at least 90% occupied by HubSpot and/or one or more satisfactory replacement tenants paying full unabated rent in an amount not less than HubSpot’s weighted average contractual rental rate, and all TI/LCs provided have been paid and accepted; (c) the borrower executes new leases with one or more tenants resulting in The Davenport Property achieving a net cash flow debt yield of 7.2% or more, and all TI/LCs provided have been paid and accepted; or (d) HubSpot is no longer insolvent or subject to any bankruptcy or insolvency proceedings and has affirmed its lease pursuant to final, non-appealable order of a court of competent jurisdiction.
A “HubSpot Trigger Event” will occur upon the earlier of HubSpot (1) failing to renew its lease on or prior to March 1, 2026; (2) failing to occupy at least 67% of its space; or (3) entering into or being subject to bankruptcy or similar insolvency proceedings.
The “HubSpot Reserve Cap” is an amount equal to the product of (a) the net rentable square footage of the HubSpot space and (b) $50.00. With regard to a HubSpot Trigger Event triggered by clause (2) above, the HubSpot Reserve Cap will be reduced proportionately if (I) any of the HubSpot space is re-leased; (II) all tenant obligations have been paid with respect to such re-leased space; and (III) the replacement tenant has unconditionally accepted possession of such re-leased space (“Proportionate HubSpot Reduction”). A Proportionate HubSpot Reduction does not apply to a HubSpot Trigger Event triggered by clauses (1) or (3) above.
Property Management. The Davenport Property is managed by an affiliate of the borrower.
Assumption.The borrower has the two-time right to transfer The Davenport Property provided that certain conditions are satisfied, including (i) no event of default has occurred and is continuing; (ii) the lender reasonably determines that the proposed transferee and guarantor satisfy the lender’s credit review and underwriting standards, taking into consideration the transferee’s experience, financial strength and general business standing; and (iii) if requested by lender, rating agency confirmation that the sale and assumption will not result in a downgrade, withdrawal or qualification of the respective ratings assigned to the Series 2017-BNK4 certificates and similar confirmations from each rating agency rating any securities backed by The Davenport Companion Loan with respect to the ratings of such securities.
Partial Release. Not permitted.
Real Estate Substitution.Not permitted.
Subordinate and Mezzanine Indebtedness.Provided no event of default has occurred and is continuing and upon written notice provided to the lender, the borrower is permitted to incur future mezzanine indebtedness, provided that (a) the mezzanine lender enters into an intercreditor agreement acceptable to the rating agencies and reasonably acceptable to the lender; (b) the mezzanine loan will have a term that is at least coterminous with The Davenport Whole Loan; (c) the combined loan-to-value ratio will not be greater than 51.5%; (d) the debt service coverage ratio of The Davenport Whole Loan and the mezzanine loan will not be less than 1.82x; (e) a rating agency confirmation from Fitch, KBRA and Moody’s that the future mezzanine indebtedness will not result in a downgrade, withdrawal or qualification of the respective ratings assigned to the Series 2017-BNK4 Certificates or similar ratings confirmations from each rating agency rating any securities backed by The Davenport Companion Loan with respect to the ratings of such securities; and (f) any other requirements as stated under the loan documents are met.
Ground Lease. None.
Terrorism Insurance.The loan documents require that the “all risk” insurance policy required to be maintained by the borrower provide coverage for terrorism in an amount equal to the full replacement cost of The Davenport Property (provided the borrower is not required to pay terrorism insurance premiums in excess of two times the premium for all risk and business interruption insurance coverage on a stand-alone basis if the Terrorism Risk Insurance Program Authorization Act is no longer in effect), as well as business interruption insurance covering no less than an amount equal to 100% of the projected gross income from The Davenport Property on an actual loss sustained basis for a period beginning on the date of business interruption and continuing until the restoration of The Davenport Property is completed, or the 18-month period following the occurrence of a casualty event, together with a six-month extended period of indemnity.
Windstorm and Flood Insurance. The loan documents require windstorm and flood insurance covering the full replacement cost of The Davenport Property during the loan term. At the time of loan closing, The Davenport Property had windstorm insurance coverage and flood insurance in the maximum limit available under the National Flood Insurance Program together with excess coverage.
THE INFORMATION IN THIS STRUCTURAL AND COLLATERAL TERM SHEET IS NOT COMPLETE AND MAY BE AMENDED PRIOR TO THE TIME OF SALE. THIS TERM SHEET IS NOT AN OFFER TO SELL THESE SECURITIES AND IT IS NOT A SOLICITATION OF AN OFFER TO BUY THESE SECURITIES IN ANY JURISDICTION WHERE THE OFFER OR SALE IS NOT PERMITTED.
| 87 |
| PLAZA 500 |
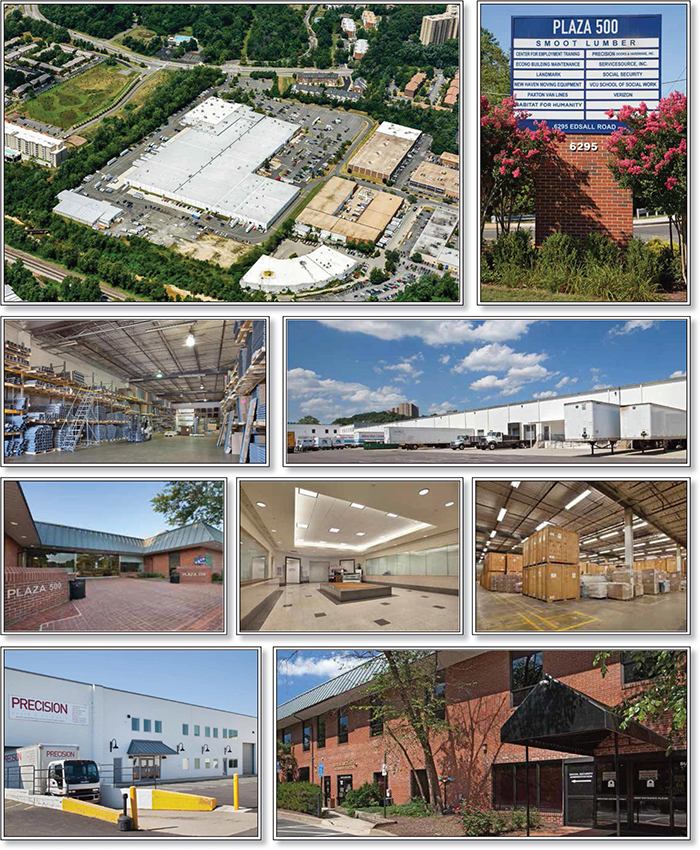
THE INFORMATION IN THIS STRUCTURAL AND COLLATERAL TERM SHEET IS NOT COMPLETE AND MAY BE AMENDED PRIOR TO THE TIME OF SALE. THIS TERM SHEET IS NOT AN OFFER TO SELL THESE SECURITIES AND IT IS NOT A SOLICITATION OF AN OFFER TO BUY THESE SECURITIES IN ANY JURISDICTION WHERE THE OFFER OR SALE IS NOT PERMITTED.
| 88 |
| PLAZA 500 |
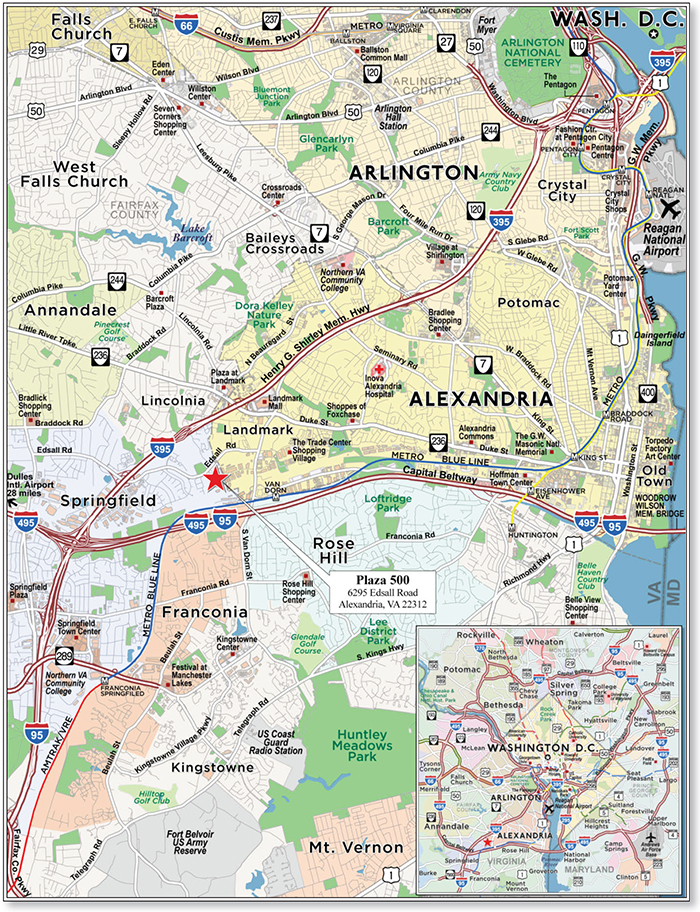
THE INFORMATION IN THIS STRUCTURAL AND COLLATERAL TERM SHEET IS NOT COMPLETE AND MAY BE AMENDED PRIOR TO THE TIME OF SALE. THIS TERM SHEET IS NOT AN OFFER TO SELL THESE SECURITIES AND IT IS NOT A SOLICITATION OF AN OFFER TO BUY THESE SECURITIES IN ANY JURISDICTION WHERE THE OFFER OR SALE IS NOT PERMITTED.
| 89 |
| No. 7 – Plaza 500 | ||||||||
| Loan Information | Property Information | |||||||
| Mortgage Loan Seller: | Bank of America, N.A. | Single Asset/Portfolio: | Single Asset | |||||
| Credit Assessment (Fitch/KBRA/Moody’s): | NR/NR/NR | Property Type: | Industrial | |||||
| Original Principal Balance: | $48,750,000 | Specific Property Type: | Flex | |||||
| Cut-off Date Balance: | $48,750,000 | Location: | Alexandria, VA | |||||
| % of Initial Pool Balance: | 4.8% | Size: | 502,807 SF | |||||
| Loan Purpose: | Acquisition | Cut-off Date Balance Per SF: | $96.96 | |||||
| Borrower Name: | MFVI PLAZA 500, LLC | Year Built/Renovated: | 1973/1989 | |||||
| Sponsor: | Mark Matan | Title Vesting: | Fee | |||||
| Mortgage Rate: | 4.565% | Property Manager: | Self-managed | |||||
| Note Date: | February 17, 2017 | 4thMost Recent Occupancy (As of): | 96.6% (12/31/2013) | |||||
| Anticipated Repayment Date: | NAP | 3rdMost Recent Occupancy (As of): | 95.9% (12/31/2014) | |||||
| Maturity Date: | March 1, 2027 | 2ndMost Recent Occupancy (As of): | 86.7% (12/31/2015) | |||||
| IO Period: | 120 months | Most Recent Occupancy (As of): | 90.5% (12/31/2016) | |||||
| Loan Term (Original): | 120 months | Current Occupancy (As of): | 86.4% (2/15/2017) | |||||
| Seasoning: | 1 month | |||||||
| Amortization Term (Original): | NAP | Underwriting and Financial Information: | ||||||
| Loan Amortization Type: | Interest-only, Balloon | |||||||
| Interest Accrual Method: | Actual/360 | 4thMost Recent NOI (As of): | $4,925,925 (12/31/2013) | |||||
| Call Protection: | L(25),D(91),O(4) | 3rdMost Recent NOI (As of): | $5,257,488 (12/31/2014) | |||||
| Lockbox Type: | Hard/Springing Cash Management | 2ndMost Recent NOI (As of): | $4,915,419 (12/31/2015) | |||||
| Additional Debt: | None | Most Recent NOI (As of): | $4,908,893 (12/31/2016) | |||||
| Additional Debt Type: | NAP | |||||||
| U/W Revenues: | $6,098,427 | |||||||
| U/W Expenses: | $1,850,979 | |||||||
| U/W NOI: | $4,247,448 | |||||||
| Escrows and Reserves(1): | U/W NCF: | $4,048,918 | ||||||
| Type: | Initial | Monthly | Cap (If Any) | U/W NOI DSCR: | 1.88x | |||
| Taxes | $195,000 | $65,000 | NAP | U/W NCF DSCR: | 1.79x | |||
| Insurance | $1,250 | $625 | NAP | U/W NOI Debt Yield: | 8.7% | |||
| Deferred Maintenance | $24,688 | $0 | NAP | U/W NCF Debt Yield: | 8.3% | |||
| Replacement Reserves | $250,000 | $6,285 | NAP | As-Is Appraised Value: | $75,000,000 | |||
| TI/LC Reserve | $250,000 | $8,380 | NAP | As-Is Appraisal Valuation Date: | January 26, 2017 | |||
| Landlord Obligation Reserve | $728,579 | $0 | NAP | Cut-off Date LTV Ratio: | 65.0% | |||
| Free Rent Reserve | $226,086 | $0 | NAP | LTV Ratio at Maturity or ARD: | 65.0% | |||
| (1) | See “Escrows” section. |
The Mortgage Loan.The mortgage loan (the “Plaza 500 Mortgage Loan”) is evidenced by a promissory note secured by a first lien mortgage encumbering an industrial property located in Alexandria, Virginia (the “Plaza 500 Property”). The Plaza 500 Mortgage Loan was originated on February 17, 2017 by Bank of America, N.A, had an original principal balance of $48,750,000, has an outstanding principal balance as of the Cut-off Date of $48,750,000 and accrues interest at an interest rate of 4.565%per annum. The Plaza 500 Mortgage Loan had an initial term of 120 months, has a remaining term of 119 months as of the Cut-off Date and requires interest-only payments through the loan term. The Plaza 500 Mortgage Loan matures on March 1, 2027.
Following the lockout period, the borrower has the right to defease the Plaza 500 Mortgage Loan in whole, but not in part, on any date before December 1, 2026. The Plaza 500 Mortgage Loan is prepayable without penalty on or after December 1, 2026.
Sources and Uses
| Sources | Uses | |||||||
| Original loan amount | $48,750,000 | 62.3% | Purchase price | $75,000,000 | 95.8% | |||
| Borrower equity | 29,510,743 | 37.7 | Reserves | 1,675,602 | 2.1 | |||
| Closing costs | 1,585,141 | 2.0 | ||||||
| Total Sources | $78,260,743 | 100.0% | Total Uses | $78,260,743 | 100.0% |
THE INFORMATION IN THIS STRUCTURAL AND COLLATERAL TERM SHEET IS NOT COMPLETE AND MAY BE AMENDED PRIOR TO THE TIME OF SALE. THIS TERM SHEET IS NOT AN OFFER TO SELL THESE SECURITIES AND IT IS NOT A SOLICITATION OF AN OFFER TO BUY THESE SECURITIES IN ANY JURISDICTION WHERE THE OFFER OR SALE IS NOT PERMITTED.
| 90 |
| PLAZA 500 |
The Property.The Plaza 500 Property consists of the fee interests in two single-story industrial/flex buildings totaling 502,807 square feet located in Alexandria, Virginia, approximately 15 miles south of downtown Washington, D.C. The Plaza 500 Property was built in 1973, renovated in 1989 and is currently utilized 65.4% as warehouse and 34.6% as office. The warehouse component is served by 46 grade level overhead doors and 10 dock high overhead doors with clear heights of 18’ - 22’ feet. There are 1,115 surface parking spaces (approximately 2.2 spaces per 1,000 square feet).
As of February 15, 2017, the Plaza 500 Property was 86.4% leased by five industrial and nine flex/office tenants. 41.4% of the NRA has been in occupancy for 10 years and longer. There are four credit-rated tenants at the Plaza 500 Property including GSA- Social Security Administration, GSA- Federal Bureau of Investigation, Commonwealth of Virginia and Verizon Virginia, Inc., representing 20.7% of the underwritten base rent.
The following table presents certain information relating to the tenancy at the Plaza 500 Property:
Major Tenants
| Tenant Name | Credit Rating (Fitch/Moody’s/S&P) | Tenant NRSF | % of NRSF | Annual U/W Base Rent PSF | Annual U/W Base Rent | % of Total Annual U/W Base Rent | Lease Expiration Date | |
Warehouse Tenants | ||||||||
| Stock Building Supply | NR/NR/NR | 135,338 | 26.9% | $10.12 | $1,369,621 | 27.6% | 2/29/2024 | |
| Paxton Van Lines, Inc.(1) | NR/NR/NR | 143,440 | 28.5% | $6.44 | $923,123 | 18.6% | 8/31/2023(2) | |
| Precision Doors & Hardware | NR/NR/NR | 36,658 | 7.3% | $10.25 | $375,745 | 7.6% | 2/29/2024 | |
| GSA- Social Security Administration | AAA/Aaa/AAA | 13,202 | 2.6% | $32.01 | $422,596 | 8.5% | 4/24/2018 | |
| Total Warehouse Tenants | 328,638 | 65.4% | $9.41 | $3,091,084 | 62.2% | |||
| Major Flex/Office Tenants | ||||||||
| Service Source, Inc.(3) | NR/NR/NR | 27,603 | 5.5% | $14.69 | $405,580 | 8.2% | 5/31/2020(4) | |
| The New Haven Company | NR/NR/NR | 16,618 | 3.3% | $9.81 | $163,010 | 3.3% | 4/30/2020 | |
| GSA- Federal Bureau of Investigation | AAA/Aaa/AAA | 15,762 | 3.1% | $21.27 | $335,258 | 6.7% | 6/30/2022(5) | |
| Center For Employment Training | NR/NR/NR | 14,800 | 2.9% | $21.19 | $313,568 | 6.3% | 8/31/2021 | |
| Landmark Education | NR/NR/NR | 13,402 | 2.7% | $23.88 | $319,978 | 6.4% | 10/31/2022 | |
| Total Major Flex/Office Tenants | 88,185 | 17.5% | $17.43 | $1,537,394 | 30.9% | |||
| Non-Major Flex/Office Tenants | 17,359 | 3.5% | $19.65 | $341,121 | 6.9% | |||
| Total Flex/Office Tenants | 105,544 | 21.0% | $17.80 | $1,878,515 | 37.8% | |||
| Occupied Total | 434,182 | 86.4% | $11.45 | $4,969,599 | 100.0% | |||
| Vacant Space | 68,625 | 13.6% | ||||||
| Collateral Total | 502,807 | 100.0% | ||||||
| (1) | Paxton Van Lines, Inc. is entitled to a six month partial rent abatement (for its expansion space) beginning April 1, 2017 equal to $37,681 per month. |
| (2) | Paxton Van Lines, Inc. has a termination right relating to its expansion space (36,127 square feet) should the U.S. Government in the calendar year 2019 cancel its contract with the tenant for the work being performed in its expansion space (36,127 square feet) upon 6 months’ notice no later than December 31, 2019 and payment of unamortized tenant improvements and leasing commissions. |
| (3) | Service Source, Inc. occupies 14,480 square feet of flex space under a lease expiring May 31, 2020 which requires base rent of $9.02 PSF and occupies 13,123 square feet of office space under a lease expiring July 31, 2020 which requires base rent of $20.95 PSF. |
| (4) | Service Source, Inc. has a termination right in the event that the government (Medicaid and Fairfax County) cancels its contract with the tenant upon providing 90 days’ written notice and a termination fee equal to unamortized costs. The tenant also has a termination right on 13,123 square feet of its space on July 31, 2018 and July 31, 2019 upon 9 months’ written notice and payment of unamortized costs and a termination right on 14,480 square feet of its space on May 31, 2018 and May 31, 2019 upon 9 months’ written notice and payment of unamortized broker fees and tenant improvements. |
| (5) | GSA- Federal Bureau of Investigation has a termination right after June 30, 2019 upon 120 days’ notice. |
THE INFORMATION IN THIS STRUCTURAL AND COLLATERAL TERM SHEET IS NOT COMPLETE AND MAY BE AMENDED PRIOR TO THE TIME OF SALE. THIS TERM SHEET IS NOT AN OFFER TO SELL THESE SECURITIES AND IT IS NOT A SOLICITATION OF AN OFFER TO BUY THESE SECURITIES IN ANY JURISDICTION WHERE THE OFFER OR SALE IS NOT PERMITTED.
| 91 |
| PLAZA 500 |
The following table presents certain information relating to the lease rollover schedule at the Plaza 500 Property:
Lease Expiration Schedule(1)(2)
| Year Ending December 31, | No. of Leases Expiring | Expiring NRSF | % of Total NRSF | Cumulative Expiring NRSF | Cumulative % of Total NRSF | Annual U/W Base Rent | % of Total Annual U/W Base Rent | Annual U/W Base Rent PSF(3) |
| MTM | 0 | 0 | 0.0% | 0 | 0.0% | $0 | 0.0% | $0.00 |
| 2017 | 2 | 1,536 | 0.3% | 1,536 | 0.3% | $43,131 | 0.9% | $28.08 |
| 2018 | 1 | 13,202 | 2.6% | 14,738 | 2.9% | $422,596 | 8.5% | $32.01 |
| 2019 | 0 | 0 | 0.0% | 14,738 | 2.9% | $0 | 0.0% | $0.00 |
| 2020 | 4 | 47,103 | 9.4% | 61,841 | 12.3% | $610,682 | 12.3% | $12.96 |
| 2021 | 1 | 14,800 | 2.9% | 76,641 | 15.2% | $313,568 | 6.3% | $21.19 |
| 2022 | 5 | 42,105 | 8.4% | 118,746 | 23.6% | $911,133 | 18.3% | $21.64 |
| 2023 | 2 | 143,440 | 28.5% | 262,186 | 52.1% | $923,123 | 18.6% | $6.44 |
| 2024 | 2 | 171,996 | 34.2% | 434,182 | 86.4% | $1,745,365 | 35.1% | $10.15 |
| 2025 | 0 | 0 | 0.0% | 434,182 | 86.4% | $0 | 0.0% | $0.00 |
| 2026 | 0 | 0 | 0.0% | 434,182 | 86.4% | $0 | 0.0% | $0.00 |
| 2027 | 0 | 0 | 0.0% | 434,182 | 86.4% | $0 | 0.0% | $0.00 |
| Thereafter | 0 | 0 | 0.0% | 434,182 | 86.4% | $0 | 0.0% | $0.00 |
| Vacant | 0 | 68,625 | 13.6% | 502,807 | 100.0% | $0 | 0.0% | $0.00 |
| Total/Weighted Average | 17 | 502,807 | 100.0% | $4,969,599 | 100.0% | $11.45 |
| (1) | Information obtained from the underwritten rent roll. |
| (2) | Certain tenants may have lease termination or contraction options that are exercisable prior to the originally stated expiration date of the subject lease and that are not considered in the Lease Expiration Schedule. |
| (3) | Weighted Average Annual U/W Base Rent PSF excludes vacant space. |
The following table presents historical occupancy percentages at the Plaza 500 Property:
Historical Occupancy(1)
12/31/2013 | 12/31/2014 | 12/31/2015 | 12/31/2016 | 2/15/2017 |
| 96.6% | 95.9% | 86.7% | 90.5% | 86.4% |
| (1) | Information obtained from the borrower. |
Operating History and Underwritten Net Cash Flow. The following table presents certain information relating to the historical operating performance and the underwritten net cash flow at the Plaza 500 Property:
Cash Flow Analysis(1)
| 2013 | 2014 | 2015 | 2016 | U/W | % of U/W Effective Gross Income | U/W $ per SF | |
| Base Rent(1) | $6,695,150 | $6,364,653 | $6,228,465 | $6,354,967 | $4,969,599 | 81.5% | $9.88 |
| Grossed Up Vacant Space | 0 | 0 | 0 | 0 | 1,039,091 | 17.0 | 2.07 |
| Total Reimbursables | 1,137,684 | 1,282,277 | 1,243,599 | 1,322,952 | 907,915 | 14.9 | 1.81 |
| Other Income(2) | 24,307 | 20,187 | 39,197 | 42,113 | 220,913 | 3.6 | 0.44 |
| Less Vacancy & Credit Loss | (1,074,914) | (457,989) | (623,183) | (736,652) | (1,039,091) | (17.0) | (15.0%) |
| Effective Gross Income | $6,782,227 | $7,209,128 | $6,888,078 | $6,983,380 | $6,098,427 | 100.0% | $12.13 |
| Total Operating Expenses(3) | 1,856,302 | 1,951,640 | 1,972,659 | 2,074,487 | 1,850,979 | 30.4 | 3.68 |
| Net Operating Income | $4,925,925 | $5,257,488 | $4,915,419 | $4,908,893 | $4,247,448 | 69.6% | $8.45 |
| TI/LC | 0 | 0 | 0 | 0 | 123,109 | 2.0 | 0.24 |
| Capital Expenditures | 0 | 0 | 0 | 0 | 75,421 | 1.2 | 0.15 |
| Net Cash Flow | $4,925,925 | $5,257,488 | $4,915,419 | $4,908,893 | $4,048,918 | 66.4% | $8.05 |
| NOI DSCR | 2.18x | 2.33x | 2.18x | 2.18x | 1.88x | ||
| NCF DSCR | 2.18x | 2.33x | 2.18x | 2.18x | 1.79x | ||
| NOI DY | 10.1% | 10.8% | 10.1% | 10.1% | 8.7% | ||
| NCF DY | 10.1% | 10.8% | 10.1% | 10.1% | 8.3% |
| (1) | U/W Base Rent includes contractual rent steps through February 2018. |
| (2) | Other Income includes lobby kiosk income, parking lease income and yard lease income. |
| (3) | Total Operating Expenses for 2016 include the prior seller’s reclassification of non-continuing expenses and expenses relating to the sale of the property totaling $181,418. |
Appraisal. As of the appraisal valuation date of January 26, 2017, the Plaza 500 Property had an “as-is” appraised value of $75,000,000.
Environmental Matters. According to a Phase I environmental assessment dated February 1, 2017, there was no evidence of any recognized environmental conditions at the Plaza 500 Property.
THE INFORMATION IN THIS STRUCTURAL AND COLLATERAL TERM SHEET IS NOT COMPLETE AND MAY BE AMENDED PRIOR TO THE TIME OF SALE. THIS TERM SHEET IS NOT AN OFFER TO SELL THESE SECURITIES AND IT IS NOT A SOLICITATION OF AN OFFER TO BUY THESE SECURITIES IN ANY JURISDICTION WHERE THE OFFER OR SALE IS NOT PERMITTED.
| 92 |
| PLAZA 500 |
Market Overview and Competition.The Plaza 500 Property is located in the southeast portion of Fairfax County, Virginia, near the I-95/ I-395/ I-495 interchange. Primary employment centers in the area are located in Washington, D.C., Arlington and Fairfax County, all within 15 to 25 miles of the Plaza 500 Property. The area is also home to Quantico Marine Base, which employs 5,500 civilians and 7,000 military personnel and houses over 3,500 family members on base, and to Fort Belvoir, a strategic sustaining base for the U.S. Army hosting two Army major command headquarters, 19 Army agencies, eight elements of the U.S. Army Reserve and Army National Guard and 26 Department of Defense agencies.
Immediately east of the Plaza 500 Property is Eisenhower West, the subject of a Small Area Plan which was adopted by the City of Alexandria in November 2015. This 620-acre planned area will be developed over the next 25 years, and will introduce six distinct neighborhoods, a new grid of streets, planned pedestrian, bike and car pathways, parks, a mixed use area of office/industrial, retail, residential and production/wholesale/repair buildings, and will link to the already established adjacent communities of Cameron Station and Summers Grove.
According to the appraisal, the 2016 estimated population within a one-, three-, and five-mile radius of the Plaza 500 Property was 26,246, 167,728, and 470,239, respectively and the 2016 average household income within the same radii was $96,052, $111,063, and $115,550, respectively.
The Plaza 500 Property is located within the Northern Virginia Industrial Market. As of the fourth quarter of 2016, the Northern Virginia market was comprised of over 73.1 million square feet of industrial space, including approximately 43.6 million square feet of warehouse space and approximately 29.6 million square feet of flex space. For the same period, the overall industrial vacancy rate was 7.5%, with a warehouse vacancy rate of 6.2% and flex vacancy rate of 9.5%. For the same period, warehouse absorption was over 1.1 million square feet and flex absorption was over 308,000 square feet.
According to the appraisal, there are five flex and six warehouse properties, containing 216,240 square feet and 414,008 square feet, respectively, expected to be delivered in 2017, which as of the end of 2016 were 31.3% pre-leased.
The following table presents certain information relating to comparable industrial leases for the Plaza 500 Property:
Comparable Industrial Leases(1)
| Property Name/Location | Year Built | Total GLA (SF) | Total Occupancy | Distance from Subject | Tenant Name | Lease Date/Term | Lease Area (SF) | Annual Base Rent PSF | Lease Type |
Shell Oil Industrial Park Alexandria, VA | 1985 | 41,860 | 100% | 1.7 miles | Barbizon | May-17/5.0 Yrs | 12,600 | $10.75 | NNN |
Gibson Warehouse Alexandria, VA | 1979 | 45,000 | 100% | 1.7 miles | Ferguson Enterprises Inc. | Oct-16/5.0 Yrs | 11,550 | $9.60 | NNN |
Newington Business Park Center Lorton, VA
| 1986 | 256,459 | 83% | 6.8 miles | B&G Stainless Granite Kitchen Audet Construction Premium Auto | Oct-16/5.0 Yrs Sep-16/3.1 Yrs Sep-16/5.0 Yrs Jul-16/5.5 Yrs | 4,461 3,172 1,628 7,181 | $10.00 $10.50 $10.50 $9.87 | NNN NNN NNN NNN |
Springfield Eight Newington, VA
| 1984 | 76,201 | 88% | 6.7 miles | Available (upper office) American Residential Services Builders Floor Service DMV Distributors | Jun-16/5.0 Yrs Aug-14/5.9 Yrs Dec-13/2.9 Yrs Dec-13/4.9 Yrs | 8,966 12,377 2,940 16,777 | $15.00 $10.30 $12.16 $8.22 | NNN NNN NNN NNN |
Springfield South Newington, VA | 1985 | 217,364 | 90% | 6.5 miles | Galaxie Granite Best Price DFH Express | Apr-16/2.0 Yrs Mar-16/5.0 Yrs Jan-16/5.3 Yrs | 4,400 4,413 4,400 | $7.57 $8.97 $8.50 | NNN NNN NNN |
Gunston Commerce Center – Building 4 Lorton, VA | 2004 | 98,568 | 100% | 11.7 miles | Chenega | May-15/3.3 Yrs | 6,000 | $13.00 | NNN |
| (1) | Information obtained from the appraisal. |
THE INFORMATION IN THIS STRUCTURAL AND COLLATERAL TERM SHEET IS NOT COMPLETE AND MAY BE AMENDED PRIOR TO THE TIME OF SALE. THIS TERM SHEET IS NOT AN OFFER TO SELL THESE SECURITIES AND IT IS NOT A SOLICITATION OF AN OFFER TO BUY THESE SECURITIES IN ANY JURISDICTION WHERE THE OFFER OR SALE IS NOT PERMITTED.
| 93 |
| PLAZA 500 |
The following table presents certain information relating to comparable office leases for the Plaza 500 Property:
Comparable Office Leases(1)
| Property Name/Location | Year Built | Distance from Subject | Tenant Name | Lease Date/Term | Lease Area (SF) | Annual Base Rent PSF | TI’s PSF/ Escalations | |||
Beauregard Square Alexandria, VA | 1985 | 3.3 miles | Confidential | Jul-16/5.0 Yrs | 4,083 | $22.00 | $45.00/3.00% | |||
Cherokee Business Center Alexandria, VA | 1986 | 1.5 miles | Goldbelt (Parabus) GINIA Thomas Rutherford | Apr-16/5.0 Yrs May-15/5.0 Yrs Apri-15/5.0 Yrs | 4,086 4,047 11,955 | $22.00 $22.50 $25.50 | $8.00/2.75% $3.84/3.00% $6.30/3.00% | |||
Cherokee Business Center Building B Alexandria, VA | 1985 | 1.5 miles | GINIA Inc Universolutions RJK Enterprises Inc | May-15/3.0 Yrs Apr-15/2.0 Yrs Jan-15/10.0 Yrs | 7,036 1,066 1,933 | $22.50 $21.75 $24.50 | $8.00/3.00% $0.00/3.00% $0.00/3.00% | |||
Cherokee Business Center Building C Alexandria, VA | 1983 | 1.5 miles | TWD & Associates Commonwealth Wall Systems | Apr-16/5.0 Yrs Apr-15/2.0 Yrs | 8,653 1,196 | $22.50 $22.00 | $0.00/2.50% $0.00/3.00% Ann | |||
| (1) | Information obtained from the appraisal. |
The Borrower.The borrower is MFVI PLAZA 500, LLC, a single purpose Delaware limited liability company with two independent directors. Legal counsel to the borrower delivered a non-consolidation opinion in connection with the origination of the Plaza 500 Mortgage Loan. Mark Matan is the guarantor of certain nonrecourse carveouts under the Plaza 500 Mortgage Loan.
The Sponsor.The sponsor is Mark Matan, the managing partner of Matan Companies. Matan Companies was founded over 35 years ago, is headquartered in suburban Maryland and is a commercial real estate services and development firm offering asset management, leasing, development and property management services. Matan Companies has a current portfolio of over five million square feet of office/industrial properties with an additional three million square feet in development, as well as residential developments and a portfolio of multifamily units throughout Maryland, Virginia and North Carolina, primarily along I-270 from Frederick, Maryland down to Washington, D.C./Alexandria, Virginia. The sponsor has been involved in a prior deed in lieu of foreclosure. See “Description of the Mortgage Pool–Loan Purpose; Default History, Bankruptcy Issues and Other Proceedings” in the Preliminary Prospectus.
Escrows.The borrower deposited $195,000 at closing for real estate taxes and is required to deposit on each monthly payment date an amount equal to one-twelfth of the taxes the lender estimates will be payable in the next 12 months (currently $65,000). The borrower deposited $1,250 at closing for insurance premiums and is required to deposit on each monthly payment date an amount equal to one-twelfth of the insurance premiums the lender estimates will be payable in the next 12 months (currently $625);provided that the requirement to deposit insurance premiums will be suspended if the borrower provides satisfactory evidence to the lender that the insurance coverage required by the Plaza 500 Mortgage Loan documents is being provided under acceptable blanket insurance policies.
The borrower has deposited at closing $24,688 for immediate repairs. The borrower has also deposited at closing $250,000 and is required to deposit on each monthly payment date $6,285 to a replacement and leasing costs reserve.
The borrower has deposited at closing $250,000 and is required to deposit on each monthly payment date $8,380 to a TI/LC reserve, which monthly payment will increase to $41,901 during the continuance of a Paxton Trigger Period (as defined below). The borrower has deposited at closing $728,579 for a landlord obligation reserve due specifically in connection with the Stock Building Supply and Precision Doors & Hardware tenants. Additionally, the borrower has deposited at closing $226,086 for free rent associated with the Paxton tenant in connection with the tenant’s recent renewal and expansion, expected to be fully disbursed by September 1, 2017.
A “Paxton Trigger Period” will occur upon the failure of the Paxton tenant to extend or renew its lease on or prior to its extension deadline and will end upon the earliest of (a) nine months thereafter or (b)(i) the Paxton tenant renewing or extending its lease or (ii) the entire Paxton’s leased space being leased to a replacement tenant and such replacement tenant being in occupancy, open to the public for business, and paying the full amount of the rent due under its lease.
Lockbox and Cash Management.The Plaza 500 Mortgage Loan is structured with a lender-controlled lockbox, which is already in place. The Plaza 500 Mortgage Loan documents require the borrower to direct all tenants to pay rent directly into such lockbox account, and also require that all rents received by the borrower or the property manager be deposited into the lockbox account. Prior to the occurrence of a Cash Sweep Period (as defined below), all funds in the lockbox account are distributed to the borrower. During a Cash Sweep Period, all funds in the lockbox account are swept to a lender-controlled cash management account and applied as provided in the loan documents. Also during the continuation of a Cash Sweep Period, all excess cash flow shall be retained and held by lender as additional security for the Plaza 500 Mortgage Loan.
A “Cash Sweep Period” will occur during (a) an event of default; (b) the debt service coverage ratio being less than 1.30x for three consecutive calendar months; or (c) a Stock Trigger Period (as defined below). A Cash Sweep Period will end upon (x) if caused by an event of default, the cure of such event of default; (y) if caused by the debt service coverage ratio being less than 1.30x, the debt service coverage ratio being equal to or greater than 1.35x for three consecutive calendar months; or (z) if caused by a Stock Trigger Period, the expiration of a Stock Trigger Period. Notwithstanding the foregoing, a Cash Sweep Period shall not be deemed to expire in the event that a Cash Sweep Period then exists for any other reason.
THE INFORMATION IN THIS STRUCTURAL AND COLLATERAL TERM SHEET IS NOT COMPLETE AND MAY BE AMENDED PRIOR TO THE TIME OF SALE. THIS TERM SHEET IS NOT AN OFFER TO SELL THESE SECURITIES AND IT IS NOT A SOLICITATION OF AN OFFER TO BUY THESE SECURITIES IN ANY JURISDICTION WHERE THE OFFER OR SALE IS NOT PERMITTED.
| 94 |
| PLAZA 500 |
A “Stock Trigger Period” will occur upon the failure of the Stock Building Supply tenant to extend or renew its lease on or prior to the extension deadline, and will end upon (a) twelve months thereafter or (b)(i) the tenant renewing or extending its lease or (ii) the entire leased space being leased to a replacement tenant in occupancy, open to the public for business, and paying the full amount of rent due under its lease.
Property Management. The Plaza 500 Property is managed by Matan Companies, LLLP, an affiliate of the borrower.
Assumption. The borrower has the right to transfer the Plaza 500 Property provided that certain conditions are satisfied,inter alia (i) no event of default is continuing; (ii) lender has approved of the transferee based on factors including its underwriting and credit requirements, the experience, track record and financial strength of the transferee and its principals; and (iii) if required by lender, lender has received rating agency confirmation.
Partial Release. Not permitted.
Real Estate Substitution.Not permitted.
Subordinate and Mezzanine Indebtedness.Not permitted.
Ground Lease.None.
Terrorism Insurance. The loan documents require that the “all risk” insurance policy required to be maintained by the borrower provides coverage for terrorism in an amount equal to the full replacement cost of the Plaza 500 Property. The loan documents also require business interruption insurance covering no less than the 18-month period following the occurrence of a casualty event, together with a 6-month extended period of indemnity.
THE INFORMATION IN THIS STRUCTURAL AND COLLATERAL TERM SHEET IS NOT COMPLETE AND MAY BE AMENDED PRIOR TO THE TIME OF SALE. THIS TERM SHEET IS NOT AN OFFER TO SELL THESE SECURITIES AND IT IS NOT A SOLICITATION OF AN OFFER TO BUY THESE SECURITIES IN ANY JURISDICTION WHERE THE OFFER OR SALE IS NOT PERMITTED.
| 95 |
U.S. GRANT HOTEL

THE INFORMATION IN THIS STRUCTURAL AND COLLATERAL TERM SHEET IS NOT COMPLETE AND MAY BE AMENDED PRIOR TO THE TIME OF SALE. THIS TERM SHEET IS NOT AN OFFER TO SELL THESE SECURITIES AND IT IS NOT A SOLICITATION OF AN OFFER TO BUY THESE SECURITIES IN ANY JURISDICTION WHERE THE OFFER OR SALE IS NOT PERMITTED.
| 96 |
U.S. GRANT HOTEL
THE INFORMATION IN THIS STRUCTURAL AND COLLATERAL TERM SHEET IS NOT COMPLETE AND MAY BE AMENDED PRIOR TO THE TIME OF SALE. THIS TERM SHEET IS NOT AN OFFER TO SELL THESE SECURITIES AND IT IS NOT A SOLICITATION OF AN OFFER TO BUY THESE SECURITIES IN ANY JURISDICTION WHERE THE OFFER OR SALE IS NOT PERMITTED.
| 97 |
| No. 8 – U.S. Grant Hotel | |||||||
| Loan Information | Property Information | ||||||
| Mortgage Loan Seller: | Bank of America, N.A. | Single Asset/Portfolio: | Single Asset | ||||
| Credit Assessment (Fitch/KBRA/Moody’s): | NR/NR/NR | Property Type: | Hospitality | ||||
| Original Principal Balance: | $47,000,000 | Specific Property Type: | Full Service | ||||
| Cut-off Date Balance: | $47,000,000 | Location: | San Diego, CA | ||||
| % of Initial Pool Balance: | 4.7% | Size: | 270 Rooms | ||||
| Loan Purpose: | Recapitalization | Cut-off Date Balance Per Room: | $174,074 | ||||
| Borrower Name: | US Grant Hotel San Diego, LLC | Year Built/Renovated: | 1910/2017 | ||||
| Sponsor: | Sycuan Tribal Development Corporation | Title Vesting: | Fee | ||||
| Mortgage Rate: | 5.523% | Property Manager: | Starwood Hotels & Resorts Management Company, Inc. | ||||
| Note Date: | February 2, 2017 | 4th Most Recent Occupancy (As of): | 80.4% (12/31/2012) | ||||
| Anticipated Repayment Date: | NAP | 3rd Most Recent Occupancy (As of): | 79.6% (12/31/2013) | ||||
| Maturity Date: | March 1, 2027 | 2nd Most Recent Occupancy (As of): | 78.3% (12/31/2014) | ||||
| IO Period: | 24 months | Most Recent Occupancy (As of): | 81.2% (12/31/2015) | ||||
| Loan Term (Original): | 120 months | Current Occupancy (As of)(3): | 75.7% (12/31/2016) | ||||
| Seasoning: | 1 month | ||||||
| Amortization Term (Original): | 360 months | Underwriting and Financial Information: | |||||
| Loan Amortization Type: | Interest-only, Amortizing Balloon | ||||||
| Interest Accrual Method: | Actual/360 | 4th Most Recent NOI (As of): | $5,745,014 (12/31/2013) | ||||
| Call Protection: | L(25),D(91),O(4) | 3rd Most Recent NOI (As of): | $6,199,614 (12/31/2014) | ||||
| Lockbox Type: | Springing | 2nd Most Recent NOI (As of): | $6,856,431 (12/31/2015) | ||||
| Additional Debt(1): | Yes | Most Recent NOI (As of): | $6,583,253 (12/31/2016) | ||||
| Additional Debt Type(1): | Future Mezzanine | ||||||
| U/W Revenues: | $31,984,779 | ||||||
| U/W Expenses: | $25,391,769 | ||||||
| U/W NOI: | $6,593,010 | ||||||
| U/W NCF: | $5,313,619 | ||||||
| U/W NOI DSCR: | 2.05x | ||||||
| Escrows and Reserves(2): | U/W NCF DSCR: | 1.66x | |||||
| Type: | Initial | Monthly | Cap (If Any) | U/W NOI Debt Yield: | 14.0% | ||
| Taxes | $0 | $80,260 | NAP | U/W NCF Debt Yield: | 11.3% | ||
| Insurance | $244,118 | $30,515 | NAP | As-Is Appraised Value: | $98,100,000 | ||
| FF&E Reserve | $0 | Springing | NAP | As-Is Appraisal Valuation Date: | August 9, 2016 | ||
| Environmental Reserve | $716,250 | $0 | NAP | Cut-off Date LTV Ratio: | 47.9% | ||
| PIP Reserve | $0 | Springing | NAP | LTV Ratio at Maturity or ARD: | 42.0% | ||
| (1) | See “Subordinate and Mezzanine Indebtedness” section. |
| (2) | See “Escrows” section. |
| (3) | Guest room renovations were underway July through December, 2016. Occupancy as shown is based on the U.S. Grant Hotel Property’s total 270 rooms, despite a portion of those rooms being offline during that period. |
The Mortgage Loan. The mortgage loan (the “U.S. Grant Hotel Mortgage Loan”) is evidenced by a single promissory note secured by a first mortgage encumbering the fee interest in a full-service hotel located in San Diego, California (the “U.S. Grant Hotel Property”). The U.S. Grant Hotel Mortgage Loan was originated on February 2, 2017 by Bank of America, N.A. The U.S. Grant Hotel Mortgage Loan had an original principal balance of $47,000,000, has an outstanding principal balance as of the Cut-off Date of $47,000,000 and accrues interest at an interest rate of 5.523%per annum. The U.S. Grant Hotel Mortgage Loan had an initial term of 120 months, has a remaining term of 119 months as of the Cut-off Date and requires interest-only payments for the first 24 payments following origination and, thereafter, requires payments of principal and interest based on a 30-year amortization schedule. The U.S. Grant Hotel Mortgage Loan matures on March 1, 2027.
Following the lockout period, the borrower has the right to defease the U.S. Grant Hotel Mortgage Loan in whole, but not in part, on any date before December 1, 2026. The U.S. Grant Hotel Mortgage Loan is prepayable without penalty on or after December 1, 2026.
THE INFORMATION IN THIS STRUCTURAL AND COLLATERAL TERM SHEET IS NOT COMPLETE AND MAY BE AMENDED PRIOR TO THE TIME OF SALE. THIS TERM SHEET IS NOT AN OFFER TO SELL THESE SECURITIES AND IT IS NOT A SOLICITATION OF AN OFFER TO BUY THESE SECURITIES IN ANY JURISDICTION WHERE THE OFFER OR SALE IS NOT PERMITTED.
| 98 |
U.S. GRANT HOTEL
Sources and Uses
| Sources | Uses | |||||||
| Original loan amount | $47,000,000 | 100.0% | Return of equity(1) | $45,000,932 | 95.7% | |||
| Reserves | 960,368 | 2.0 | ||||||
| Closing costs | 1,038,700 | 2.2 | ||||||
| Total Sources | $47,000,000 | 100.0% | Total Uses | $47,000,000 | 100.0% |
| (1) | The U.S. Grant Hotel Property was previously unencumbered. |
The Property.The U.S. Grant Hotel Property is an eleven-story full-service, AAA Four-Diamond-rated hotel comprised of 270 guestrooms and located in the heart of Downtown San Diego, California. Situated on a 1.4-acre parcel, the iconic U.S. Grant Hotel Property was built with Classic Revival architecture in 1910 by Ulysses S. Grant Jr. in honor of his late father, the 18th President of the United States. Through its history, the U.S. Grant Hotel Property has been host to Albert Einstein, Charles Lindbergh, Woodrow Wilson, and thirteen other U.S. Presidents. When purchased by the sponsor in 2003, the hotel was closed for a $56 million (approximately $207,400 per room) renovation and restoration project and reopened in 2006. The U.S. Grant Hotel Property recently completed in January 2017 a $13.25 million renovation to the guestrooms, guestroom bathrooms, corridors and public areas. The U.S. Grant Hotel Property features a $6.5 million art collection, which includes sculptures, ironwork, murals, paintings, and in all guestrooms, headboards that are each one-of-a-kind pieces of art by French artist, Yves Clement.
The guestroom configuration at the U.S. Grant Hotel Property includes 131 king guestrooms, 69 double/double guestrooms, 9 queen standard guestrooms and 61 suites. The U.S. Grant Hotel Property also contains 21 meeting and event spaces totaling approximately 33,000 square feet, including four ballrooms. Amenities at the U.S. Grant Hotel Property include a cultural center, spa services in-room or in a private Spa Suite, a fitness center with personal training, a business center, coffee station, concierge, airport/local shuttle, valet parking and 24-hour room service. In addition, the U.S. Grant Hotel Property is home to the Grant Grill, a 140-seat, full-service, award winning restaurant that has been operating since 1951, as well as the Grant Grill Lounge. The U.S. Grant Hotel Property contains a total of 275 parking spaces in an adjacent three-story garage, accounting for a parking ratio of 1.0 spaces per room. The demand segmentation for the U.S. Grant Hotel Property is 40% corporate, 35% group and 25% leisure.
There are two ground floor commercial leases in place including a lease to Aventine Art and Antiques for 3,015 square feet through August 2019 and a lease to Banco Santander International for 4,218 square feet through March 2023.
The U.S. Grant Hotel Property is managed by Starwood Hotels & Resorts Management Company, Inc., under the Luxury Collection affiliation, through December 31, 2026 with two five-year extension options.
THE INFORMATION IN THIS STRUCTURAL AND COLLATERAL TERM SHEET IS NOT COMPLETE AND MAY BE AMENDED PRIOR TO THE TIME OF SALE. THIS TERM SHEET IS NOT AN OFFER TO SELL THESE SECURITIES AND IT IS NOT A SOLICITATION OF AN OFFER TO BUY THESE SECURITIES IN ANY JURISDICTION WHERE THE OFFER OR SALE IS NOT PERMITTED.
| 99 |
U.S. GRANT HOTEL
The following table presents certain information relating to the historical operating performance and the underwritten net cash flow at the U.S. Grant Hotel Property:
Cash Flow Analysis
| 2011 | 2012 | 2013 | 2014 | 2015 | 2016 | U/W | % of U/W Total Rev. | U/W $ per Room | |||||||||||
| Occupancy | 80.1% | 80.4% | 79.6% | 78.3% | 81.2% | 80.4% | 80.4% | ||||||||||||
| ADR | $193.34 | $202.28 | $204.58 | $216.83 | $236.40 | $248.72 | $248.72 | ||||||||||||
| RevPAR | $154.90 | $162.53 | $162.78 | $169.82 | $191.96 | $200.00 | $199.99 | ||||||||||||
| Room Revenue | $15,265,332 | $16,060,725 | $16,041,994 | $16,737,022 | $18,916,154 | $18,596,639 | $18,542,643 | 58.0% | $68,676 | ||||||||||
| F&B Revenue(1) | 9,812,882 | 9,894,787 | 10,325,116 | 11,383,237 | 11,033,539 | 10,973,108 | 10,941,247 | 34.2 | 40,523 | ||||||||||
| Phone/Parking Rev(2) | 1,526,096 | 1,746,988 | 1,871,754 | 1,851,513 | 1,681,350 | 1,635,866 | 1,631,116 | 5.1 | 6,041 | ||||||||||
| Other Income(3) | 313,136 | 354,799 | 388,437 | 477,227 | 592,273 | 871,397 | 869,773 | 2.7 | 3,221 | ||||||||||
| Total Revenue | $26,917,446 | $28,057,299 | $28,627,301 | $30,448,999 | $32,223,316 | $32,077,010 | $31,984,779 | 100.0% | $118,462 | ||||||||||
| Total Dept Expenses | 13,357,891 | 13,665,071 | 13,951,892 | 14,606,991 | 14,332,619 | 14,322,865 | 14,149,861 | 44.2 | 52,407 | ||||||||||
| Gross Operating Profit | $13,559,555 | $14,392,228 | $14,675,409 | $15,842,008 | $17,890,697 | $17,754,145 | $17,834,918 | 55.8% | $66,055 | ||||||||||
| Total Undistrib Exp | 7,625,497 | 7,679,760 | 7,746,470 | 8,399,173 | 9,789,997 | 9,864,119 | 9,912,825 | 31.0 | 36,714 | ||||||||||
| Profit Before Fixed Charges | $5,934,058 | $6,712,468 | $6,928,939 | $7,442,835 | $8,100,700 | $7,890,026 | $7,922,093 | 24.8% | $29,341 | ||||||||||
| Total Fixed Charges | 425,866 | 915,221 | 1,183,925 | 1,243,221 | 1,244,269 | 1,306,773 | 1,329,083 | 4.2 | 4,923 | ||||||||||
| Net Operating Income | $5,508,192 | $5,797,247 | $5,745,014 | $6,199,614 | $6,856,431 | $6,583,253 | $6,593,010 | 20.6% | $24,419 | ||||||||||
| FF&E | 1,076,698 | 1,122,292 | 1,145,092 | 1,217,960 | 1,288,933 | 1,283,080 | 1,279,391 | 4.0 | 4,738 | ||||||||||
| Net Cash Flow | $4,431,494 | $4,674,955 | $4,599,922 | $4,981,654 | $5,567,498 | $5,300,173 | $5,313,619 | 16.6% | $19,680 | ||||||||||
| NOI DSCR | 1.72x | 1.81x | 1.79x | 1.93x | 2.14x | 2.05x | 2.05x | ||||||||||||
| NCF DSCR | 1.38x | 1.46x | 1.43x | 1.55x | 1.73x | 1.65x | 1.66x | ||||||||||||
| NOI DY | 11.7% | 12.3% | 12.2% | 13.2% | 14.6% | 14.0% | 14.0% | ||||||||||||
| NCF DY | 9.4% | 9.9% | 9.8% | 10.6% | 11.8% | 11.3% | 11.3% | ||||||||||||
| (1) | As a part of the recent renovation, meeting spaces were offline beginning in July 2016, resulting in F&B revenue decrease June through August, 2016. |
| (2) | Parking Rev includes self-parking and valet. The parking is managed by Ace Parking III, LLC under a 36-month agreement expiring on December 31, 2018, under which agreement the U.S. Grant Hotel Property receives an annual guaranteed base fee of $410,000 plus 60.0% of gross parking revenues above $1,020,000. |
| (3) | Other Income includes retail lease rental income, attrition and cancellation penalties, commissions, package breakage fees, guest dry cleaning and laundry, gift shop revenue, and other miscellaneous income. |
Appraisal.As of the appraisal valuation date of August 9, 2016, the U.S. Grant Hotel Property had an “as-is” appraised value of $98,100,000.
Environmental Matters. According to a Phase I environmental assessment dated August 9, 2016, an Operations and Maintenance Program was recommended to be implemented to manage the suspected asbestos containing materials located at the U.S. Grant Hotel Property, and a limited subsurface investigation was recommended due to the historical drycleaner use on the U.S. Grant Hotel Property. A Phase II subsurface assessment report and vapor intrusion risk assessment dated January 4, 2017 recommended vapor intrusion mitigation which has been estimated to cost a maximum total of $573,000, 125% of which amount has been reserved by the lender.
As additional protection, environmental insurance has been bound with Zurich with a policy limit of $3,000,000 per occurrence with a $50,000 self-insured retention through February 2, 2029.
Market Overview and Competition.The U.S. Grant Hotel Property is located in the heart of Downtown San Diego, in the historic Gaslamp Quarter which features an array of dining, shopping, nightlife and entertainment venues. The U.S. Grant Hotel Property is located within a mile of Petco Park and the San Diego Convention Center, within two miles of the San Diego Zoo, Little Italy and Seaport Village, within three and a half miles of the San Diego International Airport, and is proximate to the San Diego Cruise Ships terminal, Santa Fe Depot Train Station, as well as the I-5 Freeway.
THE INFORMATION IN THIS STRUCTURAL AND COLLATERAL TERM SHEET IS NOT COMPLETE AND MAY BE AMENDED PRIOR TO THE TIME OF SALE. THIS TERM SHEET IS NOT AN OFFER TO SELL THESE SECURITIES AND IT IS NOT A SOLICITATION OF AN OFFER TO BUY THESE SECURITIES IN ANY JURISDICTION WHERE THE OFFER OR SALE IS NOT PERMITTED.
| 100 |
U.S. GRANT HOTEL
San Diego is the second largest city in California and the eighth largest in the United States, and it is also the county seat of San Diego County. The largest employer in the San Diego region is the federal government, with 16 major military bases. Due to the area’s military presence, San Diego is also headquarters to major national defense contractors. The annual economic impact of defense spending to the region is $20.6 billion. San Diego County contains the campuses of six universities as well as several privately funded colleges and universities. One of the area’s largest employers, University of California, San Diego (UCSD), enrolls approximately 30,000 students and receives over $1.0 billion in total research funding. Health care is another major component of the San Diego economic base with Scripps Health and Sharp HealthCare being the two largest healthcare employers in the market. Additionally, the local economy benefits from San Diego’s active port, which houses three cruise ship terminals, two marine cargo facilities, and three major shipyards. Due to its warm climate, coastal location, and strong medical industry, San Diego remains a popular destination for meeting and convention planners. The U.S. Grant Hotel Property is within one mile of the San Diego Convention Center, which contains 615,701 square feet of exhibit space and 204,114 square feet of meeting space. In 2013, the San Diego Convention Center generated a $1.3 billion of regional economic impact, with $560.0 million in direct convention attendee spending. Lastly, San Diego’s tourism draws include its numerous beaches and beach towns, including Mission Beach, Pacific Beach, and La Jolla, several professional sports teams, family attractions, including SeaWorld, LEGOLAND and the San Diego Zoo, public and private golf courses and tournaments including Torrey Pines Golf Course, and the entertainment and retail areas of Old Town and the Gaslamp Quarter.
As of 2016, the estimated population within a one-, three- and five-mile radius of the U.S. Grant Hotel Property was 43,542, 179,146 and 474,764, respectively, representing a growth rate from 2010 of 16.9%, 6.8% and 5.5%, respectively. The average household income within the same radii was $83,442, $82,264 and $74,163, respectively.
The appraiser identified one new hotel that is expected to be primarily competitive to the U.S. Grant Hotel Property but with a higher average daily room rate (over $300); The Pendry Hotel, which opened in February 2017, is a 317-room luxury hotel located approximately six blocks southeast of the U.S. Grant Hotel Property.
The following table presents certain information relating to the U.S. Grant Hotel Property’s competitive sets:
Subject and Market Historical Occupancy, ADR and RevPAR(1)
| Competitive Set | U.S. Grant Hotel Property | Penetration Factor | |||||||||||||||||
| Year | Occupancy | ADR | RevPAR | Occupancy | ADR | RevPAR | Occupancy | ADR | RevPAR | ||||||||||
| 12/31/2016 | 79.4% | $214.11 | $169.93 | 75.7% | $248.72 | $188.19 | 95.3% | 116.2% | 110.7% | ||||||||||
| 12/31/2015 | 83.6% | $214.24 | $179.14 | 81.2% | $236.40 | $191.94 | 97.1% | 110.3% | 107.1% | ||||||||||
| 12/31/2014 | 83.7% | $197.79 | $165.58 | 78.3% | $216.83 | $169.83 | 93.6% | 109.6% | 102.6% | ||||||||||
| 12/31/2013 | 81.4% | $186.15 | $151.60 | 79.6% | $204.58 | $162.78 | 97.7% | 109.9% | 107.4% | ||||||||||
| 12/31/2012 | 82.4% | $182.12 | $150.13 | 80.3% | $202.28 | $162.53 | 97.5% | 111.1% | 108.3% | ||||||||||
| 12/31/2011 | 80.5% | $176.01 | $141.63 | 80.1% | $193.34 | $154.90 | 99.6% | 109.8% | 109.4% | ||||||||||
| 12/31/2010 | 77.0% | $168.87 | $130.05 | 75.4% | $187.83 | $141.56 | 97.9% | 111.2% | 108.8% | ||||||||||
| 12/31/2009 | 72.8% | $178.46 | $129.91 | 59.6% | $194.50 | $115.85 | 81.8% | 109.0% | 89.2% | ||||||||||
| (1) | Information obtained from a third party hospitality research report. The transient 2016 competitive set includes Renaissance San Diego Downtown Hotel, Kimpton Hotel Solamar, Andaz San Diego, Hard Rock Hotel San Diego, Kimpton Hotel Palomar San Diego and Hotel Indigo San Diego Gaslamp Quarter. |
The Borrower.The borrower is US Grant Hotel San Diego, LLC, a Delaware limited liability company with one independent director. Legal counsel to the borrower delivered a non-consolidation opinion in connection with the origination of the U.S. Grant Hotel Mortgage Loan. Sycuan Tribal Development Corporation is the guarantor of certain nonrecourse carveouts under the U.S. Grant Hotel Mortgage Loan.
The Sponsor.The sponsor is Sycuan Tribal Development Corporation, a corporation chartered under the Sycuan Band of the Kumeyaay Nation, which is based in El Cajon, California. The Kumeyaay Indians are one of four Native American tribes that are indigenous to San Diego County. The sponsor’s real estate portfolio includes the Sycuan Smoke Shop and the leased fee interests in the Hotel Solamar San Diego and Marina Gateway Plaza San Diego.
The sponsor is required by the U.S. Grant Hotel Mortgage Loan documents to maintain a minimum net worth of $23,500,000 and a minimum liquidity of $2,000,000.
The borrower has expressly waived its sovereign immunity pursuant to its operating agreement. The borrower and sponsor have expressly waived their sovereign immunity and Tribal court jurisdiction pursuant to the U.S. Grant Hotel Mortgage Loan documents, which will apply to lender’s successors and assigns. The sponsor has represented that the U.S. Grant Hotel Property is not and shall not be Indian trust land or otherwise restricted land subject to any federal or Tribal laws. The sponsor has also represented that no consent, approval, authorization or order of, or declaration or filing with, or the obtaining of any license, or permission for any federal governmental authority, including specifically (but without limitation) the United States Secretary of the Interior, is required. Additionally, legal counsel to the borrower and the Attorney General of the Sycuan Band of the Kumeyaay Nation have each delivered a sovereign immunity opinion addressing the foregoing waivers of Tribal sovereign immunity and Tribal court jurisdiction in connection with the origination of the U.S. Grant Hotel Mortgage Loan.
Escrows.The borrower is required to deposit monthly 1/12th the estimated real estate taxes (currently $80,260). The borrower deposited at loan closing $244,118 for insurance premiums and is required to deposit monthly 1/12th the estimated insurance premiums (unless the U.S. Grant Hotel Property is covered by a blanket policy) (currently $30,515).
THE INFORMATION IN THIS STRUCTURAL AND COLLATERAL TERM SHEET IS NOT COMPLETE AND MAY BE AMENDED PRIOR TO THE TIME OF SALE. THIS TERM SHEET IS NOT AN OFFER TO SELL THESE SECURITIES AND IT IS NOT A SOLICITATION OF AN OFFER TO BUY THESE SECURITIES IN ANY JURISDICTION WHERE THE OFFER OR SALE IS NOT PERMITTED.
| 101 |
U.S. GRANT HOTEL
The borrower deposited at closing $716,250 in an environmental remediation reserve (representing 125% of the estimated maximum total cost to remediate the environmental issue), which amount may be released upon final completion of the required vapor intrusion remediation.
The operating agreement requires an annual reserve equal to 4.0% of operating income for funding routine capital improvements. If the operator’s funds for such replacements are insufficient, lender may require the borrower to deposit 4.0% of operating income monthly to an FF&E reserve.
Upon a the occurrence of a Cash Sweep Period (as defined below) triggered by an Operating Agreement Trigger Event (as defined below), all amounts remaining in the cash management account after taxes and insurance, debt service and operating expenses have been applied, will be deposited to a PIP Reserve.
Lockbox and Cash Management.The U.S. Grant Hotel Mortgage Loan requires that the borrower establish a lender-controlled lockbox account upon the occurrence of a Cash Sweep Period whereby all rents shall be deposited into such lockbox account and further swept on each business day to a lender-controlled cash management account. Additionally during a Cash Sweep Period, all excess cash will be held by lender as additional security for the U.S. Grant Hotel Mortgage Loan.
A “Cash Sweep Period” will commence upon (i) the occurrence and continuance of an event of default; (ii) the debt service coverage ratio falling below 1.25x tested quarterly; (iii) the occurrence and continuance of an Operator Trigger Event; or (iv) the occurrence and continuance of an Operating Agreement Trigger Event.
A Cash Sweep Period will end with respect to clause (i), upon the cure of such event of default (provided that no other Cash Sweep Period has occurred and is continuing); with respect to clause (ii), upon the debt service coverage ratio being equal to or greater than 1.25x for two consecutive calendar quarters; with respect to clause (iii), upon a replacement operating agreement being entered into by borrower and a qualified operator; with respect to clause (iv), upon either (x) the operating agreement being renewed and/or extended three years beyond the maturity date of the U.S. Grant Hotel Mortgage Loan or (y) a replacement operating agreement being entered into by borrower and a qualified operator.
An “Operator Trigger Event” will commence upon (a) Starwood Hotels & Resorts Management Company, Inc. (“Operator”) becoming bankrupt or insolvent, (b) Operator defaulting beyond all applicable notice and cure periods under any operator agreement, or (c) Operator engaging in gross negligence, fraud, willful misconduct or misappropriation of funds.
An “Operating Agreement Trigger Event” will commence upon the operating agreement between borrower and Operator not having been renewed or replaced upon the earlier of (i) December 31, 2025 (twelve months prior to the current expiration date of the operating agreement), or (ii) March 1, 2026 if the operating agreement has not been extended at least three years past the maturity date of the U.S. Grant Hotel Mortgage Loan.
Property Management.The U.S. Grant Hotel Property is managed under an operating agreement by Starwood Hotels & Resorts Management Company, Inc. through December 31, 2026, with two five-year extension options.
Assumption.Following six months from the closing date of the U.S. Grant Hotel Mortgage Loan, the borrower has a right to transfer the U.S. Grant Hotel Propertyprovided that certain conditions are satisfied, including (i) no event of default has occurred and is continuing; (ii) the lender reasonably determines that the proposed transferee satisfies the lender’s credit review and underwriting standards, taking into consideration transferee experience, financial strength and general business standing; and (iii) if required by lender, lender has received confirmation from Fitch, KBRA and Moody’s that such assumption will not result in a downgrade, withdrawal or qualification of the respective ratings assigned to the Series 2017-BNK4 certificates.
Partial Release.Not permitted.
Real Estate Substitution.Not permitted.
Subordinate and Mezzanine Indebtedness.On or after March 1, 2018, the holders of the direct or indirect ownership interests of the borrower may obtain a mezzanine loan from a qualified institutional lenderprovided that certain conditions are satisfied, including (i) no event of default shall exist; (ii) borrower shall have obtained rating agency confirmation; (iii) the debt yield based on the combined amount of the outstanding balance of the U.S. Grant Hotel Mortgage Loan plus the mezzanine loan shall be at least 12.25%; (iv) the debt service coverage ratio based on the combined amount of the outstanding balance of the U.S. Grant Hotel Mortgage Loan plus the mezzanine loan shall be at least 1.80x; and (v) the loan to value ratio based on the combined amount of the outstanding balance of the U.S. Grant Hotel Mortgage Loan plus the mezzanine loan over the then current appraised value shall not exceed 47.9%.
Terrorism Insurance.The loan documents require that the “all risk” insurance policy required to be maintained by the borrower provide coverage for terrorism in an amount equal to the full replacement cost of the U.S. Grant Hotel Property. The loan documents also require business interruption insurance covering no less than the 24-month period following the occurrence of a casualty event, together with a 12-month extended period of indemnity.
THE INFORMATION IN THIS STRUCTURAL AND COLLATERAL TERM SHEET IS NOT COMPLETE AND MAY BE AMENDED PRIOR TO THE TIME OF SALE. THIS TERM SHEET IS NOT AN OFFER TO SELL THESE SECURITIES AND IT IS NOT A SOLICITATION OF AN OFFER TO BUY THESE SECURITIES IN ANY JURISDICTION WHERE THE OFFER OR SALE IS NOT PERMITTED.
| 102 |
(THIS PAGE INTENTIONALLY LEFT BLANK)
| 103 |
MERRILL LYNCH DRIVE |

THE INFORMATION IN THIS STRUCTURAL AND COLLATERAL TERM SHEET IS NOT COMPLETE AND MAY BE AMENDED PRIOR TO THE TIME OF SALE. THIS TERM SHEET IS NOT AN OFFER TO SELL THESE SECURITIES AND IT IS NOT A SOLICITATION OF AN OFFER TO BUY THESE SECURITIES IN ANY JURISDICTION WHERE THE OFFER OR SALE IS NOT PERMITTED.
| 104 |
MERRILL LYNCH DRIVE |
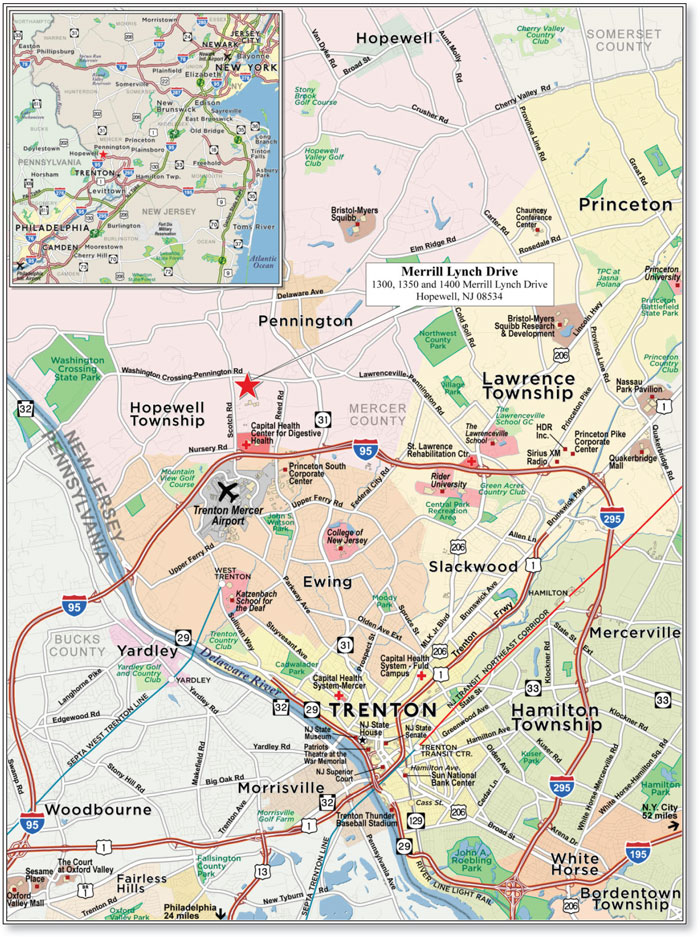
THE INFORMATION IN THIS STRUCTURAL AND COLLATERAL TERM SHEET IS NOT COMPLETE AND MAY BE AMENDED PRIOR TO THE TIME OF SALE. THIS TERM SHEET IS NOT AN OFFER TO SELL THESE SECURITIES AND IT IS NOT A SOLICITATION OF AN OFFER TO BUY THESE SECURITIES IN ANY JURISDICTION WHERE THE OFFER OR SALE IS NOT PERMITTED.
| 105 |
MERRILL LYNCH DRIVE |
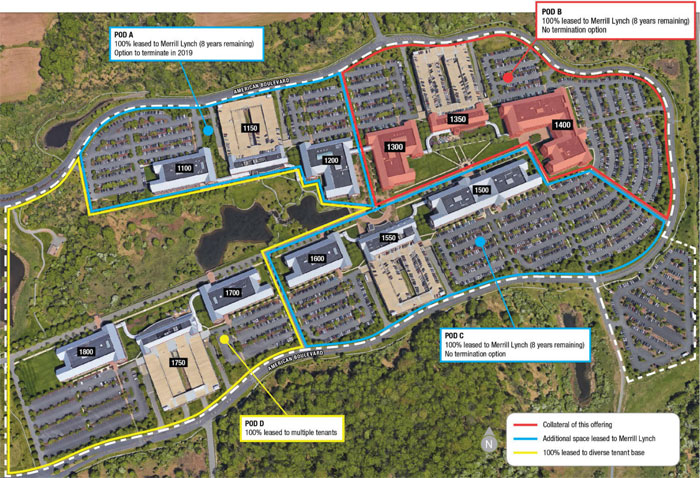
THE INFORMATION IN THIS STRUCTURAL AND COLLATERAL TERM SHEET IS NOT COMPLETE AND MAY BE AMENDED PRIOR TO THE TIME OF SALE. THIS TERM SHEET IS NOT AN OFFER TO SELL THESE SECURITIES AND IT IS NOT A SOLICITATION OF AN OFFER TO BUY THESE SECURITIES IN ANY JURISDICTION WHERE THE OFFER OR SALE IS NOT PERMITTED.
| 106 |
| No. 9 – Merrill Lynch Drive | ||||||||
| Loan Information | Property Information | |||||||
| Mortgage Loan Seller: | Morgan Stanley Mortgage Capital Holdings LLC | Single Asset/Portfolio: | Single Asset | |||||
| Credit Assessment (Fitch/KBRA/Moody’s): | NR/NR/NR | Property Type: | Office | |||||
| Original Principal Balance(1): | $41,440,000 | Specific Property Type: | Suburban | |||||
| Cut-off Date Balance(1): | $41,440,000 | Location: | Hopewell, NJ | |||||
| % of Initial Pool Balance: | 4.1% | Size: | 553,841 SF | |||||
| Loan Purpose: | Acquisition | Cut-off Date Balance Per SF(1): | $187.06 | |||||
| Borrower Name: | CCI-Hopewell VI LLC | Year Built/Renovated: | 2001/NAP | |||||
| Borrower Sponsors: | Capital Commercial Investments, Inc.; Atalaya Capital Management LP | Title Vesting: | Fee | |||||
| Mortgage Rate(2): | 3.930% | Property Manager: | NREM Hopewell Manager, LLC | |||||
| Note Date: | January 31, 2017 | 4thMost Recent Occupancy (As of): | 100.0% (12/31/2013) | |||||
| Anticipated Repayment Date(2): | February 6, 2022 | 3rdMost Recent Occupancy (As of): | 100.0% (12/31/2014) | |||||
| Maturity Date: | February 6, 2025 | 2ndMost Recent Occupancy (As of): | 100.0% (12/31/2015) | |||||
| IO Period: | 60 months | Most Recent Occupancy (As of): | 100.0% (12/31/2016) | |||||
| Loan Term (Original): | 60 months | Current Occupancy (As of): | 100.0% (4/1/2017) | |||||
| Seasoning: | 2 months | |||||||
| Amortization Term (Original): | NAP | Underwriting and Financial Information: | ||||||
| Loan Amortization Type(2): | Interest-only, ARD | |||||||
| Interest Accrual Method: | Actual/360 | 4thMost Recent NOI (As of)(3): | NAV | |||||
| Call Protection: | GRTR 0.5% or YM(56),O(4) | 3rdMost Recent NOI (As of)(3): | NAV | |||||
| Lockbox Type: | Hard/Upfront Cash Management | 2ndMost Recent NOI (As of)(3): | NAV | |||||
| Additional Debt(1): | Yes | Most Recent NOI (As of)(3): | NAV | |||||
| Additional Debt Type(1): | Pari Passu | |||||||
| U/W Revenues: | $12,496,038 | |||||||
| U/W Expenses: | $249,921 | |||||||
| U/W NOI: | $12,246,117 | |||||||
| U/W NCF: | $12,163,041 | |||||||
| U/W NOI DSCR(1): | 2.97x | |||||||
| Escrows and Reserves: | U/W NCF DSCR(1): | 2.95x | ||||||
| U/W NOI Debt Yield(1): | 11.8% | |||||||
| Type: | Initial | Monthly | Cap (If Any) | U/W NCF Debt Yield(1): | 11.7% | |||
| Taxes | $737,682 | $122,947 | NAP | As-Is Appraised Value(4): | $153,000,000 | |||
| Insurance | $124,482 | $10,374 | NAP | As-Is Appraisal Valuation Date: | January 3, 2017 | |||
| Replacement Reserves | $0 | $6,923 | NAP | Cut-off Date LTV Ratio(1): | 67.7% | |||
| TI/LC Reserve | $0 | $0 | NAP | LTV Ratio at Maturity or ARD(1)(5): | 67.7% | |||
| Deferred Maintenance | $18,113 | $0 | NAP | |||||
| (1) | The Merrill Lynch Drive Whole Loan (as defined below), which had an original principal balance of $103,600,000, is comprised of threepari passu notes (Notes A-1, A-2 and A-3). The non-controlling Note A-3 had an original principal balance of $41,440,000, has an outstanding principal balance of $41,440,000 as of the Cut-off Date and will be contributed to the BANK 2017-BNK4 trust. All statistical information related to balances per square foot, loan-to-value ratios, debt service coverage ratios and debt yields are based on the Merrill Lynch Drive Whole Loan. |
| (2) | The Merrill Lynch Drive Whole Loan is structured with an anticipated repayment date of February 6, 2022 (the “ARD”). If the Merrill Lynch Drive Whole Loan is not repaid on or before the ARD, then the Merrill Lynch Drive Whole Loan will accrue interest at a per annum rate equal to the higher of (i) the initial interest rate of 3.930% (the “Initial Interest Rate”) plus 3.000% and (ii) the Treasury Rate (as defined below) plus 3.000% (such higher rate, the “Adjusted Interest Rate”); however, interest accrued at the excess of the Adjusted Interest Rate over the Initial Interest Rate (“Accrued Interest”) will be deferred. In addition, from and after the ARD, all excess cash flow from the Merrill Lynch Drive Property after the payment of reserves, interest calculated at the Initial Interest Rate and operating expenses (“Excess Cash Flow”) will be applied (a) first, to repay the outstanding principal balance of the Merrill Lynch Drive Whole Loan until paid in full and (b) second, to the payment of Accrued Interest. The final maturity date of the Merrill Lynch Drive Whole Loan is February 6, 2025. The “Treasury Rate” means the yield calculated by the linear interpolation of the yields, as reported in Federal Reserve Statistical Release H.15 Selected Interest Rates (or if no longer published, a comparable publication selected by the lender) under the heading U.S. Government Securities/Treasury Constant Maturities for the week ending prior to the ARD, of U.S. Treasury constant maturities with maturity dates (one longer and one shorter) most nearly approximating the ARD. |
| (3) | The Merrill Lynch Drive Property is leased to a single tenant pursuant to a triple-net lease; the single tenant is responsible for the payment of property expenses and, as such, historical financial information is not presented. |
| (4) | The appraisal also concluded a “hypothetical-go-dark” value of $93.2 million (approximately $168 per square foot) as of January 3, 2017. |
| (5) | LTV Ratio at Maturity or ARD is calculated as of the ARD. |
THE INFORMATION IN THIS STRUCTURAL AND COLLATERAL TERM SHEET IS NOT COMPLETE AND MAY BE AMENDED PRIOR TO THE TIME OF SALE. THIS TERM SHEET IS NOT AN OFFER TO SELL THESE SECURITIES AND IT IS NOT A SOLICITATION OF AN OFFER TO BUY THESE SECURITIES IN ANY JURISDICTION WHERE THE OFFER OR SALE IS NOT PERMITTED.
| 107 |
MERRILL LYNCH DRIVE |
The Mortgage Loan.The mortgage loan (the “Merrill Lynch Drive Mortgage Loan”) is a part of a whole loan (the “Merrill Lynch Drive Whole Loan”) that is evidenced by threepari passu promissory notes (Notes A-1, A-2 and A-3) secured by a first mortgage encumbering three class A office buildings totaling 553,841 square feet located at 1300, 1350 and 1400 Merrill Lynch Drive in Hopewell, New Jersey (the “Merrill Lynch Drive Property”). The Merrill Lynch Drive Whole Loan was co-originated on January 31, 2017 by Morgan Stanley Bank, N.A. and Barclays Bank PLC. The Merrill Lynch Drive Whole Loan had an original principal balance of $103,600,000, has an outstanding principal balance as of the Cut-off Date of $103,600,000 and accrues interest at an interest rate of 3.930% per annum. The Merrill Lynch Drive Whole Loan had an initial term of 60 months, has a remaining term of 58 months as of the Cut-off Date and requires payments of interest-only through the anticipated repayment date (“ARD”). The ARD is February 6, 2022 and the final maturity date is February 6, 2025.
The Merrill Lynch Drive Mortgage Loan is evidenced by the non-controlling Note A-3, which will be contributed to the BANK 2017-BNK4 securitization trust, had an original principal balance of $41,440,000 and has an outstanding principal balance of $41,440,000 as of the Cut-off Date. The controlling Note A-1, which had an original principal balance of $41,500,000, was contributed to the BBCMS 2017-C1 securitization trust. The non-controlling Note A-2 (and, together with the controlling Note A-1, the “Merrill Lynch Drive Pari Passu Companion Loans”), which had an original principal balance of $20,660,000, is expected to be contributed to the WFCM 2017-RB1 securitization trust. See “Description of the Mortgage Pool—The Whole Loans—The Non-Serviced Whole Loans” in the Preliminary Prospectus.
Pari Passu Note Summary
| Original Balance | Note Holder | Controlling Piece | |
| Note A-1 | $41,500,000 | BBCMS 2017-C1 | Yes |
| Note A-2 | $20,660,000 | WFCM 2017-RB1 | No |
| Note A-3 | $41,440,000 | BANK 2017-BNK4 | No |
| Total | $103,600,000 |
In the event the Merrill Lynch Drive Whole Loan is not repaid in full on or before the ARD, the interest rate will increase to a rate equal to the Adjusted Interest Rate. On and after the ARD, all funds in the excess cash flow reserve account and all Excess Cash Flow thereafter will be applied (a) first, to repay the outstanding principal balance of the Merrill Lynch Drive Whole Loan until paid in full and (b) second, to the payment of Accrued Interest. See “Description of the Mortgage Pool—Certain Terms of the Mortgage Loans—ARD Loans”.
The borrower has the right at any time to prepay the Merrill Lynch Drive Whole Loan in whole, but not in part, on any date provided that the borrower pays interest to the next payment date, and, if such prepayment is prior to the payment date in November 2021 (the “Open Date”) the borrower pays a prepayment premium equal to the greater of (i) 0.5% of the principal amount prepaid and (ii) a yield maintenance premium. In addition, the Merrill Lynch Drive Whole Loan is prepayable without penalty on and after the Open Date.
Sources and Uses
| Sources | Uses | |||||||
| Original whole loan amount | $103,600,000 | 67.3% | Purchase price | $148,000,000 | 96.1% | |||
Sponsor equity Other sources(1) | 48,309,153 | 31.4 | Closing costs | 5,152,327 | 3.3 | |||
| 2,123,450 | 1.4 | Reserves | 880,276 | 0.6 | ||||
| Total Sources | $154,032,603 | 100.0% | Total Uses | $154,032,603 | 100.0% |
| (1) | Other Sources reflects credits to the purchaser for pre-paid rents and pre-paid expense reimbursements collected by the seller from the tenant prior to the origination date of the Merrill Lynch Drive Whole Loan in respect of rents and expenses reimbursements due after the origination date of the Merrill Lynch Drive Whole Loan. |
The Property.The Merrill Lynch Drive Property consists of three Class A office buildings totaling 553,841 square feet within a larger 12-building, approximately 1.8 million square foot office campus (the “Hopewell Campus”) located in Hopewell, New Jersey, approximately 30 miles northeast of Philadelphia and 50 miles southwest of New York City. The Hopewell Campus was constructed in 2001 on a built-to-suit basis for Merrill Lynch Pierce Fenner & Smith Incorporated (“Merrill Lynch”) (S&P: A+; Fitch: A+). The Hopewell Campus is home to Merrill Lynch’s Global Wealth Management division including the executive team as well as technology support, credit card processing and the 24/7 Merrill Edge call center, one of the only two in the United States. The 12 LEED® certified buildings comprising the Hopewell Campus were designed to function and operate as four separate, three-building “pods” each of which includes a dedicated parking garage and surface lot. Common amenities at the Hopewell Campus include a 30,500 square foot day care center, an indoor basketball court, a drop-off dry cleaning service and a hair salon. Pedestrian walkways provide access throughout the Hopewell Campus, connecting to a central plaza which features a landscaped garden with ponds and a waterfall, artwork and outdoor dining areas. Access to the common amenities, pedestrian walkways and public spaces is provided for under perpetual non-exclusive easement agreements. In December 2012, Merrill Lynch completed a sale-leaseback transaction for the Hopewell Campus and simultaneously executed separate leases for each of the four pods. The four pods were each subsequently sold in separate transactions. As of the Cut-off Date, Merrill Lynch was the sole tenant in nine buildings at the Hopewell Campus, representing three of the four pods (one of which is collateral for the Merrill Lynch Drive Whole Loan); Merrill Lynch vacated one of the pods in December 2014 and ownership subsequently leased the buildings to four separate tenants. According to the borrower sponsor, approximately 6,200 Merrill Lynch employees currently work on site at the Hopewell Campus.
THE INFORMATION IN THIS STRUCTURAL AND COLLATERAL TERM SHEET IS NOT COMPLETE AND MAY BE AMENDED PRIOR TO THE TIME OF SALE. THIS TERM SHEET IS NOT AN OFFER TO SELL THESE SECURITIES AND IT IS NOT A SOLICITATION OF AN OFFER TO BUY THESE SECURITIES IN ANY JURISDICTION WHERE THE OFFER OR SALE IS NOT PERMITTED.
| 108 |
MERRILL LYNCH DRIVE |
As of April 1, 2017, the Merrill Lynch Drive Property was 100.0% leased to Merrill Lynch on a triple-net basis through November 30, 2024 with three remaining, five-year renewal options and no termination rights. The base rent for each renewal option period is 95% of the fair market rental value of the Merrill Lynch Drive Property as of the commencement of the applicable extension term. The Merrill Lynch Drive Property consists of three buildings, 1300 Merrill Lynch Drive (the “1300 Building”), 1350 Merrill Lynch Drive (the “1350 Building”) and 1400 Merrill Lynch Drive (the “1400 Building”). The three-story 1300 Building consists of 167,715 square feet of office space which, according to the borrower sponsor, is utilized to provide technical and operational support to Merrill Lynch’s Global Wealth Management division. The four-story 1400 Building consists of 327,278 square feet which, according to the borrower sponsor, is utilized by financial advisors in the Merrill Edge and Global Wealth Management divisions and also includes the 24/7 Merrill Edge call center. The two-story, 58,848-square foot 1350 Building features a cafeteria and meeting/conference room space, and connects to a dedicated 2,469-space parking area with 953 garage spaces and 1,516 surface spaces (parking ratio of approximately 4.46 spaces per 1,000 square feet of net rentable area).
The borrower may, without lender consent, (i) enter into any extensions or renewals of the existing Merrill Lynch lease pursuant to options expressly contained therein which operate automatically or at the sole option or request of the tenant as to which the borrower has no discretion and (ii) amend the Merrill Lynch lease to provide access to additional parking spaces in connection with any reciprocal easement agreement or other similar document that the borrower may enter into.
Merrill Lynch is the wealth management, brokerage, and investment banking subsidiary of the Bank of America Corporation (“BofA”) (NYSE: BAC; Moody’s: Baa1; S&P: BBB+; Fitch: A). BofA operates through five business segments: Consumer & Business Banking, Consumer Real Estate Services, Global Wealth & Investment Management, Global Banking, Global Markets and Legal Assets & Servicing. Merrill Lynch is part of BofA’s Global Wealth & Investment Management segment, where it operates as Merrill Lynch Global Wealth Management. Merrill Lynch Global Wealth Management’s network of financial advisors focus on serving clients with over $250,000 in investable assets by offering a full set of investment management, brokerage, banking and retirement products.
As of December 31, 2016, client balances held by Merrill Lynch Global Wealth Management totaled approximately $2.1 trillion.
The following table presents certain information relating to the tenancy at the Merrill Lynch Drive Property:
Tenant Summary(1)
| Tenant Name | Credit Rating (Fitch/Moody’s/ S&P)(2) | Tenant NRSF | % of NRSF | Annual U/W Base Rent PSF(3)(4) | Annual U/W Base Rent(3) | % of Total Annual U/W Base Rent | Lease Expiration Date |
| Merrill Lynch | A+/NR/A+ | 553,841 | 100.0% | $23.75 | $13,153,724 | 100.0% | 11/30/2024 |
| Occupied Collateral Total | 553,841 | 100.0% | $23.75 | $13,153,724 | 100.0% | ||
| Vacant Space | 0 | 0.0% | |||||
| Collateral Total | 553,841 | 100.0% | |||||
| (1) | Based on the underwritten rent roll. |
| (2) | Ratings provided are for the entity listed in the tenant field. |
| (3) | Annual U/W Base Rent includes $969,222 of straight-line average rent escalations through the term of the lease. In place base rent as of April 1, 2017 is $22.00 per square foot. |
| (4) | Merrill Lynch has asserted that it overpaid operating expense reimbursements to the seller of the Merrill Lynch Drive Property. At loan closing, $5,000,000 was escrowed with respect to such dispute pursuant to an escrow holdback agreement among the seller, borrower and title company. If an audit determines that such alleged overcharge has occurred, Merrill Lynch has the right to treat the $5,000,000 escrowed amount as a rent abatement and the borrower is required under the Merrill Lynch Drive Whole Loan to cause the amount of the abated rent to be transferred from such escrow to a rent abatement reserve under the Merrill Lynch Drive Whole Loan. See “Description of the Mortgage Pool—Mortgage Pool Characteristics—Property Types—Office Properties” in the Preliminary Prospectus. |
THE INFORMATION IN THIS STRUCTURAL AND COLLATERAL TERM SHEET IS NOT COMPLETE AND MAY BE AMENDED PRIOR TO THE TIME OF SALE. THIS TERM SHEET IS NOT AN OFFER TO SELL THESE SECURITIES AND IT IS NOT A SOLICITATION OF AN OFFER TO BUY THESE SECURITIES IN ANY JURISDICTION WHERE THE OFFER OR SALE IS NOT PERMITTED.
| 109 |
MERRILL LYNCH DRIVE
Lease Expiration Schedule(1)
| Year Ending December 31, | No. of Leases Expiring | Expiring NRSF | % of Total NRSF | Cumulative Expiring NRSF | Cumulative % of Total NRSF | Annual U/W Base Rent(2) | % of Total Annual U/W Base Rent | Annual U/W Base Rent PSF(2) |
| MTM | 0 | 0 | 0.0% | 0 | 0.0% | $0 | 0.0% | $0.00 |
| 2017 | 0 | 0 | 0.0% | 0 | 0.0% | $0 | 0.0% | 0.00 |
| 2018 | 0 | 0 | 0.0% | 0 | 0.0% | $0 | 0.0% | 0.00 |
| 2019 | 0 | 0 | 0.0% | 0 | 0.0% | $0 | 0.0% | 0.00 |
| 2020 | 0 | 0 | 0.0% | 0 | 0.0% | $0 | 0.0% | 0.00 |
| 2021 | 0 | 0 | 0.0% | 0 | 0.0% | $0 | 0.0% | 0.00 |
| 2022 | 0 | 0 | 0.0% | 0 | 0.0% | $0 | 0.0% | 0.00 |
| 2023 | 0 | 0 | 0.0% | 0 | 0.0% | $0 | 0.0% | 0.00 |
| 2024 | 1 | 553,841 | 100.0% | 553,841 | 100.0% | $13,153,724 | 100.0% | $23.75 |
| 2025 | 0 | 0 | 0.0% | 553,841 | 100.0% | $0 | 0.0% | 0.00 |
| 2026 | 0 | 0 | 0.0% | 553,841 | 100.0% | $0 | 0.0% | 0.00 |
| 2027 | 0 | 0 | 0.0% | 553,841 | 100.0% | $0 | 0.0% | 0.00 |
| Thereafter | 0 | 0 | 0.0% | 553,841 | 100.0% | $0 | 0.0% | 0.00 |
| Vacant | 0 | 0 | 0.0% | 553,841 | 100.0% | $0 | 0.0% | 0.00 |
| Total/Weighted Average | 1 | 553,841 | 100.0% | $13,153,724 | 100.0% | $23.75 |
| (1) | Information obtained from the underwritten rent roll. |
| (2) | Annual U/W Base Rent includes straight-line average rent through the lease term totaling $969,222. |
The following table presents historical occupancy percentages at the Merrill Lynch Drive Property:
Historical Occupancy(1)
12/31/2013 | 12/31/2014 | 12/31/2015 | 12/31/2016 | 4/1/2017 | ||||
| 100.0% | 100.0% | 100.0% | 100.0% | 100.0% |
| (1) | Information obtained from the borrower. |
THE INFORMATION IN THIS STRUCTURAL AND COLLATERAL TERM SHEET IS NOT COMPLETE AND MAY BE AMENDED PRIOR TO THE TIME OF SALE. THIS TERM SHEET IS NOT AN OFFER TO SELL THESE SECURITIES AND IT IS NOT A SOLICITATION OF AN OFFER TO BUY THESE SECURITIES IN ANY JURISDICTION WHERE THE OFFER OR SALE IS NOT PERMITTED.
| 110 |
MERRILL LYNCH DRIVE
Underwritten Net Cash Flow. The following table presents certain information relating to the underwritten net cash flow at the Merrill Lynch Drive Property:
Cash Flow Analysis(1)
| U/W | % of U/W Effective Gross Income | U/W $ per SF | |||||
| Base Rent(2)(3) | $13,153,724 | 105.3% | $23.75 | ||||
| Total Reimbursables | 0 | 0.0 | 0.00 | ||||
| Less Vacancy & Credit Loss(4) | (657,686) | (5.3) | (1.19) | ||||
| Effective Gross Income | $12,496,038 | 100.0% | $22.56 | ||||
| Total Operating Expenses(5) | 249,921 | 2.0 | 0.45 | ||||
| Net Operating Income | $12,246,117 | 98.0% | $22.11 | ||||
| TI/LC | 0 | 0.0 | 0.00 | ||||
| Capital Expenditures | 83,076 | 0.7 | 0.15 | ||||
| Net Cash Flow | $12,163,041 | 97.3% | $21.96 | ||||
| NOI DSCR(6) | 2.97x | ||||||
| NCF DSCR(6) | 2.95x | ||||||
| NOI DY(6) | 11.8% | ||||||
| NCF DY(6) | 11.7% |
| (1) | The Merrill Lynch Drive Property is leased to a single tenant pursuant to a triple-net lease; the single tenant is responsible for the payment of property expenses and, as such, historical financial information is not presented. |
| (2) | Base Rent includes straight-line average rent through the lease term totaling $969,222. |
| (3) | Merrill Lynch has asserted that it overpaid operating expense reimbursements to the seller of the Merrill Lynch Drive Property. At loan closing, $5,000,000 was escrowed with respect to such dispute pursuant to an escrow holdback agreement among the seller, borrower and title company. If an audit determines that such alleged overcharge has occurred, Merrill Lynch has the right to treat the $5,000,000 escrowed amount as a rent abatement and the borrower is required under the Merrill Lynch Drive Whole Loan to cause the amount of the abated rent to be transferred from such escrow to a rent abatement reserve under the Merrill Lynch Drive Whole Loan. See “Description of the Mortgage Pool—Mortgage Pool Characteristics—Property Types—Office Properties” in the Preliminary Prospectus. |
| (4) | The underwritten economic vacancy is 5.0%. The Merrill Lynch Drive Property is currently 100.0% leased through November 2024. |
| (5) | The Merrill Lynch Drive Property is leased to Merrill Lynch pursuant to a triple-net lease; the single tenant, Merrill Lynch is responsible for the payment of property expenses and as such U/W Total Operating Expenses is comprised solely of a 2.0% management fee. |
| (6) | The debt service coverage ratios and debt yields are based on the Merrill Lynch Drive Whole Loan. |
Appraisal.As of the appraisal valuation date of January 3, 2017, the Merrill Lynch Drive Property had an “as-is” appraised value of $153,000,000. In addition, the appraisal for the Merrill Lynch Property set forth a “hypothetical-go-dark” appraised value of $93,200,000 as of January 3, 2017.
Environmental Matters. According to a Phase I environmental site assessment dated December 30, 2016, there was no evidence of any recognized environmental conditions at the Merrill Lynch Drive Property.
Market Overview and Competition.The Merrill Lynch Drive Property is located in Hopewell, New Jersey, in northwest Mercer County, approximately 30 miles northeast of Philadelphia, Pennsylvania and approximately 50 miles southwest of New York City. The Merrill Lynch Drive Property is approximately 8 miles southwest of Princeton University and approximately one mile north of the Trenton Mercer Airport. The Merrill Lynch Drive Property has access to the south by Interstate 95 and Route 1 is to the east, which provides access to the New Jersey Turnpike and the Garden State Parkway. According to the appraisal, the estimated 2015 population within a three-, five- and ten-mile radius of the Merrill Lynch Drive Property was 31,406, 96,829, and 444,396, respectively. According to the appraisal, the estimated 2015 average household income within a three- five- and ten-mile radius of the Merrill Lynch Drive Property was $140,207, $114,230 and $105,514, respectively.
According to the appraisal, the Merrill Lynch Drive Property is located within the Princeton submarket of the Central New Jersey office market. As of the third quarter of 2016, the Central New Jersey office market vacancy rate and average asking gross lease rate were 17.7% and $24.85 per square foot, respectively. The Princeton office submarket vacancy rate and average asking gross lease rate were 16.0% and $27.48 per square foot, respectively, for the same time period. The appraisal identified eleven leases within nine competitive office buildings built between 1980 and 2001 and ranging in size from approximately 28,269 to 563,289 square feet. The average rental rate for the eleven leases ranged from $17.50 to $28.00 per square foot on net lease equivalent basis. The appraisal concluded a market rent of $21.00 per square foot for the Merrill Lynch Drive Property.
THE INFORMATION IN THIS STRUCTURAL AND COLLATERAL TERM SHEET IS NOT COMPLETE AND MAY BE AMENDED PRIOR TO THE TIME OF SALE. THIS TERM SHEET IS NOT AN OFFER TO SELL THESE SECURITIES AND IT IS NOT A SOLICITATION OF AN OFFER TO BUY THESE SECURITIES IN ANY JURISDICTION WHERE THE OFFER OR SALE IS NOT PERMITTED.
| 111 |
MERRILL LYNCH DRIVE
The following table presents certain information relating to comparable office leases to the Merrill Lynch Drive Property:
Comparable Leases(1)
| Property Name/Location | Year Built | Total GLA (SF) | Tenant Name | Lease Area (SF) | Lease Date/Term | Base Rent PSF | Lease Structure | TI’s PSF | Annual Escal. |
| Merrill Lynch – Hopewell Campus 1700 Merrill Lynch Drive Hopewell Twp, NJ | 2001 | 122,163 | Horizon Blue Cross | 122,163 | Jan-17/17.5 Yrs | $30.10 | MG | $60.00 | 1.65% annually |
| Merrill Lynch – Hopewell Campus 1800 Merrill Lynch Drive Hopewell Twp, NJ | 2001 | 119,329 | Jansessen Research & Development LLC Cenlar FSB Pershing LLC | 39,681 28,269 44,042 | Sep-16/5.3 Yrs Apr-16/5.3 Yrs Nov-16/15.0 Yrs | $31.00 $31.00 $29.50 | MG MG MG | $25.00 $20.00 $45.00 | $0.50 $0.50 $0.50 |
| Carnegie Center 506 Carnegie Center, Princeton NJ | 1991 | 197,000 | Withum, Smith & Brown | 36,500 | Dec-15/10.0 Yrs | $38.00 | MG | $58.00 | $0.50 psf |
| Carnegie Center 202 Carnegie Center, West Windsor, NJ | 1988 | 47,000 | inVentiv Health | 47,000 | Mar-15/10.0 Yrs | $34.00 | MG | $35.00 | Yes |
| 100 College Road West 100 College Road West Plainsboro, NJ | 2000 | 154,101 | Sandoz, Inc. | 150,376 | Mar-14/12.0 Yrs | $25.54 | Net | $70.00 | $0.54 psf |
| 107 College Road East 107 College Road East, Plainsboro, NJ | 1980 | 80,000 | Dr. Reddy’s Laboratories | 80,000 | Apr-13/11.0 Yrs | $23.50 | Net | $25.00 | None |
| 10 Sylvan Way 10 Sylvan Way, Parsippany, NJ | 1984 | 125,735 | Zoetis Services | 125,735 | Oct-16/12.2 Yrs | $22.00 | Net | $0.00 | 2.0% |
| 2 Giralda Farms, 2 Giralda, Farms, Madison, NJ | 2000 | 147,419 | Merck & Company, Inc. | 147,419 | Apr-14/11.0 Yrs | $21.50 | Net | $40.00 | $0.50 psf |
| 800 Scudders Mill Road 800 Scudders Mill Road, Plainsboro, NJ | 1985 | 563,289 | Novo Nordisk, Inc. | 563,289 | May-13/15.0 Yrs | $28.00 | Net | Turnkey | 2.0% |
| (1) | Information obtained from the appraisal. |
The Borrower.The borrower is CCI-Hopewell VI LLC, a single purpose Delaware limited liability company with two independent directors. Legal counsel to the borrower delivered a non-consolidation opinion in connection with the origination of the Merrill Lynch Drive Whole Loan. Paul D. Agarwal is the guarantor of certain nonrecourse carveouts under the Merrill Lynch Drive Whole Loan.
The Borrower Sponsor.The sponsor is a joint venture between Capital Commercial Investments, Inc. (“CCI”) and Atalaya Capital Management LP (“Atalaya”). Paul D. Agarwal, the nonrecourse carve-out guarantor under the Merrill Lynch Drive Whole Loan, founded CCI in 1992 and serves as president of the company. CCI is a commercial real estate investment firm based in Austin, Texas focused on investment in class A/B office and industrial properties in the United States. As of the third quarter of 2016, CCI and its partners owned and managed a real estate portfolio totaling 4.8 million square feet. Atalaya is a privately-held, SEC-registered, alternative investment advisory firm focused on making credit and special situations investments, primarily via three principal strategies, corporate, real estate and specialty finance. Founded in 2006 and headquartered in New York City, Atalaya has a client base predominantly comprised of institutional investors including endowments, foundations, family offices, and public and corporate pension plans.
Escrows.The loan documents provide for upfront reserves in the amount of $737,682 for real estate taxes, $124,482 for property insurance premiums and $18,113 for required repairs. The loan documents provide for ongoing monthly reserves in the amount equal to one-twelfth of the estimated annual real estate taxes due (initially estimated at $122,947), ongoing monthly reserves in the amount equal to one-twelfth of the estimated annual insurance premiums due (initially estimated at $10,374) and ongoing replacement reserves in the amount of $6,923 (approximately $0.15 per square foot annually). Monthly deposits for insurance premiums are waived if the Merrill Lynch Drive Property is covered by an acceptable blanket insurance policy.
The requirement for the borrower to deposit monthly escrows into the tenant improvements and leasing commissions reserve is waived so long as no Tenant Trigger Period (as defined below) is continuing. During the continuance of a Tenant Ratings Trigger Period, all excess cash flow after payment of debt service, required reserves and operating expenses is required to be swept into the tenant improvements and leasing commissions reserve, subject to the TI/LC Reserve Cap (as defined below). During any other Tenant Trigger Period, all such excess cash flow is required to be swept into an excess cash flow account; however such account may be used for tenant improvements and leasing commissions as described below.
THE INFORMATION IN THIS STRUCTURAL AND COLLATERAL TERM SHEET IS NOT COMPLETE AND MAY BE AMENDED PRIOR TO THE TIME OF SALE. THIS TERM SHEET IS NOT AN OFFER TO SELL THESE SECURITIES AND IT IS NOT A SOLICITATION OF AN OFFER TO BUY THESE SECURITIES IN ANY JURISDICTION WHERE THE OFFER OR SALE IS NOT PERMITTED.
| 112 |
MERRILL LYNCH DRIVE
A “Tenant Trigger Period” means a period (A) commencing upon the first to occur of (i) the occurrence and continuance of a material monetary default under the Merrill Lynch lease beyond all applicable notice and cure periods, (ii) any bankruptcy or similar insolvency of Merrill Lynch, (iii) Merrill Lynch giving notice that it is terminating its lease for or otherwise abandoning all or any substantial portion of its space at the Merrill Lynch Drive Property (or applicable portion thereof), and (iv) the occurrence of (a) the withdrawal of the credit rating of Merrill Lynch, (b) the downgrade of the credit rating of Merrill Lynch below “BBB-” by S&P and Fitch or (c) the downgrade of the credit rating of Merrill Lynch below “BB” by either S&P or Fitch (any of (a), (b) or (c) a “Tenant Ratings Trigger Period”); and (B) expiring upon the first to occur of (I) (aa) with regard to clause (i) above, the cure (if applicable) of such default, (bb) with regard to clause (ii) above, Merrill Lynch is no longer insolvent or subject to any bankruptcy or insolvency proceedings and has affirmed its lease, (cc) with regard to clause (iii) above Merrill Lynch has revoked or rescinded all termination or cancellation or vacation notices, re-affirmed its lease as being in full force and effect and occupies its space and (dd) with regard to clause (iv) above, (1) the credit rating of Merrill Lynch is reinstated by each of the rating agencies that withdrew such rating or each of the rating agencies that downgraded Merrill Lynch has increased such rating to at least “BBB-” or (2) the credit rating of Merrill Lynch is at least BB+ by both S&P and Fitch and the amount on deposit in the tenant improvements and leasing commissions reserve equals or exceeds $22,153,640 (the “TI/LC Reserve Cap”), or (II) the borrower leasing the Merrill Lynch space at the Merrill Lynch Drive Property to one or more replacement tenants, and each applicable replacement tenant (x) has accepted the premises demised under its lease and is paying the full amount of the rent due thereunder (unless any free rent is reserved with the lender) and (y) has a credit rating of at least “BBB-” by S&P or Fitch.
Lockbox and Cash Management.The Merrill Lynch Drive Whole Loan is structured with a hard lockbox and in-place cash management. The borrower was required to send a direction letter to the tenant instructing it to deposit all rents into a lockbox account controlled by the lender. All funds in the lockbox account are required to be swept weekly to a cash management account under the control of the lender and disbursed on each monthly payment date during the term of the Merrill Lynch Drive Whole Loan to fund the required reserves deposits described above under “Escrows,” to pay debt service on the Merrill Lynch Drive Whole Loan, to disburse monthly operating expenses as referenced in the approved annual budget, to pay extraordinary expenses not referenced in the approved annual budget and approved by the lender, and any remainder is required to be disbursed (i) in the event of a Tenant Ratings Trigger Period, into a tenant improvements and leasing commissions reserve, until the amount on deposit therein equals the TI/LC Reserve Cap, (ii) in the event of a Tenant Ratings Trigger Period as to which the TI/LC Reserve Cap has been satisfied, or if any other Cash Sweep Period is continuing, to an excess cash flow account to be held as additional collateral for the Merrill Lynch Drive Whole Loan and (iii) if no Cash Sweep Period is continuing, to the borrower. The excess cash flow account may be used for capital expenditures set forth in the approved annual budget or otherwise approved by the lender and for tenant improvements and leasing commissions for leases approved by the lender or otherwise permitted under the loan documents, to the extent funds in the related reserves for such purposes are insufficient.
A “Cash Sweep Period” means a period commencing upon the occurrence of (i) an event of default under the Merrill Lynch Drive Whole Loan; (ii) a Tenant Trigger Period or (iii) the ARD and terminating upon (a) in the case of clause (i) the cure (if applicable) of such event of default and (b) in the case of clause (ii), the Tenant Trigger Period terminates by its terms. A Cash Sweep Period due to the ARD will not terminate.
Property Management. The Merrill Lynch Drive Property is managed by NREM Hopewell Manager, LLC.
Assumption. The borrower has the right to transfer the Merrill Lynch Drive Property provided that certain conditions are satisfied, including (i) no event of default has occurred and is continuing; (ii) the lender reasonably determines that the proposed transferee and guarantor satisfy the lender's standards, taking into consideration the transferee’s identity, experience, financial condition and creditworthiness; and (iii) the lender has received confirmation from each rating agency rating the BANK 2017-BNK4 Certificates and each rating agency rating any securities backed by any Merrill Lynch Drive Pari Passu Companion Loans that such assumption will not result in a downgrade, withdrawal or qualification of the respective ratings assigned to the Certificates and any such other securities.
Rights of First Offer. Merrill Lynch has a continuing right of first offer to purchase the Merrill Lynch Drive Property. Merrill Lynch waived its right of first offer until April 27, 2017. After April 27, 2017, Merrill Lynch has the right of first offer to purchase the property to be sold (the “Sale Property”) within 14 days of notice by the borrower. If Merrill Lynch rejects the borrower’s offer, the borrower has the right to sell the Sale Property to any party on substantially the same terms and at a purchase price of at least 80% of the price originally offered to Merrill Lynch within 18 months. A Subordination, Non-Disturbance and Attornment Agreement was entered into with Merrill Lynch, which states that the right of first offer does not apply to a foreclosure, including judicial and nonjudicial foreclosure and deed-in-lieu of foreclosure, but will apply to subsequent transfers.
In addition, Merrill Lynch has a right of first offer to lease any space in the Merrill Lynch Drive Property or common areas owned by the borrower.
Partial Release. Not permitted.
Real Estate Substitution.Not permitted.
Subordinate and Mezzanine Indebtedness.None.
Ground Lease.None.
Terrorism Insurance. The loan documents require that the “all risk” insurance policy required to be maintained by the borrower provide coverage for terrorism in an amount equal to the full replacement cost of the Merrill Lynch Drive Property and 18 months of business interruption insurance; provided that if the Terrorism Risk Insurance Program Reauthorization Act of 2015 or subsequent statute, extension or reauthorization thereof (“TRIPRA”) is in effect and continues to cover both foreign and domestic acts of terrorism, the lender is required to accept terrorism insurance with coverage against “covered acts” within the meaning of TRIPRA.
THE INFORMATION IN THIS STRUCTURAL AND COLLATERAL TERM SHEET IS NOT COMPLETE AND MAY BE AMENDED PRIOR TO THE TIME OF SALE. THIS TERM SHEET IS NOT AN OFFER TO SELL THESE SECURITIES AND IT IS NOT A SOLICITATION OF AN OFFER TO BUY THESE SECURITIES IN ANY JURISDICTION WHERE THE OFFER OR SALE IS NOT PERMITTED.
| 113 |
| KEY CENTER CLEVELAND |

THE INFORMATION IN THIS STRUCTURAL AND COLLATERAL TERM SHEET IS NOT COMPLETE AND MAY BE AMENDED PRIOR TO THE TIME OF SALE. THIS TERM SHEET IS NOT AN OFFER TO SELL THESE SECURITIES AND IT IS NOT A SOLICITATION OF AN OFFER TO BUY THESE SECURITIES IN ANY JURISDICTION WHERE THE OFFER OR SALE IS NOT PERMITTED.
| 114 |
| KEY CENTER CLEVELAND |
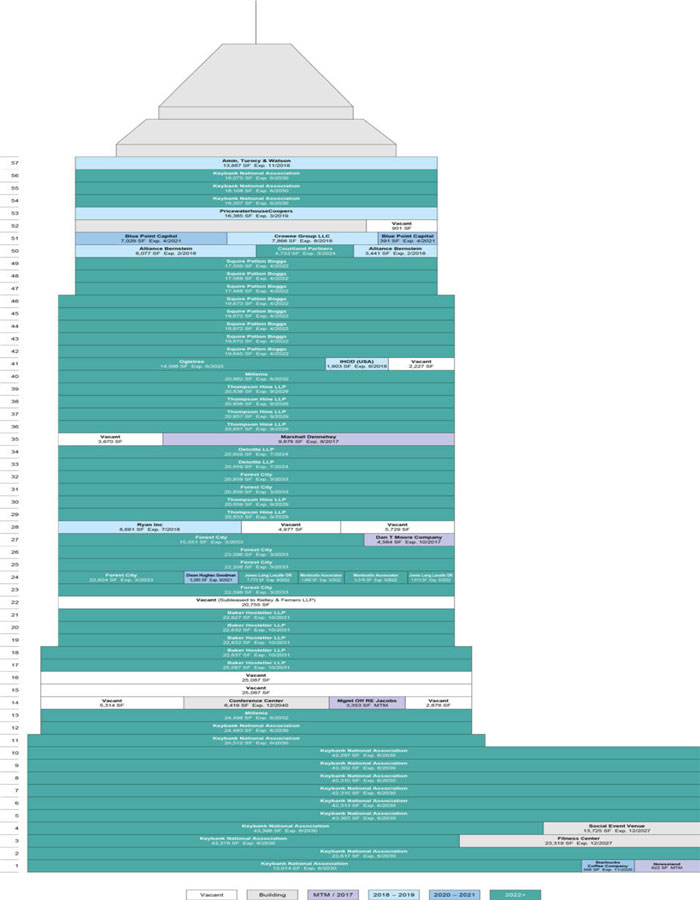
THE INFORMATION IN THIS STRUCTURAL AND COLLATERAL TERM SHEET IS NOT COMPLETE AND MAY BE AMENDED PRIOR TO THE TIME OF SALE. THIS TERM SHEET IS NOT AN OFFER TO SELL THESE SECURITIES AND IT IS NOT A SOLICITATION OF AN OFFER TO BUY THESE SECURITIES IN ANY JURISDICTION WHERE THE OFFER OR SALE IS NOT PERMITTED.
| 115 |
| KEY CENTER CLEVELAND |
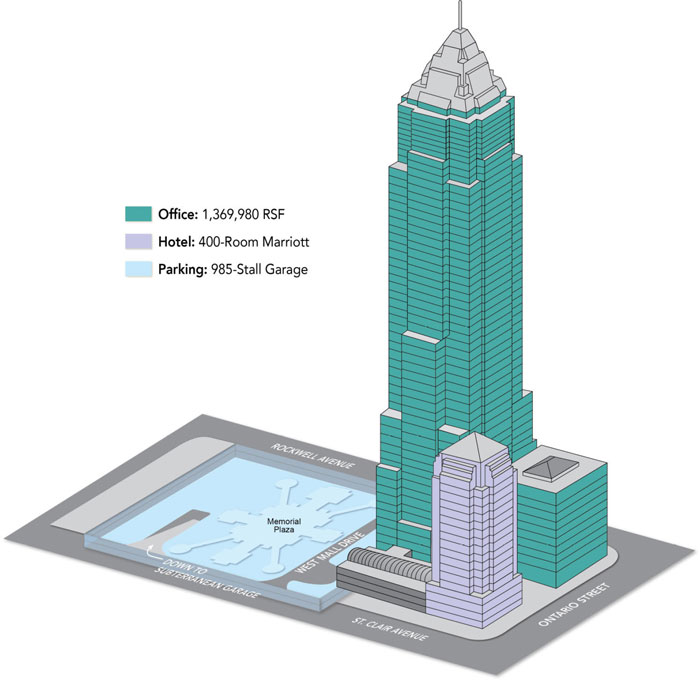
THE INFORMATION IN THIS STRUCTURAL AND COLLATERAL TERM SHEET IS NOT COMPLETE AND MAY BE AMENDED PRIOR TO THE TIME OF SALE. THIS TERM SHEET IS NOT AN OFFER TO SELL THESE SECURITIES AND IT IS NOT A SOLICITATION OF AN OFFER TO BUY THESE SECURITIES IN ANY JURISDICTION WHERE THE OFFER OR SALE IS NOT PERMITTED.
| 116 |
| KEY CENTER CLEVELAND |
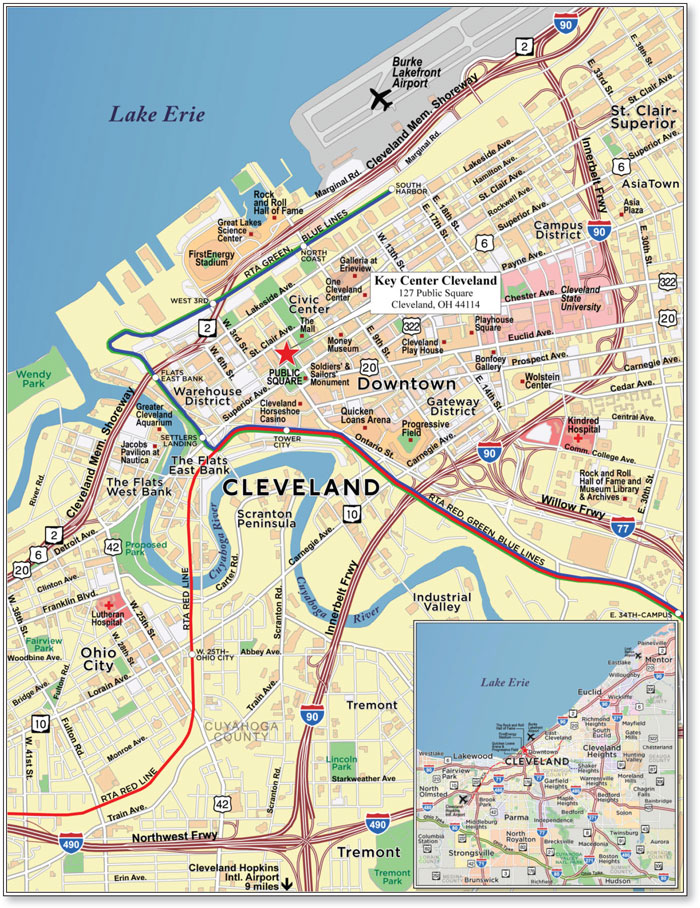
THE INFORMATION IN THIS STRUCTURAL AND COLLATERAL TERM SHEET IS NOT COMPLETE AND MAY BE AMENDED PRIOR TO THE TIME OF SALE. THIS TERM SHEET IS NOT AN OFFER TO SELL THESE SECURITIES AND IT IS NOT A SOLICITATION OF AN OFFER TO BUY THESE SECURITIES IN ANY JURISDICTION WHERE THE OFFER OR SALE IS NOT PERMITTED.
| 117 |
| No. 10 – Key Center Cleveland | |||||||
| Loan Information | Property Information | ||||||
| Mortgage Loan Seller: | Bank of America, N.A. | Single Asset/Portfolio: | Single Asset | ||||
Credit Assessment (Fitch/KBRA/Moody’s): | NR/NR/NR | Property Type: | Mixed Use | ||||
| Original Principal Balance(1): | $40,000,000 | Specific Property Type: | Office/Hospitality/Parking | ||||
| Cut-off Date Balance(1): | $40,000,000 | Location: | Cleveland, OH | ||||
| % of Initial Pool Balance: | 4.0% | Size(4): | 1,369,980 SF | ||||
| Loan Purpose: | Acquisition | Cut-off Date Balance Per SF(1): | $160.59 | ||||
| Borrower Names: | 127 PS Fee Owner LLC | Year Built/Renovated: | 1991/2015 | ||||
| Sponsor: | Frank T. Sinito; Malisse J. Sinito | Title Vesting: | Fee/Leasehold | ||||
| Mortgage Rate: | 5.310% | Property Manager(5): | Various | ||||
| Note Date: | January 31, 2017 | 4thMost Recent Occupancy (As of)(4): | NAV | ||||
| Anticipated Repayment Date: | NAP | 3rdMost Recent Occupancy (As of)(4): | 89.7% (12/31/2013) | ||||
| Maturity Date: | February 6, 2027 | 2ndMost Recent Occupancy (As of)(4): | 86.4% (12/31/2014) | ||||
| IO Period: | 24 months | Most Recent Occupancy (As of)(4): | 80.3% (12/31/2015) | ||||
| Loan Term (Original): | 120 months | Current Occupancy (As of)(4): | 92.9% (10/19/2016) | ||||
| Seasoning: | 2 months | ||||||
| Amortization Term (Original): | 300 months | Underwriting and Financial Information: | |||||
| Loan Amortization Type: | Interest-only, Amortizing Balloon | ||||||
| Interest Accrual Method: | Actual/360 | 4thMost Recent NOI (As of)(6): | $28,055,510 (12/31/2013) | ||||
| Call Protection(2): | L(26),D(90),O(4) | 3rdMost Recent NOI (As of)(6): | $24,855,822 (12/31/2014) | ||||
| Lockbox Type: | Hard/Upfront Cash Management | 2ndMost Recent NOI (As of)(6): | $22,253,611 (12/31/2015) | ||||
| Additional Debt(1): | Yes | Most Recent NOI (As of)(6): | $19,057,726 (12/31/2016) | ||||
| Additional Debt Type(1): | Pari Passu; Mezzanine | ||||||
| U/W Revenues: | $67,329,103 | ||||||
| U/W Expenses: | $40,324,409 | ||||||
| Escrows and Reserves(3): | U/W NOI: | $27,004,694 | |||||
| U/W NCF: | $25,327,136 | ||||||
| Type: | Initial | Monthly | Cap (If Any) | U/W NOI DSCR(1): | 1.70x | ||
| Taxes | $1,540,363 | $770,181 | NAP | U/W NCF DSCR(1): | 1.59x | ||
| Insurance | $55,406 | $27,703 | NAP | U/W NOI Debt Yield(1): | 12.3% | ||
| Deferred Maintenance | $64,625 | $0 | NAP | U/W NCF Debt Yield(1): | 11.5% | ||
| Replacement Reserves | $18,271,556 | $29,284 | $1,757,065 | As-Completed Appraised Value(7): | $362,000,000 | ||
| TI/LC Reserve | $24,069,759 | $110,513 | NAP | As-Completed Appraisal Valuation Date(7): | December 1, 2017 | ||
| Other Reserves | $6,643,844 | $5,000 | NAP | Cut-off Date LTV Ratio(1)(7): | 60.8% | ||
| New Lease Reserve | $5,175,296 | $0 | NAP | LTV Ratio at Maturity or ARD(1)(7): | 49.6% | ||
| (1) | The Key Center Cleveland Whole Loan (as defined below), which had an original principal balance of $220,000,000, is comprised of sixpari passu notes (Notes A-1, A-2, A-3, A-4, A-5 and A-6). The non-controlling Note A-2 had an original principal balance of $40,000,000, has an outstanding balance of $40,000,000 as of the Cut-off Date and will be contributed to the BANK 2017-BNK4 trust. The remaining five notes, which had an aggregate original principal balance of $180,000,000, are expected to be contributed to future trusts. All statistical information related to balances per foot, debt service coverage ratios and debt yields are based on the Key Center Cleveland Whole Loan. See “Subordinate and Mezzanine Indebtedness” section. The Cut-off Date LTV Ratio, U/W NCF DSCR and U/W NOI DY based on the combined Key Center Cleveland Whole Loan and Key Center Cleveland Mezzanine Loan (as defined under “Subordinate and Mezzanine Indebtedness” section) aggregate principal amount of $262,500,000 are 72.5%, 1.17x and 10.3%, respectively. |
| (2) | The defeasance lockout period will be at least 26 payment dates beginning with and including the first payment date of March 6, 2017. Defeasance of the Key Center Cleveland Whole Loan is permitted on or after the date that is the earlier to occur of (i) two years after the closing date of the securitization that includes the last note to be securitized, and (ii) July 31, 2020. The assumed lockout period of 26 payments is based on the expected BANK 2017-BNK4 trust closing date in April 2017. |
| (3) | See “Escrows” section. |
| (4) | Size, Current Occupancy and most recent occupancies represent the occupancy for Key Tower (as defined below) only. Most recent occupancy for the Marriott Cleveland Downtown was 66.2%, 70.2%, 65.8% and 70.4% for the trailing twelve month periods ending year-end 2016, 2015, 2014 and 2013, respectively. |
| (5) | The Key Center Cleveland Property (as defined below) is managed by Millennia Housing Management, Ltd., Jacobs Real Estate Services LLC, Marriott Hotel Services, Inc. and SP Plus Corporation. |
| (6) | See “Cash Flow Analysis” section. |
| (7) | The Cut-off Date LTV Ratio and LTV Ratio at Maturity or ARD are calculated based upon a “Prospective Value upon Completion” value of $362,000,000 as of December 1, 2017, which is the date upon which all capital improvements are expected to be completed at the property. The budgeted costs of such planned capital improvements were reserved for at loan origination. The appraised value of $362,000,000 consists of (i) $253,800,000 ($185 per square foot) for Key Tower, (ii) $77,000,000 ($192,500 per room) for Marriott Cleveland Downtown and (iii) $31,200,000 ($98 per square foot) for the Key Center Cleveland Parking Garage Component (as defined below). The combined “as-is” appraised value of $304,100,000 as of December 1, 2016 results in a Cut-off Date LTV Ratio and LTV Ratio at Maturity or ARD for the whole loan of 72.3% and 59.0%, respectively and 86.3% and 72.3% for the total debt, respectively. |
The Mortgage Loan. The mortgage loan (the “Key Center Cleveland Mortgage Loan”) is part of a whole loan (the “Key Center Cleveland Whole Loan”) that is evidenced by sixpari passu senior promissory notes secured by a first lien mortgage encumbering a 1,369,980 square foot office building, a 400-room full service hotel and the leasehold interest in an adjacent, 985-space subterranean parking garage, located in Cleveland, Ohio (the “Key Center Cleveland Property”). The Key Center Cleveland Whole Loan was co-originated on January 31, 2017 by Bank of America, N.A., Citi Real Estate Funding Inc. and Deutsche Bank AG, New
THE INFORMATION IN THIS STRUCTURAL AND COLLATERAL TERM SHEET IS NOT COMPLETE AND MAY BE AMENDED PRIOR TO THE TIME OF SALE. THIS TERM SHEET IS NOT AN OFFER TO SELL THESE SECURITIES AND IT IS NOT A SOLICITATION OF AN OFFER TO BUY THESE SECURITIES IN ANY JURISDICTION WHERE THE OFFER OR SALE IS NOT PERMITTED.
| 118 |
| KEY CENTER CLEVELAND |
York Branch. The Key Center Cleveland Whole Loan had an original principal balance of $220,000,000, has an outstanding principal balance as of the Cut-off Date of $220,000,000 and accrues interest at an interest rate of 5.310%per annum. The Key Center Cleveland Whole Loan had an initial term of 120 months, has a remaining term of 118 months as of the Cut-off Date and requires interest-only payments through the through the first 24 payments then requires principal and interest payments based on a 25-year amortization schedule through the term of the Key Center Cleveland Whole Loan. The Key Center Cleveland Whole Loan matures on February 6, 2027.
The Key Center Cleveland Mortgage Loan, evidenced by the non-controlling Note A-2, which will be contributed to the BANK 2017-BNK4 trust, had an original principal balance of $40,000,000 and has an outstanding principal balance as of the Cut-off Date of $40,000,000. The remaining notes, including the controlling Note A-1 (the “Key Center Cleveland Companion Loans”), which had an aggregate original principal balance of $180,000,000, are expected to be contributed to future trusts. The lender provides no assurances that any non-securitized notes will not be split further. See “Description of the Mortgage Pool—The Whole Loans—The Serviced Pari Passu Whole Loans” in the Preliminary Prospectus.
Note Summary
| Notes | Original Balance | Note Holder(1) | Controlling Interest | |
| A-1 | $50,000,000 | CGCMT 2017-P7 | Yes | |
| A-2 | $40,000,000 | BANK 2017-BNK4 | No | |
| A-3, A-6 | $60,000,000 | JPMDB 2017-C5 | No | |
| A-4 | $30,000,000 | Citibank | No | |
| A-5 | $40,000,000 | BANA | No | |
| Total | $220,000,000 |
| (1) | Bank of America, N.A. (“BANA”); Citi Real Estate Funding Inc. (“Citibank”) |
Following the lockout period, the borrower has the right to defease the Key Center Cleveland Whole Loan in whole, but not in part, on any date before November 6, 2026. In addition, the Key Center Cleveland Whole Loan is prepayable without penalty on or after November 6, 2026.
Sources and Uses
| Sources | Uses | |||||||
| Original whole loan amount | $220,000,000 | 66.7% | Purchase Price | $267,500,000 | 81.1% | |||
| Sponsor Equity | 60,845,008 | 18.5 | Reserves | 50,645,553 | 15.4 | |||
| Mezzanine Loan | 42,500,000 | 12.9 | Closing costs | 11,588,828 | 3.5 | |||
| Other Sources(1) | 6,389,372 | 1.9 | ||||||
| Total Sources | $329,734,380 | 100.0% | Total Uses | $329,734,380 | 100.0% |
| (1) | Other sources include $5,608,359 of seller credits transferred to the loan sponsor at loan closing which was related to outstanding tenant improvements for the Thompson Hine LLP tenant. |
The Property.The Key Center Cleveland Property is located in downtown Cleveland, Ohio, within Cuyahoga County and consists of a 1,369,980 square foot office building (“Key Tower”), a 400-room full service hotel (“Marriott Cleveland Downtown”), and a leasehold interest in a 985-space subterranean parking garage (“Key Center Cleveland Parking Garage Component”) located on three separate parcels over a 2.1-acre site at 127 Public Square in Cleveland, Ohio. Public Square underwent a $50 million renovation in March 2015 as part of a revitalization of downtown Cleveland. The Key Center Cleveland Property takes up a full city block and is located between two arteries and two commercial corridors. The immediate area is urban in nature and has a mix of commercial uses, including retail, office and multifamily developments. Local transportation is provided by the Greater Cleveland Regional Transit Authority (“RTA”). RTA services 59 municipalities including 38 cities, 19 villages and two townships. There are several stops in the immediate vicinity located along East 9th Street and St. Clair Avenue. The Key Center Cleveland Property is located approximately 13.5 miles northeast of the Cleveland Hopkins International Airport.
The original structure was built in 1890, with the construction of Key Tower in 1991, which contains 1,369,980 square feet over 57 stories. Key Tower was designed by architect Cesar Pelli and is currently the tallest building in Ohio. The building provides views of Lake Erie, FirstEnergy Stadium, City Hall, and the Cleveland skyline. Key Tower features a spacious and ornate lobby with four separate street entrances and access to the underground parking facilities between Key Tower and the Marriott Cleveland Downtown lobbies.
Key Tower is currently 92.9% leased to approximately 36 tenants under 71 leases, as of October 19, 2016 and historical occupancy has averaged 90% since 2006. The largest tenant at the Key Tower is KeyBank National Association (rated Moody’s/S&P/Fitch: Aa3/A-/A-) (“KeyBank”) which has been operating its headquarters there since 1992 and currently occupies 34.9% of the net rentable area. KeyBank is one of the largest bank-based financial services companies in the United States, with a reported $136.5 billion in total assets as of year-end 2016.
KeyBank has reportedly invested approximately $24.0 million in its space since 2013. KeyBank’s lease expires in June 2030 and provides for three, five-year renewal options remaining. KeyBank has an ongoing option, beginning in July 2020, to contract its space by up to an aggregate amount of 103,000 square feet; provided that each exercise of a contraction option may not exceed 44,000 square feet, and following each exercise of a contraction option, KeyBank may not exercise another contraction option for a period of three years following such exercise. KeyBank must give 12 months’ notice for each contraction option as well as a pay a termination fee consisting of unamortized tenant improvement and leasing commissions costs as well as a rent penalty.
THE INFORMATION IN THIS STRUCTURAL AND COLLATERAL TERM SHEET IS NOT COMPLETE AND MAY BE AMENDED PRIOR TO THE TIME OF SALE. THIS TERM SHEET IS NOT AN OFFER TO SELL THESE SECURITIES AND IT IS NOT A SOLICITATION OF AN OFFER TO BUY THESE SECURITIES IN ANY JURISDICTION WHERE THE OFFER OR SALE IS NOT PERMITTED.
| 119 |
| KEY CENTER CLEVELAND |
Other large tenants in the building include law firms such as Squire Patton Boggs, Thompson Hine LLP and Baker Hostetler LLP as well as accounting and consulting firms such as Deloitte LLP and PricewaterhouseCoopers. The top five tenants by net rentable area have been at the Key Center Cleveland property on average approximately 18.0 years and have a weighted average remaining lease term of 12.6 years.
The following table presents historical occupancy percentages at Key Tower:
Historical Occupancy
12/31/2013(1) | 12/31/2014(1) | 12/31/2015(1) | 10/19/2016(1) |
| 89.7% | 86.4% | 80.3% | 92.9% |
| (1) | Information obtained from the underwrittenrent roll. |
The Key Center Cleveland Parking Garage Component contains 985 spaces and is connected to the Key Tower lobby through a separate double elevator bank. The garage features security lighting, video surveillance, and security patrols throughout the day. Valet service is offered at the Marriott Cleveland Downtown entrance. SL Plus Corporation (formerly known as Standard Parking Corporation) manages the Key Center Cleveland Parking Garage Component for a 3.0% fee of net revenue. The term of the parking management agreement is month-to-month with automatic renewals.
Marriott Cleveland Downtown is a 24-story, 400-room, full service hotel built in 1991. Amenities at the Marriott Cleveland Downtown include a sports bar (“Jake’s Lounge”) and a modern American restaurant (“David’s Restaurant”) and an approximately 23,000 square foot private health club which is for use by hotel guests as well as tenants at the Key Tower (“Key Club”). The private health club features an indoor pool, sauna, and fitness room. The Marriott Cleveland Downtown also contains approximately 17,000 square feet of meeting space, a ballroom, and a contemporary lobby lounge with TVs.
Since 2010 the prior ownership has invested $6.3 million ($15,782 per room) in capital expenditures, including over $4.6 million in guestroom upgrades in 2013-2014. The Marriott Cleveland Downtown is slated to undergo approximately $13.5 million in capital improvements which includes $3.3 million to update Key Club, $2.6 million to modernize the ballrooms and meeting space, approximately $2.0 million to renovate David’s Restaurant and $1.4 million to upgrade the hotel lobby.
The Marriott Cleveland Downtown Hotel is brand-managed by Marriott Hotel Services, Inc. (“Marriott”) under a long term agreement which commenced in 1988 and will be expiring in 2021, with three, 10-year renewal periods. Marriott is entitled to a base management fee equal to 3.0% of total revenue. The management agreement may be terminated by the owner if the average operating profit does not equal or exceed $3.3 million for any three consecutive fiscal years.
THE INFORMATION IN THIS STRUCTURAL AND COLLATERAL TERM SHEET IS NOT COMPLETE AND MAY BE AMENDED PRIOR TO THE TIME OF SALE. THIS TERM SHEET IS NOT AN OFFER TO SELL THESE SECURITIES AND IT IS NOT A SOLICITATION OF AN OFFER TO BUY THESE SECURITIES IN ANY JURISDICTION WHERE THE OFFER OR SALE IS NOT PERMITTED.
| 120 |
| KEY CENTER CLEVELAND |
The following table presents certain information relating to the tenancies at the Key Tower:
Major Tenants
| Tenant Name | Credit Rating (Fitch/Moody’s/ S&P)(1) | Tenant NRSF | % of NRSF | Annual U/W Base Rent PSF(2) | Annual U/W Base Rent(2) | % of Total Annual U/W Base Rent | Lease Expiration Date |
| Major Tenants | |||||||
| KeyBank National Association(3) | A-/Aa3/A- | 477,781 | 34.9% | $31.30 | $14,955,575 | 39.7% | 6/30/2030 |
| Squire Patton Boggs | NR/NR/NR | 150,890 | 11.0% | $33.05 | $4,987,280 | 13.2% | 4/30/2022 |
| Forest City(4) | NR/NR/BB- | 147,795 | 10.8% | $27.00 | $3,990,465 | 10.6% | 3/31/2033 |
| Thompson Hine LLP(5) | NR/NR/NR | 125,120 | 9.1% | $27.55 | $3,447,532 | 9.2% | 9/30/2029 |
| Baker Hostetler LLP | NR/NR/NR | 115,615 | 8.4% | $28.62 | $3,308,369 | 8.8% | 10/31/2031 |
| Total Major Tenants | 1,017,201 | 74.2% | $30.17 | $30,689,221 | 81.5% | ||
| Non-Major Tenants | 255,534 | 18.7% | $27.26 | $6,966,943 | 18.5% | ||
| Occupied Collateral Total | 1,272,735 | 92.9% | $29.59 | $37,656,164 | 100.0% | ||
| Vacant Space | 97,245 | 7.1% | |||||
| Collateral Total | 1,369,980 | 100.0% | |||||
| (1) | Certain ratings are those of the parent company whether or not the parent company guarantees the lease. |
| (2) | Annual U/W Base Rent PSF and Annual U/W Base Rent include contractual rent steps through May 2017. |
| (3) | KeyBank has an ongoing option, beginning in July 2020, to contract its space by up to an aggregate amount of 103,000 square feet in three installments; provided that each exercise of a contraction option may not exceed 44,000 square feet, and following each exercise of a contraction option, KeyBank may not exercise another contraction option for a period of three years following such exercise. KeyBank must give 12 months’ notice for each contraction option as well as pay a termination fee consisting of unamortized tenant improvement and leasing commissions costs as well as a rent penalty. |
| (4) | Forest City is not yet in occupancy or paying rent. Forest City is expected to commence paying rent no later than April 1, 2018. At the origination date, the borrower provided the lender a letter of credit in the amount of $4,655,546 (noting that per the terms of the loan documents, the borrower requested and was granted a $436,489 burn down of such letter of credit on March 6, 2017), in respect of gap rent for Forest City. Forest City has the one-time option to contract its space by not less than one-half of one floor and not more than one full floor on March 31, 2023 upon 12 months prior notice. |
| (5) | Thompson Hine LLP has the one time option to terminate its space by not more than a full floor of either (i) any single, non-contiguous floor leased by it or (ii) the highest or lowest full floor of any contiguous block of floors leased by it, which termination may be effective, at the tenant’s option, either on October 1, 2023 or October 1, 2025. Such option is exercisable upon written notice no later than 12 months prior to the applicable termination date, and payment of a fee equal to unamortized tenant improvement allowances and leasing commissions that were paid with respect to the terminated space. |
The following table presents certain information relating to the lease rollover schedule at the Key Tower:
Lease Expiration Schedule(1)(2)
Year Ending December 31, | No. of Leases Expiring | Expiring NRSF | % of Total NRSF | Cumulative Expiring NRSF | Cumulative % of Total NRSF | Annual U/W Base Rent | % of Total Annual U/W Base Rent | Annual U/W Base Rent PSF(3) |
| MTM | 2 | 3,353 | 0.2% | 3,353 | 0.2% | $97,237 | 0.3% | $29.00 |
| 2017 | 10 | 14,240 | 1.0% | 17,593 | 1.3% | $574,472 | 1.5% | $40.34 |
| 2018 | 9 | 35,869 | 2.6% | 53,462 | 3.9% | $1,152,639 | 3.1% | $32.13 |
| 2019 | 2 | 24,251 | 1.8% | 77,713 | 5.7% | $784,222 | 2.1% | $32.34 |
| 2020 | 3 | 356 | 0.0% | 78,069 | 5.7% | $79,602 | 0.2% | $223.59 |
| 2021 | 3 | 10,705 | 0.8% | 88,774 | 6.5% | $292,071 | 0.8% | $27.28 |
| 2022 | 8 | 167,787 | 12.2% | 256,561 | 18.7% | $5,454,978 | 14.5% | $32.51 |
| 2023 | 0 | 0 | 0.0% | 256,561 | 18.7% | $0 | 0.0% | $0.00 |
| 2024 | 3 | 46,451 | 3.4% | 303,012 | 22.1% | $1,359,875 | 3.6% | $29.28 |
| 2025 | 3 | 14,589 | 1.1% | 317,601 | 23.2% | $417,778 | 1.1% | $28.64 |
| 2026 | 0 | 0 | 0.0% | 317,601 | 23.2% | $0 | 0.0% | $0.00 |
| 2027 | 2 | 37,044 | 2.7% | 354,645 | 25.9% | $349,785 | 0.9% | $9.44 |
| Thereafter | 26 | 918,090 | 67.0% | 1,272,735 | 92.9% | $27,093,506 | 71.9% | $29.51 |
| Vacant | 0 | 97,245 | 7.1% | 1,369,980 | 100.0% | $0 | 0.0% | $0.00 |
| Total/Weighted Average | 71 | 1,369,980 | 100.0% | $37,656,164 | 100.0% | $29.59 |
| (1) | Information obtained from the underwritten rent roll. |
| (2) | Certain tenants may have lease termination options that are exercisable prior to the originally stated expiration date of the subject lease and that are not considered in the Lease Expiration Schedule. |
| (3) | Weighted Average Annual U/W Base Rent PSF excludes vacant space. |
THE INFORMATION IN THIS STRUCTURAL AND COLLATERAL TERM SHEET IS NOT COMPLETE AND MAY BE AMENDED PRIOR TO THE TIME OF SALE. THIS TERM SHEET IS NOT AN OFFER TO SELL THESE SECURITIES AND IT IS NOT A SOLICITATION OF AN OFFER TO BUY THESE SECURITIES IN ANY JURISDICTION WHERE THE OFFER OR SALE IS NOT PERMITTED.
| 121 |
| KEY CENTER CLEVELAND |
Operating History and Underwritten Net Cash Flow. The following table presents certain information relating to the historical operating performance and underwritten net cash flow at the Marriott Cleveland Downtown:
Cash Flow Analysis
| 2013 | 2014 | 2015 | 2016 | U/W | % of U/W Total Revenue | U/W $ per Room(1) | |
| Occupancy | 71.6% | 66.5% | 70.9% | 66.2% | 65.0% | ||
| ADR | $155.32 | $157.83 | $157.93 | $162.44 | $163.45 | ||
| RevPAR(1) | $111.24 | $104.99 | $111.95 | $107.51 | $106.24 | ||
| Room Revenue | $16,240,749 | $15,328,051 | $16,344,286 | $15,738,880 | $15,511,405 | 70.2% | $38,779 |
| F&B Revenue | 6,570,035 | 6,684,994 | 6,900,689 | 6,359,302 | 5,996,176 | 27.1 | 14,990 |
| Other Revenue(2) | 944,523 | 880,565 | 807,358 | 825,681 | 584,993 | 2.6 | 1,462 |
| Total Revenue | $23,755,307 | $22,893,610 | $24,052,333 | $22,923,863 | $22,092,574 | 100.0% | $55,231 |
| Total Department Expenses | 10,120,537 | 9,813,014 | 10,411,963 | 9,540,605 | 9,055,128 | 41.0 | 22,638 |
| Gross Operating Profit | $13,634,770 | $13,080,596 | $13,640,370 | $13,383,258 | $13,037,446 | 59.0% | $32,594 |
| Total Undistributed Expenses | 6,890,609 | 6,965,054 | 7,394,903 | 7,407,458 | 7,437,569 | 33.7 | 18,594 |
| Profit Before Fixed Charges | $6,744,161 | $6,115,542 | $6,245,467 | $5,975,800 | $5,599,876 | 25.3% | $14,000 |
| Total Fixed Charges | 1,205,091 | 1,487,694 | 1,264,250 | 1,312,263 | 1,433,240 | 6.5 | 3,583 |
| Net Operating Income | $5,539,070 | $4,627,848 | $4,981,217 | $4,663,537 | $4,166,637 | 18.9% | $10,417 |
| FF&E Reserve | 1,181,285 | 1,138,580 | 1,197,413 | 1,141,811 | 1,104,629 | 5.0 | 2,762 |
| Net Cash Flow | $4,357,785 | $3,489,268 | $3,783,804 | $3,521,726 | $3,062,008 | 13.9% | $7,655 |
| (1) | U/W $ per Room values are based upon 400 guest rooms. |
| (2) | Historical RevPAR for 2008, 2009, 2010, 2011 and 2012 was $102.07, $91.24, $90.59, $92.57 and $106.13, respectively. |
| (3) | Other Revenue consists primarily of vending commissions, guest services, miscellaneous commissions, sales tax discounts, cancellation fees and attrition fees. |
The following table presents certain information relating to the historical operating performance and underwritten net cash flow at the Key Center Cleveland Property:
Cash Flow Analysis
| 2013 | 2014 | 2015 | 2016 | U/W | % of U/W Effective Gross Income | U/W $ per SF | |||||||||
| Base Rent(1) | $32,510,214 | $31,608,409 | $29,936,738 | $28,060,735 | $37,656,164 | 55.9% | $27.49(3) | ||||||||
| Grossed Up Vacant Space | 0 | 0 | 0 | 0 | 2,745,589 | 4.1 | 2.00(3) | ||||||||
| Total Reimbursables | 2,348,968 | 2,690,336 | 1,319,674 | 691,479 | 597,315 | 0.9 | 0.44(3) | ||||||||
| Hotel Revenue | 23,755,307 | 22,893,610 | 24,052,333 | 22,923,863 | 22,092,574 | 32.8 | 55,231.44(4) | ||||||||
| Parking Revenue | 4,208,945 | 3,784,318 | 3,804,773 | 4,014,186 | 3,953,056 | 5.9 | 12.37(5) | ||||||||
| Other Income(2) | 3,122,262 | 3,226,533 | 4,133,442 | 3,550,145 | 3,375,221 | 5.0 | 2.46(3) | ||||||||
| Less Vacancy & Credit Loss | 0 | 0 | 0 | 0 | (3,090,816) | (4.6) | (2.26)(3) | ||||||||
| Effective Gross Income | $65,945,696 | $64,203,206 | $63,246,960 | $59,240,408 | $67,329,103 | 100.0% | $28.18(6) | ||||||||
| Total Operating Expenses(7) | 39,071,471 | 39,347,384 | 40,993,349 | 40,182,682 | 40,324,409 | 59.9 | 16.88(6) | ||||||||
| Net Operating Income | $26,874,225 | $24,855,822 | $22,253,611 | $19,057,726 | $27,004,694 | 40.1% | $11.30(6) | ||||||||
| TI/LC | 0 | 0 | 0 | 0 | 1,326,153 | 2.0 | 0.97(3) | ||||||||
| Capital Expenditures | 0 | 0 | 0 | 0 | 351,405 | 0.5 | 0.26(3) | ||||||||
| Net Cash Flow | $26,874,225 | $24,855,822 | $22,253,611 | $19,057,726 | $25,327,136 | 37.6% | $10.60(6) | ||||||||
| NOI DSCR(8) | 1.69x | 1.56x | 1.40x | 1.20x | 1.70x | ||||||||||
| NCF DSCR(8) | 1.69x | 1.56x | 1.40x | 1.20x | 1.59x | ||||||||||
| NOI DY(8) | 12.2% | 11.3% | 10.1% | 8.7% | 12.3% | ||||||||||
| NCF DY(8) | 12.2% | 11.3% | 10.1% | 8.7% | 11.5% |
| (1) | Base Rent includes contractual rent steps through May 2017 and the present value of rent steps for Jones Lang LaSalle GR and KeyBank National Association. The decline in historical Base Rent is due primarily to KeyBank downsizing its space at the property. The increase in Base Rent between U/W and 2016 was primarily due to newly executed leases with tenants Forest City and Millennia. Forest City executed a lease commencing in April 2018 for 147,795 square feet resulting in an increase to the U/W Base Rent of $3,990,465 and Millennia executed a lease commencing in July 2017 for 45,360 square feet resulting in an increase to the U/W Base Rent of $1,247,400. |
| (2) | Other Income includes bill back reimbursements, tenant services income, late charge income, other property income and minor utility charges. |
| (3) | Calculated based on the total square footage of Key Tower. |
| (4) | Calculated based on the total rooms at the Marriott Cleveland Downtown. |
| (5) | Calculated based on the total square footage of the Key Center Cleveland Parking Garage Component (319,590 square feet). |
| (6) | Calculated based on the total square footage of the Key Center Cleveland Property (2,389,441 square feet). |
| (7) | Total Operating Expenses include hotel FF&E reserves. |
| (8) | Debt service coverage ratios and debt yields are based on the Key Center Whole Loan. |
THE INFORMATION IN THIS STRUCTURAL AND COLLATERAL TERM SHEET IS NOT COMPLETE AND MAY BE AMENDED PRIOR TO THE TIME OF SALE. THIS TERM SHEET IS NOT AN OFFER TO SELL THESE SECURITIES AND IT IS NOT A SOLICITATION OF AN OFFER TO BUY THESE SECURITIES IN ANY JURISDICTION WHERE THE OFFER OR SALE IS NOT PERMITTED.
| 122 |
| KEY CENTER CLEVELAND |
Appraisal.As of the appraisal valuation date of December 1, 2016, the Key Center Cleveland Property had an “as-is” appraised value of $304,100,000. The appraisal also provided a “Prospective Value upon Completion” value of $362,000,000 as of December 1, 2017, which is the date upon which all capital improvements are expected to be completed at the property.
Environmental Matters.According to the Phase I environmental report dated August 11, 2016, there was no evidence of any recognized environmental conditions at the Key Center Cleveland Property other than an asbestos operations and maintenance plan, which is already in place, and continued weekly monitoring of the underground storage tank.
Market Overview and Competition.The Key Center Cleveland Property is within proximity to the Gateway District and local sports venue Progressive Field (home to Major League Baseball’s Cleveland Indians) and Quicken Loans Arena (home to the National Basketball Association’s Cleveland Cavaliers), both of which are less than one mile from the Marriott Cleveland Downtown. Playhouse Square, a not-for-profit performing arts center is located approximately 0.7 miles away and is the largest performing arts center outside of New York and features over 1,000 annual events including Broadway shows, dance, concerts, and speakers. Cleveland State University (over 17,000 students) is located approximately 1.0 mile from the Marriott Cleveland Downtown.
The approximate distribution of demand of the Marriott Cleveland Downtown is 41% group, 28% leisure, 27% commercial, and 4% extended-stay, which generally mirror that of the market. Year-to-date July 2016, top accounts at the Marriott Cleveland Downtown which includes tenants at Key Tower were KeyBank (4.2% of room nights), Greater Cleveland Sports Commissions (2.4%), Association of Healthcare Journalists (1.3%), Ernst & Young (1.2%), and Deloitte LLP (1.1%).
The following table presents certain information relating to the Marriott Cleveland Downtown’s competitive sets:
Subject and Market Historical Occupancy, ADR and RevPAR(1)
Competitive Set | Marriott Cleveland Downtown | Penetration Factor | |||||||
Year | Occupancy | ADR | RevPAR | Occupancy | ADR | RevPAR | Occupancy | ADR | RevPAR |
| 12/31/2016 TTM | 69.8% | $161.00 | $112.33 | 66.2% | $162.44 | $107.51 | 94.9% | 100.9% | 95.7% |
| 12/31/2015 TTM | 70.4% | $162.80 | $114.68 | 70.2% | $159.52 | $111.95 | 99.6% | 98.0% | 97.6% |
| 12/31/2014 TTM | 67.9% | $161.07 | $109.31 | 65.8% | $159.58 | $104.99 | 96.9% | 99.1% | 96.0% |
| (1) | Information obtained from a third party hospitality research report. Competitive set includes the Wyndham Cleveland at Playhouse Square, the Hyatt Regency Cleveland at The Arcade and the InterContinental Hotel Cleveland. |
Key Tower is located within the Cleveland central business district office submarket which has a total Class A office inventory of 10.9 million square feet and a vacancy rate of 14.9% as of the third quarter 2016. Over the past four quarters, the central business district Class A office market has experienced no growth of supply. There was also positive net absorption, decrease in vacancy rates and increase of asking rent in the marketplace. The appraisal identified five Class A properties located within the submarket that are the primary competitors of Key Tower. The properties range from 321,311 square feet to 1,270,204 with occupancies ranging from 89.0% to 93.6% with a weighted average of 90.8%. Average asking rents range from $17.00 per square foot to $35.00 per square foot with a weighted average of $24.57 per square foot on a modified gross basis. The appraisal concluded to a general vacancy rate of 7.0% for Key Tower.
Cleveland has a diversified economy with a large presence in education, technology, finance, biotechnology, and healthcare. The top five employers in the Cleveland area are Cleveland Clinic (34,000 employees), US Office of Personnel Management (15,095 employees), University Hospitals (13,726 employees), Giant Eagle (10,311 employees), and Progressive Corporation (8,612 employees). According to a third party report, the 2016 population within the one-, three-, and five-mile radius was 11,685, 75,091 and 239,627, respectively and the 2016 average household income was $65,299, $41,254 and $39,712, respectively.
The following table presents certain information relating to comparable properties to Key Tower:
Comparable Properties(1)
| Property Name | Location | Distance from Subject | Year Built | SF | Occupancy | Average Asking Rent $/SF |
| Key Tower (subject) | Cleveland, OH | — | 1991 | 1,369,980 | 92.9% | $29.59 |
| Ernst & Young Tower | Cleveland, OH | 0.5 miles | 2013 | 550,000 | 93.6% | $35.00 |
| 200 Public Square | Cleveland, OH | 0.1 miles | 1985 | 1,270,204 | 91.0% | $20.00 – $27.00 |
| Fifth Third Center | Cleveland, OH | 0.2 miles | 1991 | 508,400 | 89.7% | $19.00 – $23.00 |
| One Cleveland Center | Cleveland, OH | 0.4 miles | 1983 | 545,028 | 89.0% | $22.00 |
| Skylight Office Tower | Cleveland, OH | 0.2 miles | 1990 | 321,311 | 90.0% | $17.00 – $25.00 |
| (1) | Information obtained from the appraisal and the underwritten rent roll. |
The Borrowers.The borrower is 127 PS Fee Owner LLC, a Delaware limited liability company and a single purpose entity with one independent director. Legal counsel to the borrowers delivered a non-consolidation opinion in connection with the origination of the Key Center Cleveland Whole Loan. Frank T. Sinito and his wife, Malisse J. Sinito are the guarantors of certain nonrecourse carveouts under the Key Center Cleveland Whole Loan.
THE INFORMATION IN THIS STRUCTURAL AND COLLATERAL TERM SHEET IS NOT COMPLETE AND MAY BE AMENDED PRIOR TO THE TIME OF SALE. THIS TERM SHEET IS NOT AN OFFER TO SELL THESE SECURITIES AND IT IS NOT A SOLICITATION OF AN OFFER TO BUY THESE SECURITIES IN ANY JURISDICTION WHERE THE OFFER OR SALE IS NOT PERMITTED.
| 123 |
| KEY CENTER CLEVELAND |
The Sponsor.The sponsor is Frank T. Sinito and his wife, Malisse J. Sinito. Frank T. Sinito is the CEO and President of Millennia Companies which he founded in 1995. Millennia Companies owns and manages over 200 multifamily communities totaling over 20,000 residential units across 22 states. The sponsorship includes a joint venture between Frank T. Sinito and Lubert Adler, an institutional real estate fund. Frank T. Sinito and Lubert Adler own 38.3% controlling interest and 24.4% non-controlling, limited interest in the borrowing entity, respectively.
Escrows.The loan documents provide for upfront reserves of $1,540,363 for real estate taxes, $55,406 for insurance premiums, $18,271,556 for planned capital improvements for Key Tower and the Marriott Cleveland Downtown, $18,461,400 for outstanding tenant improvements related to Forest City and Millennia, $5,608,359 for outstanding tenant improvements related to Thompson Hine LLP (which amount was funded by the seller of the Key Center Cleveland property and is being held by a third party escrow agent, and not by the lender), $4,652,415 for a property improvement plan expected to be incurred at the Marriott Cleveland Downtown in connection with the anticipated renewal of the management agreement with Marriott in 2021, $64,625 for deferred maintenance and $1,991,429 for hotel FF&E. Additionally, at origination, the borrower provided two letters of credit in the aggregate amount of $5,175,296 to cover free rent associated with the Forest City and Millennia tenants. Provided no event of default has occurred, at the borrower’s request, and subject to the conditions set forth in the loan agreement, such letters of credit may be reduced to reflect the burn-off of the respective tenant’s free rent period.
The loan documents also provide for ongoing monthly reserves of $770,181 for real estate taxes; $27,703 for insurance premiums; $29,284 for replacement reserves (subject to a cap of $1,757,065); $110,513 for TI/LCs and $5,000 for ground rent. On a monthly basis the borrower is required to deposit an amount equal to 1/12 of 5.00% (or if Marriott Corporation or an affiliate is the hotel manager, 4.00%) of gross hotel revenues unless (a) Marriott Corporation or an affiliate thereof is the hotel manager, (b) the borrower is required to reserve with the hotel manager an amount not less than the FF&E payment required under the Key Center Cleveland Whole Loan documents, and (c) no event of default is continuing. In the event that a property improvement plan (“PIP”) is required pursuant to the applicable hotel management agreement, borrower will be required to deposit on a monthly basis, all excess cash flow, until an amount equal to 110% of the costs of such a PIP (exclusive of any portion of the PIP which is duplicative of any of the approved FF&E that has already been reserved for) has been deposited into the PIP reserve account.
Lockbox and Cash Management.The Key Center Cleveland Whole Loan requires a lender-controlled lockbox account, which is already in place. The borrower was required at origination to deliver tenant direction letters instructing all tenants to pay their rents and (if Marriott Corporation or an affiliate is not the hotel manager) all credit card companies under merchant agreements to pay receipts directly into such lockbox account. All checks and cash received from the hotel manager by the borrower or the property manager are required to be deposited into the lockbox account immediately upon receipt; provided that, so long as Marriott or its affiliate is the hotel manager, Marriott is only required to deposit net proceeds payable to the borrower into the lockbox. The funds on deposit in the lockbox account are required to be transferred daily to the cash management account under the control of the lender. On each due date, the Key Center Cleveland Whole Loan documents require that all amounts on deposit in the cash management account will be applied to fund reserves and pay debt service (and mezzanine debt service), and (i) to the extent that a Key Center Trigger Period (as defined below) has occurred and is continuing, remaining funds after payment of operating expenses are transferred into an excess cash flow account to be held by the lender as additional collateral and (ii) to the extent that no Key Center Trigger Period exists, be disbursed to the borrower in accordance with the loan documents. Upon an event of default under the Key Center Cleveland Whole Loan documents, the lender may apply the funds in the cash management account in such priority as it may determine.
A “Key Center Trigger Period” means a period (A) commencing upon the earliest of: (i) the occurrence and continuance of an event of default, (ii) the combined mortgage and mezzanine debt service coverage ratio being less than (a) 1.05x through January 31, 2019 or (b) 1.10x at any time thereafter, (iii) the occurrence of a Key Center Specified Tenant Trigger Period (as defined below) or (iv) the occurrence of a Hotel Management Trigger Period (as defined below), and (B) expiring upon: (i) with regard to any Key Center Trigger Period commenced in connection with clause (A)(i) above, the cure (if applicable) of such event of default, (ii) with regard to any Key Center Trigger Period commenced in connection with clause (A)(ii) above, the date that the combined debt service coverage ratio is equal to or greater (a) 1.10x for one calendar quarter through January 31, 2019 and (b) 1.15x for one calendar quarter thereafter, (iii) with regard to any Key Center Trigger Period commenced in connection with clause (A)(iii) above, a Key Center Specified Tenant Trigger Period ceasing to exist and (iv) with regard to any Key Center Trigger Period commenced in connection with clause (A)(iv) above, a Hotel Management Trigger Period ceasing to exist.
A “Key Center Specified Tenant Trigger Period” means a period: (A) commencing upon the first to occur of (i) any Key Center Specified Tenant (as defined below) being in default under its lease beyond applicable grace and cure periods set forth therein, (ii) any Key Center Specified Tenant failing to be in actual, physical possession of any portion of the applicable space in excess of 20,000 square feet (except as a result of a qualified casualty event), (iii) any Key Center Specified Tenant giving notice that it is terminating its lease for all or any portion of the space (or applicable portion thereof) (other than as a result of an exercise of a contraction option set forth in the lease at origination), (iv) any termination or cancellation of any Key Center Specified Tenant lease (including, without limitation, rejection in any bankruptcy or similar insolvency proceeding) and/or any Key Center Specified Tenant lease failing to otherwise be in full force and effect, (v) any bankruptcy or similar insolvency of any Key Center Specified Tenant, (vi) any Key Center Specified Tenant failing to extend or renew its lease on or prior to the earlier to occur of (a) the date occurring one (1) year prior to the expiration of the then applicable term of the applicable Key Center Specified Tenant lease or (b) the renewal notice date (if any) set forth in the applicable Key Center Specified Tenant lease for a term of at least 5 years, (vii) any Key Center Specified Tenant ceasing to maintain for at least one calendar quarter a long-term unsecured debt rating of at least “BBB-” from S&P and an equivalent rating from each of the other Rating Agencies which rate such entity, and (viii) any termination or cancellation of the Key Center Specified Tenant lease to any portion (but less than all) of the Key Center Specified Tenant space; and (B) expiring upon the first to occur of the lender’s receipt of evidence reasonably acceptable to the lender (which such evidence includes a duly executed estoppel certificate from the applicable Key Center Specified Tenant in form and substance acceptable to the lender) of: (i) the satisfaction of the Key Center Specified Tenant Cure Conditions (defined below) or (ii) the borrower leasing the entire Key Center Specified Tenant space (or applicable portion thereof that was partially terminated) in accordance with the applicable terms and
THE INFORMATION IN THIS STRUCTURAL AND COLLATERAL TERM SHEET IS NOT COMPLETE AND MAY BE AMENDED PRIOR TO THE TIME OF SALE. THIS TERM SHEET IS NOT AN OFFER TO SELL THESE SECURITIES AND IT IS NOT A SOLICITATION OF AN OFFER TO BUY THESE SECURITIES IN ANY JURISDICTION WHERE THE OFFER OR SALE IS NOT PERMITTED.
| 124 |
| KEY CENTER CLEVELAND |
conditions of the Key Center Cleveland Whole Loan documents, the applicable tenant under such lease being in actual, physical occupancy of the space demised under its lease and paying the full amount of the rent due under its lease and the borrower depositing into the leasing reserve account funds (which, to the extent that the excess cash flow account contains sufficient funds therefor, shall be transferred from the excess cash flow account to the leasing reserve account) sufficient to pay any leasing costs as reasonably expected to be incurred by the borrower in connection with re-leasing the applicable Key Center Specified Tenant space and applicable to the Key Center Specified Tenant space.
A “Key Center Specified Tenant” means, as applicable, (i) KeyBank National Association, (ii) any other lessee(s) of more than 20,000 square feet of the space occupied by KeyBank National Association at origination (or any portion thereof), and (iii) any guarantor(s) of such lease.
“Key Center Specified Tenant Cure Conditions” means the receipt by the lender of evidence reasonably satisfactory to the lender of the following, as applicable: (i) the applicable Key Center Specified Tenant has cured all defaults under the applicable Key Center Specified Tenant lease, (ii) the applicable Key Center Specified Tenant is in actual, physical possession of the Key Center Specified Tenant space (or applicable portion thereof) and the applicable Key Center Specified Tenant is paying full, unabated rent under the applicable Key Center Specified Tenant lease, (iii) the applicable Key Center Specified Tenant has revoked or rescinded all termination or cancellation notices with respect to the applicable Key Center Specified Tenant lease and has re-affirmed the applicable Key Center Specified Tenant lease as being in full force and effect, (iv) in the event the Key Center Specified Tenant Trigger Period is due to the applicable Key Center Specified Tenant’s failure to extend or renew the applicable Key Center Specified Tenant lease in accordance with clause (A)(vi) of the definition of “Key Center Specified Tenant Trigger Period”, the applicable Key Center Specified Tenant has renewed or extended the applicable Key Center Specified Tenant lease in accordance with the terms of the Key Center Cleveland Whole Loan documents for a term of at least 5 years, (v) with respect to any applicable bankruptcy or insolvency proceedings involving the applicable Key Center Specified Tenant and/or the applicable Key Center Specified Tenant lease, the applicable Key Center Specified Tenant is no longer insolvent or subject to any bankruptcy or insolvency proceedings and has affirmed the applicable Key Center Specified Tenant lease pursuant to final, non-appealable order of a court of competent jurisdiction, (vi) in the event the Key Center Specified Tenant Trigger Period is due to clause (A)(vii) of the definition of “Key Center Specified Tenant Trigger Period”, the applicable Key Center Specified Tenant with respect to which such trigger occurred satisfies the credit requirements, and (vii) in the event the Key Center Specified Tenant Trigger Period is due to the borrower having deposited or caused to be deposited into the reserve account, an amount equal to $50 per square foot terminated.
“Hotel Management Trigger Period” means a period: (A) commencing upon the first to occur of: (i) the occurrence of a default by the borrower or hotel manager under the hotel management agreement, which default continues beyond any applicable grace or cure period, (ii) the borrower or hotel manager giving notice that it is terminating the hotel management agreement or hotel manager failing to renew the hotel management agreement not later than December 31, 2020, (iii) a PIP is required in connection with any hotel management agreement (including, but not limited to, as a result of the exercise of hotel manager’s rights pursuant to the hotel management agreement to require, from time to time, a PIP), (iv) any notice of termination, non-renewal or cancellation of the hotel management agreement (including, without limitation, rejection in any bankruptcy or similar insolvency proceeding) and/or the hotel management agreement failing to otherwise be in full force and effect, (v) any bankruptcy or similar insolvency of hotel manager, (vi) the hotel failing to be operated, “flagged” and/or branded pursuant to the hotel management agreement, and (vii) any permit required pursuant to the hotel management agreement ceasing to be in full force in effect; and (B) expiring upon the first to occur of the lender’s receipt of evidence reasonably acceptable to the lender (which such evidence includes, without limitation, a duly executed estoppel certificate from the hotel manager in form and substance reasonably acceptable to the lender) of: (1) the satisfaction of the Hotel Management Cure Conditions (defined below), and (2) the branding, “flagging” and operation of the hotel pursuant to a hotel management agreement entered into in accordance with the terms of the Key Center Cleveland Whole Loan documents and the (which agreement is in full force and effect with no defaults thereunder) and the deposit into a PIP reserve account of an amount equal to any required PIP deposit (if any).
“Hotel Management Cure Conditions” means each of the following, as applicable: (i) all defaults have been cured under the hotel management agreement to the satisfaction of the non-defaulting party, (ii) the borrower and the applicable hotel manager have re-affirmed in writing the hotel management agreement as being in full force and effect, (iii) with respect to any applicable bankruptcy or insolvency proceedings involving the applicable hotel manager and/or hotel management agreement, such hotel manager is no longer insolvent or subject to any bankruptcy or insolvency proceedings and has affirmed such hotel management agreement pursuant to a final, non-appealable order of a court of competent jurisdiction, (iv) the hotel continues to be operated, “flagged” and branded pursuant to the hotel management agreement, (v) all permits applicable to the related hotel management agreement are in full force and effect, and (vi) any required PIP reserve has been deposited.
Property Management.The Key Center Cleveland Property is managed by Millennia Housing Management, Ltd., Jacobs Real Estate Services LLC, Marriott Hotel Services, Inc. and SP Plus Corporation.
Assumption.The Borrowers have the right to transfer the Key Center Cleveland Property provided that certain conditions are satisfied, including (i) no event of default has occurred and is continuing; (ii) the lender reasonably determines that the proposed transferee and guarantor satisfy the lender’s credit review and underwriting standards, taking into consideration the transferee’s experience, financial strength and general business standing; and (iii) the lender has received confirmation from Fitch, KBRA, and Moody’s that such assumption will not result in a downgrade, withdrawal or qualification of the respective ratings assigned to the Series 2017-BNK4 certificates and similar confirmations from each rating agency rating any securities backed by any Key Center Cleveland Companion Loans with respect to the ratings of such securities.
Partial Release.Not permitted.
Real Estate Substitution.Not permitted.
THE INFORMATION IN THIS STRUCTURAL AND COLLATERAL TERM SHEET IS NOT COMPLETE AND MAY BE AMENDED PRIOR TO THE TIME OF SALE. THIS TERM SHEET IS NOT AN OFFER TO SELL THESE SECURITIES AND IT IS NOT A SOLICITATION OF AN OFFER TO BUY THESE SECURITIES IN ANY JURISDICTION WHERE THE OFFER OR SALE IS NOT PERMITTED.
| 125 |
| KEY CENTER CLEVELAND |
Subordinate and Mezzanine Indebtedness. Concurrently with the funding of the Key Center Cleveland Whole Loan, ACREFI Mortgage Lending, LLC funded a $42,500,000 mezzanine loan (the “Key Center Cleveland Mezzanine Loan”) to 127 PS Mezz Borrower LLC, the sole member of the borrower under the Key Center Cleveland Whole Loan. The Key Center Cleveland Mezzanine Loan accrues interest at an interest rate of 12.750%per annum. The Key Center Cleveland Mezzanine Loan had an initial term of 120 months, has a remaining term of 118 months as of the Cut-off Date and requires interest-only payments through the through the first 24 payments then requires principal and interest payments based on a 25-year amortization schedule through the term of the Key Center Cleveland Mezzanine Loan. The Key Center Cleveland Mezzanine Loan has the same maturity date as the Key Center Cleveland Whole Loan.
Ground Lease. The City of Cleveland, Ohio owns the land beneath the parking lot and leases it to the borrower through 2059 with one 34-year extension through 2093 (“Parking Ground Lease”). The ground lease requires that at least 45% of the parking spaces be reserved for transient parking and hotel guests and the remainder of the parking spaces may be leased on a monthly basis. Minimum base rent paid to the city under the Parking Ground Lease is $60,000 per year provided that if the revenue exceeds certain breakpoints (based on the percentage of parking space leased on a monthly basis), percentage rent will also be payable.
Terrorism Insurance.The loan documents require that the “all risk” insurance policy required to be maintained by the borrower provide coverage for terrorism in an amount equal to the full replacement cost of the Key Center Cleveland Property, as well as business interruption insurance covering no less than the 18-month period following the occurrence of a casualty event, together with a 12-month extended period of indemnity.
Right of First Refusal. The hotel manager, Marriott Hotel Services, Inc., has a right of first refusal in connection with any proposed bona fide offer to purchase the hotel portion of the Mortgaged Property. The hotel management agreement states that such right of first refusal is subordinate to the mortgage so long as (i) in the event the lender comes into possession of the hotel portion of the property by virtue of a foreclosure or deed-in-lieu thereof of the Mortgaged Property, Marriott Hotel Services, Inc. may not be disturbed in its rights under the hotel management agreement, and (ii) no other event has happened or condition exists that allows the borrower to terminate the hotel management.
THE INFORMATION IN THIS STRUCTURAL AND COLLATERAL TERM SHEET IS NOT COMPLETE AND MAY BE AMENDED PRIOR TO THE TIME OF SALE. THIS TERM SHEET IS NOT AN OFFER TO SELL THESE SECURITIES AND IT IS NOT A SOLICITATION OF AN OFFER TO BUY THESE SECURITIES IN ANY JURISDICTION WHERE THE OFFER OR SALE IS NOT PERMITTED.
| 126 |
(THIS PAGE INTENTIONALLY LEFT BLANK)
| 127 |
| No. 11 – DoubleTree Greenway Houston | ||||||||
| Loan Information | Property Information | |||||||
| Mortgage Loan Seller: | Morgan Stanley Mortgage Capital Holdings LLC | Single Asset/Portfolio: | Single Asset | |||||
| Credit Assessment (Fitch/KBRA/Moody’s): | NR/NR/NR | Property Type: | Hospitality | |||||
| Original Principal Balance: | $39,000,000 | Specific Property Type: | Full Service | |||||
| Cut-off Date Balance: | $38,901,583 | Location: | Houston, TX | |||||
| % of Initial Pool Balance: | 3.9% | Size: | 388 Rooms | |||||
| Loan Purpose: | Acquisition | Cut-off Date Balance Per Room: | $100,262 | |||||
| Borrower Name: | Blue River Hospitality LLC | Year Built/Renovated: | 1975/2015 | |||||
| Sponsor: | Navika Capital Group LLC | Title Vesting: | Fee | |||||
| Mortgage Rate: | 5.060% | Property Manager: | Yashodhar Management Co., L.L.C. | |||||
| Note Date: | January 25, 2017 | 4thMost Recent Occupancy (As of): | 68.8% (12/31/2012) | |||||
| Anticipated Repayment Date: | NAP | 3rdMost Recent Occupancy (As of): | 71.4% (12/31/2013) | |||||
| Maturity Date: | February 1, 2027 | 2ndMost Recent Occupancy (As of): | 72.0% (12/31/2014) | |||||
| IO Period: | None | Most Recent Occupancy (As of): | 68.1% (12/31/2015) | |||||
| Loan Term (Original): | 120 months | Current Occupancy (As of): | 68.5% (11/30/2016) | |||||
| Seasoning: | 2 months | |||||||
| Amortization Term (Original): | 360 months | Underwriting and Financial Information: | ||||||
| Loan Amortization Type: | Amortizing Balloon | |||||||
| Interest Accrual Method: | Actual/360 | 4thMost Recent NOI (As of)(2): | $3,844,099 (12/31/2013) | |||||
| Call Protection: | L(26),D(90),O(4) | 3rdMost Recent NOI (As of)(2): | $5,586,253 (12/31/2014) | |||||
| Lockbox Type: | Springing | 2ndMost Recent NOI (As of): | $5,981,892 (12/31/2015) | |||||
| Additional Debt: | No | Most Recent NOI (As of): | $5,632,160 (TTM 11/30/2016) | |||||
| Additional Debt Type: | NAP | |||||||
| U/W Revenues: | $20,924,859 | |||||||
| U/W Expenses: | $15,371,708 | |||||||
| U/W NOI: | $5,553,151 | |||||||
| U/W NCF: | $4,716,157 | |||||||
| U/W NOI DSCR: | 2.20x | |||||||
| Escrows and Reserves: | U/W NCF DSCR: | 1.86x | ||||||
| U/W NOI Debt Yield: | 14.3% | |||||||
| Type: | Initial | Monthly | Cap (If Any) | U/W NCF Debt Yield: | 12.1% | |||
| Taxes | $81,868 | $81,868 | NAP | As-Is Appraised Value: | $63,100,000 | |||
| Insurance | $10,771 | $10,771 | NAP | As-Is Appraisal Valuation Date: | December 14, 2016 | |||
| FF&E Reserve | $0 | $34,875(1) | NAP | Cut-off Date LTV Ratio: | 61.7% | |||
| PIP Reserve | $2,000,000 | $0 | NAP | LTV Ratio at Maturity or ARD: | 50.9% | |||
| (1) | Required monthly FF&E reserve deposits are 1/12 of (i) 2% of operating income until March 1, 2018, (ii) 3% of operating income until March 1, 2019, and (iii) 4% of operating income thereafter. |
| (2) | See “Cash Flow Analysis” section. |
The DoubleTree Greenway Houston mortgage loan is evidenced by a single promissory note secured by a first mortgage encumbering a 21-story, 388-room full service hotel located in Houston, Texas (the “DoubleTree Greenway Houston Property”). Built in 1975 and renovated between 2013 and 2015, the DoubleTree Greenway Houston Property features 150 king guestrooms, 170 queen/queen guestrooms, 62 queen guestrooms and 6 full suites. Amenities at the DoubleTree Greenway Houston Property include two restaurants, a café (Starbucks), 26,962 square feet of meeting space, an outdoor pool, a fitness center, a market pantry and a parking garage. The renovations since 2013 reportedly cost approximately $11.7 million ($30,155 per room) and include a major reflagging PIP. The DoubleTree Greenway Houston Property has a new 15-year franchise agreement that expires January 31, 2032. At origination, the borrower reserved $2,000,000 for a 12-month change of ownership property improvement plan. According to the appraisal, the 2016 market mix of the DoubleTree Greenway Houston Property was 60% commercial, 25% meeting and group, and 15% leisure.
The DoubleTree Greenway Houston Property is located six miles southwest of the Houston central business district within the 52-acre Greenway Plaza, a planned mixed-use development off I-69/US 59. Greenway Plaza is comprised of ten interconnected commercial buildings ranging from 11 to 34 stories and encompassing more than 4.3 million square feet of office space. Within Greenway Plaza there are a variety of dining options ranging from an underground food court to upscale restaurants. The DoubleTree Greenway Houston Property is connected to the neighboring office buildings within Greenway Plaza via underground passageways and is situated across the street from Lakewood Church, the nation’s largest church by congregation and former home of the Houston Rockets NBA franchise.
THE INFORMATION IN THIS STRUCTURAL AND COLLATERAL TERM SHEET IS NOT COMPLETE AND MAY BE AMENDED PRIOR TO THE TIME OF SALE. THIS TERM SHEET IS NOT AN OFFER TO SELL THESE SECURITIES AND IT IS NOT A SOLICITATION OF AN OFFER TO BUY THESE SECURITIES IN ANY JURISDICTION WHERE THE OFFER OR SALE IS NOT PERMITTED.
| 128 |
| DOUBLETREE GREENWAY HOUSTON |
According to the appraisal, additions to supply in the Houston market include the construction of an unflagged 240-room full service hotel that is expected to open in 2018. The appraisal deemed this new hotel to be 70% competitive with the DoubleTree Greenway Houston Property.
Sources and Uses
| Sources | Uses | |||||||
| Original loan amount | $39,000,000 | 62.7% | Purchase price | $59,000,000 | 94.9% | |||
| Sponsor’s new cash contribution | 23,185,166 | 37.3 | Reserves | 2,092,639 | 3.4 | |||
| Closing costs | 1,092,526 | 1.8 | ||||||
| Total Sources | $62,185,166 | 100.0% | Total Uses | $62,185,166 | 100.0% |
Subject and Market Historical Occupancy, ADR and RevPAR(1)
Competitive Set | DoubleTree Greenway Houston(2) | Penetration Factor | |||||||
Year | Occupancy | ADR | RevPAR | Occupancy | ADR | RevPAR | Occupancy | ADR | RevPAR |
| 11/30/2016 TTM | 68.6% | $142.82 | $98.02 | 68.5% | $144.04 | $98.72 | 99.9% | 100.9% | 100.7% |
| 11/30/2015 TTM | 76.2% | $146.14 | $111.30 | 67.2% | $152.97 | $102.87 | 88.3% | 104.7% | 92.4% |
| 11/30/2014 TTM | 76.1% | $151.55 | $115.25 | 71.0% | $143.90 | $102.10 | 93.3% | 95.0% | 88.6% |
| (1) | Information obtained from a third party hospitality research report dated December 19, 2016. The competitive set includes: Crowne Plaza Houston River Oaks, Royal Sonesta Houston, Hilton Houston Post Oak, Marriott Houston West Loop By Galleria, Marriott Houston at the Texas Medical Center, Omni Houston Hotel and Hotel Derek. |
| (2) | Variances between the underwriting, the appraisal and the above table with respect to Occupancy, ADR and RevPAR at the DoubleTree Greenway Houston Property are attributable to variances in reporting methodologies and/or timing differences. |
Operating History and Underwritten Net Cash Flow. The following table presents certain information relating to the historical operating performance and the underwritten net cash flow at the DoubleTree Greenway Houston Property:
Cash Flow Analysis
| 2013(1) | 2014(1) | 2015(1) | TTM 11/30/2016(1) | U/W | % of U/W Total Revenue | U/W $ per Room | ||||||||
| Occupancy | 71.4% | 72.0% | 68.1% | 68.5% | 68.5% | |||||||||
| ADR | $136.35 | $143.63 | $152.28 | $144.04 | $144.04 | |||||||||
| RevPAR | $97.30 | $103.38 | $103.71 | $98.73 | $98.73 | |||||||||
| Room Revenue | $13,892,937 | $14,641,131 | $14,687,291 | $14,019,534 | $13,981,229 | 66.8% | $36,034 | |||||||
| F&B Revenue | 5,146,250 | 4,942,999 | 5,198,928 | 5,301,115 | 5,286,631 | 25.3 | 13,625 | |||||||
| Other Revenue(2) | 1,278,419 | 1,620,980 | 1,702,558 | 1,661,538 | 1,656,999 | 7.9 | 4,271 | |||||||
| Total Revenue | $20,317,606 | $21,205,110 | $21,588,777 | $20,982,187 | $20,924,859 | 100.0% | $53,930 | |||||||
| Total Department Expenses | 7,376,786 | 6,704,096 | 6,699,268 | 6,724,063 | 6,705,691 | 32.0 | 17,283 | |||||||
| Gross Operating Profit | $12,940,820 | $14,501,014 | $14,889,509 | $14,258,124 | $14,219,168 | 68.0% | $36,647 | |||||||
| Total Undistributed Expenses | 6,613,442 | 6,780,808 | 6,823,875 | 6,691,354 | 6,673,072 | 31.9 | 17,199 | |||||||
| Profit Before Fixed Charges | $6,327,378 | $7,720,206 | $8,065,634 | $7,566,770 | $7,546,096 | 36.1% | $19,449 | |||||||
| Total Fixed Charges | 2,483,279 | 2,133,953 | 2,083,742 | 1,934,610 | 1,992,945 | 9.5 | 5,136 | |||||||
| Net Operating Income | $3,844,099(3) | $5,586,253(3) | $5,981,892 | $5,632,160 | $5,553,151 | 26.5% | $14,312 | |||||||
| FF&E | 787,374 | 848,204 | 863,498 | 839,279 | 836,994 | 4.0 | 2,157 | |||||||
| Net Cash Flow | $3,056,725 | $4,738,049 | $5,118,394 | $4,792,881 | $4,716,157 | 22.5% | $12,155 | |||||||
| NOI DSCR | 1.52x | 2.21x | 2.36x | 2.23x | 2.20x | |||||||||
| NCF DSCR | 1.21x | 1.87x | 2.02x | 1.89x | 1.86x | |||||||||
| NOI DY | 9.9% | 14.4% | 15.4% | 14.5% | 14.3% | |||||||||
| NCF DY | 7.9% | 12.2% | 13.2% | 12.3% | 12.1% | |||||||||
| (1) | Occupancy, ADR and RevPAR figures are based on the underwriting, which have been taken from financial statements provided by the Doubletree Greenway Houston Borrower. Variances between the underwriting, the appraisal and the Subject and Market Historical Occupancy, ADR and RevPAR table with respect to Occupancy, ADR and RevPAR at the Doubletree Greenway Houston Property are attributable to variances in reporting methodologies and/or timing differences. |
| (2) | Other revenues consist of income from parking, the gift shop, guest communication, guest laundry, in-house movies and ATM fees. |
| (3) | Net Operating Income between 2013 and 2014 increased mostly due to the completion of the conversion to a DoubleTree by Hilton flag. |
THE INFORMATION IN THIS STRUCTURAL AND COLLATERAL TERM SHEET IS NOT COMPLETE AND MAY BE AMENDED PRIOR TO THE TIME OF SALE. THIS TERM SHEET IS NOT AN OFFER TO SELL THESE SECURITIES AND IT IS NOT A SOLICITATION OF AN OFFER TO BUY THESE SECURITIES IN ANY JURISDICTION WHERE THE OFFER OR SALE IS NOT PERMITTED.
| 129 |
| No. 12 – American Greetings HQ | |||||||
| Loan Information | Property Information | ||||||
| Mortgage Loan Seller: | Bank of America, N.A. | Single Asset/Portfolio: | Single Asset | ||||
Credit Assessment (Fitch/KBRA/Moody’s): | NR/NR/NR | Property Type: | Office | ||||
| Original Principal Balance(1): | $38,000,000 | Specific Property Type: | Suburban | ||||
| Cut-off Date Balance(1): | $37,669,589 | Location: | Westlake, OH | ||||
| % of Initial Pool Balance: | 3.7% | Size: | 655,969 SF | ||||
| Loan Purpose: | Refinance | Cut-off Date Balance Per SF(1): | $139.03 | ||||
| Borrower Name: | AG HQ Creative Studios, LLC | Year Built/Renovated: | 2016/NAP | ||||
| Sponsor: | H L & L Property Company | Title Vesting: | Leasehold | ||||
| Mortgage Rate: | 4.716% | Property Manager: | Self-managed | ||||
| Note Date: | October 5, 2016 | 4thMost Recent Occupancy (As of): | NAV | ||||
| Anticipated Repayment Date: | NAP | 3rdMost Recent Occupancy (As of): | NAV | ||||
| Maturity Date: | November 1, 2026 | 2ndMost Recent Occupancy (As of): | NAV | ||||
| IO Period: | None | Most Recent Occupancy (As of): | 100.0% (12/31/2016) | ||||
| Loan Term (Original): | 120 months | Current Occupancy (As of): | 100.0% (4/1/2017) | ||||
| Seasoning: | 5 months | ||||||
| Amortization Term (Original): | 300 months | Underwriting and Financial Information: | |||||
| Loan Amortization Type: | Amortizing Balloon | ||||||
| Interest Accrual Method: | Actual/360 | 4thMost Recent NOI (As of)(3): | NAV | ||||
| Call Protection: | L(29),D(87),O(4) | 3rdMost Recent NOI (As of)(3): | NAV | ||||
| Lockbox Type: | Hard/Springing Cash Management | 2ndMost Recent NOI (As of)(3): | NAV | ||||
| Additional Debt(1): | Yes | Most Recent NOI (As of)(3): | NAV | ||||
| Additional Debt Type(1): | Pari Passu; State of Ohio Subordinate Secured Loan | ||||||
| U/W Revenues(3): | $10,382,494 | ||||||
| U/W Expenses(3): | $513,508 | ||||||
| U/W NOI(3): | $9,868,986 | ||||||
| U/W NCF(3): | $9,114,622 | ||||||
| Escrows and Reserves: | U/W NOI DSCR(1): | 1.57x | |||||
| U/W NCF DSCR(1): | 1.45x | ||||||
| Type: | Initial | Monthly | Cap (If Any) | U/W NOI Debt Yield(1): | 10.8% | ||
| Taxes | $0 | Springing | NAP | U/W NCF Debt Yield(1): | 10.0% | ||
| Insurance | $0 | Springing | NAP | As-Is Appraised Value(4): | $148,790,000 | ||
| TI/LC Reserve | $0 | $54,664 | NAP | As-Is Appraisal Valuation Date(4): | August 30, 2016 | ||
| Ground Rent Reserve | $50,675 | Springing | NAP | Cut-off Date LTV Ratio(1): | 61.3% | ||
| Other Reserves(2) | $15,653,716 | $0 | NAP | LTV Ratio at Maturity or ARD(1): | 45.7% | ||
| (1) | All statistical information related to balances per SF, loan-to-value ratios, debt service coverage ratios and debt yields are based on The American Greetings HQ whole loan. The American Greetings HQ Property also secures a ten year subordinate mortgage loan, which had an original principal balance of $15,000,000. The Cut-off Date Balance per SF, Maturity Date Balance per SF, UW NCF DSCR, UW NOI Debt Yield, UW NOI Debt Yield at Maturity, Cut-off Date LTV Ratio and Maturity Date LTV Ratio numbers including the subordinate mortgage are $161, $104, 1.11x, 9.3%, 14.5%, 71.2% and 45.7%, respectively. |
| (2) | Other reserves include a $13,041,716 cash reserve and a $2,612,000 letter of credit for all outstanding costs incurred for the completion of the American Greetings HQ Property that have not yet been disbursed. |
| (3) | See “Cash Flow Analysis” section. |
| (4) | The American Greetings HQ Property was given a “Dark” Value of $92,590,000 by the appraiser. |
The American Greetings HQ mortgage loan is part of a whole loan that is evidenced by threepari passu senior promissory notes secured by a leasehold mortgage encumbering the air rights-leasehold interests and sub-leasehold interests in the office portion of two buildings which is solely occupied by American Greetings Corporation (“American Greetings”), known as the American Greetings HQ (the “American Greetings HQ Property”) located in Westlake, Ohio. The American Greetings HQ whole loan was originated on October 5, 2016 by Bank of America, N.A. The American Greetings HQ whole loan had an original principal balance of $92,000,000, has an outstanding principal balance as of the Cut-off Date of $91,200,058 and accrues interest at an interest rate of 4.716%per annum. The American Greetings HQ whole loan had an initial term of 120 months, has a remaining term of 115 months as of the Cut-off Date and requires principal and interest payments based on a 25-year amortization schedule through the term of the American Greetings HQ whole loan. The American Greetings HQ whole loan matures on November 1, 2026.
The American Greetings HQ Property also secures a subordinate loan with a Cut-off Date principal balance of $14,708,996 payable to the Director of the Ohio Development Services Agency (the “American Greetings HQ State of Ohio Subordinate Secured Loan”). The American Greetings HQ State of Ohio Subordinate Secured Loan carries an interest rate of 5.0% (plus a 0.25% annual service fee on the outstanding principal balance), has initial payments of interest only for the first 29 payments then fully amortizes over the remaining term, matures on January 1, 2027, and is guaranteed by three affiliates of American Greetings. The American Greetings HQ State of Ohio Subordinate Secured Loan is subordinate to the American Greetings HQ whole loan pursuant to a subordination and
THE INFORMATION IN THIS STRUCTURAL AND COLLATERAL TERM SHEET IS NOT COMPLETE AND MAY BE AMENDED PRIOR TO THE TIME OF SALE. THIS TERM SHEET IS NOT AN OFFER TO SELL THESE SECURITIES AND IT IS NOT A SOLICITATION OF AN OFFER TO BUY THESE SECURITIES IN ANY JURISDICTION WHERE THE OFFER OR SALE IS NOT PERMITTED.
| 130 |
| AMERICAN GREETINGS HQ |
intercreditor agreement. The loan-to-value ratio as of the Cut-off Date and underwritten net cash flow debt service coverage ratio calculated for the American Greetings HQ whole loan including the American Greetings HQ State of Ohio Subordinate Secured Loan are 71.2% and 1.11x, respectively.
The American Greetings HQ mortgage loan, evidenced by the controlling Note A-1-1, which will be contributed to the BANK 2017-BNK4 trust, had an original principal balance of $38,000,000 and has an outstanding principal balance as of the Cut-off Date of $37,669,589. Note A-1-2 had an original principal balance of $27,000,000 and was contributed to the MSC 2016-BNK2 trust. Note A-2 had an original principal balance of $27,000,000 and was contributed to the MSBAM 2016-C32 trust. See “Description of the Mortgage Pool—The Whole Loans—The Serviced Pari Passu Whole Loans” in the Preliminary Prospectus.
Note Summary
| Notes | Original Balance | Note Holder(1) | Controlling Interest | |
| A-1-1 | $38,000,000 | BANK 2017-BNK4 | Yes | |
| A-1-2 | $27,000,000 | MSC 2016-BNK2 | No | |
| A-2 | $27,000,000 | MSBAM 2016-C32 | No | |
| Total | $92,000,000 |
Following the lockout period, the borrower has the right to defease the American Greetings HQ whole loan in whole, but not in part, on any date before August 1, 2026. In addition, the American Greetings HQ whole loan is prepayable without penalty on or after August 1, 2026.
Sources and Uses
| Sources | Uses | |||||||
| Original whole loan amount | $92,000,000 | 96.5% | Loan Payoff(1) | $80,300,000 | 84.2% | |||
| Sponsor Equity | 3,368,520 | 3.5 | Reserves | 13,092,391 | 13.7 | |||
| Closing costs | 1,976,129 | 2.1 | ||||||
| Total Sources | $95,368,520 | 100.0% | Total Uses | $95,368,520 | 100.0% |
| (1) | The American Greetings HQ borrower used the proceeds of the American Greetings HQ whole loan to repay a previous construction loan of approximately $86,300,000, of which an estimated $80,300,000 was allocated to the office portion currently encumbered by the American Greetings HQ whole loan. The remaining estimated $6,000,000 of the previous construction loan was allocated to the retail portion of the building which is not part of the collateral for the American Greetings HQ whole loan. |
The American Greetings HQ Property is comprised of the air rights leasehold interest in the 655,969 SF office portion of two buildings (the American Greetings building and the Tech West building located in Westlake, Ohio, which interest is owned pursuant to leases and subleases with the Cleveland-Cuyahoga County Port Authority, which were executed in order to accommodate tax exemptions. The American Greetings building contains 596,673 SF of office space and has five floors with an outdoor courtyard atrium beginning on the third floor featuring heated sidewalks, landscaped seating areas, a barbecue grill, fire pit and giant versions of corn hole, Jenga and Connect Four. The Tech West building contains 59,296 SF of office space and has three floors. The American Greetings HQ Property interiors feature open floor plans, artwork almost exclusively from American Greetings artists, a full-service Starbucks coffee shop, ATM, post office, dry-cleaning drop-off, private company store, full-service cafeteria and various casual meeting spaces, including coffee lounges on each floor. Additionally, the buildings include photo and audio studios, artist workshop spaces and a 10,000-volume reference library. The American Greetings building and Tech West building each have ground floor retail space totaling 92,000 SF, which is not included as collateral for the American Greetings HQ whole loan. The American Greetings building is attached via skyway to a non-collateral public multi-level garage, which is connected to the Tech West building. The public garage contains 1,253 spaces available for use for American Greetings during daytime hours. Additionally, there are 170 private spaces that are owned by American Greetings and included as collateral for the American Greetings HQ whole loan.
The American Greetings HQ Property is the southern anchor of Crocker Park, a mixed use development encompassing twelve city blocks that includes the American Greetings HQ Property, residential, retail and dining properties, a 120-room Hyatt Place hotel, a 24,000 SF civic center and performance space, two grocers, a fitness center and a 16-theater movie theater and an IMAX theater. The American Greetings HQ Property officially opened in September 2016 as a built-to-suit Class A world headquarters for American Greetings. American Greetings moved their headquarters and approximately 1,600 employees from Brooklyn, Ohio to the American Greetings HQ Property and occupies 100% of the NRA on a 15-year triple-net lease, beginning September 1, 2016 and expiring September 30, 2031 (with no renewal or termination options), at a fixed annual base rent of $16.19 PSF during the term of the lease.
American Greetings acquired the fee interest in a 14.5-acre site within Crocker Park in March, 2014 and has developed the site with a parking garage, parking lot, and retail space. American Greetings has ground leased the retail portion of the American Greetings HQ building to an affiliate and has ground leased the office portion, the American Greetings HQ Property, to the American Greetings HQ Borrower. The ground lease between American Greetings and the American Greetings HQ Borrower has a flat lease rate of $202,701 per year with no rental increases during the term of the American Greetings HQ whole loan, and expires in June 2089.
The American Greetings HQ borrower spent approximately $137.1 million on the development of the office improvements and American Greetings spent approximately $51.5 million on additional tenant improvements. To accommodate a sales tax exemption on the hard costs of construction, the predecessor to the American Greetings HQ Borrower entered into a “lease-leaseback” transaction with Cleveland-Cuyahoga County Port Authority which will expire in September 2020. In addition, the American Greetings HQ Property, together with the adjacent public parking garage and other internal roadways and public infrastructure
THE INFORMATION IN THIS STRUCTURAL AND COLLATERAL TERM SHEET IS NOT COMPLETE AND MAY BE AMENDED PRIOR TO THE TIME OF SALE. THIS TERM SHEET IS NOT AN OFFER TO SELL THESE SECURITIES AND IT IS NOT A SOLICITATION OF AN OFFER TO BUY THESE SECURITIES IN ANY JURISDICTION WHERE THE OFFER OR SALE IS NOT PERMITTED.
| 131 |
| AMERICAN GREETINGS HQ |
benefitting the American Greetings HQ Property, was financed with the proceeds of a tax incremental financing issued by the City of Westlake, Ohio (“TIF”). In connection with the TIF, the American Greetings HQ Property, along with other properties within the TIF district, received a 30-year exemption from any real estate tax increases related to the improvement of the TIF district parcels, which expires in December 2043.
Founded in 1906, American Greetings is a privately-held company managed by members of its founding family. American Greetings creates and manufactures paper greeting cards, gift packaging, party goods, stationary and giftware sold in retail outlets worldwide, distributes electronic greeting cards and digital content, and also designs and licenses characters such as “Care Bears”. American Greetings’ greeting card brands include American Greetings, Carlton Cards, Gibson, Recycled Paper Greetings, and Papyrus, and other paper product brands include DesignWare party goods, Plus Mark gift-wrap and boxed-cards and Date Works calendars. American Greetings’ internet brands include AmericanGreetings.com, BlueMountain.com, justwink.com and Cardstore.com.
As of their 2016 fiscal year-end, American Greetings had approximately 7,000 full-time employees and 20,500 part-time employees and generated annual revenues estimated at approximately $2 billion. The annual United States retail sales of greeting cards is estimated over $7 billion dollars. American Greetings estimates that its market share, as a percentage of total sales of greetings cards in North America, has increased from approximately 35% in 2007 to approximately 45% in 2016.
Thefollowing table presents certain information relating to the tenancies at theAmerican Greetings HQProperty:
Major Tenants
| Tenant Name | Credit Rating (Fitch/Moody’s/ S&P)(1) | Tenant NRSF | % of NRSF | Annual U/W Base Rent PSF | Annual U/W Base Rent | % of Total Annual U/W Base Rent | Lease Expiration Date |
| Major Tenants | |||||||
| American Greetings | NR/B2/BB- | 655,969 | 100.0% | $16.19 | $10,618,134 | 100.0% | 9/30/2031 |
| Total Major Tenants | 655,969 | 100.0% | $16.19 | $10,618,134 | 100.0% | ||
| Non-Major Tenants | 0 | 0.0% | $0.00 | $0 | 0.0% | ||
| Occupied Collateral Total | 655,969 | 100.0% | $16.19 | $10,618,134 | 100.0% | ||
| Vacant Space | 0 | 0.0% | |||||
| Collateral Total | 655,969 | 100.0% | |||||
| (1) | Certain ratings are those of the parent company whether or not the parent company guarantees the lease. |
The following table presents certain information relating to the lease rollover schedule at theAmerican Greetings HQProperty:
Lease Expiration Schedule(1)
Year Ending December 31, | No. of Leases Expiring | Expiring NRSF | % of Total NRSF | Cumulative Expiring NRSF | Cumulative % of Total NRSF | Annual U/W Base Rent | % of Total Annual U/W Base Rent | Annual U/W Base Rent PSF |
| MTM | 0 | 0 | 0.0% | 0 | 0.0% | $0 | 0.0% | $0.00 |
| 2017 | 0 | 0 | 0.0% | 0 | 0.0% | $0 | 0.0% | $0.00 |
| 2018 | 0 | 0 | 0.0% | 0 | 0.0% | $0 | 0.0% | $0.00 |
| 2019 | 0 | 0 | 0.0% | 0 | 0.0% | $0 | 0.0% | $0.00 |
| 2020 | 0 | 0 | 0.0% | 0 | 0.0% | $0 | 0.0% | $0.00 |
| 2021 | 0 | 0 | 0.0% | 0 | 0.0% | $0 | 0.0% | $0.00 |
| 2022 | 0 | 0 | 0.0% | 0 | 0.0% | $0 | 0.0% | $0.00 |
| 2023 | 0 | 0 | 0.0% | 0 | 0.0% | $0 | 0.0% | $0.00 |
| 2024 | 0 | 0 | 0.0% | 0 | 0.0% | $0 | 0.0% | $0.00 |
| 2025 | 0 | 0 | 0.0% | 0 | 0.0% | $0 | 0.0% | $0.00 |
| 2026 | 0 | 0 | 0.0% | 0 | 0.0% | $0 | 0.0% | $0.00 |
| 2027 | 0 | 0 | 0.0% | 0 | 0.0% | $0 | 0.0% | $0.00 |
| Thereafter | 1 | 655,969 | 100.0% | 655,969 | 100.0% | $10,618,134 | 100.0% | $16.19 |
| Vacant | 0 | 0 | 0.0% | 655,969 | 100.0% | $0 | 0.0% | $0.00 |
| Total/Weighted Average | 1 | 655,969 | 100.0% | $10,618,134 | 100.0% | $16.19 |
| (1) | Information obtained from the underwritten rent roll. |
THE INFORMATION IN THIS STRUCTURAL AND COLLATERAL TERM SHEET IS NOT COMPLETE AND MAY BE AMENDED PRIOR TO THE TIME OF SALE. THIS TERM SHEET IS NOT AN OFFER TO SELL THESE SECURITIES AND IT IS NOT A SOLICITATION OF AN OFFER TO BUY THESE SECURITIES IN ANY JURISDICTION WHERE THE OFFER OR SALE IS NOT PERMITTED.
| 132 |
| AMERICAN GREETINGS HQ |
Operating History and Underwritten Net Cash Flow. The following table presents certain information relating to the underwritten net cash flow at the American Greetings HQ Property:
Cash Flow Analysis(1)
| U/W | % of U/W Effective Gross Income | U/W $ per SF | ||||
| Base Rent | $10,618,134 | 102.3% | $16.19 | |||
| Grossed Up Vacant Space | 0 | 0.0 | 0.00 | |||
| Total Reimbursables | 310,807 | 3.0 | 0.47 | |||
| Other Income | 0 | 0.0 | 0.00 | |||
| Less Vacancy & Credit Loss | (546,447)(2) | (5.3) | (0.83) | |||
| Effective Gross Income | $10,382,494 | 100.0% | $15.83 | |||
| Total Operating Expenses | $513,508 | 4.9% | $0.78 | |||
| Net Operating Income | $9,868,986 | 95.1% | $15.04 | |||
| TI/LC | 655,969 | 6.3 | 1.00 | |||
| Capital Expenditures | 98,395 | 0.9 | 0.15 | |||
| Net Cash Flow | $9,114,622 | 87.8% | $13.89 | |||
| NOI DSCR(3) | 1.57x | |||||
| NCF DSCR(3) | 1.45x | |||||
| NOI DY(3) | 10.8% | |||||
| NCF DY(3) | 10.0% |
| (1) | The American Greetings HQ Property was constructed in 2016; accordingly no historical operating information is available. |
| (2) | The underwritten economic vacancy is 5.0%. As of April 1, 2017, the American Greetings HQ Property was 100.0% occupied. |
| (3) | Debt service coverage ratios and debt yields are based on the American Greetings whole loan. |
The following table presents certain information relating to comparable properties to the American Greetings HQ Property:
Comparable Leases(1)
| Property Name | Location | Year Built | Occ. | Building Class | Total GLA (SF) | Tenant Name | Lease Date | Leased SF | Base Rent PSF | Lease Type |
| American Greetings HQ (subject) | Westlake, OH | 2016 | 100.0% | A | 655,969 | American Greetings | Sept-16 | 655,969 | $16.19 | NNN |
| Single Tenant Properties | ||||||||||
| Express Scripts Call Center | North Huntingdon, PA | 2015 | 100.0% | A | 70,529 | Express Scripts | Nov -15 | 70,529 | $18.05 | Absolute Net |
| Central Park IV | Norwood, OH | 2003 | 100.0% | B | 95,000 | Encore Technologies | Jan -16 | 95,000 | $11.00 | Net |
| Healthplex | Indianapolis, IN | 2015 | 100.0% | A | 149,250 | University of Indianapolis | Aug -15 | 149,250 | $15.93 | NNN |
| Xerox Lexington | Lexington, KY | 1978 | 100.0% | B | 165,759 | Xerox | Jul -15 | 165,759 | $12.27 | Absolute Net |
| Synchrony Financial Call Center | Canton, OH | 2000 | 100.0% | B | 150,000 | Synchrony Financial Call Center | Jan -16 | 150,000 | $10.73 | Absolute Net |
| Harman Becker HQ | Novi, MI | 2015 | 100.0% | A | 188,042 | Harman Becker | Dec -15 | 188,042 | $15.51 | NNN |
| Westlake, OH Office Properties | ||||||||||
| Avon Point Professional Campus | Avon, OH | 2006 | 100% | B | 21,621 | University Hospitals | Jan -16 | 7,000 | $21.00 | NNN |
| Crocker Corporate Center | Westlake, OH | 2007 | 100% | A | 63,251 | Confidential | Dec -14 | 5,024 | $22.75 | MG |
| Gemini II | Westlake, OH | 1985 | 100% | B | 72,000 | Emerald Hospitality | Aug -15 | 3,000 | $21.50 | NNN |
| Carnegie Center | Westlake, OH | 1997 | 82% | B | 16,200 | Cook Villari & Associates | Feb -15 | 3,623 | $18.00 | MG |
| (1) | Information obtained from the appraisal. |
THE INFORMATION IN THIS STRUCTURAL AND COLLATERAL TERM SHEET IS NOT COMPLETE AND MAY BE AMENDED PRIOR TO THE TIME OF SALE. THIS TERM SHEET IS NOT AN OFFER TO SELL THESE SECURITIES AND IT IS NOT A SOLICITATION OF AN OFFER TO BUY THESE SECURITIES IN ANY JURISDICTION WHERE THE OFFER OR SALE IS NOT PERMITTED.
| 133 |
| No. 13 – The Shoppes at South Bay | ||||||
| Loan Information | Property Information | |||||
| Mortgage Loan Seller: | Wells Fargo Bank, National Association | Single Asset/Portfolio: | Single Asset | |||
Credit Assessment (Fitch/KBRA/Moody’s) | NR/NR/NR | Property Type: | Retail | |||
| Original Principal Balance(1): | $37,000,000 | Specific Property Type: | Anchored | |||
| Cut-off Date Balance(1): | $37,000,000 | Location: | Torrance, CA | |||
| % of Initial Pool Balance: | 3.7% | Size: | 196,912 SF | |||
| Loan Purpose: | Refinance | Cut-off Date Balance Per SF: | $187.90 | |||
| Borrower: | Celda LLC | Year Built/Renovated: | 2005/NAP | |||
| Borrower Sponsors: | Robert Ko; Nancy Ko | Title Vesting: | Fee | |||
| Mortgage Rate: | 4.740% | Property Manager: | Self-managed | |||
| Note Date: | March 8, 2017 | 4thMost Recent Occupancy (As of): | 94.2% (12/31/2013) | |||
| Anticipated Repayment Date: | NAP | 3rdMost Recent Occupancy (As of): | 95.3% (12/31/2014) | |||
| Maturity Date: | March 11, 2027 | 2ndMost Recent Occupancy (As of): | 96.5% (12/31/2015) | |||
| IO Period: | 120 months | Most Recent Occupancy (As of): | 96.6% (12/31/2016) | |||
| Loan Term (Original): | 120 months | Current Occupancy (As of)(5): | 95.7% (3/2/2017) | |||
| Seasoning: | 1 month | |||||
| Amortization Term (Original): | NAP | Underwriting and Financial Information: | ||||
| Loan Amortization Type: | Interest-only, Balloon | |||||
| Interest Accrual Method: | Actual/360 | 4thMost Recent NOI: | NAV | |||
| Call Protection: | L(25),D(91),O(4) | 3rdMost Recent NOI (As of): | $2,725,230 (12/31/2014) | |||
| Lockbox Type: | Hard/Upfront Cash Management | 2ndMost Recent NOI (As of): | $2,670,923 (12/31/2015) | |||
| Additional Debt: | None | Most Recent NOI (As of)(6): | $2,746,777 (12/31/2016) | |||
| Additional Debt Type: | NAP | |||||
| U/W Revenues: | $3,723,671 | |||||
| U/W Expenses: | $599,146 | |||||
| Escrows and Reserves: | U/W NOI(6): | $3,124,525 | ||||
| U/W NCF: | $2,963,727 | |||||
| Type: | Initial | Monthly | Cap (If Any) | U/W NOI DSCR: | 1.76x | |
| Taxes(2) | $21,730 | $21,730 | NAP | U/W NCF DSCR: | 1.67x | |
| Insurance | $20,810 | $4,162 | NAP | U/W NOI Debt Yield: | 8.4% | |
| Deferred Maintenance | $2,500 | $0 | NAP | U/W NCF Debt Yield: | 8.0% | |
| Replacement Reserves(3) | $0 | $3,352 | $120,659 | As-Is Appraised Value: | $59,000,000 | |
| TI/LC Reserve | $360,000 | $8,379 | $360,000 | As-Is Appraisal Valuation Date: | January 16, 2017 | |
| Rent Concession Reserve(4) | $5,250 | $0 | NAP | Cut-off Date LTV Ratio: | 62.7% | |
| Fast 5 Economic Holdback | (1) | $0 | NAP | LTV Ratio at Maturity: | 62.7% | |
| (1) | The Shoppes at South Bay mortgage loan is structured with an economic holdback of $2,250,000 related to tenant Fast 5 Car Wash (“Fast 5”). Fast 5 signed its lease in November 2016 and is scheduled to commence rent upon the earlier of (i) 30 days after the City of Los Angeles issues a certificate of occupancy and (ii) 12 months after the City of Los Angeles issues use approvals. As long as no event of default has occurred and is continuing, the lender will disburse the economic holdback funds to the borrower upon receipt of evidence that, within 24 months of the note date, the following requirements have been satisfied: (a) construction of the car wash has been completed and (b) Fast 5 (or a replacement tenant reasonably approved by the lender and paying at least $180,000 in annual rent) is in occupancy, open for business, operating and paying full unabated rent. If such conditions outlined in (a) and (b) are not satisfied, the economic holdback funds may be used to defease a portion of The Shoppes at South Bay mortgage loan. |
| (2) | There are additional monthly springing tax deposits beyond the current monthly escrow amount for tenants paying taxes directly upon the occurrence of (i) an event of default, (ii) tax paying tenants are not obligated to pay or are not paying taxes directly prior to delinquency, (iii) borrower did not provide lender evidence taxes have been paid or (iv) tax paying tenant leases are not in full force and effect. |
| (3) | The replacement reserves are capped at $120,659 as long as (i) no event of default has occurred and is continuing and (ii) the lender determines that the borrower is properly maintaining The Shoppes at South Bay Property (as defined below). |
| (4) | The Initial Rent Concession Reserve represents one month of free rent for the Burgerim tenant. |
| (5) | See “Historical Occupancy” section. |
| (6) | See “Cash Flows Analysis” section. |
The mortgage loan is evidenced by a single promissory note that is secured by a first mortgage encumbering the fee interest in a 196,912 square foot anchored retail center located in Torrance, California (“The Shoppes at South Bay Property”), approximately 15.8 miles south of downtown Los Angeles. Built in 2005 and situated on a 19.9-acre site, The Shoppes at South Bay Property is anchored by Wal-Mart R.E. Business (“Wal-Mart”) (74.6% of the net rentable area and 55.9% of underwritten base rent; rated AA/Aa2/AA by Fitch/Moody’s/S&P). Wal-Mart executed a 20-year triple net lease expiring June 14, 2025 with fifteen, five-year renewal options, and is the only full service Wal-Mart located in west Los Angeles (west of Interstate-110). The nearest full service Wal-Mart stores are located in Lake Wood (11.2 miles southeast) and Southgate (14.0 miles northeast). The second largest tenant is Dollar Tree Stores, Inc (5.3% of the net rentable area and 7.2% of underwritten base rent; rated Ba1/BB+ by Moody’s/S&P). The remaining suites at The Shoppes at South Bay Property are occupied by 18 tenants, which account for an average of 0.9% of the net
THE INFORMATION IN THIS STRUCTURAL AND COLLATERAL TERM SHEET IS NOT COMPLETE AND MAY BE AMENDED PRIOR TO THE TIME OF SALE. THIS TERM SHEET IS NOT AN OFFER TO SELL THESE SECURITIES AND IT IS NOT A SOLICITATION OF AN OFFER TO BUY THESE SECURITIES IN ANY JURISDICTION WHERE THE OFFER OR SALE IS NOT PERMITTED.
| 134 |
| THE SHOPPES AT SOUTH BAY |
rentable area. The Shoppes at South Bay Property contains 1,056 surface parking spaces, resulting in a parking ratio of 5.4 spaces per 1,000 square feet of rentable area. As of March 2, 2017, The Shoppes at South Bay Property was 95.7% leased to 20 tenants.
The Shoppes at South Bay Property is within the Los Angeles-Long Beach-Anaheim, California metropolitan statistical area. The metropolitan statistical area, comprising Los Angeles and Orange Counties, is the second-largest metropolitan area in the U.S. According to the appraisal, the estimated 2016 population within a three- and five-mile radius of The Shoppes at South Bay Property was 205,688 and 629,856, respectively; and the average household income within the same radii was $82,128 and $82,766, respectively. The Shoppes at South Bay Property benefits from its proximity to strong transportation routes including Interstate-405, Interstate-110, and California State Route-1, which comprise the northern, eastern, and southern borders of Torrance, respectively. Additionally, according to a third party market report, the average daily traffic count along The Shoppes at South Bay Property is 26,377 vehicles. The Shoppes at South Bay Property also benefits from the large presence of single-family homes, industrial properties, and office buildings located nearby in eastern Torrance.
According to a third party market research report, The Shoppes at South Bay Property is located within the Torrance submarket of the Los Angeles retail market. As of year-end 2016, the submarket reported a total inventory of approximately 16.2 million square feet with a 3.6% vacancy rate and an average asking rent of $24.93, triple net. The appraiser concluded to market rents for The Shoppes at South Bay Property of $13.80 per square foot for the anchor space, $21.00 per square foot for large inline space greater than 2,501 square feet, $30.00 per square foot for the retail space less than 2,500 square feet, $42.00 per square foot for food space, and $180,000 per pad for annual ground lease, all on a triple net basis.
Sources and Uses
| Sources | Uses | |||||||
| Original loan amount | $37,000,000 | 95.9% | Loan Payoff(1) | $35,400,547 | 91.8% | |||
| Borrower sponsors’ new cash | 1,582,987 | 4.1 | Fast 5 Economic Holdback(2) | 2,250,000 | 5.8 | |||
| contribution | Reserves | 410,290 | 1.1 | |||||
| Closing Costs | 522,151 | 1.4 | ||||||
| Total Sources | $38,582,987 | 100.0% | Total Uses | $38,582,987 | 100.0% |
| (1) | The Shoppes at South Bay Property was previously securitized in CD 2007-CD4. |
| (2) | See “Major Tenants” section. |
The following table presents certain information relating to the tenancy at The Shoppes at South Bay Property:
Major Tenants
| Tenant Name | Credit Rating Moody’s/ | Tenant NRSF | % of NRSF | Annual U/W Base Rent PSF(2) | Annual U/W Base Rent(2) | % of Total Annual U/W Base Rent | Sales PSF(3) | Occupancy Cost(3) | Lease Expiration Date |
| Anchor Tenant | |||||||||
| Wal-Mart | AA/Aa2/AA | 146,947 | 74.6% | $12.63 | $1,855,455 | 55.9% | NAV | NAV | 6/14/2025(4) |
| Total Anchor Tenants | 146,947 | 74.6% | $12.63 | $1,855,455 | 55.9% | ||||
| Major Tenants | |||||||||
| Dollar Tree Stores, Inc | NR/Ba1/BB+ | 10,350 | 5.3% | $23.21 | $240,224 | 7.2% | NAV | NAV | 3/31/2018 |
| Fast 5(5)(6) | NR/NR/NR | (5) | (5) | (5) | $180,000 | 5.4% | NAV | NAV | 12/31/2032 |
| Light of Day Inc, & Kevin | NR/NR/NR | 3,500 | 1.8% | $37.56 | $131,446 | 4.0% | NAV | NAV | 6/30/2020 |
| D.H. International | NR/NR/NR | 2,000 | 1.0% | $51.00 | $102,000 | 3.1% | NAV | NAV | MTM(7) |
| Total Major Tenants | 15,850 | 8.0% | $29.88(8) | $653,669 | 19.7% | ||||
| Non-Major Tenants | 25,720 | 13.1% | $31.59 | $812,540 | 24.5% | ||||
| Occupied Collateral Total | 188,517 | 95.7% | $16.67(8) | $3,321,663 | 100.0% | ||||
| Vacant Space | 8,395 | 4.3% | |||||||
| Collateral Total | 196,912 | 100.0% | |||||||
| (1) | Certain ratings are those of the parent company whether or not the parent guarantees the lease. |
| (2) | Annual U/W Base Rent PSF and Annual U/W Base Rent include contractual rent steps through March 2018 totaling $72,240. |
| (3) | Sales PSF and Occupancy Costs are not available as none of the tenants at The Shoppes at South Bay Property are required to report sales. |
| (4) | Wal-Mart has fifteen, five-year lease renewal options. |
| (5) | Fast 5 has a signed lease but is not yet in occupancy or paying rent. Fast 5 is expected to operate under a ground lease with no attributed square footage. |
| (6) | The Shoppes at South Bay mortgage loan is structured with an economic holdback of $2,250,000 related to Fast 5. Fast 5 signed its lease in November 2016 and is scheduled to commence rent upon the earlier of (i) 30 days after the City of Los Angeles issues a certificate of occupancy and (ii) 12 months after the City of Los Angeles issues use approvals. As long as no event of default has occurred and is continuing, the lender will disburse the economic holdback funds to the borrower upon receipt of evidence that, within 24 months of the note date, the following requirements have been satisfied: (a) construction of the car wash has been completed and (b) Fast 5 (or a replacement |
THE INFORMATION IN THIS STRUCTURAL AND COLLATERAL TERM SHEET IS NOT COMPLETE AND MAY BE AMENDED PRIOR TO THE TIME OF SALE. THIS TERM SHEET IS NOT AN OFFER TO SELL THESE SECURITIES AND IT IS NOT A SOLICITATION OF AN OFFER TO BUY THESE SECURITIES IN ANY JURISDICTION WHERE THE OFFER OR SALE IS NOT PERMITTED.
| 135 |
| THE SHOPPES AT SOUTH BAY |
| tenant reasonably approved by the lender and paying at least $180,000 in annual rent) is in occupancy, open for business, operating and paying full unabated rent. If such conditions outlined in (a) and (b) are not satisfied, the economic holdback funds may be used to defease a portion of The Shoppes at South Bay mortgage loan. |
| (7) | D.H. International had a lease expiration date of June 30, 2015 and has since operated on a month-to-month lease. |
| (8) | The Total Major Tenants Annual U/W Base Rent PSF and Occupied Collateral Total Annual U/W Base Rent PSF exclude the Annual U/W Base Rent from Fast 5, which is expected to operate under a ground lease with no attributed square footage. |
The following table presents certain information relating to the lease rollover schedule at The Shoppes at South Bay Property:
Lease Expiration Schedule(1)(2)
| Year Ending December 31, | No. of Leases Expiring | Expiring NRSF | % of Total NRSF | Cumulative Expiring NRSF | Cumulative % of Total NRSF | Annual U/W Base Rent | % of Total Annual U/W Base Rent | Annual U/W Base Rent PSF(3) |
| MTM | 1 | 2,000 | 1.0% | 2,000 | 1.0% | $102,000 | 3.1% | $51.00 |
| 2017 | 1 | 1,500 | 0.8% | 3,500 | 1.8% | $38,192 | 1.1% | $25.46 |
| 2018 | 6 | 19,060 | 9.7% | 22,560 | 11.5% | $574,182 | 17.3% | $30.12 |
| 2019 | 1 | 1,125 | 0.6% | 23,685 | 12.0% | $29,160 | 0.9% | $25.92 |
| 2020 | 6 | 12,755 | 6.5% | 36,440 | 18.5% | $357,958 | 10.8% | $28.06 |
| 2021 | 1 | 1,830 | 0.9% | 38,270 | 19.4% | $49,410 | 1.5% | $27.00 |
| 2022 | 0 | 0 | 0.0% | 38,270 | 19.4% | $0 | 0.0% | $0.00 |
| 2023 | 0 | 0 | 0.0% | 38,270 | 19.4% | $0 | 0.0% | $0.00 |
| 2024 | 0 | 0 | 0.0% | 38,270 | 19.4% | $0 | 0.0% | $0.00 |
| 2025 | 1 | 146,947 | 74.6% | 185,217 | 94.1% | $1,855,455 | 55.9% | $12.63 |
| 2026 | 2 | 3,300 | 1.7% | 188,517 | 95.7% | $135,306 | 4.1% | $41.00 |
| 2027 | 0 | 0 | 0.0% | 188,517 | 95.7% | $0 | 0.0% | $0.00 |
| Thereafter | 1(4) | 0(4) | 0.0% | 188,517 | 95.7% | $180,000(4) | 5.4% | $0.00 |
| Vacant | 0 | 8,395 | 4.3% | 196,912 | 100.0% | $0 | 0.0% | $0.00 |
| Total/Weighted Average | 20 | 196,912 | 100.0% | $3,321,663 | 100.0% | $16.67(5) |
| (1) | Information obtained from the underwritten rent roll. |
| (2) | Certain tenants may have lease termination options that are exercisable prior to the originally stated expiration date of the subject lease and that are not considered in the Lease Expiration Schedule. |
| (3) | Weighted Average Annual U/W Base Rent PSF excludes vacant space. |
| (4) | Fast 5 will operate under a ground lease with no attributed square footage. The tenant is awaiting building permits and use approvals from the City of Los Angeles in order to commence construction of its improvements. Fast 5’s lease will commence upon the earlier of (i) 30 days after the City of Los Angeles issues a certificate of occupancy or (ii) 12 months after the City of Los Angeles issues use approvals. Fast 5’s Annual U/W Base Rent is reflective of ground rent. |
| (5) | Excludes Annual U/W Base Rent from Fast 5, which is expected to operate on a ground lease with no attributed square footage. |
The following table presents historical occupancy percentages at The Shoppes at South Bay Property:
Historical Occupancy
12/31/2013(1) | 12/31/2014(1) | 12/31/2015(1) | 12/31/2016(1) | 3/2/2017(2)(3) | ||||
| 94.2% | 95.3% | 96.5% | 96.6% | 95.7% |
| (1) | Information obtained a third party market research report. |
| (2) | Information obtained from the underwritten rent roll. |
| (3) | Current Occupancy includes Fast 5, which has a signed lease but is not yet in occupancy or paying rent; however, the tenant is expected to operate under a ground lease with no attributed square footage and therefore has no impact on the physical occupancy statistic. Fast 5 accounts for 5.4% of underwritten rent. The Shoppes at South Bay Mortgage Loan is structured with an economic holdback tied to Fast 5. See “Major Tenants” section. |
THE INFORMATION IN THIS STRUCTURAL AND COLLATERAL TERM SHEET IS NOT COMPLETE AND MAY BE AMENDED PRIOR TO THE TIME OF SALE. THIS TERM SHEET IS NOT AN OFFER TO SELL THESE SECURITIES AND IT IS NOT A SOLICITATION OF AN OFFER TO BUY THESE SECURITIES IN ANY JURISDICTION WHERE THE OFFER OR SALE IS NOT PERMITTED.
| 136 |
| THE SHOPPES AT SOUTH BAY |
Operating History and Underwritten Net Cash Flow. The following table presents certain information relating to the historical operating performance and the underwritten net cash flow at The Shoppes at South Bay Property:
Cash Flow Analysis
| 2014 | 2015 | 2016 | U/W | % of U/W Effective Gross Income | U/W $ per SF | ||||||
| Base Rent | $2,954,419 | $2,901,281 | $2,926,868 | $3,321,663(1)(2) | 89.2 % | $16.87 | |||||
| Grossed Up Vacant Space | 0 | 0 | 0 | 201,480 | 5.4 | 1.02 | |||||
| Total Reimbursables | 290,419 | 315,255 | 311,931 | 398,687 | 10.7 | 2.02 | |||||
| Other Income | 22,320 | 21,706 | 3,321 | 3,321 | 0.1 | 0.02 | |||||
| Less Vacancy & Credit Loss | 0 | 0 | 0 | (201,480)(3) | (5.4) | (1.02) | |||||
| Effective Gross Income | $3,267,158 | $3,238,243 | $3,242,120 | $3,723,671 | 100.0% | $18.91 | |||||
| Total Operating Expenses | 541,928 | 567,320 | 495,343 | 599,146 | 16.1 | 3.04 | |||||
| Net Operating Income | $2,725,230 | $2,670,923 | $2,746,777 | $3,124,525 | 83.9% | $15.87 | |||||
| TI/LC | 0 | 0 | 0 | 157,415 | 4.2 | 0.80 | |||||
| Capital Expenditures | 0 | 0 | 0 | 39,382 | 1.1 | 0.20 | |||||
| Upfront TI/LC Reserve Credit | 0 | 0 | 0 | (36,000)(4) | (1.0) | (0.18) | |||||
| Net Cash Flow | $2,725,230 | $2,670,923 | $2,746,777 | $2,963,727 | 79.6% | $15.05 | |||||
| NOI DSCR | 1.53x | 1.50x | 1.54x | 1.76x | |||||||
| NCF DSCR | 1.53x | 1.50x | 1.54x | 1.67x | |||||||
| NOI DY | 7.4% | 7.2% | 7.4% | 8.4% | |||||||
| NCF DY | 7.4% | 7.2% | 7.4% | 8.0% |
| (1) | U/W Base Rent includes contractual rent steps through March 2018 totaling $72,240. |
| (2) | U/W Base Rent includes Fast 5’s annual base rent of $180,000. Fast 5 is expected to operate under a ground lease and is awaiting buildings permits and use approvals from the City of Los Angeles. Fast 5’s lease will commence upon the earlier of (i) 30 days after the City of Los Angeles issues a certificate of occupancy or (ii) 12 months after the City of Los Angeles issues use approvals. The Shoppes at South Bay mortgage loan is structured with an economic holdback of $2,250,000 related to Fast 5 that may be used to defease a portion of the mortgage loan if certain conditions are not satisfied (See “Major Tenants” section). |
| (3) | The underwritten economic vacancy is 5.7%. The Shoppes at South Bay Property was 95.7% physically occupied as of March 2, 2017. |
| (4) | Represents one-tenth of the upfront TI/LC reserve totaling $360,000. |
The following table presents certain information relating to comparable properties to The Shoppes at South Bay Property:
Comparable Properties(1)
| The Shoppes at South Bay (Subject) | Gardena Marketplace | 20220-20240 Avalon Blvd | Gardena Gateway Center | Best Plaza | Torrance Promenade | Carson Town Center | |
| Location | Torrance, CA | Gardena, CA | Carson, CA | Gardena, CA | Torrance, CA | Torrance, CA | Carson, CA |
| Distance from Subject | -- | 1.6 miles | 2.7 miles | 1.1 miles | 3.9 miles | 3.8 miles | 2.3 miles |
| Year Built/Renovated | 2005/NAP | 2001/NAP | 1967/NAP | 1990/NAP | 1973/1999 | 1973/NAP | 1996/NAP |
| Anchors | Wal-Mart | Albertsons | Walmart Neighborhood Market | 99 Ranch Market, Daiso | Babies ‘R’ Us, Planet Fitness | Marshalls, Office Depot, Ross Dress for Less, Sam Ash Music, Sears Outlet, AKI-Home, Trader Joe’s, UFC Gym | Kmart |
| Total GLA | 196,912 SF | 100,309 SF | 54,713 SF | 65,987 SF | 102,255 SF | 270,882 SF | 188,053 SF |
| Total Occupancy | 95.7% | 100.0% | 91.8% | 88.5% | 98.1% | 100.0% | 99.5% |
(1) Information obtained from the appraisal and the underwritten rent roll.
THE INFORMATION IN THIS STRUCTURAL AND COLLATERAL TERM SHEET IS NOT COMPLETE AND MAY BE AMENDED PRIOR TO THE TIME OF SALE. THIS TERM SHEET IS NOT AN OFFER TO SELL THESE SECURITIES AND IT IS NOT A SOLICITATION OF AN OFFER TO BUY THESE SECURITIES IN ANY JURISDICTION WHERE THE OFFER OR SALE IS NOT PERMITTED.
| 137 |
| No. 14 – GM Renaissance Center Parking Garage | |||||||
| Loan Information | Property Information | ||||||
| Mortgage Loan Seller: | Bank of America, N.A. | Single Asset/Portfolio: | Single Asset | ||||
Credit Assessment (Fitch/KBRA/Moody's): | NR/NR/NR | Property Type: | Other | ||||
| Original Principal Balance: | $31,500,000 | Specific Property Type: | Parking Garage | ||||
| Cut-off Date Balance: | $31,397,064 | Location: | Detroit, MI | ||||
| % of Initial Pool Balance: | 3.1% | Size: | 1,273 spaces | ||||
| Loan Purpose: | Acquisition | Cut-off Date Balance Per Space: | $24,664 | ||||
| Borrower Name: | MVP Detroit Center Garage, LLC | Year Built/Renovated: | 1978/2016 | ||||
| Sponsor: | MVP REIT, Inc; MVP REIT II, Inc; Michael V. Shustek | Title Vesting: | Fee | ||||
| Mortgage Rate: | 5.520% | Property Manager: | SP Plus Corporation | ||||
| Note Date: | January 10, 2017 | 4thMost Recent Occupancy (As of)(1): | NAV | ||||
| Anticipated Repayment Date: | NAP | 3rdMost Recent Occupancy (As of)(1): | NAV | ||||
| Maturity Date: | February 1, 2027 | 2ndMost Recent Occupancy (As of)(1): | NAV | ||||
| IO Period: | None | Most Recent Occupancy (As of)(1): | NAV | ||||
| Loan Term (Original): | 120 months | Current Occupancy (As of)(1): | 100.0% (4/1/2017) | ||||
| Seasoning: | 2 months | ||||||
| Amortization Term (Original): | 300 months | Underwriting and Financial Information: | |||||
| Loan Amortization Type: | Amortizing Balloon | ||||||
| Interest Accrual Method: | Actual/360 | 4thMost Recent NOI (As of)(2): | NAV | ||||
| Call Protection: | L(26),D(90),O(4) | 3rdMost Recent NOI (As of)(2): | $2,439,773 (12/31/2014) | ||||
| Lockbox Type: | Hard/Springing Cash Management | 2ndMost Recent NOI (As of)(2): | $3,292,749 (12/31/2015) | ||||
| Additional Debt: | No | Most Recent NOI (As of)(2): | $3,881,561 (TTM 11/30/2016) | ||||
| Additional Debt Type: | NAP | ||||||
| U/W Revenues(2): | $4,395,157 | ||||||
| U/W Expenses(2): | $785,202 | ||||||
| U/W NOI(2): | $3,609,955 | ||||||
| U/W NCF(2): | $3,546,305 | ||||||
| U/W NOI DSCR: | 1.55x | ||||||
| Escrows and Reserves: | U/W NCF DSCR: | 1.52x | |||||
| U/W NOI Debt Yield: | 11.5% | ||||||
| Type: | Initial | Monthly | Cap (If Any) | U/W NCF Debt Yield: | 11.3% | ||
| Taxes | $101,502 | $50,751 | NAP | As-Is Appraised Value: | $57,150,000 | ||
| Insurance | $9,061 | $3,020 | NAP | As-Is Appraisal Valuation Date: | December 15, 2016 | ||
| Deferred Maintenance | $596,250 | $0 | NAP | Cut-off Date LTV Ratio: | 54.9% | ||
| Replacement Reserves | $200,000 | $5,304 | NAP | LTV Ratio at Maturity or ARD: | 42.0% | ||
| (1) | The GM Renaissance Center Parking Garage Property (as defined below) is currently 100% leased to SP Plus Corporation which in turn leases spaces out to monthly parkers via a series of licensing agreements and to transient parkers on a daily or hourly basis. Due to the nature of the property, historical occupancy was not tracked. |
| (2) | See “Cash Flow Analysis” section. |
The GM Renaissance Center Parking Garage mortgage loan is evidenced by a single promissory note that is secured by a seven-level parking garage structure containing 1,273 parking spaces located in Detroit, Michigan (the “GM Renaissance Center Parking Garage Property”). Built in 1978, the GM Renaissance Center Parking Garage Property situated directly across the street from the 5.6 million square foot mixed-use commercial complex, GM Renaissance Center (General Motors’ world headquarters, "RenCen"). The subject sits on approximately 1.3 acres of land and features an enclosed skywalk that provides pedestrian access to the RenCen. According to the appraisal, over the past six years, approximately $3.2 million in capex has been spent at the GM Renaissance Center Parking Garage Property. Upgrades included installation of a security system with cameras, intercoms in the ticket machines and pay stations, and installation of other security and technology systems. The garage is also equipped with two high voltage electric stations with the capacity to accommodate four electric cars, and WiFi throughout the GM Renaissance Center Parking Garage Property.
The GM Renaissance Center Parking Garage Property is subject to a modified net lease with one of the largest parking operators in the country, SP Plus Corporation (NYSE: SP) (“SP+”) expiring on December 31, 2022 with one-five year extension option. SP+ was founded in 1929 and is a diverse provider of professional parking, ground transportation, facility maintenance, security and event logistics services to real estate owners and managers in a wide array of markets. In 2012, SP+ merged with Central Parking Corporation and now services more than 2,200 parking facilities totaling nearly one million parking spaces across the United States and Canada. SP+ trades on the Nasdaq and accounts for 14.3% of the overall industry market share. SP+ generated an estimated $1.6 billion in revenue in 2015. SP+ operates several garages in the Detroit central business district and one other property in the
THE INFORMATION IN THIS STRUCTURAL AND COLLATERAL TERM SHEET IS NOT COMPLETE AND MAY BE AMENDED PRIOR TO THE TIME OF SALE. THIS TERM SHEET IS NOT AN OFFER TO SELL THESE SECURITIES AND IT IS NOT A SOLICITATION OF AN OFFER TO BUY THESE SECURITIES IN ANY JURISDICTION WHERE THE OFFER OR SALE IS NOT PERMITTED.
| 138 |
| GM RENAISSANCE CENTER PARKING GARAGE |
vicinity of the RenCen. Previously, the GM Renaissance Center Parking Garage Property had been operated by the seller, Miller Parking Co., a Michigan-based and family owned parking owner and operator.
The GM Renaissance Center Parking Garage Property is located in Detroit, MI across the street from the RenCen. General Motors acquired the RenCen in 1996 and immediately began a $500 million renovation project. The RenCen spans over 14.0 acres and features four office towers that surround a Marriott hotel as well as two adjacent office towers, comprising 3 million square feet of Class “A” office space. The RenCen hosts 17,000 tenants and visitors each day. Tenants include General Motors, OnStar, Deloitte, Urban Science, and the Dykema Gossett law firm. General Motors continues to make significant investments in its headquarters and is expected to open GMWorld in May 2018. GMWorld is a $70 million, 150,000 square feet interactive high-tech space that will feature curated spaces and educate the public about General Motors’ brands and engineering processes. RenCen also features several retail shops and a 73-story, 1,300-key Marriott Hotel that can accommodate up to 2,200 people which underwent a $30 million renovation in 2015.
The Marriott, owned by an affiliate of General Motors, has a license agreement with the GM Renaissance Center Parking Garage Property permitting 50 reserved stalls for their valet service and an additional 250 when needed. Other license agreements include Aegis, CW Professional Services, Caidan Management Company, Riverfront Holdings Inc, Dykema Gossett PLLC, Detroit WindsorTunnel, Jack Morton Worldwide, Carpenters Fringe Benefits Joint Delinquency Committee, and Ryoji Noda (the Deputy Counsel General, Consulate of Japan). Historically, monthly parkers have made up approximately 52% of revenues. The sponsor has projected monthly parkers to comprise 54% of the 2017 revenue and transient parkers to comprise 43%. The remaining 3% comes from coupons and validations.
Sources and Uses
| Sources | Uses | |||||||
| Original mortgage loan amount | $31,500,000 | 55.7% | Purchase Price | $55,000,000 | 97.2% | |||
| Sponsor Equity | 25,102,674 | 44.3 | Reserves | 906,813 | 1.6 | |||
| Closing costs | 695,861 | 1.2 | ||||||
| Total Sources | $56,602,674 | 100.0% | Total Uses | $56,602,674 | 100.0% |
The following table presents historical occupancy percentages at GM Renaissance Center Parking Garage Property:
Historical Occupancy
12/31/2014(1) | 12/31/2015(1) | 12/31/2016(1) | 4/1/2017(1) |
| NAV | NAV | NAV | 100.0% |
| (1) | The GM Renaissance Center Parking Garage Property is currently 100% leased to SP Plus Corporation which in turn leases spaces out to monthly parkers via a series of licensing agreements and to transient parkers on a daily or hourly basis. Due to the nature of the GM Renaissance Center Parking Garage Property, historical occupancy was not tracked. |
THE INFORMATION IN THIS STRUCTURAL AND COLLATERAL TERM SHEET IS NOT COMPLETE AND MAY BE AMENDED PRIOR TO THE TIME OF SALE. THIS TERM SHEET IS NOT AN OFFER TO SELL THESE SECURITIES AND IT IS NOT A SOLICITATION OF AN OFFER TO BUY THESE SECURITIES IN ANY JURISDICTION WHERE THE OFFER OR SALE IS NOT PERMITTED.
| 139 |
| GM RENAISSANCE CENTER PARKING GARAGE |
Operating History and Underwritten Net Cash Flow. The following table presents certain information relating to the historical operating performance and underwritten net cash flow at the GM Renaissance Center Parking Garage Property:
Cash Flow Analysis(1)(2)
| 2014 | 2015 | TTM 11/30/2016 | U/W | % of U/W Effective Gross Income | U/W $ per SF | |
| Base Rent | $3,871,840 | $4,771,941 | $5,769,281 | $3,427,500 | 78.0% | $2,692 |
| Total Reimbursables | 0 | 0 | 0 | 572,000 | 13.0 | 449 |
| Percentage Rent | 0 | 0 | 0 | 595,632 | 13.6 | 468 |
| Less Vacancy & Credit Loss | 0 | 0 | 0 | (199,975)(3) | (4.5) | (157) |
| Effective Gross Income | $3,871,840 | $4,771,941 | $5,769,281 | $4,395,157 | 100.0% | $3,453 |
| Total Operating Expenses | 1,432,067 | 1,479,192 | 1,887,720 | 785,202 | 17.9 | 617 |
| Net Operating Income | $2,439,773 | $3,292,749 | $3,881,561 | $3,609,955 | 82.1% | $2,836 |
| TI/LC | 0 | 0 | 0 | 0 | 0.0 | 0 |
| Capital Expenditures | 0 | 0 | 0 | 63,650 | 1.4 | 50 |
| Net Cash Flow | $2,439,773 | $3,292,749 | $3,881,561 | $3,546,305 | 80.7% | $2,786 |
| NOI DSCR | 1.05x | 1.42x | 1.67x | 1.55x | ||
| NCF DSCR | 1.05x | 1.42x | 1.67x | 1.52x | ||
| NOI DY | 7.8% | 10.5% | 12.4% | 11.5% | ||
| NCF DY | 7.8% | 10.5% | 12.4% | 11.3% |
| (1) | U/W is based on the executed lease with SP+. Historical financials are based on the borrower operating the GM Renaissance Parking Garage Property. The SP+ lease calls for base rent of $3,427,500 per year in addition to percentage rent in an amount equal to 80% of gross receipts in excess of $5,000,000 per lease year. The percentage rent threshold will increase annually in the amount of $25,000. The lease is a modified triple net lease with SP+ responsible for all operating expenses, liability insurance and real estate taxes up to $572,000. The borrower is responsible for real estate taxes in excess of $572,000 per annum, property insurance and roof/structural maintenance. |
| (2) | SP+ may terminate its lease if: (1) SP+ is unable to obtain or maintain the necessary licenses or permits required for the conduct of its business (through no fault of its own), (2) the City of Detroit or other controlling government authority should limit parking at the GM Renaissance Center Parking Garage Property to permit accessory parking only (as opposed to general or transient parking), (3) the City of Detroit or other government entity should reduce the total number of parking spaces in the Property as a requirement in order for SP+ to obtain or retain necessary permits or licenses, (4) the City of Detroit or other government entity should require improvements to the GM Renaissance Parking Garage Property which reduce the total number of parking spaces or (5) gross receipts are reduced by at least 15% during the 60 days following an unforeseeable event (such as interference with ingress or egress, loss of parking capacity, civil commotion, terrorist acts, and natural disasters), unless the borrower has granted a temporary reduction in rent in proportion to the loss of such gross receipts. |
| (3) | The underwritten economic vacancy is 5.0%. As of April 1, 2017, the GM Renaissance Center Parking Garage Property was 100.0% leased. |
THE INFORMATION IN THIS STRUCTURAL AND COLLATERAL TERM SHEET IS NOT COMPLETE AND MAY BE AMENDED PRIOR TO THE TIME OF SALE. THIS TERM SHEET IS NOT AN OFFER TO SELL THESE SECURITIES AND IT IS NOT A SOLICITATION OF AN OFFER TO BUY THESE SECURITIES IN ANY JURISDICTION WHERE THE OFFER OR SALE IS NOT PERMITTED.
| 140 |
| GM RENAISSANCE CENTER PARKING GARAGE |
The following table presents certain information relating to comparable properties to GM Renaissance Center Parking Garage Property:
Comparable Properties(1)
| Property Name | Address | Type | Parking Operator | Total Spaces | Incremental Rates | Monthly Rates |
| GM Renaissance Center Parking Garage (subject) | 414 Renaissance Drive West Detroit, MI | Garage | SP+ | 1,273 | 0 to 20 min - $2.00 21 to 60 min - $5.00 61 to 180 min - $10.00 3 to 4 hours - $15.00 4 to 8 hours - $20.00 8 to 24 hours - $25.00 | $190.00 |
| Beaubien Place Parking | 521 Atwater Street Detroit, MI | Garage | SP+ | 1,168 | 0 to 20 min - $2.00 21 to 60 min - $4.00 61 to 80 min - $6.00 81 to 120 min - $8.00 121 to 140 min - $10.00 141 to 180 min - $12.00 3 to 3.5 hours - $14.00 3.5 to 4 hours - $16.00 4 to 24 hours - $20.00 | $180.00 |
| Port Atwater Garage | 200 Beaubien Place Detroit, MI | Garage | Ultimate Parking | 1,080 | 0 to 20 min - $2.00 21 to 40 min - $4.00 41 to 60 min - $6.00 61 to 80 min - $8.00 81 to 100 min - $10.00 101 to 120 min - $12.00 121 to 140 min - $14.00 141 to 160 min - $16.00 161 to 180 min - $18.00 3 to 24 hours - $20.00 | $175.00 |
| Premier Underground Parking | 3 Gatriot Avenue Detroit, MI | Garage | City of Detroit | 1,200 | 0 to 2 hours - $5.00 2 to 4 hours - $10.00 4 to close - $15.00 | $150.00 |
| Ford Underground Parking Garage | 30 East Jefferson Detroit, MI | Garage | City of Detroit | 750 | 0 to 2 hours - $5.00 2 to 4 hours - $10.00 4 to close - $15.00 | $150.00 |
| One Detroit Center | 500 Woodward Avenue Detroit, MI | Garage | Ultimate Parking | 2,070 | 0 to 20 min - $3.00 21 to 40 min - $6.00 41 to 60 min - $9.00 61 to 80 min - $12.00 81 to 100 min - $15.00 101 to 120 min - $18.00 2 to 24 hours - $20.00 | NAP |
| (1) | Information obtained from the appraisal and the underwritten rent roll. |
THE INFORMATION IN THIS STRUCTURAL AND COLLATERAL TERM SHEET IS NOT COMPLETE AND MAY BE AMENDED PRIOR TO THE TIME OF SALE. THIS TERM SHEET IS NOT AN OFFER TO SELL THESE SECURITIES AND IT IS NOT A SOLICITATION OF AN OFFER TO BUY THESE SECURITIES IN ANY JURISDICTION WHERE THE OFFER OR SALE IS NOT PERMITTED.
| 141 |
| No. 15 – Ralph’s Food Warehouse Portfolio | ||||||
| Loan Information | Property Information | |||||
| Mortgage Loan Seller: | Morgan Stanley Mortgage Capital Holdings LLC | Single Asset/Portfolio: | Portfolio | |||
| Credit Assessment (Fitch/KBRA/Moody’s): | NR/NR/NR | Property Type: | Retail | |||
| Original Principal Balance(1): | $25,000,000 | Specific Property Type: | Various – See Table | |||
| Cut-off Date Balance(1): | $24,890,754 | Location: | Various – See Table | |||
| % of Initial Pool Balance: | 2.5% | Size: | 667,457 SF | |||
| Loan Purpose: | Refinance | Cut-off Date Balance Per SF(1): | $62.65 | |||
| Borrower Name(2): | Various | Year Built/Renovated: | Various – See Table | |||
| Sponsors: | Rafael Soto | Title Vesting(8): | Various | |||
| Mortgage Rate: | 6.290% | Property Manager: | Caliche Management LLC | |||
| Note Date: | January 30, 2017 | 4thMost Recent Occupancy: | 94.5% (12/31/2013) | |||
| Anticipated Repayment Date: | NAP | 3rdMost Recent Occupancy (As of): | 95.7% (12/31/2014) | |||
| Maturity Date: | February 1, 2027 | 2ndMost Recent Occupancy (As of): | 95.7% (12/31/2015) | |||
| IO Period: | None | Most Recent Occupancy (As of): | 97.8% (12/31/2016) | |||
| Loan Term (Original): | 120 months | Current Occupancy (As of): | 97.8% (1/25/2017) | |||
| Seasoning: | 2 months | |||||
| Amortization Term (Original): | 240 months | Underwriting and Financial Information: | ||||
| Loan Amortization Type: | Amortizing Balloon | |||||
| Interest Accrual Method: | Actual/360 | 4thMost Recent NOI (As of): | $6,346,091 (12/31/2013) | |||
| Call Protection(3): | L(26),D(87),O(7) | 3rdMost Recent NOI (As of): | $6,503,209 (12/31/2014) | |||
| Lockbox Type: | Hard/Upfront Cash Management | 2ndMost Recent NOI (As of): | $6,278,535 (12/31/2015) | |||
| Additional Debt(1): | Yes | Most Recent NOI (As of): | $6,294,443 (TTM 7/31/2016) | |||
| Additional Debt Type(1): | Pari Passu | |||||
| U/W Revenues: | $8,706,078 | |||||
| Escrows and Reserves: | U/W Expenses: | $2,328,751 | ||||
| U/W NOI: | $6,377,327 | |||||
| Type: | Initial | Monthly | Cap (If Any) | U/W NCF: | $6,245,785 | |
| Taxes | $69,001 | $69,001 | NAP | U/W NOI DSCR(1): | 1.73x | |
| Insurance(4) | $0 | Springing | NAP | U/W NCF DSCR(1): | 1.69x | |
| Replacement Reserves | $0 | $12,237 | $734,203 | U/W NOI Debt Yield(1): | 15.3% | |
| TI/LC Reserve | $0 | $55,621 | NAP | U/W NCF Debt Yield(1): | 14.9% | |
| Deferred Maintenance | $101,494 | $0 | NAP | As-Is Appraised Value: | $78,450,000 | |
| Ground Rent Funds(5) | $30,000 | Springing | $30,000 | As-Is Appraisal Valuation Date: | December 22, 2016 | |
| Condominium Common Charge Reserve(6) | $8,988 | Springing | NAP | Cut-off Date LTV Ratio(1): | 53.3% | |
| Use Agreement Reserve(7) | $4,800 | Springing | $4,800 | LTV Ratio at Maturity or ARD(1): | 35.5% | |
| (1) | The Ralph’s Food Warehouse Portfolio Whole Loan (as defined below), which had an original principal balance of $42,000,000, is comprised of twopari passu notes (Notes A-1, and A-2). The controlling Note A-1 had an original principal balance of $25,000,000, has an outstanding principal balance of $24,890,754 as of the Cut-off Date and will be contributed to the BANK 2017-BNK4 trust. The non-controlling Note A-2 had an original principal balance of $17,000,000 and is expected to be contributed to a future securitization trust. All statistical financial information related to balances per square foot, loan-to-value ratios, debt service coverage ratios and debt yields are based on the Ralph’s Food Warehouse Portfolio Whole Loan. |
| (2) | The borrowers are R&J Investments, Inc., Inversiones Rafael A. Soto, Inc. and Aventura Realty LLC. |
| (3) | The defeasance lockout period will be at least 26 payment dates beginning with and including the first payment date of March 1, 2017. Defeasance of the Ralph’s Food Warehouse Portfolio Whole Loan is permitted after the date that is the earlier of (i) two years after the closing date of the securitization that includes the last note to be securitized and (ii) August 1, 2020. The assumed lockout period of 26 payments is based on the expected BANK 2017-BNK4 trust closing date in April 2017. The Ralph’s Food Warehouse Portfolio Whole Loan may be prepaid in part at any time, together with yield maintenance, in connection with a partial release of the portion of the Ralph's Food Warehouse - Caguas property that is leased to McDonald’s upon exercise of a purchase option or right of first refusal by the tenant. See“Description of the Mortgage Pool—Certain Terms of the Mortgage Loans—Releases; Partial Releases” in the Preliminary Prospectus. |
| (4) | Ongoing reserves for insurance premiums are not required as long as (i) no event of default has occurred and is continuing; (ii) the Ralph’s Food Warehouse Portfolio Properties (as defined below) are insured via an acceptable blanket insurance policy; and (iii) the borrower provides the lender with evidence of renewal of the insurance policies and timely proof of payment of insurance premiums. |
| (5) | A deposit into the Ground Rent Funds to replenish up to the reserve cap will be required if the balance on deposit in the Ground Rent Funds falls below the cap. |
| (6) | Relates to the Supermercado del Este property. Ongoing reserves for condominium common charges are not required as long as a cash sweep event period has not commenced. |
| (7) | A deposit into the Use Agreement Reserve to replenish up to the reserve cap will be required if the balance on deposit in the Use Agreement Reserve falls below the cap. The Use Agreement Reserve is for payments under a use agreement that allows the Ralph’s Food Warehouse - Humacao property the use of a government owned property on which a small portion of the Ralph’s store at such location encroaches. The encroachment is also insured under the title insurance policy for such property. |
| (8) | All of the Ralph’s Food Warehouse Portfolio Properties are fee, except for Ralph's Food Warehouse – Yabucoa, which is leasehold. |
THE INFORMATION IN THIS STRUCTURAL AND COLLATERAL TERM SHEET IS NOT COMPLETE AND MAY BE AMENDED PRIOR TO THE TIME OF SALE. THIS TERM SHEET IS NOT AN OFFER TO SELL THESE SECURITIES AND IT IS NOT A SOLICITATION OF AN OFFER TO BUY THESE SECURITIES IN ANY JURISDICTION WHERE THE OFFER OR SALE IS NOT PERMITTED.
| 142 |
| RALPH’S FOOD WAREHOUSE PORTFOLIO |
The Ralph’s Food Warehouse Portfolio mortgage loan is a part of a whole loan (the “Ralph’s Food Warehouse Portfolio Whole Loan”) that is evidenced by twopari passu notes (Notes A-1 and A-2) secured by a first mortgage encumbering eleven retail properties located in Puerto Rico (the “Ralph’s Food Warehouse Portfolio Properties”). The Ralph’s Food Warehouse Portfolio Properties are located throughout the eastern portion of Puerto Rico, away from San Juan. The largest tenant at each of ten of the eleven Ralph’s Food Warehouse Portfolio Properties is a master leased with Ralph’s Food Warehouse Inc. (in one case operating as Supermercado del Este), a supermarket chain owned by an affiliate of the borrower (“Ralph’s”). Ralph’s represents 78.1% of total square feet and is signed to a 20-year master lease expiring in 2037 with no termination options. Ralph’s maintains both a retail and wholesale operation, serving not only individuals and families, but also restaurants, bars, and other bulk buyers. In 2016, Ralph’s reported sales at the Ralph’s Food Warehouse Portfolio Properties of approximately $266 million ($510 per square foot), made up of retail sales of approximately $240 million ($927 per square foot) and wholesale sales of approximately $26 million ($110 per square foot). The appraiser concluded a market vacancy of 5% for all of the Ralph’s locations.
The Instituto de Banca y Comercio property is a single tenant property master leased to Jopesose, Inc., an affiliate of the borrower, under a 20 year master lease expiring in 2037. The borrower affiliate in turn leases such property to Instituto de Banca y Comercio (“IBC”), under a lease expiring December 31, 2024. IBC is a technical school offering diplomas and associate's degrees at 23 locations across a variety of fields, including cosmetology, healthcare, business, information technology, culinary and industrial trades. The appraiser concluded a market vacancy of 4.0% for the Instituto de Banca y Comercio property. IBC occupies 9.0% of total square feet of the Ralph’s Food Warehouse Portfolio Properties.
As of January 25, 2017, the Ralph’s Food Warehouse Portfolio Properties were 97.8% occupied by 31 tenants. Other than Ralph’s and IBC, no single tenant represents more than 1.6% of the portfolio’s underwritten base rent.
Sources and Uses
| Sources | Uses | |||||||
| Original loan amount | $42,000,000 | 100.0% | Loan payoff | $37,488,126 | 89.3% | |||
| Reserves | 214,283 | 0.5 | ||||||
| Closing costs | 1,992,742 | 4.7 | ||||||
| Return of equity | 2,304,849 | 5.5 | ||||||
| Total Sources | $42,000,000 | 100.0% | Total Uses | $42,000,000 | 100.0% |
The following table presents certain information relating to the Ralph’s Food Warehouse Portfolio Properties:
| Property Name - Location | Property Type | Allocated Cut-off Date Balance(1) | % of Portfolio Cut-off Date Balance | Occupancy(2) | Year Built/ Renovated | Net Rentable Area (SF) | Appraised | Allocated LTV(1) |
| Ralph's Food Warehouse – Fajardo | Anchored | $9,060,234 | 21.7% | 92.9% | 2011/NAP | 98,260 | $16,900,000 | 53.6% |
| Instituto de Banca y Comercio - Caguas | Single Tenant | $6,172,907 | 14.8% | 100.0% | 1992/2007 | 60,000 | $11,500,000 | 53.7% |
| Ralph's Food Warehouse – Yabucoa | Anchored | $5,227,058 | 12.5% | 97.6% | 2001/NAP | 89,312 | $9,000,000 | 58.1% |
| Ralph's Food Warehouse – Caguas | Anchored | $4,679,462 | 11.2% | 100.0% | 2008/NAP | 72,640 | $8,800,000 | 53.2% |
| Ralph's Food Warehouse - Humacao | Anchored | $3,982,521 | 9.5% | 97.5% | 2005/NAP | 82,357 | $7,400,000 | 53.8% |
| Ralph's Food Warehouse – Gurabo | Anchored | $3,335,361 | 8.0% | 100.0% | 2000/NAP | 50,954 | $6,250,000 | 53.4% |
| Ralph's Food Warehouse – Naguabo | Anchored | $3,086,454 | 7.4% | 93.3% | 2007/NAP | 57,134 | $6,000,000 | 51.4% |
| Ralph's Food Warehouse - San Lorenzo | Single Tenant | $1,742,353 | 4.2% | 100.0% | 1989/NAP | 45,109 | $3,500,000 | 49.8% |
| Ralph's Food Warehouse - Cayey | Single Tenant | $1,692,571 | 4.0% | 100.0% | 1999/NAP | 40,424 | $3,400,000 | 49.8% |
| Ralph's Food Warehouse - Las Piedras | Single Tenant | $1,593,008 | 3.8% | 100.0% | 1990/2012 | 40,862 | $3,200,000 | 49.8% |
| Supermercado del Este - Humacao | Single Tenant | $1,244,538 | 3.0% | 100.0% | 1989/NAP | 30,405 | $2,500,000 | 49.8% |
| Total/Weighted Average | $41,816,467 | 100.0% | 97.8% | 667,457 | $78,450,000 | 53.3% |
| (1) | Allocated Cut-off Date Balance and Allocated LTV are based on the Ralph’s Food Warehouse Portfolio Whole Loan Cut-off Date balance. |
| (2) | Information obtained from the underwritten rent roll. |
| (3) | As of the appraisaldated December 22, 2016. |
THE INFORMATION IN THIS STRUCTURAL AND COLLATERAL TERM SHEET IS NOT COMPLETE AND MAY BE AMENDED PRIOR TO THE TIME OF SALE. THIS TERM SHEET IS NOT AN OFFER TO SELL THESE SECURITIES AND IT IS NOT A SOLICITATION OF AN OFFER TO BUY THESE SECURITIES IN ANY JURISDICTION WHERE THE OFFER OR SALE IS NOT PERMITTED.
| 143 |
| RALPH’S FOOD WAREHOUSE PORTFOLIO |
The following table presents certain information relating to sales at the Ralph’s properties:
Retail Tenant Sales(1) | Wholesale Tenant Sales(1)(2) | Total Tenant Sales(1)(2) | ||||||
2014 | 2015 | 2016 | 2014 | 2015 | 2016 | 2014 | 2015 | 2016 |
$254,673,143 | $237,625,937 | $240,282,465 | $31,443,284 | $28,675,377 | $25,587,233 | $286,116,427 | $266,301,314 | $265,869,698 |
| (1) | Information obtained from the underwritten rent roll. |
| (2) | The Ralph's Food Warehouse - Cayey and the Supermercado del Este properties do not possess a wholesale component. |
The following table presents certain information relating to the tenants at the Ralph’s Food Warehouse Portfolio Properties:
Major Tenants
| Tenant Name | Credit Rating (Fitch/Moody’s/S&P) | Tenant NRSF | % of Portfolio NRSF | Annual U/W Base Rent PSF(1) | Annual U/W Base Rent(1) | % of Total Portfolio Annual U/W Base Rent | Lease Expiration Date(2) |
| Major Tenants(3) | |||||||
| Ralph's Food Warehouse - Fajardo | NR/NR/NR | 82,000 | 12.30% | $8.77 | $719,313 | 10.6% | 1/31/2037 |
| Ralph's Food Warehouse - Humacao | NR/NR/NR | 74,679 | 11.20% | $8.77 | $655,092 | 9.7% | 1/31/2037 |
| Ralph's Food Warehouse - Caguas | NR/NR/NR | 62,281 | 9.30% | $8.77 | $546,336 | 8.1% | 1/31/2037 |
| Instituto de Banca y Comercio(4) | NR/NR/NR | 60,000 | 9.00% | $17.00 | $1,020,000 | 15.1% | 1/31/2037 |
| Ralph's Food Warehouse - Yabucoa | NR/NR/NR | 59,276 | 8.90% | $8.77 | $519,976 | 7.7% | 1/31/2037 |
| Ralph's Food Warehouse - Naguabo | NR/NR/NR | 47,484 | 7.10% | $8.77 | $416,535 | 6.1% | 1/31/2037 |
| Ralph's Food Warehouse - San Lorenzo | NR/NR/NR | 45,109 | 6.80% | $8.77 | $395,701 | 5.8% | 1/31/2037 |
| Ralph's Food Warehouse - Las Piedras | NR/NR/NR | 40,862 | 6.10% | $8.77 | $358,446 | 5.3% | 1/31/2037 |
| Ralph's Food Warehouse - Cayey | NR/NR/NR | 40,424 | 6.10% | $8.77 | $354,604 | 5.2% | 1/31/2037 |
| Ralph's Food Warehouse - Gurabo | NR/NR/NR | 38,725 | 5.80% | $8.77 | $339,700 | 5.0% | 1/31/2037 |
| Supermercados del Este | NR/NR/NR | 30,405 | 4.6% | $8.77 | $266,716 | 3.9% | 1/31/2037 |
| Total Major Tenants | 581,245 | 87.1% | $9.62 | $5,592,418 | 82.6% | ||
| Non-Major Tenants | 71,257 | 10.7% | $16.58 | $1,181,560 | 17.4% | ||
| Occupied Collateral Total | 652,502 | 97.8% | $10.38 | $6,773,978 | 100.0% | ||
| Vacant Space | 14,955 | 2.2% | |||||
| Collateral Total | 667,457 | 100.0% | |||||
| (1) | Annual U/W Base Rent PSF and Annual U/W Base Rent include contractual rent steps through March 22, 2017 totaling $3,998. |
| (2) | All of the Major Tenants are signed to a master lease. |
| (3) | All Major Tenants, representing 87.1% of total net rentable square feet, are leased to an affiliate of the sponsor. |
| (4) | The Instituto de Banca y Comercio Property is leased to an affiliate of the sponsor under a master lease expiring January 31, 2037. The sponsor affiliate in turn leases the property to Instituto de Banca y Comercio (IBC), under a lease expiring December 31, 2024. |
THE INFORMATION IN THIS STRUCTURAL AND COLLATERAL TERM SHEET IS NOT COMPLETE AND MAY BE AMENDED PRIOR TO THE TIME OF SALE. THIS TERM SHEET IS NOT AN OFFER TO SELL THESE SECURITIES AND IT IS NOT A SOLICITATION OF AN OFFER TO BUY THESE SECURITIES IN ANY JURISDICTION WHERE THE OFFER OR SALE IS NOT PERMITTED.
| 144 |
| RALPH’S FOOD WAREHOUSE PORTFOLIO |
The following table presents certain information relating to the lease rollover schedule at the Ralph’s Food Warehouse Portfolio Properties:
Lease Expiration Schedule(1)(2)
| Year Ending December 31, | No. of Leases Expiring | Expiring NRSF | % of Total NRSF | Cumulative Expiring NRSF | Cumulative % of Total NRSF | Annual U/W Base Rent | % of Total Annual U/W Base Rent | Annual U/W Base Rent PSF(3) |
| MTM(4) | 1 | 0 | 0.0% | 0 | 0.0% | $6,000 | 0.1% | $0.00 |
| 2017 | 1 | 3,448 | 0.5% | 3,448 | 0.5% | $55,168 | 0.8% | $16.00 |
| 2018 | 5 | 13,310 | 2.0% | 16,758 | 2.5% | $227,310 | 3.4% | $17.08 |
| 2019 | 3 | 10,853 | 1.6% | 27,611 | 4.1% | $189,836 | 2.8% | $17.49 |
| 2020 | 2 | 3,546 | 0.5% | 31,157 | 4.7% | $87,490 | 1.3% | $24.67 |
| 2021 | 2 | 18,569 | 2.8% | 49,726 | 7.5% | $158,580 | 2.3% | $8.54 |
| 2022 | 1 | 3,600 | 0.5% | 53,326 | 8.0% | $52,200 | 0.8% | $14.50 |
| 2023 | 1 | 1,596 | 0.2% | 54,922 | 8.2% | $30,521 | 0.5% | $19.12 |
| 2024 | 1 | 1,912 | 0.3% | 56,834 | 8.5% | $34,800 | 0.5% | $18.20 |
| 2025 | 1 | 2,100 | 0.3% | 58,934 | 8.8% | $67,151 | 1.0% | $31.98 |
| 2026 | 1 | 5,652 | 0.8% | 64,586 | 9.7% | $102,850 | 1.5% | $18.20 |
| 2027 | 0 | 0 | 0.0% | 64,586 | 9.7% | $0 | 0.0% | $0.00 |
| Thereafter(5) | 13 | 587,916 | 88.1% | 652,502 | 97.8% | $5,762,071 | 85.1% | $9.80 |
| Vacant | 0 | 14,955 | 2.2% | 667,457 | 100.0% | $0 | 0.0% | $0.00 |
| Total/Weighted Average | 32 | 667,457 | 100.0% | $6,773,978 | 100.0% | $10.38 |
| (1) | Information obtained from the underwritten rent roll. |
| (2) | Certain tenants may have lease termination options that are exercisable prior to the originally stated expiration date of the subject lease and that are not considered in the lease rollover schedule. |
| (3) | Weighted Average Annual U/W Base Rent PSF excludes vacant space. |
| (4) | MTM tenant is an ATM. |
| (5) | The Instituto de Banca y Comercio Property is leased to an affiliate of the sponsor under a master lease expiring January 31, 2037. The sponsor affiliate in turn leases the property to Instituto de Banca y Comercio (IBC), under a lease expiring December 31, 2024. |
The following table presents historical occupancy percentages at the Ralph’s Food Warehouse Portfolio Properties:
Historical Occupancy
12/31/2013(1) | 12/31/2014(1) | 12/31/2015(1) | 12/31/2016(1) | Various(3) |
| 94.5% | 95.7% | 95.7% | 97.8% | 97.8% |
| (1) | Information obtained from the borrower rent roll. |
| (2) | Information obtained from the underwritten rent roll. |
| (3) | TheInstituto de Banca y Comercio Property, Ralph's Food Warehouse - San Lorenzo Property, Ralph's Food Warehouse – Cayey Property, Ralph's Food Warehouse - Las Piedras Property and Supermercado del Este Property were all 100.0% leased as of April 1, 2017. |
THE INFORMATION IN THIS STRUCTURAL AND COLLATERAL TERM SHEET IS NOT COMPLETE AND MAY BE AMENDED PRIOR TO THE TIME OF SALE. THIS TERM SHEET IS NOT AN OFFER TO SELL THESE SECURITIES AND IT IS NOT A SOLICITATION OF AN OFFER TO BUY THESE SECURITIES IN ANY JURISDICTION WHERE THE OFFER OR SALE IS NOT PERMITTED.
| 145 |
| RALPH’S FOOD WAREHOUSE PORTFOLIO |
Operating History and Underwritten Net Cash Flow. The following table presents certain information relating to the historical operating performance and the underwritten net cash flow at the Ralph’s Food Warehouse Portfolio Properties:
Cash Flow Analysis
| 2013 | 2014 | 2015 | TTM 7/31/2016 | U/W | % of U/W Effective Gross Income | U/W $ per SF | |
| Base Rent | $6,689,234 | $6,824,806 | $6,631,480 | $6,611,259 | $6,769,979 | 77.8% | $10.14 |
| Grossed Up Vacant Space | 0 | 0 | 0 | 0 | 257,790 | 3.0 | 0.39 |
| Rent Steps | 0 | 0 | 0 | 0 | 3,998 | 0.0 | 0.01 |
| Total Reimbursables(2) | 954,779 | 974,711 | 980,558 | 1,012,065 | 2,132,525 | 24.5 | 3.20 |
| Less Vacancy & Credit Loss | 0 | 0 | 0 | 0 | (458,215)(1) | (5.3) | (0.69) |
| Effective Gross Income | $7,644,013 | $7,799,517 | $7,612,038 | $7,623,324 | $8,706,078 | 100.0% | $13.04 |
| Total Operating Expenses(2) | 1,297,922 | 1,296,308 | 1,333,503 | 1,328,881 | 2,328,751 | 26.7 | 3.49 |
| Net Operating Income | $6,346,091 | $6,503,209 | $6,278,535 | $6,294,443 | $6,377,327 | 73.3% | $9.55 |
| TI/LC | 0 | 0 | 0 | 0 | 0 | 0.0 | 0.00 |
| Capital Expenditures | 0 | 0 | 0 | 0 | 131,542 | 1.5 | 0.20 |
| Net Cash Flow | $6,346,091 | $6,503,209 | $6,278,535 | $6,294,443 | $6,245,785 | 71.7% | $9.36 |
| NOI DSCR(3) | 1.72x | 1.76x | 1.70x | 1.70x | 1.73x | ||
| NCF DSCR(3) | 1.72x | 1.76x | 1.70x | 1.70x | 1.69x | ||
| NOI DY(3) | 15.2% | 15.6% | 15.0% | 15.1% | 15.3% | ||
| NCF DY(3) | 15.2% | 15.6% | 15.0% | 15.1% | 14.9% |
| (1) | The underwritten economic vacancy is 5.0%. The Ralph’s Food Warehouse Portfolio Properties were 97.8% physically occupied as of January 25, 2017. |
| (2) | The increase in U/W Total Reimbursables and U/W Total Operating Expenses from TTM 7/31/2016 to U/W is due to a new insurance policy, which increased insurance premiums to $1,219,289 from $137,491 for the TTM 7/31/2016. |
| (3) | The debt service coverage ratios and debt yields are based on the Ralph’s Food Warehouse Portfolio Whole Loan. |
THE INFORMATION IN THIS STRUCTURAL AND COLLATERAL TERM SHEET IS NOT COMPLETE AND MAY BE AMENDED PRIOR TO THE TIME OF SALE. THIS TERM SHEET IS NOT AN OFFER TO SELL THESE SECURITIES AND IT IS NOT A SOLICITATION OF AN OFFER TO BUY THESE SECURITIES IN ANY JURISDICTION WHERE THE OFFER OR SALE IS NOT PERMITTED.
| 146 |
| BANK 2017-BNK4 | Transaction Contact Information |
VI. Transaction Contact Information
Questions regarding this Structural and Collateral Term Sheet may be directed to any of the following individuals:
| Wells Fargo Securities, LLC | |
| Brigid Mattingly | Tel. (312) 269-3062 |
| A.J. Sfarra | Tel. (212) 214-5613 |
| Alex Wong | Tel. (212) 214-5615 |
| BofA Merrill Lynch | |
| Leland Bunch | Tel. (646) 855-3953 |
| Danielle Caldwell | Tel. (646) 855-3421 |
| Anthony Candela | Tel. (646) 743-0727 |
| Morgan Stanley & Co. | |
| Zachary Fischer | Tel. (212) 761-3076 |
| Jane Lam | Tel. (212) 296-8567 |
| Brandon Atkins | Tel. (212) 761-4846 |
THE INFORMATION IN THIS STRUCTURAL AND COLLATERAL TERM SHEET IS NOT COMPLETE AND MAY BE AMENDED PRIOR TO THE TIME OF SALE. THIS TERM SHEET IS NOT AN OFFER TO SELL THESE SECURITIES AND IT IS NOT A SOLICITATION OF AN OFFER TO BUY THESE SECURITIES IN ANY JURISDICTION WHERE THE OFFER OR SALE IS NOT PERMITTED.
| 147 |