| FREE WRITING PROSPECTUS | ||
| FILED PURSUANT TO RULE 433 | ||
| REGISTRATION FILE NO.: 333-226486-01 | ||
 |  |
Free Writing Prospectus
Structural and Collateral Term Sheet
$951,555,654
(Approximate Initial Pool Balance)
$830,232,000
(Approximate Aggregate Certificate Balance of Offered Certificates)
Wells Fargo Commercial Mortgage Trust 2018-C47
as Issuing Entity
Wells Fargo Commercial Mortgage Securities, Inc.
as Depositor
Wells Fargo Bank, National Association
Barclays Bank PLC
Ladder Capital Finance LLC
Rialto Mortgage Finance, LLC
C-III Commercial Mortgage LLC
as Sponsors and Mortgage Loan Sellers
Commercial Mortgage Pass-Through Certificates
Series 2018-C47
October 1, 2018
WELLS FARGO SECURITIES Co-Lead Manager and Joint Bookrunner | BARCLAYS Co-Lead Manager and Joint Bookrunner | |
Academy Securities Co-Manager |
1
STATEMENT REGARDING THIS FREE WRITING PROSPECTUS
The depositor has filed a registration statement (including a prospectus) with the Securities and Exchange Commission (‘‘SEC’’) (SEC File No. 333-226486) for the offering to which this communication relates. Before you invest, you should read the prospectus in the registration statement and other documents the depositor has filed with the SEC for more complete information about the depositor, the issuing entity and this offering. You may get these documents for free by visiting EDGAR on the SEC Web site at www.sec.gov. Alternatively, the depositor, any underwriter, or any dealer participating in the offering will arrange to send you the prospectus after filing if you request it by calling toll free 1-800-745-2063 (8 a.m. – 5 p.m. EST) or by emailing wfs.cmbs@wellsfargo.com.
Nothing in this document constitutes an offer of securities for sale in any jurisdiction where the offer or sale is not permitted. The information contained herein is preliminary as of the date hereof, supersedes any such information previously delivered to you and will be superseded by any such information subsequently delivered and ultimately by the final prospectus relating to the securities. These materials are subject to change, completion, supplement or amendment from time to time.
This free writing prospectus has been prepared by the underwriters for information purposes only and does not constitute, in whole or in part, a prospectus for the purposes of Directive 2003/71/EC (as amended) and/or Part VI of the Financial Services and Markets Act 2000, as amended, or other offering document.
STATEMENT REGARDING ASSUMPTIONS AS TO SECURITIES, PRICING ESTIMATES AND OTHER INFORMATION
The attached information contains certain tables and other statistical analyses (the “Computational Materials”) which have been prepared in reliance upon information furnished by the Mortgage Loan Sellers. Numerous assumptions were used in preparing the Computational Materials, which may or may not be reflected herein. As such, no assurance can be given as to the Computational Materials’ accuracy, appropriateness or completeness in any particular context; or as to whether the Computational Materials and/or the assumptions upon which they are based reflect present market conditions or future market performance. The Computational Materials should not be construed as either projections or predictions or as legal, tax, financial or accounting advice. You should consult your own counsel, accountant and other advisors as to the legal, tax, business, financial and related aspects of a purchase of these securities. Any weighted average lives, yields and principal payment periods shown in the Computational Materials are based on prepayment and/or loss assumptions, and changes in such prepayment and/or loss assumptions may dramatically affect such weighted average lives, yields and principal payment periods. In addition, it is possible that prepayments or losses on the underlying assets will occur at rates higher or lower than the rates shown in the attached Computational Materials. The specific characteristics of the securities may differ from those shown in the Computational Materials due to differences between the final underlying assets and the preliminary underlying assets used in preparing the Computational Materials. The principal amount and designation of any security described in the Computational Materials are subject to change prior to issuance. None of Wells Fargo Securities, LLC, Barclays Capital Inc., Academy Securities, Inc., or any of their respective affiliates, make any representation or warranty as to the actual rate or timing of payments or losses on any of the underlying assets or the payments or yield on the securities. The information in this presentation is based upon management forecasts and reflects prevailing conditions and management’s views as of this date, all of which are subject to change. In preparing this presentation, we have relied upon and assumed, without independent verification, the accuracy and completeness of all information available from public sources or which was provided to us by or on behalf of the Mortgage Loan Sellers or which was otherwise reviewed by us.
This free writing prospectus contains certain forward-looking statements. If and when included in this free writing prospectus, the words “expects”, “intends”, “anticipates”, “estimates” and analogous expressions and all statements that are not historical facts, including statements about our beliefs or expectations, are intended to identify forward-looking statements. Any forward-looking statements are made subject to risks and uncertainties which could cause actual results to differ materially from those stated. Those risks and uncertainties include, among other things, declines in general economic and business conditions, increased competition, changes in demographics, changes in political and social conditions, regulatory initiatives and changes in customer preferences, many of which are beyond our control and the control of any other person or entity related to this offering. The forward-looking statements made in this free writing prospectus are made as of the date stated on the cover. We have no obligation to update or revise any forward-looking statement.
Wells Fargo Securities is the trade name for the capital markets and investment banking services of Wells Fargo & Company and its subsidiaries, including but not limited to Wells Fargo Securities, LLC, a member of NYSE, FINRA, NFA and SIPC, Wells Fargo Prime Services, LLC, a member of FINRA, NFA and SIPC, and Wells Fargo Bank, N.A. Wells Fargo Securities, LLC and Wells Fargo Prime Services, LLC are distinct entities from affiliated banks and thrifts.
IMPORTANT NOTICE REGARDING THE OFFERED CERTIFICATES
The information herein is preliminary and may be supplemented or amended prior to the time of sale. In addition, the Offered Certificates referred to in these materials and the asset pool backing them are subject to modification or revision (including the possibility that one or more classes of certificates may be split, combined or eliminated at any time prior to issuance or availability of a final prospectus) and are offered on a “when, as and if issued” basis.
The underwriters described in these materials may from time to time perform investment banking services for, or solicit investment banking business from, any company named in these materials. The underwriters and/or their affiliates or respective employees may from time to time have a long or short position in any security or contract discussed in these materials.
The information contained herein supersedes any previous such information delivered to any prospective investor and will be superseded by information delivered to such prospective investor prior to the time of sale.
IMPORTANT NOTICE RELATING TO AUTOMATICALLY-GENERATED EMAIL DISCLAIMERS
Any legends, disclaimers or other notices that may appear at the bottom of any email communication to which this free writing prospectus is attached relating to (1) these materials not constituting an offer (or a solicitation of an offer), (2) any representation that these materials are accurate or complete and may not be updated or (3) these materials possibly being confidential, are not applicable to these materials and should be disregarded. Such legends, disclaimers or other notices have been automatically generated as a result of these materials having been sent via Bloomberg or another system.
THE INFORMATION IN THIS STRUCTURAL AND COLLATERAL TERM SHEET IS NOT COMPLETE AND MAY BE AMENDED PRIOR TO THE TIME OF SALE. THIS TERM SHEET IS NOT AN OFFER TO SELL THESE SECURITIES AND IT IS NOT A SOLICITATION OF AN OFFER TO BUY THESE SECURITIES IN ANY JURISDICTION WHERE THE OFFER OR SALE IS NOT PERMITTED.
2
| Wells Fargo Commercial Mortgage Trust 2018-C47 | Certificate Structure |
I. Certificate Structure
| Class | Expected Ratings (DBRS/Fitch/Moody’s)(1) | Approximate Initial Certificate Balance or Notional Amount(2) | Approx. Initial Credit Support(3) | Pass-Through Rate Description | Weighted Average Life (Years)(4) | Expected Principal Window(4) | Certificate Principal to Value Ratio(5) | Certificate Principal U/W NOI Debt Yield(6) | ||
| Offered Certificates | ||||||||||
| A-1 | AAA(sf)/AAAsf/Aaa(sf) | $23,396,000 | 30.000% | (7) | 2.87 | 11/18 – 09/23 | 41.2% | 16.0% | ||
| A-2 | AAA(sf)/AAAsf/Aaa(sf) | $26,280,000 | 30.000% | (7) | 4.93 | 09/23 – 10/23 | 41.2% | 16.0% | ||
| A-SB | AAA(sf)/AAAsf/Aaa(sf) | $45,625,000 | 30.000% | (7) | 7.35 | 10/23 – 05/28 | 41.2% | 16.0% | ||
| A-3 | AAA(sf)/AAAsf/Aaa(sf) | (8) | 30.000% | (7) | (8) | (8) | 41.2% | 16.0% | ||
| A-4 | AAA(sf)/AAAsf/Aaa(sf) | (8) | 30.000% | (7) | (8) | (8) | 41.2% | 16.0% | ||
| X-A | AAA(sf)/AAAsf/Aaa(sf) | $666,088,000(9) | N/A | Variable(10) | N/A | N/A | N/A | N/A | ||
| X-B | AA(low)(sf)/A-sf/NR | $164,144,000(11) | N/A | Variable(12) | N/A | N/A | N/A | N/A | ||
| A-S | AAA(sf)/AAAsf/Aa2(sf) | $86,830,000 | 20.875% | (7) | 9.89 | 09/28 – 09/28 | 46.6% | 14.1% | ||
| B | AA(sf)/AA-sf/NR | $38,062,000 | 16.875% | (7) | 9.90 | 09/28 – 10/28 | 48.9% | 13.5% | ||
| C | A(high)(sf)/A-sf/NR | $39,252,000 | 12.750% | (7) | 9.97 | 10/28 – 10/28 | 51.3% | 12.8% | ||
| Non-Offered Certificates | ||||||||||
| X-D(13) | A(sf)/BBB-sf/NR | $28,266,000(14) | N/A | Variable(15) | N/A | N/A | N/A | N/A | ||
| D(13) | A(low)(sf)/BBB-sf/NR | $28,266,000 | 9.780% | (7) | 9.97 | 10/28 – 10/28 | 53.1% | 12.4% | ||
| Risk Retention Certificates | ||||||||||
| E-RR(13) | BBB(sf)/BBB-sf/NR | $20,501,000 | 7.625% | (7) | 9.97 | 10/28 – 10/28 | 54.3% | 12.1% | ||
| F-RR | BBB(low)(sf)/BB+sf/NR | $13,084,000 | 6.250% | (7) | 9.97 | 10/28 – 10/28 | 55.2% | 11.9% | ||
| G-RR | BB(sf)/BB-sf/NR | $10,705,000 | 5.125% | (7) | 9.97 | 10/28 – 10/28 | 55.8% | 11.8% | ||
| H-RR | B(high)(sf)/B-sf/NR | $9,515,000 | 4.125% | (7) | 9.97 | 10/28 – 10/28 | 56.4% | 11.7% | ||
| J-RR | NR/NR/NR | $39,252,654 | 0.000% | (7) | 9.97 | 10/28 – 10/28 | 58.8% | 11.2% | ||
| Notes: | |
| (1) | The expected ratings presented are those of DBRS, Inc. (“DBRS”), Fitch Ratings, Inc. (“Fitch”) and Moody’s Investors Service, Inc. (“Moody’s”), which the depositor hired to rate the Offered Certificates. One or more other nationally recognized statistical rating organizations that were not hired by the depositor may use information they receive pursuant to Rule 17g-5 under the Securities Exchange Act of 1934, as amended (the “Exchange Act”) or otherwise, to rate or provide market reports and/or published commentary related to the Offered Certificates. We cannot assure you as to what ratings a non-hired nationally recognized statistical rating organization would assign or that its reports will not express differing, possibly negative, views of the mortgage loans and/or the Offered Certificates. The ratings of each class of Offered Certificates address the likelihood of the timely distribution of interest and, except in the case of the Class X-A, X-B and X-D Certificates, the ultimate distribution of principal due on those classes on or before the Rated Final Distribution Date. See “Risk Factors—Other Risks Relating to the Certificates—Nationally Recognized Statistical Rating Organizations May Assign Different Ratings to the Certificates; Ratings of the Certificates Reflect Only the Views of the Applicable Rating Agencies as of the Dates Such Ratings Were Issued; Ratings May Affect ERISA Eligibility; Ratings May Be Downgraded” and “Ratings” in the Preliminary Prospectus, expected to be dated October 1, 2018 (the “Preliminary Prospectus”). DBRS, Fitch and Moody’s have informed us that the “sf” designation in their ratings represents an identifier for structured finance product ratings. |
| (2) | The certificate balances and notional amounts set forth in the table are approximate. The actual initial certificate balances and notional amounts may be larger or smaller depending on the initial pool balance of the mortgage loans definitively included in the pool of mortgage loans, which aggregate cut-off date balance may be as much as 5% larger or smaller than the amount presented in the Preliminary Prospectus. In addition, the notional amounts of the Class X-A, X-B and X-D certificates may vary depending upon the final pricing of the classes of principal balance certificates whose certificate balances comprise such notional amounts, and, if, as a result of such pricing, the pass-through rate of the Class X-A, X-B or X-D certificates, as applicable, would be equal to zero at all times, such class of certificates may not be issued on the closing date of this securitization. |
| (3) | The approximate initial credit support with respect to the Class A-1, A-2, A-SB, A-3 and A-4 Certificates represents the approximate credit enhancement for the Class A-1, A-2, A-SB, A-3 and A-4 Certificates in the aggregate. |
| (4) | Weighted Average Lives and Expected Principal Windows are calculated based on an assumed prepayment rate of 0% CPR and the “Structuring Assumptions” described under “Yield and Maturity Considerations—Weighted Average Life” in the Preliminary Prospectus. |
| (5) | The Certificate Principal to Value Ratio for each Class of Certificates (other than the Class A-1, A-2, A-SB, A-3 and A-4 Certificates) is calculated as the product of (a) the weighted average Cut-off Date LTV Ratio for the mortgage loans and (b) a fraction, the numerator of which is the total initial Certificate Balance of such Class of Certificates and all Classes of Principal Balance Certificates (as defined in the Preliminary Prospectus) senior to such Class of Certificates and the denominator of which is the total initial Certificate Balance of all of the Principal Balance Certificates. The Certificate Principal to Value Ratio for each of the Class A-1, A-2, A-SB, A-3 and A-4 Certificates is calculated in the aggregate for those Classes as if they were a single Class and is calculated as the product of (a) the weighted average Cut-off Date LTV Ratio for the mortgage loans and (b) a fraction, the numerator of which is the total initial aggregate Certificate Balances of such Classes of Certificates and the denominator of which is the total initial Certificate Balance of all of the Principal Balance Certificates. In any event, however, excess mortgaged property value associated with a mortgage loan will not be available to offset losses on any other mortgage loan. |
| (6) | The Certificate Principal U/W NOI Debt Yield for each Class of Certificates (other than the Class A-1, A-2, A-SB, A-3 and A-4 Certificates) is calculated as the product of (a) the weighted average U/W NOI Debt Yield for the mortgage loans and (b) a fraction, the numerator of which is the total initial Certificate Balance of all of the Classes of Principal Balance Certificates and the denominator of which is the total initial Certificate Balance for such Class of Certificates and all Classes of Principal Balance Certificates senior to such Class of Certificates. The Certificate Principal U/W NOI Debt Yield for each of the Class A-1, A-2, A-SB, A-3 and A-4 Certificates is calculated in the aggregate for those Classes as if they were a single Class and is calculated as the product of (a) the weighted average U/W NOI Debt Yield for the mortgage loans and (b) a fraction, the numerator of which is the total initial Certificate Balance of all of the Classes of Principal Balance Certificates and the denominator of which is the total aggregate initial Certificate Balances for the Class A-1, A-2, A-SB, A-3 and A-4 Certificates. In any event, however, cash flow from each mortgaged property supports only the related mortgage loan and will not be available to support any other mortgage loan. |
THE INFORMATION IN THIS STRUCTURAL AND COLLATERAL TERM SHEET IS NOT COMPLETE AND MAY BE AMENDED PRIOR TO THE TIME OF SALE. THIS TERM SHEET IS NOT AN OFFER TO SELL THESE SECURITIES AND IT IS NOT A SOLICITATION OF AN OFFER TO BUY THESE SECURITIES IN ANY JURISDICTION WHERE THE OFFER OR SALE IS NOT PERMITTED.
3
| Wells Fargo Commercial Mortgage Trust 2018-C47 | Certificate Structure |
| (7) | The pass-through rates for the Class A-1, A-2, A-SB, A-3, A-4, A-S, B, C, D, E-RR, F-RR, G-RR, H-RR and J-RR Certificates in each case will be one of the following: (i) a fixed rateper annum, (ii) a variable rate per annum equal to the weighted average of the net mortgage interest rates on the mortgage loans for the related distribution date, (iii) a variable rateper annum equal to the lesser of (a) a fixed rate and (b) the weighted average of the net mortgage interest rates on the mortgage loans for the related distribution date or (iv) a variable rateper annum equal to the weighted average of the net mortgage interest rates on the mortgage loans for the related distribution date minus a specified percentage. For purposes of the calculation of the weighted average of the net mortgage interest rates on the mortgage loans for each distribution date, the mortgage interest rates will be adjusted as necessary to a 30/360 basis. |
| (8) | The exact initial certificate balances of the Class A-3 and A-4 Certificates are unknown and will be determined based on the final pricing of those classes of certificates. However, the respective initial certificate balances, weighted average lives and principal windows of the Class A-3 and A-4 Certificates are expected to be within the applicable ranges reflected in the following chart. The aggregate initial certificate balance of the Class A-3 and A-4 Certificates is expected to be approximately $570,787,000, subject to a variance of plus or minus 5%. |
| Class of Certificates | Expected Range of Approximate Initial Certificate Balance | Expected Range of Weighted Average Life (Years) | Expected Range of Principal Window | |||
| Class A-3 | $100,000,000 - $280,000,000 | 9.63 – 9.73 | 05/28 – 07/28 / 05/28 – 08/28 | |||
| Class A-4 | $290,787,000 - $470,787,000 | 9.85 – 9.89 | 07/28 – 09/28 / 08/28 – 09/28 |
| (9) | The Class X-A Certificates are notional amount certificates. The Notional Amount of the Class X-A Certificates will be equal to the aggregate Certificate Balance of the Class A-1, A-2, A-SB, A-3 and A-4 Certificates outstanding from time to time. The Class X-A Certificates will not be entitled to distributions of principal. |
| (10) | The pass-through rate for the Class X-A Certificates for any distribution date will be aper annum rate equal to the excess, if any, of (a) the weighted average of the net mortgage interest rates on the mortgage loans for the related distribution date, over (b) the weighted average of the pass-through rates on the Class A-1, A-2, A-SB, A-3 and A-4 Certificates for the related distribution date, weighted on the basis of their respective Certificate Balances outstanding immediately prior to that distribution date. For purposes of the calculation of the weighted average of the net mortgage interest rates on the mortgage loans for each distribution date, the mortgage interest rates will be adjusted as necessary to a 30/360 basis. |
| (11) | The Class X-B Certificates are notional amount certificates. The Notional Amount of the Class X-B Certificates will be equal to the aggregate Certificate Balance of the Class A-S, B and C Certificates outstanding from time to time. The Class X-B Certificates will not be entitled to distributions of principal. |
| (12) | The pass-through rate for the Class X-B Certificates for any distribution date will be aper annum rate equal to the excess, if any, of (a) the weighted average of the net mortgage interest rates on the mortgage loans for the related distribution date, over (b) the weighted average of the pass-through rates on the Class A-S, B and C Certificates for the related distribution date, weighted on the basis of their respective Certificate Balances outstanding immediately prior to that distribution date. For purposes of the calculation of the weighted average of the net mortgage interest rates on the mortgage loans for each distribution date, the mortgage interest rates will be adjusted as necessary to a 30/360 basis. |
| (13) | The initial notional amount of the X-D certificates and the initial certificate balance of each of the Class D and E-RR certificates are subject to change based on final pricing of all certificates and the final determination of the Class E-RR, F-RR, G-RR, H-RR and J-RR Certificates (collectively, the “horizontal risk retention certificates”) that will be retained by the retaining sponsor through a third party purchaser as part of the U.S. risk retention requirements. For more information regarding the methodology and key inputs and assumptions used to determine the sizing of the horizontal risk retention certificates, see “Credit Risk Retention” in the Preliminary Prospectus. |
| (14) | The Class X-D Certificates are notional amount certificates. The Notional Amount of the Class X-D Certificates will be equal to the Certificate Balance of the Class D Certificates outstanding from time to time. The Class X-D Certificates will not be entitled to distributions of principal. |
| (15) | The pass-through rate for the Class X-D Certificates for any distribution date will be aper annum rate equal to the excess, if any, of (a) the weighted average of the net mortgage interest rates on the mortgage loans for the related distribution date, over (b) the pass-through rate on the Class D Certificates for the related distribution date. For purposes of the calculation of the weighted average of the net mortgage interest rates on the mortgage loans for each distribution date, the mortgage interest rates will be adjusted as necessary to a 30/360 basis. |
THE INFORMATION IN THIS STRUCTURAL AND COLLATERAL TERM SHEET IS NOT COMPLETE AND MAY BE AMENDED PRIOR TO THE TIME OF SALE. THIS TERM SHEET IS NOT AN OFFER TO SELL THESE SECURITIES AND IT IS NOT A SOLICITATION OF AN OFFER TO BUY THESE SECURITIES IN ANY JURISDICTION WHERE THE OFFER OR SALE IS NOT PERMITTED.
4
| Wells Fargo Commercial Mortgage Trust 2018-C47 | Transaction Highlights |
II. Transaction Highlights
Mortgage Loan Sellers:
Mortgage Loan Seller | Number of | Number of | Aggregate Cut-off | % of Initial |
| Wells Fargo Bank, National Association | 19 | 43 | $322,529,075 | 33.9% |
| Barclays Bank PLC | 14 | 17 | 246,449,941 | 25.9 |
| Ladder Capital Finance LLC | 12 | 16 | 196,042,420 | 20.6 |
| Rialto Mortgage Finance, LLC | 11 | 12 | 112,797,103 | 11.9 |
| C-III Commercial Mortgage LLC | 18 | 18 | 73,737,115 | 7.7 |
Total | 74 | 106 | $951,555,654 | 100.0% |
Loan Pool:
| Initial Pool Balance: | $951,555,654 |
| Number of Mortgage Loans: | 74 |
| Average Cut-off Date Balance per Mortgage Loan: | $12,858,860 |
| Number of Mortgaged Properties: | 106 |
| Average Cut-off Date Balance per Mortgaged Property(1): | $8,976,940 |
| Weighted Average Mortgage Interest Rate: | 4.956% |
| Ten Largest Mortgage Loans as % of Initial Pool Balance: | 42.0% |
| Weighted Average Original Term to Maturity (months): | 118 |
| Weighted Average Remaining Term to Maturity (months): | 117 |
| Weighted Average Original Amortization Term (months)(2): | 361 |
| Weighted Average Remaining Amortization Term (months)(2): | 361 |
| Weighted Average Seasoning (months): | 1 |
| (1) | Information regarding mortgage loans secured by multiple properties is based on an allocation according to relative appraised values or the allocated loan amounts or property-specific release prices set forth in the related loan documents or such other allocation as the related mortgage loan seller deemed appropriate. |
| (2) | Excludes any mortgage loan that does not amortize. |
Credit Statistics:
| Weighted Average U/W Net Cash Flow DSCR(1): | 1.84x |
| Weighted Average U/W Net Operating Income Debt Yield(1): | 11.2% |
| Weighted Average Cut-off Date Loan-to-Value Ratio(1): | 58.8% |
| Weighted Average Balloon Loan-to-Value Ratio(1): | 53.8% |
| % of Mortgage Loans with Additional Subordinate Debt(2): | 23.6% |
| % of Mortgage Loans with Single Tenants(3): | 7.9% |
| (1) | With respect to any mortgage loan that is part of a whole loan, loan-to-value ratio, debt service coverage ratio and debt yield calculations include the relatedpari passucompanion loan(s) but exclude any related subordinate debt (unless otherwise stated). The debt service coverage ratio, debt yield and loan-to-value ratio information do not take into account any subordinate debt (whether or not secured by the related mortgaged property), that currently exists or is allowed under the terms of any mortgage loan. See “Description of the Mortgage Pool—Mortgage Pool Characteristics” in the Preliminary Prospectus and Annex A-1 to the Preliminary Prospectus. |
| (2) | The percentage figure expressed as “% of Mortgage Loans with Additional Subordinate Debt” is determined as a percentage of the initial pool balance and does not take into account any future subordinate debt (whether or not secured by the mortgaged property), if any, that may be permitted under the terms of any mortgage loan or the pooling and servicing agreement. See “Description of the Mortgage Pool—Additional Indebtedness—Other Unsecured Indebtedness” in the Preliminary Prospectus. |
| (3) | Excludes mortgage loans that are secured by multiple single tenant properties. |
THE INFORMATION IN THIS STRUCTURAL AND COLLATERAL TERM SHEET IS NOT COMPLETE AND MAY BE AMENDED PRIOR TO THE TIME OF SALE. THIS TERM SHEET IS NOT AN OFFER TO SELL THESE SECURITIES AND IT IS NOT A SOLICITATION OF AN OFFER TO BUY THESE SECURITIES IN ANY JURISDICTION WHERE THE OFFER OR SALE IS NOT PERMITTED.
5
| Wells Fargo Commercial Mortgage Trust 2018-C47 | Transaction Highlights |
Loan Structural Features:
Amortization:Based on the Initial Pool Balance, 61.0% of the mortgage pool (56 mortgage loans) has scheduled amortization, as follows:
39.2% (29 mortgage loans) provides for an interest-only period followed by an amortization period;
21.7% (27 mortgage loans) requires amortization during the entire loan term; and
Interest-Only:Based on the Initial Pool Balance, 39.0% of the mortgage pool (18 mortgage loans) provides for interest-only payments during the entire loan term through maturity. The Weighted Average Cut-off Date Loan-to-Value Ratio and Weighted Average U/W Net Cash Flow DSCR for those mortgage loans are 50.6% and 2.24x, respectively.
Hard Lockboxes: Based on the Initial Pool Balance, 39.5% of the mortgage pool (17 mortgage loans) have hard lockboxes in place.
Reserves:The mortgage loans require amounts to be escrowed monthly as follows (excluding any mortgage loans with springing provisions):
| Real Estate Taxes: | 73.4% of the pool |
| Insurance: | 58.3% of the pool |
| Capital Replacements: | 78.5% of the pool |
| TI/LC: | 50.9% of the pool(1) |
| (1) The percentage of Initial Pool Balance for mortgage loans with TI/LC reserves is based on the aggregate principal balance allocable to loans that include retail, office, mixed use and industrial properties. | |
Call Protection/Defeasance: Based on the Initial Pool Balance, the mortgage pool has the following call protection and defeasance features:
78.5% of the mortgage pool (64 mortgage loans) features a lockout period, then defeasance only until an open period;
8.4% of the mortgage pool (6 mortgage loans) features a lockout period, then the greater of a prepayment premium (1%) or yield maintenance until an open period;
7.4% of the mortgage pool (1 mortgage loan) features a lockout period, then the greater of a prepayment premium (1%) or yield maintenance, then the greater of a prepayment premium (1%) or yield maintenance or defeasance until an open period;
2.9% of the mortgage pool (2 mortgage loans) features a lockout period, then the greater of a prepayment premium (1%) or yield maintenance or defeasance until an open period;
2.7% of the mortgage pool (1 mortgage loan) features the greater of a prepayment premium (1%) or yield maintenance, then the greater of a prepayment premium (1%) or yield maintenance or defeasance until an open period;
Prepayment restrictions for each mortgage loan reflect the entire life of the mortgage loan. Please refer to Annex A-1 to the Preliminary Prospectus and the footnotes related thereto for further information regarding individual loan call protection.
THE INFORMATION IN THIS STRUCTURAL AND COLLATERAL TERM SHEET IS NOT COMPLETE AND MAY BE AMENDED PRIOR TO THE TIME OF SALE. THIS TERM SHEET IS NOT AN OFFER TO SELL THESE SECURITIES AND IT IS NOT A SOLICITATION OF AN OFFER TO BUY THESE SECURITIES IN ANY JURISDICTION WHERE THE OFFER OR SALE IS NOT PERMITTED.
6
| Wells Fargo Commercial Mortgage Trust 2018-C47 | Issue Characteristics |
III. Issue Characteristics
| Securities Offered: | $830,232,000 approximate monthly pay, multi-class, commercial mortgage REMIC pass-through certificates consisting of ten classes (Classes A-1, A-2, A-SB, A-3, A-4, A-S, B, C, X-A and X-B), which are offered pursuant to a registration statement filed with the SEC (such classes of certificates, the “Offered Certificates”). | |
| Mortgage Loan Sellers: | Wells Fargo Bank, National Association (“WFB”), Barclays Bank PLC (“Barclays”), Ladder Capital Finance LLC (“LCF”), Rialto Mortgage Finance, LLC (“RMF”) and C-III Commercial Mortgage LLC (“CIIICM”) | |
| Joint Bookrunners and Co-Lead Managers: | Wells Fargo Securities, LLC and Barclays Capital Inc. | |
| Co-Manager: | Academy Securities, Inc. | |
| Rating Agencies: | DBRS, Inc., Fitch Ratings, Inc. and Moody’s Investors Service, Inc. | |
| Master Servicer: | Wells Fargo Bank, National Association | |
| Special Servicer: | Midland Loan Services, a Division of PNC Bank, National Association | |
| Certificate Administrator: | Wells Fargo Bank, National Association | |
| Trustee: | Wilmington Trust, National Association | |
| Operating Advisor: | Park Bridge Lender Services LLC | |
| Asset Representations Reviewer: | Park Bridge Lender Services LLC | |
| Initial Majority Controlling Class Certificateholder: | KKR Real Estate Credit Opportunity Partners Aggregator I L.P. or an affiliate | |
| U.S. Credit Risk Retention: | For a discussion on the manner in which the U.S. credit risk retention requirements will be satisfied by Wells Fargo Bank, National Association, as the retaining sponsor, see “Credit Risk Retention” in the Preliminary Prospectus. This transaction is being structured with a “third party purchaser” that will acquire an “eligible horizontal residual interest”, which will be comprised of the Class E-RR, F-RR, G-RR, H-RR and J-RR certificates (the “horizontal risk retention certificates”). KKR Real Estate Credit Opportunity Partners Aggregator I L.P. (in satisfaction of the retention obligations of Wells Fargo Bank, National Association, as the retaining sponsor) will be contractually obligated to retain (or to cause its “majority-owned affiliate” to retain) the horizontal risk retention certificates for a minimum of five years after the closing date, subject to certain permitted exceptions provided for under the risk retention rules. During this time, KKR Real Estate Credit Opportunity Partners Aggregator I L.P. will agree to comply with hedging, transfer and financing restrictions that are applicable to third party purchasers under the credit risk retention rules. For additional information, see “Credit Risk Retention” in the Preliminary Prospectus. | |
| EU Credit Risk Retention | None of the sponsors, the depositor or the issuing entity intends to retain a material net economic interest in the securitization constituted by the issue of the Offered Certificates in accordance with the EU risk retention and due diligence requirements or to take any other action which may be required by EEA-regulated investors for the purposes of their compliance with the EU risk retention and due diligence requirements or similar requirements. | |
| Cut-off Date: | The Cut-off Date with respect to each mortgage loan is the due date for the monthly debt service payment that is due in October 2018 (or, in the case of any mortgage loan that has its first due date in November 2018, the date that would have been its due date in October 2018 under the terms of that mortgage loan if a monthly debt service payment were scheduled to be due in that month). | |
| Expected Closing Date: | On or about October 25, 2018. | |
| Determination Dates: | The 11th day of each month (or if that day is not a business day, the next succeeding business day), commencing in November 2018. | |
| Distribution Dates: | The fourth business day following the Determination Date in each month, commencing in November 2018. | |
| Rated Final Distribution Date: | The Distribution Date in September 2061. |
THE INFORMATION IN THIS STRUCTURAL AND COLLATERAL TERM SHEET IS NOT COMPLETE AND MAY BE AMENDED PRIOR TO THE TIME OF SALE. THIS TERM SHEET IS NOT AN OFFER TO SELL THESE SECURITIES AND IT IS NOT A SOLICITATION OF AN OFFER TO BUY THESE SECURITIES IN ANY JURISDICTION WHERE THE OFFER OR SALE IS NOT PERMITTED.
7
| Wells Fargo Commercial Mortgage Trust 2018-C47 | Issue Characteristics |
| Interest Accrual Period: | With respect to any Distribution Date, the calendar month immediately preceding the month in which such Distribution Date occurs. | |
| Day Count: | The Offered Certificates will accrue interest on a 30/360 basis. | |
| Minimum Denominations: | $10,000 for each Class of Offered Certificates (other than the Class X-A and X-B Certificates) and $1,000,000 for the Class X-A and X-B Certificates. Investments may also be made in any whole dollar denomination in excess of the applicable minimum denomination. | |
| Clean-up Call: | 1.0% | |
| Delivery: | DTC, Euroclear and Clearstream Banking | |
| ERISA/SMMEA Status: | Each Class of Offered Certificates is expected to be eligible for exemptive relief under ERISA. No Class of Offered Certificates will be SMMEA eligible. | |
| Risk Factors: | THE CERTIFICATES INVOLVE CERTAIN RISKS AND MAY NOT BE SUITABLE FOR ALL INVESTORS. SEE THE “RISK FACTORS” SECTION OF THE PRELIMINARY PROSPECTUS. | |
| Bond Analytics Information: | The Certificate Administrator will be authorized to make distribution date statements, CREFC® reports and certain supplemental reports (other than confidential information) available to certain financial modeling and data provision services, including Bloomberg, L.P., Trepp, LLC, Intex Solutions, Inc., Interactive Data Corp., Markit Group Limited, BlackRock Financial Management, Inc., CMBS.com, Inc., Moody’s Analytics, MBS Data, LLC, Thomson Reuters Corporation and RealINSIGHT. |
THE INFORMATION IN THIS STRUCTURAL AND COLLATERAL TERM SHEET IS NOT COMPLETE AND MAY BE AMENDED PRIOR TO THE TIME OF SALE. THIS TERM SHEET IS NOT AN OFFER TO SELL THESE SECURITIES AND IT IS NOT A SOLICITATION OF AN OFFER TO BUY THESE SECURITIES IN ANY JURISDICTION WHERE THE OFFER OR SALE IS NOT PERMITTED.
8
| Wells Fargo Commercial Mortgage Trust 2018-C47 | Characteristics of the Mortgage Pool |
IV. Characteristics of the Mortgage Pool(1)
A. Ten Largest Mortgage Loans
| Mortgage Loan Seller | Mortgage Loan Name | City | State | Number of Mortgage Loans / Mortgaged Properties | Mortgage Loan Cut-off Date Balance ($) | % of Initial Pool Balance (%) | Property Type | Number of Rooms/SF | Cut-off Date Balance Per Room/SF | Cut-off Date LTV Ratio (%) | Balloon LTV Ratio (%) | U/W NCF DSCR (x) | U/W NOI Debt Yield (%) |
| WFB | Starwood Hotel Portfolio | Various | Various | 1 / 22 | $70,000,000 | 7.4% | Hospitality | 2,943 | $90,044 | 66.1% | 66.1% | 2.07x | 12.5% |
| WFB | Aventura Mall | Aventura | FL | 1 / 1 | 50,000,000 | 5.3 | Retail | 1,217,508 | 1,155 | 40.8 | 40.8 | 2.58 | 11.0 |
| Barclays | Christiana Mall | Newark | DE | 1 / 1 | 50,000,000 | 5.3 | Retail | 779,084 | 434 | 32.5 | 32.5 | 3.15 | 13.8 |
| WFB | Showcase II | Las Vegas | NV | 1 / 1 | 45,000,000 | 4.7 | Retail | 41,407 | 3,091 | 54.0 | 54.0 | 1.62 | 8.1 |
| Barclays | Virginia Beach Hotel Portfolio | Virginia Beach | VA | 1 / 2 | 45,000,000 | 4.7 | Hospitality | 456 | 197,368 | 69.0 | 59.6 | 1.84 | 13.1 |
| LCF | Holiday Inn FiDi | New York | NY | 1 / 1 | 35,000,000 | 3.7 | Hospitality | 492 | 176,880 | 37.3 | 37.3 | 2.47 | 14.2 |
| RMF | Lower Makefield Corporate Center - North | Lower Makefield Township | PA | 1 / 1 | 29,150,000 | 3.1 | Office | 190,183 | 153 | 69.1 | 63.4 | 1.71 | 11.5 |
| Barclays | 2747 Park Boulevard | Palo Alto | CA | 1 / 1 | 26,000,000 | 2.7 | Office | 36,120 | 720 | 37.7 | 34.4 | 2.42 | 14.7 |
| LCF | Meridian at North | Indianapolis | IN | 1 / 1 | 25,900,000 | 2.7 | Office | 334,506 | 77 | 61.1 | 54.2 | 1.53 | 11.3 |
| RMF | Ellsworth Place | Silver Spring | MD | 1 / 1 | 24,000,000 | 2.5 | Retail | 347,758 | 198 | 71.9 | 63.7 | 1.46 | 10.0 |
| Top Three Total/Weighted Average | 3 / 24 | $170,000,000 | 17.9% | 48.8% | 48.8% | 2.54x | 12.4% | ||||||
| Top Five Total/Weighted Average | 5 / 27 | $260,000,000 | 27.3% | 53.2% | 51.6% | 2.26x | 11.8% | ||||||
| Top Ten Total/Weighted Average | 10 / 32 | $400,050,000 | 42.0% | 53.6% | 51.0% | 2.15x | 12.0% | ||||||
| Non-Top Ten Total/Weighted Average | 64 / 74 | $551,505,654 | 58.0% | 62.6% | 55.8% | 1.62x | 10.6% | ||||||
| (1) | With respect to any mortgage loan that is part of a whole loan, Cut-off Date Balance Per Room/SF, loan-to-value ratio, debt service coverage ratio and debt yield calculations include the relatedpari passu companion loan(s) but exclude any related subordinate debt (unless otherwise stated). With respect to each mortgage loan, debt service coverage ratio, debt yield and loan-to-value ratio information do not take into account subordinate debt (whether or not secured by the related mortgaged property), if any, that currently exists or is allowed under the terms of such mortgage loan. |
THE INFORMATION IN THIS STRUCTURAL AND COLLATERAL TERM SHEET IS NOT COMPLETE AND MAY BE AMENDED PRIOR TO THE TIME OF SALE. THIS TERM SHEET IS NOT AN OFFER TO SELL THESE SECURITIES AND IT IS NOT A SOLICITATION OF AN OFFER TO BUY THESE SECURITIES IN ANY JURISDICTION WHERE THE OFFER OR SALE IS NOT PERMITTED.
9
| Wells Fargo Commercial Mortgage Trust 2018-C47 | Characteristics of the Mortgage Pool |
B. Summary of the Whole Loans
| Property Name | Mortgage Loan Seller in WFCM | Note(s)(1) | Original Balance | Holder of Note(1) | Lead Servicer for Whole Loan | Master Servicer Under Lead Securitization Servicing Agreement | Special Servicer Under Lead Securitization Servicing Agreement | ||
| Starwood Hotel Portfolio | WFB | A-1 | $70,000,000 | WFCM 2018-C47 | Yes | Wells Fargo Bank, National Association | Midland Loan Services | ||
| A-2 | $65,000,000 | BANK 2018-BNK14 | No | ||||||
| A-3 | $100,000,000 | WFB | No | ||||||
| A-4 | $30,000,000 | WFB | No | ||||||
| Aventura Mall | WFB | A-1-A, A-1-B, A-1-C, A-1-D | $406,700,000 | Aventura Mall Trust 2018-AVM | Yes | Wells Fargo Bank, National Association | CWCapital Asset Management | ||
| A-2-A-1, A-2-B-3 | $115,000,000 | Benchmark 2018-B4 | No | ||||||
| A-2-A-2, A-2-B-2-A | $103,000,000 | Benchmark 2018-B5 | No | ||||||
| A-2-A-4, A-2-B-4 | $110,000,000 | Benchmark 2018-B6 | No | ||||||
| A-2-B-1 | $60,000,000 | CD 2018-CD7 | No | ||||||
| A-2-A-3, A-2-A-5 | $125,000,000 | JPMorgan Chase Bank, N.A. | No | ||||||
| A-2-C-1, A-2-C-3, A-2-C-4, A-2-C-5 | $170,000,000 | Morgan Stanley Bank, N.A. | No | ||||||
| A-2-C-2, A-2-D-1 | $100,000,000 | BANK 2018-BNK14 | No | ||||||
| A-2-B-2-B, A-2-B-2-C, A-2-B-5 | $47,000,000 | Deutsche Bank AG, New York Branch | No | ||||||
| A-2-D-3 | $50,000,000 | WFCM 2018-C47 | No | ||||||
| A-2-D-4, A-2-D-5 | $70,000,000 | WFB | No | ||||||
| A-2-D-2 | $50,000,000 | CSAIL 2018-CX12 | No | ||||||
| B-1, B-2, B-3, B-4 | $343,300,000 | Aventura Mall Trust 2018-AVM | No | ||||||
| Christiana Mall | Barclays | A-1-A | $36,160,000 | BBCMS 2018-CHRS | Yes | Wells Fargo Bank, National Association |
Wells Fargo Bank, National | ||
| A-1-B | $50,000,000 | WFCM 2018-C47 | No | ||||||
| A-1-C | $40,000,000 | Barclays | No | ||||||
| A-1-D | $28,000,000 | Barclays | No | ||||||
| A-1-E | $14,840,000 | Barclays | No | ||||||
| A-2-A | $21,696,000 | BBCMS 2018-CHRS | No | ||||||
| A-2-B | $30,000,000 | UBS 2018-C13(3) | No | ||||||
| A-2-C | $25,000,000 | Société Générale | No | ||||||
| A-2-D | $15,000,000 | Société Générale | No | ||||||
| A-2-E | $9,704,000 | Société Générale | No | ||||||
| A-3-A | $14,464,000 | BBCMS 2018-CHRS | No | ||||||
| A-3-B | $30,000,000 | Deutsche Bank AG, New York Branch | No | ||||||
| A-3-C | $23,136,000 | Deutsche Bank AG, New York Branch | No | ||||||
| B-1 | $106,000,000 | BBCMS 2018-CHRS | No | ||||||
| B-2 | $63,600,000 | BBCMS 2018-CHRS | No | ||||||
| B-3 | $42,400,000 | BBCMS 2018-CHRS | No | ||||||
THE INFORMATION IN THIS STRUCTURAL AND COLLATERAL TERM SHEET IS NOT COMPLETE AND MAY BE AMENDED PRIOR TO THE TIME OF SALE. THIS TERM SHEET IS NOT AN OFFER TO SELL THESE SECURITIES AND IT IS NOT A SOLICITATION OF AN OFFER TO BUY THESE SECURITIES IN ANY JURISDICTION WHERE THE OFFER OR SALE IS NOT PERMITTED.
10
| Wells Fargo Commercial Mortgage Trust 2018-C47 | Characteristics of the Mortgage Pool |
| Showcase II | WFB | A-1 | $50,000,000 | BANK 2018-BNK13 | Yes | Wells Fargo Bank, National Association | Torchlight Loan Services, LLC | ||
| A-2 | $33,000,000 | WFCM 2018-C46 | No | ||||||
| A-3 | $45,000,000 | WFCM 2018-C47 | No | ||||||
| Virginia Beach Hotel Portfolio | Barclays | A-1 | $45,000,000 | WFCM 2018-C47 | Yes | Wells Fargo Bank, National Association | Midland Loan Services | ||
| A-2 | $30,000,000 | Barclays | No | ||||||
| A-3 | $15,000,000 | Barclays | No | ||||||
| Holiday Inn FiDi | LCF | A-1 | $32,025,000 | LCF | Yes | Wells Fargo Bank, National Association(2) | Midland Loan Services(2) | ||
| A-2 | $35,000,000 | WFCM 2018-C47 | No | ||||||
| A-3 | $20,000,000 | LCF | No | ||||||
| B | $50,000,000 | Third Party Purchaser | No | ||||||
| Ellsworth Place | RMF | A-1 | $24,000,000 | WFCM 2018-C47 | Yes | Wells Fargo Bank, National Association | Midland Loan Services | ||
| A-2 | $20,000,000 | UBS 2018-C13(3) | No | ||||||
| A-3 | $15,000,000 | RMF | No | ||||||
| A-4 | $5,000,000 | RMF | No | ||||||
| A-5 | $5,000,000 | RMF | No | ||||||
| Indian Hills Senior Community | LCF | A-1 | $18,350,000 | LCF | Yes | Wells Fargo Bank, National Association(2) | Midland Loan Services(2) | ||
| A-2 | $22,000,000 | WFCM 2018-C47 | No | ||||||
| A-3 | $11,000,000 | LCF | No | ||||||
| Skyline Village | Barclays | A-1 | $15,000,000 | WFCM 2018-C46 | Yes | Wells Fargo Bank, National Association | LNR Partners, LLC | ||
| A-2 | $9,800,000 | WFCM 2018-C47 | No | ||||||
| (1) | Unless otherwise indicated, each note not currently held by a securitization trust is expected to be contributed to a future securitization. No assurance can be provided that any such note will not be split further. |
| (2) | The related whole loan is expected to initially be serviced under the WFCM 2018-C47 pooling and servicing agreement until the securitization of the related “lead” pari passu note (namely, the related pari passu note marked “Yes” in the column entitled “Lead Servicer for Whole Loan”), after which the related whole loan will be serviced under the pooling and servicing agreement governing such securitization of the related “lead” pari passu note. The master servicer and special servicer for such securitization will be identified in a notice, report or statement to holders of the WFCM 2018-C47 certificates after the closing of such securitization. |
| (3) | The UBS 2018-C13 securitization is expected to close on or about October 11, 2018. |
THE INFORMATION IN THIS STRUCTURAL AND COLLATERAL TERM SHEET IS NOT COMPLETE AND MAY BE AMENDED PRIOR TO THE TIME OF SALE. THIS TERM SHEET IS NOT AN OFFER TO SELL THESE SECURITIES AND IT IS NOT A SOLICITATION OF AN OFFER TO BUY THESE SECURITIES IN ANY JURISDICTION WHERE THE OFFER OR SALE IS NOT PERMITTED.
11
| Wells Fargo Commercial Mortgage Trust 2018-C47 | Characteristics of the Mortgage Pool |
C. Mortgage Loans with Additional Secured and Mezzanine Financing
| Loan No. | Mortgage Loan Seller | Mortgage Loan Name | Mortgage Loan Cut-off Date Balance ($) | % of Initial Pool Balance (%) | Sub Debt Cut-off Date Balance ($) | Mezzanine Debt Cut-off Date Balance ($) | Total Debt Interest Rate (%)(1) | Mortgage Loan U/W NCF DSCR (x)(2) | Total Debt U/W NCF DSCR (x) | Mortgage Loan Cut-off Date U/W NOI Debt Yield (%)(2) | Total Debt Cut-off Date U/W NOI Debt Yield (%) | Mortgage Loan Cut-off Date LTV Ratio (%)(2) | Total Debt Cut-off Date LTV Ratio (%) |
| 2 | WFB | Aventura Mall | $50,000,000 | 5.3% | $343,300,000 | NAP | 4.1213% | 2.58x | 2.07x | 11.0% | 8.8% | 40.8% | 50.7% |
| 3 | Barclays | Christiana Mall | 50,000,000 | 5.3 | 212,000,000 | NAP | 4.2775 | 3.15 | 1.93 | 13.8 | 8.5 | 32.5 | 52.9 |
| 4 | WFB | Showcase II | 45,000,000 | 4.7 | NAP | $37,000,000 | 5.3680 | 1.62 | 1.15 | 8.1 | 6.3 | 54.0 | 69.6 |
| 6 | LCF | Holiday Inn Fidi | 35,000,000 | 3.7 | 50,000,000 | NAP | 5.2590 | 2.47 | 1.53 | 14.2 | 9.0 | 37.3 | 58.8 |
| 8 | Barclays | 2747 Park Boulevard | 26,000,000 | 2.7 | NAP | 24,000,000 | 5.5530 | 2.42 | 1.15 | 14.7 | 7.6 | 37.7 | 72.5 |
| 15 | WFB | Christenbury Corners | 18,500,000 | 1.9 | NAP | 2,500,000 | 5.6602 | 1.42 | 1.16 | 9.4 | 8.3 | 68.3 | 77.5 |
| Total/Weighted Average | $224,500,000 | 23.6% | $605,300,000 | $63,500,000 | 4.8760% | 2.38x | 1.59x | 11.8% | 8.1% | 43.0% | 61.0% | ||
| (1) | Total Debt Interest Rate for any specified mortgage loan reflects the weighted average of the interest rates on the respective components of the total debt. |
| (2) | With respect to any mortgage loan that is part of a whole loan, the loan-to-value ratio, debt service coverage ratio and debt yield calculations include the related pari passu companion loan(s). |
THE INFORMATION IN THIS STRUCTURAL AND COLLATERAL TERM SHEET IS NOT COMPLETE AND MAY BE AMENDED PRIOR TO THE TIME OF SALE. THIS TERM SHEET IS NOT AN OFFER TO SELL THESE SECURITIES AND IT IS NOT A SOLICITATION OF AN OFFER TO BUY THESE SECURITIES IN ANY JURISDICTION WHERE THE OFFER OR SALE IS NOT PERMITTED.
12
| Wells Fargo Commercial Mortgage Trust 2018-C47 | Characteristics of the Mortgage Pool |
D. Previous Securitization History(1)
| Loan No. | Mortgage Loan Seller | Mortgage Loan or Mortgaged Property Name | City | State | Property Type | Mortgage Loan or Mortgaged Property Cut-off Date Balance ($) | % of Initial Pool Balance (%) | Previous Securitization |
| 1 | WFB | Starwood Hotel Portfolio | Various | Various | Hospitality | $70,000,000 | 7.4% | CGCMT 2015-SSHP; WFRBS 2013-C18 |
| 3 | Barclays | Christiana Mall | Newark | DE | Retail | 50,000,000 | 5.3 | MSC 2011-C1 |
| 5.01 | Barclays | Hilton Virginia Beach Oceanfront | Virginia Beach | VA | Hospitality | 29,263,804 | 3.1 | JPMBB 2014-C21 |
| 18 | Barclays | Schuyler Commons | Utica | NY | Multifamily | 16,800,000 | 1.8 | GSMS 2015-GC28 |
| 22 | RMF | Allen Central Market | Allen | TX | Retail | 14,483,430 | 1.5 | LBUBS 2015-C7 |
| 26 | Barclays | 1400 Fifth Avenue | New York | NY | Retail | 12,300,000 | 1.3 | UBSBB 2012-C3 |
| 32 | CIIICM | Oak Lane MHC | Merrionette Park | IL | Manufactured Housing Community | 9,763,534 | 1.0 | JPMBB 2013-C15 |
| 38 | WFB | SPS Martinez - CA | Martinez | CA | Self Storage | 9,000,000 | 0.9 | MSC 2007-T25 |
| 40 | CIIICM | Chancellor Farms MHC | Fenton | MO | Manufactured Housing Community | 8,390,147 | 0.9 | JPMBB 2013-C15 |
| 50 | CIIICM | Town View Retail Center | Zephyrhills | FL | Retail | 6,237,163 | 0.7 | BSCMS 2005-PWR9 |
| 62 | CIIICM | Cahaba Mobile Estates | Trussville | AL | Manufactured Housing Community | 3,175,000 | 0.3 | WFCM 2015-C31 |
| Total | $229,413,079 | 24.1% |
| (1) | The table above represents the most recent securitization with respect to the mortgaged property securing the related mortgage loan, based on information provided by the related borrower or obtained through searches of a third-party database. While loans secured by the above mortgaged properties may have been securitized multiple times in prior transactions, mortgage loans in this securitization are only listed in the above chart if the mortgage loan paid off a loan in another securitization. The information has not otherwise been confirmed by the mortgage loan sellers. |
THE INFORMATION IN THIS STRUCTURAL AND COLLATERAL TERM SHEET IS NOT COMPLETE AND MAY BE AMENDED PRIOR TO THE TIME OF SALE. THIS TERM SHEET IS NOT AN OFFER TO SELL THESE SECURITIES AND IT IS NOT A SOLICITATION OF AN OFFER TO BUY THESE SECURITIES IN ANY JURISDICTION WHERE THE OFFER OR SALE IS NOT PERMITTED.
13
| Wells Fargo Commercial Mortgage Trust 2018-C47 | Characteristics of the Mortgage Pool |
E. Mortgage Loans with Scheduled Balloon Payments and Related Classes
| Class A-2(1) | ||||||||||||||||
| Loan No. | Mortgage Loan Seller | Mortgage Loan Name | State | Property Type | Mortgage Loan Cut-off Date Balance ($) | % of Initial Pool Balance (%) | Mortgage Loan Balance at Maturity ($) | % of Class A-2 Certificate Principal Balance (%)(2) | Units/Rooms | Loan per Unit/Room ($) | U/W NCF DSCR (x) | U/W NOI Debt Yield (%) | Cut-off Date LTV Ratio (%) | Balloon LTV Ratio (%) | Rem. IO Period (mos.) | Rem. Term to Maturity (mos.) |
| 23 | WFB | Four Points by Sheraton Miami Airport | FL | Hospitality | $13,750,000 | 1.4% | $13,186,988 | 50.2% | 124 | $110,887 | 1.62x | 12.7% | 58.8% | 56.4% | 23 | 60 |
| 27 | WFB | 4645 Live Oak Street | CA | Multifamily | 11,750,000 | 1.2 | 11,750,000 | 44.7 | 83 | 141,566 | 1.69 | 8.7 | 64.2 | 64.2 | 59 | 59 |
| Total/Weighted Average | $25,500,000 | 2.7% | $24,936,988 | 94.9% | 1.65x | 10.9% | 61.3% | 60.0% | 40 | 60 | ||||||
| (1) | The table above presents the mortgage loan(s) whose balloon payments would be applied to pay down the principal balance of the Class A-2 Certificates, assuming a 0% CPR and applying the “Structuring Assumptions” described in the Preliminary Prospectus, including the assumptions that (i) none of the mortgage loans in the pool experience prepayments prior to maturity, defaults or losses; (ii) there are no extensions of maturity dates of any mortgage loans in the pool; and (iii) each mortgage loan in the pool is paid in full on its stated maturity date. Each Class of Certificates evidences undivided ownership interests in the entire pool of mortgage loans. Debt service coverage ratio, debt yield and loan-to-value ratio information do not take into account subordinate debt (whether or not secured by the related mortgaged property), if any, that currently exists or is allowed under the terms of any mortgage loan. See Annex A-1 to the Preliminary Prospectus. |
| (2) | Reflects the percentage equal to the Balloon Balance divided by the initial Class A-2 Certificate Balance. |
THE INFORMATION IN THIS STRUCTURAL AND COLLATERAL TERM SHEET IS NOT COMPLETE AND MAY BE AMENDED PRIOR TO THE TIME OF SALE. THIS TERM SHEET IS NOT AN OFFER TO SELL THESE SECURITIES AND IT IS NOT A SOLICITATION OF AN OFFER TO BUY THESE SECURITIES IN ANY JURISDICTION WHERE THE OFFER OR SALE IS NOT PERMITTED.
14
| Wells Fargo Commercial Mortgage Trust 2018-C47 | Characteristics of the Mortgage Pool |
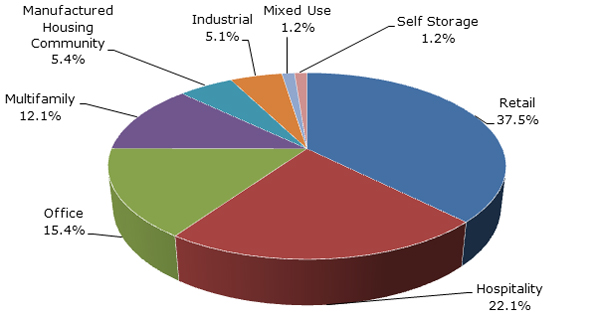
F. Property Type Distribution(1)
| Property Type | Number of Mortgaged Properties | Aggregate Cut-off Date Balance ($) | % of Initial Pool Balance (%) | Weighted Average Cut-off Date LTV Ratio (%) | Weighted Average Balloon LTV Ratio (%) | Weighted Average U/W NCF DSCR (x) | Weighted Average U/W NOI Debt Yield (%) | Weighted Average U/W NCF Debt Yield (%) | Weighted Average Mortgage Rate (%) |
| Retail | 30 | $357,095,674 | 37.5% | 55.2% | 51.1% | 1.91x | 10.5% | 10.1% | 4.830% |
| Anchored | 11 | 151,428,808 | 15.9 | 63.7 | 58.4 | 1.51 | 9.3 | 8.8 | 5.055 |
| Super Regional Mall | 2 | 100,000,000 | 10.5 | 36.7 | 36.7 | 2.87 | 12.4 | 12.2 | 4.199 |
| Shadow Anchored | 5 | 47,138,634 | 5.0 | 60.9 | 54.0 | 1.61 | 10.8 | 10.1 | 5.009 |
| Single Tenant | 9 | 34,903,232 | 3.7 | 62.6 | 56.3 | 1.59 | 10.1 | 9.8 | 5.275 |
| Unanchored | 3 | 23,625,000 | 2.5 | 57.1 | 51.7 | 1.49 | 10.0 | 9.6 | 5.051 |
| Hospitality | 31 | 210,691,941 | 22.1 | 60.1 | 55.2 | 1.99 | 13.2 | 11.7 | 5.167 |
| Full Service | 8 | 123,390,308 | 13.0 | 58.2 | 53.2 | 2.04 | 13.3 | 11.8 | 5.086 |
| Limited Service | 11 | 44,644,601 | 4.7 | 62.0 | 53.4 | 1.91 | 13.7 | 12.1 | 5.276 |
| Select Service | 7 | 29,567,751 | 3.1 | 62.7 | 61.6 | 1.86 | 12.6 | 10.9 | 5.350 |
| Extended Stay | 5 | 13,089,281 | 1.4 | 66.1 | 66.1 | 2.07 | 12.5 | 10.8 | 5.150 |
| Office | 10 | 146,390,022 | 15.4 | 56.1 | 51.5 | 2.12 | 12.8 | 11.8 | 4.668 |
| Suburban | 6 | 94,807,227 | 10.0 | 56.3 | 51.5 | 2.14 | 12.9 | 12.1 | 4.545 |
| CBD | 2 | 41,400,000 | 4.4 | 54.6 | 50.3 | 2.20 | 13.2 | 12.0 | 4.873 |
| Medical | 2 | 10,182,796 | 1.1 | 59.2 | 56.6 | 1.63 | 10.1 | 8.9 | 4.986 |
| Multifamily | 9 | 115,139,602 | 12.1 | 64.6 | 60.5 | 1.37 | 8.4 | 8.2 | 5.098 |
| Garden | 6 | 66,639,602 | 7.0 | 64.7 | 60.6 | 1.43 | 8.5 | 8.3 | 5.128 |
| High Rise | 1 | 22,000,000 | 2.3 | 64.2 | 59.3 | 1.26 | 9.0 | 8.2 | 5.130 |
| Age Restricted Housing | 1 | 16,800,000 | 1.8 | 64.6 | 59.4 | 1.33 | 8.3 | 8.3 | 4.726 |
| Mid Rise | 1 | 9,700,000 | 1.0 | 65.1 | 65.1 | 1.24 | 6.9 | 6.9 | 5.465 |
| Manufactured Housing Community | 11 | 50,980,952 | 5.4 | 66.0 | 56.9 | 1.36 | 9.0 | 8.8 | 5.189 |
| Manufactured Housing Community | 11 | 50,980,952 | 5.4 | 66.0 | 56.9 | 1.36 | 9.0 | 8.8 | 5.189 |
| Industrial | 10 | 48,062,846 | 5.1 | 70.6 | 58.9 | 1.50 | 11.4 | 10.3 | 5.237 |
| Warehouse | 5 | 22,004,846 | 2.3 | 72.1 | 58.9 | 1.51 | 12.1 | 10.9 | 5.282 |
| Flex | 2 | 13,108,000 | 1.4 | 73.7 | 61.5 | 1.31 | 9.9 | 8.9 | 5.489 |
| Cold Storage | 2 | 10,900,000 | 1.1 | 65.0 | 56.0 | 1.73 | 11.9 | 11.0 | 4.835 |
| Warehouse Distribution | 1 | 2,050,000 | 0.2 | 65.1 | 56.7 | 1.41 | 10.2 | 9.4 | 5.280 |
| Mixed Use | 3 | 11,694,616 | 1.2 | 45.8 | 38.3 | 1.99 | 13.3 | 12.8 | 5.086 |
| Retail/Office | 2 | 9,369,616 | 1.0 | 39.9 | 33.0 | 2.13 | 14.0 | 13.6 | 4.991 |
| Self Storage/Retail | 1 | 2,325,000 | 0.2 | 69.8 | 59.7 | 1.43 | 10.2 | 9.7 | 5.470 |
| Self Storage | 2 | 11,500,000 | 1.2 | 56.6 | 51.3 | 1.77 | 10.9 | 10.8 | 4.881 |
| Self Storage | 2 | 11,500,000 | 1.2 | 56.6 | 51.3 | 1.77 | 10.9 | 10.8 | 4.881 |
| Total/Weighted Average: | 106 | $951,555,654 | 100.0% | 58.8% | 53.8% | 1.84x | 11.2% | 10.5% | 4.956% |
| (1) | Because this table presents information relating to the mortgaged properties and not the mortgage loans, the information for mortgage loans secured by more than one mortgaged property is based on allocated amounts (allocating the principal balance of the mortgage loan to each of those properties according to the relative appraised values of the mortgaged properties or the allocated loan amounts or property-specific release prices set forth in the related mortgage loan documents or such other allocation as the related mortgage loan seller deemed appropriate). With respect to any mortgage loan that is part of a whole loan, the loan-to-value ratio, debt service coverage ratio and debt yield calculations include the related pari passu companion loan(s) but exclude any related subordinate debt (unless otherwise stated). With respect to each mortgage loan, debt service coverage ratio, debt yield and loan-to-value ratio information do not take into account any subordinate debt (whether or not secured by the related mortgaged property) that currently exists or is allowed under the terms of such mortgage loan. See Annex A-1 to the Preliminary Prospectus. |
THE INFORMATION IN THIS STRUCTURAL AND COLLATERAL TERM SHEET IS NOT COMPLETE AND MAY BE AMENDED PRIOR TO THE TIME OF SALE. THIS TERM SHEET IS NOT AN OFFER TO SELL THESE SECURITIES AND IT IS NOT A SOLICITATION OF AN OFFER TO BUY THESE SECURITIES IN ANY JURISDICTION WHERE THE OFFER OR SALE IS NOT PERMITTED.
15
| Wells Fargo Commercial Mortgage Trust 2018-C47 | Characteristics of the Mortgage Pool |
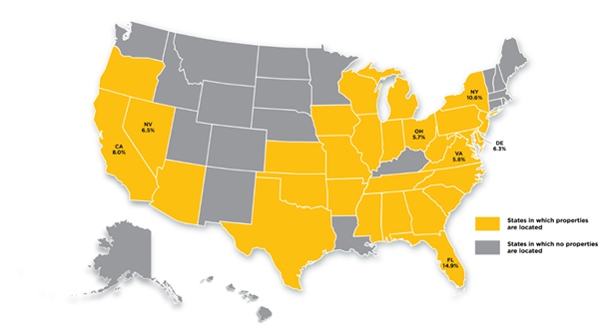
G. Geographic Distribution(1)
| Location | Number of Mortgaged Properties | Aggregate Cut-off Date Balance ($) | % of Initial Pool Balance (%) | Weighted Average Cut-off Date LTV Ratio (%) | Weighted Average Balloon LTV Ratio (%) | Weighted Average U/W NCF DSCR (x) | Weighted Average U/W NOI Debt Yield (%) | Weighted Average U/W NCF Debt Yield (%) | Weighted Average Mortgage Rate (%) |
| Florida | 14 | $141,728,444 | 14.9% | 51.8% | 49.0% | 2.11x | 11.4% | 10.7% | 4.756% |
| New York | 9 | 100,664,233 | 10.6 | 53.1 | 51.0 | 1.75 | 10.3 | 9.7 | 5.157 |
| California | 7 | 76,165,348 | 8.0 | 51.3 | 45.7 | 1.97 | 12.2 | 11.8 | 4.742 |
| Northern California | 4 | 55,549,732 | 5.8 | 51.1 | 44.3 | 1.98 | 12.6 | 12.2 | 4.678 |
| Southern California | 3 | 20,615,616 | 2.2 | 51.7 | 49.6 | 1.94 | 11.1 | 10.9 | 4.917 |
| Nevada | 2 | 62,000,000 | 6.5 | 57.3 | 55.8 | 1.68 | 9.3 | 9.0 | 4.885 |
| Delaware | 2 | 59,710,000 | 6.3 | 37.0 | 36.2 | 2.86 | 13.0 | 12.8 | 4.372 |
| Virginia | 3 | 54,800,000 | 5.8 | 69.9 | 60.7 | 1.79 | 12.7 | 11.5 | 4.935 |
| Ohio | 4 | 53,797,972 | 5.7 | 68.7 | 61.2 | 1.29 | 9.1 | 8.4 | 5.180 |
| Indiana | 3 | 43,439,602 | 4.6 | 63.9 | 57.1 | 1.50 | 10.3 | 9.4 | 5.026 |
| Illinois | 9 | 41,136,911 | 4.3 | 66.5 | 61.7 | 1.61 | 9.8 | 9.3 | 5.228 |
| Texas | 7 | 37,470,008 | 3.9 | 58.1 | 51.9 | 1.59 | 10.2 | 9.6 | 5.160 |
| North Carolina | 5 | 36,247,459 | 3.8 | 68.4 | 60.4 | 1.45 | 9.8 | 9.2 | 5.125 |
| Pennsylvania | 2 | 31,196,352 | 3.3 | 68.9 | 63.6 | 1.73 | 11.6 | 10.6 | 4.673 |
| Maryland | 3 | 27,816,171 | 2.9 | 71.1 | 64.0 | 1.54 | 10.3 | 9.6 | 5.029 |
| Kansas | 5 | 26,300,500 | 2.8 | 62.2 | 54.8 | 1.80 | 12.8 | 11.2 | 5.296 |
| Missouri | 4 | 25,443,084 | 2.7 | 68.6 | 64.4 | 1.82 | 11.2 | 10.0 | 5.143 |
| New Jersey | 2 | 25,200,000 | 2.6 | 48.4 | 40.7 | 2.63 | 15.5 | 14.3 | 4.899 |
| Georgia | 6 | 24,263,704 | 2.5 | 65.8 | 57.9 | 1.71 | 11.6 | 10.8 | 5.143 |
| Mississippi | 2 | 12,980,058 | 1.4 | 70.2 | 61.2 | 1.69 | 12.2 | 10.9 | 5.240 |
| Tennessee | 2 | 11,591,941 | 1.2 | 63.9 | 53.9 | 1.90 | 13.3 | 12.3 | 5.063 |
| Arkansas | 1 | 9,750,000 | 1.0 | 65.2 | 55.0 | 1.41 | 9.6 | 9.1 | 4.980 |
| South Carolina | 1 | 9,500,000 | 1.0 | 67.9 | 58.3 | 2.12 | 14.9 | 13.2 | 4.745 |
| Iowa | 2 | 9,449,671 | 1.0 | 64.7 | 63.1 | 1.88 | 11.6 | 10.5 | 5.150 |
| Alabama | 2 | 8,175,000 | 0.9 | 74.7 | 62.0 | 1.45 | 9.9 | 9.7 | 5.319 |
| Arizona | 2 | 6,825,000 | 0.7 | 66.2 | 58.8 | 1.34 | 10.2 | 8.9 | 5.259 |
| Oklahoma | 3 | 6,011,907 | 0.6 | 66.4 | 61.9 | 1.77 | 11.2 | 10.1 | 5.277 |
| West Virginia | 1 | 3,893,673 | 0.4 | 59.0 | 44.6 | 1.74 | 13.6 | 12.5 | 5.230 |
| Wisconsin | 1 | 3,115,618 | 0.3 | 66.1 | 66.1 | 2.07 | 12.5 | 10.8 | 5.150 |
| Oregon | 1 | 1,525,000 | 0.2 | 49.7 | 49.7 | 1.81 | 9.7 | 9.5 | 5.200 |
| Michigan | 1 | 1,358,000 | 0.1 | 70.0 | 58.4 | 1.61 | 11.4 | 11.0 | 5.480 |
| Total/Weighted Average | 106 | $951,555,654 | 100.0% | 58.8% | 53.8% | 1.84x | 11.2% | 10.5% | 4.956% |
| (1) | Because this table presents information relating to the mortgaged properties and not the mortgage loans, the information for mortgage loans secured by more than one mortgaged property is based on allocated amounts (allocating the principal balance of the mortgage loan to each of those properties according to the relative appraised values of the mortgaged properties or the allocated loan amounts or property-specific release prices set forth in the related mortgage loan documents or such other allocation as the related mortgage loan seller deemed appropriate). With respect to any mortgage loan that is part of a whole loan, the loan-to-value ratio, debt service coverage ratio and debt yield calculations include the relatedpari passu companion loan(s) but exclude any related subordinate debt (unless otherwise stated). With respect to each mortgage loan, debt service coverage ratio, debt yield and loan-to-value ratio information do not take into account any subordinate debt (whether or not secured by the related mortgaged property) that currently exists or is allowed under the terms of such mortgage loan. See Annex A-1 to the Preliminary Prospectus. |
THE INFORMATION IN THIS STRUCTURAL AND COLLATERAL TERM SHEET IS NOT COMPLETE AND MAY BE AMENDED PRIOR TO THE TIME OF SALE. THIS TERM SHEET IS NOT AN OFFER TO SELL THESE SECURITIES AND IT IS NOT A SOLICITATION OF AN OFFER TO BUY THESE SECURITIES IN ANY JURISDICTION WHERE THE OFFER OR SALE IS NOT PERMITTED.
16
| Wells Fargo Commercial Mortgage Trust 2018-C47 | Characteristics of the Mortgage Pool |
H. Characteristics of the Mortgage Pool(1)
| CUT-OFF DATE BALANCE | |||||||||
| Range of Cut-off Date Balances ($) | Number of Mortgage Loans | Aggregate Cut- off Date Balance | Percent by Aggregate Cut- off Date Pool Balance (%) | ||||||
| 1,358,000 - 2,000,000 | 5 | $7,922,000 | 0.8 | % | |||||
| 2,000,001 - 3,000,000 | 6 | 14,219,497 | 1.5 | ||||||
| 3,000,001 - 4,000,000 | 6 | 19,968,673 | 2.1 | ||||||
| 4,000,001 - 5,000,000 | 5 | 23,578,500 | 2.5 | ||||||
| 5,000,001 - 6,000,000 | 2 | 10,240,000 | 1.1 | ||||||
| 6,000,001 - 7,000,000 | 7 | 46,797,076 | 4.9 | ||||||
| 7,000,001 - 8,000,000 | 3 | 22,490,616 | 2.4 | ||||||
| 8,000,001 - 9,000,000 | 3 | 25,990,147 | 2.7 | ||||||
| 9,000,001 - 10,000,000 | 7 | 67,923,534 | 7.1 | ||||||
| 10,000,001 - 15,000,000 | 9 | 112,021,162 | 11.8 | ||||||
| 15,000,001 - 20,000,000 | 8 | 136,089,602 | 14.3 | ||||||
| 20,000,001 - 30,000,000 | 7 | 169,314,846 | 17.8 | ||||||
| 30,000,001 - 50,000,000 | 5 | 225,000,000 | 23.6 | ||||||
| 50,000,001 - 70,000,000 | 1 | 70,000,000 | 7.4 | ||||||
| Total: | 74 | $951,555,654 | 100.0 | % | |||||
| Weighted Average | $12,858,860 | ||||||||
| UNDERWRITTEN NOI DEBT SERVICE COVERAGE RATIO | |||||||||
| Range of U/W NOI DSCRs (x) | Number of Mortgage | Aggregate Cut- off Date Balance | Percent by Aggregate Cut- off Date Pool Balance (%) | ||||||
| 1.25 - 1.30 | 2 | $25,500,000 | 2.7 | % | |||||
| 1.31 - 1.40 | 11 | 98,595,952 | 10.4 | ||||||
| 1.41 - 1.50 | 14 | 94,451,574 | 9.9 | ||||||
| 1.51 - 1.60 | 9 | 89,233,430 | 9.4 | ||||||
| 1.61 - 1.70 | 9 | 122,166,079 | 12.8 | ||||||
| 1.71 - 1.80 | 7 | 67,484,390 | 7.1 | ||||||
| 1.81 - 1.90 | 6 | 60,593,673 | 6.4 | ||||||
| 1.91 - 2.00 | 3 | 43,000,000 | 4.5 | ||||||
| 2.01 - 2.50 | 7 | 173,278,616 | 18.2 | ||||||
| 2.51 - 3.00 | 4 | 111,751,941 | 11.7 | ||||||
| 3.01 - 3.50 | 1 | 50,000,000 | 5.3 | ||||||
| 3.51 - 3.57 | 1 | 15,500,000 | 1.6 | ||||||
| Total: | 74 | $951,555,654 | 100.0 | % | |||||
| Weighted Average | 1.97x | ||||||||
| UNDERWRITTEN NCF DEBT SERVICE COVERAGE RATIO | |||||||||
Range of U/W NCF DSCRs (x) | Number of Mortgage Loans | Aggregate Cut- off Date Balance | Percent by Aggregate Cut- off Date Pool Balance (%) | ||||||
| 1.24 - 1.30 | 9 | $86,257,682 | 9.1 | % | |||||
| 1.31 - 1.40 | 16 | 101,262,406 | 10.6 | ||||||
| 1.41 - 1.50 | 9 | 94,898,032 | 10.0 | ||||||
| 1.51 - 1.60 | 10 | 131,274,579 | 13.8 | ||||||
| 1.61 - 1.70 | 8 | 104,988,727 | 11.0 | ||||||
| 1.71 - 1.80 | 6 | 62,443,673 | 6.6 | ||||||
| 1.81 - 1.90 | 5 | 75,438,000 | 7.9 | ||||||
| 1.91 - 2.00 | 1 | 4,750,000 | 0.5 | ||||||
| 2.01 - 2.50 | 6 | 154,482,557 | 16.2 | ||||||
| 2.51 - 3.00 | 2 | 70,260,000 | 7.4 | ||||||
| 3.01 - 3.32 | 2 | 65,500,000 | 6.9 | ||||||
| Total: | 74 | $951,555,654 | 100.0 | % | |||||
| Weighted Average | 1.84x | ||||||||
| LOAN PURPOSE | |||||||||
| Loan Purpose | Number of Mortgage Loans | Aggregate Cut- off Date Balance | Percent by Aggregate Cut- off Date Pool Balance (%) | ||||||
| Refinance | 47 | $667,092,771 | 70.1 | % | |||||
| Acquisition | 26 | 280,569,210 | 29.5 | ||||||
| Recapitalization | 1 | 3,893,673 | 0.4 | ||||||
| Total: | 74 | $951,555,654 | 100.0 | % | |||||
| MORTGAGE RATE | |||
Range of Mortgage Rates (%) | Number of Mortgage Loans | Aggregate Cut- off Date Balance | Percent by Aggregate Cut- off Date Pool Balance (%) |
| 4.121 - 4.250 | 2 | $76,000,000 | 8.0% |
| 4.251 - 4.500 | 2 | 70,260,000 | 7.4 |
| 4.501 - 4.750 | 4 | 70,950,000 | 7.5 |
| 4.751 - 5.000 | 16 | 239,220,159 | 25.1 |
| 5.001 - 5.250 | 18 | 277,107,285 | 29.1 |
| 5.251 - 5.500 | 26 | 179,884,210 | 18.9 |
| 5.501 - 5.750 | 4 | 34,470,000 | 3.6 |
| 5.751 - 5.830 | 2 | 3,664,000 | 0.4 |
| Total: | 74 | $951,555,654 | 100.0% |
| Weighted Average | 4.956% | ||
| UNDERWRITTEN NOI DEBT YIELD | |||
Range of U/W NOI Debt Yields (%) | Number of Mortgage Loans | Aggregate Cut- off Date Balance | Percent by Aggregate Cut- off Date Pool Balance (%) |
| 6.9 - 8.0 | 2 | $25,500,000 | 2.7% |
| 8.1 - 9.0 | 12 | 178,236,784 | 18.7 |
| 9.1 - 10.0 | 21 | 138,553,242 | 14.6 |
| 10.1 - 11.0 | 14 | 141,982,162 | 14.9 |
| 11.1 - 12.0 | 7 | 84,942,390 | 8.9 |
| 12.1 - 13.0 | 6 | 162,014,846 | 17.0 |
| 13.1 - 14.0 | 4 | 105,893,673 | 11.1 |
| 14.1 - 15.0 | 6 | 92,440,616 | 9.7 |
| 15.1 - 16.0 | 1 | 6,491,941 | 0.7 |
| 16.1 - 16.4 | 1 | 15,500,000 | 1.6 |
| Total: | 74 | $951,555,654 | 100.0% |
| Weighted Average | 11.2% | ||
| UNDERWRITTEN NCF DEBT YIELD | |||
| Range of U/W NCF Debt Yields (%) | Number of Mortgage Loans | Aggregate Cut- off Date Balance | Percent by Aggregate Cut- off Date Pool Balance (%) |
| 6.9 - 8.0 | 3 | $70,500,000 | 7.4% |
| 8.1 - 9.0 | 22 | 192,044,755 | 20.2 |
| 9.1 - 10.0 | 21 | 177,519,864 | 18.7 |
| 10.1 - 11.0 | 11 | 212,154,805 | 22.3 |
| 11.1 - 12.0 | 6 | 110,750,000 | 11.6 |
| 12.1 - 13.0 | 4 | 68,853,673 | 7.2 |
| 13.1 - 14.0 | 3 | 64,250,000 | 6.8 |
| 14.1 - 15.0 | 3 | 39,982,557 | 4.2 |
| 15.1 - 15.3 | 1 | 15,500,000 | 1.6 |
| Total: | 74 | $951,555,654 | 100.0% |
| Weighted Average | 10.5% | ||
| ORIGINAL TERM TO MATURITY | |||
| Original Terms to Maturity (months) | Number of Mortgage Loans | Aggregate Cut- off Date Balance | Percent by Aggregate Cut- off Date Pool Balance (%) |
| 60 | 1 | $11,750,000 | 1.2% |
| 61 | 1 | 13,750,000 | 1.4 |
| 119 | 1 | 26,000,000 | 2.7 |
| 120 | 71 | 900,055,654 | 94.6 |
| Total: | 74 | $951,555,654 | 100.0% |
| Weighted Average | 118 months | ||
| (1) | With respect to any mortgage loan that is part of a whole loan, the loan-to-value ratio, debt service coverage ratio and debt yield calculations include the relatedpari passu companion loan(s) but exclude any related subordinate debt (unless otherwise stated). With respect to each mortgage loan, debt service coverage ratio, debt yield and loan-to-value ratio information do not take into account any subordinate debt (whether or not secured by the related mortgaged property) that currently exists or is allowed under the terms of such mortgage loan. See Annex A-1 to the Preliminary Prospectus. Prepayment provisions for each mortgage loan reflects the entire life of the loan (from origination to maturity). |
THE INFORMATION IN THIS STRUCTURAL AND COLLATERAL TERM SHEET IS NOT COMPLETE AND MAY BE AMENDED PRIOR TO THE TIME OF SALE. THIS TERM SHEET IS NOT AN OFFER TO SELL THESE SECURITIES AND IT IS NOT A SOLICITATION OF AN OFFER TO BUY THESE SECURITIES IN ANY JURISDICTION WHERE THE OFFER OR SALE IS NOT PERMITTED.
17
| Wells Fargo Commercial Mortgage Trust 2018-C47 | Characteristics of the Mortgage Pool |
| REMAINING TERM TO MATURITY | ||||
| Range of Remaining Terms to Maturity (months) | Number of Mortgage Loans | Aggregate Cut- off Date Balance | Percent by Aggregate Cut- off Date Pool Balance (%) | |
| 59 - 84 | 2 | $25,500,000 | 2.7% | |
| 85 - 120 | 72 | 926,055,654 | 97.3 | |
| Total: | 74 | $951,555,654 | 100.0% | |
| Weighted Average | 117 months | |||
| ORIGINAL AMORTIZATION TERM(2) | ||||
| Original Amortization Terms (months) | Number of Mortgage Loans | Aggregate Cut- off Date Balance | Percent by Aggregate Cut- off Date Pool Balance (%) | |
| Non-Amortizing | 18 | $371,581,500 | 39.0% | |
| 240 | 1 | 9,700,000 | 1.0 | |
| 300 | 1 | 3,893,673 | 0.4 | |
| 360 | 53 | 550,890,879 | 57.9 | |
| 480 | 1 | 15,489,602 | 1.6 | |
| Total: | 74 | $951,555,654 | 100.0% | |
| Weighted Average(3) | 361 months | |||
(2) The original amortization term shown for any mortgage loan that is interest-only for part of its term does not include the number of months in its interest-only period and reflects only the number of months as of the commencement of amortization remaining from the end of such interest-only period. (3) Excludes the non-amortizing mortgage loans.
| ||||
| REMAINING AMORTIZATION TERM(4) | ||||
| Range of Remaining Amortization Terms (months) | Number of Mortgage Loans | Aggregate Cut- off Date Balance | Percent by Aggregate Cut- off Date Pool Balance (%) | |
| Non-Amortizing | 18 | $371,581,500 | 39.0% | |
| 240 | 1 | 9,700,000 | 1.0 | |
| 241 - 300 | 1 | 3,893,673 | 0.4 | |
| 301 - 420 | 53 | 550,890,879 | 57.9 | |
| 421 - 479 | 1 | 15,489,602 | 1.6 | |
| Total: | 74 | $951,555,654 | 100.0% | |
| Weighted Average(5) | 361 months | |||
(4) The remaining amortization term shown for any mortgage loan that is interest-only for part of its term does not include the number of months in its interest-only period and reflects only the number of months as of the commencement of amortization remaining from the end of such interest-only period. (5) Excludes the non-amortizing mortgage loans.
| ||||
| LOCKBOXES | ||||
| Type of Lockbox | Number of Mortgage Loans | Aggregate Cut- off Date Balance | Percent by Aggregate Cut- off Date Pool Balance (%) | |
| Springing | 50 | $432,924,836 | 45.5% | |
| Hard/Springing Cash Management | 13 | 263,167,972 | 27.7 | |
| Soft/Springing Cash Management | 4 | 127,304,846 | 13.4 | |
| Hard/Upfront Cash Management | 4 | 112,800,000 | 11.9 | |
| None | 3 | 15,358,000 | 1.6 | |
| Total: | 74 | $951,555,654 | 100.0% | |
| PREPAYMENT PROVISION SUMMARY(6) | ||||
| Prepayment Provision | Number of Mortgage Loans | Aggregate Cut- off Date Balance | Percent by Aggregate Cut- off Date Pool Balance (%) | |
| Lockout / Defeasance / Open | 64 | $747,406,608 | 78.5% | |
| Lockout / GRTR 1% or YM / Open | 6 | 80,149,046 | 8.4 | |
| Lockout / GRTR 1% or YM / GRTR 1% or YM or Defeasance / Open | 1 | 70,000,000 | 7.4 | |
| Lockout / GRTR 1% or YM or Defeasance / Open | 2 | 28,000,000 | 2.9 | |
| GRTR 1% or YM / GRTR 1% or YM or Defeasance / Open | 1 | 26,000,000 | 2.7 | |
| Total: | 74 | $951,555,654 | 100.0% | |
(6) As a result of property releases or the application of funds in a performance reserve, partial principal prepayments could occur during a period that voluntary principal prepayments are otherwise prohibited.
| ||||
| CUT-OFF DATE LOAN-TO-VALUE RATIO | |||
| Range of Cut-off Date LTV Ratios (%) | Number of Mortgage Loans | Aggregate Cut- off Date Balance | Percent by Aggregate Cut-off Date Pool Balance (%) |
| 32.4 - 35.0 | 2 | $57,490,616 | 6.0% |
| 35.1 - 40.0 | 2 | 61,000,000 | 6.4 |
| 40.1 - 45.0 | 3 | 67,975,000 | 7.1 |
| 45.1 - 50.0 | 2 | 2,900,000 | 0.3 |
| 50.1 - 55.0 | 4 | 95,543,430 | 10.0 |
| 55.1 - 60.0 | 13 | 107,686,673 | 11.3 |
| 60.1 - 65.0 | 14 | 158,535,174 | 16.7 |
| 65.1 - 70.0 | 20 | 278,923,872 | 29.3 |
| 70.1 - 75.0 | 14 | 121,500,890 | 12.8 |
| Total: | 74 | $951,555,654 | 100.0% |
| Weighted Average | 58.8% | ||
BALLOON LOAN-TO-VALUE RATIO | |||
| Range of Balloon LTV Ratios (%) | Number of Mortgage Loans | Aggregate Cut- off Date Balance | Percent by Aggregate Cut-off Date Pool Balance (%) |
| 26.5 - 30.0 | 1 | $7,490,616 | 0.8% |
| 30.1 - 35.0 | 2 | 76,000,000 | 8.0 |
| 35.1 - 40.0 | 3 | 47,175,000 | 5.0 |
| 40.1 - 45.0 | 4 | 83,877,103 | 8.8 |
| 45.1 - 50.0 | 5 | 21,045,000 | 2.2 |
| 50.1 - 55.0 | 13 | 195,611,674 | 20.6 |
| 55.1 - 60.0 | 24 | 234,987,815 | 24.7 |
| 60.1 - 65.0 | 18 | 187,268,447 | 19.7 |
| 65.1 - 66.1 | 4 | 98,100,000 | 10.3 |
| Total: | 74 | $951,555,654 | 100.0% |
| Weighted Average | 53.8% | ||
AMORTIZATION TYPE | |||
| Amortization Type | Number of Mortgage Loans | Aggregate Cut- off Date Balance | Percent by Aggregate Cut-off Date Pool Balance (%) |
| Interest-only, Amortizing Balloon | 29 | $373,180,000 | 39.2% |
| Interest-only, Balloon | 18 | 371,581,500 | 39.0 |
| Amortizing Balloon | 27 | 206,794,154 | 21.7 |
| Total: | 74 | $951,555,654 | 100.0% |
ORIGINAL TERM OF INTEREST-ONLY PERIOD FOR PARTIAL IO LOANS | |||
| IO Terms (months) | Number of Mortgage Loans | Aggregate Cut- off Date Balance | Percent by Aggregate Cut-off Date Pool Balance (%) |
| 12 | 4 | $20,780,000 | 2.2% |
| 24 | 9 | 100,200,000 | 10.5 |
| 36 | 6 | 92,340,000 | 9.7 |
| 48 | 1 | 4,500,000 | 0.5 |
| 60 | 9 | 155,360,000 | 16.3 |
| Total: | 29 | $373,180,000 | 39.2% |
| Weighted Average | 42 months | ||
SEASONING | |||
| Seasoning (months) | Number of Mortgage Loans | Aggregate Cut- off Date Balance | Percent by Aggregate Cut-off Date Pool Balance (%) |
| 0 | 22 | $208,162,000 | 21.9% |
| 1 | 33 | 447,668,673 | 47.0 |
| 2 | 11 | 148,314,981 | 15.6 |
| 3 | 6 | 92,660,000 | 9.7 |
| 5 | 2 | 54,750,000 | 5.8 |
| Total: | 74 | $951,555,654 | 100.0% |
| Weighted Average | 1 month | ||
THE INFORMATION IN THIS STRUCTURAL AND COLLATERAL TERM SHEET IS NOT COMPLETE AND MAY BE AMENDED PRIOR TO THE TIME OF SALE. THIS TERM SHEET IS NOT AN OFFER TO SELL THESE SECURITIES AND IT IS NOT A SOLICITATION OF AN OFFER TO BUY THESE SECURITIES IN ANY JURISDICTION WHERE THE OFFER OR SALE IS NOT PERMITTED.
18
| Wells Fargo Commercial Mortgage Trust 2018-C47 | Certain Terms and Conditions |
V. Certain Terms and Conditions
| Interest Entitlements: | The interest entitlement of each Class of Certificates on each Distribution Date generally will be the interest accrued during the related Interest Accrual Period on the related Certificate Balance or Notional Amount at the related pass-through rate, net of any prepayment interest shortfalls allocated to that Class for such Distribution Date as described below. If prepayment interest shortfalls arise from voluntary prepayments (without Master Servicer consent) on particular non-specially serviced loans during any collection period, the Master Servicer is required to make a compensating interest payment to offset those shortfalls, generally up to an amount equal to the portion of its master servicing fees that accrue at 0.25 basis pointsper annum. The remaining amount of prepayment interest shortfalls will be allocated to reduce the interest entitlement on all Classes of Certificates entitled to interest, on apro rata basis, based on their respective amounts of accrued interest for the related Distribution Date. If a Class receives less than the entirety of its interest entitlement on any Distribution Date, then the shortfall (excluding any shortfall due to prepayment interest shortfalls), together with interest thereon, will be added to its interest entitlement for the next succeeding Distribution Date. |
| Principal Distribution Amount: | The Principal Distribution Amount for each Distribution Date generally will be the aggregate amount of principal received or advanced in respect of the mortgage loans, net of any non-recoverable advances and interest thereon and workout-delayed reimbursement amounts that are reimbursed to the Master Servicer, the Special Servicer or the Trustee during the related collection period. Non-recoverable advances and interest thereon are reimbursable from principal collections and advances before reimbursement from other amounts. Workout-delayed reimbursement amounts are reimbursable from principal collections. |
| Subordination, Allocation of Losses and Certain Expenses | The chart below describes the manner in which the payment rights of certain Classes of Certificates will be senior or subordinate, as the case may be, to the payment rights of other Classes of Certificates. The chart also shows the corresponding entitlement to receive principal and/or interest of certain Classes of Certificates on any distribution date in descending order. It also shows the manner in which losses are allocated to certain Classes of Certificates in ascending order (beginning with the Non-Offered Certificates, and other than the Class R certificates) to reduce the balance of each such class to zero;provided that no principal payments or mortgage loan losses will be allocated to the Class X-A, X-B, X-D or R Certificates, although principal payments and losses may reduce the notional amounts of the Class X-A, X-B and X-D certificates and, therefore, the amount of interest they accrue. |
(1) The Class X-A, X-B and X-D Certificates are interest-only certificates. |
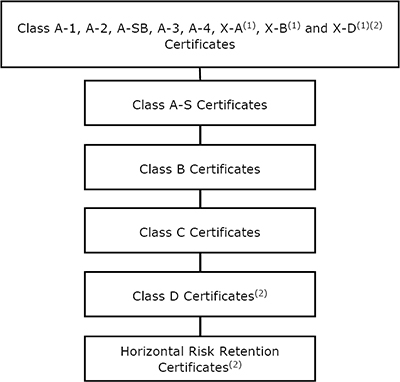
THE INFORMATION IN THIS STRUCTURAL AND COLLATERAL TERM SHEET IS NOT COMPLETE AND MAY BE AMENDED PRIOR TO THE TIME OF SALE. THIS TERM SHEET IS NOT AN OFFER TO SELL THESE SECURITIES AND IT IS NOT A SOLICITATION OF AN OFFER TO BUY THESE SECURITIES IN ANY JURISDICTION WHERE THE OFFER OR SALE IS NOT PERMITTED.
19
| Wells Fargo Commercial Mortgage Trust 2018-C47 | Certain Terms and Conditions |
| Distributions: | On each Distribution Date, funds available for distribution from the mortgage loans, net of specified trust fees, expenses and reimbursements will generally be distributed in the following amounts and order of priority (in each case to the extent of remaining available funds): |
| 1. Class A-1, A-2, A-SB, A-3, A-4, X-A, X-B and X-D Certificates: To interest on the Class A-1, A-2, A-SB, A-3, A-4, X-A, X-B and X-D Certificates,pro rata, according to their respective interest entitlements. | |
| 2. Class A-1, A-2, A-SB, A-3 and A-4 Certificates: To principal on the Class A-1, A-2, A-SB, A-3 and A-4 Certificates in the following amounts and order of priority: (i) first, to principal on the Class A-SB Certificates, in an amount up to the Principal Distribution Amount for such Distribution Date until their Certificate Balance is reduced to the Class A-SB Planned Principal Balance for such Distribution Date; (ii) second, to principal on the Class A-1 Certificates until their Certificate Balance is reduced to zero, up to the remainder of the Principal Distribution Amount for such Distribution Date; (iii) third, to principal on the Class A-2 Certificates until their Certificate Balance is reduced to zero, up to the remainder of the Principal Distribution Amount for such Distribution Date; (iv) fourth, to principal on the Class A-3 Certificates until their Certificate Balance is reduced to zero, up to the remainder of the Principal Distribution Amount for such Distribution Date; (v) fifth, to principal on the Class A-4 Certificates until their Certificate Balance is reduced to zero, up to the remainder of the Principal Distribution Amount for such Distribution Date; and (vi) sixth, to principal on the Class A-SB Certificates until their Certificate Balance is reduced to zero, up to the remainder of the Principal Distribution Amount for such Distribution Date. However, if the Certificate Balance of each Class of Principal Balance Certificates, other than the Class A-1, A-2, A-SB, A-3 and A-4 Certificates, has been reduced to zero as a result of the allocation of Mortgage Loan losses and expenses and any of the Class A-1, A-2, A-SB, A-3 and A-4 Certificates remains outstanding, then the Principal Distribution Amount will be distributed to the Class A-1, A-2, A-SB, A-3 and A-4 Certificates,pro rata, based on their respective outstanding Certificate Balances, until their Certificate Balances have been reduced to zero. | |
| 3. Class A-1, A-2, A-SB, A-3 and A-4 Certificates: To reimburse the holders of the Class A-1, A-2, A-SB, A-3 and A-4 Certificates,pro rata, on the basis of previously allocated unreimbursed losses, for any previously unreimbursed losses (plus interest thereon) on the mortgage loans that were previously allocated in reduction of the Certificate Balances of such Classes. | |
4. Class A-S Certificates: To make distributions on the Class A-S Certificates as follows: (a) first, to interest on the Class A-S Certificates in the amount of the interest entitlement for that Class; (b) next, to the extent of the portion of the Principal Distribution Amount remaining after distributions in respect of principal to each Class with a higher distribution priority (in this case, the Class A-1, A-2, A-SB, A-3 and A-4 Certificates), to principal on the Class A-S Certificates until their Certificate Balance is reduced to zero; and (c) next, to reimburse the holders of the Class A-S Certificates for any previously unreimbursed losses (plus interest thereon) on the mortgage loans that were previously allocated to that Class in reduction of their Certificate Balance.
5. Class B Certificates: To make distributions on the Class B Certificates as follows: (a) first, to interest on the Class B Certificates in the amount of the interest entitlement for that Class; (b) next, to the extent of the portion of the Principal Distribution Amount remaining after distributions in respect of principal to each Class with a higher distribution priority (in this case, the Class A-1, A-2, A-SB, A-3, A-4 and A-S Certificates), to principal on the Class B Certificates until their Certificate Balance is reduced to zero; and (c) next, to reimburse the holders of the Class B Certificates for any previously unreimbursed losses (plus interest thereon) on the mortgage loans that were previously allocated to that Class in reduction of their Certificate Balance.
6. Class C Certificates: To make distributions on the Class C Certificates as follows: (a) first, to interest on the Class C Certificates in the amount of the interest entitlement for that Class; (b) next, to the extent of the portion of the Principal Distribution Amount remaining after distributions in respect of principal to each Class with a higher distribution priority (in this case, the Class A-1, A-2, A-SB, A-3, A-4, A-S and B Certificates), to principal on the Class C Certificates until their Certificate Balance is reduced to zero; and (c) next, to reimburse the holders of the Class C Certificates for any previously unreimbursed losses (plus interest thereon) on the mortgage loans that were previously allocated to that Class in reduction of their Certificate Balance.
7. After the Class A-1, A-2, A-SB, A-3, A-4, X-A, X-B, X-D, A-S, B and C Certificates are paid all amounts to which they are entitled, the remaining funds available for distribution will be used to pay interest, principal and loss reimbursement amounts on the Class D, E-RR, |
THE INFORMATION IN THIS STRUCTURAL AND COLLATERAL TERM SHEET IS NOT COMPLETE AND MAY BE AMENDED PRIOR TO THE TIME OF SALE. THIS TERM SHEET IS NOT AN OFFER TO SELL THESE SECURITIES AND IT IS NOT A SOLICITATION OF AN OFFER TO BUY THESE SECURITIES IN ANY JURISDICTION WHERE THE OFFER OR SALE IS NOT PERMITTED.
20
| Wells Fargo Commercial Mortgage Trust 2018-C47 | Certain Terms and Conditions |
| F-RR, G-RR, H-RR and J-RR Certificates sequentially in that order in a manner analogous to the Class C Certificates. | |
| Allocation of Yield Maintenance Charges and Prepayment Premiums: | If any yield maintenance charge or prepayment premium is collected during any particular collection period with respect to any mortgage loan, then on the Distribution Date corresponding to that collection period, the certificate administrator will pay that yield maintenance charge or prepayment premium (net of liquidation fees payable therefrom) in the following manner: (1) to each of the Class A-1, A-2, A-SB, A-3, A-4, A-S, B, C and D Certificates, the product of (a) the yield maintenance charge or prepayment premium, (b) the related Base Interest Fraction (as defined in the Preliminary Prospectus) for such Class, and (c) a fraction, the numerator of which is equal to the amount of principal distributed to such Class for that Distribution Date, and the denominator of which is the total amount of principal distributed to all Principal Balance Certificates for that Distribution Date, (2) to the Class X-A Certificates, the excess, if any, of (a) the product of (i) such yield maintenance charge or prepayment premium and (ii) a fraction, the numerator of which is equal to the amount of principal distributed to the Class A-1, A-2, A-SB, A-3 and A-4 Certificates for that Distribution Date, and the denominator of which is the total amount of principal distributed to all Principal Balance Certificates for that Distribution Date, over (b) the amount of such yield maintenance charge or prepayment premium distributed to the Class A-1, A-2, A-SB, A-3 and A-4 Certificates as described above, and (3) to the Class X-B Certificates, any remaining portion of such yield maintenance charge or prepayment premium not distributed as described above.
No prepayment premiums or yield maintenance charges will be distributed to the holders of the Class X-D, E-RR, F-RR, G-RR, H-RR, J-RR or R certificates. For a description of when prepayment premiums and yield maintenance charges are generally required on the mortgage loans, see Annex A-1 to the Preliminary Prospectus. See also “Risk Factors—Risks Relating to the Mortgage Loans—Risks Relating to Enforceability of Yield Maintenance Charges, Prepayment Premiums or Defeasance Provisions” and “Risk Factors—Other Risks Relating to the Certificates—Your Yield May Be Affected by Defaults, Prepayments and Other Factors” in the Preliminary Prospectus. Prepayment premiums and yield maintenance charges will be distributed on each Distribution Date only to the extent they are actually received on the mortgage loans as of the related Determination Date. |
| Realized Losses: | The Certificate Balances of the Class A-1, A-2, A-SB, A-3, A-4, A-S, B, C, D, E-RR, F-RR, G-RR, H-RR and J-RR Certificates will be reduced without distribution on any Distribution Date as a write-off to the extent of any losses realized on the mortgage loans allocated to such Class on such Distribution Date. Such losses will be applied in the following order, in each case until the related Certificate Balance is reduced to zero: first, to the Class J-RR Certificates, second, to the Class H-RR Certificates; third, to the Class G-RR Certificates; fourth, to the Class F-RR Certificates; fifth, to the Class E-RR Certificates; sixth, to the Class D Certificates; seventh, to the Class C Certificates; eighth, to the Class B Certificates; ninth, to the Class A-S Certificates; and, finally,pro rata, to the Class A-1, A-2, A-SB, A-3 and A-4 Certificates based on their outstanding Certificate Balances.
The notional amount of the Class X-A Certificates will be reduced by the amount of all losses that are allocated to the Class A-1, A-2, A-SB, A-3 or A-4 Certificates as write-offs in reduction of their Certificate Balances. The notional amount of the Class X-B Certificates will be reduced by the amount of all losses that are allocated to the Class A-S, B or C Certificates as write-offs in reduction of their Certificate Balances. The notional amount of the Class X-D Certificates will be reduced by the amount of all losses that are allocated to the Class D Certificates as write-offs in reduction of its Certificate Balance. |
| P&I Advances: | The Master Servicer or, if the Master Servicer fails to do so, the Trustee, will be obligated to advance delinquent debt service payments (other than balloon payments and default interest) and assumed debt service payments on mortgage loans with delinquent balloon payments (excluding any related companion loan), except to the extent any such advance is deemed non-recoverable from collections on the related mortgage loan. In addition, if an Appraisal Reduction Amount exists for a given mortgage loan, the interest portion of any P&I advance for such mortgage loan will be reduced, which will have the effect of reducing the amount of interest available for distribution to the Certificates in reverse alphabetical order of their Class designations (except that interest payments on the Class A-1, A-2, A-SB, A-3, A-4, X-A, X-B and X-D Certificates would be affected on apari passu basis). |
| Servicing Advances: | The Master Servicer or, if the Master Servicer fails to do so, the Trustee, will be obligated to make servicing advances, including the payment of delinquent property taxes, insurance premiums and ground rent, except to the extent that those advances are deemed non-recoverable from collections on the related mortgage loan. The Master Servicer or the Trustee, as applicable, will have the primary obligation to make any required servicing advances with respect to any serviced whole loan. With respect to any non-serviced whole loan, the master servicer or trustee, as |
THE INFORMATION IN THIS STRUCTURAL AND COLLATERAL TERM SHEET IS NOT COMPLETE AND MAY BE AMENDED PRIOR TO THE TIME OF SALE. THIS TERM SHEET IS NOT AN OFFER TO SELL THESE SECURITIES AND IT IS NOT A SOLICITATION OF AN OFFER TO BUY THESE SECURITIES IN ANY JURISDICTION WHERE THE OFFER OR SALE IS NOT PERMITTED.
21
| Wells Fargo Commercial Mortgage Trust 2018-C47 | Certain Terms and Conditions |
| applicable, under the related lead securitization servicing agreement will have the primary obligation to make any required servicing advances with respect to such non-serviced whole loan. | |
Appraisal Reduction Amounts and Collateral Deficiency Amounts:
| An “Appraisal Reduction Amount” generally will be created in the amount, if any, by which the principal balance of a required appraisal loan (which is a mortgage loan (other than a non-serviced mortgage loan) with respect to which certain defaults, modifications or insolvency events have occurred as further described in the Preliminary Prospectus) plus other amounts overdue or advanced in connection with such mortgage loan exceeds 90% of the appraised value of the related mortgaged property plus certain escrows and reserves (including letters of credit) held with respect to the mortgage loan. With respect to any serviced whole loan, any Appraisal Reduction Amount will be allocated,pro rata, to the related mortgage loan and the relatedpari passu companion loan(s). With respect to any non-serviced mortgage loan, appraisal reduction amounts are expected to be calculated in a similar manner under the related non-serviced pooling and servicing agreement.
A mortgage loan will cease to be a required appraisal loan when the same has ceased to be a specially serviced loan (if applicable), has been brought current for at least three consecutive months and no other circumstances exist that would cause such mortgage loan to be a required appraisal loan.
A “Collateral Deficiency Amount” will exist with respect to any mortgage loan that is modified into an AB loan structure and remains a corrected mortgage loan and will generally equal the excess of (i) the stated principal balance of such AB modified loan (taking into account the related junior note(s) and anypari passu notes included therein), over (ii) the sum of (in the case of a whole loan, solely to the extent allocable to the subject mortgage loan) (x) the most recent appraised value of the related mortgaged property plus (y) solely to the extent not reflected or taken into account in such appraised value and to the extent on deposit with, or otherwise under the control of, the lender as of the date of such determination, any capital or additional collateral contributed by the related borrower at the time the mortgage loan (and as part of the modification thereto) became an AB modified loan plus (z) any other escrows or reserves (in addition to any amounts set forth in the immediately preceding clause (y)) held with respect to the mortgage loan as of the date of such determination.
A “Cumulative Appraisal Reduction Amount” with respect to any mortgage loan will be the sum of any Appraisal Reduction Amount and any Collateral Deficiency Amount.
Appraisal Reduction Amounts will affect the amount of debt service advances in respect of the related mortgage loan. Additionally, Cumulative Appraisal Reduction Amounts will be taken into account in the determination of the identity of the Class whose majority constitutes the “majority controlling class certificateholder” and is entitled to appoint the directing certificateholder. |
Clean-Up Call and Exchange Termination:
| On each Distribution Date occurring after the aggregate unpaid principal balance of the pool of mortgage loans is less than 1.0% of the principal balance of the mortgage loans as of the cut-off date, certain specified persons will have the option to purchase all of the remaining mortgage loans (and the trust’s interest in all property acquired through exercise of remedies in respect of any mortgage loan) at the price specified in the Preliminary Prospectus. Exercise of the option will terminate the trust and retire the then-outstanding certificates.
If the aggregate Certificate Balances of each of the Class A-1, A-2, A-SB, A-3, A-4, A-S, B, C and D Certificates have been reduced to zero, the trust may also be terminated in connection with an exchange of all the then-outstanding certificates (other than the Class R Certificates) for the mortgage loans and REO properties then remaining in the issuing entity, subject to payment of a price specified in the Preliminary Prospectus, but all of the holders of those outstanding Classes (other than the Class R Certificates) of certificates would have to voluntarily participate in the exchange. |
| Liquidation Loan Waterfall: | Following the liquidation of any loan or property, the net liquidation proceeds generally will be applied (after reimbursement of advances and certain trust fund expenses), first, as a recovery of accrued interest, other than delinquent interest that was not advanced as a result of Appraisal Reduction Amounts, second, as a recovery of principal until all principal has been recovered, and then as a recovery of delinquent interest that was not advanced as a result of Appraisal Reduction Amounts. Please see “Description of the Certificates—Distributions—Application Priority of Mortgage Loan Collections or Whole Loan Collections” in the Preliminary Prospectus. |
| Control Eligible Certificates: | The Class E-RR, F-RR, G-RR, H-RR and J-RR Certificates. |
| Directing Certificateholder/ Controlling Class: | A directing certificateholder may be appointed by the “majority controlling class certificateholder”, which will be the holder(s) of a majority of the “controlling class”, which means the most subordinate class of Certificates among the Control Eligible Certificates.
The “Controlling Class” will be, as of any time of determination, the most subordinate class of Control Eligible Certificates then outstanding that has an aggregate Certificate Balance (as
|
THE INFORMATION IN THIS STRUCTURAL AND COLLATERAL TERM SHEET IS NOT COMPLETE AND MAY BE AMENDED PRIOR TO THE TIME OF SALE. THIS TERM SHEET IS NOT AN OFFER TO SELL THESE SECURITIES AND IT IS NOT A SOLICITATION OF AN OFFER TO BUY THESE SECURITIES IN ANY JURISDICTION WHERE THE OFFER OR SALE IS NOT PERMITTED.
22
| Wells Fargo Commercial Mortgage Trust 2018-C47 | Certain Terms and Conditions |
| notionally reduced by any Cumulative Appraisal Reduction Amounts allocable to such class(es)) at least equal to 25% of the initial Certificate Balance of that class;provided,however, that if at any time the Certificate Balances of the certificates other than the Control Eligible Certificates have been reduced to zero as a result of principal payments on the Mortgage Loans, then the Controlling Class will be the most subordinate class of Control Eligible Certificates that has a Certificate Balance greater than zero without regard to any Cumulative Appraisal Reduction Amounts. The Controlling Class as of the Closing Date will be the Class J-RR Certificates. | |
| Control and Consultation: | The rights of various parties to replace the Special Servicer and approve or consult with respect to major actions of the Special Servicer will vary according to defined periods.
A “Control Termination Event” will occur when the Class E-RR Certificates have a Certificate Balance (taking into account the application of any Cumulative Appraisal Reduction Amounts to notionally reduce the Certificate Balance of such class) of less than 25% of the initial Certificate Balance of that class;provided,however, that a Control Termination Event will not be deemed continuing in the event that the Certificate Balances of the certificates other than the Control Eligible Certificates have been reduced to zero as a result of principal payments on the Mortgage Loans.
A “Consultation Termination Event” will occur when there is no class of Control Eligible Certificates that has a then-outstanding Certificate Balance at least equal to 25% of the initial Certificate Balance of that class, in each case, without regard to the application of any Cumulative Appraisal Reduction Amounts;provided,however, that a Consultation Termination Event will not be deemed continuing in the event that the Certificate Balances of the certificates other than the Control Eligible Certificates have been reduced to zero as a result of principal payments on the Mortgage Loans.
If no Control Termination Event has occurred and is continuing, except with respect to the Excluded Loans (as defined below), with respect to the directing certificateholder and except with respect to Servicing Shift Whole Loans (as defined below) (i) the directing certificateholder will be entitled to grant or withhold approval of asset status reports prepared, and material servicing actions proposed, by the Special Servicer, and (ii) the directing certificateholder will be entitled to terminate and replace the Special Servicer with or without cause, and appoint itself or another person as the successor special servicer. It will be a condition to such appointment that DBRS, Fitch and Moody’s (and any rating agency rating any securities backed by anypari passu companion loan(s) serviced under this transaction) confirm that the appointment would not result in a qualification, downgrade or withdrawal of any of their then-current ratings of certificates (and any certificates backed by anypari passu companion loan(s) serviced under this transaction).
If a Control Termination Event has occurred and is continuing but no Consultation Termination Event has occurred and is continuing, the Special Servicer will be required to consult with the directing certificateholder (other than with respect to Excluded Loans as to such party) in connection with asset status reports and material special servicing actions.
If a Consultation Termination Event has occurred and is continuing, no directing certificateholder will be recognized or have any right to terminate the Special Servicer or approve, direct or consult with respect to servicing matters.
With respect to each serviced whole loan that is not a Servicing Shift Whole Loan, the rights of the directing certificateholder described above will be subject to the consultation rights of the holders of the related pari passu companion loans. Those consultation rights will generally extend to asset status reports and material special servicing actions involving the related whole loan, will be as set forth in the related intercreditor agreement, and will be in addition to the rights of the directing certificateholder in this transaction described above.
With respect to each whole loan marked with footnote (2) under “IV. Characteristics of the Mortgage Pool—B. Summary of the Whole Loans” (each, a “Servicing Shift Whole Loan”), prior to date of securitization of the related controlling pari passu companion loan (such date, a “Servicing Shift Securitization Date”), the holder of the related controlling pari passu companion loan will have certain control rights regarding the servicing of the related whole loan under the WFCM 2018-C47 pooling and servicing agreement, including the right to approve or disapprove various material servicing actions involving the related whole loan.
With respect to (x) each non-serviced whole loan, and (y) each Servicing Shift Whole Loan after its Servicing Shift Securitization Date, the applicable servicing agreement for the related controllingpari passu companion loan(s) generally grants (or will grant) the directing certificateholder under the related securitization control rights that may include the right to approve or disapprove various material servicing actions involving the related whole loan. The directing certificateholder for this securitization (so long as no Consultation Termination Event has occurred and is occurring) generally will nonetheless have the right to be consulted on a non- |
THE INFORMATION IN THIS STRUCTURAL AND COLLATERAL TERM SHEET IS NOT COMPLETE AND MAY BE AMENDED PRIOR TO THE TIME OF SALE. THIS TERM SHEET IS NOT AN OFFER TO SELL THESE SECURITIES AND IT IS NOT A SOLICITATION OF AN OFFER TO BUY THESE SECURITIES IN ANY JURISDICTION WHERE THE OFFER OR SALE IS NOT PERMITTED.
23
| Wells Fargo Commercial Mortgage Trust 2018-C47 | Certain Terms and Conditions |
binding basis with respect to such actions. For purposes of the servicing of any such whole loan contemplated by this paragraph, the occurrence and continuance of a Control Termination Event or Consultation Termination Event under this securitization will not limit the control or other rights of the directing certificateholder (or equivalent) under the securitization of the related controllingpari passu companion loan(s).
The control rights and consent and consultation rights described in the three preceding paragraphs are subject to various limitations, conditions and exceptions as described in the Preliminary Prospectus.
Notwithstanding any contrary description set forth above, with respect to the Holiday Inn FiDi whole loan, unless a control shift trigger event exists with respect to the related subordinate companion loan, the holder of that subordinate companion loan will have the right to approve or disapprove various material servicing actions involving, and the right to replace the special servicer for, that whole loan.
Notwithstanding any contrary description set forth above, in the event that, with respect to any mortgage loan, if the majority controlling class certificateholder or the directing certificateholder is a Borrower Party, the majority controlling class certificateholder and the directing certificateholder will have no right to receive asset status reports or such other information as may be specified in the WFCM 2018-C47 pooling and servicing agreement, to grant or withhold approval of, or consult with respect to, asset status reports prepared, and material servicing actions proposed, by the Special Servicer, with respect to such mortgage loan, and such mortgage loan will be referred to as an “Excluded Loan” as to such party.
In addition, notwithstanding any contrary description set forth above, in the event that, with respect to any mortgage loan, a controlling class certificateholder is a Borrower Party, such controlling class certificateholder will have no right to receive asset status reports or such other information as may be specified in the WFCM 2018-C47 pooling and servicing agreement with respect to such mortgage loan, and such controlling class certificateholder will be referred to as an “excluded controlling class holder”.
“Borrower Party” means a borrower, a mortgagor or a manager of a mortgaged property, an Accelerated Mezzanine Loan Lender, or any Borrower Party Affiliate. “Accelerated Mezzanine Loan Lender” means a mezzanine lender under a mezzanine loan that has been accelerated or as to which foreclosure or enforcement proceedings have been commenced against the equity collateral pledged to secure such mezzanine loan. “Borrower Party Affiliate” means, with respect to a borrower, a mortgagor, a manager of a Mortgaged Property or an Accelerated Mezzanine Loan Lender, (x) any other person controlling or controlled by or under common control with such borrower, mortgagor, manager or Accelerated Mezzanine Loan Lender, as applicable, or (y) any other person owning, directly or indirectly, 25% or more of the beneficial interests in such borrower, mortgagor, manager or Accelerated Mezzanine Loan Lender. | |
Replacement of Special Servicer:
| If a Control Termination Event has occurred and is continuing, the Special Servicer (other than with respect to a Servicing Shift Whole Loan) may be removed and replaced without cause upon the affirmative direction of certificate owners holding not less than 66-2/3% of a certificateholder quorum, following a proposal from certificate owners holding not less than 25% of the appraisal-reduced voting rights of all Certificates. The certificateholders who initiate a vote on a termination and replacement of the Special Servicer without cause must cause DBRS, Fitch and Moody’s to confirm the then-current ratings of the certificates (or decline to review the matter) and cause the payment of the fees and expenses incurred in the replacement. If no Control Termination Event has occurred and is continuing, the Special Servicer (other than with respect to a Servicing Shift Whole Loan) may be replaced by the directing certificateholder, subject to DBRS, Fitch and Moody’s (and any Rating Agency rating any securities backed by anypari passu companion loan(s) serviced under this transaction) confirming the then-current ratings of the Certificates (and any certificates backed by anyparipassu companion loans serviced under this transaction) or declining to review the matter.
In addition, if at any time the Operating Advisor determines, in its sole discretion exercised in good faith, that (i) the Special Servicer is not performing its duties as required under the pooling and servicing agreement in accordance with the Servicing Standard and (ii) the replacement of the Special Servicer would be in the best interest of the certificateholders as a collective whole, then, the Operating Advisor will have the right to recommend the replacement of the Special Servicer and will submit its formal recommendation to the Trustee and the Certificate Administrator (along with its rationale, its proposed replacement special servicer and other relevant information justifying its recommendation).
The Operating Advisor’s recommendation to replace the Special Servicer must be confirmed by an affirmative vote of holders of Principal Balance Certificates evidencing at least a majority of a quorum of certificateholders (which, for this purpose, is the holders of Principal Balance |
THE INFORMATION IN THIS STRUCTURAL AND COLLATERAL TERM SHEET IS NOT COMPLETE AND MAY BE AMENDED PRIOR TO THE TIME OF SALE. THIS TERM SHEET IS NOT AN OFFER TO SELL THESE SECURITIES AND IT IS NOT A SOLICITATION OF AN OFFER TO BUY THESE SECURITIES IN ANY JURISDICTION WHERE THE OFFER OR SALE IS NOT PERMITTED.
24
| Wells Fargo Commercial Mortgage Trust 2018-C47 | Certain Terms and Conditions |
| Certificates that (i) evidence at least 20% of the Voting Rights (taking into account the application of any cumulative appraisal reduction amounts to notionally reduce the respective Certificate Balances) of all Principal Balance Certificates on an aggregate basis, and (ii) consist of at least three certificateholders or certificate owners that are not risk retention affiliated with each other). In the event the holders of Principal Balance Certificates evidencing at least a majority of a quorum of certificateholders elect to remove and replace the Special Servicer (which requisite affirmative votes must be received within 180 days of the posting of the notice of the Operating Advisor’s recommendation to replace the Special Servicer to the Certificate Administrator’s website), the Certificate Administrator will be required to receive a Rating Agency Confirmation from each of the Rating Agencies at that time. | |
| Excluded Special Servicer: | In the event that, with respect to any mortgage loan, the Special Servicer is a Borrower Party, the Special Servicer will be required to resign as special servicer of such mortgage loan (referred to as an “excluded special servicer loan”). If no Control Termination Event has occurred and is continuing, the directing certificateholder will be entitled to appoint (and may replace with or without cause) a separate special servicer that is not a Borrower Party (referred to as an “excluded special servicer”) with respect to such excluded special servicer loan unless such excluded special servicer loan is also an excluded loan. Otherwise, upon resignation of the Special Servicer with respect to an excluded special servicer loan, the resigning Special Servicer will be required to appoint the excluded special servicer. |
| Appraisal Remedy: | If the Class of Certificates comprising the controlling class loses its status as controlling class because of the application of an Appraisal Reduction Amount or Collateral Deficiency Amount, the holders of a majority of the voting rights of such Class may require the Special Servicer to order a second appraisal for any mortgage loan in respect of which an Appraisal Reduction Amount or Collateral Deficiency Amount has been applied. The Special Servicer must thereafter determine whether, based on its assessment of such second appraisal, any recalculation of the Appraisal Reduction Amount or Collateral Deficiency Amount is warranted. Such Class will not be able to exercise any direction, control, consent and/or similar rights of the controlling class unless and until reinstated as the controlling class through such determination; and pending such determination, the rights of the controlling class will be exercised by the Control Eligible Certificates, if any, that would be the controlling class taking into account the subject appraisal reduction amount. |
| Sale of Defaulted Assets: | There will be no “fair value” purchase option. Instead, the WFCM 2018-C47 pooling and servicing agreement will authorize the Special Servicer to sell defaulted mortgage loans serviced by such Special Servicer to the highest bidder in a manner generally similar to sales of REO properties.
The sale of a defaulted loan (other than a non-serviced whole loan) for less than par plus accrued interest and certain other fees and expenses owed on the loan will be subject to consent or consultation rights of the directing certificateholder and/or Operating Advisor, as described in the Preliminary Prospectus. Generally speaking, the holder of apari passucompanion loan will have consent and/or consultation rights, as described in the Preliminary Prospectus.
With respect to (x) any serviced whole loan and (y) any Servicing Shift Whole Loan prior to its Servicing Shift Securitization Date, if such whole loan becomes a defaulted loan under the WFCM 2018-C47 pooling and servicing agreement, the Special Servicer will generally be required to sell both the mortgage loan and the related pari passu companion loan(s) (and, in some cases, any related subordinate companion loan) as a single whole loan.
With respect to (x) each non-serviced whole loan and (y) each Servicing Shift Whole Loan after its related Servicing Shift Securitization Date, the applicable servicing agreement governing the servicing of such whole loan generally provides (or is expected to provide) that, if the relatedpari passu companion loan(s) serviced under such agreement become a defaulted loan under such servicing agreement, then the related special servicer may offer to sell to any person (or may offer to purchase) for cash such whole loan (exclusive, in some cases, of any related subordinate companion loan) during such time as such applicablepari passucompanion loan(s) constitutes a defaulted loan under such servicing agreement. Generally speaking, in connection with any such sale, the related special servicer is required to sell both the mortgage loan and the related pari passu companion loan(s) (and, in some cases, any related subordinate companion loan) as a whole loan. The directing certificateholder for this securitization generally will have consent and/or consultation rights as the holder of an interest in the related mortgage loan, as described in the Preliminary Prospectus.
The procedures for the sale of any whole loan that becomes a defaulted whole loan, and any associated consultation rights, are subject to various limitations, conditions and exceptions as described in the Preliminary Prospectus. |
THE INFORMATION IN THIS STRUCTURAL AND COLLATERAL TERM SHEET IS NOT COMPLETE AND MAY BE AMENDED PRIOR TO THE TIME OF SALE. THIS TERM SHEET IS NOT AN OFFER TO SELL THESE SECURITIES AND IT IS NOT A SOLICITATION OF AN OFFER TO BUY THESE SECURITIES IN ANY JURISDICTION WHERE THE OFFER OR SALE IS NOT PERMITTED.
25
| Wells Fargo Commercial Mortgage Trust 2018-C47 | Certain Terms and Conditions |
| “As-Is” Appraisals: | Appraisals must be conducted on an “as-is” basis, and must be no more than 12 months old, for purposes of determining Appraisal Reduction Amounts and market value in connection with REO sales. Required appraisals may consist of updates of prior appraisals. Internal valuations by the Special Servicer are permitted if the principal balance of a mortgage loan is less than $2,000,000. |
| Operating Advisor: | The Operating Advisor will have certain review and consultation rights relating to the performance of the Special Servicer and with respect to its actions taken in connection with the resolution and/or liquidation of Specially Serviced Loans. With respect to each mortgage loan (other than a Non-Serviced Mortgage Loan) or serviced whole loan, the Operating Advisor will be responsible for:
● reviewing the actions of the Special Servicer with respect to any Specially Serviced Loan;
● reviewing (i) all reports by the Special Servicer made available to Privileged Persons on the Certificate Administrator’s website and (ii) each Asset Status Report (as defined in the Preliminary Prospectus) (after the occurrence and during the continuance of an Operating Advisor Consultation Event (as defined below)) and Final Asset Status Report (as defined in the Preliminary Prospectus);
● recalculating and verifying the accuracy of the mathematical calculations by the special servicer and the corresponding application of the non-discretionary portion of the applicable formulas required to be utilized in connection with Appraisal Reduction Amounts, Collateral Deficiency Amounts and net present value calculations used in the Special Servicer’s determination of what course of action to take in connection with the workout or liquidation of a Specially Serviced Loan; and
● preparing an annual report (if any mortgage loan (other than any Non-Serviced Mortgage Loan) or serviced whole loan was a Specially Serviced Loan at any time during the prior calendar year or an Operating Advisor Consultation Event (as defined below) occurred during the prior calendar year) that sets forth whether the Operating Advisor believes, in its sole discretion exercised in good faith, that the Special Servicer is operating in compliance with the Servicing Standard with respect to its performance of its duties under the pooling and servicing agreement with respect to Specially Serviced Loans (and, after the occurrence and continuance of an Operating Advisor Consultation Event (as defined below), with respect to major decisions on non-Specially Serviced Loans) during the prior calendar year on an “asset-level basis”. The Operating Advisor will identify (1) which, if any, standards the Operating Advisor believes, in its sole discretion exercised in good faith, the Special Servicer has failed to comply with and (2) any material deviations from the Special Servicer’s obligations under the pooling and servicing agreement with respect to the resolution or liquidation of any Specially Serviced Loan or REO Property (other than with respect to any REO Property related to any Non-Serviced Mortgage Loan). In preparing any Operating Advisor Annual Report (as defined in the Preliminary Prospectus), the Operating Advisor will not be required to report on instances of non-compliance with, or deviations from, the Servicing Standard or the Special Servicer’s obligations under the pooling and servicing agreement that the Operating Advisor determines, in its sole discretion exercised in good faith, to be immaterial.
With respect to each mortgage loan (other than any Non-Serviced Mortgage Loan) or serviced whole loan, after the Operating Advisor has received notice that an Operating Advisor Consultation Event (as defined below) has occurred and is continuing, in addition to the duties described above, the Operating Advisor will be required to perform the following additional duties:
● to consult (on a non-binding basis) with the Special Servicer in respect of asset status reports and
● to consult (on a non-binding basis) with the Special Servicer with respect to “major decisions” processed by the Special Servicer.
An “Operating Advisor Consultation Event” will occur when the Certificate Balances of the Class E-RR, F-RR, G-RR, H-RR and J-RR Certificates in the aggregate (taking into account the application of any Cumulative Appraisal Reduction Amounts to notionally reduce the Certificate Balances of such classes) is 25% or less of the initial Certificate Balances of such classes in the aggregate. |
| Asset Representations Reviewer: | The Asset Representations Reviewer will be required to review certain delinquent mortgage loans after a specified delinquency threshold has been exceeded (an “Asset Review Trigger”) and the required percentage of certificateholders vote to direct a review of such delinquent loans. An Asset Review Trigger will occur when either (1) mortgage loans with an aggregate outstanding principal balance of 25.0% or more of the aggregate outstanding principal balance of all of the |
THE INFORMATION IN THIS STRUCTURAL AND COLLATERAL TERM SHEET IS NOT COMPLETE AND MAY BE AMENDED PRIOR TO THE TIME OF SALE. THIS TERM SHEET IS NOT AN OFFER TO SELL THESE SECURITIES AND IT IS NOT A SOLICITATION OF AN OFFER TO BUY THESE SECURITIES IN ANY JURISDICTION WHERE THE OFFER OR SALE IS NOT PERMITTED.
26
| Wells Fargo Commercial Mortgage Trust 2018-C47 | Certain Terms and Conditions |
mortgage loans (including any REO loans (or a portion of any REO loan in the case of a whole loan)) held by the issuing entity as of the end of the applicable collection period are delinquent loans or (2) at least 15 mortgage loans are delinquent loans as of the end of the applicable collection period and the outstanding principal balance of such delinquent loans in the aggregate constitutes at least 20.0% of the aggregate outstanding principal balance of all of the mortgage loans (including any REO loans (or a portion of any REO loan in the case of a whole loan)) held by the issuing entity as of the end of the applicable collection period. See “Pooling and Servicing Agreement—The Asset Representations Reviewer—Asset Review” in the Preliminary Prospectus.
The Asset Representations Reviewer may be terminated and replaced without cause. Upon (i) the written direction of certificateholders evidencing not less than 25% of the voting rights (without regard to the application of any Cumulative Appraisal Reduction Amounts) requesting a vote to terminate and replace the Asset Representations Reviewer with a proposed successor Asset Representations Reviewer that is an eligible asset representations reviewer, and (ii) payment by such holders to the certificate administrator of the reasonable fees and expenses to be incurred by the certificate administrator in connection with administering such vote, the certificate administrator will promptly provide notice to all certificateholders and the Asset Representations Reviewer of such request by posting such notice on its internet website, and by mailing such notice to all certificateholders and the Asset Representations Reviewer. Upon the written direction of certificateholders evidencing at least 75% of a certificateholder quorum (without regard to the application of any Cumulative Appraisal Reduction Amounts), the Trustee will terminate all of the rights and obligations of the Asset Representations Reviewer under the WFCM 2018-C47 pooling and servicing agreement by written notice to the Asset Representations Reviewer, and the proposed successor Asset Representations Reviewer will be appointed. See “Pooling and Servicing Agreement—The Asset Representations Reviewer” in the Preliminary Prospectus. | |
| Dispute Resolution Provisions: | The mortgage loan sellers will be subject to the dispute resolution provisions set forth in the WFCM 2018-C47 pooling and servicing agreement to the extent those provisions are triggered with respect to any mortgage loan sold to the depositor by a mortgage loan seller and such mortgage loan seller will be obligated under the related mortgage loan purchase agreement to comply with all applicable provisions and to take part in any mediation or arbitration proceedings that may result.
Generally, in the event that a Repurchase Request (as defined in the Preliminary Prospectus) is not “Resolved” (as defined below) within 180 days after the related mortgage loan seller receives such Repurchase Request, then the enforcing servicer will be required to send a notice to the “Initial Requesting Certificateholder” (if any) and the Certificate Administrator indicating the enforcing servicer’s intended course of action with respect to the Repurchase Request. If (a) the enforcing servicer’s intended course of action with respect to the Repurchase Request does not involve pursuing further action to exercise rights against the related mortgage loan seller with respect to the Repurchase Request and the Initial Requesting Certificateholder, if any, or any other certificateholder or certificate owner wishes to exercise its right to refer the matter to mediation (including non-binding arbitration) or arbitration, or (b) the enforcing servicer’s intended course of action is to pursue further action to exercise rights against the related mortgage loan seller with respect to the Repurchase Request but the Initial Requesting Certificateholder, if any, or any other certificateholder or certificate owner does not agree with the dispute resolution method selected by the enforcing servicer, then the Initial Requesting Certificateholder, if any, or such other certificateholder or certificate owner may deliver a written notice to the Special Servicer indicating its intent to exercise its right to refer the matter to either mediation or arbitration.
“Resolved” means, with respect to a Repurchase Request, (i) that the related Material Defect has been cured, (ii) the related mortgage loan has been repurchased in accordance with the related mortgage loan purchase agreement, (iii) a mortgage loan has been substituted for the related mortgage loan in accordance with the related mortgage loan purchase agreement, (iv) the applicable mortgage loan seller has made a Loss of Value Payment (as defined in the Preliminary Prospectus), (v) a contractually binding agreement is entered into between the enforcing servicer, on behalf of the issuing entity, and the related mortgage loan seller that settles the related mortgage loan seller’s obligations under the related mortgage loan purchase agreement or (vi) the related mortgage loan is no longer property of the issuing entity as a result of a sale or other disposition in accordance with the WFCM 2018-C47 pooling and servicing agreement. See “Pooling and Servicing Agreement—Dispute Resolution Provisions” in the Preliminary Prospectus. |
| Investor Communications: | The certificate administrator is required to include on any Form 10–D any request received from a certificateholder to communicate with other certificateholders related to certificateholders exercising their rights under the terms of the WFCM 2018-C47 pooling and servicing agreement. Any certificateholder wishing to communicate with other certificateholders regarding the exercise of its rights under the terms of the WFCM 2018-C47 pooling and servicing agreement will be able |
THE INFORMATION IN THIS STRUCTURAL AND COLLATERAL TERM SHEET IS NOT COMPLETE AND MAY BE AMENDED PRIOR TO THE TIME OF SALE. THIS TERM SHEET IS NOT AN OFFER TO SELL THESE SECURITIES AND IT IS NOT A SOLICITATION OF AN OFFER TO BUY THESE SECURITIES IN ANY JURISDICTION WHERE THE OFFER OR SALE IS NOT PERMITTED.
27
| Wells Fargo Commercial Mortgage Trust 2018-C47 | Certain Terms and Conditions |
| to deliver a written request signed by an authorized representative of the requesting investor to the certificate administrator. | |
| Certain Fee Offsets: | If a workout fee is earned by the Special Servicer following a loan default with respect to any mortgage loan that it services, then certain limitations will apply based on modification fees paid by the borrower. The modification fee generally must not exceed 1% of the principal balance of the loan as modified in any 12-month period. In addition, if the loan re-defaults, any subsequent workout fee on that loan must be reduced by a portion of the modification fees paid by the borrower in the previous 12-months. Likewise, liquidation fees collected in connection with a liquidation or partial liquidation of a mortgage loan must be reduced by a portion of the modification fees paid by the borrower in the previous 12 months. |
| Deal Website: | The Certificate Administrator will be required to maintain a deal website, which will include, among other items: (a) summaries of asset status reports prepared by the Special Servicer, (b) inspection reports, (c) appraisals, (d) various “special notices” described in the Preliminary Prospectus, (e) the “Investor Q&A Forum”, (f) a voluntary “Investor Registry” and (g) the “Risk Retention Special Notices” tab. Investors may access the deal website following execution of a certification and confidentiality agreement. |
| Initial Majority Controlling Class Certificateholder: | It is expected that KKR Real Estate Credit Opportunity Partners Aggregator I L.P. or an affiliate will be the initial majority controlling class certificateholder. |
| Whole Loans: | Each of the mortgaged properties identified above under “IV. Characteristics of the Mortgage Pool—B. Summary of the Whole Loans” secures both a mortgage loan to be included in the trust fund and one or more other mortgage loans that will not be included in the trust fund, each of which will bepari passu or subordinate in right of payment with the mortgage loan included in the trust fund. We refer to each such group of mortgage loans as a “whole loan”. Such “—Summary of the Whole Loans” section includes further information regarding the various notes in each whole loan, the holders of such notes, the lead servicing agreement for each such whole loan, and the master servicer and special servicer under such lead servicing agreement. |
THE INFORMATION IN THIS STRUCTURAL AND COLLATERAL TERM SHEET IS NOT COMPLETE AND MAY BE AMENDED PRIOR TO THE TIME OF SALE. THIS TERM SHEET IS NOT AN OFFER TO SELL THESE SECURITIES AND IT IS NOT A SOLICITATION OF AN OFFER TO BUY THESE SECURITIES IN ANY JURISDICTION WHERE THE OFFER OR SALE IS NOT PERMITTED.
28
(THIS PAGE INTENTIONALLY LEFT BLANK)
THE INFORMATION IN THIS STRUCTURAL AND COLLATERAL TERM SHEET IS NOT COMPLETE AND MAY BE AMENDED PRIOR TO THE TIME OF SALE. THIS TERM SHEET IS NOT AN OFFER TO SELL THESE SECURITIES AND IT IS NOT A SOLICITATION OF AN OFFER TO BUY THESE SECURITIES IN ANY JURISDICTION WHERE THE OFFER OR SALE IS NOT PERMITTED.
29
| STARWOOD HOTEL PORTFOLIO |

THE INFORMATION IN THIS STRUCTURAL AND COLLATERAL TERM SHEET IS NOT COMPLETE AND MAY BE AMENDED PRIOR TO THE TIME OF SALE. THIS TERM SHEET IS NOT AN OFFER TO SELL THESE SECURITIES AND IT IS NOT A SOLICITATION OF AN OFFER TO BUY THESE SECURITIES IN ANY JURISDICTION WHERE THE OFFER OR SALE IS NOT PERMITTED.
30
| STARWOOD HOTEL PORTFOLIO |
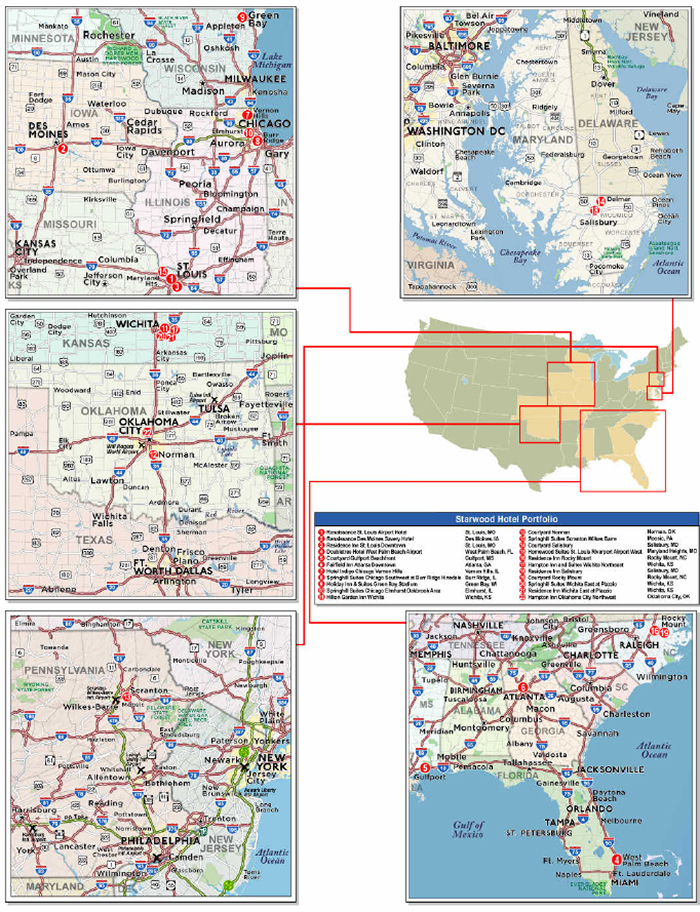
THE INFORMATION IN THIS STRUCTURAL AND COLLATERAL TERM SHEET IS NOT COMPLETE AND MAY BE AMENDED PRIOR TO THE TIME OF SALE. THIS TERM SHEET IS NOT AN OFFER TO SELL THESE SECURITIES AND IT IS NOT A SOLICITATION OF AN OFFER TO BUY THESE SECURITIES IN ANY JURISDICTION WHERE THE OFFER OR SALE IS NOT PERMITTED.
31
| No. 1 – Starwood Hotel Portfolio | |||||||
| Loan Information | Property Information | ||||||
| Mortgage Loan Seller: | Wells Fargo Bank, National Association | Single Asset/Portfolio: | Portfolio | ||||
| Credit Assessment (DBRS/Fitch/Moody’s): | NR/NR/NR | Property Type: | Hospitality | ||||
| Original Principal Balance(1): | $70,000,000 | Specific Property Type: | Various | ||||
| Cut-off Date Balance(1): | $70,000,000 | Location: | Various | ||||
| % of Initial Pool Balance: | 7.4% | Size: | 2,943 Rooms | ||||
| Loan Purpose: | Refinance | Cut-off Date Balance Per Room(1): | $90,044 | ||||
| Borrower Names(2): | Various | Year Built/Renovated: | Various – See Table | ||||
| Borrower Sponsor: | SCG Hotel Investors Holdings L.P. | Title Vesting: | Fee | ||||
| Mortgage Rate: | 5.1500% | Property Manager: | Schulte Hospitality Group, Inc. | ||||
| Note Date: | August 16, 2018 | 4th Most Recent Occupancy (As of): | 73.0% (12/31/2014) | ||||
| Anticipated Repayment Date: | NAP | 3rd Most Recent Occupancy (As of): | 72.4% (12/31/2015) | ||||
| Maturity Date: | September 11, 2028 | 2nd Most Recent Occupancy (As of)(5): | 71.5% (12/31/2016) | ||||
| IO Period: | 120 months | Most Recent Occupancy (As of)(5): | 72.0% (12/31/2017) | ||||
| Loan Term (Original): | 120 months | Current Occupancy (As of)(5): | 72.5% (5/31/2018) | ||||
| Seasoning: | 1 month | ||||||
| Amortization Term (Original): | NAP | Underwriting and Financial Information: | |||||
| Loan Amortization Type: | Interest-only, Balloon | 4th Most Recent NOI (As of): | $32,310,013 (12/31/2015) | ||||
| Interest Accrual Method: | Actual/360 | 3rd Most Recent NOI (As of)(6): | $29,372,183 (12/31/2016) | ||||
| Call Protection(3): | L(11),GRTR 1% or YM(14),GRTR 1% or YM or D(88),O(7) | 2nd Most Recent NOI (As of)(6): | $29,477,118 (12/31/2017) | ||||
| Most Recent NOI (As of)(6): | $29,954,374 (TTM 5/31/2018) | ||||||
| Lockbox Type: | Soft/Springing Cash Management | U/W Revenues: | $106,614,582 | ||||
| Additional Debt(1): | Yes | U/W Expenses: | $73,391,622 | ||||
| Additional Debt Type(1): | Pari Passu | U/W NOI(6): | $33,222,960 | ||||
| U/W NCF: | $28,658,491 | ||||||
| U/W NOI DSCR(1): | 2.40x | ||||||
| U/W NCF DSCR(1): | 2.07x | ||||||
| Escrows and Reserves(4): | U/W NOI Debt Yield(1): | 12.5% | |||||
| Type: | Initial | Monthly | Cap (If Any) | U/W NCF Debt Yield(1): | 10.8% | ||
| Taxes | $0 | Springing | NAP | As-Is Appraised Value(7): | $401,000,000 | ||
| Insurance | $0 | Springing | NAP | As-Is Appraisal Valuation Date(7) : | Various | ||
| FF&E Reserve | $0 | $330,760 | NAP | Cut-off Date LTV Ratio(1)(7) : | 66.1% | ||
| PIP Reserve | $5,408,895 | $0 | NAP | LTV Ratio at Maturity(1)(7): | 66.1% | ||
| (1) | The Starwood Hotel Portfolio Mortgage Loan (as defined below) is part of the Starwood Hotel Portfolio Whole Loan (as defined below), which comprises four pari passu notes with an aggregate original principal balance of $265,000,000. The Cut-off Date Balance per Room, Maturity Date Balance per Room, UW NOI Debt Yield, UW NOI Debt Yield at Maturity, UW NCF DSCR, Cut-off Date LTV Ratio and Maturity Date LTV Ratio numbers presented are based on the Starwood Hotel Portfolio Whole Loan. |
| (2) | See “The Borrower” Section |
| (3) | Prepayment of the Starwood Hotel Portfolio Whole Loan is permitted at any time on or after September 11, 2019 (the “Prepayment Lockout Date”). Defeasance of the Starwood Hotel Portfolio Whole Loan is permitted at any time after the earlier of (i) October 11, 2021 and (ii) two years from the closing date of the securitization that includes the last pari passu note of the Starwood Hotel Portfolio Whole Loan to be securitized (the “Defeasance Lockout Date”). The assumed defeasance lockout period of 25 payments is based on the closing date of this transaction in October 2018. |
| (4) | See “Escrows” section. |
| (5) | The Renaissance Des Moines Savery Hotel property (the “RDM Property”) has been closed for renovations since August 2016 and is excluded from the total portfolio historic occupancy in 2016, 2017 and May 31, 2018. |
| (6) | The increase from Most Recent NOI to UW NOI was due to the inclusion of the RDM Property in underwriting. The RDM Property has been closed and undergoing renovations since August 2016 and was thus excluded from the historical 2016, 2017 and TTM 5/31/2018 cash flows. The RDM Property’s underwritten cash flows are based on cash flow estimates set forth in the related appraisal. See “The Properties” and “Cash Flow Analysis” below. |
| (7) | The individual property level appraised values total $377,700,000, which would equate to a Cut-off Date LTV Ratio and LTV Ratio at Maturity of 70.2%; however, the appraisal concluded to a portfolio value of $401,000,000 based on the assumption that the entire portfolio is marketed to a single purchaser. |
The Mortgage Loan. The mortgage loan (the “Starwood Hotel Portfolio Mortgage Loan”) is part of a whole loan (the “Starwood Hotel Portfolio Whole Loan”) evidenced by fourpari passu promissory notes in the aggregate original principal balance of $265,000,000, which are secured by the first priority fee interest in a portfolio of 22 hospitality properties (the “Starwood Hotel Portfolio Properties”). The Starwood Hotel Portfolio Whole Loan was originated on August 16, 2018 by Wells Fargo Bank, National Association. The Starwood Hotel Portfolio Whole Loan had an original principal balance of $265,000,000, has an outstanding principal balance as of the Cut-off Date of $265,000,000 and accrues interest at an interest rate of 5.1500%per annum. The Starwood Hotel Portfolio Whole Loan had an initial term of 120 months, has a remaining term of 119 months as of the Cut-off Date and requires payments of interest only through the loan term. The Starwood Hotel Portfolio Whole Loan matures on September 11, 2028.
THE INFORMATION IN THIS STRUCTURAL AND COLLATERAL TERM SHEET IS NOT COMPLETE AND MAY BE AMENDED PRIOR TO THE TIME OF SALE. THIS TERM SHEET IS NOT AN OFFER TO SELL THESE SECURITIES AND IT IS NOT A SOLICITATION OF AN OFFER TO BUY THESE SECURITIES IN ANY JURISDICTION WHERE THE OFFER OR SALE IS NOT PERMITTED.
32
| STARWOOD HOTEL PORTFOLIO |
The Starwood Hotel Portfolio Mortgage Loan, evidenced by the controlling Note A-1, will be contributed to the WFCM 2018-C47 securitization trust, had an original principal balance of $70,000,000 and has an outstanding principal balance as of the Cut-off Date of $70,000,000. The non-controlling Note A-2 had an original principal balance of $65,000,000, has an outstanding principal balance as of the Cut-off Date of $65,000,000 and was contributed to the BANK 2018-BNK14 Trust. The non-controlling Note A-3 in the original principal balance of $100,000,000 and the non-controlling Note A-4 in the original principal balance of $30,000,000, have outstanding principal balances as of the Cut-off Date of $100,000,000 and $30,000,000, respectively, and are expected to be contributed to a future securitization trust or trusts. The mortgage loans evidenced by Notes A-2, A-3 and A-4 are collectively referred to herein as the “Starwood Hotel Portfolio Companion Loans”. The lender provides no assurances that any non-securitizedpari passu notes will not be split further. See “Description of the Mortgage Pool—The Whole Loans—The Serviced Pari Passu Whole Loans” and “Pooling and Servicing Agreement” in the Preliminary Prospectus.
Note Summary
| Notes | Original Balance | Note Holder | Controlling Interest | |
| A-1 | $70,000,000 | WFCM 2018-C47 | Yes | |
| A-2 | $65,000,000 | BANK 2018-BNK14 | No | |
| A-3 | $100,000,000 | Wells Fargo Bank, National Association | No | |
| A-4 | $30,000,000 | Wells Fargo Bank, National Association | No | |
| Total | $265,000,000 |
Prepayment of the Starwood Hotel Portfolio Whole Loan is permitted at any time on or after September 11, 2019 (the “Prepayment Lockout Date”). Defeasance of the Starwood Hotel Portfolio Whole Loan is permitted at any time after the earlier of (i) October 11, 2021 and (ii) two years from the closing date of the securitization that includes the lastpari passunote of the Starwood Hotel Portfolio Whole Loan to be securitized (the “Defeasance Lockout Date”). The assumed defeasance lockout period of 25 payments is based on the closing date of this transaction in October 2018.
Sources and Uses
| Sources | Uses | |||||||
| Original loan amount | $265,000,000 | 100.0% | Loan payoff | $245,817,666 | 92.8% | |||
| Closing costs | 11,487,269 | 4.3 | ||||||
| Reserves | 5,408,895 | 2.0 | ||||||
| Return of equity | 2,286,170 | 0.9 | ||||||
| Total Sources | $265,000,000 | 100.0% | Total Uses | $265,000,000 | 100.0% |
The Properties.The Starwood Hotel Portfolio Properties comprise 22 hotels offering a range of amenities across limited service, select service, full service and extended stay properties. The largest individual property (Renaissance St. Louis Airport Hotel) accounts for 13.4% of total rooms and 12.1% of underwritten net cash flow, and no other individual property accounts for more than 7.1% of total rooms or 10.5% of underwritten net cash flow. All of the Starwood Hotel Portfolio Properties have been built or renovated since 2012, with 19 properties representing 89.6% of underwritten net cash flow having been renovated since 2015. The hotels range in size from 77 to 393 rooms with an average room count of 134 rooms.
Approximately $81.5 million ($27,693 per room) of capital expenditures have been made at the Starwood Hotel Portfolio Properties since 2015, and the Starwood Hotel Portfolio Borrower has budgeted for approximately $31.9 million ($10,836 per room) in additional capital expenditures through 2022. Of the $31.9 million of budgeted capital expenditures, approximately $5.4 million ($1,838 per room) relates to brand-mandated renovations required by the related franchise agreements, which were reserved for at origination. The remainder of the budgeted expenditures relate to elective renovations and are not required to be completed by the Starwood Hotel Portfolio Whole Loan documents and were not reserved for.
The RDM Property is an 11-story, 209-room, full service hotel originally built in 1887 that has been offline for renovations since August 2016, and is expected to re-open in October 2018. The renovations at the RDM Property since 2016 total approximately $33.2 million ($158,753 per room) and included complete guest-facing upgrades and updating all mechanical, electrical and HVAC systems. The RDM Property accounts for 8.9% of the allocated loan amount, 7.1% of total rooms, and 9.3% of underwritten net cash flow.
THE INFORMATION IN THIS STRUCTURAL AND COLLATERAL TERM SHEET IS NOT COMPLETE AND MAY BE AMENDED PRIOR TO THE TIME OF SALE. THIS TERM SHEET IS NOT AN OFFER TO SELL THESE SECURITIES AND IT IS NOT A SOLICITATION OF AN OFFER TO BUY THESE SECURITIES IN ANY JURISDICTION WHERE THE OFFER OR SALE IS NOT PERMITTED.
33
| STARWOOD HOTEL PORTFOLIO |
The following table presents certain information relating to the Starwood Hotel Portfolio Properties:
| Property Name | City / State | Year Built / Renovated | No. of Rooms | Allocated Cut-off Date Balance(1) | % of Portfolio Cut-off Date Balance | Appraised Value | Allocated Cut-off Date LTV | UW Net Cash Flow | % of UW | 5/31/18 Occ.(2) | TTM 5/31/18 RevPAR Pen.(2) |
| Renaissance St. Louis Airport Hotel | St. Louis, MO | 1987 / 2015 | 393 | $34,965,762 | 13.2% | $50,100,000 | 69.8% | $3,480,137 | 12.1% | 70.5% | 109.2% |
| Renaissance Des Moines Savery Hotel | Des Moines, IA | 1887 / 2018 | 209 | $23,659,468 | 8.9% | $33,600,000(3) | 70.4%(3) | $2,673,235(3) | 9.3%(3) | (3) | (3) |
| Residence Inn St. Louis Downtown | St. Louis, MO | 2006 / 2017 | 188 | $22,193,837 | 8.4% | $31,800,000 | 69.8% | $2,381,957 | 8.3% | 75.5% | 123.0% |
| Doubletree Hotel West Palm Beach Airport | West Palm Beach, FL | 1987 / 2015 | 175 | $21,914,669 | 8.3% | $29,700,000 | 73.8% | $3,016,297 | 10.5% | 87.7% | 104.4% |
| Courtyard Gulfport Beachfront | Gulfport, MS | 1972 / 2015 | 149 | $15,772,979 | 6.0% | $22,600,000 | 69.8% | $1,428,547 | 5.0% | 65.7% | 106.6% |
| Fairfield Inn Atlanta Downtown | Atlanta, GA | 1915 / 2012 | 156 | $14,656,308 | 5.5% | $21,000,000 | 69.8% | $1,413,835 | 4.9% | 69.5% | 87.0% |
| Hotel Indigo Chicago Vernon Hills | Vernon Hills, IL | 1997 / 2015 | 127 | $13,469,845 | 5.1% | $19,300,000 | 69.8% | $1,291,636 | 4.5% | 68.4% | 92.6% |
| Springhill Suites Chicago Southwest at Burr Ridge Hinsdale | Burr Ridge, IL | 2000 / 2015 | 128 | $12,074,006 | 4.6% | $17,300,000 | 69.8% | $1,432,507 | 5.0% | 70.8% | 126.3% |
| Holiday Inn & Suites Green Bay Stadium | Green Bay, WI | 2007 / 2015 | 118 | $11,794,838 | 4.5% | $16,900,000 | 69.8% | $1,314,971 | 4.6% | 72.1% | 98.6% |
| Springhill Suites Chicago Elmhurst Oakbrook Area | Elmhurst, IL | 2000 / 2015 | 128 | $10,817,751 | 4.1% | $15,500,000 | 69.8% | $1,223,279 | 4.3% | 77.5% | 146.3% |
| Hilton Garden Inn Wichita | Wichita, KS | 2000 / 2016 | 103 | $9,421,912 | 3.6% | $13,500,000 | 69.8% | $1,198,180 | 4.2% | 78.5% | 144.5% |
| Courtyard Norman | Norman, OK | 2009 / 2016 | 113 | $8,095,865 | 3.1% | $11,600,000 | 69.8% | $827,823 | 2.9% | 65.4% | 115.2% |
| Springhill Suites Scranton Wilkes Barre | Moosic, PA | 2012 / NAP | 102 | $7,746,905 | 2.9% | $11,100,000 | 69.8% | $829,052 | 2.9% | 73.9% | 94.9% |
| Courtyard Salisbury | Salisbury, MD | 2006 / 2015 | 106 | $7,467,738 | 2.8% | $10,700,000 | 69.8% | $636,356 | 2.2% | 66.1% | 118.4% |
| Homewood Suites St. Louis Riverport Airport West | Maryland Heights, MO | 2007 / 2017 | 104 | $7,397,946 | 2.8% | $10,600,000 | 69.8% | $662,010 | 2.3% | 76.3% | 129.2% |
| Residence Inn Rocky Mount | Rocky Mount, NC | 1999 / 2016 | 77 | $7,397,946 | 2.8% | $10,600,000 | 69.8% | $784,222 | 2.7% | 72.7% | 121.2% |
| Hampton Inn and Suites Wichita Northeast | Wichita, KS | 2009 / 2017 | 102 | $7,048,986 | 2.7% | $10,100,000 | 69.8% | $898,704 | 3.1% | 72.1% | 128.8% |
| Residence Inn Salisbury | Salisbury, MD | 2007 / 2015 | 84 | $6,979,194 | 2.6% | $10,000,000 | 69.8% | $585,659 | 2.0% | 77.0% | 125.3% |
| Courtyard Rocky Mount | Rocky Mount, NC | 2000 / 2015 | 90 | $5,653,147 | 2.1% | $8,100,000 | 69.8% | $614,727 | 2.1% | 67.6% | 97.0% |
| Springhill Suites Wichita East at Plazzio | Wichita, KS | 2009 / 2016 | 102 | $5,583,355 | 2.1% | $8,000,000 | 69.8% | $628,629 | 2.2% | 69.1% | 99.0% |
| Residence Inn Wichita East at Plazzio | Wichita, KS | 2005 / 2013 | 93 | $5,583,355 | 2.1% | $8,000,000 | 69.8% | $736,422 | 2.6% | 73.3% | 109.6% |
| Hampton Inn Oklahoma City Northwest | Oklahoma City, OK | 1997 / 2016 | 96 | $5,304,188 | 2.0% | $7,600,000 | 69.8% | $600,304 | 2.1% | 70.3% | 102.2% |
| Total/Weighted Average | 2,943 | $265,000,000 | 100.0% | $401,000,000(4) | 66.1% | $28,658,491 | 100.0% | 72.5%(3) | 112.5%(3) |
| (1) | Balances shown are for the Starwood Hotel Portfolio Whole Loan. |
| (2) | Occupancy shown was obtained from borrower operating statements, and RevPAR Penetration Rates were obtained from various third party reports. |
| (3) | The RDM Property has been offline for renovations since August 2016 and is excluded from the total portfolio weighted averages for occupancy and RevPAR penetration. The RDM Property is expected to re-open in October 2018. The UW Net Cash Flow for the RDM Property is based on assumptions set forth in the related appraisal. The appraised value shown represents the as if complete value as of July 6, 2018. The as-is appraised value as of July 6, 2018 is $27,700,000, which would equate to an allocated cut-off date LTV of 85.4%. |
| (4) | The individual property level appraised values total $377,700,000, which would equate to a Cut-off Date LTV Ratio and LTV Ratio at Maturity of 70.2%; however, the appraisal concluded to a portfolio value of $401,000,000 based on the assumption that the entire portfolio is marketed to a single purchaser. |
THE INFORMATION IN THIS STRUCTURAL AND COLLATERAL TERM SHEET IS NOT COMPLETE AND MAY BE AMENDED PRIOR TO THE TIME OF SALE. THIS TERM SHEET IS NOT AN OFFER TO SELL THESE SECURITIES AND IT IS NOT A SOLICITATION OF AN OFFER TO BUY THESE SECURITIES IN ANY JURISDICTION WHERE THE OFFER OR SALE IS NOT PERMITTED.
34
| STARWOOD HOTEL PORTFOLIO |
The following table presents certain information relating to the property sub-types of the Starwood Hotel Portfolio Properties:
Property Sub-Type
| Property Sub-Type | # of Hotels | # of Rooms | UW NCF | % of Total UW NCF | Appraised Value | Appraised Value Per Room | 5/31/2018 Penetration(1) |
| Extended Stay | 5 | 546 | $5,150,270 | 18.0% | $71,000,000 | $130,037 | 122.0% |
| Full Service | 4 | 895 | $10,484,640 | 36.6% | $130,300,000 | $145,587 | 106.2%(2) |
| Select Service | 6 | 688 | $5,997,269 | 20.9% | $85,800,000 | $124,709 | 111.7% |
| Limited Service | 7 | 814 | $7,026,310 | 24.5% | $90,600,000 | $111,302 | 112.0% |
| Total/Weighted Average | 22 | 2,943 | $28,658,491 | 100.0% | $401,000,000(3) |
| (1) | Information obtained from various third party reports. |
| (2) | The RevPAR Penetration for Full Service Hotels excludes the RDM Property, which has been closed for renovations since August 2016. |
| (3) | The individual property level appraised values total $377,700,000, which would equate to a Cut-off Date LTV Ratio and LTV Ratio at Maturity of 70.2%; however, the appraisal concluded to a portfolio value of $401,000,000 based on the assumption that the entire portfolio is marketed to a single purchaser. |
The following table presents certain information relating to the historical and budgeted capital expenditures at the Starwood Hotel Portfolio Properties:
Historical and Budgeted Capital Expenditures
| 2012 | 2013 | 2014 | 2015 | 2016 | 2017 | 2018 YTD | 2018 Budget(2) | 2019 Budget(2) | 2020 Budget(2) | 2021 Budget(2) | 2022 Budget(2) | Total | |
| Cap Ex(1) | $77 | $177 | $1,671 | $25,620 | $24,743 | $25,991 | $5,146 | $7,134 | $2,625 | $1,758 | $3,945 | $16,428 | $115,315 |
| Per Room | $26 | $60 | $568 | $8,705 | $8,407 | $8,831 | $1,749 | $2,424 | $892 | $597 | $1,340 | $5,582 | $39,183 |
| (1) | The capital expenditures are shown in thousands. |
| (2) | Of the budgeted capital expenditures shown for 2018 through 2022, approximately $5.4 million relates to brand-mandated renovations required by the related franchise agreements, which were reserved for at origination. The remainder of the budgeted expenditures relate to elective renovations and are not required to be completed by the Starwood Hotel Portfolio Whole Loan documents and have not been reserved for. |
The following table presents certain information relating to the flags and brands of the Starwood Hotel Portfolio Properties:
Property Flags and Brands
| Brand | # of Hotels | # of Rooms | % of Rooms | Allocated Cut- off Date Balance(1) | Allocated Cut-off Date Balance Per Room | UW Net Cash Flow | % of Total UW NCF | Appraised Value | LTV |
| Marriott | |||||||||
| Renaissance | 2 | 602 | 20.5% | $58,625,230 | $97,384 | $6,153,372(2) | 21.5%(2) | $83,700,000 | 70.0% |
| Residence Inn | 4 | 442 | 15.0% | $42,154,332 | $95,372 | $4,488,260 | 15.7% | $60,400,000 | 69.8% |
| Courtyard | 4 | 458 | 15.6% | $36,989,729 | $80,764 | $3,507,453 | 12.2% | $53,000,000 | 69.8% |
| Springhill Suites | 4 | 460 | 15.6% | $36,222,017 | $78,744 | $4,113,467 | 14.4% | $51,900,000 | 69.8% |
| Fairfield Inn | 1 | 156 | 5.3% | $14,656,308 | $93,951 | $1,413,835 | 4.9% | $21,000,000 | 69.8% |
| Total Marriott | 15 | 2,118 | 72.0% | $188,647,616 | $89,069 | $19,676,387 | 68.7% | $270,000,000 | 69.9% |
| Hilton | |||||||||
| Homewood Suites | 1 | 104 | 3.5% | $7,397,946 | $71,134 | $662,010 | 2.3% | $10,600,000 | 69.8% |
| Hampton Inn | 2 | 198 | 6.7% | $12,353,174 | $62,390 | $1,499,008 | 5.2% | $17,700,000 | 69.8% |
| Hilton Garden Inn | 1 | 103 | 3.5% | $9,421,912 | $91,475 | $1,198,180 | 4.2% | $13,500,000 | 69.8% |
| Doubletree | 1 | 175 | 5.9% | $21,914,669 | $125,227 | $3,016,297 | 10.5% | $29,700,000 | 73.8% |
| Total Hilton | 5 | 580 | 19.7% | $51,087,701 | $88,082 | $6,375,495 | 22.2% | $71,500,000 | 71.5% |
| Intercontinental | |||||||||
| Holiday Inn & Suites | 1 | 118 | 4.0% | $11,794,838 | $99,956 | $1,314,971 | 4.6% | $16,900,000 | 69.8% |
| Hotel Indigo | 1 | 127 | 4.3% | $13,469,845 | $106,062 | $1,291,636 | 4.5% | $19,300,000 | 69.8% |
| Total Intercontinental | 2 | 245 | 8.3% | $25,264,683 | $103,121 | $2,606,607 | 9.1% | $36,200,000 | 69.8% |
| Total/Weighted Average | 22 | 2,943 | $265,000,000 | $90,044 | 28,658,491 | 100.0% | $401,000,000(3) |
| (1) | Balances shown are for the Starwood Hotel Portfolio Whole Loan. |
| (2) | The RDM Property has been offline for renovations since August 2016 and is expected to re-open in October 2018. The UW Net Cash Flow for the RDM Property is based on the assumptions set forth in the appraisal. |
| (3) | The individual property level appraised values total $377,700,000, which would equate to a Cut-off Date LTV Ratio and LTV Ratio at Maturity of 70.2%; however, the appraisal concluded to a portfolio value of $401,000,000 based on the assumption that the entire portfolio is marketed to a single purchaser. |
THE INFORMATION IN THIS STRUCTURAL AND COLLATERAL TERM SHEET IS NOT COMPLETE AND MAY BE AMENDED PRIOR TO THE TIME OF SALE. THIS TERM SHEET IS NOT AN OFFER TO SELL THESE SECURITIES AND IT IS NOT A SOLICITATION OF AN OFFER TO BUY THESE SECURITIES IN ANY JURISDICTION WHERE THE OFFER OR SALE IS NOT PERMITTED.
35
| STARWOOD HOTEL PORTFOLIO |
The following table presents certain information relating to the franchise agreement expirations of the Starwood Hotel Portfolio Properties:
Franchise Expiration Summary
Year | # Hotels | # Rooms | % Rooms | Cumulative # of Rooms Expiring | Cumulative % of Rooms Expiring | UW NCF | % UW NCF |
| 2018 | 0 | 0 | 0.0% | 0 | 0.0% | $0 | 0.0% |
| 2019 | 0 | 0 | 0.0% | 0 | 0.0% | $0 | 0.0% |
| 2020 | 0 | 0 | 0.0% | 0 | 0.0% | $0 | 0.0% |
| 2021 | 0 | 0 | 0.0% | 0 | 0.0% | $0 | 0.0% |
| 2022 | 0 | 0 | 0.0% | 0 | 0.0% | $0 | 0.0% |
| 2023 | 0 | 0 | 0.0% | 0 | 0.0% | $0 | 0.0% |
| 2024(1) | 2 | 256 | 8.7% | 256 | 8.7% | $2,655,786 | 9.3% |
| 2025 | 0 | 0 | 0.0% | 256 | 8.7% | $0 | 0.0% |
| 2026(2) | 1 | 106 | 3.6% | 362 | 12.3% | $636,356 | 2.2% |
| 2027 | 1 | 84 | 2.9% | 446 | 15.2% | $585,659 | 2.0% |
| 2028(3) | 2 | 267 | 9.1% | 713 | 24.2% | $2,743,518 | 9.6% |
| 2029 & Beyond | 16 | 2,230 | 75.8% | 2,943 | 100.0% | $22,037,170 | 76.9% |
| Total/Weighted Average | 22 | 2,943 | 100.0% | $28,658,491 | 100.0% |
| (1) | The franchise agreements for SpringHill Suites Elmhurst Oakbrook Area and SpringHill Suites Chicago Southwest at Burr Ridge Hinsdale each include extension options to either 2029 or 2034 subject to certain property improvement plan requirements outlined in the respective franchise agreements. |
| (2) | The franchise agreement for Courtyard Salisbury has one, 10-year renewal option subject to certain terms outlined in the franchise agreement. |
| (3) | The franchise agreement for Courtyard Gulfport Beachfront has one, 10-year renewal option subject to certain terms outlined in the franchise agreement. |
Operating History and Underwritten Net Cash Flow.The following table presents certain information relating to the historical operating performance and the underwritten net cash flow at the Starwood Hotel Portfolio Properties:
Cash Flow Analysis(1)
| 2015 | 2016(1) | 2017(1) | TTM 5/31/2018 (1)(2) | UW Excluding RDM | UW RDM Only | UW(2) | % of U/W Total Revenue | U/W $ Room | |
| Occupancy | 72.4% | 71.5% | 72.0% | 72.5% | 72.5% | 65.0% | 71.9% | ||
| ADR | $112.51 | $114.55 | $116.14 | $116.97 | $116.97 | $170.98 | $120.44 | ||
| RevPAR | $81.42 | $81.85 | $83.62 | $84.77 | $84.77 | $111.14 | $86.64 | ||
| Room Revenue | $87,465,272 | $81,899,359 | $83,441,436 | $84,593,757 | $84,593,757 | $8,478,071 | $93,071,828 | 87.3% | $31,625 |
| F&B Revenue | 9,250,986 | 8,103,985 | 7,697,959 | 7,829,732 | 7,829,732 | 3,016,524 | 10,846,256 | 10.2 | 3,685 |
| Other Revenue(3) | 2,669,481 | 2,511,951 | 2,252,133 | 2,284,070 | 2,284,070 | 412,428 | 2,696,498 | 2.5 | 916 |
| Total Revenue | $99,385,739 | $92,515,295 | $93,391,528 | $94,707,559 | $94,707,559 | $11,907,023 | $106,614,582 | 100.0% | $36,226 |
| Total Department Expenses | 27,992,309 | 25,950,306 | 26,623,065 | 27,010,784 | 27,010,784 | 4,035,966 | 31,046,750 | 29.1 | 10,549 |
| Gross Operating Income | $71,393,430 | $66,564,989 | $66,768,463 | $67,696,775 | $67,696,775 | $7,871,057 | $75,567,832 | 70.9% | 25,677 |
| Total Undistributed Expenses | 33,118,817 | 31,281,406 | 31,633,726 | 32,120,237 | 32,120,237 | 3,923,822 | 36,044,059 | 33.8 | 12,247 |
| Gross Operating Profit | $38,274,613 | $35,283,583 | $35,134,737 | 35,576,538 | 35,576,538 | $3,947,235 | $39,523,773 | 37.1% | 13,430 |
| Total Fixed Charges | 5,964,600 | 5,911,400 | 5,657,619 | 5,622,164 | 5,622,164 | 678,649 | 6,300,813 | 5.9 | 2,141 |
| Net Operating Income | $32,310,013 | $29,372,183 | $29,477,118 | $29,954,374 | 29,954,374 | $3,268,586 | $33,222,960 | 31.2% | $11,289 |
| FF&E | 0 | 0 | 0 | 0 | 3,969,118 | 595,351 | 4,564,469 | 4.3 | 1,551 |
| Net Cash Flow | $32,310,013 | $29,372,183 | $29,477,118 | $29,954,374 | $25,985,256 | $2,673,235 | $28,658,491 | 26.9% | $9,738 |
| NOI DSCR | 2.34x | 2.12x | 2.13x | 2.16x | 2.16x | NAP | 2.40x | ||
| NCF DSCR | 2.34x | 2.12x | 2.13x | 2.16x | 1.88x | NAP | 2.07x | ||
| NOI DY | 12.2% | 11.1% | 11.1% | 11.3% | 11.3% | NAP | 12.5% | ||
| NCF DY | 12.2% | 11.1% | 11.1% | 11.3% | 9.8% | NAP | 10.8% | ||
| (1) | The RDM Property has been closed for renovations since August 2016 and is excluded from Occupancy, ADR and RevPAR statistics and historical cash flows for 2016, 2017 and TTM 5/31/2018. The RDM Property is expected to re-open in October 2018 and is included in the UW. The underwriting for the RDM Property is based on the cash flow estimates set forth in the related appraisal. |
| (2) | The increase from TTM 5/31/2018 NOI to UW NOI results from the inclusion of the RDM Property. |
| (3) | Other Income consists of guest laundry/dry cleaning, ATM commissions, vending machines commissions, cancellation/attrition fees, convenience store sales, pet fees, telephone revenue, parking revenue and other miscellaneous income. |
| (4) | The debt service coverage ratios and debt yields shown are based on the Starwood Hotel Portfolio Whole Loan. |
Appraisal.The appraiser concluded to an “as is” appraised value for the Starwood Hotel Portfolio Properties of $401,000,000.
Environmental Matters. According to the Phase I environmental site assessments, there are no recognized environmental conditions at the Starwood Hotel Portfolio Properties.
THE INFORMATION IN THIS STRUCTURAL AND COLLATERAL TERM SHEET IS NOT COMPLETE AND MAY BE AMENDED PRIOR TO THE TIME OF SALE. THIS TERM SHEET IS NOT AN OFFER TO SELL THESE SECURITIES AND IT IS NOT A SOLICITATION OF AN OFFER TO BUY THESE SECURITIES IN ANY JURISDICTION WHERE THE OFFER OR SALE IS NOT PERMITTED.
36
| STARWOOD HOTEL PORTFOLIO |
Market Overview and Competition. The portfolio is located across 16 cities in 12 states, with the largest concentrations in Missouri (23.3% of rooms, 22.8% of underwritten net cash flow), Kansas (13.6% of rooms, 12.1% of underwritten net cash flow) and Illinois (13.0% of rooms, 13.8% of underwritten net cash flow).
Excluding the RDM Property (which has been closed for renovations since August 2016 and is expected to re-open in October 2018), the Starwood Hotel Portfolio Properties reported weighted average occupancy, ADR and RevPAR penetration rates each in excess of 105% for 2015 through the trailing 12-month period ending May 31, 2018. Additionally, excluding the RDM Property, approximately 74.6% of the Starwood Hotel Portfolio Properties based on room count achieved a RevPAR penetration in excess of 100.0% for the trailing 12-month period ending May 31, 2018.
The following tables present certain information relating to the weighted average historical occupancy, ADR, RevPAR and penetration rates of the Starwood Hotel Portfolio Properties:
Historical Occupancy, ADR and RevPAR(1)(2)
| Starwood Hotel Portfolio | Penetration Rates | |||||
| Year | Occupancy | ADR | RevPAR | Occupancy | ADR | RevPAR |
| 2015 | 71.9% | $112.45 | $80.92 | 105.8% | 106.7% | 113.1% |
| 2016 | 71.5% | $114.70 | $81.90 | 105.6% | 106.4% | 112.2% |
| 2017 | 72.3% | $115.77 | $83.78 | 105.5% | 106.2% | 111.9% |
| TTM May 2018 | 72.7% | $116.50 | $84.92 | 105.3% | 106.8% | 112.5% |
| (1) | Information obtained from various third party reports. |
| (2) | The RDM Property has been closed for renovations since August 2016 and is excluded from the weighted average portfolio historic occupancy, ADR, RevPAR and penetration rates. |
The Borrowers.The borrowers comprise 22 single-purpose Delaware limited partnerships, each of which is structured to be bankruptcy remote with two independent directors (collectively, the “Starwood Hotel Portfolio Borrower”). Each of the 22 borrower entities is indirectly owned by a Real Estate Investment Trust (“REIT”), which requires each borrower entity to lease the related hotel via an operating lease to a taxable REIT subsidiary. Legal counsel to the Starwood Hotel Portfolio Borrower delivered a non-consolidation opinion in connection with the origination of the Starwood Hotel Portfolio Whole Loan.
The Borrower Sponsor.The borrower sponsor and nonrecourse guarantor is SCG Hotel Investors Holdings L.P., an affiliate of Starwood Capital Group (“Starwood”). Starwood is a private alternative investment firm with a core focus on global real estate, energy infrastructure and oil & gas. Starwood and its affiliates have raised over $45 billion of equity capital since its inception in 1991, currently manage approximately $56 billion in assets, and have more than 3,800 employees in 11 offices around the world. Over the past 26 years, Starwood has acquired approximately $92 billion of assets across various real estate classes. As of April 2018, SCG Hotel Investors Holdings L.P. indirectly owned 276 hotels totaling more than 23,990 keys across 40 states.
Escrows.At origination, the Starwood Hotel Portfolio Borrower deposited upfront reserves of $5,408,895 for property improvement plans related to the Fairfield Inn Atlanta Downtown ($983,740), Courtyard Rocky Mount ($184,616), and Renaissance Des Moines Savery Hotel ($4,240,539). The Starwood Hotel Portfolio Whole Loan documents also provide for ongoing monthly reserves for furniture, fixtures and equipment (“FF&E”) equal to the greater of (i) 1/12th of 4% of aggregate gross revenue for the 12-month period ending in the month that is two months prior to the applicable payment date and (ii) the aggregate monthly deposit amount required under the franchise agreements for FF&E work (currently $330,760).
The Starwood Hotel Portfolio Whole Loan documents do not require ongoing monthly escrows for insurance premiums as long as (i) no Cash Trap Event Period (as defined below) has occurred and is continuing; (ii) the Starwood Hotel Portfolio Borrower provides the lender with evidence that the insurance coverage for the Starwood Hotel Portfolio Properties is included in a blanket policy and such policy is in full force and effect; and (iii) the Starwood Hotel Portfolio Borrower pays all applicable insurance premiums and provides the lender with evidence of renewals. The Starwood Hotel Portfolio Whole Loan documents do not require ongoing monthly escrows for taxes as long as no Cash Trap Event Period has occurred and is continuing. Upon the continuance of a Cash Trap Event Period, ongoing tax and insurance reserves are required in an amount equal to 1/12th of the estimated property taxes and insurance premiums payable during the ensuing 12 months.
Lockbox and Cash Management.A soft lockbox with springing cash management is in place with respect to the Starwood Hotel Portfolio Whole Loan. The Starwood Hotel Portfolio Borrower, property manager and operating lessee are required to deposit property income into the lockbox account within three business days after receipt, and commercial tenants and credit card providers are required to deposit rents and income directly into the lockbox during the continuance of an event of default. During a Cash Trap Event Period, all excess cash flow is required to be held in the excess cash flow sub account as additional security for the Starwood Hotel Portfolio Whole Loan.
A “Cash Trap Event Period” will commence upon the earliest of the following:
| (i) | the occurrence of an event of default under the Starwood Hotel Portfolio Whole Loan; |
| (ii) | the net cash flow debt yield falling below 8.0% for the immediately preceding calendar quarter; or |
| (iii) | two or more franchise agreements having expired or having been terminated at any given overlapping time during the loan term. |
THE INFORMATION IN THIS STRUCTURAL AND COLLATERAL TERM SHEET IS NOT COMPLETE AND MAY BE AMENDED PRIOR TO THE TIME OF SALE. THIS TERM SHEET IS NOT AN OFFER TO SELL THESE SECURITIES AND IT IS NOT A SOLICITATION OF AN OFFER TO BUY THESE SECURITIES IN ANY JURISDICTION WHERE THE OFFER OR SALE IS NOT PERMITTED.
37
| STARWOOD HOTEL PORTFOLIO |
A Cash Trap Event Period will end upon the occurrence of the following:
| ● | with regard to clause (i), the cure of such event of default; |
| ● | with regard to clause (ii), the net cash flow debt yield being equal to or greater than 8.0% for two consecutive calendar quarters (which may be achieved by a prepayment or delivery of a letter of credit in an amount which, if applied to the Starwood Hotel Portfolio Whole Loan balance, would satisfy such debt yield test); and |
| ● | with regard to clause (iii), (A) the replacement of at least one of the applicable expired or terminated franchise agreements in accordance with the loan documents, or (B) the release of the applicable individual property in accordance with the loan documents (see “Partial Release”). |
Property Management.Each of the Starwood Hotel Portfolio Properties is subject to an individual management agreement with Schulte Hospitality Group (“Schulte”). As of 2018, Schulte was the 12th largest hotel management company in the United States, with 108 hotels under management totaling over 15,320 keys across 26 states. Schulte has completed 62 renovations and 18 ground-up constructions since inception in 1999.
Assumption.The Starwood Hotel Portfolio Borrower has the right to transfer any of the Starwood Hotel Portfolio Propertiesprovidedthat certain conditions are satisfied, including (i) no event of default has occurred and is continuing; (ii) the lender’s reasonable determination that the proposed transferee and guarantor satisfy the lender’s credit review and underwriting standards, taking into consideration of transferee experience, financial strength and general business standing; and (iii) if requested by the lender, rating agency confirmation from Fitch, DBRS and Moody’s that the transfer will not result in a downgrade, withdrawal or qualification of the respective ratings assigned to the Series 2018-C47 Certificates and similar confirmations from each rating agency rating any securities backed by the Starwood Hotel Portfolio Companion Loans with respect to the ratings of such securities.
Partial Release.After the Defeasance Lockout Date or Prepayment Lockout Date (as applicable), the Starwood Hotel Portfolio Borrower may obtain the release of any of the Starwood Hotel Portfolio Properties,provided that, among other things, and in accordance with the Starwood Hotel Portfolio Whole Loan documents, (a) no event of default has occurred and is continuing (unless a non-monetary default specifically related to the released property is ongoing, in which event the Starwood Hotel Portfolio Borrower may obtain the release of such property under certain conditions, which if exercised prior to the Prepayment Lockout Date may be by partial prepayment only along with any applicable yield maintenance premium); (b) the Starwood Hotel Portfolio Whole Loan is either partially defeased or partially prepaid (along with any applicable yield maintenance premium) in an amount equal to the Release Price (as defined below); (c) the net cash flow debt yield for the remaining Starwood Hotel Portfolio Properties immediately following the release is equal to or greater than the greater of (i) 10.81% and (ii) the net cash flow debt yield immediately prior to the release;provided, however, that the Starwood Hotel Portfolio Borrower has the right to partially defease or prepay the Starwood Hotel Portfolio Whole Loan further or deliver cash or a letter of credit as additional collateral in order to meet such debt yield test; (d) a legal opinion covering compliance in all respects with all laws, rules and regulations governing REMICs has been delivered; and (e) with respect to a partial defeasance, rating agency confirmation is received. All releases subsequent to the first release are required to match the release format, prepayment or partial defeasance, selected for the first release. The allocated loan amount for each of the Starwood Hotel Portfolio Properties is subject topro rata reduction by the release premium and prepayment or non-release prepayment to account for previous prepayments and partial defeasances.
“Release Price” is an amount equal to the following amounts;provided, however, that if the release of any individual property would cause the aggregate amount partially defeased or prepaid to exceed either the 10% or 20% thresholds outlined below, then the Release Price for such property would be equal to the product of the allocated loan amount and thepro rata weighted average of the release prices outlined below:
| ● | 105% of the allocated loan amount for such property if less than or equal to 10% of the original principal balance of the Starwood Hotel Portfolio Whole Loan has been partially defeased or prepaid; |
| ● | 110% of the allocated loan amount for such property if more than 10% but less than or equal to 20% of the original principal balance of the Starwood Hotel Portfolio Whole Loan has been partially defeased or prepaid; and |
| ● | 115% of the allocated loan amount for such property if more than 20% of the original principal balance of the Starwood Hotel Portfolio Whole Loan has been partially defeased or prepaid. |
The allocated loan amount for each property is subject topro rata reduction to account for previous prepayments under the Starwood Hotel Portfolio Whole Loan, including in connection with prior partial releases and partial defeasances.
Real Estate Substitution.Not permitted.
Subordinate and Mezzanine Indebtedness.Not permitted.
Ground Lease.None.
Terrorism Insurance. The Starwood Hotel Portfolio Whole Loan documents require that the “all risk” insurance policy required to be maintained by the Starwood Hotel Portfolio Borrower provides coverage for terrorism in an amount equal to the full replacement cost of the Starwood Hotel Portfolio Properties. The loan documents also require business interruption insurance covering no less than the 18 month period following the occurrence of a casualty event, together with a 12 month extended period of indemnity (provided that if TRIPRA or a similar statute is not in effect, the Starwood Hotel Portfolio Borrower will not be obligated to pay terrorism insurance premiums in excess of two times the premium for the casualty and business interruption coverage on a stand-alone basis). See “Risk Factors—Risks Relating to the Mortgage Loans—Terrorism Insurance May Not Be Available for All Mortgaged Properties” in the Preliminary Prospectus.
Windstorm Insurance. The Starwood Hotel Portfolio Whole Loan documents require windstorm and flood insurance covering the full replacement cost of the Starwood Hotel Portfolio Properties during the loan term. At the time of loan closing, Starwood Hotel Portfolio Properties had windstorm insurance coverage and flood insurance in the maximum limit available under the National Flood Insurance Program together with excess coverage.
THE INFORMATION IN THIS STRUCTURAL AND COLLATERAL TERM SHEET IS NOT COMPLETE AND MAY BE AMENDED PRIOR TO THE TIME OF SALE. THIS TERM SHEET IS NOT AN OFFER TO SELL THESE SECURITIES AND IT IS NOT A SOLICITATION OF AN OFFER TO BUY THESE SECURITIES IN ANY JURISDICTION WHERE THE OFFER OR SALE IS NOT PERMITTED.
38
(THIS PAGE INTENTIONALLY LEFT BLANK)
THE INFORMATION IN THIS STRUCTURAL AND COLLATERAL TERM SHEET IS NOT COMPLETE AND MAY BE AMENDED PRIOR TO THE TIME OF SALE. THIS TERM SHEET IS NOT AN OFFER TO SELL THESE SECURITIES AND IT IS NOT A SOLICITATION OF AN OFFER TO BUY THESE SECURITIES IN ANY JURISDICTION WHERE THE OFFER OR SALE IS NOT PERMITTED.
39
AVENTURA MALL
THE INFORMATION IN THIS STRUCTURAL AND COLLATERAL TERM SHEET IS NOT COMPLETE AND MAY BE AMENDED PRIOR TO THE TIME OF SALE. THIS TERM SHEET IS NOT AN OFFER TO SELL THESE SECURITIES AND IT IS NOT A SOLICITATION OF AN OFFER TO BUY THESE SECURITIES IN ANY JURISDICTION WHERE THE OFFER OR SALE IS NOT PERMITTED.
40
AVENTURA MALL
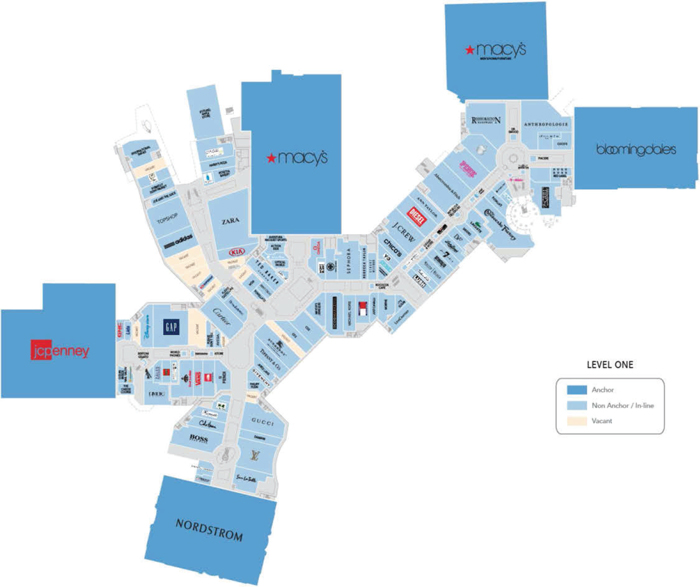
THE INFORMATION IN THIS STRUCTURAL AND COLLATERAL TERM SHEET IS NOT COMPLETE AND MAY BE AMENDED PRIOR TO THE TIME OF SALE. THIS TERM SHEET IS NOT AN OFFER TO SELL THESE SECURITIES AND IT IS NOT A SOLICITATION OF AN OFFER TO BUY THESE SECURITIES IN ANY JURISDICTION WHERE THE OFFER OR SALE IS NOT PERMITTED.
41
AVENTURA MALL
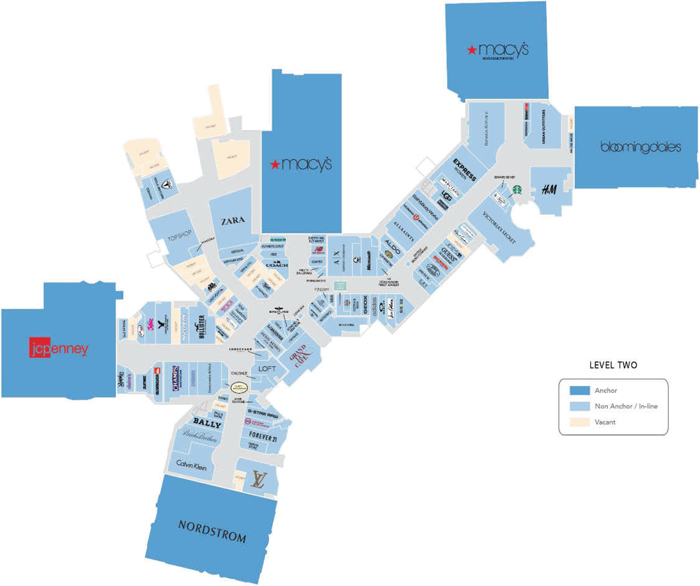
THE INFORMATION IN THIS STRUCTURAL AND COLLATERAL TERM SHEET IS NOT COMPLETE AND MAY BE AMENDED PRIOR TO THE TIME OF SALE. THIS TERM SHEET IS NOT AN OFFER TO SELL THESE SECURITIES AND IT IS NOT A SOLICITATION OF AN OFFER TO BUY THESE SECURITIES IN ANY JURISDICTION WHERE THE OFFER OR SALE IS NOT PERMITTED.
42
AVENTURA MALL
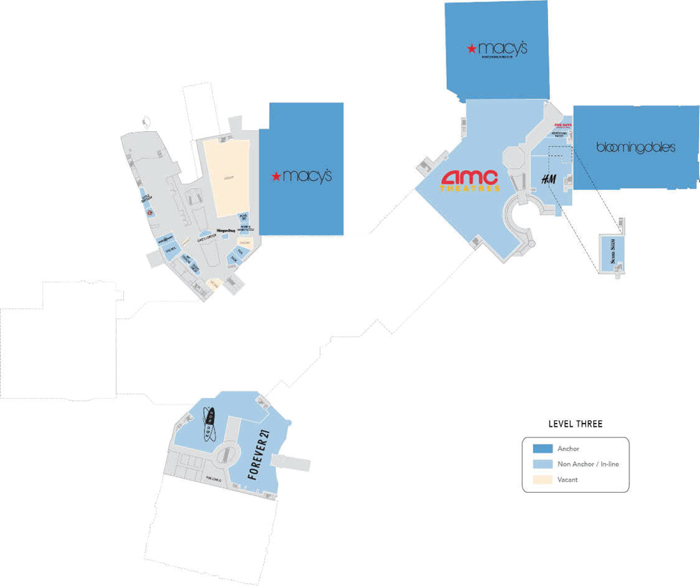
THE INFORMATION IN THIS STRUCTURAL AND COLLATERAL TERM SHEET IS NOT COMPLETE AND MAY BE AMENDED PRIOR TO THE TIME OF SALE. THIS TERM SHEET IS NOT AN OFFER TO SELL THESE SECURITIES AND IT IS NOT A SOLICITATION OF AN OFFER TO BUY THESE SECURITIES IN ANY JURISDICTION WHERE THE OFFER OR SALE IS NOT PERMITTED.
43
AVENTURA MALL
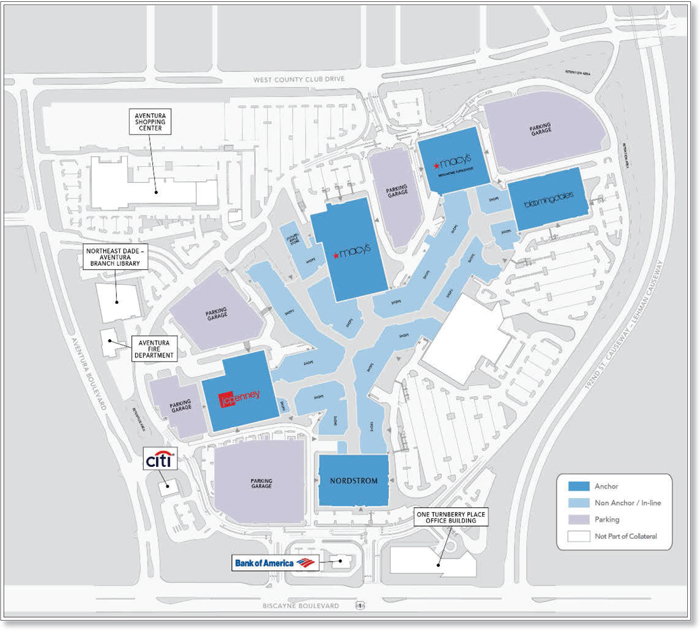
THE INFORMATION IN THIS STRUCTURAL AND COLLATERAL TERM SHEET IS NOT COMPLETE AND MAY BE AMENDED PRIOR TO THE TIME OF SALE. THIS TERM SHEET IS NOT AN OFFER TO SELL THESE SECURITIES AND IT IS NOT A SOLICITATION OF AN OFFER TO BUY THESE SECURITIES IN ANY JURISDICTION WHERE THE OFFER OR SALE IS NOT PERMITTED.
44
AVENTURA MALL
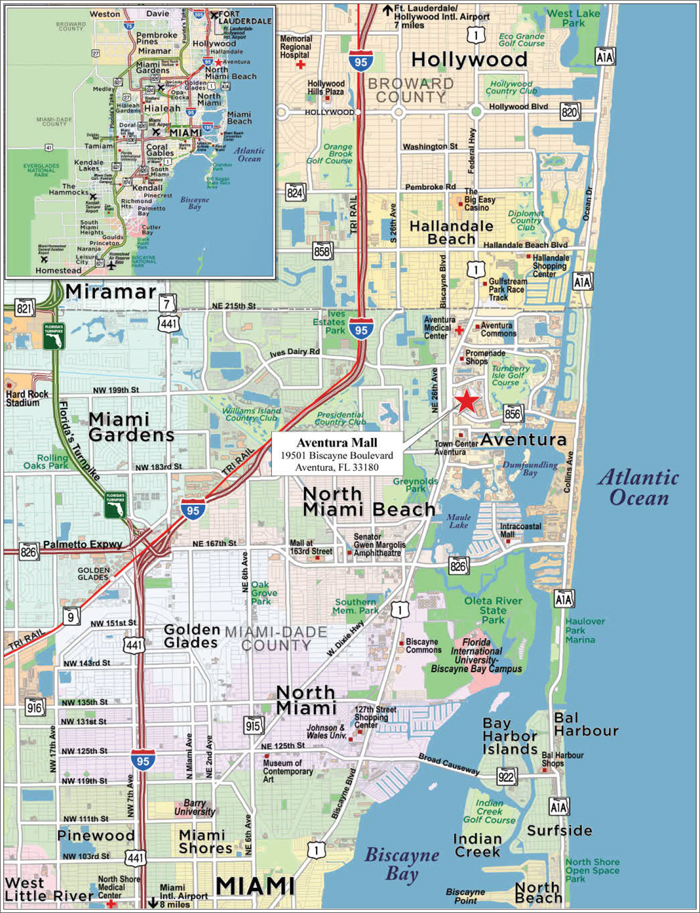
THE INFORMATION IN THIS STRUCTURAL AND COLLATERAL TERM SHEET IS NOT COMPLETE AND MAY BE AMENDED PRIOR TO THE TIME OF SALE. THIS TERM SHEET IS NOT AN OFFER TO SELL THESE SECURITIES AND IT IS NOT A SOLICITATION OF AN OFFER TO BUY THESE SECURITIES IN ANY JURISDICTION WHERE THE OFFER OR SALE IS NOT PERMITTED.
45
| No. 2 – Aventura Mall | ||||||
| Loan Information | Property Information | |||||
| Mortgage Loan Seller: | Wells Fargo Bank, National Association | Single Asset/Portfolio: | Single Asset | |||
| Credit Assessment (DBRS/Fitch/Moody's): | BBB (high)/Asf*/Aa3 | Property Type: | Retail | |||
| Original Principal Balance(1): | $50,000,000 | Specific Property Type: | Super Regional Mall | |||
| Cut-off Date Balance(1): | $50,000,000 | Location: | Aventura, FL | |||
| % of Initial Pool Balance: | 5.3% | Size: | 1,217,508 SF | |||
| Loan Purpose: | Refinance | Cut-off Date Balance Per SF(1): | $1,155.39 | |||
| Borrower Name: | Aventura Mall Venture | Year Built/Renovated: | 1983/2017 | |||
| Borrower Sponsors: | Simon Property Group, L.P.; Jacquelyn Soffer; Jeffrey Soffer | Title Vesting: | Fee | |||
| Mortgage Rate: | 4.12125% | Property Manager: | Self-managed | |||
| Note Date: | June 7, 2018 | 4th Most Recent Occupancy (As of): | 99.2% (12/31/2014) | |||
| Anticipated Repayment Date: | NAP | 3rd Most Recent Occupancy (As of): | 99.2% (12/31/2015) | |||
| Maturity Date: | July 1, 2028 | 2nd Most Recent Occupancy (As of): | 99.1% (12/31/2016) | |||
| IO Period: | 120 months | Most Recent Occupancy (As of): | 99.1% (12/31/2017) | |||
| Loan Term (Original): | 120 months | Current Occupancy (As of)(6): | 92.8% (2/14/2018) | |||
| Seasoning: | 3 months | |||||
| Amortization Term (Original): | NAP | Underwriting and Financial Information: | ||||
| Loan Amortization Type: | Interest-only, Balloon | |||||
| Interest Accrual Method: | Actual/360 | 4th Most Recent NOI: | $109,025,339 (12/31/2015) | |||
| Call Protection(2): | L(27),D(86),O(7) | 3rd Most Recent NOI: | $110,653,403 (12/31/2016) | |||
| Lockbox Type(3): | Hard/Springing Cash Management | 2nd Most Recent NOI: | $115,240,562 (12/31/2017) | |||
| Additional Debt(1): | Yes | Most Recent NOI(7): | $118,291,397 (TTM 3/31/2018) | |||
| Additional Debt Type(1)(4): | Pari Passu / Subordinate | |||||
| U/W Revenues: | $185,479,647 | |||||
| U/W Expenses: | $30,620,668 | |||||
| U/W NOI(7): | $154,858,979 | |||||
| Escrows and Reserves(5): | U/W NCF(7): | $151,571,708 | ||||
| U/W NOI DSCR(1): | 2.63x | |||||
| Type: | Initial | Monthly | Cap (If Any) | U/W NCF DSCR(1): | 2.58x | |
| Taxes | $0 | Springing | NAP | U/W NOI Debt Yield(1): | 11.0% | |
| Insurance | $0 | Springing | NAP | U/W NCF Debt Yield(1): | 10.8% | |
| Replacement Reserve | $0 | Springing | $487,003 | As-Is Appraised Value: | $3,450,000,000 | |
| TI/LC Reserve | $0 | Springing | $6,087,540 | As-Is Appraisal Valuation Date: | April 16, 2018 | |
| Outstanding Rollover Reserve | $19,392,145 | $0 | NAP | Cut-off Date LTV Ratio(1): | 40.8% | |
| Free Rent/Gap Rent Reserve | $6,776,765 | $0 | NAP | LTV Ratio at Maturity or ARD(1): | 40.8% | |
| (1) | See “The Mortgage Loan” section. All statistical financial information related to balances per square foot, loan-to-value ratios, debt service coverage ratios and debt yields are based on the Aventura Mall Senior Loans (as defined below). The Cut-off Date LTV Ratio, LTV Ratio at Maturity or ARD, U/W NCF DSCR and U/W NOI Debt Yield based on the Aventura Mall Senior Loans and the Aventura Mall B Notes (as defined below) (together, the “Aventura Mall Whole Loan”), are 50.7%, 50.7%, 2.07x and 8.8%, respectively. |
| (2) | Defeasance of the Aventura Mall Whole Loan is permitted at any time after the earlier to occur of (a) two years after the closing date of the securitization that includes the last note to be securitized or (b) August 1, 2021. The assumed defeasance lockout period of 27 payments is based on the expected WFCM 2018-C47 securitization trust closing date in October 2018. |
| (3) | Lockbox is soft for the master lease rents (see “Master Lease” section) and hard for other lease rents. |
| (4) | See “Subordinate and Mezzanine Indebtedness” section. |
| (5) | See “Escrows” section. |
| (6) | See “Historical Occupancy” section. |
| (7) | See “Cash Flow Analysis” section. |
The Mortgage Loan. The mortgage loan (the “Aventura Mall Mortgage Loan”) is part of the Aventura Mall Whole Loan evidenced by 26pari passu senior promissory notes (collectively, the “Aventura Mall Senior Loans”) and fourpari passu subordinate promissory notes (collectively, the “Aventura Mall B Notes”) secured by a first mortgage encumbering the fee interest in a 1.2 million square foot super regional mall (the “Aventura Mall Property”) located in Aventura, Florida. The Aventura Mall Whole Loan was co-originated on June 7, 2018 by Wells Fargo Bank, National Association (“WFB”), Morgan Stanley Bank, N.A. (“MS”), JPMorgan Chase Bank, National Association (“JPMCB”), and Deutsche Bank AG, New York Branch (“DBNY”). The Aventura Mall Whole Loan had an original principal balance of $1,750,000,000, has an outstanding principal balance as of the Cut-off Date of $1,750,000,000, and accrues interest at an interest rate of 4.12125%per annum. The Aventura Mall Senior Loans had an original principal balance of $1,406,700,000 and have an outstanding principal balance as of the Cut-off Date of $1,406,700,000. The Aventura Mall B Notes had an original principal balance of $343,300,000 and have an outstanding principal balance as of the Cut-off Date of $343,300,000.
THE INFORMATION IN THIS STRUCTURAL AND COLLATERAL TERM SHEET IS NOT COMPLETE AND MAY BE AMENDED PRIOR TO THE TIME OF SALE. THIS TERM SHEET IS NOT AN OFFER TO SELL THESE SECURITIES AND IT IS NOT A SOLICITATION OF AN OFFER TO BUY THESE SECURITIES IN ANY JURISDICTION WHERE THE OFFER OR SALE IS NOT PERMITTED.
46
AVENTURA MALL
The Aventura Mall Whole Loan had an initial term of 120 months, has a remaining term of 117 months as of the Cut-off Date, and requires payments of interest-only through the loan term. The Aventura Mall Whole Loan matures on July 1, 2028.
Note A-2-D-3, which will be contributed to the WFCM 2018-C47 securitization trust, had an original principal balance of $50,000,000, has an outstanding principal balance as of the Cut-off Date of $50,000,000 and represents a non-controlling interest in the Aventura Mall Whole Loan.
Of the remaining Aventura Mall Senior Loans (collectively, the “Aventura Mall Non-ServicedPari Passu Companion Loans”), the Aventura Mall Non-Serviced Pari Passu Companion Loans evidenced by the controlling Notes A-1-A, A-1-B, A-1-C, and A-1-D had an original principal balance of $406,700,000, have an outstanding principal balance as of the Cut-off Date of $406,700,000, and were contributed to the Aventura Mall Trust 2018-AVM securitization trust. The Aventura Mall Whole Loan will be serviced pursuant to the trust and servicing agreement for the Aventura Mall Trust 2018-AVM securitization trust.
The remaining Aventura Mall Non-ServicedPari Passu Companion Loans, which had an aggregate original principal balance of $950,000,000 and have an aggregate outstanding principal balance as of the Cut-off Date of $950,000,000, (i) have been contributed to securitization trusts, or (ii) are expected to be contributed to future securitization trusts, or (iii) may be otherwise transferred at any time. See the Note Summary table below. See “Description of the Mortgage Pool—The Whole Loans—The AB Whole Loans—The Aventura Mall Whole Loan” and “Pooling and Servicing Agreement” in the Preliminary Prospectus.
Note Summary
| Notes | Original Balance | Note Holder | Controlling Interest(2) | |
| Aventura Mall Mortgage Loan | ||||
| A-2-D-3 | $50,000,000 | WFCM 2018-C47 | No | |
| Aventura Mall Non-ServicedPari Passu Companion Loans | ||||
| A-1-A, A-1-B, A-1-C, A-1-D | $406,700,000 | Aventura Mall Trust 2018-AVM | Yes | |
| A-2-A-1, A-2-B-3 | $115,000,000 | Benchmark 2018-B4 | No | |
| A-2-A-4, A-2-B-4 | $110,000,000 | Benchmark 2018-B6 | No | |
| A-2-A-2, A-2-B-2-A | $103,000,000 | Benchmark 2018-B5 | No | |
| A-2-C-2, A-2-D-1 | $100,000,000 | BANK 2018-BNK14 | No | |
| A-2-B-1 | $60,000,000 | CD 2018-CD7 | No | |
| A-2-D-2 | $50,000,000 | CSAIL 2018-CX12 | No | |
| A-2-C-1, A-2-C-3, A-2-C-4, A-2-C-5 | $170,000,000 | MS | No | |
| A-2-A-3, A-2-A-5 | $125,000,000 | JPMCB | No | |
| A-2-D-4, A-2-D-5 | $70,000,000 | WFB | No | |
| A-2-B-2-B, A-2-B-2-C, A-2-B-5 | $47,000,000 | DBNY | No | |
| Aventura Mall B Notes | ||||
| B-1, B-2, B-3, B4(1) | $343,300,000 | Aventura Mall Trust 2018-AVM | No | |
| Total | $1,750,000,000 | |||
| (1) | The B-Notes are subordinate to the A-Notes. |
| (2) | All notesheld under Aventura Mall Trust 2018-AVM together constitute the controlling noteholders for the Aventura Mall Whole Loan. |
Following the lockout period, on any date before January 1, 2028, the borrower has the right to defease the Aventura Mall Whole Loan in whole, but not in part. In addition, the Aventura Mall Whole Loan is prepayable without penalty on or after January 1, 2028. The lockout period will expire on the earlier to occur of (i) two years after the closing date of the securitization that includes the last note to be securitized and (ii) August 1, 2021.
Sources and Uses
| Sources | Uses | |||||||
| Original whole loan amount | $1,750,000,000 | 100.0% | Loan payoff(1) | $1,230,695,723 | 70.3% | |||
| Construction loan payoff(2) | 200,853,019 | 11.5 | ||||||
| Upfront reserves | 26,168,910 | 1.5 | ||||||
| Closing costs | 13,967,630 | 0.8 | ||||||
| Return of equity | 278,314,718 | 15.9 | ||||||
| Total Sources | $1,750,000,000 | 100.0% | Total Uses | $1,750,000,000 | 100.0% |
| (1) | The Aventura Mall Property was previously securitized in the AVMT 2013-AVM transaction. |
| (2) | The Borrower Sponsors spent approximately $230.0 million completing a 225,641 square foot expansion (the “Expansion Parcel”) of the Aventura Mall Property. |
THE INFORMATION IN THIS STRUCTURAL AND COLLATERAL TERM SHEET IS NOT COMPLETE AND MAY BE AMENDED PRIOR TO THE TIME OF SALE. THIS TERM SHEET IS NOT AN OFFER TO SELL THESE SECURITIES AND IT IS NOT A SOLICITATION OF AN OFFER TO BUY THESE SECURITIES IN ANY JURISDICTION WHERE THE OFFER OR SALE IS NOT PERMITTED.
47
AVENTURA MALL
The Property.Aventura Mall is an approximately 2.2 million square foot, super regional mall that was developed by Turnberry in 1983 and subsequently expanded and renovated in 1997, 2008 and 2017. Of the 2.2 million square feet, 1,217,508 square feet serves as collateral for the Aventura Mall Whole Loan, which also includes four anchor pad sites ground leased from the Aventura Mall Borrower (as defined below). The collateral does not include 942,842 square feet of tenant-owned anchor improvements on those sites.
The Aventura Mall Property is located approximately 17 miles from downtown Miami and is surrounded by master-planned residential areas including Turnberry Isle, Porto Vita and the Waterways of Biscayne Bay. Aventura Mall is the largest mall in Florida and the third largest mall in the United States. According to the appraisal, the Aventura Mall is the second most-visited shopping center in the United States with more than 28 million annual visitors. The Aventura Mall is anchored by a number of traditional mall anchors, including Macy’s, Bloomingdale’s, Macy’s Men’s & Home, Nordstrom and J.C. Penney Co., as well as a number of non-traditional mall anchors. The Aventura Mall has a mix of luxury, bridge to luxury and mass market tenants that appeal to a variety of shoppers.
The Aventura Mall Property is currently 92.8% leased as of February 14, 2018. According to the appraisal, the Aventura Mall Property is one of the top-performing malls in the U.S., with comparable in-line sales of $1,681 per square feet and total gross reported sales of approximately $1.2 billion as of the trailing twelve months ending February 2018.
In November 2017, the borrower sponsors opened a new 225,641 square foot Expansion Parcel at a cost of approximately $230.0 million, which is included in the collateral for the Aventura Mall Whole Loan. The Expansion Parcel features a 20,218 square foot, two-level Apple store along with Tesla, Topshop, Zara, Serafina and Shake Shack. The Expansion Parcel is 72.2% leased as of February 14, 2018.
The Aventura Mall is anchored by six tenants which combined generate approximately $298.9 million in annual sales as of TTM February 2018. The anchors include a collateral J.C. Penney and AMC Theaters and four ground lease anchors (as to which the related improvements are not collateral): Macy’s, Bloomingdales, Macy’s (Men’s & Home) and Nordstrom.
J.C. Penney Co. occupies a 193,759 square foot store (15.9% of net rentable area, 0.5% of underwritten base rent) under an initial lease dated April 27, 1983, expiring on April 30, 2023 and renewed eight times, with no renewal options remaining. J.C. Penney Co. was not required to report sales at the Aventura Mall Property. AMC Theaters occupies a 78,738 square foot theatre unit (6.5% of net rentable area, 1.3% of underwritten base rent) under an initial lease dated August 7, 1998, expiring on August 31, 2023 and had renewed one time, leaving three five year renewal options remaining. AMC Theaters achieved annual sales of $16.9 million as of TTM February 2018. The Aventura Mall’s non-collateral ground lease anchors are Macy’s (two stores – 524,011 square feet), Bloomingdale’s (251,831 square feet), and Nordstrom (167,000 square feet) that each owns their own improvements and leases the related land under a ground lease. The operating covenants for J.C. Penney Co., Macy’s, and Bloomingdales have terminated. Generally, the operating covenants of the anchors have expired, or the anchors are not required to operate.
The following table presents a summary of historical anchor sales at the Aventura Mall Property:
Historical Anchor Sales PSF(1)
| Tenant Name | Tenant NRSF | 2015 | 2016 | 2017 |
TTM February 2018 |
Macy’s (Ground Lease) (Non-Collateral) | 299,011 | $322 | $294 | $268 | $271 |
Bloomingdales (Ground Lease) (Non-Collateral) | 251,831 | $509 | $440 | $413 | $418 |
Macy’s (Men’s & Home) (Ground Lease) (Non-Collateral) | 225,000 | $226 | $199 | $184 | $187 |
| J.C. Penney Co. | 193,759 | NAV | NAV | NAV | NAV |
Nordstrom (Ground Lease) (Non-Collateral) | 167,000 | $414 | $331 | $316 | $321 |
| AMC Theatres | 78,738 | $258 | $238 | $213 | $215 |
| Total | 1,215,339 | $357 | $311 | $289 | $293 |
| (1) | Historical Sales PSF information is estimated and as provided by the borrower sponsor. |
THE INFORMATION IN THIS STRUCTURAL AND COLLATERAL TERM SHEET IS NOT COMPLETE AND MAY BE AMENDED PRIOR TO THE TIME OF SALE. THIS TERM SHEET IS NOT AN OFFER TO SELL THESE SECURITIES AND IT IS NOT A SOLICITATION OF AN OFFER TO BUY THESE SECURITIES IN ANY JURISDICTION WHERE THE OFFER OR SALE IS NOT PERMITTED.
48
AVENTURA MALL
The following table presents certain information relating to the tenancy at the Aventura Mall Property:
Major Tenants
| Tenant Name | Credit Rating (Fitch/Moody’s/S&P)(1) | Tenant NRSF | % of NRSF | Annual U/W Base Rent PSF(2) | Annual U/W Base Rent(2) | % of Total Annual U/W Base Rent | Sales PSF(3) | Occupancy Cost(3) | Lease Expiration Date |
| Non-Collateral Anchor Tenants | |||||||||
Macy’s | BBB/Baa3/BBB- | 299,011 | NAV | NAV | $168,480 | 0.1% | $271 | NAV | 7/31/2029 |
Bloomingdales | BBB/Baa3/BBB- | 251,831 | NAV | NAV | $150,000 | 0.1% | $418 | NAV | 2/5/2033 |
Macy’s (Men’s & Home) | BBB/Baa3/BBB- | 225,000 | NAV | NAV | $150,000 | 0.1% | $187 | NAV | 2/3/2035 |
Nordstrom | BBB+/Baa1/BBB+ | 167,000 | NAV | NAV | $800,000 | 0.6% | $321 | NAV | 2/28/2023 |
| Total Non-Collateral Anchor Tenants | $1,268,480 | 0.9% | |||||||
| Major Tenants | |||||||||
| J.C. Penney Co. | B/B3/B- | 193,759 | 15.9% | $3.41 | $661,053 | 0.5% | NAV | NAV | 4/30/2023 |
| AMC Theatres(4) | B/B2/B+ | 78,738 | 6.5% | $23.50 | $1,850,343 | 1.3% | $703,921 | 10.6% | 8/31/2023(5) |
| Zara(6)(7) | NR/NR/NR | 34,454 | 2.8% | $119.58 | $4,120,000 | 2.9% | $971 | 16.3% | 10/31/2029 |
| XXI Forever | NR/NR/NR | 32,504 | 2.7% | $75.82 | $2,464,387 | 1.7% | $381 | 22.6% | 1/31/2019 |
| H & M | NR/NR/NR | 28,830 | 2.4% | $117.09 | $3,375,705 | 2.4% | $666 | 18.4% | 1/31/2027 |
| Equinox Fitness | NR/NR/NR | 25,458 | 2.1% | $28.56 | $727,192 | 0.5% | $174 | 18.4% | 1/31/2024(8) |
| Topshop | NR/NR/NR | 23,296 | 1.9% | $122.00 | $2,842,112 | 2.0% | NAV | NAV | 10/31/2029 |
| Apple (2 Levels)(6)(9) | NR/Aa1/AA+ | 20,218 | 1.7% | $173.11 | $3,500,000 | 2.5% | $31,124 | 0.5% | 1/31/2030 |
| Victoria's Secret | NR/NR/NR | 18,387 | 1.5% | $165.00 | $3,033,855 | 2.1% | $1,041 | 12.7% | 7/31/2026 |
| Louis Vuitton | NR/NR/A+ | 18,180 | 1.5% | $110.00 | $1,999,800 | 1.4% | $1,989 | 7.8% | 11/30/2022(10) |
| Banana Republic | BB+/Baa2/BB+ | 16,857 | 1.4% | $175.05 | $2,950,818 | 2.1% | $580 | 37.8% | 2/29/2020 |
| Restoration Hardware | NR/NR/NR | 11,988 | 1.0% | $200.17 | $2,399,638 | 1.7% | $2,150 | 11.4% | 2/28/2019 |
| Urban Outfitters | NR/NR/NR | 11,638 | 1.0% | $50.76 | $590,785 | 0.4% | $644 | 11.0% | 12/31/2023 |
| Express | NR/NR/NR | 11,320 | 0.9% | $145.75 | $1,649,890 | 1.2% | $641 | 28.7% | 1/31/2022 |
| Abercrombie & Fitch | NR/NR/BB- | 11,246 | 0.9% | $281.38 | $3,164,399 | 2.2% | $1,555 | 20.9% | 1/31/2020 |
| Anthropologie | NR/NR/NR | 11,089 | 0.9% | $60.82 | $674,444 | 0.5% | $624 | 16.5% | 6/30/2019 |
| The Gap | BB+/Baa2/BB+ | 11,065 | 0.9% | $165.00 | $1,825,725 | 1.3% | NAV | NAV | 7/31/2024 |
| Grand Lux Café | NR/NR/NR | 10,442 | 0.9% | $47.00 | $490,774 | 0.3% | $631 | 14.1% | 3/31/2027 |
| The Cheesecake Factory | NR/NR/NR | 10,421 | 0.9% | $81.33 | $847,488 | 0.6% | $1,723 | 6.8% | 6/30/2023 |
| Calvin Klein | NR/NR/NR | 10,280 | 0.8% | $95.61 | $982,844 | 0.7% | $555 | 25.8% | 1/31/2019 |
| Total Major Tenants | 590,170 | 48.5% | $68.03(11) | $40,151,252 | 28.3% | ||||
| Non-Major Tenants | 539,111 | 44.3% | $185.90 | $100,218,462 | 70.8% | ||||
| Occupied Collateral Total | 1,129,281 | 92.8% | $125.42 | $141,638,194 | 100.0% | ||||
| Vacant Space | 88,227 | 7.2% | |||||||
| Collateral Total | 1,217,508 | 100.0% | |||||||
| (1) | Certain ratings are those of the parent company whether or not the parent company guarantees the lease. |
| (2) | Annual U/W Base Rent PSF and Annual U/W Base Rent include the following: (a) in-place leases based on the February 2018 rent roll, (b) contractual rent steps of $6.5 million through June 2019, including the $1.4 million contractual rent step that is scheduled to occur in August 2019 for the executed renewal of Victoria's Secret (included in the Free Rent/Gap Reserve), and (c) ground rent in an amount of approximately $1.3 million for tenants that own their improvements (Macy's, Bloomingdale's, Macy's Men's & Home, and Nordstrom). |
| (3) | Sales PSF and Occupancy Cost are for the trailing 12-month period ending February 28, 2018. |
| (4) | AMC Theatres Sales PSF shown are per screen and based on the tenant’s current 24 screens. |
| (5) | AMC Theatres as three, five-year renewal options, with nine months’ notice, at rental rates as specified in the lease. |
| (6) | A full year of sales and occupancy costs are not available for Expansion Parcel tenants Zara and Apple. |
| (7) | Zara was a tenant in the existing Aventura Mall, occupying 18,717 square feet, before departing for Bal Harbour Shops in 2012. Zara has since returned to the Aventura Mall Property and opened in the Expansion Parcel in November 2017. Zara’s Sales PSF are based on the tenant's annualized sales from November 2017 through April 2018. |
| (8) | Equinox Fitness has two, five-year renewal options, with six months’ notice, at rental rates as specified in the lease. |
| (9) | Apple’s Sales PSF are based on the tenant's 6,303 square foot space in the pre-existing portion of the Aventura Mall Property. Apple recently executed a lease for 20,218 square feet at the Expansion Parcel. |
| (10) | Louis Vuitton has one, five-year renewal option, with six months’ notice, at a rental rate as specified in the lease. |
| (11) | Annual U/W Base Rent PSF for Total Major Tenants excludes Annual U/W Base Rent related to the Non-Collateral Anchor Tenants, which are on ground leases and own its improvements with no attributed square footage. |
THE INFORMATION IN THIS STRUCTURAL AND COLLATERAL TERM SHEET IS NOT COMPLETE AND MAY BE AMENDED PRIOR TO THE TIME OF SALE. THIS TERM SHEET IS NOT AN OFFER TO SELL THESE SECURITIES AND IT IS NOT A SOLICITATION OF AN OFFER TO BUY THESE SECURITIES IN ANY JURISDICTION WHERE THE OFFER OR SALE IS NOT PERMITTED.
49
AVENTURA MALL
The following table presents certain information relating to the lease rollover schedule at the Aventura Mall Property:
Lease Expiration Schedule(1)(2)
Year Ending December 31, | No. of Leases Expiring(3) | Expiring NRSF | % of Total NRSF | Cumulative Expiring NRSF | Cumulative % of Total NRSF | Annual U/W Base Rent(4)(5) | % of Total Annual U/W Rent | Annual U/W Base Rent PSF(4)(5) |
| MTM(6) | 25 | 20,093 | 1.7% | 20,093 | 1.7% | $2,497,856 | 1.8% | $124.31 |
| 2018 | 23 | 41,733 | 3.4% | 61,826 | 5.1% | $5,988,502 | 4.2% | $143.50 |
| 2019 | 32 | 124,307 | 10.2% | 186,133 | 15.3% | $14,841,136 | 10.5% | $119.39 |
| 2020 | 36 | 96,193 | 7.9% | 282,326 | 23.2% | $18,375,213 | 13.0% | $191.02 |
| 2021 | 24 | 54,397 | 4.5% | 336,723 | 27.7% | $13,685,691 | 9.7% | $251.59 |
| 2022 | 24 | 76,594 | 6.3% | 413,317 | 33.9% | $12,967,832 | 9.2% | $169.31 |
| 2023 | 29 | 352,941 | 29.0% | 766,258 | 62.9% | $16,933,820 | 12.0% | $47.98 |
| 2024 | 27 | 79,905 | 6.6% | 846,163 | 69.5% | $13,311,865 | 9.4% | $166.60 |
| 2025 | 13 | 19,020 | 1.6% | 865,183 | 71.1% | $5,163,035 | 3.6% | $271.45 |
| 2026 | 9 | 46,368 | 3.8% | 911,551 | 74.9% | $7,858,163 | 5.5% | $169.47 |
| 2027 | 20 | 78,035 | 6.4% | 989,586 | 81.3% | $10,641,238 | 7.5% | $136.36 |
| 2028 | 13 | 41,146 | 3.4% | 1,030,732 | 84.7% | $6,126,042 | 4.3% | $148.89 |
| 2029 & Beyond(7) | 13 | 98,549 | 8.1% | 1,129,281 | 92.8% | $13,247,802 | 9.4% | $134.43 |
| Vacant | 0 | 88,227 | 7.2% | 1,217,508 | 100.0% | $0 | 0.0% | $0.00 |
| Total/Weighted Average | 288 | 1,217,508 | 100.0% | $141,638,194 | 100.0% | $125.42 |
| (1) | Information is based on the underwritten rent roll. |
| (2) | Certain tenants may have lease termination options that are exercisable prior to the originally stated expiration date of the subject lease and that are not considered in the Lease Expiration Schedule. |
| (3) | No. of Leases Expiring excludes approximately 30 temporary/kiosk tenants who operate under short-term leases. |
| (4) | Weighted Average Annual U/W Base Rent and Weighted Average Annual U/W Base Rent PSF exclude vacant space. |
| (5) | Annual U/W Base Rent and Annual U/W Base Rent PSF reflect the following: (a) in-place leases based on the February 2018 rent roll, (b) contractual rent steps of $6.5 million through June 2019 including the $1.4 million contractual rent step that is scheduled to occur in August 2019 for the executed renewal of Victoria's Secret (included in the free rent/gap reserve) and (c) ground rent in an amount of approximately $1.3 million for tenants that own their improvements (Macy's, Bloomingdale's, Macy's Men's & Home and Nordstrom). |
| (6) | MTM includes temporary tenants. |
| (7) | 2029 & Beyond includes the square footage attributable to the recently executed Apple lease and lease expiration for the Expansion Parcel. |
The following table presents historical occupancy percentages at the Aventura Mall Property:
Historical Occupancy(1)
2008(2) | 2009 | 2010 | 2011 | 2012 | 2013 | 2014 | 2015 | 2016 | 2017 | 2/14/2018(1) | ||||||||||||
| Occupancy - Excluding Anchors | 84.1% | 94.9% | 95.2% | 96.6% | 94.9% | 98.9% | 97.8% | 97.8% | 97.3% | 97.7% | 91.4% | |||||||||||
| Occupancy - Including Anchors | 93.3% | 98.1% | 98.2% | 98.8% | 98.2% | 99.6% | 99.2% | 99.2% | 99.1% | 99.1% | 92.8% |
| (1) | Historical Occupancy is based on the average of each respective year. Current occupancy is based on the February 14, 2018 rent roll, including recently executed leases and master leased tenants. |
| (2) | In 2008, occupancy declined due to a challenging corporate environment for several tenants including Stride Rite, Kay Bee Toys, The Sharper Image, Walden Books and Sigrid Olsen. 2008 occupancy as of December 31, 2008 was 87.9% and 96.1% for Occupancy – Excluding Anchors and Occupancy – Including Anchors, respectively. |
THE INFORMATION IN THIS STRUCTURAL AND COLLATERAL TERM SHEET IS NOT COMPLETE AND MAY BE AMENDED PRIOR TO THE TIME OF SALE. THIS TERM SHEET IS NOT AN OFFER TO SELL THESE SECURITIES AND IT IS NOT A SOLICITATION OF AN OFFER TO BUY THESE SECURITIES IN ANY JURISDICTION WHERE THE OFFER OR SALE IS NOT PERMITTED.
50
AVENTURA MALL
Operating History and Underwritten Net Cash Flow. The following table presents certain information relating to the underwritten net cash flow at the Aventura Mall Property:
Cash Flow Analysis(1)
| 2015 | 2016 | 2017 |
3/31/2018 TTM(1) | U/W(1) | U/W $ per SF | ||||||||
| Base Rent | $99,418,818 | $103,197,968 | $106,500,453 | $109,896,747 | $141,638,194 | $116.33 | |||||||
| Vacant Income | 0 | 0 | 0 | 0 | 13,640,745 | 11.20 | |||||||
| Percentage Rent | 5,466,448 | 4,115,391 | 3,447,721 | 3,326,930 | 3,627,027 | 2.98 | |||||||
| Total Recoveries | 26,727,546 | 26,287,600 | 27,329,454 | 28,195,516 | 32,253,113 | 26.49 | |||||||
| Specialty Leasing Income | 3,536,265 | 3,076,589 | 4,453,595 | 4,900,785 | 3,805,199 | 3.13 | |||||||
| Other Income(2) | 3,628,986 | 3,701,438 | 3,994,113 | 4,090,769 | 4,156,114 | 3.41 | |||||||
| Less Vacancy & Credit Loss | (272,229) | (422,401) | (438,454) | (634,418) | (13,640,745)(3) | (11.20)(3) | |||||||
| Effective Gross Income | $138,505,834 | $139,956,585 | $145,286,882 | $149,776,330 | $185,479,647 | $152.34 | |||||||
| Total Operating Expenses | $29,480,495 | $29,303,182 | $30,046,320 | $31,484,933 | $30,620,668 | $25.15 | |||||||
| Net Operating Income | $109,025,339 | $110,653,403 | $115,240,562 | $118,291,397 | $154,858,979 | $127.19 | |||||||
| Capital Expenditures | 0 | 0 | 0 | 0 | 243,502 | $0.20 | |||||||
| TI/LC | 0 | 0 | 0 | 0 | 3,043,770 | $2.50 | |||||||
| Net Cash Flow | $109,025,339 | $110,653,403 | $115,240,562 | $118,291,397 | $151,571,708 | $124.49 | |||||||
| NOI DSCR(4) | 1.85x | 1.88x | 1.96x | 2.01x | 2.63x | ||||||||
| NCF DSCR(4) | 1.85x | 1.88x | 1.96x | 2.01x | 2.58x | ||||||||
| NOI Debt Yield(4) | 7.8% | 7.9% | 8.2% | 8.4% | 11.0% | ||||||||
| NCF Debt Yield(4) | 7.8% | 7.9% | 8.2% | 8.4% | 10.8% |
| (1) | The increase in Base Rent and Net Operating Income from 3/31/2018 TTM to U/W is primarily driven by the inclusion of the executed leases on the new Expansion Parcel, which opened in November 2017, and is based on the February 2018 annualized rent roll. Base Rent also includes $1.3 million of ground rent paid by Bloomingdales, Macy's, Macy's Men's & Home, and Nordstrom and approximately $3.4 million of master lease rent for current leases that are out for signature. Contractual rent steps were underwritten through June 2019 totaling approximately $6.5 million, including the $1.4 million contractual rent step for the executed renewal of Victoria's Secret that is scheduled to occur in August 2019 (included in the free rent/gap reserve). |
| (2) | Other Income includes fee income (revenues associated with license fees and valet management fees), and miscellaneous revenues (revenues associated with commissions, late charges, and other miscellaneous sources). |
| (3) | The underwritten economic vacancy is 7.1%. The Aventura Mall Properties were 92.8% leased as of February 14, 2018, which includes 33,813 square feet to be leased by 12 tenants with leases out for signature that are covered under a master lease. |
| (4) | The debt service coverage ratios and debt yields shown are based on the Aventura Mall Senior Loans. |
Appraisal. As of the appraisal valuation date of April 16, 2018, the Aventura Mall Property had an “as-is” appraised value of $3,450,000,000.
Environmental Matters. According to a Phase I environmental site assessment dated April 27, 2018, there was no evidence of any recognized environmental conditions at any of the Aventura Mall Property.
Market Overview and Competition.The Aventura Mall Property is located in Aventura, Miami Dade County, Florida, approximately 11 miles north of the Miami central business district and 11 miles south of the Fort Lauderdale central business district. Regional access to the Aventura Mall Property is provided by I-95 and Biscayne Boulevard (U.S. Highway 1). The William Lehman Causeway, which connects the beach areas with U.S. Highway 1, also provides access to the Aventura Mall. The Aventura Mall Property is located approximately 17 miles from downtown Miami and is surrounded by Turnberry Isle, Porto Vita and the Waterways of Biscayne Bay. According to the appraisal, as of year-end 2017, Aventura Mall’s local trade area within a 15 mile radius is home to over 2.3 million people with an average income of $66,306.
According to the appraisal, the estimated 2017 population within a one -, three- and five-mile radius of the Aventura Mall Property was 25,173, 188,456, and 414,744, respectively. The estimated 2017 average household income within a one-, three- and five-mile radius was $86,750, $72,828, and $66,753, respectively. The appraiser considers the 15-mile radius to be the Aventura Mall Property’s primary trade area. From 2000 to 2017, the one-mile radius trade area experienced compound annual growth in population of 2.2% and in average household income of 1.3%. The primary trade area had 2017 average retail sales per household of $48,617.
The Aventura Mall Property is a part of the Miami submarket of the Miami retail market. The Miami submarket contains approximately 5.6 million SF of retail space which as of the year-end 2017 had a vacancy rate of 7.1% and asking rents of $30.88 PSF.
THE INFORMATION IN THIS STRUCTURAL AND COLLATERAL TERM SHEET IS NOT COMPLETE AND MAY BE AMENDED PRIOR TO THE TIME OF SALE. THIS TERM SHEET IS NOT AN OFFER TO SELL THESE SECURITIES AND IT IS NOT A SOLICITATION OF AN OFFER TO BUY THESE SECURITIES IN ANY JURISDICTION WHERE THE OFFER OR SALE IS NOT PERMITTED.
51
AVENTURA MALL
The following table presents certain information relating to comparable properties to the Aventura Mall Property:
Comparable Properties(1)
| Property, Location | Type | Year Built/ Renovated | Size (SF) | Occ. | Sales PSF | Anchor Tenants |
Distance to Subject (miles) |
Aventura Mall Property Aventura, FL | Super Regional Mall | 1983 / 2017 | 2,156,203 | 92.8%(2) | $1,681(3) | Macy’s (non-collateral), JC Penney, Bloomingdales (non-collateral), Macy’s Men’s & Home (non-collateral), Nordstrom (non-collateral) | NAP |
| Primary Competition | |||||||
| Bal Harbour Shops Bal Harbour, FL | Regional Center | 1965 / 2008 | 460,000 | 99% | $2,200 | Neiman Marcus, Saks Fifth Avenue | 4.7 |
| Sawgrass Mills Sunrise, FL | Super Regional Mall | 1990 / 2006 | 2,384,000 | 89% | $1,100 | Super Target, Bloomingdales Outlet, Neiman Marcus Last Call, Nordstrom Rack, Saks Off Fifth, Burlington, Dick’s Sporting Goods | 19.0 |
| Dadeland Mall Kendall, FL | Super Regional Mall | 1962 / 2013 | 1,488,000 | 95% | $1,400 | J.C. Penney Co., Macy’s, Nordstrom, Saks Fifth Avenue | 22.0 |
| Secondary Competition | |||||||
| Pembroke Lakes Mall Pembroke Pines, FL | Super Regional Mall | 1992 / 1998 | 1,136,000 | 96% | $490 | Dillard’s, Dillard’s Men’s & Home, Macy’s, Macy’s Home Store, J.C. Penney Co., Sears | 11.0 |
| Galleria Mall Fort Lauderdale, FL | Super Regional Mall | 1980 / 2005 | 955,000 | 80% | $870 | Dillard’s, Macy’s, Neiman Marcus | 13.0 |
| Dolphin Mall Miami, FL | Super Regional Mall | 2001 / 2010 | 1,403,000 | 97% | $950 | Burlington, Bass Pro Outdoor World, Bloomingdale’s Outlet, Cobb Theater | 16.0 |
| (1) | Information obtained from the appraisal. |
| (2) | Occupancy as of February 14, 2018 includes 12 tenants (33,813 SF) with leases out for signature that are covered under a master lease. |
| (3) | Comparable inline sales shown as of February 28, 2018 including Apple. |
The Borrower.The borrower for the Aventura Mall Whole Loan is Aventura Mall Venture, a Florida general partnership structured to be a bankruptcy remote entity with two independent directors in its organizational structure (the “Aventura Mall Borrower”). Legal counsel to the borrower delivered a non-consolidation opinion in connection with the origination of the Aventura Mall Whole Loan.
The Borrower Sponsors.The borrower sponsors and nonrecourse carveout guarantors are Jacquelyn Soffer and Jeffrey Soffer (the “Turnberry Guarantors”) and Simon Property Group, L.P. (the “Simon Guarantor”, and together with the Turnberry Guarantors, the “Non-Recourse Carveout Guarantors”). The liability of the Non-Recourse Carveout Guarantors for breaches or violations of the non-recourse carveout provisions in the loan documents is capped at $350.0 million plus all reasonable, out-of-pocket costs and expenses (including, but not limited to, court costs and fees and reasonable attorney’s fees) incurred by the lender in connection with the enforcement of, or preservation of the lender’s rights under the guaranty. The liability as between the Turnberry Guarantors and the Simon Guarantor will be several but not joint.
The Turnberry Guarantors have been involved in various litigation proceedings and foreclosures, including various litigation matters involving claims resulting from the Fontainebleau Las Vegas project filing for Chapter 11 bankruptcy protection in mid-2009. The majority of lawsuits related to the Fontainebleau Las Vegas project were settled in 2013, with a global settlement reached in 2014 and fully documented and dismissed in 2015. In addition, the Turnberry Guarantors were involved in the foreclosure of a shopping center in 2011. See “Description of the Mortgage Pool—Loan Purpose; Default History, Bankruptcy Issues and Other Proceedings” in the Preliminary Prospectus.
Escrows.The Aventura Mall Whole Loan documents provide for upfront reserves of $6,776,765 for certain free rent credits remaining in connection with certain leases at the Aventura Mall Property and $19,392,145 for certain outstanding tenant improvement and leasing costs due in connection with certain leases at the Aventura Mall Property.
If the debt service coverage ratio (as calculated pursuant to the loan agreement based on the trailing four quarters) falls below 1.50x for two consecutive calendar quarters (among other conditions in certain cases), the Aventura Mall Borrower is required to deposit monthly escrows for real estate taxes in the amount of 1/12 of projected annual property taxes, insurance premiums in the amount of 1/12 of projected annual insurance premiums (also waived if a blanket policy is in place and there is no event of default continuing), replacement funds (approximately $20,292 monthly (or $0.20 PSF annually), subject to a cap of $487,003) and tenant rollover funds (approximately $253,648 monthly (or $2.50 PSF annually), subject to a cap of $6,087,540).
THE INFORMATION IN THIS STRUCTURAL AND COLLATERAL TERM SHEET IS NOT COMPLETE AND MAY BE AMENDED PRIOR TO THE TIME OF SALE. THIS TERM SHEET IS NOT AN OFFER TO SELL THESE SECURITIES AND IT IS NOT A SOLICITATION OF AN OFFER TO BUY THESE SECURITIES IN ANY JURISDICTION WHERE THE OFFER OR SALE IS NOT PERMITTED.
52
AVENTURA MALL
Lockbox and Cash Management.The Aventura Mall Whole Loan is structured with a hard lockbox and springing cash management for all rents except rents from the Master Lease (as defined below), which are structured with a soft springing hard lockbox. The Aventura Mall Borrower is required to cause all Master Lease rents to be deposited directly into the lockbox account, while for remaining rents, the Aventura Mall Borrower is required to notify each tenant under each lease (except the Master Lease) that has not received instructions from the Aventura Mall Borrower to send all payments of rents directly to the lender-controlled lockbox account. Provided no Lockbox Event (as defined below) has occurred, all sums in the lockbox account are required to be transferred daily to an account designated by the Aventura Mall Borrower. In the event a Lockbox Event has occurred and is continuing, all funds in the lockbox account are required to be swept weekly into a cash management account controlled by the lender. In the event a Lockbox Event is caused only by the occurrence of a DSCR Trigger Event (as defined below), all funds in the cash management account are required to be applied by the lender each business day to payments of taxes, insurance, debt service, operating expenses, capital expenditure reserves and any remaining funds in the cash management account are required to be released to the Aventura Mall Borrower only to the extent necessary to reimburse the Aventura Mall Borrower for extraordinary expenses approved by the lender. All additional funds in the cash management account are required to be held by the lender as additional collateral for the Aventura Mall Whole Loan. In the event any Lockbox Event other than a DSCR Trigger Event has occurred and is continuing, all amounts in the cash management account may be applied in the lender’s sole discretion. In addition, following the occurrence and during the continuance of a Lockbox Event or a DSCR Trigger Event, all Master Lease rents are also required to be deposited directly into the lockbox account.
A “Lockbox Event” will commence upon the earliest of the following:
| (i) | the occurrence and continuance of an event of default; |
| (ii) | the bankruptcy or insolvency of the Aventura Mall Borrower; |
| (iii) | the bankruptcy or insolvency of the property manager except where such bankruptcy or insolvency does not result in the cash or bank accounts associated with the Aventura Mall Property being subsumed in such proceedings or result in a material adverse effect upon the operations of the Aventura Mall Property or the value or security of the lender’s lien; or |
| (iv) | the Aventura Mall Whole Loan debt service coverage ratio (based on the trailing four calendar quarters) falling below 1.35x for two consecutive quarters. |
A Lockbox Event will end upon the occurrence of the following, upon:
| ● | with regard to clause (i) above, the cure of such event of default; |
| ● | with regard to clause (ii) above, the bankruptcy or insolvency proceedings having terminated; |
| ● | with regard to clause (iii) above, (a) the bankruptcy or insolvency proceedings having terminated or (b) a new approved property manager being appointed in accordance with the loan documents; or |
| ● | with regard to clause (iv) above, the Aventura Mall Whole Loan debt service coverage ratio (based on the trailing four calendar quarters) being equal to or greater than 1.35x for two consecutive calendar quarters. |
Property Management. The Aventura Mall Property is managed by TB All Fees Operating LP, an affiliate of the borrower.
Assumption. The borrower has the right to transfer the Aventura Mall Property, provided that certain conditions are satisfied, including (i) no event of default has occurred and is continuing; (ii) the lender has reasonably determined that the proposed transferee and guarantor satisfy the lender’s credit review and underwriting standards, taking into consideration of the transferee’s experience, financial strength and general business standing; and (iii) if required by the lender, rating agency confirmation from DBRS, Fitch and Moody’s that the transfer will not result in a downgrade, withdrawal or qualification of the respective ratings assigned to the Series 2018-C47 Certificates and similar confirmations from each rating agency rating any securities backed by the Aventura Mall Companion Loans with respect to the ratings of such securities.
Partial Release. The borrower is permitted to (a) obtain the release of (i) immaterial or non-income producing portions of the Aventura Mall Property to any federal, state or local government or any political subdivision thereof in connection with takings or condemnations of any portion of the Aventura Mall Property (including portions of the “ring road”) for dedication or public use and (ii) non-income producing portions of the Aventura Mall Property (including, without limitation, certain outparcels containing parking areas and portions of the “ring road”) (by sale, ground lease, sublease or other conveyance of any interest) to third parties or affiliates of the Aventura Mall Borrower, and (b) dedicate portions of the Aventura Mall Property or grant easements, restrictions, covenants, reservations and rights of way in the ordinary course of business for traffic circulation, ingress, egress, parking, access, utilities lines or for other similar purposes.
Real Estate Substitution.Not permitted.
Additional Secured Indebtedness.The Aventura Mall Property also secures the Aventura Mall Non-ServicedPari Passu Companion Loans, which have an aggregate Cut-off Date principal balance of $1,356,700,000 and the Aventura Mall B Notes, which have an aggregate Cut-off Date principal balance of $343,300,000. The Aventura Mall Non-ServicedPari Passu Companion Loans and the Aventura Mall B Notes are coterminous with the Aventura Mall Mortgage Loan. The Aventura Mall Non-ServicedPari PassuCompanion Loans and Aventura Mall B Notes accrue interest at the same rate as the Aventura Mall Mortgage Loan. The Aventura Mall Mortgage Loan and the Aventura Mall Non-ServicedPari Passu Companion Loans are eachpari passu in right of payment and together are senior in right of payment to the Aventura Mall B Notes. The holders of the Aventura Mall Mortgage Loan, the Aventura Mall Non-ServicedPari Passu Companion Loans and the Aventura Mall B Notes have entered into a co-lender agreement which sets forth the allocation of collections on the Aventura Mall Whole Loan. See “Description of the Mortgage Pool—The Whole Loans—The AB Whole Loans—The Aventura Mall Whole Loan” in the Preliminary Prospectus.
THE INFORMATION IN THIS STRUCTURAL AND COLLATERAL TERM SHEET IS NOT COMPLETE AND MAY BE AMENDED PRIOR TO THE TIME OF SALE. THIS TERM SHEET IS NOT AN OFFER TO SELL THESE SECURITIES AND IT IS NOT A SOLICITATION OF AN OFFER TO BUY THESE SECURITIES IN ANY JURISDICTION WHERE THE OFFER OR SALE IS NOT PERMITTED.
53
AVENTURA MALL
Master Lease. The Aventura Mall Borrower entered into a master lease (the “Master Lease”) at origination with the Guarantors and Turnberry Retail Holding, L.P., which Master Lease covers a certain portion (33,813 square feet) of the Aventura Mall Property that is currently not occupied. The Master Lease provides for payment of rent in an annual amount up to $3,426,159 in equal monthly installments of approximately $285,513 each during (x) a period commencing on the occurrence of the debt service coverage ratio based on the trailing four quarters falling below 1.50x for two consecutive quarters until cured in accordance with the loan documents, and/or (y) any of the following (i) an event of default, (ii) bankruptcy of the Aventura Mall Borrower, (iii) bankruptcy of the property manager, or (iv) a period commencing on the occurrence of a Lockbox Event until cured in accordance with the loan documents. The Master Lease covers the spaces for 12 proposed tenants with leases that are out for signature or which were otherwise not occupied prior to the loan origination date. The Master Lease provides for a reduction of rent as third-party tenants sign leases, take occupancy of space and commence paying rent in the premises covered by the Master Lease (as well as tenants signing leases in any portion of the Aventura Mall Property, including the space under the Master Lease, to the extent the total annualized lease payments (excluding Master Lease rents) exceed $178,400,000. The term will expire on the earliest to occur of (a) 10 years after loan maturity, (b) the earlier of the date on which the annual rent under the Master Lease is reduced to zero or the date on which the annualized total lease payments from tenants at the Aventura Mall Property (not including percentage rent) exceeds $181,850,000 or (c) following the exercise of the Master Lessees’ cancellation option after a lender foreclosure or deed-in-lieu of foreclosure. The Master Lease rents equal 1.8% of the approximately $185.5 million of underwritten effective gross income.
Redevelopment Rights. If J.C. Penney Co. or any of Macy’s, Bloomingdales, Macy’s (Men’s & Home) or Nordstrom (each, a “Department Store”) ceases operations or seeks to assign its lease in any manner not expressly permitted thereunder, the Aventura Mall Borrower has the right to enter into a ground lease with a third party or an affiliate of the Aventura Mall Borrower for the related parcel and obtain a release of the lien of the Aventura Mall Whole Loan on the ground leasehold interest in such J.C. Penney Co. or Department Store parcel so long as certain conditions in the loan agreement are satisfied, including (i) the ground lease is in form and substance reasonably acceptable to the lender, including that the rent to be paid thereunder is not less than the rent payable by J.C. Penney Co. or the Department Store immediately prior to such new lease, (ii) the tenant or the guarantor of such ground lease is a creditworthy person acceptable to the lender, (iii) no event of default is continuing, (iv) delivery of a rating agency confirmation, (v) if material work is being performed, delivery of a completion guaranty (or a collateral assignment of a completion guaranty in favor of the Aventura Mall Borrower) from a credit-worthy entity acceptable to the lender, (vi) the term of the ground lease expires no less than 20 years after the maturity of the Aventura Mall Whole Loan, and (vii) compliance with the “anti-poaching” conditions set forth in the loan agreement. In lieu of entering into a new ground lease, the loan documents permit an affiliate of the Aventura Mall Borrower to accept an assignment of the existing leasehold interest, provided that the Aventura Mall Borrower satisfies the requirements in the loan documents including, without limitation, condition (i) above. J.C. Penney Co. has six, five-year renewal options remaining (each requiring 12 months’ notice).
Ground Lease. None.
Terrorism Insurance.The Aventura Mall Whole Loan documents require that the “all risk” insurance policy required to be maintained by the Borrower provides coverage for terrorism in an amount equal to the full replacement cost of the Aventura Mall Property, as well as business interruption insurance covering no less than the 18-month period following the occurrence of a casualty event, together with a 6-month extended period of indemnity (provided that if TRIPRA or a similar statute is not in effect, the Borrower will not be obligated to pay terrorism insurance premiums in excess of two times the premium for the casualty and business interruption coverage on a stand-alone basis).
THE INFORMATION IN THIS STRUCTURAL AND COLLATERAL TERM SHEET IS NOT COMPLETE AND MAY BE AMENDED PRIOR TO THE TIME OF SALE. THIS TERM SHEET IS NOT AN OFFER TO SELL THESE SECURITIES AND IT IS NOT A SOLICITATION OF AN OFFER TO BUY THESE SECURITIES IN ANY JURISDICTION WHERE THE OFFER OR SALE IS NOT PERMITTED.
54
(THIS PAGE INTENTIONALLY LEFT BLANK)
THE INFORMATION IN THIS STRUCTURAL AND COLLATERAL TERM SHEET IS NOT COMPLETE AND MAY BE AMENDED PRIOR TO THE TIME OF SALE. THIS TERM SHEET IS NOT AN OFFER TO SELL THESE SECURITIES AND IT IS NOT A SOLICITATION OF AN OFFER TO BUY THESE SECURITIES IN ANY JURISDICTION WHERE THE OFFER OR SALE IS NOT PERMITTED.
55
| CHRISTIANA MALL |

THE INFORMATION IN THIS STRUCTURAL AND COLLATERAL TERM SHEET IS NOT COMPLETE AND MAY BE AMENDED PRIOR TO THE TIME OF SALE. THIS TERM SHEET IS NOT AN OFFER TO SELL THESE SECURITIES AND IT IS NOT A SOLICITATION OF AN OFFER TO BUY THESE SECURITIES IN ANY JURISDICTION WHERE THE OFFER OR SALE IS NOT PERMITTED.
56
| CHRISTIANA MALL |
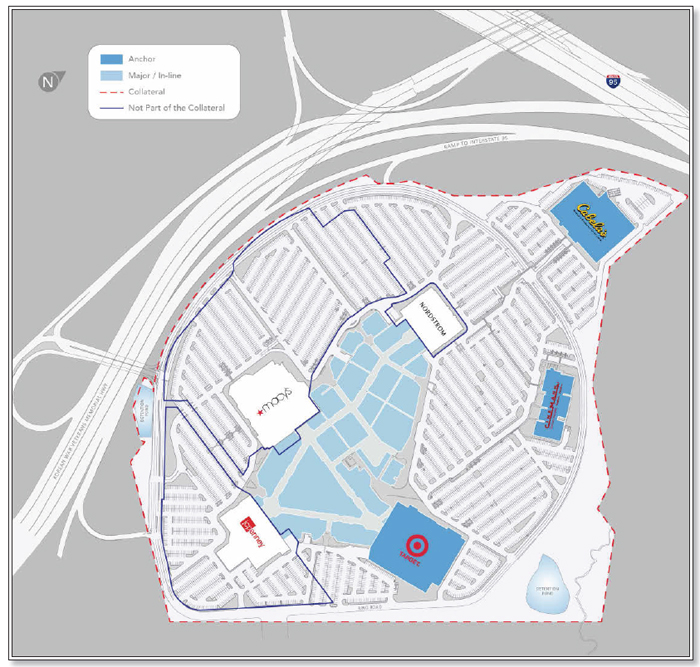
THE INFORMATION IN THIS STRUCTURAL AND COLLATERAL TERM SHEET IS NOT COMPLETE AND MAY BE AMENDED PRIOR TO THE TIME OF SALE. THIS TERM SHEET IS NOT AN OFFER TO SELL THESE SECURITIES AND IT IS NOT A SOLICITATION OF AN OFFER TO BUY THESE SECURITIES IN ANY JURISDICTION WHERE THE OFFER OR SALE IS NOT PERMITTED.
57
| CHRISTIANA MALL |
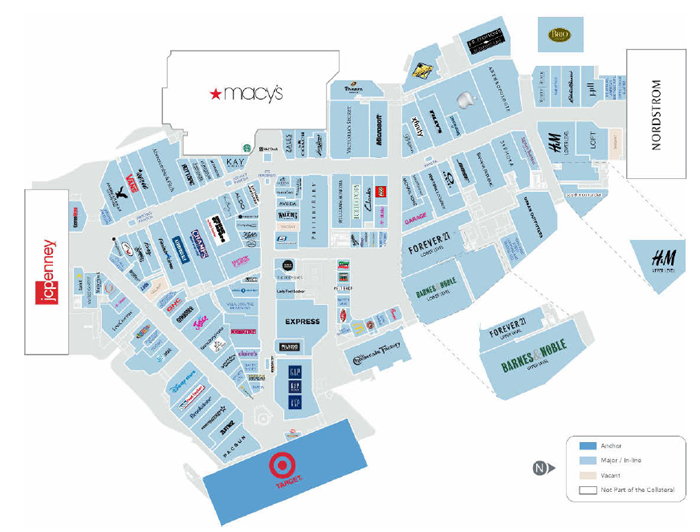
THE INFORMATION IN THIS STRUCTURAL AND COLLATERAL TERM SHEET IS NOT COMPLETE AND MAY BE AMENDED PRIOR TO THE TIME OF SALE. THIS TERM SHEET IS NOT AN OFFER TO SELL THESE SECURITIES AND IT IS NOT A SOLICITATION OF AN OFFER TO BUY THESE SECURITIES IN ANY JURISDICTION WHERE THE OFFER OR SALE IS NOT PERMITTED.
58
| CHRISTIANA MALL |
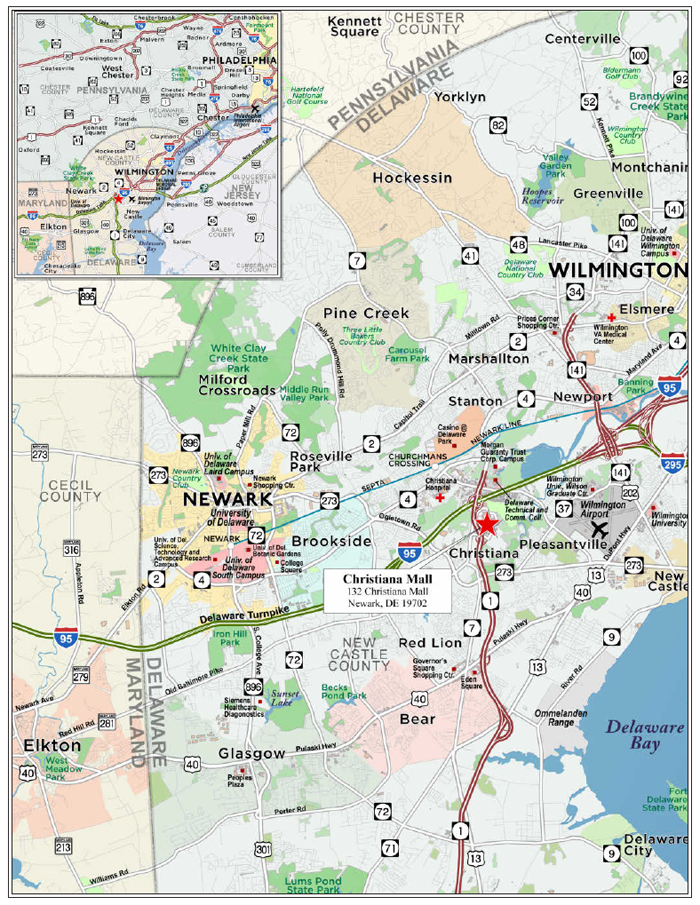
THE INFORMATION IN THIS STRUCTURAL AND COLLATERAL TERM SHEET IS NOT COMPLETE AND MAY BE AMENDED PRIOR TO THE TIME OF SALE. THIS TERM SHEET IS NOT AN OFFER TO SELL THESE SECURITIES AND IT IS NOT A SOLICITATION OF AN OFFER TO BUY THESE SECURITIES IN ANY JURISDICTION WHERE THE OFFER OR SALE IS NOT PERMITTED.
59
| No. 3 – Christiana Mall | ||||||
| Loan Information | Property Information | |||||
| Mortgage Loan Seller: | Barclays Bank PLC | Single Asset/Portfolio: | Single Asset | |||
| Credit Assessment (DBRS/Fitch/Moody’s): | A/AA-sf*/A3 | Property Type: | Retail | |||
| Original Principal Balance(1): | $50,000,000 | Specific Property Type: | Super Regional Mall | |||
| Cut-off Date Balance(1): | $50,000,000 | Location: | Newark, DE | |||
| % of Initial Pool Balance: | 5.3% | Size: | 779,084 SF | |||
| Loan Purpose: | Refinance | Cut-off Date Balance Per SF(1): | $433.84 | |||
| Borrower Name: | Christiana Mall LLC | Year Built/Renovated: | 1978/2014 | |||
| Sponsors: | GGP Inc.; PPF Retail, LLC | Title Vesting: | Fee/Leasehold | |||
| Mortgage Rate: | 4.2775% | Property Manager: | Self-managed | |||
| Note Date: | July 12, 2018 | 4thMost Recent Occupancy (As of)(5): | 99.2% (12/31/2014) | |||
| Anticipated Repayment Date: | NAP | 3rdMost Recent Occupancy (As of)(5): | 99.3% (12/31/2015) | |||
| Maturity Date: | August 1, 2028 | 2ndMost Recent Occupancy (As of)(5): | 99.8% (12/31/2016) | |||
| IO Period: | 120 months | Most Recent Occupancy (As of)(5): | 99.0% (12/31/2017) | |||
| Loan Term (Original): | 120 months | Current Occupancy (As of)(5): | 98.3% (5/31/2018) | |||
| Seasoning: | 2 months | |||||
| Amortization Term (Original): | NAP | Underwriting and Financial Information: | ||||
| Loan Amortization Type: | Interest-only, Balloon | |||||
| Interest Accrual Method: | Actual/360 | 4thMost Recent NOI (As of): | $41,918,054 (12/31/2015) | |||
| Call Protection(2): | L(26),D(87),O(7) | 3rdMost Recent NOI (As of): | $43,957,559 (12/31/2016) | |||
| Lockbox Type: | Hard/Springing Cash Management | 2ndMost Recent NOI (As of): | $43,514,169 (12/31/2017) | |||
| Additional Debt(1)(3): | Yes | Most Recent NOI (As of): | $43,550,426 (TTM 5/31/2018) | |||
| Additional Debt Type(1)(3): | Pari Passu; Subordinate Secured Debt; Future Mezzanine | |||||
| U/W Revenues: | $56,260,022 | |||||
| U/W Expenses: | $9,514,932 | |||||
| Escrows and Reserves(4): | U/W NOI: | $46,745,090 | ||||
| U/W NCF: | $46,104,564 | |||||
| Type: | Initial | Monthly | Cap (If Any) | U/W NOI DSCR(1): | 3.19x | |
| Taxes | $0 | Springing | NAP | U/W NCF DSCR(1): | 3.15x | |
| Insurance | $0 | Springing | NAP | U/W NOI Debt Yield(1): | 13.8% | |
| Replacement Reserve | $0 | Springing | $241,565 | U/W NCF Debt Yield(1): | 13.6% | |
| TI/LC Reserve | $0 | Springing | $1,449,387 | As-Is Appraised Value: | $1,040,000,000 | |
| Outstanding TI/LC Reserve | $1,804,093 | $0 | NAP | As-Is Appraisal Valuation Date: | June 5, 2018 | |
| Cut-off Date LTV Ratio(1): | 32.5% | |||||
| LTV Ratio at Maturity or ARD(1): | 32.5% | |||||
| (1) | See “The Mortgage Loan” section. The Cut-off Date Balance per SF, U/W NOI DSCR, U/W NCF DSCR, U/W NOI Debt Yield, U/W NCF Debt Yield, Cut-off Date LTV Ratio and LTV Ratio at Maturity or ARD presented above are based on the Christiana Mall Senior Loan (as defined below). The Cut-off Date Balance per SF, U/W NOI DSCR, U/W NCF DSCR, U/W NOI Debt Yield, U/W NCF Debt Yield, Cut-off Date LTV Ratio and LTV Ratio at Maturity or ARD based on the Christiana Mall Whole Loan (as defined below) are $706, 1.96x, 1.93x, 8.5%, 8.4%, 52.9% and 52.9%, respectively. |
| (2) | The lockout period will be at least 26 payments, beginning with and including the first payment date of September 1, 2018. Defeasance of the Christiana Mall Whole Loan is permitted at any time after the earlier to occur of (i) two years after the closing date of the securitization that includes the last note to be securitized or (ii) July 12, 2021. The assumed lockout period of 26 payments is based on the expected WFCM 2018-C47 securitization trust closing date in October 2018. |
| (3) | See “Subordinate and Mezzanine Indebtedness” section. |
| (4) | See “Escrows” section. |
| (5) | See “Historical Occupancy” table. |
The Mortgage Loan. The mortgage loan (the “Christiana Mall Mortgage Loan”) is part of a whole loan (the “Christiana Mall Whole Loan”) in the aggregate original principal amount of $550,000,000, evidenced by thirteenpari passu senior notes with an aggregate original balance of $338,000,000 (the “Christiana Mall Senior Loan”) and threepari passusubordinate notes with an original principal balance of $212,000,000 (the “Christiana Mall B Notes”) secured by a first mortgage encumbering the fee and leasehold interest in 779,084 square feet of a 1,275,084 square foot super regional mall located in Newark, Delaware (the “Christiana Mall Property”). The Christiana Mall Whole Loan was co-originated on July 12, 2018 by Barclays Bank PLC, Société Générale, and Deutsche Bank AG, New York Branch. The Christiana Mall Senior Loan had an original principal balance of $338,000,000, has an outstanding principal balance as of the Cut-off Date of $338,000,000 and accrues interest at a rate of 4.2775%per annum. The Christiana Mall B Notes had an original principal balance of $212,000,000, have an outstanding principal balance as of the Cut-off Date of $212,000,000, and accrue at an interest rate of 4.2775% per annum. The Christiana Mall Whole Loan had an initial term of 120 months, has a remaining term of 118 months as of the Cut-off Date and requires interest only payments for the entirety of the term. The Christiana Mall Whole Loan matures on August 1, 2028.
THE INFORMATION IN THIS STRUCTURAL AND COLLATERAL TERM SHEET IS NOT COMPLETE AND MAY BE AMENDED PRIOR TO THE TIME OF SALE. THIS TERM SHEET IS NOT AN OFFER TO SELL THESE SECURITIES AND IT IS NOT A SOLICITATION OF AN OFFER TO BUY THESE SECURITIES IN ANY JURISDICTION WHERE THE OFFER OR SALE IS NOT PERMITTED.
60
| CHRISTIANA MALL |
The non-controlling Note A-1-B, which will be contributed to the WFCM 2018-C47 securitization trust, had an original principal balance of $50,000,000 and has an outstanding principal balance as of the Cut-off Date of $50,000,000. The controlling Note A-1-A and non-controlling Notes A-2-A and A-3-A, which have been contributed to the BBCMS 2018-CHRS securitization trust, had an original principal balance of $72,320,000 and have an outstanding principal balance as of the Cut-off Date of $72,320,000. The non-controlling Notes A-1-C, A-1-D, and A-1-E had an original principal balance of $82,840,000, have an outstanding principal balance as of the Cut-off Date of $82,840,000, are held by Barclays Bank PLC and are expected to be contributed to one or more future securitization transactions. The non-controlling note A-2-B had an original principal balance of $30,000,000, has an outstanding principal balance of $30,000,000, and is expected to be contributed to the UBS 2018-C13 securitization trust. The non-controlling Notes A-2-C, A-2-D, and A-2-E had an original principal balance of $49,704,000, have an outstanding principal balance as of the Cut-off Date of $49,704,000, are held by Société Générale and are expected to be contributed to one or more future securitization transactions. The non-controlling Notes A-3-B and A-3-C had an original principal balance of $53,136,000, have an outstanding principal balance as of the Cut-off Date of $53,136,000, are held by Deutsche Bank AG, New York Branch, and are expected to be contributed to one or more future securitization transactions. The Christiana Mall B Notes, which have been contributed to the BBCMS 2018-CHRS securitization trust, had an original principal balance of $212,000,000 and have an outstanding principal balance as of the Cut-off Date of $212,000,000. The lender provides no assurances that the non-securitizedpari passu notes will not be split further. See “Description of the Mortgage Pool—The Whole Loans—The AB Whole Loans—The Christiana Mall Whole Loan” and “Pooling and Servicing Agreement” in the Prospectus.
Note Summary
| Christiana Mall Whole Loan ($550,000,000) | |||
| Christiana MallPari PassuCompanion Notes ($338,000,000) | |||
Companion A Notes BBCMS 2018-CHRS
$72,320,000 Notes A-1-A, A-2-A, A-3-A
| Companion A Note WFCM 2018-C47
$50,000,000 Note A-1-B
| Companion A Note UBS 2018-C13
$30,000,000 Note A-2-B
| Companion A Notes Future Conduit
$185,680,000 Notes A-1-C, A-1-D, A-1-E, A-2-C, A-2-D, A-2-E, A-3-B, A-3-C |
| Christiana Mall Subordinate Companion Notes ($212,000,000) | |||
Subordinate Companion B Notes BBCMS 2018-CHRS $212,000,000 Notes B-1, B-2, B-3 | |||
Following the lockout period, on any date before February 1, 2028, the borrower has the right to defease the Christiana Mall Whole Loan in whole, but not in part. In addition, the Christiana Mall Whole Loan is prepayable without penalty on or after February 1, 2028. The lockout period will expire on the earlier to occur of (i) two years after the closing date of the securitization that includes the last note to be securitized and (ii) July 12, 2021.
Sources and Uses
| Sources | Uses | |||||||
| Original whole loan amount(1) | $550,000,000 | 100.0% | Loan payoff | $235,182,023 | 42.8% | |||
| Upfront reserves | 1,804,093 | 0.3 | ||||||
| Closing costs | 3,253,713 | 0.6 | ||||||
| Return of Equity | 309,760,172 | 56.3 | ||||||
| Total Sources | $550,000,000 | 100.0% | Total Uses | $550,000,000 | 100.0% |
| (1) | The Christiana Mall Whole Loan proceeds were used to retire an approximately $235.2 million outstanding loan (inclusive of defeasance costs) previously securitized in the MSC 2011-C1 transaction, pay closing costs and return of equity to the borrower. |
The Property.The Christiana Mall Property consists of a 779,084 square foot portion of the two-story, 1,275,084 square foot Christiana Mall, located in Newark, Delaware. The Christiana Mall Property is anchored by Target, Cabela’s, and Cinemark and non-collateral anchors include Macy’s, JCPenney, and Nordstrom. Target and Cabela’s each own their improvements and ground lease the land from the borrower. The collateral and non-collateral anchor tenants generate approximately $198.8 million in annual sales. The Christiana Mall Property features over 130 specialty in-line stores including Apple, Anthropologie, Banana Republic, Barnes & Noble, Express, Finish Line, H&M, Microsoft, Pottery Barn, Sephora, Urban Outfitters, Victoria’s Secret, Williams-Sonoma, and XXI Forever. Additionally, the Christiana Mall Property includes dining options such as a 10-bay food court and restaurants including Brio, California Pizza Kitchen, The Cheesecake Factory, J.B. Dawson’s Restaurant, and Panera Bread. Included in the collateral are 6,628 parking spaces (approximately 5.2 spaces per 1,000 SF). Excluding the anchor tenants, no other tenant occupies more than 4.7% of NRA or represents more than 6.0% of underwritten base rent.
The Christiana Mall Property was built in 1978, and underwent an expansion phase from 2007 to 2014. Over $200.0 million was invested, adding several large format tenants including Nordstrom, Target, Cabela’s, and Cinemark, as well as over 160,000 square feet of in-line, restaurant, and exterior facing in-line space.
The Christiana Mall Property was 98.3% leased as of May 31, 2018 to 131 permanent retail and restaurant tenants, and the entire 1,275,084 square feet of the Christiana Mall was 98.9% leased as of May 31, 2018. Since 2014, Christiana Mall has maintained an average occupancy of approximately 99.5% including anchor tenants, with no year-end occupancy falling below 98.9%. As of TTM April 30, 2018, sales for in-line tenants occupying less than 10,000 square feet of space were $885 per square foot with occupancy cost of 13.4% (including Apple and its 10,705 square feet of space, the Christiana Mall Property generated sales per square foot of $2,504 with an occupancy cost of 4.7%).
THE INFORMATION IN THIS STRUCTURAL AND COLLATERAL TERM SHEET IS NOT COMPLETE AND MAY BE AMENDED PRIOR TO THE TIME OF SALE. THIS TERM SHEET IS NOT AN OFFER TO SELL THESE SECURITIES AND IT IS NOT A SOLICITATION OF AN OFFER TO BUY THESE SECURITIES IN ANY JURISDICTION WHERE THE OFFER OR SALE IS NOT PERMITTED.
61
| CHRISTIANA MALL |
The following table presents certain information relating to the tenancy at the Christiana Mall Property:
Major Tenants(1)
| Tenant Name | Credit Rating (Fitch/ Moody’s/ S&P)(2) | Tenant NRSF | % of NRSF | Annual U/W Base Rent PSF | Annual U/W Base Rent(3) | % of Total Annual U/W Base Rent | April 30, 2018 TTM Sales(4) | Lease Expiration Date | ||||
| $ | PSF | Occ. Cost | ||||||||||
| Major Tenants | ||||||||||||
| Target | A-/A2/A | 145,312 | 18.7% | $0.00 | $0 | 0.0% | $52,000,000 | $358 | NAP | 12/31/2036(5) | ||
| Cabela’s | NR/NR/NR | 100,000 | 12.8% | $10.21 | $1,021,250 | 2.8% | $50,782,999 | $508 | 2.0% | 1/31/2035(6) | ||
| Cinemark | NR/NR/BB | 50,643 | 6.5% | $22.30 | $1,129,339 | 3.1% | $7,251,437 | $604,286(7) | 15.6% | 11/30/2029(8) | ||
| Barnes & Noble Bookseller | NR/NR/NR | 36,803 | 4.7% | $20.38 | $750,000 | 2.1% | $7,894,999 | $215 | 9.5% | 1/31/2020(9) | ||
| XXI Forever | NR/NR/NR | 27,300 | 3.5% | $78.21 | $2,135,133 | 6.0% | $6,494,724 | $238 | 32.9% | 1/31/2020 | ||
| H&M | NR/NR/NR | 20,160 | 2.6% | $45.60 | $919,371 | 2.6% | $6,381,061 | $317 | 14.4% | 2/28/2021(10) | ||
| Anthropologie | NR/NR/NR | 10,967 | 1.4% | $68.43 | $750,455 | 2.1% | $1,637,845 | $149 | 45.8% | 1/31/2021(11) | ||
| Victoria’s Secret | NR/NR/NR | 10,830 | 1.4% | $60.00 | $649,800 | 1.8% | $6,484,521 | $599 | 10.0% | 1/31/2024 | ||
| Apple | NR/Aa1/AA+ | 10,705 | 1.4% | $109.85 | $1,175,974 | 3.3% | $488,995,320 | $45,679 | 0.2% | 1/31/2023 | ||
| Gap/Gap Kids/Baby Gap | NR/Baa2/BB+ | 10,583 | 1.4% | $59.12 | $625,698 | 1.7% | $3,157,328 | $298 | 19.8% | 5/31/2024 | ||
| Express | NR/NR/NR | 10,008 | 1.3% | $45.75 | $457,913 | 1.3% | $3,175,091 | $317 | 14.4% | 1/31/2024 | ||
| Urban Outfitters | NR/NR/NR | 10,000 | 1.3% | $42.00 | $420,000 | 1.2% | $2,445,323 | $245 | 17.2% | 1/31/2021(12) | ||
| Total Major Tenants | 443,311 | 56.9% | $33.67(13) | $10,034,934 | 28.0% | |||||||
| Other Tenants(14) | 322,372 | 41.4% | $82.30 | $25,834,705 | 72.0% | $250,347,499 | $885(15) | 13.4%(15) | ||||
| Occupied Collateral Total | 765,683 | 98.3% | $58.62(13)(14) | $35,869,639 | 100.0% | |||||||
| Vacant Space | 13,401 | 1.7% | ||||||||||
| Collateral Total | 779,084 | 100.0% | ||||||||||
| Non-Collateral Tenants | ||||||||||||
| Macy's | BBB/Baa3/BBB- | 215,000 | NAP | NAP | NAP | $48,000,000 | $223 | NAP | 12/31/2028 | |||
| JCPenney | B/B3/B- | 158,000 | NAP | NAP | NAP | $21,000,000 | $133 | NAP | 12/31/2028 | |||
| Nordstrom | BBB+/Baa1/BBB+ | 123,000 | NAP | NAP | NAP | $19,707,999 | $160 | NAP | 12/31/2028 | |||
| (1) | Information is based on the underwritten rent roll dated May 31, 2018. |
| (2) | Certain ratings are those of the parent company whether or not the parent guarantees the lease. |
| (3) | U/W Base Rent includes contractual rent steps of $1,226,247 taken through July 2019. |
| (4) | Sales figures for Macy’s, JCPenney, and Target represent 2017 borrower estimates. |
| (5) | See “Target Purchase and Put Options” section. |
| (6) | Cabela’s has eight five-year renewal options with six months’ written notice. Additionally, Cabela’s has a right to raze its leased premises, so long as it restores the building pad back to the condition at which time the lease premises were delivered, caps utilities at their in-place levels and otherwise leaves its leased premises in good condition. Upon substantial completion of this razing, the Cabela’s lease will terminate. |
| (7) | Sales PSF for Cinemark reflects sales per screen (12 screens). |
| (8) | Cinemark has three five-year renewal options with six months’ written notice. |
| (9) | Barnes & Noble has two five-year renewal options with 180 days’ written notice. |
| (10) | H&M has one five-year renewal options with 180 days’ written notice. |
| (11) | Anthropologie has one five-year renewal option with 180 days’ written notice. |
| (12) | Urban Outfitters has one five-year renewal option with 180 days’ written notice. |
| (13) | Target’s square footage is excluded from this calculation as it has no attributable U/W base rent. |
| (14) | Other Tenants include 1,553 square feet for one temporary tenant with an expiration date in May 2019 and 6,907 square feet of kiosk, antenna, and storage tenants with no attributable U/W base rent, and are excluded from the U/W Base Rent PSF calculation. |
| (15) | Other Tenants Sales PSF and Occupancy Cost figures reflect only comparable in-line tenants less than 10,000 square feet. |
THE INFORMATION IN THIS STRUCTURAL AND COLLATERAL TERM SHEET IS NOT COMPLETE AND MAY BE AMENDED PRIOR TO THE TIME OF SALE. THIS TERM SHEET IS NOT AN OFFER TO SELL THESE SECURITIES AND IT IS NOT A SOLICITATION OF AN OFFER TO BUY THESE SECURITIES IN ANY JURISDICTION WHERE THE OFFER OR SALE IS NOT PERMITTED.
62
| CHRISTIANA MALL |
The following table presents certain information relating to the lease rollover schedule at the Christiana Mall Property:
Lease Expiration Schedule(1)(2)(3)
| Year Ending December 31, | No. of Leases Expiring | Expiring NRSF | % of Total NRSF | Cumulative Expiring NRSF | Cumulative % of Total NRSF | Annual U/W Base Rent(4) | % of Total Annual U/W Base Rent(4) | Annual U/W Base Rent PSF(4)(5) |
| 2018/MTM | 5 | 9,964 | 1.3% | 9,964 | 1.3% | $910,842 | 2.5% | $91.41 |
| 2019(5) | 14 | 21,935 | 2.8% | 31,899 | 4.1% | $2,084,627 | 5.8% | $102.28 |
| 2020 | 18 | 114,468 | 14.7% | 146,367 | 18.8% | $6,063,941 | 16.9% | $52.97 |
| 2021 | 21 | 105,128 | 13.5% | 251,495 | 32.3% | $6,432,376 | 17.9% | $61.19 |
| 2022 | 9 | 19,976 | 2.6% | 271,471 | 34.8% | $2,099,539 | 5.9% | $105.10 |
| 2023 | 13 | 33,728 | 4.3% | 305,199 | 39.2% | $3,132,006 | 8.7% | $92.86 |
| 2024 | 12 | 50,843 | 6.5% | 356,042 | 45.7% | $3,842,731 | 10.7% | $75.58 |
| 2025 | 13 | 37,189 | 4.8% | 393,231 | 50.5% | $3,715,274 | 10.4% | $99.90 |
| 2026 | 14 | 39,768 | 5.1% | 432,999 | 55.6% | $3,914,722 | 10.9% | $98.44 |
| 2027 | 3 | 9,078 | 1.2% | 442,077 | 56.7% | $480,791 | 1.3% | $52.96 |
| 2028 | 3 | 4,742 | 0.6% | 446,819 | 57.4% | $459,072 | 1.3% | $96.81 |
| Thereafter(6) | 6 | 311,957 | 40.0% | 758,776 | 97.4% | $2,733,718 | 7.6% | $16.40 |
| Other(7) | 0 | 6,907 | 0.9% | 765,683 | 98.3% | $0 | 0.0% | $0.00 |
| Vacant | 0 | 13,401 | 1.7% | 779,084 | 100.0% | $0 | 0.0% | $0.00 |
| Total/Weighted Average | 131 | 779,084 | 100.0% | $35,869,639 | 100.0% | $58.62 |
| (1) | Information obtained from the underwritten rent roll for leases in place as of May 31, 2018. |
| (2) | Certain tenants may have lease termination options that are exercisable prior to the originally stated expiration date of the subject lease and that are not considered in the Lease Expiration Schedule. |
| (3) | Includes executed leases that have not yet commenced as of May 31, 2018. |
| (4) | U/W Base Rent includes contractual rent steps of $1,226,247 taken through July 2019. |
| (5) | Square footage of 2019 includes a 1,553 SF temporary tenant with an expiration date of May 31, 2019 and no attributable U/W base rent and is excluded from the calculation for U/W Base Rent PSF. |
| (6) | U/W Base Rent PSF excludes Target’s space (145,312 square feet) from the calculation. |
| (7) | 6,907 square feet of kiosk, antenna, and storage tenants was included with no annual U/W base rent and are excluded from the calculation for U/W Base Rent PSF. |
The following table presents historical occupancy percentages at the Christiana Mall Property:
Historical Occupancy(1)
12/31/2014(2) | 12/31/2015(2) | 12/31/2016(2) | 12/31/2017(2) | 5/31/2018(3)(4)(5) |
| 99.2% | 99.3% | 99.8% | 99.0% | 98.3% |
| (1) | Historical occupancy of the entire 1,275,084 square feet of the Christiana Mall was 99.5%, 99.5%, 99.9%, 99.4%, and 98.9% respectively. |
| (2) | Information obtained from the borrower. |
| (3) | Information obtained from the underwritten rent roll. |
| (4) | Current occupancy figure includes five tenants (11,868 square feet) who have signed their lease but are not currently occupying their space. |
| (5) | Current occupancy figure excludes four tenants (5,820 square feet) who have either filed for bankruptcy or are completely dark. Including those tenants in occupancy would result in a current Christiana Mall occupancy of 99.4%, a current Christiana Mall Property (including collateral anchors) occupancy of 99.0%, and a current Christiana Mall Property (excluding collateral anchors) occupancy of 98.4%. |
The following table presents historical in-line sales at the Christiana Mall Property:
Historical In-line Tenant Sales Summary(1)(2)
| Year | Sales PSF w/ Apple | Occupancy Cost w/ Apple | Sales PSF w/o Apple | Occupancy Cost w/o Apple | |||
| 2014 | $3,733 | 2.8% | $699 | 14.8% | |||
| 2015 | $2,750 | 3.9% | $786 | 13.8% | |||
| 2016 | $1,660 | 6.8% | $821 | 13.8% | |||
| 2017 | $2,038 | 5.8% | $887 | 13.4% | |||
| TTM 4/30/2018 | $2,504 | 4.7% | $885 | 13.4% | |||
| (1) | Information as provided by the borrower sponsors and only includes tenants reporting comparable sales. |
| (2) | Christiana Mall and the Christiana Mall Property sales total fluctuations are primarily driven by the Apple store, which has reported sales ranging between $273.0 million and $944.5 million. According to the appraisal, the results may be partially attributed to changes in accounting methodology. The same trend has been observed at other Apple mall locations. |
THE INFORMATION IN THIS STRUCTURAL AND COLLATERAL TERM SHEET IS NOT COMPLETE AND MAY BE AMENDED PRIOR TO THE TIME OF SALE. THIS TERM SHEET IS NOT AN OFFER TO SELL THESE SECURITIES AND IT IS NOT A SOLICITATION OF AN OFFER TO BUY THESE SECURITIES IN ANY JURISDICTION WHERE THE OFFER OR SALE IS NOT PERMITTED.
63
| CHRISTIANA MALL |
The following table presents historical anchor sales at the Christiana Mall Property:
Historical Anchor Tenant Sales Summary(1)
| Year | Macy’s Sales $ mil / Sales PSF(2)(3) | JCPenney’s Sales $ mil / Sales PSF(2)(3) | Target’s Sales $ mil / Sales PSF(3) | Nordstrom Sales $ mil / Sales PSF(2)(3) | Cabela’s Sales $ mil / Sales PSF | Cinemark Sales $ mil / Sales PSF(4) |
| 2014 | $56.0/$260 | $22.0/$139 | $56.0/$385 | $25.1/$204 | NAV | NAV |
| 2015 | $57.0/$265 | $22.0/$139 | $60.0/$413 | $25.0/$203 | $57.9/$579 | $8.0/$665,953 |
| 2016 | $52.0/$242 | $20.0/$127 | $52.0/$358 | $24.1/$196 | $50.6/$506 | $8.4/$697,866 |
| 2017 | $48.0/$223 | $21.0/$133 | $52.0/$358 | $19.7/$160 | $50.8/$508 | $7.3/$604,286 |
| TTM 4/30/2018 | $48.0/$223 | $21.0/$133 | $52.0/$358 | $19.7/$160 | $50.8/$508 | $7.3/$604,286 |
| (1) | Information is estimated and as provided by the borrower sponsors. |
| (2) | Anchors are non-collateral tenants. |
| (3) | Sales figures for Macy’s, JCPenney, and Target represent borrower estimates. TTM April 2018 sales were not available for Macy’s, JCPenney, and Target, thus 2017 estimates were utilized. Additionally, Nordstrom reports sales on an annual basis, thus TTM April 2018 sales figures on this table reflect 2017 sales. |
| (4) | Cinemark Sales PSF represent sales per screen (12 screens). |
Operating History and Underwritten Net Cash Flow. The following table presents certain information relating to the historical operating performance and the underwritten net cash flow at the Christiana Mall Property:
Cash Flow Analysis
| 2015 | 2016 | 2017 | TTM 5/31/2018 | U/W | % of U/W Effective Gross Income | U/W $ per SF | |
| Base Rent(1)(2) | $32,684,203 | $34,240,787 | $34,477,828 | $34,558,591 | $35,869,639 | 63.8% | $46.04 |
| Vacant Space | 0 | 0 | 0 | 0 | 1,638,466 | 2.9 | 2.10 |
| Percentage Rent | 0 | 0 | 6,575 | 7,770 | 0 | 0.0 | 0.00 |
| Total Recoveries | 13,257,802 | 13,807,251 | 13,491,109 | 13,425,783 | 14,157,327 | 25.2 | 18.17 |
| Specialty Leasing | 2,714,827 | 2,749,431 | 2,713,432 | 2,759,788 | 2,876,610 | 5.1 | 3.69 |
| Other Income(3) | 3,469,234 | 3,343,004 | 3,369,589 | 3,277,797 | 3,356,447 | 6.0 | 4.31 |
| Less Vacancy(4) | 0 | 0 | 0 | 0 | (1,638,466) | (2.9) | (2.10) |
| Effective Gross Income | $52,126,066 | $54,140,474 | $54,058,534 | $54,029,729 | $56,260,022 | 100.0% | $72.21 |
| Total Operating Expenses | $10,208,012 | $10,182,915 | $10,544,365 | $10,479,303 | $9,514,932 | 16.9% | $12.21 |
| Net Operating Income | $41,918,054 | $43,957,559 | $43,514,169 | $43,550,426 | $46,745,090 | 83.1% | $60.00 |
| Capital Expenditures | 0 | 0 | 0 | 0 | 106,754 | 0.2 | 0.14 |
| TI/LC | 0 | 0 | 0 | 0 | 533,772 | 0.9 | 0.69 |
| Net Cash Flow | $41,918,054 | $43,957,559 | $43,514,169 | $43,550,426 | $46,104,564 | 81.9% | $59.18 |
| NOI DSCR(5) | 2.86x | 3.00x | 2.97x | 2.97x | 3.19x | ||
| NCF DSCR(5) | 2.86x | 3.00x | 2.97x | 2.97x | 3.15x | ||
| NOI DY(5) | 12.4% | 13.0% | 12.9% | 12.9% | 13.8% | ||
| NCF DY(5) | 12.4% | 13.0% | 12.9% | 12.9% | 13.6% |
| (1) | U/W Base Rent includes contractual rent steps of $1,226,247 taken through July 2019. |
| (2) | U/W Base Rent includes $643,284 for tenants who have signed leases but have not occupied their space as of May 31, 2018 including Tilly’s (4,999 SF), Xfinity (4,014 SF), Lolli and Pops (2,400 SF), Jamba Juice (246 SF), and Bath and Body Works (209 SF). XFinity has since moved into their space. U/W Base Rent excludes bankrupt tenants as of May 31, 2018 including Icing by Claire’s (1,979 SF), Claire’s (1,239 SF), and the Walking Company (1,582 SF) and also excludes Teavana (1,020 SF) who is currently dark and not occupying their space. Walking Company has since emerged from bankruptcy. |
| (3) | Other income includes overage rent and storage and other income. |
| (4) | The underwritten economic vacancy is 2.9%. The Christiana Mall Property was 98.3% physically leased as of May 31, 2018. |
| (5) | The debt service coverage ratios and debt yields shown are based on the Christiana Mall Senior Loan. |
Appraisal. As of the appraisal valuation date of June 5, 2018, the Christiana Mall Property had an “as-is” appraised value of $1,040,000,000.
Environmental Matters. According to a Phase I environmental site assessment dated June 11, 2018, there was no evidence of any recognized environmental conditions at the Christiana Mall Property.
Market Overview and Competition. The Christiana Mall Property is located in the southeast quadrant of the intersection of Route 7 and Interstate 95 in Newark, Delaware. Delaware is one of the only five U.S. states with no sales tax, and the Christiana Mall Property benefits from being the closest super regional shopping center to several surrounding states with sales tax. According to the appraisal, Interstate 95 is the most important limited access highway serving the region and offers direct access to Philadelphia and New York City to the north and Baltimore and Washington D.C. to the south. Christiana Mall is directly off Interstate 95 with over 200,000 vehicles passing by daily. A $150.0 million upgrade to Interstate 95 has been completed, including the addition of an exit dedicated to Christiana Mall. The mall is popular for out-of-state shoppers since it is only approximately 10 miles from Maryland, Pennsylvania, and New Jersey. US Highway 1, DE Routes 2, 7, and 273, and Interstates 95, 295, and 495 all serve the area. Interstate 295, with access
THE INFORMATION IN THIS STRUCTURAL AND COLLATERAL TERM SHEET IS NOT COMPLETE AND MAY BE AMENDED PRIOR TO THE TIME OF SALE. THIS TERM SHEET IS NOT AN OFFER TO SELL THESE SECURITIES AND IT IS NOT A SOLICITATION OF AN OFFER TO BUY THESE SECURITIES IN ANY JURISDICTION WHERE THE OFFER OR SALE IS NOT PERMITTED.
64
| CHRISTIANA MALL |
to the Delaware Memorial Bridge, leading to New Jersey, New York, and New England, lies approximately four miles northeast of the mall.
According to the appraisal, the Christiana Mall Property is located in a growing, suburban area, which benefits from access to the major traffic arteries connecting the surrounding metropolitan area. Christiana Mall caters to two large universities within a seven-mile radius, University of Delaware and Wilmington University, which are home to a combined 38,000 students and 5,000 employees. Another draw to the area is the Christiana Hospital, housing 907 licensed beds, 22 hospital-based operating rooms and 10 outpatient rooms, which is located a short distance south. It is home to Delaware’s only level 3 neonatal intensive care unit and the state’s largest maternity center. The Christiana Hospital Campus is also home to the Center for Heart & Vascular Health and the Helen F. Graham Cancer Center. The Christiana Mall Property is located in the Philadelphia metropolitan statistical area, which is home to 14 Fortune 500 companies of which two (DuPont and Chemours) are located in Wilmington, Delaware.
According to the appraisal, the estimated 2017 population within the Christiana Mall Property’s primary trade area was 680,683. The estimated 2017 average household income in the trade area was $90,061. The primary trade area has been established by zip codes based on a shopper intercept survey. From 2000 to 2017, the trade area experienced compound annual population growth rate of approximately 0.9% and an annual household income growth rate of approximately 2.0%.
The table below presents certain information relating to seven comparable properties to the Christiana Mall Property identified by the appraisal:
Comparable Properties(1)
| Property, Location | Property Type | Year Built/ Renovated | Size (SF) | Occ. | Sales PSF | Anchor Tenants | Distance to Subject (mi.) |
Christiana Mall Property Newark, DE | Super Regional Mall | 1978/2014 | 1,275,084 | 98.9%(2) | $885(3) | Macy’s, JC Penney, Target, Nordstrom, Cabela’s, Cinemark(3) | NAP |
| Primary Competition | |||||||
Concord Mall Wilmington, DE | Super Regional Mall | 1969/1984 | 960,000 | 86.0% | $395 | Boscov’s, Macy’s Sears | 13.5 |
Springfield Mall Springfield, PA | Super Regional Mall | 1964/1997 | 610,582 | 97.0% | $424 | Macy’s, Target | 26.6 |
Exton Square Mall Exton, PA | Super Regional Mall | 1973/2000 | 1,088,000 | 84.0% | $316 | Boscov’s, Macy’s, Main Line Health Center, Sears, Round 1 | 30.2 |
| Secondary Competition | |||||||
Dover Mall Dover, DE | Super Regional Mall | 1982/1997 | 928,194 | 93.0% | $410 | AMC Cinema, Boscov’s, Dick’s Sporting Goods, JCPenney, Macy’s, Sears | 39.2 |
King of Prussia Mall King of Prussia, PA | Super Regional Mall | 1962/1995 | 2,391,105 | 96.0% | $805 | Bloomingdales, JCPenney, Lord & Taylor, Macy’s, Neiman Marcus, Nordstrom, Sears | 41.6 |
Cherry Hill Mall Cherry Hill, NJ | Super Regional Mall | 1961/2009 | 1,305,813 | 97.0% | $659 | JCPenney, Macy’s, Nordstrom | 44.3 |
Towson Town Center Towson, MD | Super Regional Mall | 1958/2007 | 1,063,549 | 92.0% | $495 | Macy’s, Nordstrom, Crate & Barrel, Nordstrom Rack | 63.6 |
| (1) | Information obtained from the appraisal and underwritten rent roll. |
| (2) | This occupancy reflects the entire Christiana Mall as of May 31, 2018. The 779,084 square feet of collateral was 98.3% occupied as of May 31, 2018. |
| (3) | Based on TTM April 2018 sales for comparable in-line tenants occupying less than 10,000 square feet. |
The Borrower.The borrower is Christiana Mall LLC, a single-purpose Delaware limited liability company structured to be bankruptcy remote with at least two independent directors. Legal counsel to the borrower delivered a non-consolidation opinion in connection with the origination of the Christiana Mall Whole Loan. GGP Nimbus, LP and PPF Retail, LLC are the guarantors under the Christiana Mall Whole Loan. The borrower is currently a 50/50 joint venture that is indirectly owned and controlled by GGP and Morgan Stanley’s Prime Property Fund.
The Borrower Sponsors.The borrower sponsors are GGP Inc. (“GGP”) and PPF Retail, LLC. GGP (NYSE: GGP) is a retail real estate company headquartered in Chicago, Illinois and is one of the largest owners and operators of real estate in the United States. According to the borrower, GGP owns, manages, leases and develops retail properties throughout the United States. As of March 31, 2018, GGP owned, either entirely or with joint venture partners, 125 retail properties located throughout the United States comprising approximately 122.5 million square feet of gross leasable area, which was 95.3% leased. GGP’s portfolio includes Ala Moana Center in Honolulu, Hawaii, Fashion Show in Las Vegas, Nevada, Tysons Galleria in McLean, Virginia, Glendale Galleria in Glendale, California, and Water Tower Place in Chicago, Illinois. On March 26, 2018, an affiliate of Brookfield, Brookfield Properties Partners, L.P. (“BPY”) announced that BPY and GGP have entered into an agreement for BPY to acquire all of the outstanding shares of common stock of GGP other than those shares that were already held by BPY and its affiliates, and the transaction was completed on August 28, 2018. BPY is one of the world’s largest commercial real estate companies, with approximately $68.0 billion in total assets. GGP is currently in the
THE INFORMATION IN THIS STRUCTURAL AND COLLATERAL TERM SHEET IS NOT COMPLETE AND MAY BE AMENDED PRIOR TO THE TIME OF SALE. THIS TERM SHEET IS NOT AN OFFER TO SELL THESE SECURITIES AND IT IS NOT A SOLICITATION OF AN OFFER TO BUY THESE SECURITIES IN ANY JURISDICTION WHERE THE OFFER OR SALE IS NOT PERMITTED.
65
| CHRISTIANA MALL |
final stages of transferring a 24.995% indirect interest in the borrower to Institutional Mall Investors LLC. GGP had previously filed for bankruptcy on April 16, 2009. For more details, please see “Description of the Mortgage Pool – Loan Purpose; Bankruptcy Issues and Other Proceedings” in the Preliminary Prospectus. PPF Retail, LLC is Morgan Stanley’s Prime Property Fund, which is a diversified core real estate fund managed by Morgan Stanley Real Estate. The fund’s assets include office, retail, multifamily, industrial self-storage and hotel properties located in major real estate markets throughout the United States. As of March 31, 2018, the Prime Property Fund had over $20.0 billion in net asset value.
Escrows.The Christiana Mall Whole Loan documents provide for upfront reserves of $1,804,093 for outstanding tenant improvements and/or leasing commissions. During a Cash Sweep Event Period (as defined below) the borrower is required to deposit monthly (i) 1/12th of the estimated annual real estate taxes, (ii) 1/12th of the estimated annual insurance premiums (except to the extent that the insurance required is maintained under a blanket insurance policy), (iii) $10,065 for replacement reserves until a cap of $241,565 is reached and (iv) $60,391 for tenant improvements and leasing commissions until a cap of $1,449,387 is reached.
Lockbox and Cash Management.The Christiana Mall Whole Loan is structured to have a hard lockbox and springing cash management. The Christiana Mall Whole Loan documents require the lender to deliver written instructions to tenants to deposit all rents payable under such leases directly into a clearing account. The Christiana Mall Whole Loan documents require that all rents received by the borrower or the property manager be deposited into the lockbox account within three business days of receipt. Funds in the lockbox account, absent the continuance of a Cash Sweep Event Period (as defined below), are required to be transferred daily to a borrower operating account.Upon the first occurrence of a Cash Sweep Event Period, the borrower is required to establish a cash management account under the sole control of the lender, to which during a Cash Sweep Event Period all amounts in the lockbox account are required to be automatically transferred daily for the payment of, among other things, debt service, monthly escrows, default interest and late payment charges. Any remaining funds after such disbursements are required to be distributed to the borrower if no event of default has occurred and is continuing.
A “Cash Sweep Event Period” will occur during the earliest of:
| (i) | an event of default under the Christiana Mall Mortgage Loan; |
| (ii) | any bankruptcy action of the borrower; |
| (iii) | any bankruptcy action of the guarantors or any replacement guarantor or guarantors; and |
| (iv) | the debt service coverage ratio falling below 1.35x for two consecutive quarters. |
A “Cash Sweep Event Period” will end if:
| (w) | with respect to clause (i) above, such event of default has been cured and no other event of default has occurred and is continuing, |
| (x) | with respect to clause (ii) above, such bankruptcy action is discharged, |
| (y) | with respect to clause (iii) above, (A) the borrower replaces the guarantor subject to such bankruptcy action with either (x) a replacement guarantor having an aggregate net worth of at least $500,000,000 and liquidity of at least $25,000,000, in each case exclusive of such person’s interest in the Christiana Mall Property or otherwise acceptable to lender or (y) PPF Retail, LLC or (so long as Institutional Mall Investors LLC is a qualified equityholder (as defined in the loan documents) and has an aggregate net worth of $500,000,000 exclusive of any interest in the Christiana Mall Property), Institutional Mall Investors LLC and one such substitute guarantor has assumed all obligations of such guarantor under each guaranty and environmental indemnity or executed an acceptable replacement guaranty, the borrower has delivered an insolvency opinion, a rating agency confirmation if required by the lender, and a credit check acceptable to the lender as reasonably required by the lender or (B) such bankruptcy action is discharged, stayed, or dismissed within 90 days of filing provided that such filing does not materially affect guarantor’s ability to pay and perform its obligations in the lender’s reasonable discretion, and |
| (z) | with respect to clause (iv) above, the Christiana Mall Property has achieved a debt service coverage ratio of at least 1.35x for two consecutive quarters. |
Property Management. The Christiana Mall Property is managed by an affiliate of the borrower.
Assumption. Following the six (6) month anniversary of the first monthly payment date, the borrower has the right to transfer the Christiana Mall Property without the lender’s consent provided that certain conditions are satisfied, including, but not limited to, (i) no event of default has occurred and is continuing; (ii) the lender has reasonably determined that the proposed transferee and guarantor satisfy the lender’s credit review and underwriting standards, taking into consideration the transferee’s experience, financial strength and general business standing; and (iii) receipt of rating agency confirmation that the transfer will not result in a downgrade, withdrawal or qualification of the respective ratings assigned to the Series WFCM 2018-C47 certificates.
Partial Release. If no event of default is continuing, the borrower is permitted to release from the lien of the mortgage the Cabela’s parcel and/or the Cinemark parcel (each, an “Outlot Parcel”) (or a portion thereof) in connection with the transfer of the fee simple interest in such Outlot Parcel (or portion thereof) to a transferee which is not an affiliate of the borrower that is either a national tenant or approved by the lender in its reasonable discretion, upon the borrower’s satisfaction of certain conditions, including, among other things:
| (i) | The borrower must make a partial prepayment of the Mortgage Loan by an amount equal to the greatest of (i) 125% of the allocated loan amount (i.e., $8,400,000 with respect to the Cabela’s parcel and $6,600,000 with respect to the Cinemark parcel) for such Outlot Parcel, (ii) the net sales proceeds received by the borrower with respect to such transfer and (iii) any “qualified amount” necessary to comply with any applicable REMIC requirement described in clause (iii) below, which partial prepayment, if made prior to the open period, shall be accompanied by a payment of the yield maintenance premium payment (calculated based upon the amount prepaid); provided, however, in lieu of making any such prepayment, at the borrower’s election prior to the release of the Outlot Parcel in question, the borrower may either (a) deposit cash with the |
THE INFORMATION IN THIS STRUCTURAL AND COLLATERAL TERM SHEET IS NOT COMPLETE AND MAY BE AMENDED PRIOR TO THE TIME OF SALE. THIS TERM SHEET IS NOT AN OFFER TO SELL THESE SECURITIES AND IT IS NOT A SOLICITATION OF AN OFFER TO BUY THESE SECURITIES IN ANY JURISDICTION WHERE THE OFFER OR SALE IS NOT PERMITTED.
66
| CHRISTIANA MALL |
| lender in the amount of such prepayment (exclusive of the yield maintenance premium payment) as additional reserve funds, which the lender will hold in an additional reserve account, or (b) deliver to the lender a letter of credit in the amount of such prepayment (exclusive of the yield maintenance premium payment). The borrower will have the option of having such reserve funds or letter of credit, as applicable, returned to the borrower with the payment to the lender of the amounts required pursuant to this clause (i) with respect to the Outlot Parcel in question (inclusive of any yield maintenance premium payment that may be due and payable as of the date of such prepayment); |
| (ii) | upon request by lender, delivery of a REMIC opinion; |
| (iii) | the loan-to-value ratio immediately after the release of the applicable Outlot Parcel is less than or equal to 125%, provided that the borrower may prepay the “qualified amount” (with payment of the yield maintenance premium calculated based upon the amount prepaid), in order to meet the foregoing loan-to-value ratio; and |
| (iv) | delivery of rating agency confirmation. |
Real Estate Substitution.If no event of default is continuing, the borrower may substitute the fee or leasehold interest to a parcel of real property at or adjacent to the related mall (each an “Acquired Parcel”) in connection with the release of one or more parcels of the Christiana Mall Property (each, an “Exchange Parcel”), provided that, among other conditions, (i) the borrower provides at least 20 days’ prior written notice, (ii) the Acquired Parcel is reasonably equivalent in value to the Exchange Parcel, (iii) the Exchange Parcel must be vacant, non-income producing and unimproved or improved only by landscaping, utility facilities that are readily relocatable or surface parking areas, (iv) the borrower pays the lender a fee in the amount of $10,000, along with any reasonable out-of-pocket expenses, (v) the borrower delivers a satisfactory environmental report covering the Acquired Parcel (unless the Acquired Parcel is covered by the environmental report received by the lender in connection with the origination of the mortgage loan) and (vi) after giving effect to such substitution, the loan-to-value ratio is less than or equal to 125%, provided that the borrower may prepay the “qualified amount” in order to meet such loan-to-value ratio.
Target Purchase and Put Options.Target constructed its own store on a 10.15-acre site which is ground leased from the borrower. The ground lease agreement with Target provides that Target has a fair market value purchase option to acquire the fee interest from the borrower in the Target property at any time during the ground lease term. The ground lease with Target has an initial term which runs through December 2036 and also includes five, 10-year and one final, 5-year renewal option. The Target lease does not have any minimum rent but does require Target to make a contribution (currently $139,557 per year) towards the common area maintenance (“CAM”). The Target lease states that, should Target exercise its purchase option, Target would still be obligated to pay its CAM contribution to the borrower through its lease term. The appraisal concluded that the exclusion of Target from the Christiana Mall Property in the appraisal would not affect the value of the Christiana Mall Property.
The lender agrees to release the Target parcel from the lien of the mortgage if and when Target exercises its purchase option pursuant to the terms of the Target lease upon satisfaction of certain conditions, which include, but are not limited to, the following:
| (i) | the borrower agrees that the purchase option will not be exercised in the event that (a) the borrower, or controlling affiliate of the borrower, acquires Target’s interest under its lease and (b) such option had not therefore been exercised in accordance with Target’s lease; |
| (ii) | the loan-to-value ratio immediately after the release of the Target parcel must be less than or equal to 125% and the borrower must repay the “qualified amount” (with payment of the yield maintenance premium amount calculated based upon the amount prepaid), in order to meet the foregoing loan-to-value ratio; |
| (iii) | the borrower must cause all proceeds from the sale of the Target parcel to be deposited into the clearing account to be applied in the same manner as rents; and |
| (iv) | the borrower must pay a fee in the amount of $10,000. |
Pursuant to the terms set forth in the Target lease, Target has the unilateral right to require the borrower to purchase the improvements located on the Target parcel owned by Target (the “Target Improvements”) and/or, if Target is then the fee owner of the Target parcel (pursuant to the exercise of its purchase option or otherwise), the fee interest in the Target parcel, for the lesser of fair market value or book value (the “Put Option”). On or prior to the anticipated date of the conveyance of the Target Improvements pursuant to the exercise by Target of the Put Option, the borrower must execute and deliver to the lender any amendment or modification to the mortgage or similar documents reasonably necessary in order to confirm that the lien of the mortgage attaches to the Target Improvements, in form and substance reasonably satisfactory to the lender.
Subordinate and Mezzanine Indebtedness.Barclays Bank PLC, Société Générale and Deutsche Bank AG, New York Branch funded the subordinate Christiana Mall B Notes to Christiana Mall LLC, a Delaware limited liability company. The Christiana Mall B Notes accrue interest at a rate of 4.2775% per annum. The Christiana Mall B Notes are coterminous with the Christiana Mall Senior Loan. The holders of the Christiana Mall Senior Loan and the Christiana Mall B Notes have entered into a co-lender agreement which sets forth the allocation of collections on the Christiana Mall Whole Loan.
The borrower has the one-time right to obtain a mezzanine loan subject to terms and conditions set forth in the loan documents including that (i) no event of default is continuing, (ii) the principal amount of the permitted mezzanine debt cannot be greater than an amount equal to the amount which will yield (x) an aggregate LTV ratio that does not exceed 95.0% of the closing date LTV ratio and (y) an aggregate forward looking DSCR ratio that is not less than 105.0% of the closing date DSCR as determined by the lender, (iii) the lender has received a rating agency confirmation, (iv) the execution of a market intercreditor agreement acceptable to the lender, (v) the mezzanine loan will be interest-only and coterminous with the Christiana Mall Whole Loan maturity date, and (vi) the mezzanine borrower must acquire and maintain an interest rate cap or swap agreement if the mezzanine loan bears a floating interest rate.
Terrorism Insurance.The Christiana Mall borrower is required to obtain and maintain property insurance for full replacement cost, public liability insurance, and rental loss and/or business interruption insurance for 36 months plus 12 months of extended indemnity that covers perils of terrorism and acts of terrorism, provided, in the event that the Terrorism Risk Insurance Program Reauthorization Act of 2007 or similar is not in effect, borrower will only be obligated to carry terrorism insurance if commercially available and, in such event, subject to a cap equal to two times the premium for the property and business interruption and rental loss coverage.
THE INFORMATION IN THIS STRUCTURAL AND COLLATERAL TERM SHEET IS NOT COMPLETE AND MAY BE AMENDED PRIOR TO THE TIME OF SALE. THIS TERM SHEET IS NOT AN OFFER TO SELL THESE SECURITIES AND IT IS NOT A SOLICITATION OF AN OFFER TO BUY THESE SECURITIES IN ANY JURISDICTION WHERE THE OFFER OR SALE IS NOT PERMITTED.
67
(THIS PAGE INTENTIONALLY LEFT BLANK)
THE INFORMATION IN THIS STRUCTURAL AND COLLATERAL TERM SHEET IS NOT COMPLETE AND MAY BE AMENDED PRIOR TO THE TIME OF SALE. THIS TERM SHEET IS NOT AN OFFER TO SELL THESE SECURITIES AND IT IS NOT A SOLICITATION OF AN OFFER TO BUY THESE SECURITIES IN ANY JURISDICTION WHERE THE OFFER OR SALE IS NOT PERMITTED.
68
SHOWCASE II
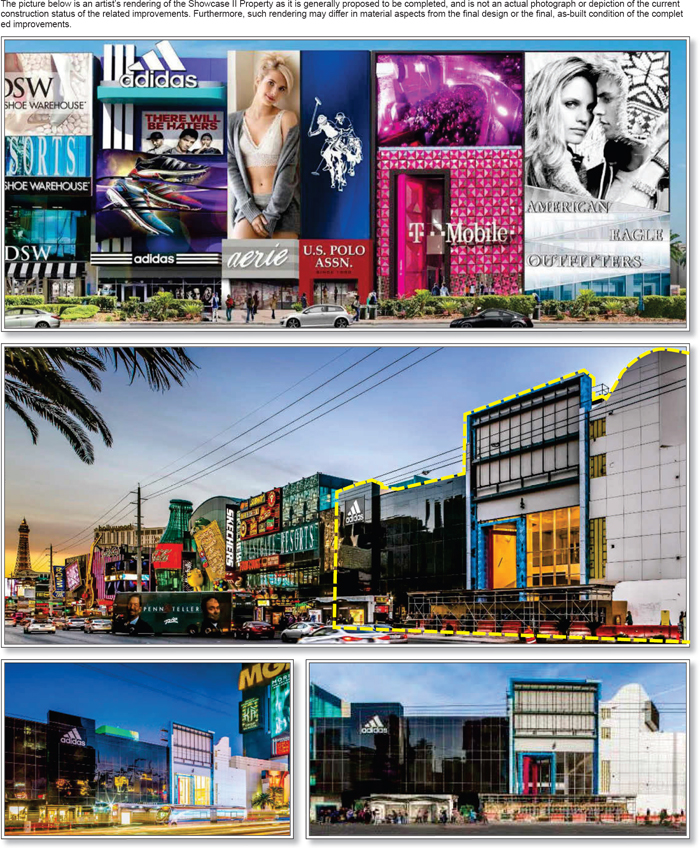
THE INFORMATION IN THIS STRUCTURAL AND COLLATERAL TERM SHEET IS NOT COMPLETE AND MAY BE AMENDED PRIOR TO THE TIME OF SALE. THIS TERM SHEET IS NOT AN OFFER TO SELL THESE SECURITIES AND IT IS NOT A SOLICITATION OF AN OFFER TO BUY THESE SECURITIES IN ANY JURISDICTION WHERE THE OFFER OR SALE IS NOT PERMITTED.
69
SHOWCASE II
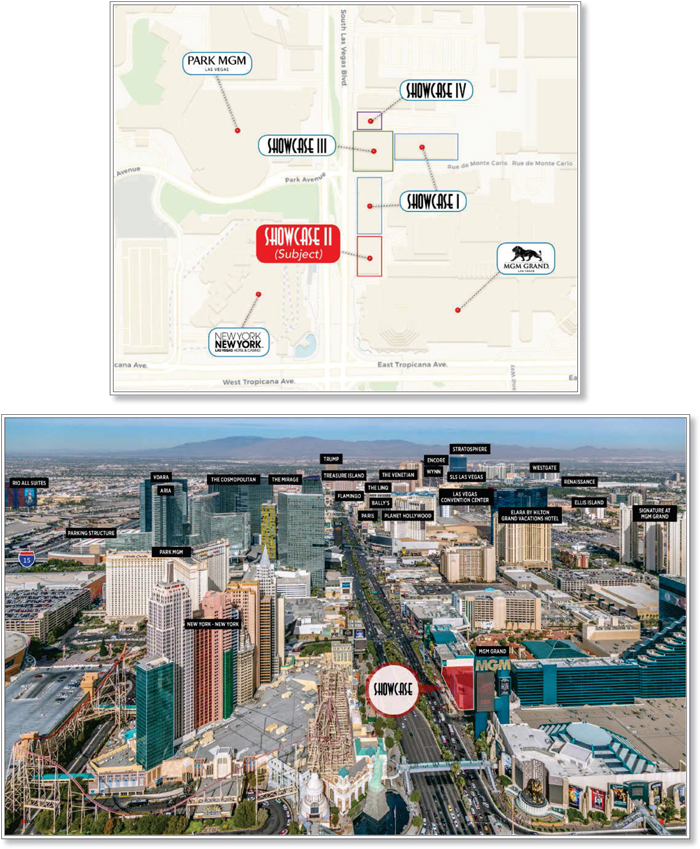
THE INFORMATION IN THIS STRUCTURAL AND COLLATERAL TERM SHEET IS NOT COMPLETE AND MAY BE AMENDED PRIOR TO THE TIME OF SALE. THIS TERM SHEET IS NOT AN OFFER TO SELL THESE SECURITIES AND IT IS NOT A SOLICITATION OF AN OFFER TO BUY THESE SECURITIES IN ANY JURISDICTION WHERE THE OFFER OR SALE IS NOT PERMITTED.
70
SHOWCASE II
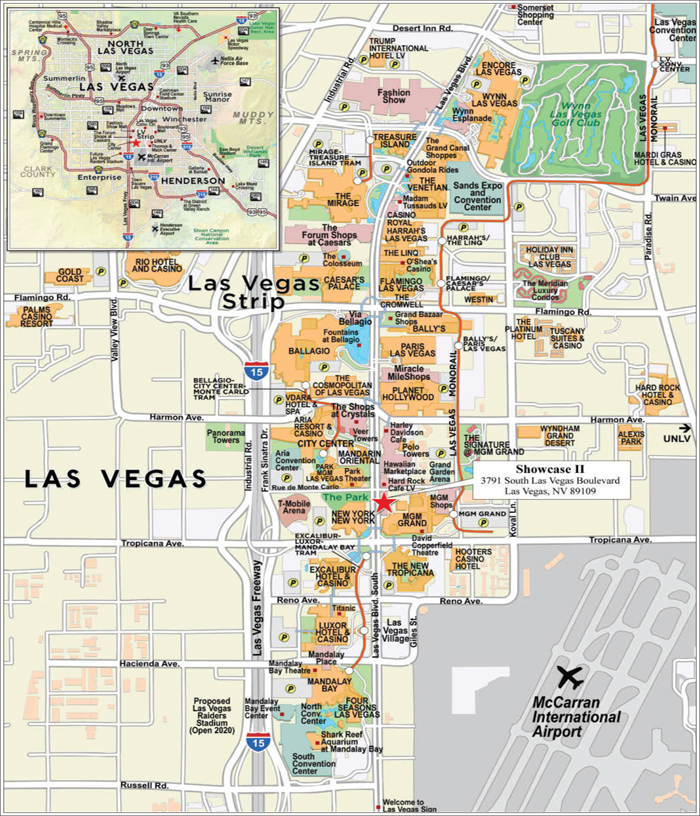
THE INFORMATION IN THIS STRUCTURAL AND COLLATERAL TERM SHEET IS NOT COMPLETE AND MAY BE AMENDED PRIOR TO THE TIME OF SALE. THIS TERM SHEET IS NOT AN OFFER TO SELL THESE SECURITIES AND IT IS NOT A SOLICITATION OF AN OFFER TO BUY THESE SECURITIES IN ANY JURISDICTION WHERE THE OFFER OR SALE IS NOT PERMITTED.
71
| No. 4 – Showcase II | |||||||
| Loan Information | Property Information | ||||||
| Mortgage Loan Seller: | Wells Fargo Bank, National Association | Single Asset/Portfolio: | Single Asset | ||||
| Credit Assessment (DBRS/Fitch/Moody’s): | NR/NR/NR | Property Type: | Retail | ||||
| Original Principal Balance(1): | $45,000,000 | Specific Property Type: | Anchored | ||||
| Cut-off Date Balance(1): | $45,000,000 | Location: | Las Vegas, NV | ||||
| % of Initial Pool Balance: | 4.7% | Size: | 41,407 SF | ||||
| Loan Purpose: | Refinance | Cut-off Date Balance Per SF(1): | $3,091.26 | ||||
| Borrower Names: | SG Island Plaza LLC; Nakash Showcase II, LLC; Nakash Holding Island Plaza LLC; EG Island Plaza LLC; JG Island Plaza LLC | Year Built/Renovated: | 2001/2018 | ||||
| Borrower Sponsors: | Nakash Properties LLC; Nakash Holding LLC; Eli Gindi; Jeffrey Gindi | Title Vesting: | Fee | ||||
| Mortgage Rate: | 4.8963% | Property Manager: | Self-managed | ||||
| Note Date: | April 24, 2018 | 4th Most Recent Occupancy (As of): | 100.0% (12/31/2014) | ||||
| Anticipated Repayment Date: | NAP | 3rd Most Recent Occupancy (As of): | 100.0% (12/31/2015) | ||||
| Maturity Date: | May 11, 2028 | 2nd Most Recent Occupancy (As of): | 100.0% (12/31/2016) | ||||
| IO Period: | 120 months | Most Recent Occupancy (As of)(4): | 76.8% (12/31/2017) | ||||
| Loan Term (Original): | 120 months | Current Occupancy (As of): | 100.0% (7/1/2018) | ||||
| Seasoning: | 5 months | ||||||
| Amortization Term (Original): | NAP | Underwriting and Financial Information: | |||||
| Loan Amortization Type: | Interest-only, Balloon | ||||||
| Interest Accrual Method: | Actual/360 | 4th Most Recent NOI(5): | NAV | ||||
| Call Protection: | L(29),D(87),O(4) | 3rd Most Recent NOI(5): | NAV | ||||
| Lockbox Type: | Hard/Upfront Cash Management | 2nd Most Recent NOI(5): | NAV | ||||
| Additional Debt(1)(2): | Yes | Most Recent NOI(5): | NAV | ||||
| Additional Debt Type(1)(2): | Pari Passu; Mezzanine | ||||||
| U/W Revenues: | $11,287,376 | ||||||
| U/W Expenses: | $890,855 | ||||||
| U/W NOI: | $10,396,521 | ||||||
| Escrows and Reserves(3): | U/W NCF: | $10,302,429 | |||||
| U/W NOI DSCR(1): | 1.64x | ||||||
| U/W NCF DSCR(1): | 1.62x | ||||||
| Type: | Initial | Monthly | Cap (If Any) | U/W NOI Debt Yield(1): | 8.1% | ||
| Taxes | $26,118 | $8,706 | NAP | U/W NCF Debt Yield(1): | 8.0% | ||
| Insurance | $41,517 | $6,920 | NAP | As-Stabilized Appraised Value(6): | $237,000,000 | ||
| Replacement Reserve | $0 | $6,909 | NAP | As-Stabilized Appraisal Valuation Date(6): | April 1, 2019 | ||
| Rent Concession Reserve | $1,116,622 | $0 | NAP | Cut-off Date LTV Ratio(1)(6): | 54.0% | ||
| Existing TI/LC Reserve | $8,563,335 | $0 | NAP | LTV Ratio at Maturity or ARD(1)(6): | 54.0% | ||
| (1) | The Showcase II Mortgage Loan (as defined below) is part of the Showcase II Whole Loan (as defined below), which comprises three pari passu notes with an aggregate original principal balance of $128,000,000. All statistical information related to the Cut-off Date Balance per SF, U/W NOI Debt Yield, U/W NCF Debt Yield, U/W NOI DSCR, U/W NCF DSCR, Cut-off Date LTV Ratio and LTV Ratio at Maturity or ARD are based on the Showcase II Whole Loan. |
| (2) | The equity interest in the Showcase II Borrower (as defined below) has been pledged to secure mezzanine indebtedness with an original principal balance of $37,000,000. As of the Cut-off Date, the U/W NOI Debt Yield, U/W NCF DSCR and Cut-off Date LTV Ratio based on the Showcase II Total Debt (as defined below) are 6.3%, 1.15x and 69.6%, respectively. See “Subordinate and Mezzanine Indebtedness”. |
| (3) | See “Escrows” section. |
| (4) | See “Historical Occupancy” section. |
| (5) | Historical operating statements are not applicable as the Showcase II Property has undergone significant recent renovations and reconfiguration (see “The Property” section). |
| (6) | The Appraised Value, Cut-off Date LTV Ratio and LTV Ratio at Maturity or ARD are based on the appraiser’s “Prospective Market Value Upon Stabilization” as of April 1, 2019, which assumes that tenants with executed leases have opened for business and that contractual tenant improvement and leasing commission (“TI/LC”) obligations and landlord work expenditures have been fulfilled. The Showcase II Borrower deposited upfront reserves totaling $8,563,335 for such contractual TI/LC and landlord work obligations and $1,116,622 for gap rent for tenants with rent abatement periods through September 2018 (see “Escrows” section). The appraiser concluded to an “as-is” Appraised Value of $215,000,000 (as of February 27, 2018), which would result in a Cut-off Date LTV Ratio of 59.5% based on the Showcase II Whole Loan and a Cut-off Date LTV Ratio of 76.7% based on the Showcase II Total Debt. |
The Mortgage Loan. The mortgage loan (the “Showcase II Mortgage Loan”) is part of a whole loan (the “Showcase II Whole Loan”) evidenced by threepari passu notes secured by a first mortgage encumbering the fee interest in an anchored retail shopping center located in Las Vegas, Nevada (the “Showcase II Property”). The Showcase II Whole Loan was originated on April 24, 2018 by Wells Fargo Bank, National Association. The Showcase II Whole Loan had an original principal balance of $128,000,000, has an outstanding principal balance as of the Cut-off Date of $128,000,000 and accrues interest at an interest rate of 4.8963%per annum. The Showcase II Whole Loan had an initial term of 120 months, has a remaining term of 115 months as of the Cut-off Date and requires payments of interest-only through the loan term. The Showcase II Whole Loan matures on May 11, 2028.
THE INFORMATION IN THIS STRUCTURAL AND COLLATERAL TERM SHEET IS NOT COMPLETE AND MAY BE AMENDED PRIOR TO THE TIME OF SALE. THIS TERM SHEET IS NOT AN OFFER TO SELL THESE SECURITIES AND IT IS NOT A SOLICITATION OF AN OFFER TO BUY THESE SECURITIES IN ANY JURISDICTION WHERE THE OFFER OR SALE IS NOT PERMITTED.
72
SHOWCASE II
The non-controlling Note A-3, which will be contributed to the WFCM 2018-C47 securitization trust, had an original principal balance of $45,000,000, has an outstanding principal balance as of the Cut-off Date of $45,000,000 and represents a non-controlling interest in the Showcase II Whole Loan. The controlling Note A-1 had an original principal balance of $50,000,000, has an outstanding principal balance as of the Cut-off Date of $50,000,000 and was contributed to the BANK 2018-BNK13 trust. The non-controlling Note A-2 had an original principal balance of $33,000,000, has an outstanding principal balance as of the Cut-off Date of $33,000,000 and was contributed to the WFCM 2018-C46 trust. The mortgage loans evidenced by Notes A-1 and A-2 are collectively referred to herein as the “Showcase II Companion Loans”. See “Description of the Mortgage Pool—The Whole Loans—The Serviced Pari Passu Whole Loans” and “Pooling and Servicing Agreement” in the Preliminary Prospectus.
Note Summary
| Notes | Original Balance | Note Holder | Controlling Interest | |
| A-1 | $50,000,000 | BANK 2018-BNK13 | Yes | |
| A-2 | $33,000,000 | WFCM 2018-C46 | No | |
| A-3 | $45,000,000 | WFCM 2018-C47 | No | |
| Total | $128,000,000 |
Following the lockout period, on any date before February 11, 2028, the borrower has the right to defease the Showcase II Whole Loan in whole, but not in part. In addition, the Showcase II Whole Loan is prepayable without penalty on or after February 11, 2028. The lockout period will expire on the earlier to occur of (i) two years after the closing date of the securitization that includes the last note to be securitized and (ii) June 11, 2022.
Sources and Uses
| Sources | Uses | |||||||
| Original whole loan amount | $128,000,000 | 77.6% | Loan payoff(1) | $76,289,680 | 46.2% | |||
| Mezzanine debt(2) | $37,000,000 | 22.4 | Upfront reserves | 9,747,592 | 5.9 | |||
| Closing costs | 2,435,150 | 1.5 | ||||||
| Return of equity | 76,527,578 | 46.4 | ||||||
| Total Sources | $165,000,000 | 100.0% | Total Uses | $165,000,000 | 100.0% |
| (1) | Loan payoff includes an existing senior loan ($61,158,880) and existing mezzanine loan ($15,130,800). |
| (2) | See “Subordinate and Mezzanine Indebtedness” section. |
The Property.The Showcase II Property consists of 41,407 square feet of specialty retail space within the larger Showcase retail development in Las Vegas, Nevada. The Showcase II Property is situated on 0.7 acres of land and comprises a two-story retail center featuring direct frontage, exposure and tenant access from the Las Vegas Strip (“The Strip”). The building is currently being renovated and is expected to feature a 32-foot front façade height to maximize signage and exposure from The Strip. The overall Showcase retail development, which is owned by affiliates of the Showcase II Borrower, comprises four phases totaling approximately 350,917 square feet of specialty and entertainment retail space (of which approximately 309,510 square feet does not serve as collateral for the Showcase II Whole Loan) with tenants and attractions including World of Coca-Cola, M&M’s World and Hard Rock Café. As of July 1, 2018, the Showcase II Property was 100.0% leased to six tenants.
Following the borrower sponsor’s acquisition of the Showcase II Property in December 2015, the borrower sponsor has been renovating and redeveloping the existing improvements and has spent over $44.9 million on tenant buyouts, tenant allowances and capital and legal expenditures. Prior to a recent reconfiguration, the Showcase II Property was fully occupied by two tenants with Grand Canyon Shops occupying 52.8% of the net rentable area (22,190 square feet) and Adidas occupying the remaining 47.2% of net rentable area (19,835 square feet). In 2016, the borrower sponsor negotiated a mutual release and discharge and terminated Grand Canyon Shops’ lease in exchange for a $20.8 million termination payment and also negotiated a downsizing of the Adidas space to 10,350 square feet. The Showcase II Property now comprises five retail suites and a sidewalk kiosk.
The Showcase II Property does not contain on-site parking; however, parking is available within both the adjacent parking garage at the non-collateral portion of the Showcase development and the MGM Grand garage (located approximately 0.5 miles east of the Showcase II Property). Per the zoning report, parking requirements are satisfied via these neighboring garages.
Major Tenants. The largest tenant at the Showcase II Property by underwritten rent is T-Mobile (S&P: BBB+; 29.2% of underwritten base rent). T-Mobile recently announced a proposed $26 billion dollar acquisition of Sprint, which was under review by the Federal Communications Commission as of September 11, 2018. The Showcase II Property location is T-Mobile’s first two-story store and the company’s fifth signature-style store (after New York, Chicago, Miami and Santa Monica). The store has a nightclub theme and features a virtual reality headset demo area, a photo booth, a bar serving non-alcoholic beverages, a concierge desk with tickets to events at the nearby T-Mobile Arena and access to 25 portable phone chargers for in-store use. T-Mobile opened for business at the Showcase II Property in January 2018.
The second largest tenant by underwritten rent is American Eagle (23.6% of underwritten base rent), which is expected to operate a flagship store at the Showcase II Property. American Eagle has taken possession of its space, commenced paying rent and is expected to open by November 2018.
The third largest tenant by underwritten rent is Adidas (21.9% of underwritten base rent). The Adidas store at the Showcase II Property was recently updated with a new design inspired by high school and college stadiums. The store features a test area that uses Run Genie, a tablet-based software that helps employees recommend shoes based on how a customer runs. Adidas has been a tenant at the Showcase II Property since 2004.
THE INFORMATION IN THIS STRUCTURAL AND COLLATERAL TERM SHEET IS NOT COMPLETE AND MAY BE AMENDED PRIOR TO THE TIME OF SALE. THIS TERM SHEET IS NOT AN OFFER TO SELL THESE SECURITIES AND IT IS NOT A SOLICITATION OF AN OFFER TO BUY THESE SECURITIES IN ANY JURISDICTION WHERE THE OFFER OR SALE IS NOT PERMITTED.
73
SHOWCASE II
The fourth largest tenant is Aerie (American Eagle’s lingerie brand; 13.7% of underwritten base rent), and the fifth largest tenant is US Polo (8.2% of underwritten base rent), both of which have taken possession of their spaces but have not yet opened for business. The anticipated rent commencement date for both US Polo and Aerie is October 2, 2018 with estimated opening dates for Aerie in November 2018 and US Polo in January 2019. All outstanding tenant improvement costs and gap rent through September 30, 2018 were reserved upon origination of the Showcase II Whole Loan (see “Escrows” section).
The following table presents certain information relating to the tenancy at the Showcase II Property:
Major Tenants
| Tenant Name | Credit Rating (Fitch/Moody’s/ S&P)(1) | Tenant NRSF | % of NRSF | Annual U/W Base Rent PSF(2) | Annual U/W Base Rent(2) | % of Total Annual U/W Base Rent | Lease Expiration Date |
| Major Tenants | |||||||
| T-Mobile | BBB+/Baa1/BBB+ | 10,249 | 24.8% | $311.25 | $3,190,000 | 29.2% | 1/31/2028(3) |
| American Eagle(4) | NR/NR/NR | 10,960 | 26.5% | $234.95 | $2,575,000 | 23.6% | 1/31/2028(5) |
| Adidas | NR/NR/NR | 10,350 | 25.0% | $231.59 | $2,397,000 | 21.9% | 9/30/2027(6) |
| Aerie(4)(7) | NR/NR/NR | 5,669 | 13.7% | $264.60(7) | $1,500,000(7) | 13.7% | 5/31/2028(8) |
| US Polo(9)(10) | NR/NR/NR | 3,923 | 9.5% | $229.42(9) | $900,000(9) | 8.2% | 5/31/2028(11) |
| Total Major Tenants | 41,151 | 99.4% | $256.66 | $10,562,000 | 96.7% | ||
| Non-Major Tenant(12) | 256 | 0.6% | $1421.19 | $363,825 | 3.3% | ||
| Vacant Space | 0 | 0.0% | |||||
| Collateral Total | 41,407 | 100.0% | $263.86 | $10,925,825 | 100.0% | ||
| (1) | Certain ratings are those of the parent company whether or not the parent company guarantees the lease. |
| (2) | Annual U/W Base Rent PSF and Annual U/W Base Rent include contractual rent steps through January 2019 totaling $212,000. |
| (3) | T-Mobile has three, five-year renewal options, with 12 months’ notice, at rental rates as specified in the lease. |
| (4) | American Eagle and Aerie are affiliated with Schottenstein, which holds a 25.0% equity interest in the Showcase II Borrower (see “The Borrowers and Borrower Sponsors” section). |
| (5) | American Eagle has taken possession of its space, commenced paying rent and is expected to open for business by November 2018. American Eagle has one, five-year renewal option, with 12 months’ notice, at rental rates as specified in the lease. |
| (6) | Adidas has two five-year renewal options, with six months’ notice, at rental rates as specified in the lease. |
| (7) | Aerie has taken possession of its space and is anticipated to begin paying rent on October 2, 2018 and open for business by November 2018. At origination of the Showcase II Whole Loan, a gap rent reserve was required to cover rental payments through the anticipated rent commencement date (see “Escrows” section). |
| (8) | Aerie has one five-year renewal option, with 12 months’ notice, at rental rates as specified in the lease. |
| (9) | US Polo has taken possession of its space and is anticipated to begin paying rent on October 2, 2018 and open for business in January 2019. At origination of the Showcase II Whole Loan, a gap rent reserve was required to cover rental payments through the anticipated rent commencement date. |
| (10) | US Polo is affiliated with Nakash Properties LLC and Nakash Holding LLC, which serve as borrower sponsors for the Showcase II Whole Loan. |
| (11) | US Polo has one, five-year renewal option, with 12 months’ notice, at rental rates as specified in the lease. |
| (12) | The Non-Major Tenant is Vegas.com, a kiosk tenant with a March 31, 2019 lease expiration. Vegas.com has one remaining, three-year renewal option, with six months’ notice, at a rental rate 5.0% greater than its current fixed minimum rent. |
THE INFORMATION IN THIS STRUCTURAL AND COLLATERAL TERM SHEET IS NOT COMPLETE AND MAY BE AMENDED PRIOR TO THE TIME OF SALE. THIS TERM SHEET IS NOT AN OFFER TO SELL THESE SECURITIES AND IT IS NOT A SOLICITATION OF AN OFFER TO BUY THESE SECURITIES IN ANY JURISDICTION WHERE THE OFFER OR SALE IS NOT PERMITTED.
74
SHOWCASE II
The following table presents certain information relating to the lease rollover schedule at the Showcase II Property:
Lease Expiration Schedule(1)(2)
| Year Ending December 31, | No. of Leases Expiring | Expiring NRSF | % of Total NRSF | Cumulative Expiring NRSF | Cumulative % of Total NRSF | Annual U/W Base Rent | % of Total Annual U/W Base Rent | Annual U/W Base Rent PSF |
| MTM | 0 | 0 | 0.0% | 0 | 0.0% | $0 | 0.0% | $0.00 |
| 2018 | 0 | 0 | 0.0% | 0 | 0.0% | $0 | 0.0% | $0.00 |
| 2019 | 1 | 256 | 0.6% | 256 | 0.6% | $363,825 | 3.3% | $1,421.19 |
| 2020 | 0 | 0 | 0.0% | 256 | 0.6% | $0 | 0.0% | $0.00 |
| 2021 | 0 | 0 | 0.0% | 256 | 0.6% | $0 | 0.0% | $0.00 |
| 2022 | 0 | 0 | 0.0% | 256 | 0.6% | $0 | 0.0% | $0.00 |
| 2023 | 0 | 0 | 0.0% | 256 | 0.6% | $0 | 0.0% | $0.00 |
| 2024 | 0 | 0 | 0.0% | 256 | 0.6% | $0 | 0.0% | $0.00 |
| 2025 | 0 | 0 | 0.0% | 256 | 0.6% | $0 | 0.0% | $0.00 |
| 2026 | 0 | 0 | 0.0% | 256 | 0.6% | $0 | 0.0% | $0.00 |
| 2027 | 1 | 10,350 | 25.0% | 10,606 | 25.6% | $2,397,000 | 21.9% | $231.59 |
| 2028 | 4 | 30,801 | 74.4% | 41,407 | 100.0% | $8,165,000 | 74.7% | $265.09 |
| Thereafter | 0 | 0 | 0.0% | 41,407 | 100.0% | $0 | 0.0% | $0.00 |
| Vacant | 0 | 0 | 0.0% | 41,407 | 100.0% | $0 | 0.0% | $0.00 |
| Total/Weighted Average | 6 | 41,407 | 100.0% | $10,925,825 | 100.0% | $263.86 |
| (1) | Information obtained from the underwritten rent roll. |
| (2) | Certain tenants may have lease termination options that are exercisable prior to the originally stated expiration date of the subject lease and that are not considered in the Lease Expiration Schedule. |
The following table presents historical occupancy percentages at the Showcase II Property:
Historical Occupancy
12/31/2014(1) | 12/31/2015(1) | 12/31/2016(1) | 12/31/2017(2) | 7/1/2018(3) |
| 100.0% | 100.0% | 100.0% | 76.8% | 100.0% |
| (1) | Information obtained from a third-party market research provider. |
| (2) | Occupancy as of December 31, 2017 includes T-Mobile, American Eagle, Adidas and the kiosk tenant. Aerie and US Polo each had a lease commencement date in June 2018. |
| (3) | Information obtained from the underwritten rent roll. |
Operating History and Underwritten Net Cash Flow. The following table presents certain information relating to the underwritten net cash flow at the Showcase II Property:
Cash Flow Analysis(1)
| U/W | % of U/W Effective Gross Income | U/W $ per SF | |
| Base Rent | $10,925,825 | 96.8% | $263.86 |
| Total Recoveries | 710,645 | 6.3 | 17.16 |
| Less Vacancy & Credit Loss | (349,094)(2) | (3.2) | (8.43) |
| Effective Gross Income | $11,287,376 | 100.0% | $272.60 |
| Total Operating Expenses | $890,855 | 7.9% | $21.51 |
| Net Operating Income | $10,396,521 | 92.1% | $251.08 |
| Replacement Reserves | 11,180 | 0.1 | 0.27 |
| TI/LC | 82,912 | 0.7 | 2.00 |
| Net Cash Flow | $10,302,429 | 91.3% | $248.81 |
| NOI DSCR(3) | 1.64x | ||
| NCF DSCR(3) | 1.62x | ||
| NOI Debt Yield(3) | 8.1% | ||
| NCF Debt Yield(3) | 8.0% |
| (1) | Historical operating statements are not applicable as the Showcase II Property has recently undergone significant renovations and reconfiguration (see “The Property” section). |
| (2) | The underwritten economic vacancy is 3.2%. The Showcase II Property was 100.0% leased as of July 1, 2018. |
| (3) | The debt service coverage ratios and debt yields are based on the Showcase II Whole Loan. |
THE INFORMATION IN THIS STRUCTURAL AND COLLATERAL TERM SHEET IS NOT COMPLETE AND MAY BE AMENDED PRIOR TO THE TIME OF SALE. THIS TERM SHEET IS NOT AN OFFER TO SELL THESE SECURITIES AND IT IS NOT A SOLICITATION OF AN OFFER TO BUY THESE SECURITIES IN ANY JURISDICTION WHERE THE OFFER OR SALE IS NOT PERMITTED.
75
SHOWCASE II
Appraisal. The appraiser concluded to a “Prospective Market Value Upon Stabilization” for the Showcase II Property of $237,000,000 as of April 1, 2019, which assumes that leased tenants have opened for business and contractual TI/LC obligations and landlord work expenditures have been fulfilled. The Showcase II Borrower deposited upfront reserves totaling $8,563,335 for such contractual TI/LC and landlord work obligations and $1,116,622 for gap rent for tenants with rent abatement periods through September 2018 (see “Escrows” section). The appraiser concluded to an “as-is” Appraised Value of $215,000,000 as of February 27, 2018.
Environmental Matters. According to a Phase I environmental site assessment dated February 28, 2018, there was no evidence of any recognized environmental conditions at the Showcase II Property.
Market Overview and Competition.The Showcase II Property is located in Las Vegas, Nevada, approximately 0.1 miles north of the intersection of Las Vegas Boulevard and Tropicana Avenue, which is the site of four major resorts and casinos including the MGM Grand, New York-New York Hotel and Casino (“New York-New York”), Excalibur Hotel and Casino (“Excalibur”) and Tropicana Las Vegas (“Tropicana”), totaling over 12,500 combined rooms. According to the appraisal, The MGM Grand is the largest single hotel in the U.S. and the third-largest hotel complex in the world with 5,124 rooms. According to the appraisal, Monte Carlo Resort and Casino, located approximately 0.3 miles northwest of the Showcase II Property, is being transformed from a historically mid-level hotel fronting The Strip into a renovated development. Monte Carlo owner MGM Resorts International is partnering with New York hotelier Sydell Group for the ongoing approximately $450 million renovation project. Average foot traffic and traffic count along South Las Vegas Boulevard adjacent to the Showcase II Property is approximately 50,000 pedestrians and 55,000 vehicles, respectively. The Showcase II Property is located approximately 1.4 miles east of Interstate 15 and approximately 1.9 miles northwest of McCarran International Airport.
The Showcase II Property is situated 0.2 miles southeast of The Park, a plaza and outdoor retail and dining area that features multiple restaurants and bars as well as a live music venue that features events every Tuesday and Wednesday evening. Immediately adjacent to The Park is the Park Theater at Park MGM, which features 5,200 seats, a 140-foot wide stage, nine projectors and seven bars and terraces with views of The Strip and The Park. The Park Theater can accommodate configurations for concerts, award shows, combat sports, conventions and basketball. The Park connects The Strip to T-Mobile Arena, located approximately 0.5 miles west of the Showcase II Property. Built in April 2016, T-Mobile Arena is home to the National Hockey League’s (NHL) Vegas Golden Knights and is expected to host 100 to 150 events per year, including concerts, award shows, college basketball games, boxing and major MMA events.
According to the Las Vegas Convention & Visitors Authority, Las Vegas achieved a record 42.9 million visitors in 2016, with average per-trip visitor shopping expenses of $157. Additionally, between 2012 and 2016, the Las Vegas metro area’s annual job growth averaged 3.3%. According to a third-party market research report, the estimated 2017 population within a three- and five-mile radius of the Showcase II Property was approximately 132,125, and 367,283, respectively; while the 2017 estimated average household income within the same radii was $48,706, and $58,830, respectively.
According to a third-party market research report, the Showcase II Property is situated within the Central East Las Vegas Retail submarket. As of year-end 2017, the submarket reported a total inventory of 15.8 million square feet with a 10.6% vacancy rate. Submarket vacancy has decreased from 13.6% in 2011 and has averaged 11.8% over the last six years. The appraiser identified four primary competitive properties for the Showcase II Property totaling approximately 3.8 million square feet, which reported an average occupancy rate of approximately 91.5%. The appraiser concluded to net market rents for the Showcase II Property of $250.00 per square foot, for retail tenants and $1,400.00 per square foot gross for the kiosk tenant.
THE INFORMATION IN THIS STRUCTURAL AND COLLATERAL TERM SHEET IS NOT COMPLETE AND MAY BE AMENDED PRIOR TO THE TIME OF SALE. THIS TERM SHEET IS NOT AN OFFER TO SELL THESE SECURITIES AND IT IS NOT A SOLICITATION OF AN OFFER TO BUY THESE SECURITIES IN ANY JURISDICTION WHERE THE OFFER OR SALE IS NOT PERMITTED.
76
SHOWCASE II
The following table presents certain information relating to comparable leases for the Showcase II Property:
Comparable Leases(1)
| Tenant Name | Tenant Description | Size (SF) | Tenant Opening Date | Base Rent (PSF) | Reimbursements (PSF) | Gross- Equivalent Rent (PSF) |
| Confidential | Specialty food tenant | 698 | Jun-17 | $250.00 | $23.75 | $273.75 |
| Confidential | Specialty food tenant | 4,046 | Dec-16 | $104.85 | $24.75 | $129.60 |
| Confidential | Cosmetics retail tenant | 768 | Aug-16 | $250.00 | $65.96 | $315.96 |
| Confidential | Luxury menswear retailer | 2,500 | Dec-15 | $200.00 | $95.42 | $295.42 |
| Confidential | Specialty chocolates | 492 | Dec-15 | $356.00 | $60.00 | $416.00 |
| Confidential | Specialty retail tenant | 1,400 | Nov-15 | $250.00 | $23.75 | $273.75 |
| Confidential | Upscale shoes | 1,442 | Sep-15 | $225.00 | $95.00 | $320.00 |
| Confidential | Specialty footwear retailer | 3,017 | Sep-15 | $130.00 | $62.69 | $192.69 |
| Confidential | Specialty retail/accessories | 3,733 | Sep-15 | $218.47 | $45.00 | $263.47 |
| Confidential | Specialty food tenant | 11,797 | Sep-15 | $103.81 | $25.75 | $129.56 |
| Confidential | Upscale watches and accessories | 1,276 | Jan-15 | $475.00 | $95.00 | $570.00 |
| Confidential | Specialty jewelry | 731 | Jan-15 | $307.07 | $62.69 | $369.76 |
| Confidential | Specialty food tenant | 1,158 | Sep-14 | $377.47 | $48.27 | $425.74 |
| Confidential | Upscale fashion and accessory retailer | 5,251 | May-14 | $300.00 | $95.00 | $395.00 |
| Confidential | Restaurant/Bar space | 786 | May-14 | $301.39 | $95.00 | $396.39 |
| Confidential | Specialty travel | 938 | May-14 | $243.00 | $23.06 | $266.06 |
| Confidential | Specialty food tenant | 774 | Apr-14 | $255.00 | $23.75 | $278.75 |
| Confidential | Specialty upscale retailer | 715 | Nov-13 | $300.00 | $66.86 | $366.86 |
| Confidential | Upscale watches and accessories | 4,500 | Jul-13 | $300.00 | $95.00 | $395.00 |
| Confidential | Specialty food and coffee | 1,184 | May-13 | $422.30 | $86.00 | $508.30 |
| Confidential | Specialty retail tenant | 1,421 | Jan-12 | $288.75 | $23.75 | $312.50 |
| Confidential | Luxury watch retailer | 789 | Mar-11 | $450.00 | $85.00 | $535.00 |
| Confidential | Women’s apparel and accessories | 5,418 | Feb-10 | $235.00 | $95.00 | $330.00 |
| Weighted Average | $252.94 | $60.10 | $313.05 |
| (1) | Information obtained from the appraisal. |
The table below presents certain information relating to four comparable retail properties to the Showcase II Property identified by the appraiser:
Competitive Set(1)
Showcase II (Subject) | Showcase | Miracle Mile Shops | Fashion Show Mall | Town Square Las Vegas | |
| Location | Las Vegas, NV | Las Vegas, NV | Las Vegas, NV | Las Vegas, NV | Las Vegas, NV |
| Distance from Subject | -- | Adjacent | 0.5 miles | 1.7 miles | 2.5 miles |
| Property Type | Retail/Anchored | Specialty Retail | Fashion/Specialty Center | Super-Regional Center | Lifestyle Center |
| Year Built/Renovated | 2001/2018 | 1997/2013 | 2000/2008 | 1981/2015 | 2007/2015 |
| Anchors | Adidas, American Eagle, T-Mobile, Aerie, US Polo | Coca-Cola, Ross Dress For Less, Hard Rock Café, “M&M’s” | -- | Neiman Marcus, Dillard’s, Macy’s, Saks, Forever 21, Nordstrom, Dick’s Sporting Goods | Saks Off Fifth Avenue, Container Store, H&M, Cinema, Old Navy, Whole Foods |
| Total GLA | 41,407 SF | 347,281 SF | 503,000 SF | 1,875,400 SF | 1,123,000 SF |
| Total Occupancy | 100.0% | 96.0% | 90.0% | 95.0% | 85.0% |
| (1) | Information obtained from the appraisal and the underwritten rent roll. |
The Borrowers and Borrower Sponsors.The borrowers comprise five tenants-in-common: Nakash Showcase II, LLC; Nakash Holding Island Plaza, LLC; SG Island Plaza, LLC; EG Island Plaza LLC and JG Island Plaza LLC (collectively, the “Showcase II Borrower”), each a Delaware limited liability company and single purpose entity with two independent directors. Legal counsel to the Showcase II Borrower delivered a non-consolidation opinion in connection with the origination of the Showcase II Whole Loan. The nonrecourse carve-out guarantors of the Showcase II Whole Loan are Nakash Properties LLC, Nakash Holding LLC, Eli Gindi and Jeffrey Gindi.
THE INFORMATION IN THIS STRUCTURAL AND COLLATERAL TERM SHEET IS NOT COMPLETE AND MAY BE AMENDED PRIOR TO THE TIME OF SALE. THIS TERM SHEET IS NOT AN OFFER TO SELL THESE SECURITIES AND IT IS NOT A SOLICITATION OF AN OFFER TO BUY THESE SECURITIES IN ANY JURISDICTION WHERE THE OFFER OR SALE IS NOT PERMITTED.
77
SHOWCASE II
Schottenstein Realty LLC (“Schottenstein”) holds a 25.0% equity interest in the Showcase II Borrower. Schottenstein is a vertically-integrated owner, operator, acquirer and redeveloper of high quality, power/big box, community and neighborhood shopping centers in major population areas throughout the U.S. Schottenstein owns an interest in a portfolio of more than 156 properties in 27 states in excess of 21 million square feet of gross leasable area.
The borrower sponsors are Nakash Properties LLC, Nakash Holding LLC (“Nakash Holdings”), Eli Gindi and Jeffrey Gindi. Nakash Holdings is the private investment office of the Nakash family, which manages a multi-billion dollar portfolio of investments including aviation, retail, agriculture, transportation, manufacturing and real estate located throughout the world. Eli and Jeffrey Gindi are part of the founding family of the Century 21 department stores and are the managing members in a variety of retail, multifamily and hospitality assets located throughout the United States. Eli and Jeffrey Gindi are also the co-founders and principals of Gindi Capital, a family holding company that invests in commercial real estate.
Affiliates of the Showcase II Borrower acquired phases I, II and III of the Showcase retail development in separate transactions in 2014 and 2015, as well as phase IV (the former Smith & Wollensky building) in 2017 for a total purchase price of approximately $426.9 million (phases I, III and IV do not serve as collateral for the Showcase II Whole Loan).
Escrows.The loan documents provide for upfront reserves of $26,118 for real estate taxes, $41,517 for insurance premiums, $1,116,622 for gap rent related to Aerie ($695,518) and US Polo ($421,105) and $8,563,335 for existing TI/LCs related to American Eagle ($3,500,000), Adidas ($1,018,043), Aerie ($2,654,072) and US Polo ($1,391,220). The loan documents provide for ongoing monthly escrows in an amount equal to one-twelfth of the real estate taxes that the lender estimates will be payable during the next twelve months (initially $8,706), one-twelfth of the insurance premiums that the lender estimates will be payable during the next twelve months (initially $6,920) and $6,909 for capital expenditures.
Lockbox and Cash Management.The Showcase II Whole Loan requires a lender-controlled lockbox account, which is already in place, and that the Showcase II Borrower direct all tenants to pay rent directly into such lockbox account. The loan documents also require that all rents received by the borrower or the property manager be deposited into the lockbox account within three business day of receipt. All funds in the lockbox account are required to be swept each business day into the cash management account controlled by the lender and disbursed on each payment date in accordance with the loan documents. Prior to the occurrence of a Cash Trap Event Period (as defined below), all excess funds are required to be distributed to the borrower. During a Cash Trap Event Period, all excess funds are required to be swept to an excess cash flow subaccount controlled by the lender.
A “Cash Trap Event Period” will commence upon the earliest to occur of the following:
| (i) | an event of default under the Showcase II Whole Loan; |
| (ii) | the net cash flow debt service coverage ratio for the Showcase II Total Debt (see “Subordinate and Mezzanine Indebtedness” section) falling below 1.10x at the end of any calendar quarter; or |
| (iii) | a Major Tenant Cash Trap Event Period (as defined below). |
A Cash Trap Event Period will end upon the occurrence of:
| ● | with regard to clause (i) above, the cure of such event of default; |
| ● | with regard to clause (ii) above, the net cash flow debt service coverage ratio for the Showcase II Total Debt being equal to or greater than 1.10x for two consecutive calendar quarters; or |
| ● | with regard to clause (iii) above, a Major Tenant Cash Trap Event Period Cure (as defined below). |
A “Major Tenant Cash Trap Event Period” will commence upon the earliest to occur of the following:
| (i) | any Major Tenant (as defined below) failing to extend or renew its lease (A) on or prior to the extension or renewal date set forth in its lease or (B) 12 months prior to lease expiration; |
| (ii) | any Major Tenant (A) terminating or cancelling its lease (including, without limitation, rejection in any bankruptcy or similar insolvency proceeding) or (B) failing to otherwise have its lease be in full force and effect; or |
| (iii) | any Major Tenant becoming insolvent or filing for bankruptcy; |
A “Major Tenant Cash Trap Event Period Cure” will occur upon:
| ● | with regard to clause (i) above, (x) such Major Tenant having renewed or extended its lease in accordance with the loan documents and delivered an estoppel in form and substance acceptable to lender, or (y) a Qualified Re-Leasing Event (as defined below); |
| ● | with regard to clause (ii) above, such Major Tenant, as applicable, having revoked or rescinded all termination or cancellation notices with respect to its lease and having re-affirmed the applicable lease as being in full force and effect; or |
| ● | with regard to clause (iii) above, such Major Tenant, as applicable, being no longer insolvent or subject to any bankruptcy or insolvency proceedings and its lease having been affirmed pursuant to a final and non-appealable order of a court of competent jurisdiction. |
A “Qualified Re-Leasing Event” will occur upon one or more replacement tenants acceptable to the lender executing leases covering all of the space currently occupied by any Major Tenant in accordance with the loan documents, as applicable, and delivering an estoppel certificate confirming such replacement tenants having accepted its premises, taken possession thereof and paying full unabated rent. After giving effect to the rents paid under such leases, the net cash flow debt service coverage ratio for the Showcase II Total Debt is required to be equal to or greater than 1.10x for two consecutive calendar quarters.
THE INFORMATION IN THIS STRUCTURAL AND COLLATERAL TERM SHEET IS NOT COMPLETE AND MAY BE AMENDED PRIOR TO THE TIME OF SALE. THIS TERM SHEET IS NOT AN OFFER TO SELL THESE SECURITIES AND IT IS NOT A SOLICITATION OF AN OFFER TO BUY THESE SECURITIES IN ANY JURISDICTION WHERE THE OFFER OR SALE IS NOT PERMITTED.
78
SHOWCASE II
“Major Tenant” will mean (i) any tenant that accounts for 20.0% or more of the total rental income for the Showcase II Property, (ii) any lease which contains any option, offer, right of first refusal or other similar entitlement to acquire the fee interest in all or any portion of the Showcase II Property, or (iii) any instrument guaranteeing or providing credit support for any lease meeting the requirements of (i) or (ii) above.
Property Management. The Showcase II Property is managed by an affiliate of the Showcase II Borrower.
Assumption. The borrower has a two-time right, commencing 12 months after loan origination, to transfer the Showcase II Property, provided that certain conditions are satisfied, including (i) no event of default has occurred and is continuing; (ii) the lender has reasonably determined that the proposed transferee and guarantor satisfy the lender’s credit review and underwriting standards, taking into consideration the transferee’s experience, financial strength and general business standing; (iii) to the extent there is a tenant-in-common interest after such transfer (x) the transfer must not create more than five tenant-in-common owners of the Showcase II Property and (y) each tenant-in-common owner must be at least 51% owned and controlled by sponsorship approved by lender; and (iv) if required by the lender, rating agency confirmation from DBRS, Fitch and Moody’s that the transfer will not result in a downgrade, withdrawal or qualification of the respective ratings assigned to the Series 2018-C47 Certificates and similar confirmations from each rating agency rating any securities backed by the Showcase II Companion Loans with respect to the ratings of such securities.
Partial Release. Not permitted.
Real Estate Substitution.Not permitted.
Subordinate and Mezzanine Indebtedness.Wells Fargo Bank, National Association, funded and placed with Nonghyup Bank, as the Trustee of Vestas Qualified Investors Private Real Estate Fund Investment Trust No. 35, a $37,000,000 mezzanine loan (the “Showcase II Mezzanine Loan”) to five tenants-in-common: Nakash Showcase II Mezz LLC; Nakash Holding Island Plaza Mezz LLC; SG Island Plaza Mezz LLC; EG Island Plaza Mezz LLC; and JG Island Plaza Mezz LLC, each a Delaware limited liability company (collectively, the Showcase II Whole Loan and the Showcase II Mezzanine Loan are referred to herein as the “Showcase II Total Debt”). The Showcase II Mezzanine Loan is secured by 100.0% of the direct equity interest in the Showcase II Borrower. The Showcase II Mezzanine Loan accrues interest at a rate of 7.0000% per annum and requires payments of interest-only through the maturity date of May 11, 2028 (co-terminus with the Showcase II Whole Loan).
Ground Lease. None.
Terrorism Insurance.The Showcase II Whole Loan documents require that the “all risk” insurance policy required to be maintained by the borrower provides coverage for terrorism in an amount equal to the full replacement cost of the Showcase II Property, as well as business interruption insurance covering no less than the 18-month period following the occurrence of a casualty event, together with a 6-month extended period of indemnity (provided that if TRIPRA or a similar statute is not in effect, the borrower will not be obligated to pay terrorism insurance premiums in excess of two times the premium for the casualty and business interruption coverage on a stand-alone basis).
THE INFORMATION IN THIS STRUCTURAL AND COLLATERAL TERM SHEET IS NOT COMPLETE AND MAY BE AMENDED PRIOR TO THE TIME OF SALE. THIS TERM SHEET IS NOT AN OFFER TO SELL THESE SECURITIES AND IT IS NOT A SOLICITATION OF AN OFFER TO BUY THESE SECURITIES IN ANY JURISDICTION WHERE THE OFFER OR SALE IS NOT PERMITTED.
79
VIRGINIA BEACH HOTEL PORTFOLIO
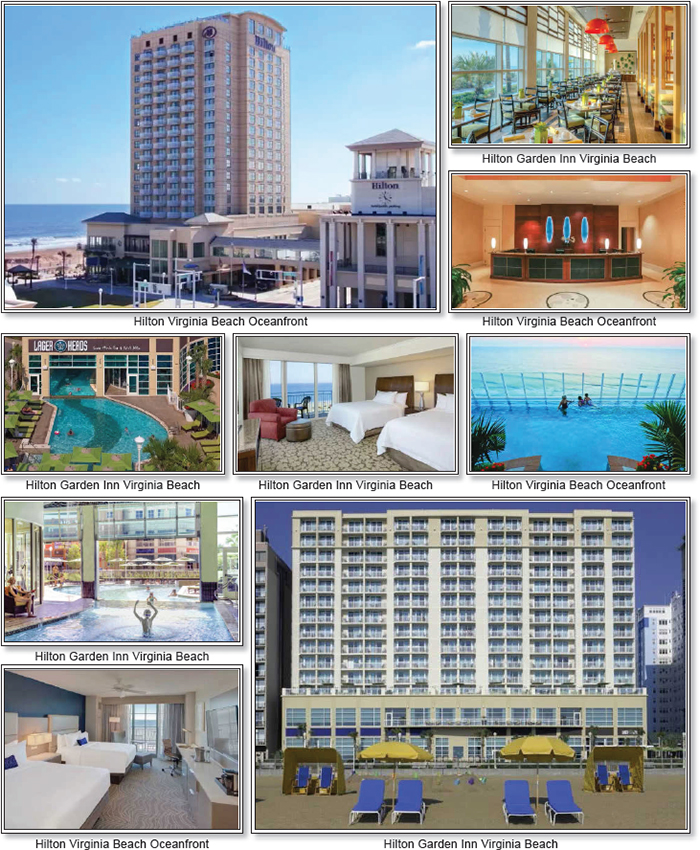
THE INFORMATION IN THIS STRUCTURAL AND COLLATERAL TERM SHEET IS NOT COMPLETE AND MAY BE AMENDED PRIOR TO THE TIME OF SALE. THIS TERM SHEET IS NOT AN OFFER TO SELL THESE SECURITIES AND IT IS NOT A SOLICITATION OF AN OFFER TO BUY THESE SECURITIES IN ANY JURISDICTION WHERE THE OFFER OR SALE IS NOT PERMITTED.
80
VIRGINIA BEACH HOTEL PORTFOLIO
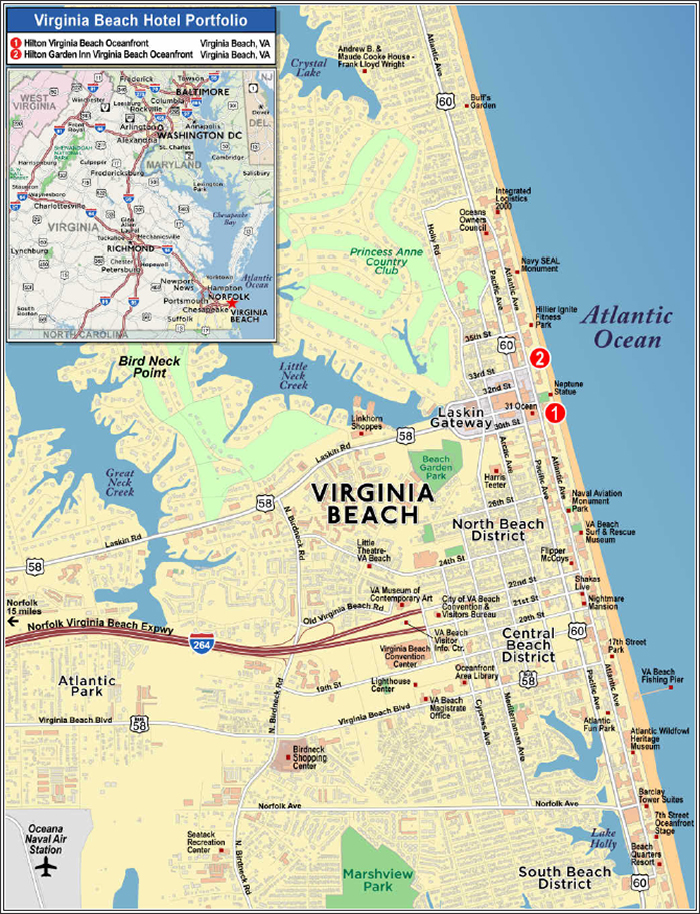
THE INFORMATION IN THIS STRUCTURAL AND COLLATERAL TERM SHEET IS NOT COMPLETE AND MAY BE AMENDED PRIOR TO THE TIME OF SALE. THIS TERM SHEET IS NOT AN OFFER TO SELL THESE SECURITIES AND IT IS NOT A SOLICITATION OF AN OFFER TO BUY THESE SECURITIES IN ANY JURISDICTION WHERE THE OFFER OR SALE IS NOT PERMITTED.
81
| No. 5 – Virginia Beach Hotel Portfolio | |||||||||
| Loan Information | Property Information | ||||||||
| Mortgage Loan Seller: | Barclays Bank PLC | Single Asset/Portfolio: | Portfolio | ||||||
| Credit Assessment (DBRS/Fitch/Moody’s): | NR/NR/NR | Property Type: | Hospitality | ||||||
| Original Principal Balance(1): | $45,000,000 | Specific Property Type: | Full Service | ||||||
| Cut-off Date Balance(1): | $45,000,000 | Location: | Virginia Beach, VA | ||||||
| % of Initial Pool Balance: | 4.7% | Size: | 456 Rooms | ||||||
| Loan Purpose: | Acquistion | Cut-off Date Balance Per Room(1): | $197,368 | ||||||
| Borrowers: | 3001 Altlantic, LLC; 3315 Atlantic, LLC | Year Built/Renovated: | Various | ||||||
| Borrower Sponsors: | Neil P. Amin; Jay B. Shah | Title Vesting(4): | Fee/Leasehold | ||||||
| Mortgage Rate: | 4.9125% | Property Manager: | Self-managed | ||||||
| Note Date: | August 31, 2018 | 4th Most Recent Occupancy (As of)(5): | NAV | ||||||
| Anticipated Repayment Date: | NAP | 3rd Most Recent Occupancy (As of): | 71.5% (12/31/2015) | ||||||
| Maturity Date: | September 6, 2028 | 2nd Most Recent Occupancy (As of): | 75.5% (12/31/2016) | ||||||
| IO Period: | 24 months | Most Recent Occupancy (As of): | 76.8% (12/31/2017) | ||||||
| Loan Term (Original): | 120 months | Current Occupancy (As of): | 76.0% (5/31/2018) | ||||||
| Seasoning: | 1 month | ||||||||
| Amortization Term (Original): | 360 months | Underwriting and Financial Information: | |||||||
| Loan Amortization Type: | Interest-only, Amortizing Balloon | 4thMost Recent NOI (As of): | $11,341,568 (12/31/2015) | ||||||
| Interest Accrual Method: | Actual/360 | 3rdMost Recent NOI (As of): | $12,284,627 (12/31/2016) | ||||||
| Call Protection(2): | L(25),D(91),O(4) | 2ndMost Recent NOI (As of): | $12,509,547 (12/31/2017) | ||||||
| Lockbox Type: | Springing | Most Recent NOI (As of): | $11,841,080 (TTM 5/31/2018) | ||||||
| Additional Debt(1): | Yes | ||||||||
| Additional Debt Type(1): | Pari Passu | U/W Revenues(6): | $30,113,592 | ||||||
| U/W Expenses: | $18,324,515 | ||||||||
| U/W NOI: | $11,789,077 | ||||||||
| U/W NCF: | $10,584,533 | ||||||||
| Escrows and Reserves(3): | U/W NOI DSCR(1): | 2.05x | |||||||
| U/W NCF DSCR(1): | 1.84x | ||||||||
| Type: | Initial | Monthly | Cap (If Any) | U/W NOI Debt Yield(1): | 13.1% | ||||
| Taxes | $326,006 | $81,502 | NAP | U/W NCF Debt Yield(1): | 11.8% | ||||
| Insurance | $0 | $28,642 | NAP | As-Stabilized Appraised Value(7): | $130,400,000 | ||||
| FF&E Reserve | $0 | $104,329 | $3,755,852 | As-Stabilized Appraisal Valuation Date(7): | Various | ||||
| HGI PIP Reserve | $741,954 | NAP | NAP | Cut-off Date LTV Ratio(1)(7): | 69.0% | ||||
| Parking and Retail Lease Reserve | $0 | Springing | NAP | LTV Ratio at Maturity or ARD(1)(7): | 59.6% | ||||
| (1) | See “The Mortgage Loan” section. All statistical information related to balance per room, loan-to-value ratios, debt service coverage ratios, and debt yields are based on the Virginia Beach Hotel Portfolio Whole Loan (as defined below). |
| (2) | Defeasance of the Virginia Beach Hotel Portfolio Whole Loan is permitted at any time after the earlier to occur of (i) two years after the closing date that includes the last note to be securitized or (ii) August 31, 2021. The assumed lockout period of 25 payments is based on the expected WFCM 2018-C47 securitization trust closing date in October 2018. |
| (3) | See “The Escrows” section. |
| (4) | See “Leasehold Interest” section. |
| (5) | The 4thMost Recent Occupancy is not available because the Hilton Garden Inn Virginia Beach Oceanfront property opened in 2014. |
| (6) | See “The Cash Flow Analysis” section. |
| (7) | The Appraised Value, Cut-off Date LTV Ratio and LTV Ratio at Maturity or ARD are based on the appraiser’s prospective as-is value, which assumes that 50.0% of expected PIP work ($1,000,000) would be escrowed by the lender and would be available to a prospective buyer to fund the PIP work at the Hilton Garden Inn Virginia Beach property. The Virginia Beach Hotel Portfolio Borrowers (as defined below) deposited upfront PIP reserves totaling $741,954, which represents 50.0% of the engineer’s updated estimated costs of the remaining PIP work (see “Escrows” section). The balance of the remaining PIP work will be funded by the monthly FF&E reserve in an amount of 1/12th of 5.0% of the gross income from operations (initially $104,329 for the portfolio). For the Hilton Garden Inn Virginia Beach Oceanfront property, the appraiser concluded an as-is appraised value without the PIP assumption of $44,600,000 which results in a total appraised value for the portfolio of $129,400,000, and a Cut-off Date LTV Ratio and LTV Ratio at Maturity or ARD of 69.6% and 60.0%, respectively. |
The Mortgage Loan. The mortgage loan (the “Virginia Beach Hotel Portfolio Mortgage Loan”) is part of a whole loan (the “Virginia Beach Hotel Portfolio Whole Loan”) evidenced by three pari passu promissory notes that are secured by a first lien mortgage on the borrowers’ fee and leasehold interest in two full-service hotels located in Virginia Beach, Virginia (the “Virginia Beach Hotel Portfolio Properties”). The Virginia Beach Hotel Portfolio Whole Loan was originated on August 31, 2018 by Barclays Bank PLC. The Virginia Beach Hotel Portfolio Whole Loan had an original principal balance of $90,000,000, has an outstanding principal balance as of the Cut-off Date of $90,000,000 and accrues interest at an interest rate of 4.9125% per annum. The Virginia Beach Hotel Portfolio Whole Loan had an original term of 120 months, has a remaining term of 119 months as of the Cut-off Date, and requires interest-only payments for the first 24 payment periods followed by payments of principal and interest and requires payments based on a 360-month amortization schedule through the term of the Virginia Beach Hotel Portfolio Whole Loan. The Virginia Beach Hotel Portfolio Whole Loan
THE INFORMATION IN THIS STRUCTURAL AND COLLATERAL TERM SHEET IS NOT COMPLETE AND MAY BE AMENDED PRIOR TO THE TIME OF SALE. THIS TERM SHEET IS NOT AN OFFER TO SELL THESE SECURITIES AND IT IS NOT A SOLICITATION OF AN OFFER TO BUY THESE SECURITIES IN ANY JURISDICTION WHERE THE OFFER OR SALE IS NOT PERMITTED.
82
VIRGINIA BEACH HOTEL PORTFOLIO
matures on September 6, 2028. The Virginia Beach Hotel Portfolio Mortgage Loan, evidenced by the controlling Note A-1, which had an aggregate original principal balance of $45,000,000, and has an outstanding aggregate principal balance as of the Cut-off Date of $45,000,000. The non-controlling Notes A-2 and A-3 had an aggregate original principal balance of $45,000,000, have an outstanding aggregate principal balance as of the Cut-off Date of $45,000,000, and are held by Barclays Bank PLC and expected to be contributed to future securitization transactions.
Note Summary
| Notes | Original Balance | Note Holder | Controlling Interest |
| A-1 | $45,000,000 | WFCM 2018-C47 | Yes |
| A-2 | $30,000,000 | Barclays Bank PLC | No |
| A-3 | $15,000,000 | Barclays Bank PLC | No |
| Total | $90,000,000 |
Following the lockout period, on any date before June 6, 2028, the Virginia Beach Hotel Portfolio Borrowers have the right to defease the Virginia Beach Hotel Portfolio Whole Loan in whole, but not in part. The lockout period will expire on the earlier to occur of (i) two years after the closing date of the securitization and (ii) August 31, 2021. The Virginia Beach Hotel Portfolio Whole Loan is prepayable without penalty on or after June 6, 2028.
Sources and Uses
| Sources | Uses | |||||||
| Original whole loan amount | $90,000,000 | 69.5% | Purchase price(1) | $126,538,697 | 97.7% | |||
| Borrower’s equity | 39,510,713 | 30.5 | Closing costs | 1,904,056 | 1.5 | |||
| Reserve funds | 1,067,960 | 0.8 | ||||||
| Total Sources | $129,510,713 | 100.0% | Total Uses | $129,510,713 | 100.0% |
| (1) | The purchase price includes defeasance costs that the buyer paid on behalf of the seller in the amount of $3,538,697. |
The Properties. The Virginia Beach Hotel Portfolio Properties are comprised of two full service hotels properties built in 2005 and 2014 totaling 456 rooms that as of May 31, 2018, were 76.0% occupied with occupancies at the individual hotel properties of 75.7% at the Hilton Virginia Beach Oceanfront property and 76.6% at the Hilton Garden Inn Virginia Beach Oceanfront property, respectively.
The Hilton Virginia Beach Oceanfront property is a 289-key full-service resort hotel. The property was built in 2005, and features two restaurants and a lounge, 10,050 square feet of meeting space, an indoor pool, a rooftop outdoor pool and whirlpool, oceanfront and boardwalk access, a fitness room, valet parking service and a business center. The hotel contains 186 double/double guestrooms, 90 king guestrooms, 11 studio suites and two one-bedroom suites. Catch 21, the hotel’s primary dining outlet is located in the northern portion of the lobby and has a built-in buffet to facilitate breakfast and lunch service. The second restaurant, Salacia, is the only four diamond steakhouse in Virginia. Additionally, the Skybar is located on the 21st floor and offers food and beverage service to the rooftop infinity pool. The hotel is expected to undergo renovations anticipated to cost approximately $832,184 which will be funded by the monthly FF&E reserve in an amount equal to one-twelfth of 5.0% of the projected annual gross income from room revenue operations (currently $104,329 for the portfolio). Attached to the property by way of an overhead walkway is an approximately 1,000 car parking garage with ground floor retail. The borrower has a leasehold interest in 380 garage parking spaces and approximately 26,000 square feet of retail space, with 58 additional spaces for exclusive retail use (see “Leasehold Interest” section). There are currently 13 tenants leasing the retail space for a total underwritten base rent of $765,284 resulting in a net positive cash flow. Tenants include Starbucks and other small shops that cater to the hotel’s customer base. The hotel franchise agreement with Hilton Franchise Holding LLC expires on August 31, 2038.
The Hilton Garden Inn Virginia Beach Oceanfront property is a 167-key full-service hotel. The property was built in 2014, featuring two restaurants, a lounge, 6,350 square feet of meeting space, an indoor/outdoor pool, oceanfront access, a fitness room, a 24-hour business center, a market pantry, and a guest laundry room. The hotel contains 51 king guestrooms, 20 king suites, 92 queen/queen guestrooms, and four queen/queen suites. All rooms at the hotel have a view of the ocean. The on-site Lager Heads Restaurant serves lunch and dinner, with indoor and outdoor seating, and the on-site Great American Grill serves breakfast. The Hilton Garden Inn Virginia Beach Oceanfront has a leasehold interest in a 168-space parking garage, located approximately one block away from the subject property (see “Leasehold Interest” section). The hotel offers valet service from the hotel to the garage. The Hilton Garden Inn Virginia Beach Oceanfront property is expected to undergo an approximately $1.5 million property improvement plan (“PIP”) of which $741,954 was reserved at closing and the remaining balance will be funded by the monthly FF&E reserve in an amount equal to one-twelfth of 5.0% of the projected annual gross income from room revenue operations (currently $104,329 for the portfolio). The hotel franchise agreement with Hilton Franchise Holding LLC expires on August 31, 2038.
THE INFORMATION IN THIS STRUCTURAL AND COLLATERAL TERM SHEET IS NOT COMPLETE AND MAY BE AMENDED PRIOR TO THE TIME OF SALE. THIS TERM SHEET IS NOT AN OFFER TO SELL THESE SECURITIES AND IT IS NOT A SOLICITATION OF AN OFFER TO BUY THESE SECURITIES IN ANY JURISDICTION WHERE THE OFFER OR SALE IS NOT PERMITTED.
83
VIRGINIA BEACH HOTEL PORTFOLIO
The following table presents certain information relating to the Virginia Beach Hotel Portfolio Properties:
| Property | Year Built/ Renovated | Rooms | Allocated Cut-off Date Principal Balance | % of Portfolio Cut-off Date Principal Balance | Cut-off Date Principal Balance Per Room | Appraised Value | % of Appraised Value |
| Hilton Virginia Beach Oceanfront | 2005/2018 | 289 | $58,527,607 | 65.0% | $202,518 | $84,800,000 | 65.0% |
Hilton Garden Inn Virginia Beach Oceanfront | 2014/NAP | 167 | $31,472,393 | 35.0% | $188,457 | $45,600,000(1) | 35.0% |
| Total/Weighted Average | 456 | $90,000,000 | 100.0% | $197,368 | $130,400,000(1) | 100.0% |
| (1) | The appraised value for the Hilton Garden Inn Virginia Beach Oceanfront property assumes that 50.0% of expected PIP work ($1,000,000) would be escrowed by the lender and would be available to a prospective buyer to fund the PIP work at the Hilton Garden Inn Virginia Beach Oceanfront property. The Virginia Beach Hotel Portfolio Borrowers deposited upfront PIP reserves totaling $741,954, which represents 50.0% of the engineer’s updated estimated cost of the remaining PIP work. The balance of the remaining PIP work will be funded by the monthly FF&E reserve. The appraiser concluded an as-is appraised value without the PIP assumption of $44,600,000 resulting in a total appraised value of $129,400,000 for the portfolio. |
Appraisal.The appraiser concluded an “as-is” appraised value of $130,400,000, which assumes that 50.0% of expected PIP work ($1,000,000) would be escrowed by the lender and would be available to a prospective buyer to fund the PIP work at the Hilton Garden Inn Virginia Beach Oceanfront property. The Virginia Beach Hotel Portfolio Borrowers (as defined below) deposited upfront PIP reserves totaling $741,954, which represents 50.0% of the engineer’s updated estimated cost of the remaining PIP work. The balance of the remaining PIP work will be funded by the monthly FF&E reserve. For the Hilton Garden Inn Virginia Beach Oceanfront property, the appraiser concluded an as-is appraised value without the PIP assumption of $44,600,000 resulting in a total appraised value of $129,400,000 for the portfolio.
Environmental Matters. According to Phase I environmental assessments dated June 21, 2018, there was no evidence of any recognized environmental conditions at the Hilton Virginia Beach Oceanfront property or the Hilton Garden Inn Virginia Beach Oceanfront property.
Market Overview and Competition.The Hilton Virginia Beach Oceanfront property and the Hilton Garden Inn Virginia Beach Oceanfront property are located in Virginia Beach, Virginia. The Virginia Beach Hotel Portfolio Properties are accessible regionally by Interstate 64, Interstate 264, and Atlantic Avenue and are located approximately 11 miles southeast of Norfolk International Airport. According to the appraisal, Virginia Beach is best known as a resort, with miles of beaches and hundreds of hotels, motels, and restaurants along its oceanfront. It is also home to several state parks, long protected beach areas, three military bases, three Fortune 500 companies and a number of other large corporations, two universities, and historic sites. The Virginia Beach Convention Center, which is located approximately two miles from the Virginia Beach Hotel Portfolio Properties, offers over 516,000 square feet of convention space and hosts an array of conventions, consumer shows, theater events, banquets, local meetings and trade shows.
There is an approximately 300-key full service Marriott which recently broke ground and will likely open in 2020 within the market approximately 0.6 miles away. According to the appraisal, the Marriott will have more meeting space and is expected to operate at a higher price point. Furthermore, according to the appraisal, the proposed Marriott is not located within easy walking distance of many of the restaurants in the area and is expected to be part of a campus setting. The appraisal considers the property secondarily competitive. Additionally, an Embassy Suites by Hilton has been proposed for a site located within one mile from the subject properties; however, this project is not expected to break ground until the Marriott is operational and absorbed in the market. There is potential additional demand as the city of Virginia Beach is constructing a 285,000 square foot Virginia Beach Sports Center, which is expected to be completed by November 2020. The sports center will feature 12 basketball courts, 24 volleyball courts, and nine indoor field hockey courts. By its fifth year in operation, this facility is expected to increase hotel traffic by 100,000 guests and direct spending revenue by over $82.0 million according to a third party report.
The Virginia Beach Hotel Portfolio Properties are located within the greater Hampton Roads lodging market. For the year 2017, the market-wide occupancy level was 69.9%, average daily rate was $178.86, and RevPAR was $125.10. Market segmentation for the Hampton Roads lodging market is 46% leisure, 39% commercial, and 15% meeting and group, which is consistent with the subject properties (40%, 35% and 25% for the Hilton Virginia Beach Oceanfront property and 45%, 40%, and 15% for the Hilton Garden Inn Virginia Beach Oceanfront property, respectively). Leisure demand is driven largely by the beaches and cultural attractions, commercial demand is driven by the government and government-related contractors, and meeting and group demand comes from a variety of sources.
THE INFORMATION IN THIS STRUCTURAL AND COLLATERAL TERM SHEET IS NOT COMPLETE AND MAY BE AMENDED PRIOR TO THE TIME OF SALE. THIS TERM SHEET IS NOT AN OFFER TO SELL THESE SECURITIES AND IT IS NOT A SOLICITATION OF AN OFFER TO BUY THESE SECURITIES IN ANY JURISDICTION WHERE THE OFFER OR SALE IS NOT PERMITTED.
84
VIRGINIA BEACH HOTEL PORTFOLIO
The following tables present certain information relating to the Virginia Beach Hotel Portfolio Properties:
Subject and Market Historical Occupancy, ADR and RevPAR
(Hilton Virginia Beach Oceanfront)(1)
Competitive Set(2) | Hilton Virginia Beach Oceanfront(3) | Penetration Factor(4) | |||||||
Year | Occupancy | ADR | RevPAR | Occupancy | ADR | RevPAR | Occupancy | ADR | RevPAR |
| 6/30/2018 TTM | 68.2% | $161.92 | $110.41 | 75.7%(5) | $214.32(5) | $162.27(5) | 111.0% | 132.4% | 147.0% |
| 6/30/2017 TTM | 67.3% | $164.08 | $110.49 | 76.0% | $213.70 | $162.45 | 112.9% | 130.2% | 147.0% |
| 6/30/2016 TTM | 65.8% | $162.73 | $107.03 | 72.7% | $214.48 | $155.84 | 110.5% | 131.8% | 145.6% |
| (1) | The competitive set includes Holiday Inn Virginia Beach Oceanside 21st Street, Sheraton Virginia Beach Oceanfront Hotel, Hampton Inn Virginia Beach Oceanfront North, Ramada Virginia Beach Oceanfront, Holiday Inn Express & Suites Virginia Beach Surfside, Courtyard Virginia Beach Oceanfront South, and Courtyard Virginia Beach Oceanfront North 37thStreet. |
| (2) | Information obtained from a third party hospitality report dated July 17, 2018. |
| (3) | Information obtained from the borrower. |
| (4) | The Penetration Factor has been calculated using data from third party reports for the competitive set and information obtained from the borrower for the Hilton Virginia Beach Oceanfront property. |
| (5) | For the Hilton Virginia Beach Oceanfront property, 5/31/2018 TTM data is used. |
Subject and Market Historical Occupancy, ADR and RevPAR
(Hilton Garden Inn Virginia Beach Oceanfront)(1)
Competitive Set(2) | Hilton Garden Inn Virginia Beach(3) | Penetration Factor(4) | |||||||
Year | Occupancy | ADR | RevPAR | Occupancy | ADR | RevPAR | Occupancy | ADR | RevPAR |
| 6/30/2018 TTM | 63.7% | $169.82 | $108.13 | 76.6%(5) | $192.19(5) | $147.16(5) | 120.3% | 113.2% | 136.1% |
| 6/30/2017 TTM | 63.4% | $171.84 | $108.93 | 79.9% | $192.10 | $153.56 | 126.1% | 111.8% | 141.0% |
| 6/30/2016 TTM | 61.6% | $172.54 | $106.30 | 74.1% | $191.52 | $141.91 | 120.3% | 111.0% | 133.5% |
| (1) | The competitive set includes Holiday Inn & Suites Virginia Beach North Beach, Holiday Inn Virginia Beach Oceanside 21st Street, Sheraton Virginia Beach Oceanfront Hotel, Hampton Inn Virginia Beach Oceanfront North, Wyndham Virginia Beach, Courtyard Virginia Beach Oceanfront North 37th Street, Springhill Suites Virginia Beach Oceanfront, and Hampton Inn Virginia Beach Oceanfront South. |
| (2) | Information obtained from a third party hospitality report dated July 17, 2018. |
| (3) | Information obtained from the borrower. |
| (4) | The Penetration Factor has been calculated using data from third party reports for the competitive set and information obtained from the borrower for the Hilton Garden Inn Virginia Beach Oceanfront property. |
| (5) | For the Hilton Garden Inn Virginia Beach Oceanfront property, 5/31/2018 TTM data is used. |
THE INFORMATION IN THIS STRUCTURAL AND COLLATERAL TERM SHEET IS NOT COMPLETE AND MAY BE AMENDED PRIOR TO THE TIME OF SALE. THIS TERM SHEET IS NOT AN OFFER TO SELL THESE SECURITIES AND IT IS NOT A SOLICITATION OF AN OFFER TO BUY THESE SECURITIES IN ANY JURISDICTION WHERE THE OFFER OR SALE IS NOT PERMITTED.
85
VIRGINIA BEACH HOTEL PORTFOLIO
Operating History and Underwritten Net Cash Flow.The following table presents certain information relating to the historical operating performance and underwritten net cash flow at the Virginia Beach Hotel Portfolio Properties:
Cash Flow Analysis
| 2015 | 2016 | 2017 | TTM 5/31/2018 | U/W | % of U/W Total Revenue | U/W $ per Room | |
| Occupancy | 71.5% | 75.5% | 76.8% | 76.0% | 73.1%(1) | ||
| ADR | $206.24 | $206.83 | $204.58 | $206.21 | $206.21 | ||
| RevPAR | $147.45 | $147.45 | $155.44 | $156.51 | $150.44(1) | ||
| Room Revenue | $24,541,676 | $26,010,775 | $25,870,802 | $25,039,015 | $25,039,015(1) | 83.1% | $54,910 |
| F&B Revenue | 3,325,000 | 3,325,000 | 3,325,000 | 3,325,000 | 3,325,000 | 11.0 | 7,292 |
| Other Revenue(2) | 1,687,647 | 1,703,206 | 1,721,681 | 1,702,584 | 1,749,577 | 5.8 | 3,837 |
| Total Revenue | $29,554,323 | $31,038,981 | $30,917,483 | $30,066,599 | $30,113,592 | 100.0% | $66,039 |
| Total Department Expenses | 7,266,870 | 7,273,072 | 7,154,071 | 7,088,295 | 7,088,295 | 23.5 | 15,545 |
| Gross Operating Income | $22,287,453 | $23,765,909 | $23,763,412 | $22,978,304 | $23,025,297 | 76.5% | $50,494 |
| Total Undistributed Expenses | 9,252,195 | 9,576,837 | 9,513,721 | 9,360,639 | 9,832,133 | 32.7 | 21,562 |
| Gross Operating Profit | $13,035,258 | $14,189,072 | $14,249,691 | $13,617,665 | $13,193,164 | 43.8% | $28,932 |
| Total Fixed Charges | 1,693,690 | 1,904,445 | 1,740,144 | 1,776,585 | 1,404,087 | 4.7 | 3,079 |
| Net Operating Income | $11,341,568 | $12,284,627 | $12,509,547 | $11,841,080 | $11,789,077 | 39.1% | $25,853 |
| FF&E | 0 | 0 | 0 | 0 | 1,204,544 | 4.0 | 2,642 |
| Net Cash Flow | $11,341,568 | $12,284,627 | $12,509,547 | $11,841,080 | $10,584,533 | 35.1% | $23,212 |
| NOI DSCR(3) | 1.98x | 2.14x | 2.18x | 2.06x | 2.05x | ||
| NCF DSCR(3) | 1.98x | 2.14x | 2.18x | 2.06x | 1.84x | ||
| NOI DY(3) | 12.6% | 13.6% | 13.9% | 13.2% | 13.1% | ||
| NCF DY(3) | 12.6% | 13.6% | 13.9% | 13.2% | 11.8% | ||
| (1) | U/W Room Revenue is underwritten to the TTM 5/31/2018 (“TTM”) Room Revenue figure. U/W Occupancy and RevPAR figures differ from TTM figures due to certain rooms being off-line in the TTM period at the Hilton Virginia Beach Oceanfront property. |
| (2) | Other revenue includes telephone revenue, parking, and retail revenue. |
| (3) | The debt service coverage ratios and debt yields shown are based on the Virginia Beach Hotel Portfolio Whole Loan. |
The Borrowers. The borrowers for the Virginia Beach Hotel Portfolio Whole Loan are 3001 Atlantic, LLC and 3315 Atlantic, LLC, Virginia limited liability companies and special purpose entities with two independent directors (the “Virginia Beach Hotel Portfolio Borrowers”). Legal counsel to the Virginia Beach Hotel Portfolio Borrowers delivered a non-consolidation opinion in connection with the origination of the Virginia Beach Hotel Portfolio Whole Loan. Neil P. Amin and Jay B. Shah are the nonrecourse carveout guarantors under the Virginia Beach Hotel Portfolio Whole Loan.
The Borrower Sponsors. The borrower sponsors are Neil P. Amin and Jay B. Shah. Neil P. Amin is the CEO of Shamin Hotels and Jay B. Shah serves as Vice President. Founded in 1979, Shamin Hotels is the largest hotel management company in Virginia. It owns and manages 56 properties with more than 7,000 rooms and over 100,000 square feet of meeting and banquet space. Managed brands include Hilton, Marriott, Intercontinental Hotels, and Hyatt. Shamin Hotels is headquartered in Virginia, but has expanded nationally, operating hotels in Virginia, Maryland, New York, Colorado, Florida, and North Carolina. Shamin Hotels has received numerous awards and recognitions including the Developer of the Year from Intercontinental Hotels Group and the Multi-Brand Developer of the Year, New Build/Adaptive Reuse of the Year, and the Lifetime Achievement Award from Hilton Hotels. The borrower sponsors disclosed three previous loan modifications. See “Description of the Mortgage Pool – Loan Purpose; Default History, Bankruptcy Issues and Other Proceedings” in thePreliminary Prospectus.
Escrows. The Virginia Beach Hotel Portfolio Whole Loan documents provide for upfront escrows in the amount of $326,006 for real estate taxes and $741,954 for estimated expenses related to remaining planned PIP renovations for the Hilton Garden Inn Virginia Beach Oceanfront property. The Virginia Beach Hotel Portfolio Whole Loan documents also provide for ongoing monthly escrows of 1/12th of the estimated annual real estate taxes (initially $81,502), ongoing monthly escrows of 1/12th of the estimated annual insurance premiums (initially $28,642) and an amount equal to 1/12th of 5.0% of the total revenue for each Virginia Beach Hotel Portfolio Properties for the FF&E reserve (the initial estimated FF&E monthly deposit is $104,329 capped at $3,755,852). For each Virginia Beach Hotel Portfolio Properties, the monthly FF&E reserve will decrease to one-twelfth of 4.0% of the total revenue when the PIP work at the respective property is completed.
During the occurrence and continuance of a Low DSCR Cash Sweep Period (as defined below) or a Franchise Trigger Period (as defined below), the Virginia Beach Hotel Portfolio Borrowers are required to deposit 1/12th of the parking and retail rents in order to have sufficient funds to pay the rents at least thirty days prior to their due dates.
Lockbox and Cash Management.A springing lockbox is required with respect to the Virginia Hotel Portfolio Whole Loan. The springing lockbox will be established upon the occurrence of a Trigger Period (as defined below). During the continuance of a Trigger Period, the Virginia Beach Hotel Portfolio Borrowers are required to deposit, or cause to be deposited, all gross income from operations, all forfeited security deposits, and all other revenue of any kind from the Virginia Beach Hotel Portfolio Properties received by the Virginia Beach Hotel Portfolio Borrowers or manager. All funds on deposit in the lockbox account are then required to be disbursed immediately
THE INFORMATION IN THIS STRUCTURAL AND COLLATERAL TERM SHEET IS NOT COMPLETE AND MAY BE AMENDED PRIOR TO THE TIME OF SALE. THIS TERM SHEET IS NOT AN OFFER TO SELL THESE SECURITIES AND IT IS NOT A SOLICITATION OF AN OFFER TO BUY THESE SECURITIES IN ANY JURISDICTION WHERE THE OFFER OR SALE IS NOT PERMITTED.
86
VIRGINIA BEACH HOTEL PORTFOLIO
preceding each payment date in accordance with the loan documents, with all excess cash flow to be deposited to an excess cash reserve to be held as additional security for the Virginia Beach Portfolio Whole Loan.
A “Trigger Period” will commence upon the earliest of:
| (i) | an event of default; |
| (ii) | the debt service coverage ratio being less than 1.15x for any calendar quarter; or |
| (iii) | the earliest to occur of (a) lender’s reasonable determination that the Virginia Beach Hotel Portfolio Borrowers have failed to complete all work under the PIP within the reasonable time required under such PIP (as may be extended by or with the consent of Hilton Franchise Holding LLC) or (b) the expiration or termination of the franchise agreement at any time while any portion of the debt remains outstanding (a “Franchise Trigger Period”). |
A “Trigger Period” will end upon:
| ● | with regard to clause (i) above, the cure of such event of default; |
| ● | with regard to clause (ii) above, the debt service coverage ratio being greater than 1.20x for two consecutive calendar quarters; and |
| ● | with regard to clause (iii) above, (a) the lender’s receipt of confirmation that all necessary work under the PIP has been completed and accepted by Hilton Franchise Holding LLC or (b) the lender’s receipt of confirmation that a replacement franchise agreement has been entered into and is in full force and effect. |
A “Low DSCR Cash Sweep Period” shall mean any period commencing on the last day of the second consecutive calendar quarter for which the debt service coverage ratio for the property is less than 1.15x and will end upon the debt service coverage ratio being greater or equal to 1.20x for two consecutive calendar quarters.
Property Management. The Virginia Beach Hotel Portfolio Properties are managed by an affiliate of the Virginia Beach Hotel Portfolio Borrowers.
Assumption. The Virginia Beach Hotel Portfolio Borrowers have the unlimited right to transfer the Virginia Beach Hotel Portfolio Properties, provided that certain conditions are satisfied, including (i) no event of default has occurred and is continuing; (ii) the lender has reasonably determined that the proposed transferee and guarantor satisfy the lender’s credit review and underwriting standards, taking into consideration the transferee’s experience, financial strength and general business standing; (iii) the transferee is not an affiliate of either the Virginia Beach Hotel Portfolio Borrowers or guarantor; and (iv) receipt of rating agency confirmation that the transfer will not result in a downgrade, withdrawal or qualification of the respective ratings assigned to the Series 2018-C47 certificates.
Partial Release.Not permitted.
Real Estate Substitution.Not permitted.
Subordinate and Mezzanine Indebtedness.Not permitted.
Leasehold Interest. At the Hilton Virginia Beach Oceanfront property, the borrower has a leasehold interest in a portion of the garage consisting of 380 parking garage spaces. The leased fee holder of the garage is the City of Virginia Beach Development Authority. Rent under the parking lease currently consists of an approximately $222,000 annual payment plus special rent (fixed at $10,538 per year expiring in 2025), and additional rent. Additional rent is calculated as 2.0% applied to the difference between the current year room revenue less the room revenue in 2014, capped at $50,000. The lease expires on June 30, 2070. Additionally, the borrower has also entered into a lease for the ground floor retail portion of the parking garage, which provides approximately 26,000 square feet of commercial space to the borrower as well as an additional 58 parking spaces for exclusive retail use. The annual lease expense is $378,930 with the lease term expiring on June 30, 2030.
At the Hilton Garden Inn Virginia Beach Oceanfront, the borrower has a leasehold interest in an off-site parking garage where the borrower leases 168 spaces from 34th Street Garage, LLC. Annual rent under the lease equals $1.00 plus a pro-rata share of all expenses paid or incurred by the lessor and operation and preservation of the property and parking facilities. The lease expires in May 2105.
Terrorism Insurance. The Virginia Beach Hotel Portfolio Whole Loan documents require that the “all risk” insurance policy required to be maintained by Virginia Beach Hotel Portfolio Borrowers provide coverage for terrorism in an amount equal to the full replacement cost of the Virginia Beach Hotel Portfolio Properties. The Virginia Beach Hotel Portfolio Whole Loan documents also require business interruption insurance covering no less than the 18-month period following the occurrence of a casualty event, provided that such coverage is available.
THE INFORMATION IN THIS STRUCTURAL AND COLLATERAL TERM SHEET IS NOT COMPLETE AND MAY BE AMENDED PRIOR TO THE TIME OF SALE. THIS TERM SHEET IS NOT AN OFFER TO SELL THESE SECURITIES AND IT IS NOT A SOLICITATION OF AN OFFER TO BUY THESE SECURITIES IN ANY JURISDICTION WHERE THE OFFER OR SALE IS NOT PERMITTED.
87
Holiday Inn FiDi

THE INFORMATION IN THIS STRUCTURAL AND COLLATERAL TERM SHEET IS NOT COMPLETE AND MAY BE AMENDED PRIOR TO THE TIME OF SALE. THIS TERM SHEET IS NOT AN OFFER TO SELL THESE SECURITIES AND IT IS NOT A SOLICITATION OF AN OFFER TO BUY THESE SECURITIES IN ANY JURISDICTION WHERE THE OFFER OR SALE IS NOT PERMITTED.
88
Holiday Inn FiDi
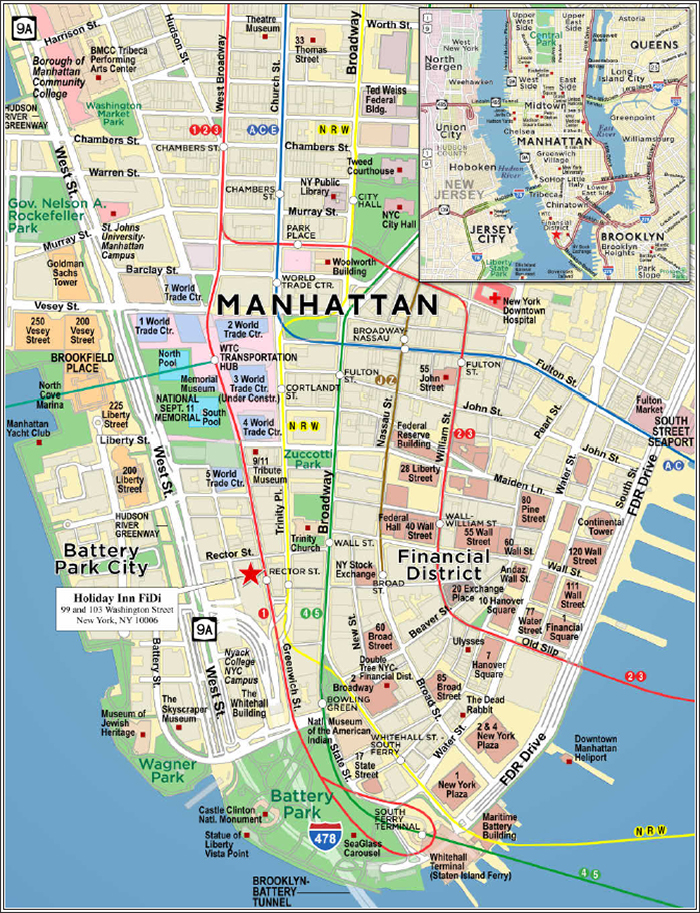
THE INFORMATION IN THIS STRUCTURAL AND COLLATERAL TERM SHEET IS NOT COMPLETE AND MAY BE AMENDED PRIOR TO THE TIME OF SALE. THIS TERM SHEET IS NOT AN OFFER TO SELL THESE SECURITIES AND IT IS NOT A SOLICITATION OF AN OFFER TO BUY THESE SECURITIES IN ANY JURISDICTION WHERE THE OFFER OR SALE IS NOT PERMITTED.
89
| No. 6 – Holiday Inn FiDi | |||||||
| Loan Information | Property Information | ||||||
| Mortgage Loan Seller: | Ladder Capital Finance LLC | Single Asset/Portfolio: | Single Asset | ||||
| Credit Assessment (DBRS/Fitch/Moody’s): | NR/NR/NR | Property Type: | Hospitality | ||||
| Original Principal Balance(1): | $35,000,000 | Specific Property Type: | Full Service | ||||
| Cut-off Date Balance(1): | $35,000,000 | Location: | New York, NY | ||||
| % of Initial Pool Balance: | 3.7% | Size: | 492 Rooms | ||||
| Loan Purpose: | Refinance | Cut-off Date Balance Per Room(1): | $176,880 | ||||
| Borrower Name: | Golden Seahorse LLC | Year Built/Renovated: | 2014 / NAP | ||||
| Borrower Sponsor: | Jubao Xie | Title Vesting: | Fee | ||||
| Mortgage Rate: | 5.1205% | Property Manager: | Crescent Hotels & Resorts, LLC | ||||
| Note Date: | September 18, 2018 | 4th Most Recent Occupancy(5): | NAV | ||||
| Anticipated Repayment Date: | NAP | 3rd Most Recent Occupancy (As of): | 73.1% (12/31/2015) | ||||
| Maturity Date: | October 6, 2028 | 2nd Most Recent Occupancy (As of)(6): | 82.2% (12/31/2016) | ||||
| IO Period: | 120 months | Most Recent Occupancy (As of)(6): | 89.0% (12/31/2017) | ||||
| Loan Term (Original): | 120 months | Current Occupancy (As of)(6): | 92.5% (6/30/2018) | ||||
| Seasoning: | 0 months | ||||||
| Amortization Term (Original): | NAP | Underwriting and Financial Information: | |||||
| Loan Amortization Type: | Interest-only, Balloon | ||||||
| Interest Accrual Method: | Actual/360 | 4th Most Recent NOI (As of): | $10,932,254 (12/31/2015) | ||||
| Call Protection(2): | L(24),D(91),O(5) | 3rd Most Recent NOI (As of)(6): | $10,597,216 (12/31/2016) | ||||
| Lockbox Type(3): | Hard/Upfront Cash Management | 2nd Most Recent NOI (As of)(6): | $11,471,090 (12/31/2017) | ||||
| Additional Debt(1): | Yes | Most Recent NOI (As of)(6): | $12,683,790 (TTM 6/30/2018) | ||||
| Additional Debt Type(1): | Pari Passu / Subordinate Secured Debt | ||||||
| U/W Revenues: | $30,047,207 | ||||||
| U/W Expenses: | $17,696,201 | ||||||
| U/W NOI: | $12,351,006 | ||||||
| Escrows and Reserves(4): | U/W NCF: | $11,149,117 | |||||
| U/W NOI DSCR(1): | 2.73x | ||||||
| Type: | Initial | Monthly | Cap (If Any) | U/W NCF DSCR(1): | 2.47x | ||
| Taxes | $1,617,071 | $323,414 | NAP | U/W NOI Debt Yield(1): | 14.2% | ||
| Insurance | $189,683 | $31,614 | NAP | U/W NCF Debt Yield(1): | 12.8% | ||
| FF&E Reserve | $0 | (4) | NAP | Appraised Value: | $233,000,000 | ||
| Seasonality Reserve | $1,300,000 | Springing | $1,300,000 | Appraisal Valuation Date: | July 26, 2018 | ||
| Cut-off Date LTV Ratio(1): | 37.3% | ||||||
| LTV Ratio at Maturity(1): | 37.3% | ||||||
| (1) | See “The Mortgage Loan” section. The Cut-off Date Balance Per Room, U/W NOI DSCR, U/W NCF DSCR, U/W NOI Debt Yield, U/W NCF Debt Yield, Cut-off Date LTV Ratio and LTV Ratio at Maturity presented above are based on the Holiday Inn FiDi Senior Loan (as defined below). The Cut-off Date Balance Per Room, U/W NOI DSCR, U/W NCF DSCR, U/W NOI Debt Yield, U/W NCF Debt Yield, Cut-off Date LTV Ratio and LTV Ratio at Maturity based on the Holiday Inn FiDi Whole Loan (as defined below) are $278,506, 1.69x, 1.53x, 9.0%, 8.1%, 58.8% and 58.8%, respectively. |
| (2) | Defeasance of the Holiday Inn FiDi Whole Loan is permitted at any time after the earlier of (i) September 18, 2021 and (ii) two years from the closing date of the securitization that includes the last pari passu note of the Holiday Inn FiDi Whole Loan to be securitized. The assumed lockout period of 24 payments is based on the closing date of this transaction in October 2018. |
| (3) | See “Lockbox and Cash Management” section. |
| (4) | See “Escrows” section. |
| (5) | The Holiday Inn FiDi Property was built in 2014. |
| (6) | See “Cash Flow Analysis” section. |
The Mortgage Loan. The mortgage loan (the “Holiday Inn FiDi Mortgage Loan”) is part of a whole loan (the “Holiday Inn FiDi Whole Loan”) that is evidenced by three seniorpari passupromissory notes (Notes A-1, A-2, and A-3) (collectively, the “Holiday Inn FiDi Senior Loan”) and a subordinate B-note (the “Holiday Inn FiDi Subordinate Companion Loan”) secured by a first mortgage encumbering the fee interest in a full service hotel located in New York, New York (the “Holiday Inn FiDi Property”). The Holiday Inn FiDi Whole Loan was originated on September 18, 2018 by Ladder Capital Finance LLC (“LCF”). The Holiday Inn FiDi Senior Loan had an original principal balance of $87,025,000, has an outstanding principal balance as of the Cut-off Date of $87,025,000 and accrues interest at an interest rate of 5.1205%per annum. The Holiday Inn FiDi Whole Loan had an original principal balance of $137,025,000, has an outstanding principal balance as of the Cut-off Date of $137,025,000 and accrues interest at a weighted average interest rate of 5.259%per annum. The Holiday Inn FiDi Whole Loan had an initial term of 120 months, has a remaining term of 120 months as of the Cut-off Date and requires interest-only payments through the term of the Holiday Inn FiDi Whole Loan. The Holiday Inn FiDi Whole Loan matures on October 6, 2028.
THE INFORMATION IN THIS STRUCTURAL AND COLLATERAL TERM SHEET IS NOT COMPLETE AND MAY BE AMENDED PRIOR TO THE TIME OF SALE. THIS TERM SHEET IS NOT AN OFFER TO SELL THESE SECURITIES AND IT IS NOT A SOLICITATION OF AN OFFER TO BUY THESE SECURITIES IN ANY JURISDICTION WHERE THE OFFER OR SALE IS NOT PERMITTED.
90
Holiday Inn FiDi
The Holiday Inn FiDi Mortgage Loan, which is evidenced by the non-controlling Note A-2 and will be contributed to the WFCM 2018-C47 Trust, had an original principal balance of $35,000,000 and has an outstanding principal balance as of the Cut-off Date of $35,000,000. The controlling Note A-1 and non-controlling Note A-3 are expected to be contributed to one or more future securitizations. The lender provides no assurances that Note A-1 and/or Note A-3 will not be split further. The Holiday Inn FiDi Whole Loan will initially be serviced pursuant to the WFCM 2018-C47 pooling and servicing agreement; however, upon securitization of Note A-1, such whole loan will be serviced pursuant to the pooling and servicing agreement for the securitization that includes Note A-1. See “Description of the Mortgage Pool-The Whole Loans” in the Preliminary Prospectus.
Note Summary
| Original Balance | Note Holder | Controlling Piece(1) | ||
| Note A-1 | $32,025,000 | LCF or an affiliate | Yes | |
| Note A-2 | $35,000,000 | WFCM 2018-C47 | No | |
| Note A-3 | $20,000,000 | LCF or an affiliate | No | |
| Note B | $50,000,000 | Third Party Purchaser | No | |
| Total | $137,025,000 |
| (1) | The holder of the Holiday Inn FiDi Subordinate Companion Loan will have certain control rights with respect to the Holiday Inn FiDi Whole Loan and the right to appoint the special servicer with respect to the Holiday Inn FiDi Whole Loan; provided that after the occurrence of certain control shift events, the holder of Note A-1 will have such rights. |
Following the lockout period, the borrower has the right to defease the Holiday Inn FiDi Whole Loan in whole, but not in part, on any payment date before June 6, 2028. In addition, the Holiday Inn FiDi Whole Loan is prepayable without penalty on or after June 6, 2028.
Sources and Uses
| Sources | Uses | |||||||
| Original whole loan amount | $137,025,000 | 100.0% | Loan payoff | $125,829,280 | 91.8% | |||
| Reserves | 3,106,754 | 2.3 | ||||||
| Closing costs | 3,664,714 | 2.7 | ||||||
| Return of equity | 4,424,252 | 3.2 | ||||||
| Total Sources | $137,025,000 | 100.0% | Total Uses | $137,025,000 | 100.0% |
The Property.The Holiday Inn FiDi Property is a full service hotel with 492 guestrooms located on 99 and 103 Washington Street in the Financial District of Manhattan. Built in 2014, the Holiday Inn FiDi Property is a 50-story hotel situated on a 0.17 acre parcel located on the intersection formed by Rector Street and Washington Street, which is two blocks away from the PATH train at the World Trade Center and one block away from the Rector Street MTA New York City subway station. The Holiday Inn FiDi Property is located approximately 22 miles northwest of JFK International Airport, 11 miles east of Newark Liberty International Airport and 13 miles southwest of LaGuardia Airport. The Holiday Inn FiDi Property features a restaurant and lounge, a fitness center, a business center, on-site guest self-service laundry, and ice machines. The Holiday Inn FiDi Property contains 273 King rooms, 183 Double/Double rooms, 35 Queen rooms and one Suite. Each room features a flat-panel television, a dresser, bedside tables, a desk with chair, wall sconces and floor lamps. The Holiday Inn FiDi also includes the St. George Tavern which seats approximately 120 people. According to the appraisal, the demand segmentation for the Holiday Inn FiDi Property is approximately 41% leisure, 38% corporate, 15% group and 6% extended stay. The Holiday Inn FiDi Property operates under a franchise agreement with Holiday Hospitality Franchising, LLC, which expires in October 2034 with no extensions.
THE INFORMATION IN THIS STRUCTURAL AND COLLATERAL TERM SHEET IS NOT COMPLETE AND MAY BE AMENDED PRIOR TO THE TIME OF SALE. THIS TERM SHEET IS NOT AN OFFER TO SELL THESE SECURITIES AND IT IS NOT A SOLICITATION OF AN OFFER TO BUY THESE SECURITIES IN ANY JURISDICTION WHERE THE OFFER OR SALE IS NOT PERMITTED.
91
Holiday Inn FiDi
Operating History and Underwritten Net Cash Flow. The following table presents certain information relating to the historical operating performance and the underwritten net cash flow at the Holiday Inn FiDi Property:
Cash Flow Analysis
| 2015 | 2016(1) | 2017(1) | TTM 6/30/2018(1) | U/W | % of U/W Total Revenue | U/W $ per Room | |
| Occupancy | 73.1% | 82.2% | 89.0% | 92.5% | 92.5% | ||
| ADR | $193.44 | $182.89 | $175.79 | $177.63 | $177.63 | ||
| RevPAR | $141.45 | $150.39 | $156.41 | $164.36 | $164.36 | ||
| Room Revenue | $25,401,384 | $27,081,477 | $28,088,962 | $29,515,174 | $29,515,174 | 98.2% | $59,990 |
| F&B Revenue | 0 | 0 | 0 | 300,000 | 300,000 | 1.0 | 610 |
| Other Revenue | 237,262 | 244,141 | 196,454 | 295,395 | 232,033 | 0.8 | 472 |
| Total Revenue | $25,638,646 | $27,325,618 | $28,285,416 | $30,110,569 | $30,047,207 | 100.0% | $61,072 |
| Total Department Expenses | 5,282,018 | 5,450,291 | 5,899,626 | 6,533,830 | 6,526,862 | 21.7 | 13,266 |
| Gross Operating Profit | $20,356,628 | $21,875,327 | $22,385,790 | $23,576,739 | $23,520,345 | 78.3% | $47,806 |
| Total Undistributed Expenses | 6,124,746 | $6,304,755 | 6,356,901 | 6,606,266 | 6,855,809 | 22.8 | 13,935 |
| Profit Before Fixed Charges | $14,231,882 | $15,570,572 | $16,028,889 | $16,970,473 | $16,664,537 | 55.5% | $33,871 |
| Total Fixed Charges | 3,299,628 | 4,973,356 | 4,557,799 | 4,286,683 | 4,313,531 | 14.4 | 8,767 |
| Net Operating Income(1) | $10,932,254 | $10,597,216 | $11,471,090 | $12,683,790 | $12,351,006 | 41.1% | $25,104 |
| FF&E | 0 | 0 | 0 | 0 | 1,201,888 | 4.0 | 2,443 |
| Net Cash Flow | $10,932,254 | $10,597,216 | $11,471,090 | $12,683,790 | $11,149,117 | 37.1% | $22,661 |
| NOI DSCR(2) | 2.42x | 2.35x | 2.54x | 2.81x | 2.73x | ||
| NCF DSCR(2) | 2.42x | 2.35x | 2.54x | 2.81x | 2.47x | ||
| NOI DY(2) | 12.6% | 12.2% | 13.2% | 14.6% | 14.2% | ||
| NCF DY(2) | 12.6% | 12.2% | 13.2% | 14.6% | 12.8% |
| (1) | Net Operating Income has increased from 2016 to TTM 6/30/2018 due to an increase in occupancy. The building was developed in 2014 and has had increasing occupancy each year since. |
| (2) | DSCRs and DYs are based on the Holiday Inn FiDi Senior Loan. |
Appraisal.As of the appraisal valuation date of July 26, 2018, the Holiday Inn FiDi Property had an “as-is” appraised value of $233,000,000.
Environmental Matters. According to a Phase I environmental assessment dated August 27, 2018, there are no recognized environmental conditions at the Holiday Inn FiDi Property.
Market Overview and Competition.The Holiday Inn FiDi Property is located within the Financial District Submarket of Manhattan in New York, New York. The Holiday Inn FiDi Property is located on the northeast corner of Rector and Washington Streets, adjacent to the 9/11 Memorial Museum and 0.2 miles from the 9/11 Memorial Plaza. It is estimated that during 2017 the 9/11 Memorial Plaza had approximately 33 million visitors and the 9/11 Memorial Museum had approximately five million visitors.
The Holiday Inn FiDi Property is located adjacent to the Rector Street Station where the 1, N, Q, R and W subway lines are located, 0.1 miles from Wall Street Station where the 4 and 5 subway lines is located and 0.2 miles from the Broad Street Station where the J and Z subway lines are located. The Holiday Inn FiDi Property is located 0.3 miles from the World Trade Center Transportation Hub, known as Oculus, which has served 250,000 PATH daily commuters and millions of annual visitors.
According to the appraisal, the estimated 2018 population within a one-, three-, and five-mile radius of the Holiday Inn FiDi Property is expected to be 86,914, 874,796, and 2,272,525, respectively; the estimated 2018 average household income within the same one-, three-, and five-mile radii is expected to be $154,407, $129,878, and $113,998, respectively. A third party hospitality research report identified six other hotels within the Holiday Inn FiDi Property’s competitive set. Occupancy for the competitive set has increased from 91.8% during 2017 to 92.8% during the trailing 12 month period ending with June 2018. Occupancy at the Holiday Inn FiDi Property for these same periods has increased from 89.1% to 91.8%. ADR for the competitive set has increased from $186.50 during 2017 to $188.92 during the trailing 12 month period ending with June 2018. ADR for the Holiday Inn FiDi Property was $175.62 in 2017 and $179.02 during the trailing 12 month period ending with June 2018. As a result of the increased occupancy and ADR at the Holiday Inn FiDi Property, Revenue Per Room (“RevPAR”) has increased from $156.42 in 2017 to $164.37 in the trailing 12 month period ending with June 2018.
THE INFORMATION IN THIS STRUCTURAL AND COLLATERAL TERM SHEET IS NOT COMPLETE AND MAY BE AMENDED PRIOR TO THE TIME OF SALE. THIS TERM SHEET IS NOT AN OFFER TO SELL THESE SECURITIES AND IT IS NOT A SOLICITATION OF AN OFFER TO BUY THESE SECURITIES IN ANY JURISDICTION WHERE THE OFFER OR SALE IS NOT PERMITTED.
92
Holiday Inn FiDi
The following table presents certain information relating to the Holiday Inn FiDi Property’s competitive set:
Subject and Market Historical Occupancy, ADR and RevPAR(1)
Competitive Set | Holiday Inn FiDi | Penetration Factor | |||||||
Year | Occupancy | ADR | RevPAR | Occupancy | ADR | RevPAR | Occupancy | ADR | RevPAR |
| TTM 6/30/2018 | 92.8% | $188.92 | $175.26 | 91.8% | $179.02 | $164.37 | 98.9% | 94.8% | 93.8% |
| 12/31/2017 | 91.8% | $186.50 | $171.17 | 89.1% | $175.62 | $156.42 | 97.0% | 94.2% | 91.4% |
| 12/31/2016 | 90.3% | $193.70 | $174.87 | 82.4% | $182.51 | $150.39 | 91.3% | 94.2% | 86.0% |
| (1) | Information obtained from two third party hospitality research reports dated July 17, 2018 and January 18, 2018, respectively. The competitive set includes: Holiday Inn Manhattan Financial District, The Watson Hotel, Edison Hotel, The Gallivant Times Square, Doubletree New York City Financial District, and Four Points by Sheraton New York Downtown. |
The Borrower.The borrower is Golden Seahorse LLC, a Delaware limited liability company and single purpose entity with two independent directors. Counsel to the borrower delivered a non-consolidation opinion in connection with origination. Jubao Xie is the guarantor of certain nonrecourse carveouts under the Holiday Inn FiDi Mortgage Loan.
The Borrower Sponsor.The borrower sponsor is Jubao Xie, who is the managing member of Golden Seahorse LLC and has over 25 years of experience in commercial real estate investing and development. Mr. Xie founded Yiduo Group in 1992 which invests in real estate development, commercial spaces, property management and financial services. Mr. Xie still serves as the chairmen of Yiduo Group, which owns 16 subsidiaries. In 2009, Mr. Xie invested in and developed over 100 residential houses in Seattle.
Escrows.The loan documents provide for an upfront escrow at closing in the amount of $1,617,071 for taxes, $189,683 for insurance and $1,300,000 for a seasonality reserve.
The loan documents provide for ongoing monthly escrows of $323,414 for taxes, and $31,614 for insurance.
On each monthly payment date, the borrower is required to deposit for FF&E costs, an amount equal to the greater of (A) (x) commencing on 11/6/2018 through 10/6/2019, 1/12th of 2%, (y) commencing on 11/6/2019 through 10/6/2020, 1/12th of 3%, and (z) commencing on 11/6/2020 and thereafter, an amount equal to 1/12th of 4%, in each case of the greater of (i) the gross revenue generated during the 12-month period ending on the last day of the most recent calendar quarter for which the borrower has furnished financial statements or (ii) the gross revenue projected in the then-effective approved annual budget for the 12-month period to which such approved annual budget relates or (B) the amount required to be reserved under the franchise agreement and the management agreement.
If the seasonality reserve falls below the cap of $1,300,000, then all excess cash flow shall be deposited into the seasonality reserve until the cap is achieved. If on the December payment date of each calendar year, the seasonality reserve balance is less than $1,300,000, the borrower will be required to deposit into the seasonality reserve account an amount such that the amounts on deposit therein shall be equal to $1,300,000
Property Management.The Holiday Inn FiDi Property is managed by Crescent Hotels and Resorts, LLC (the “Holiday Inn FiDi Manager”). The management agreement expires in July 2024 with two five-year renewal options.
Lockbox and Cash Management.The borrower and the Holiday Inn FiDi Manager are required to cause all rents and other gross revenue from the Holiday Inn FiDi Property to be delivered directly into a lender-controlled clearing account (the “Holiday Inn FiDi Clearing Account”). Credit card direction letters and tenant direction letters were delivered at closing to cause credit card payments and rents to be deposited directly into the Holiday Inn FiDi Clearing Account. To the extent the borrower or the Holiday Inn FiDi Manager receives any gross revenue from the operation of the Holiday Inn FiDi Property, the borrower and the Holiday Inn FiDi Manager are required within one business day of such receipt to deposit such amounts into the Holiday Inn FiDi Clearing Account. Amounts on deposit in the Holiday Inn FiDi Clearing Account are swept daily to a lender-controlled cash management account (the “Holiday Inn FiDi Cash Management Account”). On each monthly payment date, amounts on deposit in the Holiday Inn FiDi Cash Management Account are applied to pay debt service, to make deposits into the reserve funds and pay operating expenses in accordance with the then current approved annual budget. If no Cash Sweep Event Period (defined below) is continuing, all excess cash will be disbursed to the borrower.
A “Cash Sweep Event Period” will commence upon the earlier of (i) the occurrence and continuance of an event of default under the Holiday Inn FiDi Whole Loan; (ii) the occurrence and continuance of any event of default under the related management agreement; (iii) the date that the debt service coverage ratio is less than 1.20x through the Holiday Inn FiDi Subordinate Companion Loan (equivalent to 1.95x through the Holiday Inn FiDi Senior Loan); or (iv) the delivery of notice by the related franchisor of any breach or default by the borrower under the related franchise agreement that, with the passage of time and/or delivery of notice, permits the related franchisor to terminate or cancel the related franchise agreement. A Cash Sweep Event Period will end, with regard to clause (i) above, upon the lender’s acceptance in its sole discretion of a cure of such event of default; with regard to clause (ii) above, on the date on which (a) the event of default under the related management agreement has been cured to the lender’s satisfaction, or (b) the borrower has entered into a replacement management agreement with a qualified manager in accordance with the terms of the loan documents; with regard to clause (iii) above, upon the net cash flow debt service coverage ratio being at least 1.40x through the Holiday Inn FiDi Subordinate Companion Loan (equivalent to 2.26x through the Holiday Inn FiDi Senior Loan for two consecutive calendar quarters; or with regard to clause (iv) above, on the date on which the borrower has delivered evidence reasonably satisfactory
THE INFORMATION IN THIS STRUCTURAL AND COLLATERAL TERM SHEET IS NOT COMPLETE AND MAY BE AMENDED PRIOR TO THE TIME OF SALE. THIS TERM SHEET IS NOT AN OFFER TO SELL THESE SECURITIES AND IT IS NOT A SOLICITATION OF AN OFFER TO BUY THESE SECURITIES IN ANY JURISDICTION WHERE THE OFFER OR SALE IS NOT PERMITTED.
93
Holiday Inn FiDi
to the lender, which may include a “good standing” or similar letter from the related franchisor, indicating that the related franchise agreement is in full force and effect with no default thereunder.
Assumption.The borrower has an unlimited right to transfer the Holiday Inn FiDi Property; provided that certain conditions are satisfied, including that (i) no event of default has occurred and is continuing; (ii) the lender reasonably determines that the proposed transferee and guarantor satisfy the lender’s credit review and underwriting standards, taking into consideration the transferee’s experience, financial strength and general business standing; (iii) such transfer being permitted under the related franchise agreement; and (iv) the lender has received confirmation from the applicable rating agencies that such assumption will not result in a downgrade, withdrawal or qualification of the respective ratings assigned to the Series 2018-C47 certificates and similar confirmations from each rating agency rating any securities backed by the Holiday Inn FiDipari passu companion loans with respect to the ratings of such securities.
Partial Release.Not permitted.
Real Estate Substitution.Not permitted.
Subordinate and Mezzanine Indebtedness. The Holiday Inn FiDi Subordinate Companion Loan had an original principal balance of $50,000,000, has a Cut-off Date balance of $50,000,000 and is coterminous with the Holiday Inn FiDi Senior Loan. The Holiday Inn FiDi Subordinate Companion Loan requires interest-only payments through maturity. Prior to the occurrence of certain control shift events, the holder of the Holiday Inn FiDi Subordinate Companion Loan has consent rights with respect to certain material actions and can replace the special servicer of the Holiday Inn FiDi Whole Loan under the pooling and servicing agreement for the Series 2018-C47 certificates (or such other servicing agreement as then governs the Holiday Inn FiDi Whole Loan). After such control shift events, the holder of Note A-1 will be entitled to exercise such rights. The Holiday Inn FiDi Subordinate Companion Loan accrues interest at an interest rate of 5.500%per annum on an Actual/360 basis. The Holiday Inn FiDi Subordinate Companion Loan was sold to IGIS US Private Placement Real Estate Investment Trust. See “Description of the Mortgage Pool– The Whole Loans–The AB Whole Loans—The Holiday Inn FiDi Whole Loan” in the Preliminary Prospectus.
Ground Lease.None.
Terrorism Insurance.The loan documents require that the “all risk” insurance policy required to be maintained by the borrower provides coverage for terrorism in an amount equal to the full replacement cost of the Property. The loan documents also require business interruption insurance covering no less than the 18-month period following the occurrence of a casualty event, together with a 12-month extended period of indemnity.
THE INFORMATION IN THIS STRUCTURAL AND COLLATERAL TERM SHEET IS NOT COMPLETE AND MAY BE AMENDED PRIOR TO THE TIME OF SALE. THIS TERM SHEET IS NOT AN OFFER TO SELL THESE SECURITIES AND IT IS NOT A SOLICITATION OF AN OFFER TO BUY THESE SECURITIES IN ANY JURISDICTION WHERE THE OFFER OR SALE IS NOT PERMITTED.
94
(THIS PAGE INTENTIONALLY LEFT BLANK)
THE INFORMATION IN THIS STRUCTURAL AND COLLATERAL TERM SHEET IS NOT COMPLETE AND MAY BE AMENDED PRIOR TO THE TIME OF SALE. THIS TERM SHEET IS NOT AN OFFER TO SELL THESE SECURITIES AND IT IS NOT A SOLICITATION OF AN OFFER TO BUY THESE SECURITIES IN ANY JURISDICTION WHERE THE OFFER OR SALE IS NOT PERMITTED.
95
| LOWER MAKEFIELD CORPORATE CENTER - NORTH |
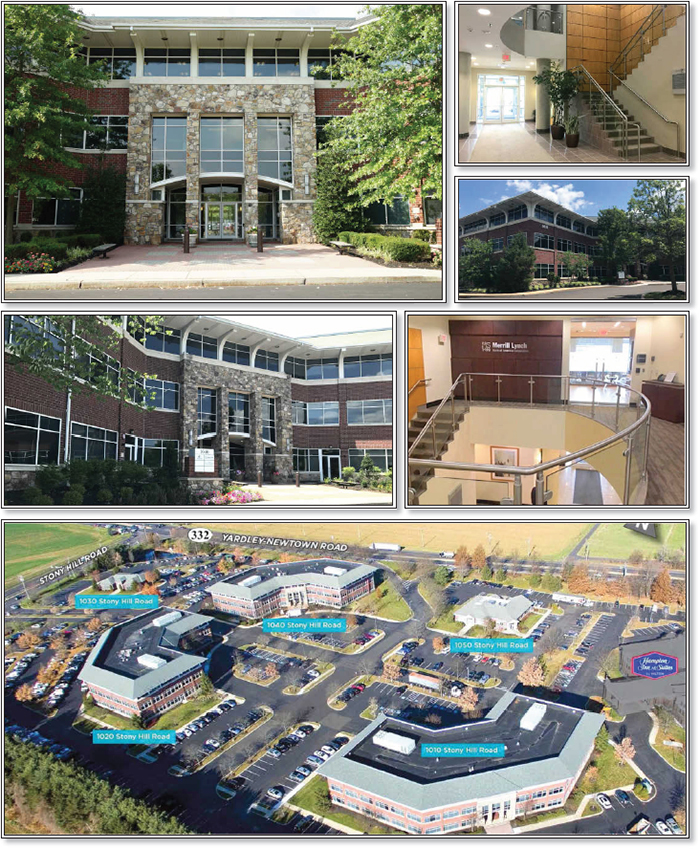
THE INFORMATION IN THIS STRUCTURAL AND COLLATERAL TERM SHEET IS NOT COMPLETE AND MAY BE AMENDED PRIOR TO THE TIME OF SALE. THIS TERM SHEET IS NOT AN OFFER TO SELL THESE SECURITIES AND IT IS NOT A SOLICITATION OF AN OFFER TO BUY THESE SECURITIES IN ANY JURISDICTION WHERE THE OFFER OR SALE IS NOT PERMITTED.
96
| LOWER MAKEFIELD CORPORATE CENTER - NORTH |

THE INFORMATION IN THIS STRUCTURAL AND COLLATERAL TERM SHEET IS NOT COMPLETE AND MAY BE AMENDED PRIOR TO THE TIME OF SALE. THIS TERM SHEET IS NOT AN OFFER TO SELL THESE SECURITIES AND IT IS NOT A SOLICITATION OF AN OFFER TO BUY THESE SECURITIES IN ANY JURISDICTION WHERE THE OFFER OR SALE IS NOT PERMITTED.
97
| No. 7 - Lower Makefield Corporate Center - North | ||||||
| Loan Information | Property Information | |||||
| Mortgage Loan Seller: | Rialto Mortgage Finance, LLC | Single Asset/Portfolio: | Single Asset | |||
| Credit Assessment (DBRS/Fitch/Moody’s): | NR/NR/NR | Property Type: | Office | |||
| Original Principal Balance: | $29,150,000 | Specific Property Type: | Suburban | |||
| Cut-off Date Principal Balance: | $29,150,000 | Location: | Lower Makefield Township, PA | |||
| % of Initial Pool Balance: | 3.1% | Size: | 190,183 SF | |||
| Loan Purpose: | Acquisition | Cut-off Date Principal Balance Per SF: | $153.27 | |||
| Borrower Name: | LMCC North Acquisitions LLC | Year Built/Renovated: | 2000/NAP | |||
| Borrower Sponsor: | Rubenstein Properties Fund III, L.P. | Title Vesting: | Fee | |||
| Mortgage Rate: | 4.6400% | Property Manager: | Self-managed | |||
| 4thMost Recent Occupancy (As of): | NAV | |||||
| Note Date: | September 5, 2018 | 3rdMost Recent Occupancy (As of): | 70.4% (12/31/2015) | |||
| Anticipated Repayment Date: | NAP | 2ndMost Recent Occupancy (As of): | 75.1% (12/31/2016) | |||
| Maturity Date: | September 6, 2028 | Most Recent Occupancy (As of): | 81.8% (12/31/2017) | |||
| IO Period: | 60 months | Current Occupancy (As of): | 86.2% (7/13/2018) | |||
| Loan Term (Original): | 120 months | |||||
| Seasoning: | 1 month | Underwriting and Financial Information: | ||||
| Amortization Term (Original): | 360 months | 4thMost Recent NOI (As of): | $2,342,513 (12/31/2015) | |||
| Loan Amortization Type: | Interest-only, Amortizing Balloon | 3rdMost Recent NOI (As of): | $2,541,530 (12/31/2016) | |||
| Interest Accrual Method: | Actual/360 | 2ndMost Recent NOI (As of): | $2,460,247 (12/31/2017) | |||
| Call Protection: | L(25), D(91), O(4) | Most Recent NOI (As of)(3): | $2,743,909 (TTM 6/30/2018) | |||
| Lockbox Type: | Hard/Springing Cash Management | |||||
| Additional Debt(1): | Yes | U/W Revenues: | $5,506,365 | |||
| Additional Debt Type(1): | Future Mezzanine | U/W Expenses: | $2,152,218 | |||
| U/W NOI(3): | $3,354,147 | |||||
| U/W NCF: | $3,078,382 | |||||
| Escrows and Reserves(2): | U/W NOI DSCR: | 1.86x | ||||
| U/W NCF DSCR: | 1.71x | |||||
| Type: | Initial | Monthly | Cap (If Any) | U/W NOI Debt Yield: | 11.5% | |
| Taxes | $106,041 | $50,496 | NAP | U/W NCF Debt Yield: | 10.6% | |
| Insurance | $0 | Springing | NAP | As-Is Appraised Value(4): | $42,200,000 | |
| Replacement Reserves | $0 | $3,170 | NAP | As-Is Appraisal Valuation Date: | July 20, 2018 | |
| TI/LC Reserve | $500,000 | $19,811 | $750,000 | Cut-off Date LTV Ratio(4): | 69.1% | |
| Free Rent | $241,940 | $0 | NAP | LTV Ratio at Maturity or ARD(4): | 63.4% | |
| Landlord Obligations | $517,500 | $0 | NAP | |||
| Stifel Reserve | $98,860 | $0 | NAP | |||
| (1) | See “Subordinate and Mezzanine Indebtedness” section. |
| (2) | See “Escrows” section. |
| (3) | AIG, the prior owner of the Lower Makefield Corporate Center - North Property (defined below), invested approximately $4.0 million in capital improvements and tenant improvements packages, increasing the occupancy of the Lower Makefield Corporate Center - North Property from 70.4% in 2015, 75.1% in 2016, and 81.8% in 2017, to the in-place occupancy of 86.2%; therefore, the NOI increased accordingly. The U/W NOI increases more than 5% compared to the Most Recent NOI because of recent leasing activities at the Lower Makefield Corporate Center - North Property. The largest tenant, Optinose US, Inc., expanded 9,590 SF in 2018, increasing its space to a total of 30,099 SF (15.8% of NRA, 19.1% of UW base rent), and the fifth largest tenant, Janney Montgomery Scott (6.1% of NRA, 8.0% of UW base rent), entered into a new lease with the expanded space in August 2018. |
| (4) | See “Appraisal” section. The Lower Makefield Corporate Center - North Property’s Appraised Value is based on the “As Is Alternate Scenario” Appraised Value of $42,200,000 as of July 20, 2018, which assumes that the Janney Montgomery Scott tenant’s expanded space has been built out, and that the tenant’s extended lease has commenced and free rent period has expired. The Appraised Value for the Lower Makefield Corporate Center - North Property based on the “As-Is” Appraised Value is $40,300,000 as of July 20, 2018. The Cut-off Date LTV Ratio and LTV Ratio at Maturity or ARD based on the “As-Is” Appraised Value for the Lower Makefield Corporate Center - North Property are 72.3% and 66.3%, respectively. At closing, the borrower deposited $241,940 into the Free Rent Reserve and $517,500 into the Landlord Obligations Reserve. |
The Mortgage Loan. The mortgage loan (the “Lower Makefield Corporate Center - North Mortgage Loan”) is evidenced by a single promissory note that is secured by a first mortgage encumbering a suburban office property located in Lower Makefield Township, Pennsylvania (the “Lower Makefield Corporate Center - North Property”). The Lower Makefield Corporate Center - North Mortgage Loan was originated on September 5, 2018 by Rialto Mortgage Finance, LLC. The Lower Makefield Corporate Center - North Mortgage Loan had an original principal balance of $29,150,000, has an outstanding principal balance as of the Cut-off Date of $29,150,000 and accrues interest at an interest rate of 4.6400%per annum. The Lower Makefield Corporate Center - North Mortgage Loan had an initial term of 120 months, has a remaining term of 119 months as of the Cut-off Date and requires interest-only payments for the first 60 months following origination and, thereafter, requires payments of principal and interest based on a 30-year amortization schedule. The Lower Makefield Corporate Center - North Mortgage Loan matures on September 6, 2028.
THE INFORMATION IN THIS STRUCTURAL AND COLLATERAL TERM SHEET IS NOT COMPLETE AND MAY BE AMENDED PRIOR TO THE TIME OF SALE. THIS TERM SHEET IS NOT AN OFFER TO SELL THESE SECURITIES AND IT IS NOT A SOLICITATION OF AN OFFER TO BUY THESE SECURITIES IN ANY JURISDICTION WHERE THE OFFER OR SALE IS NOT PERMITTED.
98
| LOWER MAKEFIELD CORPORATE CENTER - NORTH |
Following the lockout period, the borrower has the right to defease the Lower Makefield Corporate Center - North Mortgage Loan in whole, and in part (see “Partial Release” section), on any date before June 6, 2028. In addition, the Lower Makefield Corporate Center – North Mortgage Loan is prepayable without penalty on or after June 6, 2028.
Sources and Uses
| Sources | Uses | |||||||
| Original loan amount | $29,150,000 | 71.1% | Purchase Price | $38,500,000 | 93.9% | |||
| Borrowers sponsors’ new cash contribution | 11,862,387 | 28.9 | Reserves | 1,464,341 | 3.6 | |||
| Closing Costs | 1,048,046 | 2.6 | ||||||
| Total Sources | $41,012,387 | 100.0% | Total Uses | $41,012,387 | 100.0% |
The Property. The Lower Makefield Corporate Center - North Property is a suburban office property containing approximately 190,183 square feet and located in Lower Makefield Township, Pennsylvania. The Lower Makefield Corporate Center - North Property consists of three, three-story Class A office buildings and two, one-story Class B office buildings. The five buildings were constructed from 2000 to 2002 and are situated on a 20.9 acre site at 1010 Stony Hill Road (“Building A”), 1020 Stony Hill Road (“Building B”), 1030 Stony Hill Road (“Building C”), 1040 Stony Hill Road (“Building D”), and 1050 Stony Hill Road (“Building E”). The Lower Makefield Corporate Center – North Property includes a 137-room Hampton Inn & Suites Hotel, which is not part of the collateral for the Lower Makefield Corporate Center – North Mortgage Loan. Parking is provided via 875 surface parking spaces, resulting in a parking ratio of 4.6 spaces per 1,000 square feet of rentable area. As of July 13, 2018, the Lower Makefield Corporate Center – North Property was 86.2% leased to 18 tenants. The seller of Lower Makefield Corporate Center - North Property, AIG, took possession of the property in February 2015 from a defaulted mortgaged loan, which was originally issued by AIG. See “Description of the Mortgage Pool—Loan Purpose; Default History, Bankruptcy Issues and Other Proceedings” in the Preliminary Prospectus.
The Lower Makefield Corporate Center – North Property is part of the Yardley Newtown Corporate Center Condominium (the “Condominium”). The Lower Corporate Center Makefield – North Property comprises 83.15% of the Condominium (1010 Stony Hill Road: 20.55%, 1020 Stony Hill Road: 20.55%, 1030 Stony Hill Road: 11.75%, 1040 Stony Hill Road: 20.15%, and 1050 Stony Hill Road: 10.15%). The remaining condominium units include the Hampton Inn & Suites Hotel which has a 16.65% share and cell antenna which has a 0.20% share. Each Condominium unit is a separate structure, and the common elements consist of the parking areas and landscaping. Each unit owner is responsible for its proportionate share of condominium expenses to maintain the common elements. Amendments to the condominium declaration and/or bylaws must be approved by 66.0% of voting members. The Lower Makefield Corporate Center – North Mortgage Loan permits the borrower to obtain the release of either Building C or Building E from the collateral (see “Partial Release” section). Under either release scenario, following the release, the borrower will still maintain a share greater than the 66.0% required to amend the condominium declaration and/or by-laws.
Building Summary(1)
| Building Address | Year Built | Allocated Loan Amount | Total Building SF | Total Occupied SF | Building Occupancy % | Total Units | Occupied Units | % NRA |
| 1010 Stony Hill Road (Building A) | 2000 | $26,525,000 | 60,314 | 43,351 | 71.9% | 13 | 9 | 31.7% |
| 1020 Stony Hill Road (Building B) | 2001 | 60,605 | 51,271 | 84.6% | 7 | 5 | 31.9% | |
| 1040 Stony Hill Road (Building D) | 2000 | 59,528 | 59,528 | 100.0% | 8 | 8 | 31.3% | |
| 1030 Stony Hill Road (Building C) | 2000 | $1,200,000 | 3,500 | 3,500 | 100.0% | 1 | 1 | 1.8% |
| 1050 Stony Hill Road (Building E) | 2002 | $1,425,000 | 6,236 | 6,236 | 100.0% | 2 | 2 | 3.3% |
| Totals/Weighted Average | $29,150,000 | 190,183 | 163,886 | 86.2% | 31 | 25 | 100.0% |
| (1) | Based on the underwritten rent roll. |
As of July 13, 2018, the Lower Makefield Corporate Center - North Property was 86.2% leased to 18 tenants. The largest tenant at the Lower Makefield Corporate Center - North Property is Optinose US, Inc. (15.8% of NRA; 19.1% of the U/W base rent) (“OptiNose”). OptiNose is a specialty pharmaceutical company founded in 2010 and headquartered at the Lower Makefield Corporate Center – North Property. The company focuses on the development and commercialization of products for patients treated by ear, nose, and throat (ENT) and allergy specialists in the United States. OptiNose has been in occupancy since 2013, and in April 2018, OptiNose extended its lease for a term of three years expiring in May 2021 with one, three-year renewal options.
The second largest tenant is Merrill Lynch, Pierce, Fenner & Smith Incorporated (10.6% of NRA; 12.5% of the U/W base rent) (“Merrill Lynch”) and has been at the Lower Makefield Corporate Center - North Property since 1999. Merrill Lynch is currently in its third extended lease period for 10 years which began in February 2016 and expires in January 2026, with two, five-year renewal options.
The third largest tenant is Managed Markets Insight & Technology (“MMIT”) (9.2% of NRA; 10.3% of UW Base Rent) and has been in occupancy since 2012. Founded in 1994, MMIT is headquartered in at the Lower Makefield Corporate Center – North Property and provides formulary management tools and software to payers, pharmaceutical companies, healthcare providers, pharmacies, organizational customers, and plan members.
THE INFORMATION IN THIS STRUCTURAL AND COLLATERAL TERM SHEET IS NOT COMPLETE AND MAY BE AMENDED PRIOR TO THE TIME OF SALE. THIS TERM SHEET IS NOT AN OFFER TO SELL THESE SECURITIES AND IT IS NOT A SOLICITATION OF AN OFFER TO BUY THESE SECURITIES IN ANY JURISDICTION WHERE THE OFFER OR SALE IS NOT PERMITTED.
99
| LOWER MAKEFIELD CORPORATE CENTER - NORTH |
The following table presents certain information relating to the tenancies at the Lower Makefield Corporate Center - North Property:
Major Tenants
| Tenant Name | Credit Rating (Fitch/Moody’s/ S&P)(1) | Tenant NRSF | % of NRSF | Annual U/W Base Rent PSF(2) | Annual U/W Base Rent(2) | % of Total Annual U/W Base Rent | Lease Expiration Date |
| Major Tenants | |||||||
| Optinose US, Inc. | NR/NR/NR | 30,099 | 15.8% | $30.35 | $913,355 | 19.1% | 5/31/2021(3) |
| Merrill Lynch, Pierce, Fenner & Smith Incorporated | A+/A3/A- | 20,232 | 10.6% | $29.50 | $596,844 | 12.5% | 1/31/2026(4) |
| Managed Markets Insight & Technology | NR/NR/NR | 17,559 | 9.2% | $28.00 | $491,652 | 10.3% | 2/28/2023(5) |
| Curtin & Heefner | NR/NR/NR | 14,752 | 7.8% | $27.00 | $398,304 | 8.3% | 5/31/2022(6) |
| Janney Montgomery Scott | A+/Aa3/NR | 11,537 | 6.1% | $32.96 | $380,260 | 8.0% | 7/31/2029(7) |
| Total Major Tenants | 94,179 | 49.5% | $29.52 | $2,780,415 | 58.2% | ||
| Non-Major Tenants(8) | 69,707 | 36.7% | $28.68 | $1,999,260 | 41.8% | ||
| Occupied Collateral Total(8) | 163,886 | 86.2% | $29.16 | $4,779,675 | 100.0% | ||
| Vacant Space | 26,297 | 13.8% | |||||
| Collateral Total | 190,183 | 100.0% | |||||
| (1) | Certain ratings are those of the parent company whether or not the parent guarantees the lease. |
| (2) | Annual U/W Base Rent PSF and Annual U/W Base Rent include contractual rent steps through September 2019, unless otherwise noted. |
| (3) | Optinose US, Inc. has one, three-year renewal option remaining and no termination options. Optinose US, Inc. has $19,418 of free rent outstanding through October 2018, which amount was reserved at origination. |
| (4) | Merrill Lynch, Pierce, Fenner & Smith Incorporated has two, five-year renewal options remaining with no termination options. |
| (5) | Managed Markets Insight & Technology has one, five-year renewal option remaining with no termination options. |
| (6) | Curtin & Heefner has one, five-year renewal option remaining and no termination options. Curtin & Heefner has a right of first refusal on any available adjacent space to its suite on the 1st floor of the 1040 Stony Hill Road building (Building D). |
| (7) | Janney Montgomery Scott has two, five-year renewal options remaining and no termination options. Janney Montgomery Scott has $222,522 in free rent outstanding through April 2019, which was reserved at origination. Janney Montgomery Scott also has a right of first refusal on the adjacent space in the 1010 Stony Hill Road building (Building A). |
| (8) | Includes 1,730 SF property management office space. |
The following table presents certain information relating to the lease rollover schedule at the Lower Makefield Corporate Center - North Property:
Lease Expiration Schedule(1)(2)
| Year Ending December 31, | No. of Leases Expiring | Expiring NRSF | % of Total NRSF | Cumulative Expiring NRSF | Cumulative% of Total NRSF | Annual U/W Base Rent | % of Total Annual U/W Base Rent | Annual U/W Base Rent PSF(3) |
| 2018 | 0 | 0 | 0.0% | 0 | 0.0% | $0 | 0.0% | $0.00 |
| 2019 | 4 | 12,341 | 6.5% | 12,341 | 6.5% | $380,823 | 8.0% | $30.86 |
| 2020 | 2 | 7,625 | 4.0% | 19,966 | 10.5% | $249,125 | 5.2% | $32.67 |
| 2021 | 4 | 37,694 | 19.8% | 57,660 | 30.3% | $1,114,623 | 23.3% | $29.57 |
| 2022 | 4 | 28,289 | 14.9% | 85,949 | 45.2% | $799,163 | 16.7% | $28.25 |
| 2023 | 6 | 41,853 | 22.0% | 127,802 | 67.2% | $1,205,844 | 25.2% | $28.81 |
| 2024 | 1 | 2,585 | 1.4% | 130,387 | 68.6% | $52,993 | 1.1% | $20.50 |
| 2025 | 0 | 0 | 0.0% | 130,387 | 68.6% | $0 | 0.0% | $0.00 |
| 2026 | 1 | 20,232 | 10.6% | 150,619 | 79.2% | $596,844 | 12.5% | $29.50 |
| 2027 | 0 | 0 | 0.0% | 150,619 | 79.2% | $0 | 0.0% | $0.00 |
| 2028 | 0 | 0 | 0.0% | 150,619 | 79.2% | $0 | 0.0% | $0.00 |
| Thereafter | 3 | 13,267 | 7.0% | 162,156 | 86.2% | $380,260 | 8.0% | $28.66 |
| Vacant | 0 | 26,297 | 13.8% | 188,453 | 100.0% | $0 | 0.0% | $0.00 |
| Total/Weighted Average | 25 | 190,183(4) | 100.0% | $4,779,675 | 100.0% | $29.16(4) |
| (1) | Information obtained from the underwritten rent roll. |
| (2) | Certain tenants may have lease termination options that are exercisable prior to the stated expiration date of the subject lease and that are not considered in the Lease Expiration Schedule. |
| (3) | Weighted Average Annual U/W Base Rent PSF excludes vacant space. |
| (4) | Includes 1,730 SF of property management office space. |
THE INFORMATION IN THIS STRUCTURAL AND COLLATERAL TERM SHEET IS NOT COMPLETE AND MAY BE AMENDED PRIOR TO THE TIME OF SALE. THIS TERM SHEET IS NOT AN OFFER TO SELL THESE SECURITIES AND IT IS NOT A SOLICITATION OF AN OFFER TO BUY THESE SECURITIES IN ANY JURISDICTION WHERE THE OFFER OR SALE IS NOT PERMITTED.
100
| LOWER MAKEFIELD CORPORATE CENTER - NORTH |
The following table presents historical occupancy percentages at the Lower Makefield Corporate Center - North Property:
Historical Occupancy
2014 | 2015(1) | 2016(1) | 2017(1) | 7/13/2018(2) |
| NAV | 70.4% | 75.1% | 81.8% | 86.2% |
| (1) | Information obtained from the borrower. |
| (2) | Information obtained from the underwritten rent roll. |
Operating History and Underwritten Net Cash Flow.The following table presents certain information relating to the historical operating performance and Underwritten Net Cash Flow at the Lower Makefield Corporate Center - North Property:
Cash Flow Analysis
| 2015 | 2016 | 2017 | TTM 6/30/2018 | U/W | % of U/W Effective Gross Income | U/W $ per SF | |||||||||
| Base Rent | $3,448,640 | $3,982,505 | $3,981,437 | $4,242,589 | $4,690,917 | 85.2% | $24.67 | ||||||||
| Rent Steps | 0 | 0 | 0 | 0 | 88,757 | 1.6 | 0.47 | ||||||||
| Straight Line Rent(1) | 0 | 0 | 0 | 0 | 165,697 | 3.0 | 0.87 | ||||||||
| Grossed Up Vacant Space | 0 | 0 | 0 | 0 | 815,207 | 14.8 | 4.29 | ||||||||
| Total Reimbursables | 488,481 | 528,956 | 428,619 | 506,804 | 560,993 | 10.2 | 2.95 | ||||||||
| Less Vacancy & Credit Loss | 0 | 0 | 0 | 0 | (815,207)(2) | (14.8) | (4.29) | ||||||||
| Effective Gross Income | $3,937,121 | $4,511,461 | $4,410,056 | $4,749,393 | $5,506,365 | 100.0% | $28.95 | ||||||||
| Total Operating Expenses | $1,594,609 | $1,969,931 | $1,949,809 | $2,005,484 | $2,152,218 | 39.1% | $11.32 | ||||||||
| Net Operating Income(3) | $2,342,513 | $2,541,530 | $2,460,247 | $2,743,909 | $3,354,147 | 60.9% | $17.64 | ||||||||
| TI/LC | 0 | 0 | 0 | 0 | 237,729 | 4.3 | 1.25 | ||||||||
| Capital Expenditures | 0 | 0 | 0 | 0 | 38,037 | 0.7 | 0.20 | ||||||||
| Net Cash Flow | $2,342,513 | $2,541,530 | $2,460,247 | $2,743,909 | $3,078,382 | 55.9% | $16.19 | ||||||||
| NOI DSCR | 1.30x | 1.41x | 1.37x | 1.52x | 1.86x | ||||||||||
| NCF DSCR | 1.30x | 1.41x | 1.37x | 1.52x | 1.71x | ||||||||||
| NOI DY | 8.0% | 8.7% | 8.4% | 9.4% | 11.5% | ||||||||||
| NCF DY | 8.0% | 8.7% | 8.4% | 9.4% | 10.6% | ||||||||||
| (1) | Straight Line Rent is attributable to the investment grade tenancy at the Lower Makefield Corporate Center – North Property. The investment grade tenants include Merrill Lynch, Pierce, Fenner & Smith Incorporated, Stifel Nicholas, Janney Montgomery Scott, Fox & Roach, Wells Fargo Advisors, Mercer Holding Corp., and Charles Schwab. |
| (2) | The underwritten economic vacancy is 12.9%. The Lower Makefield Corporate Center - North Property was 86.2% physically occupied as of July 13, 2018. |
| (3) | AIG, the prior owner of the Lower Makefield Corporate Center - North Property invested approximately $4.0 million in capital improvements and tenant improvements packages, increasing the occupancy of the Lower Makefield Corporate Center - North Property from 70.4% in 2015, 75.1% in 2016, and 81.8% in 2017, to the in-place occupancy of 86.2%; therefore, the NOI increased accordingly. The U/W NOI increases more than 5% compared to the Most Recent NOI because of recent leasing activities at the Lower Makefield Corporate Center - North Property. The largest tenant, Optinose US, Inc., expanded its space 9,590 SF in 2018, increasing its space to a total of 30,099 SF (15.8% of NRA, 19.1% of UW base rent), and the fifth largest tenant, Janney Montgomery Scott (6.1% of NRA, 8.0% of UW base rent), entered into a new lease with the expanded space in August 2018. |
Appraisal.As of the appraisal valuation date of July 20, 2018, the Lower Makefield Corporate Center - North Property had an “as-is alternate scenario” appraised value of $42,200,000, which assumes that Janney Montgomery Scott tenant’s expanded space has been built out, and that the tenant’s new lease has commenced and free rent period has expired. At origination, the borrower deposited $241,940 into the Free Rent Reserve and $517,500 into the Landlord Obligations Reserve. The appraiser also concluded an “as-is” value of $40,300,000 as of July 20, 2018 and an “as stabilized” value of $49,000,000 as of September 1, 2020 for the Lower Makefield Corporate Center - North Property.
| Building Address | As-Is Appraised Value July 20, 2018 | As-Is Alternate Scenario Appraised Value July 20, 2018 | As-Stabilized Appraised Value September 1, 2020 |
| 1010 Stony Hill Road (Building A); 1020 Stony Hill Road (Building B); 1040 Stony Hill Road (Building D) | $36,800,000 | $38,700,000 | $45,500,000 |
| 1030 Stony Hill Road (Building C) | $1,600,000 | N/A | N/A |
| 1050 Stony Hill Road (Building E) | $1,900,000 | N/A | N/A |
| Total Value | $40,300,000 | $42,200,000 | $49,000,000 |
Environmental Matters.According to a Phase I environmental assessment dated July 25, 2018, there was no evidence of any recognized environmental conditions at the Lower Makefield Corporate Center - North Property.
THE INFORMATION IN THIS STRUCTURAL AND COLLATERAL TERM SHEET IS NOT COMPLETE AND MAY BE AMENDED PRIOR TO THE TIME OF SALE. THIS TERM SHEET IS NOT AN OFFER TO SELL THESE SECURITIES AND IT IS NOT A SOLICITATION OF AN OFFER TO BUY THESE SECURITIES IN ANY JURISDICTION WHERE THE OFFER OR SALE IS NOT PERMITTED.
101
| LOWER MAKEFIELD CORPORATE CENTER - NORTH |
Market Overview and Competition. The Lower Makefield Corporate Center - North Property is located in Lower Makefield Township, Bucks County, Pennsylvania, within the Philadelphia-Camden-Wilmington, PA-NJ-DE-MD metropolitan statistical area. Bucks County encompasses 604 square miles in southeastern Pennsylvania immediately north of Philadelphia. Bucks County is located within the greater Montgomery-Bucks-Chester County trade area, which, according to the appraisal, is the state’s most educated and affluent economy with a 2018 gross metro product estimated at $132.6 billion. Major employers in Bucks County include: Central Bucks School District, Giant Food Stores LLC, St. Mary Medical Center, Doylestown Hospital and Bucks County. The Lower Makefield Corporate Center - North Property is located approximately 11.1 miles from Trenton, New Jersey; 18.0 miles from Princeton, New Jersey; 28.1 miles from Center City Philadelphia; and, 75.1 miles from New York, New York. Primary access to the Lower Makefield Corporate Center - North Property’s market area is provided by Interstate 95, US Route 332 (Newtown Bypass), and Interstate 276 (Pennsylvania Turnpike). The Lower Makefield Corporate Center - North Property is visible along Interstate 95 and is situated at the Yardley-Newtown exit. Interstate 95 travels north-south and provides interstate access to Center City Philadelphia, Philadelphia International Airport, Princeton, Trenton, and Delaware.
The Lower Makefield Corporate Center - North Property’s neighborhood is approximately 75% developed with a mix of office, agricultural, and residential properties. Recent development within the area includes office development within the Lower Makefield Corporate Center - North Property’s office campuses which were constructed in the mid to late 2000s, as well as 777 Township Line Road, a 110,000 square foot LEED Certified office building built in 2006, and 1000 Floral Vale Boulevard, an 87,000 square foot Class A office building completed in 2009.
According to a third party market research report, the average estimated 2018 population within a one-, three-, and five-mile radius of the Lower Makefield Corporate Center - North Property is 6,524, 47,602 and 158,242, respectively. The estimated 2018 average household income within the one-, three-, and five-mile radius of the Lower Makefield Corporate Center - North Property is $148,128, $167,840, and $136,387.
According to a third party market research report, the Lower Makefield Corporate Center - North Property is located within the Philadelphia office market and the Lower Bucks office submarket. As of the second quarter of 2018, the Philadelphia office market consisted of 25,387 buildings providing approximately 441.4 million square feet of office space. The Philadelphia office market reported a vacancy rate of 8.1% and asking rents of $22.72 per square foot. There were seven buildings delivered with positive net absorption of 590,632 square feet. The Lower Bucks office submarket consisted of 1,110 buildings providing approximately 15.1 million square feet of office space. The second quarter 2018 vacancy rate was reported at 13.2% with an asking rental rate of $21.17 per square foot with positive net absorption of 182,879 square feet.
The following table presents certain information relating to comparable office properties for the Lower Makefield Corporate Center - North Property:
Comparable Leases(1)
| Property Name/Location | Year Built/ Renovated | Stories | Total GLA (SF) | Distance from Subject | Tenant Name | Lease Date/Term | Lease Area (SF) | Annual Base Rent PSF | Lease Type |
Lower Makefield Corporate Center - North (Subject) Lower Makefield Township, PA | 2000/NAP | Various | 190,183 | -- | Janney Montgomery Scott | Aug. 2018 / 11 Yrs | 11,537 | $32.00 | Mod Gross |
41 University Drive Newtown, PA | 1999/NAP | 4 | 90,325 | 1.8 miles | EPAM Systems | June 2018 / 11 Yrs | 17,746 | $25.00 | Gross + TE |
1000 Floral Vale Boulevard Yardley, PA | 2009/NAP | 4 | 87,155 | 1.7 miles | Smart Sand | Nov. 2017 / 7 Yrs | 5,805 | $28.50 | Gross + TE |
777 Township Line Road Yardley, PA | 2006/NAP | 3 | 110,000 | 0.8 miles | Morgan Stanley | Sep. 2017 / 10 Yrs | 6,671 | $28.50 | Gross + TE |
41 University Drive Newtown, PA | 1999/NAP | 4 | 90,325 | 1.8 miles | Xsunt Corporation | Aug. 2017 / 3 Yrs
| 2,067 | $27.50 | Gross + TE |
19 W. College Avenue Yardley, PA | 1906/2016 | 1 | 57,000 | 3.1 miles | Icon | June 2017 / 10.25 Yrs | 12,923 | $30.50 | Gross + TE |
100 Brandywine Boulevard Newtown, PA | 2002/NAP | 3 | 106,250 | 1.0 mile | Inventiv Health | Feb. 2017 / 7.5 Yrs | 51,320 | $26.25 | Gross + TE |
777 Township Line Road Yardley, PA | 2006/NAP | 3 | 110,000 | 0.8 miles | ETHOS Health Communications | Dec. 2016 / 7.25 Yrs | 28,016 | $27.50 | Gross + TE |
| (1) | Information obtained from the appraisal dated August 28, 2018 and the underwritten rent roll. |
The Borrower.The borrower is LMCC North Acquisitions LLC, a single purpose, Delaware limited liability company entity with one independent director. Legal counsel to the borrower delivered a non-consolidation opinion in connection with the origination of the Lower Makefield Corporate Center - North Mortgage Loan. Rubenstein Properties Fund III, L.P., the indirect owner of the borrower, is the guarantor of certain nonrecourse carveouts under Lower Makefield Corporate Center - North Mortgage Loan.
The Borrower Sponsor.The borrower sponsor and non-recourse carveout guarantor is Rubenstein Properties Fund III, L.P., a Delaware limited partnership, which is indirectly controlled by David Rubenstein. Rubenstein Properties Fund III, L.P. was founded by Rubenstein Partners, which was founded in 2004 by David Rubenstein. Rubenstein Partners is a vertically-integrated fund manager for a series of private equity funds focused on office investments throughout the eastern United States. The firm provides professional investment
THE INFORMATION IN THIS STRUCTURAL AND COLLATERAL TERM SHEET IS NOT COMPLETE AND MAY BE AMENDED PRIOR TO THE TIME OF SALE. THIS TERM SHEET IS NOT AN OFFER TO SELL THESE SECURITIES AND IT IS NOT A SOLICITATION OF AN OFFER TO BUY THESE SECURITIES IN ANY JURISDICTION WHERE THE OFFER OR SALE IS NOT PERMITTED.
102
| LOWER MAKEFIELD CORPORATE CENTER - NORTH |
services as a Registered Investment Advisor on behalf of its investor base, which consists of public and private pension funds, university endowments, foundations, and family offices. The firm focuses on a single asset class (office), a single segment of the risk spectrum (value-added), and a specific geography (the eastern U.S.). Although focused, the platform is expansive and covers the largest segment of the real estate industry, commercial office, and approximately 70% of the U.S. office markets.
Escrows.The loan documents provide for upfront reserves in the amount of $106,041 for real estate taxes, $500,000 for TI/LC reserve, $241,940 for free rent reserves, $517,500 for landlord obligations, and $98,860 for Stifel tenant improvement reserves. The loan documents require monthly deposits of $50,496 for real estate taxes, $3,170 for replacement reserves and $19,811 for tenant improvements and leasing commissions (subject to a $750,000 cap).
The Lower Makefield Corporate Center – North Mortgage Loan documents do not require ongoing monthly escrows for insurance premiums as long as (i) the blanket insurance policy required under the loan documents and maintained by the borrower is in full force and effect; and (ii) the borrower delivers to the lender within 15 days prior to the expiration of the blanket insurance policy, the certificates of insurance evidencing coverage accompanied by evidence of payment of the insurance premiums due under the policy.
Lockbox and Cash Management.The Lower Makefield Corporate Center - North Mortgage Loan requires a lender-controlled lockbox account, which is already in place. The borrower has directed all tenants to pay their rents directly to such lockbox account. The loan documents also require that all rents or other charges related to the Lower Makefield Corporate Center – North Property received by the borrower be deposited into the lockbox account within two business days of receipt. Pursuant to the Lower Makefield Corporate Center – North Mortgage Loan documents, all excess funds on deposit will be applied (a) if a Cash Sweep Event (as defined below) is not in effect, to the borrower; (b) if a Cash Sweep Event is in effect due to the existence of a Critical Tenant Trigger Event (as defined below), to the Critical Tenant TI/LC account, until the Critical Tenant Trigger Event has been cured, and (c) if a Cash Sweep Event is in effect, but no Critical Tenant Trigger Event is in effect, to the excess cash flow account. So long as no event of default exists, funds on deposit in the excess cash flow account will be disbursed to the borrower for tenant improvement costs and leasing commissions incurred to the extent the sums on deposit in the rollover account or Critical Tenant TI/LC account are insufficient for the payment of the same.
A “Cash Sweep Event” will commence upon the occurrence of
| (i) | an event of default; |
| (ii) | any bankruptcy action of the borrower, guarantor, or manager; or |
| (iii) | a Critical Tenant Trigger Event. |
A Cash Sweep Event will end when
| ● | with regards to clause (i) above, such event of default has been cured provided that the lender will not have exercised any of its rights under the loan documents to accelerate the loan, move to appoint a receiver or commence a foreclosure action; |
| ● | with respect to clause (ii) above, such bankruptcy action has been discharged, stayed, or dismissed, within 90 days for the borrower, 60 days for the guarantor and 120 days for the manager, among other conditions; or |
| ● | with respect to clause (iii) above, the Critical Tenant Trigger Event has been cured. |
A “Critical Tenant Trigger Event” will occur upon
| (i) | Optinose US, Inc., or any other tenant occupying the space currently occupied by such tenant (each, a “Critical Tenant” and each related lease, a “Critical Tenant Lease”) giving notice of its intention to not extend or renew its lease; |
| (ii) | termination of the Critical Tenant Lease; |
| (iii) | the Critical Tenant failing to give notice of its election to renew its lease on or prior to the date that is twelve (12) months prior to the expiration date of its lease; |
| (iv) | the Critical Tenant failing to give notice of its election to renew its lease on or prior to the date on which such Critical Tenant is required under its lease to notify the landlord of its election to renew its lease; |
| (v) | the occurrence of a monetary or material non-monetary event of default under the Critical Tenant Lease; |
| (vi) | the occurrence of a bankruptcy action of the related Critical Tenant or any guarantor of the Critical Tenant Lease; or |
| (vii) | the related Critical Tenant discontinuing its normal business operations at its leased premises. |
A Critical Tenant Trigger Event will end upon
| ● | with respect to clause (i) above, the earlier of (I) the date that is 24 months after the occurrence of such Critical Tenant Trigger Event and (II) the date that (1) a lease extension (acceptable to lender) covering the Critical Tenant leased premises is executed and delivered, pursuant to which all tenant improvement costs, leasing commissions and other material costs and expenses related to the lease extension have been paid or reserved with lender (such lease extension, a “Critical Tenant Lease Extension”), (2) a Critical Tenant Space Re-tenanting Event (as defined below) has occurred, or (3) the Alternative Conditions (as defined below) have been satisfied; |
| ● | with respect to clause (ii), (iii) or (iv) above, the date that (1) a Critical Tenant Lease Extension is executed and delivered by the borrower, (2) a Critical Tenant Space Re-tenanting Event has occurred, or (3) the Alternative Conditions have been satisfied; |
| ● | with respect to clause (v) above, the date that the applicable event of default under the Critical Tenant Lease has been cured; |
| ● | with respect to clause (vi) above, the related Critical Tenant having affirmed its lease in the bankruptcy proceeding and is paying all rents and other amounts due under its lease; or |
| ● | with respect to clause (vii) above, (1) the related Critical Tenant re-commencing its normal business operations at its leased premises, (2) a Critical Tenant Space Re-Tenanting Event having occurred, or (3) the Alternative Conditions having been satisfied. |
THE INFORMATION IN THIS STRUCTURAL AND COLLATERAL TERM SHEET IS NOT COMPLETE AND MAY BE AMENDED PRIOR TO THE TIME OF SALE. THIS TERM SHEET IS NOT AN OFFER TO SELL THESE SECURITIES AND IT IS NOT A SOLICITATION OF AN OFFER TO BUY THESE SECURITIES IN ANY JURISDICTION WHERE THE OFFER OR SALE IS NOT PERMITTED.
103
| LOWER MAKEFIELD CORPORATE CENTER - NORTH |
A “Critical Tenant Space Re-tenanting Event” will occur on the date that each of the following conditions has been satisfied: (i) the related Critical Tenant space has been leased to one or more replacement tenants for a term of at least five years and on terms that are acceptable to the lender, (ii) all tenant improvement costs, leasing commissions and other material costs and expenses relating to the re-letting of the related Critical Tenant Space have been paid in full or reserved with the lender, and (iii) the replacement tenant(s) are conducting normal business operations at the related Critical Tenant space.
The “Alternative Condition” will be satisfied if (i) the total occupancy at the Lower Makefield Corporate Center – North Property is at least 86.0% (based on leases with tenants that are in occupancy, open for business and paying full, unabated rent) and (ii) the debt yield is equal to or greater than 9.7% without giving effect to the related Critical Tenant Lease.
Property Management.The Lower Makefield Corporate Center - North Property is managed by an affiliate of the borrower sponsor.
Assumption.The borrower has the right to transfer the Lower Makefield Corporate Center - North Property with the lender’s consent (not to be unreasonably withheld), provided that no event of default has occurred and is continuing and certain other conditions are satisfied, including (i) the lender’s reasonable determination that the proposed transferee and guarantor satisfy the lender’s credit review and underwriting standards, taking into consideration transferee experience, financial strength and general business standing; (ii) execution of a recourse guaranty and an environmental indemnity by an affiliate of the transferee; and (iii) if requested by the lender, rating agency confirmation from Fitch, DBRS and Moody’s that the transfer will not result in a downgrade, withdrawal or qualification of the respective ratings assigned to the Series 2018-C47 certificates.
Partial Release.Following the second anniversary of closing date of the WFCM 2018-C47 securitization and prior to June 6, 2028, the borrower is permitted to obtain the release of either Building C or Building E in connection with a partial defeasance, subject to certain conditions, including (i) delivery of defeasance collateral in an amount equal to 125.0% of the related property’s original allocated loan balance (the allocated loan balance for Building C is $1,200,000 and Building E is $1,425,000); (ii) the amortizing debt service coverage ratio (based upon the trailing 12-month period immediately preceding the date of such determination) with respect to the remaining properties will be no less than the greater of (a) 1.57x and (b) the amortizing debt service coverage ratio immediately prior to the release; and (iii) the loan to value ratio with respect to the remaining properties will be no greater than the lesser of (a) 70.0% and (b) the loan to value ratio immediately prior to the release.
Real Estate Substitution.Not permitted.
Subordinate and Mezzanine Indebtedness.The loan documents permit mezzanine financing subject to certain conditions, including (i) the execution of an intercreditor agreement in form and substance reasonably acceptable to the lender and acceptable to the rating agencies; (ii) based on the combined balances, (a) the loan-to-value ratio is not greater than 70.0% and (b) the amortizing debt service coverage ratio is not less than 1.57x; and (iii) receipt of rating agency confirmation from each of the rating agencies that the mezzanine financing will not result in a downgrade, withdrawal or qualification of the respective ratings assigned to the Series 2018-C47 certificates.
Ground Lease.None.
Terrorism Insurance.The loan documents require that the “all risk” insurance policy required to be maintained by the borrower provides coverage for terrorism in an amount equal to the full replacement cost of the Lower Makefield Corporate Center - North, as well as business interruption insurance covering no less than the 18-month period following the occurrence of a casualty event, together with a 12-month extended period of indemnity.
THE INFORMATION IN THIS STRUCTURAL AND COLLATERAL TERM SHEET IS NOT COMPLETE AND MAY BE AMENDED PRIOR TO THE TIME OF SALE. THIS TERM SHEET IS NOT AN OFFER TO SELL THESE SECURITIES AND IT IS NOT A SOLICITATION OF AN OFFER TO BUY THESE SECURITIES IN ANY JURISDICTION WHERE THE OFFER OR SALE IS NOT PERMITTED.
104
(THIS PAGE INTENTIONALLY LEFT BLANK)
THE INFORMATION IN THIS STRUCTURAL AND COLLATERAL TERM SHEET IS NOT COMPLETE AND MAY BE AMENDED PRIOR TO THE TIME OF SALE. THIS TERM SHEET IS NOT AN OFFER TO SELL THESE SECURITIES AND IT IS NOT A SOLICITATION OF AN OFFER TO BUY THESE SECURITIES IN ANY JURISDICTION WHERE THE OFFER OR SALE IS NOT PERMITTED.
105
| 2747 PARK BOULEVARD |
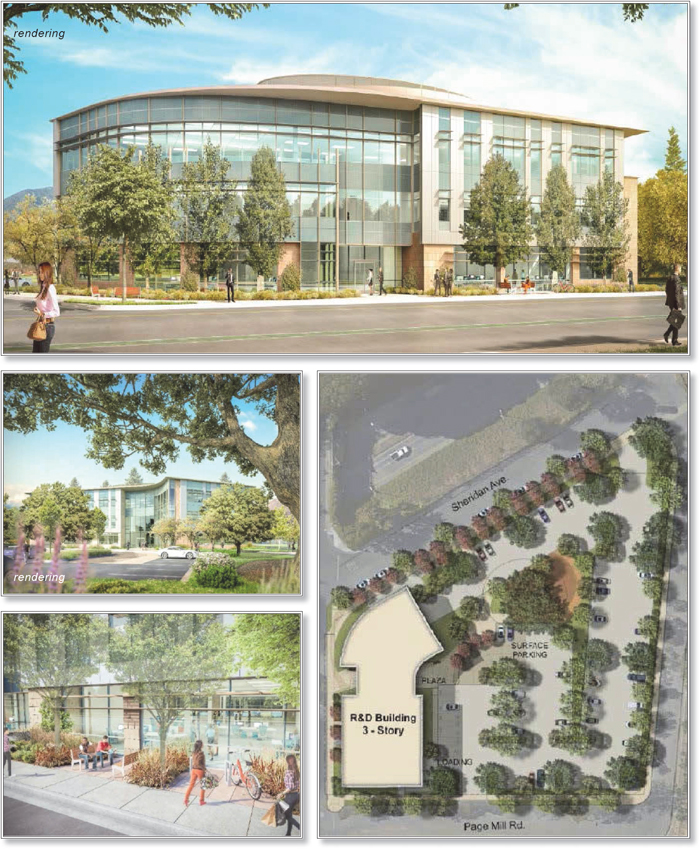
THE INFORMATION IN THIS STRUCTURAL AND COLLATERAL TERM SHEET IS NOT COMPLETE AND MAY BE AMENDED PRIOR TO THE TIME OF SALE. THIS TERM SHEET IS NOT AN OFFER TO SELL THESE SECURITIES AND IT IS NOT A SOLICITATION OF AN OFFER TO BUY THESE SECURITIES IN ANY JURISDICTION WHERE THE OFFER OR SALE IS NOT PERMITTED.
106
| 2747 PARK BOULEVARD |
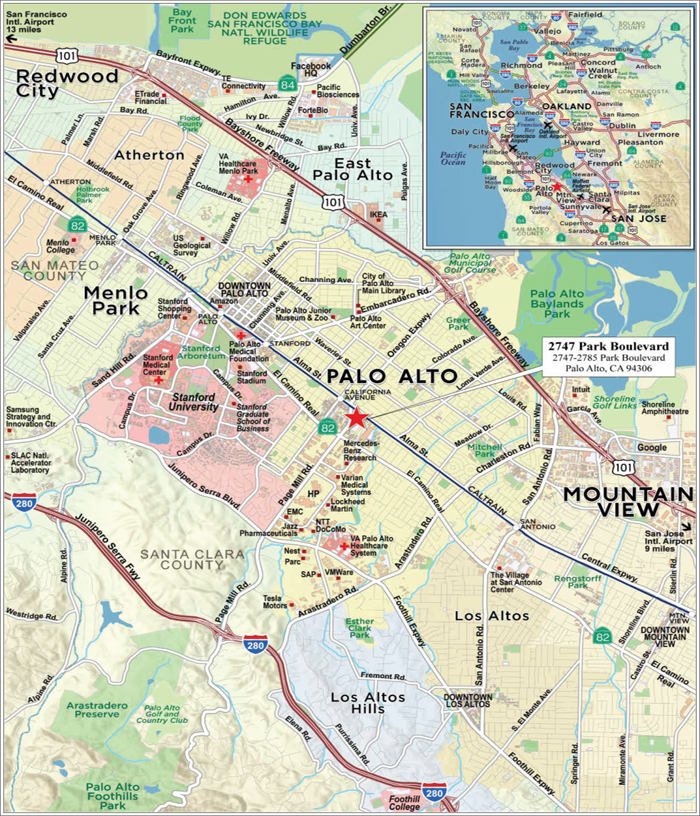
THE INFORMATION IN THIS STRUCTURAL AND COLLATERAL TERM SHEET IS NOT COMPLETE AND MAY BE AMENDED PRIOR TO THE TIME OF SALE. THIS TERM SHEET IS NOT AN OFFER TO SELL THESE SECURITIES AND IT IS NOT A SOLICITATION OF AN OFFER TO BUY THESE SECURITIES IN ANY JURISDICTION WHERE THE OFFER OR SALE IS NOT PERMITTED.
107
| No. 8 – 2747 Park Boulevard | ||||||
| Loan Information | Property Information | |||||
| Mortgage Loan Seller: | Barclays Bank PLC | Single Asset/Portfolio: | Single Asset | |||
| Credit Assessment (DBRS/Fitch/Moody’s): | A/BBB-sf*/Baa3 | Property Type: | Office | |||
| Original Principal Balance(1): | $26,000,000 | Specific Property Type: | Suburban | |||
| Cut-off Date Balance(1): | $26,000,000 | Location: | Palo Alto, CA | |||
| % of Initial Pool Balance: | 2.7% | Size: | 36,120 SF | |||
| Loan Purpose: | Refinance | Cut-off Date Balance Per SF(1): | $719.82 | |||
| Borrower Name: | 2747 Park PA LLC | Year Built/Renovated: | 2018/NAP | |||
| Borrower Sponsor: | The Jay Paul Company | Title Vesting: | Fee | |||
| Mortgage Rate: | 4.2173% | Property Manager: | Self-managed | |||
| Note Date: | September 13, 2018 | 4thMost Recent Occupancy(4): | NAP | |||
| Anticipated Repayment Date: | NAP | 3rdMost Recent Occupancy(4): | NAP | |||
| Maturity Date: | September 6, 2028 | 2ndMost Recent Occupancy(4): | NAP | |||
| IO Period: | 60 months | Most Recent Occupancy(4): | NAP | |||
| Loan Term (Original): | 119 months | Current Occupancy (As of): | 100.0% (10/1/2018) | |||
| Seasoning: | 0 months | |||||
| Amortization Term (Original): | 360 months | |||||
| Loan Amortization Type: | Interest-only, Amortizing Balloon | Underwriting and Financial Information: | ||||
| Interest Accrual Method: | Actual/360 | 4thMost Recent NOI(4): | NAP | |||
| Call Protection: | GRTR 1% or YM(24);GRTR 1% or | 3rdMost Recent NOI(4): | NAP | |||
| YM or D(88);O(7) | 2ndMost Recent NOI(4): | NAP | ||||
| Lockbox Type: | Hard/Upfront Cash Management | Most Recent NOI(4): | NAP | |||
| Additional Debt(2): | Yes | |||||
| Additional Debt Type(2): | Mezzanine | |||||
| U/W Revenues: | $4,658,286 | |||||
| U/W Expenses: | $848,118 | |||||
| U/W NOI: | $3,810,169 | |||||
| Escrows and Reserves(3): | U/W NCF: | $3,705,709 | ||||
| U/W NOI DSCR: | 2.49x | |||||
| Type: | Initial | Monthly | Cap (If Any) | U/W NCF DSCR(1): | 2.42x | |
| Taxes | $72,697 | $12,480 | NAP | U/W NOI Debt Yield(1): | 14.7% | |
| Insurance | $0 | Springing | NAP | U/W NCF Debt Yield: | 14.3% | |
| Replacement Reserve | $0 | $602 | NAP | As-Is Appraised Value(5): | $69,000,000 | |
| Rent Concession Reserve | $976,143 | $0 | NAP | As-Is Appraisal Valuation Date(5): | July 13, 2018 | |
| Upfront TI/LC Reserve | $2,889,600 | $0 | NAP | Cut-off Date LTV Ratio(1)(5): | 37.7% | |
| Environmental Reserve | $400,000 | $0 | NAP | LTV Ratio at Maturity or ARD(1)(5): | 34.4% | |
| (1) | See “The Mortgage Loan” section. All statistical information related to balance per square foot, loan-to-value ratios, debt service coverage ratios and debt yields are based on the 2747 Park Boulevard Mortgage Loan (as defined below). The Cut-off Date LTV Ratio, LTV Ratio at Maturity or ARD, U/W NCF DSCR and U/W NOI Debt Yield based on the 2747 Park Boulevard Mortgage Loan and the 2747 Park Boulevard Mezzanine Loan (as defined below) (together, the “2747 Park Boulevard Total Debt”), are 72.5%, 69.2%, 1.15x, and 7.6%, respectively. |
| (2) | See “Subordinate and Mezzanine Indebtedness” section. |
| (3) | See “Escrows” section. |
| (4) | Historical occupancy, operating and financial information are unavailable as the 2747 Park Boulevard Property (as defined below) was built in 2018. |
| (5) | The appraiser concluded a “go-dark” value of $65,200,000 as of July 13, 2018. The Cut-off Date LTV Ratio and LTV Ratio at Maturity or ARD were 39.9% and 36.4%, respectively, in regards to the “go-dark” value for the 2747 Park Boulevard Mortgage Loan and 76.7% and 73.2%, respectively, for the 2747 Park Boulevard Mortgage Loan and 2747 Park Boulevard Mezzanine Loan. |
The Mortgage Loan.The mortgage loan (the “2747 Park Boulevard Mortgage Loan”) is evidenced by a single promissory note secured by a first mortgage encumbering the fee simple interest in a Class A office building that is fully leased to Tencent America LLC and located in Palo Alto, California (the “2747 Park Boulevard Property”). The 2747 Park Boulevard Mortgage Loan was originated on September 13, 2018 by Barclays Bank PLC. The 2747 Park Boulevard Mortgage Loan had an original principal balance of $26,000,000, has an outstanding principal balance as of the Cut-off Date of $26,000,000 and accrues interest at an interest rate of 4.2173%per annum. The 2747 Park Boulevard Mortgage Loan had an initial term of 119 months, has a remaining term of 119 months as of the Cut-off Date and requires interest-only payments for the first 60 payment periods followed by payments of principal and interest based on a 30-year amortization schedule. The 2747 Park Boulevard Mortgage Loan matures on September 6, 2028.
On November 6, 2018 and on any business day thereafter, the borrower has the right to prepay the 2747 Park Boulevard Mortgage Loan in whole, but not in part, provided that the borrower pays the greater of a yield maintenance premium or a prepayment premium equal to 1.0% of the unpaid principal balance of the loan as of the repayment date. Following the date that is two years after the closing of the WFCM 2018-C47 securitization, on any date before March 6, 2028, the borrower also has the right to defease the 2747 Park Boulevard Mortgage Loan in whole, but not in part. The 2747 Park Boulevard Mortgage Loan is prepayable without penalty on or after March 6, 2028.
THE INFORMATION IN THIS STRUCTURAL AND COLLATERAL TERM SHEET IS NOT COMPLETE AND MAY BE AMENDED PRIOR TO THE TIME OF SALE. THIS TERM SHEET IS NOT AN OFFER TO SELL THESE SECURITIES AND IT IS NOT A SOLICITATION OF AN OFFER TO BUY THESE SECURITIES IN ANY JURISDICTION WHERE THE OFFER OR SALE IS NOT PERMITTED.
108
| 2747 PARK BOULEVARD |
Sources and Uses
| Sources | Uses | |||||||
| Original mortgage loan amount | $26,000,000 | 52.0% | Loan payoff | $28,977,199 | 58.0% | |||
| Mezzanine loan | 24,000,000 | 48.0 | Reserves | 4,338,440 | 8.7 | |||
| Closing costs | 346,872 | 0.7 | ||||||
| Return of equity | 16,337,489 | 32.7 | ||||||
| Total Sources | $50,000,000 | 100.0% | Total Uses | $50,000,000 | 100.0% |
The Property.The 2747 Park Boulevard Property is a newly-constructed, three-story, Class A office building totaling 36,120 square feet in Palo Alto, California. As of October 1, 2018, the 2747 Park Boulevard Property was 100.0% leased to Tencent America LLC, a subsidiary of Tencent Holdings Limited (rated A+/A1/A+ by Fitch/Moody’s/S&P), on a triple-net basis through August 31, 2028, with one, five-year extension option and no early termination option. As of the origination date, Tencent America LLC has taken possession of the 2747 Park Boulevard Property and commenced the build-out of its space. Outstanding rent concessions and tenant improvement allowances related to the Tencent America LLC lease were deposited into escrows by the borrower on the origination date (See “Escrows” section).
Tencent America LLC is a leading provider of internet services and entertainment. Tencent America LLC offers users a rich digital content catalog including games, video, music, and books and provides infrastructure services to support business growth. The company was founded in 2007 as a subsidiary of Tencent Holdings Limited, which is a leading provider of internet services in China. Tencent Holdings Limited’s two primary business operations are social media platforms and digital content. The company develops and delivers the social media communication platforms ‘Weixin/WeChat’ and ‘QQ’ which are instant communication platforms in China. It also offers gaming, entertainment, and animation platforms that reach over one billion users across the globe. Additionally, Tencent Holdings LLC provides mobile payment solutions. The 2747 Park Boulevard Property is expected to house Tencent America LLC’s only location within Palo Alto and to be the headquarters of Tencent’s operations in the United States. As of the second quarter of 2018, Tencent Holdings Limited reported $11.1 billion in revenues which is up 30% over the second quarter of 2017, driven primarily by payment related services, digital content subscriptions and sales, social advertising, and smart phone games.
The following table presents certain information relating to the tenancy at the 2747 Park Boulevard Property:
Major Tenants
| Tenant Name | Credit Rating (Fitch/Moody's/S&P)(1) | Tenant NRSF(2) | % of NRSF | Annual U/W Base Rent PSF(2)(3) | Annual U/W Base Rent(2)(3) | % of Total Annual U/W Base Rent | Lease Expiration Date |
| Major Tenant | |||||||
| Tencent America LLC | A+/A1/A+ | 36,120 | 100.0% | $112.31 | $4,056,720 | 100.0% | 8/31/2028(4) |
| Total Major Tenant | 36,120 | 100.0% | $112.31 | $4,056,720 | 100.0% | ||
| Vacant Space | 0 | 0.0% | |||||
| Collateral Total | 36,120 | 100.0% | |||||
| (1) | Certain ratings are those of the parent company whether or not the parent company guarantees the lease. |
| (2) | Annual U/W Base Rent PSF and Annual U/W Base Rent include $462,853 of straight-line rent through the maturity date of the 2747 Park Boulevard Mortgage Loan and $104,676 of rent steps through August 12, 2019. |
| (3) | Tencent America LLC has four months of free rent. On the origination date, the borrower deposited $976,143 into a rent concession reserve for the remaining rent concessions. |
| (4) | Tencent has one, five-year lease renewal option. |
THE INFORMATION IN THIS STRUCTURAL AND COLLATERAL TERM SHEET IS NOT COMPLETE AND MAY BE AMENDED PRIOR TO THE TIME OF SALE. THIS TERM SHEET IS NOT AN OFFER TO SELL THESE SECURITIES AND IT IS NOT A SOLICITATION OF AN OFFER TO BUY THESE SECURITIES IN ANY JURISDICTION WHERE THE OFFER OR SALE IS NOT PERMITTED.
109
| 2747 PARK BOULEVARD |
The following table presents certain information relating to the lease rollover schedule at the 2747 Park Boulevard Property:
Lease Expiration Schedule(1)
| Year Ending December 31 | No. of Leases Expiring | Expiring NRSF | % of Total NRSF | Cumulative Expiring NRSF | Cumulative % of Total NRSF | Annual U/W Base Rent(2) | % of Annual U/W Base Rent(2) | Annual U/W Base Rent PSF(2) |
| MTM | 0 | 0 | 0.0% | 0 | 0.0% | $0 | 0.0% | $0.00 |
| 2018 | 0 | 0 | 0.0% | 0 | 0.0% | $0 | 0.0% | $0.00 |
| 2019 | 0 | 0 | 0.0% | 0 | 0.0% | $0 | 0.0% | $0.00 |
| 2020 | 0 | 0 | 0.0% | 0 | 0.0% | $0 | 0.0% | $0.00 |
| 2021 | 0 | 0 | 0.0% | 0 | 0.0% | $0 | 0.0% | $0.00 |
| 2022 | 0 | 0 | 0.0% | 0 | 0.0% | $0 | 0.0% | $0.00 |
| 2023 | 0 | 0 | 0.0% | 0 | 0.0% | $0 | 0.0% | $0.00 |
| 2024 | 0 | 0 | 0.0% | 0 | 0.0% | $0 | 0.0% | $0.00 |
| 2025 | 0 | 0 | 0.0% | 0 | 0.0% | $0 | 0.0% | $0.00 |
| 2026 | 0 | 0 | 0.0% | 0 | 0.0% | $0 | 0.0% | $0.00 |
| 2027 | 0 | 0 | 0.0% | 0 | 0.0% | $0 | 0.0% | $0.00 |
| 2028 | 1 | 36,120 | 100.0% | 36,120 | 100.0% | $4,056,720 | 100.0% | $112.31 |
| Thereafter | 0 | 0 | 0.0% | 36,120 | 100.0% | $0 | 0.0% | $0.00 |
| Vacant | 0 | 0 | 0.0% | 36,120 | 100.0% | $0 | 0.0% | $0.00 |
| Total/Weighted Average | 1 | 36,120 | 100.0% | $4,056,720 | 100.0% | $112.31 |
| (1) | Information obtained from the underwritten rent roll. |
| (2) | Annual U/W Base Rent, % of Annual U/W Base Rent and Annual U/W Base Rent PSF include $462,853 of straight-line rent through the maturity date of the 2747 Park Boulevard Mortgage Loan and $104,676 of rent steps through August 12, 2019. |
The following table presents historical occupancy percentages at the 2747 Park Boulevard Property:
Historical Occupancy
12/31/2014(1) | 12/31/2015(1) | 12/31/2016(1) | 12/31/2017(1) | 10/1/2018(2) |
| NAP | NAP | NAP | NAP | 100.0% |
| (1) | Historical Occupancy prior to 12/31/2017 is not applicable as the 2747 Park Boulevard Property was built in 2018. |
| (2) | Information obtained from the underwritten rent roll. |
Underwritten Net Cash Flow. The following table presents certain information relating to the underwritten net cash flow at the 2747 Park Boulevard Property:
Cash Flow Analysis(1)
| U/W | % of U/W Effective Gross Income | U/W $ per SF | |
| Base Rent(2) | $4,056,720 | 87.1% | $112.31 |
| Grossed Up Vacant Space | 0 | 0.0 | 0.00 |
| Total Reimbursables | 846,739 | 18.2 | 23.44 |
| Less Vacancy & Credit Loss(3) | (245,173) | (5.3) | (6.79) |
| Effective Gross Income | $4,658,286 | 100.0% | $128.97 |
| Total Operating Expenses | $848,118 | 18.2% | $23.48 |
| Net Operating Income | $3,810,169 | 81.8% | $105.49 |
| TI/LC | 97,236 | 2.1 | 2.69 |
| Capital Expenditures | 7,224 | 0.2 | 0.20 |
| Net Cash Flow | $3,705,709 | 79.6% | $102.59 |
| NOI DSCR(4) | 2.49x | ||
| NCF DSCR(4) | 2.42x | ||
| NOI DY(4) | 14.7% | ||
| NCF DY(4) | 14.3% |
| (1) | Historical Cash Flows are not available as the 2747 Park Boulevard Property was built in 2018. |
| (2) | U/W Base Rent includes $462,853 of straight-line rent through the maturity date of the 2747 Park Boulevard Mortgage Loan and $104,676 of rent steps through August 12, 2019. |
| (3) | The underwritten economic vacancy is 5.0%. The 2747 Park Boulevard Property was 100.0% occupied as of October 1, 2018. |
| (4) | Debt service coverage ratios and debt yields are based on the 2747 Park Boulevard Mortgage Loan. |
Appraisal.The appraiser concluded to an “as-is” appraised value of $69,000,000 as of July 13, 2018. The appraiser also concluded a “hypothetical go-dark” appraised value of $65,200,000 equating to a Cut-off Date LTV ratio and LTV Ratio at Maturity of 39.9% and 36.4%, respectively, for the 2747 Park Boulevard Mortgage Loan.
THE INFORMATION IN THIS STRUCTURAL AND COLLATERAL TERM SHEET IS NOT COMPLETE AND MAY BE AMENDED PRIOR TO THE TIME OF SALE. THIS TERM SHEET IS NOT AN OFFER TO SELL THESE SECURITIES AND IT IS NOT A SOLICITATION OF AN OFFER TO BUY THESE SECURITIES IN ANY JURISDICTION WHERE THE OFFER OR SALE IS NOT PERMITTED.
110
| 2747 PARK BOULEVARD |
Environmental Matters. According to a Phase I environmental site assessment (“ESA”) dated July 23, 2018, the subject property is on the SLIC (Spills, Leaks, Investigations, and Clean-up) List with an Open-Verification Monitoring status as of January 9, 2018. The property redevelopment is being conducted under a voluntary clean-up agreement with regulatory oversight of the San Francisco Bay Regional Water Quality Control Board to address soil impacts containing elevated levels of total petroleum hydrocarbons and organic lead from historical site operations and vapor intrusion concerns presented by the chlorinated volatile organic compound groundwater contamination plume within the California-Olive-Emerson study area. Through further investigation, TPH levels have decreased from original concentrations and no longer pose an unacceptable risk to human health. Additionally, the groundwater contamination plume was not caused by the subject property but by three nearby properties. The environmental report recommends that any additional response actions required by the regulatory body be conducted until closure of the SLIC case. The estimated cost of the environmental monitoring is $40,000 per year. At closing, the borrower deposited $400,000 into an environmental monitoring reserve to cover the monitoring costs through the loan term.
Market Overview and Competition.The 2747 Park Boulevard Property is located in the Palo Alto submarket within Silicon Valley. According to the appraisal, Palo Alto serves as a central economic focal point of Silicon Valley and is home to more than 7,000 businesses that collectively employ more than 98,000 people. Many technology firms reside in the Stanford Research Park on Page Mill Road (1.8 miles from the 2747 Park Boulevard property), while Menlo Park is a hub for venture capitalists (3.5 miles from the 2747 Park Boulevard Property). The 2747 Park Boulevard Property’s main transportation corridors are Interstate 280, Highway 101, Highway 84 (the Dumbarton Bridge) and Highway 92 (the Hayward-San Mateo Bridge). U.S. Highway 101 runs northward through San Francisco and southward through San Jose, terminating in the city of Los Angeles. The Santa Clara County Transit System provides bus service county-wide with stops near the 2747 Park Boulevard Property. In addition, the California Avenue Train Station of the Caltrain commuter rail system is located one block northwest of the 2747 Park Boulevard Property and provides service to downtown San Francisco to the north and San Jose to the south. The property also enjoys biking access along one of Palo Alto’s primary bicycle corridors on Park Boulevard. The 2747 Park Boulevard Property is located in the South Peninsula office market and the Palo Alto office submarket. According to the appraisal, overall vacancy in South Peninsula market and the Palo Alto submarket was 7.0% and 6.6%, respectively, as of the second quarter of 2018. As of the second quarter of 2018, new supply under construction in South Peninsula office market stood at approximately 3.1 million square feet. As of the second quarter of 2018, the total office average asking rent for the Palo Alto submarket was $74.28 per square foot, which is above the South Peninsula total office annual average asking rent of $62.40 per square foot. Within the Palo Alto submarket, the annual average asking rent for Class A office properties is $79.20 per square foot.
The following table presents certain information relating to comparable leases to the 2747 Park Boulevard Property:
Comparable Leases(1)
| Property Name/Location | Year Built | Class | Stories | Total GLA (SF) | Tenant Name | Lease Date/Term | Lease Area (SF) | Initial Annual Base Rent PSF | Lease Type |
2747 Park Boulevard (subject property) Palo Alto, CA | 2018 | A | 3 | 36,120(2) | Tencent America LLC | August 2018 / 10 Yrs | 36,120(2) | $99.50(2) | NNN |
Palo Alto Square Palo Alto, CA | 1972 | A | 10 | 320,925 | Covington & Burlington | August 2018 / 10 Yrs | 27,186 | $95.40 | NNN |
Palo Alto Square Palo Alto, CA | 1972 | A | 10 | 320,925 | Orbital Insight | July 2018 / 6.8 Yrs | 40,827 | $95.40 | NNN |
3075 Hansen Way Palo Alto, CA | 2000 | A | 2 | 89,595 | Merrill Lynch | February 2018 / 10.3 Yrs | 89,595 | $87.00 | NNN |
395 Page Mill Road Palo Alto, CA | 2000 | A | 2 | 224,852 | Cloudera | July 2017 / 10.4 Yrs | 224,852 | $87.00 | NNN |
Visa Building Palo Alto, CA | 2017 | A | 3 | 68,164 | Visa | July 2016 / 12 Yrs | 63,746 | $94.80 | NNN |
| (1) | Information obtained from the appraisal. |
| (2) | Information obtained from underwritten rent roll. |
The Borrower.The borrower for the 2747 Park Boulevard Mortgage Loan is 2747 Park PA LLC, a Delaware limited liability company and a special purpose entity with two independent directors (the “2747 Park Boulevard Borrower”). Legal counsel to the 2747 Park Boulevard Borrower delivered a non-consolidation opinion in connection with the origination of the 2747 Park Boulevard Mortgage Loan. Paul Guarantor LLC, a Delaware limited liability company (the “2747 Park Boulevard Guarantor”) is the guarantor of certain nonrecourse carveouts under the 2747 Park Boulevard Mortgage Loan. Paul Guarantor LLC is wholly owned by the Jay Paul Revocable Living Trust, of which Jay Paul is trustee. The 2747 Park Boulevard Guarantor will be required to maintain a minimum net worth, excluding its interest in the 2747 Park Boulevard Property, of $225,000,000 and liquidity of at least $10,000,000 during the term of the 2747 Park Boulevard Mortgage Loan.
The Borrower Sponsor.The borrower sponsor is The Jay Paul Company, a privately held, opportunity-driven real estate firm based in San Francisco, California. Founded in 1975, The Jay Paul Company concentrates on the acquisition, development, and management of commercial properties throughout California. The Jay Paul Company has developed over 11.0 million square feet of institutional quality space. The Jay Paul Company’s portfolio includes Moffett Gateway, Moffett Towers, Moffett Towers II, Moffett Place, and other Class A office properties in the Silicon Valley area.
THE INFORMATION IN THIS STRUCTURAL AND COLLATERAL TERM SHEET IS NOT COMPLETE AND MAY BE AMENDED PRIOR TO THE TIME OF SALE. THIS TERM SHEET IS NOT AN OFFER TO SELL THESE SECURITIES AND IT IS NOT A SOLICITATION OF AN OFFER TO BUY THESE SECURITIES IN ANY JURISDICTION WHERE THE OFFER OR SALE IS NOT PERMITTED.
111
| 2747 PARK BOULEVARD |
Escrows.The 2747 Park Boulevard Mortgage Loan documents provide for upfront reserves in the amount of $72,697 for real estate taxes, $2,889,600 for outstanding tenant improvements relating to the Tencent space, $976,143 for outstanding rent concessions due under the Tencent lease, and $400,000 for environmental monitoring costs.
The 2747 Park Boulevard Mortgage Loan documents require monthly reserve deposits for real estate taxes in an amount equal to one-twelfth of the real estate taxes that the lender estimates will be payable during the next 12 months, initially $12,480, and monthly deposits of $602 for annual capital expenditures. The 2747 Park Boulevard Mortgage Loan documents do not require ongoing monthly escrows for insurance premiums as long as the 2747 Park Boulevard Borrower provides the lender with evidence that the 2747 Park Boulevard Property is insured via an acceptable blanket insurance policy and such policy is in full force and effect.
Lockbox and Cash Management.The 2747 Park Boulevard Mortgage Loan is structured with a hard lockbox and in-place cash management. The 2747 Park Boulevard Borrower was required at origination to deliver tenant direction letters to all tenants at the 2747 Park Boulevard Property directing them to pay all rents directly into a lender-controlled lockbox account. All funds received by the 2747 Park Boulevard Borrower or the manager are required to be deposited in the lockbox account within one business day following receipt. Funds on deposit in the lockbox account are required to be swept on each business day into a lender-controlled cash management account and applied on each payment date to the payment of debt service, the funding of required reserves, budgeted monthly operating expenses, approved extraordinary operating expenses, debt service on the 2747 Park Boulevard Mezzanine Loan (as defined below) and, during a Lease Sweep Period (as defined below), to the payment of an amount equal to the Required Minimum Monthly Lease Sweep Deposit Amount (as defined below) to fund a lease sweep reserve account (the “Lease Sweep Reserve Account”) until the aggregate funds swept in the Lease Sweep Reserve Account during such lease sweep equal the Lease Sweep Reserve Threshold (as defined below) and then to the Debt Service Reserve Account until the aggregate funds transferred to the Lease Sweep Reserve Account and the Debt Service Reserve Account during such Lease Sweep Period equals the Lease Sweep and Debt Service Reserve Cap (as defined below). Provided no Trigger Period (as defined below) is continuing, excess cash in the deposit account will be disbursed to the 2747 Park Boulevard Borrower in accordance with the 2747 Park Boulevard Mortgage Loan documents. If a Trigger Period is continuing (other than a Trigger Period due to a Lease Sweep Period), excess cash in the deposit account will be transferred to an account (the “Cash Collateral Account”) held by the lender as additional collateral for the 2747 Park Boulevard Mortgage Loan.
A “Trigger Period” will commence upon the earliest to occur of the following:
| (i) | an event of default under the 2747 Park Boulevard Mortgage Loan; |
| (ii) | as of the last day of any calendar quarter during the term of the 2747 Park Boulevard Mortgage Loan (a) the credit rating of a Lease Sweep Tenant Party (as defined below) by Fitch, Moody’s or S&P being less than “BBB-”, “Baa3” or “BBB-”, respectively and (b) the debt service coverage ratio falling below 1.20x based on the 2747 Park Boulevard Mortgage Loan or 1.10x based on the 2747 Park Boulevard Total Debt (a “Low Debt Service Period”); |
| (iii) | the commencement of a Lease Sweep Period; or |
| (iv) | an event of default under the 2747 Park Boulevard Mezzanine Loan. |
A “Trigger Period” will end upon:
| ● | with regard to clauses (i) and (iv) above, the cure of such event of default; |
| ● | with regard to clause (ii) above, the earlier to occur of (1) the date that the debt service coverage ratio being at least 1.20x based on the 2747 Park Boulevard Mortgage Loan and 1.10x based on the 2747 Park Boulevard Total Debt for two consecutive calendar quarters and (2) the balance of funds on deposit in the Cash Collateral Account being equal to $1,806,000 ($50.00 per square foot); and |
| ● | with regard to clause (iii) above, the ending of such Lease Sweep Period. |
A “Lease Sweep Period” will commence following the earliest to occur of any of the following (each a “Lease Sweep Event”):
| (i) | with respect to the Tencent lease, Tencent failing to give notice of its intent to renew or extend such lease on or prior to March 6, 2027; |
| (ii) | the date on which, with respect to any Lease Sweep Lease (as defined below), (a) a Lease Sweep Tenant Party cancels or terminates its Lease Sweep Lease with respect to all or a Material Termination Portion (as defined below) of the Lease Sweep Space (as defined below) subject to such Lease Sweep Lease prior to the then current expiration date under such Lease Sweep Lease, or (b) a Lease Sweep Tenant Party delivers to the 2747 Park Boulevard Borrower notice that it is canceling or terminating its Lease Sweep Lease with respect to all or a Material Termination Portion of the Lease Sweep Space subject to such Lease Sweep Lease (the affected space being the “Terminated Space”); provided, however, no Lease Sweep Period will commence pursuant to this clause (ii) if, in connection with such termination or cancellation (or delivery of notice of termination or cancellation), the 2747 Park Boulevard Borrower simultaneously enters into a replacement lease with an entity or a wholly-owned subsidiary of an entity rated “BBB-” or equivalent by at least two of Fitch, Moody’s and S&P (an “Investment Grade Entity”) covering the Terminated Space, provided that such replacement lease is a qualified lease and the occupancy conditions, as specified in the 2747 Park Boulevard Mortgage Loan documents, are satisfied with respect to such replacement lease on or prior to the date of such termination or cancellation (or delivery of notice of termination or cancellation); |
| (iii) | the date on which, with respect to any Lease Sweep Lease, a Lease Sweep Tenant Party ceases operating its business (i.e., “goes dark”) at 20.0% or more of its Lease Sweep Space on a rentable square foot basis (a “Dark Period Event” and the |
THE INFORMATION IN THIS STRUCTURAL AND COLLATERAL TERM SHEET IS NOT COMPLETE AND MAY BE AMENDED PRIOR TO THE TIME OF SALE. THIS TERM SHEET IS NOT AN OFFER TO SELL THESE SECURITIES AND IT IS NOT A SOLICITATION OF AN OFFER TO BUY THESE SECURITIES IN ANY JURISDICTION WHERE THE OFFER OR SALE IS NOT PERMITTED.
112
| 2747 PARK BOULEVARD |
| affected space, the “Dark Space”), provided, however, that if the Lease Sweep Tenant Party either (a) is an Investment Grade Entity or (b) has subleased the Dark Space portion of its premises to an Investment Grade Entity who has accepted delivery thereof (i.e., the lease has commenced) and is paying unabated rent at a contract rate no less than the contract rate required under the Lease Sweep Lease, such Lease Sweep Tenant Party will not be deemed to have “gone dark” for purposes of this clause (iii) and no Lease Sweep Period will commence pursuant to this clause (iii); |
| (iv) | an event of default under a Lease Sweep Lease by the tenant thereunder that continues beyond any applicable notice and cure period; |
| (v) | a Lease Sweep Tenant Party being subject to an insolvency proceeding; or |
| (vi) | the date on which Tencent is no longer an Investment Grade Entity (a “Tencent Downgrade Event”). |
A Lease Sweep Period (other than a Lease Sweep Period triggered by clause (v) above) will not be triggered (or, if already triggered, may be terminated) if the 2747 Park Boulevard Borrower delivers to the lender an acceptable letter of credit in an amount equal to the Lease Sweep and Debt Service Reserve Cap.
A Lease Sweep Period will end upon the earliest of the applicable of the following to occur:
| ● | with regard to clauses (i) and (ii) above, the date on which, with respect to each Lease Sweep Space (1) in the case of clause (i), the Lease Sweep Tenant Parties have exercised a renewal or an extension right under their respective Lease Sweep Leases, provided that the Lease Sweep Lease in question is a qualified lease and the occupancy conditions, as specified in the 2747 Park Boulevard Mortgage Loan documents, are satisfied, (2) in the case of clauses (i) and (ii) above, one or more replacement tenants acceptable to the lender (in its sole but good faith discretion) execute and deliver replacement lease(s) covering the Requisite Lease Sweep Space (as defined below), provided that such replacement lease(s) are qualified leases and the occupancy conditions, as specified in the 2747 Park Boulevard Mortgage Loan documents, are satisfied or (3) a combination of lease renewals or extensions (as described in subclause (1) of this clause (a)) and replacement lease(s) (as described in subclause (2) of this clause (a)) occurs; |
| ● | with regard to clauses (iii) and (vi) above, the date on which either (1) one or more replacement tenants acceptable to the lender (in its sole but good faith discretion) execute and deliver replacement lease(s) covering the Requisite Lease Sweep Space, provided that such replacement tenant(s) and lease(s) are qualified leases and the occupancy conditions, as specified in the 2747 Park Boulevard Mortgage Loan documents, are satisfied or (2) for a Dark Period Event or an Tencent Downgrade Event, Tencent is restored as an Investment Grade Entity or the entirety of the Lease Sweep Space has been sublet to an Investment Grade Entity who has accepted delivery thereof (i.e., the lease has commenced) and is paying unabated rent at a contract rate no less than the contract rate required under the Lease Sweep Lease; |
| ● | with regard to clause (iv) above, the date on which the event of default has been cured and no other event of default under such Lease Sweep Lease occurs for a period of three consecutive months following such cure; |
| ● | with regard to clause (v) above, the Lease Sweep Tenant Party insolvency proceeding has terminated and the applicable Lease Sweep Lease has been affirmed, assumed or assigned in a manner satisfactory to the lender; and |
| ● | with regard to clauses (i), (ii), (iii), (iv) and (vi) above, the date on which the aggregate amount of funds transferred into the Lease Sweep Reserve Account and the Debt Service Reserve Account equals the applicable Lease Sweep And Debt Reserve Cap (as defined below) and if a Lease Sweep Period is continuing due to the occurrence of more than one Lease Sweep Event, the aggregate amount of funds required to be transferred over the course of the Lease Sweep Period will be equal to the amount of the largest Lease Sweep and Debt Service Reserve Cap applicable to all then-continuing Lease Sweep Periods, such that each Lease Sweep Period will be treated as concurrent and not duplicative or independent of another. |
The “Required Minimum Monthly Lease Sweep Deposit Amount” means, on each payment date during the continuance of a Lease Sweep Period, an amount equal to the greater of $45,150 or all excess cash up to the Lease Sweep and Debt Service Reserve Cap.
The “Lease Sweep and Debt Service Reserve Cap” means (a) with respect to a Lease Sweep Trigger continuing solely pursuant to clause (i) and/or (iv) above, $1,697,640 ($47.00 per square foot), (b) with respect to a Lease Sweep Period continuing solely pursuant to clause (ii) above, $47.00 per square foot of the Terminated Space, (c) with respect to a Lease Sweep Period continuing pursuant to clause (iii) above, whether or not a Lease Sweep Period pursuant to clauses (i), (ii) and/or (iv) above is concurrently continuing, $50.00 per square foot of Dark Space or (d) with respect to clause (vi) above, whether or not a Lease Sweep Period pursuant to clauses (i), (ii), (iii) and/or (iv) above is concurrently continuing, $1,806,000 ($50.00 per square foot).
The “Lease Sweep Reserve Threshold” means (a) with respect to a Lease Sweep Trigger continuing solely pursuant to clauses (i), (iv) and/or (vi) above, $1,408,680 ($39.00 per square foot) or (b) with respect to a Lease Sweep Trigger continuing solely pursuant to clauses (ii) and/or (iii) above, $39.00 per square foot of the Dark Space or Terminated Space.
The “Lease Sweep Space” means the space demised under a Lease Sweep Lease.
A “Lease Sweep Lease” shall mean the Tencent lease or any replacement lease or leases which cover at least 75.0% of the rentable square feet demised under the Tencent lease as of September 13, 2018 (the “Requisite Lease Sweep Space”).
A “Lease Sweep Tenant Party” is a tenant under a Lease Sweep Lease or its direct or indirect parent company (if any).
THE INFORMATION IN THIS STRUCTURAL AND COLLATERAL TERM SHEET IS NOT COMPLETE AND MAY BE AMENDED PRIOR TO THE TIME OF SALE. THIS TERM SHEET IS NOT AN OFFER TO SELL THESE SECURITIES AND IT IS NOT A SOLICITATION OF AN OFFER TO BUY THESE SECURITIES IN ANY JURISDICTION WHERE THE OFFER OR SALE IS NOT PERMITTED.
113
| 2747 PARK BOULEVARD |
A “Material Termination Portion” is, with respect to any space under a Lease Sweep Lease, if the tenant under a Lease Sweep Lease cancels or terminates its Lease Sweep Lease with respect to at least 11,000 square feet of space (or, if a full floor of space is less than 11,000 square feet, a full floor of space) but less than the entirety of the space under such Lease Sweep Lease, the portion of space under the Lease Sweep Lease affected by such cancellation or termination.
Property Management. The 2747 Park Boulevard Property is managed by an affiliate of the 2747 Park Boulevard Borrower.
Assumption.The 2747 Park Boulevard Borrower has, at any time, the right to convey all of the property to a new borrower and have the transferee borrower assume all the borrower’s obligations under the loan documents provided that certain conditions are satisfied, including: (i) no event of default under the 2747 Park Boulevard Mortgage Loan documents or 2747 Park Boulevard Mezzanine Loan documents has occurred and is continuing, (ii) the 2747 Park Boulevard Borrower has provided the lender with 60 days’ prior written notice, (iii) the proposed transferee qualifies as a qualified transferee under the 2747 Park Boulevard Mortgage Loan documents, and (iv) the lender has received rating agency confirmation that such assumption will not result in a downgrade of the respective ratings assigned to the Series 2018-C47 certificates and similar confirmations from each rating agency rating any securities backed by any of the 2747 Park Boulevard Companion Loans.
Partial Release. Not permitted.
Real Estate Substitution.Not permitted.
Subordinate and Mezzanine Indebtedness.Barclays Bank PLC funded a $24,000,000 mezzanine loan (the “2747 Park Boulevard Mezzanine Loan”) to 2747 Park Mezz LLC (the “2747 Park Boulevard Mezzanine Borrower”), a Delaware limited liability company owning 100.0% of the borrower under the 2747 Park Boulevard Mortgage Loan. The mezzanine loan was subsequently sold to UAV (Barclays) on September 27, 2018. The 2747 Park Boulevard Mezzanine Loan accrues interest at a rate of 7.000% perannumand requires interest-only payments through the maturity date of September 6, 2028. The rights of the lender of the 2747 Park Boulevard Mezzanine Loan are further described under “Description of the Mortgage Pool—Additional Indebtedness—Mezzanine Indebtedness” in the Preliminary Prospectus.
Ground Lease.None.
Terrorism Insurance. The 2747 Park Boulevard Mortgage Loan documents require that the “all risk” insurance policy required to be maintained by the 2747 Park Boulevard Borrower provides coverage for terrorism in an amount equal to the full replacement cost and rental loss and/or business interruption insurance for 18 months plus 12 months of extended indemnity that covers perils of terrorism and acts of terrorism. Provided that the Terrorism Risk Insurance Program Reauthorization Act is no longer in effect and such policies contain an exclusion for acts of terrorism, the 2747 Park Boulevard Borrower will obtain, to the extent available, a stand-alone policy that provides the same coverage as the policies would have if such exclusion did not exist.
THE INFORMATION IN THIS STRUCTURAL AND COLLATERAL TERM SHEET IS NOT COMPLETE AND MAY BE AMENDED PRIOR TO THE TIME OF SALE. THIS TERM SHEET IS NOT AN OFFER TO SELL THESE SECURITIES AND IT IS NOT A SOLICITATION OF AN OFFER TO BUY THESE SECURITIES IN ANY JURISDICTION WHERE THE OFFER OR SALE IS NOT PERMITTED.
114
(THIS PAGE INTENTIONALLY LEFT BLANK)
THE INFORMATION IN THIS STRUCTURAL AND COLLATERAL TERM SHEET IS NOT COMPLETE AND MAY BE AMENDED PRIOR TO THE TIME OF SALE. THIS TERM SHEET IS NOT AN OFFER TO SELL THESE SECURITIES AND IT IS NOT A SOLICITATION OF AN OFFER TO BUY THESE SECURITIES IN ANY JURISDICTION WHERE THE OFFER OR SALE IS NOT PERMITTED.
115
| MERIDIAN AT NORTH |
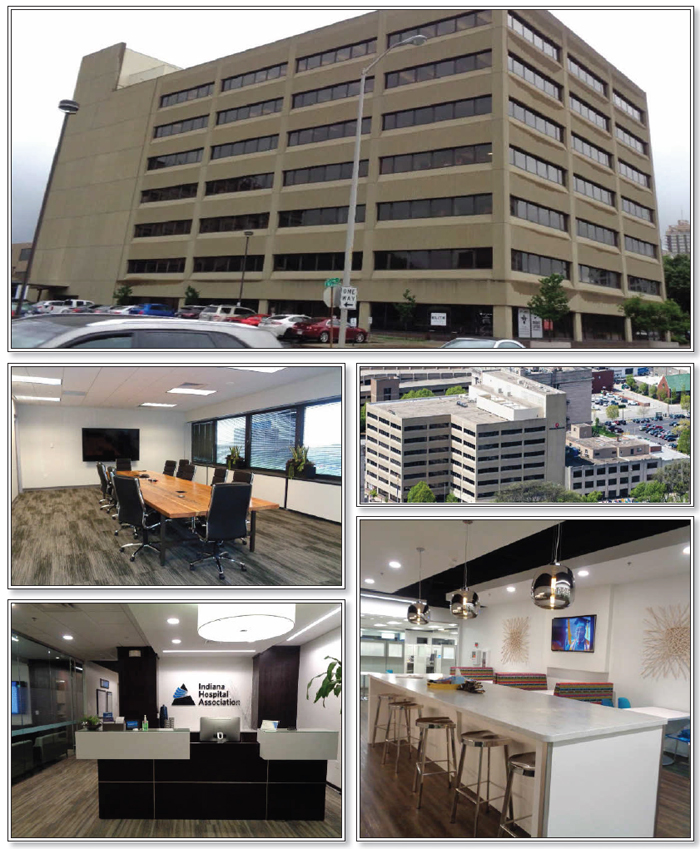
THE INFORMATION IN THIS STRUCTURAL AND COLLATERAL TERM SHEET IS NOT COMPLETE AND MAY BE AMENDED PRIOR TO THE TIME OF SALE. THIS TERM SHEET IS NOT AN OFFER TO SELL THESE SECURITIES AND IT IS NOT A SOLICITATION OF AN OFFER TO BUY THESE SECURITIES IN ANY JURISDICTION WHERE THE OFFER OR SALE IS NOT PERMITTED.
116
| MERIDIAN AT NORTH |

THE INFORMATION IN THIS STRUCTURAL AND COLLATERAL TERM SHEET IS NOT COMPLETE AND MAY BE AMENDED PRIOR TO THE TIME OF SALE. THIS TERM SHEET IS NOT AN OFFER TO SELL THESE SECURITIES AND IT IS NOT A SOLICITATION OF AN OFFER TO BUY THESE SECURITIES IN ANY JURISDICTION WHERE THE OFFER OR SALE IS NOT PERMITTED.
117
| No. 9 – Meridian at North | ||||||
| Loan Information | Property Information | |||||
| Mortgage Loan Seller: | Ladder Capital Finance LLC | Single Asset/Portfolio: | Single Asset | |||
| Credit Assessment (DBRS/Fitch/Moody’s): | NR/NR/NR | Property Type: | Office | |||
| Original Principal Balance: | $25,900,000 | Specific Property Type: | CBD | |||
| Cut-off Date Principal Balance: | $25,900,000 | Location: | Indianapolis, IN | |||
| % of Initial Pool Balance: | 2.7% | Size: | 334,506 SF | |||
| Loan Purpose: | Acquisition | Cut-off Date Balance Per SF: | $77.43 | |||
| Borrower Name: | M500, LLC | Year Built/Renovated: | 1975/2014 | |||
| Borrower Sponsor: | Yoav Merary | Title Vesting: | Fee | |||
| Mortgage Rate: | 5.0760% | Property Manager: | Self-managed | |||
| Note Date: | August 14, 2018 | 4thMost Recent Occupancy (As of)(2): | 30.0% (12/31/2015) | |||
| Anticipated Repayment Date: | NAP | 3rdMost Recent Occupancy (As of)(2): | 73.0% (12/31/2016) | |||
| Maturity Date: | September 6, 2028 | 2ndMost Recent Occupancy (As of)(2): | 86.7% (12/31/2017) | |||
| IO Period: | 36 months | Most Recent Occupancy (As of)(2): | 100.0% (5/31/2018) | |||
| Loan Term (Original): | 120 months | Current Occupancy (As of)(2): | 100.0% (6/1/2018) | |||
| Seasoning: | 1 month | |||||
| Amortization Term (Original): | 360 months | Underwriting and Financial Information: | ||||
| Loan Amortization Type: | Interest-only, Amortizing Balloon | 4thMost Recent NOI (As of): | NAV | |||
| Interest Accrual Method: | Actual/360 | 3rdMost Recent NOI (As of): | $1,929,495 (12/31/2016) | |||
| Call Protection: | L(25),GRTR 1% or YM(92),O(3) | 2ndMost Recent NOI (As of)(3): | $1,833,439 (12/31/2017) | |||
| Lockbox Type: | Hard/Springing Cash Management | Most Recent NOI (As of)(3): | $2,270,265 (TTM 5/31/2018) | |||
| Additional Debt: | None | |||||
| Additional Debt Type: | NAP | U/W Revenues: | $5,301,791 | |||
| U/W Expenses: | $2,369,839 | |||||
| U/W NOI(3): | $2,931,952 | |||||
| U/W NCF: | $2,580,147 | |||||
| Escrows and Reserves(1): | U/W NOI DSCR: | 1.74x | ||||
| U/W NCF DSCR: | 1.53x | |||||
| Type: | Initial | Monthly | Cap (If Any) | U/W NOI Debt Yield: | 11.3% | |
| Taxes | $124,018 | $20,670 | NAP | U/W NCF Debt Yield: | 10.0% | |
| Insurance | $24,540 | $6,135 | NAP | Appraised Value: | $42,400,000 | |
| Replacement Reserve | $0 | $6,969 | NAP | Appraisal Valuation Date: | January 31, 2018 | |
| Ongoing TI/LC Reserve | $0 | $22,305 | NAP | Cut-off Date LTV Ratio: | 61.1% | |
| Immediate Repair Reserve | $19,375 | $0 | NAP | LTV Ratio at Maturity or ARD: | 54.2% | |
| HVAC Maintenance | $50,000 | $0 | NAP | |||
| (1) | See “Escrows” section. |
| (2) | See “Historical Occupancy” section. |
| (3) | The increase in Net Operating Income from 2017 to TTM 5/31/2018 and can be attributed to 146,067 square feet of new leasing (43.7% of net rentable area) throughout 2016 and the 89,100 square feet (26.6% of net rentable area) lease signed by Centene with a commencement date in July 2017. |
The Mortgage Loan. The mortgage loan (the “Meridian at North Mortgage Loan”) is evidenced by a single promissory note that is secured by a first mortgage encumbering the fee interest in an office building located in Indianapolis, Indiana (the “Meridian at North Property”). The Meridian at North Mortgage Loan was originated on August 14, 2018 by Ladder Capital Finance LLC. The Meridian at North Mortgage Loan had an original principal balance of $25,900,000, has an outstanding principal balance as of the Cut-off Date of $25,900,000 and accrues interest at a rate of 5.0760%per annum. The Meridian at North Mortgage Loan had an initial term of 120 months, has a remaining term of 119 months as of the Cut-off Date and requires interest-only payments for the first 36 payments following origination and, thereafter, requires payments of principal and interest based on a 30-year amortization schedule. The Meridian at North Mortgage Loan matures on September 6, 2028.
Following the lockout period, the borrower has the right to prepay the Meridian at North Mortgage Loan in whole, or in part, together with a yield maintenance premium at any time before July 6, 2028. In addition, the Meridian at North Mortgage Loan is prepayable without penalty on or after July 6, 2028.
THE INFORMATION IN THIS STRUCTURAL AND COLLATERAL TERM SHEET IS NOT COMPLETE AND MAY BE AMENDED PRIOR TO THE TIME OF SALE. THIS TERM SHEET IS NOT AN OFFER TO SELL THESE SECURITIES AND IT IS NOT A SOLICITATION OF AN OFFER TO BUY THESE SECURITIES IN ANY JURISDICTION WHERE THE OFFER OR SALE IS NOT PERMITTED.
118
| MERIDIAN AT NORTH |
Sources and Uses
| Sources | Uses | |||||||
| Original loan amount | $25,900,000 | 68.9% | Purchase price | $37,000,000 | 98.5% | |||
| Borrower sponsor’s new cash equity | 11,672,650 | 31.1 | Upfront reserves | 167,933 | 0.4 | |||
| Closing costs | 404,717 | 1.1 | ||||||
| Total Sources | $37,572,650 | 100.0% | Total Uses | $37,572,650 | 100.0% |
The Property.The Meridian at North Property is a Class A mid-rise office property totaling 334,506 square feet and located within the Indianapolis, Indiana central business district. Built in 1975, the Meridian at North Property is situated on two non-contiguous parcels on a 3.9-acre site consisting of two buildings. The Meridian at North Property includes a 1,000 space covered parking garage resulting in a parking ratio of 3.0 spaces per 1,000 square feet of rentable area.
The largest tenants at the Meridian at North Property are Hall Render (31.0% of underwritten net rentable area), Centene Corporation (“Centene”) (26.6% of underwritten net rentable area) and Indiana Department of Child Services (24.5% of underwritten net rentable area). As of June 1, 2018, the Meridian at North Property was 100.0% leased to eight tenants. The seller of Meridian at North Property, purchased the subject property in June 2014 out of foreclosure. See “Description of the Mortgage Pool—Loan Purpose; Default History, Bankruptcy Issues and Other Proceedings” in the Preliminary Prospectus.
The following table presents certain information relating to the tenancy at the Meridian at North Property:
Major Tenants
| Tenant Name | Credit Rating (Fitch/ Moody’s/ S&P)(1) | Tenant NRSF | % of NRSF | Annual U/W Base Rent PSF(2) | Annual U/W Base Rent(2) | % of Total Annual U/W Base Rent | Lease Expiration Date |
| Major Tenants | |||||||
| Hall Render(3) | NR/NR/NR | 103,860 | 31.0% | $16.62 | $1,726,337 | 32.5% | 3/31/2031 |
| Centene | NR/Ba1/BB+ | 89,100 | 26.6% | $17.50 | $1,559,250 | 29.3% | 1/31/2025 |
| Indiana Department of Child Services(4) | NR/NR/NR | 81,832 | 24.5% | $15.56 | $1,273,306 | 24.0% | 5/31/2025 |
| Blue & Company | NR/NR/NR | 23,670 | 7.1% | $16.25 | $384,638 | 7.2% | 3/31/2031 |
| Indiana Hospital | NR/NR/NR | 10,950 | 3.3% | $16.25 | $177,938 | 3.3% | 3/31/2031 |
| Total Major Tenants | 309,412 | 92.5% | $16.55 | $5,121,468 | 96.3% | ||
| Non-Major Tenants | 25,094 | 7.5% | $7.74 | $194,161 | 3.7% | ||
| Occupied Collateral Total | 334,506 | 100.0% | $15.89 | $5,315,629 | 100.0% | ||
| Collateral Total | 334,506 | 100.0% | |||||
| (1) | Certain ratings are those of the parent company whether or not the parent guarantees the lease. |
| (2) | Annual U/W Base Rent PSF and Annual U/W Base Rent include contractual rent steps through March 2019 totaling $2,760. |
| (3) | Hall Render subleases 13,576 square feet to Pondurance on the fifth floor for $11.00 per square foot and is dark in 21,044 square feet. The dark space was underwritten as vacant although Hall Render continues to pay full unabated rent on the entire floor. |
| (4) | Indiana Department of Child Services can terminate its lease (a) at any time with 12 months’ notice and payment of a termination fee; or (b) if funds are not appropriated or are otherwise unavailable to support the lease. |
THE INFORMATION IN THIS STRUCTURAL AND COLLATERAL TERM SHEET IS NOT COMPLETE AND MAY BE AMENDED PRIOR TO THE TIME OF SALE. THIS TERM SHEET IS NOT AN OFFER TO SELL THESE SECURITIES AND IT IS NOT A SOLICITATION OF AN OFFER TO BUY THESE SECURITIES IN ANY JURISDICTION WHERE THE OFFER OR SALE IS NOT PERMITTED.
119
| MERIDIAN AT NORTH |
The following table presents certain information relating to the lease rollover schedule at the Meridian at North Property:
Lease Expiration Schedule(1)(2)
| Year Ending December 31, | No. of Leases Expiring | Expiring NRSF | % of Total NRSF | Cumulative Expiring NRSF | Cumulative % of Total NRSF | Annual U/W Base Rent | % of Total Annual U/W Base Rent | Annual U/W Base Rent PSF(3) |
| MTM | 0 | 0 | 0.0% | 0 | 0.0% | $0 | 0.0% | $0.00 |
| 2018 | 0 | 0 | 0.0% | 0 | 0.0% | $0 | 0.0% | $0.00 |
| 2019 | 2 | 17,210 | 5.1% | 17,210 | 5.1% | $42,000 | 0.8% | $2.44 |
| 2020 | 1 | 7,884 | 2.4% | 25,094 | 7.5% | $152,161 | 2.9% | $19.30 |
| 2021 | 0 | 0 | 0.0% | 25,094 | 7.5% | $0 | 0.0% | $0.00 |
| 2022 | 0 | 0 | 0.0% | 25,094 | 7.5% | $0 | 0.0% | $0.00 |
| 2023 | 0 | 0 | 0.0% | 25,094 | 7.5% | $0 | 0.0% | $0.00 |
| 2024 | 0 | 0 | 0.0% | 25,094 | 7.5% | $0 | 0.0% | $0.00 |
| 2025 | 3 | 170,932 | 51.1% | 196,026 | 58.6% | $2,832,556 | 53.3% | $16.57 |
| 2026 | 0 | 0 | 0.0% | 196,026 | 58.6% | $0 | 0.0% | $0.00 |
| 2027 | 0 | 0 | 0.0% | 196,026 | 58.6% | $0 | 0.0% | $0.00 |
| 2028 | 0 | 0 | 0.0% | 196,026 | 58.6% | $0 | 0.0% | $0.00 |
| Thereafter | 5 | 138,480 | 41.4% | 334,506 | 100.0% | $2,288,912 | 43.1% | $16.53 |
| Vacant | 0 | 0 | 0.0% | 334,506 | 100.0% | $0 | 0.0% | $0.00 |
| Total/Weighted Average | 11 | 334,506 | 100.0% | $5,315,629 | 100.0% | $15.89 |
| (1) | Information obtained from the underwritten rent roll. |
| (2) | Certain tenants may have lease termination options that are exercisable prior to the originally stated expiration date of the subject lease and that are not considered in the Lease Expiration Schedule. |
| (3) | Weighted Average Annual U/W Base Rent PSF excludes vacant space. |
The following table presents historical occupancy percentages at the Meridian at North Property:
Historical Occupancy
12/31/2015(1)(2) | 12/31/2016(1)(2) | 12/31/2017(1)(2) | 5/31/2018(1)(2) | 6/1/2018(3)(4) |
| 30.0% | 73.0% | 86.7% | 100.0% | 100.0% |
| (1) | Information obtained from the borrower. |
| (2) | The Meridian at North Property was occupied by a single tenant prior to 2014. When the sole tenant did not renew its lease, the Meridian at North Property was vacant and re-leased to 100.0% over time. Leasing progressed each year as follows: a) 2014-17,507 square feet (5.2% of net rentable area), b) 2015- 81,832 square feet (24.5% of net rentable area), c) 2016- 146,067 square (43.7% of net rentable area) and d) 2017- 89,100 square feet (26.6% of net rentable area). |
| (3) | Information obtained from the underwritten rent roll. |
| (4) | The Meridian at North Property is 100.0% leased to eight tenants. Hall Render subleases 13,576 square feet and is dark in 21,044 square feet but continues to pay full unabated rent for both spaces. |
THE INFORMATION IN THIS STRUCTURAL AND COLLATERAL TERM SHEET IS NOT COMPLETE AND MAY BE AMENDED PRIOR TO THE TIME OF SALE. THIS TERM SHEET IS NOT AN OFFER TO SELL THESE SECURITIES AND IT IS NOT A SOLICITATION OF AN OFFER TO BUY THESE SECURITIES IN ANY JURISDICTION WHERE THE OFFER OR SALE IS NOT PERMITTED.
120
| MERIDIAN AT NORTH |
Operating History and Underwritten Net Cash Flow.The following table presents certain information relating to the historical operating performance and underwritten net cash flow at the Meridian at North Property:
Cash Flow Analysis
| 2016 | 2017 | TTM 5/31/2018 | U/W |
% of U/W | U/W $ per SF | ||||||||
| Base Rent | $2,844,574 | $3,743,708 | $4,272,830 | $5,315,629 | 100.3% | $15.89 | |||||||
| Grossed Up Vacant Space | 0 | 0 | 0 | 0 | 0.0 | 0.00 | |||||||
| Total Reimbursement | 65,040 | 63,939 | 77,301 | 70,293 | 1.3 | 0.21 | |||||||
| Other Income(1) | $1,359,377 | 345,696 | 280,141 | 280,141 | 5.3 | 0.84 | |||||||
| Less Vacancy & Credit Loss | 0 | 0 | 0 | (364,272)(3) | (6.9) | (1.09) | |||||||
| Effective Gross Income | $4,268,991 | $4,153,343 | $4,630,271 | $5,301,791 | 100.0% | $15.85 | |||||||
| Total Operating Expenses | $2,339,496 | $2,319,903 | $2,360,006 | $2,369,839 | 44.7% | $7.08 | |||||||
| Net Operating Income(2) | $1,929,495 | $1,833,439 | $2,270,265 | $2,931,952 | 55.3% | $8.77 | |||||||
| Replacement Reserves | 0 | 0 | 0 | 83,627 | 1.6 | 0.25 | |||||||
| Tenant Improvements | 0 | 0 | 0 | 184,267 | 3.5 | 0.55 | |||||||
| Leasing Commissions | 0 | 0 | 0 | 83,912 | 1.6 | 0.25 | |||||||
| Net Cash Flow | $1,929,495 | $1,833,439 | $2,270,265 | $2,580,147 | 48.6% | $7.70 | |||||||
| NOI DSCR | 1.15x | 1.09x | 1.35x | 1.74x | |||||||||
| NCF DSCR | 1.15x | 1.09x | 1.35x | 1.53x | |||||||||
| NOI DY | 7.4% | 7.1% | 8.8% | 11.3% | |||||||||
| NCF DY | 7.4% | 7.1% | 8.8% | 10.0% |
| (1) | Other income consists of parking garage income and miscellaneous income. |
| (2) | The increase in Net Operating Income from 2017 to TTM 5/31/2018 and TTM 5/31/2018 to UW can be attributed to 146,067 square feet of new leasing (43.7% of net rentable area) throughout 2016 and the 89,100 square feet (26.6% of net rentable area) lease signed by Centene with a commencement date in July 2017. |
| (3) | The underwritten economic vacancy is 6.3%. The Meridian at North Property was 100.0% leased as of June 1, 2018. |
Appraisal.As of the appraisal valuation date of January 31, 2018, the Meridian at North Property had an “as-is” appraised value of $42,400,000, which equates to an “as-is” Cut-off Date LTV Ratio of 61.1%.
Environmental Matters. According to a Phase I environmental site assessment dated February 12, 2018, there was no evidence of any recognized environmental conditions at the Meridian at North Property.
Market Overview and Competition. The Meridian at North Property is located in the north side of the Indianapolis central business district within Marion County, located 0.9 miles from Interstate 65 and Interstate 70 that connects I-465 which forms a loop around Indianapolis. The Meridian at North Property is located approximately 10 miles from the Indianapolis International Airport, which recently underwent an estimated $974 million expansion, which included the construction of a new terminal and creation of new concourses and a parking garage. The Meridian at North Property is also located 0.8 miles from the Indiana Convention Center, which offers 566,600 square feet of exhibit hall space, 113,302 square feet of meeting room space and 62,173 square feet of ballroom space and located 0.9 miles from Lucas Oil Stadium and 0.7 miles from the Bankers Life Fieldhouse, which are homes to the Indianapolis Colts and Indiana Pacers, respectively. Finally, the Meridian at North Property is also located 0.8 miles away from the Indiana University / Purdue University at Indianapolis Campus, a public research university with an undergraduate enrollment of 21,610. According to the appraisal, top employers in Marion County are Indiana University Health, St. Vincent’s Hospitals and Indiana University / Purdue University at Indianapolis which employ approximately 21,712, 15,285 and 14,558 people, respectively.
According to the appraisal, the Meridian at North Property is located in the Class A Central Office submarket of Indianapolis. As of the first quarter of 2018, the Central Office submarket reported an 85.5% occupancy rate and an effective rent of $16.09 per square foot which is approximately 1.3% above the Meridian at North Property rent of $15.89 per square foot. The estimated 2017 population within a one-, three-, and five-mile radius of the Meridian at North Property is 16,993, 104,709, and 256,067, respectively, while the estimated 2017 medium average household income within the same radii is $40,366, $29,907, and $33,201, respectively.
THE INFORMATION IN THIS STRUCTURAL AND COLLATERAL TERM SHEET IS NOT COMPLETE AND MAY BE AMENDED PRIOR TO THE TIME OF SALE. THIS TERM SHEET IS NOT AN OFFER TO SELL THESE SECURITIES AND IT IS NOT A SOLICITATION OF AN OFFER TO BUY THESE SECURITIES IN ANY JURISDICTION WHERE THE OFFER OR SALE IS NOT PERMITTED.
121
| MERIDIAN AT NORTH |
The following table presents certain information relating to comparable office leases for the Meridian at North Property:
Comparable Leases(1)
| Property Name/Location | Year Built/Renovated | Total Property Occupancy | Total GLA (SF) | Distance from Subject | Tenant Name | Lease Date/ Term | Lease Area (SF) | Annual Base Rent PSF | Lease Type |
Marrott Center 342 Massachusetts Ave, Indianapolis, IN | 1945 | 88.0% | 42,056 | 0.3 miles | Home Advisors | Aug. 2017 / 6.6 Years | 17,622 | $22.68 | Full Service |
McQuat Place 14 E. Washington St. Indianapolis, IN | 1912 | 100.0% | 25,200 | 0.6 miles | Char blue | May 2017 / 6.4 Years | 4,032 | $16.28 | Full Service |
Walker Plaza 719 Indiana Ave. Indianapolis, IN | 1989 | 100.0% | 141,000 | 0.6 miles | The Trustees of IU | Apr. 2017 / 5.0 Years | 10,132 | $16.66 | Gross |
Capital Center 251 N. Illinois Indianapolis, IN | 1986 | 91.2% | 650,000 | 0.3 miles | HCC Medical | Feb. 2016 / 4.0 Years | 22,742 | $20.50 | Full Service |
| (1) | Information obtained from the appraisal. |
The Borrower.The borrower is M500, LLC a Delaware limited liability company and single purpose entity with one independent director. Yoav Merary is the non-recourse carveout guarantor on the Meridian at North Mortgage Loan.
The Borrower Sponsor.The borrower sponsor is Yoav Merary, the founder and managing member of Naya USA LLC. Mr. Merary has over 25 years of experience in the acquisition and management of commercial and residential real estate assets nationwide. As of September 2018, Mr. Merary owns, manages and leases a portfolio that is comprised of 19 commercial properties and five residential developments totaling over 1.5 million square feet with assets primarily located in Indiana and Florida.
Escrows.The loan documents provide for upfront escrows at origination in the amounts of $124,018 for taxes, $24,540 for insurance, $19,375 for an immediate repairs reserve held by the lender, and $50,000 for an HVAC maintenance reserve held with the title company.
The loan documents provide for ongoing monthly escrows of $20,670 for taxes, $6,135 for insurance premiums, $6,969 for replacement reserves, and $22,305 for tenant improvements and leasing commissions.
Lockbox and Cash Management.
The Meridian at North Mortgage Loan is structured with a lender-controlled hard lockbox, which is already in place. The Meridian at North Mortgage Loan documents require the borrower to direct all tenants to pay rent directly into such lockbox account, and also require that all rents received by the borrower or the property manager be deposited into the lockbox account within one day of receipt. Prior to the occurrence of a Cash Sweep Period (as defined below), all funds in the lockbox account are distributed to the borrower. During a Cash Sweep Period, all funds in the lockbox account are swept to a lender-controlled cash management account and applied as provided in the loan documents. Also during the continuation of a Cash Sweep Period, all excess cash flow shall be retained and held by the lender as additional security for the Meridian at North Mortgage Loan.
A “Cash Sweep Period” will commence upon the earliest of (i) an event of default under the loan agreement, (ii) an event of default under the management agreement; (iii) the net cash flow debt service ratio falling below 1.25x; (iv) the date on which any tenant occupying more than 20% of the net rentable area or constituting more than 20% of the total annual rents (a “Significant Tenant”) vacates, surrenders or ceases to conduct its normal business operations at 50% or more of its demised premises or notifies the lender of its intent to do same; provided that the DSCR is less than 1.25x; (v) the date on which a Significant Tenant (or parent company thereof) becomes insolvent or a debtor in a bankruptcy action, provided that the DSCR is less than 1.25x; (vi) any Significant Tenant (or its parent) having an investment grade rating and having its senior unsecured debt rating fall below “B+” by S&P or the equivalent of such rating by any other Rating Agency, provided that the DSCR is less than 1.25x; (vii) the earlier occurrence of (1) the date by which such Significant Tenant is required to renew its lease pursuant to the terms of such lease and (2) nine months prior to the expiration of a Significant Tenant’s lease, unless the renewal of such Significant Tenant’s lease or the re-tenanting of applicable space and payment of full, unabated rent for two consecutive quarters has occurred, and provided that the DSCR is less than 1.25x, (viii) any Significant Tenant subleasing 50% or more of its leased premises, provided that the DSCR is less than 1.25x. The event described in clause (iii) of the preceding sentence is referred to as a “Cash Sweep DSCR Trigger Event”, and the events described in clauses (iv) through (viii) of the preceding sentence are referred to as “Cash Sweep Significant Tenant Trigger Events”.
The borrower may avoid a Cash Sweep Period: with regard to clause (iv), (v) or (vii) above if the borrower, within five business days of the event, and on each monthly payment date thereafter, deposits with the lender (1) if such Cash Sweep Significant Tenant Trigger Event occurs during the interest only period, the sum of $103,739 and (2) if such Cash Sweep Significant Tenant Trigger Event occurs at any time after the expiration of the interest only period, the sum of $74,299; with respect to clause (vi) or (viii) above if within five business days of the occurrence of the Cash Sweep Significant Tenant Trigger Event, and on each monthly payment date thereafter, the borrower deposits with the lender an amount equal to the monthly rent due under the lease for the applicable Significant Tenant; and with respect to clause (iii) above, if the borrower, within five business days of the Cash Sweep DSCR Trigger Event, and on each monthly payment date thereafter, deposits with the lender (1) if such Cash Sweep DSCR Trigger Event occurs during the interest only period, the sum of $71,294 and (2) if such Cash Sweep DSCR Trigger Event occurs at any time after the expiration of the interest only period, the sum of $41,854.
THE INFORMATION IN THIS STRUCTURAL AND COLLATERAL TERM SHEET IS NOT COMPLETE AND MAY BE AMENDED PRIOR TO THE TIME OF SALE. THIS TERM SHEET IS NOT AN OFFER TO SELL THESE SECURITIES AND IT IS NOT A SOLICITATION OF AN OFFER TO BUY THESE SECURITIES IN ANY JURISDICTION WHERE THE OFFER OR SALE IS NOT PERMITTED.
122
| MERIDIAN AT NORTH |
A Cash Sweep Period will end upon: with regard to clause (i), a cure of the applicable event of default; with respect to clause (ii), the replacement of the management agreement or a cure of the applicable event of default; with respect to clause (iii) the property achieving a net cash flow debt service coverage ratio of 1.30x or greater for two consecutive quarters; with respect to clause (iv), such Significant Tenant a) being in occupancy of at least 50% of its space and has revoked any notice of its intent to vacate or abandon the premises (if applicable) and b) paying the full, unabated rent under its lease (unless the lender is holding funds to cover a free rent or rent abated period for such tenant in the rent abatement account), or c) at least 50% or more of the applicable space having been retenanted; with respect to clause (v), (A) such Significant Tenant (or its parent, as applicable) having become solvent to the lender’s reasonable satisfaction for two consecutive quarters or having emerged from bankruptcy pursuant to a final non-appealable order of a court of competent jurisdiction and having commenced paying full, unabated post-petition rent under its lease, or (B) such Significant Tenant’s lease having been assumed by an assignee pursuant to a final non-appealable order of a court of competent jurisdiction, which assignee is occupying at least 50% of the applicable space and is paying the full unabated post-petition rent; with respect to clause (vi), the Significant Tenant (or its parent) causing such trigger regaining a minimum senior unsecured credit rating from S&P of at least B+ (or an equivalent rating from any other applicable rating agency) and maintaining the aforementioned rating for two consecutive quarters; with respect to clause (vii), the renewal of such Significant Tenant’s lease or the re-tenanting of at least 50% of the applicable space and payment of full and unabated rent for two consecutive quarters; and with respect to clauses (iv) through (vii) the amortizing net cash flow debt service coverage ratio being 1.30x for two consecutive quarters, each as further outlined in the loan documents.
Property Management. The Meridian at North Property is managed by an affiliate of the borrower.
Assumption.The borrower has the unlimited right to transfer the Meridian at North Property; provided that certain conditions are satisfied, including (i) no event of default has occurred and is continuing; (ii) the lender reasonably determines that the proposed transferee and guarantor satisfy the lender’s credit review and underwriting standards, taking into consideration the transferee’s experience, financial strength and general business standing; and (iii) if requested by lender, receipt of rating agency confirmation that the sale and assumption will not result in a downgrade, withdrawal or qualification of the respective ratings assigned to the Series 2018-C47 certificates.
Partial Release. Not permitted.
Real Estate Substitution.Not permitted.
Subordinate and Mezzanine Indebtedness.None.
Ground Lease. None.
Terrorism Insurance.The loan documents require that the “all risk” insurance policy required to be maintained by the borrower provide coverage for terrorism in an amount equal to the full replacement cost of The Meridian at North Property as well as business interruption covering no less than the 18-month period following the occurrence of a casualty event, together with a 365 day extended period of indemnity.
THE INFORMATION IN THIS STRUCTURAL AND COLLATERAL TERM SHEET IS NOT COMPLETE AND MAY BE AMENDED PRIOR TO THE TIME OF SALE. THIS TERM SHEET IS NOT AN OFFER TO SELL THESE SECURITIES AND IT IS NOT A SOLICITATION OF AN OFFER TO BUY THESE SECURITIES IN ANY JURISDICTION WHERE THE OFFER OR SALE IS NOT PERMITTED.
123
(THIS PAGE INTENTIONALLY LEFT BLANK)
THE INFORMATION IN THIS STRUCTURAL AND COLLATERAL TERM SHEET IS NOT COMPLETE AND MAY BE AMENDED PRIOR TO THE TIME OF SALE. THIS TERM SHEET IS NOT AN OFFER TO SELL THESE SECURITIES AND IT IS NOT A SOLICITATION OF AN OFFER TO BUY THESE SECURITIES IN ANY JURISDICTION WHERE THE OFFER OR SALE IS NOT PERMITTED.
124
ELLSWORTH PLACE
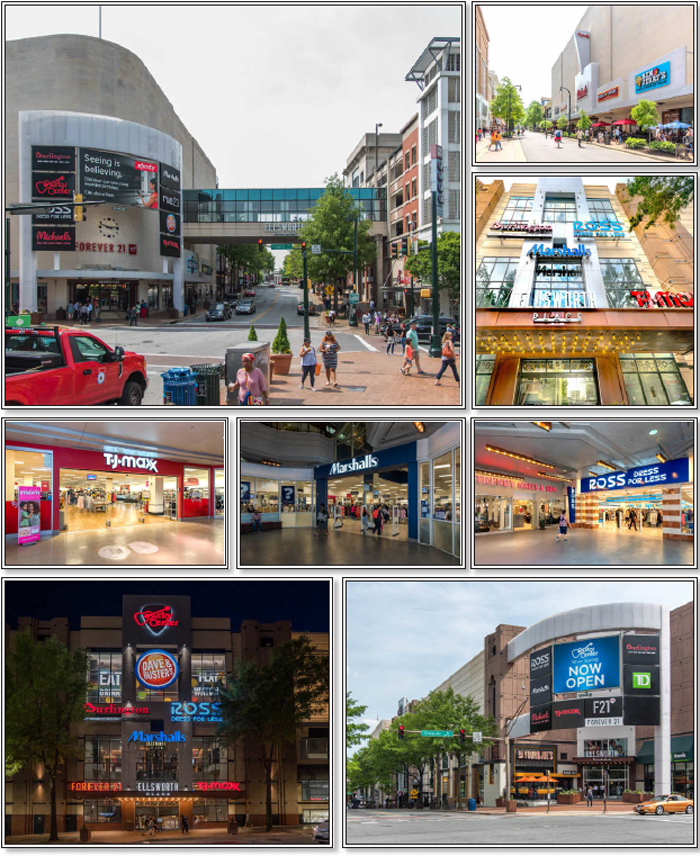
THE INFORMATION IN THIS STRUCTURAL AND COLLATERAL TERM SHEET IS NOT COMPLETE AND MAY BE AMENDED PRIOR TO THE TIME OF SALE. THIS TERM SHEET IS NOT AN OFFER TO SELL THESE SECURITIES AND IT IS NOT A SOLICITATION OF AN OFFER TO BUY THESE SECURITIES IN ANY JURISDICTION WHERE THE OFFER OR SALE IS NOT PERMITTED.
125
ELLSWORTH PLACE
THE INFORMATION IN THIS STRUCTURAL AND COLLATERAL TERM SHEET IS NOT COMPLETE AND MAY BE AMENDED PRIOR TO THE TIME OF SALE. THIS TERM SHEET IS NOT AN OFFER TO SELL THESE SECURITIES AND IT IS NOT A SOLICITATION OF AN OFFER TO BUY THESE SECURITIES IN ANY JURISDICTION WHERE THE OFFER OR SALE IS NOT PERMITTED.
126
ELLSWORTH PLACE
THE INFORMATION IN THIS STRUCTURAL AND COLLATERAL TERM SHEET IS NOT COMPLETE AND MAY BE AMENDED PRIOR TO THE TIME OF SALE. THIS TERM SHEET IS NOT AN OFFER TO SELL THESE SECURITIES AND IT IS NOT A SOLICITATION OF AN OFFER TO BUY THESE SECURITIES IN ANY JURISDICTION WHERE THE OFFER OR SALE IS NOT PERMITTED.
127
ELLSWORTH PLACE
THE INFORMATION IN THIS STRUCTURAL AND COLLATERAL TERM SHEET IS NOT COMPLETE AND MAY BE AMENDED PRIOR TO THE TIME OF SALE. THIS TERM SHEET IS NOT AN OFFER TO SELL THESE SECURITIES AND IT IS NOT A SOLICITATION OF AN OFFER TO BUY THESE SECURITIES IN ANY JURISDICTION WHERE THE OFFER OR SALE IS NOT PERMITTED.
128
ELLSWORTH PLACE

THE INFORMATION IN THIS STRUCTURAL AND COLLATERAL TERM SHEET IS NOT COMPLETE AND MAY BE AMENDED PRIOR TO THE TIME OF SALE. THIS TERM SHEET IS NOT AN OFFER TO SELL THESE SECURITIES AND IT IS NOT A SOLICITATION OF AN OFFER TO BUY THESE SECURITIES IN ANY JURISDICTION WHERE THE OFFER OR SALE IS NOT PERMITTED.
129
| No. 10 – Ellsworth Place | ||||||
| Loan Information | Property Information | |||||
| Mortgage Loan Seller: | Rialto Mortgage Finance, LLC | Single Asset/Portfolio: | Single Asset | |||
| Credit Assessment (DBRS/Fitch/Moody’s): | NR/NR/NR | Property Type: | Retail | |||
| Original Principal Balance(1): | $24,000,000 | Specific Property Type: | Anchored | |||
| Cut-off Date Principal Balance(1): | $24,000,000 | Location: | Silver Spring, MD | |||
| % of Initial Pool Balance: | 2.5% | Size: | 347,758 SF | |||
| Loan Purpose: | Acquisition | Cut-off Date Principal Balance Per SF(1): | $198.41 | |||
| Borrower Name: | Avante Ellsworth Venture I LLC | Year Built/Renovated: | 1947/2015 | |||
| Borrower Sponsor: | George B. Tomlin, Jr. | Title Vesting: | Fee | |||
| Mortgage Rate: | 5.0100% | Property Manager: | Self-managed | |||
| 4th Most Recent Occupancy (As of): | 52.8% (12/31/2014) | |||||
| Note Date: | July 20, 2018 | 3rd Most Recent Occupancy (As of): | 53.4% (12/31/2015) | |||
| Anticipated Repayment Date: | NAP | 2nd Most Recent Occupancy (As of): | 87.1% (12/31/2016) | |||
| Maturity Date: | August 6, 2028 | Most Recent Occupancy (As of): | 92.4% (12/31/2017) | |||
| IO Period: | 36 months | Current Occupancy (As of): | 91.6% (7/1/2018) | |||
| Loan Term (Original): | 120 months | |||||
| Seasoning: | 2 months | Underwriting and Financial Information: | ||||
| Amortization Term (Original): | 360 months | |||||
| Loan Amortization Type: | Interest-only, Amortizing Balloon | 3rd Most Recent NOI (As of)(3): | $3,016,553 (12/31/2016) | |||
| Interest Accrual Method: | Actual/360 | 2nd Most Recent NOI (As of)(3): | $5,952,628 (12/31/2017) | |||
| Call Protection: | L(23),GRTR 1% or YM(90),O(7) | Most Recent NOI (As of): | $6,385,363 (TTM 5/31/2018) | |||
| Lockbox Type: | Hard/Springing Cash Management | |||||
| Additional Debt(1): | Yes | U/W Revenues: | $10,153,983 | |||
| Additional Debt Type(1): | Pari Passu | U/W Expenses: | $3,226,042 | |||
| U/W NOI: | $6,927,941 | |||||
| U/W NCF: | $6,510,631 | |||||
| Escrows and Reserves(2): | U/W NOI DSCR(1): | 1.56x | ||||
| U/W NCF DSCR(1): | 1.46x | |||||
| Type: | Initial | Monthly | Cap (If Any) | U/W NOI Debt Yield(1): | 10.0% | |
| Taxes | $0 | $41,858 | NAP | U/W NCF Debt Yield(1): | 9.4% | |
| Insurance | $61,994 | $6,560 | NAP | As-Is Appraised Value: | $95,900,000 | |
| Replacement Reserves | $0 | $7,245 | NAP | As-Is Appraisal Valuation Date: | June 21, 2018 | |
| TI/LC Reserve | $2,000,000 | $27,531 | $2,000,000 | Cut-off Date LTV Ratio(1): | 71.9% | |
| Deferred Maintenance | $16,875 | $0 | NAP | LTV Ratio at Maturity or ARD(1): | 63.7% | |
| Five Below Rent Reserve | $382,927 | $0 | NAP | |||
| Five Below TI Reserve | $313,155 | $0 | NAP | |||
| Metro PCS TI Reserve | $152,100 | $0 | NAP | |||
| Panadian TI Reserve | $32,164 | $0 | NAP | |||
| Burlington TI Reserve | $22,519 | $0 | NAP | |||
| Five Below LC Reserve | $104,737 | $0 | NAP | |||
| (1) | See “The Mortgage Loan” section. All statistical information related to balances per square foot, loan-to-value ratios, debt service coverage ratios and debt yields are based on the Ellsworth Place Whole Loan (as defined below). |
| (2) | See “Escrows” section. |
| (3) | See “Cash Flow Analysis” section. |
The Mortgage Loan. The mortgage loan (the “Ellsworth Place Mortgage Loan”) is part of a whole loan (the “Ellsworth Place Whole Loan”) evidenced by fivepari passu promissory notes that are secured by a first mortgage encumbering the fee simple interest in a 347,758 square foot anchored retail property located in Silver Spring, Maryland (the “Ellsworth Place Property”). The Ellsworth Place Mortgage Loan was originated on July 20, 2018 by Rialto Mortgage Finance, LLC. The Ellsworth Place Whole Loan had an original principal balance of $69,000,000, has an outstanding principal balance as of the Cut-off Date of $69,000,000 and accrues interest at an interest rate of 5.0100%per annum. The Ellsworth Place Whole Loan had an initial term of 120 months, has a remaining term of 118 months as of the Cut-off Date and requires interest-only payments for the first 36 months following origination and, thereafter, requires payments of principal and interest based on a 30-year amortization schedule. The Ellsworth Place Whole Loan matures on August 6, 2028.
The Ellsworth Place Mortgage Loan, evidenced by the controlling Note A-1, will be contributed to the WFCM 2018-C47 Trust, had an original principal balance of $24,000,000, and has an outstanding principal balance as of the Cut-Off Date of $24,000,000. The non-controlling Note A-2 which had an original principal balance of $20,000,000 was contributed to the UBS 2018-C13 Trust. The non-controlling Note A-3, Note A-4, and Note A-5 which had an original principal balance of $15,00,0000, $5,000,000, and $5,000,000
THE INFORMATION IN THIS STRUCTURAL AND COLLATERAL TERM SHEET IS NOT COMPLETE AND MAY BE AMENDED PRIOR TO THE TIME OF SALE. THIS TERM SHEET IS NOT AN OFFER TO SELL THESE SECURITIES AND IT IS NOT A SOLICITATION OF AN OFFER TO BUY THESE SECURITIES IN ANY JURISDICTION WHERE THE OFFER OR SALE IS NOT PERMITTED.
130
ELLSWORTH PLACE
respectively, are held by Rialto Mortgage Finance, LLC and are expected to be contributed to one or more future securitizations. The aforementioned notes, collectively, serve as the “Ellsworth Place Companion Loans”. See “Description of the Mortgage Pool-The Whole Loans-The Serviced Pari Passu Whole Loans” and “Pooling and ServicingAgreement” in the Preliminary Prospectus.
The following table presents a summary of the promissory notes comprising the Ellsworth Place Whole Loan:
Note Summary
| Notes | Original Balance | Note Holder | Controlling Interest | |
| Note A-1 | $24,000,000 | WFCM 2018-C47 | Yes | |
| Note A-2 | $20,000,000 | UBS 2018-C13 | No | |
| Note A-3 | $15,000,000 | Rialto Mortgage Finance, LLC | No | |
| Note A-4 | $5,000,000 | Rialto Mortgage Finance, LLC | No | |
| Note A-5 | $5,000,000 | Rialto Mortgage Finance, LLC | No | |
| Total | $69,000,000 |
Following the lockout period and prior to February 6, 2028, the borrower has the right to voluntarily prepay the Ellsworth Place Whole Loan in whole, but not in part, provided that the borrower pays the greater of a yield maintenance premium or a prepayment premium equal to 1.0% of the then outstanding principal balance. The Ellsworth Place Whole Loan is prepayable without penalty on or after February 6, 2028.
Sources and Uses
| Sources | Uses | |||||||
| Original loan amount | $69,000,000 | 69.8% | Purchase price | $92,000,000 | 93.1% | |||
| Sponsor’s new equity contribution | 29,827,229 | 30.2 | Closing costs | 3,740,757 | 3.8 | |||
| Reserves | 3,086,471 | 3.1 | ||||||
| Total Sources | $98,827,229 | 100.0% | Total Uses | $98,827,229 | 100.0% |
The Property.The Ellsworth Place Property is an anchored retail center containing approximately 347,758 square feet and located in Silver Spring, Maryland approximately 6.5 miles north of Washington D.C. Built in 1947 and renovated in 1991, and between 2014 and 2015, the Ellsworth Place Property consists of one, five-story building situated on a 2.1-acre parcel along Colesville Road. The Ellsworth Place Property is anchored by Burlington Coat Factory, Dave & Busters, Marshalls, Ross Dress for Less, Inc., TJ Maxx and Michael’s Stores Inc. There are no parking requirements per local zoning code, but the Ellsworth Place Property does have direct interior access to a 1,200-space parking garage via a pedestrian sky bridge located on the upper level of the Ellsworth Place Property. The city of Silver Spring has granted an easement for a pedestrian walkway from the parking garage to the Ellsworth Place Property, and the borrower sponsor is responsible for the maintenance of the sky bridge. The parking garage is owned and operated by Montgomery County, which offers free parking during the evening and weekends, charging fees only during the workday. As of July 1, 2018, the Ellsworth Place Property was 91.6% leased to 37 tenants.
The Ellsworth Place Property was converted from a department store to a regional mall in 1991. Between 2014 and 2015, the seller of the Ellsworth Place Property completed a $46.7 million redevelopment and reconfiguration of the Ellsworth Place Property into an enclosed vertical, urban power center. Exterior improvements focused on increasing pedestrian traffic through increased accessibility and visibility through the addition of 15 escalators and stairways. Additional points of entry were added along Colesville Road and Ellsworth Drive, and the existing entrance along Fenton Street was widened. The result is six total access points that allow customers to enter from Colesville Road, Fenton Street, Ellsworth Drive, and via the sky bridge that connects to the parking garage. Additionally, the prior owner of the Ellsworth Place Property improved signage with the addition of LED and blade signs to improve visibility of the Ellsworth Place Property. Interior improvements focused on upgrading the design and finishes to create a modern retail environment and experience while promoting movement through the various levels of the Ellsworth Place Property.
The Ellsworth Place Property consists of two condominium units, including the existing retail unit (the “Retail Unit”) and an air rights unit in which is vested the right to commence future construction of a nine story office building totaling 210,000 SF of office space in the air rights above the Retail Unit (the “AR Unit”). The borrower (the owner of the AR Unit) has the right to build an office building in the AR Unit in the future. The borrower pays nominal taxes on the AR Unit based on an assessment of the air rights, which were approved when the Retail Unit was originally built in 1988. The borrower owns 100% of the condominium units. The Ellsworth Place Whole Loan documents prohibits the sale or other transfer of the AR Unit and the development of the AR Unit office space during the term of the Ellsworth Place Whole Loan.
The largest tenant at the Ellsworth Place Property is Burlington Coat Factory (65,096 SF, 18.7% of NRA, 12.8% of underwritten rent). Burlington Coat Factory is owned by Burlington Stores, Inc., a nationally recognized off-price retailer of high-quality, branded merchandise at everyday low prices. Burlington Coat Factory has been a tenant at the Ellsworth Place Property since 1997 under a lease that commenced on February 1, 1997 and expires on February 28, 2026, with four, five-year renewal options remaining and no termination options.
The second largest tenant at the Ellsworth Place Property is Dave & Buster’s (41,975 SF, 12.1% of NRA, 17.1% of underwritten rent). The concept of Dave and Buster’s is to offer customers the opportunity to “Eat Drink Play and Watch” all in one location, providing an upbeat atmosphere with interactive entertainment options for adults and families while serving food and beverages. Dave & Buster’s
THE INFORMATION IN THIS STRUCTURAL AND COLLATERAL TERM SHEET IS NOT COMPLETE AND MAY BE AMENDED PRIOR TO THE TIME OF SALE. THIS TERM SHEET IS NOT AN OFFER TO SELL THESE SECURITIES AND IT IS NOT A SOLICITATION OF AN OFFER TO BUY THESE SECURITIES IN ANY JURISDICTION WHERE THE OFFER OR SALE IS NOT PERMITTED.
131
ELLSWORTH PLACE
has been a tenant at the Ellsworth Place Property since 2016 under a lease that commenced on November 21, 2016 and expires on January 31, 2032, with two, five-year renewal options remaining and no termination options.
The third largest tenant at the Ellsworth Place Property is Marshalls (27,771 SF, 8.0% of NRA, 4.7% of underwritten rent). Marshalls is owned by the TJX Companies, Inc., the leading off-price apparel and home fashions retailer in the United States and worldwide. The company offers a changing assortment of brand name and designer merchandise generally at discounted prices. Marshalls has been a tenant at the Ellsworth Place Property since 1992 under a lease that commenced on April 2, 1992 and expires on June 30, 2020, with three, five-year renewal options remaining and no termination options
The following table presents certain information relating to the tenancies at the Ellsworth Place Property:
Major Tenants
| Tenant Name | Credit Rating (Fitch/ Moody’s/ S&P)(1) | Tenant NRSF | % of NRSF | Annual U/W Base Rent PSF(2) | Annual U/W Base Rent(2) | % of Total Annual U/W Base Rent | Sales PSF(3) | Occupancy Cost(3) | Lease Expiration Date |
| Anchor Tenant – Collateral | |||||||||
| Burlington Coat Factory(4) | NR/NR/BB | 65,096 | 18.7% | $14.50 | $943,892 | 12.8% | $199 | 7.9% | 2/28/2026 |
| Dave & Buster’s(5) | NR/NR/NR | 41,975 | 12.1% | $30.00 | $1,259,250 | 17.1% | $243 | 14.1% | 1/31/2032 |
| Marshalls(6) | NR/A2/A+ | 27,771 | 8.0% | $12.50 | $347,138 | 4.7% | $283 | 7.7% | 6/30/2020 |
| Ross Dress for Less, Inc.(7)(8) | NR/A3/A- | 25,716 | 7.4% | $18.50 | $475,746 | 6.5% | N/A | N/A | 1/31/2027 |
| TJ Maxx(9) | NR/A2/A+ | 24,000 | 6.9% | $14.16 | $339,840 | 4.6% | N/A | N/A | 11/30/2025 |
| Michaels Stores, Inc(10) | NR/NR/BB- | 21,336 | 6.1% | $19.50 | $416,052 | 5.6% | N/A | N/A | 2/28/2025 |
| Total Anchor Tenant – Collateral | 205,894 | 59.2% | $18.37 | $3,781,918 | 51.3% | ||||
| Major Tenants – Collateral | |||||||||
| Guitar Center Stores, Inc.(11) | NR/Caa3/CCC+ | 14,600 | 4.2% | $22.50 | $328,500 | 4.5% | N/A | N/A | 4/30/2032 |
| Forever 21 Retail, Inc.(12) | NR/NR/NR | 13,224 | 3.8% | $16.50 | $218,196 | 3.0% | $143 | 18.6% | 1/31/2027 |
| McGinty’s Irish Public House(13) | NR/NR/NR | 9,821 | 2.8% | $31.98 | $314,043 | 4.3% | $279 | 13.5% | 12/31/2025 |
| Five Below(14) | NR/NR/NR | 9,500 | 2.7% | $28.00 | $266,004 | 3.6% | N/A | N/A | 1/31/2029 |
| Total Major Tenants – Collateral | 47,145 | 13.6% | $23.90 | $1,126,743 | 15.3% | ||||
| Non-Major Tenants – Collateral | 65,581 | 18.9% | $37.49 | $2,458,718 | 33.4% | ||||
| Occupied Collateral Total | 318,620 | 91.6% | $23.12 | $7,367,379 | 100.0% | ||||
| Vacant Space(15) | 29,138 | 8.4% | |||||||
| Collateral Total | 347,758 | 100.0% | |||||||
| (1) | Certain ratings are those of the parent company whether or not the parent guarantees the lease. |
| (2) | Unless otherwise noted, Annual U/W Base Rent PSF and Annual U/W Base Rent include contractual rent escalations through August 2019. |
| (3) | Sales PSF and Occupancy Costs are for the trailing 12-month period ending on May 31, 2018 for each tenant reporting sales above, except for Dave & Buster’s whose Sales PSF and Occupancy Costs are for trailing 12-month period ending on December 31, 2017. |
| (4) | Burlington Coat Factory has four, five-year renewal options remaining. |
| (5) | Dave & Buster’s has two, five-year renewal options remaining. |
| (6) | Marshall’s has three, five-year renewal options remaining. |
| (7) | Ross Dress for Less, Inc. has four, five-year renewal options remaining. |
| (8) | Ross Dress for Less, Inc. has a one-time right to terminate its lease if their gross sales do not exceed $7.5 million during February 1, 2018 through January 31, 2019 by delivering notice within 365 days following the measuring period. |
| (9) | TJ Maxx has four, five-year renewal options remaining. |
| (10) | Michael’s Stores Inc. has two, five-year renewal options remaining. |
| (11) | Guitar Center Stores, Inc. has three, five-year renewal options remaining. |
| (12) | Forever 21 has three, five-year renewal options remaining. Forever 21 has a one-time right to terminate its lease if their gross sales do not exceed $250.00 per square feet from October 2018 through September 2019, with a 180 notice period. |
| (13) | McGinty’s Irish Public House has two, five-year renewal options remaining. |
| (14) | Five Below is not yet in occupancy and is in the free rent period of 90 days after the earlier of (i) the delivery date and (ii) the date Five Below opens for business. It is anticipated that Five Below will commence occupancy in October 2018 after tenant improvements have been completed. The borrower deposited $382,927 in a free rent reserve and $417,892 in the tenant improvement leasing reserve account related to this tenant. Five Below has three, five-year renewal options remaining. Five Below has a one-time right to terminate its lease if their gross sales do not exceed $2,220,000 from the 44th month through the 55th month with a 60-day notice period and payment of 100% of the unamortized tenant allowance. |
| (15) | Vacant space includes temporary tenants Kids for Less, which occupies 7,110 square feet and pays percent in lieu of base rent and Oxford Jewelers, which occupies 828 square feet and pays month-to-month rent. Noodle & Co., which occupied 2,994 square feet, went dark in May 2018 and continues to pay $55.00 per square feet in rent until August 2019. Payless ShoeSource which occupies 3,574 square feet is on rent relief. Each such tenant has been underwritten as vacant. |
THE INFORMATION IN THIS STRUCTURAL AND COLLATERAL TERM SHEET IS NOT COMPLETE AND MAY BE AMENDED PRIOR TO THE TIME OF SALE. THIS TERM SHEET IS NOT AN OFFER TO SELL THESE SECURITIES AND IT IS NOT A SOLICITATION OF AN OFFER TO BUY THESE SECURITIES IN ANY JURISDICTION WHERE THE OFFER OR SALE IS NOT PERMITTED.
132
ELLSWORTH PLACE
The following table presents certain information relating to the historical sales at the Ellsworth Place Property:
Historical Sales (PSF)(1)
| Tenant Name | 2016 | 2017 | TTM 5/31/2018 | Average National Sales (PSF)(2) | Current Occupancy Cost |
| Burlington Coat Factory | $173 | $187 | $199 | $124 | 7.9% |
| Dave & Buster’s | NAV | $243 | $240(3) | NAV | 14.1% |
| Marshall’s | $263 | $273 | $283 | $414 | 7.7% |
| Forever 21 | NAV | $133 | $143 | $280 | 18.6% |
| In-line tenants (<10,000 square feet) | $287(4) | $316(5) | $328(5) | 13.7% |
| (1) | Historical Sales (PSF) are based on historical statements provided by the borrower. |
| (2) | Average National Sales (PSF) are provided by a third party market research report. |
| (3) | Dave & Buster’s Sales represent the twelve month period ending on January 31, 2018. |
| (4) | 2016 Weighted Average In-Line (10,000 square feet) Historical Sales (PSF) represent McGinty’s Irish Public House, Asia Buffet/Blue Pearl, Rainbow, Foot Locker, Beauty Pro, Mod Super Fast Pizza, General Nutrition Center, Hair Cuttery, Ben & Jerry’s, Pour Moi/Luggage Center, Photo Palace and Cobbler Bench Shoe Repair. |
| (5) | 2017 and TTM 5/31/2018 Weighted Average In-Line (10,000 square feet) Historical Sales (PSF) represent McGinty’s Irish Pubic House, Asia Buffet/Blue Pearl, Not Your Average Joe’s, Shoe City, Rainbow, Foot Locker, Beauty Pro, Mod Super Fast Pizza, General Nutrition Center, Trendy Nail Salon, Hair Cuttery, Ben & Jerry’s, Pour Moi/Luggage Center, Kung Fu Tea, Photo Palace, Wireless And Repair Store, Cobbler Bench Shoe Repair and OM Eyebrow Design. |
The following table presents certain information relating to the lease rollover schedule at the Ellsworth Place Property:
Lease Expiration Schedule(1)(2)
| Year Ending December 31, | No. of Leases Expiring | Expiring NRSF | % of Total NRSF | Cumulative Expiring NRSF | Cumulative% of Total NRSF | Annual U/W Base Rent | % of Total Annual U/W Base Rent | Annual U/W Base Rent PSF(3) |
| MTM | 0 | 0 | 0.0% | 0 | 0.0% | $0 | 0.0% | $0.00 |
| 2018 | 0 | 0 | 0.0% | 0 | 0.0% | $0 | 0.0% | $0.00 |
| 2019 | 2 | 3,530 | 1.0% | 3,530 | 1.0% | $166,199 | 2.3% | $47.08 |
| 2020 | 3 | 39,954 | 11.5% | 43,484 | 12.5% | $670,538 | 9.1% | $16.78 |
| 2021 | 0 | 0 | 0.0% | 43,484 | 12.5% | $0 | 0.0% | $0.00 |
| 2022 | 1 | 282 | 0.1% | 43,766 | 12.6% | $18,942 | 0.3% | $67.17 |
| 2023 | 2 | 2,290 | 0.7% | 46,056 | 13.2% | $80,342 | 1.1% | $35.08 |
| 2024 | 1 | 1,266 | 0.4% | 47,322 | 13.6% | $90,519 | 1.2% | $71.50 |
| 2025 | 6 | 63,513 | 18.3% | 110,835 | 31.9% | $1,431,687 | 19.4% | $22.54 |
| 2026 | 4 | 73,391 | 21.1% | 184,226 | 53.0% | $1,283,639 | 17.4% | $17.49 |
| 2027 | 10 | 57,512 | 16.5% | 241,738 | 69.5% | $1,316,220 | 17.9% | $22.89 |
| 2028 | 3 | 2,280 | 0.7% | 244,018 | 70.2% | $109,378 | 1.5% | $47.97 |
| Thereafter | 5 | 74,602 | 21.5% | 318,620 | 91.6% | $2,199,916 | 29.9% | $29.49 |
| Vacant(4) | 0 | 29,138 | 8.4% | 347,758 | 100.0% | $0 | 0.0% | $0.00 |
| Total/Weighted Average | 37 | 347,758 | 100.0% | $7,367,379 | 100.0% | $23.12 |
| (1) | Information obtained from the underwritten rent roll. |
| (2) | Certain tenants may have lease termination options that are exercisable prior to the originally stated expiration date of the subject lease and that are not considered in the Lease Expiration Schedule. |
| (3) | Total/Weighted Average Annual U/W Base Rent PSF excludes vacant space. |
| (4) | Vacant space includes temporary tenants Kids for Less, which occupies 7,110 square feet and pays percent in lieu of base rent and Oxford Jewelers, which occupies 828 square feet and pays month-to-month rent. Noodle & Co., which occupied 2,994 square feet, went dark in May 2018 and continues to pay $55.00 per square feet in rent until August 2019. Payless ShoeSource which occupies 3,574 square feet is on rent relief. Each such tenant has been underwritten as vacant. |
The following table presents historical occupancy percentages at the Ellsworth Place Property:
Historical Occupancy
12/31/2014(1) | 12/31/2015(1) | 12/31/2016(1) | 12/31/2017(1) | 7/1/2018(2)(3) |
| 52.8% | 53.4% | 87.1% | 92.4% | 91.6% |
| (1) | Information obtained from the borrower. |
| (2) | Information obtained from the underwritten rent roll. |
| (3) | Vacant space includes temporary tenants Kids for Less, which occupies 7,110 square feet and pays percent in lieu of base rent and Oxford Jewelers, which occupies 828 square feet and pays month-to-month rent. Noodle & Co., which occupied 2,994 square feet, went dark in May 2018 and continues to pay $55.00 per square foot in rent until August 2019. Payless ShoeSource which occupies 3,574 square feet is on rent relief. Each such tenant has been underwritten as vacant. |
THE INFORMATION IN THIS STRUCTURAL AND COLLATERAL TERM SHEET IS NOT COMPLETE AND MAY BE AMENDED PRIOR TO THE TIME OF SALE. THIS TERM SHEET IS NOT AN OFFER TO SELL THESE SECURITIES AND IT IS NOT A SOLICITATION OF AN OFFER TO BUY THESE SECURITIES IN ANY JURISDICTION WHERE THE OFFER OR SALE IS NOT PERMITTED.
133
ELLSWORTH PLACE
Operating History and Underwritten Net Cash Flow. The following table presents certain information relating to the historical operating performance and Underwritten Net Cash Flow at the Ellsworth Place Property:
Cash Flow Analysis
| 2015(1) | 2016(1) | 2017 | TTM 5/31/2018 | U/W | % of Effective Gross Income | U/W $ per SF | |||||||||
| Base Rent | $2,631,267 | $4,264,915 | $6,818,576 | $7,102,782 | $7,327,055 | 72.2% | $21.07 | ||||||||
| Rent Steps | 0 | 0 | 0 | 0 | 40,325 | 0.4 | 0.12 | ||||||||
| Grossed Up Vacant Space | 0 | 0 | 0 | 0 | 962,308 | 9.5 | 2.77 | ||||||||
| Percentage Rent | 0 | 0 | 10,283 | 10,283 | 6,944 | 0.1 | 0.02 | ||||||||
| Straight Line Rent(2) | 0 | 0 | 0 | 0 | 67,866 | 0.7 | 0.20 | ||||||||
| Total Reimbursables | 945,439 | 1,067,832 | 1,823,852 | 1,984,911 | 2,139,221 | 21.1 | 6.15 | ||||||||
| Other Income(3) | 535,804 | 403,510 | 537,386 | 545,575 | 572,573 | 5.6 | 1.65 | ||||||||
| Less Vacancy & Credit Loss | 0 | 0 | 0 | 0 | (962,308)(4) | (9.5) | (2.77) | ||||||||
| Effective Gross Income | $4,112,510 | $5,736,257 | $9,190,096 | $9,643,551 | $10,153,983 | 100.0% | $29.20 | ||||||||
| Total Operating Expenses | $2,379,217 | $2,719,704 | $3,237,469 | $3,258,188 | $3,226,042 | 31.8% | $9.28 | ||||||||
| Net Operating Income | $1,733,293 | $3,016,553 | $5,952,628 | $6,385,363 | $6,927,941 | 68.2% | $19.92 | ||||||||
| TI/LC | 0 | 0 | 0 | 0 | 330,370 | 3.3 | 0.95 | ||||||||
| Capital Expenditures | 0 | 0 | 0 | 0 | 86,940 | 0.9 | 0.25 | ||||||||
| Net Cash Flow | $1,733,293 | $3,016,553 | $5,952,628 | $6,385,363 | $6,510,631 | 64.1% | $18.72 | ||||||||
| NOI DSCR(5) | 0.39x | 0.68x | 1.34x | 1.43x | 1.56x | ||||||||||
| NCF DSCR(5) | 0.39x | 0.68x | 1.34x | 1.43x | 1.46x | ||||||||||
| NOI DY(5) | 2.5% | 4.4% | 8.6% | 9.3% | 10.0% | ||||||||||
| NCF DY(5) | 2.5% | 4.4% | 8.6% | 9.3% | 9.4% |
| (1) | The Ellsworth Place Property underwent a $46.7 million renovation and reconfiguration within the last 5 years. |
| (2) | Straight Line Rent includes rent related to TJ Maxx, PNC, TD Bank, Ben & Jerry’s and MetroPCS. |
| (3) | Other Income includes other tenant reimbursements, specialty income, billboard income, promotional income, storage rent, other income, late fees, trash pad rental, and miscellaneous income. |
| (4) | The underwritten economic vacancy is 9.1%. The Ellsworth Place Property was 91.6% occupied as of July 1, 2018. |
| (5) | Debt service coverage ratios and debt yields are based on the Ellsworth Place Whole Loan. |
Appraisal.As of the appraisal valuation date of June 21, 2018, the Ellsworth Place Property had an “as-is” appraised value of $95,900,000.
Environmental Matters.According to a Phase I environmental assessment dated June 22, 2018, there was no evidence of any recognized environmental conditions at the Ellsworth Place Property.
Market Overview and Competition.The Ellsworth Place Property is located in Silver Spring, Maryland, in Montgomery County, within the Washington D.C. metropolitan statistical area (the “Washington D.C. MSA”). The Washington D.C. MSA is situated along the country’s eastern seaboard centrally located between Norfolk, Virginia and New York City. Encompassing more than 5,627 square miles, the region is comprised of 15 counties and six independent cities within the states of Maryland and West Virginia as well as the Commonwealth of Virginia.
Silver Spring is an unincorporated area located in the eastern portion of Montgomery County and, according to the appraisal, it is in the northern path of commercial and residential expansion from Washington, D.C. Silver Spring is the fourth most populous place in Maryland, after Baltimore, Columbia and Germantown. The Silver Spring central business district is located at the southernmost part of Silver Spring and at the northern part of Washington D.C. The downtown area has undergone renovations with the addition of major retail, residential and office developments. Landmarks within the Silver Spring central business district include the world headquarters of Discovery Communication, the American Film Institute (AFI) and the headquarters of the Seventh-Day Adventist Church. At the beginning of the 21st century, downtown Silver Spring began to redevelop several blocks near the Ellsworth Place Property to accommodate the new lifestyle center known as Downtown Silver Spring. Downtown Silver Spring includes national retailers such as Whole Food Markets, a 20-screen Regal Theater, Ann Taylor, DSW Shoe Warehouse, Office Depot, and Pier 1 Imports, as well as restaurants such as Red Lobster, Romano’s Macaroni Grill, Cold Stone Creamery, Fuddruckers, Potbelly Sandwich Works, Baja Fresh and Chick-Fil-A. According to a third party market research report, the 2018 estimated population within a one, three, and five-mile radius of the Ellsworth Place Property is 36,503, 233,126 and 612,058, respectively. The 2018 estimated average household income within the same radii was $110,328, $123,688, and $131,651, respectively.
According to a third party market research report, the Ellsworth Place Property is located within the Washington, D.C. retail market which contained approximately 302 million square feet of retail space as of the first quarter of 2018. The Washington, D.C. retail market reported a vacancy rate of 4.4% with an average rental rate of $24.68 per square foot as of the first quarter of 2018. The Washington, D.C. retail market reported negative net absorption of 493,446 square feet during the first quarter of 2018. There was 2.3 million square feet of retail space under construction in 70 buildings and year-to-date deliveries totaling 171,208 square feet.
According to a third party market research report, the Ellsworth Place Property is located within the Montgomery County retail submarket which contained approximately 11.4 million square feet of retail space as of the first quarter of 2018. The Montgomery County retail submarket reported a vacancy rate of 3.0% with an average rental rate of $30.20 per square foot. The Montgomery
THE INFORMATION IN THIS STRUCTURAL AND COLLATERAL TERM SHEET IS NOT COMPLETE AND MAY BE AMENDED PRIOR TO THE TIME OF SALE. THIS TERM SHEET IS NOT AN OFFER TO SELL THESE SECURITIES AND IT IS NOT A SOLICITATION OF AN OFFER TO BUY THESE SECURITIES IN ANY JURISDICTION WHERE THE OFFER OR SALE IS NOT PERMITTED.
134
ELLSWORTH PLACE
County retail submarket reported negative net absorption of 9,466 square feet during the first quarter of 2018. There was 3,500 square feet of retail space under construction in one building and no year-to-date deliveries.
The following table presents certain information relating to comparable retail properties for the Ellsworth Place Property:
Competitive Set(1)
| Property Name / Location | Year Built/ Renovated | Total GLA (SF) | Occupancy | Distance to Subject | Major / Anchor Tenants |
Ellsworth Place (Subject) Silver Spring, MD | 1947/2015 | 347,758 | 91.6% | - | Burlington Coat Factory, Dave & Buster’s, Marshalls, Ross Dress for Less, Inc., TJ Maxx |
Downtown Silver Spring Silver Spring, MD | 2004/NAP | 398,455 | 97.0% | <1.0 miles | Whole Foods, H&M, The Majestic Cinema, Washington Sports Club |
DC USA Washington, D.C. | 2008/NAP | 434,819 | 93.0% | 5.0 miles | Target, Best Buy, Bed, Bath & Beyond, Marshall’s, Staples, Washington Sports Club |
The Shops at Wisconsin Place Chevy Chase, MD | 2009/NAP | 297,202 | 94.0% | 3.0 miles | Bloomingdales, Whole Foods |
Bethesda Row Bethesda, MD | 1951/1999 | 520,000 | 98.0% | 3.0 miles | Landmark Theater, Barnes & Noble, Giant Food, Equinox Fitness Club |
The Shops at Georgetown Washington, D.C. | 1981/2013 | 303,574 | 92.0% | 7.0 miles | TJ Maxx/Homegoods, H&M, Washington Sports Club, DSW, Forever 21 |
Orchard Shopping Center Silver Spring, MD | 1996/NAP | 392,107 | 100.0% | 5.0 miles | Target, Babies R Us, Kohl’s, PetSmart, ShopRite |
The Shops at Dakota Crossing Washington, D.C. | 2012/NAP | 426,278 | 97.0% | 7.0 miles | Lowe’s Home Improvement, Costco, Dick’s Sporting Goods, Marshall’s, PetSmart |
Montrose Crossing Rockville, MD | 1962/1997 | 547,926 | 97.0% | 5.0 miles | Giant Food, Marshall’s, AC Moore, Barnes & Noble, Bob’s Discount Furniture, Target |
| (1) | Information obtained from the appraisal dated July 12, 2018 and the underwritten rent roll. |
The Borrower.The borrower is Avante Ellsworth Venture I LLC, a single purpose, Delaware limited liability company structured with two independent directors. Legal counsel to the borrower delivered a non-consolidation opinion in connection with the origination of the Ellsworth Place Whole Loan. George B. Tomlin, Jr. is the non-recourse carveout guarantor and borrower sponsor for the Ellsworth Place Whole Loan.
The Borrower Sponsor.The borrower sponsor, George B. Tomlin, Jr., is a Nashville-based real estate executive who founded GBT Realty Corporation (“GBT”) in 1987 with a regional focus in office and retail investment management services. GBT changed its focus in 1990 from investment management services to retail development, and over the past 30 years, GBT has developed over 35 million square feet in 27 states. Additionally, GBT has acquired and sold over $5 billion of retail assets and procured over $2 billion in financing backed by commercial real estate.
Escrows.The loan documents provide for upfront reserves in the amount of $61,994 for insurance, $2,000,000 for tenant improvement and leasing commissions, $16,875 for deferred maintenance, $382,927 for a rent reserve for Five Below, $313,155 for a tenant improvement reserve for Five Below, $104,737 for a leasing commissions reserve for Five Below, $152,100 for a Metro PCS tenant improvements reserve, $32,164 for a tenant improvement reserve for Panadian, and $22,519 for a tenant improvement reserve for Burlington Coat Factory. The loan documents require ongoing monthly deposits of $41,858 for real estate taxes, $6,560 for insurance premiums, $7,245 for replacement reserves, and $27,531 for tenant improvement and leasing commissions (subject to a $2,000,000 cap).
Lockbox and Cash Management.The Ellsworth Place Whole Loan requires a hard lockbox and springing cash management. The borrower is required to instruct tenants to deposit rents and other amounts due into the lockbox account during the occurrence and continuance of a Cash Management Trigger Event (as defined below) and funds in the lockbox account are required to be transferred to the cash management account within one business day. Pursuant to the Ellsworth Place Whole Loan documents, all excess funds on deposit will be applied (a) if a Cash Sweep Event (as defined below) period is not in effect, to the borrower; (b) if a Cash Sweep Event is in effect due to the existence of a Critical Tenant Trigger Event (as defined below), to the Critical Tenant TI/LC account, until the Critical Tenant Trigger Event has been cured; and (c) if a Cash Sweep Event is in effect, but no Critical Tenant Trigger Event is in effect, to the excess cash flow account.
A “Cash Management Trigger Event” will commence upon
| (i) | the occurrence and continuation of an event of default; |
| (ii) | the borrower’s second late debt service payment within any consecutive 12-month period; |
| (iii) | any bankruptcy action with respect to the borrower, the guarantor or the property manager; |
| (iv) | a Cash Management DSCR Trigger Event (as defined below); or |
| (v) | a Critical Tenant Trigger Event (as defined below). |
THE INFORMATION IN THIS STRUCTURAL AND COLLATERAL TERM SHEET IS NOT COMPLETE AND MAY BE AMENDED PRIOR TO THE TIME OF SALE. THIS TERM SHEET IS NOT AN OFFER TO SELL THESE SECURITIES AND IT IS NOT A SOLICITATION OF AN OFFER TO BUY THESE SECURITIES IN ANY JURISDICTION WHERE THE OFFER OR SALE IS NOT PERMITTED.
135
ELLSWORTH PLACE
A Cash Management Event will end when
| ● | with respect to clause (i) above, such event of default has been cured or waived; |
| ● | with respect to clause (ii) above, the debt service payments have been made on time for 12 consecutive months; |
| ● | with respect to clause (iii) above, such bankruptcy petition has been discharged, stayed, or dismissed within 30 days of such filing for the borrower or guarantor and within 120 days for the property manager, and certain other conditions have been satisfied; |
| ● | with respect to clause (iv) above, the trailing 12-month amortizing net operating income debt service coverage ratio is greater than 1.25x for two consecutive calendar quarters, and certain other conditions have been satisfied; and |
| ● | with respect to clause (v) above, a Critical Tenant Trigger Event cure has occurred. |
A “Cash Management DSCR Trigger Event” will occur on any day the debt service coverage ratio, based on the trailing 12-month period immediately preceding the date of such determination, is less than 1.15x.
A “Cash Sweep Event” will commence upon
| (i) | the occurrence and continuation of an event of default; |
| (ii) | any bankruptcy action of the borrower, the guarantor or the property manager; |
| (iii) | a Cash Sweep DSCR Trigger Event (as defined below); |
| (iv) | a Critical Tenant Trigger Event (as defined below). |
A Cash Sweep Event will end when
| ● | with respect to clause (i) above, such event of default has been cured; |
| ● | with respect to clause (ii) above, such bankruptcy petition has been discharged, stayed, or dismissed within 30 days of such filing for the borrower or guarantor and within 120 days for the property manager, and certain other conditions have been satisfied; |
| ● | with respect to clause (iii) above, the trailing 12-month amortizing net operating income debt service coverage ratio is greater than 1.20x for two consecutive calendar quarters, and certain other conditions have been satisfied; and |
| ● | with respect to clause (iv) above, a Critical Tenant Trigger Event cure has occurred. |
A ”Cash Sweep DSCR Trigger Event” will occur upon any date that the debt service coverage ratio, based on the trailing 12-month period immediately preceding the date of such determination, is less than 1.10x.
A “Critical Tenant Trigger Event” will occur upon
| (i) | Burlington Coat Factory, Dave & Buster’s, Forever 21, Guitar Center, Marshalls, Michaels, Ross and TJ Maxx or any other tenant occupying the space currently occupied by such tenant or tenants (each, a “Critical Tenant” and each related lease, a “Critical Tenant Lease”) giving notice of its intention to not extend or renew its lease; |
| (ii) | the Critical Tenant failing to give notice of its election to renew its lease on or prior to twelve (12) months prior to the expiration date; |
| (iii) | the Critical Tenant failing to give notice of its election to renew its lease; on or prior to the date on which such Critical Tenant is required under its lease to notify landlord of its election to renew its lease; |
| (iv) | the occurrence of an event of default under the Critical Tenant lease; |
| (v) | the occurrence of a bankruptcy action of the Critical Tenant; |
| (vi) | the Critical Tenant discontinuing its normal business operations or going dark; or |
| (vii) | the exercise of any Co-Tenancy Right (as defined below) or the receipt of any notice from any Critical Tenant of its intention to exercise any Co-Tenancy Right; provided that a Critical Tenant Trigger Event will not occur with respect to any Designated Tenant (as defined below) for as long as the Critical Tenant Trigger Event affects two (2) or more of the Designated Tenants simultaneously. |
A Critical Tenant Trigger Event will end upon
| ● | with respect to clauses (i), (ii) or (iii) above, the date that (1) a Critical Tenant lease extension is executed and delivered by the borrower and the related tenant improvements costs, leasing commissions and other material costs and expenses have been deposited into the Critical Tenant TI/LC account; or (2) a Critical Tenant Space Re-tenanting Event (as defined below) has occurred; |
| ● | with respect to clause (iv) above, a cure of applicable event of default; |
| ● | with respect to clause (v) above, an affirmation that the Critical Tenant is actually paying all rents and other amounts under its lease; |
| ● | with respect to clause (vi) above, the Critical Tenant re-commencing its normal business operations or a Critical Tenant Space Re-tenanting Event (as defined below) having occurred; or |
| ● | with respect to clause (vii) above, each related Critical Tenant waiving all Co-Tenancy Rights or a Critical Tenant Space Re-tenanting Event having occurred. |
A “Co-Tenancy Right” means any right or remedy granted to any Critical Tenant pursuant to the related to the Critical Tenant Lease due to any co-tenancy provision within the lease, including any rent reductions or abatements, any other modification to the amount of frequency of rent payments due, any right to terminate the related Critical Tenant Lease, or any other modification rights affecting the related lease or the tenancy of such Critical Tenant arising under the co-tenancy provision.
A “Designated Tenant” means Forever 21, Guitar Center, Marshalls, Michaels, Ross, and TJ Maxx and any other tenant occupying the Critical Tenant space presently leased to a Designated Tenant.
THE INFORMATION IN THIS STRUCTURAL AND COLLATERAL TERM SHEET IS NOT COMPLETE AND MAY BE AMENDED PRIOR TO THE TIME OF SALE. THIS TERM SHEET IS NOT AN OFFER TO SELL THESE SECURITIES AND IT IS NOT A SOLICITATION OF AN OFFER TO BUY THESE SECURITIES IN ANY JURISDICTION WHERE THE OFFER OR SALE IS NOT PERMITTED.
136
ELLSWORTH PLACE
A “Critical Tenant Space Re-tenanting Event” will occur on the date that each of the following conditions has been satisfied: (i) the Critical Tenant space has been leased to one or more replacement tenants for a term of at least five years on terms that are acceptable to the lender; (ii) all tenant improvement costs, leasing commissions and other material costs and expenses relating to the re-letting of the space have been paid in full; and (iii) the replacement tenant(s) have been conducting normal business operations at the related Critical Tenant space as evidenced by the applicable estoppel certificate.
Property Management.The Ellsworth Place Property is managed by GBT Realty Corporation, an affiliate of the borrower sponsor.
Assumption.The borrower has the right to transfer the Ellsworth Place Property, provided that no event of default has occurred and is continuing and certain other conditions are satisfied, including (i) the lender’s reasonable determination that the proposed transferee and guarantor satisfy the lender’s credit review and underwriting standards, taking into consideration transferee experience, financial strength and general business standing; (ii) execution of a recourse guaranty and an environmental indemnity by an affiliate of the transferee; and (iii) if requested by the lender, rating agency confirmation from Fitch, DBRS and Moody’s that the transfer will not result in a downgrade, withdrawal or qualification of the respective ratings assigned to the Series 2018-C47 Certificates.
Partial Release.Not permitted.
Real Estate Substitution.Not permitted.
Subordinate and Mezzanine Indebtedness.Not permitted.
Ground Lease.None.
Terrorism Insurance.The Ellsworth Place Whole Loan documents require that the “all risk” insurance policy required to be maintained by the borrower provides coverage for terrorism in an amount equal to the full replacement cost of the Ellsworth Place Property, as well as business interruption insurance covering no less than the 18-month period following the occurrence of a casualty event, together with a 12-month extended period of indemnity.
THE INFORMATION IN THIS STRUCTURAL AND COLLATERAL TERM SHEET IS NOT COMPLETE AND MAY BE AMENDED PRIOR TO THE TIME OF SALE. THIS TERM SHEET IS NOT AN OFFER TO SELL THESE SECURITIES AND IT IS NOT A SOLICITATION OF AN OFFER TO BUY THESE SECURITIES IN ANY JURISDICTION WHERE THE OFFER OR SALE IS NOT PERMITTED.
137
| No. 11 – Triyar Portfolio II | |||||||
| Loan Information | Property Information | ||||||
| Mortgage Loan Seller: | Ladder Capital Finance LLC | Single Asset/Portfolio: | Portfolio | ||||
| Credit Assessment (DBRS/Fitch/Moody’s): | NR/NR/NR | Property Type: | Industrial | ||||
| Original Principal Balance: | $22,051,995 | Specific Property Type: | Warehouse | ||||
| Cut-off Date Balance: | $22,004,846 | Location(7): | Various | ||||
| % of Initial Pool Balance: | 2.3% | Size: | 818,802 SF | ||||
| Loan Purpose: | Acquisition | Cut-off Date Balance Per SF: | $26.87 | ||||
| Borrower Name(1): | Various | Year Built/Renovated(7): | Various | ||||
| Borrower Sponsor: | Bob Yari | Title Vesting: | Fee | ||||
| Mortgage Rate: | 5.2820% | Property Manager: | Self-managed | ||||
| Note Date: | July 25, 2018 | ||||||
| Anticipated Repayment Date: | NAP | 3rdMost Recent Occupancy (As of)(8): | NAV | ||||
| Maturity Date: | August 6, 2028 | 2ndMost Recent Occupancy (As of)(8): | NAV | ||||
| IO Period: | NAP | Most Recent Occupancy (As of)(8): | NAV | ||||
| Loan Term (Original): | 120 months | Current Occupancy (As of)(8): | 100.0% (Various) | ||||
| Seasoning: | 2 months | ||||||
| Amortization Term (Original): | 360 months | Underwriting and Financial Information: | |||||
| Loan Amortization Type: | Amortizing Balloon | ||||||
| Interest Accrual Method: | Actual/360 | 4thMost Recent NOI (As of)(9): | NAV | ||||
| Call Protection(2): | L(26),D(90),O(4) | 3rdMost Recent NOI (As of)(9): | NAV | ||||
| Lockbox Type: | Soft/Springing Cash Management | 2ndMost Recent NOI (As of)(9): | NAV | ||||
| Additional Debt: | None | Most Recent NOI (As of)(9): | NAV | ||||
| Additional Debt Type: | NAP | ||||||
| U/W Revenues: | $3,260,764 | ||||||
| U/W Expenses: | $804,210 | ||||||
| Escrows and Reserves: | U/W NOI: | $2,456,554 | |||||
| U/W NCF: | $2,210,914 | ||||||
| Type: | Initial | Monthly | Cap (If Any) | U/W NOI DSCR: | 1.68x | ||
| Taxes | $218,574 | $36,429 | NAP | U/W NCF DSCR: | 1.51x | ||
| Insurance | $90,964 | $9,096 | NAP | U/W NOI Debt Yield(5): | 12.1% | ||
| Replacement Reserves(3) | $0 | $6,823 | NAP | U/W NCF Debt Yield(5): | 10.9% | ||
| TI/LC Reserve(4) | $0 | $13,647 | $875,000 | As-Is Appraised Value: | $28,110,000 | ||
| Deferred Maintenance | $237,125 | $0 | NAP | As-Is Appraisal Valuation Date(7): | Various | ||
| Earnout Reserve(2)(5) | $1,750,000 | $0 | NAP | Cut-off Date LTV Ratio(5): | 72.1% | ||
| Other Reserves(6) | $208,327 | $0 | NAP | LTV Ratio at Maturity(5): | 58.9% | ||
| (1) | The borrower consists of four limited liability companies: 57-59 Borden Norwich Properties, LLC, 840 Boling Jackson Properties, LLC, Energy Kilgore Properties, LLC and Oglesby Ottawa Properties, LLC. |
| (2) | If the conditions for the disbursement of the Kerry Bio-Science Earnout Reserve (defined below) are not satisfied within twenty-four months after origination, then the lender shall apply the balance of the Kerry Bio-Science Earnout Reserve to pay the outstanding principal balance of the loan and borrower must pay the yield maintenance premium and any applicable interest shortfall in connection with such prepayment. |
| (3) | Upon completion of the Kerry Bio-Science expansion space, the monthly collection is expected to increase to $7,323. |
| (4) | At the time of a cash flow sweep triggered by certain events relating to a significant tenant (a “Significant Tenant Sweep”), if the TI/LC Reserve has reached the $875,000 cap, the TI/LC Reserve Cap will be increased to $1,100,000 and the lender may collect an additional amount of $37,500 per month until the TI/LC Reserve reaches $1,100,000; if the TI/LC Reserve is below $875,000 at the time of the Significant Tenant Sweep, the lender may collect a monthly amount equal to $1,100,000 less the amount in the TI/LC Reserve at the time of the Significant Tenant Sweep divided by six. In lieu of the foregoing additional monthly TI/LC collections during a Significant Tenant Sweep, the borrower may elect to post the equivalent cash or a letter of credit. |
| (5) | All LTVs and debt yields are calculated assuming the applicable loan amount less the $1,750,000 earnout reserve (the “Kerry Bio-Science Earnout Reserve”). The Kerry Bio-Science Earnout Reserve shall be released to the borrower upon satisfaction of the following conditions: (a) proof of complete construction of the 60,000 square foot expansion space (the “Kerry Expansion Space”) at the Norwich, NY property; (b) Kerry Bio-Science has fully accepted the Kerry Expansion Space and executed an expansion lease for 60,000 square feet at $4.25/SF NNN for a term of five (5) years; (c) no event of default or cash flow sweep under the loan has occurred and is continuing; and (d) the in-place debt metrics will be no worse than that at origination. The borrower sponsor executed a completion guaranty at origination to guarantee the completion of the Kerry Expansion Space. In the event the Kerry Expansion Space is not completed and the disbursement conditions are not satisfied within twenty-four months after origination, then the lender will apply the Kerry Bio-Science Earnout Reserve to pay the outstanding principal balance of the loan and borrower must pay the yield maintenance premium and any applicable interest shortfall in connection with such prepayment. Assuming the full earnout balance is not applied to the full loan amount of $22,051,995, the Cut-off Date LTV Ratio, LTV Ratio at Maturity, U/W NOI Debt Yield and U/W NCF Debt Yield are 78.3%, 65.1%, 11.2%, and 10.0%, respectively. |
| (6) | Other Reserves consist of the Oglesby Environmental Reserve ($150,000) and Office Depot Rent Reserve ($58,327). |
| (7) | See table below titled “Triyar Portfolio II Properties”. |
| (8) | See table below titled “Historical Occupancy”. |
| (9) | See table below titled “Cash Flow Analysis”. |
THE INFORMATION IN THIS STRUCTURAL AND COLLATERAL TERM SHEET IS NOT COMPLETE AND MAY BE AMENDED PRIOR TO THE TIME OF SALE. THIS TERM SHEET IS NOT AN OFFER TO SELL THESE SECURITIES AND IT IS NOT A SOLICITATION OF AN OFFER TO BUY THESE SECURITIES IN ANY JURISDICTION WHERE THE OFFER OR SALE IS NOT PERMITTED.
138
TRIYAR PORTFOLIO II
The Mortgage Loan. The Triyar Portfolio II mortgage loan (“Triyar Portfolio II Mortgage Loan”) is evidenced by a single promissory note that is secured by a first mortgage encumbering the fee interest in five industrial properties (the “Triyar Portfolio II Properties”) totaling 818,802 square feet located in Jackson, Mississippi (377,950 square feet; 46.2% of net rentable area), Kilgore, Texas (145,083 square feet; 17.7% of net rentable area), Norwich, New York (139,925 square feet; 17.1% of net rentable rea), Ottawa, Illinois (92,250 square feet; 11.3% of net rentable area), and Oglesby, Illinois (63,594 square feet; 7.8% of net rentable area).
The Triyar Portfolio II Mortgage Loan was originated on July 25, 2018 by Ladder Capital Finance LLC. The Triyar Portfolio II Mortgage Loan had an original principal balance of $22,051,995, has an outstanding principal balance as of the Cut-off Date of $22,004,846 and accrues interest at an interest rate of 5.2820%per annum. The Triyar Portfolio II Mortgage Loan had an initial term of 120 months, has a remaining term of 118 months as of the Cut-off Date and requires payments of principal and interest based on a 30-year amortization schedule. The Triyar Portfolio II Mortgage Loan matures on August 6, 2028.
Following the lockout period, the borrower has the right to defease the Triyar Portfolio II Mortgage Loan on any date before May 6, 2028. In addition, the Triyar Portfolio II Mortgage Loan is prepayable without penalty on or after May 6, 2028.
Sources and Uses
| Sources | Uses | |||||||
| Original loan amount | $22,051,995 | 74.1% | Purchase price | $26,857,000 | 90.3% | |||
| Sponsor’s new cash contribution | 7,706,436 | 25.9 | Reserves | 2,504,990 | 8.4 | |||
| Closing costs | 396,441 | 1.3 | ||||||
| Total Sources | $29,758,431 | 100.0% | Total Uses | $29,758,431 | 100.0% |
The Properties. The Triyar Portfolio II properties are comprised of five industrial buildings located in Jackson, Mississippi, Kilgore, Texas, Norwich, New York, Ottawa, Illinois and Oglesby, Illinois.
The Jackson, Mississippi property is a multi-tenanted warehouse building comprised of 377,950 square feet of rentable area. The property is 100.0% leased and serves as a warehouse and distribution facility for Office Depot and Sanhua. Office Depot currently operates 40 distribution facilities throughout the United States. Sanhua uses the property as a distribution and testing facility for their HVAC products. The Jackson, Mississippi property is located in the North Jackson industrial submarket. According to the appraisal, as of the first quarter of 2018, the average rental rate for the North Jackson industrial submarket is $5.27 per square foot, which is approximately 88.2% higher than the Jackson, Mississippi property rent of $2.80 per square foot, and the North Jackson industrial submarket’s vacancy rate is 4.4%.
The Kilgore, Texas property is a single tenant warehouse building comprised of 145,083 square feet of rentable area. The property is currently 100.0% leased to Closure Systems. Closure Systems distributes plastic caps to Coca-Cola and Tropicana. It is estimated that Closure Systems will produce 90 billion caps in 2018; 11 billion of which will be produced at the property. The Kilgore, Texas property is located in the Gregg County industrial submarket. According to a third party report, as of June 2018, the average rental rate for the Gregg County industrial submarket is $4.11 per square foot, which is approximately 24.3% lower than the Kilgore, Texas property rent of $5.43 per square foot, and the Gregg County industrial submarket’s vacancy rate is 7.5%.
The Norwich, New York property is a multi-tenanted warehouse building comprised of 139,925 square feet of net rentable area. The property is currently 100.0% leased to Kerry Bio-Science, Southern Tier Pet Nutrition, CZ USA Inc. and Sun Printing. Kerry Bio-Science occupies 70,000 square feet of the property, which the tenant uses for storage and distribution of products manufactured at their plant located 1.3 miles north of the Norwich, New York property. The Norwich, New York property is located within the Binghamton warehouse submarket. According to the appraisal, as of the first quarter of 2018, the average rental rate for the Binghamton warehouse submarket is $5.72 per square foot, which is approximately 66.8% higher than the Norwich, New York property rent of $3.43 per square foot, and the Binghamton warehouse submarket’s vacancy rate is 4.8%.
The Ottawa, Illinois property is a single tenant warehouse building comprised of 92,250 square feet of net rentable area. The property is currently 100.0% leased to Clover Technologies Group (“CTG”). The property serves as the main global facility for Clover Imaging, a subsidiary of CTG, which acts as a hub for Clover Imaging primary business including marketing, finance, accounting, product testing, and creation. The Ottawa, Illinois property is located in the Ottawa-Peru industrial submarket. According to a third party report, as of June 2018, the average rental rate for Ottawa-Peru’s industrial submarket is $4.36 compared to the Ottawa, Illinois property rent of $2.73 per square foot, and the Ottawa-Peru’s industrial submarket’s vacancy rate is 4.0%.
The Oglesby, Illinois property is a single tenant warehouse property comprised of 63,594 square feet of net rentable area. The property is 100.0% leased to CTG. The Oglesby, Illinois property serves as the tenant’s primary collection and distribution warehouse for the central region of the United States. The Oglesby, Illinois property is located in the Ottawa-Peru industrial submarket. According to a third party report, as of June 2018 the average rental rate for Ottawa-Peru’s industrial submarket was $4.36, compared to Oglesby Illinois property rent of $2.36 per square foot. The Ottawa-Peru’s industrial submarket’s vacancy rate is 4.0%.
THE INFORMATION IN THIS STRUCTURAL AND COLLATERAL TERM SHEET IS NOT COMPLETE AND MAY BE AMENDED PRIOR TO THE TIME OF SALE. THIS TERM SHEET IS NOT AN OFFER TO SELL THESE SECURITIES AND IT IS NOT A SOLICITATION OF AN OFFER TO BUY THESE SECURITIES IN ANY JURISDICTION WHERE THE OFFER OR SALE IS NOT PERMITTED.
139
TRIYAR PORTFOLIO II
The following table presents certain information relating to the Triyar Portfolio II Properties:
Triyar Portfolio II Properties
| Property Name | City, State | Allocated Cut-Off Date Balance(1) | % of Portfolio Cut-Off Date Balance | Occupancy(2) | Year Built/Renovated | Net rentable area | Appraised Value | Allocated LTV(1) |
| Jackson | Jackson, MS | $8,813,611 | 40.1% | 100.0% | 1975/2007 | 377,950 | $11,500,000 | 72.1% |
| Kilgore | Kilgore, TX | $5,797,578 | 26.3% | 100.0% | 2006/NAP | 145,083 | $8,300,000 | 72.1% |
| Norwich | Norwich, NY | $4,325,233 | 19.7% | 100.0% | 1959/2012 | 139,925 | $4,000,000 | 72.1% |
| Ottawa | Ottawa, IL | $1,920,884 | 8.7% | 100.0% | 1983/NAP | 92,250 | $2,610,000 | 72.1% |
| Oglesby | Oglesby, IL | $1,147,541 | 5.2% | 100.0% | 1986/NAP | 63,594 | $1,700,000 | 72.1% |
| Total/Weighted Average | $22,004,846 | 100.0% | 100.0% | 818,802 | $28,110,000 | 72.1% |
| (1) | The Allocated LTV shown is the Cut-off Date LTV Ratio for the Triyar Portfolio II Mortgage Loan, which reflects the $1,750,000 earnout reserve subtracted from the Total Allocated Cut-off Date Balance for such Mortgage Loan. The Triyar Portfolio II Mortgaged Properties are crossed with no releases. |
| (2) | Information obtained from the underwritten rent roll dated July 1, 2018. The Jackson property and Norwich property are each 100.0% occupied by multiple tenants as of July 1, 2018. The Kilgore property, Ottawa property, and Oglesby property are each 100.0% occupied by a single tenant as of October 1, 2018. |
The following table presents certain information relating to the tenancies at the Triyar Portfolio II Properties:
Major Tenants(1)
| Tenant Name | Credit Rating (Fitch/Moody’s/ S&P)(2) | Tenant NRSF | % of NRSF | Annual U/W Base Rent PSF(3) | Annual U/W Base Rent(3) | % of Total Annual U/W Base Rent | Lease Expiration Date |
| Major Tenants | |||||||
| Office Depot | NR/B1/B | 194,168 | 23.7% | $3.60 | $699,922 | 25.6% | 5/31/2023 |
| Sanhua | NR/NR/NR | 183,782 | 22.4% | $1.96 | $360,000 | 13.2% | 11/30/2019 |
| Clover Technologies | NR/NR/NR | 155,844 | 19.0% | $2.58 | $402,000 | 14.7% | 5/31/2023 |
| Closure Systems | NR/NR/NR | 145,083 | 17.7% | $5.43 | $787,200 | 28.8% | 7/31/2021 |
| Kerry Bio-Science | NR/Baa2/BBB+ | 70,000 | 8.5% | $3.30 | $231,000 | 8.5% | 12/31/2022 |
| Total Major Tenants | 748,877 | 91.5% | $3.31 | $2,480,122 | 90.9% | ||
| Non-Major Tenants | 69,925 | 8.5% | $3.56 | $249,267 | 9.1% | ||
| Occupied Collateral Total | 818,802 | 100.0% | $3.33 | $2,729,389 | 100.0% | ||
| Vacant Space | 0 | 0.0% | |||||
| Collateral Total | 818,802 | 100.0% | |||||
| (1) | Information is based on the underwritten rent roll. |
| (2) | Certain ratings are those of the parent company whether or not the parent guarantees the lease. |
| (3) | Annual U/W Base Rent PSF and Annual U/W Base Rent include rent escalations through February 1, 2019. |
THE INFORMATION IN THIS STRUCTURAL AND COLLATERAL TERM SHEET IS NOT COMPLETE AND MAY BE AMENDED PRIOR TO THE TIME OF SALE. THIS TERM SHEET IS NOT AN OFFER TO SELL THESE SECURITIES AND IT IS NOT A SOLICITATION OF AN OFFER TO BUY THESE SECURITIES IN ANY JURISDICTION WHERE THE OFFER OR SALE IS NOT PERMITTED.
140
TRIYAR PORTFOLIO II
The following table presents certain information relating to the lease rollover schedule at the Triyar Portfolio II Properties:
Lease Expiration Schedule(1)(2)
| Year Ending December 31, | No. of Leases Expiring | Expiring NRSF | % of Total NRSF | Cumulative Expiring NRSF | Cumulative % of Total NRSF | Annual U/W Base Rent(3) | % of Total Annual U/W Base Rent | Annual U/W Base Rent PSF(3) |
| MTM | 0 | 0 | 0.0% | 0 | 0.0% | $0 | 0.0% | $0.00 |
| 2018 | 0 | 0 | 0.0% | 0 | 0.0% | $0 | 0.0% | $0.00 |
| 2019 | 3 | 210,182 | 25.7% | 210,182 | 25.7% | $456,360 | 16.7% | $2.17 |
| 2020 | 0 | 0 | 0.0% | 210,182 | 25.7% | $0 | 0.0% | $0.00 |
| 2021 | 1 | 145,083 | 17.7% | 355,265 | 43.4% | $787,200 | 28.8% | $5.43 |
| 2022 | 1 | 70,000 | 8.5% | 425,265 | 51.9% | $231,000 | 8.5% | $3.30 |
| 2023 | 4 | 350,012 | 42.7% | 775,277 | 94.7% | $1,101,922 | 40.4% | $3.15 |
| 2024 | 0 | 0 | 0.0% | 775,277 | 94.7% | $0 | 0.0% | $0.00 |
| 2025 | 3 | 43,525 | 5.3% | 818,802 | 100.0% | $152,907 | 5.6% | $3.51 |
| 2026 | 0 | 0 | 0.0% | 818,802 | 100.0% | $0 | 0.0% | $0.00 |
| 2027 | 0 | 0 | 0.0% | 818,802 | 100.0% | $0 | 0.0% | $0.00 |
| 2028 | 0 | 0 | 0.0% | 818,802 | 100.0% | $0 | 0.0% | $0.00 |
| 2029 & Beyond | 0 | 0 | 0.0% | 818,802 | 100.0% | $0 | 0.0% | $0.00 |
| Vacant | 0 | 0 | 0.0% | 818,802 | 100.0% | $0 | 0.0% | $0.00 |
| Total/Weighted Average | 12 | 818,802 | 100.0% | $2,729,389 | 100.0% | $3.33 |
| (1) | Information obtained from the underwritten rent roll. |
| (2) | Certain tenants have lease termination options that are exercisable prior to the originally stated expiration date of the subject lease and which are not reflected in the Lease Expiration Schedule. |
| (3) | Annual U/W Base Rent and Annual U/W Base Rent PSF include rent escalations through February 1, 2019. |
The following table presents historical occupancy percentages at the Triyar Portfolio II Properties:
Historical Occupancy
12/31/2014(1) | 12/31/2015(1) | 12/31/2016(1) | 12/31/2017(1) | Various(2) |
| NAV | NAV | NAV | NAV | 100.0% |
| (1) | Historical occupancy is unavailable prior to 2018 as the properties were acquired in five separate transactions. All the properties are triple net leased. |
| (2) | Information obtained from the underwritten rent roll. The dates range from July 1, 2018 to October 1, 2018. |
Operating History and Underwritten Net Cash Flow.The following table presents certain information relating to the historical operating performance and the underwritten net cash flow at the Triyar Portfolio II Properties:
Cash Flow Analysis
| U/W | % of U/W Effective Gross Income | U/W $ per SF | |||||||
| Base Rent | $2,729,389(1) | 83.7 | % | $3.33 | |||||
| Grossed Up Vacant Space | 0 | 0.0 | 0.00 | ||||||
| Total Reimbursables | 702,994 | 21.6 | 0.86 | ||||||
| Other Income | 0 | 0.0 | 0.00 | ||||||
| Less Vacancy & Credit Loss | (171,619)(2) | (5.3 | ) | (0.21 | ) | ||||
| Effective Gross Income | $3,260,764 | 100.0 | % | $3.98 | |||||
| Total Operating Expenses | 804,210 | 24.7 | 0.98 | ||||||
| Net Operating Income | $2,456,554 | 75.3 | % | $3.00 | |||||
| TI/LC | 163,760 | 5.0 | 0.20 | ||||||
| Capital Expenditures | 81,880 | 2.5 | 0.10 | ||||||
| Net Cash Flow | $2,210,914 | 67.8 | % | $2.70 | |||||
| NOI DSCR | 1.68x | ||||||||
| NCF DSCR | 1.51x | ||||||||
| NOI DY(3) | 12.1% | ||||||||
| NCF DY(3) | 10.9% | ||||||||
| (1) | U/W Base Rent PSF and U/W Base Rent include contractual rent steps through February 2019, totaling $4,856. |
| (2) | The underwritten economic vacancy is 5.0%. As of July 1, 2018, the Triyar Portfolio II Properties were 100.0% physically occupied. The historical financial information is unavailable prior to 2018 as the properties were acquired in five separate transactions. All the properties are triple net leased. |
| (3) | Debt yields are calculated assuming the loan amount less a $1,750,000 Kerry Bio-Science Earnout Reserve. |
THE INFORMATION IN THIS STRUCTURAL AND COLLATERAL TERM SHEET IS NOT COMPLETE AND MAY BE AMENDED PRIOR TO THE TIME OF SALE. THIS TERM SHEET IS NOT AN OFFER TO SELL THESE SECURITIES AND IT IS NOT A SOLICITATION OF AN OFFER TO BUY THESE SECURITIES IN ANY JURISDICTION WHERE THE OFFER OR SALE IS NOT PERMITTED.
141
| No. 12 – Indian Hills Senior Community | ||||||||
| Loan Information | Property Information | |||||||
| Mortgage Loan Seller: | Ladder Capital Finance LLC | Single Asset/Portfolio: | Single Asset | |||||
| Credit Assessment (DBRS/Fitch/Moody’s): | NR/NR/NR | Property Type: | Multifamily | |||||
| Original Principal Balance(1): | $22,000,000 | Specific Property Type: | High Rise | |||||
| Cut-off Date Balance(1): | $22,000,000 | Location: | Euclid, OH | |||||
| % of Initial Pool Balance: | 2.3% | Size: | 1,572 Units | |||||
| Loan Purpose: | Refinance | Cut-off Date Balance Per Unit(1): | 32,665 | |||||
| Borrower Name: | Euclid Indian Hills, LLC | Year Built/Renovated: | 1964/2006 | |||||
| Borrower Sponsor: | Michael E. Gibbons | Title Vesting: | Fee | |||||
| Mortgage Rate: | 5.1300% | Property Manager: | Self-managed | |||||
| Note Date: | August 16, 2018 | 4thMost Recent Occupancy(3): | 83.3% (12/31/2015) | |||||
| Anticipated Repayment Date: | NAP | 3rdMost Recent Occupancy(3): | 85.5% (12/31/2016) | |||||
| Maturity Date: | September 6, 2028 | 2ndMost Recent Occupancy(3): | 88.8% (12/31/2017) | |||||
| IO Period: | 60 months | Most Recent Occupancy (As of)(3): | 89.4% (6/30/2018) | |||||
| Loan Term (Original): | 120 months | Current Occupancy (As of)(3): | 93.1% (8/2/2018) | |||||
| Seasoning: | 1 month | |||||||
| Amortization Term (Original): | 360 months | Underwriting and Financial Information: | ||||||
| Loan Amortization Type: | Interest-only, Amortizing Balloon | |||||||
| Interest Accrual Method: | Actual/360 | 4thMost Recent NOI (As of)(4): | NAV | |||||
| Call Protection(2): | L(25),D(90),O(5) | 3rdMost Recent NOI (As of)(4): | $3,288,284 (12/31/2016) | |||||
| Lockbox Type: | Springing | 2ndMost Recent NOI (As of)(4): | $4,148,691 (12/31/2017) | |||||
| Additional Debt(1): | Yes | Most Recent NOI (As of)(4): | $4,288,180 (TTM 6/30/2018) | |||||
| Additional Debt Type(1): | Pari Passu | |||||||
| U/W Revenues: | $10,566,417 | |||||||
| U/W Expenses: | $5,944,870 | |||||||
| U/W NOI: | $4,621,547 | |||||||
| U/W NCF: | $4,228,547 | |||||||
| U/W NOI DSCR(1): | 1.38x | |||||||
| U/W NCF DSCR(1): | 1.26x | |||||||
| Escrows and Reserves: | U/W NOI Debt Yield(1): | 9.0% | ||||||
| U/W NCF Debt Yield(1): | 8.2% | |||||||
| Type: | Initial | Monthly | Cap (If Any) | As-Is Appraised Value: | $80,000,000 | |||
| Taxes | $497,268 | $124,317 | NAP | As-Is Appraisal Valuation Date: | June 1, 2018 | |||
| Insurance | $234,079 | $18,006 | NAP | Cut-off Date LTV Ratio(1): | 64.2% | |||
| Replacement Reserves | $0 | $32,750 | NAP | LTV Ratio at Maturity or ARD(1): | 59.3% | |||
| Deferred Maintenance | $449,381 | $0 | NAP | |||||
| (1) | The Indian Hills Senior Community Whole Loan totaling $51,350,000 is comprised of threepari passu notes (Notes A-1, A-2, A-3). The controlling Note A-1 and non-controlling Note A-3 had an aggregate original principal balance of $29,350,000, have an aggregate outstanding principal balance of $29,350,000 as of the Cut-off Date and are currently held by Ladder Capital Finance LLC. The non-controlling Note A-2 had an original principal balance of $22,000,000 and is being contributed to the WFCM 2018-C47 Securitization Trust. All statistical information related to loan-to-value ratios, debt service coverage ratios, debt yields and balance per unit are based on the Indian Hills Senior Community Whole Loan (as defined below). See “Description of the Mortgage Pool-The Whole Loans” – The Serviced Pari Passu Whole Loans” and “- The Non-Serviced Pari Passu Whole Loans”in the Preliminary Prospectus. |
| (2) | Defeasance of the Indian Hills Senior Community Whole Loan is permitted at any time after the earlier of (i) August 16, 2021 and (ii) two years from the closing date of the securitization that includes the lastpari passu note of the Indian Hills Senior Community Whole Loan (as defined below) to be securitized. The assumed lockout period of 25 payments is based on the closing date of this transaction in October 2018. |
| (3) | See “Historical Occupancy” table below. |
| (4) | See “Cash Flow Analysis” table below. |
The Mortgage Loan. The mortgage loan (the “Indian Hills Senior Community Mortgage Loan”) is part of a whole loan (the “Indian Hills Senior Community Whole Loan”) that is evidenced by threepari passu promissory notes (Notes A-1, A-2 and A-3) and secured by a first mortgage encumbering a 1,572 unit multifamily property located in Euclid, Ohio (the “Indian Hills Senior Community Property”). The Indian Hills Senior Community Whole Loan was originated on August 16, 2018 by Ladder Capital Finance LLC (“LCF”). The Indian Hills Senior Community Whole Loan had an original principal balance of $51,350,000 has an outstanding principal balance as of the Cut-off Date of $51,350,000 and accrues interest at a rate of 5.130%per annum.The Indian Hills Senior Housing Whole Loan had an initial term of 120 months, has a remaining term of 119 months as of the Cut-off Date and requires interest-only payments for the first 60 payments following origination and thereafter, requires payments of principal and interest based on a 30-year amortization schedule. The Indian Hills Senior Community Whole Loan matures on September 6, 2028.
The Indian Hills Senior Community Mortgage Loan is evidenced by the non-controlling Note A-2, which had an original principal balance of $22,000,000 and has an outstanding principal balance as of the Cut-off Date of $22,000,000. The controlling Note A-1 and non-controlling Note A-3, which had an aggregate original principal balance of $29,350,000, are expected to be contributed to one or more future securitizations. The lender provides no assurances that the notes will not be split further. The Indian Hills Senior Community
THE INFORMATION IN THIS STRUCTURAL AND COLLATERAL TERM SHEET IS NOT COMPLETE AND MAY BE AMENDED PRIOR TO THE TIME OF SALE. THIS TERM SHEET IS NOT AN OFFER TO SELL THESE SECURITIES AND IT IS NOT A SOLICITATION OF AN OFFER TO BUY THESE SECURITIES IN ANY JURISDICTION WHERE THE OFFER OR SALE IS NOT PERMITTED.
142
INDIAN HILLS SENIOR COMMUNITY
Whole Loan will initially be serviced under the WFCM 2018-C47 pooling and servicing agreement; however, upon securitization of Note A-1, such whole loan will be serviced under the pooling and servicing agreement for the securitization that includes Note A-1. See “Description of the Mortgage Pool—The Whole Loans—The Serviced Pari Passu Whole Loans” and “—The Non-Serviced Pari Passu Whole Loans”in the Preliminary Prospectus.
Note Summary
| Notes | Original Balance | Note Holder | Controlling Interest |
| A-1 | $18,350,000 | LCF or an affiliate | Yes |
| A-2 | $22,000,000 | WFCM 2018-C47 | No |
| A-3 | $11,000,000 | LCF or an affiliate | No |
| Total | $51,350,000 |
Following the lockout period, the borrower has the right to defease the Indian Hills Senior Community Whole Loan on any date before May 6, 2028. In addition, the Indian Hills Senior Community Whole Loan is prepayable without penalty on or after May 6, 2028.
Sources and Uses
| Sources | Uses | |||||||
| Original whole loan amount | $51,350,000 | 100.0% | Existing debt | $42,027,674 | 81.8% | |||
| Reserves | 1,180,728 | 2.3 | ||||||
| Closing costs | 764,888 | 1.5 | ||||||
| Return of equity | 7,376,710 | 14.4 | ||||||
| Total Sources | $51,350,000 | 100.0% | Total Uses | $51,350,000 | 100.0% |
The Property. The Indian Hills Senior Community Property consists of a 1,572 unit high-rise apartment community situated on a 29.1 acre site. Built in 1964 and renovated in 2006, the Indian Hills Senior Community Property is located approximately 8.8 miles northeast of downtown Cleveland and provides housing for adults that are 55 years old or older. Adjacent to the Indian Hills Senior Community Property is the Euclid Adult Activities Center, which hosts daily exercise classes and creative events and activities. The Indian Hills Senior Community Property is also adjacent to the Willows Health and Rehab Center, which offers extensive rehabilitation and recovery services along with long-term care and skilled nursing.
Amenities at the Indian Hills Senior Community Property include a party room in each building, an indoor pool, a clubhouse, a movie theater and a fitness center. Unit amenities include fully-equipped kitchens, each including a refrigerator, a stove-range and a microwave. The Indian Hills Senior Community Property features 800 open parking spaces and 774 garage parking spaces, resulting in a parking ratio of 1.0 spaces per unit. The Indian Hills Senior Community Property offers a shuttle service to the Euclid Senior Center located 4.5 miles from the Indian Hills Senior Community Property. The Euclid Senior Center offers health and fitness classes, crafts, recreational activities, planned trips and many other activities. According to the appraisal, the 2017 estimated population within a one-, three- and five-mile radius of the Indian Hills Senior Community Property is 12,410, 102,732 and 249,821, respectively, and the 2017 estimated average household income within the same radii is $38,022, $48,887 and $59,286, respectively. More specifically, according to the appraisal the estimated population within a one-, three- and five-mile radius for ages 65 and older has grown 6.1%, 4.4% and 4.4%, respectively, from 2010 to 2017 and is projected to grow 11.8%, 9.6% and 9.9%, respectively, from 2017 to 2022, respectively.
According to the appraisal, as of the fourth quarter of 2017, the Euclid, Ohio submarket reported a vacancy of 3.4%, which is 3.5% lower than the 6.9% vacancy for Indian Hills Senior Community Property, and a market rent of $693 per unit, which is approximately 22% higher than the average monthly rent at Indian Hills Senior Community Property of $568 per unit. Section 8 tenants at the Indian Hills Senior Community Property occupy 550 units at an average rent of $555 per unit. The borrower has received approval to increase the Section 8 units to a weighted average rent of approximately $614 per unit. As of August 2, 2018, the Indian Hills Senior Community Property was 93.1% occupied.
The following table presents certain information relating to the unit mix of the Indian Hills Senior Community Property:
Apartment Unit Summary(1)
| Unit Type | No. of Units | % of Total Units | Average Unit Size (SF) | Average Monthly Rent per Unit |
| Studio – A | 77 | 4.9% | 380 | $452 |
| Studio – B | 9 | 0.6% | 380 | $466 |
| One Bedroom / 1.0 Bath – A | 885 | 56.3% | 585 | $539 |
| One Bedroom / 1.0 Bath – B | 151 | 9.6% | 585 | $595 |
| Two Bedroom / 1.0 Bath – A | 100 | 6.4% | 799 | $622 |
| Two Bedroom / 1.0 Bath – B | 179 | 11.4% | 793 | $631 |
| Two Bedroom / 1.5 Bath – A | 170 | 10.8% | 868 | $648 |
| Two Bedroom / 1.5 Bath - B | 1 | 0.1% | 868 | $644 |
| Total/Weighted Average | 1,572 | 100.0% | 643 | $568 |
| (1) | Information obtained from the borrower rent roll as of August 2, 2018. There are an additional two commercial units. |
THE INFORMATION IN THIS STRUCTURAL AND COLLATERAL TERM SHEET IS NOT COMPLETE AND MAY BE AMENDED PRIOR TO THE TIME OF SALE. THIS TERM SHEET IS NOT AN OFFER TO SELL THESE SECURITIES AND IT IS NOT A SOLICITATION OF AN OFFER TO BUY THESE SECURITIES IN ANY JURISDICTION WHERE THE OFFER OR SALE IS NOT PERMITTED.
143
INDIAN HILLS SENIOR COMMUNITY
The following table presents historical occupancy percentages at the Indian Hills Senior Community Property:
Historical Occupancy
12/31/2015(1)(2) | 12/31/2016(1) | 12/31/2017(1) | 6/30/2018(1) | 8/2/2018(3) |
| 83.3% | 85.5% | 88.8% | 89.4% | 93.1% |
| (1) | Information obtained from the borrower. |
| (2) | Reflects occupancy as of December 31, 2015. Does not reflect full year. |
| (3) | Information obtained from the borrower rent roll. |
Operating History and Underwritten Net Cash Flow.The following table presents certain information relating to the historical operating performance and underwritten net cash flow at the Indian Hills Senior Community Property:
Cash Flow Analysis
| 12/31/2016 | 12/31/2017 | TTM 6/30/2018 | U/W | % of U/W Effective Gross Income | U/W $ per Unit | |
| Base Rent | $8,706,392 | $9,365,553 | $9,598,859 | $9,862,438 | 93.3% | $6,274 |
| Grossed Up Vacant Space | 1,654,925 | 1,086,997 | 921,588 | 720,643 | 6.8 | 458 |
| Concessions | 0 | 0 | 0 | 0 | 0.0 | 0 |
| Other Income(1) | 602,098 | 661,383 | 691,172 | 703,979 | 6.7 | 448 |
| Less Vacancy & Credit Loss | (1,654,925) | (1,086,997) | (921,588) | (720,643)(2) | (6.8) | (458) |
| Effective Gross Income | $9,308,490 | $10,026,936 | $10,290,031 | $10,566,417 | 100.0% | $6,722 |
| Total Operating Expenses | $6,020,206 | $5,878,245 | $6,001,851 | $5,944,870 | 56.3% | $3,782 |
|
|
|
|
|
| |
| Net Operating Income(3) | $3,288,284 | $4,148,691 | $4,288,180 | $4,621,547 | 43.7% | $2,940 |
| Capital Expenditures | 0 | 0 | 0 | 393,000 | 3.7 | 250 |
| Net Cash Flow | $3,288,284 | $4,148,691 | $4,288,180 | $4,228,547 | 40.0% | $2,690 |
| NOI DSCR(4) | 0.98x | 1.24x | 1.28x | 1.38x | ||
| NCF DSCR(4) | 0.98x | 1.24x | 1.28x | 1.26x | ||
| NOI DY(4) | 6.4% | 8.1% | 8.4% | 9.0% | ||
| NCF DY(4) | 6.4% | 8.1% | 8.4% | 8.2% |
| (1) | Other Income consists of cable income, pet fees, laundry income and additional fees. |
| (2) | The underwritten economic vacancy is 6.8%. The Indian Hills Senior Community Property was 93.1% physically occupied as of August 2, 2018. |
| (3) | The Indian Hills Senior Community Property was acquired by the sponsor in 2015. The property was 83.3% occupied at the time of purchase with over 100 units not rentable. Since acquiring the property, the sponsor has invested a total of $3,681,697 in capital improvements. All 100 unrentable units were brought back online to rent and, total of 340 units were gut renovated and rented at a premium to other units. Since acquisition, the property has shown increasing occupancy with an increase in occupancy from 85.5% in 2016 to 88.8% in 2017. Capital improvements have also improved rents per unit from $495 in 2016 to $532 in 2017. |
| (4) | DSCRs and DYs are based on the Indian Hills Senior Community Whole Loan. |
Competitive Set(1)
| Property Name | Location | Distance to Subject (miles) | Property Type | Number of Units | Avg. Monthly Rent Per Unit | Total Occupancy |
| Indian Hills Senior Community (Subject) | Euclid, OH | -- | High Rise | 1,572 | $568 | 93.1% |
| Dorchester Village | Richmond Heights, OH | 3.3 | Mid Rise | 474 | $672 | 98.3% |
| Bishop Park Apartments | Wickliffe, OH | 3.8 | High Rise | 615 | $768 | 98.7% |
| Water’s Edge | Euclid, OH | 4.1 | High Rise | 426 | $682 | 94.0% |
| Harbor Crest | Euclid, OH | 4.2 | Mid Rise | 738 | $714 | 97.1% |
| (1) | Information obtained from the appraisal and the borrower rent roll. |
THE INFORMATION IN THIS STRUCTURAL AND COLLATERAL TERM SHEET IS NOT COMPLETE AND MAY BE AMENDED PRIOR TO THE TIME OF SALE. THIS TERM SHEET IS NOT AN OFFER TO SELL THESE SECURITIES AND IT IS NOT A SOLICITATION OF AN OFFER TO BUY THESE SECURITIES IN ANY JURISDICTION WHERE THE OFFER OR SALE IS NOT PERMITTED.
144
(THIS PAGE INTENTIONALLY LEFT BLANK)
THE INFORMATION IN THIS STRUCTURAL AND COLLATERAL TERM SHEET IS NOT COMPLETE AND MAY BE AMENDED PRIOR TO THE TIME OF SALE. THIS TERM SHEET IS NOT AN OFFER TO SELL THESE SECURITIES AND IT IS NOT A SOLICITATION OF AN OFFER TO BUY THESE SECURITIES IN ANY JURISDICTION WHERE THE OFFER OR SALE IS NOT PERMITTED.
145
| No. 13 – Boca Village Corporate Center | |||||||
| Loan Information | Property Information | ||||||
| Mortgage Loan Seller: | Barclays Bank PLC | Single Asset/Portfolio: | Single Asset | ||||
| Credit Assessment (DBRS/Fitch/Moody’s): | NR/NR/NR | Property Type: | Office | ||||
| Original Principal Balance: | $20,260,000 | Specific Property Type: | Suburban | ||||
| Cut-off Date Balance: | $20,260,000 | Location: | Boca Raton, FL | ||||
| % of Initial Pool Balance: | 2.1% | Size: | 108,616 SF | ||||
| Loan Purpose: | Refinance | Cut-off Date Balance Per SF: | $186.53 | ||||
| Borrower: | BVCC Corp. | Year Built/Renovated: | 2008/NAP | ||||
| Borrower Sponsor: | AGS Properties Corporation | Title Vesting: | Fee | ||||
| Mortgage Rate: | 4.3600% | Property Manager: | Squone Real Estate Services, Inc. | ||||
| Note Date: | September 7, 2018 | 4thMost Recent Occupancy(6): | NAV | ||||
| Anticipated Repayment Date: | NAP | 3rdMost Recent Occupancy(6): | NAV | ||||
| Maturity Date: | October 1, 2028 | 2ndMost Recent Occupancy(6): | 81.5% (12/31/2016) | ||||
| IO Period: | 120 months | Most Recent Occupancy (As of)(6)(7): | 80.3% (12/31/2017) | ||||
| Loan Term (Original): | 120 months | Current Occupancy (As of)(6)(7): | 90.3% (9/4/2018) | ||||
| Seasoning: | 0 months | ||||||
| Amortization Term (Original): | NAP | Underwriting and Financial Information: | |||||
| Loan Amortization Type: | Interest-only, Balloon | ||||||
| Interest Accrual Method: | Actual/360 | 4thMost Recent NOI: | $2,509,462 (12/31/2015) | ||||
| Call Protection: | L(24),D(89),O(7) | 3rdMost Recent NOI: | $1,937,657 (12/31/2016) | ||||
| Lockbox Type: | Springing | 2ndMost Recent NOI: | $2,362,478 (12/31/2017) | ||||
| Additional Debt: | None | Most Recent NOI: | $2,591,718 (TTM 7/31/2018) | ||||
| Additional Debt Type: | NAP | ||||||
| U/W Revenues: | $3,931,868 | ||||||
| U/W Expenses: | $1,371,465 | ||||||
| Escrows and Reserves: | U/W NOI: | $2,560,402 | |||||
| U/W NCF: | $2,458,558 | ||||||
| Type: | Initial | Monthly | Cap (If Any) | U/W NOI DSCR: | 2.86x | ||
| Taxes(1) | $0 | Springing | NAP | U/W NCF DSCR: | 2.75x | ||
| Insurance(2) | $0 | Springing | NAP | U/W NOI Debt Yield: | 12.6% | ||
| Replacement Reserves(3) | $0 | Springing | NAP | U/W NCF Debt Yield: | 12.1% | ||
| TI/LC Reserve(4) | $735,000 | Springing | NAP | As-Is Appraised Value: | $40,400,000 | ||
| Outstanding TI Reserve | $179,750 | $0 | NAP | As-Is Appraisal Valuation Date: | August 1, 2018 | ||
| Free Rent Reserve | $310,425 | $0 | NAP | Cut-off Date LTV Ratio: | 50.1% | ||
| Condominium Assessments Reserve(5) | $47,745 | Springing | NAP | LTV Ratio at Maturity or ARD: | 50.1% | ||
| (1) | Ongoing monthly reserves for taxes equal to 1/12th of the annual taxes will be required upon the earlier to occur of (i) an event of default or (ii) the last day of any two consecutive calendar quarters for which the debt service coverage ratio is less than 1.35x. |
| (2) | Ongoing monthly insurance reserves will not be required so long a blanket or umbrella policy acceptable to the lender is maintained. |
| (3) | Commencing upon the earlier to occur of (i) an event of default or (ii) the last day of any two consecutive calendar quarters for which the debt service coverage ratio is less than 1.35x, ongoing monthly replacement reserves are required on each payment date in the amount of $1,810 ($0.20 per square foot annually). |
| (4) | In the event that the TI/LC reserve balance falls below $435,000, the borrower is required to begin depositing a monthly amount of $9,051 ($1.00 per square foot annually) into a rollover reserve account until the cap of $435,000 is reached. |
| (5) | At such time that the lender determines that the Condominium Assessments Reserve is not sufficient to cover twelve months of condominium assessments, monthly payments will be required so as to make the balance in the account sufficient to cover twelve months of assessments. |
| (6) | Please see historical occupancy table. The borrower did not provide historical occupancy for 2014 and 2015. |
| (7) | The increase in occupancy from 2017 to the current occupancy is attributable to Geo Corrections Holdings, Inc. executing a ten-year lease on January 1, 2018 for 24,914 square feet of the Boca Village Corporate Center Property (as defined below). |
The mortgage loan is evidenced by a single promissory note secured by the fee interest in a seven-story, Class-A suburban office building located in Boca Raton, Florida (the “Boca Village Corporate Center Property”). The Boca Village Corporate Center Property was built in 2008, consists of 108,616 square feet, is LEED Silver certified and is situated on an 8.2-acre site. The largest tenants at the Boca Village Corporate Center Property include Oppenheimer & Co. Inc., Geo Corrections Holdings, Inc. and Morgan Stanley Smith Barney. The Boca Village Corporate Center Property contains 440 parking spaces, inclusive of 241 spaces in a parking garage, resulting in a parking ratio of 4.1 spaces per 1,000 square feet of rentable area. As of September 4, 2018, the Boca Village Corporate Center Property was 90.3% occupied by seven tenants (including one antenna tenant) and a 3,689 square foot management office.
THE INFORMATION IN THIS STRUCTURAL AND COLLATERAL TERM SHEET IS NOT COMPLETE AND MAY BE AMENDED PRIOR TO THE TIME OF SALE. THIS TERM SHEET IS NOT AN OFFER TO SELL THESE SECURITIES AND IT IS NOT A SOLICITATION OF AN OFFER TO BUY THESE SECURITIES IN ANY JURISDICTION WHERE THE OFFER OR SALE IS NOT PERMITTED.
146
BOCA VILLAGE CORPORATE CENTER
The Boca Village Corporate Center Property is located in Palm Beach County, Florida, which is approximately 25.0 miles south of West Palm Beach and 20.0 miles north of the Fort Lauderdale central business district. The Boca Village Corporate Center Property benefits from its proximity to the Florida Turnpike and Interstate 95, which are located approximately 4.0 miles southwest and approximately 0.5 miles east of the Boca Village Corporate Center Property, respectively. Additionally, the Florida Department of Transportation recently announced completion of the Spanish River Boulevard Interchange project, a four-year, $69.0 million project designed to create a new freeway interchange onto the Spanish River Boulevard (approximately 1.4 miles from the Boca Village Corporate Center Property), enhancing accessibility into Boca Raton. According to the appraisal, the 2017 population within a one-, three- and five-mile radius of the Boca Village Corporate Center Property was 2,247, 73,131, and 204,712, respectively; and the median household income within the same radii was $69,698, $74,775 and $60,003, respectively.
Sources and Uses
| Sources | Uses | |||||
| Original loan amount | $20,260,000 | 100.0% | Loan payoff | $18,165,288 | 89.7% | |
| Closing costs | 562,143 | 2.8 | ||||
| Return of equity | 259,649 | 1.3 | ||||
| Reserves | 1,272,921 | 6.3 | ||||
| Total Sources | $20,260,000 | 100.0% | Total Uses | $20,260,000 | 100.0% |
The following table presents certain information relating to the tenancy at the Boca Village Corporate Center Property:
Major Tenant
| Tenant Name | Credit Rating (Fitch/Moody’s/ S&P)(1) | Tenant NRSF | % of NRSF | Annual U/W Base Rent PSF(2) | Annual U/W Base Rent(2) | % of Total Annual U/W Base Rent | Lease Expiration Date | |
| Major Tenant | ||||||||
| Oppenheimer & Co. Inc. | NR/NR/NR | 27,079 | 24.9% | $31.23 | $845,677 | 30.9% | 7/31/2019(3) | |
| Geo Corrections Holdings, Inc. | NR/NR/NR | 24,914 | 22.9% | $26.27 | $654,491 | 23.9% | 12/31/2028(4) | |
| Morgan Stanley Smith Barney | A/A3/BBB+ | 17,975 | 16.5% | $31.20(5) | $560,745(5) | 20.5% | 12/31/2025(6) | |
| Tech Service Today, LLC | NR/NR/NR | 15,716 | 14.5% | $27.32 | $429,361 | 15.7% | 5/31/2022(7) | |
| Gunster, Yoakley, & Stewart, P.A. | NR/NR/NR | 6,636 | 6.1% | $25.41 | $168,621 | 6.2% | 2/28/2021(8) | |
| Clean-Mark Group of Companies | NR/NR/NR | 1,732 | 1.6% | $25.97 | $44,984 | 1.6% | 5/31/2022 | |
| Total Major Tenants | 94,052 | 86.6% | $28.75 | $2,703,879 | 98.9% | |||
| Non-Major Tenants(8)(9) | 3,989 | 3.7% | $100.87 | $30,261 | 1.1% | |||
| Occupied Collateral Total | 98,041 | 90.3% | $28.98 | $2,734,140 | 100.0% | |||
| Vacant Space | 10,575 | 9.7% | ||||||
| Collateral Total | 108,616 | 100.0% | ||||||
| (1) | Certain ratings are those of the parent company whether or not the parent guarantees the lease. |
| (2) | Annual U/W Base Rent PSF and Annual U/W Base Rent include contractual rent steps for five tenants of $37,799 through July 2019. |
| (3) | Oppenheimer & Co. Inc. has two five-year lease renewal options. |
| (4) | Geo Corrections Holdings, Inc. has two five-year lease renewal options and a one-time right to terminate its lease effective as of December 31, 2026 with a 12-month notice period and payment of a termination fee. |
| (5) | Annual U/W Base Rent for Morgan Stanley Smith Barney has been straight-lined through its February 2022 termination option. |
| (6) | Morgan Stanley Smith Barney has two five-year lease renewal options and a one-time right to terminate its lease as of February 28, 2022 with a 12-month notice period and payment of a termination fee. |
| (7) | Tech Service Today, LLC has one five-year lease renewal option. |
| (8) | Gunster, Yoakley & Stewart, P.A. has one five-year lease renewal option. |
| (9) | Non-major tenants include a 3,689 square foot management office that has no attributable U/W Base Rent and is not included in the Annual U/W Base Rent PSF. |
THE INFORMATION IN THIS STRUCTURAL AND COLLATERAL TERM SHEET IS NOT COMPLETE AND MAY BE AMENDED PRIOR TO THE TIME OF SALE. THIS TERM SHEET IS NOT AN OFFER TO SELL THESE SECURITIES AND IT IS NOT A SOLICITATION OF AN OFFER TO BUY THESE SECURITIES IN ANY JURISDICTION WHERE THE OFFER OR SALE IS NOT PERMITTED.
147
BOCA VILLAGE CORPORATE CENTER
The following table presents certain information relating to the lease rollover schedule at the Boca Village Corporate Center Property:
Lease Expiration Schedule(1)(2)
| Year Ending December 31, | No. of Leases Expiring | Expiring NRSF | % of Total NRSF | Cumulative Expiring NRSF | Cumulative % of Total NRSF | Annual U/W Base Rent | % of Total Annual U/W Base Rent | Annual U/W Base Rent PSF(3) |
| MTM(4) | 1 | 3,689 | 3.4% | 3,689 | 3.4% | $0 | 0.0% | $0.00 |
| 2018 | 0 | 0 | 0.0% | 3,689 | 3.4% | $0 | 0.0% | $0.00 |
| 2019 | 1 | 27,079 | 24.9% | 30,768 | 28.3% | $845,677 | 30.9% | $31.23 |
| 2020 | 1 | 300 | 0.3% | 31,068 | 28.6% | $30,261 | 1.1% | $100.87 |
| 2021 | 1 | 6,636 | 6.1% | 37,704 | 34.7% | $168,621 | 6.2% | $25.41 |
| 2022 | 2 | 17,448 | 16.1% | 55,152 | 50.8% | $474,345 | 17.3% | $27.19 |
| 2023 | 0 | 0 | 0.0% | 55,152 | 50.8% | $0 | 0.0% | $0.00 |
| 2024 | 0 | 0 | 0.0% | 55,152 | 50.8% | $0 | 0.0% | $0.00 |
| 2025 | 1 | 17,975 | 16.5% | 73,127 | 67.3% | $560,745 | 20.5% | $31.20 |
| 2026 | 0 | 0 | 0.0% | 73,127 | 67.3% | $0 | 0.0% | $0.00 |
| 2027 | 0 | 0 | 0.0% | 73,127 | 67.3% | $0 | 0.0% | $0.00 |
| 2028 | 1 | 24,914 | 22.9% | 98,041 | 90.3% | $654,491 | 23.9% | $26.27 |
| Thereafter | 0 | 0 | 0.0% | 98,041 | 90.3% | $0 | 0.0% | $0.00 |
| Vacant | 0 | 10,575 | 9.7% | 108,616 | 100.0% | $0 | 0.0% | $0.00 |
| Total/Weighted Average | 8 | 108,616 | 100.0% | $2,734,140 | 100.0% | $28.98 |
| (1) | Information obtained from the underwritten rent roll. |
| (2) | Certain tenants may have lease termination options that are exercisable prior to the originally stated expiration date of the subject lease and that are not considered in the Lease Expiration Schedule. |
| (3) | Annual U/W Base Rent PSF excludes vacant space and a 3,689 square foot management office that has no attributable U/W Base Rent. |
| (4) | MTM includes a 3,689 square foot management office that has no attributable U/W Base Rent. |
The following table presents historical occupancy percentages at the Boca Village Corporate Center Property:
Historical Occupancy
12/31/2014(1) | 12/31/2015(1) | 12/31/2016(2)(3) | 12/31/2017(2)(4) | 9/4/2018(5) |
| NAV | NAV | 81.5% | 80.3% | 90.3% |
| (1) | The borrower did not provide historical occupancy for 2014 and 2015. |
| (2) | Information obtained from the borrower and represents end of monthly averages for the respective year. |
| (3) | Occupancy is lower in 2016 due to a previous large tenant vacating its space due to financial issues. |
| (4) | As part of an expansion within the submarket, a previous tenant vacated its space which was subsequently backfilled two months later by Geo Correction Holdings, Inc. Geo Corrections Holdings, Inc. executed a ten-year lease commencing on January 1, 2018 for 24,914 square feet of the Boca Village Corporate Center Property, increasing the occupancy to 90.3% as of September 4, 2018. |
| (5) | Information obtained from the underwritten rent roll. |
THE INFORMATION IN THIS STRUCTURAL AND COLLATERAL TERM SHEET IS NOT COMPLETE AND MAY BE AMENDED PRIOR TO THE TIME OF SALE. THIS TERM SHEET IS NOT AN OFFER TO SELL THESE SECURITIES AND IT IS NOT A SOLICITATION OF AN OFFER TO BUY THESE SECURITIES IN ANY JURISDICTION WHERE THE OFFER OR SALE IS NOT PERMITTED.
148
BOCA VILLAGE CORPORATE CENTER
Operating History and Underwritten Net Cash Flow. The following table presents certain information relating to the underwritten net cash flow at the Boca Village Corporate Center Property:
Cash Flow Analysis
| 2015 | 2016 | 2017 | TTM 7/31/2018 | U/W | % of U/W Effective Gross Income | U/W $ per SF | |
| Base Rent | $2,556,916 | $2,214,505 | $2,453,794 | $2,559,654 | $2,734,140(1) | 69.5% | $25.17 |
| Grossed Up Vacant Space | 0 | 0 | 0 | 0 | 269,663 | 6.9 | 2.48 |
| Total Reimbursables | 1,265,431 | 983,815 | 1,125,509 | 1,038,282 | 1,197,728 | 30.5 | 11.03 |
| Other Income | 55,035 | 54,228 | 1,901 | 1,335 | 0 | 0.0 | 0.00 |
| Less Vacancy & Credit Loss | 0 | 0 | 0 | 0 | (269,663)(2) | (6.9) | (2.48) |
| Free Rent | 14,572 | 106,650 | 81,854 | 317,654 | 0 | 0.0 | 0.00 |
| Effective Gross Income | $3,891,953 | $3,359,198 | $3,663,058 | $3,916,924 | $3,931,868 | 100.0% | $36.20 |
| Total Operating Expenses | $1,382,491 | $1,421,541 | $1,300,579 | $1,325,205 | $1,371,465 | 34.9% | $12.63 |
|
|
|
|
|
|
| |
| Net Operating Income | $2,509,462 | $1,937,657 | $2,362,478 | $2,591,718 | $2,560,402 | 65.1% | $23.57 |
| TI/LC | 0 | 0 | 0 | 0 | 80,121(3) | 2.0 | 0.74 |
| Capital Expenditures | 0 | 0 | 0 | 0 | 21,723 | 0.6 | 0.20 |
| Net Cash Flow | $2,509,462 | $1,937,657 | $2,362,478 | $2,591,718 | $2,458,558 | 62.5% | $22.64 |
| NOI DSCR | 2.80x | 2.16x | 2.64x | 2.89x | 2.86x | ||
| NCF DSCR | 2.80x | 2.16x | 2.64x | 2.89x | 2.75x | ||
| NOI DY | 12.4% | 9.6% | 11.7% | 12.8% | 12.6% | ||
| NCF DY | 12.4% | 9.6% | 11.7% | 12.8% | 12.1% |
| (1) | U/W Base Rent includes contractual rent steps for five tenants of $37,799 through July 2019. |
| (2) | The underwritten economic vacancy is 9.0%. The Boca Village Corporate Center Property was 90.3% leased as of September 4, 2018. |
| (3) | U/W TI/LC is inclusive of a TI/LC credit equivalent to one-tenth of the upfront TI/LC reserve of $735,000. |
The following table presents certain information relating to comparable office leases for the Boca Village Corporate Center Property:
Comparable Leases(1)
| Property Name/Location | Distance from Subject | Year Built | Lease Date/Term | Total Rentable Area (SF) | Lease Area (SF) | Annual Base Rent PSF | Lease Type |
750 Park of Commerce Blvd Boca Raton, FL | 0.7 miles | 2008 | Aug. 2018 / NAV | 95,331 | 3,615 | $24.00 | NNN |
1905 NW Corporate Blvd Boca Raton, FL | 2.8 miles | 2007 | Aug. 2018 / NAV | 85,000 | 6,711 | $32.00 | NNN |
2385 NW Executive Center Drive Boca Raton, FL | 3.1 miles | 1999 | Aug. 2018 / 120 months | 87,158 | 2,079 | $28.00 | NNN |
2385 NW Executive Center Drive Boca Raton, FL | 3.1 miles | 1999 | Aug. 2018 / 120 months | 87,158 | 1,399 | $28.00 | NNN |
2255 Glades Road Boca Raton, FL | 3.4 miles | 1986 | Aug. 2018 / 120 months | 277,390 | 3,587 | $32.00 | NNN |
5355 Town Center Road Boca Raton, FL | 3.4 miles | 1986 | Aug. 2018 / 120 months | 144,687 | 2,688 | $30.00 | NNN |
1800 North Military Trail Boca Raton, FL | 3.5 miles | 2008 | Aug. 2018 / NAV | 145,171 | 4,230 | $30.00 | NNN |
| (1) | Information obtained from appraisal and other third party reports. |
THE INFORMATION IN THIS STRUCTURAL AND COLLATERAL TERM SHEET IS NOT COMPLETE AND MAY BE AMENDED PRIOR TO THE TIME OF SALE. THIS TERM SHEET IS NOT AN OFFER TO SELL THESE SECURITIES AND IT IS NOT A SOLICITATION OF AN OFFER TO BUY THESE SECURITIES IN ANY JURISDICTION WHERE THE OFFER OR SALE IS NOT PERMITTED.
149
| No. 14 – Embassy Suites Overland Park | |||||||
| Loan Information | Property Information | ||||||
| Mortgage Loan Seller: | Ladder Capital Finance LLC | Single Asset/Portfolio: | Single Asset | ||||
| Credit Assessment (DBRS/Fitch/Moody’s): | NR/NR/NR | Property Type: | Hospitality | ||||
| Original Principal Balance: | $19,000,000 | Specific Property Type: | Full Service | ||||
| Cut-off Date Balance: | $19,000,000 | Location: | Overland Park, KS | ||||
| % of Initial Pool Balance: | 2.0% | Size: | 199 Rooms | ||||
| Loan Purpose: | Acquisition | Cut-off Date Balance Per Room: | $95,477.39 | ||||
| Borrower Names: | EH Overland Park, LLC | Year Built/Renovated: | 1984/2015 | ||||
| Borrower Sponsor: | Encore Enterprises, Inc. | Title Vesting: | Fee | ||||
| Mortgage Rate: | 5.3520% | Property Manager: | Self-managed | ||||
| Note Date: | September 7, 2018 | 4thMost Recent Occupancy: | NAV | ||||
| Anticipated Repayment Date: | NAP | 3rdMost Recent Occupancy (As of): | 74.9% (12/31/2015) | ||||
| Maturity Date: | October 6, 2028 | 2ndMost Recent Occupancy (As of): | 74.5% (12/31/2016) | ||||
| IO Period: | 0 months | Most Recent Occupancy (As of): | 74.1% (12/31/2017) | ||||
| Loan Term (Original): | 120 months | Current Occupancy (As of): | 73.6% (6/30/2018) | ||||
| Seasoning: | 0 months | ||||||
| Amortization Term (Original): | 360 months | Underwriting and Financial Information: | |||||
| Loan Amortization Type: | Amortizing Balloon | ||||||
| Interest Accrual Method: | Actual/360 | 4thMost Recent NOI (As of): | $2,689,988 (12/31/2015) | ||||
| Call Protection: | L(24),GRTR 1% or YM or D(91),O(5) | 3rdMost Recent NOI (As of): | $2,586,490 (12/31/2016) | ||||
| Lockbox Type: | Hard/Springing Cash Management | 2ndMost Recent NOI (As of): | $2,552,765 (12/31/2017) | ||||
| Additional Debt: | No | Most Recent NOI (As of): | $2,569,413 (TTM 6/30/2018) | ||||
| Additional Debt Type: | None | ||||||
| U/W Revenues: | $7,195,954 | ||||||
| U/W Expenses: | $4,745,112 | ||||||
| U/W NOI: | $2,450,842 | ||||||
| Escrows and Reserves: | U/W NCF: | $2,163,004 | |||||
| U/W NOI DSCR: | 1.92x | ||||||
| Type: | Initial | Monthly | Cap (If Any) | U/W NCF DSCR: | 1.70x | ||
| Taxes | $311,249 | $44,464 | NAP | U/W NOI Debt Yield: | 12.9% | ||
| Insurance | $25,810 | $4,302 | NAP | U/W NCF Debt Yield: | 11.4% | ||
| FF&E Reserve | $0 | (1) | NAP | As-Complete Appraised Value(4): | $31,300,000 | ||
| Seasonality Reserve | $80,000 | (2) | $100,000 | As-Complete Appraisal Valuation Date(4): | July 25, 2019 | ||
| PIP Reserve(3) | $9,000,000 | $0 | NAP | Cut-off Date LTV Ratio(4): | 60.7% | ||
| Debt Service Reserve | $106,122 | $0 | NAP | LTV Ratio at Maturity(4): | 50.5% | ||
| (1) | The borrower is required to deposit in the FF&E Reserve on each monthly payment date (a) commencing on November 6, 2018 and ending on October 6, 2021, an amount equal to 1/12th of 1% of annual gross revenue in the FF&E Reserve and (b) commencing on November 6, 2021 and thereafter, 1/12th of 4% of annual gross revenue. |
| (2) | At origination the borrower deposited $80,000 into the seasonality reserve to fund shortfalls during the months of December and January. The seasonality reserve can be used to fund shortfalls during seasonal months. If the seasonality reserve is drawn on then the borrower will be required to replenish the reserve to the seasonality cap. |
| (3) | The PIP reserve is required by Hilton in order for the Embassy Suites Overland Park property to be relicensed as an Embassy Suites. The PIP is expected to be completed by March 1, 2020. |
| (4) | The appraiser concluded to an “as-complete” value of $31,300,000 as of July 25, 2019, which assumes the completion of a property improvement plan. The Cut-off Date LTV Ratio and LTV Ratio at Maturity are calculated based on the “as-complete” appraised value. The Cut-off Date LTV Ratio and LTV Ratio at Maturity based on the July 25, 2018 “as-is” appraised value of $22,000,000 are 86.4% and 71.8%, respectively. |
The Mortgage Loan. The Embassy Suites Overland Park mortgage loan (the “Embassy Suites Overland Park Mortgage Loan”) is evidenced by a single promissory note secured by a first mortgage encumbering the fee interest in a full service hotel located in Overland Park, Kansas (the “Embassy Suites Overland Park Property”) with 199 rooms situated on a 5.46-acre site.
The Embassy Suites Overland Park Mortgage Loan was originated on September 7, 2018 by Ladder Capital Finance LLC. The Embassy Suites Overland Park Mortgage Loan had an original principal balance of $19,000,000, has an outstanding principal balance as of the Cut-off Date of $19,000,000 and accrues interest at an interest rate of 5.3520%per annum. The Embassy Suites Overland Park Mortgage Loan had an initial term of 120 months, has a remaining term of 120 months as of the Cut-off Date and requires payments of principal and interest based on a 30-year amortization schedule. The Embassy Suites Overland Park Mortgage Loan matures on October 6, 2028.
Following the lockout period, the borrower has the right to defease or to prepay (with a yield maintenance charge) the Embassy Suites Overland Park Mortgage Loan on any date before June 6, 2028. In addition, the Embassy Suites Overland Park Mortgage Loan is prepayable without penalty on or after June 6, 2028.
THE INFORMATION IN THIS STRUCTURAL AND COLLATERAL TERM SHEET IS NOT COMPLETE AND MAY BE AMENDED PRIOR TO THE TIME OF SALE. THIS TERM SHEET IS NOT AN OFFER TO SELL THESE SECURITIES AND IT IS NOT A SOLICITATION OF AN OFFER TO BUY THESE SECURITIES IN ANY JURISDICTION WHERE THE OFFER OR SALE IS NOT PERMITTED.
150
EMBASSY SUITES OVERLAND PARK
Sources and Uses
| Sources | Uses | |||||||
| Original loan amount | $19,000,000 | 64.4% | Loan payoff | $19,000,000 | 64.4% | |||
| Sponsor contribution | 10,494,326 | 35.6 | Closing costs | 971,145 | 3.3 | |||
| Reserves | 9,523,181 | 32.3 | ||||||
| Total Sources | $29,494,326 | 100.0% | Total Uses | $29,494,326 | 100.0% |
The Property.The Embassy Suites Overland Park Property was originally constructed in 1984 and underwent a renovation in 2015. The borrower is expected to complete a $9,000,000 property improvement plan by March 2020, including the renovation of guestrooms, bathrooms, meeting area and various other building systems. The Embassy Suites Overland Park market mix is 55% commercial, 15% group, 25% leisure, and 5% extended-stay. The Embassy Suites Overland Park Property is located within the Johnson County Office submarket of Overland Park, which has seen an increase of office supply from approximately 17.4 million square feet as of the second quarter of 2009 to approximately 18.3 million square feet as of the second quarter of 2018. During this period office market vacancy reached a high of approximately 14.7% in the second quarter of 2011 and declined to a low of approximately 7.4% in the second quarter of 2018. The Embassy Suites Overland Park Property features a restaurant, lounge, meeting space, indoor swimming pool and whirlpool. The Embassy Suites Overland Park Property is located approximately 20 miles south of Kansas City, and 32 miles south of Kansas City International Airport.
Operating History and Underwritten Net Cash Flow. The following table presents certain information relating to the historical operating performance and the underwritten net cash flow at the Embassy Suites Overland Park Property:
Cash Flow Analysis
| 2015 | 2016 | 2017 | TTM 6/30/2018 | U/W | % of U/W Total Revenue | U/W $ per Room | |
| Occupancy | 74.9% | 74.5% | 74.1% | 73.6% | 73.6% | ||
| ADR | $127.93 | $128.49 | $130.86 | $131.34 | $131.34 | ||
| RevPAR | $95.85 | $95.72 | $96.94 | $96.61 | $96.61 | ||
| Room Revenue | $6,962,303 | $6,971,506 | $7,041,359 | $7,017,209 | $7,017,209 | 97.5% | $35,262 |
| F&B Revenue | 0 | 0 | 0 | 0 | 0 | 0.0 | 0 |
| Other Revenue | 67,580 | 44,400 | 122,838 | 178,745 | 178,745 | 2.5 | 898 |
| Total Revenue | $7,029,884 | $7,015,906 | $7,164,197 | $7,195,954 | $7,195,954 | 100.0% | $36,161 |
| Total Department Expenses | 1,637,306 | 1,686,457 | 1,725,788 | 1,753,209 | 1,753,209 | 24.4 | 8,810 |
| Gross Operating Profit | $5,392,578 | $5,329,449 | $5,438,408 | $5,442,745 | $5,442,745 | 75.6% | $27,350 |
| Total Undistributed Expenses | 2,178,750 | 2,210,779 | 2,283,919 | 2,293,742 | 2,406,714 | 33.4 | 12,094 |
| Profit Before Fixed Charges | $3,213,828 | $3,118,670 | $3,154,489 | $3,149,003 | $3,036,031 | 42.2% | $15,256 |
| Total Fixed Charges | 523,840 | 532,180 | 601,724 | 579,590 | 585,189 | 8.1 | 2,941 |
| Net Operating Income | $2,689,988 | $2,586,490 | $2,552,765 | $2,569,413 | $2,450,842 | 34.1% | $12,316 |
| FF&E | 0 | 0 | 0 | 0 | 287,838 | 4.0 | 1,446 |
| Net Cash Flow | $2,689,988 | $2,586,490 | $2,552,765 | $2,569,413 | $2,163,004 | 30.1% | $10,869 |
| NOI DSCR | 2.11x | 2.03x | 2.00x | 2.02x | 1.92x | ||
| NCF DSCR | 2.11x | 2.03x | 2.00x | 2.02x | 1.70x | ||
| NOI DY | 14.2% | 13.6% | 13.4% | 13.5% | 12.9% | ||
| NCF DY | 14.2% | 13.6% | 13.4% | 13.5% | 11.4% |
THE INFORMATION IN THIS STRUCTURAL AND COLLATERAL TERM SHEET IS NOT COMPLETE AND MAY BE AMENDED PRIOR TO THE TIME OF SALE. THIS TERM SHEET IS NOT AN OFFER TO SELL THESE SECURITIES AND IT IS NOT A SOLICITATION OF AN OFFER TO BUY THESE SECURITIES IN ANY JURISDICTION WHERE THE OFFER OR SALE IS NOT PERMITTED.
151
EMBASSY SUITES OVERLAND PARK
The following table presents certain information relating to the Embassy Suites Overland Park Property’s competitive set:
Subject and Market Historical Occupancy, ADR and RevPAR(1)
Embassy Suites Overland Park
Competitive Set | The Embassy Suites Overland Park | Penetration Factor | |||||||
Year | Occupancy | ADR | RevPAR | Occupancy | ADR | RevPAR | Occupancy | ADR | RevPAR |
| TTM 7/31/2018 | 60.1% | $124.54 | $74.84 | 73.2% | $130.37 | $95.46 | 121.8% | 104.7% | 127.5% |
| 12/31/2017 | 62.9% | $124.45 | $78.32 | 74.1% | $130.86 | $96.94 | 117.7% | 105.2% | 123.8% |
| 12/31/2016 | 63.6% | $122.69 | $78.05 | 74.5% | $128.49 | $95.72 | 117.1% | 104.7% | 122.6% |
| (1) | Information obtained from two third party hospitality research reports dated August 17, 2018 and January 18, 2018, respectively. The competitive set includes: The Clarion Hotel Kansas City Overland Park, The Marriott Overland Park, The DoubleTree Kansas City Overland Park, The Hyatt Place Kansas City Overland Park Metcalf, The Hyatt Place Kansas City Overland Park Convention Center, The Holiday Inn & Suites Overland Park Convention Center and The Sheraton Hotel Overland Park & Conference Center. |
THE INFORMATION IN THIS STRUCTURAL AND COLLATERAL TERM SHEET IS NOT COMPLETE AND MAY BE AMENDED PRIOR TO THE TIME OF SALE. THIS TERM SHEET IS NOT AN OFFER TO SELL THESE SECURITIES AND IT IS NOT A SOLICITATION OF AN OFFER TO BUY THESE SECURITIES IN ANY JURISDICTION WHERE THE OFFER OR SALE IS NOT PERMITTED.
152
(THIS PAGE INTENTIONALLY LEFT BLANK)
THE INFORMATION IN THIS STRUCTURAL AND COLLATERAL TERM SHEET IS NOT COMPLETE AND MAY BE AMENDED PRIOR TO THE TIME OF SALE. THIS TERM SHEET IS NOT AN OFFER TO SELL THESE SECURITIES AND IT IS NOT A SOLICITATION OF AN OFFER TO BUY THESE SECURITIES IN ANY JURISDICTION WHERE THE OFFER OR SALE IS NOT PERMITTED.
153
| No. 15 – Christenbury Corners | ||||||
| Loan Information | Property Information | |||||
| Mortgage Loan Seller: | Wells Fargo Bank, National Association | Single Asset/Portfolio: | Single Asset | |||
| Credit Assessment (DBRS/Fitch/Moody’s): | NR/NR/NR | Property Type: | Retail | |||
| Original Principal Balance: | $18,500,000 | Specific Property Type: | Anchored | |||
| Cut-off Date Balance: | $18,500,000 | Location: | Concord, NC | |||
| % of Initial Pool Balance: | 1.9% | Size(7): | 118,473 SF | |||
| Loan Purpose: | Refinance | Cut-off Date Balance Per SF(7): | $156.15 | |||
| Borrower: | Concord Mills NC, LLC | Year Built/Renovated: | 2017/NAP | |||
| Borrower Sponsors: | John G. Thompson; John G. Thompson Revocable Trust u/t/d December 2, 2003; Paul M. Thrift Revocable Trust u/t/d May 16, 2003; Paul M. Thrift | Title Vesting: | Fee | |||
| Mortgage Rate: | 5.0400% | Property Manager: | Self-managed | |||
| Note Date: | June 19, 2018 | 4thMost Recent Occupancy(8): | NAV | |||
| Anticipated Repayment Date: | NAP | 3rdMost Recent Occupancy(8): | NAV | |||
| Maturity Date: | July 11, 2028 | 2ndMost Recent Occupancy(8): | NAV | |||
| IO Period: | 36 months | Most Recent Occupancy (As of)(8): | 89.1% (12/31/2017) | |||
| Loan Term (Original): | 120 months | Current Occupancy (As of): | 100.0% (4/27/2018) | |||
| Seasoning: | 3 months | |||||
| Amortization Term (Original): | 360 months | Underwriting and Financial Information: | ||||
| Loan Amortization Type: | Interest-only, Amortizing Balloon | |||||
| Interest Accrual Method: | Actual/360 | 4thMost Recent NOI(9): | NAV | |||
| Call Protection: | L(27),D(89),O(4) | 3rdMost Recent NOI(9): | NAV | |||
| Lockbox Type: | Soft/Springing Cash Management | 2ndMost Recent NOI(9): | NAV | |||
| Additional Debt(1): | Yes | Most Recent NOI (As of)(9): | $1,279,701 (TTM 7/31/2018) | |||
| Additional Debt Type(1): | Mezzanine | |||||
| U/W Revenues: | $2,271,905 | |||||
| U/W Expenses: | $526,508 | |||||
| U/W NOI(9): | $1,745,397 | |||||
| U/W NCF: | $1,694,614 | |||||
| Escrows and Reserves: | U/W NOI DSCR: | 1.46x | ||||
| U/W NCF DSCR: | 1.42x | |||||
| Type: | Initial | Monthly | Cap (If Any) | U/W NOI Debt Yield: | 9.4% | |
| Taxes | $89,210 | $12,745(2) | NAP | U/W NCF Debt Yield: | 9.2% | |
| Insurance | $0 | Springing(3) | NAP | As-Is Appraised Value: | $27,100,000 | |
| Replacement Reserve | $0 | $900 | $30,000(4) | As-Is Appraisal Valuation Date: | April 25, 2018 | |
| TI/LC Reserve | $425,000 | $6,250 | $425,000(5) | Cut-off Date LTV Ratio: | 68.3% | |
| Rent Concession Reserve(6) | $40,000 | $0 | NAP | LTV Ratio at Maturity: | 60.5% | |
| (1) | The equity interest in the borrower has been pledged to secure mezzanine indebtedness with an original principal balance of $2,500,000. MSC – Christenbury Corners Holdco, LLC, an entity related to Morrison Street Capital, funded the mezzanine loan to Concord Mills Mezz, LLC. As of the Cut-off Date, the U/W NOI Debt Yield, U/W NCF DSCR and Cut-off Date LTV Ratio based on the Christenbury Corners Total Debt (as defined below) are 8.3%, 1.16x and 77.5%, respectively. |
| (2) | Springing additional monthly deposit are required for tenants (Circle K, McDonald's, Kohl's (as defined below) or Andy's Frozen Custard) required to pay taxes directly or reimburse borrower for tax payments, upon the occurrence of any of the following: (i) an event of default; (ii) said tenants not being obligated to pay (or do not pay) taxes or reimburse (or do not reimburse) borrower for tax payments; (iii) borrower not providing the lender with evidence taxes have been paid; or (iv) said tenant leases not being in full force and effect. |
| (3) | The loan documents do not require ongoing monthly escrows for insurance premiums as long as (i) no event of default has occurred and is continuing; (ii) the borrower provides the lender with evidence that the Christenbury Corners Property’s (as defined below) insurance coverage is included in a blanket policy and such policy is in full force and effect; and (iii) the borrower pays all applicable insurance premiums and provides the lender with evidence of renewals. |
| (4) | The Replacement Reserve will be capped at $30,000 as long as (i) no event of default exists and (ii) the Christenbury Corners Property is being properly maintained based on property inspections. |
| (5) | The Leasing Reserve will be capped at $425,000 as long as (i) no event of default exists; (ii) the net cash flow debt service coverage ratio does not fall below 1.10x; and (iii) the net cash flow debt yield does not fall below 7.5%. |
| (6) | The Rent Concession Reserve represents all outstanding future rent credits or abatements related to the tenant Andy’s Frozen Custard. No other future rent credits or abatements are outstanding under existing leases. |
| (7) | Size and Cut-off Date Balance Per SF include tenants which are on ground leases and own their improvements. |
| (8) | See “Historical Occupancy” table. |
| (9) | See “Cash Flow Analysis” section. The Christenbury Corners Property was built in 2017; therefore, historical operating statements are not available. |
The mortgage loan (the “Christenbury Corners Mortgage Loan”) is evidenced by a single promissory note that is secured by a first mortgage encumbering the borrower’s fee interest in a 118,473 square foot, four building, class A, anchored retail neighborhood/community center located in Concord, North Carolina (the “Christenbury Corners Property”). The Christenbury Corners
THE INFORMATION IN THIS STRUCTURAL AND COLLATERAL TERM SHEET IS NOT COMPLETE AND MAY BE AMENDED PRIOR TO THE TIME OF SALE. THIS TERM SHEET IS NOT AN OFFER TO SELL THESE SECURITIES AND IT IS NOT A SOLICITATION OF AN OFFER TO BUY THESE SECURITIES IN ANY JURISDICTION WHERE THE OFFER OR SALE IS NOT PERMITTED.
154
| CHRISTENBURY CORNERS |
Property includes four outparcels that are encumbered by ground leases and are identified as Outparcel 2 (1.3 acres ground leased to Circle K through December 2035), Outparcel 4 (0.9 acres ground leased to Andy’s Frozen Custard through May 2033), Outparcel 6 (1.7 acres ground leased to McDonald’s through March 2037) and Outparcel A100 (4.4 acres ground leased to Kohl’s through January 2038). The Christenbury Corners Property was constructed in 2017 and is situated on a 26.3-acre site with 509 surface parking spaces resulting in a parking ratio of 4.6 spaces per 1,000 square feet of rentable area. As of April 27, 2018, the Christenbury Corners Property was 100.0% leased to 16 tenants. Approximately 50.9% of the net rentable area and 22.0% of underwritten base rent at the Christenbury Corners Property is attributed to investment grade tenants.
MSC – Christenbury Corners Holdco, LLC, an entity related to Morrison Street Capital, funded a $2,500,000 mezzanine loan (the “Christenbury Corners Mezzanine Loan”) to Concord Mills Mezz, LLC (the “Christenbury Corners Mezzanine Borrower”) (collectively, the Christenbury Corners Mortgage Loan and the Christenbury Corners Mezzanine Loan are referred to herein as the “Christenbury Corners Total Debt”). The Christenbury Corners Mezzanine Loan is secured by a pledge of the Christenbury Corners Mezzanine Borrower’s equity interest in the borrower under the Christenbury Corners Mortgage Loan. The Christenbury Corners Mezzanine Loan accrues interest at a rate of 10.2500%per annumand requires interest-only payments through the maturity date of July 11, 2028 (co-terminus with the Christenbury Corners Mortgage Loan).
The largest tenant at the Christenbury Corners Property by underwritten base rent is Earth Fare, Inc. (“Earth Fare”), which accounts for 21.9% of net rentable area and 25.1% of underwritten base rent with a June 2037 lease expiration. Founded in 1975, Earth Fare operates organic and natural healthy grocery stores in the Southeast, Mid-Atlantic, and Midwest United States. The company currently has approximately 45 stores open in Alabama, Florida, Georgia, Indiana, Michigan, North Carolina, Ohio, South Carolina, Tennessee and Virginia. Earth Fare has three five-year renewal options, with 180 days’ notice, at rental rates as specified in the lease.
The second largest tenant at the Christenbury Corners Property by underwritten base rent is Kohl’s Department Store (“Kohl’s”), which accounts for 50.9% of net rentable area and 12.0% of underwritten base rent with a January 2038 lease expiration. Kohl’s has six five-year renewal options, with six months’ notice, at rental rates as specified in the lease. Kohl’s is subject to a ground lease at the Christenbury Corners Property and owns its improvements.
Other than Earth Fare and Kohl’s, no tenant accounts for more than 6.4% of the net rentable area or 7.5% of underwritten base rent at the Christenbury Corners Property.
The Christenbury Corners Property is located approximately 1.4 miles northwest of Interstate 85, 1.9 miles northeast of Interstate 485, 2.9 miles north of the Interstate 85 and Interstate 485 junction, 13.8 miles northeast of the Charlotte central business district and 19.0 miles northeast of Charlotte Douglas International Airport. Concord Mills, a 1.4 million square foot Simon-owned regional outlet shopping center with over 200 stores featuring Bass Pro Shops Outdoor World, Adidas, Best Buy, Brooks Brothers, Polo Ralph Lauren and The Disney Store, is located approximately 0.8 miles southeast of the Christenbury Corners Property. Concord Mills is the largest outlet shopping destination in North Carolina and includes a 24-screen AMC/IMAX Theatre, Sea-Life Aquarium, Dave & Busters and The Concord Speed Park, a racing entertainment facility with go-karting, mini golf and monster truck rides. According to the appraisal, as of 2017, the Charlotte-Concord-Gastonia, NC-SC metropolitan statistical area had an estimated population of approximately 2.5 million people with an estimated median household income of $61,800. According to a third-party market research report, the estimated 2018 population within a three- and five-mile radius of the Christenbury Corners Property was approximately 46,098, and 125,125, respectively; while the 2018 estimated average household income within the same radii was $107,534, and $91,819, respectively.
Per a third party market research provider, as of year-to-date September 2018, the Cabarrus County retail submarket reported a total inventory of approximately 14.0 million square feet with a 3.2% vacancy rate. The appraiser concluded to the following market rents for the Christenbury Corners Property: $19.75 per square foot for a grocer tenant (Earth Fare); $4.00 per square foot for Kohl’s (ground lease); $32.00 per square foot for in-line spaces; $18.00 per square foot for large in-line space; and $43.50 per square foot for pad sites, all of which are on a triple net basis.
Sources and Uses
| Sources | Uses | |||||||
| Original loan amount | $18,500,000 | 88.1% | Loan payoff | $19,413,316 | 92.4% | |||
| Mezzanine debt | 2,500,000 | 11.9 | Return of equity | 928,834 | 4.4 | |||
| Upfront reserves | 554,210 | 2.6 | ||||||
| Closing costs | 103,639 | 0.5 | ||||||
| Total Sources | $21,000,000 | 100.0% | Total Uses | $21,000,000 | 100.0% |
THE INFORMATION IN THIS STRUCTURAL AND COLLATERAL TERM SHEET IS NOT COMPLETE AND MAY BE AMENDED PRIOR TO THE TIME OF SALE. THIS TERM SHEET IS NOT AN OFFER TO SELL THESE SECURITIES AND IT IS NOT A SOLICITATION OF AN OFFER TO BUY THESE SECURITIES IN ANY JURISDICTION WHERE THE OFFER OR SALE IS NOT PERMITTED.
155
| CHRISTENBURY CORNERS |
The following table presents certain information relating to the tenancy at Christenbury Corners Property:
Major Tenants
| Tenant Name | Credit Rating (Fitch/ Moody’s/ S&P)(1) | Tenant NRSF | % of NRSF | Annual U/W Base Rent PSF(2) | Annual U/W Base Rent(2) | % of Total Annual U/W Base Rent | Lease Expiration Date |
| Anchor Tenants | |||||||
| Earth Fare | NR/NR/NR | 24,110 | 20.4% | $19.51 | $470,445 | 25.2% | 6/30/2037(3) |
| Kohl’s (Ground Lease) | BBB/Baa2/BBB- | 56,004 | 47.3% | $4.01(2) | $224,590(2) | 12.0% | 1/31/2038(4) |
| Total Anchor Tenants | 80,114 | 67.6% | $8.68 | $695,035 | 37.2% | ||
| Major Tenants | |||||||
| Bad Daddy’s Burgers | NR/NR/NR | 3,800 | 3.2% | $37.00 | $140,600 | 7.5% | 10/1/2027(5) |
| Pet Supplies Plus | NR/NR/NR | 7,040 | 5.9% | $18.00 | $126,720 | 6.8% | 8/20/2027(6) |
| Hand and Stone Massage | NR/NR/NR | 3,300 | 2.8% | $33.00 | $108,900 | 5.8% | 12/5/2022(7) |
| Total Major Tenants | 14,140 | 11.9% | $26.61 | $376,220 | 20.1% | ||
| Non-Major Tenants(8) | 24,219(8) | 20.4%(8) | $33.93(8) | $798,681 | 42.7% | ||
| Vacant Space | 0 | 0.0% | |||||
| Collateral Total | 118,473 | 100.0% | $14.59(8)(9) | $1,869,936 | 100.0% | ||
| (1) | Certain ratings are those of the parent company whether or not the parent company guarantees the lease. |
| (2) | Annual U/W Base Rent PSF and Annual U/W Base Rent include contractual rent steps through April 2019 for two tenants totaling $3,712 and straight-line rent averaging for investment grade tenants over the remaining loan term for Kohl’s and Circle K totaling $4,965. Kohl’s has a current annual base rent per square foot of $4.00. |
| (3) | Earth Fare has three five-year renewal options, with 180 days’ notice, at rental rates as specified in the lease. |
| (4) | Kohl’s has six five-year renewal options, with six months’ notice, at rental rates as specified in the lease. |
| (5) | Bad Daddy’s Burgers has two five-year renewal options, with 270 days’ notice, at rental rates as specified in the lease. |
| (6) | Pet Supplies Plus has four five-year automatic renewal options at rental rates as specified in the lease. Pet Supplies Plus must provide at least 180 days’ notice of its intent not to renew its lease. |
| (7) | Hand and Stone Massage has two five-year renewal options, with 270 days’ notice, at rental rates as specified in the lease. |
| (8) | Annual U/W Base Rent PSF for Non-Major Tenants and Collateral Total excludes Annual U/W Base Rent related to Circle K, McDonald’s and Andy’s Frozen Custard, which are on ground leases and own their improvements. |
| (9) | The Collateral Total Annual U/W Base Rent PSF excluding the Kohl’s ground lease is $30.49. |
The following table presents certain information relating to the lease rollover schedule at Christenbury Corners Property:
Lease Expiration Schedule(1)(2)
| Year Ending December 31, | No. of Leases Expiring | Expiring NRSF | % of Total NRSF | Cumulative Expiring NRSF | Cumulative % of Total NRSF | Annual U/W Base Rent | % of Total Annual U/W Base Rent | Annual U/W Base Rent PSF(3) |
| MTM | 0 | 0 | 0.0% | 0 | 0.0% | $0 | 0.0% | $0.00 |
| 2018 | 0 | 0 | 0.0% | 0 | 0.0% | $0 | 0.0% | $0.00 |
| 2019 | 0 | 0 | 0.0% | 0 | 0.0% | $0 | 0.0% | $0.00 |
| 2020 | 0 | 0 | 0.0% | 0 | 0.0% | $0 | 0.0% | $0.00 |
| 2021 | 0 | 0 | 0.0% | 0 | 0.0% | $0 | 0.0% | $0.00 |
| 2022 | 3 | 6,300 | 5.3% | 6,300 | 5.3% | $206,100 | 11.0% | $32.71 |
| 2023 | 1 | 1,568 | 1.3% | 7,868 | 6.6% | $53,296 | 2.9% | $33.99 |
| 2024 | 0 | 0 | 0.0% | 7,868 | 6.6% | $0 | 0.0% | $0.00 |
| 2025 | 0 | 0 | 0.0% | 7,868 | 6.6% | $0 | 0.0% | $0.00 |
| 2026 | 0 | 0 | 0.0% | 7,868 | 6.6% | $0 | 0.0% | $0.00 |
| 2027 | 4 | 16,491 | 13.9% | 24,359 | 20.6% | $445,320 | 23.8% | $27.00 |
| 2028 | 3 | 6,100 | 5.2% | 30,459 | 25.7% | $202,160 | 10.8% | $33.93 |
| Thereafter | 5 | 88,014 | 74.3% | 118,473 | 100.0% | $963,060 | 51.5% | $9.48 |
| Vacant | 0 | 0 | 0.0% | 118,473 | 100.0% | $0 | 0.0% | $0.00 |
| Total/Weighted Average | 16 | 118,473 | 100.0% | $1,869,936 | 100.0% | $14.59 |
| (1) | Information obtained from the underwritten rent roll. |
| (2) | Certain tenants may have lease termination options that are exercisable prior to the originally stated expiration date of the subject lease and that are not considered in the Lease Expiration Schedule. |
| (3) | Annual U/W Base Rent PSF excludes Annual U/W Base Rent related to Circle K, McDonald’s and Andy’s Frozen Custard, which are on ground leases and own their improvements. |
THE INFORMATION IN THIS STRUCTURAL AND COLLATERAL TERM SHEET IS NOT COMPLETE AND MAY BE AMENDED PRIOR TO THE TIME OF SALE. THIS TERM SHEET IS NOT AN OFFER TO SELL THESE SECURITIES AND IT IS NOT A SOLICITATION OF AN OFFER TO BUY THESE SECURITIES IN ANY JURISDICTION WHERE THE OFFER OR SALE IS NOT PERMITTED.
156
| CHRISTENBURY CORNERS |
The following table presents historical occupancy percentages at Christenbury Corners Property:
Historical Occupancy
12/31/2014(1) | 12/31/2015(1) | 12/31/2016(1) | 12/31/2017(2) | 4/27/2018(3) |
| NAV | NAV | NAV | 89.1% | 100.0% |
| (1) | The Christenbury Corners Property was built in 2017; therefore, historical operating statistics are unavailable prior to 12/31/17. |
| (2) | Three tenants, Lee Spa Nails, Code Ninja and Andy’s Frozen Custard, had not taken occupancy by 12/31/2017. The economic occupancy is shown above. |
| (3) | Information obtained from the underwritten rent roll. |
Operating History and Underwritten Net Cash Flow. The following table presents certain information relating to the historical operating performance and underwritten net cash flow at Christenbury Corners Property:
Cash Flow Analysis(1)
| TTM 7/31/2018 | U/W(2) | % of U/W Effective Gross Income | U/W $ per SF | ||||||
| Base Rent | $1,573,965 | $1,869,936 | 82.3% | $15.78 | |||||
| Grossed Up Vacant Space | 0 | 0 | 0.0 | 0.00 | |||||
| Total Reimbursables | 244,054 | 495,465 | 21.8 | 4.18 | |||||
| Other Income | 9 | 0 | 0.0 | 0.00 | |||||
Less Vacancy & Credit Loss | (30,525) | (93,497)(3) | (4.1) | (0.79) | |||||
| Effective Gross Income | $1,787,503 | $2,271,905 | 100.0% | $19.18 | |||||
| Total Operating Expenses | $507,802 | $526,508 | 23.2% | $4.44 | |||||
| Net Operating Income | $1,279,701 | $1,745,397 | 76.8% | $14.73 | |||||
| TI/LC | 0 | 39,988 | 1.8 | 0.34 | |||||
| Capital Expenditures | 0 | 10,795 | 0.5 | 0.09 | |||||
| Net Cash Flow | $1,279,701 | $1,694,614 | 74.6% | $14.30 | |||||
| NOI DSCR | 1.07x | 1.46x | |||||||
| NCF DSCR | 1.07x | 1.42x | |||||||
| NOI DY | 6.9% | 9.4% | |||||||
| NCF DY | 6.9% | 9.2% |
| (1) | The Christenbury Corners Property was built in 2017; therefore, further historical operating statements are not available. |
| (2) | The increase in Net Operating Income from TTM 7/31/2018 to U/W was driven by (i) 10 new leases totaling 43.8% of underwritten base rent commencing between October 2017 and December 2018 and (ii) the inclusion of contractual rent steps totaling $3,712 through April 2019 and straight-line rent averaging for investment grade tenants (Kohl’s and Circle K) over the remaining loan term totaling $4,965. |
| (3) | The underwritten economic vacancy is 5.0%. Christenbury Corners Property was 100.0% physically occupied as of April 27, 2018. |
THE INFORMATION IN THIS STRUCTURAL AND COLLATERAL TERM SHEET IS NOT COMPLETE AND MAY BE AMENDED PRIOR TO THE TIME OF SALE. THIS TERM SHEET IS NOT AN OFFER TO SELL THESE SECURITIES AND IT IS NOT A SOLICITATION OF AN OFFER TO BUY THESE SECURITIES IN ANY JURISDICTION WHERE THE OFFER OR SALE IS NOT PERMITTED.
157
| CHRISTENBURY CORNERS |
The following table presents certain information relating to comparable properties to Christenbury Corners Property:
Comparable Leases(1)
| Property Name/Location | Year Built/ Renovated | Total GLA (SF) | Distance from Subject | Occupancy | Lease Term | Tenant Size | Annual Base Rent PSF | Reimbursement Amount PSF | Lease Type |
Cochran Commons 2720 W Mallard Creek Church Road Charlotte, NC | 2003/NAP | 66,021 | 3.0 miles | 96.0% | 5.0 Yrs | 1,400 SF | $29.00 - $33.00 | $8.24 | NNN |
The Arbors Phase II & III 1823 East Arbors Drive Charlotte, NC | 2007/NAP | 55,323 | 3.0 miles | 98.0% | 3.0 – 5.0 Yrs | NAV | $29.50 | $4.77 | NNN |
Promenade Shoppes 8455 Pit Stop Court NW Concord, NC | 2007/NAP | 15,913 | 0.4 miles | 92.0% | 5.0 Yrs | 1,242 SF | $25.00 | NAV | NNN |
Concord Mills Shops 8694 Concord Mills Blvd. Concord, NC | 2012/2017 | 36,145 | 0.2 miles | 89.0% | 5.0 Yrs | 1,815 SF | $40.00 | $3.75 | NNN |
Colonnade Plaza 8500 Pit Stop Court Concord, NC | 2006/NAP | 21,426 | 0.5 miles | 100.0% | 5.0 Yrs | 5,213 SF | $20.00 | NAV | NNN |
| (1) | Information obtained from the appraisal. |
THE INFORMATION IN THIS STRUCTURAL AND COLLATERAL TERM SHEET IS NOT COMPLETE AND MAY BE AMENDED PRIOR TO THE TIME OF SALE. THIS TERM SHEET IS NOT AN OFFER TO SELL THESE SECURITIES AND IT IS NOT A SOLICITATION OF AN OFFER TO BUY THESE SECURITIES IN ANY JURISDICTION WHERE THE OFFER OR SALE IS NOT PERMITTED.
158
| Wells Fargo Commercial Mortgage Trust 2018-C47 | Transaction Contact Information |
VI. Transaction Contact Information
Questions regarding this Structural and Collateral Term Sheet may be directed to any of the following individuals:
| Wells Fargo Securities, LLC | |
| Brigid Mattingly | Tel. (312) 269-3062 |
| A.J. Sfarra | Tel. (212) 214-5613 |
| Alex Wong | Tel. (212) 214-5615 |
| Barclays Capital Inc. | |
| Daniel Vinson | Tel. (212) 528-8224 |
| Brian Wiele | Tel. (212) 412-5780 |
THE INFORMATION IN THIS STRUCTURAL AND COLLATERAL TERM SHEET IS NOT COMPLETE AND MAY BE AMENDED PRIOR TO THE TIME OF SALE. THIS TERM SHEET IS NOT AN OFFER TO SELL THESE SECURITIES AND IT IS NOT A SOLICITATION OF AN OFFER TO BUY THESE SECURITIES IN ANY JURISDICTION WHERE THE OFFER OR SALE IS NOT PERMITTED.
159