| | | FREE WRITING PROSPECTUS |
| | | FILED PURSUANT TO RULE 433 |
| | | REGISTRATION FILE NO.: 333-226486-09 |
| | | |
Free Writing Prospectus
Structural and Collateral Term Sheet
$702,171,519
(Approximate Initial Pool Balance)
$596,845,000
(Approximate Aggregate Certificate Balance of Offered Certificates)
Wells Fargo Commercial Mortgage Trust 2019-C53
as Issuing Entity
Wells Fargo Commercial Mortgage Securities, Inc.
as Depositor
Rialto Mortgage Finance, LLC
Barclays Capital Real Estate Inc.
Wells Fargo Bank, National Association
Ladder Capital Finance LLC
C-III Commercial Mortgage LLC
as Sponsors and Mortgage Loan Sellers
Commercial Mortgage Pass-Through Certificates
Series 2019-C53
October 15, 2019
WELLS FARGO SECURITIES Co-Lead Manager and Joint Bookrunner | | BARCLAYS Co-Lead Manager and Joint Bookrunner |
| | | |
Academy Securities Co-Manager | | Drexel Hamilton Co-Manager |
| | | |
STATEMENT REGARDING THIS FREE WRITING PROSPECTUS
The depositor has filed a registration statement (including a prospectus) with the Securities and Exchange Commission (“SEC”) (SEC File No. 333-226486) for the offering to which this communication relates. Before you invest, you should read the prospectus in the registration statement and other documents the depositor has filed with the SEC for more complete information about the depositor, the issuing entity and this offering. You may get these documents for free by visiting EDGAR on the SEC Web site at www.sec.gov. Alternatively, the depositor, any underwriter, or any dealer participating in the offering will arrange to send you the prospectus after filing if you request it by calling toll free 1-800-745-2063 (8 a.m. – 5 p.m. EST) or by emailing wfs.cmbs@wellsfargo.com.
Nothing in this document constitutes an offer of securities for sale in any jurisdiction where the offer or sale is not permitted. The information contained herein is preliminary as of the date hereof, supersedes any such information previously delivered to you and will be superseded by any such information subsequently delivered and ultimately by the final prospectus relating to the securities. These materials are subject to change, completion, supplement or amendment from time to time.
This free writing prospectus has been prepared by the underwriters for information purposes only and does not constitute, in whole or in part, a prospectus for the purposes of Directive 2003/71/EC (as amended) and/or Part VI of the Financial Services and Markets Act 2000, as amended, or other offering document.
STATEMENT REGARDING ASSUMPTIONS AS TO SECURITIES, PRICING ESTIMATES AND OTHER INFORMATION
The attached information contains certain tables and other statistical analyses (the “Computational Materials”) which have been prepared in reliance upon information furnished by the Mortgage Loan Sellers. Numerous assumptions were used in preparing the Computational Materials, which may or may not be reflected herein. As such, no assurance can be given as to the Computational Materials’ accuracy, appropriateness or completeness in any particular context; or as to whether the Computational Materials and/or the assumptions upon which they are based reflect present market conditions or future market performance. The Computational Materials should not be construed as either projections or predictions or as legal, tax, financial or accounting advice. You should consult your own counsel, accountant and other advisors as to the legal, tax, business, financial and related aspects of a purchase of these securities. Any weighted average lives, yields and principal payment periods shown in the Computational Materials are based on prepayment and/or loss assumptions, and changes in such prepayment and/or loss assumptions may dramatically affect such weighted average lives, yields and principal payment periods. In addition, it is possible that prepayments or losses on the underlying assets will occur at rates higher or lower than the rates shown in the attached Computational Materials. The specific characteristics of the securities may differ from those shown in the Computational Materials due to differences between the final underlying assets and the preliminary underlying assets used in preparing the Computational Materials. The principal amount and designation of any security described in the Computational Materials are subject to change prior to issuance. None of Wells Fargo Securities, LLC, Barclays Capital Inc., Academy Securities, Inc., Drexel Hamilton, LLC, or any of their respective affiliates, make any representation or warranty as to the actual rate or timing of payments or losses on any of the underlying assets or the payments or yield on the securities. The information in this presentation is based upon management forecasts and reflects prevailing conditions and management’s views as of this date, all of which are subject to change. In preparing this presentation, we have relied upon and assumed, without independent verification, the accuracy and completeness of all information available from public sources or which was provided to us by or on behalf of the Mortgage Loan Sellers or which was otherwise reviewed by us.
This free writing prospectus contains certain forward-looking statements. If and when included in this free writing prospectus, the words “expects”, “intends”, “anticipates”, “estimates” and analogous expressions and all statements that are not historical facts, including statements about our beliefs or expectations, are intended to identify forward-looking statements. Any forward-looking statements are made subject to risks and uncertainties which could cause actual results to differ materially from those stated. Those risks and uncertainties include, among other things, declines in general economic and business conditions, increased competition, changes in demographics, changes in political and social conditions, regulatory initiatives and changes in customer preferences, many of which are beyond our control and the control of any other person or entity related to this offering. The forward-looking statements made in this free writing prospectus are made as of the date stated on the cover. We have no obligation to update or revise any forward-looking statement.
Wells Fargo Securities is the trade name for the capital markets and investment banking services of Wells Fargo & Company and its subsidiaries, including but not limited to Wells Fargo Securities, LLC, a member of NYSE, FINRA, NFA and SIPC, Wells Fargo Prime Services, LLC, a member of FINRA, NFA and SIPC, and Wells Fargo Bank, N.A. Wells Fargo Securities, LLC and Wells Fargo Prime Services, LLC are distinct entities from affiliated banks and thrifts.
IMPORTANT NOTICE REGARDING THE OFFERED CERTIFICATES
The information herein is preliminary and may be supplemented or amended prior to the time of sale. In addition, the Offered Certificates referred to in these materials and the asset pool backing them are subject to modification or revision (including the possibility that one or more classes of certificates may be split, combined or eliminated at any time prior to issuance or availability of a final prospectus) and are offered on a “when, as and if issued” basis.
The underwriters described in these materials may from time to time perform investment banking services for, or solicit investment banking business from, any company named in these materials. The underwriters and/or their affiliates or respective employees may from time to time have a long or short position in any security or contract discussed in these materials.
The information contained herein supersedes any previous such information delivered to any prospective investor and will be superseded by information delivered to such prospective investor prior to the time of sale.
IMPORTANT NOTICE RELATING TO AUTOMATICALLY-GENERATED EMAIL DISCLAIMERS
Any legends, disclaimers or other notices that may appear at the bottom of any email communication to which this free writing prospectus is attached relating to (1) these materials not constituting an offer (or a solicitation of an offer), (2) any representation that these materials are accurate or complete and may not be updated or (3) these materials possibly being confidential, are not applicable to these materials and should be disregarded. Such legends, disclaimers or other notices have been automatically generated as a result of these materials having been sent via Bloomberg or another system.
THE INFORMATION IN THIS STRUCTURAL AND COLLATERAL TERM SHEET IS NOT COMPLETE AND MAY BE AMENDED PRIOR TO THE TIME OF SALE. THIS TERM SHEET IS NOT AN OFFER TO SELL THESE SECURITIES AND IT IS NOT A SOLICITATION OF AN OFFER TO BUY THESE SECURITIES IN ANY JURISDICTION WHERE THE OFFER OR SALE IS NOT PERMITTED.
2
| Wells Fargo Commercial Mortgage Trust 2019-C53 | Certificate Structure |
I. Certificate Structure
| | | Class | Expected Ratings
(DBRS/Fitch/Moody’s)(1) | Approximate Initial
Certificate Balance
or Notional
Amount(2) | Approx.
Initial
Credit
Support(3) | Pass-Through Rate Description | Weighted Average Life (Years)(4) | Expected Principal Window(4) | Certificate
Principal to Value
Ratio(5) | Certificate
Principal
U/W NOI
Debt Yield(6) |
| | | Offered Certificates | | | | |
| | | A-1 | AAA(sf)/AAAsf/Aaa(sf) | $20,689,000 | 30.000% | (7) | 2.97 | 12/19 – 10/24 | 43.7% | 14.0% |
| | | A-2 | AAA(sf)/AAAsf/Aaa(sf) | $45,608,000 | 30.000% | (7) | 4.94 | 10/24 – 10/24 | 43.7% | 14.0% |
| | | A-SB | AAA(sf)/AAAsf/Aaa(sf) | $33,381,000 | 30.000% | (7) | 7.08 | 10/24 – 12/28 | 43.7% | 14.0% |
| | | A-3 | AAA(sf)/AAAsf/Aaa(sf) | (8) | 30.000% | (7) | (8) | (8) | 43.7% | 14.0% |
| | | A-4 | AAA(sf)/AAAsf/Aaa(sf) | (8) | 30.000% | (7) | (8) | (8) | 43.7% | 14.0% |
| | | X-A | AAA(sf)/AAAsf/Aaa(sf) | $491,520,000(9) | N/A | Variable(10) | N/A | N/A | N/A | N/A |
| | | X-B | AA(low)(sf)/A-sf/NR | $105,325,000(11) | N/A | Variable(12) | N/A | N/A | N/A | N/A |
| | | A-S | AAA(sf)/AAAsf/Aa1(sf) | $29,842,000 | 25.750% | (7) | 9.94 | 10/29 – 10/29 | 46.4% | 13.2% |
| | | B | AAA(sf)/AA-sf/NR | $36,864,000 | 20.500% | (7) | 9.94 | 10/29 – 10/29 | 49.7% | 12.3% |
| | | C | A(high)(sf)/A-sf/NR | $38,619,000 | 15.000% | (7) | 9.94 | 10/29 – 10/29 | 53.1% | 11.5% |
| | | Non-Offered Certificates | | | | | | |
| | | X-D(13) | A(sf)/BBB-sf/NR | $25,535,000(14) | N/A | Variable(15) | N/A | N/A | N/A | N/A |
| | | D(13) | A(low)(sf)/BBB-sf/NR | $25,535,000 | 11.364% | (7) | 9.94 | 10/29 – 10/29 | 55.4% | 11.1% |
| | | Risk Retention Certificates | | | | | | |
| | | E-RR(13) | BBB(sf)/BBB-sf/NR | $17,473,000 | 8.875% | (7) | 9.94 | 10/29 – 10/29 | 56.9% | 10.8% |
| | | F-RR | BBB(low)(sf)/BBsf/NR | $10,533,000 | 7.375% | (7) | 9.94 | 10/29 – 10/29 | 57.9% | 10.6% |
| | | G-RR | BB(high)(sf)/BB-sf/NR | $8,777,000 | 6.125% | (7) | 9.94 | 10/29 – 10/29 | 58.6% | 10.4% |
| | | H-RR | BB(low)(sf)/B-sf/NR | $8,777,000 | 4.875% | (7) | 9.94 | 10/29 – 10/29 | 59.4% | 10.3% |
| | | J-RR | B(high)(sf)/NR/NR | $7,022,000 | 3.875% | (7) | 9.94 | 10/29 – 10/29 | 60.1% | 10.2% |
| | | K-RR | B(low)(sf)/NR/NR | $7,899,000 | 2.750% | (7) | 9.94 | 10/29 – 10/29 | 60.8% | 10.1% |
| | | L-RR | NR/NR/NR | $19,310,519 | 0.000% | (7) | 9.94 | 10/29 – 10/29 | 62.5% | 9.8% |
| Notes: |
| (1) | The expected ratings presented are those of DBRS, Inc. (“DBRS”), Fitch Ratings, Inc. (“Fitch”) and Moody’s Investors Service, Inc. (“Moody’s”), which the depositor hired to rate the Offered Certificates. One or more other nationally recognized statistical rating organizations that were not hired by the depositor may use information they receive pursuant to Rule 17g-5 under the Securities Exchange Act of 1934, as amended (the “Exchange Act”) or otherwise, to rate or provide market reports and/or published commentary related to the Offered Certificates. We cannot assure you as to what ratings a non-hired nationally recognized statistical rating organization would assign or that its reports will not express differing, possibly negative, views of the mortgage loans and/or the Offered Certificates. The ratings of each Class of Offered Certificates address the likelihood of the timely distribution of interest and, except in the case of the Class X-A, X-B and X-D Certificates, the ultimate distribution of principal due on those Classes on or before the Rated Final Distribution Date. See “Risk Factors—Other Risks Relating to the Certificates—Nationally Recognized Statistical Rating Organizations May Assign Different Ratings to the Certificates; Ratings of the Certificates Reflect Only the Views of the Applicable Rating Agencies as of the Dates Such Ratings Were Issued; Ratings May Affect ERISA Eligibility; Ratings May Be Downgraded” and “Ratings” in the Preliminary Prospectus, expected to be dated October 15, 2019 (the “Preliminary Prospectus”). DBRS, Fitch and Moody’s have informed us that the “sf” designation in their ratings represents an identifier for structured finance product ratings. |
| (2) | The Certificate Balances and Notional Amounts set forth in the table are approximate. The actual initial Certificate Balances and Notional Amounts may be larger or smaller depending on the initial pool balance of the mortgage loans definitively included in the pool of mortgage loans, which aggregate cut-off date balance may be as much as 5% larger or smaller than the amount presented in the Preliminary Prospectus. In addition, the Notional Amounts of the Class X-A, X-B and X-D Certificates may vary depending upon the final pricing of the Classes of Principal Balance Certificates (as defined in the Preliminary Prospectus) whose Certificate Balances comprise such Notional Amounts, and, if, as a result of such pricing, the pass-through rate of the Class X-A, X-B or X-D Certificates, as applicable, would be equal to zero at all times, such Class of Certificates may not be issued on the closing date of this securitization. |
| (3) | The approximate initial credit support with respect to the Class A-1, A-2, A-SB, A-3 and A-4 Certificates represents the approximate credit enhancement for the Class A-1, A-2, A-SB, A-3 and A-4 Certificates in the aggregate. |
| (4) | Weighted Average Lives and Expected Principal Windows are calculated based on an assumed prepayment rate of 0% CPR and the “Structuring Assumptions” described under “Yield and Maturity Considerations—Weighted Average Life” in the Preliminary Prospectus. |
| (5) | The Certificate Principal to Value Ratio for each Class of Certificates (other than the Class A-1, A-2, A-SB, A-3 and A-4 Certificates) is calculated as the product of (a) the weighted average Cut-off Date LTV Ratio for the mortgage loans and (b) a fraction, the numerator of which is the total initial Certificate Balance of such Class of Certificates and all Classes of Principal Balance Certificates senior to such Class of Certificates and the denominator of which is the total initial Certificate Balance of all of the Principal Balance Certificates. The Certificate Principal to Value Ratio for each of the Class A-1, A-2, A-SB, A-3 and A-4 Certificates is calculated in the aggregate for those Classes as if they were a single Class and is calculated as the product of (a) the weighted average Cut-off Date LTV Ratio for the mortgage loans and (b) a fraction, the numerator of which is the total initial aggregate Certificate Balances of such Classes of Certificates and the denominator of which is the total initial Certificate Balance of all of the Principal Balance Certificates. In any event, however, excess mortgaged property value associated with a mortgage loan will not be available to offset losses on any other mortgage loan. |
| (6) | The Certificate Principal U/W NOI Debt Yield for each Class of Certificates (other than the Class A-1, A-2, A-SB, A-3 and A-4 Certificates) is calculated as the product of (a) the weighted average U/W NOI Debt Yield for the mortgage loans and (b) a fraction, the numerator of which is the total initial Certificate Balance of all of the Classes of Principal Balance Certificates and the denominator of which is the total initial Certificate Balance for such Class of Certificates and all Classes of Principal Balance Certificates senior to such Class of Certificates. The Certificate Principal U/W NOI Debt Yield for each of the Class A-1, A-2, A-SB, A-3 and A-4 Certificates is calculated in the aggregate for those Classes as if they were a single Class and is calculated as the product of (a) the weighted average U/W NOI Debt Yield for the mortgage loans and (b) a fraction, the numerator of which is the total initial Certificate Balance of all of the Classes of Principal Balance Certificates and the denominator of which is the total aggregate initial Certificate Balances for the Class A-1, A-2, A-SB, A-3 and A-4 Certificates. In any event, however, cash flow from each mortgaged property supports only the related mortgage loan and will not be available to support any other mortgage loan. |
| | |
THE INFORMATION IN THIS STRUCTURAL AND COLLATERAL TERM SHEET IS NOT COMPLETE AND MAY BE AMENDED PRIOR TO THE TIME OF SALE. THIS TERM SHEET IS NOT AN OFFER TO SELL THESE SECURITIES AND IT IS NOT A SOLICITATION OF AN OFFER TO BUY THESE SECURITIES IN ANY JURISDICTION WHERE THE OFFER OR SALE IS NOT PERMITTED.
3
| Wells Fargo Commercial Mortgage Trust 2019-C53 | Certificate Structure |
| (7) | The pass-through rates for the Class A-1, A-2, A-SB, A-3, A-4, A-S, B, C, D, E-RR, F-RR, G-RR, H-RR, J-RR, K-RR and L-RR Certificates in each case will be one of the following: (i) a fixed rateper annum, (ii) a variable rateper annum equal to the weighted average of the net mortgage interest rates on the mortgage loans for the related distribution date, (iii) a variable rateper annum equal to the lesser of (a) a fixed rate and (b) the weighted average of the net mortgage interest rates on the mortgage loans for the related distribution date or (iv) a variable rateper annum equal to the weighted average of the net mortgage interest rates on the mortgage loans for the related distribution date minus a specified percentage. For purposes of the calculation of the weighted average of the net mortgage interest rates on the mortgage loans for each distribution date, the mortgage interest rates will be adjusted as necessary to a 30/360 basis. |
| (8) | The exact initial Certificate Balances of the Class A-3 and A-4 Certificates are unknown and will be determined based on the final pricing of those Classes of Certificates. However, the respective initial Certificate Balances, weighted average lives and principal windows of the Class A-3 and A-4 Certificates are expected to be within the applicable ranges reflected in the following chart. The aggregate initial Certificate Balance of the Class A-3 and A-4 Certificates is expected to be approximately $391,842,000, subject to a variance of plus or minus 5%. |
| | Class of Certificates | | Expected Range of Approximate Initial
Certificate Balance | | Expected Range of Weighted Average Life (Years) | | Expected Range of Principal Window |
| | Class A-3 | | $75,000,000 - $195,000,000 | | 9.67 – 9.78 | | 12/28 – 09/29 / 12/28 – 09/29 |
| | Class A-4 | | $196,842,000 - $316,842,000 | | 9.89 – 9.91 | | 09/29 – 10/29 / 09/29 – 10/29 |
| (9) | The Class X-A Certificates are notional amount certificates. The Notional Amount of the Class X-A Certificates will be equal to the aggregate Certificate Balance of the Class A-1, A-2, A-SB, A-3 and A-4 Certificates outstanding from time to time. The Class X-A Certificates will not be entitled to distributions of principal. |
| (10) | The pass-through rate for the Class X-A Certificates for any distribution date will be aper annum rate equal to the excess, if any, of (a) the weighted average of the net mortgage interest rates on the mortgage loans for the related distribution date, over (b) the weighted average of the pass-through rates on the Class A-1, A-2, A-SB, A-3 and A-4 Certificates for the related distribution date, weighted on the basis of their respective Certificate Balances outstanding immediately prior to that distribution date. For purposes of the calculation of the weighted average of the net mortgage interest rates on the mortgage loans for each distribution date, the mortgage interest rates will be adjusted as necessary to a 30/360 basis. |
| (11) | The Class X-B Certificates are notional amount certificates. The Notional Amount of the Class X-B Certificates will be equal to the aggregate Certificate Balance of the Class A-S, B and C Certificates outstanding from time to time. The Class X-B Certificates will not be entitled to distributions of principal. |
| (12) | The pass-through rate for the Class X-B Certificates for any distribution date will be aper annum rate equal to the excess, if any, of (a) the weighted average of the net mortgage interest rates on the mortgage loans for the related distribution date, over (b) the weighted average of the pass-through rates on the Class A-S, B and C Certificates for the related distribution date, weighted on the basis of their respective Certificate Balances outstanding immediately prior to that distribution date. For purposes of the calculation of the weighted average of the net mortgage interest rates on the mortgage loans for each distribution date, the mortgage interest rates will be adjusted as necessary to a 30/360 basis. |
| (13) | The initial Notional Amount of the X-D Certificates and the initial Certificate Balance of each of the Class D and E-RR Certificates are subject to change based on final pricing of all Certificates and the final determination of the Class E-RR, F-RR, G-RR, H-RR, J-RR, K-RR and L-RR Certificates (collectively, the “horizontal risk retention certificates”) that will be retained by the retaining sponsor through a third party purchaser as part of the U.S. risk retention requirements. For more information regarding the methodology and key inputs and assumptions used to determine the sizing of the horizontal risk retention certificates, see “Credit Risk Retention” in the Preliminary Prospectus. |
| (14) | The Class X-D Certificates are notional amount certificates. The Notional Amount of the Class X-D Certificates will be equal to the Certificate Balance of the Class D Certificates outstanding from time to time. The Class X-D Certificates will not be entitled to distributions of principal. |
| (15) | The pass-through rate for the Class X-D Certificates for any distribution date will be aper annum rate equal to the excess, if any, of (a) the weighted average of the net mortgage interest rates on the mortgage loans for the related distribution date, over (b) the pass-through rate on the Class D Certificates for the related distribution date. For purposes of the calculation of the weighted average of the net mortgage interest rates on the mortgage loans for each distribution date, the mortgage interest rates will be adjusted as necessary to a 30/360 basis. |
THE INFORMATION IN THIS STRUCTURAL AND COLLATERAL TERM SHEET IS NOT COMPLETE AND MAY BE AMENDED PRIOR TO THE TIME OF SALE. THIS TERM SHEET IS NOT AN OFFER TO SELL THESE SECURITIES AND IT IS NOT A SOLICITATION OF AN OFFER TO BUY THESE SECURITIES IN ANY JURISDICTION WHERE THE OFFER OR SALE IS NOT PERMITTED.
4
| Wells Fargo Commercial Mortgage Trust 2019-C53 | Transaction Highlights |
II. Transaction Highlights
Mortgage Loan Sellers:
Mortgage Loan Seller | | Number of
Mortgage Loans | | Number of
Mortgaged
Properties | | Aggregate Cut-off Date Balance | | % of Initial Pool
Balance |
| Rialto Mortgage Finance, LLC | | 12 | | 27 | | $216,417,868 | | 30.8 | % |
| Barclays Capital Real Estate Inc. | | 11 | | 11 | | 162,863,414 | | 23.2 | |
| Wells Fargo Bank, National Association | | 10 | | 11 | | 145,700,622 | | 20.8 | |
| Ladder Capital Finance LLC | | 6 | | 7 | | 95,298,867 | | 13.6 | |
| C-III Commercial Mortgage LLC | | 19 | | 29 | | 81,890,748 | | 11.7 | |
Total | | 58 | | 85 | | $702,171,519 | | 100.0 | % |
Loan Pool:
| Initial Pool Balance: | $702,171,519 |
| Number of Mortgage Loans: | 58 |
| Average Cut-off Date Balance per Mortgage Loan: | $12,106,406 |
| Number of Mortgaged Properties: | 85 |
| Average Cut-off Date Balance per Mortgaged Property(1): | $8,260,841 |
| Weighted Average Mortgage Interest Rate: | 3.961% |
| Ten Largest Mortgage Loans as % of Initial Pool Balance: | 52.3% |
| Weighted Average Original Term to Maturity or ARD (months): | 116 |
| Weighted Average Remaining Term to Maturity or ARD (months): | 115 |
| Weighted Average Original Amortization Term (months)(2): | 356 |
| Weighted Average Remaining Amortization Term (months)(2): | 356 |
| Weighted Average Seasoning (months): | 2 |
| (1) | Information regarding mortgage loans secured by multiple properties is based on an allocation according to relative appraised values or the allocated loan amounts or property-specific release prices set forth in the related loan documents or such other allocation as the related mortgage loan seller deemed appropriate. |
| (2) | Excludes any mortgage loan that does not amortize. |
Credit Statistics:
| Weighted Average U/W Net Cash Flow DSCR(1): | 1.97x |
| Weighted Average U/W Net Operating Income Debt Yield(1): | 9.8% |
| Weighted Average Cut-off Date Loan-to-Value Ratio(1): | 62.5% |
| Weighted Average Balloon or ARD Loan-to-Value Ratio(1): | 56.8% |
| % of Mortgage Loans with Additional Subordinate Debt(2): | 3.3% |
| % of Mortgage Loans with Single Tenants(3): | 20.2% |
| (1) | With respect to any mortgage loan that is part of a whole loan, loan-to-value ratio, debt service coverage ratio and debt yield calculations include the relatedpari passucompanion loan(s) (unless otherwise stated). The debt service coverage ratio, debt yield and loan-to-value ratio information do not take into account any subordinate debt (whether or not secured by the related mortgaged property), that currently exists or is allowed under the terms of any mortgage loan. See “Description of the Mortgage Pool—Mortgage Pool Characteristics” in the Preliminary Prospectus and Annex A-1 to the Preliminary Prospectus. |
| (2) | The percentage figure expressed as “% of Mortgage Loans with Additional Subordinate Debt” is determined as a percentage of the initial pool balance and does not take into account any future subordinate debt (whether or not secured by the mortgaged property), if any, that may be permitted under the terms of any mortgage loan or the pooling and servicing agreement. See “Description of the Mortgage Pool—Additional Indebtedness” in the Preliminary Prospectus. |
| (3) | Excludes mortgage loans that are secured by multiple single tenant properties. |
THE INFORMATION IN THIS STRUCTURAL AND COLLATERAL TERM SHEET IS NOT COMPLETE AND MAY BE AMENDED PRIOR TO THE TIME OF SALE. THIS TERM SHEET IS NOT AN OFFER TO SELL THESE SECURITIES AND IT IS NOT A SOLICITATION OF AN OFFER TO BUY THESE SECURITIES IN ANY JURISDICTION WHERE THE OFFER OR SALE IS NOT PERMITTED.
5
| Wells Fargo Commercial Mortgage Trust 2019-C53 | Transaction Highlights |
Loan Structural Features:
Amortization:Based on the Initial Pool Balance, 57.4% of the mortgage pool (45 mortgage loans) has scheduled amortization, as follows:
40.3% (25 mortgage loans) provides for an interest-only period followed by an amortization period; and
17.1% (20 mortgage loans) requires amortization during the entire loan term.
Interest-Only:Based on the Initial Pool Balance, 42.6% of the mortgage pool (13 mortgage loans) provides for interest-only payments during the entire loan term through maturity or ARD. The Weighted Average Cut-off Date Loan-to-Value Ratio and Weighted Average U/W Net Cash Flow DSCR for those mortgage loans are 59.2% and 2.43x, respectively.
Hard Lockboxes: Based on the Initial Pool Balance, 53.1% of the mortgage pool (19 mortgage loans) have hard lockboxes in place.
Reserves:The mortgage loans require amounts to be escrowed monthly as follows (excluding any mortgage loans with springing provisions):
| Real Estate Taxes: | 71.4% of the pool |
| Insurance: | 51.8% of the pool |
| Capital Replacements: | 76.6% of the pool |
| TI/LC: | 57.1% of the pool(1) |
| (1) | The percentage of Initial Pool Balance for mortgage loans with TI/LC reserves is based on the aggregate principal balance allocable to loans that include retail, office, mixed use and industrial properties. |
Call Protection/Defeasance: Based on the Initial Pool Balance, the mortgage pool has the following call protection and defeasance features:
86.7% of the mortgage pool (46 mortgage loans) features a lockout period, then defeasance only until an open period;
12.3% of the mortgage pool (8 mortgage loans) features a lockout period, then the greater of a prepayment premium (1%) or yield maintenance until an open period;
0.7% of the mortgage pool (2 mortgage loans) features a lockout period, then the greater of a prepayment premium (1%) or yield maintenance, or defeasance until an open period; and
0.3% of the mortgage pool (2 mortgage loans) features yield maintenance, then yield maintenance or defeasance until an open period and no lockout period.
Prepayment restrictions for each mortgage loan reflect the entire life of the mortgage loan. Please refer to Annex A-1 to the Preliminary Prospectus and the footnotes related thereto for further information regarding individual loan call protection.
THE INFORMATION IN THIS STRUCTURAL AND COLLATERAL TERM SHEET IS NOT COMPLETE AND MAY BE AMENDED PRIOR TO THE TIME OF SALE. THIS TERM SHEET IS NOT AN OFFER TO SELL THESE SECURITIES AND IT IS NOT A SOLICITATION OF AN OFFER TO BUY THESE SECURITIES IN ANY JURISDICTION WHERE THE OFFER OR SALE IS NOT PERMITTED.
6
| Wells Fargo Commercial Mortgage Trust 2019-C53 | Issue Characteristics |
III. Issue Characteristics
| | Securities Offered: | | $596,845,000 approximate monthly pay, multi-class, commercial mortgage REMIC pass-through certificates consisting of ten classes (Classes A-1, A-2, A-SB, A-3, A-4, A-S, B, C, X-A and X-B), which are offered pursuant to a registration statement filed with the SEC (such classes of certificates, the “Offered Certificates”). |
| | Mortgage Loan Sellers: | | Rialto Mortgage Finance, LLC (“RMF”), Barclays Capital Real Estate Inc. (“Barclays”), Wells Fargo Bank, National Association (“WFB”), Ladder Capital Finance LLC (“LCF”) and C-III Commercial Mortgage LLC (“CIIICM”) |
| | Joint Bookrunners and Co-Lead Managers: | | Wells Fargo Securities, LLC and Barclays Capital Inc. |
| | Co-Manager: | | Academy Securities, Inc. and Drexel Hamilton, LLC |
| | Rating Agencies: | | DBRS, Inc., Fitch Ratings, Inc. and Moody’s Investors Service, Inc. |
| | Master Servicer: | | Wells Fargo Bank, National Association |
| | Special Servicer: | | Midland Loan Services, a Division of PNC Bank, National Association |
| | Certificate Administrator: | | Wells Fargo Bank, National Association |
| | Trustee: | | Wilmington Trust, National Association |
| | Operating Advisor: | | Park Bridge Lender Services LLC |
| | Asset Representations Reviewer: | | Park Bridge Lender Services LLC |
| | Initial Majority Controlling Class Certificateholder: | | KKR CMBS II Aggregator Type 2 L.P. |
| | U.S. Credit Risk Retention: | | For a discussion on the manner in which the U.S. credit risk retention requirements will be satisfied by Wells Fargo Bank, National Association, as the retaining sponsor, see “Credit Risk Retention” in the Preliminary Prospectus. This transaction is being structured with a “third party purchaser” that will acquire an “eligible horizontal residual interest”, which will be comprised of the Class E-RR, F-RR, G-RR, H-RR, J-RR, K-RR and L-RR Certificates (the “horizontal risk retention certificates”). KKR CMBS II Aggregator Type 2 L.P. (in satisfaction of the retention obligations of Wells Fargo Bank, National Association, as the retaining sponsor) will be contractually obligated to retain (or to cause its “majority-owned affiliate” to retain) the horizontal risk retention certificates for a minimum of five years after the closing date, subject to certain permitted exceptions provided for under the risk retention rules. During this time, KKR CMBS II Aggregator Type 2 L.P. will agree to comply with hedging, transfer and financing restrictions that are applicable to third party purchasers under the credit risk retention rules. For additional information, see “Credit Risk Retention” in the Preliminary Prospectus. |
| | EU Credit Risk Retention | | None of the sponsors, the depositor or any other party to the transaction intends or is required to retain a material net economic interest in the securitization constituted by the issue of the Certificates in a manner that would satisfy the requirements of the European Union Regulation (EU) 2017/2402. In addition, no such person undertakes to take any other action which may be required by any investor for the purposes of its compliance with any applicable requirement under such Regulation. Furthermore, the arrangements described under “Credit Risk Retention” in the Preliminary Prospectus have not been structured with the objective of ensuring compliance by any person with any requirements of such Regulation. |
| | Cut-off Date: | | The Cut-off Date with respect to each mortgage loan is the due date for the monthly debt service payment that is due in November 2019 (or, in the case of any mortgage loan that has its first due date in December 2019, the date that would have been its due date in November 2019 under the terms of that mortgage loan if a monthly debt service payment were scheduled to be due in that month). |
| | Expected Closing Date: | | On or about November 7, 2019. |
| | Determination Dates: | | The 11th day of each month (or if that day is not a business day, the next succeeding business day), commencing in December 2019. |
| | Distribution Dates: | | The fourth business day following the Determination Date in each month, commencing in December 2019. |
| | Rated Final Distribution Date: | | The Distribution Date in October 2052. |
THE INFORMATION IN THIS STRUCTURAL AND COLLATERAL TERM SHEET IS NOT COMPLETE AND MAY BE AMENDED PRIOR TO THE TIME OF SALE. THIS TERM SHEET IS NOT AN OFFER TO SELL THESE SECURITIES AND IT IS NOT A SOLICITATION OF AN OFFER TO BUY THESE SECURITIES IN ANY JURISDICTION WHERE THE OFFER OR SALE IS NOT PERMITTED.
7
| Wells Fargo Commercial Mortgage Trust 2019-C53 | Issue Characteristics |
| | Interest Accrual Period: | | With respect to any Distribution Date, the calendar month immediately preceding the month in which such Distribution Date occurs. |
| | Day Count: | | The Offered Certificates will accrue interest on a 30/360 basis. |
| | Minimum Denominations: | | $10,000 for each Class of Offered Certificates (other than the Class X-A and X-B Certificates) and $1,000,000 for the Class X-A and X-B Certificates. Investments may also be made in any whole dollar denomination in excess of the applicable minimum denomination. |
| | Clean-up Call: | | 1.0% |
| | Delivery: | | DTC, Euroclear and Clearstream Banking |
| | ERISA/SMMEA Status: | | Each Class of Offered Certificates is expected to be eligible for exemptive relief under ERISA. No Class of Offered Certificates will be SMMEA eligible. |
| | Risk Factors: | | THE CERTIFICATES INVOLVE CERTAIN RISKS AND MAY NOT BE SUITABLE FOR ALL INVESTORS. SEE THE “RISK FACTORS” SECTION OF THE PRELIMINARY PROSPECTUS. |
| | Bond Analytics Information: | | The Certificate Administrator will be authorized to make distribution date statements, CREFC® reports and certain supplemental reports (other than confidential information) available to certain financial modeling and data provision services, including Bloomberg, L.P., Trepp, LLC, Intex Solutions, Inc., Interactive Data Corp., Markit Group Limited, BlackRock Financial Management, Inc., CMBS.com, Moody’s Analytics, MBS Data, LLC, Thomson Reuters Corporation and RealINSIGHT. |
| | Tax Treatment | | For U.S. federal income tax purposes, the issuing entity will consist of one or more REMICs and the Offered Certificates will represent REMIC regular interests. |
THE INFORMATION IN THIS STRUCTURAL AND COLLATERAL TERM SHEET IS NOT COMPLETE AND MAY BE AMENDED PRIOR TO THE TIME OF SALE. THIS TERM SHEET IS NOT AN OFFER TO SELL THESE SECURITIES AND IT IS NOT A SOLICITATION OF AN OFFER TO BUY THESE SECURITIES IN ANY JURISDICTION WHERE THE OFFER OR SALE IS NOT PERMITTED.
8
| Wells Fargo Commercial Mortgage Trust 2019-C53 | Characteristics of the Mortgage Pool |
IV. Characteristics of the Mortgage Pool(1)
A. Ten Largest Mortgage Loans
Mortgage Loan
Seller | Mortgage Loan Name | City | State | Number of Mortgage Loans / Mortgaged Properties | Mortgage Loan Cut-off Date Balance ($) | % of Initial Pool Balance (%) | Property
Type | Number
of SF | Cut-off
Date
Balance
Per SF | Cut-off
Date LTV
Ratio (%) | Balloon or ARD LTV
Ratio (%) | U/W NCF
DSCR (x) | U/W NOI
Debt
Yield (%) |
| RMF | Equinix Data Center | Secaucus | NJ | 1 / 1 | $60,000,000 | 8.5 | % | Other | 663,621 | $151 | 49.8 | % | 49.8 | % | 2.44 | x | 8.2 | % |
| Barclays | Ceasar’s Bay Shopping Center | Brooklyn | NY | 1 / 1 | 45,500,000 | 6.5 | | Retail | 301,300 | 290 | 51.5 | | 51.5 | | 3.60 | | 11.6 | |
| RMF | Planet Self Storage Portfolio | Various | Various | 1 / 11 | 45,000,000 | 6.4 | | Self Storage | 563,807 | 124 | 67.1 | | 67.1 | | 2.42 | | 7.9 | |
| WFB | 777 East Eisenhower | Ann Arbor | MI | 1 / 1 | 44,500,000 | 6.3 | | Office | 272,502 | 163 | 73.4 | | 62.0 | | 1.50 | | 9.4 | |
| LCF | 1000 Chesterbrook | Berwyn | PA | 1 / 1 | 37,900,000 | 5.4 | | Office | 172,421 | 220 | 66.4 | | 66.4 | | 2.09 | | 9.2 | |
| WFB | 112-118 West 125th Street | New York | NY | 1 / 1 | 32,100,000 | 4.6 | | Mixed Use | 32,000 | 1,003 | 57.7 | | 57.7 | | 1.91 | | 7.3 | |
| WFB | 600 & 620 National Avenue | Mountain View | CA | 1 / 1 | 30,000,000 | 4.3 | | Office | 151,064 | 913 | 70.0 | | 70.0 | | 1.93 | | 7.2 | |
| Barclays | 800 Delaware | Wilmington | DE | 1 / 1 | 27,000,000 | 3.8 | | Office | 280,190 | 96 | 70.8 | | 59.4 | | 1.63 | | 11.0 | |
| LCF | Martin Brower | Coatesville | PA | 1 / 1 | 23,200,000 | 3.3 | | Industrial | 152,854 | 152 | 62.7 | | 57.2 | | 1.66 | | 10.2 | |
| RMF | Bird Creek Crossing | Temple | TX | 1 / 1 | 21,800,000 | 3.1 | | Retail | 129,941 | 168 | 70.8 | | 64.2 | | 1.64 | | 9.8 | |
| Top Three Total/Weighted Average | | | 3 / 13 | $150,500,000 | 21.4 | % | | | | 55.5 | % | 55.5 | % | 2.78 | x | 9.1 | % |
| Top Five Total/Weighted Average | | | 5 /15 | $232,900,000 | 33.2 | % | | | | 60.7 | % | 58.5 | % | 2.43 | x | 9.2 | % |
| Top Ten Total/Weighted Average | | | 10 / 20 | $367,000,000 | 52.3 | % | | | | 62.7 | % | 59.7 | % | 2.19 | x | 9.1 | % |
| Non-Top Ten Total/Weighted Average | | | 48 / 65 | $335,171,519 | 47.7 | % | | | | 62.3 | % | 53.6 | % | 1.74 | x | 10.6 | % |
| (1) | With respect to any mortgage loan that is part of a whole loan, Cut-off Date Balance Per SF, loan-to-value ratio, debt service coverage ratio and debt yield calculations include the relatedpari passu companion loan(s) (unless otherwise stated). With respect to each mortgage loan, debt service coverage ratio, debt yield and loan-to-value ratio information do not take into account subordinate debt (whether or not secured by the related mortgaged property), if any, that currently exists or is allowed under the terms of such mortgage loan. |
THE INFORMATION IN THIS STRUCTURAL AND COLLATERAL TERM SHEET IS NOT COMPLETE AND MAY BE AMENDED PRIOR TO THE TIME OF SALE. THIS TERM SHEET IS NOT AN OFFER TO SELL THESE SECURITIES AND IT IS NOT A SOLICITATION OF AN OFFER TO BUY THESE SECURITIES IN ANY JURISDICTION WHERE THE OFFER OR SALE IS NOT PERMITTED.
9
| Wells Fargo Commercial Mortgage Trust 2019-C53 | Characteristics of the Mortgage Pool |
B. Summary of the Whole Loans
| Property Name | Mortgage Loan Seller in WFCM 2019-C53 | Note(s)(1) | Original Balance | Holder of Note(1) | Lead Servicer for Whole Loan | Master Servicer Under Lead Securitization Servicing Agreement | Special Servicer Under Lead Securitization Servicing Agreement |
| Equinix Data Center | RMF | A-1, A-4 | $60,000,000 | WFCM 2019-C53 | Yes | Wells Fargo Bank National Association | Midland Loan Services, a Division of PNC Bank, National Association |
| A-2 | $25,000,000 | RMF | No |
| A-3 | $15,000,000 | RMF | No |
| Ceasar’s Bay Shopping Center | Barclays | A-1 | $45,500,000 | WFCM 2019-C53 | Yes | Wells Fargo Bank National Association | Midland Loan Services, a Division of PNC Bank, National Association |
| A-2 | $42,000,000 | Barclays | No |
| Planet Self Storage Portfolio | RMF | A-1, A-3 | $45,000,000 | WFCM 2019-C53 | Yes | Wells Fargo Bank National Association | Midland Loan Services, a Division of PNC Bank, National Association |
| A-2 | $20,000,000 | RMF | No |
| A-4 | $5,000,000 | RMF | No |
| 600 & 620 National Avenue | WFB | A-1-1 | $38,950,000 | UBS 2019-C17(2) | Yes | Wells Fargo Bank National Association | Rialto Capital Advisors, LLC |
| A-1-2 | $30,000,000 | WFCM 2019-C53 | No |
| A-2-1 | $30,000,000 | JPMorgan Chase Bank, National Association | No |
| A-2-2 | $30,000,000 | JPMorgan Chase Bank, National Association | No |
| | | A-2-3 | $8,950,000 | JPMorgan Chase Bank, National Association | No | | |
| Smoke Tree Village and Smoke Tree Commons | RMF | A-1-1 | $15,000,000 | UBS 2019-C17(2) | Yes | Wells Fargo Bank National Association | Rialto Capital Advisors, LLC |
| A-1-2 | $10,500,000 | WFCM 2019-C53 | No |
| A-2 | $10,000,000 | WFCM 2019-C52 | No |
| (1) | Unless otherwise indicated, each note not currently held by a securitization trust is expected to be contributed to a future securitization. No assurance can be provided that any such note will not be split further. |
| (2) | The UBS 2019-C17 transaction is expected to close on or about October 15, 2019. |
THE INFORMATION IN THIS STRUCTURAL AND COLLATERAL TERM SHEET IS NOT COMPLETE AND MAY BE AMENDED PRIOR TO THE TIME OF SALE. THIS TERM SHEET IS NOT AN OFFER TO SELL THESE SECURITIES AND IT IS NOT A SOLICITATION OF AN OFFER TO BUY THESE SECURITIES IN ANY JURISDICTION WHERE THE OFFER OR SALE IS NOT PERMITTED.
10
| Wells Fargo Commercial Mortgage Trust 2019-C53 | Characteristics of the Mortgage Pool |
C. Mortgage Loans with Additional Secured and Mezzanine Financing
| Loan No. | Mortgage Loan Seller | Mortgage Loan Name | Mortgage
Loan
Cut-off Date Balance ($) | % of Initial Pool Balance (%) | Sub Debt Cut-off Date Balance ($) | Mezzanine Debt Cut-off Date Balance ($) | Total Debt Interest
Rate (%)(1) | Mortgage Loan U/W NCF
DSCR (x) | Total Debt U/W NCF DSCR (x)(2) | Mortgage Loan Cut-off Date U/W NOI Debt
Yield (%) | Total Debt Cut-off Date U/W NOI Debt Yield (%) | Mortgage Loan Cut-off Date LTV Ratio (%) | Total Debt Cut-off Date LTV Ratio (%) |
| 9 | LCF | Martin Brower | $23,200,000 | 3.3% | $0 | $7,500,000 | 6.1584% | 1.66x | 1.18x | 10.2% | 7.7% | 62.7% | 83.0% |
| Total/Weighted Average | $23,200,000 | 3.3% | $0 | $7,500,000 | 6.1584% | 1.66x | 1.18x | 10.2% | 7.7% | 62.7% | 83.0% |
| (1) | Total Debt Interest Rate for any specified mortgage loan reflects the weighted average of the interest rates on the respective components of the total debt. |
| (2) | Based on interest only. |
THE INFORMATION IN THIS STRUCTURAL AND COLLATERAL TERM SHEET IS NOT COMPLETE AND MAY BE AMENDED PRIOR TO THE TIME OF SALE. THIS TERM SHEET IS NOT AN OFFER TO SELL THESE SECURITIES AND IT IS NOT A SOLICITATION OF AN OFFER TO BUY THESE SECURITIES IN ANY JURISDICTION WHERE THE OFFER OR SALE IS NOT PERMITTED.
11
| Wells Fargo Commercial Mortgage Trust 2019-C53 | Characteristics of the Mortgage Pool |
D. Previous Securitization History(1)
Loan
No. | Mortgage Loan Seller | Mortgage
Loan or Mortgaged
Property Name | City | State | Property
Type | Mortgage Loan
or Mortgaged Property Cut-off Date Balance ($) | % of
Initial Pool Balance
(%) | Previous Securitization |
| 31 | CIIICM | Bank of America Brooklyn | Brooklyn | NY | Retail | $5,900,000 | 0.8% | JPMBB 2015-C28 |
| 32 | WFB | 101 NE 40th Street - FL | Miami | FL | Retail | 5,400,000 | 0.8 | CSAIL 2015-C4 |
| Total | | | | | | $11,300,000 | 1.6% | |
| (1) | The table above represents the most recent securitization with respect to the mortgaged property securing the related mortgage loan, based on information provided by the related borrower or obtained through searches of a third-party database. While loans secured by the above mortgaged properties may have been securitized multiple times in prior transactions, mortgage loans in this securitization are only listed in the above chart if the mortgage loan paid off a loan in another securitization. The information has not otherwise been confirmed by the mortgage loan sellers. |
THE INFORMATION IN THIS STRUCTURAL AND COLLATERAL TERM SHEET IS NOT COMPLETE AND MAY BE AMENDED PRIOR TO THE TIME OF SALE. THIS TERM SHEET IS NOT AN OFFER TO SELL THESE SECURITIES AND IT IS NOT A SOLICITATION OF AN OFFER TO BUY THESE SECURITIES IN ANY JURISDICTION WHERE THE OFFER OR SALE IS NOT PERMITTED.
12
| Wells Fargo Commercial Mortgage Trust 2019-C53 | Characteristics of the Mortgage Pool |
E. Mortgage Loans with Scheduled Balloon Payments and Related Classes
| Class A-2(1) |
| Loan No. | Mortgage Loan Seller | Mortgage Loan Name | State | Property Type | Mortgage Loan Cut-off Date Balance ($) | % of Initial Pool
Balance (%) | Mortgage
Loan Balance at Maturity or ARD($) | % of Class A-2 Certificate Principal
Balance (%)(2) | SF | Loan per
SF ($) | U/W NCF DSCR
(x) | U/W NOI Debt Yield (%) | Cut-off Date LTV Ratio (%) | Balloon or ARD
LTV Ratio (%) | Rem. IO Period (mos.) | Rem. Term to Maturity or ARD (mos.) |
| 3 | RMF | Planet Self Storage Portfolio | Various | Self Storage | $45,000,000 | 6.4% | $45,000,000 | 98.7% | 563,807 | $124 | 2.42x | 7.9% | 67.1% | 67.1% | 59 | 59 |
| Total/Weighted Average | | | $45,000,000 | 6.4% | $45,000,000 | 98.7% | | | 2.42x | 7.9% | 67.1% | 67.1% | 59 | 59 |
| (1) | The table above presents the mortgage loan(s) whose balloon payments would be applied to pay down the principal balance of the Class A-2 Certificates, assuming a 0% CPR and applying the “Structuring Assumptions” described in the Preliminary Prospectus, including the assumptions that (i) none of the mortgage loans in the pool experience prepayments prior to maturity (or in the case of an ARD loan, its anticipated repayment date), defaults or losses; (ii) there are no extensions of maturity dates of any mortgage loans in the pool; and (iii) each mortgage loan in the pool is paid in full on its stated maturity date (or, in the case of an ARD loan, its anticipated repayment date). Each Class of Certificates evidences undivided ownership interests in the entire pool of mortgage loans. Debt service coverage ratio, debt yield and loan-to-value ratio information do not take into account subordinate debt (whether or not secured by the related mortgaged property), if any, that currently exists or is allowed under the terms of any mortgage loan. See Annex A-1 to the Preliminary Prospectus. |
| (2) | Reflects the percentage equal to the Balloon Balance divided by the initial Class A-2 Certificate Balance. |
THE INFORMATION IN THIS STRUCTURAL AND COLLATERAL TERM SHEET IS NOT COMPLETE AND MAY BE AMENDED PRIOR TO THE TIME OF SALE. THIS TERM SHEET IS NOT AN OFFER TO SELL THESE SECURITIES AND IT IS NOT A SOLICITATION OF AN OFFER TO BUY THESE SECURITIES IN ANY JURISDICTION WHERE THE OFFER OR SALE IS NOT PERMITTED.
13
| Wells Fargo Commercial Mortgage Trust 2019-C53 | Characteristics of the Mortgage Pool |
F. Property Type Distribution(1)

| Property Type | Number of Mortgaged Properties | Aggregate
Cut-off Date
Balance ($) | % of Initial
Pool
Balance (%) | Weighted Average Cut-off Date LTV Ratio (%) | Weighted Average Balloon LTV
Ratio (%) | Weighted Average
U/W NCF DSCR (x) | Weighted Average U/W NOI Debt Yield (%) | Weighted Average U/W NCF Debt Yield (%) | Weighted Average Mortgage Rate (%) |
| Office | 8 | $181,722,063 | 25.9 | % | 69.0 | % | 63.2 | % | 1.84 | x | 9.6 | % | 8.7 | % | 3.963 | % |
| Suburban | 6 | 141,972,063 | 20.2 | | 68.5 | | 64.0 | | 1.91 | | 9.2 | | 8.6 | | 3.977 | |
| CBD | 2 | 39,750,000 | 5.7 | | 70.9 | | 60.1 | | 1.62 | | 10.7 | | 9.2 | | 3.914 | |
| Retail | 17 | 139,936,652 | 19.9 | | 56.6 | | 51.9 | | 2.25 | | 10.0 | | 9.6 | | 3.795 | |
| Anchored | 4 | 77,800,000 | 11.1 | | 57.7 | | 55.2 | | 2.75 | | 10.8 | | 10.2 | | 3.513 | |
| Single Tenant | 11 | 55,136,652 | 7.9 | | 54.8 | | 47.1 | | 1.61 | | 9.0 | | 8.8 | | 4.131 | |
| Shadow Anchored | 2 | 7,000,000 | 1.0 | | 59.6 | | 52.8 | | 1.59 | | 9.9 | | 9.4 | | 4.278 | |
| Self Storage | 18 | 81,209,564 | 11.6 | | 67.6 | | 63.5 | | 2.10 | | 8.7 | | 8.6 | | 3.670 | |
| Self Storage | 18 | 81,209,564 | 11.6 | | 67.6 | | 63.5 | | 2.10 | | 8.7 | | 8.6 | | 3.670 | |
| Hospitality | 8 | 76,780,493 | 10.9 | | 63.2 | | 51.6 | | 1.80 | | 13.0 | | 11.3 | | 4.664 | |
| Limited Service | 5 | 44,355,970 | 6.3 | | 64.1 | | 52.0 | | 1.81 | | 13.0 | | 11.5 | | 4.848 | |
| Full Service | 3 | 32,424,524 | 4.6 | | 62.1 | | 51.0 | | 1.78 | | 13.2 | | 11.0 | | 4.412 | |
| Other | 1 | 60,000,000 | 8.5 | | 49.8 | | 49.8 | | 2.44 | | 8.2 | | 8.2 | | 3.300 | |
| Leased Fee | 1 | 60,000,000 | 8.5 | | 49.8 | | 49.8 | | 2.44 | | 8.2 | | 8.2 | | 3.300 | |
| Manufactured Housing Community | 22 | 52,235,247 | 7.4 | | 64.5 | | 53.1 | | 1.49 | | 9.2 | | 9.0 | | 4.376 | |
| Manufactured Housing Community | 22 | 52,235,247 | 7.4 | | 64.5 | | 53.1 | | 1.49 | | 9.2 | | 9.0 | | 4.376 | |
| Mixed Use | 2 | 47,600,000 | 6.8 | | 58.1 | | 58.1 | | 1.90 | | 7.7 | | 7.4 | | 3.869 | |
| Retail/Office | 1 | 32,100,000 | 4.6 | | 57.7 | | 57.7 | | 1.91 | | 7.3 | | 7.0 | | 3.636 | |
| Retail/Parking | 1 | 15,500,000 | 2.2 | | 58.9 | | 58.9 | | 1.88 | | 8.6 | | 8.3 | | 4.350 | |
| Industrial | 5 | 35,300,000 | 5.0 | | 64.9 | | 57.3 | | 1.60 | | 10.1 | | 9.5 | | 4.349 | |
| Distribution | 1 | 23,200,000 | 3.3 | | 62.7 | | 57.2 | | 1.66 | | 10.2 | | 9.8 | | 4.270 | |
| Flex | 4 | 12,100,000 | 1.7 | | 69.2 | | 57.5 | | 1.48 | | 9.9 | | 9.0 | | 4.500 | |
| Multifamily | 4 | 27,387,500 | 3.9 | | 59.6 | | 53.4 | | 2.04 | | 12.2 | | 11.6 | | 3.998 | |
| Garden | 4 | 27,387,500 | 3.9 | | 59.6 | | 53.4 | | 2.04 | | 12.2 | | 11.6 | | 3.998 | |
| Total/Weighted Average: | 85 | $702,171,519 | 100.0 | % | 62.5 | % | 56.8 | % | 1.97 | x | 9.8 | % | 9.2 | % | 3.961 | % |
| (1) | Because this table presents information relating to the mortgaged properties and not the mortgage loans, the information for mortgage loans secured by more than one mortgaged property is based on allocated amounts (allocating the principal balance of the mortgage loan to each of those properties according to the relative appraised values of the mortgaged properties or the allocated loan amounts or property-specific release prices set forth in the related mortgage loan documents or such other allocation as the related mortgage loan seller deemed appropriate). With respect to any mortgage loan that is part of a whole loan, the loan-to-value ratio, debt service coverage ratio and debt yield calculations include the relatedpari passu companion loan(s) (unless otherwise stated). With respect to each mortgage loan, debt service coverage ratio, debt yield and loan-to-value ratio information do not take into account any subordinate debt (whether or not secured by the related mortgaged property) that currently exists or is allowed under the terms of such mortgage loan. See Annex A-1 to the Preliminary Prospectus. |
THE INFORMATION IN THIS STRUCTURAL AND COLLATERAL TERM SHEET IS NOT COMPLETE AND MAY BE AMENDED PRIOR TO THE TIME OF SALE. THIS TERM SHEET IS NOT AN OFFER TO SELL THESE SECURITIES AND IT IS NOT A SOLICITATION OF AN OFFER TO BUY THESE SECURITIES IN ANY JURISDICTION WHERE THE OFFER OR SALE IS NOT PERMITTED.
14
| Wells Fargo Commercial Mortgage Trust 2019-C53 | Characteristics of the Mortgage Pool |
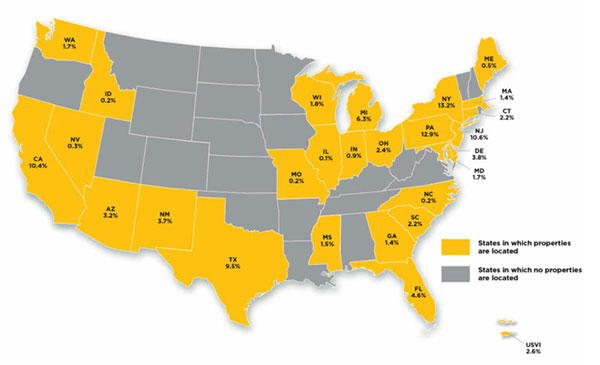
G. Geographic Distribution(1)
| Location | Number of Mortgaged Properties | Aggregate Cut-off Date Balance ($) | % of Initial Pool
Balance (%) | Weighted Average Cut-off Date LTV Ratio (%) | Weighted Average Balloon or ARD LTV Ratio (%) | Weighted Average U/W NCF DSCR (x) | Weighted Average U/W NOI Debt Yield (%) | Weighted Average U/W NCF Debt Yield (%) | Weighted Average Mortgage Rate (%) |
| New York | 4 | $92,500,000 | 13.2 | % | 55.5 | % | 54.0 | % | 2.65 | x | 9.5 | % | 9.1 | % | 3.420 | % |
| Pennsylvania | 8 | 90,703,131 | 12.9 | | 64.7 | | 62.7 | | 2.12 | | 9.9 | | 9.3 | | 3.993 | |
| New Jersey | 5 | 74,528,571 | 10.6 | | 53.2 | | 53.2 | | 2.44 | | 8.1 | | 8.1 | | 3.276 | |
| California | 7 | 73,348,985 | 10.4 | | 59.2 | | 54.1 | | 1.80 | | 9.3 | | 8.9 | | 4.036 | |
| Northern California | 3 | 41,377,147 | 5.9 | | 64.4 | | 61.8 | | 2.10 | | 9.6 | | 9.3 | | 3.854 | |
| Southern California | 4 | 31,971,838 | 4.6 | | 52.5 | | 44.1 | | 1.41 | | 8.8 | | 8.4 | | 4.271 | |
| Texas | 12 | 66,866,710 | 9.5 | | 68.0 | | 59.2 | | 1.58 | | 9.5 | | 9.1 | | 4.068 | |
| Michigan | 1 | 44,500,000 | 6.3 | | 73.4 | | 62.0 | | 1.50 | | 9.4 | | 8.7 | | 4.080 | |
| Florida | 9 | 32,087,536 | 4.6 | | 57.1 | | 54.0 | | 1.82 | | 8.9 | | 8.7 | | 4.336 | |
| Delaware | 1 | 27,000,000 | 3.8 | | 70.8 | | 59.4 | | 1.63 | | 11.0 | | 9.2 | | 3.850 | |
| New Mexico | 2 | 26,248,257 | 3.7 | | 65.0 | | 53.5 | | 1.77 | | 13.0 | | 10.9 | | 4.426 | |
| Arizona | 4 | 22,820,436 | 3.2 | | 60.1 | | 52.0 | | 1.53 | | 10.1 | | 9.2 | | 4.388 | |
| Virgin Islands | 1 | 18,375,000 | 2.6 | | 69.9 | | 60.9 | | 1.72 | | 10.3 | | 10.2 | | 4.300 | |
| Ohio | 5 | 16,600,000 | 2.4 | | 69.2 | | 57.5 | | 1.48 | | 9.9 | | 9.0 | | 4.500 | |
| South Carolina | 1 | 15,775,000 | 2.2 | | 68.9 | | 56.5 | | 1.92 | | 12.3 | | 11.1 | | 4.070 | |
| Connecticut | 4 | 15,227,143 | 2.2 | | 67.9 | | 66.1 | | 2.28 | | 8.0 | | 7.9 | | 3.293 | |
| Wisconsin | 1 | 12,750,000 | 1.8 | | 71.2 | | 61.7 | | 1.59 | | 10.2 | | 9.2 | | 4.051 | |
| Maryland | 4 | 12,273,226 | 1.7 | | 63.0 | | 51.7 | | 1.54 | | 9.6 | | 9.4 | | 4.451 | |
| Washington | 2 | 12,152,063 | 1.7 | | 61.1 | | 54.5 | | 1.67 | | 8.4 | | 8.3 | | 4.227 | |
| Mississippi | 1 | 10,845,775 | 1.5 | | 63.4 | | 50.8 | | 1.32 | | 12.6 | | 10.9 | | 6.565 | |
| Georgia | 3 | 10,020,936 | 1.4 | | 58.0 | | 47.9 | | 1.84 | | 11.7 | | 10.9 | | 4.302 | |
| Massachusetts | 2 | 9,771,429 | 1.4 | | 67.1 | | 67.1 | | 2.42 | | 7.9 | | 7.8 | | 3.175 | |
| Indiana | 2 | 6,199,025 | 0.9 | | 63.6 | | 53.6 | | 2.01 | | 13.9 | | 12.2 | | 4.765 | |
| Maine | 1 | 3,800,000 | 0.5 | | 72.1 | | 62.7 | | 1.55 | | 9.3 | | 9.1 | | 4.200 | |
| Nevada | 1 | 2,450,000 | 0.3 | | 20.4 | | 17.5 | | 4.26 | | 25.3 | | 23.4 | | 3.650 | |
| Idaho | 1 | 1,647,847 | 0.2 | | 69.8 | | 56.6 | | 1.64 | | 10.2 | | 10.0 | | 4.500 | |
| Missouri | 1 | 1,363,355 | 0.2 | | 67.5 | | 54.5 | | 1.39 | | 8.6 | | 8.4 | | 4.450 | |
| North Carolina | 1 | 1,297,754 | 0.2 | | 27.3 | | 20.0 | | 3.31 | | 21.9 | | 21.8 | | 4.350 | |
| Illinois | 1 | 1,019,341 | 0.1 | | 63.3 | | 63.3 | | 1.93 | | 9.6 | | 9.5 | | 4.822 | |
| Total/Weighted Average | 85 | $702,171,519 | 100.0 | % | 62.5 | % | 56.8 | % | 1.97 | x | 9.8 | % | 9.2 | % | 3.961 | % |
| (1) | Because this table presents information relating to the mortgaged properties and not the mortgage loans, the information for mortgage loans secured by more than one mortgaged property is based on allocated amounts (allocating the principal balance of the mortgage loan to each of those properties according to the relative appraised values of the mortgaged properties or the allocated loan amounts or property-specific release prices set forth in the related mortgage loan documents or such other allocation as the related mortgage loan seller deemed appropriate). With respect to any mortgage loan that is part of a whole loan, the loan-to-value ratio, debt service coverage ratio and debt yield calculations include the relatedpari passu companion loan(s) (unless otherwise stated). With respect to each mortgage loan, debt service coverage ratio, debt yield and loan-to-value ratio information do not take into account any subordinate debt (whether or not secured by the related mortgaged property) that currently exists or is allowed under the terms of such mortgage loan. See Annex A-1 to the Preliminary Prospectus. |
THE INFORMATION IN THIS STRUCTURAL AND COLLATERAL TERM SHEET IS NOT COMPLETE AND MAY BE AMENDED PRIOR TO THE TIME OF SALE. THIS TERM SHEET IS NOT AN OFFER TO SELL THESE SECURITIES AND IT IS NOT A SOLICITATION OF AN OFFER TO BUY THESE SECURITIES IN ANY JURISDICTION WHERE THE OFFER OR SALE IS NOT PERMITTED.
15
| Wells Fargo Commercial Mortgage Trust 2019-C53 | Characteristics of the Mortgage Pool |
H. Characteristics of the Mortgage Pool(1)
| CUT-OFF DATE BALANCE |
Range of Cut-off Date
Balances ($) | | Number of
Mortgage
Loans | | Aggregate
Cut-off Date
Balance | | Percent by
Aggregate
Cut-off Date
Pool Balance (%) | |
| 861,914 - 1,000,000 | | 1 | | $861,914 | | 0.1 | % | |
| 1,000,001 - 2,000,000 | | 6 | | 8,664,442 | | 1.2 | | |
| 2,000,001 - 3,000,000 | | 7 | | 16,811,954 | | 2.4 | | |
| 3,000,001 - 4,000,000 | | 6 | | 21,312,068 | | 3.0 | | |
| 4,000,001 - 5,000,000 | | 4 | | 18,723,976 | | 2.7 | | |
| 5,000,001 - 6,000,000 | | 4 | | 21,917,111 | | 3.1 | | |
| 6,000,001 - 7,000,000 | | 2 | | 13,048,330 | | 1.9 | | |
| 7,000,001 - 8,000,000 | | 1 | | 7,188,257 | | 1.0 | | |
| 8,000,001 - 9,000,000 | | 4 | | 34,790,988 | | 5.0 | | |
| 9,000,001 - 10,000,000 | | 1 | | 9,750,000 | | 1.4 | | |
| 10,000,001 - 15,000,000 | | 5 | | 57,120,644 | | 8.1 | | |
| 15,000,001 - 20,000,000 | | 6 | | 103,510,000 | | 14.7 | | |
| 20,000,001 - 30,000,000 | | 5 | | 123,471,838 | | 17.6 | | |
| 30,000,001 - 50,000,000 | | 5 | | 205,000,000 | | 29.2 | | |
| 50,000,001 - 60,000,000 | | 1 | | 60,000,000 | | 8.5 | | |
| Total: | | 58 | | $702,171,519 | | 100.0 | % | |
| Average | | $12,106,406 | | | | | | |
| UNDERWRITTEN NOI DEBT SERVICE COVERAGE RATIO |
Range of U/W NOI
DSCRs (x) | | Number of
Mortgage
Loans | | Aggregate
Cut-off Date
Balance | | Percent by
Aggregate
Cut-off Date
Pool Balance (%) | |
| 1.33 - 1.40 | | 5 | | $28,036,954 | | 4.0 | % | |
| 1.41 - 1.50 | | 9 | | 44,134,711 | | 6.3 | | |
| 1.51 - 1.60 | | 7 | | 65,022,503 | | 9.3 | | |
| 1.61 - 1.70 | | 5 | | 74,411,687 | | 10.6 | | |
| 1.71 - 1.80 | | 7 | | 88,925,000 | | 12.7 | | |
| 1.81 - 1.90 | | 2 | | 4,453,045 | | 0.6 | | |
| 1.91 - 2.00 | | 6 | | 110,525,146 | | 15.7 | | |
| 2.01 - 2.50 | | 10 | | 210,693,783 | | 30.0 | | |
| 2.51 - 3.00 | | 2 | | 6,120,936 | | 0.9 | | |
| 3.01 - 3.50 | | 2 | | 19,497,754 | | 2.8 | | |
| 3.51 - 4.00 | | 1 | | 45,500,000 | | 6.5 | | |
| 4.01 - 5.02 | | 2 | | 4,850,000 | | 0.7 | | |
| Total: | | 58 | | $702,171,519 | | 100.0 | % | |
| Weighted Average | | 2.09x | | | | | | |
| UNDERWRITTEN NCF DEBT SERVICE COVERAGE RATIO |
Range of U/W NCF
DSCRs (x) | | Number of
Mortgage
Loans | | Aggregate
Cut-off Date
Balance | | Percent by
Aggregate
Cut-off Date
Pool Balance (%) | |
| 1.30 | | 1 | | $8,250,000 | | 1.2 | % | |
| 1.31 - 1.40 | | 9 | | 50,929,290 | | 7.3 | | |
| 1.41 - 1.50 | | 11 | | 125,564,877 | | 17.9 | | |
| 1.51 - 1.60 | | 5 | | 37,963,840 | | 5.4 | | |
| 1.61 - 1.70 | | 5 | | 77,547,847 | | 11.0 | | |
| 1.71 - 1.80 | | 4 | | 46,335,000 | | 6.6 | | |
| 1.81 - 1.90 | | 5 | | 33,317,569 | | 4.7 | | |
| 1.91 - 2.00 | | 6 | | 92,777,293 | | 13.2 | | |
| 2.01 - 2.50 | | 6 | | 156,938,048 | | 22.4 | | |
| 2.51 - 3.00 | | 2 | | 20,900,000 | | 3.0 | | |
| 3.01 - 3.50 | | 1 | | 1,297,754 | | 0.2 | | |
| 3.51 - 4.00 | | 1 | | 45,500,000 | | 6.5 | | |
| 4.01 - 4.83 | | 2 | | 4,850,000 | | 0.7 | | |
| Total: | | 58 | | $702,171,519 | | 100.0 | % | |
| Weighted Average | | 1.97x | | | | | | |
| LOAN PURPOSE |
| Loan Purpose | | Number of
Mortgage
Loans | | Aggregate
Cut-off Date
Balance | | Percent by
Aggregate
Cut-off Date
Pool Balance (%) | |
| Refinance | | 33 | | $431,158,739 | | 61.4 | % | |
| Acquisition | | 24 | | 244,012,780 | | 34.8 | | |
| Recapitalization | | 1 | | 27,000,000 | | 3.8 | | |
| Total: | | 58 | | $702,171,519 | | 100.0 | % | |
| | | | | | |
| MORTGAGE RATE |
Range of Mortgage
Rates (%) | | Number of Mortgage Loans | | Aggregate
Cut-off Date
Balance | | Percent by
Aggregate
Cut-off Date
Pool Balance (%) | |
| 3.015 - 3.500 | | 3 | | $150,500,000 | | 21.4 | % | |
| 3.501 - 3.750 | | 5 | | 85,150,000 | | 12.1 | | |
| 3.751 - 4.000 | | 5 | | 66,155,805 | | 9.4 | | |
| 4.001 - 4.250 | | 16 | | 196,243,283 | | 27.9 | | |
| 4.251 - 4.500 | | 19 | | 150,375,366 | | 21.4 | | |
| 4.501 - 4.750 | | 7 | | 41,020,035 | | 5.8 | | |
| 4.751 - 5.000 | | 1 | | 1,019,341 | | 0.1 | | |
| 5.001 - 6.500 | | 1 | | 861,914 | | 0.1 | | |
| 6.501 - 6.565 | | 1 | | 10,845,775 | | 1.5 | | |
| Total: | | 58 | | $702,171,519 | | 100.0 | % | |
| Weighted Average | | 3.961% | | | | |
| UNDERWRITTEN NOI DEBT YIELD |
Range of U/W NOI
Debt Yields (%) | | Number of
Mortgage
Loans | | Aggregate
Cut-off Date
Balance | | Percent by
Aggregate
Cut-off Date
Pool Balance (%) | |
| 7.2 - 8.0 | | 5 | | $121,500,000 | | 17.3 | % | |
| 8.1 - 9.0 | | 16 | | 154,423,502 | | 22.0 | | |
| 9.1 - 10.0 | | 13 | | 173,457,595 | | 24.7 | | |
| 10.1 - 11.0 | | 8 | | 94,965,238 | | 13.5 | | |
| 11.1 - 12.0 | | 4 | | 56,696,936 | | 8.1 | | |
| 12.1 - 13.0 | | 5 | | 72,857,922 | | 10.4 | | |
| 13.1 - 14.0 | | 2 | | 13,364,524 | | 1.9 | | |
| 14.1 - 20.0 | | 2 | | 8,758,048 | | 1.2 | | |
| 20.1 - 27.7 | | 3 | | 6,147,754 | | 0.9 | | |
| Total: | | 58 | | $702,171,519 | | 100.0 | % | |
| Weighted Average | | 9.8% | | | | |
| UNDERWRITTEN NCF DEBT YIELD |
Range of U/W NCF
Debt Yields (%) | | Number of
Mortgage
Loans | | Aggregate
Cut-off Date
Balance | | Percent by
Aggregate
Cut-off Date
Pool Balance (%) | |
| 7.0 - 8.0 | | 8 | | $134,636,954 | | 19.2 | % | |
| 8.1 - 9.0 | | 21 | | 278,699,048 | | 39.7 | | |
| 9.1 - 10.0 | | 10 | | 104,542,942 | | 14.9 | | |
| 10.1 - 11.0 | | 10 | | 133,855,238 | | 19.1 | | |
| 11.1 - 12.0 | | 3 | | 28,343,278 | | 4.0 | | |
| 12.1 - 13.0 | | 2 | | 12,525,368 | | 1.8 | | |
| 13.1 - 20.0 | | 1 | | 3,420,936 | | 0.5 | | |
| 20.1 - 26.7 | | 3 | | 6,147,754 | | 0.9 | | |
| Total: | | 58 | | $702,171,519 | | 100.0 | % | |
| Weighted Average | | 9.2% | | | | |
| ORIGINAL TERM TO MATURITY OR ARD |
Original Terms to
Maturity or ARD (months) | | Number of
Mortgage
Loans | | Aggregate
Cut-off Date
Balance | | Percent by
Aggregate
Cut-off Date
Pool Balance (%) | |
| 60 | | 1 | | $45,000,000 | | 6.4 | % | |
| 120 | | 57 | | 657,171,519 | | 93.6 | | |
| Total: | | 58 | | $702,171,519 | | 100.0 | % | |
| Weighted Average | 116 months | | | | | |
| (1) | With respect to any mortgage loan that is part of a whole loan, the loan-to-value ratio, debt service coverage ratio and debt yield calculations include the relatedpari passucompanion loan(s) (unless otherwise stated). With respect to each mortgage loan, debt service coverage ratio, debt yield and loan-to-value ratio information do not take into account any subordinate debt (whether or not secured by the related mortgaged property) that currently exists or is allowed under the terms of such mortgage loan. See Annex A-1 to the Preliminary Prospectus. Prepayment provisions for each mortgage loan reflects the entire life of the loan (from origination to maturity or ARD). |
THE INFORMATION IN THIS STRUCTURAL AND COLLATERAL TERM SHEET IS NOT COMPLETE AND MAY BE AMENDED PRIOR TO THE TIME OF SALE. THIS TERM SHEET IS NOT AN OFFER TO SELL THESE SECURITIES AND IT IS NOT A SOLICITATION OF AN OFFER TO BUY THESE SECURITIES IN ANY JURISDICTION WHERE THE OFFER OR SALE IS NOT PERMITTED.
16
| Wells Fargo Commercial Mortgage Trust 2019-C53 | Characteristics of the Mortgage Pool |
| REMAINING TERM TO MATURITY OR ARD |
Range of Remaining Terms to
Maturity or ARD (months) | | Number of
Mortgage
Loans | | Aggregate
Cut-off Date
Balance | | Percent by
Aggregate
Cut-off Date
Pool Balance (%) | |
| 59 | | 1 | | $45,000,000 | | 6.4 | % | |
| 109 - 119 | | 57 | | 657,171,519 | | 93.6 | | |
| Total: | | 58 | | $702,171,519 | | 100.0 | % | |
| Weighted Average | | 115 months | | | | | | |
| ORIGINAL AMORTIZATION TERM(2) |
Original
Amortization Terms
(months) | | Number of
Mortgage
Loans | | Aggregate
Cut-off Date
Balance | | Percent by
Aggregate
Cut-off Date
Pool Balance (%) | |
| Non-Amortizing | | 13 | | $299,461,255 | | 42.6 | % | |
| 300 | | 4 | | 23,924,176 | | 3.4 | | |
| 360 | | 41 | | 378,786,088 | | 53.9 | | |
| Total: | | 58 | | $702,171,519 | | 100.0 | % | |
| Weighted Average(3) | | 356 months | | | | | | |
(2) The original amortization term shown for any mortgage loan that is interest-only for part of its term does not include the number of months in its interest-only period and reflects only the number of months as of the commencement of amortization remaining from the end of such interest-only period. (3) Excludes the non-amortizing mortgage loans. |
| REMAINING AMORTIZATION TERM(4) |
Range of Remaining
Amortization Terms
(months) | | Number of
Mortgage
Loans | | Aggregate
Cut-off Date
Balance | | Percent by
Aggregate
Cut-off Date
Pool Balance (%) | |
| Non-Amortizing | | 13 | | $299,461,255 | | 42.6 | % | |
| 289 - 299 | | 4 | | 23,924,176 | | 3.4 | | |
| 357 - 360 | | 41 | | 378,786,088 | | 53.9 | | |
| Total: | | 58 | | $702,171,519 | | 100.0 | % | |
| Weighted Average(5) | | 356 months | | | | | | |
(4) The remaining amortization term shown for any mortgage loan that is interest-only for part of its term does not include the number of months in its interest-only period and reflects only the number of months as of the commencement of amortization remaining from the end of such interest-only period. (5) Excludes the non-amortizing mortgage loans. |
| LOCKBOXES |
| Type of Lockbox | | Number of
Mortgage
Loans | | Aggregate
Cut-off Date
Balance | | Percent by
Aggregate
Cut-off Date
Pool Balance (%) | |
| Springing | | 36 | | $317,764,322 | | 45.3 | % | |
| Hard/Springing Cash Management | | 13 | | 254,358,105 | | 36.2 | | |
| Hard/Upfront Cash Management | | 6 | | 118,327,030 | | 16.9 | | |
| Soft/Springing Cash Management | | 1 | �� | 6,872,063 | | 1.0 | | |
| None | | 2 | | 4,850,000 | | 0.7 | | |
| Total: | | 58 | | $702,171,519 | | 100.0 | % | |
| PREPAYMENT PROVISION SUMMARY(6) |
| Prepayment Provision | | Number of
Mortgage
Loans | | Aggregate
Cut-off Date
Balance | Percent by
Aggregate
Cut-off Date
Pool Balance (%) | |
| Lockout / Defeasance / Open | | 46 | | $608,804,448 | | 86.7 | % | |
| Lockout / GRTR 1% or YM / Open | | 8 | | 86,635,816 | | 12.3 | | |
| Lockout / GRTR 1% or YM or Defeasance / Open | | 2 | | 4,850,000 | | 0.7 | | |
| YM / YM or Defeasance / Open | | 2 | | 1,881,255 | | 0.3 | | |
| Total: | | 58 | | $702,171,519 | | 100.0 | % | |
| (6) As a result of property releases or the application of funds in a performance reserve, partial principal prepayments could occur during a period that voluntary principal prepayments are otherwise prohibited. |
| CUT-OFF DATE LOAN-TO-VALUE RATIO |
Range of Cut-off
Date LTV Ratios (%) | | Number of
Mortgage
Loans | | Aggregate
Cut-off Date
Balance | | Percent by
Aggregate
Cut-off Date
Pool Balance (%) | |
| 16.6 - 20.0 | | 1 | | $2,400,000 | | 0.3 | % | |
| 20.1 - 25.0 | | 1 | | 2,450,000 | | 0.3 | | |
| 25.1 - 45.0 | | 1 | | 1,297,754 | | 0.2 | | |
| 45.1 - 50.0 | | 4 | | 72,643,217 | | 10.3 | | |
| 50.1 - 55.0 | | 6 | | 86,455,360 | | 12.3 | | |
| 55.1 - 60.0 | | 10 | | 93,858,403 | | 13.4 | | |
| 60.1 - 65.0 | | 10 | | 79,169,141 | | 11.3 | | |
| 65.1 - 70.0 | | 16 | | 235,132,034 | | 33.5 | | |
| 70.1 - 73.4 | | 9 | | 128,765,611 | | 18.3 | | |
| Total: | | 58 | | $702,171,519 | | 100.0 | % | |
| Weighted Average | | 62.5% | | | | |
| BALLOON or ARD LOAN-TO-VALUE RATIO | |
Range of Balloon or ARD
LTV Ratios (%) | | Number of
Mortgage
Loans | | Aggregate
Cut-off Date
Balance | | Percent by
Aggregate
Cut-off Date
Pool Balance (%) | |
| 14.2 - 35.0 | | 3 | | $6,147,754 | | 0.9 | % | |
| 35.1 - 40.0 | | 2 | | 26,377,643 | | 3.8 | | |
| 40.1 - 45.0 | | 5 | | 23,109,191 | | 3.3 | | |
| 45.1 - 50.0 | | 7 | | 91,770,146 | | 13.1 | | |
| 50.1 - 55.0 | | 9 | | 88,268,363 | | 12.6 | | |
| 55.1 - 60.0 | | 17 | | 202,140,667 | | 28.8 | | |
| 60.1 - 65.0 | | 12 | | 151,457,755 | | 21.6 | | |
| 65.1 - 70.0 | | 3 | | 112,900,000 | | 16.1 | | |
| Total: | | 58 | | $702,171,519 | | 100.0 | % | |
| Weighted Average | | 56.8% | | | | |
| AMORTIZATION TYPE |
| Amortization Type | | Number of
Mortgage
Loans | | Aggregate
Cut-off Date
Balance | | Percent by
Aggregate
Cut-off Date
Pool Balance (%) | |
| Interest-only, Balloon | | 11 | | $297,580,000 | | 42.4 | % | |
| Interest-only, Amortizing Balloon | | 25 | | 282,881,500 | | 40.3 | | |
| Amortizing Balloon | | 20 | | 119,828,764 | | 17.1 | | |
| Interest-only, ARD | | 2 | | 1,881,255 | | 0.3 | | |
| Total: | | 58 | | $702,171,519 | | 100.0 | % | |
| ORIGINAL TERM OF INTEREST-ONLY PERIOD FOR PARTIAL IO LOANS |
| IO Terms (months) | | Number of
Mortgage
Loans | | Aggregate
Cut-off Date
Balance | | Percent by
Aggregate
Cut-off Date
Pool Balance (%) | |
| 12 | | 5 | | $39,750,000 | | 5.7 | % | |
| 24 | | 6 | | 108,560,000 | | 15.5 | | |
| 36 | | 7 | | 44,384,000 | | 6.3 | | |
| 48 | | 1 | | 9,750,000 | | 1.4 | | |
| 60 | | 6 | | 80,437,500 | | 11.5 | | |
| Total: | | 25 | | $282,881,500 | | 40.3 | % | |
| Weighted Average | | 35 months | | | | | | |
| SEASONING |
| Seasoning (months) | | Number of
Mortgage
Loans | | Aggregate
Cut-off Date
Balance | | Percent by
Aggregate
Cut-off Date
Pool Balance (%) | |
| 1 | | 28 | | $413,743,181 | | 58.9 | % | |
| 2 | | 21 | | 226,665,686 | | 32.3 | | |
| 3 | | 7 | | 40,416,878 | | 5.8 | | |
| 4 | | 1 | | 10,500,000 | | 1.5 | | |
| 11 | | 1 | | 10,845,775 | | 1.5 | | |
| Total: | | 58 | | $702,171,519 | | 100.0 | % | |
| Weighted Average | | 2 months | | | | | | |
THE INFORMATION IN THIS STRUCTURAL AND COLLATERAL TERM SHEET IS NOT COMPLETE AND MAY BE AMENDED PRIOR TO THE TIME OF SALE. THIS TERM SHEET IS NOT AN OFFER TO SELL THESE SECURITIES AND IT IS NOT A SOLICITATION OF AN OFFER TO BUY THESE SECURITIES IN ANY JURISDICTION WHERE THE OFFER OR SALE IS NOT PERMITTED.
17
Wells Fargo Commercial Mortgage Trust 2019-C53 | Certain Terms and Conditions |
V. Certain Terms and Conditions
| Interest Entitlements: | The interest entitlement of each Class of Certificates on each Distribution Date generally will be the interest accrued during the related Interest Accrual Period on the related Certificate Balance or Notional Amount at the related pass-through rate, net of any prepayment interest shortfalls allocated to that Class for such Distribution Date as described below. If prepayment interest shortfalls arise from voluntary prepayments (without Master Servicer consent) on particular non-specially serviced loans during any collection period, the Master Servicer is required to make a compensating interest payment to offset those shortfalls, generally up to an amount equal to the portion of its master servicing fees that accrue at 0.25 basis pointsper annum. The remaining amount of prepayment interest shortfalls will be allocated to reduce the interest entitlement on all Classes of Certificates entitled to interest, on apro rata basis, based on their respective amounts of accrued interest for the related Distribution Date. If a Class receives less than the entirety of its interest entitlement on any Distribution Date, then the shortfall (excluding any shortfall due to prepayment interest shortfalls), together with interest thereon, will be added to its interest entitlement for the next succeeding Distribution Date. |
| | |
| Principal Distribution Amount: | The Principal Distribution Amount for each Distribution Date generally will be the aggregate amount of principal received or advanced in respect of the mortgage loans, net of any non-recoverable advances and interest thereon and workout-delayed reimbursement amounts that are reimbursed to the Master Servicer, the Special Servicer or the Trustee during the related collection period. Non-recoverable advances and interest thereon are reimbursable from principal collections and advances before reimbursement from other amounts. Workout-delayed reimbursement amounts are reimbursable from principal collections. |
| | |
| Subordination, Allocation of Losses and Certain Expenses | The chart below describes the manner in which the payment rights of certain Classes of Certificates will be senior or subordinate, as the case may be, to the payment rights of other Classes of Certificates. The chart also shows the corresponding entitlement to receive principal and/or interest of certain Classes of Certificates (other than excess interest that accrues on each mortgage loan that has an anticipated repayment date) on any distribution date in descending order. It also shows the manner in which losses are allocated to certain Classes of Certificates in ascending order (beginning with the Non-Offered Certificates, and other than the Class V and Class R Certificates) to reduce the balance of each such Class to zero;provided that no principal payments or mortgage loan losses will be allocated to the Class X-A, X-B, X-D, V or R Certificates, although principal payments and losses may reduce the Notional Amounts of the Class X-A, X-B and X-D Certificates and, therefore, the amount of interest they accrue. |
| | |
| | 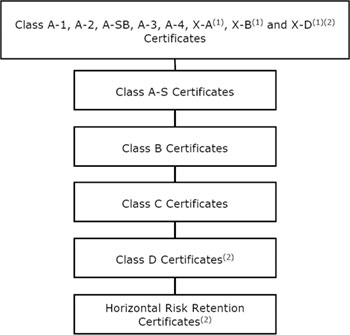 |
| | |
| | (1) The Class X-A, X-B and X-D Certificates are interest-only certificates.
(2) Non-Offered Certificates. |
THE INFORMATION IN THIS STRUCTURAL AND COLLATERAL TERM SHEET IS NOT COMPLETE AND MAY BE AMENDED PRIOR TO THE TIME OF SALE. THIS TERM SHEET IS NOT AN OFFER TO SELL THESE SECURITIES AND IT IS NOT A SOLICITATION OF AN OFFER TO BUY THESE SECURITIES IN ANY JURISDICTION WHERE THE OFFER OR SALE IS NOT PERMITTED.
18
Wells Fargo Commercial Mortgage Trust 2019-C53 | Certain Terms and Conditions |
| Distributions: | On each Distribution Date, funds available for distribution from the mortgage loans, net of specified trust fees, expenses and reimbursements will generally be distributed in the following amounts and order of priority (in each case to the extent of remaining available funds): |
| | |
| | 1. Class A-1, A-2, A-SB, A-3, A-4, X-A, X-B and X-D Certificates: To interest on the Class A-1, A-2, A-SB, A-3, A-4, X-A, X-B and X-D Certificates,pro rata, according to their respective interest entitlements. |
| | |
| | 2. Class A-1, A-2, A-SB, A-3 and A-4 Certificates: To principal on the Class A-1, A-2, A-SB, A-3 and A-4 Certificates in the following amounts and order of priority: (i) first, to principal on the Class A-SB Certificates, in an amount up to the Principal Distribution Amount for such Distribution Date until their Certificate Balance is reduced to the Class A-SB Planned Principal Balance for such Distribution Date; (ii) second, to principal on the Class A-1 Certificates until their Certificate Balance is reduced to zero, up to the remainder of the Principal Distribution Amount for such Distribution Date; (iii) third, to principal on the Class A-2 Certificates until their Certificate Balance is reduced to zero, up to the remainder of the Principal Distribution Amount for such Distribution Date; (iv) fourth, to principal on the Class A-3 Certificates until their Certificate Balance is reduced to zero, up to the remainder of the Principal Distribution Amount for such Distribution Date; (v) fifth, to principal on the Class A-4 Certificates until their Certificate Balance is reduced to zero, up to the remainder of the Principal Distribution Amount for such Distribution Date; and (vi) sixth, to principal on the Class A-SB Certificates until their Certificate Balance is reduced to zero, up to the remainder of the Principal Distribution Amount for such Distribution Date. However, if the Certificate Balance of each Class of Principal Balance Certificates, other than the Class A-1, A-2, A-SB, A-3 and A-4 Certificates, has been reduced to zero as a result of the allocation of Mortgage Loan losses and expenses and any of the Class A-1, A-2, A-SB, A-3 and A-4 Certificates remains outstanding, then the Principal Distribution Amount will be distributed to the Class A-1, A-2, A-SB, A-3 and A-4 Certificates,pro rata, based on their respective outstanding Certificate Balances, until their Certificate Balances have been reduced to zero. |
| | |
| | 3. Class A-1, A-2, A-SB, A-3 and A-4 Certificates: To reimburse the holders of the Class A-1, A-2, A-SB, A-3 and A-4 Certificates,pro rata, on the basis of previously allocated unreimbursed losses, for any previously unreimbursed losses (plus interest thereon) on the mortgage loans that were previously allocated in reduction of the Certificate Balances of such Classes. |
| | |
| | 4. Class A-S Certificates: To make distributions on the Class A-S Certificates as follows: (a) first, to interest on the Class A-S Certificates in the amount of the interest entitlement for that Class; (b) next, to the extent of the portion of the Principal Distribution Amount remaining after distributions in respect of principal to each Class with a higher distribution priority (in this case, the Class A-1, A-2, A-SB, A-3 and A-4 Certificates), to principal on the Class A-S Certificates until their Certificate Balance is reduced to zero; and (c) next, to reimburse the holders of the Class A-S Certificates for any previously unreimbursed losses (plus interest thereon) on the mortgage loans that were previously allocated to that Class in reduction of their Certificate Balance. 5. Class B Certificates: To make distributions on the Class B Certificates as follows: (a) first, to interest on the Class B Certificates in the amount of the interest entitlement for that Class; (b) next, to the extent of the portion of the Principal Distribution Amount remaining after distributions in respect of principal to each Class with a higher distribution priority (in this case, the Class A-1, A-2, A-SB, A-3, A-4 and A-S Certificates), to principal on the Class B Certificates until their Certificate Balance is reduced to zero; and (c) next, to reimburse the holders of the Class B Certificates for any previously unreimbursed losses (plus interest thereon) on the mortgage loans that were previously allocated to that Class in reduction of their Certificate Balance. 6. Class C Certificates: To make distributions on the Class C Certificates as follows: (a) first, to interest on the Class C Certificates in the amount of the interest entitlement for that Class; (b) next, to the extent of the portion of the Principal Distribution Amount remaining after distributions in respect of principal to each Class with a higher distribution priority (in this case, the Class A-1, A-2, A-SB, A-3, A-4, A-S and B Certificates), to principal on the Class C Certificates until their Certificate Balance is reduced to zero; and (c) next, to reimburse the holders of the Class C Certificates for any previously unreimbursed losses (plus interest thereon) on the mortgage loans that were previously allocated to that Class in reduction of their Certificate Balance. 7. After the Class A-1, A-2, A-SB, A-3, A-4, X-A, X-B, X-D, A-S, B and C Certificates are paid all amounts to which they are entitled, the remaining funds available for distribution will be used to pay interest, principal and loss reimbursement amounts on the Class D, E-RR, |
THE INFORMATION IN THIS STRUCTURAL AND COLLATERAL TERM SHEET IS NOT COMPLETE AND MAY BE AMENDED PRIOR TO THE TIME OF SALE. THIS TERM SHEET IS NOT AN OFFER TO SELL THESE SECURITIES AND IT IS NOT A SOLICITATION OF AN OFFER TO BUY THESE SECURITIES IN ANY JURISDICTION WHERE THE OFFER OR SALE IS NOT PERMITTED.
19
Wells Fargo Commercial Mortgage Trust 2019-C53 | Certain Terms and Conditions |
| | F-RR, G-RR, H-RR, J-RR, K-RR and L-RR Certificates sequentially in that order in a manner analogous to the Class C Certificates. |
| | |
| Allocation of Yield Maintenance Charges and Prepayment Premiums: | If any yield maintenance charge or prepayment premium is collected during any particular collection period with respect to any mortgage loan, then on the Distribution Date corresponding to that collection period, the certificate administrator will pay that yield maintenance charge or prepayment premium (net of liquidation fees payable therefrom) in the following manner: (1) to each of the Class A-1, A-2, A-SB, A-3, A-4, A-S, B, C and D Certificates, the product of (a) the yield maintenance charge or prepayment premium, (b) the related Base Interest Fraction (as defined in the Preliminary Prospectus) for such Class, and (c) a fraction, the numerator of which is equal to the amount of principal distributed to such Class for that Distribution Date, and the denominator of which is the total amount of principal distributed to all Principal Balance Certificates for that Distribution Date, (2) to the Class X-A Certificates, the excess, if any, of (a) the product of (i) such yield maintenance charge or prepayment premium and (ii) a fraction, the numerator of which is equal to the amount of principal distributed to the Class A-1, A-2, A-SB, A-3 and A-4 Certificates for that Distribution Date, and the denominator of which is the total amount of principal distributed to all Principal Balance Certificates for that Distribution Date, over (b) the amount of such yield maintenance charge or prepayment premium distributed to the Class A-1, A-2, A-SB, A-3 and A-4 Certificates as described above, and (3) to the Class X-B Certificates, any remaining portion of such yield maintenance charge or prepayment premium not distributed as described above. No prepayment premiums or yield maintenance charges will be distributed to the holders of the Class X-D, E-RR, F-RR, G-RR, H-RR, J-RR, K-RR, L-RR, V or R Certificates. For a description of when prepayment premiums and yield maintenance charges are generally required on the mortgage loans, see Annex A-1 to the Preliminary Prospectus. See also “Risk Factors—Risks Relating to the Mortgage Loans—Risks Relating to Enforceability of Yield Maintenance Charges, Prepayment Premiums or Defeasance Provisions” and “Risk Factors—Other Risks Relating to the Certificates—Your Yield May Be Affected by Defaults, Prepayments and Other Factors” in the Preliminary Prospectus. Prepayment premiums and yield maintenance charges will be distributed on each Distribution Date only to the extent they are actually received on the mortgage loans as of the related Determination Date. |
| | |
| Realized Losses: | The Certificate Balances of the Class A-1, A-2, A-SB, A-3, A-4, A-S, B, C, D, E-RR, F-RR, G-RR, H-RR, J-RR, K-RR and L-RR Certificates will be reduced without distribution on any Distribution Date as a write-off to the extent of any losses realized on the mortgage loans allocated to such Class on such Distribution Date. Such losses will be applied in the following order, in each case until the related Certificate Balance is reduced to zero: first, to the Class L-RR Certificates; second, to the Class K-RR Certificates; third, to the Class J-RR Certificates; fourth, to the Class H-RR Certificates; fifth, to the Class G-RR Certificates; sixth, to the Class F-RR Certificates; seventh, to the Class E-RR Certificates; eighth, to the Class D Certificates; ninth, to the Class C Certificates; tenth, to the Class B Certificates; eleventh, to the Class A-S Certificates; and, finally,pro rata, to the Class A-1, A-2, A-SB, A-3 and A-4 Certificates based on their outstanding Certificate Balances. The Notional Amount of the Class X-A Certificates will be reduced by the amount of all losses that are allocated to the Class A-1, A-2, A-SB, A-3 and A-4 Certificates as write-offs in reduction of their Certificate Balances. The Notional Amount of the Class X-B Certificates will be reduced by the amount of all losses that are allocated to the Class A-S, B or C Certificates as write-offs in reduction of their Certificate Balances. The Notional Amount of the Class X-D Certificates will be reduced by the amount of all losses that are allocated to the Class D Certificates as write-offs in reduction of its Certificate Balance. |
| | |
| P&I Advances: | The Master Servicer or, if the Master Servicer fails to do so, the Trustee, will be obligated to advance delinquent debt service payments (other than balloon payments, excess interest and default interest) and assumed debt service payments on mortgage loans with delinquent balloon payments (excluding any related companion loan), except to the extent any such advance is deemed non-recoverable from collections on the related mortgage loan. In addition, if an Appraisal Reduction Amount exists for a given mortgage loan, the interest portion of any P&I advance for such mortgage loan will be reduced, which will have the effect of reducing the amount of interest available for distribution to the Certificates in reverse alphabetical order of their Class designations (except that interest payments on the Class A-1, A-2, A-SB, A-3, A-4, X-A, X-B and X-D Certificates would be affected on apari passu basis). |
| | |
| Servicing Advances: | The Master Servicer or, if the Master Servicer fails to do so, the Trustee, will be obligated to make servicing advances, including the payment of delinquent property taxes, insurance premiums and ground rent, except to the extent that those advances are deemed non-recoverable from collections on the related mortgage loan. The Master Servicer or the Trustee, as applicable, will have the primary obligation to make any required servicing advances with respect to any serviced |
THE INFORMATION IN THIS STRUCTURAL AND COLLATERAL TERM SHEET IS NOT COMPLETE AND MAY BE AMENDED PRIOR TO THE TIME OF SALE. THIS TERM SHEET IS NOT AN OFFER TO SELL THESE SECURITIES AND IT IS NOT A SOLICITATION OF AN OFFER TO BUY THESE SECURITIES IN ANY JURISDICTION WHERE THE OFFER OR SALE IS NOT PERMITTED.
20
Wells Fargo Commercial Mortgage Trust 2019-C53 | Certain Terms and Conditions |
| | whole loan. With respect to any non-serviced whole loan, the master servicer or trustee, as applicable, under the related lead securitization servicing agreement will have the primary obligation to make any required servicing advances with respect to such non-serviced whole loan. |
| | |
Appraisal Reduction Amounts and Collateral Deficiency Amounts: | An “Appraisal Reduction Amount” generally will be created in the amount, if any, by which the principal balance of a required appraisal loan (which is a mortgage loan (other than a non-serviced mortgage loan) with respect to which certain defaults, modifications or insolvency events have occurred as further described in the Preliminary Prospectus) plus other amounts overdue or advanced in connection with such mortgage loan exceeds 90% of the appraised value of the related mortgaged property plus certain escrows and reserves (including letters of credit) held with respect to the mortgage loan. With respect to any serviced whole loan, any Appraisal Reduction Amount will be allocated,pro rata, to the related mortgage loan and the relatedpari passu companion loan(s). With respect to any non-serviced mortgage loan, appraisal reduction amounts are expected to be calculated in a similar manner under the related non-serviced pooling and servicing agreement. A mortgage loan will cease to be a required appraisal loan when the same has ceased to be a specially serviced loan (if applicable), has been brought current for at least three consecutive months and no other circumstances exist that would cause such mortgage loan to be a required appraisal loan. A “Collateral Deficiency Amount” will exist with respect to any mortgage loan that is modified into an AB loan structure and remains a corrected mortgage loan and will generally equal the excess of (i) the stated principal balance of such AB modified loan (taking into account the related junior note(s) and anypari passu notes included therein), over (ii) the sum of (in the case of a whole loan, solely to the extent allocable to the subject mortgage loan) (x) the most recent appraised value of the related mortgaged property plus (y) solely to the extent not reflected or taken into account in such appraised value and to the extent on deposit with, or otherwise under the control of, the lender as of the date of such determination, any capital or additional collateral contributed by the related borrower at the time the mortgage loan (and as part of the modification thereto) became an AB modified loan plus (z) any other escrows or reserves (in addition to any amounts set forth in the immediately preceding clause (y)) held with respect to the mortgage loan as of the date of such determination. A “Cumulative Appraisal Reduction Amount” with respect to any mortgage loan will be the sum of any Appraisal Reduction Amount and any Collateral Deficiency Amount. Appraisal Reduction Amounts will affect the amount of debt service advances in respect of the related mortgage loan. Additionally, Cumulative Appraisal Reduction Amounts will be taken into account in the determination of the identity of the Class whose majority constitutes the “majority controlling class certificateholder” and is entitled to appoint the directing certificateholder. |
| | |
Clean-Up Call and Exchange Termination: | On each Distribution Date occurring after the aggregate unpaid principal balance of the pool of mortgage loans is less than 1.0% of the principal balance of the mortgage loans as of the cut-off date (solely for the purposes of this calculation, if such right is being exercised after the distribution date in November 2029 and either of the Dollar General Chillicothe mortgage loan or the Dollar General Poseyville mortgage loan is still an asset of the issuing entity, then such mortgage loan will be excluded from the then aggregate stated principal balance of the pool of mortgage loans and from the initial pool balance), certain specified persons will have the option to purchase all of the remaining mortgage loans (and the trust’s interest in all property acquired through exercise of remedies in respect of any mortgage loan) at the price specified in the Preliminary Prospectus. Exercise of the option will terminate the trust and retire the then-outstanding Certificates. If the aggregate Certificate Balances of each of the Class A-1, A-2, A-SB, A-3, A-4, A-S, B, C and D Certificates have been reduced to zero, the trust may also be terminated in connection with an exchange of all the then-outstanding Certificates (other than the Class V and Class R Certificates) for the mortgage loans and REO properties then remaining in the issuing entity, subject to payment of a price specified in the Preliminary Prospectus, but all of the holders of those outstanding Classes (other than the Class V and Class R Certificates) of Certificates would have to voluntarily participate in the exchange. |
| | |
| Liquidation Loan Waterfall: | Following the liquidation of any loan or property, the net liquidation proceeds generally will be applied (after reimbursement of advances and certain trust fund expenses), first, as a recovery of accrued interest, other than delinquent interest that was not advanced as a result of Appraisal Reduction Amounts, second, as a recovery of principal until all principal has been recovered, and then as a recovery of delinquent interest that was not advanced as a result of Appraisal Reduction Amounts. Please see “Description of the Certificates—Distributions—Application Priority of Mortgage Loan Collections or Whole Loan Collections” in the Preliminary Prospectus. |
THE INFORMATION IN THIS STRUCTURAL AND COLLATERAL TERM SHEET IS NOT COMPLETE AND MAY BE AMENDED PRIOR TO THE TIME OF SALE. THIS TERM SHEET IS NOT AN OFFER TO SELL THESE SECURITIES AND IT IS NOT A SOLICITATION OF AN OFFER TO BUY THESE SECURITIES IN ANY JURISDICTION WHERE THE OFFER OR SALE IS NOT PERMITTED.
21
Wells Fargo Commercial Mortgage Trust 2019-C53 | Certain Terms and Conditions |
| Control Eligible Certificates: | The Class E-RR, F-RR, G-RR, H-RR, J-RR, K-RR and L-RR Certificates. |
| | |
| Directing Certificateholder/ Controlling Class: | A directing certificateholder may be appointed by the “majority controlling class certificateholder”, which will be the holder(s) of a majority of the Controlling Class. The “Controlling Class” will be, as of any time of determination, the most subordinate Class of Control Eligible Certificates then outstanding that has an aggregate Certificate Balance (as notionally reduced by any Cumulative Appraisal Reduction Amounts allocable to such Class(es)) at least equal to 25% of the initial Certificate Balance of that Class;provided,however, that if at any time the Certificate Balances of the Certificates other than the Control Eligible Certificates have been reduced to zero as a result of principal payments on the Mortgage Loans, then the Controlling Class will be the most subordinate Class of Control Eligible Certificates that has a Certificate Balance greater than zero without regard to any Cumulative Appraisal Reduction Amounts. The Controlling Class as of the Closing Date will be the Class L-RR Certificates. |
| | |
| Control and Consultation: | The rights of various parties to replace the Special Servicer and approve or consult with respect to major actions of the Special Servicer will vary according to defined periods. A “Control Termination Event” will occur when the Class E-RR Certificates have a Certificate Balance (taking into account the application of any Cumulative Appraisal Reduction Amounts to notionally reduce the Certificate Balance of such Class) of less than 25% of the initial Certificate Balance of that Class;provided,however, that a Control Termination Event will not be deemed continuing in the event that the Certificate Balances of the Certificates other than the Control Eligible Certificates have been reduced to zero as a result of principal payments on the Mortgage Loans. A “Consultation Termination Event” will occur when there is no Class of Control Eligible Certificates that has a then-outstanding Certificate Balance at least equal to 25% of the initial Certificate Balance of that Class, in each case, without regard to the application of any Cumulative Appraisal Reduction Amounts;provided,however, that a Consultation Termination Event will not be deemed continuing in the event that the Certificate Balances of the Certificates other than the Control Eligible Certificates have been reduced to zero as a result of principal payments on the Mortgage Loans. If no Control Termination Event has occurred and is continuing, except with respect to the Excluded Loans (as defined below) (i) the directing certificateholder will be entitled to grant or withhold approval of asset status reports prepared, and material servicing actions proposed, by the Special Servicer, and (ii) the directing certificateholder will be entitled to terminate and replace the Special Servicer with or without cause, and appoint itself or another person as the successor special servicer. It will be a condition to such appointment that DBRS, Fitch and Moody’s (and any rating agency rating any securities backed by anypari passu companion loan(s) serviced under this transaction) confirm that the appointment would not result in a qualification, downgrade or withdrawal of any of their then-current ratings of Certificates (and any certificates backed by anypari passu companion loan(s) serviced under this transaction). If a Control Termination Event has occurred and is continuing but no Consultation Termination Event has occurred and is continuing, the Special Servicer will be required to consult with the directing certificateholder (other than with respect to Excluded Loans) in connection with asset status reports and material special servicing actions. If a Consultation Termination Event has occurred and is continuing, no directing certificateholder will be recognized or have any right to terminate the Special Servicer or approve, direct or consult with respect to servicing matters. With respect to each serviced whole loan, the rights of the directing certificateholder described above will be subject to the consultation rights of the holders of the relatedpari passu companion loans. Those consultation rights will generally extend to asset status reports and material special servicing actions involving the related whole loan, will be as set forth in the related intercreditor agreement, and will be in addition to the rights of the directing certificateholder in this transaction described above. With respect to each non-serviced whole loan, the applicable servicing agreement for the related controllingpari passucompanion loan(s) generally grants (or will grant) the directing certificateholder under the related securitization control rights that may include the right to approve or disapprove various material servicing actions involving the related whole loan. The directing certificateholder for this securitization (so long as no Consultation Termination Event has occurred and is occurring) generally will nonetheless have the right to be consulted on a non-binding basis with respect to such actions. For purposes of the servicing of any such whole loan contemplated by this paragraph, the occurrence and continuance of a Control Termination Event or Consultation Termination Event under this securitization will not limit the control or other rights |
THE INFORMATION IN THIS STRUCTURAL AND COLLATERAL TERM SHEET IS NOT COMPLETE AND MAY BE AMENDED PRIOR TO THE TIME OF SALE. THIS TERM SHEET IS NOT AN OFFER TO SELL THESE SECURITIES AND IT IS NOT A SOLICITATION OF AN OFFER TO BUY THESE SECURITIES IN ANY JURISDICTION WHERE THE OFFER OR SALE IS NOT PERMITTED.
22
Wells Fargo Commercial Mortgage Trust 2019-C53 | Certain Terms and Conditions |
| | of the directing certificateholder (or equivalent) under the securitization of the related controllingpari passu companion loan(s). The control rights and consent and consultation rights described in the two preceding paragraphs are subject to various limitations, conditions and exceptions as described in the Preliminary Prospectus. Notwithstanding any contrary description set forth above, in the event that, with respect to any mortgage loan, if the majority controlling class certificateholder or the directing certificateholder is a Borrower Party, the majority controlling class certificateholder and the directing certificateholder will have no right to receive asset status reports or such other information as may be specified in the WFCM 2019-C53 pooling and servicing agreement, to grant or withhold approval of, or consult with respect to, asset status reports prepared, and material servicing actions proposed, by the Special Servicer, with respect to such mortgage loan, and such mortgage loan will be referred to as an “Excluded Loan” as to such party. In addition, notwithstanding any contrary description set forth above, in the event that, with respect to any mortgage loan, a controlling class certificateholder is a Borrower Party, such controlling class certificateholder will have no right to receive asset status reports or such other information as may be specified in the WFCM 2019-C53 pooling and servicing agreement with respect to such mortgage loan, and such controlling class certificateholder will be referred to as an “excluded controlling class holder”. “Borrower Party” means a borrower, a mortgagor or a manager of a mortgaged property, an Accelerated Mezzanine Loan Lender, or any Borrower Party Affiliate. “Accelerated Mezzanine Loan Lender” means a mezzanine lender under a mezzanine loan that has been accelerated or as to which foreclosure or enforcement proceedings have been commenced against the equity collateral pledged to secure such mezzanine loan. “Borrower Party Affiliate” means, with respect to a borrower, a mortgagor, a manager of a Mortgaged Property or an Accelerated Mezzanine Loan Lender, (x) any other person controlling or controlled by or under common control with such borrower, mortgagor, manager or Accelerated Mezzanine Loan Lender, as applicable, or (y) any other person owning, directly or indirectly, 25% or more of the beneficial interests in such borrower, mortgagor, manager or Accelerated Mezzanine Loan Lender. |
| | |
Replacement of Special Servicer:
| If a Control Termination Event has occurred and is continuing, the Special Servicer may be removed and replaced without cause upon the affirmative direction of certificate owners holding not less than 66-2/3% of a certificateholder quorum, following a proposal from certificate owners holding not less than 25% of the appraisal-reduced voting rights of all Certificates. The certificateholders who initiate a vote on a termination and replacement of the Special Servicer without cause must cause DBRS, Fitch and Moody’s to confirm the then-current ratings of the Certificates (or decline to review the matter) and cause the payment of the fees and expenses incurred in the replacement. If no Control Termination Event has occurred and is continuing, the Special Servicer may be replaced by the directing certificateholder, subject to DBRS, Fitch and Moody’s (and any Rating Agency rating any securities backed by anypari passu companion loan(s) serviced under this transaction) confirming the then-current ratings of the Certificates (and any certificates backed by anyparipassu companion loans serviced under this transaction) or declining to review the matter. In addition, if at any time the Operating Advisor determines, in its sole discretion exercised in good faith, that (i) the Special Servicer is not performing its duties as required under the pooling and servicing agreement in accordance with the Servicing Standard and (ii) the replacement of the Special Servicer would be in the best interest of the certificateholders as a collective whole, then the Operating Advisor will have the right to recommend the replacement of the Special Servicer and will submit its formal recommendation to the Trustee and the Certificate Administrator (along with its rationale, its proposed replacement special servicer and other relevant information justifying its recommendation). The Operating Advisor’s recommendation to replace the Special Servicer must be confirmed by an affirmative vote of holders of Principal Balance Certificates evidencing at least a majority of a quorum of certificateholders (which, for this purpose, is the holders of Principal Balance Certificates that (i) evidence at least 20% of the Voting Rights (taking into account the application of any cumulative appraisal reduction amounts to notionally reduce the respective Certificate Balances) of all Principal Balance Certificates on an aggregate basis, and (ii) consist of at least three certificateholders or certificate owners that are not risk retention affiliated with each other). In the event the holders of Principal Balance Certificates evidencing at least a majority of a quorum of certificateholders elect to remove and replace the Special Servicer (which requisite affirmative votes must be received within 180 days of the posting of the notice of the Operating Advisor’s recommendation to replace the Special Servicer to the Certificate Administrator’s |
THE INFORMATION IN THIS STRUCTURAL AND COLLATERAL TERM SHEET IS NOT COMPLETE AND MAY BE AMENDED PRIOR TO THE TIME OF SALE. THIS TERM SHEET IS NOT AN OFFER TO SELL THESE SECURITIES AND IT IS NOT A SOLICITATION OF AN OFFER TO BUY THESE SECURITIES IN ANY JURISDICTION WHERE THE OFFER OR SALE IS NOT PERMITTED.
23
Wells Fargo Commercial Mortgage Trust 2019-C53 | Certain Terms and Conditions |
| | website), the Certificate Administrator will be required to receive a Rating Agency Confirmation from each of the Rating Agencies at that time. |
| | |
| Excluded Special Servicer: | In the event that, with respect to any mortgage loan, the Special Servicer is a Borrower Party, the Special Servicer will be required to resign as special servicer of such mortgage loan (referred to as an “excluded special servicer loan”). If no Control Termination Event has occurred and is continuing, the directing certificateholder will be entitled to appoint (and may replace with or without cause) a separate special servicer that is not a Borrower Party (referred to as an “excluded special servicer”) with respect to such excluded special servicer loan unless such excluded special servicer loan is also an excluded loan. Otherwise, upon resignation of the Special Servicer with respect to an excluded special servicer loan, the resigning Special Servicer will be required to appoint the excluded special servicer. |
| | |
| Appraisal Remedy: | If the Class of Certificates comprising the Controlling Class loses its status as Controlling Class because of the application of an Appraisal Reduction Amount or Collateral Deficiency Amount, the holders of a majority of the voting rights of such Class may require the Special Servicer to order a second appraisal for any mortgage loan in respect of which an Appraisal Reduction Amount or Collateral Deficiency Amount has been applied. The Special Servicer must thereafter determine whether, based on its assessment of such second appraisal, any recalculation of the Appraisal Reduction Amount or Collateral Deficiency Amount is warranted. Such Class will not be able to exercise any direction, control, consent and/or similar rights of the Controlling Class unless and until reinstated as the Controlling Class through such determination; and pending such determination, the rights of the Controlling Class will be exercised by the Control Eligible Certificates, if any, that would be the Controlling Class taking into account the subject appraisal reduction amount. |
| | |
| Sale of Defaulted Assets: | There will be no “fair value” purchase option. Instead, the WFCM 2019-C53 pooling and servicing agreement will authorize the Special Servicer to sell defaulted mortgage loans serviced by such Special Servicer to the highest bidder in a manner generally similar to sales of REO properties. The sale of a defaulted loan (other than a non-serviced whole loan) for less than par plus accrued interest and certain other fees and expenses owed on the loan will be subject to consent or consultation rights of the directing certificateholder and/or Operating Advisor, as described in the Preliminary Prospectus. Generally speaking, the holder of apari passucompanion loan will have consent and/or consultation rights, as described in the Preliminary Prospectus. With respect to any serviced whole loan, if such whole loan becomes a defaulted loan under the WFCM 2019-C53 pooling and servicing agreement, the Special Servicer will generally be required to sell both the mortgage loan and the relatedpari passu companion loan(s) as a single whole loan. With respect to each non-serviced whole loan, the applicable servicing agreement governing the servicing of such whole loan generally provides (or is expected to provide) that, if the relatedpari passu companion loan(s) serviced under such agreement become a defaulted loan under such servicing agreement, then the related special servicer may offer to sell to any person (or may offer to purchase) for cash such whole loan during such time as such applicablepari passucompanion loan(s) constitutes a defaulted loan under such servicing agreement. Generally speaking, in connection with any such sale, the related special servicer is required to sell both the mortgage loan and the relatedpari passu companion loan(s) as a whole loan. The directing certificateholder for this securitization generally will have consent and/or consultation rights as the holder of an interest in the related mortgage loan, as described in the Preliminary Prospectus. The procedures for the sale of any whole loan that becomes a defaulted whole loan, and any associated consultation rights, are subject to various limitations, conditions and exceptions as described in the Preliminary Prospectus. |
| | |
| “As-Is” Appraisals: | Appraisals must be conducted on an “as-is” basis, and must be no more than 12 months old, for purposes of determining Appraisal Reduction Amounts and market value in connection with REO sales. Required appraisals may consist of updates of prior appraisals. Internal valuations by the Special Servicer are permitted if the principal balance of a mortgage loan is less than $2,000,000. |
THE INFORMATION IN THIS STRUCTURAL AND COLLATERAL TERM SHEET IS NOT COMPLETE AND MAY BE AMENDED PRIOR TO THE TIME OF SALE. THIS TERM SHEET IS NOT AN OFFER TO SELL THESE SECURITIES AND IT IS NOT A SOLICITATION OF AN OFFER TO BUY THESE SECURITIES IN ANY JURISDICTION WHERE THE OFFER OR SALE IS NOT PERMITTED.
24
Wells Fargo Commercial Mortgage Trust 2019-C53 | Certain Terms and Conditions |
| Operating Advisor: | The Operating Advisor will have certain review and consultation rights relating to the performance of the Special Servicer and with respect to its actions taken in connection with the resolution and/or liquidation of Specially Serviced Loans. With respect to each mortgage loan (other than a Non-Serviced Mortgage Loan) or serviced whole loan, the Operating Advisor will be responsible for: ● reviewing the actions of the Special Servicer with respect to any Specially Serviced Loan; ● reviewing (i) all reports by the Special Servicer made available to Privileged Persons on the Certificate Administrator’s website and (ii) each Asset Status Report (as defined in the Preliminary Prospectus) (after the occurrence and during the continuance of an Operating Advisor Consultation Event (as defined below)) and Final Asset Status Report (as defined in the Preliminary Prospectus); ● recalculating and reviewing for accuracy and consistency with the WFCM 2019-C53 pooling and servicing agreement the mathematical calculations by the special servicer and the corresponding application of the non-discretionary portion of the applicable formulas required to be utilized in connection with Appraisal Reduction Amounts, Collateral Deficiency Amounts and net present value calculations used in the Special Servicer’s determination of what course of action to take in connection with the workout or liquidation of a Specially Serviced Loan; and ● preparing an annual report (if any mortgage loan (other than any Non-Serviced Mortgage Loan) or serviced whole loan was a Specially Serviced Loan at any time during the prior calendar year or an Operating Advisor Consultation Event (as defined below) occurred during the prior calendar year) that sets forth whether the Operating Advisor believes, in its sole discretion exercised in good faith, that the Special Servicer is operating in compliance with the Servicing Standard with respect to its performance of its duties under the pooling and servicing agreement with respect to Specially Serviced Loans (and, after the occurrence and continuance of an Operating Advisor Consultation Event (as defined below), with respect to major decisions on non-Specially Serviced Loans) during the prior calendar year on an “asset-level basis”. The Operating Advisor will identify (1) which, if any, standards the Operating Advisor believes, in its sole discretion exercised in good faith, the Special Servicer has failed to comply with and (2) any material deviations from the Special Servicer’s obligations under the pooling and servicing agreement with respect to the resolution or liquidation of any Specially Serviced Loan or REO Property (other than with respect to any REO Property related to any Non-Serviced Mortgage Loan). In preparing any Operating Advisor Annual Report (as defined in the Preliminary Prospectus), the Operating Advisor will not be required to report on instances of non-compliance with, or deviations from, the Servicing Standard or the Special Servicer’s obligations under the pooling and servicing agreement that the Operating Advisor determines, in its sole discretion exercised in good faith, to be immaterial. With respect to each mortgage loan (other than any Non-Serviced Mortgage Loan) or serviced whole loan, after the Operating Advisor has received notice that an Operating Advisor Consultation Event (as defined below) has occurred and is continuing, in addition to the duties described above, the Operating Advisor will be required to perform the following additional duties: ● to consult (on a non-binding basis) with the Special Servicer in respect of asset status reports and ● to consult (on a non-binding basis) with the Special Servicer with respect to “major decisions” processed by the Special Servicer. An “Operating Advisor Consultation Event” will occur when the Certificate Balances of the Class E-RR, F-RR, G-RR, H-RR, J-RR, K-RR and L-RR Certificates in the aggregate (taking into account the application of any Cumulative Appraisal Reduction Amounts to notionally reduce the Certificate Balances of such Classes) is 25% or less of the initial Certificate Balances of such Classes in the aggregate. |
| | |
| Asset Representations Reviewer: | The Asset Representations Reviewer will be required to review certain delinquent mortgage loans after a specified delinquency threshold has been exceeded (an “Asset Review Trigger”) and the required percentage of certificateholders vote to direct a review of such delinquent loans. An Asset Review Trigger will occur when either (1) mortgage loans with an aggregate outstanding principal balance of 25.0% or more of the aggregate outstanding principal balance of all of the mortgage loans (including any REO loans (or a portion of any REO loan in the case of a whole loan)) held by the issuing entity as of the end of the applicable collection period are delinquent loans or (2) at least 15 mortgage loans are delinquent loans as of the end of the applicable |
THE INFORMATION IN THIS STRUCTURAL AND COLLATERAL TERM SHEET IS NOT COMPLETE AND MAY BE AMENDED PRIOR TO THE TIME OF SALE. THIS TERM SHEET IS NOT AN OFFER TO SELL THESE SECURITIES AND IT IS NOT A SOLICITATION OF AN OFFER TO BUY THESE SECURITIES IN ANY JURISDICTION WHERE THE OFFER OR SALE IS NOT PERMITTED.
25
Wells Fargo Commercial Mortgage Trust 2019-C53 | Certain Terms and Conditions |
| | collection period and the outstanding principal balance of such delinquent loans in the aggregate constitutes at least 20.0% of the aggregate outstanding principal balance of all of the mortgage loans (including any REO loans (or a portion of any REO loan in the case of a whole loan)) held by the issuing entity as of the end of the applicable collection period. See “Pooling and Servicing Agreement—The Asset Representations Reviewer—Asset Review” in the Preliminary Prospectus. The Asset Representations Reviewer may be terminated and replaced without cause. Upon (i) the written direction of certificateholders evidencing not less than 25% of the voting rights (without regard to the application of any Cumulative Appraisal Reduction Amounts) requesting a vote to terminate and replace the Asset Representations Reviewer with a proposed successor Asset Representations Reviewer that is an eligible asset representations reviewer, and (ii) payment by such holders to the certificate administrator of the reasonable fees and expenses to be incurred by the certificate administrator in connection with administering such vote, the certificate administrator will promptly provide notice to all certificateholders and the Asset Representations Reviewer of such request by posting such notice on its internet website, and by mailing such notice to all certificateholders and the Asset Representations Reviewer. Upon the written direction of certificateholders evidencing at least 75% of a certificateholder quorum (without regard to the application of any Cumulative Appraisal Reduction Amounts), the Trustee will terminate all of the rights and obligations of the Asset Representations Reviewer under the WFCM 2019-C53 pooling and servicing agreement by written notice to the Asset Representations Reviewer, and the proposed successor Asset Representations Reviewer will be appointed. See “Pooling and Servicing Agreement—The Asset Representations Reviewer” in the Preliminary Prospectus. |
| | |
| Dispute Resolution Provisions: | The mortgage loan sellers will be subject to the dispute resolution provisions set forth in the WFCM 2019-C53 pooling and servicing agreement to the extent those provisions are triggered with respect to any mortgage loan sold to the depositor by a mortgage loan seller and such mortgage loan seller will be obligated under the related mortgage loan purchase agreement to comply with all applicable provisions and to take part in any mediation or arbitration proceedings that may result. Generally, in the event that a Repurchase Request (as defined in the Preliminary Prospectus) is not “Resolved” (as defined below) within 180 days after the related mortgage loan seller receives such Repurchase Request, then the enforcing servicer will be required to send a notice to the “Initial Requesting Certificateholder” (if any) and the Certificate Administrator indicating the enforcing servicer’s intended course of action with respect to the Repurchase Request. If (a) the enforcing servicer’s intended course of action with respect to the Repurchase Request does not involve pursuing further action to exercise rights against the related mortgage loan seller with respect to the Repurchase Request and the Initial Requesting Certificateholder, if any, or any other certificateholder or certificate owner wishes to exercise its right to refer the matter to mediation (including non-binding arbitration) or arbitration, or (b) the enforcing servicer’s intended course of action is to pursue further action to exercise rights against the related mortgage loan seller with respect to the Repurchase Request but the Initial Requesting Certificateholder, if any, or any other certificateholder or certificate owner does not agree with the dispute resolution method selected by the enforcing servicer, then the Initial Requesting Certificateholder, if any, or such other certificateholder or certificate owner may deliver a written notice to the Special Servicer indicating its intent to exercise its right to refer the matter to either mediation or arbitration. “Resolved” means, with respect to a Repurchase Request, (i) that the related Material Defect has been cured, (ii) the related mortgage loan has been repurchased in accordance with the related mortgage loan purchase agreement, (iii) a mortgage loan has been substituted for the related mortgage loan in accordance with the related mortgage loan purchase agreement, (iv) the applicable mortgage loan seller has made a Loss of Value Payment (as defined in the Preliminary Prospectus), (v) a contractually binding agreement is entered into between the enforcing servicer, on behalf of the issuing entity, and the related mortgage loan seller that settles the related mortgage loan seller’s obligations under the related mortgage loan purchase agreement or (vi) the related mortgage loan is no longer property of the issuing entity as a result of a sale or other disposition in accordance with the WFCM 2019-C53 pooling and servicing agreement. See “Pooling and Servicing Agreement—Dispute Resolution Provisions” in the Preliminary Prospectus. |
| | |
| Investor Communications: | The certificate administrator is required to include on any Form 10–D any request received from a certificateholder to communicate with other certificateholders related to certificateholders exercising their rights under the terms of the WFCM 2019-C53 pooling and servicing agreement. Any certificateholder wishing to communicate with other certificateholders regarding the exercise of its rights under the terms of the WFCM 2019-C53 pooling and servicing agreement will be able to deliver a written request signed by an authorized representative of the requesting investor to the certificate administrator. |
THE INFORMATION IN THIS STRUCTURAL AND COLLATERAL TERM SHEET IS NOT COMPLETE AND MAY BE AMENDED PRIOR TO THE TIME OF SALE. THIS TERM SHEET IS NOT AN OFFER TO SELL THESE SECURITIES AND IT IS NOT A SOLICITATION OF AN OFFER TO BUY THESE SECURITIES IN ANY JURISDICTION WHERE THE OFFER OR SALE IS NOT PERMITTED.
26
Wells Fargo Commercial Mortgage Trust 2019-C53 | Certain Terms and Conditions |
| Certain Fee Offsets: | If a workout fee is earned by the Special Servicer following a loan default with respect to any mortgage loan that it services, then certain limitations will apply based on modification fees paid by the borrower. The modification fee generally must not exceed 1% of the principal balance of the loan as modified in any 12-month period. In addition, if the loan re-defaults, any subsequent workout fee on that loan must be reduced by a portion of the modification fees paid by the borrower in the previous 12-months. Likewise, liquidation fees collected in connection with a liquidation or partial liquidation of a mortgage loan must be reduced by a portion of the modification fees paid by the borrower in the previous 12 months. |
| | |
| Deal Website: | The Certificate Administrator will be required to maintain a deal website, which will include, among other items: (a) summaries of asset status reports prepared by the Special Servicer, (b) inspection reports, (c) appraisals, (d) various “special notices” described in the Preliminary Prospectus, (e) the “Investor Q&A Forum”, (f) a voluntary “Investor Registry” and (g) the “Risk Retention Special Notices” tab. Investors may access the deal website following execution of a certification and confidentiality agreement. |
| | |
| Initial Majority Controlling Class Certificateholder: | It is expected that KKR CMBS II Aggregator Type 2 L.P. or an affiliate will be the initial majority controlling class certificateholder. |
| | |
| Whole Loans: | Each of the mortgaged properties identified above under “IV. Characteristics of the Mortgage Pool—B. Summary of the Whole Loans” secures both a mortgage loan to be included in the trust fund and one or more other mortgage loans that will not be included in the trust fund, each of which will bepari passu in right of payment with the mortgage loan included in the trust fund. We refer to each such group of mortgage loans as a “whole loan”. Such “—Summary of the Whole Loans” section includes further information regarding the various notes in each whole loan, the holders of such notes, the lead servicing agreement for each such whole loan, and the master servicer and special servicer under such lead servicing agreement. |
THE INFORMATION IN THIS STRUCTURAL AND COLLATERAL TERM SHEET IS NOT COMPLETE AND MAY BE AMENDED PRIOR TO THE TIME OF SALE. THIS TERM SHEET IS NOT AN OFFER TO SELL THESE SECURITIES AND IT IS NOT A SOLICITATION OF AN OFFER TO BUY THESE SECURITIES IN ANY JURISDICTION WHERE THE OFFER OR SALE IS NOT PERMITTED.
27
| Other – Leased Fee | Loan #1 | Cut-off Date Balance: | | $60,000,000 |
| 755 and 800 Secaucus Road | Equinix Data Center | Cut-off Date LTV: | | 49.8% |
| & 105 Enterprise Avenue | | U/W NCF DSCR: | | 2.44x |
| Secaucus, NJ 07094 | | U/W NOI Debt Yield: | | 8.2% |

THE INFORMATION IN THIS STRUCTURAL AND COLLATERAL TERM SHEET IS NOT COMPLETE AND MAY BE AMENDED PRIOR TO THE TIME OF SALE. THIS TERM SHEET IS NOT AN OFFER TO SELL THESE SECURITIES AND IT IS NOT A SOLICITATION OF AN OFFER TO BUY THESE SECURITIES IN ANY JURISDICTION WHERE THE OFFER OR SALE IS NOT PERMITTED.
28
| Other – Leased Fee | Loan #1 | Cut-off Date Balance: | | $60,000,000 |
| 755 and 800 Secaucus Road | Equinix Data Center | Cut-off Date LTV: | | 49.8% |
| & 105 Enterprise Avenue | | U/W NCF DSCR: | | 2.44x |
| Secaucus, NJ 07094 | | U/W NOI Debt Yield: | | 8.2% |

THE INFORMATION IN THIS STRUCTURAL AND COLLATERAL TERM SHEET IS NOT COMPLETE AND MAY BE AMENDED PRIOR TO THE TIME OF SALE. THIS TERM SHEET IS NOT AN OFFER TO SELL THESE SECURITIES AND IT IS NOT A SOLICITATION OF AN OFFER TO BUY THESE SECURITIES IN ANY JURISDICTION WHERE THE OFFER OR SALE IS NOT PERMITTED.
29
| No. 1 – Equinix Data Center |
| |
| Mortgage Loan Information | | Mortgaged Property Information |
| Mortgage Loan Seller: | Rialto Mortgage Finance, LLC | | Single Asset/Portfolio: | Single Asset |
Credit Assessment
(DBRS/Fitch/Moody’s): | NR/NR/NR | | Property Type – Subtype: | Other – Leased Fee |
| Original Principal Balance(1): | $60,000,000 | | Location: | Secaucus, NJ |
| Cut-off Date Balance(1): | $60,000,000 | | Size: | 663,621 SF |
| % of Initial Pool Balance: | 8.5% | | Cut-off Date Balance Per SF(1): | $150.69 |
| Loan Purpose: | Refinance | | Maturity Date Balance Per SF(1): | $150.69 |
| Borrower Sponsor: | Hartz Mountain Industries, Inc. | | Year Built/Renovated: | 2001/2019 |
| Guarantor: | Hartz Financial Corp. | | Title Vesting: | Fee |
| Mortgage Rate: | 3.3000% | | Property Manager: | Self-managed |
| Note Date: | September 20, 2019 | | Current Occupancy (As of): | 100.0% (11/1/2019) |
| Seasoning: | 1 month | | YE 2018 Occupancy: | 100.0% |
| Maturity Date: | October 6, 2029 | | YE 2017 Occupancy(2): | 100.0% |
| IO Period: | 120 months | | YE 2016 Occupancy(2): | 100.0% |
| Loan Term (Original): | 120 months | | YE 2015 Occupancy(2): | 100.0% |
| Amortization Term (Original): | NAP | | As-Is Appraised Value: | $201,000,000 |
| Loan Amortization Type: | Interest-only, Balloon | | As-Is Appraised Value Per SF: | $302.88 |
| Call Protection(3): | L(25),D(91),O(4) | | As-Is Appraisal Valuation Date: | August 8, 2019 |
| Lockbox Type: | Hard/Springing Cash Management | | Underwriting and Financial Information |
| Additional Debt(1): | Yes | | YE 2018 NOI:(5) | $6,687,602 |
| Additional Debt Type (Balance)(1): | Pari Passu($40,000,000) | | YE 2017 NOI: | $6,678,724 |
| | | | YE 2016 NOI: | $6,456,324 |
| | | | U/W Revenues: | $8,170,147 |
| | | | U/W Expenses: | $0 |
| | | U/W NOI:(5) | $8,170,147 |
| Escrows and Reserves(4) | | U/W NCF: | $8,170,147 |
| | Initial | Monthly | Cap | | U/W DSCR based on NOI/NCF(1): | 2.44x / 2.44x |
| Taxes | $0 | Springing | NAP | | U/W Debt Yield based on NOI/NCF(1): | 8.2% / 8.2% |
| Insurance | $0 | Springing | NAP | | U/W Debt Yield at Maturity based on NOI/NCF(1) | 8.2% / 8.2% |
| Replacement Reserve | $0 | $0 | NAP | | Cut-off Date LTV Ratio(1): | 49.8% |
| TI/LC Reserve | $0 | $0 | NAP | | LTV Ratio at Maturity(1): | 49.8% |
| | | | | | | |
| | | | | | | | |
| Sources and Uses |
| Sources | | | | | Uses | | | |
| Original whole loan amount | $100,000,000 | | 100.0% | | Loan payoff | $68,817,116 | | 68.8% |
| | | | | | Closing costs | 564,569 | | 0.6 |
| | | | | | Return of equity | 30,618,315 | | 30.6 |
| Total Sources | $100,000,000 | | 100.0% | | Total Uses | $100,000,000 | | 100.0% |
| (1) | The Equinix Data Center Mortgage Loan (as defined below) is part of the Equinix Data Center Whole Loan (as defined below), which comprises fourpari passu notes with an aggregate original principal balance of $100,000,000. All statistical information related to the Cut-off Date Balance per SF, Maturity Date Balance per SF, U/W DSCR based on NOI/NCF, U/W Debt Yield based on NOI/NCF, U/W Debt Yield at Maturity based on NOI/NCF, Cut-off Date LTV Ratio and LTV Ratio at Maturity or ARD are based on the Equinix Data Center Whole Loan. |
| (2) | Historical Occupancy of YE 2017, YE 2016, and YE 2015 is obtained from the Equinix Data Center Borrowers (as defined below). |
| (3) | Defeasance of the Equinix Data Center Whole Loan is permitted at any time after the earlier of (i) two years after the closing date of the securitization that includes the last note to be securitized and (ii) three years after the origination date. The assumed lockout period of 25 months is based on the WFCM 2019-C53 securitization closing date of November 2019. |
| (4) | See “Escrows” section for a full description of Escrows and Reserves. |
| (5) | The U/W NOI increased compared to the YE 2018 NOI mainly due to (i) new ground leases in place in December 2018, (ii) underwritten straight line rent of $684,172, and (iii) underwritten rent steps through August 2020 of $146,783. |
The Mortgage Loan. The mortgage loan (the “Equinix Data Center Mortgage Loan”) is part of a whole loan (the “Equinix Data Center Whole Loan”) evidenced by fourpari passu notes with an original principal balance of $100,000,000 and outstanding balance as of the Cut-off Date of $100,000,000 secured by a first priority mortgage encumbering the fee simple interest in two non-contiguous land parcels located in Secaucus, New Jersey (the “Equinix Data Center Property”). The Equinix Data Center Mortgage Loan represents the controlling Note A-1 and the non-controlling Note A-4. See “Description of the Mortgage Pool—The Whole Loans—The Serviced Pari Passu Whole Loans” and “Pooling and Servicing Agreement” in the Preliminary Prospectus.
THE INFORMATION IN THIS STRUCTURAL AND COLLATERAL TERM SHEET IS NOT COMPLETE AND MAY BE AMENDED PRIOR TO THE TIME OF SALE. THIS TERM SHEET IS NOT AN OFFER TO SELL THESE SECURITIES AND IT IS NOT A SOLICITATION OF AN OFFER TO BUY THESE SECURITIES IN ANY JURISDICTION WHERE THE OFFER OR SALE IS NOT PERMITTED.
30
| Other – Leased Fee | Loan #1 | Cut-off Date Balance: | | $60,000,000 |
| 755 and 800 Secaucus Road | Equinix Data Center | Cut-off Date LTV: | | 49.8% |
| & 105 Enterprise Avenue | | U/W NCF DSCR: | | 2.44x |
| Secaucus, NJ 07094 | | U/W NOI Debt Yield: | | 8.2% |
Note Summary
| Notes | Original Principal Balance | Cut-off Date Balance | Note Holder | Controlling Interest |
| A-1 | $50,000,000 | $50,000,000 | WFCM 2019-C53 | Yes |
| A-2 | $25,000,000 | $25,000,000 | Rialto Mortgage Finance, LLC | No |
| A-3 | $15,000,000 | $15,000,000 | Rialto Mortgage Finance, LLC | No |
| A-4 | $10,000,000 | $10,000,000 | WFCM 2019-C53 | No |
| Total | $100,000,000 | $100,000,000 | | |
The Borrowers and Borrower Sponsor.The borrowers under the Equinix Data Center Whole Loan are 755 Secaucus LLC and 800 Secaucus LLC (collectively, the “Equinix Data Center Borrowers”), each a Delaware limited liability company and single purpose entity with two independent directors. Legal counsel to the Equinix Data Center Borrowers delivered a non-consolidation opinion in connection with the origination of the Equinix Data Center Whole Loan. The borrower sponsor and nonrecourse carve-out guarantor of the Equinix Data Center Whole Loan is Hartz Financial Corp (“Hartz”). Hartz is capitalized solely by a $5 million dollar demand note and is liable under similar guaranties on other loans. The borrower sponsor was the guarantor with respect to defaulted loans, and entered into deed-in-lieu of foreclosure agreements related to defaulted loans. See “Description of the Mortgage Pool—Loan Purpose; Default History, Bankruptcy Issues and Other Proceedings” in the Preliminary Prospectus.
Hartz, a New Jersey corporation, is a wholly-owned subsidiary of Hartz Mountain Development Corp., which is wholly owned by Hartz Mountain Industries, Inc. (“HMI”), which is indirectly wholly owned by The Hartz Group, Inc. Headquartered in Secaucus, New Jersey, HMI is a full service privately held real estate company that owns and manages a diversified real estate portfolio, which includes corporate offices, warehouse and distribution facilities, hotels, multi-family developments, retail centers, movie theaters and restaurants. The portfolio includes approximately 246 properties comprising over 40.0 million square feet and an 85-acre land bank, primarily in New Jersey and New York.
The Property.The Equinix Data Center Property is comprised of the Equinix Data Center Borrowers’ fee simple interest in two non-contiguous land parcels of 18.96 and 13.03 acres totaling 31.99 acres, subject to two separate 50-year ground leases to Equinix, Inc. (“Equinix”). Equinix operates its data centers on the land parcels within three buildings encompassing 663,621 square feet located at 755 and 800 Secaucus Road, and 105 Enterprise Avenue in Secaucus, New Jersey, pursuant to two ground leases with the Equinix Data Center Borrowers that commenced December 2018. The ground leases stipulate that the Equinix Data Center Borrowers have and retain ownership in the core and shell of the buildings (i.e. footings, foundation, floor slab, exterior walls, and roof structure components of the building). Equinix has title to the improvements erected on the land and all alterations over and above the core and shell (the “Other Improvements”). To the extent that following the expiration or other termination of one or both of the ground leases, Equinix elects to leave any portion of the Other Improvements at the Equinix Data Center Property, title to all such remaining Other Improvements will automatically become vested in the Equinix Data Center Borrowers. Equinix has operated its data centers at the Equinix Data Center Property since 2006.
The 755 Secaucus Road building (the “755 Secaucus Building”) is a single-story, steel framed building on a concrete slab with a partial second-story mezzanine. The improvements, which were built in phases in 2001, 2006, 2009, and 2010 at a cost of approximately $277.0 million, are situated on the 18.96-acre parcel and were completely renovated by Equinix. The 755 Secaucus Building contains 338,967 square feet and provides 151,772 square feet of colocation space with a floor load capacity of 175 lbs per square feet. Security features include hand geometry readers, CCTV and recorders, motion detection and 24x7 security officers. Parking is provided via 290 surface parking spaces, resulting in a parking ratio of 0.86 parking spaces per 1,000 square feet of net rentable area.
The 800 Secaucus Road building (the “800 Secaucus Building”) is a two-story steel framed building on a concrete slab. The 800 Secaucus Building is a LEED Silver certified building that was constructed by Equinix in 2012 after demolishing an existing structure for a cost of approximately $81.0 million. The 800 Secaucus Building was built in phases from 2017 and 2019 . The 800 Secaucus Building provides 108,005 square feet of colocation space and has a floor load capacity of 250 lbs per square feet and 9,530 square feet of flex space.
The 105 Enterprise Avenue building (the “105 Enterprise Building”) is located behind the 800 Secaucus Building. The 105 Enterprise Building is a single-story, steel framed building, on a concrete slab built in 2014 by Equinix at an estimated cost of approximately $35.0 million. The 105 Enterprise Building provides 16,390 square feet of colocation space and consists of 70,183 square feet with a floor load capacity of 250 lbs per square feet. The 800 Secaucus Building and 105 Enterprise Building have a shared delivery driveway and are situated on the 13.03-acre parcel. Parking is provided via 300 surface parking spaces, resulting in a parking ratio of 0.87 parking spaces per 1,000 square feet of net rentable area. Security features at the 800 Secaucus Building and 105 Enterprise Building include hand geometry readers, CCTV, and recorders. Together, the 105 Enterprise Building and the 800 Secaucus Building contain 324,654 square feet.
The Tenant.
Equinix, Inc. (BBB-/Ba2/BBB- by Fitch/Moody’s/S&P; 663,621 square feet, 100.0% of net rentable area, 100.0% of underwritten base rent; 12/31/2068 lease expiration) – Equinix is an American multinational publicly traded real estate investment trust that owns and operates interconnected data centers. Headquartered in Redwood City, CA, Equinix is a provider of network-neutral data centers serving many of the world’s largest financial, media and enterprise companies. Equinix connects 9,800 companies directly to their
THE INFORMATION IN THIS STRUCTURAL AND COLLATERAL TERM SHEET IS NOT COMPLETE AND MAY BE AMENDED PRIOR TO THE TIME OF SALE. THIS TERM SHEET IS NOT AN OFFER TO SELL THESE SECURITIES AND IT IS NOT A SOLICITATION OF AN OFFER TO BUY THESE SECURITIES IN ANY JURISDICTION WHERE THE OFFER OR SALE IS NOT PERMITTED.
31
| Other – Leased Fee | Loan #1 | Cut-off Date Balance: | | $60,000,000 |
| 755 and 800 Secaucus Road | Equinix Data Center | Cut-off Date LTV: | | 49.8% |
| & 105 Enterprise Avenue | | U/W NCF DSCR: | | 2.44x |
| Secaucus, NJ 07094 | | U/W NOI Debt Yield: | | 8.2% |
customers and partners via a global network of state-of-the-art International Business Exchange (“IBX”) data centers, a variety of interconnection solutions, digital ecosystems, and support services. Equinix has established its interconnected platform with 200 IBX centers in 52 markets across the Americas, Asia-Pacific, Europe, and the Middle East and Africa. IBX data centers allow customers to safely and securely aggregate and distribute information globally. Within Equinix’s data centers, customers can rent or purchase cabinets, which are groups of server systems used for distributing data. Customers can purchase shared or private cabinets and customize their respective spaces. In certain locations, customers can purchase a private suite, which is securely separated from the rest of the data center. Equinix has approximately 7,903 employees, of which 3,480 are in the U.S. and 4,423 are international. According to its audited annual statement dated December 31, 2018, Equinix reported revenues and net income of $5.1 billion and $365.4 million, respectively.
The following table presents certain information relating to the tenancy at the Equinix Data Center Property:
Major Tenant
| Tenant Name | Credit Rating
(Fitch/Moody’s/
S&P)(1) | Tenant
NRSF | % of
NRSF | Annual
U/W Base
Rent PSF(2) | Annual
U/W Base
Rent(2) | % of Total
Annual
U/W Base
Rent | Lease
Expiration
Date | Extension Options | Termination
Option (Y/N) |
| Major Tenant | | | | | | | | |
| Equinix, Inc. | BBB-/Ba2/BBB- | 663,621 | 100.0% | $11.28 | $7,485,975 | 100.0% | 12/31/2068 | 1, 5-year | Y(3) |
| Total Major Tenants | 663,621 | 100.0% | $11.28 | $7,485,975 | 100.0% | | | |
| | | | | | | | | |
| Vacant Space | 0 | 0.0% | | | | | | |
| | | | | | | | | |
| Collateral Total | 663,621 | 100.0% | | | | | | |
| | | | | | | | | | |
| (1) | Certain ratings are those of the parent company whether or not the parent company guarantees the lease. |
| (2) | Annual U/W Base Rent PSF and Annual U/W Base Rent include contractual rent steps through August 2020 totaling $146,783. |
| (3) | Equinix has the right to terminate its lease on December 31, 2048 by providing a one-year notice. |
The following table presents certain information relating to the lease rollover schedule at the Equinix Data Center Property:
Lease Expiration Schedule(1)
Year Ending
December 31, | No. of
Leases
Expiring | Expiring
NRSF | % of
Total
NRSF | Cumulative
Expiring
NRSF | Cumulative
% of Total
NRSF | Annual
U/W
Base Rent | % of Total
Annual
U/W Base
Rent | Annual
U/W
Base Rent
PSF |
| MTM | 0 | 0 | 0.0% | 0 | 0.0% | $0 | 0.0% | $0.00 |
| 2019 | 0 | 0 | 0.0% | 0 | 0.0% | $0 | 0.0% | $0.00 |
| 2020 | 0 | 0 | 0.0% | 0 | 0.0% | $0 | 0.0% | $0.00 |
| 2021 | 0 | 0 | 0.0% | 0 | 0.0% | $0 | 0.0% | $0.00 |
| 2022 | 0 | 0 | 0.0% | 0 | 0.0% | $0 | 0.0% | $0.00 |
| 2023 | 0 | 0 | 0.0% | 0 | 0.0% | $0 | 0.0% | $0.00 |
| 2024 | 0 | 0 | 0.0% | 0 | 0.0% | $0 | 0.0% | $0.00 |
| 2025 | 0 | 0 | 0.0% | 0 | 0.0% | $0 | 0.0% | $0.00 |
| 2026 | 0 | 0 | 0.0% | 0 | 0.0% | $0 | 0.0% | $0.00 |
| 2027 | 0 | 0 | 0.0% | 0 | 0.0% | $0 | 0.0% | $0.00 |
| 2028 | 0 | 0 | 0.0% | 0 | 0.0% | $0 | 0.0% | $0.00 |
| 2029 | 0 | 0 | 0.0% | 0 | 0.0% | $0 | 0.0% | $0.00 |
| Thereafter | 2 | 663,621 | 100.0% | 663,621 | 100.0% | $7,485,975 | 100.0% | $11.28 |
| Vacant | 0 | 0 | 0.0% | 663,621 | 100.0% | $0 | 0.0% | $0.00 |
| Total/Weighted Average | 2 | 663,621 | 100.0% | | | $7,485,975 | 100.0% | $11.28 |
| (1) | Information obtained from the underwritten rent roll. |
The following table presents historical occupancy percentages at the Equinix Data Center Property:
Historical Occupancy
12/31/2015(1) | 12/31/2016(1) | 12/31/2017(1) | 12/31/2018(1) | 11/1/2019(2) |
| 100.0% | 100.0% | 100.0% | 100.0% | 100.0% |
| (1) | Information obtained from the Equinix Data Center Borrower. |
| (2) | Information obtained from the underwritten rent roll. |
THE INFORMATION IN THIS STRUCTURAL AND COLLATERAL TERM SHEET IS NOT COMPLETE AND MAY BE AMENDED PRIOR TO THE TIME OF SALE. THIS TERM SHEET IS NOT AN OFFER TO SELL THESE SECURITIES AND IT IS NOT A SOLICITATION OF AN OFFER TO BUY THESE SECURITIES IN ANY JURISDICTION WHERE THE OFFER OR SALE IS NOT PERMITTED.
32
| Other – Leased Fee | Loan #1 | Cut-off Date Balance: | | $60,000,000 |
| 755 and 800 Secaucus Road | Equinix Data Center | Cut-off Date LTV: | | 49.8% |
| & 105 Enterprise Avenue | | U/W NCF DSCR: | | 2.44x |
| Secaucus, NJ 07094 | | U/W NOI Debt Yield: | | 8.2% |
Operating History and Underwritten Net Cash Flow. The following table presents certain information relating to the underwritten net cash flow at the Equinix Data Center Property:
Cash Flow Analysis
| | 2016 | | 2017 | | 2018 | | U/W | | %(1) | | U/W $ per SF | |
| Rents in Place | $6,456,324 | | $6,678,724 | | $6,687,602 | | $7,339,192 | | 89.8 | % | | $11.06 | |
| Contractual Rent Steps(2) | 0 | | 0 | | 0 | | 146,783 | | 1.8 | | | 0.22 | |
| Straight Line Rent | 0 | | 0 | | 0 | | 684,172 | | 8.4 | | | 1.03 | |
| Grossed Up Vacant Space | 0 | | 0 | | 0 | | 0 | | 0.0 | | | 0.00 | |
| Gross Potential Rent | $6,456,324 | | $6,678,724 | | $6,687,602 | | $8,170,147 | | 100.0 | % | | $12.31 | |
| Other Income | 0 | | 0 | | 0 | | 0 | | 0.0 | | | 0.00 | |
| Total Recoveries | 0 | | 0 | | 0 | | 0 | | 0.0 | | | 0.00 | |
| Net Rental Income | $6,456,324 | | $6,678,724 | | $6,687,602 | | $8,170,147 | | 100.0 | % | | $12.31 | |
| (Vacancy & Credit Loss) | 0 | | 0 | | 0 | | 0 | | 0.0 | | | 0.00 | |
| Effective Gross Income | $6,456,324 | | $6,678,724 | | $6,687,602 | | $8,170,147 | | 100.0 | % | | $12.31 | |
| | | | | | | | | | | | | |
| Real Estate Taxes | 0 | | 0 | | 0 | | 0 | | 0.0 | | | 0.00 | |
| Insurance | 0 | | 0 | | 0 | | 0 | | 0.0 | | | 0.00 | |
| Management Fee | 0 | | 0 | | 0 | | 0 | | 0.0 | | | 0.00 | |
| Other Operating Expenses | 0 | | 0 | | 0 | | 0 | | 0.0 | | | 0.00 | |
| Total Operating Expenses | $0 | | $0 | | $0 | | $0 | | 0.0 | % | | $0.00 | |
| | | | | | | | | | | | | |
| Net Operating Income(3) | $6,456,324 | | $6,678,724 | | $6,687,602 | | $8,170,147 | | 100.0 | % | | $12.31 | |
| Replacement Reserves | 0 | | 0 | | 0 | | 0 | | 0.0 | | | 0.00 | |
| TI/LC | 0 | | 0 | | 0 | | 0 | | 0.0 | | | 0.00 | |
| Net Cash Flow | $6,456,324 | | $6,678,724 | | $6,687,602 | | $8,170,147 | | 100.0 | % | | $12.31 | |
| | | | | | | | | | | | | |
| NOI DSCR(4) | 1.92x | | 1.99x | | 1.99x | | 2.44x | | | | | |
| NCF DSCR(4) | 1.92x | | 1.99x | | 1.99x | | 2.44x | | | | | |
| NOI Debt Yield(4) | 6.5% | | 6.7% | | 6.7% | | 8.2% | | | | | |
| NCF Debt Yield(4) | 6.5% | | 6.7% | | 6.7% | | 8.2% | | | | | |
| (1) | Represents (i) percent of Net Rental Income for all revenue fields, (ii) percent of Gross Potential Rent for Vacancy & Credit Loss and (iii) percent of Effective Gross Income for all other fields. |
| (2) | Represents contractual rent steps through August 2020. |
| (3) | The U/W Net Operating Income increased compared to the 2018 Net Operating Income mainly due to (i) new ground leases in place in December 2018. (ii) underwritten straight line rent of $684,172, and (iii) underwritten rent step through 2020 of $146,783. |
| (4) | The debt service coverage ratios and debt yields are based on the Equinix Data Center Whole Loan. |
Appraisal.As of the appraisal valuation date of August 8, 2019, the Equinix Data Center Property had an “as-is” appraised value of $201,000,000.
Environmental Matters. According to a Phase I environmental site assessment dated September 17, 2019, there was a controlled recognized environmental condition relating to regulatory records. For additional information, see “Environmental Considerations” in the Preliminary Prospectus.
Market Overview and Competition.The Equinix Data Center Property is located in Secaucus, Hudson County, New Jersey, approximately 7.8 miles west of New York within the New York City metropolitan statistical area (the “New York MSA”). According to the appraisal, the New York MSA is the financial capital of the world. Other major industries include service, retail trade, insurance and real estate sectors. New York is home to 71 Fortune 500 company headquarters, which include, JPMorgan Chase, Verizon Communications, Citigroup, MetLife, Goldman Sachs Group and Morgan Stanley. Primary regional access to the Equinix Data Center Property is provided by Interstates 95 and 80. The Equinix Data Center Property neighborhood is located in close proximity to the Secaucus Junction Station of the New Jersey Transit system where major New Jersey transit rail lines connect for travel into Manhattan.
The New York metro data center market includes clusters in Northern New Jersey, Southeastern New York, and Southwestern Connecticut. According to the appraisal, the New York metro represents the second largest data center market in the United States with 4.7 million square feet of operational data center space and accounts for the highest colocation revenues with proximity to Wall Street and subsea connectivity. Data center customers within this region primarily include the financial sector, healthcare, media and others, of which the financial industry is responsible for approximately 40% of its total economic output. According to the appraisal, there are 156 active data centers with a combined 624 megawatts operated by 60 providers within the New York metro data center market. The 755 Secaucus Building within the Equinix Data Center Property hosts 49 exchanges and is a prominent data center which
THE INFORMATION IN THIS STRUCTURAL AND COLLATERAL TERM SHEET IS NOT COMPLETE AND MAY BE AMENDED PRIOR TO THE TIME OF SALE. THIS TERM SHEET IS NOT AN OFFER TO SELL THESE SECURITIES AND IT IS NOT A SOLICITATION OF AN OFFER TO BUY THESE SECURITIES IN ANY JURISDICTION WHERE THE OFFER OR SALE IS NOT PERMITTED.
33
| Other – Leased Fee | Loan #1 | Cut-off Date Balance: | | $60,000,000 |
| 755 and 800 Secaucus Road | Equinix Data Center | Cut-off Date LTV: | | 49.8% |
| & 105 Enterprise Avenue | | U/W NCF DSCR: | | 2.44x |
| Secaucus, NJ 07094 | | U/W NOI Debt Yield: | | 8.2% |
provides services to the financial services sector with its matching engines that allocate competing trades among competing bids and offers priced the same, to support trades for several major exchanges.
The table below presents certain information relating to comparable sales for the Equinix Data Center Property identified by the appraiser.
Comparable Ground Lease Sales(1)
| Property Name | Location | Land Size
(SF) | Sale Date | Sale Price | Sale Price (PSF) | Cap Rate(2) |
| 525 Eighth Avenue | New York, NY | 7,454 | Apr-19 | $61,000,000 | $8,183.53 | 3.69% |
| 39 West 55th Street | New York, NY | 5,025 | Apr-19 | $28,000,000 | $5,572.14 | 3.46% |
| 1733 Ocean Avenue | Santa Monica, CA | 28,410 | Mar-19 | $65,000,000 | $2,287.93 | 1.93% |
| 3747 South 2700 West | Salt Lake City, UT | 567,587 | Jan-19 | $10,439,000 | $18.39 | 4.72% |
| 7 Bryant Park | New York, NY | 19,207 | Sep-18 | $200,000,000 | $10,412.87 | 2.65% |
| 1 Teterboro Drive | Teterboro, NJ | 625,522 | Jul-18 | $37,481,551 | $59.92 | 4.76% |
| 375 Hudson Street | New York, NY | 69,260 | Aug-17 | $580,000,000 | $8,374.24 | 4.50% |
| 24300 Town Center Drive | Valencia, CA | 387,684 | Jul-17 | $67,000,000 | $172.82 | 5.00% |
| 6200 Hollywood Boulevard | Los Angeles (Hollywood), CA | 475,597 | Jun-17 | $142,000,000 | $298.57 | 3.50% |
| 350 South Grand Avenue | Los Angeles, CA | 156,380 | Nov-16 | $70,000,000 | $447.63 | 3.30% |
| 300 South Grand Avenue | Los Angeles, CA | 105,415 | Nov-16 | $33,430,000 | $317.13 | 2.80% |
| 144 Route-73 Highway | Voorhees, NJ | 737,005 | Nov-16 | $17,215,000 | $23.36 | 5.80% |
| 411 108th Avenue NE | Bellevue, WA | 48,352 | Feb-16 | $19,500,000 | $403.29 | 3.50% |
| (1) | Information obtained from the appraisal. |
| (2) | Per the appraisal, the sales comparison approach is not relevant except as a source providing indications of capitalization rates for this type of investment (leased fee). |
The following table presents certain information relating to ten comparable leases to those at the Equinix Data Center Property:
Comparable Leases(1)
Property
Name/Location | Year Built/
Renovated | Total
GLA
(SF) | Distance
from
Subject | Lease
Term | Tenant
Size | Annual
Base
Rent PSF | Lease
Type |
| Industrial Leases | | | | | | | |
Harmon Cove Industrial Park 550 Meadowlands Pkwy Secaucus, NJ | 1983/NAP | 144,605 | 1.6 miles | 2.0 Yrs | 83,470 | $11.50 | NNN |
10 Enterprise Avenue North 10 Enterprise Avenue Secaucus, NJ | 1971/NAP | 158,268 | 0.8 miles | 5.0 Yrs | 125,904 | $11.50 | NNN |
100 Electric Avenue 100 Electric Avenue Secaucus, NJ | 1984/NAP | 126,086 | 0.7 miles | 5.0 Yrs | 126,086 | $12.50 | NNN |
46 Meadowlands Parkway 46 Meadowlands Parkway Secaucus, NJ | 2016/NAP | 302,727 | 1.4 miles | 10.0 Yrs | 302,727 | $10.00 | NNN |
| (1) | Information obtained from the appraisal. |
Escrows.
Real Estate Taxes – Upfront escrows were not required. Ongoing monthly real estate tax reserves, equaling one-twelfth of the real estate taxes that the lender estimates will be payable during the next twelve months, are not currently required and will not be required so long as (i) no event of default has occurred or is continuing, (ii) all of the Equinix Data Center Property is demised by the Critical Tenant Lease (as defined below), (iii) the Critical Tenant Lease is in full force and effect, (iv) no Critical Tenant Trigger Event (as defined below) has occurred or remains outstanding, and (v) the Critical Tenant (as defined below) is paying all taxes to the governmental authorities in full in a timely manner and the Equinix Data Center Borrowers provide satisfactory evidence to the lender in a timely manner.
Insurance – Upfront escrows were not required. Ongoing monthly insurance reserves, equaling one-twelfth of the insurance premiums that the lender estimates will be payable during the next twelve months, are not currently required and will not be required so long as (i) no event of default has occurred or is continuing, (ii) all of the Equinix Data Center Property is demised by the Critical Tenant Lease,
THE INFORMATION IN THIS STRUCTURAL AND COLLATERAL TERM SHEET IS NOT COMPLETE AND MAY BE AMENDED PRIOR TO THE TIME OF SALE. THIS TERM SHEET IS NOT AN OFFER TO SELL THESE SECURITIES AND IT IS NOT A SOLICITATION OF AN OFFER TO BUY THESE SECURITIES IN ANY JURISDICTION WHERE THE OFFER OR SALE IS NOT PERMITTED.
34
| Other – Leased Fee | Loan #1 | Cut-off Date Balance: | | $60,000,000 |
| 755 and 800 Secaucus Road | Equinix Data Center | Cut-off Date LTV: | | 49.8% |
| & 105 Enterprise Avenue | | U/W NCF DSCR: | | 2.44x |
| Secaucus, NJ 07094 | | U/W NOI Debt Yield: | | 8.2% |
(iii) the Critical Tenant Lease is in full force and effect, (iv) no Critical Tenant Trigger Event has occurred or remains outstanding, and (v) the Critical Tenant is maintaining insurance with insurance companies that satisfy the requirement set forth within the loan documents and the Equinix Data Center Borrowers provides satisfactory evidence to the lender in a timely manner.
Replacement Reserves – Upfront escrows were not required. Ongoing monthly replacement reserves are not required under the Equinix Data Center Whole Loan documents.
TI/LC Reserve – Upfront escrows were not required. Ongoing monthly TI/LC reserves will not be required.
Lockbox and Cash Management.The Equinix Data Center Whole Loan requires a hard lockbox with springing cash management (which will be triggered upon the occurrence of a Cash Sweep Event (as defined below)). The Equinix Data Center Whole Loan documents require the Equinix Data Center Borrowers to deliver written notification to the tenant to deposit all rents payable under each lease directly into the lockbox account, which is already in place. The Equinix Data Center Whole Loan documents also require that all rents received by the Equinix Data Center Borrowers or the property manager be deposited into the lockbox account within one business day of receipt. Upon the occurrence of a Cash Sweep Event, the Equinix Data Center Borrowers will establish a lender-controlled cash management account, and all amounts in the account are to be transferred daily for the payment, among other things, of the debt service, monthly escrows, and default interest (if applicable). Pursuant to the Equinix Data Center Whole Loan documents, all excess funds on deposit are required to be applied as follows (a) if a Cash Sweep Event is not in effect, to the Equinix Data Center Borrowers, and (b) if a Cash Sweep Event is in effect due to the existence of a Critical Tenant Trigger Event to the Critical Tenant TI/LC account until the applicable Critical Tenant Trigger Event Cure (as defined below) has occurred. If a Cash Sweep Event is in effect but a Critical Tenant Trigger Event is not in effect, then funds will be applied to the excess cash flow account.
A “Cash Sweep Event” will commence upon the occurrence of the following:
| (ii) | any bankruptcy action of the Equinix Data Center Borrowers or guarantor; or |
| (iii) | a Critical Tenant Trigger Event |
A Cash Sweep Event will end upon the occurrence of:
| ● | with regard to clause (i) above, a cure of such event of default being accepted or waived by the lender; |
| ● | with regard to clause (ii) above, such bankruptcy action being discharged, stayed, or dismissed within 45 days for the Equinix Data Center Borrowers or guarantor; or |
| ● | with regard to clause (iii) above, a Critical Tenant Trigger Event Cure. |
A “Critical Tenant Trigger Event” will occur if Equinix, Inc. (the “Critical Tenant” and the related lease, the “Critical Tenant Lease”) (i) gives notice of its intention to not extend or renew the Critical Tenant Lease, (ii) on or prior to twelve (12) months prior to the applicable expiration date under the Critical Tenant Lease, the Critical Tenant fails to give notice of its election to renew the Critical Tenant Lease, (iii) an event of default under the Critical Tenant Lease occurs and continues beyond any applicable notice and/or cure periods, or (iv) a bankruptcy action of the Critical Tenant.
A “Critical Tenant Trigger Event Cure” will occur upon (a) in the event of a Critical Tenant Trigger Event described in clause (i) or (ii), the date that the Critical Tenant Space Re-tenanting Event (as defined below) has occurred, (b) in the event of a Critical Tenant Trigger Event described in clause (iii), a cure of the applicable event of default under the Critical Tenant Lease as determined by the lender in its reasonable discretion, or (c) in the event of a Critical Tenant Trigger Event described in clause (iv), the affirmation of the Critical Tenant Lease in the applicable bankruptcy proceeding, provided that the Critical Tenant is actually paying all rents and other amounts due under the Critical Tenant Lease accruing from the petition date;provided, however, that at such time as the amount transferred into the Critical Tenant TI/LC account pursuant to any Critical Tenant Trigger Event exceeds $3,345,833, a Critical Tenant Trigger Event Cure with respect to such Critical Tenant Trigger Event will be deemed to have occurred.
A “Critical Tenant Space Re-tenanting Event” will occur upon the date all of the following conditions have been satisfied: (i) the Critical Tenant Space has been leased to one or more replacement tenants (or the Critical Tenant) for a term that does not expire on or prior to two (2) years after October 6, 2029 and on terms and conditions acceptable to the lender, (ii) all tenant improvement costs, leasing commissions and other material costs and expenses relating to the re-letting of the Critical Tenant Space, if any, have been paid in full, and (iii) the related tenant(s) have accepted the Critical Tenant space and are paying full contractual rent as evidenced by the tenant estoppel certificate(s) acceptable to the lender.
Property Management. The Equinix Data Center Property is self-managed.
Partial Release. Not permitted.
Real Estate Substitution. Not permitted.
Subordinate and Mezzanine Indebtedness. Not permitted.
Ground Lease. None.
Terrorism Insurance.The Equinix Data Center Whole Loan documents require that the “all risk” insurance policy required to be maintained by the Equinix Data Center Borrowers provides coverage for terrorism in an amount equal to the full replacement cost of
THE INFORMATION IN THIS STRUCTURAL AND COLLATERAL TERM SHEET IS NOT COMPLETE AND MAY BE AMENDED PRIOR TO THE TIME OF SALE. THIS TERM SHEET IS NOT AN OFFER TO SELL THESE SECURITIES AND IT IS NOT A SOLICITATION OF AN OFFER TO BUY THESE SECURITIES IN ANY JURISDICTION WHERE THE OFFER OR SALE IS NOT PERMITTED.
35
| Other – Leased Fee | Loan #1 | Cut-off Date Balance: | | $60,000,000 |
| 755 and 800 Secaucus Road | Equinix Data Center | Cut-off Date LTV: | | 49.8% |
| & 105 Enterprise Avenue | | U/W NCF DSCR: | | 2.44x |
| Secaucus, NJ 07094 | | U/W NOI Debt Yield: | | 8.2% |
the Equinix Data Center Property, as well as business interruption insurance covering no less than the 18-month period following the occurrence of a casualty event, together with a 12-month extended period of indemnity.
THE INFORMATION IN THIS STRUCTURAL AND COLLATERAL TERM SHEET IS NOT COMPLETE AND MAY BE AMENDED PRIOR TO THE TIME OF SALE. THIS TERM SHEET IS NOT AN OFFER TO SELL THESE SECURITIES AND IT IS NOT A SOLICITATION OF AN OFFER TO BUY THESE SECURITIES IN ANY JURISDICTION WHERE THE OFFER OR SALE IS NOT PERMITTED.
36
(THIS PAGE INTENTIONALLY LEFT BLANK)
THE INFORMATION IN THIS STRUCTURAL AND COLLATERAL TERM SHEET IS NOT COMPLETE AND MAY BE AMENDED PRIOR TO THE TIME OF SALE. THIS TERM SHEET IS NOT AN OFFER TO SELL THESE SECURITIES AND IT IS NOT A SOLICITATION OF AN OFFER TO BUY THESE SECURITIES IN ANY JURISDICTION WHERE THE OFFER OR SALE IS NOT PERMITTED.
37
| Retail – Anchored | Loan #2 | Cut-off Date Balance: | | $45,500,000 |
| 8973 Bay Parkway | Ceasar’s Bay Shopping Center | Cut-off Date LTV: | | 51.5% |
| Brooklyn, NY 11214 | | U/W NCF DSCR: | | 3.60x |
| | | U/W NOI Debt Yield: | | 11.6% |
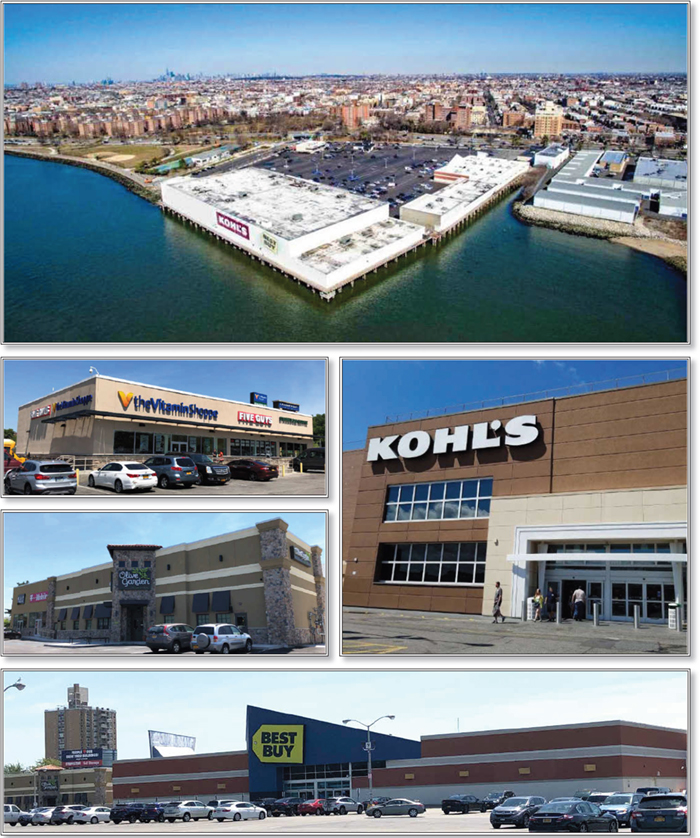
THE INFORMATION IN THIS STRUCTURAL AND COLLATERAL TERM SHEET IS NOT COMPLETE AND MAY BE AMENDED PRIOR TO THE TIME OF SALE. THIS TERM SHEET IS NOT AN OFFER TO SELL THESE SECURITIES AND IT IS NOT A SOLICITATION OF AN OFFER TO BUY THESE SECURITIES IN ANY JURISDICTION WHERE THE OFFER OR SALE IS NOT PERMITTED.
38
| Retail – Anchored | Loan #2 | Cut-off Date Balance: | | $45,500,000 |
| 8973 Bay Parkway | Ceasar’s Bay Shopping Center | Cut-off Date LTV: | | 51.5% |
| Brooklyn, NY 11214 | | U/W NCF DSCR: | | 3.60x |
| | | U/W NOI Debt Yield: | | 11.6% |
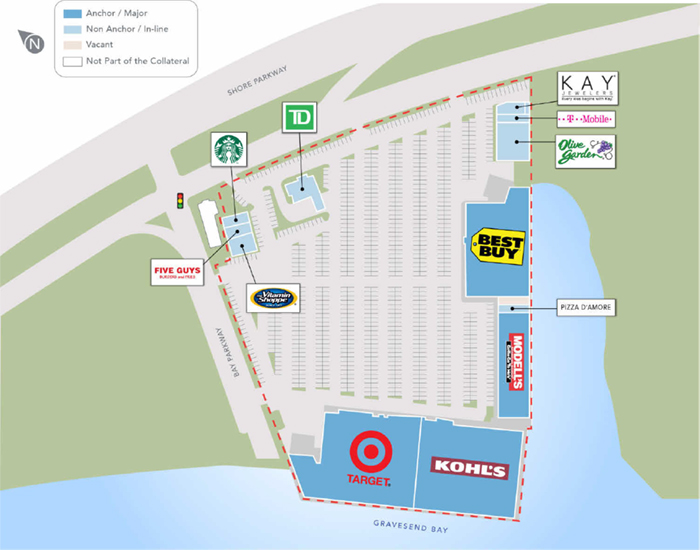
THE INFORMATION IN THIS STRUCTURAL AND COLLATERAL TERM SHEET IS NOT COMPLETE AND MAY BE AMENDED PRIOR TO THE TIME OF SALE. THIS TERM SHEET IS NOT AN OFFER TO SELL THESE SECURITIES AND IT IS NOT A SOLICITATION OF AN OFFER TO BUY THESE SECURITIES IN ANY JURISDICTION WHERE THE OFFER OR SALE IS NOT PERMITTED.
39
| Retail – Anchored | Loan #2 | Cut-off Date Balance: | | $45,500,000 |
| 8973 Bay Parkway | Ceasar’s Bay Shopping Center | Cut-off Date LTV: | | 51.5% |
| Brooklyn, NY 11214 | | U/W NCF DSCR: | | 3.60x |
| | | U/W NOI Debt Yield: | | 11.6% |

THE INFORMATION IN THIS STRUCTURAL AND COLLATERAL TERM SHEET IS NOT COMPLETE AND MAY BE AMENDED PRIOR TO THE TIME OF SALE. THIS TERM SHEET IS NOT AN OFFER TO SELL THESE SECURITIES AND IT IS NOT A SOLICITATION OF AN OFFER TO BUY THESE SECURITIES IN ANY JURISDICTION WHERE THE OFFER OR SALE IS NOT PERMITTED.
40
| No. 2 – Ceasar’s Bay Shopping Center |
| |
| Mortgage Loan Information | | Mortgaged Property Information |
| Mortgage Loan Seller: | Barclays Capital Real Estate Inc. | | Single Asset/Portfolio: | Single Asset |
Credit Assessment (DBRS/Fitch/Moody’s): | NR/NR/NR | | Property Type – Subtype: | Retail – Anchored |
| Original Principal Balance(1): | $45,500,000 | | Location: | Brooklyn, NY |
| Cut-off Date Balance(1): | $45,500,000 | | Size: | 301,300 SF |
| % of Initial Pool Balance: | 6.5% | | Cut-off Date Balance Per SF(1): | $290.41 |
| Loan Purpose: | Refinance | | Maturity Date Balance Per SF(1): | $290.41 |
| Borrower Sponsors: | Gazit Horizons, Inc.; CBB Realty Associates, LLC | | Year Built/Renovated: | 1957/2018 |
| Guarantor: | Gazit Horizons, Inc.; CBB Realty Associates, LLC | | Title Vesting: | Leasehold |
| Mortgage Rate: | 3.0150% | | Property Manager: | Self-managed |
| Note Date: | October 4, 2019 | | Current Occupancy (As of)(4): | 97.8% (10/2/2019) |
| Seasoning: | 1 month | | YE 2018 Occupancy(4): | 73.7% |
| Maturity Date: | October 6, 2029 | | YE 2017 Occupancy(4): | 97.4% |
| IO Period: | 120 months | | YE 2016 Occupancy: | 97.4% |
| Loan Term (Original): | 120 months | | YE 2015 Occupancy: | 97.4% |
| Amortization Term (Original): | NAP | | As-Is Appraised Value(5): | $170,000,000 |
| Loan Amortization Type: | Interest-only, Balloon | | As-Is Appraised Value Per SF(5): | $564.22 |
| Call Protection(2): | L(25),D(88),O(7) | | As-Is Appraisal Valuation Date: | July 2, 2019 |
| Lockbox Type: | Hard/Springing Cash Management | | Underwriting and Financial Information |
| Additional Debt: | Yes | | TTM NOI (6/30/2019)(6): | $5,272,354 |
| Additional Debt Type (Balance): | Pari Passu ($42,000,000); Future Mezzanine | | YE 2018 NOI: | $4,446,707 |
| | | | YE 2017 NOI: | $4,284,721 |
| | | | YE 2016 NOI: | $5,374,439 |
| | | | U/W Revenues: | $15,626,531 |
| | | | U/W Expenses: | $5,441,084 |
| Escrows and Reserves(3) | | U/W NOI(6): | $10,185,447 |
| | Initial | Monthly | Cap | | U/W NCF: | $9,645,265 |
| Taxes | $468,758 | $117,190 | NAP | | U/W DSCR based on NOI/NCF(1): | 3.80x / 3.60x |
| Insurance | $761,458 | $76,620 | NAP | | U/W Debt Yield based on NOI/NCF(1): | 11.6% / 11.0% |
| Ground Rent Reserve | $0 | $60,683 | NAP | | U/W Debt Yield at Maturity based on NOI/NCF(1): | 11.6% / 11.0% |
| Replacement Reserves | $1,000,000 | Springing | NAP | | Cut-off Date LTV Ratio(1): | 51.5% |
| TI/LC Reserve | $0 | Springing | NAP | | LTV Ratio at Maturity(1): | 51.5% |
| Target Free Rent Reserve | $4,567,700 | $0 | NAP | | | |
| Outstanding TI Reserve | $2,511,385 | $0 | NAP | | | |
| Piling Work Reserve | $6,000,000 | $0 | NAP | | | |
| | | | | | | | |
| Sources and Uses |
| Sources | | | | | Uses | | | |
| Original whole loan amount | $87,500,000 | | 100.0% | | Loan payoff | $22,338,887 | | 25.5% |
| | | | | | Upfront reserves | 15,309,301 | | 17.5 |
| | | | | | Return of equity | 46,634,047 | | 53.3 |
| | | | | | Closing costs | 3,217,765 | | 3.7 |
| Total Sources | $87,500,000 | | 100.0% | | Total Uses | $87,500,000 | | 100.0% |
| (1) | The Ceasar’s Bay Shopping Center Mortgage Loan (as defined below) is part of the Ceasar’s Bay Shopping Center Whole Loan (as defined below), which comprises twopari passunotes with an aggregate original balance of $87,500,000. All statistical information related to the Cut-off Date Balance Per SF, Maturity Date Balance Per SF, U/W DSCR based on NOI/NCF, U/W Debt Yield based on NOI/NCF, U/W Debt Yield at Maturity based on NOI/NCF, Cut-off Date LTV Ratio and LTV Ratio at Maturity are based on the Ceasar’s Bay Shopping Center Whole Loan. |
| (2) | Defeasance of the Ceasar’s Bay Shopping Center Whole Loan is permitted at any time after the earlier to occur of (a) the end of the two-year period commencing on the closing date of the securitization of the Ceasar’s Bay Shopping Centerpari-passu companion loans to be securitized and (b) October 4, 2022. |
| (3) | See “Escrows” section for a full description of Escrows and Reserves. |
| (4) | The decrease in occupancy from 2017 to 2018 is due to Toys “R” Us vacating the Ceasar’s Bay Shopping Center Property following the company’s bankruptcy proceedings. The increase in occupancy from 2018 to 10/2/2019 is due to Target backfilling the Toys “R” Us space. |
| (5) | The Appraised Value and Appraised Value Per SF assume that immediate repairs and capital expenditures are completed within a timely manner. At origination, the borrower deposited upfront reserves totaling $1,000,000 for general capital improvements, $6,000,000 for piling improvements and $2,511,385 for outstanding tenant improvements and leasing commissions regarding the Target space. |
| (6) | The increase in U/W NOI from TTM (6/30/2019) is due to (i) the lease up of the Target space (previously Toys “R” Us was not paying rent), (ii) the development of a new outparcel totaling 12,000 square feet leased to Olive Garden, Kay Jewelers and T-Mobile accounting for $1.1 million of rent that was not fully captured in the TTM 6/30/2019 period and (iv) rent steps and straight-lined rent combining for $342,434. |
The Mortgage Loan. The mortgage loan (the “Ceasar’s Bay Shopping Center Mortgage Loan”) is part of a whole loan (the “Ceasar’s Bay Shopping Center Whole Loan”) evidenced by twopari passu notes with an original principal balance of $87,500,000 and an outstanding principal balance as of the Cut-off Date of $87,500,000 secured by a first mortgage encumbering the leasehold interest in an anchored retail center located in Brooklyn, New York (the “Ceasar’s Bay Shopping Center Property”). The Ceasar’s Bay Shopping Center Mortgage Loan represents the controlling Note A-1. See “Description of the Mortgage Pool—The Whole Loans—The Serviced Pari Passu Whole Loans” and “Pooling and Servicing Agreement” in the Preliminary Prospectus.
THE INFORMATION IN THIS STRUCTURAL AND COLLATERAL TERM SHEET IS NOT COMPLETE AND MAY BE AMENDED PRIOR TO THE TIME OF SALE. THIS TERM SHEET IS NOT AN OFFER TO SELL THESE SECURITIES AND IT IS NOT A SOLICITATION OF AN OFFER TO BUY THESE SECURITIES IN ANY JURISDICTION WHERE THE OFFER OR SALE IS NOT PERMITTED.
41
| Retail – Anchored | Loan #2 | Cut-off Date Balance: | | $45,500,000 |
| 8973 Bay Parkway | Ceasar’s Bay Shopping Center | Cut-off Date LTV: | | 51.5% |
| Brooklyn, NY 11214 | | U/W NCF DSCR: | | 3.60x |
| | | U/W NOI Debt Yield: | | 11.6% |
Note Summary
| Notes | Original Principal Balance | Cut-off Date Balance | Note Holder | Controlling Interest |
| A-1 | $45,500,000 | $45,500,000 | WFCM 2019-C53 | Yes |
| A-2 | $42,000,000 | $42,000,000 | An affiliate of Barclays Capital Real Estate Inc. | No |
| Total | $87,500,000 | $87,500,000 | | |
The Borrower and Borrower Sponsors.The borrower is CBB Venture LLC, a Delaware limited liability company and single purpose entity. The borrower has one independent director. Legal counsel to the borrower delivered a non-consolidation opinion in connection with the origination of the Ceasar’s Bay Shopping Center Whole Loan. The non-recourse carve-out guarantors and borrower sponsors of the Ceasar’s Bay Shopping Center Whole Loan are Gazit Horizons, Inc. and CBB Realty Associates, LLC.
The borrower sponsors are Gazit Horizons, Inc. and CBB Realty Associates, LLC. Founded in 2017, Gazit Horizons, Inc. is the US subsidiary of Gazit Globe, a publicly traded Israeli global real estate company focused on the ownership, management, and development of retail and mixed-use properties in major urban markets in North America, Brazil, Israel, Northern, Central, and Eastern Europe. Gazit Globe’s current portfolio is comprised of 103 properties totaling 26.9 million square feet worldwide with a total estimated asset value of $11.0 billion. CBB Realty Associates, LLC is an affiliate of Surrey Equities, LLC. Surrey Equities, LLC is a real estate investment management firm that was founded in 2004 by Edward Silvera and Leon Silvera and is headquartered in New York. Surrey’s current portfolio is comprised of over 1.5 million square feet of retail properties located in Texas, Ohio, North Carolina, Florida, Maine, New York, Pennsylvania and Connecticut. The borrower sponsors are currently subject to two class action litigation proceedings in Israeli court. See “Description of the Mortgage Pool—Litigation and Other Considerations” in the Prospectus.
The Property.The Ceasar’s Bay Shopping Center Property consists of a 301,300 square foot anchored retail center situated on 15.9 acres in Brooklyn, New York. The Ceasar’s Bay Shopping Center Property is comprised of five two-story retail buildings located in the densely-populated Gravesend neighborhood of Brooklyn which is bordered by Coney Island to the south, Bath Beach to the west, Bensonhurst to the north and Homecrest and Sheepshead Bay to the south. A portion of the Ceasar’s Bay Shopping Center Property is located over the water supported by pilons. According to a third party report, the Ceasar’s Bay Shopping Center Property has vehicle traffic of approximately 146,000 vehicles per day. There are 1,194 parking spaces (resulting in a ratio of 4.0 spaces per 1,000 square feet) at the Ceasar’s Bay Shopping Center Property. As of October 2, 2019, the Ceasar’s Bay Shopping Center Property was 97.8% leased to twelve tenants. Three of the four largest tenants (60.8% of net rentable area, 45.7% of underwritten base rent) have been at the Ceasar’s Bay Shopping Center Property since 2003 or earlier. Kohl’s, Target and Best Buy, making up three of the four anchor tenants, are each investment grade rated and account for 82.1% of the net rentable area.
Major Tenants.
Largest Tenant: Kohls (39.7% of net rentable area; 25.5% of underwritten base rent; 5/31/2023 lease expiration; Moody’s/Fitch/S&P: Baa2/BBB/BBB; NYSE: KSS) –Kohls is a national discount department store chain selling moderately-priced name brand and private label apparel, shoes, accessories and housewares. Kohls operates 1,159 stores in 49 states as well as 15 FILA outlets and Off-Aisle clearance centers. In 2017, Kohls entered into an agreement with a top competitor, Amazon, to accept Amazon returns in Kohls stores and establish Amazon Smart Home Experience zones in a number of its locations. Kohls had net sales of $19.2 billion in the 2018 fiscal year, an increase of 0.7% over its sales in fiscal year 2017. Kohls has been a tenant at the Ceasar’s Bay Shopping Center Property since 2003. Kohls has five, five-year renewal options remaining on their lease. The next option to renew is for $26.40 PSF which is below the appraisal’s concluded market rent at $31.75 PSF.
2ndLargest Tenant: Target (29.2% of net rentable area; 33.0% of underwritten base rent; 7/31/2035 lease expiration; Moody’s/Fitch/S&P: A2/A-/A; NYSE: TGT) –Target is the second largest discount retailer in the United States and the fifth largest domestic retailer overall according to the appraisal. Target operates 1,822 stores selling a wide variety of consumables, commodities, electronics, sporting goods, toys, apparel, and home furnishings. Target sales increased 3.6% to $74.4 billion in fiscal year 2018 compared to 2017. Target signed a new lease for the former Toys “R” Us space in February 2019. According to the borrower sponsors, Target will be doing its own build out and is expected to invest approximately $20.0 million to build out its interior according to the borrower sponsor. Target is expected to open in summer 2020, with rent commencement on the earlier of (i) its opening date or (ii) August 21, 2020. All outstanding TI/LC’s and gap rent were reserved at origination. See the “Escrows and Reserves” section for further details. Target has four, five-year renewal options.
3rdLargest Tenant: Best Buy (13.1% of net rentable area; 8.7% of underwritten base rent; 1/31/2022 lease expiration; Moody’s/Fitch/S&P: Baa1/BBB/BBB) –Best Buy is a specialty retailer of consumer electronics, home-office products, entertainment software, appliances and related services. Best Buy operates 1,238 stores in the United States and internationally. Best Buy has been a tenant at the Ceasar’s Bay Shopping Center Property since 2002 and has one, 10-year renewal option remaining. Best Buy’s next option to renew is for $30.00 PSF, which is below the appraiser’s concluded market rent of $50.00.
THE INFORMATION IN THIS STRUCTURAL AND COLLATERAL TERM SHEET IS NOT COMPLETE AND MAY BE AMENDED PRIOR TO THE TIME OF SALE. THIS TERM SHEET IS NOT AN OFFER TO SELL THESE SECURITIES AND IT IS NOT A SOLICITATION OF AN OFFER TO BUY THESE SECURITIES IN ANY JURISDICTION WHERE THE OFFER OR SALE IS NOT PERMITTED.
42
| Retail – Anchored | Loan #2 | Cut-off Date Balance: | | $45,500,000 |
| 8973 Bay Parkway | Ceasar’s Bay Shopping Center | Cut-off Date LTV: | | 51.5% |
| Brooklyn, NY 11214 | | U/W NCF DSCR: | | 3.60x |
| | | U/W NOI Debt Yield: | | 11.6% |
The following table presents certain information relating to the tenancy at the Ceasar’s Bay Shopping Center Property:
Major Tenants
| Tenant Name | Credit Rating
(Fitch/Moody’s/
S&P)(1) | Tenant NRSF | % of
NRSF | Annual
U/W Base
Rent PSF(2) | Annual
U/W Base Rent(2) | % of Total
Annual
U/W Base
Rent | Lease
Expiration
Date | Extension Options | Termination
Option (Y/N) |
| Major Tenants | | | | | | | | |
| Kohls | BBB/Baa2/BBB | 119,734 | 39.7% | $24.20 | $2,898,078 | 25.5% | 5/31/2023 | 5, 5-year | N |
| Target(3) | A-/A2/A | 88,000 | 29.2% | $42.67 | $3,755,330 | 33.0% | 7/31/2035 | 4, 5-year | N |
| Best Buy | BBB/Baa1/BBB | 39,568 | 13.1% | $25.00 | $989,200 | 8.7% | 1/31/2022 | 1, 10-year | N |
| Modell’s | NR/NR/NR | 23,792 | 7.9% | $55.00 | $1,308,560 | 11.5% | 1/31/2025 | 2, 5-year | N |
| Olive Garden | NR/NR/NR | 8,350 | 2.8% | $90.00 | $751,500 | 6.6% | 11/28/2028 | 4, 5-year | N |
| Total Major Tenants | 279,444 | 92.7% | $34.72 | $9,702,667 | 85.4% | | | |
| | | | | | | | | | |
| Non-Major Tenant | 15,256 | 5.1% | $109.04 | $1,663,519 | 14.6% | | | |
| | | | | | | | | |
| Occupied Collateral Total | 294,700 | 97.8% | $38.57 | $11,366,186 | 100.0% | | | |
| | | | | | | | | |
| Vacant Space | 6,600 | 2.2% | | | | | | |
| | | | | | | | | |
| Collateral Total | 301,300 | 100.0% | | | | | | |
| | | | | | | | | | |
| (1) | Certain ratings are those of the parent company whether or not the parent company guarantees the lease. |
| (2) | Annual U/W Base Rent PSF and Annual U/W Base Rent include contractual rent steps through September 2020 and straight-lined rent for Target over the term of the loan. |
| (3) | The Target space was officially delivered to the tenant with no termination options on August 21, 2019. Target will commence paying rent on the earlier of (i) the date it opens to the public (expected summer 2020) or (ii) August 21, 2020. All free rent and outstanding TI/LCs were reserved at origination. |
The following table presents certain information relating to the lease rollover schedule at the Ceasar’s Bay Shopping Center Property:
Lease Expiration Schedule(1)(2)
Year Ending
December 31, | No. of Leases Expiring | Expiring
NRSF | % of
Total
NRSF | Cumulative Expiring NRSF | Cumulative % of Total NRSF | Annual
U/W
Base Rent | % of Total
Annual
U/W Base
Rent | Annual
U/W
Base Rent
PSF(3) |
| MTM | 0 | 0 | 0.0% | 0 | 0.0% | $0 | 0.0% | $0.00 |
| 2019 | 0 | 0 | 0.0% | 0 | 0.0% | $0 | 0.0% | $0.00 |
| 2020 | 0 | 0 | 0.0% | 0 | 0.0% | $0 | 0.0% | $0.00 |
| 2021 | 0 | 0 | 0.0% | 0 | 0.0% | $0 | 0.0% | $0.00 |
| 2022 | 2 | 43,237 | 14.4% | 43,237 | 14.4% | $1,461,740 | 12.9% | $33.81 |
| 2023 | 1 | 119,734 | 39.7% | 162,971 | 54.1% | $2,898,078 | 25.5% | $24.20 |
| 2024 | 2 | 4,783 | 1.6% | 167,754 | 55.7% | $558,668 | 4.9% | $116.80 |
| 2025 | 2 | 25,346 | 8.4% | 193,100 | 64.1% | $1,482,608 | 13.0% | $58.49 |
| 2026 | 0 | 0 | 0.0% | 193,100 | 64.1% | $0 | 0.0% | $0.00 |
| 2027 | 0 | 0 | 0.0% | 193,100 | 64.1% | $0 | 0.0% | $0.00 |
| 2028 | 4 | 13,600 | 4.5% | 206,700 | 68.6% | $1,209,763 | 10.6% | $88.95 |
| 2029 | 0 | 0 | 0.0% | 206,700 | 68.6% | $0 | 0.0% | $0.00 |
| Thereafter | 1 | 88,000 | 29.2% | 294,700 | 97.8% | $3,755,330 | 33.0% | $42.67 |
| Vacant | 0 | 6,600 | 2.2% | 301,300 | 100.0% | $0 | 0.0% | $0.00 |
| Total/Weighted Average | 12 | 301,300 | 100.0% | | | $11,366,186 | 100.0% | $38.57 |
| (1) | Information obtained from the underwritten rent roll. |
| (2) | Certain tenants may have lease termination options that are exercisable prior to the originally stated expiration date of the subject lease and that are not considered in the Lease Expiration Schedule. |
| (3) | Weighted Average Annual U/W Base Rent PSF excludes vacant space. |
THE INFORMATION IN THIS STRUCTURAL AND COLLATERAL TERM SHEET IS NOT COMPLETE AND MAY BE AMENDED PRIOR TO THE TIME OF SALE. THIS TERM SHEET IS NOT AN OFFER TO SELL THESE SECURITIES AND IT IS NOT A SOLICITATION OF AN OFFER TO BUY THESE SECURITIES IN ANY JURISDICTION WHERE THE OFFER OR SALE IS NOT PERMITTED.
43
| Retail – Anchored | Loan #2 | Cut-off Date Balance: | | $45,500,000 |
| 8973 Bay Parkway | Ceasar’s Bay Shopping Center | Cut-off Date LTV: | | 51.5% |
| Brooklyn, NY 11214 | | U/W NCF DSCR: | | 3.60x |
| | | U/W NOI Debt Yield: | | 11.6% |
The following table presents historical occupancy percentages at the Ceasar’s Bay Shopping Center Property:
Historical Occupancy
12/31/2015(1) | 12/31/2016(1) | 12/31/2017(1)(2) | 12/31/2018(1)(2) | 10/2/2019(2)(3) |
| 97.4% | 97.4% | 97.4% | 73.7% | 97.8% |
| (1) | Information obtained from the borrower. |
| (2) | The decrease in occupancy from 2017 to 2018 is due to Toys “R” Us vacating the Ceasar’s Bay Shopping Center Property following the company’s bankruptcy proceedings. The increase in occupancy from 2018 to 10/2/2019 is due to Target backfilling the Toys “R” Us space. |
| (3) | Information obtained from the underwritten rent roll. |
Operating History and Underwritten Net Cash Flow. The following table presents certain information relating to the underwritten net cash flow at the Ceasar’s Bay Shopping Center Property:
Cash Flow Analysis
| | 2016 | 2017 | 2018 | TTM
6/30/2019(1) | U/W(1) | %(2) | U/W $ per SF |
| Rents in Place | $7,884,569 | $7,878,917 | $6,744,017 | $7,155,498 | $11,023,743 | 67.9% | $36.59 |
| Contractual Rent Steps | 0 | 0 | 0 | 0 | 342,434 | 2.1 | 1.14 |
| Grossed Up Vacant Space | 0 | 0 | 0 | 0 | 587,000 | 3.6 | 1.95 |
| Gross Potential Rent | $7,884,569 | $7,878,917 | $6,744,017 | $7,155,498 | $11,953,178 | 73.7% | $39.67 |
| Other Income | 550 | 0 | 825 | 2,204 | 0 | 0.0 | 0.00 |
| Total Recoveries | 1,306,106 | 959,916 | 2,401,601 | 2,856,874 | 4,271,012 | 26.3 | 14.18 |
| Net Rental Income | $9,191,225 | $8,838,833 | $9,146,443 | $10,014,576 | $16,224,189 | 100.0% | $53.85 |
| (Vacancy & Credit Loss)) | 0 | 0 | 0 | 0 | (597,659)(3) | (5.0) | (1.98) |
| Effective Gross Income | $9,191,225 | $8,838,833 | $9,146,443 | $10,014,576 | $15,626,531 | 96.3% | $51.86 |
| | | | | | | | |
| Real Estate Taxes(4) | 1,471,567 | 1,476,400 | 1,493,534 | 1,513,117 | 1,882,580 | 12.0 | 6.25 |
| Insurance | 725,176 | 833,071 | 1,114,711 | 885,391 | 949,472 | 6.1 | 3.15 |
| Management Fee | 218,880 | 218,880 | 359,709 | 462,197 | 468,796 | 3.0 | 1.56 |
| Other Operating Expenses | 1,401,164 | 2,025,761 | 1,731,782 | 1,881,517 | 2,140,236 | 13.7 | 7.10 |
| Total Operating Expenses | $3,816,787 | $4,554,112 | $4,699,736 | $4,742,222 | $5,441,084 | 34.8% | $18.06 |
| | | | | | | | |
| Net Operating Income | $5,374,439 | $4,284,721 | $4,446,707 | $5,272,354 | $10,185,447 | 65.2% | $33.81 |
| Replacement Reserves | 0 | 0 | 0 | 0 | 136,338 | 0.9 | 0.45 |
| TI/LC | 0 | 0 | 0 | 0 | 403,843 | 2.6 | 1.34 |
| Net Cash Flow | $5,374,439 | $4,284,721 | $4,446,707 | $5,272,354 | $9,645,265 | 61.7% | $32.01 |
| | | | | | | | |
| NOI DSCR(5) | 2.00x | 1.60x | 1.66x | 1.97x | 3.80x | | |
| NCF DSCR(5) | 2.00x | 1.60x | 1.66x | 1.97x | 3.60x | | |
| NOI Debt Yield(5) | 6.1% | 4.9% | 5.1% | 6.0% | 11.6% | | |
| NCF Debt Yield(5) | 6.1% | 4.9% | 5.1% | 6.0% | 11.0% | | |
| (1) | The increase in U/W NOI from TTM (6/30/2019) is due to (i) the lease up of the Target space (previously Toys “R” Us was not paying rent), (ii) the development of a new outparcel totaling 12,000 square feet leased to Olive Garden, Kay Jewelers and T-Mobile accounting for $1.1 million of rent that was not fully captured in the TTM 6/30/2019 period and (iv) rent steps and straight-lined rent combining for $342,434. |
| (2) | Represents (i) percent of Net Rental Income for all revenue fields, (ii) percent of Gross Potential Rent for Vacancy & Credit Loss and (iii) percent of Effective Gross Income for all other fields. |
| (3) | The underwritten economic vacancy is 5.0%. The Ceasar’s Bay Shopping Center Property was 97.8% leased as of October 2, 2019. |
| (4) | The Ceasar’s Bay Shopping Center Property benefits from an ICIP tax abatement that began in the 2004/2005 tax year and expires in the 2030/2031 tax year. Full taxes begin to phase in at 10% increments beginning in 2021/2022. The current expected tax expense is $1.4 million and the year 10 expected tax expense is $2.5 million. Real Estate Taxes are underwritten to the average expected tax payment over the loan term which is equal to $1.9 million. |
| (5) | Based on the Ceasar’s Bay Shopping Center Whole Loan. |
THE INFORMATION IN THIS STRUCTURAL AND COLLATERAL TERM SHEET IS NOT COMPLETE AND MAY BE AMENDED PRIOR TO THE TIME OF SALE. THIS TERM SHEET IS NOT AN OFFER TO SELL THESE SECURITIES AND IT IS NOT A SOLICITATION OF AN OFFER TO BUY THESE SECURITIES IN ANY JURISDICTION WHERE THE OFFER OR SALE IS NOT PERMITTED.
44
| Retail – Anchored | Loan #2 | Cut-off Date Balance: | | $45,500,000 |
| 8973 Bay Parkway | Ceasar’s Bay Shopping Center | Cut-off Date LTV: | | 51.5% |
| Brooklyn, NY 11214 | | U/W NCF DSCR: | | 3.60x |
| | | U/W NOI Debt Yield: | | 11.6% |
Appraisal.The appraiser concluded to an “as-is” Appraised Value of $170,000,000 as of July 2, 2019.
Environmental Matters. According to a Phase I environmental site assessment dated July 8, 2019, there was no evidence of any recognized environmental conditions at the Ceasar’s Bay Shopping Center Property.
Market Overview and Competition.The Ceasar’s Bay Shopping Center Property is located in Brooklyn, Kings County, New York. Brooklyn is the second largest of the five boroughs by land area and is the most populous borough with one-third of New York City’s population. Over the past decade, Brooklyn has expanded at a rapid pace, attracting both businesses and residents. According to a third party report, since 2003, the number of businesses in Brooklyn has increased by 21.0% and job growth has grown by 19.8%, a rate twice as fast as the rest of New York City. With many restaurants, a growing nightlife, diverse neighborhoods, and accessibility to Manhattan, Brooklyn is attracting young professionals in large numbers. The Ceasar’s Bay Shopping Center Property is located in the densely-populated Gravesend neighborhood bound by Avenue P to the north, Bay Parkway to the west, Ocean Parkway to the east and Gravesend Bay to the south. On average, vehicle traffic per day for the Ceasar’s Bay Shopping Center Property is approximately 146,000 vehicles. According to the borrower sponsor, the closest directly competitive shopping center is approximately three miles away from the Ceasar’s Bay Shopping Center Property, and there is no new planned retail supply in the area. According to the appraisal, as of 2018, the population within a 1-mile, 3-mile, and 5-mile radius totaled 82,704, 689,652, and 1,372,552 people, respectively, and average household income for the same radii was $71,035, $76,656 and $79,557, respectively.
Submarket Information – According to a third-party market research report, the Ceasar’s Bay Shopping Center Property is situated within the South Brooklyn retail submarket. As of the first quarter of 2019, the submarket reported a total inventory of 38.9 million square feet with a 3.2% vacancy rate and average rental rates of $45.86 per square foot.
Appraiser’s Comp Set –The appraiser identified five directly competitive retail properties totaling approximately 2.7 million square feet with a weighted average occupancy of 96.5% and base rents ranging from $18.00 to $180.00 per square foot.
The following table presents certain information relating to the appraiser’s market rent conclusion for the Ceasar’s Bay Shopping Center Property:
Market Rent Summary(1)
| | Anchor | Junior Anchor | Inline |
| Market Rent (PSF) | $31.75-$41.08 | $50.00-$60.00 | $70.00-$135.00 |
| Lease Term (Years) | 20 | 20 | 10 |
| Lease Type (Reimbursements) | Net | Net | Net |
| Rent Increase Projection | 10.0% every 5 years | 10.0% every 5 years | 10.0% every 5 years |
| (1) | Information obtained from the appraisal. |
THE INFORMATION IN THIS STRUCTURAL AND COLLATERAL TERM SHEET IS NOT COMPLETE AND MAY BE AMENDED PRIOR TO THE TIME OF SALE. THIS TERM SHEET IS NOT AN OFFER TO SELL THESE SECURITIES AND IT IS NOT A SOLICITATION OF AN OFFER TO BUY THESE SECURITIES IN ANY JURISDICTION WHERE THE OFFER OR SALE IS NOT PERMITTED.
45
| Retail – Anchored | Loan #2 | Cut-off Date Balance: | | $45,500,000 |
| 8973 Bay Parkway | Ceasar’s Bay Shopping Center | Cut-off Date LTV: | | 51.5% |
| Brooklyn, NY 11214 | | U/W NCF DSCR: | | 3.60x |
| | | U/W NOI Debt Yield: | | 11.6% |
The table below presents certain information relating to comparable sales for the Ceasar’s Bay Shopping Center Property identified by the appraiser:
Comparable Sales(1)
| Property Name | Location | Rentable
Area (SF) | Sale Date | Sale Price | Sale Price (PSF) | Adjusted Sale
Price (PSF) |
| Nostrand Place | Brooklyn, NY | 70,009 | Jun-19 | $27,650,000 | $395 | $427 |
| Nostrand Avenue Shopping Center | Brooklyn, NY | 80,991 | Jan-19 | $38,250,000 | $472 | $531 |
| 1100 Kings Highway & 2067 Coney Island Avenue | Brooklyn, NY | 43,318 | May-18 | $30,500,000 | $704 | $507 |
| Atlantic Center | Brooklyn, NY | 396,224 | Dec-17 | $195,000,000 | $492 | $566 |
| Harlem Center | Upper Manhattan, NY | 126,234 | Dec-17 | $103,000,000 | $816 | $530 |
| Queens Place | Elmhurst, NY | 220,953 | Dec-17 | $175,000,000 | $792 | $594 |
| Riverdale Crossings | Bronx, NY | 159,137 | Oct-15 | $132,925,000 | $835 | $606 |
| Shops @ Skyview Center | Whitestone, NY | 508,817 | Jul-15 | $400,000,000 | $786 | $598 |
| (1) | Information obtained from the appraisal. |
The appraiser identified seven major anchor leases, 13 junior anchor leases and 12 inline rent comparables. See the table below for the lows, highs and averages for the lease comparables:
Comparable Leases(1)
Property
Name/Location | Tenant
Size (SF) | Lease
Term | Annual
Base
Rent
PSF | Reimbursement
Amount PSF | | Lease
Type |
| Anchor Tenant | | | | | | |
| Low | 40,000 | 10.0 Yrs | $27.27 | NAV | | Net |
| Average | 75,770 | 16.4 Yrs | $45.43 | NAV | | Net |
| High | 108,855 | 25.0 Yrs | $70.00 | NAV | | Net |
| Junior Anchor | | | | | | |
| Low | 10,760 | 10.0 Yrs | $34.50 | NAV | | Net |
| Average | 20,971 | 12.7 Yrs | $47.94 | NAV | | Net |
| High | 38,081 | 15.0 Yrs | $70.54 | NAV | | Net |
| Inline | | | | | | |
| Low | 788 | 10.0 Yrs | $72.00 | NAV | | Net |
| Average | 2,959 | 10.8 Yrs | $90.87 | NAV | | Net |
| High | 8,000 | 15.0 Yrs | $150.00 | NAV | | Net |
| (1) | Information obtained from the appraisal. |
Escrows.
Real Estate Taxes – An upfront tax reserve of $468,758 is required under the Ceasar’s Bay Shopping Center Whole Loan documents. The borrower is required to make monthly payments of one-twelfth of the taxes payable during the next twelve months, currently equal to $117,190.
Insurance – An upfront insurance reserve of $761,458 is required under the Ceasar’s Bay Shopping Center Whole Loan documents. The borrower is required to make monthly payments of one-twelfth of the insurance premiums payable during the next twelve months, currently equal to $76,620.
Ground Rent Reserve – The borrower is required to make monthly payments of one-twelfth of the annual ground rent payable during the next twelve months, currently equal to $60,683.
Replacement Reserves – An upfront replacement reserve of $1,000,000 is required under the Ceasar’s Bay Shopping Center Whole Loan documents. Ongoing monthly replacement reserves of $7,533 are not required unless an event of default has occurred and is continuing.
TI/LC Reserve –Ongoing monthly TI/LC reserves of $31,385 are not required unless an event of default has occurred and is continuing.
Target Free Rent Reserve –The Ceasar’s Bay Shopping Center Whole Loan documents require an upfront reserve of $4,567,700 for outstanding free rent to Target.
THE INFORMATION IN THIS STRUCTURAL AND COLLATERAL TERM SHEET IS NOT COMPLETE AND MAY BE AMENDED PRIOR TO THE TIME OF SALE. THIS TERM SHEET IS NOT AN OFFER TO SELL THESE SECURITIES AND IT IS NOT A SOLICITATION OF AN OFFER TO BUY THESE SECURITIES IN ANY JURISDICTION WHERE THE OFFER OR SALE IS NOT PERMITTED.
46
| Retail – Anchored | Loan #2 | Cut-off Date Balance: | | $45,500,000 |
| 8973 Bay Parkway | Ceasar’s Bay Shopping Center | Cut-off Date LTV: | | 51.5% |
| Brooklyn, NY 11214 | | U/W NCF DSCR: | | 3.60x |
| | | U/W NOI Debt Yield: | | 11.6% |
Outstanding TI/LC Reserve – The Ceasar’s Bay Shopping Center Whole Loan documents require an upfront reserve of $2,511,385 for existing tenant improvements and leasing commissions.
Piling Work Reserve –A portion of the Ceasar’s Bay Shopping Center Property is located over the water supported by pilons that are currently undergoing repairs. The Ceasar’s Bay Shopping Center Whole Loan documents require an upfront reserve of $6,000,000 to be used for future work related to the pier/piling structure under a portion of the Ceasar’s Bay Shopping Center Property.
Lockbox and Cash Management.The Ceasar’s Bay Shopping Center Whole Loan requires a hard lockbox with springing cash management. The Ceasar’s Bay Shopping Center Whole Loan documents require the borrower to deliver written instructions to tenants to deposit all rents payable under such leases directly into a clearing account. The Ceasar’s Bay Shopping Center Whole Loan documents require that all rents received by the borrower or the property manager be deposited into the lockbox account within two business days of receipt. Funds in the lockbox account, absent the continuance of an event of default, are required to be transferred daily to a borrower operating account. Upon the first occurrence of an event of default, the borrower is required to establish a cash management account under the sole control of the lender, to which during the continuance of such event of default, all amounts in the lockbox account are required to be automatically transferred daily for the payment, among other things, of the debt service, monthly escrows, default interest and late payment charges.
Property Management. The Ceasar’s Bay Shopping Center Property is managed by Surrey Equities, LLC, an affiliate of the borrower.
Partial Release. Not permitted.
Real Estate Substitution.Not permitted.
Subordinate and Mezzanine Indebtedness.At any time after two years from the securitization, the borrower is permitted to incur additional mezzanine financing if (i) no event of default has occurred; (ii) the combined loan-to-value ratio of all thepari passu companion loans and the mezzanine loan does not exceed 48.93%; (iii) the debt yield is greater than or equal to 12.12% as calculated by the lender after giving effect to the mezzanine loan; (iv) the debt service coverage ratio is greater than or equal to 3.96x as calculated by the lender after giving effect to the mezzanine loan; (iv) the borrower has received a rating agency confirmation and (v) the borrower is in compliance with other conditions as set forth in the Ceasar’s Bay Shopping Center Whole Loan documents.
Ground Lease. The fee interest in the Ceasar’s Bay Shopping Center Property is owned in a tenants-in-common structure, with the borrower sponsors owning a 16.18% share. The ground lease commenced in 1966 and continues through December 31, 2065. The ground rent for 2019 is $728,190 with annual CPI increases through lease expiration. There are no fair market value resets in the ground lease and no extension options.
Flood Insurance.The Ceasar’s Bay Shopping Center Property is located in flood zone VE. Therefore, the borrower obtain flood insurance coverage of $40.0 million per occurrence and in the annual aggregate with a flood deductible of $275,000.
Terrorism Insurance.The Ceasar’s Bay Shopping Center Whole Loan documents require that the “all risk” insurance policy required to be maintained by the borrower provides coverage for terrorism in an amount equal to the full replacement cost of the Ceasar’s Bay Shopping Center Property, as well as business interruption insurance covering no less than the 18-month period following the occurrence of a casualty event, together with a 12-month extended period of indemnity.
THE INFORMATION IN THIS STRUCTURAL AND COLLATERAL TERM SHEET IS NOT COMPLETE AND MAY BE AMENDED PRIOR TO THE TIME OF SALE. THIS TERM SHEET IS NOT AN OFFER TO SELL THESE SECURITIES AND IT IS NOT A SOLICITATION OF AN OFFER TO BUY THESE SECURITIES IN ANY JURISDICTION WHERE THE OFFER OR SALE IS NOT PERMITTED.
47
| | Loan #3 | Cut-off Date Balance: | | $45,000,000 |
| Self Storage – Self Storage | Planet Self Storage Portfolio | Cut-off Date LTV: | | 67.1% |
| Property Addresses - Various | | U/W NCF DSCR: | | 2.42x |
| | | U/W NOI Debt Yield: | | 7.9% |
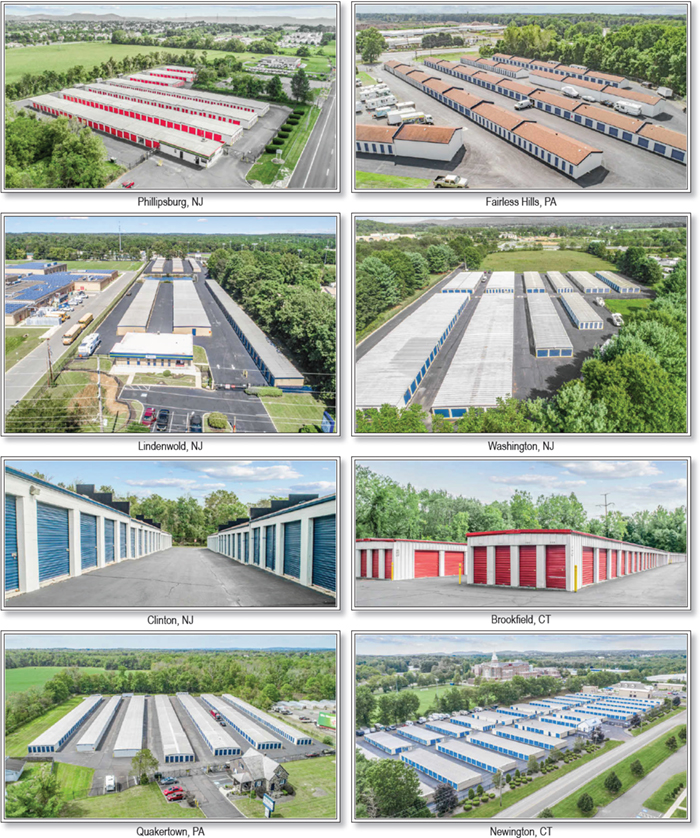
THE INFORMATION IN THIS STRUCTURAL AND COLLATERAL TERM SHEET IS NOT COMPLETE AND MAY BE AMENDED PRIOR TO THE TIME OF SALE. THIS TERM SHEET IS NOT AN OFFER TO SELL THESE SECURITIES AND IT IS NOT A SOLICITATION OF AN OFFER TO BUY THESE SECURITIES IN ANY JURISDICTION WHERE THE OFFER OR SALE IS NOT PERMITTED.
48
| | Loan #3 | Cut-off Date Balance: | | $45,000,000 |
| Self Storage – Self Storage | Planet Self Storage Portfolio | Cut-off Date LTV: | | 67.1% |
| Property Addresses - Various | | U/W NCF DSCR: | | 2.42x |
| | | U/W NOI Debt Yield: | | 7.9% |

THE INFORMATION IN THIS STRUCTURAL AND COLLATERAL TERM SHEET IS NOT COMPLETE AND MAY BE AMENDED PRIOR TO THE TIME OF SALE. THIS TERM SHEET IS NOT AN OFFER TO SELL THESE SECURITIES AND IT IS NOT A SOLICITATION OF AN OFFER TO BUY THESE SECURITIES IN ANY JURISDICTION WHERE THE OFFER OR SALE IS NOT PERMITTED.
49
| No. 3 – Planet Self Storage Portfolio |
| |
| Mortgage Loan Information | | Mortgaged Property Information |
| Mortgage Loan Seller: | Rialto Mortgage Finance, LLC | | Single Asset/Portfolio: | Portfolio |
Credit Assessment (DBRS/Fitch/Moody’s): | NR/NR/NR | | Property Type – Subtype: | Self Storage – Self Storage |
| Original Principal Balance(1): | $45,000,000 | | Location: | Various |
| Cut-off Date Balance(1): | $45,000,000 | | Size: | 563,807 SF |
| % of Initial Pool Balance: | 6.4% | | Cut-off Date Balance Per SF(1): | $124.16 |
| Loan Purpose: | Refinance | | Maturity Date Balance Per SF(1): | $124.16 |
| Borrower Sponsor(2): | Robert Moser | | Year Built/Renovated: | Various/Various |
| Guarantor(2): | Robert Moser | | Title Vesting: | Fee |
| Mortgage Rate: | 3.1750% | | Property Manager: | Self-managed |
| Note Date: | September 26, 2019 | | Current Occupancy (As of): | 85.2% (8/31/2019) |
| Seasoning: | 1 month | | YE 2018 Occupancy: | 84.8% |
| Maturity Date: | October 6, 2024 | | YE 2017 Occupancy: | 82.9% |
| IO Period: | 60 months | | YE 2016 Occupancy(5): | NAV |
| Loan Term (Original): | 60 months | | YE 2015 Occupancy(5): | NAV |
| Amortization Term (Original): | NAP | | Appraised Value(6): | $104,250,000 |
| Loan Amortization Type: | Interest-only, Balloon | | Appraised Value Per SF(6): | $184.90 |
| Call Protection(3): | L(25),D(31),O(4) | | Appraisal Valuation Date: | Various |
| Lockbox Type: | Springing | | Underwriting and Financial Information |
| Additional Debt(1): | Yes | | TTM NOI (8/31/2019): | $5,340,664 |
| Additional Debt Type (Balance)(1): | Pari Passu($25,000,000); Future | | YE 2018 NOI: | $5,092,614 |
| | Mezzanine | | YE 2017 NOI(7): | $4,808,378 |
| | | | YE 2016 NOI: | NAV |
| | | | U/W Revenues: | $8,246,557 |
| | | | U/W Expenses: | $2,709,614 |
| | | U/W NOI: | $5,536,943 |
| | | | | | U/W NCF: | $5,472,942 |
| Escrows and Reserves(4) | | U/W DSCR based on NOI/NCF(1): | 2.45x / 2.42x |
| | Initial | Monthly | Cap | | U/W Debt Yield based on NOI/NCF(1): | 7.9% / 7.8% |
| Taxes | $370,554 | $58,818 | NAP | | U/W Debt Yield at Maturity based on NOI/NCF(1): | 7.9% / 7.8% |
| Insurance | $7,162 | $3,410 | NAP | | Cut-off Date LTV Ratio(1)(6): | 67.1% |
| Replacement Reserve | $0 | $5,333 | NAP | | LTV Ratio at Maturity(1)(6): | 67.1% |
| Deferred Maintenance | $73,438 | $0 | NAP | | | |
| | | | | | | |
| | | | | | | | |
| Sources and Uses |
| Sources | | | | | Uses | | | |
| Original whole amount | $70,000,000 | | 93.4% | | Loan Payoff | $71,483,636 | | 95.4% |
| Sponsor equity | 4,910,107 | | 6.6 | | Upfront reserves | 451,153 | | 0.6 |
| | | | | | Closing costs | 2,975,318 | | 4.0 |
| Total Sources | $74,910,107 | | 100.0% | | Total Uses | $74,910,107 | | 100.0% |
| (1) | The Planet Self Storage Portfolio Mortgage Loan (as defined below) is part of the Planet Self Storage Portfolio Whole Loan (as defined below), which comprises fourpari passunotes with an aggregate original balance of $70,000,000. All statistical information related to the Cut-off Date Balance per SF, Maturity Date Balance per SF, U/W DSCR based on NOI/NCF, U/W Debt Yield based on NOI/NCF, U/W Debt Yield at Maturity based on NOI/NCF, Cut-off Date LTV Ratio and LTV Ratio at Maturity are based on the Planet Self Storage Portfolio Whole Loan. |
| (2) | Robert Moser is also the borrower sponsor and guarantor for the Fortress Self Storage loan (2.6% of the initial pool balance) and Gorham Self Storage loan (0.5% of the initial pool balance). |
| (3) | Defeasance of the Planet Self Storage Portfolio Whole Loan is permitted at any time after the earlier of (i) two years after the closing date of the securitization that includes the last note to be securitized and (ii) three years after the origination date. The assumed lockout period of 25 months is based on the WFCM 2019-C53 securitization closing date of November 2019. |
| (4) | See “Escrows” section for a full description of Escrows and Reserves. |
| (5) | The Planet Self Storage Portfolio Borrowers (as defined below) acquired the Planet Self Storage Portfolio Properties (as defined below) in 2017; therefore, YE 2016 Occupancy and YE 2015 Occupancy are not available. |
| (6) | The Appraised Value, Appraised Value Per SF, Cut-Off Date LTV Ratio and LTV Ratio at Maturity is based on the as-is bulk portfolio value of $104,250,000. The combined “as-is” individual appraised value is $96,350,000, which results in a combined “as-is” appraised value per SF of $170.89. The Cut-off Date LTV Ratio and LTV Ratio at Maturity on the combined “as-is” individual appraised value is 72.7% and 72.7%, respectively. |
| (7) | See “Cash Flow Analysis” section for a full description of Cash Flows. |
The Mortgage Loan.The mortgage loan (the “Planet Self Storage Portfolio Mortgage Loan”) is part of a whole loan (the “Planet Self Storage Portfolio Whole Loan”) evidenced by fourpari passu notes with an original principal balance of $70,000,000 and an outstanding principal balance as of the Cut-off Date of $70,000,000 secured by a first mortgage encumbering the fee interest in 11 self-storage properties located in Massachusetts, Connecticut, New Jersey and Pennsylvania (the “Planet Self Storage Portfolio Properties” or the
THE INFORMATION IN THIS STRUCTURAL AND COLLATERAL TERM SHEET IS NOT COMPLETE AND MAY BE AMENDED PRIOR TO THE TIME OF SALE. THIS TERM SHEET IS NOT AN OFFER TO SELL THESE SECURITIES AND IT IS NOT A SOLICITATION OF AN OFFER TO BUY THESE SECURITIES IN ANY JURISDICTION WHERE THE OFFER OR SALE IS NOT PERMITTED.
50
| | Loan #3 | Cut-off Date Balance: | | $45,000,000 |
| Self Storage – Self Storage | Planet Self Storage Portfolio | Cut-off Date LTV: | | 67.1% |
| Property Addresses - Various | | U/W NCF DSCR: | | 2.42x |
| | | U/W NOI Debt Yield: | | 7.9% |
“Planet Self Storage Portfolio”). The Planet Self Storage Portfolio Mortgage Loan is evidenced by the controlling Note A-1 and the non-controlling Note A-3. See “Description of the Mortgage Pool—The Whole Loans–The Serviced Pari Passu Whole Loans” and “Pooling and Servicing Agreement” in the Preliminary Prospectus.
Note Summary
| Notes | Original Principal Balance | Cut-off Date
Balance | Note Holder | Controlling Interest |
| A-1 | $30,000,000 | $30,000,000 | WFCM 2019-C53 | Yes |
| A-2 | $20,000,000 | $20,000,000 | Rialto Mortgage Finance, LLC | No |
| A-3 | $15,000,000 | $15,000,000 | WFCM 2019-C53 | No |
| A-4 | $5,000,000 | $5,000,000 | Rialto Mortgage Finance, LLC | No |
| Total | $70,000,000 | $70,000,000 | | |
The Borrowers and Borrower Sponsor.The borrowers are Prime Storage Brookfield, LLC, Prime Storage Clinton, LLC, Prime Storage Fairless Hills, LLC, Prime Storage Lindenwold, LLC, Prime Storage Newington, LLC, Prime Storage New Milford, LLC, Prime Storage Phillipsburg, LLC, Prime Storage Quakertown, LLC, Prime Storage Washington, LLC, Prime Storage Hyde Park, LLC and Prime Storage Somerville, LLC (collectively, the “Planet Self Storage Portfolio Borrowers”), each a Delaware limited liability company and single purpose entity, together with two independent directors. Legal counsel to the Planet Self Storage Portfolio Borrowers delivered a non-consolidation opinion in connection with the origination of the Planet Self Storage Portfolio Whole Loan. The borrower sponsor and non-recourse carveout guarantor of the Planet Self Storage Portfolio Whole Loan is Robert Moser.
Robert Moser has over 20 years of experience as an owner, operator and developer of commercial real estate. Robert Moser is the owner and principal of Prime Group Holdings, overseeing all operations, strategic initiatives and investment activities of the company, and is a member of the firm’s investment committee. Over the past few years, Prime Group Holdings has grown to become the largest private owner-operator of self-storage in the United States. Mr. Moser was a party to prior foreclosure litigation. See “Description of the Mortgage Pool–Loan Purpose; Default History, Bankruptcy Issues and Other Proceedings” in the Preliminary Prospectus.
The Properties. The Planet Self Storage Portfolio is a 11-property, 563,807 square-foot and 4,844 unit self storage portfolio located in New Jersey (four properties, 35.5% of the square footage, 34.4% of units), Connecticut (three properties, 33.8% of the square footage, 32.2% of units), Pennsylvania (two properties, 19.5% of the square footage, 18.5% of units) and Massachusetts (two properties, 11.3% of the square footage, 15.0% of units). The Planet Self Storage Portfolio Properties were constructed from 1930 to 2000 and range in size from 27,504 square feet to 87,925 square feet and 311 units to 724 units, with no Planet Self Storage Portfolio Property comprising more than 15.6% of the total net rentable area based on square footage and 14.9% of the total storage units, respectively. Of the 4,844 units at the Planet Self Storage Portfolio Properties, 981 units are climate controlled. The Planet Self Storage Portfolio Properties also generate income from 171 parking spaces, three office units of 1,475 square feet, two apartment units, two billboards, two cell towers, and income from one easement agreement. Based on self storage units, the Planet Self Storage Portfolio Properties were 85.2% occupied as of August 31, 2019.
THE INFORMATION IN THIS STRUCTURAL AND COLLATERAL TERM SHEET IS NOT COMPLETE AND MAY BE AMENDED PRIOR TO THE TIME OF SALE. THIS TERM SHEET IS NOT AN OFFER TO SELL THESE SECURITIES AND IT IS NOT A SOLICITATION OF AN OFFER TO BUY THESE SECURITIES IN ANY JURISDICTION WHERE THE OFFER OR SALE IS NOT PERMITTED.
51
| | Loan #3 | Cut-off Date Balance: | | $45,000,000 |
| Self Storage – Self Storage | Planet Self Storage Portfolio | Cut-off Date LTV: | | 67.1% |
| Property Addresses - Various | | U/W NCF DSCR: | | 2.42x |
| | | U/W NOI Debt Yield: | | 7.9% |
The following table presents certain information regarding the Planet Self Storage Portfolio Properties:
Property Name –
Location | Allocated
Cut-off Date
Balance | % of
Portfolio
Cut-off
Date
Balance | Occupancy(1)(2) | Year Built/ Renovated | Net
Rentable
Area
(SF)(2) | Appraised
Value | UW NOI(2) | % of
UW NOI | Storage Units(2) |
Prime Storage - Somerville Somerville, MA | $9,100,000 | 13.0% | 91.3% | 1930/1995 | 36,095 | $12,170,000 | $686,906(3)(4) | 12.4% | 414 |
Prime Storage - Newington Newington, CT | 8,370,000 | 12.0 | 83.6 | 2000/2018 | 87,925 | 12,440,000 | 615,271(4) | 11.1 | 724 |
Prime Storage - Washington Washington, NJ | 8,050,000 | 11.5 | 96.9 | 1987/2018 | 63,450 | 10,790,000 | 709,533 | 12.8 | 523 |
Prime Storage - Brookfield Brookfield, CT | 6,800,000 | 9.7 | 83.0 | 1984/2018 | 61,350 | 9,090,000 | 517,582(4)(5)(7) | 9.3 | 505 |
Prime Storage - Quakertown Quakertown, PA | 6,750,000 | 9.6 | 80.5 | 1987/NAP | 67,450 | 9,190,000 | 536,678(4)(6) | 9.7 | 513 |
Prime Storage – Hyde Park Boston, MA | 6,100,000 | 8.7 | 77.8 | 1960;1997/NAP | 27,504 | 9,250,000 | 459,556(4) | 8.3 | 311 |
Prime Storage – New Milford New Milford, CT | 5,250,000 | 7.5 | 84.8 | 1989/NAP | 41,050 | 7,040,000 | 424,320(4)(7) | 7.7 | 329 |
Prime Storage – Philipsburg Greenwich and Lopatcong, NJ | 5,250,000 | 7.5 | 86.3 | 1982/2018 | 48,691 | 7,040,000 | 426,205(4)(6) | 7.7 | 408 |
Prime Storage – Fairless Hills Fairless Hills, PA | 5,030,000 | 7.2 | 90.3 | 1979/NAP | 42,211 | 6,790,000 | 422,942(4) | 7.6 | 382 |
Prime Storage – Clinton Clinton, NJ | 4,800,000 | 6.9 | 90.4 | 1980/2018 | 35,538 | 6,490,000 | 377,115 | 6.8 | 313 |
Prime Storage – Lindenwold Lindenwold, NJ | 4,500,000 | 6.4 | 83.9 | 1979/NAP | 52,543 | 6,060,000 | 360,834(4) | 6.5 | 422 |
| Total/Weighted Average | $70,000,000 | 100.0% | 86.2% | | 563,807 | $104,250,000(8) | $5,536,943 | 100.0% | 4,844 |
| (1) | Occupancy is based on storage units. |
| (2) | Based on the underwritten rent roll. |
| (3) | Includes revenue from cell tower. |
| (4) | Includes revenue from parking. |
| (5) | Includes revenue from office. |
| (6) | Includes revenue from billboard. |
| (7) | Includes revenue from apartment. |
| (8) | The total Appraised Value is based on the “as-is” bulk portfolio value. The sum of the appraised values of the individual properties is $96,350,000, resulting in a Cut-off Date LTV Ratio and LTV Ratio at Maturity of 72.7% and 72.7%, respectively. |
The following table presents historical occupancy percentages at the Planet Self Storage Portfolio:
Historical Occupancy(1)
12/31/2015(2) | 12/31/2016(2) | 12/31/2017(3) | 12/31/2018(3) | 8/31/2019(4) |
| NAV | NAV | 82.9% | 84.8% | 85.2% |
| (1) | Occupancy is based on a per square foot basis. |
| (2) | The Planet Self Storage Portfolio Borrowers acquired the Planet Self Storage Portfolio Properties in 2017; therefore, historical occupancy for 12/31/2015 and 12/31/2016 are not available. |
| (3) | Information provided by the Planet Self Storage Portfolio Borrowers. |
| (4) | Based on underwritten rent roll. |
THE INFORMATION IN THIS STRUCTURAL AND COLLATERAL TERM SHEET IS NOT COMPLETE AND MAY BE AMENDED PRIOR TO THE TIME OF SALE. THIS TERM SHEET IS NOT AN OFFER TO SELL THESE SECURITIES AND IT IS NOT A SOLICITATION OF AN OFFER TO BUY THESE SECURITIES IN ANY JURISDICTION WHERE THE OFFER OR SALE IS NOT PERMITTED.
52
| | Loan #3 | Cut-off Date Balance: | | $45,000,000 |
| Self Storage – Self Storage | Planet Self Storage Portfolio | Cut-off Date LTV: | | 67.1% |
| Property Addresses - Various | | U/W NCF DSCR: | | 2.42x |
| | | U/W NOI Debt Yield: | | 7.9% |
Operating History and Underwritten Net Cash Flow. The following table presents certain information relating to the historical operating performance and underwritten net cash flow at the Planet Self Storage Portfolio Properties:
Cash Flow Analysis
| | 2017(1) | 2018 | TTM
8/31/2019 | U/W | %(2) | U/W $ per
SF |
| Base Rent(3) | $6,520,760 | $7,721,713 | $7,800,243 | $7,526,647 | 78.8% | $13.35 |
| Grossed Up Vacant Space | 0 | 0 | 0 | 1,244,160 | 13.0 | 2.21 |
| Gross Potential Rent | $6,520,760 | $7,721,713 | $7,800,243 | $8,770,806 | 91.8% | $15.56 |
| Other Income(4) | 571,776 | 640,267 | 738,870 | 783,741 | 8.2 | 1.39 |
| Net Rental Income | $7,092,536 | $8,361,980 | $8,539,113 | $9,554,547 | 100.0% | $16.95 |
| (Vacancy & Credit Loss) | (98,412) | (598,662) | (495,632) | (1,307,991)(5) | (14.9) | (2.32) |
| Effective Gross Income | $6,994,124 | $7,763,318 | $8,043,481 | $8,246,557 | 86.3% | $14.63 |
| | | | | | | |
| Real Estate Taxes | 556,835 | 669,927 | 689,956 | 705,816 | 8.6 | 1.25 |
| Insurance | 89,397 | 50,450 | 50,202 | 40,923 | 0.5 | 0.07 |
| Management Fee | 357,250 | 399,045 | 412,112 | 412,328 | 5.0 | 0.73 |
| Other Operating Expenses | 1,182,264 | 1,551,282 | 1,550,547 | 1,550,547 | 18.8 | 2.75 |
| Total Operating Expenses | $2,185,746 | $2,670,704 | $2,702,817 | $2,709,614 | 32.9% | $4.81 |
| | | | | | | |
| Net Operating Income | $4,808,378 | $5,092,614 | $5,340,664 | $5,536,943 | 67.1% | $9.82 |
| Replacement Reserves | 0 | 0 | 0 | 64,001 | 0.8 | 0.11 |
| TI/LC | 0 | 0 | 0 | 0 | 0.0 | 0.00 |
| Net Cash Flow | $4,808,378 | $5,092,614 | $5,340,664 | $5,472,942 | 66.4% | $9.71 |
| | | | | | | |
| NOI DSCR(6) | 2.13x | 2.25x | 2.36x | 2.45x | | |
| NCF DSCR(6) | 2.13x | 2.25x | 2.36x | 2.42x | | |
| NOI Debt Yield(6) | 6.9% | 7.3% | 7.6% | 7.9% | | |
| NCF Debt Yield(6) | 6.9% | 7.3% | 7.6% | 7.8% | | |
| (1) | The Planet Self Storage Portfolio Borrowers acquired the Planet Self Storage Portfolio Properties in 2017 and did not receive financial statements for the months of July 2017 – August 2017 for the Prime Storage – Newington, Prime Storage – Washington, Prime Storage – Brookfield, Prime Storage – Quakertown, Prime Storage – New Milford, Prime Storage – Philipsburg, Prime Storage – Fairless Hills, Prime Storage – Clinton and Prime Storage – Lindenwold properties and July 2017 for the Prime Storage – Somerville and Prime Storage – Hyde Park properties. |
| (2) | Represents (i) percent of Net Rental Income for all revenue fields, (ii) percent of Gross Potential Rent for Vacancy & Credit Loss and (iii) percent of Effective Gross Income for all other fields. |
| (3) | Base Rent includes rents from cell tower, parking, billboards, office, and apartment. |
| (4) | Other Income includes insurance income, late fees, application fees, point of sale and other miscellaneous income. |
| (5) | The underwritten economic vacancy is 14.9%. The Planet Self Storage Portfolio Properties were 86.2% occupied as of August 31, 2019 based on self storage units. |
| (6) | The debt service coverage ratios and debt yields are based on the Planet Self Storage Whole Loan. |
Appraisal.As of the appraisal valuation dates from August 24, 2019 to August 30, 2019, the Planet Self Storage Portfolio Properties had an “as-is” bulk value of $104,250,000. The sum of the appraised values of the individual properties is $96,350,000, resulting in a Cut-off Date LTV Ratio and LTV Ratio at Maturity of 72.7% and 72.7%, respectively.
Environmental Matters.According to Phase I environmental site assessments dated from September 5, 2019 to September 9, 2019, there was no evidence of any recognized environmental conditions at the Planet Self Storage Portfolio Properties.
Market Overview.The Planet Self Storage Portfolio is an 11-property, 563,807 square-foot and 4,844-unit self-storage portfolio located in New Jersey (four properties, 35.5% of the square footage, 34.4% of units), Connecticut (three properties, 33.8% of the square footage, 32.2% of units), Pennsylvania (two properties, 19.5% of the square footage, 18.5% of units) and Massachusetts (two properties, 11.3% of the square footage, 15.0% of units).
According to the appraisals, the New Jersey properties are located in the Mid-Atlantic sub-region with average monthly rents of $144.67 and $174.27 per unit for 10x10 foot non-climate controlled and climate controlled units, respectively as of end of the second quarter of 2018. As of the end of the second quarter of 2018, the Mid-Atlantic sub-region reported a vacancy rate of 8.0% for self storage properties.
According to the appraisals, the Connecticut properties are located in the New England sub-region with reported monthly rents of $125.22 and $149.27 per unit for 10x10 foot non-climate controlled and climate controlled units, respectively as of end of the second quarter of 2018. As of the end of the second quarter of 2019, the New England sub-region reported vacancy rate of 9.5% for self-storage properties.
THE INFORMATION IN THIS STRUCTURAL AND COLLATERAL TERM SHEET IS NOT COMPLETE AND MAY BE AMENDED PRIOR TO THE TIME OF SALE. THIS TERM SHEET IS NOT AN OFFER TO SELL THESE SECURITIES AND IT IS NOT A SOLICITATION OF AN OFFER TO BUY THESE SECURITIES IN ANY JURISDICTION WHERE THE OFFER OR SALE IS NOT PERMITTED.
53
| | Loan #3 | Cut-off Date Balance: | | $45,000,000 |
| Self Storage – Self Storage | Planet Self Storage Portfolio | Cut-off Date LTV: | | 67.1% |
| Property Addresses - Various | | U/W NCF DSCR: | | 2.42x |
| | | U/W NOI Debt Yield: | | 7.9% |
According to the appraisals, the Pennsylvania properties are located in the Bucks County self storage submarket with reported monthly asking rents of $126.97 and $152.39 per unit for 10x10 foot non-climate controlled and climate controlled units, respectively as of end of the second quarter of 2018. As of the end of the second quarter of 2019, the Bucks County self storage submarket reported a vacancy rate of 11.3% for self storage properties.
According to the appraisals, the Massachusetts properties are located in the Boston Core and Cambridge/Near West submarket. The Boston Core submarket reported monthly asking rents of $214.52 and $197.26 per unit for 10x10 foot non-climate controlled and climate controlled units, respectively as of end of the second quarter of 2018. The Cambridge/Near West submarket reported monthly asking rents of $203.49 and $256.75 per unit for 10x10 foot non-climate controlled and climate controlled units, respectively as of end of the second quarter of 2018. As of the end of the second quarter of 2019, the Boston Core submarket reported a vacancy rate of 16.3% and the Cambridge/Near West submarket reported a vacancy rate of 10.1% for self storage properties.
Escrows.
Real Estate Taxes –The Planet Self Storage Portfolio Whole Loan documents require an upfront real estate tax reserve of $370,554 and an ongoing monthly real estate tax reserve in an amount equal to one-twelfth of the real estate taxes that the lender estimates will be necessary to pay taxes over the then succeeding twelve months (initially $58,818).
Insurance –The Planet Self Storage Portfolio Whole Loan documents require an upfront insurance reserve of $7,162 and an ongoing monthly insurance premium reserve in an amount equal to one-twelfth of the insurance premiums that the lender estimates will be necessary to pay insurance premiums over the then succeeding twelve months (initially $3,410).
Replacement Reserves –The Planet Self Storage Whole Loan documents require ongoing monthly replacement reserves of $5,333.
Deferred Maintenance –The Planet Self Storage Whole Loan documents require upfront an upfront reserve of $73,438.
Lockbox and Cash Management. The Planet Self Storage Portfolio Whole Loan documents require a springing lockbox and springing cash management. Upon the occurrence and continuance of a Cash Management Trigger Event (as defined below), (i) the Planet Self Storage Portfolio Borrowers are required to establish a lender-controlled lockbox account and instruct tenants to deposit rents into such lockbox account, and (ii) the Planet Self Storage Portfolio Borrowers and the property manager are required to deposit into such lockbox all rents received within two business day of receipt. Pursuant to the Planet Self Storage Portfolio Whole Loan documents, all excess funds on deposit are required to be applied as follows: (a) if a Cash Sweep Event (as defined below) is not in effect, to the Planet Self Storage Borrowers; and (b) if a Cash Sweep Event is in effect, to an excess cash flow account controlled by the lender, to be held by the lender as additional security for the Planet Self Storage Portfolio Whole Loan.
A “Cash Management Trigger Event” will commence upon the occurrence of the following:
| (ii) | the Planet Self Storage Portfolio Borrower’s second late debt service payment within a 12-month period; |
| (iii) | a bankruptcy action of the Planet Self Storage Portfolio Borrowers, guarantor or managers; |
| (iv) | a Cash Management DSCR Trigger Event (as defined below); or |
| (v) | a mezzanine borrower entering into a subordinate mezzanine loan. |
A Cash Management Trigger Event will end upon the occurrence of:
| ● | with regard to clause (i) above, the cure of such event of default having been accepted or waived by the lender; |
| ● | with regard to clause (ii) above, the debt service payments having been paid on time for 12 consecutive months; |
| ● | with regard to clause (iii) above, such bankruptcy action petition having been discharged, stayed, or dismissed within 30 days of such filing, among other conditions, for the Planet Self Storage Portfolio Borrowers or the guarantor and within 120 days for the property manager, or with respect to the manager, the Planet Self Storage Portfolio Borrowers replacing the manager with a qualified manager acceptable to the lender; and |
| ● | with regard to clause (iv) above, the date the amortizing debt service coverage ratio based on the trailing 12-month period immediately preceding the date of such determination is greater than 1.25x for two consecutive quarters. |
A “Cash Management DSCR Trigger Event” will occur on any day the debt service coverage ratio, based on the trailing 12-month period immediately preceding the date of determination, is less than 1.20x for the Planet Self Storage Portfolio Whole Loan.
A “Cash Sweep Event” will commence upon the occurrence of the following:
| (ii) | a bankruptcy action of the Planet Self Storage Portfolio Borrowers, guarantor or manager; or |
| (iii) | a Cash Sweep DSCR Trigger Event (as defined below). |
THE INFORMATION IN THIS STRUCTURAL AND COLLATERAL TERM SHEET IS NOT COMPLETE AND MAY BE AMENDED PRIOR TO THE TIME OF SALE. THIS TERM SHEET IS NOT AN OFFER TO SELL THESE SECURITIES AND IT IS NOT A SOLICITATION OF AN OFFER TO BUY THESE SECURITIES IN ANY JURISDICTION WHERE THE OFFER OR SALE IS NOT PERMITTED.
54
| | Loan #3 | Cut-off Date Balance: | | $45,000,000 |
| Self Storage – Self Storage | Planet Self Storage Portfolio | Cut-off Date LTV: | | 67.1% |
| Property Addresses - Various | | U/W NCF DSCR: | | 2.42x |
| | | U/W NOI Debt Yield: | | 7.9% |
A Cash Sweep Event will end upon the occurrence of:
| ● | with regard to clause (i) above, the cure of such event of default having been accepted or waived by the lender; |
| ● | with regard to clause (ii) above, such bankruptcy action petition having been discharged, stayed, or dismissed within 30 days of such filing among other conditions for the Planet Self Storage Portfolio Borrowers or guarantor and within 120 days for the property manager, or with respect to the manager, the Planet Self Storage Portfolio Borrowers replacing the manager with a qualified manager acceptable to the lender; and |
| ● | with regard to clause (iii) above, the date the amortizing debt service coverage ratio based on the trailing 12-month period immediately preceding the date of such determination is greater than 1.20x for two consecutive quarters. |
A “Cash Sweep DSCR Trigger Event” will occur on any day the debt service coverage ratio, based on the trailing 12-month period immediately preceding the date of determination, is less than 1.15x for the Planet Self Storage Portfolio Whole Loan.
Property Management.The Planet Self Storage Portfolio Properties are managed by Prime Group Holdings LLC, an affiliate of the Planet Self Storage Portfolio Borrowers.
Partial Release.After expiration of the defeasance lockout period, the Planet Self Storage Portfolio Borrowers may obtain the release of any individual property, provided that, among other conditions, (i) no event of default has occurred and is continuing; (ii) the amount of the Planet Self Storage Portfolio Whole Loan defeased will be 115% of the allocated loan amount for the related Planet Self Storage Portfolio property being released; (iii) the debt service coverage ratio for the remaining properties after such release is not less than the greater of (a) 2.43x and (b) the debt service coverage ratio for the remaining properties and the property to be released for the preceding 12 months; and (iv) the loan-to-value ratio after such release is less than or equal to the lesser of (a) 67.1% and (b) the loan-to-value ratio for the remaining properties and the property to be released immediately preceding the release of the property.
Subordinate and Mezzanine Indebtedness.Provided no event of default has occurred and is continuing, the Planet Self Storage Portfolio Whole Loan documents permit an affiliate of the Planet Self Storage Portfolio Borrowers to incur future mezzanine debt subject to certain conditions, including (i) the execution of an intercreditor agreement in form and substance reasonably acceptable to the lender; (ii) based on the Planet Self Storage Portfolio Whole Loan and the mezzanine loan, (a) the combined loan-to-value ratio is not greater than 67.1% and (b) the debt service coverage ratio is not less than 2.43x; and (iii) receipt of rating agency confirmation from each rating agency, including DBRS, Fitch, and Moody’s that the mezzanine financing will not result in a downgrade, withdrawal or qualification of the respective ratings assigned to the WFCM 2019-C53 Certificates.
Ground Lease. None.
Terrorism Insurance.The Planet Self Storage Portfolio Whole Loan documents require that the “all risk” insurance policy required to be maintained by the Planet Self Storage Portfolio Borrowers provides coverage for terrorism in an amount equal to the full replacement cost of the Planet Self Storage Portfolio Properties, as well as business interruption insurance covering no less than the 18-month period following the occurrence of a casualty event, together with a 12-month extended period of indemnity.
THE INFORMATION IN THIS STRUCTURAL AND COLLATERAL TERM SHEET IS NOT COMPLETE AND MAY BE AMENDED PRIOR TO THE TIME OF SALE. THIS TERM SHEET IS NOT AN OFFER TO SELL THESE SECURITIES AND IT IS NOT A SOLICITATION OF AN OFFER TO BUY THESE SECURITIES IN ANY JURISDICTION WHERE THE OFFER OR SALE IS NOT PERMITTED.
55
| Office – Suburban | Loan #4 | Cut-off Date Balance: | | $44,500,000 |
| 777 East Eisenhower Parkway | 777 East Eisenhower | Cut-off Date LTV: | | 73.4% |
| Ann Arbor, Michigan 48108 | | U/W NCF DSCR: | | 1.50x |
| | | U/W NOI Debt Yield: | | 9.4% |
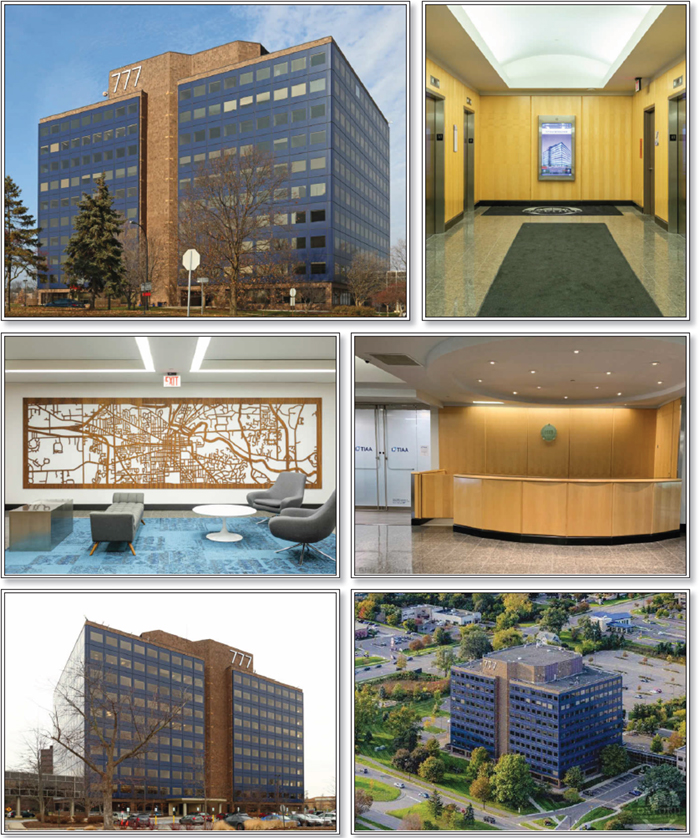
THE INFORMATION IN THIS STRUCTURAL AND COLLATERAL TERM SHEET IS NOT COMPLETE AND MAY BE AMENDED PRIOR TO THE TIME OF SALE. THIS TERM SHEET IS NOT AN OFFER TO SELL THESE SECURITIES AND IT IS NOT A SOLICITATION OF AN OFFER TO BUY THESE SECURITIES IN ANY JURISDICTION WHERE THE OFFER OR SALE IS NOT PERMITTED.
56
| Office – Suburban | Loan #4 | Cut-off Date Balance: | | $44,500,000 |
| 777 East Eisenhower Parkway | 777 East Eisenhower | Cut-off Date LTV: | | 73.4% |
| Ann Arbor, Michigan 48108 | | U/W NCF DSCR: | | 1.50x |
| | | U/W NOI Debt Yield: | | 9.4% |
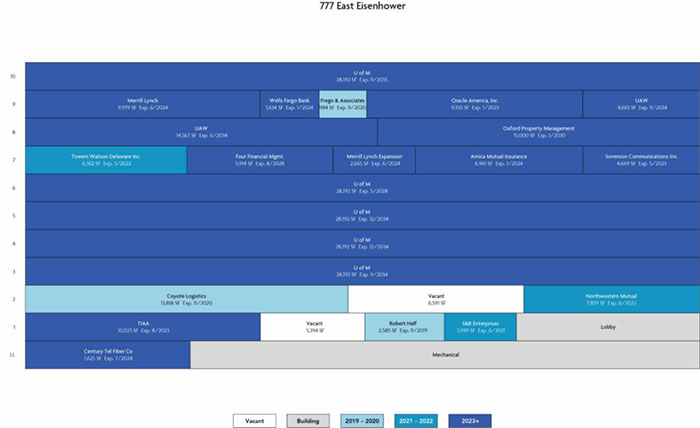
THE INFORMATION IN THIS STRUCTURAL AND COLLATERAL TERM SHEET IS NOT COMPLETE AND MAY BE AMENDED PRIOR TO THE TIME OF SALE. THIS TERM SHEET IS NOT AN OFFER TO SELL THESE SECURITIES AND IT IS NOT A SOLICITATION OF AN OFFER TO BUY THESE SECURITIES IN ANY JURISDICTION WHERE THE OFFER OR SALE IS NOT PERMITTED.
57
| Office – Suburban | Loan #4 | Cut-off Date Balance: | | $44,500,000 |
| 777 East Eisenhower Parkway | 777 East Eisenhower | Cut-off Date LTV: | | 73.4% |
| Ann Arbor, Michigan 48108 | | U/W NCF DSCR: | | 1.50x |
| | | U/W NOI Debt Yield: | | 9.4% |
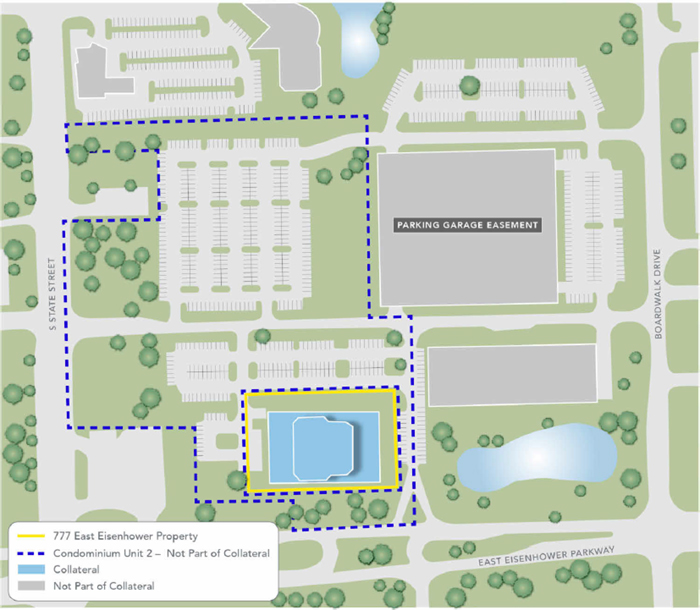
THE INFORMATION IN THIS STRUCTURAL AND COLLATERAL TERM SHEET IS NOT COMPLETE AND MAY BE AMENDED PRIOR TO THE TIME OF SALE. THIS TERM SHEET IS NOT AN OFFER TO SELL THESE SECURITIES AND IT IS NOT A SOLICITATION OF AN OFFER TO BUY THESE SECURITIES IN ANY JURISDICTION WHERE THE OFFER OR SALE IS NOT PERMITTED.
58
| Office – Suburban | Loan #4 | Cut-off Date Balance: | | $44,500,000 |
| 777 East Eisenhower Parkway | 777 East Eisenhower | Cut-off Date LTV: | | 73.4% |
| Ann Arbor, Michigan 48108 | | U/W NCF DSCR: | | 1.50x |
| | | U/W NOI Debt Yield: | | 9.4% |
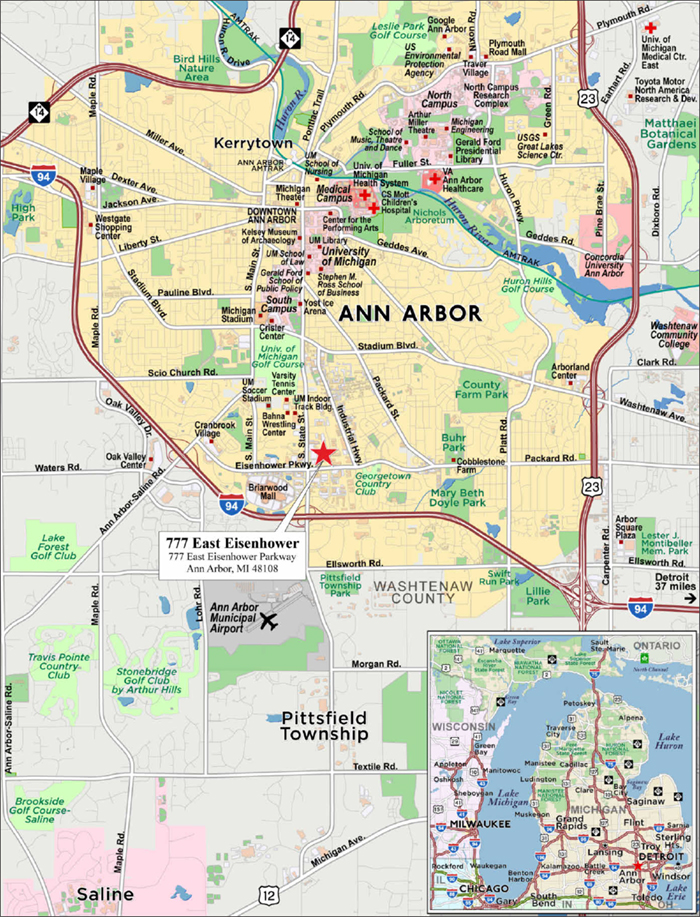
THE INFORMATION IN THIS STRUCTURAL AND COLLATERAL TERM SHEET IS NOT COMPLETE AND MAY BE AMENDED PRIOR TO THE TIME OF SALE. THIS TERM SHEET IS NOT AN OFFER TO SELL THESE SECURITIES AND IT IS NOT A SOLICITATION OF AN OFFER TO BUY THESE SECURITIES IN ANY JURISDICTION WHERE THE OFFER OR SALE IS NOT PERMITTED.
59
| No. 4 – 777 East Eisenhower |
| |
| Mortgage Loan Information | | Mortgaged Property Information |
| Mortgage Loan Seller: | Wells Fargo Bank, National Association | | Single Asset/Portfolio: | Single Asset |
Credit Assessment (DBRS/Fitch/Moody’s): | NR/NR/NR | | Property Type – Subtype: | Office – Suburban |
| Original Principal Balance: | $44,500,000 | | Location: | Ann Arbor, MI |
| Cut-off Date Balance: | $44,500,000 | | Size: | 272,502 SF |
| % of Initial Pool Balance: | 6.3% | | Cut-off Date Balance Per SF: | $163.30 |
| Loan Purpose: | Refinance | | Maturity Date Balance Per SF: | $137.87 |
| Borrower Sponsor: | Jeff Hauptman | | Year Built/Renovated: | 1975/2019 |
| Guarantors: | Jeff Hauptman; Oxford Company, LLC | | Title Vesting: | Fee |
| Mortgage Rate: | 4.0800% | | Property Manager: | Self-managed |
| Note Date: | August 29, 2019 | | Current Occupancy (As of): | 95.6% (10/4/2019) |
| Seasoning: | 2 months | | YE 2018 Occupancy(2): | 82.4% |
| Maturity Date: | September 11, 2029 | | YE 2017 Occupancy(2): | 42.6% |
| IO Period: | 24 months | | YE 2016 Occupancy: | 95.3% |
| Loan Term (Original): | 120 months | | YE 2015 Occupancy: | 91.4% |
| Amortization Term (Original): | 360 months | | As-Stabilized Appraised Value(3): | $60,600,000 |
| Loan Amortization Type: | Interest-only, Amortizing Balloon | | As-Stabilized Appraised Value Per SF(3): | $222.38 |
| Call Protection: | L(26),D(90),O(4) | | As-Stabilized Appraisal Valuation Date(3): | July 1, 2020 |
| Lockbox Type: | Hard/Upfront Cash Management | | Underwriting and Financial Information |
| Additional Debt: | None | | TTM NOI (7/31/2019)(4): | $546,965 |
| Additional Debt Type (Balance): | NAP | | YE 2018 NOI(5): | NAV |
| | | | YE 2017 NOI(5): | NAV |
| | | | YE 2016 NOI(5): | NAV |
| | | | U/W Revenues: | $7,130,787 |
| | | | U/W Expenses: | $2,955,680 |
| Escrows and Reserves(1) | | U/W NOI(4): | $4,175,108 |
| | Initial | Monthly | Cap | | U/W NCF: | $3,856,280 |
| Taxes | $175,007 | $87,504 | NAP | | U/W DSCR based on NOI/NCF: | 1.62x / 1.50x |
| Insurance | $0 | Springing | NAP | | U/W Debt Yield based on NOI/NCF: | 9.4% / 8.7% |
| Replacement Reserve | $0 | $4,537 | NAP | | U/W Debt Yield at Maturity based on NOI/NCF: | 11.1% / 10.3% |
| Immediate Repairs | $634,445 | $0 | NAP | | Cut-off Date LTV Ratio(3): | 73.4% |
| Leasing Reserve | $0 | $21,553 | $1,000,000 | | LTV Ratio at Maturity(3): | 62.0% |
| Rent Concession Reserve(3) | $1,979,394 | $0 | NAP | | | |
| Existing TI/LC Reserve(3) | $4,646,043 | $0 | NAP | | | |
| | | | | | | |
| | | | | | | | |
| Sources and Uses |
| Sources | | | | | Uses | | | |
| Original loan amount | $44,500,000 | | 95.9% | | Loan payoff(6) | $38,593,212 | | 83.1% |
| Borrower new cash contribution(6) | 1,925,778 | | 4.1 | | Upfront reserves | 7,434,889 | | 16.0 |
| | | | | | Closing costs | 397,677 | | 0.9 |
| Total Sources | $46,425,778 | | 100.0% | | Total Uses | $46,425,778 | | 100.0% |
| (1) | See “Escrows” section. |
| (2) | See “Historical Occupancy” section for a discussion of historical occupancy fluctuations. |
| (3) | The As-Stabilized Appraised Value shown reflects a “Prospective Market Value at Stabilization” which assumes that a stabilized occupancy of 95% has been attained. The 777 East Eisenhower Property (as defined below) was 95.6% leased as of October 4, 2019 and at loan origination the 777 East Eisenhower Borrower (as defined below) escrowed $1,979,394 for outstanding free rent and gap rent and $4,646,043 representing outstanding tenant allowances and tenant improvements and leasing commissions (“TI/LC”) (see the “Escrows” section below for further information). The appraiser also concluded to an “As-Is” appraised value of $52,100,000 as of July 2, 2019, which results in a Cut-off Date LTV Ratio of 85.4% and LTV Ratio at Maturity of 72.1% for the 777 East Eisenhower Mortgage Loan (as defined below). |
| (4) | See “Cash Flow Analysis” section for a discussion of the increase in U/W NOI compared to the most recent NOI. |
| (5) | Historical financials prior to the TTM period are unavailable as the borrower sponsor acquired the 777 East Eisenhower Property in August 2018 and historical statements were not provided by the seller. |
| (6) | Contemporaneously with the 777 East Eisenhower Mortgage Loan funding, Eclectic, LLC (the existing lender) made a $6.0 million capital contribution (reflected on the settlement statement as a $6.0 million “Equity Injection”, and netted from Eclectic LLC’s loan pay-off proceeds) in the 777 East Eisenhower Borrower that resulted in Eclectic, LLC’s having an approximate 12.2% effective ownership interest in the 777 East Eisenhower Borrower. The “Loan Payoff” above reflects the gross pay-off amount to Eclectic, LLC. The “Borrower’s new cash contribution” above is derived from the $6.0 million capital contribution. |
The Mortgage Loan. The mortgage loan (the “777 East Eisenhower Mortgage Loan”) is evidenced by a single promissory note secured by a first mortgage encumbering the fee interest in a class A office property in Ann Arbor, Michigan (the “777 East Eisenhower Property”).
THE INFORMATION IN THIS STRUCTURAL AND COLLATERAL TERM SHEET IS NOT COMPLETE AND MAY BE AMENDED PRIOR TO THE TIME OF SALE. THIS TERM SHEET IS NOT AN OFFER TO SELL THESE SECURITIES AND IT IS NOT A SOLICITATION OF AN OFFER TO BUY THESE SECURITIES IN ANY JURISDICTION WHERE THE OFFER OR SALE IS NOT PERMITTED.
60
| Office – Suburban | Loan #4 | Cut-off Date Balance: | | $44,500,000 |
| 777 East Eisenhower Parkway | 777 East Eisenhower | Cut-off Date LTV: | | 73.4% |
| Ann Arbor, Michigan 48108 | | U/W NCF DSCR: | | 1.50x |
| | | U/W NOI Debt Yield: | | 9.4% |
The Borrower and Borrower Sponsor.The borrower is Sevens Associates, LLC (the “777 East Eisenhower Borrower”), a Delaware limited liability company and single purpose entity with one independent director. Legal counsel to the borrower delivered a non-consolidation opinion in connection with the origination of the 777 East Eisenhower Mortgage Loan. The borrower sponsor is Jeff Hauptman, and the non-recourse carve-out guarantors of the 777 East Eisenhower Mortgage Loan are Jeff Hauptman and Oxford Company, LLC (the “Guarantors”). The Guarantors are required to maintain a net worth and liquidity of $15,000,000 and $2,500,000, respectively.
Jeff Hauptman is the founder and CEO of Oxford Companies (“Oxford”). Founded more than 20 years ago,Oxford specializes in commercial real estate acquisitions, management, leasing, construction and development with focus on acquisitions in the Ann Arbor area.As of July 2019, Oxford owned 19 commercial real estate properties totaling approximately 2.4 million square feet, including 12 office properties totaling approximately 1.9 million square feet. Affiliates of Mr. Hauptman were involved in a mortgage default related to an office building located in Ann Arbor, Michigan that resulted in a discounted pay-off in 2011.See“Description of the Mortgage Pool-Loan Purpose; Default History, Bankruptcy Issues and Other Proceedings”in the Preliminary Prospectus.
The Property.The 777 East Eisenhower Property is a 10-story, LEED Gold-certified, class A office building totaling 272,502 square feet, located in Ann Arbor, Michigan. The 777 East Eisenhower Property is situated on an approximately 1.2-acre site and is part of a two-unit land condominium with an overall site area of approximately 10.5 acres (see “Condominium Regime” section below). Constructed in 1975 and currently undergoing renovations, the 777 East Eisenhower Property was 95.6% leased as of October 4, 2019 to 17 tenants across various industries, including education, financial services, insurance, communications and technology. Approximately 66.9% of the net rentable area and 68.7% of underwritten base rent at the 777 East Eisenhower Property is attributed to investment grade tenants or tenants that are subsidiaries of investment grade-rated entities.
Since acquiring the 777 East Eisenhower Property in August 2018, the borrower sponsor has spent over $200,000 on capital improvements, including new asphalt for portions of the parking lot and HVAC zone controller replacements. Approximately $515,000 in additional renovation work is currently ongoing, which includes new asphalt for portions of the parking lot and new mechanical systems for the elevators.
The 777 East Eisenhower Property has access to 997 total parking spaces, including 567 garage spaces and 430 surface spaces, resulting in a parking ratio of approximately 3.7 spaces per 1,000 square feet of net rentable area. The 567 garage spaces and 428 of the surface spaces are not part of the collateral, and the 777 East Eisenhower Property has access subject to certain perpetual easement agreements. The 567 garage spaces are located on a separate parcel situated to the northeast of the 777 East Eisenhower Property and the 428 surface spaces are located within Condominium Unit 2 (see “Condominium Regime” section below; See “Description of the Mortgage Pool—Mortgage Pool Characteristics—Property Types—Office Properties” in the Preliminary Prospectus).
Condominium Regime. The 777 East Eisenhower Property is subject to a master deed for a land condominium (the “State-Eisenhower Condominium”), which comprises two units: “Condominium Unit 1” (the 777 East Eisenhower Property) and the adjacent “Condominium Unit 2”, which is currently owned by the borrower sponsor but is not part of the collateral for the 777 East Eisenhower Mortgage Loan. Subject to certain perpetual parking easement agreements, the 777 East Eisenhower Property has access to parking within the premises of Condominium Unit 2. Per the master deed, if the Condominium Unit 2 parking is developed over, the owner of Condominium Unit 2 is required to provide replacement parking for the benefit of the 777 East Eisenhower Property in a similar location.
The 777 East Eisenhower Property has an approximate 10.97% voting rights’ interest in the State-Eisenhower Condominium regime, but an owners’ association does not currently exist and any future formation of an association would be subject to the lender’s consent. Until the association is created, the 777 East Eisenhower Borrower is declarant and administrator of the State-Eisenhower Condominium regime. Each unit owner has sole responsibility for the maintenance of its respective unit. The 777 East Eisenhower Mortgage Loan documents provide recourse liability to the 777 East Eisenhower Borrower and the Guarantors for springing full recourse if the condominium documents are amended, modified without the lender’s prior written consent and if the condominium is cancelled, terminated or withdrawn, or the 777 East Eisenhower Property is made subject to any partition without the lender’s prior written consent.
Major Tenant.
University of Michigan (140,960 square feet; 51.7% of net rentable area; 52.3% of underwritten base rent; various lease expirations) Founded in 1817 and situated approximately 2.1 miles north of the 777 East Eisenhower Property, the University of Michigan (“U of M”) has a total undergraduate enrollment of 30,318 as of the 2018-2019 school year. U of M’s endowment increased by approximately $1 billion to $11.9 billion from 2017 to 2018. The entity on U of M’s leases at the 777 East Eisenhower Property is The Regents of the University of Michigan, a Michigan Constitutional Corporation.
U of M has executed leases at the 777 East Eisenhower Property but is not yet in full occupancy or paying rent on its entire premises. U of M’s space is located on the third, fourth, fifth, sixth and tenth floors of the 777 East Eisenhower Property.
| ● | U of M is currently in occupancy and paying full rent with respect to its sixth floor space (28,192 square feet; 20.0% of total U of M net rentable area). The sixth floor space is currently used by the Michigan Medicine’s Quality Program, which collects quality and safety data to improve work across the institution. U of M signed the lease for its sixth floor space in September 2017 and has been in occupancy since December 2017. |
| ● | With respect to the remainder of U of M’s space (the “Michigan Expansion Space”; 112,768 square feet located on the third, fourth, fifth and 10th floors; 80.0% of total U of M net rentable area), the tenant has executed leases but is not yet in occupancy |
THE INFORMATION IN THIS STRUCTURAL AND COLLATERAL TERM SHEET IS NOT COMPLETE AND MAY BE AMENDED PRIOR TO THE TIME OF SALE. THIS TERM SHEET IS NOT AN OFFER TO SELL THESE SECURITIES AND IT IS NOT A SOLICITATION OF AN OFFER TO BUY THESE SECURITIES IN ANY JURISDICTION WHERE THE OFFER OR SALE IS NOT PERMITTED.
61
| Office – Suburban | Loan #4 | Cut-off Date Balance: | | $44,500,000 |
| 777 East Eisenhower Parkway | 777 East Eisenhower | Cut-off Date LTV: | | 73.4% |
| Ann Arbor, Michigan 48108 | | U/W NCF DSCR: | | 1.50x |
| | | U/W NOI Debt Yield: | | 9.4% |
| | | or paying rent on all space. U of M is expected to utilize the Michigan Expansion Space to house Michigan Medicine’s Health Information Technology Services and Development Office, along with other staff from the medical campus. U of M signed the lease for the Michigan Expansion Space in December 2018. |
| o | U of M took delivery of its third floor space (28,192 square feet, 20.0% of total U of M net rentable area) in July 2019 and is expected to commence paying full unabated rent in October 2019; |
| o | U of M is expected to take delivery of its fourth and fifth floor spaces (56,384 square feet; 40.0% of total U of M net rentable area) in October 2019 and is required to commence paying full unabated rent three months after the delivery date; and |
| o | U of M is expected to take delivery of its 10th floor space (28,192 square feet; 20.0% of total U of M net rentable area) in July 2020 and is required to commence paying full unabated rent three months after the delivery date. |
U of M’s lease for the Michigan Expansion space is structured with three months of free rent immediately following delivery of each respective premises. The lender reserved $1,729,114 for outstanding free rent and gap rent related to U of M at the time of origination of the 777 East Eisenhower Mortgage Loan (see the “Escrows” section below). There are no assurances that U of M will take possession or commence paying full unabated rent by the estimated dates noted herein.
Each of U of M’s leased suites at the 777 East Eisenhower Property has two, 5-year renewal options remaining, each with 12 to 14 months’ prior notice, following the respective lease expiration dates. U of M’s lease for its sixth floor space (20.0% of total U of M net rentable area) expires on May 31, 2028, its third floor space (20.0% of total U of M net rentable area) expires on September 30, 2034, its fourth and fifth floor space (40.0% of total U of M net rentable area) expires on December 31, 2034 and its tenth floor space (20.0% of total U of M net rentable area) on September 30, 2035.
The following table presents certain information relating to the tenancy at the 777 East Eisenhower Property:
Major Tenants
| Tenant Name | Credit Rating
(Fitch/ Moody’s/
S&P)(1) | Tenant
NRSF | % of
NRSF | Annual U/W
Base Rent
PSF(2) | Annual
U/W Base
Rent(2) | % of Total
Annual
U/W Base
Rent | Lease
Expiration
Date | Extension Options | Termination
Option (Y/N) |
| Major Tenants | | | | | | | | |
| University of Michigan | NR/Aaa/AAA | 140,960 | 51.7% | $25.35(3) | $3,572,720(3) | 52.3% | Various(4) | 2, 5-year | N |
| UAW | NR/NR/NR | 19,230 | 7.1% | $29.36(5) | $564,593(5) | 8.3% | Various(6) | 1, 5-year | Y(7) |
| Oxford Property Management.(8) | NR/NR/NR | 15,000 | 5.5% | $27.68(9) | $415,200(9) | 6.1% | 1/31/2030 | NAP | N |
| Coyote Logistics(10) | NR/NR/NR | 13,818 | 5.1% | $26.50 | $366,177 | 5.4% | 11/30/2020 | 1, 5-year | N |
| Merrill Lynch | A+/A2/A | 12,644 | 4.6% | $26.47 | $334,661 | 4.9% | 6/30/2024 | 1, 5-year | N |
| TIAA | AA+/Aa1/AA+ | 10,023 | 3.7% | $26.87 | $269,343 | 3.9% | 8/31/2023 | 2, 5-year | Y(11) |
| Total Major Tenants | 211,675 | 77.7% | $26.09 | $5,522,694 | 80.9% | | | |
| | | | | | | | | |
| Non-Major Tenant | 48,842 | 17.9% | $26.75 | $1,306,304 | 19.1% | | | |
| | | | | | | | | |
| Occupied Collateral Total | 260,517 | 95.6% | $26.21 | $6,828,998 | 100.0% | | | |
| | | | | | | | | |
| Vacant Space | 11,985 | 4.4% | | | | | | |
| | | | | | | | | |
| Collateral Total | 272,502 | 100.0% | | | | | | |
| | | | | | | | | | |
| (1) | Certain ratings are those of the parent entity whether or not the parent entity guarantees the lease. |
| (2) | Annual U/W Base Rent PSF and Annual U/W Base Rent include contractual rent steps through October 2020 totalling $50,963 and straight-line rent averaging for the investment grade tenants through the lesser of their remaining lease terms or the loan term totalling $332,336. |
| (3) | U of M has executed leases at the 777 East Eisenhower Property but is not yet in full occupancy or paying rent on the entire Michigan Expansion Space (see “Major Tenant” section above for further details). The lender reserved $1,729,114 for outstanding gap rent and free rent obligations related to U of M (see “Escrows” section below). U of M’s Annual U/W Base Rent PSF and Annual U/W Base Rent represent the average over the 777 East Eisenhower Mortgage Loan term. |
| (4) | U of M has various lease expiration dates in 2028, 2034 and 2035 for its five suites. See “The Property” section above for additional details. |
| (5) | UAW has a total of $22,149 in outstanding free rent and gap rent, all of which was reserved upfront in connection with the origination of the 777 East Eisenhower Mortgage Loan. |
| (6) | UAW’s lease for its 14,567 square foot space expires on June 30, 2024 and its 4,663 square foot space expires on September 30, 2024. |
| (7) | UAW has a one-time termination option effective as of July 31, 2022, with eight months’ prior notice subject to a termination fee of (i) nine months’ base rent, plus (ii) the unamortized portion of any tenant allowance and brokerage commissions as of the early termination date. |
| (8) | Oxford Property Management is affiliated with Oxford Company, LLC, a non-recourse carve-out guarantor for the 777 East Eisenhower Mortgage Loan (see “The Borrower and Borrower Sponsor” section above for a full discussion of the Oxford Company, LLC). |
| (9) | Oxford Property Management has a total of $202,500 in outstanding free rent and gap rent (through January 2020), all of which was reserved upfront in connection with the origination of the 777 East Eisenhower Mortgage Loan. Coyote Logistics is required to give notice for its extension option by November 30, 2019 |
| (10) | According to the 777 East Eisenhower Borrower, Coyote Logistics is expected to vacate at its lease expiration in November 2020. |
| (11) | TIAA has a one-time termination option effective as of August 31, 2021, with 12 months’ prior notice subject to a termination fee of (i) three months’ base rent, plus (ii) the unamortized portion of any tenant allowance, abated rent and brokerage commissions as of the early termination date (calculated using a straight-line amortizing basis using an interest rate of 8% per annum). |
THE INFORMATION IN THIS STRUCTURAL AND COLLATERAL TERM SHEET IS NOT COMPLETE AND MAY BE AMENDED PRIOR TO THE TIME OF SALE. THIS TERM SHEET IS NOT AN OFFER TO SELL THESE SECURITIES AND IT IS NOT A SOLICITATION OF AN OFFER TO BUY THESE SECURITIES IN ANY JURISDICTION WHERE THE OFFER OR SALE IS NOT PERMITTED.
62
| Office – Suburban | Loan #4 | Cut-off Date Balance: | | $44,500,000 |
| 777 East Eisenhower Parkway | 777 East Eisenhower | Cut-off Date LTV: | | 73.4% |
| Ann Arbor, Michigan 48108 | | U/W NCF DSCR: | | 1.50x |
| | | U/W NOI Debt Yield: | | 9.4% |
The following table presents certain information relating to the lease rollover schedule at the 777 East Eisenhower Property:
Lease Expiration Schedule(1)(2)
Year Ending
December 31, | No. of Leases Expiring | Expiring
NRSF | % of Total NRSF | Cumulative
Expiring
NRSF | Cumulative
% of Total
NRSF | Annual
U/W
Base Rent(3) | % of Total
Annual
U/W Base
Rent | Annual
U/W
Base Rent
PSF(3) |
| MTM | 1 | 2,585 | 0.9% | 2,585 | 0.9% | $66,240 | 1.0% | $25.62 |
| 2019 | 0 | 0 | 0.0% | 2,585 | 0.9% | $0 | 0.0% | $0.00 |
| 2020 | 2 | 14,802 | 5.4% | 17,387 | 6.4% | $394,221 | 5.8% | $26.63 |
| 2021 | 1 | 1,099 | 0.4% | 18,486 | 6.8% | $27,846 | 0.4% | $25.34 |
| 2022 | 2 | 14,221 | 5.2% | 32,707 | 12.0% | $391,317 | 5.7% | $27.52 |
| 2023 | 3 | 23,842 | 8.7% | 56,549 | 20.8% | $637,041 | 9.3% | $26.72 |
| 2024 | 7 | 42,094 | 15.4% | 98,643 | 36.2% | $1,170,631 | 17.1% | $27.81 |
| 2025 | 0 | 0 | 0.0% | 98,643 | 36.2% | $0 | 0.0% | $0.00 |
| 2026 | 0 | 0 | 0.0% | 98,643 | 36.2% | $0 | 0.0% | $0.00 |
| 2027 | 0 | 0 | 0.0% | 98,643 | 36.2% | $0 | 0.0% | $0.00 |
| 2028 | 2 | 34,106 | 12.5% | 132,749 | 48.7% | $909,344 | 13.3% | $26.66 |
| 2029 | 0 | 0 | 0.0% | 132,749 | 48.7% | $0 | 0.0% | $0.00 |
| Thereafter | 5 | 127,768 | 46.9% | 260,517 | 95.6% | $3,232,358 | 47.3% | $25.30 |
| Vacant | 0 | 11,985 | 4.4% | 272,502 | 100.0% | $0 | 0.0% | $0.00 |
| Total/Weighted Average | 23 | 272,502 | 100.0% | | | $6,828,998 | 100.0% | $26.21 |
| (1) | Information obtained from the underwritten rent roll. |
| (2) | Certain tenants may have lease termination options that are exercisable prior to the originally stated expiration date of the subject lease and that are not considered in the Lease Expiration Schedule. |
| (3) | Total/Weighted Average Annual U/W Base Rent and Annual U/W Base Rent PSF exclude vacant space. |
The following table presents historical occupancy percentages at the 777 East Eisenhower Property:
Historical Occupancy
12/31/2015(1) | 12/31/2016(1) | 12/31/2017(1)(2)(3) | 12/31/2018(1)(3) | 10/4/2019(3)(4) |
| 91.4% | 95.3% | 42.6% | 82.4% | 95.6% |
| (1) | Information obtained from the 777 East Eisenhower Borrower. |
| (2) | Year-end 2017 occupancy was impacted by (i) Thompson Reuters vacating its approximately 173,696 square foot space at the 777 East Eisenhower Property (63.7% net rentable area) in March 2017 and (ii) two new leases signed in July and December 2017 totaling approximately 13.8% of the net rentable area at the 777 East Eisenhower Property. |
| (3) | The increase in occupancy from 2017 to 2018 is attributed to U of M signing its lease for the Michigan Expansion Space (112,768 square feet of its space; 41.4% of net rentable area at the 777 East Eisenhower Property) in December 2018. U of M is not currently in full occupancy of or paying unabated rent on the Michigan Expansion Space (see “Major Tenant” section above). |
| (4) | Information obtained from the underwritten rent roll. |
THE INFORMATION IN THIS STRUCTURAL AND COLLATERAL TERM SHEET IS NOT COMPLETE AND MAY BE AMENDED PRIOR TO THE TIME OF SALE. THIS TERM SHEET IS NOT AN OFFER TO SELL THESE SECURITIES AND IT IS NOT A SOLICITATION OF AN OFFER TO BUY THESE SECURITIES IN ANY JURISDICTION WHERE THE OFFER OR SALE IS NOT PERMITTED.
63
| Office – Suburban | Loan #4 | Cut-off Date Balance: | | $44,500,000 |
| 777 East Eisenhower Parkway | 777 East Eisenhower | Cut-off Date LTV: | | 73.4% |
| Ann Arbor, Michigan 48108 | | U/W NCF DSCR: | | 1.50x |
| | | U/W NOI Debt Yield: | | 9.4% |
Operating History and Underwritten Net Cash Flow. The following table presents certain information relating to the historical operating performance and underwritten net cash flow at the 777 East Eisenhower Property:
Cash Flow Analysis(1)
| | TTM
7/31/2019(2) | U/W(2) | %(3) | U/W $ per
SF |
| Base Rent | $2,749,902 | $6,445,699 | 86.1% | $23.65 |
| Contractual Rent Steps(4) | 0 | 383,299 | 5.1 | 1.41 |
| Grossed Up Vacant Space | 0 | 335,580 | 4.5 | 1.23 |
| Gross Potential Rent | $2,749,902 | $7,164,578 | 95.7% | $26.29 |
| Other Income(5) | 0 | 34,438 | 0.5 | 0.13 |
| Total Recoveries | 293,185 | 290,000 | 3.9 | 1.06 |
| Net Rental Income | $3,043,087 | $7,489,016 | 100.0% | $27.48 |
| (Vacancy & Credit Loss) | 0 | (358,229)(6) | (5.0) | (1.31) |
| Effective Gross Income | $3,043,087 | $7,130,787 | 95.2% | $26.17 |
| | | | | |
| Real Estate Taxes | 1,000,045 | 1,080,000 | 15.1 | 3.96 |
| Insurance | 42,084 | 58,034 | 0.8 | 0.21 |
| Management Fee | 89,056 | 213,924 | 3.0 | 0.79 |
| Other Operating Expenses | 1,364,937 | 1,603,722 | 22.5 | 5.89 |
| Total Operating Expenses | $2,496,122 | $2,955,680 | 41.4% | $10.85 |
| | | | | |
| Net Operating Income | $546,965 | $4,175,108 | 58.6% | $15.32 |
| Replacement Reserves | 0 | 46,325 | 0.6 | 0.17 |
| TI/LC | 0 | 272,502 | 3.8 | 1.00 |
| Net Cash Flow | $546,965 | $3,856,280 | 54.1% | $14.15 |
| | | | | |
| NOI DSCR | 0.21x | 1.62x | | |
| NCF DSCR | 0.21x | 1.50x | | |
| NOI Debt Yield | 1.2% | 9.4% | | |
| NCF Debt Yield | 1.2% | 8.7% | | |
| (1) | Historical financials prior to the TTM period are unavailable as the borrower sponsor acquired the 777 East Eisenhower Property in August 2018 and historical statements were not provided by the seller. |
| (2) | The increase in Net Operating Income from TTM 7/31/2019 to U/W was driven by (i) seven new leases totaling $3,796,950 of underwritten base rent (53.0% of underwritten base rent) commencing between July 2019 and July 2020 (including the Michigan Expansion Space, which accounts for $2,817,158 of underwritten base rent, excluding straight line rent averaging credit) and (ii) the inclusion of contractual rent steps through October 2020 totaling $50,963 and straight-line rent averaging for the investment grade tenants over the lesser of their remaining lease terms or the loan term totaling $332,336. U of M has a signed lease for the Michigan Expansion Space but is not yet in full occupancy or paying unabated rent (see “Major Tenant” section above for further details). |
| (3) | Represents (i) percent of Net Rental Income for all revenue fields, (ii) percent of Gross Potential Rent for Vacancy & Credit Loss and (iii) percent of Effective Gross Income for all other fields. |
| (4) | Represents contractual rent steps through October 2020 and straight-line rent averaging for the investment grade tenants over their remaining lease terms (see “Major Tenants” table above). |
| (5) | Other Income is primarily composed of antenna lease income. |
| (6) | The underwritten economic vacancy is 5.0%. The 777 East Eisenhower Property was 95.6% leased as of October 4, 2019. |
Appraisal.The appraiser concluded to an “Prospective Market Value at Stabilization” for the 777 East Eisenhower Property of $60,600,000 as of July 1, 2020, which assumes a stabilized occupancy of 95%. As of October 4, 2019, the 777 East Eisenhower Property was 95.6% leased and the lender collected upfront reserves for outstanding free rent and TI/LCs. The appraiser also concluded to an “as-is” Appraised Value of $52,100,000 as of July 2, 2019.
Environmental Matters. According to the Phase I environmental site assessment dated August 27, 2019, the presence of an on-site diesel underground storage tank (“UST”) is considered a recognized environmental condition. An automatic leak detection system is in place and no releases have been reported. The environmental consultant noted the information available for review only covered one of the 20 years that the UST system has operated and consequently, based on the age of the UST (approximately 20 years) and the possibility that releases may occur from tanks or tank systems that are otherwise testing as tight, was unable to rule out the potential that a release from the UST has affected the subsurface of the 777 East Eisenhower Property. The environmental consultant estimated with 90% confidence that the total cost to address potential impacts would range from $120,000 to $363,000. In lieu of a Phase II environmental site assessment, the lender obtained a prepaid lender environmental collateral protection and liability insurance policy that carries a 13-year term and a $2,000,000 limit (with a $25,000 deductible). There was no evidence of any other recognized environmental conditions at the 777 East Eisenhower Property.
THE INFORMATION IN THIS STRUCTURAL AND COLLATERAL TERM SHEET IS NOT COMPLETE AND MAY BE AMENDED PRIOR TO THE TIME OF SALE. THIS TERM SHEET IS NOT AN OFFER TO SELL THESE SECURITIES AND IT IS NOT A SOLICITATION OF AN OFFER TO BUY THESE SECURITIES IN ANY JURISDICTION WHERE THE OFFER OR SALE IS NOT PERMITTED.
64
| Office – Suburban | Loan #4 | Cut-off Date Balance: | | $44,500,000 |
| 777 East Eisenhower Parkway | 777 East Eisenhower | Cut-off Date LTV: | | 73.4% |
| Ann Arbor, Michigan 48108 | | U/W NCF DSCR: | | 1.50x |
| | | U/W NOI Debt Yield: | | 9.4% |
Market Overview and Competition.The 777 East Eisenhower Property is located in Ann Arbor, Washtenaw County, Michigan, approximately 0.8 miles north of Interstate 94 (provides access eastbound to Detroit and westbound towards Chicago), 0.4 miles east of State Street (provides north-south access through Ann Arbor), 2.2 miles south of the U of M campus and 22.5 miles west of the Detroit Metropolitan Wayne County Airport. The 777 East Eisenhower Property is situated approximately 0.2 miles east of the intersection of E Eisenhower Parkway and S State Street, which, according to a third party market research provider, had a daily traffic count of approximately 37,496 vehicles as of 2018.
The U of M hospital campus is situated approximately 3.7 miles north of the 777 East Eisenhower Property. According to the appraisal, the U of M hospital employs approximately 14,000 (and together with the university is the largest employer in the county, with approximately 33,225 total employees). According to the appraisal, the health system offers 527 beds on a 340-acre campus. Approximately 0.4 miles southwest of the 777 East Eisenhower Property is Briarwood Mall, an approximately 1.0-million square feet Simon-owned super regional mall anchored by Macy’s, Von Maur and JCPenney, featuring various boutique shops, dining and entertainment options including an Apple store, California Pizza Kitchen, Bravo Cucina Italiana and P.F. Chang’s.
According to a third party market research provider, the estimated 2019 population within a three- and five-mile radius of the 777 East Eisenhower Property was approximately 93,768 and 170,157, respectively; and the estimated 2019 average household income within the same radii was approximately $90,094 and $93,342, respectively.
Submarket Information – According to a third-party market research report, the 777 East Eisenhower Property is situated within the Washtenaw W of 23 submarket of the Ann Arbor Office Market. As of September 9, 2019, the Washtenaw W of 23 submarket reported a total inventory of approximately 11.2 million square feet with a 6.5% vacancy rate and average asking rent of $24.74 per square foot, gross. The submarket vacancy rate has decreased from 11.3% in 2011 and has averaged 8.9% from 2011 through 2018.The appraiser identified five comparable office properties totaling approximately 525,000 square feet, with an average occupancy rate of 96.4% and base rents ranging from $23.50 to $26.50 per square foot, modified gross (with one comparable property reporting a tenant’s base rent of $25.00 per square foot, full service gross).
The following table presents certain information relating to the appraiser’s market rent conclusions for the 777 East Eisenhower Property:
Market Rent Summary(1)
| | Office |
| Market Rent (PSF) | $28.00 |
| Lease Term (Years) | 5 |
| Lease Type (Reimbursements) | MG |
| Rent Increase Projection | 2-3% per annum |
| (1) | Information obtained from the appraisal. |
The table below presents certain information relating to comparable sales pertaining to the 777 East Eisenhower Property identified by the appraiser:
Comparable Sales(1)
| Property Name | Location | Year Built | Rentable
Area (SF) | Sale Date | Sale Price | Sale Price
(PSF) |
| Ann Arbor Commerce | Ann Arbor, MI | 1998 | 36,829 | Jan-19 | $12,205,000 | $331.40 |
| 1111 W. 22nd Street | Oak Brook, IL | 1984 | 233,166 | Nov-18 | $43,000,000 | $184.42 |
| Office Tower | Evanston, IL | 1969 | 339,000 | May-18 | $98,300,000 | $289.97 |
| Birmingham Place | Birmingham, MI | 1981 | 107,691 | Dec-17 | $29,000,000 | $269.29 |
| McKinley Towne Center & Offices @ Liberty Square | Ann Arbor, MI | 1972 | 190,205 | Aug-17 | $50,000,000 | $262.87 |
| One Michigan Avenue Building | Lansing, MI | 1982 | 140,000 | Mar-17 | $16,425,000 | $117.32 |
| One North Main Building | Ann Arbor, MI | 1987 | 114,043 | Feb-16 | $24,000,000 | $210.45 |
| (1) | Information obtained from the appraisal. |
THE INFORMATION IN THIS STRUCTURAL AND COLLATERAL TERM SHEET IS NOT COMPLETE AND MAY BE AMENDED PRIOR TO THE TIME OF SALE. THIS TERM SHEET IS NOT AN OFFER TO SELL THESE SECURITIES AND IT IS NOT A SOLICITATION OF AN OFFER TO BUY THESE SECURITIES IN ANY JURISDICTION WHERE THE OFFER OR SALE IS NOT PERMITTED.
65
| Office – Suburban | Loan #4 | Cut-off Date Balance: | | $44,500,000 |
| 777 East Eisenhower Parkway | 777 East Eisenhower | Cut-off Date LTV: | | 73.4% |
| Ann Arbor, Michigan 48108 | | U/W NCF DSCR: | | 1.50x |
| | | U/W NOI Debt Yield: | | 9.4% |
The following table presents certain information relating to comparable leases related to 777 East Eisenhower Property:
Comparable Leases(1)
| Property Name/Location | Year Built/ Renovated | Total GLA (SF) | Distance from Subject | Occupancy(2) | Tenant | Tenant Size | Lease Term | Annual Base Rent PSF | Lease Type |
Black & Veatch Building 3550 Green Ct. Ann Arbor Township, MI | 1998/NAV | 79,500 | 7.1 miles | 100.0% | Guardian Glass | 12,827 SF | 3.3 Yrs | $25.00 | FSG |
Burlington Office Center I 305-325 Eisenhower Pky. Ann Arbor, MI | 1982/1985 | 196,749 | 0.7 miles | 96.7% | Mercedes Benz R&D | 2,289 SF | 2.2 Yrs | $23.50 | MG |
Concord Center Office 455 E. Eisenhower Pky. Ann Arbor, MI | 1987/2017-2019 | 98,664 | 0.4 miles | 96.3% | Office Evolution | 7,112 SF | 7.4 Yrs | $25.95 | MG |
Williamsburg Square 555 Briarwood Cir. Ann Arbor, MI | 1986/2012-2016 | 80,755 | 0.5 miles | 96.6% | Longbow Advantage | 3,628 SF | 5.3 Yrs | $23.50 | MG |
Atrium Office Center I 900 Victors Way Ann Arbor, MI | 1987/NAV | 69,000 | 0.6 miles | 92.6% | Not Disclosed | 2,100 SF | 3.0 Yrs | $26.50 | MG |
| (1) | Information obtained from the appraisal, unless otherwise noted. |
| (2) | Information obtained from a third party market research provider. |
Escrows.
Real Estate Taxes – The 777 East Eisenhower Mortgage Loan documents require an upfront real estate tax reserve of $175,007 and ongoing monthly real estate tax reserves in an amount equal to one-twelfth of the real estate taxes that the lender estimates will be payable during the next twelve months (initially $87,504).
Insurance – The 777 East Eisenhower Mortgage Loan documents do not require ongoing monthly escrows for insurance premiums so long as (i) no event of default has occurred and is continuing, (ii) the 777 East Eisenhower Borrower provides the lender with evidence that the 777 East Eisenhower Property’s insurance coverage is included in a blanket policy and such policy is in full force and effect, and (iii) the 777 East Eisenhower Borrower provides the lender with evidence of timely payment of the insurance premiums and renewals (and in no event later than 10 business days prior to expiration).
Immediate Repairs Reserve –The 777 East Eisenhower Mortgage Loan documents require an upfront immediate repairs reserve of $634,445 to perform deferred maintenance at the 777 East Eisenhower Property.
Replacement Reserve – The 777 East Eisenhower Mortgage Loan documents require ongoing monthly replacement reserves of $4,537, which the lender may require the 777 East Eisenhower Borrower to increase (not more than once per year) if the lender reasonably determines such increase is necessary to maintain the proper operation of the 777 East Eisenhower Property.
Leasing Reserve –The 777 East Eisenhower Mortgage Loan documents require ongoing general TI/LC reserves of $21,553, subject to a cap of $1,000,000 (which cap will only apply so long as no event of default is continuing, the amortizing net cash flow debt service coverage ratio based upon a hypothetical 30-year amortization period (“Amortizing NCF DSCR”) is equal to or greater than 1.30x and the 777 East Eisenhower Property’s physical and economic occupancy is no less than 85.0%).
Rent Concession Reserve – The 777 East Eisenhower Mortgage Loan documents require an upfront reserve of $1,979,394 for rent concessions related to four tenants: U of M ($1,729,114), Oxford Property Management ($202,500), UAW ($22,149) and Four Financial ($25,630).
Existing TI/LC Reserve – The 777 East Eisenhower Mortgage Loan documents require an upfront reserve of $4,646,043 for TI/LCs related to four tenants: U of M ($3,076,474), Merrill Lynch ($63,220), UAW ($519,420) and Oxford Property Management ($986,930).
Lockbox and Cash Management. The 777 East Eisenhower Mortgage Loan documents require that the 777 East Eisenhower Borrower establish and maintain a lender-controlled lockbox account, which is already in-place, and that the 777 East Eisenhower Borrower direct all tenants to pay rent directly into such lockbox account. The 777 East Eisenhower Mortgage Loan documents also require that all rents received by the 777 East Eisenhower Borrower or the property manager be deposited into the lockbox account within one business day of receipt. All funds in the lockbox account are required to be swept each business day into the cash management account controlled by the lender and, on each payment date, all funds in the cash management account are required to be applied in accordance with the 777 East Eisenhower Mortgage Loan documents. Prior to the occurrence of a Cash Trap Event Period,
THE INFORMATION IN THIS STRUCTURAL AND COLLATERAL TERM SHEET IS NOT COMPLETE AND MAY BE AMENDED PRIOR TO THE TIME OF SALE. THIS TERM SHEET IS NOT AN OFFER TO SELL THESE SECURITIES AND IT IS NOT A SOLICITATION OF AN OFFER TO BUY THESE SECURITIES IN ANY JURISDICTION WHERE THE OFFER OR SALE IS NOT PERMITTED.
66
| Office – Suburban | Loan #4 | Cut-off Date Balance: | | $44,500,000 |
| 777 East Eisenhower Parkway | 777 East Eisenhower | Cut-off Date LTV: | | 73.4% |
| Ann Arbor, Michigan 48108 | | U/W NCF DSCR: | | 1.50x |
| | | U/W NOI Debt Yield: | | 9.4% |
any excess cash flow will be disbursed to the 777 East Eisenhower Borrower. During a Cash Trap Event Period, any excess cash flow remaining after satisfaction of the waterfall items are required to be swept to an excess cash flow subaccount to be held by the lender as additional security for the 777 East Eisenhower Whole Loan during the continuance of the Cash Trap Event Period.
A “Cash Trap Event Period” will commence upon the earlier of the following:
| (i) | the occurrence and continuance of an event of default; |
| (ii) | the Amortizing NCF DSCR falling below 1.15x for two consecutive calendar quarters (excluding any non-recurring expenses); |
| (iii) | the occurrence and continuation of a Major Tenant Event Period (as defined below); or |
| (iv) | the 777 East Eisenhower Borrower receiving notice that U of M has exercised its option to purchase the 777 East Eisenhower Property pursuant to the terms of its lease (see “Purchase Option” section below). |
A Cash Trap Event Period will end upon the occurrence of the following:
| ● | with regard to clause (i), the cure of such event of default; |
| ● | with regard to clause (ii), the Amortizing NCF DSCR being greater than or equal to 1.30x for two consecutive calendar quarters; |
| ● | with regard to clause (iii), a Major Tenant Event Period Cure (as defined below); or |
| ● | with regard to clause (iv), repayment of the 777 East Eisenhower Mortgage Loan in full pursuant to the terms of the 777 East Eisenhower Mortgage Loan documents. |
Any reference to “U of M” in the conditions below (or within the definition of Major Tenant Event Period Cure below) will also apply to such tenant’s successors and assigns, and any replacement tenant that enters into a lease for all or any portion of U of M’s space in accordance with the terms of the 777 East Eisenhower Mortgage Loan documents.
A “Major Tenant Event Period” will commence upon the earliest to occur of the following:
| (i) | U of M (x) “going dark” in 100% of its space or vacating or otherwise failing to occupy its entire space (“Go Dark Triggers”) on or before August 11, 2024 or (y) commencing any Go Dark Trigger with respect to 75% or more of its space after August 11, 2024 or (z) giving notice of its intent to commence any Go Dark Trigger with respect to the applicable space; |
| (ii) | a default, beyond any notice and grace period, under the U of M lease; |
| (iii) | U of M filing, as a debtor, a bankruptcy or similar insolvency proceeding, or otherwise becoming involved, as a debtor, in a bankruptcy or any similar insolvency proceeding; |
| (iv) | U of M failing to renew or extend the term of its lease for at least 85% of its space on or prior to the earlier of (x) the deadline to provide notice of renewal under its lease or (y) 12 months prior to lease expiration; or |
| (v) | the long-term, unsecured debt rating for U of M being downgraded, withdrawn or qualified below investment grade by any such rating agency designated, or anticipated to be designated, by the lender in connection with any securitization involving the 777 East Eisenhower Mortgage Loan or any portion thereof (“Rating Agency”). |
A “Major Tenant Event Period Cure” will occur upon:
| ● | with regard to clause (i) above, the occurrence of (x) a Major Tenant Re-Tenanting Event (as defined below) or (y) U of M having resumed its normal business operations in the applicable percentage of its space and being open during customary hours and paying full, unabated rent for a period of two consecutive calendar quarters; |
| ● | with regard to clause (ii) above, (x) a Major Tenant Re-Tenanting Event having occurred or (y) the applicable default having been cured and no other default under the related lease having occurred for a period of two consecutive calendar quarters; |
| ● | with regard to clause (iii) above, (x) a Major Tenant Re-Tenanting Event having occurred or (y) the bankruptcy or insolvency proceeding having been terminated in a manner satisfactory to the lender, the related lease having been affirmed, and the terms of such lease, as affirmed, being satisfactory to the lender; |
| ● | with regard to clause (iv) above, (x) a Major Tenant Re-Tenanting Event having occurred or (y)(1) U of M renewing or extending its lease for at least 85% of its space pursuant to its lease or otherwise on terms and conditions acceptable to the lender and (2) the Amortizing NCF DSCR being at least 1.30x (excluding non-recurring expenses); or |
| ● | with regard to clause (v) above, the long-term unsecured debt rating for U of M being no lower than investment grade for two consecutive calendar quarters as rated by each Rating Agency that rates U of M. |
A “Major Tenant Re-Tenanting Event” will occur upon (x) the Amortizing NCF DSCR being at least 1.30x (excluding non-recurring expenses) and (y) the lender receiving satisfactory evidence, including, without limitation, a satisfactory estoppel certificate from each such replacement tenant affirming, that: (i) at least 85% of the U of M space at the 777 East Eisenhower Property has been leased to one or more reasonably satisfactory replacement tenants pursuant to a reasonably satisfactory replacement lease, (ii) each such tenant is in occupancy of its premises, is open for business and is paying full, unabated rent pursuant to the terms of its lease and (iii) all tenant improvement costs and leasing commissions provided in each such replacement lease have been paid (or has been reserved).
Property Management. The 777 East Eisenhower Property is managed by an affiliate of the 777 East Eisenhower Borrower.
Partial Release. Not permitted.
Real Estate Substitution.Not permitted.
Subordinate and Mezzanine Indebtedness.Not permitted.
THE INFORMATION IN THIS STRUCTURAL AND COLLATERAL TERM SHEET IS NOT COMPLETE AND MAY BE AMENDED PRIOR TO THE TIME OF SALE. THIS TERM SHEET IS NOT AN OFFER TO SELL THESE SECURITIES AND IT IS NOT A SOLICITATION OF AN OFFER TO BUY THESE SECURITIES IN ANY JURISDICTION WHERE THE OFFER OR SALE IS NOT PERMITTED.
67
| Office – Suburban | Loan #4 | Cut-off Date Balance: | | $44,500,000 |
| 777 East Eisenhower Parkway | 777 East Eisenhower | Cut-off Date LTV: | | 73.4% |
| Ann Arbor, Michigan 48108 | | U/W NCF DSCR: | | 1.50x |
| | | U/W NOI Debt Yield: | | 9.4% |
Ground Lease. None.
Purchase Option. U of M has a one-time option to purchase the 777 East Eisenhower Property on or about July 1, 2029, with 24 months’ notice. The purchase option price (net of all customary sales costs) plus all cash flows returned from the time of the 777 East Eisenhower Borrower’s acquisition of the 777 East Eisenhower Property to the date of sale, is required to produce a 13% annual internal rate of return to the 777 East Eisenhower Borrower on total investment in the 777 East Eisenhower Property as of the closing of the purchase option sale. U of M’s purchase option is subject to conditions outlined in its lease and the 777 East Eisenhower Mortgage Loan documents, including, but not limited to U of M: (i) not being in default under the lease beyond any applicable notice and cure period, unless the 777 East Eisenhower Borrower, in its sole and absolute discretion, agrees to permit the purchase notwithstanding such default and (ii) not having assigned its lease and not having sublet any portion of its premises.
The U of M lease does not provide a loan payoff-based floor for the purchase option price; however, the 777 East Eisenhower Mortgage Loan documents prohibit the 777 East Eisenhower Borrower from agreeing on a purchase price that is less than the balance of the 777 East Eisenhower Mortgage Loan as of the maturity date. Any exercise of the purchase option that does not result in the repayment of the 777 East Eisenhower Mortgage Loan in full triggers recourse for losses incurred by the lender.
The purchase option is not extinguished by foreclosure; however, the purchase option does not apply to foreclosure or deed in lieu thereof, or to any subsequent transfer of the 777 East Eisenhower Property by the lender or its nominee. Pursuant to the subordination, non-disturbance and attornment agreement, in the event of a foreclosure, the minimum purchase price is set at the outstanding principal balance of and accrued and unpaid non-default interest on the 777 East Eisenhower Mortgage Loan.
Terrorism Insurance.The 777 East Eisenhower Mortgage Loan documents require that the “all risk” insurance policy required to be maintained by the 777 East Eisenhower Borrower provides coverage for terrorism in an amount equal to the full replacement cost of the 777 East Eisenhower Property, as well as business interruption insurance covering no less than the 18-month period following the occurrence of a casualty event, together with a 6-month extended period of indemnity.
THE INFORMATION IN THIS STRUCTURAL AND COLLATERAL TERM SHEET IS NOT COMPLETE AND MAY BE AMENDED PRIOR TO THE TIME OF SALE. THIS TERM SHEET IS NOT AN OFFER TO SELL THESE SECURITIES AND IT IS NOT A SOLICITATION OF AN OFFER TO BUY THESE SECURITIES IN ANY JURISDICTION WHERE THE OFFER OR SALE IS NOT PERMITTED.
68
(THIS PAGE INTENTIONALLY LEFT BLANK)
THE INFORMATION IN THIS STRUCTURAL AND COLLATERAL TERM SHEET IS NOT COMPLETE AND MAY BE AMENDED PRIOR TO THE TIME OF SALE. THIS TERM SHEET IS NOT AN OFFER TO SELL THESE SECURITIES AND IT IS NOT A SOLICITATION OF AN OFFER TO BUY THESE SECURITIES IN ANY JURISDICTION WHERE THE OFFER OR SALE IS NOT PERMITTED.
69
| Office – Suburban | Loan #5 | Cut-off Date Balance: | | $37,900,000 |
| 1000 Chesterbrook Boulevard | 1000 Chesterbrook | Cut-off Date LTV: | | 66.4% |
| Berwyn, PA 19312 | | U/W NCF DSCR: | | 2.09x |
| | | U/W NOI Debt Yield: | | 9.2% |
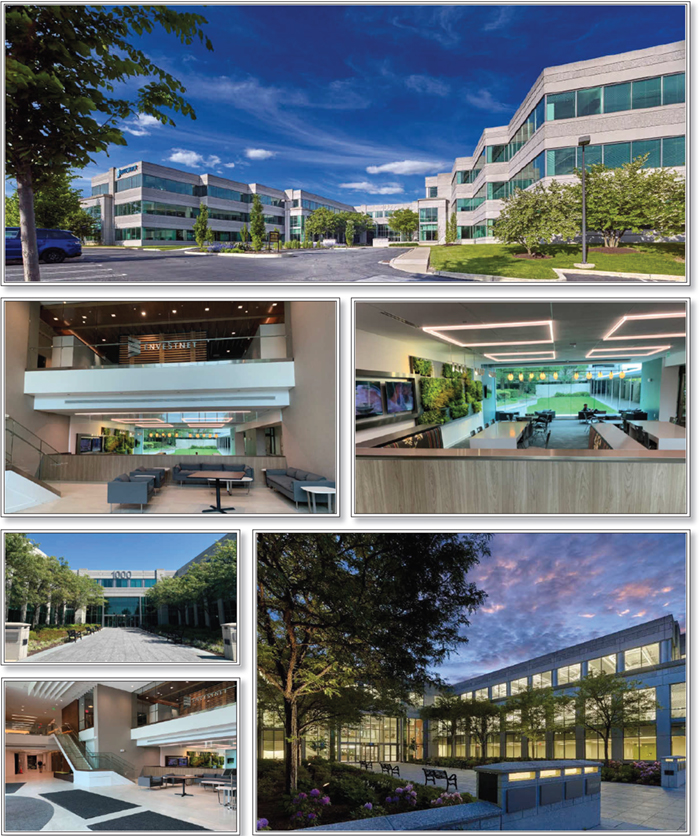
THE INFORMATION IN THIS STRUCTURAL AND COLLATERAL TERM SHEET IS NOT COMPLETE AND MAY BE AMENDED PRIOR TO THE TIME OF SALE. THIS TERM SHEET IS NOT AN OFFER TO SELL THESE SECURITIES AND IT IS NOT A SOLICITATION OF AN OFFER TO BUY THESE SECURITIES IN ANY JURISDICTION WHERE THE OFFER OR SALE IS NOT PERMITTED.
70
| Office – Suburban | Loan #5 | Cut-off Date Balance: | | $37,900,000 |
| 1000 Chesterbrook Boulevard | 1000 Chesterbrook | Cut-off Date LTV: | | 66.4% |
| Berwyn, PA 19312 | | U/W NCF DSCR: | | 2.09x |
| | | U/W NOI Debt Yield: | | 9.2% |

THE INFORMATION IN THIS STRUCTURAL AND COLLATERAL TERM SHEET IS NOT COMPLETE AND MAY BE AMENDED PRIOR TO THE TIME OF SALE. THIS TERM SHEET IS NOT AN OFFER TO SELL THESE SECURITIES AND IT IS NOT A SOLICITATION OF AN OFFER TO BUY THESE SECURITIES IN ANY JURISDICTION WHERE THE OFFER OR SALE IS NOT PERMITTED.
71
| No. 5 – 1000 Chesterbrook |
| |
| Mortgage Loan Information | | Mortgaged Property Information |
| Mortgage Loan Seller: | Ladder Capital Finance LLC | | Single Asset/Portfolio: | Single Asset |
Credit Assessment (DBRS/Fitch/Moody’s): | NR/NR/NR | | Property Type – Subtype: | Office – Suburban |
| Original Principal Balance: | $37,900,000 | | Location: | Berwyn, PA |
| Cut-off Date Balance: | $37,900,000 | | Size: | 172,421 SF |
| % of Initial Pool Balance: | 5.4% | | Cut-off Date Balance Per SF: | $219.81 |
| Loan Purpose: | Acquisition | | Maturity Date Balance Per SF: | $219.81 |
| Borrower Sponsors: | Mark I. Solomon, Harry Kammerer | | Year Built/Renovated: | 2000/2019 |
| Guarantor: | Mark I. Solomon | | Title Vesting: | Fee |
| Mortgage Rate: | 4.1400% | | Property Manager: | G&E Real Estate Management Services, Inc. |
| Note Date: | September 23, 2019 | | Current Occupancy (As of)(2): | 100.0% (9/4/2019) |
| Seasoning: | 1 month | | YE 2018 Occupancy(2): | 100.0% |
| Maturity Date: | October 6, 2029 | | YE 2017 Occupancy(2): | 98.5% |
| IO Period: | 120 months | | 7/31/2016 Occupancy(2): | 92.0% |
| Loan Term (Original): | 120 months | | YE 2015 Occupancy(2): | NAP |
| Amortization Term (Original): | NAP | | Appraised Value: | $57,100,000 |
| Loan Amortization Type: | Interest-only, Balloon | | Appraised Value Per SF: | $331.17 |
| Call Protection: | L(25),D(92),O(3) | | Appraisal Valuation Date: | July 23, 2019 |
| Lockbox Type: | Hard/Upfront Cash Management | | Underwriting and Financial Information |
| Additional Debt: | No | | TTM NOI (6/30/2019)(3): | $2,763,782 |
| Additional Debt Type (Balance): | NAP | | YE 2018 NOI(3): | $2,009,227 |
| | | | YE 2017 NOI(3): | NAV |
| | | | YE 2016 NOI(3): | NAV |
| | | | U/W Revenues: | $5,418,929 |
| | | | U/W Expenses: | $1,929,446 |
| Escrows and Reserves(1) | | U/W NOI(3): | $3,489,483 |
| | Initial | Monthly | Cap | | U/W NCF(3): | $3,334,304 |
| Taxes | $31,760 | $31,760 | NAP | | U/W DSCR based on NOI/NCF: | 2.19x / 2.09x |
| Insurance | $0 | $6,337 | NAP | | U/W Debt Yield based on NOI/NCF: | 9.2% / 8.8% |
| Replacement Reserve | $140,350 | $2,874 | NAP | | U/W Debt Yield at Maturity based on NOI/NCF: | 9.2% / 8.8% |
| TI/LC Reserve | $1,474,543 | $10,058 | NAP | | Cut-off Date LTV Ratio: | 66.4% |
| Free Rent Reserve | $394,423 | $0 | NAP | | LTV Ratio at Maturity: | 66.4% |
| Envestnet Refurbishment Allowance | $109,650 | $0 | NAP | | | |
| | | | | | | |
| | | | | | | |
| | | | | | | | |
| Sources and Uses |
| Sources | | | | | Uses | | | |
| Original loan amount | $37,900,000 | | 65.0% | | Purchase price | $56,000,000 | | 96.1% |
| Borrower equity | 20,393,076 | | 35.0 | | Purchase credits(4) | (1,113,001) | | (1.9) |
| | | | | | Upfront reserves | 2,150,726 | | 3.7 |
| | | | | | Closing costs | 1,255,352 | | 2.2 |
| Total Sources | $58,293,076 | | 100.0% | | Total Uses | $58,293,076 | | 100.0% |
| (1) | See “Escrows” section below for a full description of the escrows and reserves. |
| (2) | See “Historical Occupancy” table below for a discussion of historical occupancy increases. The increase in occupancy from 2016 to 2018 can be attributed to Envestnet signing leases totaling 118,455 square feet or 82.7% of NRA. |
| (3) | See “Operating History and Underwritten Net Cash Flow” section below for a discussion of historical NOI increases and increase of U/W NOI. Historical NOI for 1000 Chesterbrook Property (as defined below) is unavailable for 2017 and 2016 because the borrower sponsors were unable to obtain historical financials prior to 2018 at acquisition. |
| (4) | Purchase credits include TI/LC costs and remaining free rent, all of which was reserved by the lender. |
The Mortgage Loan. The mortgage loan (the “1000 Chesterbrook Mortgage Loan”) is evidenced by a single promissory note secured by a first mortgage encumbering the borrower’s fee interest in a 172,421 square foot office building located in Berwyn, Pennsylvania (the “1000 Chesterbrook Property”).
The Borrower and Borrower Sponsors.The borrower is Chesterbrook 1000 Partners LP, a Pennsylvania limited partnership and single purpose entity. The borrower’s managing member has two independent directors. Legal counsel to the borrower delivered a
THE INFORMATION IN THIS STRUCTURAL AND COLLATERAL TERM SHEET IS NOT COMPLETE AND MAY BE AMENDED PRIOR TO THE TIME OF SALE. THIS TERM SHEET IS NOT AN OFFER TO SELL THESE SECURITIES AND IT IS NOT A SOLICITATION OF AN OFFER TO BUY THESE SECURITIES IN ANY JURISDICTION WHERE THE OFFER OR SALE IS NOT PERMITTED.
72
| Office – Suburban | Loan #5 | Cut-off Date Balance: | | $37,900,000 |
| 1000 Chesterbrook Boulevard | 1000 Chesterbrook | Cut-off Date LTV: | | 66.4% |
| Berwyn, PA 19312 | | U/W NCF DSCR: | | 2.09x |
| | | U/W NOI Debt Yield: | | 9.2% |
non-consolidation opinion in connection with the origination of the 1000 Chesterbrook Mortgage Loan. The non-recourse carve-out guarantor of the 1000 Chesterbrook Mortgage Loan is Mark I. Solomon.
The borrower sponsors are Mark I. Solomon and Harry Kammerer, who primarily invest in real estate located in the northern Philadelphia suburbs, each with over forty years of experience. Since 2014, Mr. Solomon and Mr. Kammerer have partnered together as principals to form four real estate limited partnerships each of which acquired a Class A office project located in suburban Philadelphia.
Mr. Solomon founded CMS Companies (“CMS”) in 1969 and served in various senior officer capacities since 1969, including Chairman from 1985 to 2010. CMS is a financial services firm located in Wynnewood, Pennsylvania, just outside Philadelphia, and was engaged in the business of investing in real estate, private equity and special situations on behalf of the partners of the firm and the firm’s clients from 1981 until 2011. Mr. Solomon has served or is currently serving on a number of corporate and philanthropic boards, including Vishay Intertechnology, a New York Stock Exchange company, and the Marcus Family Foundation, which was created by the co-founder of Home Depot, Bernie Marcus; AIPAC; ESF Dream Camp; American Friends of Yemin Orde; advisory board of the Salvation Army; and board of trustees of the Jewish Federation of Greater Philadelphia. Mr. Kammerer served as the Chief Financial Officer of CMS from 1980 to 2000. During his tenure with CMS, he also managed several real estate projects, including a shopping center management company, condominium construction projects and the CMS office building. The CMS office building was purchased in 1981, and Mr. Kammerer was responsible for overseeing substantial building renovations and managing the building. After leaving CMS in 2000, Mr. Kammerer developed town homes in the Manayunk and West Mount Airy areas of Philadelphia, Pennsylvania. He currently manages four commercial office buildings, containing an aggregate of 622,500 square feet, in King of Prussia and Horsham, Pennsylvania and Mount Laurel, New Jersey. One of the related borrower sponsors was disciplined in early 2018 for a FINRA violation from 2014 related to notifying his firm about private placement activity. See“Description of the Mortgage Pool— Litigation and Other Considerations”in the Preliminary Prospectus.
The Property.The 1000 Chesterbrook Property is a three-story, Class A suburban office building totaling 172,421 square feet located in Berwyn, Pennsylvania, approximately 17.3 miles northwest of downtown Philadelphia. Built in 2000 and renovated in 2019, the 1000 Chesterbrook Property has undergone approximately $2.0 million in capital improvements since 2016 including lobby, common area, fitness center and landscaping upgrades. Amenities at the 1000 Chesterbrook Property include a fitness center, café, lobby lounge, structured parking garage, food service café and access to the adjacent Chester Valley Trail, which is described further in “The Market Overview and Competition” section below. The 1000 Chesterbrook Property features a three-level structured parking garage and surface lot, totaling 774 parking spaces, resulting in a parking ratio of 4.3 spaces per 1,000 square feet. As of September 4, 2019, the 1000 Chesterbrook Property was 100.0% leased.
Major Tenants.
Largest Tenant: Envestnet (145,146 square feet; 84.2% of net rentable area; 85.9% of underwritten base rent; 12/31/2032 lease expiration) –Envestnet (NYSE:ENV) is a leading provider of intelligent systems for wealth management and financial wellness. Envestnet provides asset-based, subscription-based and professional services on a business-to-business-to-consumer basis to financial services clients, whereby customers offer solutions based on Envestnet’s platform to their end users. Envestnet has more than 99,000 advisors and more than 4,100 companies that are clients of the firm including 17 of the 20 largest U.S. banks, 43 of the 50 largest wealth management and brokerage firms, over 500 of the largest Registered Independent Advisors and hundreds of internet services companies. Services provided to advisors include: financial planning, risk assessment tools, investment strategies and solutions, asset allocation models and various other software solutions to financial planning and wealth management. Envestnet initially leased 26,691 square feet of space in January 2016. Since then, Envestnet has expanded their space into over 145,000 square feet through four lease amendments with a co-terminous lease expiration of December 31, 2032 with two, seven-year renewal options. 1000 Chesterbrook is located in close proximity to clients including Vanguard (2.4 miles), Northwestern Mutual (4.2 miles), Cetera Advisors (4.9 miles), RW Bair (10.0 miles).
2ndLargest Tenant: Trinseo LLC (24,110 square feet; 14.0% of net rentable area; 14.1% of underwritten base rent; 8/31/2021 lease expiration) –Trinseo LLC is a global materials company, which focuses on the manufacture of plastics, latex, and synthetic rubber. Trinseo LLC employs approximately 2,500 employees and produced $4.6 billion in revenue in 2018. Trinseo LLC has 16 manufacturing sites and 11 research and development facilities. Trinseo LLC has been at the 1000 Chesterbrook Property since 2011 with a current lease expiration in August 2021 with one, five-year renewal option.
THE INFORMATION IN THIS STRUCTURAL AND COLLATERAL TERM SHEET IS NOT COMPLETE AND MAY BE AMENDED PRIOR TO THE TIME OF SALE. THIS TERM SHEET IS NOT AN OFFER TO SELL THESE SECURITIES AND IT IS NOT A SOLICITATION OF AN OFFER TO BUY THESE SECURITIES IN ANY JURISDICTION WHERE THE OFFER OR SALE IS NOT PERMITTED.
73
| Office – Suburban | Loan #5 | Cut-off Date Balance: | | $37,900,000 |
| 1000 Chesterbrook Boulevard | 1000 Chesterbrook | Cut-off Date LTV: | | 66.4% |
| Berwyn, PA 19312 | | U/W NCF DSCR: | | 2.09x |
| | | U/W NOI Debt Yield: | | 9.2% |
The following table presents certain information relating to the tenancy at the 1000 Chesterbrook Property:
Major Tenants
| Tenant Name | Credit Rating
(Fitch/
Moody’s/
S&P) | Tenant
NRSF | % of
NRSF | Annual
U/W Base
Rent
PSF(1)(5) | Annual
U/W Base
Rent(1) | % of Total Annual U/W Base Rent | Lease
Expiration
Date | Extension Options | Termination
Option (Y/N) |
| Major Tenants | | | | | | | | |
| Envestnet(2)(3)(4)(5) | NR/NR/NR | 145,146 | 84.2% | $31.46 | $4,566,099 | 85.9% | 12/31/2032 | 2, 7-year | Y |
| Trinseo LLC | NR/NR/NR | 24,110 | 14.0% | $31.00 | $747,410 | 14.1% | 8/31/2021 | 1, 5-year | N |
| Total Major Tenants | 169,256 | 98.2% | $31.39 | $5,313,510 | 100.0% | | | |
| | | | | | | | | |
| Amenities(6) | 3,165 | 1.8% | $0.00 | $0.00 | 0.0% | | | |
| | | | | | | | | |
| Occupied Collateral | 172,421 | 100.0% | $31.39 | $5,313,510 | 100.0% | | | |
| | | | | | | | | |
| Vacant Space | 0 | 0.0% | | | | | | |
| | | | | | | | | |
| Collateral Total | 172,421 | 100.0% | | | | | | |
| | | | | | | | | | |
| (1) | Annual U/W Base Rent PSF and Annual U/W Base Rent include contractual rent steps through April 2020 totaling $29,590. |
| (2) | Envestnet has a one-time option to terminate its lease as of December 31, 2029 with fifteen months’ prior written notice and payment of a termination fee of $1,094,098. |
| (3) | As of September 4, 2019, the 1000 Chesterbrook Property’s NRA was 75% occupied by Envestnet and with the next year, Envestnet will be expanding into additional space for a total of 145,146 square feet, which equates to 84.2% of NRA. The last space of the expansion is scheduled to be delivered to Envestnet by February 1, 2020. |
| (4) | Wells Fargo occupies 15,897 square feet (9.2% of net rentable area) in Suites 101, 102, and 103 at the 1000 Chesterbrook Property, which Envestnet will be taking over upon Wells Fargo’s lease expiration in January 31, 2020. The rent for this space is underwritten to Envestnet’s lease terms. |
| (5) | Envestnet subleases 5,434 square feet (3.2% of the net rentable area) on the ground floor to Trinseo LLC at an annual rent of $30.00/SF which terminates in August 31, 2021. |
| (6) | Amenities include a fitness center (2,715 square feet) and a café (450 square feet), which are leased on a month-to-month basis with no underwritten rent attributed to the respective spaces. Annual U/W Base Rent PSF does not include Amenities. |
The following table presents certain information relating to the lease rollover schedule at the 1000 Chesterbrook Property:
Lease Expiration Schedule(1)(2)
Year Ending
December 31, | No. of
Leases
Expiring | Expiring
NRSF | % of
Total
NRSF | Cumulative
Expiring
NRSF | Cumulative
% of Total
NRSF | Annual
U/W
Base Rent(2) | % of Total Annual U/W Base Rent | Annual
U/W
Base Rent
PSF(3) |
| MTM | 0 | 0 | 0.0% | 0 | 0.0% | $0 | 0.0% | $0.00 |
| 2019 | 0 | 0 | 0.0% | 0 | 0.0% | $0 | 0.0% | $0.00 |
| 2020 | 0 | 0 | 0.0% | 0 | 0.0% | $0 | 0.0% | $0.00 |
| 2021 | 1 | 24,110 | 14.0% | 24,110 | 14.0% | $747,410 | 14.1% | $31.00 |
| 2022 | 0 | 0 | 0.0% | 24,110 | 14.0% | $0 | 0.0% | $0.00 |
| 2023 | 0 | 0 | 0.0% | 24,110 | 14.0% | $0 | 0.0% | $0.00 |
| 2024 | 0 | 0 | 0.0% | 24,110 | 14.0% | $0 | 0.0% | $0.00 |
| 2025 | 0 | 0 | 0.0% | 24,110 | 14.0% | $0 | 0.0% | $0.00 |
| 2026 | 0 | 0 | 0.0% | 24,110 | 14.0% | $0 | 0.0% | $0.00 |
| 2027 | 0 | 0 | 0.0% | 24,110 | 14.0% | $0 | 0.0% | $0.00 |
| 2028 | 0 | 0 | 0.0% | 24,110 | 14.0% | $0 | 0.0% | $0.00 |
| 2029 | 0 | 0 | 0.0% | 24,110 | 14.0% | $0 | 0.0% | $0.00 |
| Thereafter | 1 | 145,146 | 84.2% | 169,256 | 98.2% | $4,566,099 | 85.9% | $31.46 |
| Amenities(4) | 0 | 3,165 | 1.8% | 172,421 | 100.0% | $0 | 0.0% | $0.00 |
| Total/Weighted Average | 2 | 172,421 | 100.0% | | | $5,313,510 | 100.0% | $31.39 |
| (1) | Information obtained from the underwritten rent roll. |
| (2) | Certain tenants may have lease termination options that are exercisable prior to the originally stated expiration date of the subject lease and that are not considered in the Lease Expiration Schedule. |
| (3) | Annual U/W Base Rent PSF does not include 3,165 square feet of amenities that is occupied by a café and a fitness center. |
| (4) | Amenities include a fitness center (2,715 square feet) and a café (450 square feet), which are leased on a month-to-month basis with no underwritten rent attributed to the respective spaces. Annual U/W Base Rent PSF does not include Amenities. |
THE INFORMATION IN THIS STRUCTURAL AND COLLATERAL TERM SHEET IS NOT COMPLETE AND MAY BE AMENDED PRIOR TO THE TIME OF SALE. THIS TERM SHEET IS NOT AN OFFER TO SELL THESE SECURITIES AND IT IS NOT A SOLICITATION OF AN OFFER TO BUY THESE SECURITIES IN ANY JURISDICTION WHERE THE OFFER OR SALE IS NOT PERMITTED.
74
| Office – Suburban | Loan #5 | Cut-off Date Balance: | | $37,900,000 |
| 1000 Chesterbrook Boulevard | 1000 Chesterbrook | Cut-off Date LTV: | | 66.4% |
| Berwyn, PA 19312 | | U/W NCF DSCR: | | 2.09x |
| | | U/W NOI Debt Yield: | | 9.2% |
The following table presents historical occupancy percentages at the 1000 Chesterbrook Property:
Historical Occupancy
12/31/2015(1) | 7/31/2016(2)(3) | 12/31/2017(2)(3) | 12/31/2018(2)(3) | 9/4/2019(4) |
| NAV | 92.0% | 98.5% | 100.0% | 100.0% |
| (1) | The 1000 Chesterbrook Property was acquired by the seller in 2016 and the borrower sponsors do not have a rent roll for prior years. |
| (2) | Information obtained from borrower rent roll. |
| (3) | The increase in occupancy from 2016 to 2018 can be attributed to Envestnet signing leases totaling 118,455 square feet or 82.7% of NRA. |
| (4) | Information obtained from the underwritten rent roll. |
Operating History and Underwritten Net Cash Flow. The following table presents certain information relating to the historical operating performance and underwritten net cash flow at the 1000 Chesterbrook Property:
Cash Flow Analysis(1)
| | 2018(2) | TTM 6/30/2019(2)(3) | U/W(3) | %(4) | U/W $ per
SF |
| Base Rent | $3,371,681 | $4,229,702 | $5,283,919 | 90.7% | $30.65 |
| Contractual Rent Steps | 0 | 0 | 29,590 | 0.5 | 0.17 |
| Grossed Up Vacant Space | 0 | 0 | 0 | 0.0 | 0.00 |
| Gross Potential Rent | $3,371,681 | $4,229,702 | $5,313,510 | 91.2% | $30.82 |
| Other Income | 39,915 | 42,539 | 42,539 | 0.7 | 0.25 |
| Total Recoveries | 556,572 | 367,772 | 467,555 | 8.0 | 2.71 |
| Net Rental Income | $3,968,168 | $4,640,013 | $5,823,604 | 100.0% | $33.78 |
| (Vacancy & Credit Loss)(4) | 0 | 0 | (404,675) | (7.6) | (2.35) |
| Effective Gross Income | $3,968,168 | $4,640,013 | $5,418,929 | 93.1% | $31.43 |
| | | | | | |
| Real Estate Taxes | 475,452 | 478,840 | 486,878 | 9.0% | 2.82 |
| Insurance | 38,302 | 38,948 | 76,044 | 1.4% | 0.44 |
| Management Fee | 124,017 | 154,486 | 162,568 | 3.0% | 0.94 |
| Other Operating Expenses | 1,321,170 | 1,203,956 | 1,203,956 | 22.2% | 6.98 |
| Total Operating Expenses | $1,958,941 | $1,876,231 | $1,929,446 | 35.6% | $11.19 |
| | | | | | |
| Net Operating Income | $2,009,227 | $2,763,782 | $3,489,483 | 64.4% | $20.24 |
| Replacement Reserves | 0 | 0 | 34,484 | 0.6% | 0.20 |
| TI/LC | 0 | 0 | 120,695 | 2.2% | 0.70 |
| Net Cash Flow | $2,009,227 | $2,763,782 | $3,334,304 | 61.5% | $19.34 |
| | | | | | |
| NOI DSCR | 1.26x | 1.73x | 2.19x | | |
| NCF DSCR | 1.26x | 1.73x | 2.09x | | |
| NOI Debt Yield | 5.3% | 7.3% | 9.2% | | |
| NCF Debt Yield | 5.3% | 7.3% | 8.8% | | |
| (1) | The historical financials for 2017 and 2016 are unavailable as the borrower sponsors were unable to obtain financials prior to 2018 at acquisition. |
| (2) | The increase in Net Operating Income from 2018 to TTM 6/30/2019 is primarily attributed to the rent commencement of Envestnet for Suites 105 and 301 which occurred in October and July 2018, respectively. |
| (3) | The increase in Net Operating Income from TTM 6/30/2019 to U/W is primarily attributed to the rent commencement of Envestnet for Suite 302, which occurred in July 2019. In addition, U/W includes the $36.00/SF of contractual rents for Envestnet for Suites 101, 102 and 103. Suites 101, 102 and 103 are currently occupied by Wells Fargo, which is paying $31.50/SF. There is also an increase in contractual reimbursements due to increase over 2018 base year set for Envestnet for Suites 105 and 301. |
| (3) | Represents (i) percent of Net Rental Income for all revenue fields, (ii) percent of Gross Potential Rent for Vacancy & Credit Loss and (iii) percent of Effective Gross Income for all other fields. |
| (4) | The underwritten economic vacancy is 7.0%. The 1000 Chesterbrook Property was 100.0% leased as of September 4, 2019. |
Appraisal.The appraiser concluded to an “as-is” appraised value of $57,100,000 as of July 23, 2019.
Environmental Matters. According to the Phase I environmental site assessment dated August 7, 2019, there was no evidence of any recognized environmental conditions at the 1000 Chesterbrook Property.
Market Overview and Competition.The 1000 Chesterbrook Property is located in Berwyn, Pennsylvania in Chester County. The 1000 Chesterbrook Property is located 17.3 miles northwest of Philadelphia. The 1000 Chesterbrook Property is located along Route
THE INFORMATION IN THIS STRUCTURAL AND COLLATERAL TERM SHEET IS NOT COMPLETE AND MAY BE AMENDED PRIOR TO THE TIME OF SALE. THIS TERM SHEET IS NOT AN OFFER TO SELL THESE SECURITIES AND IT IS NOT A SOLICITATION OF AN OFFER TO BUY THESE SECURITIES IN ANY JURISDICTION WHERE THE OFFER OR SALE IS NOT PERMITTED.
75
| Office – Suburban | Loan #5 | Cut-off Date Balance: | | $37,900,000 |
| 1000 Chesterbrook Boulevard | 1000 Chesterbrook | Cut-off Date LTV: | | 66.4% |
| Berwyn, PA 19312 | | U/W NCF DSCR: | | 2.09x |
| | | U/W NOI Debt Yield: | | 9.2% |
202 and is 3.7 miles from Interstate 76 which is the primary east/west interstate highway serving the Philadelphia region. The 1000 Chesterbrook Property is located 16.8 miles from the Philadelphia International Airport and adjacent to the Chester Valley Trail. The Chester Valley Trail is a multi-use, rail-to-trail facility that roughly follows U.S. Routes 30 and 202 through central Chester County from West Whiteland Township east into Montgomery County. The 1000 Chesterbrook Property is located approximately 2.4 miles north of The Vanguard Group, Inc. (“Vanguard”) headquarters, and in 2017 Vanguard continued their investment in Chester County by building a new 240,000 square foot, four-story office building employing an additional 1,600 people. Over 12,000 of Vanguard’s 17,000 employees work in Chester County. The suburban Philadelphia submarket has a vacancy as of second quarter 2019 of 9.30%.
The 1000 Chesterbrook Property is located in the Tredyffrin Township, which is part of the King of Prussia/Wayne submarket. According to the appraisal, the 2018 population within a one-, three-, and five- mile radius was 6,419, 39,459, 104,421, respectively, and average household income within the same radii was $160,868, $171,621, $164,082, respectively. The appraisal concluded a market rent of $34.00 per square foot which is approximately 8.3% above the weighted average in place rent of $31.39 per square foot.
The following table presents certain information relating to the appraiser’s market rent conclusions for the 1000 Chesterbrook Property:
Market Rent Summary(1)
| | |
| Market Rent (PSF) | $34.00 |
| Lease Term (Years) | 7 |
| Lease Type (Reimbursements) | BY + utilities |
| Rent Increase Projection | 2.3%per annum |
| (1) | Information obtained from the appraisal. |
The table below presents certain information relating to comparable sales pertaining to the 1000 Chesterbrook Property identified by the appraiser:
Comparable Sales(1)
| Property Name | Location | Rentable
Area (SF) | Sale Date | Sale Price | Sale Price
(PSF)(2) |
| Eight Tower Bridge | Conshohocken, PA | 346,659 | Oct-18 | $108,000,000 | $311.55 |
| Five Tower Bridge | West Conshohocken, PA | 222,058 | Sep-18 | $75,650,000 | $340.68 |
| 2301 Renaissance | King of Prussia, PA | 189,502 | Dec-17 | $51,177,719 | $270.06 |
| 300 Four Falls | Conshohocken, PA | 298,482 | Jan-16 | $98,400,000 | $329.67 |
| (1) | Information obtained from the appraisal. |
The following table presents certain information relating to comparable properties to 1000 Chesterbrook Property:
Comparable Leases(1)
| Property Name/Location | Year
Built/
Renovated | Total
GLA
(SF) | Distance from Subject | Occupancy | Lease
Term | Tenant Size (SF) | Annual Base Rent PSF | Lease Type |
Valley Forge Office Center 656 East Swedesford Road Wayne, PA | 1972/2008 | 55,686 | 3.0 miles | NAV | 7.5 Yrs | 4,931 | $31.75 | Modified Gross |
CrossPoint at Valley Forge 550 East Swedesford Road Wayne, PA | 1974/2014 | 272,360 | 2.8 miles | NAV | 7.1 Yrs | 10,250 | $35.00 | Full Service |
CrossPoint at Valley Forge 550 East Swedesford Road Wayne, PA | 1974/2014 | 272,360 | 2.8 miles | NAV | 5.3 Yrs | 2,404 | $36.50 | Full Service |
1055 Westlakes Drive 1055 Westlakes Drive Berwyn, PA | 1990/2015 | 118,425 | 0.4 miles | NAV | 7.3 Yrs | 6,510 | $28.50 | Full Service |
565 East Swedesford Road 565 East Swedesford Road Wayne, PA | 1986/2017 | 56,914 | 2.9 miles | NAV | 5.3 Yrs | 1,771 | $32.00 | Full Service |
| (1) | Information obtained from appraisal. |
THE INFORMATION IN THIS STRUCTURAL AND COLLATERAL TERM SHEET IS NOT COMPLETE AND MAY BE AMENDED PRIOR TO THE TIME OF SALE. THIS TERM SHEET IS NOT AN OFFER TO SELL THESE SECURITIES AND IT IS NOT A SOLICITATION OF AN OFFER TO BUY THESE SECURITIES IN ANY JURISDICTION WHERE THE OFFER OR SALE IS NOT PERMITTED.
76
| Office – Suburban | Loan #5 | Cut-off Date Balance: | | $37,900,000 |
| 1000 Chesterbrook Boulevard | 1000 Chesterbrook | Cut-off Date LTV: | | 66.4% |
| Berwyn, PA 19312 | | U/W NCF DSCR: | | 2.09x |
| | | U/W NOI Debt Yield: | | 9.2% |
Escrows.
Real Estate Taxes – At origination, the borrower was required to escrow $31,760 for real estate taxes. The borrower is required to make monthly payments of one-twelfth of the taxes payable during the next twelve months, currently equal to $31,760.
Insurance – The borrower is required to make monthly payments of one-twelfth of the insurance premiums payable during the next twelve months, currently equal to $6,337.
Replacement Reserve – At origination, the borrower was required to escrow $140,350. The borrower is required to make monthly payments of $2,874 into the replacement reserve account.
TI/LC Reserve –At origination, the borrower was required to deposit an upfront TI/LC reserve of $1,474,543. The borrower is required to make ongoing monthly payments of $10,058 into the TI/LC reserve account. $611,542 is being reserved for the build out of Suites 101, 102 and 103 for Envestnet, which suites are currently leased to Wells Fargo until January 31, 2020. $609,930 is associated with the build out of Suite 135 for Envestnet, which suite was previously occupied by Wells Fargo. $253,071 is being reserved for the improvement and upgrade of Suite 105, which has been occupied by Envestnet since October 2018.
Free Rent Reserve –At origination, the borrower is required to deposit $394,442 which consists of (i) $264,486 into a free rent reserve for rent abatement for Suites 101, 102 and 103 currently occupied by Wells Fargo until lease expiration in January 31, 2020, when Envestnet’s new lease will begin at a higher rent and (ii) free rent of $129,937 for Suite 135 leased to Envestnet for November and December 2019.
Envestnet Refurbishment Allowance – At origination, the borrower is required to reserve $109,650 for the borrower to pay the Envestnet a refurbishment allowance of up to $646,245 to be used for alterations, cosmetic changes, wiring and any other change or alteration the tenant may desire as permitted under the lease. The tenant may use the refurbishment allowance as early as January 1, 2025 but no later than December 31, 2026. A Trigger Period (as defined below) will commence 12 months prior to January 1, 2025, in order to reach the refurbishment allowance of $646,245.
Lockbox and Cash Management.The 1000 Chesterbrook Mortgage Loan documents require a hard lockbox with upfront cash management. At origination, the borrower was required to deliver written instructions to tenants directing them to deposit all rents payable under such leases directly into a lender-controlled lockbox account. The 1000 Chesterbrook Mortgage Loan documents require that all rents and other funds from operations received by the borrower or the property manager be deposited into the lockbox within one business day after receipt. Funds on deposit in the lockbox account are required to be swept on each business day into a lender-controlled cash management account and applied on each payment date to the payment of debt service, the funding of required reserves, and the payment of budgeted monthly operating expenses with excess sums being disbursed to the borrower. If a Trigger Period occurs, then excess cash in the deposit account will be transferred to an account held by the lender as additional collateral for the 1000 Chesterbrook Mortgage Loan.
A “Trigger Period” will commence following the occurrence of: (i) an event of default under the 1000 Chesterbrook Mortgage Loan; (ii) any event of default under the property management agreement; (iii) the date on which any Significant Tenant (as defined below) (a) vacates, surrenders or ceases to conduct its normal business operations at substantially all of its demised premises or otherwise “goes dark”, or (b) notifies the borrower, the property manager, any affiliate of the borrower or the property manager or any of their respective agents or representatives that it intends to vacate, surrender or cease to conduct its normal business operations at substantially all of its demised premises or otherwise “go dark”, or (c) becomes insolvent or a debtor in any bankruptcy action; (iv) the debt service coverage ratio for the 1000 Chesterbrook Property falling below 1.20x; (v) eighteen months prior to loan maturity; or (vi) January 1, 2024 if the Envestnet Refurbishment Allowance balance is less than $646,245.
A Trigger Period will expire (I) if the Trigger Period is caused solely by the occurrence of clause (i) in the definition of “Trigger Period”, upon the cure of such event of default, (II) if the Trigger Period is caused solely by the occurrence of clause (ii) in the definition of “Trigger Period”, upon the cure of such event of default under the property management agreement or the date on which the borrower has entered a replacement property management agreement with a qualified property manager, (III) if the Trigger Period is caused solely by the occurrence of clause (iii)(a) in the definition of “Trigger Period”, the date on which (a)(1) the applicable Significant Tenant has (A) reopened for business and conducted normal business operations at substantially all of its demised premises and (B) paid full, unabated rent under its lease, for two (2) consecutive quarters in each case, and (2) the borrower has delivered to the lender an acceptable tenant estoppel certificate from the applicable Significant Tenant certifying, among other things, the foregoing and reaffirming the lease as being in full force and effect, to the lender’s satisfaction in each case, or (b) a Re-tenanting Event (as defined below) has occurred; (IV) if the Trigger Period is caused solely by the occurrence of clause (iii)(b) in the definition of “Trigger Period”, the date on which (a) the applicable Significant Tenant has (1) irrevocably revoked or rescinded any such notice and (2)(A) been open for business and conducted normal business operations at substantially all of its demised premises and (B) paid full, unabated rent under its lease, for two (2) consecutive quarters following such revocation or rescission in each case, and (b) the borrower has delivered to the lender an acceptable tenant estoppel certificate from the applicable Significant Tenant certifying, among other things, the foregoing and reaffirming the lease as being in full force and effect, to the lender’s satisfaction in each case, (V) if the Trigger Period is caused solely by the occurrence of clause (iii)(c) in the definition of “Trigger Period”, the date on which the applicable Significant Tenant or such Significant Tenant’s parent company, as the case may be, becomes solvent to the lender’s satisfaction for two (2) consecutive quarters or is no longer a debtor in any bankruptcy action and has affirmed its lease pursuant to a final non-appealable order of a court of competent jurisdiction, (VI) if the Trigger Period is caused solely by the occurrence of clause (iv) in the definition of “Trigger Period”, the date on which the debt service coverage ratio is at least 1.25x for two (2) consecutive quarters, (VII) if the Trigger
THE INFORMATION IN THIS STRUCTURAL AND COLLATERAL TERM SHEET IS NOT COMPLETE AND MAY BE AMENDED PRIOR TO THE TIME OF SALE. THIS TERM SHEET IS NOT AN OFFER TO SELL THESE SECURITIES AND IT IS NOT A SOLICITATION OF AN OFFER TO BUY THESE SECURITIES IN ANY JURISDICTION WHERE THE OFFER OR SALE IS NOT PERMITTED.
77
| Office – Suburban | Loan #5 | Cut-off Date Balance: | | $37,900,000 |
| 1000 Chesterbrook Boulevard | 1000 Chesterbrook | Cut-off Date LTV: | | 66.4% |
| Berwyn, PA 19312 | | U/W NCF DSCR: | | 2.09x |
| | | U/W NOI Debt Yield: | | 9.2% |
Period is caused solely by the occurrence of clause (vi) in the definition of “Trigger Period”, the date on which there is $646,245 in the Envestnet Refurbishment Allowance account.
“Significant Tenant” means Envestnet or any tenant under a lease which, either individually, or when taken together with any other lease with such tenant or its affiliates (i) covers more than 17,000 square feet at the 1000 Chesterbrook Property or (ii) constitutes more than twenty-five percent (25%) of the total annual rents.
“Re-tenanting Event” means the lender’s receipt of evidence that the borrower has entered into a new lease or new leases with a replacement tenant or tenants reasonably acceptable to the lender for the demised premises which had previously been occupied by the applicable Significant Tenant in form and substance reasonably satisfactory to the lender and otherwise in accordance with the terms of the related loan agreement, and (i) that each tenant under any such replacement lease has accepted possession and is in occupancy of, and is open for business and conducting normal business operations at, all of the space demised under the lease and is paying full, unabated rent in accordance with the lease, (ii) that the rents payable under any such replacement lease are no less than one hundred percent (100%) of the rents under the lease being replaced and are comparable to existing local market rates for similar properties and (iii) that all landlord obligations under any such replacement lease (including, without limitation, tenant improvement and leasing commission obligations) have been duly performed, completed and paid for, such evidence to include, without limitation, a fully-executed lease and an acceptable tenant estoppel certificate from each such tenant.
Property Management. The 1000 Chesterbrook Property is managed by G&E Real Estate Management Services, Inc., d/b/a Newmark Knight Frank.
Partial Release. Pursuant to the terms of the 1000 Chesterbrook Mortgage Loan documents, the borrower has the right to obtain a release of an unimproved vacant tract of land from the lien of the mortgage and the other loan documents (an “Outparcel Release”) upon satisfaction of certain conditions, including (i) no default or event of default has occurred and is continuing or will occur solely as a result of the Outparcel Release; (ii) the borrower has paid, or has arranged to be paid contemporaneously with the Outparcel Release, to the lender, an amount equal to the sum of 125% of $460,000 (which equates to $575,000) plus a yield maintenance premium; (iii) the remaining 1000 Chesterbrook Property, together with all easements appurtenant and other permitted encumbrances thereto, will not be in violation in any material respect with the terms of any lease; (iv) after giving effect to the Outparcel Release, the debt service coverage ratio for the remaining 1000 Chesterbrook Property is not less than the greater of (a) 1.45x and (b) the debt service coverage ratio in effect immediately prior to the Outparcel Release; and (v) after giving effect to the Outparcel Release, the loan-to-value ratio for the remaining 1000 Chesterbrook Property is not greater than the lesser of (a) 67% and (b) the loan-to-value ratio in effect immediately prior to the Outparcel Release.
Real Estate Substitution.Not permitted.
Subordinate and Mezzanine Indebtedness.None.
Ground Lease. None.
Terrorism Insurance.The 1000 Chesterbrook Mortgage Loan documents require that the “all risk” insurance policy required to be maintained by the borrower provides coverage for terrorism in an amount equal to the full replacement cost of the 1000 Chesterbrook Property and business interruption insurance covering actual loss sustained following the occurrence of a casualty event, together with a 12 month extended period of indemnity.
THE INFORMATION IN THIS STRUCTURAL AND COLLATERAL TERM SHEET IS NOT COMPLETE AND MAY BE AMENDED PRIOR TO THE TIME OF SALE. THIS TERM SHEET IS NOT AN OFFER TO SELL THESE SECURITIES AND IT IS NOT A SOLICITATION OF AN OFFER TO BUY THESE SECURITIES IN ANY JURISDICTION WHERE THE OFFER OR SALE IS NOT PERMITTED.
78
(THIS PAGE INTENTIONALLY LEFT BLANK)
THE INFORMATION IN THIS STRUCTURAL AND COLLATERAL TERM SHEET IS NOT COMPLETE AND MAY BE AMENDED PRIOR TO THE TIME OF SALE. THIS TERM SHEET IS NOT AN OFFER TO SELL THESE SECURITIES AND IT IS NOT A SOLICITATION OF AN OFFER TO BUY THESE SECURITIES IN ANY JURISDICTION WHERE THE OFFER OR SALE IS NOT PERMITTED.
79
| Mixed Use – Retail/Office | Loan #6 | Cut-off Date Balance: | | $32,100,000 |
| 112-118 West 125th Street | 112-118 West 125th Street | Cut-off Date LTV: | | 57.7% |
| New York, NY 10027 | | U/W NCF DSCR: | | 1.91x |
| | | U/W NOI Debt Yield: | | 7.3% |
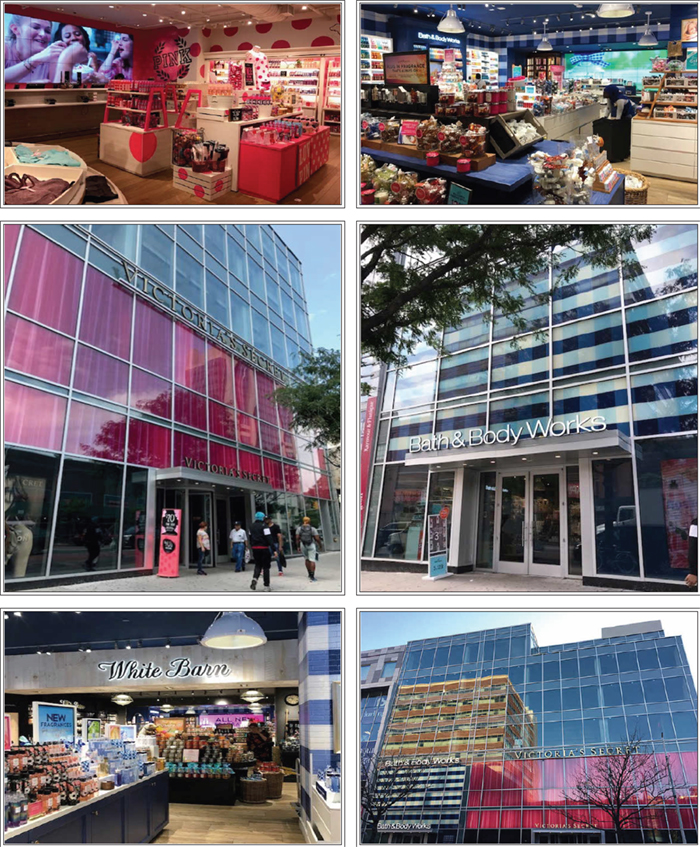
THE INFORMATION IN THIS STRUCTURAL AND COLLATERAL TERM SHEET IS NOT COMPLETE AND MAY BE AMENDED PRIOR TO THE TIME OF SALE. THIS TERM SHEET IS NOT AN OFFER TO SELL THESE SECURITIES AND IT IS NOT A SOLICITATION OF AN OFFER TO BUY THESE SECURITIES IN ANY JURISDICTION WHERE THE OFFER OR SALE IS NOT PERMITTED.
80
| Mixed Use – Retail/Office | Loan #6 | Cut-off Date Balance: | | $32,100,000 |
| 112-118 West 125th Street | 112-118 West 125th Street | Cut-off Date LTV: | | 57.7% |
| New York, NY 10027 | | U/W NCF DSCR: | | 1.91x |
| | | U/W NOI Debt Yield: | | 7.3% |
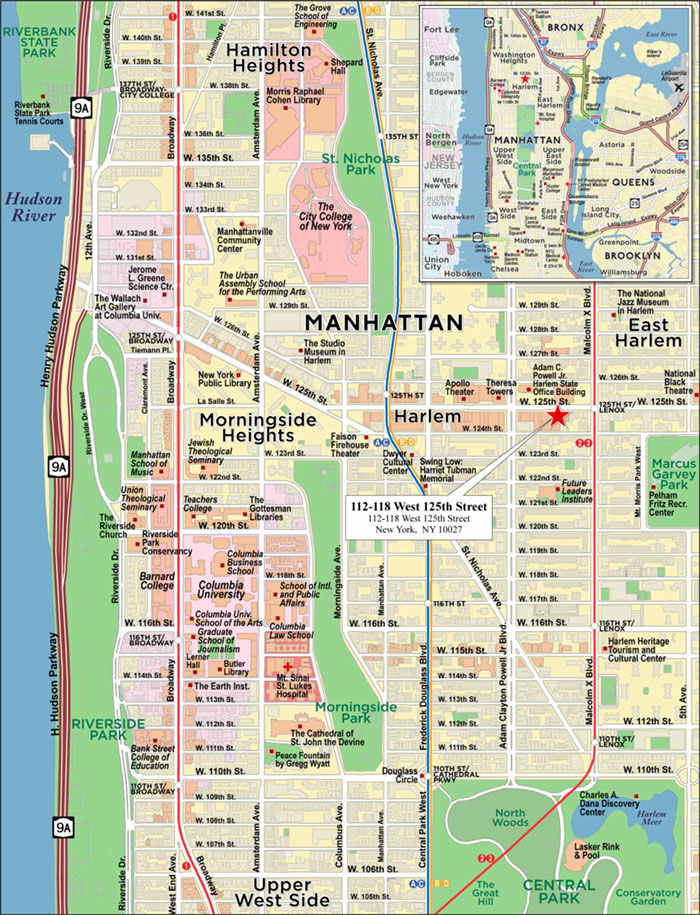
THE INFORMATION IN THIS STRUCTURAL AND COLLATERAL TERM SHEET IS NOT COMPLETE AND MAY BE AMENDED PRIOR TO THE TIME OF SALE. THIS TERM SHEET IS NOT AN OFFER TO SELL THESE SECURITIES AND IT IS NOT A SOLICITATION OF AN OFFER TO BUY THESE SECURITIES IN ANY JURISDICTION WHERE THE OFFER OR SALE IS NOT PERMITTED.
81
| No. 6 – 112-118 West 125th Street |
| |
| Mortgage Loan Information | | Mortgaged Property Information |
| Mortgage Loan Seller: | Wells Fargo Bank, National Association | | Single Asset/Portfolio: | Single Asset |
Credit Assessment (DBRS/Fitch/Moody’s): | NR/NR/NR | | Property Type – Subtype: | Mixed Use – Retail/Office |
| Original Principal Balance: | $32,100,000 | | Location: | New York, NY |
| Cut-off Date Balance: | $32,100,000 | | Size: | 32,000 SF |
| % of Initial Pool Balance: | 4.6% | | Cut-off Date Balance Per SF: | $1,003.13 |
| Loan Purpose: | Refinance | | Maturity Date Balance Per SF: | $1,003.13 |
| Borrower Sponsors: | Steven Feldman; Irving Feldman; Gary Feldman | | Year Built/Renovated: | 2018/NAP |
| Guarantors: | Steven Feldman; Irving Feldman; Gary Feldman | | Title Vesting: | Fee |
| Mortgage Rate: | 3.6360% | | Property Manager: | Salon Realty Corp. |
| Note Date: | September 27, 2019 | | Current Occupancy (As of)(2): | 56.3% (9/27/2019) |
| Seasoning: | 1 month | | YE 2018 Occupancy: | 56.3% |
| Maturity Date: | October 11, 2029 | | YE 2017 Occupancy(3): | NAP |
| IO Period: | 120 months | | YE 2016 Occupancy(3): | NAP |
| Loan Term (Original): | 120 months | | YE 2015 Occupancy(3): | NAP |
| Amortization Term (Original): | NAP | | As-Is Appraised Value: | $55,600,000 |
| Loan Amortization Type: | Interest-only, Balloon | | As-Is Appraised Value Per SF: | $1,737.50 |
| Call Protection: | L(25),D(90),O(5) | | As-Is Appraisal Valuation Date: | July 24, 2019 |
| Lockbox Type: | Hard/Springing Cash Management | | | |
| Additional Debt: | None | | Underwriting and Financial Information |
| Additional Debt Type (Balance): | NAP | | TTM NOI(3): | NAV |
| | | | YE 2018 NOI(3): | NAV |
| | | | YE 2017 NOI(3): | NAV |
| | | | YE 2016 NOI(3): | NAV |
| | | | U/W Revenues: | $3,049,405 |
| | | | U/W Expenses: | $710,603 |
| Escrows and Reserves(1) | | U/W NOI: | $2,338,802 |
| | Initial | Monthly | Cap | | U/W NCF: | $2,262,472 |
| Taxes | $104,916 | $34,972 | NAP | | U/W DSCR based on NOI/NCF: | 1.97x / 1.91x |
| Insurance | $1,934 | $967 | NAP | | U/W Debt Yield based on NOI/NCF: | 7.3% / 7.0% |
| Replacement Reserve | $0 | $534 | NAP | | U/W Debt Yield at Maturity based on NOI/NCF: | 7.3% / 7.0% |
| | | | | | Cut-off Date LTV Ratio: | 57.7% |
| | | | | | LTV Ratio at Maturity: | 57.7% |
| | | | | | | |
| | | | | | | | |
| Sources and Uses |
| Sources | | | | | Uses | | | |
| Original loan amount | $32,100,000 | | 100.0% | | Loan payoff | $27,325,871 | | 85.1% |
| | | | | | Upfront reserves | 106,850 | | 0.3 |
| | | | | | Closing costs | 1,686,233 | | 5.3 |
| | | | | | Return of equity | 2,981,046 | | 9.3 |
| Total Sources | $32,100,000 | | 100.0% | | Total Uses | $32,100,000 | | 100.0% |
| (1) | See “Escrows” section below. |
| (2) | As of September 27, 2019, the 112-118 West 125th Street Property (as defined below) was 56.3% physically occupied and 83.6% economically occupied (assuming the appraiser’s market rents for vacant space; see “Market Rent Summary” below). |
| (3) | Historical occupancy and financials are unavailable as the 112-118 West 125th Street Property was constructed in 2018. |
The Mortgage Loan. The mortgage loan (the “112-118 West 125th Street Mortgage Loan”) is evidenced by a single promissory note secured by a first mortgage encumbering the fee interest in a class A, mixed use retail/office building located in New York, New York (the “112-118 West 125th Street Property”).
The Borrower and Borrower Sponsors.The borrower is Sigfeld 114 LLC (the “112-118 West 125th Street Borrower”), a Delaware limited liability company and single purpose entity with one independent director. The borrower sponsors and nonrecourse carve-out guarantors of the 112-118 West 125th Street Mortgage Loan are Steven Feldman, Irving Feldman and Gary Feldman.
Steven Feldman has been involved in commercial real estate in the greater New York metropolitan area for over 45 years as an owner, manager and investor. Along with Gary and Irving Feldman, the Feldman family has acquired, converted and sold several million square feet of office, retail, industrial, rental apartment, cooperative and condominium complexes throughout the boroughs of New York since the early 1960’s. Steven Feldman is primarily in charge of all real estate investment and management activity for the
THE INFORMATION IN THIS STRUCTURAL AND COLLATERAL TERM SHEET IS NOT COMPLETE AND MAY BE AMENDED PRIOR TO THE TIME OF SALE. THIS TERM SHEET IS NOT AN OFFER TO SELL THESE SECURITIES AND IT IS NOT A SOLICITATION OF AN OFFER TO BUY THESE SECURITIES IN ANY JURISDICTION WHERE THE OFFER OR SALE IS NOT PERMITTED.
82
| Mixed Use – Retail/Office | Loan #6 | Cut-off Date Balance: | | $32,100,000 |
| 112-118 West 125th Street | 112-118 West 125th Street | Cut-off Date LTV: | | 57.7% |
| New York, NY 10027 | | U/W NCF DSCR: | | 1.91x |
| | | U/W NOI Debt Yield: | | 7.3% |
family-owned business. The Feldman family’s current portfolio includes 10 commercial real estate assets located in Manhattan, Brooklyn, Harlem, the Bronx and Georgia.
The Property.The 112-118 West 125th Street Property is a 32,000 square foot, three-floor class A retail condominium unit within a greater, six-story mixed-use condominium building (“Mixed-Use Condo”) located on the south side of West 125th Street, between Lenox Avenue and Adam Clayton Powell Jr. Boulevard in Harlem, New York, New York. Constructed in 2018 and situated on a 0.3-acre site, the 112-118 West 125th Street Property comprises 18,000 square feet of retail space, 4,000 square feet of second floor office space and 10,000 square feet of below-grade space. Floors three through six of the Mixed-Use Condo (not part of the collateral) include office space and make up a separate condominium unit (the, “Non-Collateral Condo Unit”; see “Condominium Regime” section below). According to the appraisal, the Non-Collateral Condo Unit is expected to be utilized as the headquarters for Children’s Aid Society. As of September 27, 2019, the 112-118 West 125th Street Property was 56.3% physically occupied and 83.6% economically occupied (assuming the appraiser’s market rents for vacant space).
The 18,000 square feet of retail space at the 112-118 West 125th Street Property accounts for 56.3% of the net rentable area and 83.6% of underwritten gross potential rent (assuming the appraiser’s market rent for vacant spaces), and is fully occupied by Bath & Body Works and Victoria’s Secret. Bath & Body Works occupies 4,000 square feet of retail space on the ground level (26.9% of underwritten base rent), while Victoria’s Secret occupies 14,000 square feet within a two-story retail suite (73.1% of underwritten base rent). The 4,000 square foot second floor office suite and the 10,000 square foot below-grade space at the 112-118 West 125th Street Property are currently vacant. According to the appraisal, the second floor space of the 112-118 West 125th Street Property comprises typical office space, consistent with that found in the competitive market. The below grade space at the 112-118 West 125th Street Property features high ceilings, an open layout, and access via an elevator lobby and stairwell.
According to the appraisal, the developer of the 112-118 West 125th Street Property received a confirmation of eligibility that the 112-118 West 125th Street Property will qualify for a 25-year ICAP tax abatement (which is expected to begin in the 2019-2020 tax period). The 25-year ICAP results in an abated level of taxes and phases out over a 25-year period with 100% of the benefit realized in years 1 through 16, with the phase out occurring in 10% increments in each of the remaining years. The lender’s underwriting and appraisal included credit for the ICAP (see “Underwritten Net Cash Flow” and “Appraisal” below).
Condominium Regime.The 112-118 West 125th Street Property is part of the 117 West 124th Street Condominium, which contains two units: the 112-118 West 125th Street Property (43% of common interest) and the Non-Collateral Condo Unit (57% of common interest). The 112-118 West 125th Street Property has the right to appoint two persons to the four-person association board (representing 50% of the board vote). The 112-118 West 125th Street Borrower does not have the voting power to affirmatively control the owners’ association; however, the 112-118 West 125th Street Borrower does have the voting power to block any material association action it opposes.See “Description of the Mortgage Pool—Mortgage Pool Characteristics—Condominium Interests” in the Preliminary Prospectus.
Major Tenants.
Largest Tenant: Victoria’s Secret (14,000 square feet; 43.8% of net rentable area; 73.1% of underwritten base rent; 2/5/2033 lease expiration) – Founded in 1977 in Palo Alto, California, Victoria’s Secret is a specialty retailer of women's intimate and other apparel and fragrances. According to the appraisal, Victoria’s Secret operates 1,098 stores in the U.S., 45 in Canada, 26 in the United Kingdom and Ireland, and 52 in China. Victoria’s Secret has one, 10-year renewal option following its February 2033 lease expiration.
2ndLargest Tenant: Bath & Body Works (4,000 square feet; 12.5% of net rentable area; 26.9% of underwritten base rent; 2/5/2033 lease expiration) – Founded in 1990 in Cambridge, Massachusetts, Bath & Body Works, which sells products under the Bath & Body Works, White Barn, C.O. Bigelow and other brand names, is a specialty retailer of body care, home fragrance products, soaps and sanitizers. According to the appraisal, the company operates 1,619 Bath and Body Works stores in the U.S. and 102 stores in Canada. Bath & Body Works has one, 10-year renewal option following its February 2033 lease expiration.
L Brands (NYSE: LB; Ba1/BB by Moody’s/S&P) is the parent company of both Victoria’s Secret and Bath & Body Works. Founded in 1963 by Leslie H. Wexner in Columbus, Ohio, L Brands has evolved from an apparel-based specialty retailer to an international enterprise focused on women's intimate and other apparel, personal care, home fragrance and beauty categories. Through Victoria’s Secret, Victoria's Secret PINK and Bath & Body Works, L Brands operates nearly 3,000 company-owned specialty stores in the United States, Canada, the United Kingdom, Ireland and Greater China. L Brands had an approximately market capitalization of $5.2 billion as of September 25, 2019.
THE INFORMATION IN THIS STRUCTURAL AND COLLATERAL TERM SHEET IS NOT COMPLETE AND MAY BE AMENDED PRIOR TO THE TIME OF SALE. THIS TERM SHEET IS NOT AN OFFER TO SELL THESE SECURITIES AND IT IS NOT A SOLICITATION OF AN OFFER TO BUY THESE SECURITIES IN ANY JURISDICTION WHERE THE OFFER OR SALE IS NOT PERMITTED.
83
| Mixed Use – Retail/Office | Loan #6 | Cut-off Date Balance: | | $32,100,000 |
| 112-118 West 125th Street | 112-118 West 125th Street | Cut-off Date LTV: | | 57.7% |
| New York, NY 10027 | | U/W NCF DSCR: | | 1.91x |
| | | U/W NOI Debt Yield: | | 7.3% |
The following table presents certain information relating to the tenancy at the 112-118 West 125th Street Property:
Major Tenants
| Tenant Name | Credit Rating
(Fitch/Moody’s/
S&P)(1) | Tenant
NRSF | % of
NRSF | Annual
U/W Base
Rent PSF | Annual
U/W Base
Rent | % of Total
Annual
U/W Base
Rent | Lease
Expiration
Date | Extension Options | Termination
Option
(Y/N) |
| Victoria’s Secret(2) | NR/Ba1/BB | 14,000 | 43.8% | $135.71 | $1,900,000 | 73.1% | 2/5/2033 | 1, 10-year | N |
| Bath & Body Works | NR/Ba1/BB | 4,000 | 12.5% | $175.00 | $700,000 | 26.9% | 2/5/2033 | 1, 10-year | N |
| Occupied Collateral Total | 18,000 | 56.3% | $144.44 | $2,600,000 | 100.0% | | | |
| | | | | | | | | |
| Vacant Space | 14,000 | 43.7% | | | | | | |
| | | | | | | | | |
| Collateral Total | 32,000 | 100.0% | | | | | | |
| | | | | | | | | | |
| (1) | Credit Ratings are for the parent company, L Brands, which does not guarantee either tenant’s lease. See the “Major Tenants” section above for additional information. |
| (2) | Victoria’s Secret occupies one suite, which comprises approximately 8,500 square feet of ground level retail space and 5,500 square feet of second floor retail space. |
The following table presents certain information relating to tenant sales at the 112-118 West 125th Street Property:
Tenant Sales (PSF)
| Major Tenant Name | % of Total
Annual U/W
Base Rent | T8
Annualized
Sales PSF(1) | Occupancy Cost(1)(2) |
| Victoria’s Secret | 73.1% | $716 | 21.2% |
| Bath & Body Works | 26.9% | $1,258 | 15.6% |
| (1) | T8 Annualized Sales PSF and Occupancy Cost are for the trailing 8-month period ending June 30, 2019, annualized. |
| (2) | Occupancy Cost is based on T8 Annualized Sales, underwritten base rent and underwritten reimbursements. |
The following table presents certain information relating to the lease rollover schedule at the 112-118 West 125th Street Property:
Lease Expiration Schedule(1)
Year Ending
December 31, | No. of
Leases
Expiring | Expiring
NRSF | % of
Total
NRSF | Cumulative
Expiring
NRSF | Cumulative % of Total NRSF | Annual
U/W
Base Rent(2) | % of Total
Annual
U/W Base
Rent | Annual
U/W
Base Rent
PSF(2) |
| MTM | 0 | 0 | 0.0% | 0 | 0.0% | $0 | 0.0% | $0.00 |
| 2019 | 0 | 0 | 0.0% | 0 | 0.0% | $0 | 0.0% | $0.00 |
| 2020 | 0 | 0 | 0.0% | 0 | 0.0% | $0 | 0.0% | $0.00 |
| 2021 | 0 | 0 | 0.0% | 0 | 0.0% | $0 | 0.0% | $0.00 |
| 2022 | 0 | 0 | 0.0% | 0 | 0.0% | $0 | 0.0% | $0.00 |
| 2023 | 0 | 0 | 0.0% | 0 | 0.0% | $0 | 0.0% | $0.00 |
| 2024 | 0 | 0 | 0.0% | 0 | 0.0% | $0 | 0.0% | $0.00 |
| 2025 | 0 | 0 | 0.0% | 0 | 0.0% | $0 | 0.0% | $0.00 |
| 2026 | 0 | 0 | 0.0% | 0 | 0.0% | $0 | 0.0% | $0.00 |
| 2027 | 0 | 0 | 0.0% | 0 | 0.0% | $0 | 0.0% | $0.00 |
| 2028 | 0 | 0 | 0.0% | 0 | 0.0% | $0 | 0.0% | $0.00 |
| 2029 | 0 | 0 | 0.0% | 0 | 0.0% | $0 | 0.0% | $0.00 |
| Thereafter | 2 | 18,000 | 56.3% | 18,000 | 56.3% | $2,600,000 | 100.0% | $144.44 |
| Vacant | 0 | 14,000 | 43.8% | 32,000 | 100.0% | $0 | 0.0% | $0.00 |
| Total/Weighted Average | 2 | 32,000 | 100.0% | | | $2,600,000 | 100.0% | $144.44 |
| (1) | Information obtained from the underwritten rent roll. |
| (2) | Total/Weighted Average Annual U/W Base Rent and Annual U/W Base Rent PSF exclude vacant space. |
THE INFORMATION IN THIS STRUCTURAL AND COLLATERAL TERM SHEET IS NOT COMPLETE AND MAY BE AMENDED PRIOR TO THE TIME OF SALE. THIS TERM SHEET IS NOT AN OFFER TO SELL THESE SECURITIES AND IT IS NOT A SOLICITATION OF AN OFFER TO BUY THESE SECURITIES IN ANY JURISDICTION WHERE THE OFFER OR SALE IS NOT PERMITTED.
84
| Mixed Use – Retail/Office | Loan #6 | Cut-off Date Balance: | | $32,100,000 |
| 112-118 West 125th Street | 112-118 West 125th Street | Cut-off Date LTV: | | 57.7% |
| New York, NY 10027 | | U/W NCF DSCR: | | 1.91x |
| | | U/W NOI Debt Yield: | | 7.3% |
The following table presents historical occupancy percentages at the 112-118 West 125th Street Property:
Historical Occupancy
12/31/2015(1) | 12/31/2016(1) | 12/31/2017(1) | 12/31/2018(2) | 9/27/2019(3) |
| NAP | NAP | NAP | 56.3% | 56.3% |
| (1) | Historical Occupancy is unavailable prior to 2018 as the 112-118 West 125th Street Property was completed in 2018. |
| (2) | Information obtained from the 112-118 West 125th Street Borrower. |
| (3) | Information obtained from the underwritten rent roll. The 112-118 West 125th Street Property is 83.6% economically occupied as of September 27, 2019 (assuming the appraiser’s market rents for vacant space). |
Underwritten Net Cash Flow. The following table presents certain information relating to the underwritten net cash flow at the 112-118 West 125th Street Property:
Cash Flow Analysis(1)
| | U/W | %(2) | U/W $ per
SF |
| Rents in Place | $2,600,000 | 73.0% | $81.25 |
| Contractual Rent Steps | 0 | 0.0 | 0.00 |
| Grossed Up Vacant Space | 510,000 | 14.3 | 15.94 |
| Gross Potential Rent | $3,110,000 | 87.4% | $97.19 |
| Other Income | 0 | 0.0 | 0.00 |
| Total Recoveries | 449,405 | 12.6 | 14.04 |
| Net Rental Income | $3,559,405 | 100.0% | $111.23 |
| (Vacancy & Credit Loss) | (510,000)(3) | (16.4) | (15.94) |
| Effective Gross Income | $3,049,405 | 85.7% | $95.29 |
| | | | |
| Real Estate Taxes(4) | 592,626 | 19.4 | 18.52 |
| Insurance | 11,053 | 0.4 | 0.35 |
| Management Fee | 91,482 | 3.0 | 2.86 |
| Other Operating Expenses | 15,442 | 0.5 | 0.48 |
| Total Operating Expenses | $710,603 | 23.3% | $22.21 |
| | | | |
| Net Operating Income | $2,338,802 | 76.7% | $73.09 |
| Replacement Reserves | 6,400 | 0.2 | 0.20 |
| TI/LC | 69,930 | 2.3 | 2.19 |
| Net Cash Flow | $2,262,472 | 74.2% | $70.70 |
| | | | |
| NOI DSCR | 1.97x | | |
| NCF DSCR | 1.91x | | |
| NOI Debt Yield | 7.3% | | |
| NCF Debt Yield | 7.0% | | |
| (1) | Historical financials are unavailable as the 112-118 West 125th Street Property was constructed in 2018. |
| (2) | Represents (i) percent of Net Rental Income for all revenue fields, (ii) percent of Gross Potential Rent for Vacancy & Credit Loss and (iii) percent of Effective Gross Income for all other fields. |
| (3) | The underwritten economic vacancy is 16.4%. The 112-118 West 125th Street Property was 56.3% physically occupied and 83.6% economically occupied (assuming the appraiser’s market rents for vacant space) as of September 27, 2019. |
| (4) | Real Estate Taxes were underwritten per actual 2019/2020 taxes less the approximate estimate of the net present value of the ICAP tax abatement (see “The Property” section above for additional information) over the 10 year loan term. According to the appraisal, the 2019/2020 taxes without ICAP benefit (including BID tax) are approximately $910,882. |
Appraisal.The appraiser concluded to an “as-is” Appraised Value of $55,600,000 as of July 24, 2019. The appraiser also concluded to a Hypothetical Market Value “As Dark” of $46,600,000 as of July 24, 2019. The “as-is” and “As Dark” appraised values both include a $6.4 million credit, which represents the present value of the ICAP (see “The Property” section above).
Environmental Matters. According to a Phase I environmental site assessment dated August 2, 2019, there was no evidence of any recognized environmental conditions at the 112-118 West 125th Street Property.
THE INFORMATION IN THIS STRUCTURAL AND COLLATERAL TERM SHEET IS NOT COMPLETE AND MAY BE AMENDED PRIOR TO THE TIME OF SALE. THIS TERM SHEET IS NOT AN OFFER TO SELL THESE SECURITIES AND IT IS NOT A SOLICITATION OF AN OFFER TO BUY THESE SECURITIES IN ANY JURISDICTION WHERE THE OFFER OR SALE IS NOT PERMITTED.
85
| Mixed Use – Retail/Office | Loan #6 | Cut-off Date Balance: | | $32,100,000 |
| 112-118 West 125th Street | 112-118 West 125th Street | Cut-off Date LTV: | | 57.7% |
| New York, NY 10027 | | U/W NCF DSCR: | | 1.91x |
| | | U/W NOI Debt Yield: | | 7.3% |
Market Overview and Competition.The 112-118 West 125th Street Property is situated on the south side of 125th Street, between Lenox Avenue and Adam Clayton Powell Jr. Boulevard in Harlem, New York, New York. The 112-118 West 125th Street Property is located adjacent to the 125 Street Subway station entrance, which services the 2 and 3 lines and approximately 3 blocks southeast of the 125 Street Subway station entrance that services the A, B, C and D lines. The Harlem-125th Street Metro North Railroad station is approximately 3 blocks southeast of the 112-118 West 125th Street Property and provides access to Grand Central Station via the Hudson line. The Apollo Theater is located approximately 2 blocks northwest of the 112-118 West 125th Street Property while the northern portion of Central Park is approximately 0.8 miles southwest of the 112-118 West 125th Street Property.
According to a third party market research provider, the estimated 2019 population within a three- and five-mile radius of the 112-118 West 125th Street Property was approximately 1,285,393 and 2,795,036, respectively; and the estimated 2019 average household income within the same radii was approximately $91,151 and $90,939, respectively.
Submarket Information – According to a third-party market research report, the 112-118 West 125th Street Property is situated within the Harlem/North Manhattan retail submarket of the New York Market. As of September 24, 2019, the Harlem/North Manhattan retail submarket reported a total inventory of approximately 8.9 million square feet with a 5.5% vacancy rate and average asking rent of $67.32 per SF, triple net.
The following table presents certain information relating to the appraiser’s market rent conclusion for the 112-118 West 125th Street Property:
Market Rent Summary(1)
| | Below
Grade
Space | Victoria’s
Secret
Space | Bath &
Body
Works
Space | Office
Space |
| Market Rent (PSF) | $35.00 | $135.00 | $175.00 | $40.00 |
| Lease Term (Years) | 10 | 10 | 10 | 5 |
| Lease Type (Reimbursements) | MG | MG | MG | MG |
| Rent Increase Projection | 2.0% per annum | 2.0% per annum | 2.0% per annum | 2.0% per annum |
| (1) | Information obtained from the appraisal. |
The following table presents certain information relating to comparable below grade retail leases for the 112-118 West 125th Street Property:
Comparable Below Grade Leases(1)
Property
Name/Location | Year Built/
Renovated | Total GLA (SF) | Distance
from
Subject | Occupancy(2) | Tenant | Lease
Date | Tenant
Size | Lease Term | Annual
Base
Rent
PSF | Lease Type |
93 Worth Street New York, NY | 1924/NAV | 12,482 | 9.2 miles | 100.0% | FitHouse | Jul-18 | 4,400 SF | 8.1 Yrs | $59.00 | NNN |
78 Bowery Street New York, NY | 2018/NAV | 18,600 | 9.1 miles | 51.5% | NYC Arts Center Inc. | Aug-18 | 2,500 SF | 5.0 Yrs | $34.00 | MG |
260 West 36th Street New York, NY | 1907/NAV | 81,375 | 5.4 miles | 88.1% | Music Makers | Jul-19 | 6,500 SF | 0.8 Yrs | $35.00 | MG |
4819 13th Avenue Brooklyn, NY | 1920/NAV | 11,700 | 15.8 miles | 100.0% | Lebogner Inc. | May-19 | 1,000 SF | 0.4 Yrs | $30.00 | MG |
| (1) | Information obtained from the appraisal, unless otherwise noted. |
| (2) | Information obtained from a third party market research provider. |
THE INFORMATION IN THIS STRUCTURAL AND COLLATERAL TERM SHEET IS NOT COMPLETE AND MAY BE AMENDED PRIOR TO THE TIME OF SALE. THIS TERM SHEET IS NOT AN OFFER TO SELL THESE SECURITIES AND IT IS NOT A SOLICITATION OF AN OFFER TO BUY THESE SECURITIES IN ANY JURISDICTION WHERE THE OFFER OR SALE IS NOT PERMITTED.
86
| Mixed Use – Retail/Office | Loan #6 | Cut-off Date Balance: | | $32,100,000 |
| 112-118 West 125th Street | 112-118 West 125th Street | Cut-off Date LTV: | | 57.7% |
| New York, NY 10027 | | U/W NCF DSCR: | | 1.91x |
| | | U/W NOI Debt Yield: | | 7.3% |
The following table presents certain information relating to comparable retail leases for the 112-118 West 125th Street Property:
Comparable Retail Leases(1)
| Property Name/Location | Year Built/
Renovated | Total
GLA
(SF) | Distance
from
Subject | Occupancy(2) | Tenant | Lease
Date | Tenant
Size | Lease Term | Annual
Base
Rent
PSF | Lease Type |
324 West 125th Street New York, NY | 2016/NAV | 35,572 | 0.3 miles | 100.0% | CVS | Sep-18 | 7,030 SF | 20.0 Yrs | $163.58 | MG |
72 W. 125th Street New York, NY | 2000/NAV | 11,287 | 0.1 miles | 100.0% | Chipotle | Jan-18 | 2,500 SF | 10.0 Yrs | $156.00 | NNN |
1 W. 125th Street New York, NY | 1901/NAV | 33,000 | 0.2 miles | 93.3% | Shake Shack | Jan-18 | 3,500 SF | NAV | $100.00 | NNN |
3534 Broadway New York, NY | 1910/NAV | 19,984 | 1.7 miles | 100.0% | CVS | Jan-16 | 14,493 SF | 15.0 Yrs | $136.00 | MG |
250 W. 125th Street New York, NY | 1960/NAV | 5,000 | 0.2 miles | 100.0% | Aldo | Apr-17 | 5,000 SF | NAV | $160.00 | NNN |
| (1) | Information obtained from the appraisal, unless otherwise noted. |
| (2) | Information obtained from a third party market research provider. |
The table below presents certain information relating to comparable sales for the 112-118 West 125th Street Property identified by the appraiser:
Comparable Sales(1)
| Property Name | Location | Rentable
Area (SF) | Sale Date | Sale Price | Sale Price
(PSF) |
| 112-118 West 125th Street (Subject) | New York, NY | 32,000 | - | - | - |
| 2025 Broadway | New York, NY | 18,393 | Feb-18 | $39,000,000 | $2,120 |
| 208 Canal Street | New York, NY | 11,000 | Apr-17 | $23,550,000 | $2,141 |
| 2308-2318 Broadway | New York, NY | 42,713 | Jun-18 | $53,000,000 | $1,241 |
| 124 Hudson Street | New York, NY | 11,500 | Oct-17 | $15,275,000 | $1,328 |
| (1) | Information obtained from the appraisal. |
Escrows.
Real Estate Taxes – The 112-118 West 125th Street Mortgage Loan documents require an upfront real estate tax reserve of $104,916 and ongoing monthly real estate tax reserves in an amount equal to one-twelfth of the real estate taxes that the lender estimates will be payable during the next twelve months (initially $34,972).
Insurance – The 112-118 West 125th Street Mortgage Loan documents require an upfront insurance reserve of $1,934 and ongoing monthly insurance reserves in an amount equal to one-twelfth of the insurance premiums that the lender estimates will be payable for the renewal of the coverage during the next twelve months (initially $967).
Replacement Reserves – The 112-118 West 125th Street Mortgage Loan documents require ongoing monthly replacement reserves of $534.
Lockbox and Cash Management.The 112-118 West 125th Street Mortgage Loan documents require that the borrower establish and maintain a lender-controlled lockbox account, which is already in-place, and that the 112-118 West 125th Street Borrower direct all tenants to pay rent directly into such lockbox account. The 112-118 West 125th Street Mortgage Loan documents also require that all rents received by the 112-118 West 125th Street Borrower or the property manager be deposited into the lockbox account within one business day of receipt. Prior to the occurrence of a Cash Trap Event Period (as defined below), all funds on deposit in the lockbox account will be disbursed to the 112-118 West 125th Street Borrower. During a Cash Trap Event Period, all funds in the lockbox account are required to be swept each business day into the cash management account controlled by the lender and, on each payment date, all funds in the cash management account are required to be applied in accordance with the 112-118 West 125th Street Mortgage Loan documents. During a Cash Trap Event Period, any excess cash flow remaining after satisfaction of the waterfall items is required to be swept to an excess cash flow subaccount to be held by the lender as additional security for the 112-118 West 125th Street Mortgage Loan.
THE INFORMATION IN THIS STRUCTURAL AND COLLATERAL TERM SHEET IS NOT COMPLETE AND MAY BE AMENDED PRIOR TO THE TIME OF SALE. THIS TERM SHEET IS NOT AN OFFER TO SELL THESE SECURITIES AND IT IS NOT A SOLICITATION OF AN OFFER TO BUY THESE SECURITIES IN ANY JURISDICTION WHERE THE OFFER OR SALE IS NOT PERMITTED.
87
| Mixed Use – Retail/Office | Loan #6 | Cut-off Date Balance: | | $32,100,000 |
| 112-118 West 125th Street | 112-118 West 125th Street | Cut-off Date LTV: | | 57.7% |
| New York, NY 10027 | | U/W NCF DSCR: | | 1.91x |
| | | U/W NOI Debt Yield: | | 7.3% |
A “Cash Trap Event Period” will commence upon the earliest to occur of the following:
| (i) | an event of default under the 112-118 West 125th Street Mortgage Loan documents; |
| (ii) | Victoria’s Secret, Bath and Body Works, or L Brands (individually and/or collectively, together with any successors or assigns and any replacement tenants, as the context may require, “Major Tenant”) filing, as a debtor, a bankruptcy or similar insolvency proceeding, or otherwise becoming involved, as a debtor, in a bankruptcy or any similar insolvency proceeding; or |
| (iii) | a Major Tenant “going dark”, vacating or otherwise failing to occupy its space (excluding any temporary cessations in connection with remodeling, renovation or restoration, not to exceed 90 days in the aggregate), or giving notice of its intent to commence any of the foregoing. |
A Cash Trap Event Period will end upon the occurrence of:
| ● | with regard to clause (i) above, the cure of such event of default; |
| ● | with regard to clause (ii) above, (x) a Major Tenant Re-tenanting Event (as defined below) or (y) the bankruptcy or insolvency proceeding having terminated in a manner satisfactory to the lender, the applicable lease having been affirmed and the terms of such lease, as affirmed, being satisfactory to the lender; or |
| ● | with regard to clause (iii) above, (x) a Major Tenant Re-Tenanting Event or (y) the applicable Major Tenant having resumed occupancy of, and having resumed its normal business operations in its space and being open during customary hours for a period of three consecutive calendar months. |
A “Major Tenant Re-Tenanting Event” will occur upon the lender receiving satisfactory evidence, including, without limitation, a satisfactory estoppel certificate from each such replacement tenant affirming, that: (i) each such replacement tenant is in occupancy of its premises, is conducting normal business operations in and is paying full, unabated rent pursuant to the terms of its replacement lease reasonably satisfactory to the lender (or the amount of any rent concessions having been reserved with the lender) and (ii) all tenant improvement costs and leasing commissions provided in each such replacement lease have been paid (or having been reserved with the lender).
Property Management. The 112-118 West 125th Street Property is managed by Salon Realty Corp., a full service property management company that offers brokerage and advisory services for individual investors, trusts, families/estates, co-ops/condominiums and institutional clients. Founded in 1980, service over 95 properties ranging from single tenant retail buildings to high rise luxury residential towers.
Partial Release. Not permitted.
Real Estate Substitution.Not permitted.
Subordinate and Mezzanine Indebtedness.None.
Ground Lease. None.
Terrorism Insurance.The 112-118 West 125th Street Mortgage Loan documents require that the “all risk” insurance policy required to be maintained by the 112-118 West 125th Street Borrower provides coverage for terrorism in an amount equal to the full replacement cost of the 112-118 West 125th Street Property, as well as business interruption insurance covering no less than the 18-month period following the occurrence of a casualty event, together with a 6-month extended period of indemnity.
THE INFORMATION IN THIS STRUCTURAL AND COLLATERAL TERM SHEET IS NOT COMPLETE AND MAY BE AMENDED PRIOR TO THE TIME OF SALE. THIS TERM SHEET IS NOT AN OFFER TO SELL THESE SECURITIES AND IT IS NOT A SOLICITATION OF AN OFFER TO BUY THESE SECURITIES IN ANY JURISDICTION WHERE THE OFFER OR SALE IS NOT PERMITTED.
88
(THIS PAGE INTENTIONALLY LEFT BLANK)
THE INFORMATION IN THIS STRUCTURAL AND COLLATERAL TERM SHEET IS NOT COMPLETE AND MAY BE AMENDED PRIOR TO THE TIME OF SALE. THIS TERM SHEET IS NOT AN OFFER TO SELL THESE SECURITIES AND IT IS NOT A SOLICITATION OF AN OFFER TO BUY THESE SECURITIES IN ANY JURISDICTION WHERE THE OFFER OR SALE IS NOT PERMITTED.
89
| Office – Suburban | Loan #7 | Cut-off Date Balance: | | $30,000,000 |
| 600 & 620 National Avenue | 600 & 620 National Avenue | Cut-off Date LTV: | | 70.0% |
| Mountain View, CA 94043 | | U/W NCF DSCR: | | 1.93x |
| | | U/W NOI Debt Yield: | | 7.2% |

THE INFORMATION IN THIS STRUCTURAL AND COLLATERAL TERM SHEET IS NOT COMPLETE AND MAY BE AMENDED PRIOR TO THE TIME OF SALE. THIS TERM SHEET IS NOT AN OFFER TO SELL THESE SECURITIES AND IT IS NOT A SOLICITATION OF AN OFFER TO BUY THESE SECURITIES IN ANY JURISDICTION WHERE THE OFFER OR SALE IS NOT PERMITTED.
90
| Office – Suburban | Loan #7 | Cut-off Date Balance: | | $30,000,000 |
| 600 & 620 National Avenue | 600 & 620 National Avenue | Cut-off Date LTV: | | 70.0% |
| Mountain View, CA 94043 | | U/W NCF DSCR: | | 1.93x |
| | | U/W NOI Debt Yield: | | 7.2% |

THE INFORMATION IN THIS STRUCTURAL AND COLLATERAL TERM SHEET IS NOT COMPLETE AND MAY BE AMENDED PRIOR TO THE TIME OF SALE. THIS TERM SHEET IS NOT AN OFFER TO SELL THESE SECURITIES AND IT IS NOT A SOLICITATION OF AN OFFER TO BUY THESE SECURITIES IN ANY JURISDICTION WHERE THE OFFER OR SALE IS NOT PERMITTED.
91
| No. 7 – 600 & 620 National Avenue |
| |
| Mortgage Loan Information | | Mortgaged Property Information |
| Mortgage Loan Seller(1): | Wells Fargo Bank, National Association | | Single Asset/Portfolio: | Single Asset |
Credit Assessment (DBRS/Fitch/Moody’s): | NR/NR/NR | | Property Type – Subtype: | Office – Suburban |
| Original Principal Balance(2): | $30,000,000 | | Location: | Mountain View, CA |
| Cut-off Date Balance(2): | $30,000,000 | | Size: | 151,064 SF |
| % of Initial Pool Balance: | 4.3% | | Cut-off Date Balance Per SF(2): | $912.86 |
| Loan Purpose: | Acquisition | | Maturity Date Balance Per SF(2): | $912.86 |
| Borrower Sponsors: | Farshid Steve Shokouhi; Brett Michael Lipman | | Year Built/Renovated: | 2017/NAP |
| Guarantors: | Farshid Steve Shokouhi; Brett Michael Lipman | | Title Vesting: | Fee |
| Mortgage Rate: | 3.6880% | | Property Manager: | Self-managed |
| Note Date: | September 11, 2019 | | Current Occupancy (As of): | 100.0% (11/1/2019) |
| Seasoning: | 2 months | | YE 2018 Occupancy(5): | NAV |
| Maturity Date: | September 11, 2029 | | YE 2017 Occupancy(5): | NAV |
| IO Period: | 120 months | | YE 2016 Occupancy(5): | NAV |
| Loan Term (Original): | 120 months | | YE 2015 Occupancy(5): | NAV |
| Amortization Term (Original): | NAP | | Appraised Value(6)(7): | $197,000,000 |
| Loan Amortization Type: | Interest-only, Balloon | | Appraised Value Per SF(6)(7): | $1,304.08 |
| Call Protection(3): | L(26),D(89),O(5) | | Appraisal Valuation Date(6)(7): | August 19, 2019 |
| Lockbox Type: | Hard/Springing Cash Management | | |
| Additional Debt(2): | Yes | | Underwriting and Financial Information |
| Additional Debt Type (Balance)(2): | Pari Passu ($107,900,000) | | TTM NOI (6/30/2019)(5): | NAV |
| | | | YE 2018 NOI(5): | NAV |
| | | | YE 2017 NOI(5): | NAV |
| | | | YE 2016 NOI(5): | NAV |
| | | | U/W Revenues: | $12,672,245 |
| | | | U/W Expenses: | $2,708,238 |
| Escrows and Reserves(4) | | U/W NOI: | $9,964,007 |
| | Initial | Monthly | Cap | | U/W NCF: | $9,964,007 |
| Taxes | $0 | Springing | NAP | | U/W DSCR based on NOI/NCF(2): | 1.93x / 1.93x |
| Insurance | $0 | Springing | NAP | | U/W Debt Yield based on NOI/NCF(2): | 7.2% / 7.2% |
| Replacement Reserve | $75,532 | $3,147 | $75,532 | | U/W Debt Yield at Maturity based on NOI/NCF(2): | 7.2% / 7.2% |
| Outstanding TI/LC | $12,085,120 | $0 | NAP | | Cut-off Date LTV Ratio(2)(6): | 70.0% |
| | | | | | LTV Ratio at Maturity(2)(6): | 70.0% |
| | | | | | | |
| | | | | | | | |
| Sources and Uses |
| Sources | | | | | Uses | | | |
| Original whole loan amount(2) | $137,900,000 | | 70.2% | | Purchase Price | $190,000,000 | | 96.7% |
| Borrower Equity | 58,663,716 | | 29.8 | | Seller Credits(8) | (12,993,370) | | (6.6) |
| | | | | | Reserves | 12,160,652 | | 6.2 |
| | | | | | Closing costs | 7,396,434 | | 3.8 |
| Total Sources | $196,563,716 | | 100.0% | | Total Uses | $196,563,716 | | 100.0% |
| (1) | The 600 & 620 National Avenue Whole Loan was co-originated by JPMorgan Chase Bank, National Association (“JPMCB”) and Wells Fargo Bank, National Association (“WFB”) on September 11, 2019. |
| (2) | The 600 & 620 National Avenue Mortgage Loan (as defined below) is part of the 600 & 620 National Avenue Whole Loan (as defined below), which is comprised of fivepari passupromissory notes with an aggregate original principal balance of $137,900,000. The Cut-off Date Balance per square foot, Maturity Date Balance per square foot, U/W Debt Yield based on NOI/NCF, U/W Debt Yield at Maturity based on NOI/NCF, U/W DSCR based on NOI/NCF, Cut-off Date LTV Ratio and LTV Ratio at Maturity figures presented above are based on the 600 & 620 National Avenue Whole Loan. |
| (3) | Defeasance of the 600 & 620 National Avenue Whole Loan is permitted at any time after the earlier to occur of (a) the end of the two-year period commencing on the closing date of the securitization of the last 600 & 620 National Whole Loan promissory note to be securitized and (b) September 11, 2022. The assumed defeasance lockout period of 26 payments is based on the expected closing date of this transaction in November 2019. |
| (4) | See “Escrows” Section. |
| (5) | Historical operating statements and occupancy are not applicable, as the first generation tenant is currently completing its buildout at the 600 & 620 National Avenue Property. |
| (6) | The Appraised Value, Cut-off Date LTV Ratio and Maturity Date LTV Ratio are based on the appraiser’s “Market Value As Stabilized”, which assumes the tenant has taken possession, free rent has expired, the tenant has commenced paying unabated rent and all outstanding tenant improvements and leasing commissions have been reserved. As of the time of origination of the 600 & 620 National Avenue Whole Loan, Google has taken possession of its space and is paying rent, and all outstanding tenant improvements and leasing commissions have been reserved. The appraisal also concluded to a “Market Value As-Is” of $185,000,000 as of August 19, 2019. All stabilizing conditions have occurred as of the closing date of this transaction in November 2019. |
| (7) | The appraisal concluded to a “Hypothetical Value As if Dark” of $152,500,000 as of August 19, 2019. |
| (8) | The majority of Seller Credits ($12,085,120) relate to outstanding tenant improvements and leasing commissions for Google, which were reserved for at the time of origination of the 600 & 620 National Avenue Whole Loan. |
THE INFORMATION IN THIS STRUCTURAL AND COLLATERAL TERM SHEET IS NOT COMPLETE AND MAY BE AMENDED PRIOR TO THE TIME OF SALE. THIS TERM SHEET IS NOT AN OFFER TO SELL THESE SECURITIES AND IT IS NOT A SOLICITATION OF AN OFFER TO BUY THESE SECURITIES IN ANY JURISDICTION WHERE THE OFFER OR SALE IS NOT PERMITTED.
92
| Office – Suburban | Loan #7 | Cut-off Date Balance: | | $30,000,000 |
| 600 & 620 National Avenue | 600 & 620 National Avenue | Cut-off Date LTV: | | 70.0% |
| Mountain View, CA 94043 | | U/W NCF DSCR: | | 1.93x |
| | | U/W NOI Debt Yield: | | 7.2% |
The Mortgage Loan. The mortgage loan (the “600 & 620 National Avenue Mortgage Loan”) is part of a whole loan (the “600 & 620 National Avenue Whole Loan”) evidenced by fivepari passu promissory notes with an aggregate original principal balance of $137,900,000. The 600 & 620 National Avenue Whole Loan is secured by a first priority fee mortgage encumbering a 151,064 square foot single tenant office located in Mountain View, California (the “600 & 620 National Avenue Property”). The 600 & 620 National Avenue Mortgage Loan represents the non-controlling Note A-1-2 with an original principal balance of $30,000,000. The below table summarizes the 600 & 620 National Avenue Whole Loan, including the remaining promissory notes, which are currently held by JPMorgan Chase Bank, National Association and may otherwise be transferred at any time. The mortgage loan seller provides no assurances that the non-securitizedpari passu notes will not be split further. The 600 & 620 National Avenue Whole Loan will be serviced pursuant to the pooling and servicing agreement for the UBS 2019-C17 Trust. See “Description of the Mortgage Pool—The Whole Loans—The Non-Serviced Pari Passu Whole Loans” and “Pooling and Servicing Agreement—Servicing of the Non-Serviced Mortgage Loans” in the Preliminary Prospectus.
600 & 620 National Avenue Whole Loan Summary
| Notes | Original Balance | Cut-off Date Balance | Note Holder | Controlling
Piece |
| A-1-2 | $30,000,000 | $30,000,000 | WFCM 2019-C53 | No |
| A-1-1 | $38,950,000 | $38,950,000 | UBS 2019-C17 | Yes |
| A-2-1 | $30,000,000 | $30,000,000 | JPMorgan Chase Bank, National Association | No |
| A-2-2 | $30,000,000 | $30,000,000 | JPMorgan Chase Bank, National Association | No |
| A-2-3 | $8,950,000 | $8,950,000 | JPMorgan Chase Bank, National Association | No |
| 600 & 620 National Avenue Whole Loan | $137,900,000 | $137,900,000 | | |
The Borrower and Borrower Sponsors.The borrower is Preylock Mountain View, LLC (the “600 & 620 National Avenue Borrower”), a Delaware limited liability company structured to be bankruptcy remote with two independent directors. Legal counsel to the 600 & 620 National Avenue Borrower delivered a non-consolidation opinion in connection with the origination of the 600 & 620 National Avenue Whole Loan. The borrower sponsors and nonrecourse carveout guarantors are Brett Michael Lipman and Farshid Steve Shokouhi, both managing partners at Preylock Real Estate Holdings (“Preylock”) a real estate acquisition and management company. Founded in Los Angeles, California in 2016, Preylock’s current portfolio comprises approximately 3.0 million square feet of office space in California and Washington.
Prior to founding Preylock, Mr. Lipman was most recently a portfolio manager and a partner at RMA Real Estate Investment Advisors (“RMA”), a real estate private equity fund. At RMA, he was responsible for portfolio management, asset management and sourcing direct real estate investment opportunities. Prior to joining RMA, Mr. Lipman worked for JP Morgan, most recently on the Global Real Assets platform, a large institutional real estate investor. Previously, Mr. Shokouhi was the Managing Principal of the Kalimian Organization, a real estate family office based in New York. Mr. Shokouhi focused on the firm’s business development and asset repositioning, as well as assembling a management team.
The Property.The 600 & 620 National Avenue Property is a 151,064 square foot, four-story, LEED Gold Certified, Class A office building located in Mountain View, California within the northern portion of Silicon Valley. Constructed in 2017 and situated on a 4.8-acre site, the 600 & 620 National Avenue Property contains large floor plates of approximately 38,000 square feet and up to 16-foot ceiling heights. The building is 100.0% leased to Google LLC (“Google”), which has taken possession of its space and, according to the appraisal, is expected to spend approximately $200 per square foot on tenant improvements (in addition to the $80 per square foot in tenant improvements provided for by the 600 & 620 National Avenue Borrower). While not yet in physical occupancy, Google has commenced paying unabated rent at the 600 & 620 National Avenue Property. The 600 & 620 National Avenue Property contains 105 surface parking spaces in addition to a two-story parking structure with 344 parking spaces, resulting in a total parking ratio of approximately 3.0 spaces per 1,000 square feet of net rentable area.
Major Tenant.
Google LLC (151,064 square feet; 100.0% of net rentable area; 100.0% of underwritten base rent; exp. 5/31/2029) Alphabet Inc., the holding company of Google, is a global technology company focused on online search, advertising, operating systems, platforms and enterprise services. The primary revenue driver for Google is online advertising, but other Google initiatives include Chrome, Android, Maps, Earth, Apps, Fiber, Music, Glass and self-driving automobiles. Alphabet Inc. (NASDAQ: GOOG) is rated ‘Aa2’ and ‘AA+’ by Moody’s and S&P, respectively. Google’s lease at the 600 & 620 National Avenue Property runs through May 31, 2029 with three, five-year renewal options and no termination options. The entity on Google’s lease at the 600 & 620 National Avenue Property is Google LLC. The 600 & 620 National Avenue Property is included within a Superfund Site that is being actively remediated, and, while mitigation measures have been incorporated into the design and construction of the improvements, Google’s lease provides for tenant remedies, including lease termination, if conditions are determined by governmental order to be hazardous to human health (see “Description of the Mortgage Pool—Environmental Conditions” in the Preliminary Prospectus).
Google has a signed lease at the 600 & 620 National Avenue Property but has not yet taken occupancy. Google has taken possession of its space, commenced paying unabated rent and, as of September 2019, is expected to take occupancy by the third quarter of 2020. There is no assurance that Google will take occupancy by the estimated date noted herein.
THE INFORMATION IN THIS STRUCTURAL AND COLLATERAL TERM SHEET IS NOT COMPLETE AND MAY BE AMENDED PRIOR TO THE TIME OF SALE. THIS TERM SHEET IS NOT AN OFFER TO SELL THESE SECURITIES AND IT IS NOT A SOLICITATION OF AN OFFER TO BUY THESE SECURITIES IN ANY JURISDICTION WHERE THE OFFER OR SALE IS NOT PERMITTED.
93
| Office – Suburban | Loan #7 | Cut-off Date Balance: | | $30,000,000 |
| 600 & 620 National Avenue | 600 & 620 National Avenue | Cut-off Date LTV: | | 70.0% |
| Mountain View, CA 94043 | | U/W NCF DSCR: | | 1.93x |
| | | U/W NOI Debt Yield: | | 7.2% |
The following table presents certain information relating to the tenancy at the 600 & 620 National Avenue Property:
Major Tenants
| Tenant Name | Credit Rating
(Fitch/ Moody’s/
S&P)(1) | Tenant
NRSF | % of
NRSF | Annual U/W Base Rent PSF(2) | Annual
U/W Base Rent(2) | % of Total Annual U/W Base Rent | Lease
Expiration
Date | Extension Options(3) | Termination
Option
(Y/N) |
| Major Tenants | | | | | | | | |
| Google LLC(4) | NR/Aa2/AA+ | 151,064 | 100.0% | $59.40 | $8,973,204 | 100.0% | 5/31/2029 | 3, 5-year | N |
| Total Major Tenants | 151,064 | 100.0% | $59.40 | $8,973,204 | 100.0% | | | |
| | | | | | | | | |
| Non-Major Tenant | 0 | 0.0% | $0.00 | $0 | 0.0% | | | |
| | | | | | | | | |
| Occupied Collateral Total | 151,064 | 100.0% | $59.40 | $8,973,204 | 100.0% | | | |
| | | | | | | | | |
| Vacant Space | 0 | 0.0% | | | | | | |
| | | | | | | | | |
| Collateral Total | 151,064 | 100.0% | | | | | | |
| | | | | | | | | | |
| | | | | | | | | | | |
| (1) | The ratings shown above are those of Alphabet Inc., Google’s parent company. The entity on Google’s lease is Google LLC. |
| (2) | Annual U/W Rent PSF and Annual U/W Rent reflect the tenant’s current contractual rental rate, and the tenant’s lease is structured with 3% contractual annual rent increases. The lender’s underwriting provides separate credit for straight-line rent averaging through the lease term due to the tenant’s investment grade nature. The total effective underwritten rent, inclusive of rent averaging credit, is $68.55 per square foot (see “Underwritten Net Cash Flow” section below). |
| (3) | Google has three, five-year renewal options with 12 months’ notice at 95% of the prevailing fair market rental rate. |
| (4) | Google has taken procession of its space and commenced paying unabated rent but has not yet taken occupancy of the 600 & 620 National Avenue Property. |
The following table presents certain information relating to the lease rollover schedule at the 600 & 620 National Avenue Property:
Lease Expiration Schedule(1)
Year Ending
December 31, | No. of Leases Expiring | Expiring NRSF | % of Total NRSF | Cumulative
Expiring
NRSF | Cumulative % of Total NRSF | Annual
U/W
Base Rent | % of Total
Annual
U/W Base
Rent | Annual
U/W
Base Rent
PSF |
| MTM | 0 | 0 | 0.0% | 0 | 0.0% | $0 | 0.0% | $0.00 |
| 2019 | 0 | 0 | 0.0% | 0 | 0.0% | $0 | 0.0% | $0.00 |
| 2020 | 0 | 0 | 0.0% | 0 | 0.0% | $0 | 0.0% | $0.00 |
| 2021 | 0 | 0 | 0.0% | 0 | 0.0% | $0 | 0.0% | $0.00 |
| 2022 | 0 | 0 | 0.0% | 0 | 0.0% | $0 | 0.0% | $0.00 |
| 2023 | 0 | 0 | 0.0% | 0 | 0.0% | $0 | 0.0% | $0.00 |
| 2024 | 0 | 0 | 0.0% | 0 | 0.0% | $0 | 0.0% | $0.00 |
| 2025 | 0 | 0 | 0.0% | 0 | 0.0% | $0 | 0.0% | $0.00 |
| 2026 | 0 | 0 | 0.0% | 0 | 0.0% | $0 | 0.0% | $0.00 |
| 2027 | 0 | 0 | 0.0% | 0 | 0.0% | $0 | 0.0% | $0.00 |
| 2028 | 0 | 0 | 0.0% | 0 | 0.0% | $0 | 0.0% | $0.00 |
| 2029 | 1 | 151,064 | 100.0% | 151,064 | 100.0% | $8,973,204 | 100.0% | $59.40 |
| Thereafter | 0 | 0 | 0.0% | 151,064 | 100.0% | $0 | 0.0% | $0.00 |
| Vacant | 0 | 0 | 0.0% | 151,064 | 100.0% | $0 | 0.0% | $0.00 |
| Total/Weighted Average | 1 | 151,064 | 100.0% | | | $8,973,204 | 100.0% | $59.40 |
| (1) | Information obtained from the underwritten rent roll. |
THE INFORMATION IN THIS STRUCTURAL AND COLLATERAL TERM SHEET IS NOT COMPLETE AND MAY BE AMENDED PRIOR TO THE TIME OF SALE. THIS TERM SHEET IS NOT AN OFFER TO SELL THESE SECURITIES AND IT IS NOT A SOLICITATION OF AN OFFER TO BUY THESE SECURITIES IN ANY JURISDICTION WHERE THE OFFER OR SALE IS NOT PERMITTED.
94
| Office – Suburban | Loan #7 | Cut-off Date Balance: | | $30,000,000 |
| 600 & 620 National Avenue | 600 & 620 National Avenue | Cut-off Date LTV: | | 70.0% |
| Mountain View, CA 94043 | | U/W NCF DSCR: | | 1.93x |
| | | U/W NOI Debt Yield: | | 7.2% |
The following table presents historical occupancy percentages at the 600 & 620 National Avenue Property:
Historical Occupancy
12/31/2015(1) | 12/31/2016(1) | 12/31/2017(1) | 12/31/2018(1) | 11/1/2019(2) |
| NAV | NAV | NAV | NAV | 100.0% |
| (1) | Historical occupancy is unavailable as the first generation tenant is currently completing its buildout at the 600 & 620 National Avenue Property. |
| (2) | Information obtained from the underwritten rent roll. |
Operating History and Underwritten Net Cash Flow. The following table presents certain information relating to the historical operating performance and underwritten net cash flow at the 600 & 620 National Avenue Property:
Cash Flow Analysis(1)
| | U/W | %(2) | U/W $ per SF |
| Base Rent | $8,973,204 | 68.7% | $59.40 |
| Contractual Rent Steps(3) | 1,382,728 | 10.6 | 9.15 |
| Grossed Up Vacant Space | 0 | 0.0 | 0.0 |
| Gross Potential Rent | $10,355,932 | 79.3% | $68.55 |
| Total Recoveries | 2,708,238 | 20.7 | 17.93 |
| Net Rental Income | $13,064,170 | 100.0% | $86.48 |
| (Vacancy & Credit Loss) | (391,925)(4) | (3.8) | (2.59) |
| Effective Gross Income | $12,672,245 | 97.0% | $83.89 |
| | | | |
| Real Estate Taxes | 2,237,440 | 17.7 | 14.81 |
| Insurance | 44,968 | 0.4 | 0.30 |
| Management Fee | 126,722 | 1.0 | 0.84 |
| Other Operating Expenses | 299,108 | 2.4 | 1.98 |
| Total Operating Expenses | $2,708,238 | 21.4% | $17.93 |
| | | | |
| Net Operating Income | $9,964,007 | 78.6% | $65.96 |
| Replacement Reserves | 0 | 0.0 | 0.00 |
| TI/LC | 0 | 0.0 | 0.00 |
| Net Cash Flow | $9,964,007 | 78.6% | $65.96 |
| | | | |
| NOI DSCR | 1.93x | | |
| NCF DSCR | 1.93x | | |
| NOI Debt Yield | 7.2% | | |
| NCF Debt Yield | 7.2% | | |
| (1) | Historical operating statements are unavailable, as the first generation tenant is currently completing its buildout at the 600 & 620 National Avenue Property. |
| (2) | Represents (i) percent of Net Rental Income for all revenue fields, (ii) percent of Gross Potential Rent for Vacancy & Credit Loss and (iii) percent of Effective Gross Income for all other fields. |
| (3) | The tenant’s lease is structured with 3% contractual annual rent increases. Contractual Rent Steps denotes credit for straight-line rent averaging through the lease term due to the tenant’s investment grade nature. |
| (4) | The underwritten economic vacancy is 3.0%. The 600 & 620 National Avenue Property was 100.0% leased as of November 1, 2019. |
Appraisal.The appraiser concluded to a “Market Value as Stabilization” appraised value for the 600 & 620 National Avenue Property of $197,000,000 as of August 19, 2019, which assumes the tenant has taken possession, free rent has expired, the tenant has commenced paying unabated rent and all outstanding tenant improvements and leasing commissions have been reserved. As of the time of origination of the 600 & 620 National Avenue Whole Loan, Google has taken possession of its space and is paying rent, and all outstanding tenant improvements and leasing commissions have been reserved. The appraisal also concluded to a “Market Value As-Is” appraised value of $185,000,000 as of August 19, 2019. All stabilizing conditions have occurred as of the closing date of this transaction in November 2019.
Environmental Matters. The 600 & 620 National Avenue Property is included within the Middlefield-Ellis-Whitman Superfund Site and ongoing remedial activities are being performed by identified responsible parties under U.S. Environmental Protection Agency oversight. While mitigation measures have been incorporated into the design and construction of the improvements at the 600 & 620 National Avenue Property, Google’s lease provides for tenant remedies, including lease termination, if conditions are determined by
THE INFORMATION IN THIS STRUCTURAL AND COLLATERAL TERM SHEET IS NOT COMPLETE AND MAY BE AMENDED PRIOR TO THE TIME OF SALE. THIS TERM SHEET IS NOT AN OFFER TO SELL THESE SECURITIES AND IT IS NOT A SOLICITATION OF AN OFFER TO BUY THESE SECURITIES IN ANY JURISDICTION WHERE THE OFFER OR SALE IS NOT PERMITTED.
95
| Office – Suburban | Loan #7 | Cut-off Date Balance: | | $30,000,000 |
| 600 & 620 National Avenue | 600 & 620 National Avenue | Cut-off Date LTV: | | 70.0% |
| Mountain View, CA 94043 | | U/W NCF DSCR: | | 1.93x |
| | | U/W NOI Debt Yield: | | 7.2% |
governmental order to be hazardous to human health (see “Description of the Mortgage Pool—Environmental Conditions” in the Preliminary Prospectus).
Market Overview and Competition.The 600 & 620 National Avenue Property is located in Mountain View, Santa Clara County, California, approximately 11.4 miles northwest of the San Jose central business district, with primary access provided by US Highway 101, State Highway 237 and State Highway 85. US Highway 101 is the major north-south route through the western bay area, providing northern access to San Francisco and southern access to San Jose. Access to the CalTrain and The Valley Transportation Authority light rail is available approximately one mile south of the 600 & 620 National Avenue Property. In addition, the 600 & 620 National Avenue Property is located approximately 3.3 miles southeast of The Googleplex (the corporate headquarters complex of Google and its parent company Alphabet Inc.) and 1.5 miles west of Moffett Park.
According to the appraisal, San Mateo and Santa Clara Counties are located within Silicon Valley, which has a large concentration of high-technology and research & development employers. Per the appraisal, Silicon Valley’s top employers are Apple Inc. (approximately 25,000 employees) and Alphabet Inc. (approximately 20,000 employees) and include Tesla Inc. (approximately 10,000 employees) and Facebook Inc. (approximately 9,385 employees). Apple’s headquarters in Cupertino is approximately 7.6 miles southwest of the 600 & 620 National Avenue Property, and Facebook’s headquarters in Menlo Park is approximately 9.3 miles to the northeast. According to a third party market research provider, the estimated 2018 population within a three- and five-mile radius of the 600 & 620 National Avenue Property was approximately 157,190 and 344,619, respectively; and the estimated 2018 average household income within the same radii was approximately $160,022 and $179,509, respectively.
According to a third party market research report, the 600 & 620 National Avenue Property is situated within the South Moffett Triangle submarket of the San Jose Office Market. As of September 11, 2019, the South Moffett Triangle submarket reported a total inventory of approximately 3.4 million square feet with a 1.0% vacancy rate, which has decreased from 7.2% in 2018 and averaged 6.6% from 2013 through 2018.
The appraiser identified six leases negotiated in competitive buildings in the marketplace totaling approximately 1.0 million square feet with direct rents ranging from $56.16 to $96.00 per square foot, net, with an average of $69.86 per square foot, net. The appraiser concluded to a market rent for the 600 & 620 National Avenue Property of $66.00 per square foot, triple net.
The following table presents certain information relating to the appraiser’s market rent conclusions for the 600 & 620 National Avenue Property:
Market Rent Summary(1)
| | Single Tenant Office |
| Market Rent (PSF) | $66.00 |
| Lease Term (Years) | 10 |
| Concessions | 6 months |
| Lease Type (Reimbursements) | Net |
| Rent Increase Projection | 3.0% per annum |
| (1) | Information obtained from the appraisal. |
The table below presents certain information relating to comparable sales pertaining to the 600 & 620 National Avenue Property identified by the appraiser:
Comparable Sales(1)
| Property Name | Location | Year Built | Rentable Area (SF) | Sale Date | Sale Price | Sale Price (PSF) |
| 600 & 620 National Avenue (subject) | Mountain View, CA | 2017 | 151,064 | Sept-19 | $190,000,000 | $1,258 |
| Grove 221 | Sunnyvale, CA | 2019 | 154,987 | Mar-19 | $183,000,000 | $1,181 |
| 3170 Porter Drive | Palo Alto, CA | 2017 | 96,626 | Jan-19 | $100,250,000 | $1,038 |
| Middlefield Station | Mountain View, CA | 2012 | 99,880 | Sept-18 | $80,000,000 | $801 |
| Castro Station | Mountain View, CA | 2014 | 114,809 | Aug-18 | $179,650,000 | $1,565 |
| 385 Sherman | Palo Alto, CA | 2016 | 67,974 | Jan-18 | $138,000,000 | $2,030 |
| (1) | Information obtained from the appraisal. |
THE INFORMATION IN THIS STRUCTURAL AND COLLATERAL TERM SHEET IS NOT COMPLETE AND MAY BE AMENDED PRIOR TO THE TIME OF SALE. THIS TERM SHEET IS NOT AN OFFER TO SELL THESE SECURITIES AND IT IS NOT A SOLICITATION OF AN OFFER TO BUY THESE SECURITIES IN ANY JURISDICTION WHERE THE OFFER OR SALE IS NOT PERMITTED.
96
| Office – Suburban | Loan #7 | Cut-off Date Balance: | | $30,000,000 |
| 600 & 620 National Avenue | 600 & 620 National Avenue | Cut-off Date LTV: | | 70.0% |
| Mountain View, CA 94043 | | U/W NCF DSCR: | | 1.93x |
| | | U/W NOI Debt Yield: | | 7.2% |
The following table presents certain information relating to comparable leases related to 600 & 620 National Avenue Property:
Comparable Leases(1)
| Property Name/Location | Year Built/ Renovated | Total GLA (SF) | Distance from Subject | Occupancy | Tenant | Tenant Size | Lease Term | Annual Base Rent PSF | Lease Type |
Pathline Park 925 W Maude Avenue & 625 N Mary Avenue Sunnyvale, California | 2020/N/A | 242,550 | 6.6 miles | 100.0% | Proofpoint | 242,000 | 11.0 Yrs | $57.00 | Triple Net |
600 Clyde 600 Clyde Avenue Mountain View, California | 2020/N/A | 189,974 | 4.4 miles | 100.0% | Google LLC | 189,974 | 11.0 Yrs | $56.16 | Triple Net |
899 W Evelyn Avenue Mountain View, California | 2013/N/A | 75,475 | 5.8 miles | 100.0% | Confluent | 75,475 | 10.0 Yrs | $96.00 | Triple Net |
Grove 221 221 N Mathilda Avenue Sunnyvale, California | 2018/N/A | 154,987 | 2.3 miles | 100.0% | 23andMe | 154,987 | 12.8 Yrs | $61.80 | Triple Net |
2240 El Camino Real Mountain View, California | 1986/N/A | 141,392 | 5.7 miles | NAV | Udacity | 39,800 | 7.0 Yrs | $70.20 | Triple Net |
Ameswell Mountain View 750 Moffett Boulevard Mountain View, California | 2020/N/A | 216,700 | 5.8 miles | 0.0% | Available | 216,700 | N/A | $78.00 | Triple Net |
| (1) | Information obtained from the appraisal, unless otherwise noted. |
Escrows.
At origination of the 600 & 620 National Avenue Whole Loan, the 600 & 620 National Avenue Borrower deposited (i) $75,532 for capital expenditures and (ii) $12,085,120 for unfunded tenant improvements and leasing commissions related to Google.
Real Estate Taxes – The related mortgage loan documents do not require ongoing monthly escrows for real estate taxes as long as (i) no event of default has occurred and is continuing; (ii) the Google lease obligates Google to directly pay taxes; (iii) Google actually pays all taxes directly; (iv) the Google lease remains in full force and effect and neither Google nor the 600 & 620 National Avenue Borrower defaults under any of their obligations under the lease beyond any applicable notice or cure periods; and (v) the 600 & 620 National Avenue Borrower delivers evidence that all taxes have been paid within 30 days after payment thereof.
Insurance– The related mortgage loan documents do not require ongoing monthly escrows for insurance premiums as long as (i) no event of default has occurred and is continuing; (ii) the 600 & 620 National Avenue Borrower or an affiliate provides the lender with evidence that the 600 & 620 National Avenue Property’s insurance coverage is included in a blanket policy and such policy is in full force and effect; and (iii) the 600 & 620 National Avenue Borrower pays all applicable insurance premiums and provides the lender with evidence of timely payment of insurance premiums/renewals.
Recurring Replacements Reserve – The related mortgage loan documents provide an ongoing monthly replacement reserve of $3,147, which the lender may require the 600 & 620 National Avenue Borrower to increase (not more than once per year) if the lender reasonably determines such increase is necessary to maintain the proper operation of the 600 & 620 National Avenue Property. However, the 600 & 620 National Avenue Borrower will not be required to make any portion of the monthly replacement reserve deposit if the amount then on deposit in the replacement reserve is equal to or exceeds $75,532.
Lockbox and Cash Management. The 600 & 620 National Avenue Whole Loan has a hard lockbox with springing cash management upon the occurrence and continuance of a Cash Trap Event Period (as defined below). Pursuant to the related mortgage loan documents, during the continuance of a Cash Trap Event Period, all funds in the cash management account are required to be applied (i) to make deposits into the tax and insurance escrows (if any are then required) as described above in “Escrows and Reserves”, (ii) to pay any interest accruing at the default rate and late payment charges, (iii) to pay debt service on the 600 & 620 National Avenue Whole Loan, (iv) to make deposits into the replacement reserve (if then required), as described above under “Escrows and Reserves,” (v) to pay any other amounts then due and payable under the related mortgage loan documents, and (vi) to disburse funds to the 600 & 620 National Avenue Borrower sufficient to pay monthly operating expenses (collectively, the “Waterfall Items”). During a Cash Trap Event Period, any excess funds remaining after satisfaction of the Waterfall Items are required to be swept to an excess cash flow subaccount to be held by the lender as additional security for the 600 & 620 National Avenue Whole Loan during the continuance of the Cash Trap Event Period.
A “Cash Trap Event Period” will commence upon the earlier of the following:
THE INFORMATION IN THIS STRUCTURAL AND COLLATERAL TERM SHEET IS NOT COMPLETE AND MAY BE AMENDED PRIOR TO THE TIME OF SALE. THIS TERM SHEET IS NOT AN OFFER TO SELL THESE SECURITIES AND IT IS NOT A SOLICITATION OF AN OFFER TO BUY THESE SECURITIES IN ANY JURISDICTION WHERE THE OFFER OR SALE IS NOT PERMITTED.
97
| Office – Suburban | Loan #7 | Cut-off Date Balance: | | $30,000,000 |
| 600 & 620 National Avenue | 600 & 620 National Avenue | Cut-off Date LTV: | | 70.0% |
| Mountain View, CA 94043 | | U/W NCF DSCR: | | 1.93x |
| | | U/W NOI Debt Yield: | | 7.2% |
| (i) | the occurrence of an event of default under the related mortgage loan documents; |
| (ii) | the net cash flow debt service coverage ratio (based on a hypothetical 30-year amortization term) being less than 1.20x at the end of any calendar quarter; or |
| (iii) | the occurrence of a Major Tenant Event Period (as defined below). |
A Cash Trap Event Period will end upon the occurrence of the following:
| ● | with regard to clause (i), the cure of such event of default or the waiver by the lender of such event of default; |
| ● | with regard to clause (ii), (x) the amortizing net cash flow debt service coverage ratio being equal to or greater than 1.25x for two consecutive calendar quarters; or |
| ● | with regard to clause (iii), a Major Tenant Event Period Cure (as defined below). |
A “Major Tenant Event Period” will commence upon the earlier of the following:
| (i) | the 600 & 620 National Avenue Borrower committing a monetary or material non-monetary default under the Google lease beyond any applicable notice and cure period; |
| (ii) | Google going dark, vacating or otherwise failing to occupy 50% or more of its space or giving notice thereof; |
| (iii) | any bankruptcy or insolvency of Google or Alphabet, Inc.; |
| (iv) | Google failing to renew or extend the term of its lease for at least five years at least 24 months prior to its lease expiration date (Google’s lease has a 12-month renewal notice period); or |
| (v) | Alphabet Inc.’s, as the parent entity to Google, long-term debt credit rating being downgraded below “BBB-” (or equivalent rating) by any one of Fitch, Moody’s or S&P. |
A “Major Tenant Event Period Cure” will occur upon the following:
| ● | with regard to clause (i), the lender receiving satisfactory evidence that such default has been cured to Google’s satisfaction, including receipt of a satisfactory estoppel; |
| ● | with regard to clause (ii), (x) a Major Tenant Re-Leasing Event (as defined below) or (y) Google having resumed occupancy of and normal business operations in at least 51% of its space for two consecutive calendar quarters; |
| ● | with regard to clause (iii), (x) a Major Tenant Re-Leasing Event or (y) the bankruptcy proceedings having been terminated in a manner reasonably satisfactory to the lender, the Google lease being affirmed and the terms of such lease being reasonably satisfactory to the lender; |
| ● | with regard to clause (iv), (x) a Major Tenant Re-Leasing Event or (y) Google having renewed or extended the term of its lease for at least five years pursuant to the terms of the lease on terms reasonably acceptable to the lender; or |
| ● | with regard to clause (v), (x) a Major Tenant Re-Leasing Event or (y) the long-term debt credit rating for Alphabet, Inc. having been upgraded to BBB-/Baa3/BBB- or higher by Fitch/Moody’s/S&P. |
A “Major Tenant Re-Leasing Event” will occur upon one or more replacement tenants under replacement leases, each being satisfactory to the lender, covering all of the space currently occupied by Google in accordance with its lease with (i) such replacement tenants having taken occupancy of such space, conducting normal business operations and paying full unabated rent; (ii) all tenant improvements, leasing commissions or other similar landlord obligations having been paid or reserved; and (iii) delivery of a satisfactory estoppel.
Property Management. The 600 & 620 National Avenue Property is managed by an affiliate of the 600 & 620 National Avenue Borrower.
Partial Release. Not permitted.
Real Estate Substitution.Not permitted.
Subordinate and Mezzanine Indebtedness.Not permitted.
Ground Lease. None.
Right of First Offer. A sale of the 600 & 620 National Avenue Property is subject to a 30-day right of first offer (“ROFO”) in favor of Google, LLC. The ROFO is not extinguished upon foreclosure and remains subordinate to the related mortgage loan documents pursuant to a subordination non disturbance agreement.
Terrorism Insurance.The related mortgage loan documents require that the comprehensive “all risk” insurance policy required to be maintained by the 600 & 620 National Avenue Borrower provide coverage in an amount equal to the “full replacement cost” of the 600 & 620 National Avenue Property. The related mortgage loan documents also require business income insurance covering no less than the 18-month period commencing at the time of casualty, together with a six-month extended period of indemnity. Notwithstanding the foregoing, for so long as the Terrorism Risk Insurance Act of 2002, as extended and modified by the Terrorism Risk Insurance Program Reauthorization Act of 2007 and by the Terrorism Risk Insurance Program Reauthorization Act of 2015 (“TRIPRA”) is in effect (including any extensions thereof or if another federal governmental program is in effect relating to “acts of terrorism” which provides substantially similar protections as TRIPRA), and covers both domestic and foreign acts of terrorism, the lender is required to accept terrorism insurance which insures against “covered acts” as defined by TRIPRA (or such other program);provided,however, that the 600 & 620 National Avenue Borrower will not be obligated to pay terrorism insurance premiums in excess of two times the premium for the “special perils” and business income coverage on a stand-alone basis in any policy year.See “Risk
THE INFORMATION IN THIS STRUCTURAL AND COLLATERAL TERM SHEET IS NOT COMPLETE AND MAY BE AMENDED PRIOR TO THE TIME OF SALE. THIS TERM SHEET IS NOT AN OFFER TO SELL THESE SECURITIES AND IT IS NOT A SOLICITATION OF AN OFFER TO BUY THESE SECURITIES IN ANY JURISDICTION WHERE THE OFFER OR SALE IS NOT PERMITTED.
98
| Office – Suburban | Loan #7 | Cut-off Date Balance: | | $30,000,000 |
| 600 & 620 National Avenue | 600 & 620 National Avenue | Cut-off Date LTV: | | 70.0% |
| Mountain View, CA 94043 | | U/W NCF DSCR: | | 1.93x |
| | | U/W NOI Debt Yield: | | 7.2% |
Factors—Risks Relating to the Mortgage Loans—Terrorism Insurance May Not Be Available for All Mortgaged Properties” in the Preliminary Prospectus.
THE INFORMATION IN THIS STRUCTURAL AND COLLATERAL TERM SHEET IS NOT COMPLETE AND MAY BE AMENDED PRIOR TO THE TIME OF SALE. THIS TERM SHEET IS NOT AN OFFER TO SELL THESE SECURITIES AND IT IS NOT A SOLICITATION OF AN OFFER TO BUY THESE SECURITIES IN ANY JURISDICTION WHERE THE OFFER OR SALE IS NOT PERMITTED.
99
| Office - CBD | Loan #8 | Cut-off Date Balance: | | $27,000,000 |
| 800 Delaware Avenue | 800 Delaware | Cut-off Date LTV: | | 70.8% |
| Wilmington, DE 19801 | | U/W NCF DSCR: | | 1.63x |
| | | U/W NOI Debt Yield: | | 11.0% |
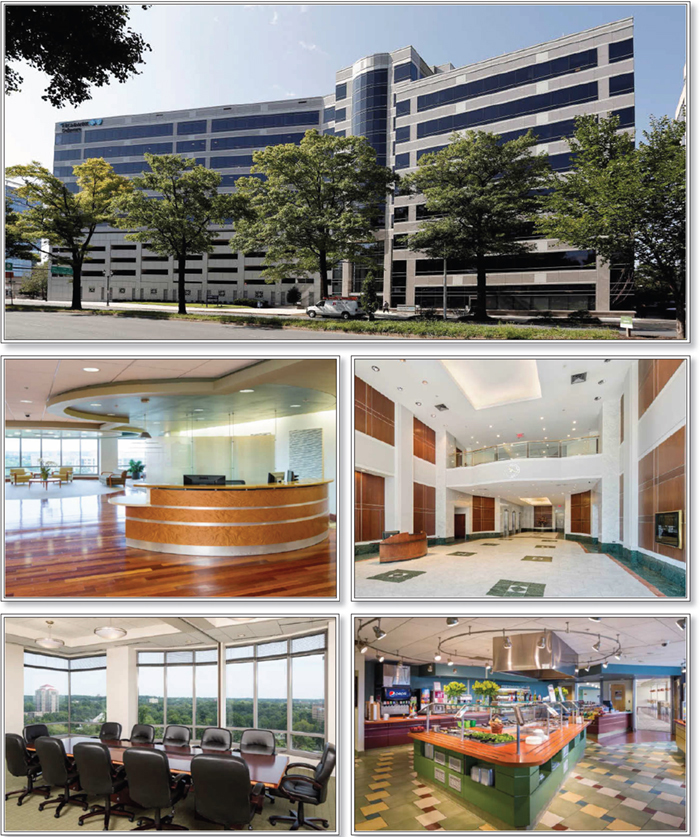
THE INFORMATION IN THIS STRUCTURAL AND COLLATERAL TERM SHEET IS NOT COMPLETE AND MAY BE AMENDED PRIOR TO THE TIME OF SALE. THIS TERM SHEET IS NOT AN OFFER TO SELL THESE SECURITIES AND IT IS NOT A SOLICITATION OF AN OFFER TO BUY THESE SECURITIES IN ANY JURISDICTION WHERE THE OFFER OR SALE IS NOT PERMITTED.
100
| Office - CBD | Loan #8 | Cut-off Date Balance: | | $27,000,000 |
| 800 Delaware Avenue | 800 Delaware | Cut-off Date LTV: | | 70.8% |
| Wilmington, DE 19801 | | U/W NCF DSCR: | | 1.63x |
| | | U/W NOI Debt Yield: | | 11.0% |
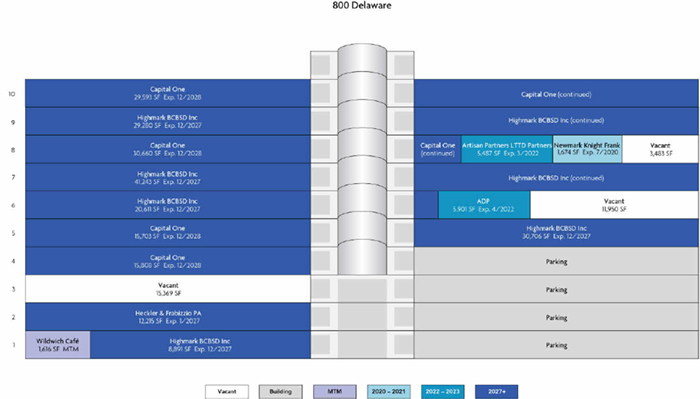
THE INFORMATION IN THIS STRUCTURAL AND COLLATERAL TERM SHEET IS NOT COMPLETE AND MAY BE AMENDED PRIOR TO THE TIME OF SALE. THIS TERM SHEET IS NOT AN OFFER TO SELL THESE SECURITIES AND IT IS NOT A SOLICITATION OF AN OFFER TO BUY THESE SECURITIES IN ANY JURISDICTION WHERE THE OFFER OR SALE IS NOT PERMITTED.
101
| Office - CBD | Loan #8 | Cut-off Date Balance: | | $27,000,000 |
| 800 Delaware Avenue | 800 Delaware | Cut-off Date LTV: | | 70.8% |
| Wilmington, DE 19801 | | U/W NCF DSCR: | | 1.63x |
| | | U/W NOI Debt Yield: | | 11.0% |

THE INFORMATION IN THIS STRUCTURAL AND COLLATERAL TERM SHEET IS NOT COMPLETE AND MAY BE AMENDED PRIOR TO THE TIME OF SALE. THIS TERM SHEET IS NOT AN OFFER TO SELL THESE SECURITIES AND IT IS NOT A SOLICITATION OF AN OFFER TO BUY THESE SECURITIES IN ANY JURISDICTION WHERE THE OFFER OR SALE IS NOT PERMITTED.
102
| No. 8 – 800 Delaware |
| |
| Mortgage Loan Information | | Mortgaged Property Information |
| Mortgage Loan Seller: | Barclays Capital Real Estate Inc. | | Single Asset/Portfolio: | Single Asset |
Credit Assessment
(DBRS/Fitch/Moody’s): | NR/NR/NR | | Property Type – Subtype: | Office – CBD |
| Original Principal Balance: | $27,000,000 | | Location: | Wilmington, DE |
| Cut-off Date Balance: | $27,000,000 | | Size: | 280,190 SF |
| % of Initial Pool Balance: | 3.8% | | Cut-off Date Balance Per SF: | $96.36 |
| Loan Purpose: | Recapitalization | | Maturity Date Balance Per SF: | $80.83 |
| Borrower Sponsor: | DOF VI REIT Holdings, LLC | | Year Built/Renovated: | 1967/2006 |
| Guarantor: | DOF VI REIT Holdings, LLC | | Title Vesting: | Fee/Leasehold |
| Mortgage Rate: | 3.8500% | | Property Manager: | G&E Real Estate Management Services, Inc. |
| Note Date: | October 1, 2019 | | Current Occupancy (As of): | 88.4% (9/6/2019) |
| Seasoning: | 1 month | | YE 2018 Occupancy: | 89.0% |
| Maturity Date: | October 6, 2029 | | YE 2017 Occupancy(2): | 90.4% |
| IO Period: | 24 months | | YE 2016 Occupancy(2)(3): | 70.2% |
| Loan Term (Original): | 120 months | | YE 2015 Occupancy(3): | 72.9% |
| Amortization Term (Original): | 360 months | | Appraised Value: | $38,150,000 |
| Loan Amortization Type: | Interest-only, Amortizing Balloon | | Appraised Value Per SF: | $136.16 |
| Call Protection: | L(25),D(88),O(7) | | Appraisal Valuation Date: | August 15, 2019 |
| Lockbox Type: | Springing | | Underwriting and Financial Information |
| Additional Debt: | No | | TTM NOI (7/31/2019)(5): | $2,090,438 |
| Additional Debt Type (Balance): | NAP | | YE 2018 NOI(4): | NAV |
| | | | YE 2017 NOI(6): | $2,627,832 |
| | | | YE 2016 NOI(6): | $3,697,405 |
| | | | U/W Revenues: | $5,368,344 |
| | | | U/W Expenses: | $2,410,223 |
| Escrows and Reserves(1) | | U/W NOI(6): | $2,958,122 |
| | Initial | Monthly | Cap | | U/W NCF: | $2,475,742 |
| Taxes | $69,984 | $69,984 | NAP | | U/W DSCR based on NOI/NCF: | 1.95x / 1.63x |
| Insurance | $0 | Springing | NAP | | U/W Debt Yield based on NOI/NCF: | 11.0% / 9.2% |
| Replacement Reserve | $0 | $4,670 | NAP | | U/W Debt Yield at Maturity based on NOI/NCF: | 13.1% / 10.9% |
| TI/LC Reserve | $0 | $23,349 | NAP | | Cut-off Date LTV Ratio: | 70.8% |
| Immediate Repairs | $85,313 | $0 | NAP | | LTV Ratio at Maturity: | 59.4% |
| ADP Rent Abatement Reserve | $11,611 | $0 | NAP | | | |
| Outstanding TI/LC Reserve | $68,600 | $0 | NAP | | | |
| | | | | | | | |
| Sources and Uses |
| Sources | | | | | Uses | | | |
| Original mortgage loan amount | $27,000,000 | | 100.0% | | Existing Debt | $0 | | 0.0% |
| | | | | | Upfront reserves | 235,507 | | 0.9 |
| | | | | | Closing costs | 751,330 | | 2.8 |
| | | | | | Return of equity | 26,013,163 | | 96.3 |
| Total Sources | $27,000,000 | | 100.0% | | Total Uses | $27,000,000 | | 100.0% |
| (1) | See “Escrows” below for a full description of the Escrows and Reserves. |
| (2) | The increase in occupancy from 2016 to 2017 was due to Capital One executing a lease for 91,764 square feet in June 2017. |
| (3) | 2015 and 2016 occupancy figures were primarily driven by three tenants vacating the property totalling 59,688 square feet. Prior to such events, occupancy was 93.1% in 2014. |
| (4) | YE 2018 NOI was incomplete due to the transfer of ownership during this period. |
| (5) | The increase in U/W NOI from TTM NOI (7/31/2019) is driven by a combination of in-place rent increases, contractual rent steps underwritten through August 2020 totaling $9,322, underwritten straight-lined rent for Highmark BDBSD Inc. and Capital One through their respective lease terms totaling $281,684, and an increase in total recoveries. |
(6) The decrease in Net Operating Income from 2016 to 2017 was primarily driven by Highmark BCBSD Inc contracting their space by 30,661 square feet in 2017 (backfilled by Capital One which was in a free rent period through 5/31/2018) and Highmark BDBSD Inc. receiving free rent from 10/1/2017 to 12/30/2017 as part of their renewal and term extension.
The Mortgage Loan. The mortgage loan (the “800 Delaware Mortgage Loan”) is evidenced by a single promissory note secured by a first mortgage encumbering the fee and leasehold interest in a 280,190 square foot office building located in Wilmington, Delaware (the “800 Delaware Property”).
THE INFORMATION IN THIS STRUCTURAL AND COLLATERAL TERM SHEET IS NOT COMPLETE AND MAY BE AMENDED PRIOR TO THE TIME OF SALE. THIS TERM SHEET IS NOT AN OFFER TO SELL THESE SECURITIES AND IT IS NOT A SOLICITATION OF AN OFFER TO BUY THESE SECURITIES IN ANY JURISDICTION WHERE THE OFFER OR SALE IS NOT PERMITTED.
103
| Office - CBD | Loan #8 | Cut-off Date Balance: | | $27,000,000 |
| 800 Delaware Avenue | 800 Delaware | Cut-off Date LTV: | | 70.8% |
| Wilmington, DE 19801 | | U/W NCF DSCR: | | 1.63x |
| | | U/W NOI Debt Yield: | | 11.0% |
The Borrower and Borrower Sponsor.The borrower is DOF VI Corporate Plaza, LLC, a Delaware limited liability company and single purpose entity. The borrower has one independent manager. Legal counsel to the borrower delivered a non-consolidation opinion in connection with the origination of the 800 Delaware Mortgage Loan. The non-recourse carve-out guarantor and borrower sponsor of the 800 Delaware Mortgage Loan is DOF VI REIT Holdings, LLC.
The borrower sponsor is DOF VI REIT Holdings, LLC, a $1.7 billion close-end fund managed by Torchlight Debt Opportunity Fund (Cayman) VI, L.P. (“Torchlight”). Since it was founded in 1995, Torchlight has acquired over $20 billion in commercial real estate debt investments and has approximately $3.6 billion of assets under management. In 1998, Torchlight launched its distressed debt workout business, Torchlight Loan Services. Torchlight Loan Services is a nationally rated special servicer and is the named special servicer on over $15.0 billion of structured commercial real estate debt. Torchlight has managed over 200 real estate assets across multiple property types and markets. Torchlight acquired the 800 Delaware Property through the purchase of a defaulted note in September 2018 which was previously securitized in the WBCMT 2007-C31 transaction. See “Description of the Mortgage Pool–Loan Purpose; Default History, Bankruptcy Issues and Other Proceedings” in the Preliminary Prospectus.
The Property.The 800 Delaware Property consists of a ten-story office building located in the central business district of Wilmington, Delaware. According to the borrower sponsor, the 800 Delaware Property was constructed in phases, starting with the west tower in 1967 (which was gut renovated in 1994 and 1995), the core tower and the parking garage in 1995 (the parking garage is not collateral for the 800 Delaware Mortgage Loan) and the east tower in 2007. Amenities include 24/7 secure building access, an efficient energy management system and a 37-foot ceiling lobby with an open balcony from the second floor and enclosed glass gallery from the third floor overlooking the lobby. The 800 Delaware Property offers large floor plates, typically about 35,200 square feet. The 800 Delaware Property is connected to a non-collateral, 513 space parking garage. A parking option agreement provides access to 400 spaces in the garage and expires on January 31, 2028 with two additional 10-year extension options, resulting in a parking ratio of 1.4 spaces per 1,000 square feet. As of September 6, 2019, the 800 Delaware Property was 88.4% leased to seven tenants.
Major Tenants.
Largest Tenant: Highmark BCBSD Inc. (130,731 square feet; 46.7% of net rentable area; 63.5% of underwritten base rent; 12/31/2027 lease expiration) – Highmark BCBSD Inc. (Moody’s/S&P: Baa2/A) is a subsidiary of Highmark Inc., an independent licensee of the Blue Cross Blue Shield Association. Highmark Inc. and its affiliates are collectively one of America’s largest health insurance organizations and operate in Pennsylvania, Delaware and West Virginia. Highmark Inc. serves approximately 4.5 million members through its BlueCard program. The 800 Delaware Property serves as Highmark’s regional headquarters for its Delaware insurance operations. Highmark BCBSD Inc. has been a tenant at the 800 Delaware Property since 2007, recently exercised a ten-year renewal in 2017 and has two, five-year renewal options remaining with at least 12 months prior notice to the landlord.
2ndLargest Tenant: Capital One (91,764 square feet; 32.8% of net rentable area; 24.0% of underwritten base rent; 12/31/2028 lease expiration)– Capital One (Moody’s/S&P/Fitch: Baa1/BBB/A-) is a diversified financial services holding company that offers a broad array of financial products and services to consumers, small businesses and commercial clients through its branches, the internet and other distribution channels. Capital One serves approximately 45 million banking customers and is one of the largest online direct banks in the United States by deposits. In addition to bank lending, treasury management and depository services, Capital One offers credit and debit card products, auto loans and other consumer lending products across the United States. According to a third party report, Capital One was the third largest issuer of Visa and MasterCard credit cards in the United States as of the end of 2018. Capital One has been a tenant at the 800 Delaware Property since 2017 when they consolidated 2,200 employees into 330,000 square feet of space at the 800 Delaware Property and 802 Delaware, an adjacent office. According to the borrower, Capital One has invested $14.2 million of their own money into their space at the 800 Delaware Mortgaged Property. Capital One has two, five-year renewal options remaining with 18 to 24 months’ notice to the landlord. Capital One has a contraction option in June 2024 to contract the lesser of 50% of its space or 45,000 square feet with 12 months’ prior notice. A cash flow sweep is required to commence 12 months prior to the contraction option if the tenant does not post cash or a letter of credit in an amount of $900,000. See the “Lockbox and Cash Management” section for further details.
THE INFORMATION IN THIS STRUCTURAL AND COLLATERAL TERM SHEET IS NOT COMPLETE AND MAY BE AMENDED PRIOR TO THE TIME OF SALE. THIS TERM SHEET IS NOT AN OFFER TO SELL THESE SECURITIES AND IT IS NOT A SOLICITATION OF AN OFFER TO BUY THESE SECURITIES IN ANY JURISDICTION WHERE THE OFFER OR SALE IS NOT PERMITTED.
104
| Office - CBD | Loan #8 | Cut-off Date Balance: | | $27,000,000 |
| 800 Delaware Avenue | 800 Delaware | Cut-off Date LTV: | | 70.8% |
| Wilmington, DE 19801 | | U/W NCF DSCR: | | 1.63x |
| | | U/W NOI Debt Yield: | | 11.0% |
The following table presents certain information relating to the tenancy at the 800 Delaware Property:
Major Tenants
| Tenant Name | Credit Rating
(Fitch/
Moody’s/
S&P)(1) | Tenant
NRSF | % of
NRSF | Annual U/W Base Rent PSF | Annual
U/W Base Rent(2) | % of Total Annual U/W Base Rent | Lease
Expiration
Date | Extension Options | Termination
Option
(Y/N) |
| Major Tenants | | | | | | | | |
| Highmark BCBSD Inc. | NR/Baa2/A | 130,731 | 46.7% | $16.42 | $2,146,878 | 63.5% | 12/31/2027 | 2, 5-year(4) | N |
| Capital One | A-/Baa1/BBB | 91,764 | 32.8% | $8.86 | $813,479 | 24.0% | 12/31/2028 | 2, 5-year(5) | Y(6) |
| Total Major Tenants | 222,495 | 79.4% | $13.31 | $2,960,356 | 87.5% | | | |
| | | | | | | | | |
| Non-Major Tenants | 25,277 | 9.0% | $16.72 | $422,682 | 12.5% | | | |
| | | | | | | | | |
| Occupied Collateral Total | 247,772 | 88.4% | $13.65 | $3,383,038 | 100.0% | | | |
| | | | | | | | | |
| Vacant Space(3) | 32,418 | 11.6% | | | | | | |
| | | | | | | | | |
| Collateral Total | 280,190 | 100.0% | | | | | | |
| | | | | | | | | | |
| (1) | Certain ratings are those of the parent company whether or not the parent company guarantees the lease. |
| (2) | Annual U/W Base Rent includes $9,322 of rent steps and $281,684 of straight-line rent for Highmark BCBSD Inc. and Capital One. |
| (3) | Vacant Space includes a 1,616 square foot café tenant that is leased on a month-to-month basis with no attributable underwritten base rent. |
| (4) | Highmark BCBSD Inc. has two, five-year renewal options at the value of 95% of the fair market rent. Additionally, Highmark BCBSD Inc. has a right of first offer on all the vacant space at the 800 Delaware Property. |
| (5) | Capital One has two, five-year renewal options. Base rent for the first renewal option will equal $12.75 per square foot with $0.25 increases on the anniversary of the commencement date of the first renewal term. Base rent for the second renewal option will equal 95% of fair market value. Capital One has a right of first offer on the vacant space in the building subject to prior rights of Highmark BCBSD Inc. |
| (6) | Capital One has the one-time option to terminate a portion of its lease on June 1, 2024, provided (i) Capital One notifies the landlord of its intent to terminate on or before June 1, 2023 and (ii) the terminated net rentable does not exceed the lesser of 50% of the total rentable square footage or 45,000 square feet and will include the entire 10th floor of the building. They do not have to pay a termination fee, but a cash flow sweep is required to commence twelve months prior to the contraction option if the tenant does not post cash or a letter of credit in an amount of $900,000. See “Lockbox and Cash Management” section for further details. |
The following table presents certain information relating to the lease rollover schedule at the 800 Delaware Property:
Lease Expiration Schedule(1)(2)
Year Ending
December 31, | No. of Leases Expiring | Expiring NRSF | % of Total NRSF | Cumulative Expiring NRSF | Cumulative % of Total NRSF | Annual
U/W
Base Rent(3) | % of Total Annual U/W Base Rent | Annual
U/W
Base Rent
PSF(3) |
| MTM | 1 | 1,616 | 0.6% | 1,616 | 0.6% | $0 | 0.0% | $0.00 |
| 2019 | 0 | 0 | 0.0% | 1,616 | 0.6% | $0 | 0.0% | $0.00 |
| 2020 | 1 | 1,674 | 0.6% | 3,290 | 1.2% | $47,106 | 1.4% | $28.14 |
| 2021 | 0 | 0 | 0.0% | 3,290 | 1.2% | $0 | 0.0% | $0.00 |
| 2022 | 2 | 11,388 | 4.1% | 14,678 | 5.2% | $262,781 | 7.8% | $23.08 |
| 2023 | 0 | 0 | 0.0% | 14,678 | 5.2% | $0 | 0.0% | $0.00 |
| 2024 | 0 | 0 | 0.0% | 14,678 | 5.2% | $0 | 0.0% | $0.00 |
| 2025 | 0 | 0 | 0.0% | 14,678 | 5.2% | $0 | 0.0% | $0.00 |
| 2026 | 0 | 0 | 0.0% | 14,678 | 5.2% | $0 | 0.0% | $0.00 |
| 2027 | 2 | 142,946 | 51.0% | 157,624 | 56.3% | $2,259,672 | 66.8% | $15.81 |
| 2028 | 1 | 91,764 | 32.8% | 249,388 | 89.0% | $813,479 | 24.0% | $8.86 |
| 2029 | 0 | 0 | 0.0% | 249,388 | 89.0% | $0 | 0.0% | $0.00 |
| Thereafter | 0 | 0 | 0.0% | 249,388 | 89.0% | $0 | 0.0% | $0.00 |
| Vacant | 0 | 30,802 | 11.0% | 280,190 | 100.0% | $0 | 0.0% | $0.00 |
| Total/Weighted Average | 7 | 280,190 | 100.0% | | | $3,383,038 | 100.0% | $13.65(4) |
| (1) | Information obtained from the underwritten rent roll. |
| (2) | Certain tenants may have lease termination options that are exercisable prior to the originally stated expiration date of the subject lease and that are not considered in the Lease Expiration Schedule. |
| (3) | Annual U/W Base Rent includes $9,322 of rent steps and $281,684 of straight-lined rent for Highmark BCBSD Inc. and Capital One. |
| (4) | Annual U/W Base Rent PSF excludes the 1,616 square foot of MTM space with no attributable base rent. |
THE INFORMATION IN THIS STRUCTURAL AND COLLATERAL TERM SHEET IS NOT COMPLETE AND MAY BE AMENDED PRIOR TO THE TIME OF SALE. THIS TERM SHEET IS NOT AN OFFER TO SELL THESE SECURITIES AND IT IS NOT A SOLICITATION OF AN OFFER TO BUY THESE SECURITIES IN ANY JURISDICTION WHERE THE OFFER OR SALE IS NOT PERMITTED.
105
| Office - CBD | Loan #8 | Cut-off Date Balance: | | $27,000,000 |
| 800 Delaware Avenue | 800 Delaware | Cut-off Date LTV: | | 70.8% |
| Wilmington, DE 19801 | | U/W NCF DSCR: | | 1.63x |
| | | U/W NOI Debt Yield: | | 11.0% |
The following table presents historical occupancy percentages at the 800 Delaware Property:
Historical Occupancy
12/31/2015(1) | 12/31/2016(1) (2) | 12/31/2017(2) | 12/31/2018 | 9/6/2019(3)(4) |
| 72.9% | 70.2% | 90.4% | 89.0% | 88.4% |
| (1) | 2015 and 2016 occupancy figures were primarily driven by three tenants vacating the 800 Delaware Property totalling 59,688 square feet. Prior to such events, occupancy was 93.1% in 2014. |
| (2) | The increase in occupancy from 2016 to 2017 is due to Capital One executing a lease for 91,764 square feet in June 2017. |
| (3) | Information obtained from the underwritten rent roll. |
| (4) | Current Occupancy excludes a 1,616 square foot café that is leased on a month-to-month basis. |
Operating History and Underwritten Net Cash Flow. The following table presents certain information relating to the historical operating performance and underwritten net cash flow at the 800 Delaware Property:
Cash Flow Analysis
| | 2016(1) | 2017(1) | TTM 7/31/2019(2) | U/W(2) | %(3) | U/W $ per
SF |
| Base Rent | $4,546,175 | $2,975,724 | $2,864,523 | $3,092,031 | 50.8% | $11.04 |
| Contractual Rent Steps(4) | 0 | 0 | 0 | 291,006 | 4.8 | 1.04 |
| Grossed Up Vacant Space | 0 | 0 | 0 | 723,847 | 11.9 | 2.58 |
| Gross Potential Rent | $4,546,175 | $2,975,724 | $2,864,523 | $4,106,884 | 67.4% | $14.66 |
| Other Income | 0 | 0 | 413 | 413 | 0.0 | 0.00 |
| Total Recoveries | 1,629,285 | 2,099,920 | 1,511,842 | 1,984,894 | 32.6 | 7.08 |
| Net Rental Income | $6,175,460 | $5,075,644 | $4,376,778 | $6,092,191 | 100.0% | $21.74 |
| (Vacancy & Credit Loss) | 0 | 0 | 0 | (723,847)(5) | (17.6) | (2.58) |
| Effective Gross Income | $6,175,460 | $5,075,644 | $4,376,778 | $5,368,344 | 88.1% | $19.16 |
| | | | | | | |
| Real Estate Taxes | 689,048 | 758,377 | 720,037 | 815,346 | 15.2 | 2.91 |
| Insurance | 67,125 | 73,942 | 49,484 | 68,194 | 1.3 | 0.24 |
| Management Fee | 255,534 | 218,880 | 85,728 | 161,050 | 3.0 | 0.57 |
| Other Operating Expenses | 1,466,348 | 1,396,613 | 1,431,091 | 1,365,633 | 25.4 | 4.87 |
| Total Operating Expenses | $2,478,055 | $2,447,812 | $2,286,340 | $2,410,223 | 44.9% | $8.60 |
| | | | | | | |
| Net Operating Income | $3,697,405 | $2,627,832 | $2,090,438 | $2,958,122 | 55.1% | $10.56 |
| Replacement Reserves | 0 | 0 | 0 | 56,038 | 1.0 | 0.20 |
| TI/LC | 0 | 0 | 0 | 426,342 | 7.9 | 1.52 |
| Net Cash Flow | $3,697,405 | $2,627,832 | $2,090,438 | $2,475,742 | 46.1% | $8.84 |
| | | | | | | |
| NOI DSCR | 2.43x | 1.73x | 1.38x | 1.95x | | |
| NCF DSCR | 2.43x | 1.73x | 1.38x | 1.63x | | |
| NOI Debt Yield | 13.7% | 9.7% | 7.7% | 11.0% | | |
| NCF Debt Yield | 13.7% | 9.7% | 7.7% | 9.2% | | |
| (1) | The decrease in Net Operating Income from 2016 to 2017 is primarily driven by Highmark BCBSD Inc. contracting their space by 30,661 square feet (backfilled by Capital One which was in a free rent period through 5/31/2018) and Highmark BCBSD Inc. receiving free rent from 10/1/2017 to 12/30/2017 as part of their renewal and term extension. |
| (2) | The increase in U/W NOI from TTM NOI (7/31/2019) is driven by a combination of in-place rent increases, contractual rent steps underwritten through August 2020 totaling $9,322, underwritten straight-lined rent for Highmark BDBSD Inc. and Capital One through their respective lease terms totaling $281,684, and an increase in total recoveries. |
| (3) | Represents (i) percent of Net Rental Income for all revenue fields, (ii) percent of Gross Potential Rent for Vacancy & Credit Loss and (iii) percent of Effective Gross Income for all other fields. |
| (4) | Contractual Rent Steps includes $9,322 of rent steps through August 2020 and $281,684 of straight-lined rent for Highmark BCBSD Inc. and Capital One. |
| (5) | The underwritten economic vacancy is 17.6%. The 800 Delaware Property was 88.4% physically occupied as of July 31, 2019. |
Appraisal.The appraiser concluded to an “as-is” appraised value of $38,150,000 as of August 15, 2019.
Environmental Matters. According to the Phase I environmental site assessment dated August 23, 2019, there was no evidence of any recognized environmental conditions at the 800 Delaware Property.
Market Overview and Competition.The 800 Delaware Property is located in the central business district of Wilmington, Delaware in New Castle County. Wilmington is the largest city in Delaware and one of the few cities in the United States that has no corporate
THE INFORMATION IN THIS STRUCTURAL AND COLLATERAL TERM SHEET IS NOT COMPLETE AND MAY BE AMENDED PRIOR TO THE TIME OF SALE. THIS TERM SHEET IS NOT AN OFFER TO SELL THESE SECURITIES AND IT IS NOT A SOLICITATION OF AN OFFER TO BUY THESE SECURITIES IN ANY JURISDICTION WHERE THE OFFER OR SALE IS NOT PERMITTED.
106
| Office - CBD | Loan #8 | Cut-off Date Balance: | | $27,000,000 |
| 800 Delaware Avenue | 800 Delaware | Cut-off Date LTV: | | 70.8% |
| Wilmington, DE 19801 | | U/W NCF DSCR: | | 1.63x |
| | | U/W NOI Debt Yield: | | 11.0% |
and sales tax. As a result, 50% of the world’s publicly traded companies and over 60% of Fortune 500 companies have locations in Wilmington according to a third party report. Additionally, Wilmington is accessible from other major cities on the eastern seaboard including Washington, D.C. (110 miles away), New York City (130 miles away), Philadelphia (30 miles away) and Baltimore (70 miles away). The 800 Delaware Property is located less than half a mile away from Interstate 95, a north/south interstate spanning from Maine to Florida, and is located approximately one mile from the Wilmington Amtrak station. Christiana Care’s Wilmington Hospital is directly across the street from the 800 Delaware Property. The 800 Delaware Property is only blocks away from Market Street, which is downtown Wilmington’s main corridor for restaurants and bars. Additionally, the 800 Delaware Property is located approximately one mile from Wilmington’s Riverfront, offering year-round attractions along its 1.3 mile riverfront including movies, mini golf, ice skating, museums, nature walks and beer gardens.
Submarket Information -According to the appraisal, the 800 Delaware Property is located in the Wilmington central business district office submarket of the Northern Delaware office market. As of the second quarter of 2019, the submarket contained 7.1 million square feet of office inventory with a vacancy rate of approximately 26.6%. The vacancy rate has recently increased driven by Bank of America exiting two of its three buildings in Wilmington totaling approximately 500,000 square feet. The asking rental rate for office space in the Wilmington central business district submarket is $25.56 per square foot.
The following table presents certain information relating to the appraiser’s market rent conclusions for the 800 Delaware Property:
Market Rent Summary(1)
| | Café | Large Office | Small Office |
| Market Rent (PSF) | $10.00 | $23.50 | $23.50 |
| Lease Term (Years) | 5 | 10 | 5 |
| Free Rent Months (New/Renewal) | 0/0 | 6/3 | 4/2 |
| Lease Type (Reimbursements) | None | Base Year | Base Year |
| Rent Increase Projection | None | 2.5% per annum | 2.5% per annum |
| Tenant Improvements (New Tenants) (PSF) | $0.00 | $25.00 | $15.00 |
| Tenant Improvements (Renewals) (PSF) | $0.00 | $10.00 | $5.00 |
| (1) | Information obtained from the appraisal. |
The table below presents certain information relating to comparable sales pertaining to the 800 Delaware Property identified by the appraiser:
Comparable Sales(1)
| Property Name | Location | Rentable Area (SF) | Sale Date | Sale Price | Sales Price (PSF) | Indicated Value (PSF) |
| Chemours Headquarters | Wilmington, DE | 283,069 | Jul-19 | $84,000,000 | $296.75 | $136.87 |
| Station Square | Silver Spring, MD | 500,348 | Jan-19 | $107,000,000 | $213.85 | $145.05 |
| 2000 Market Street | Philadelphia, PA | 665,274 | Jun-18 | $126,400,000 | $190.00 | $132.49 |
| 1650 Arch Street | Philadelphia, PA | 553,349 | May-18 | $78,000,000 | $140.96 | $133.91 |
| 120 East Baltimore | Baltimore, MD | 326,822 | Oct-17 | $32,800,000 | $100.36 | $121.18 |
| 802 Delaware Avenue | Wilmington, DE | 240,780 | May-17 | $34,000,000 | $141.21 | $133.44 |
| (1) | Information obtained from the appraisal. |
THE INFORMATION IN THIS STRUCTURAL AND COLLATERAL TERM SHEET IS NOT COMPLETE AND MAY BE AMENDED PRIOR TO THE TIME OF SALE. THIS TERM SHEET IS NOT AN OFFER TO SELL THESE SECURITIES AND IT IS NOT A SOLICITATION OF AN OFFER TO BUY THESE SECURITIES IN ANY JURISDICTION WHERE THE OFFER OR SALE IS NOT PERMITTED.
107
| Office - CBD | Loan #8 | Cut-off Date Balance: | | $27,000,000 |
| 800 Delaware Avenue | 800 Delaware | Cut-off Date LTV: | | 70.8% |
| Wilmington, DE 19801 | | U/W NCF DSCR: | | 1.63x |
| | | U/W NOI Debt Yield: | | 11.0% |
The following table presents certain information relating to comparable properties to 800 Delaware Property:
Comparable Leases(1)
| Property Name/Location | Year Built/ Renovated | Total GLA (SF) | Distance
from
Subject | Occupancy | Lease Term | Tenant Size (SF) | Annual Base
Rent PSF | TI Allowance PSF | Lease Type |
802 Delaware Avenue Wilmington, DE | 1987/NAP | 240,780 | 0.0 miles | 100.0% | 10.0 Yrs | 240,780 | $8.25 | None | NNN |
222 Delaware Avenue Wilmington, DE | 1987/NAP | 294,757 | 0.3 miles | 68.5% | 6.5 Yrs/5.0 Yrs | 30,614/3,344 | $22.00/$24.00 | $25.00/$5.00 | Base Plus Electric |
1000 North West Street Wilmington, DE | 1969/NAP | 435,594 | 0.3 miles | 62.5% | 7.6 Yrs | 21,625 | $19.50 | $45.00 | Base Plus Electric |
1007 North Orange Street Wilmington, DE | 1941/NAV | 551,488 | 0.4 miles | 86.0% | 10.3 Yrs/5.0 Yrs | 9,401/71,840 | $22.00/$22.00 | $15.00/Turnkey | Base Plus Electric |
1201 North Market Street Wilmington, DE | 1988/NAP | 441,341 | 0.5 miles | 100.0% | 5.0 Yrs/10.5 Yrs | 4,753/15,227 | $29.50/$30.85 | $10.00/Turnkey | Base Plus Electric |
1105 North Market Street Wilmington, DE | 1970/NAP | 169,494 | 0.5 miles | 87.2% | 5.3 Yrs/5.4 Yrs | 5,968/5,968 | $21.50/$19.50 | Turnkey/$51.00 | Base Plus Electric |
1313 North Market Street Wilmington, DE | 1984/NAP | 530,867 | 0.6 miles | 64.8% | 5.9 Yrs/10.0 Yrs | 25,432/22,319 | $24.50/$26.00 | $15.00/$35.00 | Base Plus Electric |
600 North King Street Wilmington, DE | 1985/NAP | 161,829 | 0.8 miles | 72.5% | 7.0 Yrs/10.5 Yrs | 2,568/27,055 | $24.50/$23.00 | $30.00/$40.00 | Base Plus Electric |
| (1) | Information obtained from appraisal. |
Escrows.
Immediate Repairs –At origination, the borrower was required to escrow $85,313 for immediate repairs at the 800 Delaware Property.
Real Estate Taxes –At origination, the borrower was required to escrow $69,984 for real estate taxes. The borrower is required to make monthly payments of one-twelfth of the taxes payable during the next twelve months, currently equal to $69,984.
Insurance – The borrower will not be required to make monthly payments of one-twelfth of the insurance premiums the lender estimates will be payable during the next twelve months as long as the borrower maintains a blanket policy acceptable to the lender.
Replacement Reserve – The borrower is required to make monthly payments of $4,670 into the replacement reserve account.
TI/LC Reserve –The borrower will be required to make monthly deposits of $23,349 into the TI/LC reserve account.
Outstanding TI/LC Reserve –The borrower is required to deposit $68,600 of outstanding tenant improvements and leasing commissions. The outstanding TI/LC funds will be disbursed to the borrower upon delivery of a clean estoppel from the respective tenant evidencing that all tenant improvements and leasing commissions have been completed and that there are no defaults under the lease.
ADP Rent Abatement Reserve –The borrower is required to deposit $11,611 into a rent abatement reserve for the ADP lease.
Lockbox and Cash Management.A springing lockbox is required for the 800 Delaware Mortgage Loan. The springing lockbox will be established upon the occurrence of a Trigger Period (as defined below). During the continuance of a Trigger Period, the borrower is required to deposit, or cause to be deposited, all rents into the lockbox account within one business day of receipt. Additionally, upon the occurrence of a Trigger Period, the borrower is required to establish a cash management account into which all funds deposited into the lockbox account will be transferred to be disbursed in accordance with the 800 Delaware Mortgage Loan documents. Any remaining funds after such disbursements are required to be (i) during a Low DSCR Period (as defined below), a CapOne Trigger Event (as defined below) or a Highmark Trigger Event (as defined below), deposited into an excess cash reserve account, the Capital One rollover reserve account or the Highmark BCBSD Inc. rollover account, as the case may be, and otherwise, (ii) to the borrower if no event of default has occurred and is continuing.
A “Trigger Period” will commence upon the earliest to occur of the following:
| (i) | an event of default under the 800 Delaware Mortgage Loan documents; |
| (iii) | a Highmark Trigger Event; or |
| (iv) | a CapOne Trigger Event. |
THE INFORMATION IN THIS STRUCTURAL AND COLLATERAL TERM SHEET IS NOT COMPLETE AND MAY BE AMENDED PRIOR TO THE TIME OF SALE. THIS TERM SHEET IS NOT AN OFFER TO SELL THESE SECURITIES AND IT IS NOT A SOLICITATION OF AN OFFER TO BUY THESE SECURITIES IN ANY JURISDICTION WHERE THE OFFER OR SALE IS NOT PERMITTED.
108
| Office - CBD | Loan #8 | Cut-off Date Balance: | | $27,000,000 |
| 800 Delaware Avenue | 800 Delaware | Cut-off Date LTV: | | 70.8% |
| Wilmington, DE 19801 | | U/W NCF DSCR: | | 1.63x |
| | | U/W NOI Debt Yield: | | 11.0% |
A Trigger Period will end upon the occurrence of:
| ● | with regard to clause (i) above, the cure of such event of default; |
| ● | with regard to clause (ii) above, the cure of a Low DSCR Period; |
| ● | with regard to clause (iii) above, a Highmark Re-Tenanting Event (as defined below); or |
| ● | with regard to clause (iii) above, a CapOne Re-Tenanting Event (as defined below). |
A “Low DSCR Period” will commence upon the last day of any two consecutive calendar quarters for which the debt service coverage ratio is less than 1.15x based on a thirty year amortization schedule and will end upon the last day of any two consecutive calendar quarters thereafter for each of which the debt service coverage ratio is greater than or equal to 1.20x based on a thirty year amortization schedule.
A “Highmark Trigger Event” will commence upon the occurrence of:
| (i) | the earliest to occur of (provided a Highmark Re-Tenanting Event has not occurred): |
| a. | December 31, 2026 (12 months prior to its lease expiration); |
| b. | Highmark giving notice that it intends to terminate its lease pursuant to the terms of its; or |
| c. | Highmark giving notice to the borrower in writing of its intent not to renew its lease pursuant to the terms of its lease; |
| (ii) | Highmark vacating or abandoning 30% or more of its leased space (sweep capped at $1.3 million if vacating or abandoning 30% to 49%) provided that a Highmark Re-Tenanting Event has not occurred; |
| (iii) | Highmark, any parent company or any guarantor of its lease filing for bankruptcy, insolvency, or reorganization; |
| (iv) | the Highmark lease having in fact been terminated provided a Highmark Re-Tenanting Event has not occurred; or |
| (v) | Highmark being in default under its lease, which default remains uncured past the applicable notice and grace periods set forth in the lease. |
A “Highmark Re-Tenanting Event” will occur when the borrower has delivered to the lender:
| (i) | evidence reasonably satisfactory to the lender that (a) Highmark has given notice of renewal under the terms of its lease (a tenant estoppel will not be required if Highmark has given notice of renewal under the terms of its lease); or (b) at least 85% or more of the Highmark space has been re-tenanted under one or more Qualified Replacement Leases (as defined below); and |
| (ii) | tenant estoppel(s) reasonably satisfactory to the lender. |
A “CapOne Trigger Event” will commence upon the earliest of:
| (i) | the earliest to occur of (provided a CapOne Re-Tenanting Event has not occurred) (sweep would be capped at $2.2 million): |
| a. | July 1, 2027 (18 months prior to its lease expiration), |
| b. | Capital One giving notice that it intends to terminate its lease, or |
| c. | Capital One giving notice to the borrower in writing of its intent not to renew its lease; |
| (ii) | the earliest to occur of (sweep would be capped at $900,000): |
| a. | June 1, 2023 (12 months prior to its contraction option); or |
| b. | Capital One giving notice that it intends to exercise its option to contract its space pursuant to its lease; |
| (iii) | Capital One vacating or abandoning 50% or more of its leased space; |
| (iv) | Capital One, any parent company or any guarantor of its lease filing for bankruptcy, insolvency, or reorganization; |
| (v) | the Capital One lease having in fact been terminated, provided that at CapOne Re-Tenanting Event has not occurred; |
| (vi) | Capital One becoming delinquent under the payment obligations of its lease or is in material default under its lease, which delinquency or default remains uncured past the applicable notice and grace periods set forth in the lease. |
A “CapOne Re-Tenanting Event” will occur when the borrower has delivered to the lender:
| (i) | evidence reasonably satisfactory to the lender that (a) Capital One has given notice of renewal under the terms of its lease; (b) at least 85% or more of the Capital One space has been re-tenanted under one or more Qualified Replacement Leases; and |
| (ii) | tenant estoppel(s) reasonably satisfactory to the lender. |
Additionally, in lieu of a cash sweep due to a Capital One or Highmark not renewing their lease, Capital One exercising its contraction option or Highmark going dark on between 30% to 49% of its space, the borrower has the option to deposit an amount equal to the Sweep Avoidance Amount (as defined below) in cash or a letter of credit within 10 days. The “Sweep Avoidance Amount” is equal to $1,900,000 if Capital One does not renew its lease, $900,000 if Capital One exercises its contraction option, and $1,300,000 if Highmark BCBSD Inc. goes dark on between 30% to 49% of its space or does not renew its lease.
A “Qualified Replacement Lease” means a lease (i) with a term no less than five years (without any termination options); (ii) with a tenant reasonably acceptable to the lender; (iii) containing rental rates of the greater of (a) 85% of the highest rental rate per square foot of the lease being replaced and (b) the then-current market rate per square foot as determined by the lender; (iv) that does not have a material adverse effect on the use, value, or operation of the 800 Delaware Property; (v) that is an arms-length transaction with a bona-fide independent third party tenant; (vi) that is in compliance with the 800 Delaware Mortgage Loan documents; and (vii) that is otherwise on market terms and is reasonably acceptable to the lender.
THE INFORMATION IN THIS STRUCTURAL AND COLLATERAL TERM SHEET IS NOT COMPLETE AND MAY BE AMENDED PRIOR TO THE TIME OF SALE. THIS TERM SHEET IS NOT AN OFFER TO SELL THESE SECURITIES AND IT IS NOT A SOLICITATION OF AN OFFER TO BUY THESE SECURITIES IN ANY JURISDICTION WHERE THE OFFER OR SALE IS NOT PERMITTED.
109
| Office - CBD | Loan #8 | Cut-off Date Balance: | | $27,000,000 |
| 800 Delaware Avenue | 800 Delaware | Cut-off Date LTV: | | 70.8% |
| Wilmington, DE 19801 | | U/W NCF DSCR: | | 1.63x |
| | | U/W NOI Debt Yield: | | 11.0% |
Property Management. The 800 Delaware Property is managed by G&E Real Estate Management Services, Inc., doing business as Newmark Knight Frank.
Partial Release. Not permitted.
Real Estate Substitution.Not permitted.
Subordinate and Mezzanine Indebtedness.None.
Ground Lease. The parking garage (non-collateral), the first floor atrium and elevator area of the office building and the land underlying a loading dock expansion area are subject to a ground lease. The ground lease commenced in March 2007 and expires on the earlier of (i) March 2106 or (ii) the date on which the ground lessee acquires the fee simple title to the premises as provided in the purchase option agreement and subject to the 800 Delaware Mortgage Loan documents. Provided that no event of default has occurred, the ground lessee has unlimited 99-year renewal options under the ground lease. The ground rent is $1.00 per annum, and the ground lessee paid $99.00 upfront to cover the ground rent for the entire 99-year term.
Terrorism Insurance.The 800 Delaware Mortgage Loan documents require that the “all risk” insurance policy required to be maintained by the borrower provides coverage for terrorism in an amount equal to the full replacement cost of the 800 Delaware Property, as well as business interruption insurance covering no less than the 18-month period following the occurrence of a casualty event, together with a 6-month extended period of indemnity.
THE INFORMATION IN THIS STRUCTURAL AND COLLATERAL TERM SHEET IS NOT COMPLETE AND MAY BE AMENDED PRIOR TO THE TIME OF SALE. THIS TERM SHEET IS NOT AN OFFER TO SELL THESE SECURITIES AND IT IS NOT A SOLICITATION OF AN OFFER TO BUY THESE SECURITIES IN ANY JURISDICTION WHERE THE OFFER OR SALE IS NOT PERMITTED.
110
(THIS PAGE INTENTIONALLY LEFT BLANK)
THE INFORMATION IN THIS STRUCTURAL AND COLLATERAL TERM SHEET IS NOT COMPLETE AND MAY BE AMENDED PRIOR TO THE TIME OF SALE. THIS TERM SHEET IS NOT AN OFFER TO SELL THESE SECURITIES AND IT IS NOT A SOLICITATION OF AN OFFER TO BUY THESE SECURITIES IN ANY JURISDICTION WHERE THE OFFER OR SALE IS NOT PERMITTED.
111
| Industrial – Distribution | Loan #9 | Cut-off Date Balance: | | $23,200,000 |
| 201 Waverly Boulevard | Martin Brower | Cut-off Date LTV: | | 62.7% |
| Coatesville, PA 19320 | | U/W NCF DSCR: | | 1.66x |
| | | U/W NOI Debt Yield: | | 10.2% |
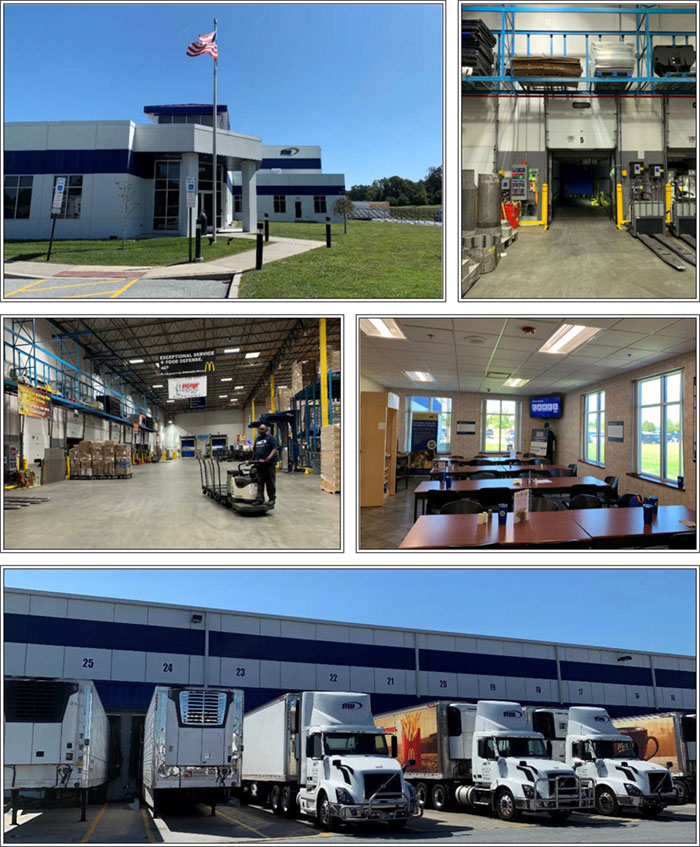
THE INFORMATION IN THIS STRUCTURAL AND COLLATERAL TERM SHEET IS NOT COMPLETE AND MAY BE AMENDED PRIOR TO THE TIME OF SALE. THIS TERM SHEET IS NOT AN OFFER TO SELL THESE SECURITIES AND IT IS NOT A SOLICITATION OF AN OFFER TO BUY THESE SECURITIES IN ANY JURISDICTION WHERE THE OFFER OR SALE IS NOT PERMITTED.
112
| Industrial – Distribution | Loan #9 | Cut-off Date Balance: | | $23,200,000 |
| 201 Waverly Boulevard | Martin Brower | Cut-off Date LTV: | | 62.7% |
| Coatesville, PA 19320 | | U/W NCF DSCR: | | 1.66x |
| | | U/W NOI Debt Yield: | | 10.2% |
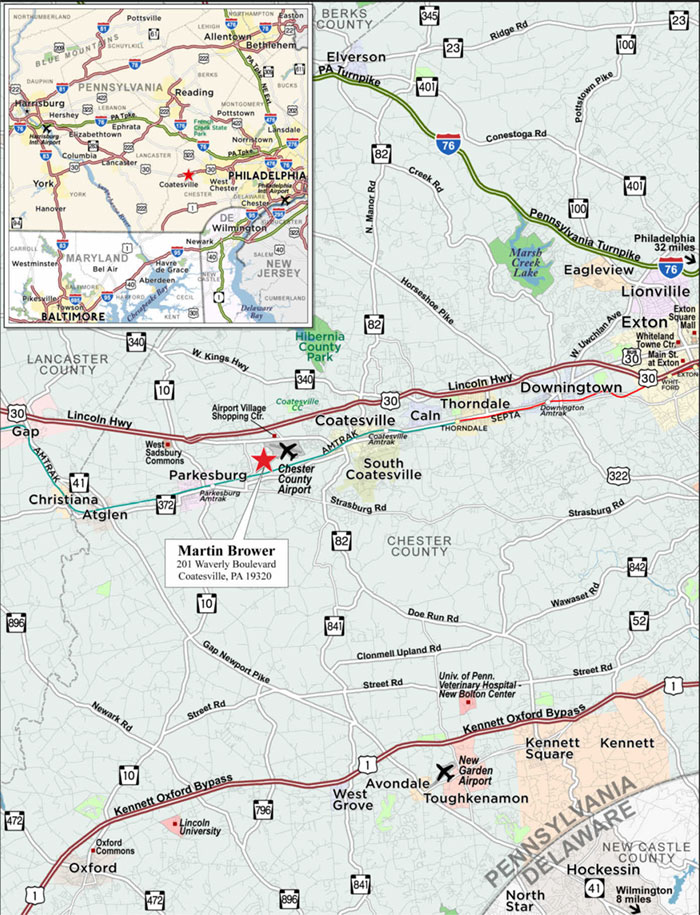
THE INFORMATION IN THIS STRUCTURAL AND COLLATERAL TERM SHEET IS NOT COMPLETE AND MAY BE AMENDED PRIOR TO THE TIME OF SALE. THIS TERM SHEET IS NOT AN OFFER TO SELL THESE SECURITIES AND IT IS NOT A SOLICITATION OF AN OFFER TO BUY THESE SECURITIES IN ANY JURISDICTION WHERE THE OFFER OR SALE IS NOT PERMITTED.
113
| No. 9 – Martin Brower |
| |
| Mortgage Loan Information | | Mortgaged Property Information |
| Mortgage Loan Seller: | Ladder Capital Finance | | Single Asset/Portfolio: | Single Asset |
Credit Assessment (DBRS/Fitch/Moody’s): | NR/NR/NR | | Property Type – Subtype: | Industrial– Distribution |
| Original Principal Balance: | $23,200,000 | | Location: | Coatesville, PA |
| Cut-off Date Balance: | $23,200,000 | | Size: | 152,854 SF |
| % of Initial Pool Balance: | 3.3% | | Cut-off Date Balance Per SF(2): | $151.78 |
| Loan Purpose: | Acquisition | | Maturity Date Balance Per SF(2): | $138.37 |
| Borrower Sponsor: | Christopher Beavor | | Year Built/Renovated: | 2009/NAP |
| Guarantors(1): | Various | | Title Vesting: | Fee |
| Mortgage Rate: | 4.270% | | Property Manager: | Self-managed |
| Note Date: | October 2, 2019 | | Current Occupancy (As of): | 100.0% (11/1/2019) |
| Seasoning: | 1 month | | YE 2018 Occupancy: | 100.0% |
| | | | YE 2017 Occupancy: | 100.0% |
| Maturity Date: | October 6, 2029 | | YE 2016 Occupancy: | 100.0% |
| IO Period: | 60 months | | YE 2015 Occupancy: | 100.0% |
| Loan Term (Original): | 120 months | | Appraised Value: | $37,000,000 |
| Amortization Term (Original): | 360 months | | Appraised Value Per SF: | $242.06 |
| Loan Amortization Type: | Interest-only, Amortizing Balloon | | Appraisal Valuation Date: | August 16, 2019 |
| Call Protection: | L(25), D(92),O(3) | | | |
| Lockbox Type: | Hard/Upfront Cash Management | | Underwriting and Financial Information |
| Additional Debt(2)(3): | Yes | | TTM NOI(5): | NAV |
| Additional Debt Type (Balance)(2)(3): | Mezzanine ($7,500,000) | | YE 2018 NOI(5): | NAV |
| | | | YE 2017 NOI(5): | NAV |
| | | | YE 2016 NOI(5): | NAV |
| | | | U/W Revenues: | $2,779,876 |
| | | | U/W Expenses: | $407,823 |
| Escrows and Reserves(4) | | U/W NOI: | $2,372,053 |
| | Initial | Monthly | Cap | | U/W NCF: | $2,272,698 |
| Taxes | $0 | Springing | NAP | | U/W DSCR based on NOI/NCF(2): | 1.73x / 1.66x |
| Insurance | $4,321 | Springing | NAP | | U/W Debt Yield based on NOI/NCF(2): | 10.2% / 9.8% |
| Replacement Reserve | $0 | $1,911 | NAP | | U/W Debt Yield at Maturity based on NOI/NCF: | 11.2% / 10.7% |
| TI/LC Reserve | $0 | $6,369 | NAP | | Cut-off Date LTV Ratio(2): | 62.7% |
| Deferred Maintenance | $11,125 | $0 | NAP | | LTV Ratio at Maturity(2): | 57.2% |
| | | | | | | |
| | | | | | | | |
| Sources and Uses |
| Sources | | | | | Uses | | | |
| Original loan amount | $23,200,000 | | 61.4 | % | | Purchase Price | $36,850,000 | | 97.5 | % |
| Mezzanine loan | 7,500,000 | | 19.8 | | | Upfront reserves | 15,446 | | 0.0 | |
| Borrower equity | 7,108,494 | | 18.8 | | | Closing costs | 943,048 | | 2.5 | |
| | | | | | | | | |
| Total Sources | $37,808,494 | | 100.0 | % | | Total Uses | $37,808,494 | | 100.0 | % |
| (1) | See “The Borrower and Borrower Sponsor” section below. |
| (2) | Based on the Martin Brower Mortgage Loan and the Martin Brower Mezzanine Loan, together, the Cut-off Date Balance Per SF, Maturity Date Balance Per SF, U/W Debt Yield based on NOI/NCF, U/W DSCR based on NOI/NCF, Cut-off Date LTV Ratio and LTV Ratio at Maturity are $201, $201, 7.7%, 7.4%, 1.04x (1.23x IO), 0.99x (1.18x IO), 83.0% and 83.0%, respectively. |
| (3) | See “Subordinate and Mezzanine Indebtedness” section below. |
| (4) | See “Escrows” section below. |
| (5) | Historical financials are unavailable as the Martin Brower Property (as defined below) was acquired in 2019 and is 100% leased to a single tenant on a triple-net lease. |
The Mortgage Loan. The mortgage loan (the “Martin Brower Mortgage Loan”) is evidenced by a single promissory note secured by a first mortgage encumbering the borrower’s fee interest in a 152,854 square foot industrial building located in Coatesville, Pennsylvania (the “Martin Brower Property”).
The Borrower and Borrower Sponsor.The borrower is CAI Investments Coatesville, DST, a single purpose entity with one independent director. The Martin Brower Property is subject to a triple net master lease between the borrower, as landlord, and CAI Investments Coatesville Master Lessee, LLC, as tenant (the “Master Tenant”). The Master Tenant is 100% owned and controlled by the non-recourse guarantor. Furthermore, the Master Tenant has (a) executed the Martin Bower Mortgage Loan agreement, to consent to
THE INFORMATION IN THIS STRUCTURAL AND COLLATERAL TERM SHEET IS NOT COMPLETE AND MAY BE AMENDED PRIOR TO THE TIME OF SALE. THIS TERM SHEET IS NOT AN OFFER TO SELL THESE SECURITIES AND IT IS NOT A SOLICITATION OF AN OFFER TO BUY THESE SECURITIES IN ANY JURISDICTION WHERE THE OFFER OR SALE IS NOT PERMITTED.
114
| Industrial – Distribution | Loan #9 | Cut-off Date Balance: | | $23,200,000 |
| 201 Waverly Boulevard | Martin Brower | Cut-off Date LTV: | | 62.7% |
| Coatesville, PA 19320 | | U/W NCF DSCR: | | 1.66x |
| | | U/W NOI Debt Yield: | | 10.2% |
the various applicable terms thereof related to operation of the Martin Brower Property and other relevant provisions, and (b) executed an assignment and subordination of master lease documents which, among other things, provide the lender with the right to terminate the master lease upon an event of default under the Martin Brower Mortgage Loan documents. The Master Tenant has in turn leased the Martin Brower Property to Martin Brower and will be obligated to cause all rental payments to be deposited into a clearing account. The Master Tenant also serves as a co-non-recourse guarantor for the Martin Brower Mortgage Loan. See“Description of the Mortgage Pool—Delaware Statutory Trusts”in the Preliminary Prospectus.
Legal counsel to the borrower delivered a non-consolidation opinion in connection with the origination of the Martin Brower Mortgage Loan. The non-recourse carve-out guarantors are Life Pillars, LLC, Four Pillars Legacy Trust, Christopher Beavor, and CAI Investments Coatesville Master Lessee, LLC, and the borrower sponsor is Christopher Beavor. Mr. Beavor is the manager and founder of CAI Investments, which is focused on financing, developing and managing properties across various markets in the United States. With over 22 years of real estate and development experience, Mr. Beavor has completed over 200 real estate transactions over the past 10 years. Mr. Beavor has developed approximately $150 million in real estate projects within the United States and Europe and manages over 1,000 real estate assets for over 150 clients.
The Property.The Martin Brower Property consists of a LEED Certified 152,854 square foot industrial cold/freezer distribution property located in Coatesville, Pennsylvania. Built in 2009 and located on a 20.4 acre site, the Martin Brower Property features 32 foot clearances with adequate loading, approximately 32,405 square feet of cooler space and 22,507 square feet of freezer space. The Martin Brower Property also features a 7,850 square foot truck repair garage and on site fueling station. As of November 1, 2019, the Martin Brower Property was 100% leased to The Martin-Brower Company, LLC (“Martin Brower”) through August 2029 with no termination options.
Sole Tenant.
Martin Brower (152,854 square feet; 100.0% of net rentable area; 100.0% of underwritten base rent; 8/30/2019 lease expiration) –Martin Brower, a division of Reyes Holdings, LLC (“Reyes Holdings”), is a global quick service restaurant distribution business and the largest supplier worldwide of distribution services to the McDonald’s restaurant system. Martin Brower has over 11,000 employees and services over 25,000 restaurants in 19 countries around the world. Founded in 1976, Reyes Holdings is the ninth largest privately owned company in the United States according to the appraisal. Annually, the company delivers more than 1.3 billion cases of beverage and food products from over 170 locations around the world with annual sales exceeding $33.0 billion. Reyes Holdings employs more than 33,000 people and has five business units including Reyes Beer Division, Martin Brower, Reinhart FoodService, Great Lakes, Coca-Cola Bottling, and Reyes Coca-Cola Bottling, which collectively produce and deliver across 43 states in the United States. The Martin Brower lease is fully guaranteed by Reyes Holdings.
The following table presents certain information relating to the tenancy at the Martin Brower Property:
Major Tenant
| Tenant Name | Credit Rating (Fitch/
Moody’s/
S&P) | Tenant
NRSF | % of
NRSF | Annual Base U/W Rent PSF(1) | Annual Base
U/W Rent(1)(2) | % of Total Annual U/W Rent | Lease
Expiration
Date | Extension Options | Termination Option (Y/N) |
| Major Tenant | | | | | | | | |
| Martin Brower(3)(4) | NR/NR/NR | 152,854 | 100.0% | $16.48 | $2,518,362 | 100.0% | 8/30/2029 | 2, 5-year | N |
| | | | | | | | | |
| Vacant Space | 0 | 0.0% | | | | | | |
| | | | | | | | | |
| Collateral Total | 152,854 | 100.0% | | | | | | |
| | | | | | | | | | |
| (1) | Annual U/W Base Rent PSF and Annual U/W Base Rent include contractual rent steps through September 2020 totaling $37,217. |
| (2) | Information obtained from the underwritten rent roll. |
| (3) | Martin Brower is a wholly owned subsidiary of Reyes Holdings. The lease is fully guaranteed by Reyes Holdings. |
| (4) | Martin Brower subleases approximately 7,850 square feet to Penske Trucking for truck maintenance at a base rent of $11.46 per square foot. |
THE INFORMATION IN THIS STRUCTURAL AND COLLATERAL TERM SHEET IS NOT COMPLETE AND MAY BE AMENDED PRIOR TO THE TIME OF SALE. THIS TERM SHEET IS NOT AN OFFER TO SELL THESE SECURITIES AND IT IS NOT A SOLICITATION OF AN OFFER TO BUY THESE SECURITIES IN ANY JURISDICTION WHERE THE OFFER OR SALE IS NOT PERMITTED.
115
| Industrial – Distribution | Loan #9 | Cut-off Date Balance: | | $23,200,000 |
| 201 Waverly Boulevard | Martin Brower | Cut-off Date LTV: | | 62.7% |
| Coatesville, PA 19320 | | U/W NCF DSCR: | | 1.66x |
| | | U/W NOI Debt Yield: | | 10.2% |
The following table presents certain information relating to the lease rollover schedule at the Martin Brower Property:
Lease Expiration Schedule(1)
Year Ending
December 31, | No. of Leases Expiring | Expiring NRSF(2) | % of Total NRSF | Cumulative Expiring NRSF | Cumulative % of Total NRSF | Annual
U/W
Rent(3) | % of Total Annual U/W Rent | Annual
U/W
Rent
PSF(3) |
| MTM | 0 | 0 | 0.0% | 0 | 0.0% | $0 | 0.0% | $0.00 |
| 2019 | 0 | 0 | 0.0% | 0 | 0.0% | $0 | 0.0% | $0.00 |
| 2020 | 0 | 0 | 0.0% | 0 | 0.0% | $0 | 0.0% | $0.00 |
| 2021 | 0 | 0 | 0.0% | 0 | 0.0% | $0 | 0.0% | $0.00 |
| 2022 | 0 | 0 | 0.0% | 0 | 0.0% | $0 | 0.0% | $0.00 |
| 2023 | 0 | 0 | 0.0% | 0 | 0.0% | $0 | 0.0% | $0.00 |
| 2024 | 0 | 0 | 0.0% | 0 | 0.0% | $0 | 0.0% | $0.00 |
| 2025 | 0 | 0 | 0.0% | 0 | 0.0% | $0 | 0.0% | $0.00 |
| 2026 | 0 | 0 | 0.0% | 0 | 0.0% | $0 | 0.0% | $0.00 |
| 2027 | 0 | 0 | 0.0% | 0 | 0.0% | $0 | 0.0% | $0.00 |
| 2028 | 0 | 0 | 0.0% | 0 | 0.0% | $0 | 0.0% | $0.00 |
| 2029 | 1 | 152,854 | 100.0% | 152,854 | 100.0% | $2,518,362 | 100.0% | $16.48 |
| Thereafter | 0 | 0 | 0.0% | 152,854 | 100.0% | $0 | 0.0% | $0.00 |
| Vacant | 0 | 0 | 0.0% | 152,854 | 100.0% | $0 | 0.0% | $0.00 |
| Total/Weighted Average | 1 | 152,854 | 100.0% | | | $2,518,362 | 100.0% | $16.48 |
| (1) | Information obtained from the underwritten rent roll. |
The following table presents historical occupancy percentages at the Martin Brower Property:
Historical Occupancy
12/31/2015(1) | 12/31/2016(1) | 12/31/2017(1) | 12/31/2018(1) | 11/1/2019(2) |
| 100.0% | 100.0% | 100.0% | 100.0% | 100.0% |
| (1) | Information obtained from the borrower. The Martin Brower Property has been leased to Martin Brower since 2008. |
| (2) | Information obtained from the underwritten rent roll. |
THE INFORMATION IN THIS STRUCTURAL AND COLLATERAL TERM SHEET IS NOT COMPLETE AND MAY BE AMENDED PRIOR TO THE TIME OF SALE. THIS TERM SHEET IS NOT AN OFFER TO SELL THESE SECURITIES AND IT IS NOT A SOLICITATION OF AN OFFER TO BUY THESE SECURITIES IN ANY JURISDICTION WHERE THE OFFER OR SALE IS NOT PERMITTED.
116
| Industrial – Distribution | Loan #9 | Cut-off Date Balance: | | $23,200,000 |
| 201 Waverly Boulevard | Martin Brower | Cut-off Date LTV: | | 62.7% |
| Coatesville, PA 19320 | | U/W NCF DSCR: | | 1.66x |
| | | U/W NOI Debt Yield: | | 10.2% |
Operating History and Underwritten Net Cash Flow. The following table presents certain information relating to the operating performance and underwritten net cash flow at the Martin Brower Property:
Cash Flow Analysis(1)
| | U/W | | %(2) | | U/W $ per SF | |
| Base Rent | $2,481,145 | | 84.8% | | $16.23 | |
| Contractual Rent Steps | 37,217 | | 1.3 | | 0.24 | |
| Grossed Up Vacant Space | 0 | | 0.0 | | 0.00 | |
| Gross Potential Rent | $2,518,362 | | 86.1% | | $16.48 | |
| Other Income | 0 | | 0.0 | | 0.00 | |
| Total Recoveries | 407,823 | | 13.9 | | 2.67 | |
| Net Rental Income | $2,926,185 | | 100.0% | | $19.14 | |
| (Vacancy & Credit Loss)(3) | (146,309) | | (5.8) | | (0.96) | |
| Effective Gross Income | $2,779,876 | | 95.0% | | $18.19 | |
| | | | | | | |
| Real Estate Taxes | 226,129 | | 8.1 | | 1.48 | |
| Insurance | 17,285 | | 0.6 | | 0.11 | |
| Management Fee | 83,396 | | 3.0 | | 0.55 | |
| Other Operating Expenses | 81,013 | | 2.9 | | 0.53 | |
| Total Operating Expenses | $407,823 | | 14.7% | | $2.67 | |
| | | | | | | |
| Net Operating Income | $2,372,053 | | 85.3% | | $15.52 | |
| Replacement Reserves | 22,928 | | 0.8 | | 0.15 | |
| TI/LC | 76,427 | | 2.7 | | 0.50 | |
| Net Cash Flow | $2,272,698 | | 81.8% | | $14.87 | |
| | | | | | | |
| NOI DSCR(4) | 1.73x | | | | | |
| NCF DSCR(4) | 1.66x | | | | | |
| NOI Debt Yield(4) | 10.2% | | | | | |
| NCF Debt Yield(4) | 9.8% | | | | | |
| (1) | Historical financial information is not available as the Martin Brower Property was recently acquired. |
| (2) | Represents (i) percent of Net Rental Income for all revenue fields, (ii) percent of Gross Potential Rent for Vacancy & Credit Loss and (iii) percent of Effective Gross Income for all other fields. |
| (3) | The underwritten economic vacancy is 5.0%. The Martin Brower Property is 100.0% physically occupied as of November 1, 2019. |
| (4) | Based on the Martin Brower Mortgage Loan. |
Appraisal.The appraiser concluded to an “as-is” appraised value of $37,000,000 as of August 16, 2019. The appraiser also concluded to an “as-dark” appraised value of $28,500,000.
Environmental Matters. According to the Phase I environmental site assessment dated September 11, 2019, there was no evidence of any recognized environmental conditions at the Martin Brower Property.
Market Overview and Competition.The Martin Brower Property is located in Coatesville, Pennsylvania within the greater Philadelphia metropolitan area. The Martin Brower Property is located 22.3 miles from Wilmington, Delaware and 37.0 miles from downtown Philadelphia, Pennsylvania. According to the appraisal, the Philadelphia metropolitan area is the seventh largest metropolitan area by population, the sixth largest by employment and the fifth largest by personal income. The Martin Brower Property is located in Valley Township in the western area of Chester County. The Martin Brower Property is located 0.5 miles from Route 30 Bypass which provides access to the greater Philadelphia. The Martin Brower Property is located 4.0 miles from the Coatesville, Pennsylvania Amtrak station and 1.5 miles from Chester County G. O. Carlson Airport. The Philadelphia International Airport is located about 40.0 miles from the Martin Brower Property.
According to the appraisal, the 2018 estimated population within one-, three- and five-miles of the Martin Brower Property was 2,777, 26,313 and 54,063, respectively. The neighborhood is projected to continue its growth, with population estimated to be increasing from 2018 to 2023 by 1.0%, 0.8% and 0.7% within one-, three- and five-miles of the Martin Brower Property, respectively. The 2018 median household income within one-, three- and five-miles of the Martin Brower Property was $77,018, $75,330 and $73,506, respectively. The industrial vacancy within the greater Philadelphia area is 4.4% as of the second quarter 2019 and the market rent is $16.45 per square foot which is in line with the in place rent at the Martin Brower Property of $16.48 per square foot.
THE INFORMATION IN THIS STRUCTURAL AND COLLATERAL TERM SHEET IS NOT COMPLETE AND MAY BE AMENDED PRIOR TO THE TIME OF SALE. THIS TERM SHEET IS NOT AN OFFER TO SELL THESE SECURITIES AND IT IS NOT A SOLICITATION OF AN OFFER TO BUY THESE SECURITIES IN ANY JURISDICTION WHERE THE OFFER OR SALE IS NOT PERMITTED.
117
| Industrial – Distribution | Loan #9 | Cut-off Date Balance: | | $23,200,000 |
| 201 Waverly Boulevard | Martin Brower | Cut-off Date LTV: | | 62.7% |
| Coatesville, PA 19320 | | U/W NCF DSCR: | | 1.66x |
| | | U/W NOI Debt Yield: | | 10.2% |
The following table presents certain information relating to the appraiser’s market rent conclusions for the Martin Brower Property:
Market Rent Summary(1)
| | |
| Market Rent (PSF) | $16.45 |
| Lease Term (Years) | 10 |
| Lease Type (Reimbursements) | NNN |
| Rent Increase Projection | 3.0%per annum |
| (1) | Information obtained from the appraisal. |
The following table presents certain information relating to comparable properties to Martin Brower Property:
Comparable Leases(1)
| Property Name/Location | Year Built/ Renovated | Total GLA (SF) | Distance from Subject | Occupancy | Lease Term | Tenant Size (SF) | Annual Base Rent PSF | Lease Type |
Cold Storage Facility 130 Eastern Avenue Chelsea, MA | 2019/NAP | 100,000 | 294.6 miles | 100.0% | 20.0 Yrs | 100,000 | $19.00 | NNN |
405 Pedricktown Road 405 Pedricktown Road Swedesboro, NJ | 2017/NAP | 152,200 | 28.7 miles | 100.0% | 15.3 Yrs | 152,200 | $10.25 | NNN |
851 Julia Street 851 Julia Street Elizabeth, NJ | 2017/NAP | 90,000 | 98.5 miles | NAV | 20.0 Yrs | 45,750 | $14.06 | NNN |
900 Fairmount Avenue 900 Fairmount Avenue Elizabeth, NJ | 2016/NAP | 138,642 | 99.8 miles | 100.0% | 20.0 Yrs | 138,642 | $19.05 | NNN |
275 Blair Road 275 Blair Road Woodbridge, NJ | 2015/NAP | 189,750 | 95.8 miles | 100.0% | 25.0 Yrs | 189,750 | $16.82 | NNN |
| (1) | Information obtained from appraisal. |
Escrows.
Taxes –At origination, no escrows for taxes were collected. Ongoing collections for taxes will be waived so long as among, other things, the Martin Brower lease is in full force and effect, Martin Brower is responsible thereunder for the payment of all taxes directly to the governing authority and timely pays such amounts.
Insurance – At origination, the borrower escrowed $4,321 for insurance premiums. The borrower is required to make monthly payments of one-twelfth of the insurance premiums during the next twelve months, currently equal to $1,440. However, ongoing collections for insurance premiums will be waived to the extent, among other things, the Martin Brower lease is in full force and effect, Martin Brower is responsible for maintaining insurance required thereunder and is actually maintaining such insurance.
TI/LC Reserve – The borrower is required to make monthly payments of $6,369 into the TI/LC reserve account.
Replacement Reserve – The borrower is required to make monthly payments of $1,911 into the replacement reserve account.
Deferred Maintenance Reserve –The borrower has escrowed $11,125 into a deferred maintenance reserve at origination.
Lockbox and Cash Management.The Martin Brower Mortgage Loan documents require a hard lockbox with upfront cash management. At origination, the borrower delivered written instructions to Martin Brower directing it to deposit all rents payable under such leases directly into a lender-controlled lockbox account. The Martin Brower Mortgage Loan documents require that all rents and other funds from operations received by the borrower, the Master Tenant, or the property manager be deposited into the lockbox within one business day after receipt. Funds on deposit in the lockbox account are required to be swept on each business day into a lender-controlled cash management account and applied on each payment date to the payment of debt service, the funding of required reserves, and the payment of budgeted monthly operating expenses. If a Trigger Period (as defined below) occurs, then excess cash in the deposit account will be transferred to an account held by the lender as additional collateral for the Martin Brower Mortgage Loan.
A “Trigger Period” will commence following the occurrence of: (i) an event of default under the Martin Brower Mortgage Loan; (ii) any event of default under the property management agreement; (iii) the date on which any Significant Tenant (as defined below) (a) vacates, surrenders or ceases to conduct its normal business operations at all or substantially all of its demised premises or otherwise “goes dark”, or (b) notifies the borrower, Master Tenant, the property manager, any affiliate of the borrower, Master Tenant or the property manager or any of their respective agents or representatives that it intends to vacate, surrender or cease to conduct its
THE INFORMATION IN THIS STRUCTURAL AND COLLATERAL TERM SHEET IS NOT COMPLETE AND MAY BE AMENDED PRIOR TO THE TIME OF SALE. THIS TERM SHEET IS NOT AN OFFER TO SELL THESE SECURITIES AND IT IS NOT A SOLICITATION OF AN OFFER TO BUY THESE SECURITIES IN ANY JURISDICTION WHERE THE OFFER OR SALE IS NOT PERMITTED.
118
| Industrial – Distribution | Loan #9 | Cut-off Date Balance: | | $23,200,000 |
| 201 Waverly Boulevard | Martin Brower | Cut-off Date LTV: | | 62.7% |
| Coatesville, PA 19320 | | U/W NCF DSCR: | | 1.66x |
| | | U/W NOI Debt Yield: | | 10.2% |
normal business operations at substantially all of its demised premises (including by subleasing) or otherwise “go dark” in all or substantially all of its premises, (c) becomes insolvent or a debtor in any bankruptcy action; or (d) has its senior unsecured debt rating fall below BBB- by S&P or its equivalent by any of Moody’s, Fitch, DBRS, Inc. or Morningstar Credit Ratings, LLC (“Investment Grade Ratings”); (iv) the mortgage loan debt service coverage ratio for the Martin Brower Property falling below 1.25x; or (v) twelve months prior to the earlier of Martin Brower’s lease expiration and the maturity date of the Martin Brower Mortgage Loan.
“Significant Tenant” means any tenant under a lease which, either individually, or when taken together with any other lease with such tenant or its affiliates constitutes more than twenty-five percent (25%) of the total annual rents or rentable square footage at the Martin Brower Property.
A “Trigger Period” will end following the occurrence of (a) with respect to clause (i) above, the acceptance by lender of a cure of such event of default, (b) with respect to clause (ii) the above, either the cure of such event of default satisfactory to the lender or the replacement of the property management agreement in accordance with the Martin Brower Mortgage Loan documents, (c) with respect to clause (iii)(a) above, the resumption of occupancy or normal business operations by such Significant Tenant or the re-tenanting of such premises, in each case, in accordance with the Martin Brower Mortgage Loan documents; (d) with respect to clause (iii)(b) above, the revocation of such notice or the retenanting of the applicable premises, in each case, in accordance with the Martin Brower Mortgage Loan documents; (e) with respect to clause (iii)(c) above, the Significant Tenant or its parent (as applicable) emergings from bankruptcy or insolvency for two (2) consecutive quarters; (f) with respect to clause (iii)(d) above, the Significant Tenant or its parent (as applicable) achieving Investment Grade Ratings; and (g) with respect to clause (iv) above, the mortgage loan debt service coverage ratio for the Martin Brower Mortgage Property reaching at least 1.30x for two (2) consecutive quarters. There is no cure for a Trigger Period resulting from clause (v) above.
Property Management. The Martin Brower Property is managed by an affiliate of the borrower.
Partial Release. Not permitted.
Real Estate Substitution.Not permitted.
Subordinate and Mezzanine Indebtedness.All of the equity in the borrower under the Martin Brower Mortgage Loan in the signatory trustee of such borrower and in the Master Tenant at the Martin Brower Property has been pledged to secure a mezzanine loan (the “Martin Brower Mezzanine Loan”) made by the mortgage loan seller, which has an aggregate principal balance of $7,500,000, is subordinate to the Martin Brower Mortgage Loan and accrues at an interest rate of 12.000%per annum. The Martin Brower Mezzanine Loan is interest-only with a term of nine months with one, six month extension option. The holders of the Martin Brower Mezzanine Loan and the Martin Brower Mortgage Loan have entered into an intercreditor agreement that sets forth their respective rights.
Ground Lease. None.
Terrorism Insurance.The Martin Brower Mortgage Loan documents require that the “all risk” insurance policy required to be maintained by the borrower provides (or otherwise the borrower will maintain) coverage for terrorism in an amount equal to the full replacement cost of the Martin Brower Property and provides business interruption insurance covering no less than the 18-month period following the occurrence of a casualty event, together with a 12-month extended period of indemnity. However, to the extent that Martin Brower maintains the insurance policies required under its lease and the related conditions set forth in the Martin Brower Mortgage Loan Documents are satisfied, the borrower will not be required to maintain such coverages.
THE INFORMATION IN THIS STRUCTURAL AND COLLATERAL TERM SHEET IS NOT COMPLETE AND MAY BE AMENDED PRIOR TO THE TIME OF SALE. THIS TERM SHEET IS NOT AN OFFER TO SELL THESE SECURITIES AND IT IS NOT A SOLICITATION OF AN OFFER TO BUY THESE SECURITIES IN ANY JURISDICTION WHERE THE OFFER OR SALE IS NOT PERMITTED.
119
| Retail - Anchored | Loan #10 | Cut-off Date Balance: | | $21,800,000 |
| 3550 South General Bruce Drive | Bird Creek Crossing | Cut-off Date LTV: | | 70.8% |
| Temple, TX 76504 | | U/W NCF DSCR: | | 1.64x |
| | | U/W NOI Debt Yield: | | 9.8% |
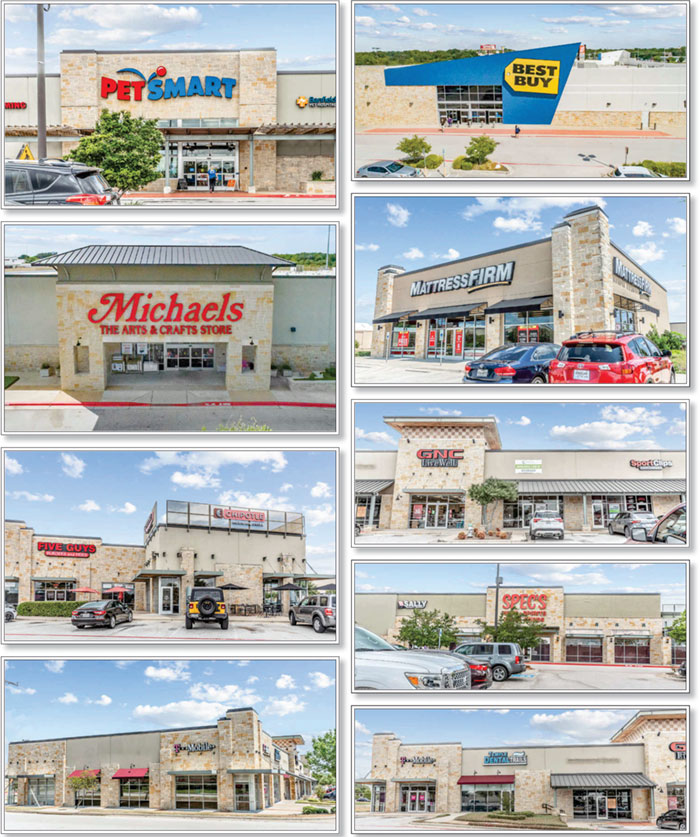
THE INFORMATION IN THIS STRUCTURAL AND COLLATERAL TERM SHEET IS NOT COMPLETE AND MAY BE AMENDED PRIOR TO THE TIME OF SALE. THIS TERM SHEET IS NOT AN OFFER TO SELL THESE SECURITIES AND IT IS NOT A SOLICITATION OF AN OFFER TO BUY THESE SECURITIES IN ANY JURISDICTION WHERE THE OFFER OR SALE IS NOT PERMITTED.
120
| Retail - Anchored | Loan #10 | Cut-off Date Balance: | | $21,800,000 |
| 3550 South General Bruce Drive | Bird Creek Crossing | Cut-off Date LTV: | | 70.8% |
| Temple, TX 76504 | | U/W NCF DSCR: | | 1.64x |
| | | U/W NOI Debt Yield: | | 9.8% |
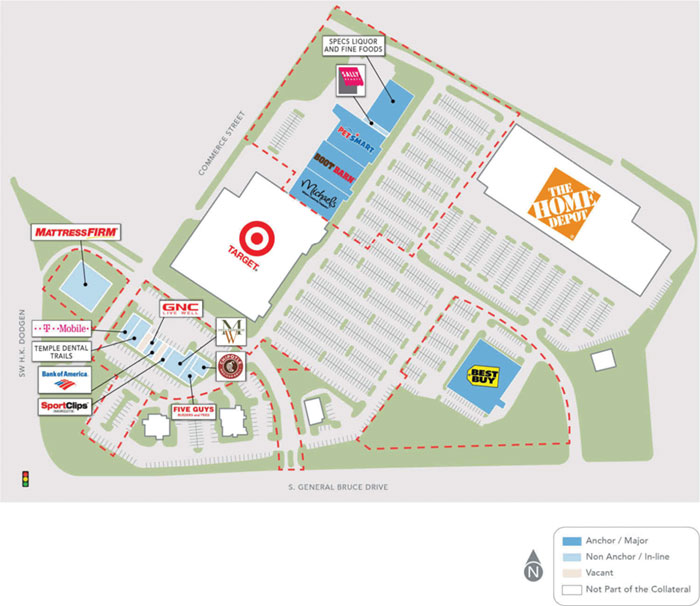
THE INFORMATION IN THIS STRUCTURAL AND COLLATERAL TERM SHEET IS NOT COMPLETE AND MAY BE AMENDED PRIOR TO THE TIME OF SALE. THIS TERM SHEET IS NOT AN OFFER TO SELL THESE SECURITIES AND IT IS NOT A SOLICITATION OF AN OFFER TO BUY THESE SECURITIES IN ANY JURISDICTION WHERE THE OFFER OR SALE IS NOT PERMITTED.
121
| Retail - Anchored | Loan #10 | Cut-off Date Balance: | | $21,800,000 |
| 3550 South General Bruce Drive | Bird Creek Crossing | Cut-off Date LTV: | | 70.8% |
| Temple, TX 76504 | | U/W NCF DSCR: | | 1.64x |
| | | U/W NOI Debt Yield: | | 9.8% |
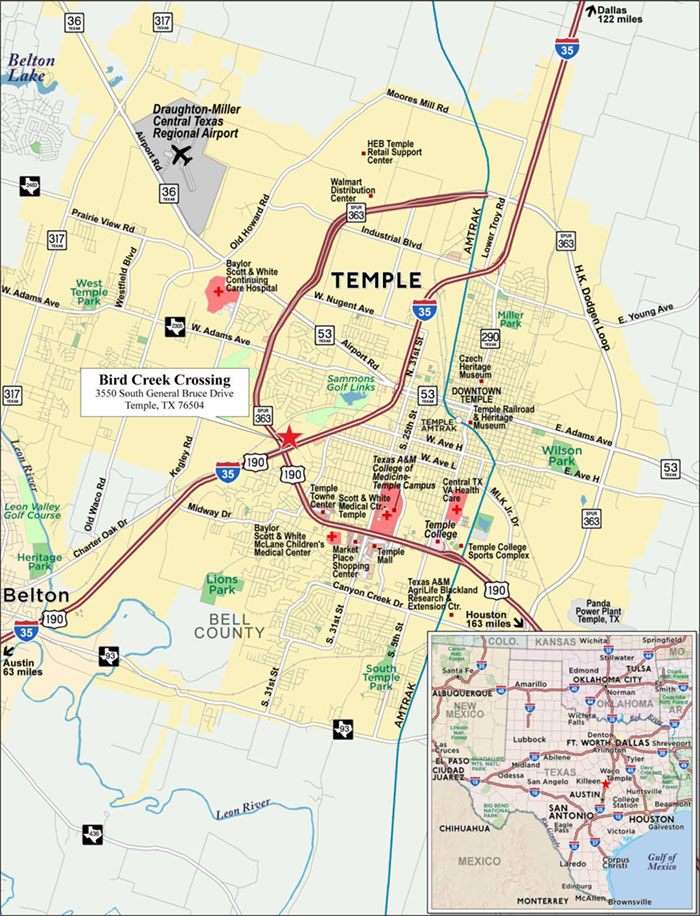
THE INFORMATION IN THIS STRUCTURAL AND COLLATERAL TERM SHEET IS NOT COMPLETE AND MAY BE AMENDED PRIOR TO THE TIME OF SALE. THIS TERM SHEET IS NOT AN OFFER TO SELL THESE SECURITIES AND IT IS NOT A SOLICITATION OF AN OFFER TO BUY THESE SECURITIES IN ANY JURISDICTION WHERE THE OFFER OR SALE IS NOT PERMITTED.
122
| No. 10 – Bird Creek Crossing |
| |
| Mortgage Loan Information | | Mortgaged Property Information |
| Mortgage Loan Seller: | Rialto Mortgage Finance, LLC | | Single Asset/Portfolio: | Single Asset |
Credit Assessment (DBRS/Fitch/Moody’s): | NR/NR/NR | | Property Type – Subtype: | Retail – Anchored |
| Original Principal Balance: | $21,800,000 | | Location: | Temple, TX |
| Cut-off Date Balance: | $21,800,000 | | Size: | 129,941 SF |
| % of Initial Pool Balance: | 3.1% | | Cut-off Date Balance Per SF: | $167.77 |
| Loan Purpose: | Acquisition | | Maturity Date Balance Per SF: | $152.23 |
| Borrower Sponsor: | E. Stanley Kroenke | | Year Built/Renovated: | 2007/NAP |
| Guarantor: | E. Stanley Kroenke | | Title Vesting: | Fee |
| Mortgage Rate: | 3.9900% | | Property Manager: | Self-managed |
| Note Date: | September 5, 2019 | | Current Occupancy (As of): | 97.7% (7/18/2019) |
| Seasoning: | 2 months | | YE 2018 Occupancy: | 84.6% |
| Maturity Date: | September 6, 2029 | | YE 2017 Occupancy: | 85.1% |
| IO Period: | 60 months | | YE 2016 Occupancy(2): | NAV |
| Loan Term (Original): | 120 months | | YE 2015 Occupancy(2): | NAV |
| Amortization Term (Original): | 360 months | | As-Is Appraised Value: | $30,800,000 |
| Loan Amortization Type: | Interest-only, Amortizing Balloon | | As-Is Appraised Value Per SF: | $237.03 |
| Call Protection: | L(23),GRTR 1% or YM(93),O(4) | | As-Is Appraisal Valuation Date: | July 1, 2019 |
| Lockbox Type: | Springing | | Underwriting and Financial Information |
| Additional Debt: | No | | TTM NOI (6/30/2019): | $1,944,843 |
| Additional Debt Type (Balance): | NAP | | YE 2018 NOI: | $2,008,117 |
| | | | YE 2017 NOI: | $2,176,661 |
| | | | YE 2016 NOI(2): | NAV |
| | | | U/W Revenues: | $2,799,305 |
| | | | U/W Expenses: | $663,691 |
| Escrows and Reserves(1) | | U/W NOI: | $2,135,614 |
| | Initial | Monthly | Cap | | U/W NCF: | $2,051,153 |
| Taxes | $0 | Springing | NAP | | U/W DSCR based on NOI/NCF: | 1.71x / 1.64x |
| Insurance | $0 | Springing | NAP | | U/W Debt Yield based on NOI/NCF: | 9.8% / 9.4% |
| Replacement Reserve | $0 | Springing | NAP | | U/W Debt Yield at Maturity based on NOI/NCF: | 10.8% / 10.4% |
| TI/LC Reserve | $0 | Springing | $324,853 | | Cut-off Date LTV Ratio: | 70.8% |
| | | | | | LTV Ratio at Maturity: | 64.2% |
| | | | | | | |
| | | | | | | | |
| Sources and Uses |
| Sources | | | | | Uses | | | |
| Original loan amount | $21,800,000 | | 76.1 | % | | Purchase Price | $28,000,000 | | 97.7 | % |
| Borrower’s equity contribution | 6,859,974 | | 23.9 | | | Closing Costs | 659,974 | | 2.3 | |
| | | | | | | | | |
| Total Sources | $28,659,974 | | 100.0 | % | | Total Uses | $28,659,974 | | 100.0 | % |
| (1) | See “Escrows” section for a full description of Escrows and Reserves. |
| (2) | The Bird Creek Crossing Borrower (as defined below) acquired the Bird Creek Crossing Property (as defined below) in July 2019; therefore, complete historical occupancy for YE 2015 and YE 2016 NOI information is not available. |
The Mortgage Loan. The mortgage loan (the “Bird Creek Crossing Mortgage Loan”) is evidenced by a single promissory note secured by a first mortgage encumbering the fee interest in a 129,941 square foot anchored retail center located in Temple, Texas (the “Bird Creek Crossing Property”).
The Borrower and Borrower Sponsor.The borrower is Bird Creek Crossing LLC (the “Bird Creek Crossing Borrower”), a Delaware limited liability company and single purpose entity with one independent director. Legal counsel to the Bird Creek Crossing Borrower delivered a non-consolidation opinion in connection with the origination of the Bird Creek Crossing Mortgage Loan. The nonrecourse carve-out guarantor of the Bird Creek Crossing Mortgage Loan is E. Stanley Kroenke.
The borrower sponsor, E. Stanley Kroenke is chairman, co-founder, and owner of THF Realty, a real estate development firm. Mr. Kroenke holds real estate interests in shopping centers, office buildings, industrial and warehouse properties, sports stadiums and storage facilities across the United States. Mr. Kroenke owns 308 properties totaling approximately 43.6 million square feet. Mr. Kroenke’s current and former board and trustee memberships include Wal-Mart Stores, Inc., Central Bancompany, Boone County National Bank and Community Investments Partnerships of St. Louis. Mr. Kroenke also owns the Denver Nuggets of the National Basketball Association, the Colorado Avalanche of the National Hockey League, the Los Angeles Rams of the National Football League,
THE INFORMATION IN THIS STRUCTURAL AND COLLATERAL TERM SHEET IS NOT COMPLETE AND MAY BE AMENDED PRIOR TO THE TIME OF SALE. THIS TERM SHEET IS NOT AN OFFER TO SELL THESE SECURITIES AND IT IS NOT A SOLICITATION OF AN OFFER TO BUY THESE SECURITIES IN ANY JURISDICTION WHERE THE OFFER OR SALE IS NOT PERMITTED.
123
| Retail - Anchored | Loan #10 | Cut-off Date Balance: | | $21,800,000 |
| 3550 South General Bruce Drive | Bird Creek Crossing | Cut-off Date LTV: | | 70.8% |
| Temple, TX 76504 | | U/W NCF DSCR: | | 1.64x |
| | | U/W NOI Debt Yield: | | 9.8% |
and is the largest shareholder in Arsenal of the English Premier League. The borrower sponsor is one of several defendants under complaints filed in April 2016 by the City of St. Louis related to the decision to relocate the St. Louis Rams to Los Angeles. See “Description of the Mortgage Pool-Litigation and Other Considerations” in the Preliminary Prospectus.
The Property.The Bird Creek Crossing Property is a 129,941 square foot anchored retail center located in Temple, Texas, approximately 37 miles south of Waco, Texas. The Bird Creek Crossing Property consists of six, one-story retail buildings developed in 2007 and 2014. The Bird Creek Crossing Property is situated on an 18.6 acre site, with 656 surface parking spaces, resulting in a parking ratio of 5.0 spaces per square foot of net rentable area. The Bird Creek Crossing Property is part of a larger retail center, which larger retail center includes Target and Home Depot and three outparcels (none of which are part of the collateral). The Bird Creek Crossing Property is anchored by Best Buy, and major tenants include PetSmart, Boot Barn, Michaels and Spec’s Liquor and Fine Foods. As of July 18, 2019, the Bird Creek Crossing Property was 97.7% occupied by 15 national and regional tenants.
Major Tenants.
Largest Tenant: Best Buy (30,038 square feet, 23.1% of net rentable area; 23.1% of underwritten base rent) –Best Buy is a provider of technology products, services and solutions with retail operations located in the U.S., Canada and Mexico. Best Buy was founded in 1966 and is headquartered in Richfield, Minnesota. As of fiscal year 2019, Best Buy operated 1,026 domestic stores and 212 international stores. According to Best Buy’s 2019 annual report, net sales for fiscal year 2019 were $42.9 billion, up 1.7% over the prior year’s total sales of $42.1 billion. Best Buy has been a tenant at the Bird Creek Crossing Property since 2007 and has three, 5-year renewal options remaining after its January 2023 lease expiration.
2ndLargest Tenant: PetSmart (19,900 square feet, 15.3% of net rentable area; 11.5% of underwritten base rent) –Founded in 1986, PetSmart, Inc. is the largest specialty pet retailer of services and solutions for the lifetime needs of pets. The company operates more than 1,650 pet stores in the United States and approximately 200 in-store PetSmart PetsHotel dog and cat boarding facilities. PetSmart provides a broad range of competitively priced pet food and pet products and offers dog training, pet grooming, pet boarding, PetSmart Doggie Day Camp day care services and pet adoption services in-store. PetSmart has been a tenant at the Bird Creek Crossing Property since 2008 and has five, 5-year renewal options remaining after its April 2023 lease expiration.
3rdLargest Tenant: Boot Barn (17,862 square feet; 13.7% of net rentable area; 7.8% of underwritten base rent) –Founded in 1978, Boot Barn is the nation’s leading lifestyle retailer of western and work-related footwear, apparel and accessories for men, women and children. The company offers a wide selection of work and lifestyle brands, which includes over 8,000 styles of boots, jeans, shirts, hats, belts, and more from brands such as Wrangler, Ariat, Justin, Carhartt, and many more. As of fiscal year 2019, Boot Barn operated 240 stores in 33 states. According to Boot Barn’s 2019 annual report, net sales for fiscal year 2019 were $776.9 million, up 14.6% over the prior year sales of $677.9 million. Boot Barn has been a tenant at the Bird Creek Crossing Property since 2019 and has three, 5-year renewal options remaining after its October 2029 lease expiration.
THE INFORMATION IN THIS STRUCTURAL AND COLLATERAL TERM SHEET IS NOT COMPLETE AND MAY BE AMENDED PRIOR TO THE TIME OF SALE. THIS TERM SHEET IS NOT AN OFFER TO SELL THESE SECURITIES AND IT IS NOT A SOLICITATION OF AN OFFER TO BUY THESE SECURITIES IN ANY JURISDICTION WHERE THE OFFER OR SALE IS NOT PERMITTED.
124
| Retail - Anchored | Loan #10 | Cut-off Date Balance: | | $21,800,000 |
| 3550 South General Bruce Drive | Bird Creek Crossing | Cut-off Date LTV: | | 70.8% |
| Temple, TX 76504 | | U/W NCF DSCR: | | 1.64x |
| | | U/W NOI Debt Yield: | | 9.8% |
The following table presents certain information relating to the tenancy at the Bird Creek Crossing Property:
Major Tenants
| Tenant Name | Credit Rating (Fitch/Moody’s/
S&P)(1) | Tenant NRSF | % of
NRSF | Annual U/W Base Rent PSF(2) | Annual
U/W Base Rent(2) | % of Total Annual U/W Base Rent | Lease
Expiration
Date | Extension Options | Termination Option (Y/N) |
| Anchor Tenants | | | | | | | | |
| Best Buy | BBB/Baa1/BBB | 30,038 | 23.1% | $17.60 | $528,669 | 23.1% | 1/31/2023 | 3, 5-year | N |
| Total Anchor Tenants | | 30,038 | 23.1% | $17.60 | $528,669 | 23.1% | | | |
| | | | | | | | | | |
| Major Tenants | | | | | | | | | |
| PetSmart | NR/B3/B- | 19,900 | 15.3% | $13.25 | $263,675 | 11.5% | 4/30/2023 | 5, 5-year | N |
| Boot Barn(3) | NR/NR/NR | 17,862 | 13.7% | $10.00 | $178,620 | 7.8% | 10/31/2029 | 3, 5-year | N |
| Michaels | NR/Ba2/BB+ | 17,175 | 13.2% | $12.66 | $217,436 | 9.5% | 2/28/2023 | 3, 5-year | N |
| Spec’s Liquor and Fine Foods | NR/NR/NR | 15,659 | 12.1% | $19.50 | $305,351 | 13.4% | 6/30/2020 | 1, 10-year | N |
| Total Major Tenants | 70,596 | 54.3% | $13.67 | $965,082 | 42.2% | | | |
| | | | | | | | | | |
| Other Tenants | 26,307 | 20.2% | $30.09 | $791,513 | 34.6% | | | |
| | | | | | | | | |
| Occupied Collateral Total | 126,941 | 97.7% | $18.00 | $2,285,264 | 100.0% | | | |
| | | | | | | | | |
| Vacant Space | 3,000 | 2.3% | | | | | | |
| | | | | | | | | |
| Collateral Total | 129,941 | 100.0% | | | | | | |
| | | | | | | | | | |
| (1) | Certain ratings are those of the parent company whether or not the parent company guarantees the lease. |
| (2) | Annual U/W Base Rent PSF and Annual U/W Base Rent include contractual rent steps through May 2020 totaling $28,978. |
| (3) | Under its lease, Boot Barn is permitted to pay 50% rent through March 2020 and has a tenant improvement allowance of $40.0 per SF ($714,480). If the tenant’s gross sales during the fifth year of its lease term are less than $2.2 million ($123.17 per SF), Boot Barn may terminate its lease by providing notice within 90 days after the conclusion of year five and payment of its unamortized tenant improvement allowance and any broker’s commission (straight-line basis over 120 months). |
The following table presents certain information relating to tenant sales at the Bird Creek Crossing Property:
Tenant Sales (PSF)
| Major Tenant Name | % of Total Annual U/W Base Rent | 2016(1) | 2017 | 2018 | Anchor Tenant Occupancy Cost(2) |
| Michaels | 9.5% | $142 | $146 | $143 | 11.5% |
| Spec’s Liquor and Fine Food | 13.4% | $329 | NAV | $361 | 6.8% |
| | | | | | |
| In-Line Sales PSF(3) | | $274 | $222 | $207 | |
| In-Line Occupancy Cost | | 12.3% | 14.8% | 15.8% | |
| (1) | 2016 sales PSF includes Sports Clips sales ($507 PSF). Sports Clips sales in 2017 and 2018 were not available. |
| (2) | Occupancy Cost is based on 2018 sales, underwritten base rent and underwritten reimbursements. |
| (3) | In-Line tenants that reported sales include Mattress Firm, Five Guys Burgers & Fries, GNC, and Sports Clips (only for 2016). |
THE INFORMATION IN THIS STRUCTURAL AND COLLATERAL TERM SHEET IS NOT COMPLETE AND MAY BE AMENDED PRIOR TO THE TIME OF SALE. THIS TERM SHEET IS NOT AN OFFER TO SELL THESE SECURITIES AND IT IS NOT A SOLICITATION OF AN OFFER TO BUY THESE SECURITIES IN ANY JURISDICTION WHERE THE OFFER OR SALE IS NOT PERMITTED.
125
| Retail - Anchored | Loan #10 | Cut-off Date Balance: | | $21,800,000 |
| 3550 South General Bruce Drive | Bird Creek Crossing | Cut-off Date LTV: | | 70.8% |
| Temple, TX 76504 | | U/W NCF DSCR: | | 1.64x |
| | | U/W NOI Debt Yield: | | 9.8% |
The following table presents certain information relating to the lease rollover schedule at the Bird Creek Crossing Property:
Lease Expiration Schedule(1)(2)
Year Ending
December 31, | No. of Leases Expiring | Expiring NRSF | % of Total NRSF | Cumulative Expiring NRSF | Cumulative % of Total NRSF | Annual
U/W
Base Rent(3) | % of Total Annual U/W Base Rent | Annual
U/W
Base Rent
PSF(3) |
| MTM | 0 | 0 | 0.0% | 0 | 0.0% | $0 | 0.0% | $0.00 |
| 2019 | 1 | 2,500 | 1.9% | 2,500 | 1.9% | $77,000 | 3.4% | $30.80 |
| 2020 | 1 | 15,659 | 12.1% | 18,159 | 14.0% | $305,351 | 13.4% | $19.50 |
| 2021 | 1 | 1,948 | 1.5% | 20,107 | 15.5% | $50,648 | 2.2% | $26.00 |
| 2022 | 2 | 7,898 | 6.1% | 28,005 | 21.6% | $190,774 | 8.3% | $24.15 |
| 2023 | 4 | 69,613 | 53.6% | 97,618 | 75.1% | $1,117,580 | 48.9% | $16.05 |
| 2024 | 3 | 8,761 | 6.7% | 106,379 | 81.9% | $277,091 | 12.1% | $31.63 |
| 2025 | 0 | 0 | 0.0% | 106,379 | 81.9% | $0 | 0.0% | $0.00 |
| 2026 | 0 | 0 | 0.0% | 106,379 | 81.9% | $0 | 0.0% | $0.00 |
| 2027 | 0 | 0 | 0.0% | 106,379 | 81.9% | $0 | 0.0% | $0.00 |
| 2028 | 1 | 1,200 | 0.9% | 107,579 | 82.8% | $43,200 | 1.9% | $36.00 |
| 2029 | 2 | 19,362 | 14.9% | 126,941 | 97.7% | $223,620 | 9.8% | $11.55 |
| Thereafter | 0 | 0 | 0.0% | 126,941 | 97.7% | $0 | 0.0% | $0.00 |
| Vacant | 0 | 3,000 | 2.3% | 129,941 | 100.0% | $0 | 0.0% | $0.00 |
| Total/Weighted Average(3) | 15 | 129,941 | 100.0% | | | $2,285,264 | 100.0% | $18.00 |
| (1) | Information obtained from the underwritten rent roll. |
| (2) | Certain tenants may have lease termination options that are exercisable prior to the originally stated expiration date of the subject lease and that are not considered in the Lease Expiration Schedule. |
| (3) | Total/Weighted Average Annual U/W Base Rent and Annual U/W Base Rent PSF exclude vacant space. |
The following table presents historical occupancy percentages at the Bird Creek Crossing Property:
Historical Occupancy
12/31/2015(1) | 12/31/2016(1) | 12/31/2017(2) | 12/31/2018(2) | 7/18/2019(3) |
| NAV | NAV | 85.1% | 84.6% | 97.7% |
| (1) | The Bird Creek Crossing Borrower acquired the Bird Creek Crossing Property in July 2019; therefore, complete historical occupancy is not available. |
| (2) | Information obtained from the Bird Creek Crossing Borrower. |
| (3) | Information obtained from the underwritten rent roll. |
THE INFORMATION IN THIS STRUCTURAL AND COLLATERAL TERM SHEET IS NOT COMPLETE AND MAY BE AMENDED PRIOR TO THE TIME OF SALE. THIS TERM SHEET IS NOT AN OFFER TO SELL THESE SECURITIES AND IT IS NOT A SOLICITATION OF AN OFFER TO BUY THESE SECURITIES IN ANY JURISDICTION WHERE THE OFFER OR SALE IS NOT PERMITTED.
126
| Retail - Anchored | Loan #10 | Cut-off Date Balance: | | $21,800,000 |
| 3550 South General Bruce Drive | Bird Creek Crossing | Cut-off Date LTV: | | 70.8% |
| Temple, TX 76504 | | U/W NCF DSCR: | | 1.64x |
| | | U/W NOI Debt Yield: | | 9.8% |
Operating History and Underwritten Net Cash Flow. The following table presents certain information relating to the underwritten net cash flow at the Bird Creek Crossing Property:
Cash Flow Analysis
| | 2017 | 2018 | TTM 6/30/2019 | U/W | | %(1) | | U/W $ per SF |
| Rents in Place | $2,244,621 | $2,151,936 | $2,098,647 | $2,256,287 | | 76.3 | % | | $17.36 |
| Contractual Rent Steps(2) | 0 | 0 | 0 | 28,978 | | 1.0 | | | 0.22 |
| Grossed Up Vacant Space | 0 | 0 | 0 | 90,000 | | 3.0 | | | 0.69 |
| Gross Potential Rent | $2,244,621 | $2,151,936 | $2,098,647 | $2,375,264 | | 80.4 | % | | $18.28 |
| Other Income | 0 | 0 | 0 | 0 | | 0.0 | | | 0.00 |
| Total Recoveries | 561,615 | 508,204 | 485,513 | 580,708 | | 19.6 | | | 4.47 |
| Net Rental Income | $2,806,236 | $2,660,140 | $2,584,160 | $2,955,972 | | 100.0 | % | | $22.75 |
| (Vacancy & Credit Loss) | (1,396) | (13,663) | (6,690) | (156,667)(3) | | (6.6 | ) | | (1.21) |
| Effective Gross Income | $2,804,840 | $2,646,477 | $2,577,470 | $2,799,305 | | 94.7 | % | | $21.54 |
| | | | | | | | | |
| Real Estate Taxes | 312,734 | 291,754 | 301,351 | 309,514 | | 11.1 | | | 2.38 |
| Insurance | 9,675 | 11,943 | 13,729 | 28,934 | | 1.0 | | | 0.22 |
| Management Fee | 82,841 | 83,556 | 80,506 | 83,979 | | 3.0 | | | 0.65 |
| Other Operating Expenses | 222,929 | 251,107 | 237,041 | 241,264 | | 8.6 | | | 1.86 |
| Total Operating Expenses | $628,179 | $638,360 | $632,627 | $663,691 | | 23.7 | % | | $5.11 |
| | | | | | | | | |
| Net Operating Income | $2,176,661 | $2,008,117 | $1,944,843 | $2,135,614 | | 76.3 | % | | $16.44 |
| Replacement Reserves | 0 | 0 | 0 | 19,491 | | 0.7 | | | 0.15 |
| TI/LC | 0 | 0 | 0 | 64,971 | | 2.3 | | | 0.50 |
| Net Cash Flow | $2,176,661 | $2,008,117 | $1,944,843 | $2,051,153 | | 73.3 | % | | $15.79 |
| | | | | | | | | |
| NOI DSCR | 1.74x | 1.61x | 1.56x | 1.71x | | | | |
| NCF DSCR | 1.74x | 1.61x | 1.56x | 1.64x | | | | |
| NOI Debt Yield | 10.0% | 9.2% | 8.9% | 9.8% | | | | |
| NCF Debt Yield | 10.0% | 9.2% | 8.9% | 9.4% | | | | |
| (1) | Represents (i) percent of Net Rental Income for all revenue fields, (ii) percent of Gross Potential Rent for Vacancy & Credit Loss and (iii) percent of Effective Gross Income for all other fields. |
| (2) | Represents contractual rent steps through May 2020. |
| (3) | The underwritten economic vacancy is 5.3%. The Bird Creek Crossing Property was 97.7% leased as of July 18, 2019. |
THE INFORMATION IN THIS STRUCTURAL AND COLLATERAL TERM SHEET IS NOT COMPLETE AND MAY BE AMENDED PRIOR TO THE TIME OF SALE. THIS TERM SHEET IS NOT AN OFFER TO SELL THESE SECURITIES AND IT IS NOT A SOLICITATION OF AN OFFER TO BUY THESE SECURITIES IN ANY JURISDICTION WHERE THE OFFER OR SALE IS NOT PERMITTED.
127
| Retail - Anchored | Loan #10 | Cut-off Date Balance: | | $21,800,000 |
| 3550 South General Bruce Drive | Bird Creek Crossing | Cut-off Date LTV: | | 70.8% |
| Temple, TX 76504 | | U/W NCF DSCR: | | 1.64x |
| | | U/W NOI Debt Yield: | | 9.8% |
Appraisal.As of the appraisal valuation date of July 1, 2019, the Bird Creek Crossing Property had an “as-is” appraised value of $30,800,000.
Environmental Matters. According to a Phase I environmental site assessment dated July 11, 2019, there was no evidence of any recognized environmental conditions at the Bird Creek Crossing Property.
Market Overview and Competition.The Bird Creek Crossing Property is located in Temple, Bell County, Texas, within the Killeen-Temple metropolitan statistical area (the “Temple MSA”). Fort Hood is one of the nation’s largest military bases located on 214,968-acres and is the largest employer within the Temple MSA. Fort Hood is the only post in the United States capable of stationing and training two armored divisions. Fort Hood units include, but are not limited to, the III Corps, 1st Calvary Division, 1st Armor Division West, 3rd Cavalry Division and the US Army Garrison Fort Hood. The rolling, semi-arid terrain is ideal for multifaceted training and testing of military units and troops. The base has been successful in attracting federal dollars, with 12 major construction projects under way totaling $300 million. Other major employers include Military Defense Contractors, Baylor Scott and White Medical Center, Central Texas Veterans Healthcare System.
The Bird Creek Crossing Property is located approximately 3.4 miles west of downtown Temple and approximately 37 miles south of Waco, Texas. Access to the Bird Creek Crossing Property neighborhood is provided by Interstate 35 and SW H.K. Dodgen Loop. The neighborhood surrounding the Bird Creek Crossing Property primarily consists of retail, commercial and residential developments. Growth patterns have occurred primarily along major commercial thoroughfares such as Interstate 35, US Highway 190 and Loop 363. According to a third party market research report, the estimated 2019 population in a one-, three-, and five-mile radius of the Bird Creek Crossing Property is 7,666, 48,652 and 80,276, respectively. The average household income within the same radii is $59,559, $65,959 and $73,354, respectively.
Submarket Information – According to a third-party market research report, the Bird Creek Crossing Property is situated within the Temple retail submarket. As of second quarter 2019, the submarket reported a total inventory of 5.4 million square feet with a 5.3% vacancy rate and an average quoted rental rate of $16.61 per square feet. As of second quarter 2019, the Temple retail submarket reported positive absorption of 3,500 square feet, with no new construction or deliveries.
Appraiser’s Comp Set – The appraiser identified six competitive properties for the Bird Creek Crossing Property totaling approximately 462,860 square feet, which reported an average occupancy rate of approximately 97.6%. The appraiser concluded to net market rents for the Bird Creek Crossing Property of $13.00 per square foot anchor tenants, $19.50 per square foot for Jr. Anchor tenants, $45.00 per square foot for high visibility space and $30.00 per square foot for in-line tenants.
The following table presents certain information relating to the appraiser’s market rent conclusion for the Bird Creek Crossing Property:
Market Rent Summary(1)
| | Anchor | Jr. Anchor | High Visibility Space | In-Line Space |
| Market Rent (PSF) | $13.00 | $19.50 | $45.00 | $30.00 |
| Lease Term (Years) | 20 | 10 | 5 | 5 |
| Lease Type (Reimbursements) | NNN | NNN | NNN | NNN |
| Rent Increase Projection | 2.50% | 2.50% | 2.50% | 2.50% |
| (1) | Information obtained from the appraisal. |
THE INFORMATION IN THIS STRUCTURAL AND COLLATERAL TERM SHEET IS NOT COMPLETE AND MAY BE AMENDED PRIOR TO THE TIME OF SALE. THIS TERM SHEET IS NOT AN OFFER TO SELL THESE SECURITIES AND IT IS NOT A SOLICITATION OF AN OFFER TO BUY THESE SECURITIES IN ANY JURISDICTION WHERE THE OFFER OR SALE IS NOT PERMITTED.
128
| Retail - Anchored | Loan #10 | Cut-off Date Balance: | | $21,800,000 |
| 3550 South General Bruce Drive | Bird Creek Crossing | Cut-off Date LTV: | | 70.8% |
| Temple, TX 76504 | | U/W NCF DSCR: | | 1.64x |
| | | U/W NOI Debt Yield: | | 9.8% |
The table below presents certain information relating to comparable sales for the Bird Creek Crossing Property identified by the appraiser:
Comparable Sales(1)
| Property Name | Location | Rentable Area (SF) | Sale Date | Sale Price | Sale Price (PSF) |
| Kyle Crossing | Kyle, TX | 121,485 | Dec-18 | $28,000,000 | $230.48 |
| Gateway Station | Burleson, TX | 78,545 | Sept-17 | $15,300,000 | $194.79 |
| 5000 South Hulen | Fort Worth, TX | 84,373 | Dec-17 | $22,100,000 | $261.93 |
| Temple Town Center | Temple, TX | 246,616 | Sept-18 | $26,900,000 | $109.08 |
| 902 W Central Expy | Killeen, TX | 60,438 | Jul-19 | $10,200,000 | $168.77 |
| Boardwalk Shopping | Round Rock, TX | 184,598 | Mar-19 | $29,375,000 | $159.13 |
| (1) | Information obtained from the appraisal. |
The following table presents certain information relating to comparable leases to those at the Bird Creek Crossing Property:
Comparable Leases(1)
| Property Name/Location | Year Built/ Renovated | Total GLA (SF) | Distance from Subject | Occupancy | Lease Term | Tenant Size (SF) | Annual Base Rent PSF | Reimbursement Amount PSF | Lease Type |
Temple Towne Center 2112 SW. H K Dodgen Loop Temple, TX | 2001/NAP | 246,616 | 2.1 miles | 100.0% | NAV | 23,905 | $12.00 | NAV | NNN |
Aubrey’s Crossing 3809 S. General Bruce Drive Temple, TX | 2006/NAP | 25,865 | 0.6 miles | 90.0% | NAV | 1,654 | $18.00 | $5.00 | NNN |
31stStreet Crossing 4301-4305 S. 31st Street Temple, TX | 2006/NAP | 9,673 | 3.2 miles | 100.0% | NAV | 1,700 | $20.00 | NAV | NNN |
Killeen Crossing 902 W Central Texas Expy Killeen, TX | 1995/NAP | 60,438 | 24.6 miles | 96.0% | NAV | 39,974 | $12.63 | $1.00 | NNN |
Five Hills Shopping 232 Robert Griffin III Dr. Copperas Cove, TX | 2017/NAP | 93,652 | 31.7 miles | 100.0% | NAV | 25,006 | $10.00 | $5.00 | NNN |
Melrose 801 S Fort Hood Street Killeen, TX | 1979/NAP | 26,616 | 24.5 miles | 100.0% | NAV | 10,956 | $20.40 | NAV | NNN |
| (1) | Information obtained from the appraisal. |
THE INFORMATION IN THIS STRUCTURAL AND COLLATERAL TERM SHEET IS NOT COMPLETE AND MAY BE AMENDED PRIOR TO THE TIME OF SALE. THIS TERM SHEET IS NOT AN OFFER TO SELL THESE SECURITIES AND IT IS NOT A SOLICITATION OF AN OFFER TO BUY THESE SECURITIES IN ANY JURISDICTION WHERE THE OFFER OR SALE IS NOT PERMITTED.
129
| Retail - Anchored | Loan #10 | Cut-off Date Balance: | | $21,800,000 |
| 3550 South General Bruce Drive | Bird Creek Crossing | Cut-off Date LTV: | | 70.8% |
| Temple, TX 76504 | | U/W NCF DSCR: | | 1.64x |
| | | U/W NOI Debt Yield: | | 9.8% |
Escrows.
Real Estate Taxes – The Bird Creek Crossing Mortgage Loan documents do not require an upfront real estate tax reserve. Ongoing monthly real estate tax reserves will be required during the continuation of a Cash Management Trigger Event (as defined below) or Cash Sweep Event (as defined below) under the Bird Creek Crossing Mortgage Loan in an amount equal to one-twelfth of the real estate taxes that the lender estimates will be necessary to pay taxes over the then succeeding twelve months.
Insurance – The Bird Creek Crossing Mortgage Loan documents do not require an upfront insurance reserve. Ongoing monthly insurance reserves will be required during the continuation of a Cash Management Trigger Event or Cash Sweep Event under the Bird Creek Crossing Mortgage Loan in an amount equal to one-twelfth of the amount that the lender estimates will be necessary to pay insurance premiums.
Replacement Reserves – The Bird Creek Crossing Mortgage Loan documents do not require an upfront replacement reserve. Ongoing monthly replacement reserves will be required during the continuation of a Cash Management Trigger Event or Cash Sweep Event under the Bird Creek Crossing Mortgage Loan in an amount equal to $1,624.
TI/LC Reserve – The Bird Creek Crossing Mortgage Loan documents do not require an upfront tenant improvement and leasing commission reserve. Ongoing monthly tenant improvement and leasing commission reserves will be required during the continuation of a Cash Management Trigger Event or Cash Sweep Event under the Bird Creek Crossing Mortgage Loan in an amount equal to $5,414, subject to a cap of $324,853. In addition, when a Cash Management Trigger Event and a Cash Sweep Event are in effect, the Bird Creek Crossing Borrower is required to deposit in the TI/LC reserve any amounts paid to the Bird Creek Crossing Borrower in connection with a termination, cancellation, sale or other disposition of any lease (or portion of the lease) other than any amount that relates to periods prior to such disposition date.
Lockbox and Cash Management.The Bird Creek Crossing Mortgage Loan requires a springing lockbox and springing cash management. Upon the occurrence and continuance of a Cash Management Trigger Event, the Bird Creek Crossing Borrower is required to establish a lender-controlled lockbox account and instruct tenants to deposit rents into such lockbox account. The Bird Creek Crossing loan documents also require that all revenues received by the Bird Creek Crossing Borrower or property manager be deposited into the lockbox account within one business day of receipt. Pursuant to the Bird Creek Crossing Mortgage Loan documents, all excess funds on deposit are required to be applied as follows: (a) if a Cash Sweep Event is not in effect, to the Bird Creek Crossing Borrower; and (b) if a Cash Sweep Event is in effect due to the existence of a Critical Tenant Trigger Event (as defined below) to the Critical Tenant TI/LC account until the applicable Critical Tenant Trigger Event Cure (as defined below) has occurred. If a Cash Sweep Event is in effect but a Critical Tenant Trigger Event is not in effect, then funds will be applied to the excess cash flow account.
A “Cash Management Trigger Event” will commence upon the occurrence of the following:
| (ii) | the Bird Creek Crossing Borrower’s second late debt service payment within a 12-month period; |
| (iii) | a bankruptcy action of the Birds Creek Crossing Borrower, guarantor or property manager; |
| (iv) | a Cash Management DSCR Trigger Event (as defined below); or |
| (v) | a Critical Tenant Trigger Event. |
A Cash Management Trigger Event will end upon the occurrence of:
| ● | with regard to clause (i) above, the cure of such event of default having been accepted or waived by the lender; |
| ● | with regard to clause (ii) above, the debt service payments having been paid on time for 12 consecutive months; |
| ● | with regard to clause (iii) above, such bankruptcy action petition having been discharged, stayed, or dismissed within 60 days of such filing among other conditions for the Bird Creek Crossing Borrower or guarantor and within 120 days for the property manager, or, with respect to the property manager, the Bird Creek Crossing Borrower replacing the property manager with a qualified property manager acceptable to the lender; |
| ● | with regard to clause (iv) above, the date the amortizing debt service coverage ratio based on the trailing 12-month period immediately preceding the date of such determination is greater than 1.15x for two consecutive quarters; and |
| ● | with regard to clause (v) above, a Critical Tenant Trigger Event Cure. |
A “Cash Management DSCR Trigger Event” will occur on any day the debt service coverage ratio, based on the trailing 12-month period immediately preceding the date of determination, is less than 1.15x, unless within five days of such date, the Bird Creek Crossing Borrower delivers one or more Master Leases (as defined below) that result in a minimum debt service coverage ratio of 1.25x for the Bird Creek Crossing Mortgage Loan.
A “Cash Sweep Event” will commence upon the occurrence of the following:
| (ii) | a bankruptcy action of the Bird Creek Crossing Borrower, guarantor or property manager; |
| (iii) | a Cash Sweep DSCR Trigger Event (as defined below); or |
| (iv) | a Critical Tenant Trigger Event. |
THE INFORMATION IN THIS STRUCTURAL AND COLLATERAL TERM SHEET IS NOT COMPLETE AND MAY BE AMENDED PRIOR TO THE TIME OF SALE. THIS TERM SHEET IS NOT AN OFFER TO SELL THESE SECURITIES AND IT IS NOT A SOLICITATION OF AN OFFER TO BUY THESE SECURITIES IN ANY JURISDICTION WHERE THE OFFER OR SALE IS NOT PERMITTED.
130
| Retail - Anchored | Loan #10 | Cut-off Date Balance: | | $21,800,000 |
| 3550 South General Bruce Drive | Bird Creek Crossing | Cut-off Date LTV: | | 70.8% |
| Temple, TX 76504 | | U/W NCF DSCR: | | 1.64x |
| | | U/W NOI Debt Yield: | | 9.8% |
A Cash Sweep Event will end upon the occurrence of:
| ● | with regard to clause (i) above, the cure of such event of default having been accepted or waived by lender; |
| ● | with regard to clause (ii) above, such bankruptcy action petition having been discharged, stayed, or dismissed within 60 days of such filing among other conditions for the Bird Creek Crossing Borrower or guarantor and within 120 days for the property manager, or, with respect to the property manager, the Bird Creek Crossing Borrower replacing the property manager with a qualified manager acceptable to the lender; |
| ● | with regard to clause (iii) above, the date the amortizing debt service coverage ratio based on the trailing 12-month period immediately preceding the date of such determination is greater than 1.10x for two consecutive quarters; and |
| ● | with regard to clause (iv) above, a Critical Tenant Trigger Event Cure. |
A “Cash Sweep DSCR Trigger Event” will occur on any day the debt service coverage ratio, based on the trailing 12-month period immediately preceding the date of determination, is less than 1.10x, unless within five days of such date, the Bird Creek Crossing Borrower delivers one or more Master Leases (as defined below) that result in a minimum debt service coverage ratio of 1.25x for the Bird Creek Crossing Mortgage Loan.
A “Critical Tenant Trigger Event” will occur if E. Stanley Kroenke is not the guarantor of the Bird Creek Crossing Mortgage Loan and any of the following occurs:
| (i) | Best Buy, PetSmart, Boot Barn or Spec’s or any other tenant occupying the space currently occupied by such tenant or tenants (each, a “Critical Tenant” and each related lease, a “Critical Tenant Lease”) gives notice of its intention to not extend or renew its lease; |
| (ii) | the date that is twelve months prior to the related lease expiration date if the Critical Tenant has failed to give notice of its election to renew its lease; |
| (iii) | the date on which the Critical Tenant is required under its lease to notify the Bird Creek Crossing Borrower of its election to renew its lease if the Critical Tenant fails to give such notice; |
| (iv) | an event of default under the Critical Tenant Lease; |
| (v) | a bankruptcy action with respect to the Critical Tenant; |
| (vi) | the Critical Tenant elects to pay reduced rent (including, without limitation, percentage rent in lieu of fixed rent) ,or |
| (vii) | the Critical Tenant discontinues its normal business operations. |
A “Critical Tenant Trigger Event Cure” will occur upon:
| ● | with regard to clause (i), (ii) or (iii) above, (x) the date that (1) the Critical Tenant Lease extension is executed and delivered to the lender by the Bird Creek Crossing Borrower; and the related tenant improvement costs, leasing commissions and other material costs and expenses have been deposited into the Critical Tenant TI/LC account; or (2) a Critical Tenant Space Re-Tenanting Event (as defined below) has occurred; |
| ● | with regard to clause (iv) above, a cure of the applicable default; |
| ● | with regard to clause (v) above, an affirmation that the Critical Tenant is actually paying all rents and other amounts under the lease; |
| ● | with regard to clause (vi) above, the Critical Tenant re-commencing the payment of full unabated rent; or |
| ● | with regard to clause (vii) above, the Critical Tenant re-commencing its normal business operations or a Critical Tenant Space Re-Tenanting Event (as defined below). |
A “Critical Tenant Space Re-tenanting Event” will occur on the date each of the following conditions has been satisfied: (i) the Critical Tenant space is at least 75% leased to one or more replacement tenants for a term of at least five years and on terms that are acceptable to the lender; (ii) all tenant improvement costs, leasing commissions and other material costs and expenses relating to the re-letting of the space have been paid in full; and (iii) the replacement tenant(s) are conducting normal business operations at the related Critical Tenant space.
“Master Lease” means a lease agreement between the Bird Creek Crossing Borrower, as landlord, and the guarantor, as tenant, that (i) is for a term of 10 or more years; (ii) is subordinate to the Bird Creek Crossing Mortgage Loan documents, and (iii) contains terms and conditions reasonably acceptable to the lender. The Master Lease may not be amended without the prior consent of the lender and can be terminated only (x) if no event of default exists and (y) if, as of the Master Lease termination date, (a) the debt service coverage ratio is not less than 1.25x for two consecutive quarters without including rent from the Master Lease, or (b) the Bird Creek Crossing Borrower has deposited with the lender an amount equal to cash flow that would have been swept into the excess cash flow account, among other conditions. There are no Master Leases currently in effect.
Property Management. The Bird Creek Crossing Property is managed by an affiliate of the Bird Creek Crossing Borrower.
Partial Release. Not permitted.
Real Estate Substitution.Not permitted.
Subordinate and Mezzanine Indebtedness.Not permitted.
Ground Lease. None.
THE INFORMATION IN THIS STRUCTURAL AND COLLATERAL TERM SHEET IS NOT COMPLETE AND MAY BE AMENDED PRIOR TO THE TIME OF SALE. THIS TERM SHEET IS NOT AN OFFER TO SELL THESE SECURITIES AND IT IS NOT A SOLICITATION OF AN OFFER TO BUY THESE SECURITIES IN ANY JURISDICTION WHERE THE OFFER OR SALE IS NOT PERMITTED.
131
| Retail - Anchored | Loan #10 | Cut-off Date Balance: | | $21,800,000 |
| 3550 South General Bruce Drive | Bird Creek Crossing | Cut-off Date LTV: | | 70.8% |
| Temple, TX 76504 | | U/W NCF DSCR: | | 1.64x |
| | | U/W NOI Debt Yield: | | 9.8% |
Terrorism Insurance.The Bird Creek Crossing Mortgage Loan documents require that the “all risk” insurance policy required to be maintained by the Bird Creek Crossing Borrower provides coverage for terrorism in an amount equal to the full replacement cost of the Bird Creek Crossing Property, as well as business interruption insurance covering no less than the 18-month period following the occurrence of a casualty event, together with a 6-month extended period of indemnity.
THE INFORMATION IN THIS STRUCTURAL AND COLLATERAL TERM SHEET IS NOT COMPLETE AND MAY BE AMENDED PRIOR TO THE TIME OF SALE. THIS TERM SHEET IS NOT AN OFFER TO SELL THESE SECURITIES AND IT IS NOT A SOLICITATION OF AN OFFER TO BUY THESE SECURITIES IN ANY JURISDICTION WHERE THE OFFER OR SALE IS NOT PERMITTED.
132
(THIS PAGE INTENTIONALLY LEFT BLANK)
THE INFORMATION IN THIS STRUCTURAL AND COLLATERAL TERM SHEET IS NOT COMPLETE AND MAY BE AMENDED PRIOR TO THE TIME OF SALE. THIS TERM SHEET IS NOT AN OFFER TO SELL THESE SECURITIES AND IT IS NOT A SOLICITATION OF AN OFFER TO BUY THESE SECURITIES IN ANY JURISDICTION WHERE THE OFFER OR SALE IS NOT PERMITTED.
133
| No. 11 – Southern California Retail Portfolio |
| |
| Mortgage Loan Information | | Mortgaged Property Information |
| Mortgage Loan Seller: | Ladder Capital Finance LLC | | Single Asset/Portfolio(3): | Portfolio |
| Original Principal Balance: | $21,500,000 | | Property Type – Subtype: | Retail – Single Tenant |
| Cut-off Date Balance: | $21,471,838 | | Location(4): | Various, CA |
| % of Initial Pool Balance: | 3.1% | | Size: | 120,199 SF |
| Loan Purpose: | Refinance | | Cut-off Date Balance Per SF: | $178.64 |
| Borrower Sponsor: | Edward M. Israel | | Maturity Date Balance Per SF: | $142.46 |
| Guarantor: | Edward M. Israel | | Year Built/Renovated(4): | Various |
| Mortgage Rate: | 4.0700% | | Title Vesting: | Fee |
| Note Date: | September 30, 2019 | | Property Manager: | Self-Managed |
| Seasoning: | 1 month | | Current Occupancy (As of): | 100.0% (11/1/2019) |
| Maturity Date: | October 6, 2029 | | YE 2018 Occupancy: | 100.0% |
| IO Period: | 0 months | | YE 2017 Occupancy: | 100.0% |
| Loan Term (Original): | 120 months | | YE 2016 Occupancy: | 100.0% |
| Amortization Term (Original): | 360 months | | YE 2015 Occupancy: | 100.0% |
| Loan Amortization Type: | Amortizing Balloon | | Appraised Value: | $42,800,000 |
| Call Protection: | L(23),GRTR 1% or YM(93),O(4) | | Appraised Value Per SF: | $356.08 |
| Lockbox Type: | Hard/Springing Cash Management | | Appraisal Valuation Date: | August 22, 2019 |
| Additional Debt: | None | | | |
| Additional Debt Type (Balance): | NAP | | Underwriting and Financial Information |
| | | | TTM NOI(5): | NAV |
| | | | YE 2018 NOI(5): | NAV |
| | | | YE 2017 NOI(5): | NAV |
| | | | YE 2016 NOI(5): | NAV |
| | | | U/W Revenues: | $1,921,018 |
| | | | U/W Expenses: | $43,826 |
| Escrows and Reserves | | U/W NOI: | $1,877,191 |
| | Initial | Monthly | Cap | | U/W NCF: | $1,781,032 |
| Taxes(1) | $0 | Springing | NAP | | U/W DSCR based on NOI/NCF: | 1.51x / 1.43x |
| Insurance(2) | $901 | $451 | NAP | | U/W Debt Yield based on NOI/NCF: | 8.7% / 8.3% |
| TI/LC Reserve | $0 | $1,502 | NAP | | U/W Debt Yield at Maturity based on NOI/NCF: | 11.0% / 10.4% |
| Replacement Reserve | $0 | $6,511 | NAP | | Cut-off Date LTV Ratio: | 50.2% |
| | | | | | LTV Ratio at Maturity: | 40.0% |
| | | | | | | |
| | | | | | | | |
| Sources and Uses |
| Sources | | | | | Uses | | | |
| Original loan amount | $21,500,000 | | 99.0 | % | | Loan payoff | $21,356,106 | | 98.3 | % |
| Borrower equity | 226,064 | | 1.0 | | | Upfront reserves | 901 | | 0.0 | |
| | | | | | Closing costs | 369,057 | | 1.7 | |
| Total Sources | $21,726,064 | | 100.0 | % | | Total Uses | $21,726,064 | | 100.0 | % |
| (1) | Monthly deposits into the tax reserve will be required upon failure of the lender to receive reasonable satisfactory evidence that the tenants at the Home Depot Property and the Ross Dress for Less Property (each as defined below) are responsible for paying, and are in fact paying, all taxes prior to the date such taxes are delinquent and no default has occurred under any tenant lease. |
| (2) | The lender required the borrower to maintain general liability and umbrella insurance because the lender is not currently named under the policy held by Ross Dress for Less Property (as defined below). Home Depot Property (as defined below) self-insures. |
| (3) | Partial release is permitted. The borrower may obtain the release of the Home Depot Property or the Ross Dress for Less Property from the collateral in connection with a third-party, arms-length sale of the release parcel subject to, among other things, the following conditions: (i) no event of default has occurred or would occur as a result of the release, (ii) the remaining collateral has an LTV no greater than the lesser of (a) the LTV in place at origination and (b) the LTV in place immediately prior to the release, (iii) the remaining collateral has a DSCR no less than the greater of (a) the DSCR in place at origination and (b) the DSCR in place immediately prior to the release, (iv) payment of a release price (the “Release Price”) and any yield maintenance premium associated with the payment of the Release Price, (v) satisfaction of customary REMIC requirements, and (vi) payment of all other costs and expenses of the lender in connection with the release. |
| (4) | See “The Mortgage Loan” and “The Properties” sections. |
| (5) | Historical operating statements are not available as the Southern California Retail Portfolio Properties (as defined below) were purchased in 2018 and are comprised of two single tenants with triple-net leases. |
The Mortgage Loan.The mortgage loan (the “Southern California Retail Portfolio Mortgage Loan”) is evidenced by a single promissory note secured by a first mortgage encumbering the fee simple interest in a 120,199 square foot single tenant retail portfolio including the Home Depot property located at 12131 Beach Boulevard in Stanton, California (the “Home Depot Property”) and the Ross Dress for Less property located at 7060 Sunset Boulevard in Los Angeles, California (the “Ross Dress for Less Property”; the Home Depot Property and the Ross Dress for Less Property, collectively, the “Southern California Retail Portfolio Properties”). The Southern California Retail Portfolio Mortgage Loan was originated on September 30, 2019 by Ladder Capital Finance
THE INFORMATION IN THIS STRUCTURAL AND COLLATERAL TERM SHEET IS NOT COMPLETE AND MAY BE AMENDED PRIOR TO THE TIME OF SALE. THIS TERM SHEET IS NOT AN OFFER TO SELL THESE SECURITIES AND IT IS NOT A SOLICITATION OF AN OFFER TO BUY THESE SECURITIES IN ANY JURISDICTION WHERE THE OFFER OR SALE IS NOT PERMITTED.
134
| Retail – Single Tenant | Loan #11 | Cut-off Date Balance: | | $21,471,838 |
| Various, CA | Southern California Retail Portfolio | Cut-off Date LTV: | | 50.2% |
| Various | | U/W NCF DSCR: | | 1.43x |
| | | U/W NOI Debt Yield: | | 8.7% |
LLC. The Southern California Retail Portfolio Mortgage Loan had an original principal balance of $21,500,000, has an outstanding principal balance as of the Cut-off Date of $21,471,838 and accrues interest at an interest rate of 4.0700%per annum. The Southern California Retail Portfolio Mortgage Loan had an initial term of 120 months and has a remaining term of 119 months as of the Cut-off Date. The Southern California Retail Portfolio Mortgage Loan matures on October 6, 2029.
The Properties.The Southern California Retail Portfolio Properties are comprised of two single-story retail stores located in Southern California totaling 120,199 square feet. The Home Depot Property is located in Stanton, California and the Ross Dress for Less Property is located in Los Angeles, California approximately 35.4 miles away from the Home Depot Property. The Southern California Retail Portfolio Properties are 100% leased to Home Depot (A/A2/A by Fitch/Moody’s/S&P) and Ross Dress for Less (A2/A- by Moody’s/S&P), through January 2025.
As of November 1, 2019, the Southern California Retail Portfolio Properties are 100% occupied and feature a weighted average parking ratio of 3.7 parking spaces per 1,000 square feet of rentable area (see table below).
The following table presents certain information relating to the Southern California Retail Portfolio Properties:
Property Name
Location | Allocated Cut-off Date Balance | % of Portfolio Cut-off Date Balance | Occupancy | Year Built/ Renovated | Net Rentable Area (SF) | Appraised Value | Allocated Cut-off Date LTV | % of UW NOI | Parking Ratio (per 1,000 SF) |
Home Depot - 12131 Beach Boulevard Stanton, CA | $11,895,398 | 55.4% | 100.0% | 1986/NAP | 93,031 | $23,800,000 | 50.0% | 61.3% | 3.2 |
Ross Dress for Less - 7060 Sunset Boulevard Los Angeles, CA | $9,576,440 | 44.6% | 100.0% | 1969/1987 | 27,168 | $19,000,000 | 50.4% | 38.7% | 4.3 |
| Total/Weighted Average | $21,471,838 | 100.0% | 100.0% | | 120,199 | $42,800,000 | 50.2% | 100.0% | 3.7 |
Major Tenants.
Largest Tenant: Home Depot (A/A2/Aby Fitch/Moody’s/S&P; 93,031 square feet; 77.4% of net rentable area; 62.0% of underwritten base rent; 1/31/2025 lease expiration) – Home Depot is a home improvement retailer. Home Depot sells an assortment of building materials, home improvement products, and lawn and garden products, and provides various services. As of February 3, 2019, Home Depot stores averaged approximately 104,000 square feet of enclosed space, with over 24,000 additional square feet of outside garden area. Home Depot stores serve three primary customer groups: do-it-yourself customers, do-it-for-me customers and professional customers. As of February 3, 2019, Home Depot had approximately 2,278 stores located throughout the United States, the Commonwealth of Puerto Rico and the territories of the United States Virgin Islands and Guam, Canada and Mexico. Home Depot currently pays a base rent of $13.03 per square foot. Home Depot has one, ten-year renewal option followed by four, five-year renewal options.
2ndLargest Tenant: Ross Dress for Less (NR/A2/A-by Fitch/Moody’s/S&P; 27,168 square feet; 22.6% of net rentable area; 38.0% of underwritten base rent; 1/31/2025 lease expiration) –Ross Dress for Less operates off-price retail and home fashion stores. It primarily offers apparel, accessories, footwear and home fashion. As of March 2019, the company operated 1,717 stores in 38 states. The company is headquartered in Dublin, California. The company recently announced it will be opening 100 new stores during fiscal year 2019 as it desires to build its presence in both existing and newer markets. California contains the largest number of Ross Dress for Less stores at 400 of the 1,717 total stores or 23.3%. Ross Dress for Less currently pays a base rent of $27.32 per square foot. Ross Dress for Less has a one, five-year renewal option at a base rent of $29.51.
THE INFORMATION IN THIS STRUCTURAL AND COLLATERAL TERM SHEET IS NOT COMPLETE AND MAY BE AMENDED PRIOR TO THE TIME OF SALE. THIS TERM SHEET IS NOT AN OFFER TO SELL THESE SECURITIES AND IT IS NOT A SOLICITATION OF AN OFFER TO BUY THESE SECURITIES IN ANY JURISDICTION WHERE THE OFFER OR SALE IS NOT PERMITTED.
135
| Retail – Single Tenant | Loan #11 | Cut-off Date Balance: | | $21,471,838 |
| Various, CA | Southern California Retail Portfolio | Cut-off Date LTV: | | 50.2% |
| Various | | U/W NCF DSCR: | | 1.43x |
| | | U/W NOI Debt Yield: | | 8.7% |
The following table presents certain information relating to the tenancy at the Southern California Retail Portfolio Properties:
Major Tenants
| Tenant Name | Credit Rating (Fitch/Moody’s/S&P)(1) | Tenant
NRSF | % of
NRSF | Annual U/W Base Rent PSF | Annual
U/W Base Rent(2) | % of Total Annual U/W Base Rent(2) | Lease
Expiration
Date | Extension Options | Termination Option (Y/N) |
| Home Depot | A/A2/A | 93,031 | 77.4% | $13.03 | $1,212,484 | 62.0% | 1/31/2025 | Various | N |
| Ross Dress for Less | NR/A2/A- | 27,168 | 22.6% | $27.32 | $742,230 | 38.0% | 1/31/2025 | 1, 5-year | N |
| Occupied Collateral Total | 120,199 | 100.0% | $16.26 | $1,954,714 | 100.0% | | | |
| | | | | | | | | |
| Vacant Space | 0 | 0.0% | | | | | | |
| | | | | | | | | |
| Collateral Total | 120,199 | 100.0% | | | | | | |
| | | | | | | | | | |
| (1) | Certain ratings are those of the parent company whether or not the parent company guarantees the lease. |
| (2) | Annual U/W Base Rent PSF and Annual U/W Base Rent include contractual rent steps through October 2020 totalling $139,472. |
The following table presents certain information relating to the lease rollover schedule at the Southern California Retail Portfolio Properties:
Lease Expiration Schedule(1)
Year Ending
December 31, | No. of Leases Expiring | Expiring NRSF | % of Total NRSF | Cumulative Expiring NRSF | Cumulative % of Total NRSF | Annual
U/W
Base Rent(2) | % of Total Annual U/W Base Rent | Annual
U/W
Base Rent
PSF(2) |
| MTM | 0 | 0 | 0.0% | 0 | 0.0% | $0 | 0.0% | $0.00 |
| 2019 | 0 | 0 | 0.0% | 0 | 0.0% | $0 | 0.0% | $0.00 |
| 2020 | 0 | 0 | 0.0% | 0 | 0.0% | $0 | 0.0% | $0.00 |
| 2021 | 0 | 0 | 0.0% | 0 | 0.0% | $0 | 0.0% | $0.00 |
| 2022 | 0 | 0 | 0.0% | 0 | 0.0% | $0 | 0.0% | $0.00 |
| 2023 | 0 | 0 | 0.0% | 0 | 0.0% | $0 | 0.0% | $0.00 |
| 2024 | 0 | 0 | 0.0% | 0 | 0.0% | $0 | 0.0% | $0.00 |
| 2025 | 2 | 120,199 | 100.0% | 120,199 | 100.0% | $1,954,714 | 100.0% | $16.26 |
| 2026 | 0 | 0 | 0.0% | 120,199 | 100.0% | $0 | 0.0% | $0.00 |
| 2027 | 0 | 0 | 0.0% | 120,199 | 100.0% | $0 | 0.0% | $0.00 |
| 2028 | 0 | 0 | 0.0% | 120,199 | 100.0% | $0 | 0.0% | $0.00 |
| 2029 | 0 | 0 | 0.0% | 120,199 | 100.0% | $0 | 0.0% | $0.00 |
| Thereafter | 0 | 0 | 0.0% | 120,199 | 100.0% | $0 | 0.0% | $0.00 |
| Vacant | 0 | 0 | 0.0% | 120,199 | 100.0% | $0 | 0.0% | $0.00 |
| Total/Weighted Average | 2 | 120,199 | 100.0% | | | $1,954,714 | 100.0% | $16.26 |
| (1) | Information obtained from the underwritten rent roll. |
| (2) | Annual U/W Base Rent and Annual U/W Base Rent PSF include contractual rent steps through October 2020 totalling $139,472. |
The following table presents historical occupancy percentages at the Southern California Retail Portfolio Properties:
Historical Occupancy
12/31/2015(1) | 12/31/2016(1) | 12/31/2017(1) | 12/31/2018(2) | 11/1/2019(2) |
| 100.0% | 100.0% | 100.0% | 100.0% | 100.0% |
| (1) | Information provided by the borrower. |
| (2) | Information obtained from the underwritten rent roll. |
THE INFORMATION IN THIS STRUCTURAL AND COLLATERAL TERM SHEET IS NOT COMPLETE AND MAY BE AMENDED PRIOR TO THE TIME OF SALE. THIS TERM SHEET IS NOT AN OFFER TO SELL THESE SECURITIES AND IT IS NOT A SOLICITATION OF AN OFFER TO BUY THESE SECURITIES IN ANY JURISDICTION WHERE THE OFFER OR SALE IS NOT PERMITTED.
136
| Retail – Single Tenant | Loan #11 | Cut-off Date Balance: | | $21,471,838 |
| Various, CA | Southern California Retail Portfolio | Cut-off Date LTV: | | 50.2% |
| Various | | U/W NCF DSCR: | | 1.43x |
| | | U/W NOI Debt Yield: | | 8.7% |
Operating History and Underwritten Net Cash Flow. The following table presents certain information relating to the historical operating performance and underwritten net cash flow at the Southern California Retail Portfolio Properties:
Cash Flow Analysis(1)
| | | U/W | | %(2) | | U/W $ per SF | |
| Base Rent | | $1,815,242 | | 89.8 | % | | $15.10 | |
| Contractual Rent Steps(3) | | 139,472 | | 6.9 | | | 1.16 | |
| Grossed Up Vacant Space | | 0 | | 0.0 | | | 0.00 | |
| Gross Potential Rent | | $1,954,714 | | 96.7 | % | | $16.26 | |
| Other Income | | 27,540 | | 1.4 | | | 0.23 | |
| Total Recoveries | | 38,420 | | 1.9 | | | 0.32 | |
| Net Rental Income | | $2,020,674 | | 100.0 | % | | $16.81 | |
| (Vacancy & Credit Loss)(4) | | (99,657) | | (5.1 | ) | | (0.83) | |
| Effective Gross Income | | $1,921,018 | | 95.1 | % | | $15.98 | |
| | | | | | | | |
| Real Estate Taxes | | 0 | | 0.0 | | | 0.00 | |
| Insurance | | 5,406 | | 0.3 | | | 0.04 | |
| Management Fee | | 38,420 | | 2.0 | | | 0.32 | |
| Other Operating Expenses | | 0 | | 0.0 | | | 0.00 | |
| Total Operating Expenses | | $43,826 | | 2.3 | % | | $0.36 | |
| | | | | | | | |
| Net Operating Income | | $1,877,191 | | 97.7 | % | | $15.62 | |
| Replacement Reserves | | 18,030 | | 0.9 | | | 0.15 | |
| TI/LC | | 78,129 | | 4.1 | | | 0.65 | |
| Net Cash Flow | | $1,781,032 | | 92.7 | % | | $14.82 | |
| | | | | | | | |
| NOI DSCR | | 1.51x | | | | | |
| NCF DSCR | | 1.43x | | | | | |
| NOI Debt Yield | | 8.7% | | | | | |
| NCF Debt Yield | | 8.3% | | | | | |
| (1) | Historical operating statements are not available as the Southern California Retail Portfolio Properties were acquired in 2018 and are comprised of two single tenants with triple-net leases. |
| (2) | Represents (i) percent of Net Rental Income for all revenue fields, (ii) percent of Gross Potential Rent for Vacancy & Credit Loss and (iii) percent of Effective Gross Income for all other fields. |
| (3) | Represents contractual rent steps through October 2020. |
| (4) | The underwritten economic vacancy is 5.0%. The Southern California Retail Portfolio Properties were 100.0% physically occupied as of November 1, 2019. |
Market Overview and Competition.
12131 Beach Boulevard – Home Depot
The Home Depot Property is located within the Orange County market, 23.1 miles northeast of the Los Angeles central business district. The Home Depot Property is located 6.4 miles inland from Sunset Beach, one of the widest beaches in Southern California stretching 1.5 miles wide and the location of the annual Sunset Beach Art Festival. The Home Depot Property is situated at the corner of Beach Boulevard (State Highway 39) and Chapman Avenue. Beach Boulevard is a highly trafficked general and service retail corridor with average traffic volume of 71,000 cars per day within Stanton.
The Home Depot Property is located within the West County submarket of the Orange County market. According to the appraisal, the population within a one-, three- and five-mile radius of the Home Depot Property is 25,638 people, 272,839 people, and 684,585 people, respectively. Average household income within a one-, three- and five-mile radius of the Home Depot Property is $75,128, $86,021, and $91,893, respectively. The market rent based on the appraisal comparables for the Home Depot Property is $15.00 per square foot which is 15.1% above the Home Depot rent of $13.03 per square foot. Retail market vacancy within West County has stayed steady between 3.2% and 4.3% from the first quarter of 2016 to the second quarter of 2019.
7060 Sunset Boulevard – Ross Dress for Less
The Ross Dress for Less Property is situated on the corner of Sunset Boulevard and North La Brea Avenue within the Hollywood neighborhood of Los Angeles. Sunset Boulevard is 22 miles long and stretches from Hollywood to Malibu, winding past Beverly Hills,
THE INFORMATION IN THIS STRUCTURAL AND COLLATERAL TERM SHEET IS NOT COMPLETE AND MAY BE AMENDED PRIOR TO THE TIME OF SALE. THIS TERM SHEET IS NOT AN OFFER TO SELL THESE SECURITIES AND IT IS NOT A SOLICITATION OF AN OFFER TO BUY THESE SECURITIES IN ANY JURISDICTION WHERE THE OFFER OR SALE IS NOT PERMITTED.
137
| Retail – Single Tenant | Loan #11 | Cut-off Date Balance: | | $21,471,838 |
| Various, CA | Southern California Retail Portfolio | Cut-off Date LTV: | | 50.2% |
| Various | | U/W NCF DSCR: | | 1.43x |
| | | U/W NOI Debt Yield: | | 8.7% |
Bel Air and UCLA. The Ross Dress for Less Property is located 1.5 miles southwest of Paramount Pictures Studio, the longest operating studio in Hollywood with over 65 acres and thirty stages. The Ross Dress for Less Property is 1.8 miles from Sunset Strip, a 1.5 mile-long strip on Sunset Boulevard between Doheny Drive and North Crescent Heights Boulevard featuring Chateau Marmont, Sunset Tower Hotel, and the Viper Room.
Population within a one-, three-, and five-mile radius from the Ross Dress for Less Property is 55,798 people, 334,543 people, and 926,470 people, respectively. Within a one-, three-, and five-mile radius from the Ross Dress for Less Property, average household income is $79,868, $102,944, and $95,333, respectively. The Los Angeles retail market rents have grown by 18.0% from $27.88 per square foot in the first quarter of 2016 to $32.89 per square foot in the second quarter of 2019. The Los Angeles market rent of $32.89 per square foot is 20.4% above the Ross Dress for Less rent of $27.32 per square foot. Retail market vacancy within the Los Angeles market has stayed steady at 4.5% as of the first quarter of 2016 and 4.4% as of the second quarter of 2019.
The following table presents certain information relating to the appraiser’s market rent conclusion for the Home Depot Property and the Ross Dress for Less Property:
Market Rent Summary(1)
| | Home Depot | Ross Dress for Less |
| Market Rent (PSF) | $15.00 | $27.00 |
| Lease Term (Years) | 10 | 10 |
| Lease Type (Reimbursements) | NNN | NNN |
| Rent Escalations Projection (per Year) | 3.00% | 3.00% |
| (1) | Information obtained from the appraisal. |
The table below presents certain information relating to four single tenant retail property comparables for the Home Depot Property identified by the appraiser:
Comparable Leases(1)
| Property Name/Location | Year Built/ Renovated | Total GLA (SF) | Distance from Subject | Occupancy | Lease Term | Tenant Size (SF) | Annual Base Rent PSF | Lease Type |
Mission Marketplace 443 College Boulevard Oceanside, CA | 1992/NAP | 86,079 | 53.5 miles | 100.0% | 10.0 Yrs | 86,079 | $15.84 | NNN |
Hobby Lobby 10201 Valley View Street Cypress, CA | 1976/2009 | 67,000 | 2.7 miles | 100.0% | 10.0 Yrs | 67,000 | $10.20 | NNN |
150 South Bent Avenue 150 South Bent Avenue San Marcos, CA | 2003/NAP | 142,463 | 63.9 miles | 100.0% | 10.0 Yrs | 142,463 | $10.68 | NNN |
Kohl’s 18182 Irvine Boulevard Tustin, CA | 1977/NAP | 74,439 | 10.0 miles | 100.0% | 5.0 | 74,439 | $13.80 | NNN |
| (1) | Information obtained from the appraisal. |
THE INFORMATION IN THIS STRUCTURAL AND COLLATERAL TERM SHEET IS NOT COMPLETE AND MAY BE AMENDED PRIOR TO THE TIME OF SALE. THIS TERM SHEET IS NOT AN OFFER TO SELL THESE SECURITIES AND IT IS NOT A SOLICITATION OF AN OFFER TO BUY THESE SECURITIES IN ANY JURISDICTION WHERE THE OFFER OR SALE IS NOT PERMITTED.
138
| Retail – Single Tenant | Loan #11 | Cut-off Date Balance: | | $21,471,838 |
| Various, CA | Southern California Retail Portfolio | Cut-off Date LTV: | | 50.2% |
| Various | | U/W NCF DSCR: | | 1.43x |
| | | U/W NOI Debt Yield: | | 8.7% |
The table below presents certain information relating to five retail property comparables for the Ross Dress for Less Property identified by the appraiser:
Comparable Leases(1)
| Property Name/Location | Year Built/ Renovated | Total GLA (SF) | Distance from Subject | Occupancy | Lease Term | Tenant Size (SF) | Annual Base Rent PSF | Lease Type |
Ralph’s Grocery 16123 Bellflower Boulevard Bellflower, CA | 1977/NAP | 35,000 | 18.9 miles | 100.0% | 10.0 Yrs | 35,000 | $15.24 | NNN |
Michaels 11260 West Olympic Los Angeles, CA | 1997/NAP | 94,125 | 6.8 miles | 100.0% | 10.0 Yrs | 22,939 | $36.00 | NNN |
24 Hour Fitness 5045 West Slauson Avenue Los Angeles, CA | 2004/NAP | 38,524 | 7.5 miles | 100.0% | 10.0 Yrs | 38,524 | $45.96 | NNN |
Glendale Marketplace 106 South Brand Boulevard Glendale, CA | 1998/NAP | 66,808 | 6.0 miles | 100.0% | 10.0 Yrs | 15,000 | $33.00 | Gross |
Torrance Promenade 19800 Hawthorne Boulevard Torrance, CA | 1973/NAP | 240,452 | 16.5 miles | 100.0% | 10.0 Yrs | 25,000 | $18.90 | NNN |
| (1) | Information obtained from the appraisal. |
THE INFORMATION IN THIS STRUCTURAL AND COLLATERAL TERM SHEET IS NOT COMPLETE AND MAY BE AMENDED PRIOR TO THE TIME OF SALE. THIS TERM SHEET IS NOT AN OFFER TO SELL THESE SECURITIES AND IT IS NOT A SOLICITATION OF AN OFFER TO BUY THESE SECURITIES IN ANY JURISDICTION WHERE THE OFFER OR SALE IS NOT PERMITTED.
139
| No. 12 – DoubleTree ABQ |
| |
| Mortgage Loan Information | | Mortgaged Property Information |
| Mortgage Loan Seller: | Barclays Capital Real Estate Inc. | | Single Asset/Portfolio: | Single Asset |
Credit Assessment (DBRS/Fitch/Moody’s): | NR/NR/NR | | Property Type – Subtype: | Hospitality – Full Service |
| Original Principal Balance: | $19,060,000 | | Location: | Albuquerque, NM |
| Cut-off Date Balance: | $19,060,000 | | Size: | 295 Rooms |
| % of Initial Pool Balance: | 2.7% | | Cut-off Date Balance Per Room | $64,610 |
| Loan Purpose: | Acquisition | | Maturity Date Balance Per Room: | $54,927 |
| Borrower Sponsors: | AWH Partners; Bernard Michael; Chad Cooley; Jonathan Rosenfeld; Russ Flicker | | Year Built/Renovated: | 1975/2018 |
| Guarantors: | Bernard Michael; Chad Cooley; Jonathan Rosenfeld; Russ Flicker | | Title Vesting: | Fee |
| Mortgage Rate: | 4.3300% | | Property Manager: | Self-managed |
| Note Date: | August 8, 2019 | | Current Occupancy (As of): | 71.9% (6/30/2019) |
| Seasoning: | 2 months | | YE 2018 Occupancy(3): | 68.0% |
| Maturity Date: | September 6, 2029 | | YE 2017 Occupancy(3): | 60.6% |
| IO Period: | 24 months | | YE 2016 Occupancy(3): | 60.8% |
| Loan Term (Original): | 120 months | | YE 2015 Occupancy: | 62.4% |
| Amortization Term (Original): | 360 months | | Appraised Value(4): | $28,230,000 |
| Loan Amortization Type: | Interest-only, Amortizing Balloon | | Appraised Value Per Room(4): | $95,695 |
| Call Protection: | L(26),D(87),O(7) | | Appraisal Valuation Date(4): | July 24, 2019 |
| Lockbox Type: | Hard/Springing Cash Management | | | |
| Additional Debt(1): | Yes | | Underwriting and Financial Information |
| Additional Debt Type (Balance)(1): | Future Unsecured or Mezzanine Debt | | TTM NOI (06/30/2019): | $2,508,699 |
| | | | YE 2018 NOI(3): | $2,217,909 |
| | | | YE 2017 NOI(3): | $1,490,284 |
| | | | YE 2016 NOI(3): | $1,942,154 |
| | | | U/W Revenues: | $10,837,704 |
| | | | U/W Expenses: | $8,417,516 |
| | | | U/W NOI: | $2,420,188 |
| | | | | | U/W NCF: | $1,986,680 |
| Escrows and Reserves | | U/W DSCR based on NOI/NCF: | 2.13x / 1.75x |
| | Initial | Monthly | Cap | | U/W Debt Yield based on NOI/NCF: | 12.7% / 10.4% |
| Taxes | $72,967 | $14,593 | NAP | | U/W Debt Yield at Maturity based on NOI/NCF: | 14.9% / 12.3% |
| Insurance | $0 | Springing(2) | NAP | | Cut-off Date LTV Ratio(4): | 67.5% |
| FF&E Reserve | $0 | $18,063 | NAP | | LTV Ratio at Maturity(4): | 57.4% |
| Immediate Repairs Reserve | $235,235 | $0 | NAP | | | |
| PIP Reserve | $2,898,765 | $0 | NAP | | | |
| | | | | | | | |
| Sources and Uses |
| Sources | | | | | Uses | | | |
| Original loan amount | $19,060,000 | | 67.3% | | Purchase Price | $24,300,000 | | 85.9% |
| Borrower’s Equity | 9,242,336 | | 32.7 | | Closing costs | 795,369 | | 2.8 |
| | | | | | Upfront reserves | 3,206,967 | | 11.3 |
| Total Sources | $28,302,336 | | 100.0% | | Total Uses | $28,302,336 | | 100.0% |
| (1) | The borrower is permitted to incur additional unsecured or mezzanine indebtedness any time after two years following the securitization, provided that (i) no event of default is continuing; (ii) the principal amount of the DoubleTree ABQ Mortgage Loan (as defined below) and additional indebtedness does not exceed 60.765% of the aggregate fair market value of the DoubleTree ABQ Property (as defined below); (iii) the combined net cash flow debt yield is greater than 11.462%; (iv) the combined debt service coverage ratio is greater than 1.75x; (v) the additional debt is subordinate to the DoubleTree ABQ Mortgage Loan; (vi) rating agency confirmation is received; and (vii) other conditions set forth in the DoubleTree ABQ Mortgage Loan agreement are satisfied. |
| (2) | The mortgage loan documents do not require ongoing monthly escrows for insurance premiums as long as (i) no event of default has occurred and is continuing and (ii) the borrower provides the lender with evidence that the DoubleTree ABQ Mortgage Loan’s insurance coverage is included in a blanket policy and such policy is in full force and effect. |
| (3) | The increase in historical Occupancy and Net Operating Income is primarily due to the completion of a $7.7 million property improvement plan that was started in 2016 and completed in December 2018. |
| (4) | The Appraised Value, Appraised Value Per Room, Cut-off Date LTV Ratio and LTV Ratio at Maturity are based on the appraiser’s “As Is” Value inclusive of an extraordinary assumption that an upfront PIP Reserve of $3,134,000 will be escrowed by the lender and that the funds would pass with title to any purchaser of the DoubleTree ABQ Property. At origination, $2,898,765 was escrowed into a PIP Reserve and $235,235 was escrowed into an immediate repairs reserve. |
THE INFORMATION IN THIS STRUCTURAL AND COLLATERAL TERM SHEET IS NOT COMPLETE AND MAY BE AMENDED PRIOR TO THE TIME OF SALE. THIS TERM SHEET IS NOT AN OFFER TO SELL THESE SECURITIES AND IT IS NOT A SOLICITATION OF AN OFFER TO BUY THESE SECURITIES IN ANY JURISDICTION WHERE THE OFFER OR SALE IS NOT PERMITTED.
140
| Hospitality – Full Service | Loan #12 | Cut-off Date Balance: | | $19,060,000 |
| 201 Marquette Avenue Northwest | DoubleTree ABQ | Cut-off Date LTV: | | 67.5% |
| Albuquerque, NM 87102 | | U/W NCF DSCR: | | 1.75x |
| | | U/W NOI Debt Yield: | | 12.70% |
The Mortgage Loan. The mortgage loan (the “DoubleTree ABQ Mortgage Loan”) is evidenced by a single promissory note secured by a first mortgage encumbering the fee interest in a full-service hotel located in Albuquerque, New Mexico (the “DoubleTree ABQ Property”).
The Property.The DoubleTree ABQ Property is a 295-key, 16-story, full-service hotel located in the central business district of Albuquerque, New Mexico. The DoubleTree ABQ Property was constructed in 1975, and its most recent renovation commenced in 2016 and was completed in December 2018. The $7.7 million renovation included a complete remodel of all guest rooms, modernization of the meeting spaces, food and beverage outlets, lobby and public areas, and renewed building systems and HVAC. Parking at the DoubleTree ABQ Property is provided by 106 on-site surface parking spaces as well as the use of the Albuquerque Convention Center garage (located directly north of the DoubleTree ABQ Property). The DoubleTree ABQ Property contains 75 king suites, 158 double queen suites, 54 queen suites, and eight parlor suites. All rooms include a flat screen TV, work desk/chair, mini-refrigerator, Keurig coffer maker, and private balcony or mountain views. Suites include a separate living room/seating area. Amenities at the DoubleTree ABQ Property include the outdoor swimming pool, fitness center, business center, 8,188 square feet of meeting and event space and complimentary Wi-Fi. The DoubleTree ABQ Property features three food and beverage outlets, including a grab-and-go coffee shop, a bistro open for breakfast and Lounge 201, a full-service restaurant. Additionally, the DoubleTree ABQ Property is the only hotel physically connected to the Albuquerque Convention Center (via underground tunnel). The Albuquerque Convention Center is an approximately 300,000 square foot complex that completed a multi-phase, $23.2 million restoration in 2013. The DoubleTree ABQ Property secured 42,778 nights of room reservations due to convention center demand in 2018 and the borrower sponsor expects to secure approximately 72,000 nights of room reservations due to this demand in 2019. The DoubleTree ABQ Property is operated as a DoubleTree by Hilton under a franchise agreement between the borrower and Hilton Franchise Holdings LLC dated August 8, 2019, which expires on August 31, 2034.
The following table presents certain information relating to the market segmentation of the DoubleTree ABQ Property, as provided in the appraisal:
Estimated Market Segmentation(1)
Commercial | Meeting/Group | Leisure |
| | 15% | | | 34% | 51% |
| (1) | Information obtained from the appraisal. |
Market Overview and Competition.The DoubleTree ABQ Property is located in Albuquerque, New Mexico, within Bernalillo County. The DoubleTree ABQ Property comprises a city block in downtown Albuquerque bound by Marquette Avenue to the south, 3rd Street NW to the west, Roma Avenue to the north, and 2nd Street NW to the east. The DoubleTree ABQ Property is located in the downtown area just north of the Albuquerque Convention Center, an approximately 300,000 square foot complex that completed a multi-phase, $23.2 million restoration in 2013. According to the appraisal, the Albuquerque Convention Center has 18 citywide events, 11 meetings and 113 business groups booked in 2019 YTD. Other demand drivers for the area include nature attractions such as the Sandia Mountains and the Rio Grande, and sports and entertainment venues, such as the Isotopes Park minor league baseball stadium and the Isleta Amphitheater (2.6 miles and 8.0 miles from the DoubleTree ABQ Property, respectively). Business demand drivers in Albuquerque include high-tech research facilities, healthcare providers, military bases and entertainment production facilities. The DoubleTree ABQ Property is located approximately one mile west of Interstate 25, a major north-south highway running from Wyoming to New Mexico, and is located approximately four miles from the Albuquerque International Sunport Airport.
According to a third party market report, the estimated 2019 population within a three- and five-mile radius of the DoubleTree ABQ Property was 103,453 and 260,349, respectively; and the estimated 2019 average household income within the same radii was $59,989 and $59,424, respectively. According to the appraisal, there is a Hilton Garden Inn being constructed nearby that is considered to be directly competitive with the DoubleTree ABQ Property. The Hilton Garden Inn is expected to open in May 2020 and will include 90 rooms that will be directly competitive with the DoubleTree ABQ Property, which is less than 5.0% of the room count of the DoubleTree ABQ Property’s competitive set.
THE INFORMATION IN THIS STRUCTURAL AND COLLATERAL TERM SHEET IS NOT COMPLETE AND MAY BE AMENDED PRIOR TO THE TIME OF SALE. THIS TERM SHEET IS NOT AN OFFER TO SELL THESE SECURITIES AND IT IS NOT A SOLICITATION OF AN OFFER TO BUY THESE SECURITIES IN ANY JURISDICTION WHERE THE OFFER OR SALE IS NOT PERMITTED.
141
| Hospitality – Full Service | Loan #12 | Cut-off Date Balance: | | $19,060,000 |
| 201 Marquette Avenue Northwest | DoubleTree ABQ | Cut-off Date LTV: | | 67.5% |
| Albuquerque, NM 87102 | | U/W NCF DSCR: | | 1.75x |
| | | U/W NOI Debt Yield: | | 12.70% |
The following table presents historical occupancy, ADR, RevPAR and penetration rates relating to the DoubleTree ABQ Property’s competitive set from the appraisal:
Subject and Market Historical Occupancy, ADR and RevPAR(1)
| | Competitive Set | DoubleTree ABQ(2) | Penetration Factor |
Year | Occupancy | ADR | RevPAR | Occupancy | ADR | RevPAR | Occupancy | ADR | RevPAR |
| YTD 06/30/2019 | 69.9% | $110.20 | $76.99 | 71.9% | $109.71 | $78.90 | 102.9% | 99.6% | 102.5% |
| 12/31/2018 | 67.0% | $103.99 | $69.72 | 68.0% | $104.37 | $70.95 | 101.4% | 100.4% | 101.8% |
| 12/31/2017 | 65.9% | $103.56 | $68.29 | 60.6% | $103.15 | $62.55 | 92.0% | 99.6% | 91.6% |
| 12/31/2016 | 63.7% | $103.09 | $65.72 | 60.8% | $100.07 | $60.80 | 95.4% | 97.1% | 92.5% |
| 12/31/2015 | 62.4% | $100.59 | $62.76 | 62.4% | $99.38 | $59.30 | 99.9% | 98.8% | 94.5% |
| (1) | Information obtained from a third party research report. The competitive set includes the following hotels: Hotel Albuquerque at Old Town, Sheraton Hotel Albuquerque Uptown, Sheraton Hotel Albuquerque Airport, Marriott Albuquerque, Crowne Plaza Albuquerque, and Hyatt Regency Albuquerque. |
| (2) | Information from the DoubleTree ABQ Property was obtained from the borrower. |
The following table presents 2018 estimated occupancy, estimated ADR and RevPAR relating to the DoubleTree ABQ Property’s primary competitive set:
Primary Competitive Set(1)
Property Name | Location | Rooms | Year Built | Estimated 2018 Occupancy | Estimated 2018 ADR | Estimated 2018 RevPAR |
| DoubleTree ABQ | Albuquerque, NM | 295 | 1975 | 68% | $104.37 | $70.95 |
| Hotel Albuquerque at Old Town | Albuquerque, NM | 188 | 1975 | 71% | $112.00 | $79.52 |
| Sheraton Hotel Albuquerque Uptown | Albuquerque, NM | 295 | 1980 | 68% | $100.00 | $68.00 |
| Sheraton Hotel Albuquerque Airport | Albuquerque, NM | 276 | 1973 | 64% | $99.00 | $63.36 |
| Marriott Albuquerque | Albuquerque, NM | 411 | 1982 | 70% | $115.00 | $80.50 |
| Crowne Plaza Albuquerque | Albuquerque, NM | 261 | 1971 | 64% | $99.00 | $63.36 |
| Hyatt Regency Albuquerque | Albuquerque, NM | 382 | 1990 | 70% | $113.00 | $79.10 |
| (1) | Information obtained from the appraisal for the competitive set and was obtained from the borrower for the DoubleTree ABQ Property. |
THE INFORMATION IN THIS STRUCTURAL AND COLLATERAL TERM SHEET IS NOT COMPLETE AND MAY BE AMENDED PRIOR TO THE TIME OF SALE. THIS TERM SHEET IS NOT AN OFFER TO SELL THESE SECURITIES AND IT IS NOT A SOLICITATION OF AN OFFER TO BUY THESE SECURITIES IN ANY JURISDICTION WHERE THE OFFER OR SALE IS NOT PERMITTED.
142
| Hospitality – Full Service | Loan #12 | Cut-off Date Balance: | | $19,060,000 |
| 201 Marquette Avenue Northwest | DoubleTree ABQ | Cut-off Date LTV: | | 67.5% |
| Albuquerque, NM 87102 | | U/W NCF DSCR: | | 1.75x |
| | | U/W NOI Debt Yield: | | 12.70% |
Operating History and Underwritten Net Cash Flow. The following table presents certain information relating to the historical operating performance and the underwritten net cash flow at the DoubleTree ABQ Property:
Cash Flow Analysis
| | 2016(1) | 2017(1) | 2018(1) | TTM 06/30/2019 | U/W | % of U/W Total Revenue(2) | U/W $ per Room |
| Occupancy | 60.8% | 60.6% | 68.0% | 71.9% | 71.9% | | |
| ADR | $100.07 | $103.15 | $104.37 | $109.71 | $109.71 | | |
| RevPAR | $60.80 | $62.55 | $70.95 | $78.90 | $78.90 | | |
| | | | | | | | |
| Room Revenue | $6,564,539 | $6,734,865 | $7,639,985 | $8,495,048 | $8,495,048 | 78.4% | $28,797 |
| Food & Beverage Revenue | 1,361,871 | 1,259,202 | 1,681,000 | 1,776,202 | 1,776,202 | 16.4 | 6,021 |
| Other Revenue | 386,248 | 389,349 | 513,102 | 566,454 | 566,454 | 5.2 | 1,920 |
| Total Revenue | $8,312,658 | $8,383,416 | $9,834,087 | $10,837,704 | $10,837,704 | 100.0% | $36,738 |
| | | | | | | | |
| Room Expense | 1,729,528 | 1,648,981 | 1,910,358 | 2,183,427 | 2,183,427 | 25.7 | 7,401 |
| Food & Beverage Expense | 1,171,466 | 1,299,242 | 1,500,158 | 1,534,943 | 1,534,943 | 86.4 | 5,203 |
| Other Department Expense | 35,252 | 39,665 | 53,038 | 62,073 | 62,073 | 11.0 | 210 |
| Total Department Expenses | 2,936,246 | 2,987,888 | 3,463,554 | 3,780,443 | 3,780,443 | 34.9% | 12,815 |
| Gross Operating Income | $5,376,412 | $5,395,528 | $6,370,533 | $7,057,261 | $7,057,261 | 65.1% | $23,923 |
| | | | | | | | |
| Total Undistributed Expenses | 3,208,455 | 3,668,931 | 3,899,246 | 4,283,012 | 4,391,873 | 40.5 | 14,888 |
| Gross Operating Profit | $2,167,957 | $1,726,597 | $2,471,287 | $2,774,249 | $2,665,388 | 24.6% | $9,035 |
| | | | | | | | |
| Total Fixed Charges | 225,803 | 236,313 | 253,378 | 265,550 | 245,200 | 2.3 | 831 |
| Total Operating Expenses | $6,370,504 | $6,893,132 | $7,616,178 | $8,329,005 | $8,417,516 | 77.7% | $28,534 |
| | | | | | | | |
| Net Operating Income(1) | $1,942,154 | $1,490,284 | $2,217,909 | $2,508,699 | $2,420,188 | 22.3% | $8,204 |
| FF&E | (318,887) | 0 | 393,557 | 433,241 | 433,508 | 4.0 | 1,470 |
| Net Cash Flow | $2,261,041 | $1,490,284 | $1,824,352 | $2,075,458 | $1,986,680 | 18.3% | $6,735 |
| | | | | | | | |
| NOI DSCR | 1.71x | 1.31x | 1.95x | 2.21x | 2.13x | | |
| NCF DSCR | 1.99x | 1.31x | 1.61x | 1.83x | 1.75x | | |
| NOI DY | 10.2% | 7.8% | 11.6% | 13.2% | 12.7% | | |
| NCF DY | 11.9% | 7.8% | 9.6% | 10.9% | 10.4% | | |
| | | | | | | | |
| (1) | The increase in historical Occupancy and Net Operating Income is primarily due to the completion of a $7.7 million property improvement plan that was started in 2016 and completed in December 2018. |
| (2) | % of U/W Total Revenue for Room Expense, F&B Expense and Other Department Expenses are based on their corresponding revenue line items. All other line items represent percent of Total Revenue. |
THE INFORMATION IN THIS STRUCTURAL AND COLLATERAL TERM SHEET IS NOT COMPLETE AND MAY BE AMENDED PRIOR TO THE TIME OF SALE. THIS TERM SHEET IS NOT AN OFFER TO SELL THESE SECURITIES AND IT IS NOT A SOLICITATION OF AN OFFER TO BUY THESE SECURITIES IN ANY JURISDICTION WHERE THE OFFER OR SALE IS NOT PERMITTED.
143
| No. 13 – Fortress Self Storage |
| |
| Mortgage Loan Information | | Mortgaged Property Information |
| Mortgage Loan Seller: | Rialto Mortgage Finance, LLC | | Single Asset/Portfolio: | Single Asset |
Credit Assessment (DBRS/Fitch/Moody’s): | NR/NR/NR | | Property Type – Subtype: | Self Storage – Self Storage |
| Original Principal Balance: | $18,375,000 | | Location: | St. Thomas, USVI |
| Cut-off Date Balance: | $18,375,000 | | Size: | 115,301 SF |
| % of Initial Pool Balance: | 2.6% | | Cut-off Date Balance Per SF: | $159.37 |
| Loan Purpose: | Acquisition | | Maturity Date Balance Per SF: | $138.85 |
| Borrower Sponsor(1): | Robert Moser | | Year Built/Renovated: | 1991/NAP |
| Guarantor(1): | Robert Moser | | Title Vesting: | Fee |
| Mortgage Rate: | 4.3000% | | Property Manager: | Self-managed |
| Note Date: | September 11, 2019 | | Current Occupancy (As of): | 92.3% (8/21/2019) |
| Seasoning: | 2 months | | YE 2018 Occupancy: | 90.8% |
| Maturity Date: | September 6, 2029 | | YE 2017 Occupancy: | 80.1% |
| IO Period: | 36 months | | YE 2016 Occupancy: | 76.6% |
| Loan Term (Original): | 120 months | | YE 2015 Occupancy: | NAV |
| Amortization Term (Original): | 360 months | | Appraised Value: | $26,300,000 |
| Loan Amortization Type: | Interest-only, Amortizing Balloon | | Appraised Value Per SF: | $228.10 |
| Call Protection: | L(26),D(90),O(4) | | Appraisal Valuation Date: | June 20, 2019 |
| Lockbox Type: | Springing | | Underwriting and Financial Information |
| Additional Debt(2): | Yes | | TTM NOI (7/31/2019): | $2,178,376 |
| Additional Debt Type (Balance)(2): | Future Mezzanine | | YE 2018 NOI: | $2,048,754 |
| | | | YE 2017 NOI: | $1,680,935 |
| | | | YE 2016 NOI: | $1,583,221 |
| | | | U/W Revenues: | $3,028,642 |
| | | | U/W Expenses: | $1,133,848 |
| | | | | | U/W NOI: | $1,894,794 |
| Escrows and Reserves | | U/W NCF: | $1,877,494 |
| | Initial | Monthly | Cap | | U/W DSCR based on NOI/NCF: | 1.74x / 1.72x |
| Taxes | $14,355 | $6,836 | NAP | | U/W Debt Yield based on NOI/NCF: | 10.3% / 10.2% |
| Insurance | $37,442 | $17,829 | NAP | | U/W Debt Yield at Maturity based on NOI/NCF: | 11.8% / 11.7% |
| Replacement Reserve | $0 | $1,441 | NAP | | Cut-off Date LTV Ratio: | 69.9% |
| | | | | | LTV Ratio at Maturity: | 60.9% |
| | | | | | | | |
| Sources and Uses |
| Sources | | | | | Uses | | | |
| Original loan amount | $18,375,000 | | 70.1% | | Purchase Price | $25,235,000 | | 96.3% |
| Borrower Equity | 7,827,562 | | 29.9 | | Closing costs | 915,765 | | 3.5 |
| | | | | | Upfront reserves | 51,797 | | 0.2 |
| | | | | | | | | |
| Total Sources | $26,202,562 | | 100.0% | | Total Uses | $26,202,562 | | 100.0% |
| (1) | Robert Moser is also the borrower sponsor and guarantor for the Planet Self Storage Portfolio loan (6.4% of the initial pool balance) and the Gorham Self Storage loan (0.5% of the initial pool balance). |
| (2) | The Fortress Self Storage Loan (as defined below) documents permit an affiliate of the borrower to incur future mezzanine debt, subject to certain conditions, including (i) no event of default has occurred and is continuing; (ii) the execution of an intercreditor agreement in form and substance reasonably acceptable to the lender; (iii) based on the Fortress Self Storage Loan and the mezzanine loan, (a) the combined loan-to-value ratio is not greater than 69.9% and (b) the debt service coverage ratio is not less than 1.72x; and (iv) receipt of rating agency confirmation from each rating agency, including DBRS, Fitch, and Moody’s that the mezzanine financing will not result in a downgrade, withdrawal or qualification of the respective ratings assigned to the WFCM 2019-C53 Certificates. |
The Mortgage Loan. The mortgage loan (the “Fortress Self Storage Mortgage Loan”) is evidenced by a single promissory note secured by a first mortgage encumbering the fee interest in a self storage property located in St. Thomas, US Virgin Islands (the “Fortress Self Storage Property”).
The Property.The Fortress Self Storage Property is a 115,301 square foot self storage facility located in St. Thomas, US Virgin Islands. The Fortress Self Storage Property was completed in phases between 1991 and 2004 and is situated on a 4.43-acre site. The Fortress Self Storage Property is comprised of 13 single-story and two-story buildings. The Fortress Self Storage Property has a total of 868 non-climate controlled self storage units. Property amenities include an on-site manager, exterior lighting, electronic gate and video surveillance. The Fortress Self Storage Property also includes 391 mailboxes and 30 uncovered parking spaces, which generate additional income for the Fortress Self Storage Property. As of August 21, 2019, the Fortress Self Storage Property was 92.3% occupied.
THE INFORMATION IN THIS STRUCTURAL AND COLLATERAL TERM SHEET IS NOT COMPLETE AND MAY BE AMENDED PRIOR TO THE TIME OF SALE. THIS TERM SHEET IS NOT AN OFFER TO SELL THESE SECURITIES AND IT IS NOT A SOLICITATION OF AN OFFER TO BUY THESE SECURITIES IN ANY JURISDICTION WHERE THE OFFER OR SALE IS NOT PERMITTED.
144
| Self Storage – Self Storage | Loan #13 | Cut-off Date Balance: | | $18,375,000 |
| 9160 Estate Thomas | Fortress Self Storage | Cut-off Date LTV: | | 69.9% |
| St. Thomas, VI 00802 | | U/W NCF DSCR: | | 1.72x |
| | | U/W NOI Debt Yield: | | 10.3% |
Historical Occupancy
12/31/2015 | 12/31/2016(1) | 12/31/2017(1) | 12/31/2018(1) | 8/21/2019(2) |
| NAV | 76.6% | 80.1% | 90.8% | 92.3% |
| (1) | Information obtained from the borrower. |
| (2) | Information obtained from the underwritten rent roll. |
Operating History and Underwritten Net Cash Flow. The following table presents certain information relating to the historical operating performance and the underwritten net cash flow at Fortress Self Storage Property:
Cash Flow Analysis
| | 2016 | 2017 | 2018 | TTM 7/31/2019 | U/W | %(1) | U/W $ per SF |
| Base Rent(2) | $2,161,894 | $2,287,446 | $2,701,516 | $2,840,076 | $2,967,606 | 85.5% | $25.74 |
| Grossed Up Vacant Space | 0 | 0 | 0 | 0 | 316,380 | 9.1 | 2.74 |
| Gross Potential Rent | $2,161,894 | $2,287,446 | $2,701,516 | $2,840,076 | $3,283,986 | 94.6% | $28.48 |
| Other Income(3) | 151,210 | 154,690 | 190,323 | 188,566 | 188,566 | 5.4 | 1.64 |
| Net Rental Income | $2,313,104 | $2,442,136 | $2,891,839 | $3,028,642 | $3,472,552 | 100.0% | $30.12 |
| (Vacancy & Credit Loss) | 0 | 0 | 0 | 0 | (443,910)(4) | (13.5) | (3.85) |
| Effective Gross Income | $2,313,104 | $2,442,136 | $2,891,839 | $3,028,642 | $3,028,642 | 87.2% | $26.27 |
| | | | | | | | |
| Real Estate Taxes | 99,282 | 99,282 | 80,585 | 89,154 | 165,485 | 5.5 | 1.44 |
| Insurance | 79,082 | 182,547 | 74,557 | 142,514 | 213,952 | 7.1 | 1.86 |
| Management Fee | 24,084 | 24,987 | 23,899 | 23,407 | 151,432 | 5.0 | 1.31 |
| Other Operating Expenses | 527,435 | 454,385 | 664,044 | 595,191 | 602,979 | 19.9 | 5.23 |
| Total Operating Expenses | $729,883 | $761,201 | $843,085 | $850,266 | $1,133,848 | 37.4% | $9.83 |
| | | | | | | | |
| Net Operating Income | $1,583,221 | $1,680,935 | $2,048,754 | $2,178,376 | $1,894,794 | 62.6% | $16.43 |
| Replacement Reserves | 0 | 0 | 0 | 0 | 17,300 | 0.6 | 0.15 |
| TI/LC | 0 | 0 | 0 | 0 | 0 | 0.0 | 0.00 |
| Net Cash Flow | $1,583,221 | $1,680,935 | $2,048,754 | $2,178,376 | $1,877,494 | 62.0% | $16.28 |
| | | | | | | | |
| NOI DSCR | 1.45x | 1.54x | 1.88x | 2.00x | 1.74x | | |
| NCF DSCR | 1.45x | 1.54x | 1.88x | 2.00x | 1.72x | | |
| NOI Debt Yield | 8.6% | 9.1% | 11.1% | 11.9% | 10.3% | | |
| NCF Debt Yield | 8.6% | 9.1% | 11.1% | 11.9% | 10.2% | | |
| (1) | Represents (i) percent of Net Rental Income for all revenue fields, (ii) percent of Gross Potential Rent for Vacancy & Credit Loss and (iii) percent of Effective Gross Income for all other fields. |
| (2) | Base Rent increased from 2016 to 2018 mainly due to increases in occupancy from 76.6% in 2016 to 80.1% in 2017, and 90.8% in 2018. |
| (3) | Other Income includes late fees, administrative fees, retail revenue, auction revenue, electricity reimbursement and miscellaneous revenue. |
| (4) | The underwritten economic vacancy is 13.5%. As of August 21, 2019, the Fortress Self Storage Property was 92.3% occupied, based on net rentable square footage, and 94.6%, based on net rentable units. |
Appraisal.The appraiser concluded to an “as-is” appraised value of $26,300,000 for the Fortress Self Storage Property as of June 20, 2019.
Environmental Matters. According to a Phase I environmental assessment dated June 25, 2019, there was no evidence of any recognized environmental conditions at the Fortress Self Storage Property.
Market Overview and Competition. The Fortress Self Storage Property is located in the United States Virgin Islands (“USVI”), which is approximately 1,100 miles southeast of Florida and 40 miles east of Puerto Rico and immediately west of the British Virgin Islands. The USVI is made up of three major islands: St. Croix, St. John and St. Thomas. Over the greater USVI, tourism remains the primary economic activity; the islands normally host two million visitors per year. St. Thomas is the primary center for resort tourism, government, finance, trade and commerce. Major employers within the USVI include K-Mart, Marriott Hotel Services Frenchman’s Reef, Ritz Carlton Virgin Islands Inc., and Innovative Telephone.
THE INFORMATION IN THIS STRUCTURAL AND COLLATERAL TERM SHEET IS NOT COMPLETE AND MAY BE AMENDED PRIOR TO THE TIME OF SALE. THIS TERM SHEET IS NOT AN OFFER TO SELL THESE SECURITIES AND IT IS NOT A SOLICITATION OF AN OFFER TO BUY THESE SECURITIES IN ANY JURISDICTION WHERE THE OFFER OR SALE IS NOT PERMITTED.
145
| Self Storage – Self Storage | Loan #13 | Cut-off Date Balance: | | $18,375,000 |
| 9160 Estate Thomas | Fortress Self Storage | Cut-off Date LTV: | | 69.9% |
| St. Thomas, VI 00802 | | U/W NCF DSCR: | | 1.72x |
| | | U/W NOI Debt Yield: | | 10.3% |
The Fortress Self Storage Property is located in Estate Thomas adjacent to Charlotte Amalie. Charlotte Amalie is the largest city and capital of the USVI. Charlotte Amalie has buildings of historical importance including St. Thomas Synagogue, the second-oldest synagogue in the western hemisphere and Frederick Lutheran Church. Blackbeard’s Castle is located near Charlotte Amalie and is a U.S. National Historic Landmark. Other attractions include Fort Christian, the oldest standing structure in the Virgin Islands Archipelago and Emancipation Park, which contains a copy of the Liberty Bell. St. Thomas is home to the busiest cruise ship terminal in the Caribbean, The West Indian Company Dock in Havensight. The West Indian Company Dock in Havensight is located in downtown Charlotte Amalie; the dock can accommodate three cruise ships simultaneously. The immediate area surrounding the Fortress Self Storage Property consists of single, multifamily and retail development along major arterials. Whispering Hill is a new affordable housing community under construction located south of the Fortress Self Storage Property on Highway 38. The facility will consist of three bedroom/two bath single family homes on quarter acre lots.
According to the appraisal, the Fortress Self Storage Property is located in the South (South Atlantic) self storage submarket of the Caribbean Region. As of the second quarter of 2018, the South (South Atlantic) self storage submarket reported a vacancy rate of 10.7%, asking rentals rates for 10x10 non-climate controlled units of $106.85, and asking rental rates for 10x10 climate controlled units of $130.10.
The table below presents certain information relating to comparable sales for the Fortress Self Storage Property identified by the appraiser:
Comparable Sales – Self Storage(1)
| Property Name | Location | Rentable Area (SF) | Sale Date | Sale Price | Sale Price (PSF) |
| Old Naples Self-Storage | Naples, FL | 78,105 | Aug-18 | $27,250,000 | $349 |
| Burlington Self-Storage | West Palm Beach, FL | 53,600 | Jan-18 | $12,450,000 | $232 |
| Exta Space Storage | Fort Lauderdale, FL | 119,036 | Jul-18 | $24,700,000 | $208 |
| Great Space Storage | Bonita Springs, FL | 83,880 | Jan-18 | $17,350,000 | $207 |
| (1) | Information obtained from the appraisal. |
The table below presents certain information relating to four comparable self storage properties to the Fortress Self Storage Property identified by the appraiser:
Competitive Set
| | Fortress Self Storage (Subject)(1) | Courtyard Self Storage(2) | Bulk Storage(2) | Bovoni Storage(2) | St. Thomas Cargo(2) |
| Location | St. Thomas, USVI | St. Thomas, USVI | St. Thomas, USVI | St. Thomas, USVI | St. Thomas, USVI |
| Distance to Subject | -- | 3.0 miles | 2.3 miles | 2.1 miles | 2.9 miles |
| Property Type | Self Storage | Self Storage | Self Storage | Self Storage | Self Storage |
| Year Built/Renovated | 1991/NAP | 2006/NAP | 2009/NAP | 1993/NAP | 1974/NAP |
| Total Units | 868 | 198 | 101 | 186 | NAV |
| Total Occupancy | 92.3% | 99.0% | 100.0% | 95.0% | NAV |
| (1) | Information obtained from the underwritten rent roll. |
| (2) | Information obtained from the appraisal. |
THE INFORMATION IN THIS STRUCTURAL AND COLLATERAL TERM SHEET IS NOT COMPLETE AND MAY BE AMENDED PRIOR TO THE TIME OF SALE. THIS TERM SHEET IS NOT AN OFFER TO SELL THESE SECURITIES AND IT IS NOT A SOLICITATION OF AN OFFER TO BUY THESE SECURITIES IN ANY JURISDICTION WHERE THE OFFER OR SALE IS NOT PERMITTED.
146
(THIS PAGE INTETIONALLY LEFT BLANK)
THE INFORMATION IN THIS STRUCTURAL AND COLLATERAL TERM SHEET IS NOT COMPLETE AND MAY BE AMENDED PRIOR TO THE TIME OF SALE. THIS TERM SHEET IS NOT AN OFFER TO SELL THESE SECURITIES AND IT IS NOT A SOLICITATION OF AN OFFER TO BUY THESE SECURITIES IN ANY JURISDICTION WHERE THE OFFER OR SALE IS NOT PERMITTED.
147
| No. 14 – Glenview Corporate Center |
| |
| Mortgage Loan Information | | Mortgaged Property Information |
| Mortgage Loan Seller: | Barclays Capital Real Estate Inc. | | Single Asset/Portfolio: | Single Asset |
Credit Assessment (Fitch/DBRS/Moody’s): | NR/NR/NR | | Property Type – Subtype: | Office – Suburban |
| Original Principal Balance: | $18,200,000 | | Location: | Bensalem, PA |
| Cut-off Date Balance: | $18,200,000 | | Size: | 176,244 SF |
| % of Initial Pool Balance: | 2.6% | | Cut-off Date Balance Per SF: | $103.27 |
| Loan Purpose: | Refinance | | Maturity Date Balance Per SF: | $103.27 |
| Borrower Sponsors: | Francis J. Greenburger; Time Equities, Inc. | | Year Built/Renovated: | 1991/NAP |
| Guarantor: | Francis J. Greenburger | | Title Vesting: | Fee |
| Mortgage Rate: | 3.6000% | | Property Manager: | Merion Commercial Realty Inc. |
| Note Date: | September 5, 2019 | | Current Occupancy (As of)(4): | 84.9% (9/1/2019) |
| Seasoning: | 2 months | | YE 2018 Occupancy(4)(5): | 73.9% |
| Maturity Date: | September 6, 2029 | | YE 2017 Occupancy(5): | 65.5% |
| IO Period: | 120 months | | YE 2016 Occupancy: | 68.3% |
| Loan Term (Original): | 120 months | | YE 2015 Occupancy: | 61.7% |
| Amortization Term (Original): | NAP | | Appraised Value: | $29,500,000 |
| Loan Amortization Type: | Interest-only, Balloon | | Appraised Value Per SF(6): | $167.38 |
| Call Protection: | L(26),D(90),O(4) | | Appraisal Valuation Date: | July 24, 2019 |
| Lockbox Type: | Springing | | | |
| Additional Debt: | No | | Underwriting and Financial Information |
| Additional Debt Type (Balance): | NAP | | TTM NOI (6/30/2019)(7): | $1,240,708 |
| | | | YE 2018 NOI: | $1,197,170 |
| | | | YE 2017 NOI: | $1,362,040 |
| | | | YE 2016 NOI: | $1,152,307 |
| | | | U/W Revenues: | $3,723,733 |
| | | | U/W Expenses: | $1,487,493 |
| Escrows and Reserves | | U/W NOI(7): | $2,236,240 |
| | Initial | Monthly | Cap | | U/W NCF: | $1,865,975 |
| Taxes | $61,715 | $33,086 | NAP | | U/W DSCR based on NOI/NCF: | 3.36x / 2.80x |
| Insurance | $0 | Springing(1) | NAP | | U/W Debt Yield based on NOI/NCF: | 12.3% / 10.3% |
| Replacement Reserve | $0 | $3,231 | NAP | | U/W Debt Yield at Maturity based on NOI/NCF: | 12.3% / 10.3% |
| TI/LC Reserve | $0 | $18,359 | $660,916 | | Cut-off Date LTV Ratio: | 61.7% |
| Deferred Maintenance | $0 | $0 | NAP | | LTV Ratio at Maturity: | 61.7% |
| Outstanding TI/LC(2) | $1,239,305 | $0 | NAP | | | |
| Free Rent Reserve(3) | $599,351 | $0 | NAP | | | |
| | | | | | | | |
| Sources and Uses |
| Sources | | | | | Uses | | | |
| Original loan amount | $18,200,000 | | 100.0% | | Loan payoff | $10,571,617 | | 58.1 | % |
| | | | | | Upfront reserves | 1,900,371 | | 10.4 | |
| | | | | | Closing costs | 197,929 | | 1.1 | |
| | | | | | Return of equity | 5,530,083 | | 30.4 | |
| Total Sources | $18,200,000 | | 100.0% | | Total Uses | $18,200,000 | | 100.0 | % |
| (1) | The Glenview Corporate Center Mortgage Loan (as defined below) documents require ongoing monthly insurance payments of one-twelfth of the annual insurance premiums if the borrower does not maintain a blanket policy acceptable to the lender. |
| (2) | The Initial Outstanding TI/LC reserve comprises $583,920 for Funding Metrics (14,598 square feet), $590,570 for Jefferson Health Medical Practice (8,598 square feet), and $64,815 for Monarch (11,668 square feet). |
| (3) | The Initial Free Rent Reserve comprises $187,384 for Funding Metrics’ (14,598 square feet) rent abatement period beginning October 2019 and ending May 2020, $78,847 for Jefferson Health Medical Practice’s (8,598 square feet) rent abatement period beginning October 2019 and ending February 2020, $333,120 for Health Care Services Group’s (52,072 square feet) rent abatement period beginning October 2019 and ending January 2022. |
| (4) | Historical increase in occupancy from 2018 to 9/1/2019 is due to Health Care Services Group’s 21,305 square foot expansion and the execution of leases for Funding Metrics (14,598 square feet)and Jefferson Medical Practice (8,598 square feet). |
| (5) | The increase in occupancy from 2017 to 2018 is due to five tenants executing leases for a total of 19,488 square feet in 2018. |
| (6) | The Appraised Value and Appraised Value Per SF assumes that any outstanding tenant improvements and leasing commissions are reserved at origination. The borrower reserved $1,838,656 for outstanding tenant improvements and leasing commissions and free rent at origination. |
| (7) | The increase in NOI from TTM 6/30/2019 to U/W is primarily driven by (i) Health Care Servicing Group’s expansion (21,305 square feet) that commenced February 2019 accounting for $479,363 of underwritten base rent, (ii) Funding Metrics new lease (14,598 square feet) that commenced July 2019 accounting for $291,960 of in-place base rent, and (iii) Jefferson Health Medical Practice’s new lease (8,598 square feet) that commenced September 2019 accounting for $137,568 of in-place base rent. |
The Mortgage Loan. The mortgage loan (the “Glenview Corporate Center Mortgage Loan”) is evidenced by a single promissory note secured by a first mortgage encumbering the fee interest in a 176,244 square foot office building located in Bensalem, Pennsylvania (the “Glenview Corporate Center Property”).
THE INFORMATION IN THIS STRUCTURAL AND COLLATERAL TERM SHEET IS NOT COMPLETE AND MAY BE AMENDED PRIOR TO THE TIME OF SALE. THIS TERM SHEET IS NOT AN OFFER TO SELL THESE SECURITIES AND IT IS NOT A SOLICITATION OF AN OFFER TO BUY THESE SECURITIES IN ANY JURISDICTION WHERE THE OFFER OR SALE IS NOT PERMITTED.
148
| Office – Suburban | Loan #14 | Cut-off Date Balance: | | $18,200,000 |
| 3220 & 3260 Tillman Drive | Glenview Corporate Center | Cut-off Date LTV: | | 61.7% |
| Bensalem, PA 19020 | | U/W NCF DSCR: | | 2.80x |
| | | U/W NOI Debt Yield: | | 12.3% |
The Property.The Glenview Corporate Center Property is comprised of two adjacent class A office building totaling 176,244 square feet located on a 14.2 acre site in Bensalem, Pennsylvania, approximately 18 miles northeast of Philadelphia. The 3220 Tillman Drive building is a 143,209 square foot five-story, class A, office building and the 3260 Tillman Drive building is a 100.0% occupied (excluding static gym space), 33,035 square foot single-story office building. Since acquiring the Glenview Corporate Center Property in February 2014 when the property was reportedly 52.0% occupied, the borrower sponsors have invested approximately $3.0 million, which includes renovations to the lobby and common corridor, addition of a fitness center and a grab-and-go café, shared conference facilities, roof replacement and electronic and energy upgrades and specific tenant improvements and leasing commissions. The Glenview Corporate Center Property is located within the larger Glenview Corporate Center, featuring ten class A and B office buildings, landscaped gardens, two restaurants and an Extended Stay America hotel. The Glenview Corporate Center has 1,023 surface parking spaces, resulting in a parking ratio of 5.8 spaces per 1,000 square feet. Since the borrower sponsors acquisition, occupancy has been trending up and as of September 1, 2019, the Glenview Corporate Center Property was 84.7% leased to 15 tenants.
Major Tenants.
Largest Tenant: Health Care Services Group (52,072 square feet; 29.5% of net rentable area; 36.7% of underwritten base rent; 1/31/2029 lease expiration) – Health Care Services Group (NASDAQ: HCSG) is a provider of housekeeping/laundry and dining/nutrition services to the healthcare industry. Health Care Services Group employs more than 45,000 individuals and operates in 48 states serving more than 3,700 healthcare facilities. Health Care Services Group has been a tenant at the Glenview Corporate Center Property since 1999 and has expanded multiple times, most recently to expand by 21,305 square feet in February 2019. The Glenview Corporate Center Property serves as the company’s headquarters.
Second Largest Tenant: Funding Metrics (14,598 square feet; 8.3% of net rentable area; 9.2% of underwritten base rent; 5/7/2030 lease expiration) –Funding Metrics is a data analytics provider that provides a data model focused on knowledge required to advance working capital to companies for the growth and development of their business. Funding Metrics’ lease commenced in July 2019. The tenant has one, five-year renewal option with nine to 12 months’ notice.
Third Largest Tenant: Meta Pharmaceutical Service (13,300 square feet; 7.5% of net rentable area; 9.7% of underwritten base rent; 10/31/2022 lease expiration) –Meta Pharmaceutical Service provides pharmaceutical management services through data management tools, web based applications, interactive products and other technological programs. Its headquarters is in Blue Bell, Pennsylvania, approximately 20 miles from the Glenview Corporate Center Property. Meta Pharmaceutical Service has been a tenant at the Glenview Corporate Center Property since 2015 and has one, five-year renewal option with nine to 18 months’ notice.
Fourth Largest Tenant: Monarch (11,668 square feet; 6.6% of net rentable area; 6.6% of underwritten base rent; 1/31/2023 lease expiration) –Monarch is an accounts receivable management company that provides debt recovery services such as placement review, advanced skip tracing and arranging promises to pay. Monarch has been a tenant at the Glenview Corporate Center Property since 2014 and recently renewed their lease in May 2019. Monarch has one, three-year renewal option remaining with nine to 12 months’ notice.
THE INFORMATION IN THIS STRUCTURAL AND COLLATERAL TERM SHEET IS NOT COMPLETE AND MAY BE AMENDED PRIOR TO THE TIME OF SALE. THIS TERM SHEET IS NOT AN OFFER TO SELL THESE SECURITIES AND IT IS NOT A SOLICITATION OF AN OFFER TO BUY THESE SECURITIES IN ANY JURISDICTION WHERE THE OFFER OR SALE IS NOT PERMITTED.
149
| Office – Suburban | Loan #14 | Cut-off Date Balance: | | $18,200,000 |
| 3220 & 3260 Tillman Drive | Glenview Corporate Center | Cut-off Date LTV: | | 61.7% |
| Bensalem, PA 19020 | | U/W NCF DSCR: | | 2.80x |
| | | U/W NOI Debt Yield: | | 12.3% |
The following table presents certain information relating to the tenancy at the Glenview Corporate Center Property:
Major Tenants
| Tenant Name | Credit Rating (Fitch/
Moody’s/
S&P) | Tenant
NRSF | % of
NRSF | Annual U/W Base Rent PSF(1) | Annual
U/W Base Rent(1) | % of Total Annual U/W Base Rent | Lease
Expiration
Date | Extension Options | Termination Option (Y/N) |
| Major Tenants | | | | | | | | | |
| Health Care Services Group | NR/NR/NR | 52,072 | 29.5% | $22.50 | $1,171,620 | 36.7% | 1/31/2029 | NAP | N |
| Funding Metrics | NR/NR/NR | 14,598 | 8.3% | $20.00 | $291,960 | 9.2% | 5/7/2030 | 1, 5-year(2) | N |
| Meta Pharmaceutical Service | NR/NR/NR | 13,300 | 7.5% | $23.27 | $309,491 | 9.7% | 10/31/2022 | 1, 5-year(3) | N |
| Monarch | NR/NR/NR | 11,668 | 6.6% | $18.01 | $210,141 | 6.6% | 1/31/2023 | 1, 3-year(4) | N |
| Jefferson Health Medical Practice | NR/NR/NR | 8,598 | 4.9% | $16.00 | $137,568 | 4.3% | 11/30/2030 | NAP | N |
| TD Bank | NR/NR/NR | 8,213 | 4.7% | $23.00 | $188,899 | 5.9% | 3/31/2021 | 1, 5-year(5) | N |
| Cummins Allison Corp | NR/NR/NR | 8,062 | 4.6% | $22.50 | $181,395 | 5.7% | 9/30/2023 | 1, 5-year(6) | N |
| Total Major Tenants | | 116,511 | 66.1% | $21.38 | $2,491,074 | 78.1% | | | |
| | | | | | | | | | |
| Non-Major Tenants | | 33,137 | 18.8% | $21.05 | $697,649 | 21.9% | | | |
| | | | | | | | | | |
| Occupied Collateral Total | 149,648 | 84.9% | $21.31 | $3,188,723 | 100.0% | | | |
| | | | | | | | | |
| Vacant Space | 26,596 | 15.1% | | | | | | |
| | | | | | | | | |
| Collateral Total | 176,244 | 100.0% | | | | | | |
| | | | | | | | | | |
| (1) | Annual U/W Base Rent PSF and Annual U/W Base Rent includes rent steps totaling $60,879. |
| (2) | Funding Metrics has one, five-year renewal option with nine to 12 months’ notice at 100% of the then-fair market value. |
| (3) | Meta Pharmaceutical Service has one, five-year renewal option with nine to 18 months’ notice at 100% of the then-fair market value. |
| (4) | Monarch has one, three-year renewal option with nine to 12 months’ notice at a rent equal to 3.0% greater than the lease year before the renewal option. |
| (5) | TD Bank has one, five-year renewal option with 270 days’ notice at 95% of the then-fair market value. |
| (6) | Cummins Allison Corp has one, five-year renewal option with nine to 12 months’ written notice at 100% of the then-fair market value. |
Market Overview and Competition.The Glenview Corporate Center Property is located in Bensalem, Pennsylvania, approximately 18 miles northeast of Philadelphia. According to the appraisal, Philadelphia is the seventh largest metropolitan area in the United States and is easily accessible from its surrounding suburbs through highways or public transportation. Bensalem is approximately 18 miles away from Philadelphia on Interstate 95, a major north-south highway spanning from Maine to Florida. Interstate 95 is located approximately 2.8 miles from the Glenview Corporate Center Property. Additional access to the Glenview Corporate Center Property is provided by Interstate 276 (approximately 1.5 miles away) and Route 1 (approximately one mile away). Interstate 276 provides connection to the surrounding suburban areas, and Route 1 provides access to Trenton, Princeton and northeast Philadelphia. Additionally, the SEPTA bus Route 1 has a stop at the Parx Casino, located approximately 0.5 miles from the Glenview Corporate Center Property. The Glenview Corporate Center Property is located within the larger Glenview Corporate Center, featuring ten class A and B office buildings, landscaped gardens, two restaurants and an Extended Stay America hotel. Demand drivers in the area include Bensalem Crossing and Village Crossing, both grocery-anchored shopping centers approximately 1.5 miles from the Glenview Corporate Center Property and Parx Casino, a 260,000 square foot gaming and entertainment facility.
According to the appraisal, the estimated 2018 population within a one-, three- and five-mile radius of the Glenview Corporate Center Property was approximately 7,330, 106,727, and 277,409, respectively; and the estimated 2018 average household income within the same radii was approximately $53,908, $88,618, and $87,425, respectively.
Submarket Information – According to the appraisal, the Glenview Corporate Center Property is located in the Lower Bucks County submarket. As of second quarter 2019, there is approximately 15.3 million square feet of office space in Lower Bucks County with a 12.3% vacancy rate and asking rents of $19.19 per square foot.
Appraiser’s Comp Set – The appraiser identified five directly competitive office properties totaling approximately 1.2 million square feet, with an average occupancy rate of 89.1% and asking rents ranging from $17.00 to $23.00 per square foot.
THE INFORMATION IN THIS STRUCTURAL AND COLLATERAL TERM SHEET IS NOT COMPLETE AND MAY BE AMENDED PRIOR TO THE TIME OF SALE. THIS TERM SHEET IS NOT AN OFFER TO SELL THESE SECURITIES AND IT IS NOT A SOLICITATION OF AN OFFER TO BUY THESE SECURITIES IN ANY JURISDICTION WHERE THE OFFER OR SALE IS NOT PERMITTED.
150
| Office – Suburban | Loan #14 | Cut-off Date Balance: | | $18,200,000 |
| 3220 & 3260 Tillman Drive | Glenview Corporate Center | Cut-off Date LTV: | | 61.7% |
| Bensalem, PA 19020 | | U/W NCF DSCR: | | 2.80x |
| | | U/W NOI Debt Yield: | | 12.3% |
The following table presents certain information relating to the lease rollover schedule at the Glenview Corporate Center Property:
Lease Expiration Schedule(1)
Year Ending
December 31, | No. of Leases Expiring | Expiring NRSF | % of Total NRSF | Cumulative Expiring NRSF | Cumulative % of Total NRSF | Annual
U/W
Base Rent(2) | % of Total Annual U/W Base Rent | Annual
U/W
Base Rent
PSF(2) |
| MTM | 0 | 0 | 0.0% | 0 | 0.0% | $0 | 0.0% | $0.00 |
| 2019 | 0 | 0 | 0.0% | 0 | 0.0% | $0 | 0.0% | $0.00 |
| 2020 | 2 | 4,896 | 2.8% | 4,896 | 2.8% | $111,650 | 3.5% | $22.80 |
| 2021 | 2 | 11,258 | 6.4% | 16,154 | 9.2% | $255,889 | 8.0% | $22.73 |
| 2022 | 2 | 19,068 | 10.8% | 35,222 | 20.0% | $425,049 | 13.3% | $22.29 |
| 2023 | 5 | 29,889 | 17.0% | 65,111 | 36.9% | $605,660 | 19.0% | $20.26 |
| 2024 | 1 | 2,661 | 1.5% | 67,772 | 38.5% | $50,559 | 1.6% | $19.00 |
| 2025 | 1 | 6,608 | 3.7% | 74,380 | 42.2% | $138,768 | 4.4% | $21.00 |
| 2026 | 0 | 0 | 0.0% | 74,380 | 42.2% | $0 | 0.0% | $0.00 |
| 2027 | 0 | 0 | 0.0% | 74,380 | 42.2% | $0 | 0.0% | $0.00 |
| 2028 | 0 | 0 | 0.0% | 74,380 | 42.2% | $0 | 0.0% | $0.00 |
| 2029 | 1 | 52,072 | 29.5% | 126,452 | 71.7% | $1,171,620 | 36.7% | $22.50 |
| Thereafter | 2 | 23,196 | 13.2% | 149,648 | 84.9% | $429,528 | 13.5% | $18.52 |
| Vacant(3) | 0 | 26,596 | 15.1% | 176,244 | 100.0% | $0 | 0.0% | $0.00 |
| Total/Weighted Average | 16 | 176,244 | 100.0% | | | $3,188,723 | 100.0% | $21.31 |
| (1) | Information obtained from the underwritten rent roll. |
| (2) | Annual U/W Base Rent PSF and Annual U/W Base Rent includes rent steps totaling $60,879. |
| (3) | Vacant space includes a 2,258 square foot gym space. |
The following table presents historical occupancy percentages at the Glenview Corporate Center Property:
Historical Occupancy
12/31/2015(1) | 12/31/2016(1) | 12/31/2017(1)(2) | 12/31/2018(1)(2)(3) | 9/1/2019(3)(4) |
| 61.7% | 68.3% | 65.5% | 73.9% | 84.9% |
| (1) | Information obtained from the borrower. |
| (2) | The increase in occupancy from 2017 to 2018 is due to five tenants executing leases for a total of 19,488 square feet in 2018. |
| (3) | The increase in occupancy from 2018 to 9/1/2019 is due to Health Care Services Group’s 21,305 square foot expansion and the execution of leases for Funding Metrics (14,598 square feet) and Jefferson Medical Practice (8,598 square feet). |
| (4) | Information obtained from the underwritten rent roll. |
THE INFORMATION IN THIS STRUCTURAL AND COLLATERAL TERM SHEET IS NOT COMPLETE AND MAY BE AMENDED PRIOR TO THE TIME OF SALE. THIS TERM SHEET IS NOT AN OFFER TO SELL THESE SECURITIES AND IT IS NOT A SOLICITATION OF AN OFFER TO BUY THESE SECURITIES IN ANY JURISDICTION WHERE THE OFFER OR SALE IS NOT PERMITTED.
151
| Office – Suburban | Loan #14 | Cut-off Date Balance: | | $18,200,000 |
| 3220 & 3260 Tillman Drive | Glenview Corporate Center | Cut-off Date LTV: | | 61.7% |
| Bensalem, PA 19020 | | U/W NCF DSCR: | | 2.80x |
| | | U/W NOI Debt Yield: | | 12.3% |
The following table presents certain information relating to the appraiser’s market rent conclusion for the Glenview Corporate Center Property:
Market Rent Summary(1)
| | 3220 Space | 3260 Space |
| Market Rent (PSF) | $23.00 | $19.00 |
| Average Lease Term (Years) | 7 | 7 |
| Lease Type (Reimbursements) | Base Year plus Electric | Base Year Plus Electric |
| Rent Increase Projection | $0.50per annum | $0.50per annum |
| (1) | Information obtained from the appraisal. |
The table below presents certain information relating to comparable sales pertaining to the Glenview Corporate Center Property identified by the appraiser:
Comparable Sales(1)
| Property Name | Location | Rentable Area (SF) | Sale Date | Sale Price | Sale Price (PSF) | Adjusted Sale Price (PSF) |
| Valley Forge Corporate Center | Audubon, PA | 103,186 | Jan-19 | $17,500,000 | $169.60 | $167.56 |
| Lower Makefield | Yardley, PA | 466,442 | Sep-18 | $85,250,000 | $182.77 | $182.31 |
| Campus Boulevard Office | Newton Square, PA | 252,828 | Nov-17 | $42,000,000 | $166.12 | $177.75 |
| Valley Creek Corporate | Exton, PA | 259,497 | Jun-17 | $45,300,000 | $174.57 | $179.11 |
| APEX Fort Washington | Upper Dublin Township, PA | 388,318 | Mar-17 | $74,075,000 | $190.76 | $187.13 |
| (1) | Information obtained from the appraisal. |
The following table presents certain information relating to comparable office properties to the Glenview Corporate Center Property identified by the appraiser:
Comparable Leases(1)
| Property Name/Location | Year
Built/
Renovated | Net Rentable Area (SF) | Tenant
Size
(SF) | Term
(Yrs.) | Distance
from
Subject | Occupancy | Asking Base Rent PSF | Concessions | Lease Type |
1150 Northbrook Drive Feastersville Trevose, PA | 2007/NAP | 107,742 | 13,175 | 10.0 Yrs | 2.6 miles | NAV | $25.00 | None | Base Year plus Electric |
Northbrook Corporate Center 900 Northbrook Drive Bensalem, PA | 2001/NAP | 66,285 | 9,445 | 5.2 Yrs | 2.6 miles | NAV | $18.50 | $10.00 | Base Year plus Electric |
Bucks County Technology Park 4800 State Road Trevose, PA | 1980/NAP | 364,000 | 5,089 | 5.0 Yrs | 4.7 miles | NAV | $26.77 | $17.50 | Base Year |
One Summit Square 1 Route 413 Langhorne, PA | 1984/NAP | 67,219 | 5,987 | 6.4 Yrs | 5.0 miles | NAV | $22.00 | None | Base Year plus Electric |
One Oxford Valley 2300 East Lincoln Highway Langhorne, PA | 1975/NAP | 120,000 | 795 | 3.0 Yrs | 8.0 miles | NAV | $22.00 | $9.00 | Base Year plus Electric |
2050 & 2080 Cabot Boulevard West Middletown Township, PA | NAV | 69,417 | 20,070 | 7.0 Yrs | 9.4 miles | NAV | $18.00 | $35.00 | Base Year plus Electric |
| (1) | Information obtained from appraisal.
|
THE INFORMATION IN THIS STRUCTURAL AND COLLATERAL TERM SHEET IS NOT COMPLETE AND MAY BE AMENDED PRIOR TO THE TIME OF SALE. THIS TERM SHEET IS NOT AN OFFER TO SELL THESE SECURITIES AND IT IS NOT A SOLICITATION OF AN OFFER TO BUY THESE SECURITIES IN ANY JURISDICTION WHERE THE OFFER OR SALE IS NOT PERMITTED.
152
| Office – Suburban | Loan #14 | Cut-off Date Balance: | | $18,200,000 |
| 3220 & 3260 Tillman Drive | Glenview Corporate Center | Cut-off Date LTV: | | 61.7% |
| Bensalem, PA 19020 | | U/W NCF DSCR: | | 2.80x |
| | | U/W NOI Debt Yield: | | 12.3% |
Operating History and Underwritten Net Cash Flow. The following table presents certain information relating to the historical operating performance and underwritten net cash flow at the Glenview Corporate Center Property:
Cash Flow Analysis
| | 2016 | 2017 | 2018 | TTM 5/31/2019(1) | U/W(1) | %(2) | U/W $ per SF |
| Base Rent | $2,080,265 | $2,321,439 | $2,206,796 | $2,212,192 | $3,127,844 | 73.0% | $17.75 |
| Contractual Rent Steps | 0 | 0 | 0 | 0 | 60,879 | 1.4 | .35 |
| Grossed Up Vacant Space | 0 | 0 | 0 | 0 | 559,774 | 13.1 | 3.18 |
| Gross Potential Rent | $2,080,265 | $2,321,439 | $2,206,796 | $2,212,192 | $3,748,497 | 87.5% | $21.27 |
| Other Income | 154,558 | 158,991 | 207,472 | 204,232 | 192,066 | 4.5 | 1.09 |
| Total Recoveries | 294,295 | 241,036 | 207,406 | 202,959 | 345,444 | 8.1 | 1.96 |
| Net Rental Income | $2,529,119 | $2,721,466 | $2,621,674 | $2,619,383 | $4,286,007 | 100.0% | $24.32 |
| Concessions | 0 | 0 | 0 | 0 | 0 | 0.0 | 0.00 |
| (Vacancy & Credit Loss) | 0 | 0 | 0 | 0 | (562,274)(3) | (15.0) | (3.19) |
| Effective Gross Income | $2,529,119 | $2,721,466 | $2,621,674 | $2,619,383 | $3,723,733 | 86.9% | $21.13 |
| | | | | | | | |
| Real Estate Taxes | 421,073 | 385,346 | 377,266 | 379,121 | 393,329 | 10.6 | 2.23 |
| Insurance | 23,016 | 22,242 | 27,395 | 33,402 | 31,102 | 0.8 | 0.18 |
| Management Fee | 75,739 | 80,544 | 80,717 | 78,755 | 111,712 | 3.0 | 0.63 |
| Other Operating Expenses | 856,984 | 871,293 | 939,126 | 887,397 | 951,350 | 25.5 | 5.40 |
| Total Operating Expenses | $1,376,812 | $1,359,426 | $1,424,504 | $1,378,675 | $1,487,493 | 39.9% | $8.44 |
| | | | | | | | |
| Net Operating Income | $1,152,307 | $1,362,040 | $1,197,170 | $1,240,708 | $2,236,240 | 60.1% | $12.69 |
| Replacement Reserves | 0 | 0 | 0 | 0 | 38,774 | 1.0 | 0.22 |
| TI/LC | 0 | 0 | 0 | 0 | 331,491 | 8.9 | 1.88 |
| Net Cash Flow | $1,152,307 | $1,362,040 | $1,197,170 | $1,240,708 | $1,865,975 | 50.1% | $10.59 |
| | | | | | | | |
| NOI DSCR | 1.73x | 2.04x | 1.80x | 1.86x | 3.36x | | |
| NCF DSCR | 1.73x | 2.04x | 1.80x | 1.86x | 2.80x | | |
| NOI Debt Yield | 6.3% | 7.5% | 6.6% | 6.8% | 12.3% | | |
| NCF Debt Yield | 6.3% | 7.5% | 6.6% | 6.8% | 10.3% | | |
| (1) | The increase in NOI from TTM 5/31/2019 to U/W is primarily driven by (i) Health Care Servicing Group’s expansion (21,305 square feet) that commenced February 2019 accounting for $479,363 of underwritten base rent, (ii) Funding Metrics new lease (14,598 square feet) that commenced July 2019 accounting for $291,960 of in-place base rent, and (iii) Jefferson Health Medical Practice’s new lease (8,598 square feet) that commenced September 2019 accounting for $137,568 of in-place base rent. |
| (2) | Represents (i) percent of Net Rental Income for all revenue fields, (ii) percent of Gross Potential Rent for Vacancy & Credit Loss and (iii) percent of Effective Gross Income for all other fields. |
| (3) | The underwritten economic vacancy is 15.0%. The Glenview Corporate Center Property was 84.9% physically occupied as of September 1, 2019. |
THE INFORMATION IN THIS STRUCTURAL AND COLLATERAL TERM SHEET IS NOT COMPLETE AND MAY BE AMENDED PRIOR TO THE TIME OF SALE. THIS TERM SHEET IS NOT AN OFFER TO SELL THESE SECURITIES AND IT IS NOT A SOLICITATION OF AN OFFER TO BUY THESE SECURITIES IN ANY JURISDICTION WHERE THE OFFER OR SALE IS NOT PERMITTED.
153
| No. 15 – MHI-Creekside Portfolio |
| |
| Mortgage Loan Information | | Mortgaged Property Information |
| Mortgage Loan Seller: | Rialto Mortgage Finance, LLC | | Single Asset/Portfolio: | Portfolio |
| Original Principal Balance: | $16,600,000 | | Property Type – Subtype(1): | Various - Industrial Flex/Office |
| Cut-off Date Balance: | $16,600,000 | | Location: | Various |
| % of Initial Pool Balance: | 2.4% | | Size: | 235,733 SF |
| Loan Purpose: | Refinance | �� | Cut-off Date Balance Per SF: | $70.42 |
| Borrower Sponsor: | Sanjay Chandrakant Patel | | Maturity Date Balance Per SF: | $58.57 |
| Guarantor: | Sanjay Chandrakant Patel | | Year Built/Renovated: | Various |
| Mortgage Rate: | 4.5000% | | Title Vesting: | Fee |
| Note Date: | September 27, 2019 | | Property Manager: | Colliers International |
| Seasoning: | 1 month | | Current Occupancy (As of): | 98.3% (Various) |
| Maturity Date: | October 6, 2029 | | YE 2018 Occupancy: | 95.4% |
| IO Period: | 12 months | | YE 2017 Occupancy: | 93.0% |
| Loan Term (Original): | 120 months | | YE 2016 Occupancy: | 90.6% |
| Amortization Term (Original): | 360 months | | YE 2015 Occupancy: | NAV |
| Loan Amortization Type: | Interest-only, Amortizing Balloon | | As-Is Appraised Value: | $23,995,000 |
| Call Protection: | L(25),D(91),O(4) | | As-Is Appraised Value Per SF: | $101.79 |
| Lockbox Type: | Springing | | As-Is Appraisal Valuation Date: | June 18, 2019 |
| Additional Debt: | No | | Underwriting and Financial Information |
| Additional Debt Type (Balance): | NAP | | TTM NOI (6/30/2019): | $1,678,065 |
| | | | YE 2018 NOI: | $1,627,173 |
| | | | YE 2017 NOI: | $1,593,216 |
| | | | YE 2016 NOI: | $1,423,824 |
| | | | U/W Revenues: | $2,348,646 |
| | | | U/W Expenses: | $700,136 |
| Escrows and Reserves | | U/W NOI: | $1,648,510 |
| | Initial | Monthly | Cap | | U/W NCF: | $1,491,192 |
| Taxes | $101,039 | $33,019 | NAP | | U/W DSCR based on NOI/NCF: | 1.63x / 1.48x |
| Insurance | $19,317 | $4,735 | NAP | | U/W Debt Yield based on NOI/NCF: | 9.9% / 9.0% |
| Replacement Reserve | $0 | $3,929 | $200,000 | | U/W Debt Yield at Maturity based on NOI/NCF: | 11.9% / 10.8% |
| TI/LC Reserve | $500,000 | $9,822 | $500,000 | | Cut-off Date LTV Ratio: | 69.2% |
| Deferred Maintenance | $195,000 | $0 | NAP | | LTV Ratio at Maturity: | 57.5% |
| | | | | | | |
| | | | | | | | |
| Sources and Uses |
| Sources | | | | | Uses | | | |
| Original loan amount | $16,600,000 | | 100.0% | | Loan Payoff | $10,677,372 | | 64.3 | % |
| | | | | | Closing Costs | 1,027,162 | | 6.2 | |
| | | | | | Reserves | 815,356 | | 4.9 | |
| | | | | | Return of Equity | 4,080,109 | | 24.6 | |
| Total Sources | $16,600,000 | | 100.0% | | Total Uses | $16,600,000 | | 100.0 | % |
| (1) | The MHI-Creekside Portfolio consists of 4 industrial flex properties containing 190,826 square feet and 1 office building containing 44,907 square feet. |
The Mortgage Loan. The mortgage loan (the “MHI-Creekside Portfolio Mortgage Loan”) is evidenced by a single promissory note secured by a first mortgage encumbering the fee interests in four industrial flex properties and one office property in Gahanna and Westerville, Ohio (the “MHI-Creekside Portfolio Properties”).
The Properties.The MHI-Creekside Portfolio Properties consist of four industrial flex buildings and one office building totaling 235,733 square feet. As of August 12, 2019 and August 19, 2019, the MHI-Creekside Portfolio Properties were 98.3% occupied by 33 tenants.
845 Claycraft & 1000 Morrison Road: The 845 Claycraft & 1000 Morrison Road property is an industrial flex building which consists of two, single-story buildings totaling 87,680 square feet constructed in 1999. The 845 Claycraft & 1000 Morrison Road property is situated on a 6.7-acre site and contains 22 roll up doors, 16-foot clear ceiling heights, and 204 surface parking spaces resulting in a parking ratio of 2.3 spaces per 1,000 square feet. The 845 Claycraft & 1000 Morrison Road property represents 37.2% and 36.6% of the MHI-Creekside Portfolio net rentable area and underwritten based rent, respectively. As of August 19, 2019, the 845 Claycraft & 1000 Morrison Road property was 100.0% occupied by 15 tenants.
960-1020 Claycraft Road: The 960-1020 Claycraft Road property is an industrial flex building which consists of three, single-story building totaling 55,946 square feet constructed in 2000. The 960-1020 Claycraft Road property is situated on a 5.3-acre site and contains 30 dock-high doors, seven roll up doors, 16-foot ceiling height and 70 surface parking spaces, resulting in a parking ratio of 1.3 spaces per 1,000 square feet. The 960-1020 Claycraft Road property represents 23.7% and 18.1% of the MHI-Creekside
THE INFORMATION IN THIS STRUCTURAL AND COLLATERAL TERM SHEET IS NOT COMPLETE AND MAY BE AMENDED PRIOR TO THE TIME OF SALE. THIS TERM SHEET IS NOT AN OFFER TO SELL THESE SECURITIES AND IT IS NOT A SOLICITATION OF AN OFFER TO BUY THESE SECURITIES IN ANY JURISDICTION WHERE THE OFFER OR SALE IS NOT PERMITTED.
154
| Property Type – Various | Loan #15 | Cut-off Date Balance: | | $16,600,000 |
| Property Addresses – Various | MHI-Creekside Portfolio | Cut-off Date LTV: | | 69.2% |
| | | U/W NCF DSCR: | | 1.48x |
| | | U/W NOI Debt Yield: | | 9.9% |
Portfolio net rentable area and underwritten base rent, respectively. As of August 12, 2019, the 960-1020 Claycraft Road property was 92.9% occupied by seven tenants.
920-940 Science & 1110 Claycraft: The 920-940 Science & 1110 Claycraft property is an industrial flex building which consists of three, single-story buildings totaling 35,200 square feet constructed in 1997. The 920-940 Science & 1110 Claycraft property is situated on a 3.8-acre site and contains five dock-high doors, seven roll-up loading doors, 18-foot ceiling heights, and 88 surface parking spaces, resulting in a parking ratio of 2.5 spaces per 1,000 square feet. The 920-940 Science & 1110 Claycraft property represents 14.9% and 12.2% of the MHI-Creekside Portfolio net rentable area and underwritten base rent, respectively. As of August 12, 2019, the 920-940 Science & 1110 Claycraft property was 100.0% occupied by five tenants.
810 Science Boulevard: The 810 Science property is an industrial flex building which consists of one, single-story building totaling 12,000 square feet constructed in 1997. The 810 Science property is situated on a 1.3-acre site and contains three dock-high doors and three roll-up loading doors, 16-foot ceiling heights, and 15 surface parking spaces, resulting in a parking ratio of 1.3 spaces per 1,000 square feet. The 810 Science Boulevard represents 5.1% and 6.3% of the MHI-Creekside Portfolio net rentable area and underwritten based rent, respectively. As of August 12, 2019, the 810 Science Boulevard property was 100.0% occupied by two tenants.
Creekside: The Creekside property is an office building which consists of one, single-story building totaling 44,907 square feet constructed in 1999 and renovated in 2014. The Creekside property is situated on a 6.5-acre site and contains four roll-up loading doors, 14-foot ceiling heights, and 240 surface parking spaces, resulting in a parking ratio of 5.3 space per 1,000 square feet. As of August 12, 2019, the Creekside property was 100.0% occupied by four tenants. The Creekside property accounts for 19.0% of the total NRA and 26.8% of the total U/W base rent.
The following table presents certain information relating to the MHI-Creekside Portfolio Properties:
MHI-Creekside Portfolio Properties(1)
| Property Name - Location | Year Built/Renovated | Square Feet | Allocated Cut-off Date Balance | % of Cut-off Date Balance | Appraised Value | Allocated Cut-off Date LTV Ratio | Annual U/W Base Rent | % of Annual U/W Base Rent |
845 Claycraft & 1000 Morrison Road - Gahanna, OH | 1999/NAP | 87,680 | $6,000,000 | 36.1% | $8,675,000 | 69.2% | $651,348 | 36.6% |
Creekside – Westerville, OH | 1999/2014 | 44,907 | $4,500,000 | 27.1% | $6,400,000 | 70.3% | $477,570 | 26.8% |
960 – 1020 Claycraft Road - Gahanna, OH | 2000/NAP | 55,946 | $3,200,000 | 19.3% | $4,675,000 | 68.4% | $323,276 | 18.1% |
920 – 940 Science & 1110 Claycraft - Gahanna, OH | 1997/NAP | 35,200 | $2,000,000 | 12.0% | $2,870,000 | 69.7% | $217,500 | 12.2% |
810 Science Boulevard - Gahanna, OH | 1997/NAP | 12,000 | $900,000 | 5.4% | $1,375,000 | 65.5% | $111,736 | 6.3% |
| Total | | 235,733 | $16,600,000 | 100.0% | $23,995,000 | 69.2% | $1,781,430 | 100.0% |
| (1) | Information obtained from the underwritten rent roll and the appraisals. |
Major Tenants.
Largest Tenant: HMS Business Services (25,212 square feet; 10.7% of portfolio net rentable area; 14.4% of underwritten base rent; 11/30/2020 lease expiration) – HMS Business Services is a provider of cost containment solutions in the healthcare marketplace. HMS Business Services uses healthcare data technology, analytics, and related services to deliver coordination of benefits, payment integrity, population risk intelligence, care management and consumer engagement solutions. HMS Business Services has approximately 2,500 employees across 28 office locations. HMS Business Services has a one time right of first refusal to lease any space that becomes available within the Creekside property building. HMS Business Services also has an ongoing right of first offer to lease any space that becomes available located within the Creekside property at any time during the tenant’s first renewal term (December 1, 2013 – November 30, 2020). HMS Business Services has been a tenant at the Creekside property since 2000 and has one, five-year renewal option remaining.
2ndLargest Tenant: Hollywood Imprints (14,830 square feet; 6.3% of portfolio net rentable area; 5.7% of underwritten base rent; 2/28/2024 lease expiration) – Hollywood Imprints is a family owned and operated business and was founded in 2006 in Columbus, Ohio. Hollywood Imprints offers screen printing, embroidery, and promotional products. Hollywood Imprints has printed and embroidered garments for four Superbowls, two World Series, two Stanley Cups, The Ohio State Buckeyes, Homage, Logan Paul, Rogue Fitness, Children’s Hospital, and The Relay for Life. Hollywood Imprints has been a tenant at the 845 Claycraft & 1000 Morrison Road property since 2006 and has no renewal options remaining.
3rdLargest Tenant: PT&C Forensics LLC (12,680 square feet; 5.4% of portfolio net rentable area; 4.9% of underwritten base rent; 4/30/2023 lease expiration) – PT&C Forensics LLC (Envista Forensics) is a global leader in forensic engineering & recovery solutions. The company provides forensic engineering and failure analysis, equipment loss consulting, hardware/software failure analysis,
THE INFORMATION IN THIS STRUCTURAL AND COLLATERAL TERM SHEET IS NOT COMPLETE AND MAY BE AMENDED PRIOR TO THE TIME OF SALE. THIS TERM SHEET IS NOT AN OFFER TO SELL THESE SECURITIES AND IT IS NOT A SOLICITATION OF AN OFFER TO BUY THESE SECURITIES IN ANY JURISDICTION WHERE THE OFFER OR SALE IS NOT PERMITTED.
155
| Property Type – Various | Loan #15 | Cut-off Date Balance: | | $16,600,000 |
| Property Addresses – Various | MHI-Creekside Portfolio | Cut-off Date LTV: | | 69.2% |
| | | U/W NCF DSCR: | | 1.48x |
| | | U/W NOI Debt Yield: | | 9.9% |
digital forensics, expert witness and litigation support, and equipment restoration. Envista Forensics has served the insurance, legal and risk management industries for over 30 years and has over 500 professionals located in 30 offices throughout 7 countries. PT&C Forensics LLC has been a tenant at the 845 Claycraft and 1000 Morrison Road property since 2013 and has one, five-year renewal option remaining.
Market Overview and Competition.
Gahanna, Ohio: The 845 Claycraft & 1000 Morrison Road property, 960-1020 Claycraft Road property, 920-940 Science & 1110 Claycraft property, and 810 Science Boulevard property are located on the same block in Gahanna, Ohio and are known as “MHI Commerce Center”. MHI Commerce Center is located in Gahanna, Franklin County, Ohio and is approximately 10 miles east from the Columbus central business district. Primary regional access to the area is provided by Interstate 270, which serves as the outer belt that encircles Columbus. The neighborhood surrounding MHI Commerce Center is heavily developed with industrial developments along with office properties. According to a third party market research provider, the estimated 2019 population within a one-, three- and five-mile radius of the MHI Commerce Center was approximately 3,260, 65,864 and 227,129, respectively; and the estimated 2019 median household income within the same radii was approximately $62,798, $75,398 and $79,203, respectively.
According to a third-party market research report, the MHI Commerce Center is situated within the Airport industrial submarket. As of the first quarter of 2019, the Airport industrial submarket reported a total inventory of approximately 21.3 million square feet of industrial space with a 3.5% vacancy rate and average asking rent of $5.54 per square foot. The Airport industrial submarket reported negative absorption of 395,599 square feet, with no new deliveries and 323,300 square feet under construction.
Westerville, Ohio: The Creekside Property is located in Westerville, Delaware County, Ohio and is situated on the east side of Worthington Road, just one mile east of Interstate 71 and approximately 15.0 miles north of the Columbus central business district. Interstate 71 and Polaris Parkway provide primary regional access to the neighborhood. The neighborhood surrounding the Creekside property is developed with mixed-use development, office, flex/industrial and commercial uses. According to a third-party market research provider, the estimated 2019 population within a one-, three- and five-mile radius of the Creekside property was approximately 9,318, 88,099 and 228,417, respectively; and the estimated 2019 average household income within the same radii was approximately $98,865, $104,231 and $108,247, respectively.
According to a third-party market research report, the Creekside property is situated within the Polaris office submarket. As of the first quarter of 2019, the Polaris office submarket reported a total inventory of approximately 6.6 million square feet of office space with a 7.8% vacancy rate and average asking rent of $21.41 per square foot, net. The Polaris office submarket reported positive absorption of 28,708 square feet, no deliveries and 42,000 square feet under construction.
THE INFORMATION IN THIS STRUCTURAL AND COLLATERAL TERM SHEET IS NOT COMPLETE AND MAY BE AMENDED PRIOR TO THE TIME OF SALE. THIS TERM SHEET IS NOT AN OFFER TO SELL THESE SECURITIES AND IT IS NOT A SOLICITATION OF AN OFFER TO BUY THESE SECURITIES IN ANY JURISDICTION WHERE THE OFFER OR SALE IS NOT PERMITTED.
156
| Property Type – Various | Loan #15 | Cut-off Date Balance: | | $16,600,000 |
| Property Addresses – Various | MHI-Creekside Portfolio | Cut-off Date LTV: | | 69.2% |
| | | U/W NCF DSCR: | | 1.48x |
| | | U/W NOI Debt Yield: | | 9.9% |
The following table presents certain information relating to the tenancy at the MHI-Creekside Portfolio Properties:
Major Tenants
| Tenant Name | | Tenant NRSF | % of
NRSF | Annual U/W Base Rent PSF(2) | Annual
U/W Base Rent(2) | % of Total Annual U/W Base Rent | Lease
Expiration
Date | Extension Options | Termination Option (Y/N) |
| Major Tenants | | | | | | | | |
| HMS Business Services | | 25,212 | 10.7% | $10.15 | $255,902 | 14.4% | 11/30/2020 | 1, 5-year | N |
| Hollywood Imprints | | 14,830 | 6.3% | $6.83 | $101,289 | 5.7% | 2/28/2024 | None | N |
| PT&C Forensics LLC | | 12,680 | 5.4% | $6.95 | $88,126 | 4.9% | 4/30/2023 | 1, 5-year | N |
| Perfection Bakeries, Inc. | | 12,000 | 5.1% | $6.00 | $72,000 | 4.0% | 1/31/2021 | None | N |
| Konecranes, Inc. | | 10,000 | 4.2% | $8.24 | $82,400 | 4.6% | 10/31/2023 | None | N |
| SiteOne Landscape Supply, LLC | | 10,000 | 4.2% | $7.16 | $71,600 | 4.0% | 2/28/2021 | None | N |
| Cintas Corporation No. 2 | | 10,000 | 4.2% | $6.63 | $66,300 | 3.7% | 9/12/2021 | 2, 5-year | N |
| Heritage Crystal Clean | | 10,000 | 4.2% | $4.75 | $47,500 | 2.7% | 11/30/2021 | None | N |
| Total Major Tenants | 104,722 | 44.4% | $7.50 | $785,117 | 44.1% | | | |
| | | | | | | | | |
| Non-Major Tenants | 127,065 | 53.9% | $7.84 | $996,313 | 55.9% | | | |
| | | | | | | | | |
| Occupied Total | 231,787 | 98.3% | $7.69 | $1,781,430 | 100.0% | | | |
| | | | | | | | | |
| Vacant Space | 3,946 | 1.7% | | | | | | |
| | | | | | | | | |
| Collateral Total | 235,733 | 100.0% | | | | | | |
| | | | | | | | | | |
| (1) | Annual U/W Base Rent PSF and Annual U/W Base Rent include contractual rent steps through March 2020 totaling $25,042. |
The following table presents certain information relating to the lease rollover schedule at the MHI-Creekside Portfolio Properties:
Lease Expiration Schedule(1)(2)
Year Ending
December 31, | No. of Leases Expiring | Expiring NRSF | % of Total NRSF | Cumulative Expiring NRSF | Cumulative % of Total NRSF | Annual
U/W
Base Rent | % of Total Annual U/W Base Rent | Annual
U/W
Base Rent
PSF(3) |
| MTM | 1 | 7,360 | 3.1% | 7,360 | 3.1% | $106,426 | 6.0% | $14.46 |
| 2019 | 2 | 9,970 | 4.2% | 17,330 | 7.4% | $62,200 | 3.5% | $6.24 |
| 2020 | 5 | 47,412 | 20.1% | 64,742 | 27.5% | $376,777 | 21.2% | $7.95 |
| 2021 | 10 | 69,960 | 29.7% | 134,702 | 57.1% | $446,956 | 25.1% | $6.39 |
| 2022 | 6 | 28,166 | 11.9% | 162,868 | 69.1% | $223,985 | 12.6% | $7.95 |
| 2023 | 6 | 43,889 | 18.6% | 206,757 | 87.7% | $351,261 | 19.7% | $8.00 |
| 2024 | 3 | 25,030 | 10.6% | 231,787 | 98.3% | $213,825 | 12.0% | $8.54 |
| 2025 | 0 | 0 | 0.0% | 231,787 | 98.3% | $0 | 0.0% | $0.00 |
| 2026 | 0 | 0 | 0.0% | 231,787 | 98.3% | $0 | 0.0% | $0.00 |
| 2027 | 0 | 0 | 0.0% | 231,787 | 98.3% | $0 | 0.0% | $0.00 |
| 2028 | 0 | 0 | 0.0% | 231,787 | 98.3% | $0 | 0.0% | $0.00 |
| 2029 | 0 | 0 | 0.0% | 231,787 | 98.3% | $0 | 0.0% | $0.00 |
| Thereafter | 0 | 0 | 0.0% | 231,787 | 98.3% | $0 | 0.0% | $0.00 |
| Vacant | 0 | 3,946 | 1.7% | 235,733 | 100.0% | $0 | 0.0% | $0.00 |
| Total/Weighted Average | 33 | 235,733 | 100.0% | | | $1,781,430 | 100.0% | $7.69 |
| (1) | Information obtained from the underwritten rent roll. |
| (2) | Certain tenants may have lease termination options that are excercisable prior to the originally stated expiration date of the subject lease and that are not considered in the Lease Expiration Schedule. |
| (3) | Weighted Average Annual U/W Base Rent PSF excludes vacant space. |
THE INFORMATION IN THIS STRUCTURAL AND COLLATERAL TERM SHEET IS NOT COMPLETE AND MAY BE AMENDED PRIOR TO THE TIME OF SALE. THIS TERM SHEET IS NOT AN OFFER TO SELL THESE SECURITIES AND IT IS NOT A SOLICITATION OF AN OFFER TO BUY THESE SECURITIES IN ANY JURISDICTION WHERE THE OFFER OR SALE IS NOT PERMITTED.
157
| Property Type – Various | Loan #15 | Cut-off Date Balance: | | $16,600,000 |
| Property Addresses – Various | MHI-Creekside Portfolio | Cut-off Date LTV: | | 69.2% |
| | | U/W NCF DSCR: | | 1.48x |
| | | U/W NOI Debt Yield: | | 9.9% |
The following table presents historical occupancy percentages at the MHI-Creekside Portfolio Properties:
Historical Occupancy
12/31/2015 | 12/31/2016(1) | 12/31/2017(1) | 12/31/2018(1) | Various(2) |
| NAV | 90.6% | 93.0% | 95.4% | 98.3% |
| (1) | Information obtained from the borrower. |
| (2) | Information obtained from the underwritten rent rolls dated August 12, 2019 and August 19, 2019. |
Operating History and Underwritten Net Cash Flow. The following table presents certain information relating to the underwritten net cash flow at the MHI-Creekside Portfolio Properties:
Cash Flow Analysis(1)
| | 2016 | 2017 | 2018 | TTM
6/30/2019 | U/W | % | U/W $ per
SF |
| Base Rent | $1,447,588 | $1,566,921 | $1,645,202 | $1,664,106 | $1,756,388 | 71.0% | $7.45 |
| Contractual Rent Steps(2) | 0 | 0 | 0 | 0 | 25,042 | 1.0 | $0.11 |
| Grossed Up Vacant Space | 0 | 0 | 0 | 0 | 25,649 | 1.0 | $0.11 |
| Gross Potential Rent | $1,447,588 | $1,566,921 | $1,645,202 | $1,664,106 | $1,807,079 | 73.1% | $7.67 |
| Other Income | 0 | 6,853 | 1,075 | 3,679 | 3,679 | 0.1 | $0.02 |
| Total Recoveries | 616,320 | 668,973 | 704,279 | 733,609 | 662,712 | 26.8 | $2.81 |
| Net Rental Income | $2,063,908 | $2,242,747 | $2,350,556 | $2,401,394 | $2,473,470 | 100.0% | $10.49 |
| (Vacancy & Credit Loss) | 0 | 0 | 0 | 0 | (124,823)(3) | (6.9) | (0.53) |
| Effective Gross Income | $2,063,908 | $2,242,747 | $2,350,556 | $2,401,394 | $2,348,646 | 95.0% | $9.96 |
| | | | | | | | |
| Real Estate Taxes | 301,517 | 333,014 | 340,448 | 350,102 | 360,605 | 15.4 | 1.53 |
| Insurance | 46,390 | 42,431 | 47,958 | 46,200 | 56,815 | 2.4 | 0.24 |
| Management Fee | 97,434 | 104,970 | 111,293 | 114,770 | 70,459 | 3.0 | 0.30 |
| Other Operating Expenses | 194,743 | 169,116 | 223,683 | 212,257 | 212,257 | 9.0 | 0.90 |
| Total Operating Expenses | $640,084 | $649,531 | $723,382 | $723,329 | $700,136 | 29.8% | $2.97 |
| | | | | | | | |
| Net Operating Income | $1,423,824 | $1,593,216 | $1,627,173 | $1,678,065 | $1,648,510 | 70.2% | $6.99 |
| Replacement Reserves | 0 | 0 | 0 | 0 | 39,451 | 1.7 | 0.17 |
| TI/LC | 0 | 0 | 0 | 0 | 117,867 | 5.0 | 0.50 |
| Net Cash Flow | $1,423,824 | $1,593,216 | $1,627,173 | $1,678,065 | $1,491,192 | 63.5% | $6.33 |
| | | | | | | | |
| NOI DSCR | 1.41x | 1.58x | 1.61x | 1.66x | 1.63x | | |
| NCF DSCR | 1.41x | 1.58x | 1.61x | 1.66x | 1.48x | | |
| NOI Debt Yield | 8.6% | 9.6% | 9.8% | 10.1% | 9.9% | | |
| NCF Debt Yield | 8.6% | 9.6% | 9.8% | 10.1% | 9.0% | | |
| (1) | Represents (i) percent of Net Rental Income for all revenue fields, (ii) percent of Gross Potential Rent for Vacancy & Credit Loss and (iii) percent of Effective Gross Income for all other fields. |
| (2) | Contractual Rent Steps through March 2020. |
| (3) | The underwritten economic vacancy is 5.1%. The MHI-Creekside Portfolio Properties were 98.3% physically occupied as of August 12, 2019 and August 19, 2019. |
THE INFORMATION IN THIS STRUCTURAL AND COLLATERAL TERM SHEET IS NOT COMPLETE AND MAY BE AMENDED PRIOR TO THE TIME OF SALE. THIS TERM SHEET IS NOT AN OFFER TO SELL THESE SECURITIES AND IT IS NOT A SOLICITATION OF AN OFFER TO BUY THESE SECURITIES IN ANY JURISDICTION WHERE THE OFFER OR SALE IS NOT PERMITTED.
158
| Wells Fargo Commercial Mortgage Trust 2019-C53 | Transaction Contact Information |
VI. Transaction Contact Information
Questions regarding this Structural and Collateral Term Sheet may be directed to any of the following individuals:
Wells Fargo Securities, LLC
| Brigid Mattingly Tel. | (312) 269-3062 |
| | |
| A.J. Sfarra Tel. | (212) 214-5613 |
| | |
| Alex Wong Tel. | (212) 214-5615 |
| | |
| Barclays Capital Inc. | |
| | |
| Daniel Vinson Tel. | (212) 528-8224 |
| | |
| Brian Wiele Tel. | (212) 412-5780 |
THE INFORMATION IN THIS STRUCTURAL AND COLLATERAL TERM SHEET IS NOT COMPLETE AND MAY BE AMENDED PRIOR TO THE TIME OF SALE. THIS TERM SHEET IS NOT AN OFFER TO SELL THESE SECURITIES AND IT IS NOT A SOLICITATION OF AN OFFER TO BUY THESE SECURITIES IN ANY JURISDICTION WHERE THE OFFER OR SALE IS NOT PERMITTED.
159