| | | FREE WRITING PROSPECTUS |
| | | FILED PURSUANT TO RULE 433 |
| | | REGISTRATION FILE NO.: 333-226486-10 |
| | | |
Free Writing Prospectus
Structural and Collateral Term Sheet
$1,202,148,724
(Approximate Initial Pool Balance)
BANK 2019-BNK22
as Issuing Entity
Wells Fargo Commercial Mortgage Securities, Inc.
as Depositor
Bank of America, National Association
Wells Fargo Bank, National Association
Morgan Stanley Mortgage Capital Holdings LLC
National Cooperative Bank, N.A.
as Sponsors and Mortgage Loan Sellers
Commercial Mortgage Pass-Through Certificates
Series 2019-BNK22
October 17, 2019
WELLS FARGO
SECURITIES | BofA MERRILL LYNCH | MORGAN STANLEY |
| | | |
Co-Lead Manager and Joint Bookrunner | Co-Lead Manager and Joint Bookrunner | Co-Lead Manager and Joint Bookrunner |
| | | |
Academy Securities, Inc. Co-Manager | | Drexel Hamilton Co-Manager |
STATEMENT REGARDING THIS FREE WRITING PROSPECTUS
The depositor has filed a registration statement (including a prospectus) with the Securities and Exchange Commission (‘‘SEC’’) (SEC File No. 333-226486) for the offering to which this communication relates. Before you invest, you should read the prospectus in the registration statement and other documents the depositor has filed with the SEC for more complete information about the depositor, the issuing entity and this offering. You may get these documents for free by visiting EDGAR on the SEC Web site at www.sec.gov. Alternatively, the depositor, any underwriter, or any dealer participating in the offering will arrange to send you the prospectus after filing if you request it by calling toll free 1-800-745-2063 (8 a.m. – 5 p.m. EST) or by emailing wfs.cmbs@wellsfargo.com.
Nothing in this document constitutes an offer of securities for sale in any jurisdiction where the offer or sale is not permitted. The information contained herein is preliminary as of the date hereof, supersedes any such information previously delivered to you and will be superseded by any such information subsequently delivered and ultimately by the final prospectus relating to the securities. These materials are subject to change, completion, supplement or amendment from time to time.
This free writing prospectus has been prepared by the underwriters for information purposes only and does not constitute, in whole or in part, a prospectus for the purposes of Regulation (EU) 2017/1129 (as amended) and/or Part VI of the Financial Services and Markets Act 2000, as amended, or other offering document.
STATEMENT REGARDING ASSUMPTIONS AS TO SECURITIES, PRICING ESTIMATES AND OTHER INFORMATION
The attached information contains certain tables and other statistical analyses (the “Computational Materials”) which have been prepared in reliance upon information furnished by the Mortgage Loan Sellers. Numerous assumptions were used in preparing the Computational Materials, which may or may not be reflected herein. As such, no assurance can be given as to the Computational Materials’ accuracy, appropriateness or completeness in any particular context; or as to whether the Computational Materials and/or the assumptions upon which they are based reflect present market conditions or future market performance. The Computational Materials should not be construed as either projections or predictions or as legal, tax, financial or accounting advice. You should consult your own counsel, accountant and other advisors as to the legal, tax, business, financial and related aspects of a purchase of these securities. Any weighted average lives, yields and principal payment periods shown in the Computational Materials are based on prepayment and/or loss assumptions, and changes in such prepayment and/or loss assumptions may dramatically affect such weighted average lives, yields and principal payment periods. In addition, it is possible that prepayments or losses on the underlying assets will occur at rates higher or lower than the rates shown in the attached Computational Materials. The specific characteristics of the securities may differ from those shown in the Computational Materials due to differences between the final underlying assets and the preliminary underlying assets used in preparing the Computational Materials. The principal amount and designation of any security described in the Computational Materials are subject to change prior to issuance. None of Wells Fargo Securities, LLC, BofA Securities, Inc., Morgan Stanley & Co. LLC, Academy Securities, Inc., Drexel Hamilton, LLC or any of their respective affiliates, make any representation or warranty as to the actual rate or timing of payments or losses on any of the underlying assets or the payments or yield on the securities. The information in this presentation is based upon management forecasts and reflects prevailing conditions and management’s views as of this date, all of which are subject to change. In preparing this presentation, we have relied upon and assumed, without independent verification, the accuracy and completeness of all information available from public sources or which was provided to us by or on behalf of the Mortgage Loan Sellers or which was otherwise reviewed by us.
This free writing prospectus contains certain forward-looking statements. If and when included in this free writing prospectus, the words “expects”, “intends”, “anticipates”, “estimates” and analogous expressions and all statements that are not historical facts, including statements about our beliefs or expectations, are intended to identify forward-looking statements. Any forward-looking statements are made subject to risks and uncertainties which could cause actual results to differ materially from those stated. Those risks and uncertainties include, among other things, declines in general economic and business conditions, increased competition, changes in demographics, changes in political and social conditions, regulatory initiatives and changes in customer preferences, many of which are beyond our control and the control of any other person or entity related to this offering. The forward-looking statements made in this free writing prospectus are made as of the date stated on the cover. We have no obligation to update or revise any forward-looking statement.
Wells Fargo Securities is the trade name for the capital markets and investment banking services of Wells Fargo & Company and its subsidiaries, including but not limited to Wells Fargo Securities, LLC, a member of NYSE, FINRA, NFA and SIPC, Wells Fargo Prime Services, LLC, a member of FINRA, NFA and SIPC, and Wells Fargo Bank, N.A. Wells Fargo Securities, LLC and Wells Fargo Prime Services, LLC are distinct entities from affiliated banks and thrifts.
IMPORTANT NOTICE REGARDING THE OFFERED CERTIFICATES
The information herein is preliminary and may be supplemented or amended prior to the time of sale. In addition, the Offered Certificates referred to in these materials and the asset pool backing them are subject to modification or revision (including the possibility that one or more classes of certificates may be split, combined or eliminated at any time prior to issuance or availability of a final prospectus) and are offered on a “when, as and if issued” basis.
The underwriters described in these materials may from time to time perform investment banking services for, or solicit investment banking business from, any company named in these materials. The underwriters and/or their affiliates or respective employees may from time to time have a long or short position in any security or contract discussed in these materials.
The information contained herein supersedes any previous such information delivered to any prospective investor and will be superseded by information delivered to such prospective investor prior to the time of sale.
IMPORTANT NOTICE RELATING TO AUTOMATICALLY-GENERATED EMAIL DISCLAIMERS
Any legends, disclaimers or other notices that may appear at the bottom of any email communication to which this free writing prospectus is attached relating to (1) these materials not constituting an offer (or a solicitation of an offer), (2) any representation that these materials are accurate or complete and may not be updated or (3) these materials possibly being confidential, are not applicable to these materials and should be disregarded. Such legends, disclaimers or other notices have been automatically generated as a result of these materials having been sent via Bloomberg or another system.
THE INFORMATION IN THIS STRUCTURAL AND COLLATERAL TERM SHEET IS NOT COMPLETE AND MAY BE AMENDED PRIOR TO THE TIME OF SALE. THIS TERM SHEET IS NOT AN OFFER TO SELL THESE SECURITIES AND IT IS NOT A SOLICITATION OF AN OFFER TO BUY THESE SECURITIES IN ANY JURISDICTION WHERE THE OFFER OR SALE IS NOT PERMITTED.
2
| BANK 2019-BNK22 | Transaction Highlights |
Mortgage Loan Sellers:
Mortgage Loan Seller | Number of
Mortgage Loans | Number of
Mortgaged
Properties | Aggregate Cut-off
Date Balance | Approx. % of
Initial Pool
Balance |
| Morgan Stanley Mortgage Capital Holdings LLC | 17 | 68 | $342,885,459 | 28.5% |
| Bank of America, National Association | 10 | 19 | 309,643,921 | 25.8 |
| Wells Fargo Bank, National Association | 11 | 24 | 262,610,467 | 21.8 |
| Wells Fargo Bank, National Association / Bank of America, National Association | 2 | 2 | 198,475,000 | 16.5 |
| National Cooperative Bank, N.A. | 18 | 18 | 88,533,878 | 7.4 |
Total | 58 | 131 | $1,202,148,724 | 100.0% |
Loan Pool:
| Initial Pool Balance: | $1,202,148,724 |
| Number of Mortgage Loans: | 58 |
| Average Cut-off Date Balance per Mortgage Loan: | $20,726,702 |
| Number of Mortgaged Properties: | 131 |
| Average Cut-off Date Balance per Mortgaged Property(1): | $9,176,708 |
| Weighted Average Mortgage Interest Rate: | 3.483% |
| Ten Largest Mortgage Loans as % of Initial Pool Balance: | 60.7% |
| Weighted Average Original Term to Maturity or ARD (months): | 120 |
| Weighted Average Remaining Term to Maturity or ARD (months): | 118 |
| Weighted Average Original Amortization Term (months)(2): | 361 |
| Weighted Average Remaining Amortization Term (months)(2): | 359 |
| Weighted Average Seasoning (months): | 1 |
| (1) | Information regarding mortgage loans secured by multiple properties is based on an allocation according to relative appraised values or the allocated loan amounts or property-specific release prices set forth in the related loan documents or such other allocation as the related mortgage loan seller deemed appropriate. |
| (2) | Excludes any mortgage loan that does not amortize. |
Credit Statistics:
| Weighted Average U/W Net Cash Flow DSCR(1): | 2.90x |
| Weighted Average U/W Net Operating Income Debt Yield(1): | 11.5% |
| Weighted Average Cut-off Date Loan-to-Value Ratio(1): | 52.9% |
| Weighted Average Balloon or ARD Loan-to-Value Ratio(1): | 51.5% |
| % of Mortgage Loans with Additional Subordinate Debt(2): | 12.9% |
| % of Mortgage Loans with Single Tenants(3): | 23.0% |
(1) With respect to any mortgage loan that is part of a whole loan, loan-to-value ratio, debt service coverage ratio and debt yield calculations include the relatedpari passucompanion loan(s) but exclude any related subordinate companion loan(s) (unless otherwise stated). For mortgaged properties securing residential cooperative mortgage loans, the debt service coverage ratio and debt yield for each such mortgaged property are calculated using U/W Net Operating Income or U/W Net Cash Flow, as applicable, for the related residential cooperative property which is the projected net operating income or net cash flow, as applicable, reflected in the most recent appraisal obtained by or otherwise in the possession of the related mortgage loan seller as of the cut-off date, and the loan-to-value ratio is calculated based upon the appraised value of the residential cooperative property determined as if such residential cooperative property is operated as a residential cooperative, inclusive of the amount of the underlying debt encumbering such residential cooperative property. The debt service coverage ratio, debt yield and loan-to-value ratio information do not take into account any subordinate debt (whether or not secured by the related mortgaged property), that currently exists or is allowed under the terms of any mortgage loan. See “Description of the Mortgage Pool—Mortgage Pool Characteristics” in the Preliminary Prospectus and Annex A-1 to the Preliminary Prospectus. (2) Fifteen (15) of the mortgage loans, each of which is secured by a residential cooperative property sold to the depositor by National Cooperative Bank, N.A., currently have in place subordinate secured lines of credit to the related mortgage borrowers that permit future advances (such loans, collectively, the “Subordinate Coop LOCs”). The percentage figure expressed as “% of Mortgage Loans with Additional Subordinate Debt” is determined as a percentage of the initial pool balance and does not take into account any future subordinate debt (whether or not secured by the mortgaged property), if any, that may be permitted under the terms of any mortgage loan or the pooling and servicing agreement. See “Description of the Mortgage Pool—Additional Indebtedness—Other Unsecured Indebtedness” and “Description of the Mortgage Pool—Additional Indebtedness—Other Secured Indebtedness—Additional Debt Financing for Mortgage Loans Secured by Residential Cooperatives Sold to the Depositor by National Cooperative Bank, N.A.” in the Preliminary Prospectus. (3) Excludes mortgage loans that are secured by multiple single tenant properties. |
THE INFORMATION IN THIS STRUCTURAL AND COLLATERAL TERM SHEET IS NOT COMPLETE AND MAY BE AMENDED PRIOR TO THE TIME OF SALE. THIS TERM SHEET IS NOT AN OFFER TO SELL THESE SECURITIES AND IT IS NOT A SOLICITATION OF AN OFFER TO BUY THESE SECURITIES IN ANY JURISDICTION WHERE THE OFFER OR SALE IS NOT PERMITTED.
3
| BANK 2019-BNK22 | Characteristics of the Mortgage Pool |
| B. | Summary of the Whole Loans |
| Property Name | Mortgage Loan Seller in BANK 2019-BNK22 | Note(s)(1) | Original Balance | Holder of Note | Lead Servicer for Whole Loan | Master Servicer Under Lead Securitization Servicing Agreement | Special Servicer Under
Lead Securitization
Servicing Agreement |
| Park Tower at Transbay | BANA | A-1 | $100,000,000 | BANK 2019-BNK20 | No | Wells Fargo Bank, National Association | Rialto Capital Advisors, LLC |
| A-2 | $100,000,000 | Bank of America, National Association | No |
| A-3 | $100,000,000 | BANK 2019-BNK21(2) | Yes |
| A-4 | $80,000,000 | BANK 2019-BNK22 | No |
| A-5 | $50,000,000 | Bank of America, National Association | No |
| A-6 | $50,000,000 | Bank of America, National Association | No |
| A-7 | $25,000,000 | BANK 2019-BNK22 | No |
| A-8 | $20,000,000 | BANK 2019-BNK20 | No |
| A-9 | $15,000,000 | BANK 2019-BNK21(2) | No |
| A-10 | $10,000,000 | BANK 2019-BNK22 | No |
| 230 Park Avenue South | WFB/BANA | A-1 | $55,000,000 | BANK 2019-BNK21(2) | Yes | Wells Fargo Bank, National Association | Rialto Capital Advisors, LLC |
| A-2 | $30,000,000 | BANK 2019-BNK22 | No |
| A-3 | $25,000,000 | BANK 2019-BNK22 | No |
| A-4 | $55,000,000 | BANK 2019-BNK21(2) | No |
| A-5 | $30,000,000 | BANK 2019-BNK22 | No |
| A-6 | $25,000,000 | BANK 2019-BNK22 | No |
| A-7 | $30,000,000 | JPMorgan Chase Bank, N.A. | No |
| Midtown Center | WFB/BANA | A-1-1 | 135,950,000 | DCOT 2019-MTC | Yes | Wells Fargo Bank, National Association | CWCapital Asset Management LLC |
| A-1-2 | 52,525,000 | DCOT 2019-MTC | No |
| A-1-3 | 72,525,000 | DCOT 2019-MTC | No |
| A-2-1 | 12,068,966 | BANK 2019-BNK22 | No |
| A-2-2 | 13,881,034 | BANK 2019-BNK22 | No |
| A-2-3 | 10,000,000 | BANK 2019-BNK22 | No |
| A-2-4 | 37,931,034 | BANK 2019-BNK22 | No |
| A-2-5 | 14,593,966 | BANK 2019-BNK22 | No |
| A-2-6 | 6,262,500 | Goldman Sachs Bank USA | No |
| A-2-7 | 26,262,500 | Goldman Sachs Bank USA | No |
| B-1-1 | 64,350,000 | DCOT 2019-MTC | No |
| B-1-2 | 39,325,000 | DCOT 2019-MTC | No |
| B-1-3 | 39,325,000 | DCOT 2019-MTC | No |
| Storage Post Portfolio | MSMCH | A-1 | 85,000,000 | BANK 2019-BNK21(2) | Yes | | Rialto Capital Advisors, LLC |
THE INFORMATION IN THIS STRUCTURAL AND COLLATERAL TERM SHEET IS NOT COMPLETE AND MAY BE AMENDED PRIOR TO THE TIME OF SALE. THIS TERM SHEET IS NOT AN OFFER TO SELL THESE SECURITIES AND IT IS NOT A SOLICITATION OF AN OFFER TO BUY THESE SECURITIES IN ANY JURISDICTION WHERE THE OFFER OR SALE IS NOT PERMITTED.
4
| BANK 2019-BNK22 | Characteristics of the Mortgage Pool |
| | | A-2 | 45,000,000 | BANK 2019-BNK22 | No | Wells Fargo Bank, National Association | |
| A-3 | 20,000,000 | BANK 2019-BNK22 | No |
| 360 North Crescent Drive | WFB | A-1 | 73,600,000 | Wells Fargo Bank, National Association | Yes | Wells Fargo Bank, National Association(3) | KeyBank National Association(3) |
| A-2 | 55,000,000 | BANK 2019-BNK22 | No |
| Tysons Tower | WFB | A-1 | 50,000,000 | BANK 2019-BNK21(2) | Yes | Wells Fargo Bank, National Association | Rialto Capital Advisors, LLC |
| A-2 | 25,000,000 | BANK 2019-BNK22 | No |
| A-3 | 20,000,000 | BANK 2019-BNK22 | No |
| A-4 | 40,000,000 | JPMorgan Chase Bank, N.A. | No |
| A-5 | 10,000,000 | JPMorgan Chase Bank, N.A. | No |
| A-6 | 15,000,000 | JPMorgan Chase Bank, N.A. | No |
| A-7 | 30,000,000 | JPMorgan Chase Bank, N.A. | No |
| National Anchored Retail Portfolio | MSMCH | A-1 | 50,000,000 | BANK 2019-BNK21(2) | Yes | Wells Fargo Bank, National Association | Rialto Capital Advisors, LLC |
| A-2 | 37,000,000 | MSMCH | No |
| A-3 | 30,000,000 | BANK 2019-BNK22 | No |
| | | | | | | | | |
| (1) | No assurance can be provided that any unsecuritized note will not be split further. |
| (2) | The BANK 2019-BNK21 securitization is expected to close on or about October 23, 2019. |
| (3) | The related whole loan is expected to initially be serviced under the BANK 2019-BNK22 pooling and servicing agreement until the securitization of the related “lead”pari passunote (namely, the relatedpari passunote marked “Yes” in the column entitled “Lead Servicer for Whole Loan”), after which the related whole loan will be serviced under the pooling and servicing agreement governing such securitization of the related “lead”pari passunote. The master servicer and special servicer for such securitization will be identified in a notice, report or statement to holders of the BANK 2019-BNK22 certificates after the closing of such securitization. |
THE INFORMATION IN THIS STRUCTURAL AND COLLATERAL TERM SHEET IS NOT COMPLETE AND MAY BE AMENDED PRIOR TO THE TIME OF SALE. THIS TERM SHEET IS NOT AN OFFER TO SELL THESE SECURITIES AND IT IS NOT A SOLICITATION OF AN OFFER TO BUY THESE SECURITIES IN ANY JURISDICTION WHERE THE OFFER OR SALE IS NOT PERMITTED.
5
| BANK 2019-BNK22 | Characteristics of the Mortgage Pool |
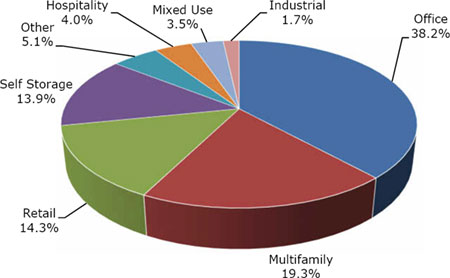
| C. | Property Type Distribution(1) |
| Property Type | | Number of
Mortgaged
Properties | | Aggregate
Cut-off Date
Balance ($) | | Approx. % of
Initial
Pool
Balance (%) | | Weighted
Average
Cut-off
Date LTV
Ratio (%) | | Weighted
Average
Balloon
LTV
Ratio (%) | | Weighted
Average
U/W NCF
DSCR (x) | | Weighted
Average
U/W NOI
Debt
Yield (%) | | Weighted
Average
U/W NCF
Debt
Yield (%) | | Weighted
Average
Mortgage
Rate (%) |
| Office | | 12 | | | $459,625,183 | | | 38.2 | % | | 49.0 | % | | 48.8 | % | | 2.95 | x | | 10.2 | % | | 10.0 | % | | 3.358 | % |
| CBD | | 3 | | | 313,475,000 | | | 26.1 | | | 47.1 | | | 47.1 | | | 3.12 | | | 10.4 | | | 10.3 | | | 3.284 | |
| Suburban | | 5 | | | 127,951,183 | | | 10.6 | | | 51.9 | | | 51.2 | | | 2.62 | | | 9.8 | | | 9.4 | | | 3.474 | |
| Medical | | 4 | | | 18,199,000 | | | 1.5 | | | 61.3 | | | 61.3 | | | 2.39 | | | 9.5 | | | 9.2 | | | 3.807 | |
| Multifamily | | 32 | | | 231,686,766 | | | 19.3 | | | 42.2 | | | 40.6 | | | 3.95 | | | 18.0 | | | 17.6 | | | 3.388 | |
| Cooperative | | 18 | | | 88,533,878 | | | 7.4 | | | 12.8 | | | 10.3 | | | 6.82 | | | 33.9 | | | 33.2 | | | 3.197 | |
| Garden | | 6 | | | 88,127,614 | | | 7.3 | | | 60.6 | | | 58.9 | | | 2.22 | | | 8.6 | | | 8.4 | | | 3.529 | |
| Mid Rise | | 8 | | | 55,025,275 | | | 4.6 | | | 59.9 | | | 59.9 | | | 2.09 | | | 7.5 | | | 7.3 | | | 3.468 | |
| Retail | | 45 | | | 171,705,107 | | | 14.3 | | | 62.0 | | | 60.9 | | | 2.49 | | | 9.8 | | | 9.5 | | | 3.673 | |
| Single Tenant | | 36 | | | 107,762,337 | | | 9.0 | | | 61.2 | | | 61.2 | | | 2.50 | | | 9.3 | | | 9.0 | | | 3.578 | |
| Anchored | | 6 | | | 41,467,770 | | | 3.4 | | | 63.7 | | | 59.9 | | | 2.64 | | | 11.4 | | | 10.8 | | | 3.747 | |
| Unanchored | | 2 | | | 17,975,000 | | | 1.5 | | | 63.3 | | | 61.3 | | | 1.94 | | | 9.1 | | | 8.6 | | | 4.104 | |
| Shadow Anchored | | 1 | | | 4,500,000 | | | 0.4 | | | 60.0 | | | 60.0 | | | 3.04 | | | 11.7 | | | 11.0 | | | 3.565 | |
| Self Storage | | 30 | | | 166,688,047 | | | 13.9 | | | 59.8 | | | 59.0 | | | 2.54 | | | 9.2 | | | 9.1 | | | 3.536 | |
| Self Storage | | 30 | | | 166,688,047 | | | 13.9 | | | 59.8 | | | 59.0 | | | 2.54 | | | 9.2 | | | 9.1 | | | 3.536 | |
| Other | | 1 | | | 61,000,000 | | | 5.1 | | | 64.9 | | | 64.9 | | | 1.71 | | | 6.7 | | | 6.7 | | | 3.840 | |
| Leased Fee | | 1 | | | 61,000,000 | | | 5.1 | | | 64.9 | | | 64.9 | | | 1.71 | | | 6.7 | | | 6.7 | | | 3.840 | |
| Hospitality | | 5 | | | 48,526,207 | | | 4.0 | | | 65.1 | | | 51.4 | | | 2.38 | | | 14.8 | | | 13.2 | | | 3.750 | |
| Limited Service | | 4 | | | 35,565,549 | | | 3.0 | | | 65.8 | | | 52.0 | | | 2.21 | | | 14.0 | | | 12.4 | | | 3.824 | |
| Select Service | | 1 | | | 12,960,658 | | | 1.1 | | | 63.3 | | | 49.6 | | | 2.84 | | | 17.0 | | | 15.4 | | | 3.550 | |
| Mixed Use | | 3 | | | 42,012,225 | | | 3.5 | | | 54.0 | | | 54.0 | | | 2.32 | | | 8.6 | | | 8.1 | | | 3.468 | |
| Multifamily/Retail | | 1 | | | 21,274,725 | | | 1.8 | | | 48.4 | | | 48.4 | | | 2.40 | | | 8.1 | | | 7.8 | | | 3.210 | |
| Office/Retail | | 1 | | | 17,000,000 | | | 1.4 | | | 58.6 | | | 58.6 | | | 2.14 | | | 8.7 | | | 8.1 | | | 3.740 | |
| Industrial/Retail | | 1 | | | 3,737,500 | | | 0.3 | | | 64.4 | | | 64.4 | | | 2.68 | | | 11.2 | | | 10.0 | | | 3.700 | |
| Industrial | | 3 | | | 20,905,189 | | | 1.7 | | | 60.2 | | | 49.8 | | | 2.42 | | | 12.9 | | | 12.2 | | | 3.652 | |
| Flex | | 2 | | | 11,618,641 | | | 1.0 | | | 57.4 | | | 49.7 | | | 2.38 | | | 12.0 | | | 11.2 | | | 3.694 | |
| Warehouse | | 1 | | | 9,286,548 | | | 0.8 | | | 63.6 | | | 49.9 | | | 2.46 | | | 14.0 | | | 13.4 | | | 3.600 | |
| Total/Weighted Average: | | 131 | | | $1,202,148,724 | | | 100.0 | % | | 52.9 | % | | 51.5 | % | | 2.90 | x | | 11.5 | % | | 11.2 | % | | 3.483 | % |
| (1) | Because this table presents information relating to the mortgaged properties and not the mortgage loans, the information for mortgage loans secured by more than one mortgaged property is based on allocated loan amounts (allocating the principal balance of the mortgage loan to each of those properties according to the relative appraised values of the mortgaged properties or the allocated loan amounts or property-specific release prices set forth in the related mortgage loan documents or such other allocation as the related mortgage loan seller deemed appropriate). For mortgaged properties securing residential cooperative mortgage loans, the debt service coverage ratio and debt yield for each such mortgaged property is calculated using U/W Net Operating Income or U/W Net Cash Flow, as applicable, for the related residential cooperative property which is the projected net operating income or net cash flow, as applicable, reflected in the most recent appraisal obtained by or otherwise in the possession of the related mortgage loan seller as of the cut-off date and the loan-to-value ratio, is calculated based upon the appraised value of the residential cooperative property determined as if such residential cooperative property is operated as a residential cooperative, inclusive of the amount of the underlying debt encumbering such residential cooperative property. With respect to any mortgage loan that is part of a whole loan, the loan-to-value ratio, debt service coverage ratio and debt yield calculations include the relatedpari passu companion loan(s) but exclude any related subordinate companion loan(s) (unless otherwise stated). With respect to each mortgage loan, debt service coverage ratio, debt yield and loan-to-value ratio information do not take into account any subordinate debt (whether or not secured by the related mortgaged property) that currently exists or is allowed under the terms of such mortgage loan. See Annex A-1 to the Preliminary Prospectus. |
THE INFORMATION IN THIS STRUCTURAL AND COLLATERAL TERM SHEET IS NOT COMPLETE AND MAY BE AMENDED PRIOR TO THE TIME OF SALE. THIS TERM SHEET IS NOT AN OFFER TO SELL THESE SECURITIES AND IT IS NOT A SOLICITATION OF AN OFFER TO BUY THESE SECURITIES IN ANY JURISDICTION WHERE THE OFFER OR SALE IS NOT PERMITTED.
6
| Office – CBD | Loan #1 | Cut-off Date Balance: | | $115,000,000 |
| 250 Howard Street | Park Tower at Transbay | Cut-off Date LTV: | | 49.1% |
| San Francisco, CA 94105 | | UW NCF DSCR: | | 2.93x |
| | | UW NOI Debt Yield: | | 10.2% |
THE INFORMATION IN THIS STRUCTURAL AND COLLATERAL TERM SHEET IS NOT COMPLETE AND MAY BE AMENDED PRIOR TO THE TIME OF SALE. THIS TERM SHEET IS NOT AN OFFER TO SELL THESE SECURITIES AND IT IS NOT A SOLICITATION OF AN OFFER TO BUY THESE SECURITIES IN ANY JURISDICTION WHERE THE OFFER OR SALE IS NOT PERMITTED.
7
| No. 1 – Park Tower at Transbay |
| |
| Mortgage Loan Information | | Mortgaged Property Information |
| Mortgage Loan Seller: | Bank of America, National Association | | Single Asset/Portfolio: | Single Asset |
| Credit Assessment (DBRS/Fitch/S&P): | AAA/BBB-(sf)/NR | | Property Type – Subtype: | Office – CBD |
| Original Principal Balance(1): | $115,000,000 | | Location: | San Francisco, CA |
| Cut-off Date Balance(1): | $115,000,000 | | Size: | 764,659 SF |
| % of Initial Pool Balance: | 9.6% | | Cut-off Date Balance Per SF(1): | $719 |
| Loan Purpose: | Refinance | | Maturity Date/ARD Balance Per SF(1)(2): | $719 |
| Borrower Sponsor: | MetLife, Inc. | | Year Built/Renovated: | 2018-2019/NA |
| Guarantor: | Park Tower Owner LLC | | Title Vesting: | Fee |
| Mortgage Rate: | 3.4500% | | Property Manager: | MA West Management LLC (borrower-related) |
| Note Date: | July 23, 2019 | | Current Occupancy (As of)(4): | 98.9% (10/1/2019) |
| Seasoning: | 3 months | | YE 2018 Occupancy(5): | NAV |
| Anticipated Repayment Date(2): | August 1, 2029 | | YE 2017 Occupancy(5): | NAV |
| Maturity Date(2): | August 1, 2034 | | YE 2016 Occupancy(5): | NAV |
| IO Period: | 120 months | | YE 2015 Occupancy(5): | NAV |
| Loan Term (ARD)(2): | 120 months | | Appraised Value(6): | $1,120,000,000 |
| Amortization Term: | NAP | | Appraised Value Per SF(6): | $1,465 |
| Loan Amortization Type: | Interest-only, Balloon | | Appraisal Valuation Date(6): | October 1, 2019 |
| Call Protection: | L(23),YM(90),O(7) | | Underwriting and Financial Information |
| Lockbox Type: | Hard/Springing Cash Management | | TTM NOI(5): | NAV |
| Additional Debt(1): | Yes | | YE 2018 NOI(5): | NAV |
| Additional Debt Type (Balance)(1): | Pari Passu ($435,000,000) | | YE 2017 NOI(5): | NAV |
| | | | YE 2016 NOI(5): | NAV |
| | | | U/W Revenues: | $85,332,264 |
| | | | U/W Expenses: | $28,981,596 |
| Escrows and Reserves(3) | | U/W NOI: | $56,350,668 |
| | Initial | Monthly | Cap | | U/W NCF: | $56,277,672 |
| Taxes | $0 | Springing | N/A | | U/W DSCR based on NOI/NCF(1): | 2.93x / 2.93x |
| Insurance | $0 | Springing | N/A | | U/W Debt Yield based on NOI/NCF(1): | 10.2% / 10.2% |
| Deferred Maintenance | $4,412,926 | $0 | N/A | | U/W Debt Yield at Maturity/ARD based on NOI/NCF(1)(2): | 10.2% / 10.2% |
| TI/LC | $80,198,366 | $0 | N/A | | Cut-off Date LTV Ratio(1)(6): | 49.1% |
| Regulatory Fees Reserve | $5,528,653 | $0 | N/A | | LTV Ratio at Maturity/ARD(1)(2)(6): | 49.1% |
| | | | | | | | |
| Sources and Uses |
| Sources | | | | | Uses | | | |
| Whole Loan Amount(1) | $550,000,000 | | 100.0% | | Loan payoff | $294,460,472 | | 53.5 | % |
| | | | | | Upfront reserves(7) | 145,173,206 | | 26.4 | |
| | | | | | Return of equity | 108,543,869 | | 19.7 | |
| | | | | | Closing costs | 1,822,453 | | 0.3 | |
| Total Sources | $550,000,000 | | 100.0% | | Total Uses | $550,000,000 | | 100.0 | % |
| (1) | The Park Tower at Transbay Mortgage Loan (as defined below) is a part of the Park Tower at Transbay Whole Loan (as defined below) with an original aggregate principal balance of $550,000,000. The Cut-off Date Balance Per SF, Maturity Date/ARD Balance Per SF, U/W DSCR based on NOI/NCF, U/W Debt Yield based on NOI/NCF, U/W Debt Yield at Maturity/ARD based on NOI/NCF, Cut-off Date LTV Ratio and LTV Ratio at Maturity/ARD numbers presented above are based on the Park Tower at Transbay Whole Loan. |
| (2) | The Park Tower at Transbay Whole Loan is structured with a 120-month loan term until the Anticipated Repayment Date (“ARD”) of August 1, 2029 and will be interest-only prior to the ARD. From and after the ARD, the Park Tower at Transbay Whole Loan will accrue additional interest at a fixed rate of 2.5000% which will be deferred and due and payable on the Maturity Date of August 1, 2034 (or earlier repayment in full of the Park Tower at Transbay Whole Loan.) The ARD automatically triggers a Cash Sweep Period (see “Lockbox and Cash Management”) whereby all excess cash flow is required to be used to pay down the principal balance of the Park Tower at Transbay Whole Loan and repay the additional accrued interest. |
| (3) | See “Escrows” below for further discussion of reserve requirements. |
| (4) | The sole office tenant, Facebook, Inc. (98.9% of NRA), is currently in the process of building out its space and, according to the borrower sponsor, is in occupancy of floors 2012 (Phase I) and is expected to move into the remaining September 2020. |
| (5) | Prior historical operating statements and occupancy are not applicable, as the Park Tower at Transbay Property (as defined below) was constructed in 2018-2019. |
| (6) | The Appraised Value shown reflects a “Prospective Market Value At Stabilization” value as of October 1, 2019, which assumes that Facebook, Inc. has commenced rent payments (which began in August 2019) and that all remaining construction project costs due by September 30, 2019 have been incurred (110% of the cost of which has been reserved by the lender). The “as-is” value as of May 30, 2019 of $959,000,000 results in both a Cut-off Date LTV Ratio and LTV Ratio at Maturity/ARD of 57.4% for the Park Tower at Transbay Whole Loan. The appraiser also provided an “as dark” value as of May 30, 2019 of $1,004,000,000, which results in both a Cut-off Date LTV Ratio and LTV Ratio at Maturity/ARD of 54.8% for the Park Tower at Transbay Whole Loan. The “as dark” value is greater than the “as-is” value due to the market rent being higher than the current contract rent at the Park Tower at Transbay Property. |
| (7) | Reserves include $55,033,261 paid by the Park Tower at Transbay Borrower (as defined below) at loan origination, which amount was subsequently disbursed to Facebook, Inc. by the escrow agent to buy out Facebook Inc.’s rent abatement period. |
THE INFORMATION IN THIS STRUCTURAL AND COLLATERAL TERM SHEET IS NOT COMPLETE AND MAY BE AMENDED PRIOR TO THE TIME OF SALE. THIS TERM SHEET IS NOT AN OFFER TO SELL THESE SECURITIES AND IT IS NOT A SOLICITATION OF AN OFFER TO BUY THESE SECURITIES IN ANY JURISDICTION WHERE THE OFFER OR SALE IS NOT PERMITTED.
8
| Office – CBD | Loan #1 | Cut-off Date Balance: | | $115,000,000 |
| 250 Howard Street | Park Tower at Transbay | Cut-off Date LTV: | | 49.1% |
| San Francisco, CA 94105 | | UW NCF DSCR: | | 2.93x |
| | | UW NOI Debt Yield: | | 10.2% |
The Mortgage Loan. The largest largest mortgage loan (the “Park Tower at Transbay Mortgage Loan”) is a part of a whole loan (the “Park Tower at Transbay Whole Loan”) evidenced by ten pari passu promissory notes in the aggregate original principal amount of $550,000,000. The Park Tower at Transbay Whole Loan is secured by a first priority fee mortgage on a 764,659 SF newly constructed, Class A office tower located in San Francisco, California (the “Park Tower at Transbay Property”).
The Park Tower at Transbay Mortgage Loan is evidenced by the non-controlling promissory Notes A-4, A-7 and A-10 in the original aggregate principal amount of $115,000,000. The controlling promissory Note A-3 and the non-controlling promissory Notes A-1, A-2, A-5, A-6, A-8 and A-9 are in the aggregate original principal amount of $435,000,000. Notes A-1 and A-8 have been contributed to the BANK 2019-BNK20 securitization trust. Notes A-3 and A-9 are expected to be contributed to the BANK 2019-BNK21 securitization trust. Notes A-2, A-5 and A-6 are currently held by Bank of America, N.A. and are expected to be contributed to future securitization trusts or may be otherwise transferred at any time. The Park Tower at Transbay Whole Loan will be serviced pursuant to the pooling and servicing agreement for the BANK 2019-BNK21 securitization trust. See “Description of the Mortgage Pool—The Whole Loans—The Non-Serviced Pari Passu Whole Loans” and “Pooling and Servicing Agreement” in the Preliminary Prospectus.
Note Summary
| Notes | Original Principal Balance | Cut-off Date Balance | Note Holder | Controlling Interest |
| A-1 | $100,000,000 | $100,000,000 | BANK 2019-BNK20 | No |
| A-2 | $100,000,000 | $100,000,000 | Bank of America, N.A. | No |
| A-3 | $100,000,000 | $100,000,000 | BANK 2019-BNK21 | Yes |
| A-4 | $80,000,000 | $80,000,000 | BANK 2019-BNK22 | No |
| A-5 | $50,000,000 | $50,000,000 | Bank of America, N.A. | No |
| A-6 | $50,000,000 | $50,000,000 | Bank of America, N.A. | No |
| A-7 | $25,000,000 | $25,000,000 | BANK 2019-BNK22 | No |
| A-8 | $20,000,000 | $20,000,000 | BANK 2019-BNK20 | No |
| A-9 | $15,000,000 | $15,000,000 | BANK 2019-BNK21 | No |
| A-10 | $10,000,000 | $10,000,000 | BANK 2019-BNK22 | No |
| Total | $550,000,000 | $550,000,000 | | |
The Borrower and the Borrower Sponsor.The borrower is Park Tower Owner LLC, a Delaware limited liability company, structured to be bankruptcy-remote with at least two independent directors (the “Park Tower at Transbay Borrower”).
The borrower sponsor is MetLife, Inc. (NYSE: MET), a Fortune 500 financial services company, providing insurance, annuities, employee benefits and asset management. The borrower sponsor was the original developer of the Park Tower at Transbay Property. There is no non-recourse carveout guarantor and no separate environmental indemnitor for the Park Tower at Transbay Whole Loan.
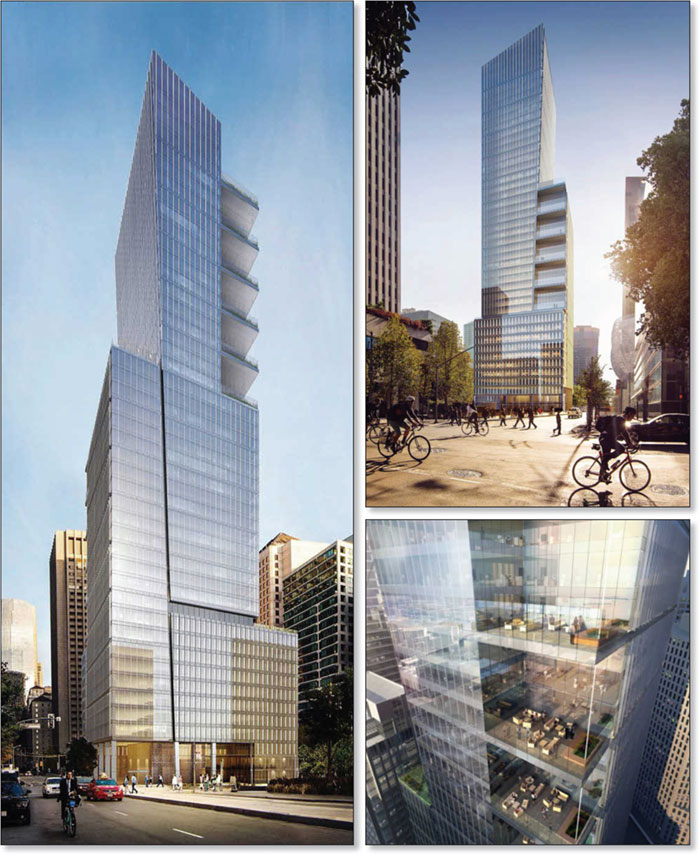
The Property. The Park Tower at Transbay Property is comprised of a newly constructed, Class A, pre-certified LEED Gold, 43-story high-rise office building located on the northeast corner of Beale Street and Howard Street in the Transbay Transit District in the South Financial District of downtown San Francisco, California. The Park Tower at Transbay Property contains a total of 764,659 SF. All of the office space (755,914 SF) and the two-level subterranean parking are leased to Facebook, Inc. (“Facebook”). Facebook’s space includes a mix of open and private offices, various common areas, a cafeteria, fitness/wellness center and a child care center. There is 50,000 SF of outdoor space including fourteen sky decks: large rooftop terraces on floors 12 and 28, and outside terraces on every third floor starting on floor 13 and ending on the top floor, 43. 70% of the floors have San Francisco Bay views.
The Property. The Park Tower at Transbay Property is comprised of a newly constructed, Class A, pre-certified LEED Gold, 43-story high-rise office building located on the northeast corner of Beale Street and Howard Street in the Transbay Transit District in the South Financial District of downtown San Francisco, California. The Park Tower at Transbay Property contains a total of 764,659 SF. All of the office space (755,914 SF) and the two-level subterranean parking are leased to Facebook, Inc. (“Facebook”). Facebook’s space includes a mix of open and private offices, various common areas, a cafeteria, fitness/wellness center and a child care center. There is 50,000 SF of outdoor space including fourteen sky decks: large rooftop terraces on floors 12 and 28, and outside terraces on every third floor starting on floor 13 and ending on the top floor, 43. 70% of the floors have San Francisco Bay views.
The remaining rentable area is comprised of three retail spaces (8,745 SF) on the ground floor. One of the retail spaces was leased to Blue Bottle after loan origination and the other spaces are presently in lease negotiations with prospective tenants, according to the borrower sponsor. Building amenities include bike parking, an open plaza on the ground level, and two non-collateral adjacent public park spaces which are required to be maintained by the Park Tower at Transbay borrower sponsor.
The Park Tower at Transbay Property is located adjacent to the recently completed multi-billion-dollar Salesforce (f/k/a Transbay) Transit Center and City Park, providing immediate proximity to all forms of public transportation. The Park Tower at Transbay Property is within walking distance to the Ferry Building, waterfront AT&T Park, Moscone Center, Westfield Shopping Centre, SF MoMA, Union Square and South Park.
Major Tenant.Facebook leases all of the office space (755,914 SF) on a long term, triple-net lease which commenced on March 1, 2019. Facebook’s lease is divided into three phases: Phase I includes floors 2-12, Phase II includes floors 13-25 and Phase III includes floors 26-43. The initial rent for Phase I, Phase II and Phase III is $60.00 PSF, $66.00 PSF and $72.00 PSF, respectively, resulting in a current weighted average rent of $65.82 PSF. The Facebook office lease requires annual rental increases of 3.0%. Facebook also
THE INFORMATION IN THIS STRUCTURAL AND COLLATERAL TERM SHEET IS NOT COMPLETE AND MAY BE AMENDED PRIOR TO THE TIME OF SALE. THIS TERM SHEET IS NOT AN OFFER TO SELL THESE SECURITIES AND IT IS NOT A SOLICITATION OF AN OFFER TO BUY THESE SECURITIES IN ANY JURISDICTION WHERE THE OFFER OR SALE IS NOT PERMITTED.
9
| Office – CBD | Loan #1 | Cut-off Date Balance: | | $115,000,000 |
| 250 Howard Street | Park Tower at Transbay | Cut-off Date LTV: | | 49.1% |
| San Francisco, CA 94105 | | UW NCF DSCR: | | 2.93x |
| | | UW NOI Debt Yield: | | 10.2% |
leases the subterranean parking (110 spaces with capacity for 140 spaces with valet operations) based on an annual rent of $594,000 ($450/space per month), with increases to market rent every five years.
Facebook is currently in the process of building out its space and, according to the borrower sponsor, is in occupancy of Phase I and is expected to move into its remaining space by September 2019 and September 2020. The Park Tower at Transbay Borrower provided Facebook with a tenant improvement allowance of $110 PSF (of which $80,198,366 ($106 PSF) was outstanding as of the loan origination date and has been fully reserved by the lender) and estimates that Facebook will be spending an additional $300-$350 PSF on its build-out. Pursuant to its lease, Facebook was entitled to rent abatements, which have been bought out by the Park Tower at Transbay Borrower as of July 25, 2019. Facebook is now paying full unabated rent.
Facebook’s lease expiration for Phase I is February 28, 2033 and for Phases II and III are February 28, 2034. Each phase has two eight-year renewal options at fair market rent. In order to exercise the renewal option for Phase II, Facebook must exercise its option for Phase I. In order to exercise the renewal option for Phase III, Facebook must exercise both options for Phase I and II.
Facebook has a right of first offer to purchase the Park Tower at Transbay Property, as discussed in “Right of First Offer” below.
Facebook (NYSE: FB) provides various products to connect and share “online”. The company’s products include Facebook, which enables people to connect, share and discover through mobile devices and personal computers; Instagram, a community for sharing photos, videos, and messages; and Messenger and WhatsApp, both messaging applications. Facebook also provides Oculus, a hardware, software and developer platform, which allows people to connect through its virtual reality products. As of December 31, 2018, Facebook had approximately 1.52 billion daily active users. The company was founded in 2004 and is headquartered in Menlo Park, California. Facebook also has large block leases at 181 Fremont and 215 Fremont, in downtown San Francisco, both within one block of the Park Tower at Transbay Property. For the fiscal year ending December 31, 2018, Facebook reported total revenue of $55.8 billion, up from $40.7 billion in the prior year and $27.6 billion in 2016. Facebook has a current market capitalization of $478 billion.
The following table presents certain information relating to the tenant at the Park Tower at Transbay Property:
Major Tenant
| Tenant Name | Credit Rating
(Fitch/Moody’s/
S&P)(1) | Tenant NRSF | % of
NRSF | Annual U/W Base Rent PSF | Annual
U/W Base Rent | % of Total Annual U/W Base Rent | Lease
Expiration
Date | Extension Options | Termination Option (Y/N) |
| Major Tenant | | | | | | | | |
| Facebook, Inc. – Phase I(1) | NR/NR/NR | 269,814 | 35.3% | $60.00 | $16,188,822 | 32.5% | 2/28/2033 | 2, 8-year | N |
| Facebook, Inc. – Phase II(1) | NR/NR/NR | 238,962 | 31.3% | $66.00 | $15,771,464 | 31.7% | 2/28/2034 | 2, 8-year | N |
| Facebook, Inc. – Phase III(1) | NR/NR/NR | 247,138 | 32.3% | $72.00 | $17,793,967 | 35.8% | 2/28/2034 | 2, 8-year | N |
| Office Totall/Wtd. Avg. | 755,914 | 98.9% | $65.82 | $49,754,253 | 100.0% | | | |
| | | | | | | | | | |
| Vacant Space (Retail) | 8,745 | 1.1% | | | | | | |
| | | | | | | | | |
| Collateral Total | 764,659 | 100.0% | | | | | | |
| | | | | | | | | | |
| (1) | Facebook is currently in the process of building out its space and expected to move Phase II and Phase III by September 2020. |
THE INFORMATION IN THIS STRUCTURAL AND COLLATERAL TERM SHEET IS NOT COMPLETE AND MAY BE AMENDED PRIOR TO THE TIME OF SALE. THIS TERM SHEET IS NOT AN OFFER TO SELL THESE SECURITIES AND IT IS NOT A SOLICITATION OF AN OFFER TO BUY THESE SECURITIES IN ANY JURISDICTION WHERE THE OFFER OR SALE IS NOT PERMITTED.
10
| Office – CBD | Loan #1 | Cut-off Date Balance: | | $115,000,000 |
| 250 Howard Street | Park Tower at Transbay | Cut-off Date LTV: | | 49.1% |
| San Francisco, CA 94105 | | UW NCF DSCR: | | 2.93x |
| | | UW NOI Debt Yield: | | 10.2% |
The following table presents certain information relating to the lease rollover schedule at the Park Tower at Transbay Property:
Lease Expiration Schedule
Year Ending
December 31, | No. of
Leases
Expiring | Expiring
NRSF | % of
Total
NRSF | Cumulative
Expiring NRSF | Cumulative
% of Total
NRSF | Annual
U/W
Base Rent | % of Total
Annual
U/W Base
Rent | Annual
U/W
Base Rent
PSF |
| 2019 | 0 | 0 | 0.0% | 0 | 0.0% | $0 | 0.0% | $0.00 |
| 2020 | 0 | 0 | 0.0% | 0 | 0.0% | $0 | 0.0% | $0.00 |
| 2021 | 0 | 0 | 0.0% | 0 | 0.0% | $0 | 0.0% | $0.00 |
| 2022 | 0 | 0 | 0.0% | 0 | 0.0% | $0 | 0.0% | $0.00 |
| 2023 | 0 | 0 | 0.0% | 0 | 0.0% | $0 | 0.0% | $0.00 |
| 2024 | 0 | 0 | 0.0% | 0 | 0.0% | $0 | 0.0% | $0.00 |
| 2025 | 0 | 0 | 0.0% | 0 | 0.0% | $0 | 0.0% | $0.00 |
| 2026 | 0 | 0 | 0.0% | 0 | 0.0% | $0 | 0.0% | $0.00 |
| 2027 | 0 | 0 | 0.0% | 0 | 0.0% | $0 | 0.0% | $0.00 |
| 2028 | 0 | 0 | 0.0% | 0 | 0.0% | $0 | 0.0% | $0.00 |
| 2029 | 0 | 0 | 0.0% | 0 | 0.0% | $0 | 0.0% | $0.00 |
| Thereafter | 1 | 755,914 | 98.9% | 755,914 | 98.9% | $49,754,253 | 100.0% | $65.82 |
| Vacant | 0 | 8,745 | 1.1% | 764,659 | 100.0% | $0 | 0.0% | $0.00 |
| Total/Weighted Average | 1 | 764,659 | 100.0% | | | $49,754,253 | 100.0% | $65.82(1) |
| (1) | Wtd. Avg. UW Rent PSF Rolling excludes vacant space. |
The following table presents historical occupancy percentages at the Park Tower at Transbay Property:
Historical Occupancy(1)
2015 | 2016 | 2017 | 2018 | 10/1/2019(1) |
| NAV | NAV | NAV | NAV | 98.9% |
| (1) | Prior occupancy is not applicable, as the Park Tower at Transbay Property was constructed in 2018-2019. |
THE INFORMATION IN THIS STRUCTURAL AND COLLATERAL TERM SHEET IS NOT COMPLETE AND MAY BE AMENDED PRIOR TO THE TIME OF SALE. THIS TERM SHEET IS NOT AN OFFER TO SELL THESE SECURITIES AND IT IS NOT A SOLICITATION OF AN OFFER TO BUY THESE SECURITIES IN ANY JURISDICTION WHERE THE OFFER OR SALE IS NOT PERMITTED.
11
| Office – CBD | Loan #1 | Cut-off Date Balance: | | $115,000,000 |
| 250 Howard Street | Park Tower at Transbay | Cut-off Date LTV: | | 49.1% |
| San Francisco, CA 94105 | | UW NCF DSCR: | | 2.93x |
| | | UW NOI Debt Yield: | | 10.2% |
Underwritten Net Cash Flow. The following table presents certain information relating to the underwritten net cash flow at the Park Tower at Transbay Property:
Cash Flow Analysis(1)
| | U/W | %(2) | U/W $ per SF |
| Base Rent(3) | $50,322,681 | 57.0% | $65.81 |
| Straight Line Rent | $7,996,394 | 9.1% | $10.46 |
| Gross Potential Rent | $58,319,075 | 66.1% | $76.27 |
| Reimbursements | $29,328,101 | 33.2% | $38.35 |
| Parking Income | $594,000 | 0.7% | $0.78 |
| Net Rental Income | $88,241,176 | 100.0% | $115.40 |
| Vacancy(4) | ($2,908,912) | (5.0%) | ($3.80) |
| Effective Gross Income | $85,332,264 | 96.7% | $111.60 |
| | | | |
| Real Estate Taxes | $16,161,609 | 18.9% | $21.14 |
| Insurance | $1,561,863 | 1.8% | $2.04 |
| Other Operating Expenses | $11,258,124 | 13.2% | $14.72 |
| Total Operating Expenses | $28,981,596 | 34.0% | $37.90 |
| | | | |
| Net Operating Income | $56,350,668 | 66.0% | $73.69 |
| TI/LC | $0 | 0.0% | $0.00 |
| Capital Expenditures | $72,995 | 0.1% | $0.10 |
| Net Cash Flow | $56,277,673 | 66.0% | $73.60 |
| | | | |
| NOI DSCR(5) | 2.93x | | |
| NCF DSCR(5) | 2.93x | | |
| NOI Debt Yield(5) | 10.2% | | |
| NCF Debt Yield(5) | 10.2% | | |
| (1) | Prior historical operating statements are not applicable, as the Park Tower at Transbay Property was constructed in 2018-2019. |
| (2) | Represents (i) percent of Net Rental Income for all revenue fields, (ii) percent of Gross Potential Rent for Vacancy, and (iii) percent of Effective Gross Income for all other fields. |
| (3) | UW Base Rent includes the ground floor retail space (8,745 SF) grossed up to an estimated NNN rent of $65.00 PSF. |
| (4) | The Park Tower at Transbay Property is 98.9% leased to Facebook. UW Vacancy is 2.5% for the office floors and 100.0% for the retail space. |
| (5) | The debt service coverage ratios and debt yields shown are based on the Park Tower at Transbay Whole Loan. |
Appraisal.The appraiser concluded to a “Prospective Market Value At Stabilization” value as of October 1, 2019, which assumes that Facebook, Inc. has commenced rent payments (which began in August 2019) and that all remaining construction project costs due by September 30, 2019 have been incurred (110% of the cost of which has been reserved by the lender). The appraiser concluded to an “as-is” value as of May 30, 2019 of $959,000,000 and also provided an “as dark” value as of May 30, 2019 of $1,004,000,000. The “as dark” value is greater than the “as-is” value due to the market rent being higher than the current contract rent at the Park Tower at Transbay Property.
Environmental Matters.According to the Phase I environmental site assessment dated June 10, 2019, no action was recommended other than to obtain documentation summarizing the implementation of the site management plan and to work toward regulatory closure due to identified contaminated soil from former industrial and gas station activities. The Phase I assessment expects that as a part of the construction of the Park Tower at Transbay Property, a large majority of any contaminated soil was removed to accommodate for the two-level basement and that the building site being covered with hard surfaces provides an engineering barrier.
Market Overview.The Park Tower at Transbay Property is located in the South Financial District of San Francisco, California, just north of the Rincon Hill/South Beach/SOMA District, which has seen a resurgence in leasing activity particularly with respect to the technology sector, and east of the Yerba Buena District, home to several major redevelopment projects including the Yerba Buena complex, Moscone convention center and Westfield Shopping Center.
A significant development in the San Francisco central business district is the redevelopment of the approximately 40-acre area surrounding the Transbay Terminal, the primary transit hub in the downtown area. Redevelopment plans include replacing the outdated Transbay Terminal (which was completed in August 2018), extending Caltrain 1.3 miles (which construction began in 2012) and developing the surrounding neighborhood by widening Folsom Street and promoting sidewalk cafes and markets, and developing approximately 2,600 new homes, 3 million SF of office and commercial space, and 100,000 SF of retail space. Recent developments of the office space include the 61-story Salesforce Tower.
THE INFORMATION IN THIS STRUCTURAL AND COLLATERAL TERM SHEET IS NOT COMPLETE AND MAY BE AMENDED PRIOR TO THE TIME OF SALE. THIS TERM SHEET IS NOT AN OFFER TO SELL THESE SECURITIES AND IT IS NOT A SOLICITATION OF AN OFFER TO BUY THESE SECURITIES IN ANY JURISDICTION WHERE THE OFFER OR SALE IS NOT PERMITTED.
12
| Office – CBD | Loan #1 | Cut-off Date Balance: | | $115,000,000 |
| 250 Howard Street | Park Tower at Transbay | Cut-off Date LTV: | | 49.1% |
| San Francisco, CA 94105 | | UW NCF DSCR: | | 2.93x |
| | | UW NOI Debt Yield: | | 10.2% |
Salesforce has also leased approximately 325,000 SF at Transbay Parcel F (550 Howard) and approximately 335,000 SF at 350 Mission. Other technology firms leasing large blocks of space in the area include Facebook at 181 Fremont (432,000 SF) and at 215 Fremont (300,000 SF), Adobe at 100 Hooper (280,000 SF), Stripe at 510 Townsend (269,063 SF), Blend Labs at 500 Pine Street (72,000 SF), Twitch at 350 Bush Street (185,000 SF), LinkedIn at 222 Second Street (430,650 SF) and Pinterest at 88 Bluxome Street (490,000 SF). As of the first quarter of 2019, large block demand greater than 50,000 SF has climbed 41% year over year, outpacing supply. According to the appraisal, there are currently 20 tenant requirements of 100,000 SF or more but only five contiguous space options that can offer occupancy through 2023.
According to a third party market report, the Park Tower at Transbay Property is located in the South Financial District office submarket of the San Francisco office market. For the first quarter of 2019, the submarket had total inventory of approximately 28.2 million SF with a vacancy rate of 6.7% and average asking rents of $83.02 PSF.
According to the appraisal, the estimated 2019 population within a one-half-, one- and three-mile radius of the Park Tower at Transbay Property was 16,122, 59,433 and 378,299, respectively. The 2019 median household income within the same radii was $204,917, $105,624 and $113,407, respectively.
The following table presents certain information relating to the appraiser’s market rent conclusion for the Park Tower at Transbay Property:
Market Rent Summary
| | Office – Low | Office – Mid | Office – High | Retail |
| Market Rent (PSF) | $75.00 | $80.00 | $85.00 | $65.00 |
| Lease Term (Years) | 12 | 12 | 12 | 10 |
| Rent Increase Projection | 3.0%per annum | 3.0%per annum | 3.0%per annum | 3.0%per annum |
The following table presents certain information from the appraisal relating to comparable properties to the Park Tower at Transbay Property:
Comparable Properties
| Property Name | Year
Built/
Renovated | Distance from Subject (miles) | Property Size (SF) | Tenant | Lease Area (SF) | Lease Date | Initial Rent PSF NNN | Lease Term (Yrs.) | TI PSF |
| Park Tower at Transbay(1) | 2018-2019 | N/A | 764,659 | Facebook | 755,914 | Mar-19 | $65.82 | 15 | $110 |
| Parcel F 546-550 Howard Street | 2023 (projected) | 0.2 | 1,100,000 | Salesforce | 325,000 | 4Q18 | $80.00 | 15 | $100 |
| 88 Bluxome Street | TBD | 1.4 | 1,000,000 | Pinterest | 490,000 | 1Q19 | $78.00 | 10-15 | N/A |
| 181 Fremont Street | 2018 | 0.1 | 432,000 | Facebook | 432,000 | Sep-17 | $65.00 | 10 | $100 |
| 45 Fremont | 1978 | 0.3 | 602,780 | Slack Technologies | 208,459 | Aug-19 | $69.00 | 11.3 | $100-$130 |
| One Tehama | 1929 | 0.2 | 98,566 | Social Finance | 98,566 | Sep-18 | $70.00 | 11 | $105 |
| (1) | Information obtained from the underwritten rent roll and Facebook lease. |
Escrows.
Taxes and Insurance Reserves -So long as (x) no Cash Sweep Period (as defined below) exists and (y) the Park Tower at Transbay Borrower provides evidence to the lender that all property taxes and insurance premiums have been paid in full, monthly escrows for taxes and insurance will be waived.
Deferred Maintenance -The Park Tower at Transbay Borrower deposited at loan origination $4,412,926, which is equal to 110% of the estimated cost for the completion of the outstanding project costs for the construction of the Park Tower at Transbay Property.
TI/LC Reserve -The Park Tower at Transbay Borrower deposited at loan origination $80,198,366 for outstanding tenant improvement allowances owed to Facebook.
Regulatory Fees Reserve -The Park Tower at Transbay Borrower deposited at loan origination $5,528,653 which is equal to 100% of the estimated cost for the regulatory fees in connection with the development of the Park Tower at Transbay Property as required pursuant to an owner participation/disposition and development agreement between the Successor Agency to the Redevelopment Agency of the City of San Francisco and the Park Tower at Transbay Borrower and as required for Municipal Transportation Agency additional street use fees.
THE INFORMATION IN THIS STRUCTURAL AND COLLATERAL TERM SHEET IS NOT COMPLETE AND MAY BE AMENDED PRIOR TO THE TIME OF SALE. THIS TERM SHEET IS NOT AN OFFER TO SELL THESE SECURITIES AND IT IS NOT A SOLICITATION OF AN OFFER TO BUY THESE SECURITIES IN ANY JURISDICTION WHERE THE OFFER OR SALE IS NOT PERMITTED.
13
| Office – CBD | Loan #1 | Cut-off Date Balance: | | $115,000,000 |
| 250 Howard Street | Park Tower at Transbay | Cut-off Date LTV: | | 49.1% |
| San Francisco, CA 94105 | | UW NCF DSCR: | | 2.93x |
| | | UW NOI Debt Yield: | | 10.2% |
Lockbox and Cash Management. The Park Tower at Transbay Whole Loan documents require a hard lockbox with springing cash management upon the occurrence of a Cash Sweep Period. During the continuance of a Cash Sweep Period, all funds in the lockbox account are required to be swept each business day to a lender-controlled cash management account and disbursed in accordance with the Park Tower at Transbay Whole Loan documents. Additionally, during a Cash Sweep Period, all excess cash flow is required to be held as additional security for the Park Tower at Transbay Whole Loan until the discontinuance of the Cash Sweep Period.
A “Cash Sweep Period” will commence upon:
| (i) | an event of default under the Park Tower at Transbay Whole Loan documents beyond notice and cure periods (a “Default Trigger”), |
| (ii) | the Park Tower at Transbay Borrower seeking bankruptcy protection (a “Borrower Bankruptcy Trigger”), |
| (iii) | Facebook seeking bankruptcy protection (a “Facebook Bankruptcy Trigger”), |
| (iv) | Facebook (A) being in monetary or material non-monetary default beyond notice and cure periods or (B) terminating or giving notice to terminate its lease (each, a “Tenant Trigger”), |
| (v) | the Park Tower at Transbay Borrower failing to repay the Park Tower at Transbay Whole Loan in full on or before the ARD (an “ARD Trigger”), |
| (vi) | if a Facebook Bankruptcy Trigger or a Tenant Trigger previously occurred and was cured pursuant to clause (c) below and thereafter, the debt yield being less than 7.000% (not including any straight line rent) for two consecutive calendar quarters (a “Debt Yield Trigger”), or |
| (vii) | any replacement tenant (should the Facebook lease be terminated) subsequently going dark in more than 50% the office SF at the Park Tower at Transbay Property (a “Replacement Tenant Trigger”), unless the replacement tenant has a credit rating of at least “BBB-” by S&P or Fitch or “Baa3” by Moody’s. |
A Cash Sweep Period will end upon (provided no other Cash Sweep Period is continuing):
| (a) | if triggered by a Default Trigger, the cure of the event of default under the Park Tower at Transbay Whole Loan documents, |
| (b) | if triggered by a Facebook Bankruptcy Trigger, the replacement or assumption of the Facebook lease by the bankruptcy court and the dismissal of such bankruptcy proceedings, |
| (c) | if triggered by a Tenant Trigger or a Debt Yield Trigger, the debt yield being equal to or greater than 7.00% (not including any straight line rent) for the trailing two calendar quarters, and |
| (d) | if triggered by a Replacement Tenant Trigger (x) delivery of a replacement lease(s) for at least 50% of the office SF at the Park Tower at Transbay Property, or (y) the dark replacement tenant conducting business in at least 50% of the office SF at the Park Tower at Transbay Property. |
A Cash Sweep Period triggered by a Borrower Bankruptcy Trigger or an ARD Trigger may not be cured and will continue until the full repayment of the Park Tower at Transbay Whole Loan. All excess cash collected after an ARD Trigger will be applied to the reduction of principal, then to pay off additional accrued interest.
Release of Property. Not permitted.
Right of First Offer.Facebook has a right of first offer to purchase the Park Tower at Transbay Property at the same terms as any purchase offer received by the Park Tower at Transbay Borrower. If Facebook fails to exercise its right of first offer, the Park Tower at Transbay Borrower will be free to sell the Park Tower at Transbay Property to another party other than a Facebook competitor, namely Alphabet Inc., Amazon.com, Inc., Apple Inc., Microsoft Corporation, salesforce.com, inc., Snap Inc. and Samsung Electronics, which list of competitors is subject to change by Facebook in accordance with its lease.
Letter of Credit.None.
Terrorism Insurance.The Park Tower at Transbay Borrower is required to obtain and maintain property insurance that covers perils of terrorism and acts of terrorism in an amount equal to the full replacement cost of the Park Tower at Transbay Property and business interruption insurance for 36 months with a twelve month extended period of indemnity, provided, if the Terrorism Risk Insurance Act of 2002, as extended and modified by the Terrorism Risk Insurance Program Reauthorization Act of 2015 (as the same may be further modified, amended, or extended) is not in effect, the Park Tower at Transbay Borrower will not be required to pay annual premiums in excess of two times the premium then payable for the property and business interruption/loss of rents insurance in order to obtain the terrorism coverage. See “Risk Factors—Risks Relating to the Mortgage Loans—Terrorism Insurance May Not Be Available for All Mortgaged Properties” in the Preliminary Prospectus.
Earthquake Insurance.The Park Tower at Transbay Whole Loan documents do not require earthquake insurance; the seismic report indicated a probable maximum loss of 12.0% for the Park Tower at Transbay Property.
THE INFORMATION IN THIS STRUCTURAL AND COLLATERAL TERM SHEET IS NOT COMPLETE AND MAY BE AMENDED PRIOR TO THE TIME OF SALE. THIS TERM SHEET IS NOT AN OFFER TO SELL THESE SECURITIES AND IT IS NOT A SOLICITATION OF AN OFFER TO BUY THESE SECURITIES IN ANY JURISDICTION WHERE THE OFFER OR SALE IS NOT PERMITTED.
14
| Office – CBD | Loan #2 | Cut-off Date Balance: | | $110,000,000 |
| 230 Park Avenue South | 230 Park Avenue South | Cut-off Date LTV: | | 51.0% |
| New York, NY 10003 | | U/W NCF DSCR: | | 2.64x |
| | | U/W NOI Debt Yield: | | 8.9% |

THE INFORMATION IN THIS STRUCTURAL AND COLLATERAL TERM SHEET IS NOT COMPLETE AND MAY BE AMENDED PRIOR TO THE TIME OF SALE. THIS TERM SHEET IS NOT AN OFFER TO SELL THESE SECURITIES AND IT IS NOT A SOLICITATION OF AN OFFER TO BUY THESE SECURITIES IN ANY JURISDICTION WHERE THE OFFER OR SALE IS NOT PERMITTED.
15
| No. 2 – 230 Park Avenue South |
| |
| Mortgage Loan Information | | Mortgaged Property Information |
| Mortgage Loan Sellers: | Wells Fargo Bank, National Association;
Bank of America, National Association | | Single Asset/Portfolio: | Single Asset |
| Credit Assessment (DBRS/Fitch/S&P): | BBB(low)/NR/NR | | Property Type – Subtype: | Office – CBD |
| Original Principal Balance(1): | $110,000,000 | | Location: | New York, NY |
| Cut-off Date Balance(1): | $110,000,000 | | Size: | 373,693 SF |
| % of Initial Pool Balance: | 9.2% | | Cut-off Date Balance Per SF(1): | $669.00 |
| Loan Purpose: | Refinance | | Maturity Date Balance Per SF(1): | $669.00 |
| Borrower Sponsor: | TF Cornerstone Properties, LLC | | Year Built/Renovated: | 1895/2019 |
| Guarantor: | TF Cornerstone Properties, LLC | | Title Vesting: | Fee |
| Mortgage Rate: | 3.2700% | | Property Manager: | TF Cornerstone, Inc. (borrower-related) |
| Note Date: | September 11, 2019 | | Current Occupancy (As of): | 100.0% (9/1/2019) |
| Seasoning: | 2 months | | YE 2018 Occupancy: | 100.0% |
| Maturity Date: | September 11, 2029 | | YE 2017 Occupancy: | 100.0% |
| IO Period: | 120 months | | YE 2016 Occupancy: | 100.0% |
| Loan Term (Original): | 120 months | | YE 2015 Occupancy: | 100.0% |
| Amortization Term (Original): | NAP | | Appraised Value(4): | $490,000,000 |
| Loan Amortization Type: | Interest-only, Balloon | | Appraised Value Per SF(4): | $1,311.24 |
| Call Protection(2): | L(26),GRTR 1% or YM or D(87),O(7) | | Appraisal Valuation Date(4): | July 24, 2019 |
| Lockbox Type: | Hard/Springing Cash Management | | Underwriting and Financial Information |
| Additional Debt(1): | Yes | | TTM NOI(5): | NAV |
| Additional Debt Type (Balance)(1): | Pari Passu($140,000,000) | | YE 2018 NOI(5): | NAV |
| | | | YE 2017 NOI(5): | NAV |
| | | | YE 2016 NOI(5): | NAV |
| | | | U/W Revenues: | $33,596,638 |
| | | | U/W Expenses: | $11,449,082 |
| Escrows and Reserves(3) | | U/W NOI: | $22,147,556 |
| | Initial | Monthly | Cap | | U/W NCF: | $21,961,566 |
| Taxes | $0 | Springing | NAP | | U/W DSCR based on NOI/NCF(1): | 2.66x / 2.64x |
| Insurance | $0 | Springing | NAP | | U/W Debt Yield based on NOI/NCF(1): | 8.9% / 8.8% |
| Rent Concession Reserve | $24,763,070 | $0 | NAP | | U/W Debt Yield at Maturity based on NOI/NCF(1): | 8.9% / 8.8% |
| Existing Landlord Obligations Reserve | (3) | $0 | NAP | | Cut-off Date LTV Ratio(1)(4): | 51.0% |
| | | | | | LTV Ratio at Maturity(1)(4): | 51.0% |
| | | | | | | |
| | | | | | | | |
| Sources and Uses |
| Sources | | | | | Uses | | | |
| Original whole loan amount(1) | $250,000,000 | | 100.0% | | Loan payoff | $146,203,186 | | 58.5 | % |
| | | | | | Upfront reserves | 59,026,648 | | 23.6 | |
| | | | | | Closing costs | 14,429,847 | | 5.8 | |
| | | | | | Return of equity | 30,340,319 | | 12.1 | |
| Total Sources | $250,000,000 | | 100.0% | | Total Uses | $250,000,000 | | 100.0 | % |
| (1) | The Cut-off Date Balance Per SF, Maturity Date Balance Per SF, U/W DSCR based on NOI/NCF, U/W Debt Yield based on NOI/NCF, U/W Debt Yield at Maturity based on NOI/NCF, Cut-off Date LTV Ratio and LTV Ratio at Maturity numbers presented above are based on the 230 Park Avenue South Whole Loan (as defined below). |
| (2) | Defeasance or prepayment of the 230 Park Avenue South Whole Loan is permitted at any time after the earlier to occur of (a) the end of the two-year period commencing on the closing date of the securitization of the last promissory note representing a portion of the 230 Park Avenue South Whole Loan to be securitized and (b) September 11, 2022 (“Defeasance Lockout Date”). No prepayment premium will apply on or after March 11, 2029. The assumed defeasance lockout period of 26 payments is based on the closing date of this transaction in November 2019. Partial defeasance or partial prepayment (with the applicable yield maintenance premium) of the 230 Park Avenue Whole Loan is permitted, after the Defeasance Lockout Date, solely to satisfy the debt yield threshold to prevent a Cash Trap Event Period (see the “Lockbox and Cash Management” below for further discussion). |
| (3) | See“Escrows and Reserves” below for further discussion of reserve requirements. |
| (4) | The Appraised Value shown reflects a “Hypothetical Market Value as Stabilized Today” which assumes that all free rent has burned off and all of the tenant improvements and landlord work have been completed. At loan closing, the 230 Park Avenue South Borrower escrowed $24,763,070 for all free rent and gap rent pertaining to the Discovery space and $34,263,578 representing 75% of the tenant allowances, tenant improvements and capital improvements pertaining to the Discovery lease and space (the remaining 25% was guaranteed by the Guarantor) (see “Escrows and Reserves” below for further information). The appraiser also concluded to an “As-Is” appraised value of $415,000,000 as of July 24, 2019, which results in a Cut-off Date LTV Ratio of 60.2% and LTV Ratio at Maturity of 60.2% for the 230 Park Avenue South Whole Loan. Additionally, the appraiser concluded to a hypothetical “Go Dark” value of $350,000,000 as of July 24, 2019. Further, the appraisal notes that, since the 230 Park Avenue South Property is the subject of and expected to be eligible for New York City’s Industrial and Commercial Abatement Program (ICAP), the 10-year benefit has been assumed in its analysis of both the “As-Is” appraised value and the “Hypothetical Market Value as Stabilized Today” (see “The Property” section below for further information about the ICAP). |
| (5) | The 230 Park Avenue South Property (as defined below) has been approximately 100.0% leased since 2008, however, it is currently undergoing an extensive repositioning program to serve as Discovery, Inc.’s global corporate headquarters. Accordingly, operating history was not considered relevant to underwriting. |
THE INFORMATION IN THIS STRUCTURAL AND COLLATERAL TERM SHEET IS NOT COMPLETE AND MAY BE AMENDED PRIOR TO THE TIME OF SALE. THIS TERM SHEET IS NOT AN OFFER TO SELL THESE SECURITIES AND IT IS NOT A SOLICITATION OF AN OFFER TO BUY THESE SECURITIES IN ANY JURISDICTION WHERE THE OFFER OR SALE IS NOT PERMITTED.
16
| Office – CBD | Loan #2 | Cut-off Date Balance: | | $110,000,000 |
| 230 Park Avenue South | 230 Park Avenue South | Cut-off Date LTV: | | 51.0% |
| New York, NY 10003 | | U/W NCF DSCR: | | 2.64x |
| | | U/W NOI Debt Yield: | | 8.9% |
The Mortgage Loan. The mortgage loan (the “230 Park Avenue South Mortgage Loan”) is part of a whole loan (the “230 Park Avenue South Whole Loan”) that is evidenced by sevenpari passupromissory notes in the aggregate original principal amount of $250,000,000. The 230 Park Avenue South Whole Loan is secured by a first priority fee mortgage encumbering an office building located in New York, New York (the “230 Park Avenue South Property”). The 230 Park Avenue South Whole Loan was co-originated on September 11, 2019 by Wells Fargo Bank, National Association (“Wells Fargo”), Bank of America, N.A. (“Bank of America”) and JPMorgan Chase Bank, National Association (“JPMorgan”). The 230 Park Avenue South Mortgage Loan is evidenced by the non-controlling promissory notes A-2, A-3, A-5 and A-6 in the aggregate original principal amount of $110,000,000. The controlling promissory note A-1 in the original principal amount of $55,000,000 and the non-controlling promissory note A-4 in the original principal amount of $55,000,000 were contributed to the BANK 2019-BNK21 securitization trust and the non-controlling promissory note A-7 in the original principal amount of $30,000,000 is currently held by JPMorgan and is expected to be contributed to future securitization trusts or may be otherwise transferred at any time. The 230 Park Avenue South Whole Loan will be serviced pursuant to the pooling and servicing agreement for the BANK 2019-BNK21 securitization trust. See “Description of the Mortgage Pool—The Whole Loans—The Non-Serviced Pari Passu Whole Loans” and “Pooling and Servicing Agreement—Servicing of the Non-Serviced Mortgage Loans” in the Preliminary Prospectus.
Note Summary
| Notes | Original Balance | Cut-off Date Balance | Note Holder | Controlling Piece |
| A-1 | $55,000,000 | $55,000,000 | BANK 2019-BNK21 | Yes |
| A-2 | $30,000,000 | $30,000,000 | BANK 2019-BNK22 | No |
| A-3 | $25,000,000 | $25,000,000 | BANK 2019-BNK22 | No |
| A-4 | $55,000,000 | $55,000,000 | BANK 2019-BNK21 | No |
| A-5 | $30,000,000 | $30,000,000 | BANK 2019-BNK22 | No |
| A-6 | $25,000,000 | $25,000,000 | BANK 2019-BNK22 | No |
| A-7 | $30,000,000 | $30,000,000 | JPMorgan | No |
| Total | $250,000,000 | $250,000,000 | | |
The Borrower and Borrower Sponsors.The borrower is 230 PAS SPE LLC (the “230 Park Avenue South Borrower”), a Delaware limited liability company and single purpose entity with two independent directors. Legal counsel to the 230 Park Avenue South Borrower delivered a non-consolidation opinion in connection with the origination of the 230 Park Avenue South Whole Loan.
The borrower sponsor and non-recourse carveout guarantor is TF Cornerstone Properties, LLC (the “Guarantor”), an affiliate of TF Cornerstone Inc., which, together with Guarantor and other affiliates (collectively, “TF Cornerstone”), comprise a family-owned real estate enterprise focused on acquisition, development, construction and management of residential and commercial properties. Founded in the 1970s and led by K. Thomas and Frederick Elghanayan, TF Cornerstone’s current portfolio includes approximately 12,625 apartment units in New York City and over 2.5 million square feet of commercial space in New York and Washington, D.C. (including 12 office properties). TF Cornerstone’s portfolio includes 387 Park Avenue South and Carnegie Hall Tower, approximately 0.4 and 2.1 miles northeast of the 230 Park Avenue South Property, respectively.
The Property.The 230 Park Avenue South Property is a 373,693 square foot, 14-story office building located within the Midtown South area of Manhattan in New York, New York. The 230 Park Avenue South Property was constructed in 1895 and is currently undergoing an extensive repositioning program that, per the appraisal, is expected to position the 230 Park Avenue South Property as a Class A building following completion. As part of a lease recently executed with Discovery for 96.7% of the NRA, the building is currently undergoing a $14.6 million modernization that includes the expansion and renovation of the entry and lobby areas (approximately $6.6 million), updated destination dispatch elevators and a newly-built service elevator that will operate on the cellar, ground and second floors (approximately $3.2 million). The 230 Park Avenue South Property will also undergo upgrades to the HVAC systems and cooling tower (approximately $2.0 million), improvements to the electrical service that will increase capacity to 8,000 Amps (approximately $2.0 million) and other miscellaneous renovations (approximately $0.8 million). Additionally, an indoor/outdoor studio is expected to be created in the newly-designed courtyard area; and the existing office spaces are expected to be renovated to consist of open, loft-style space with exposed ceilings.
According to the appraisal, as part of the proposed redevelopment, the 230 Park Avenue South Borrower is anticipated to benefit from a 10-year Industrial Commercial Abatement Program (“ICAP”) Tax Abatement. The ICAP provides abatements for property taxes for industrial or commercial properties that have been built, modernized, expanded or physically improved throughout Manhattan and the outer boroughs of New York. To qualify for the ICAP abatement, (a) properties must spend 30% of the taxable assessed value in capital expenses in four years from the date the building permit was issued, and (b) construction must be completed within five years of the issuance of a building permit, among other conditions. The borrower sponsor has filed for an ICAP tax abatement on the 230 Park Avenue South Property and is expected to be a candidate for approval of the ICAP tax abatement based on the repositioning of the existing improvements. As of the date of origination of the 230 Park Avenue South Whole Loan, the 230 Park Avenue South Property had not received the abatement; however, an ICAP application was filed in May 2018. The ICAP was not given credit in the lender’s underwriting; however, the ICAP was assumed in the appraiser’s analysis. The appraisal notes that the 230 Park Avenue South Property is expected to be eligible for the ICAP.
The 230 Park Avenue South Property was 100.0% leased to three tenants as of September 1, 2019; however, Discovery is not yet in occupancy or paying rent. Approximately 3.3% of the net rentable area and 5.9% of the underwritten base rent at the 230 Park Avenue South Property is attributed to two ground floor retail tenants (JPMorgan Chase and Earth Mail) with frontage along Park Avenue South and East 19th Street.
THE INFORMATION IN THIS STRUCTURAL AND COLLATERAL TERM SHEET IS NOT COMPLETE AND MAY BE AMENDED PRIOR TO THE TIME OF SALE. THIS TERM SHEET IS NOT AN OFFER TO SELL THESE SECURITIES AND IT IS NOT A SOLICITATION OF AN OFFER TO BUY THESE SECURITIES IN ANY JURISDICTION WHERE THE OFFER OR SALE IS NOT PERMITTED.
17
| Office – CBD | Loan #2 | Cut-off Date Balance: | | $110,000,000 |
| 230 Park Avenue South | 230 Park Avenue South | Cut-off Date LTV: | | 51.0% |
| New York, NY 10003 | | U/W NCF DSCR: | | 2.64x |
| | | U/W NOI Debt Yield: | | 8.9% |
Major Tenant.
Discovery (361,214 square feet, 96.7% of NRA; 94.1% of underwritten base rent, January 31, 2037 expiration). Discovery Communications, LLC, a wholly owned subsidiary of Discovery, Inc. (“Discovery”; S&P: BBB-; NASDAQ: DISCA), is an American mass media company with numerous television networks including the Discovery Channel, Animal Planet, TLC, HGTV, Travel Channel, and the Food Network. As of September 6, 2019, Discovery had a market capitalization of approximately $15.9 billion. In March 2018, Discovery purchased Scripps Networks Interactive for approximately $14.6 billion, which was the owner of HGTV, Food Network, and the Travel Channel. Discovery is planning to move Scripps’ headquarters into the 230 Park Avenue South Property along with the rest of Discovery.
Discovery is expected to utilize its space at the 230 Park Avenue South Property as its corporate headquarters. Discovery is expected to occupy a portion of the ground floor, floors 2-13, the courtyard and the penthouse (floor 14), as well as eastern & western cellars. The company is expected to utilize all space from the fourth floor through the penthouse as space for general and executive offices, as well as certain ancillary purposes. The ground, second, and third floor are expected to be used by one of the channels in Discovery’s portfolio, the Food Network, as production kitchens and studio space.
Discovery has a signed lease but is not yet in occupancy or paying rent. Discovery has taken possession of the eastern & western cellars, its ground floor space and floors 2-11; floors 12-14 were recently delivered on September 1, 2019; and the courtyard space is expected to be delivered in February 2021. Discovery is expected to commence occupying the premises in January 2020 with a full occupancy date expected by December 2020. Discovery’s lease is guaranteed by Discovery, Inc., the rated parent company, and has either one, 10-year or two, five-year renewal options at the fair market rental rate following its lease expiration in January 2037.
Discovery’s rent commencement is expected in June 2020 for floors 2-3 and 7-10 (46.6% of Discovery’s space; 46.2% of Discovery’s underwritten base rent); in July 2020 for the ground floor and eastern cellar space (3.6% of Discovery’s space; 3.0% of Discovery’s underwritten base rent); in September 2020 for floors 4-6 and 11 (31.0% of Discovery’s space; 29.8% of Discovery’s underwritten base rent); in October 2020 for the western cellar space (1.7% of Discovery’s space; 1.0% of Discovery’s underwritten base rent); in November 2020 for floors 12-14 (16.6% of Discovery’s space; 19.4% of Discovery’s underwritten base rent); and in April 2022 for the courtyard premises (0.5% of Discovery’s space; 0.6% of Discovery’s underwritten base rent). All outstanding free rent and gap rent were reserved for at the time of origination of the 230 Park Avenue Whole Loan, along with 75% of the landlord lease obligations for Discovery (with the additional 25% guaranteed by the Guarantor; see the “Escrows and Reserves” section below). There is no assurance that Discovery will take occupancy or begin paying rent by the estimated dates noted herein.
THE INFORMATION IN THIS STRUCTURAL AND COLLATERAL TERM SHEET IS NOT COMPLETE AND MAY BE AMENDED PRIOR TO THE TIME OF SALE. THIS TERM SHEET IS NOT AN OFFER TO SELL THESE SECURITIES AND IT IS NOT A SOLICITATION OF AN OFFER TO BUY THESE SECURITIES IN ANY JURISDICTION WHERE THE OFFER OR SALE IS NOT PERMITTED.
18
| Office – CBD | Loan #2 | Cut-off Date Balance: | | $110,000,000 |
| 230 Park Avenue South | 230 Park Avenue South | Cut-off Date LTV: | | 51.0% |
| New York, NY 10003 | | U/W NCF DSCR: | | 2.64x |
| | | U/W NOI Debt Yield: | | 8.9% |
The following table presents certain information relating to the tenancy at the 230 Park Avenue South Property:
Major Tenants
| Tenant Name | Credit Rating (Fitch/ Moody’s/
S&P)(1) | Tenant NRSF | % of
NRSF | Annual U/W Base Rent PSF | Annual
U/W Base Rent | % of Total Annual U/W Base Rent | Lease
Expiration
Date | Extension Options | Termination Option (Y/N) |
| Major Tenant | | | | | | | | |
| Discovery Communications, LLC(2) | NR/NR/BBB- | 361,214 | 96.7% | $84.06(3) | $30,363,766(3) | 94.1% | 1/31/2037 | 1, 10-year or 2, 5-year(4) | N |
| Total Major Tenant | 361,214 | 96.7% | $84.06 | $30,363,766 | 94.1% | | | |
| | | | | | | | | |
| Non-Major Tenants(5) | 12,479 | 3.3% | $153.15 | $1,911,210 | 5.9% | | | |
| | | | | | | | | |
| Occupied Collateral Total | 373,693 | 100.0% | $86.37 | $32,274,976 | 100.0% | | | |
| | | | | | | | | |
| Vacant Space | 0 | 0.0% | | | | | | |
| | | | | | | | | |
| Collateral Total | 373,693 | 100.0% | | | | | | |
| | | | | | | | | | |
| | | | | | | | | | | |
| (1) | The Discovery lease is guaranteed by Discovery, Inc., the rated entity. |
| (2) | Discovery has an executed lease but has not yet taken occupancy or commenced paying rent (see tenant description in“Major Tenants” above for further information). |
| (3) | The Annual UW Base Rent and Annual UW Base Rent PSF shown above include straight-line rent averaging over the remaining loan term for Discovery totaling $1,218,633. Discovery’s current rental rate is $80.69 PSF. |
| (4) | Discovery has either one, 10-year option or two, 5-year options to renew, each with 24 months’ notice at the fair market rental rate. |
| (5) | Non-Major Tenants comprise two ground level retail tenants. |
The following table presents certain information relating to the lease rollover schedule at the 230 Park Avenue South Property:
Lease Expiration Schedule(1)(2)
Year Ending
December 31, | No. of Leases Expiring | Expiring
NRSF | % of
Total
NRSF | Cumulative
Expiring
NRSF | Cumulative
% of Total
NRSF | Annual
U/W
Base Rent | % of Total Annual U/W Base Rent | Annual
U/W
Base Rent
PSF |
| MTM | 0 | 0 | 0.0% | 0 | 0.0% | $0 | 0.0% | $0.00 |
| 2019 | 0 | 0 | 0.0% | 0 | 0.0% | $0 | 0.0% | $0.00 |
| 2020 | 0 | 0 | 0.0% | 0 | 0.0% | $0 | 0.0% | $0.00 |
| 2021 | 2 | 12,479 | 3.3% | 12,479 | 3.3% | $1,911,210 | 5.9% | $153.15 |
| 2022 | 0 | 0 | 0.0% | 12,479 | 3.3% | $0 | 0.0% | $0.00 |
| 2023 | 0 | 0 | 0.0% | 12,479 | 3.3% | $0 | 0.0% | $0.00 |
| 2024 | 0 | 0 | 0.0% | 12,479 | 3.3% | $0 | 0.0% | $0.00 |
| 2025 | 0 | 0 | 0.0% | 12,479 | 3.3% | $0 | 0.0% | $0.00 |
| 2026 | 0 | 0 | 0.0% | 12,479 | 3.3% | $0 | 0.0% | $0.00 |
| 2027 | 0 | 0 | 0.0% | 12,479 | 3.3% | $0 | 0.0% | $0.00 |
| 2028 | 0 | 0 | 0.0% | 12,479 | 3.3% | $0 | 0.0% | $0.00 |
| 2029 | 0 | 0 | 0.0% | 12,479 | 3.3% | $0 | 0.0% | $0.00 |
| Thereafter | 1 | 361,214 | 96.7% | 373,693 | 100.0% | $30,363,766 | 94.1% | $84.06 |
| Vacant | 0 | 0 | 0.0% | 373,693 | 100.0% | $0 | 0.0% | $0.00 |
| Total/Weighted Average | 3 | 373,693 | 100.0% | | | $32,274,976 | 100.0% | $86.37 |
| (1) | Information obtained from the underwritten rent roll. |
| (2) | Certain tenants may have lease termination options that are exercisable prior to the originally stated expiration date of the subject lease and that are not considered in the Lease Expiration Schedule. |
THE INFORMATION IN THIS STRUCTURAL AND COLLATERAL TERM SHEET IS NOT COMPLETE AND MAY BE AMENDED PRIOR TO THE TIME OF SALE. THIS TERM SHEET IS NOT AN OFFER TO SELL THESE SECURITIES AND IT IS NOT A SOLICITATION OF AN OFFER TO BUY THESE SECURITIES IN ANY JURISDICTION WHERE THE OFFER OR SALE IS NOT PERMITTED.
19
| Office – CBD | Loan #2 | Cut-off Date Balance: | | $110,000,000 |
| 230 Park Avenue South | 230 Park Avenue South | Cut-off Date LTV: | | 51.0% |
| New York, NY 10003 | | U/W NCF DSCR: | | 2.64x |
| | | U/W NOI Debt Yield: | | 8.9% |
The following table presents historical occupancy percentages at the 230 Park Avenue South Property:
Historical Occupancy
12/31/2015(1) | 12/31/2016(1) | 12/31/2017(1) | 12/31/2018(1) | 9/1/2019(2) |
| 100.0% | 100.0% | 100.0% | 100.0% | 100.0% |
| (1) | Information obtained from the borrower. |
| (2) | Information obtained from the underwritten rent roll. |
Operating History and Underwritten Net Cash Flow. The following table presents certain information relating to the historical operating performance and underwritten net cash flow at the 230 Park Avenue South Property:
Cash Flow Analysis(1)
| | U/W | %(2) | U/W $ per SF |
| Base Rent | $31,056,343 | 90.0% | $83.11 |
| Rent Average Benefit | 1,218,633(3) | 3.5 | 3.26 |
| Contractual Rent Steps | 0 | 0.0 | 0.00 |
| Grossed Up Vacant Space | 0 | 0.0 | 0.00 |
| Gross Potential Rent | $32,274,976 | 93.5% | $86.37 |
| Other Income | 0 | 0.0 | 0.00 |
| Total Recoveries | 2,251,148 | 6.5 | 6.02 |
| Net Rental Income | $34,526,124 | 100.0% | $92.39 |
| (Vacancy & Credit Loss) | (929,486)(4) | (2.9) | (2.49) |
| Effective Gross Income | $33,596,638 | 97.3% | $89.90 |
| | | | |
| Real Estate Taxes | 6,627,000 | 19.7 | 17.73 |
| Insurance | 226,312 | 0.7 | 0.61 |
| Management Fee | 1,000,000 | 3.0 | 2.68 |
| Other Operating Expenses | 3,595,770 | 10.7 | 9.62 |
| Total Operating Expenses | $11,449,082 | 34.1% | $30.64 |
| | | | |
| Net Operating Income | $22,147,556 | 65.9% | $59.27 |
| Replacement Reserves | 119,582 | 0.4 | 0.32 |
| TI/LC | 66,408 | 0.2 | 0.18 |
| Net Cash Flow | $21,961,566 | 65.4% | $58.77 |
| | | | |
| NOI DSCR(5) | 2.66x | | |
| NCF DSCR(5) | 2.64x | | |
| NOI Debt Yield(5) | 8.9% | | |
| NCF Debt Yield(5) | 8.8% | | |
| (1) | The 230 Park Avenue South Property has been approximately 100.0% leased since 2008, however, it is currently undergoing an extensive repositioning program to serve as Discovery’s global corporate headquarters. Accordingly, operating history was not considered relevant to underwriting. |
| (2) | Represents (i) percent of Net Rental Income for all revenue fields, (ii) percent of Gross Potential Rent for Vacancy & Credit Loss and (iii) percent of Effective Gross Income for all other fields |
| (3) | Represents straight-line rent averaging over the remaining loan term for Discovery Communications. |
| (4) | The underwritten economic vacancy is 2.9%. The 230 Park Avenue South Property was 100.0% leased as of September 1, 2019. |
| (5) | The debt service coverage ratios and debt yields are based on the 230 Park Avenue South Whole Loan. |
Appraisal.The Appraised Value shown reflects a “Hypothetical Market Value as Stabilized Today” which assumes that all free rent has burned off and all of the tenant improvements and landlord work have been completed. At loan closing, the 230 Park Avenue South Borrower escrowed $24,763,070 for all free rent and gap rent pertaining to the Discovery space and $34,263,578 representing 75% of the tenant allowances, tenant improvements and capital improvements pertaining to the Discovery lease and space (the remaining 25% was guaranteed by the Guarantor) (see the “Escrows” section below for further information). The appraiser also concluded to an “As-Is” appraised value of $415,000,000 as of July 24, 2019, which results in a Cut-off Date LTV Ratio of 60.2% and LTV Ratio at Maturity of 60.2% for the 230 Park Avenue South Whole Loan. Additionally, the appraiser concluded to a hypothetical “Go Dark” value of $350,000,000 as of July 24, 2019. Further, the appraisal notes that, since the 230 Park Avenue South Property is the
THE INFORMATION IN THIS STRUCTURAL AND COLLATERAL TERM SHEET IS NOT COMPLETE AND MAY BE AMENDED PRIOR TO THE TIME OF SALE. THIS TERM SHEET IS NOT AN OFFER TO SELL THESE SECURITIES AND IT IS NOT A SOLICITATION OF AN OFFER TO BUY THESE SECURITIES IN ANY JURISDICTION WHERE THE OFFER OR SALE IS NOT PERMITTED.
20
| Office – CBD | Loan #2 | Cut-off Date Balance: | | $110,000,000 |
| 230 Park Avenue South | 230 Park Avenue South | Cut-off Date LTV: | | 51.0% |
| New York, NY 10003 | | U/W NCF DSCR: | | 2.64x |
| | | U/W NOI Debt Yield: | | 8.9% |
subject of and expected to be eligible for New York City’s Industrial and Commercial Abatement Program (ICAP), the 10-year benefit has been assumed in its analysis of both the “As-Is” appraised value and the “Hypothetical Market Value as Stabilized Today” (see “The Property” section below for further information about the ICAP).
Environmental Matters. According to the Phase I environmental site assessment dated August 7, 2019, there was no evidence of any recognized environmental conditions at any of the 230 Park Avenue South Property.
Market Overview and Competition.The 230 Park Avenue South Property is situated on the southwest corner of the intersection of Park Avenue South and East 19th Street within the Midtown South area of Manhattan, New York, New York. The 230 Park Avenue South Property is situated approximately four blocks southeast of the 23rd Street Subway station (which services the 4 and 6 lines) and four blocks northeast of the 14th Street/Union Square subway station (which services the L, N, Q, R, W, 4, 5 and 6 lines and is the fourth busiest Subway station according to the most recently published data by the Metropolitan Transportation Authority (MTA) in 2016). Madison Square Park, a 6.2-acre public park that opened in 1847, is located approximately four blocks northwest of the 230 Park Avenue South Property. Notable landmarks and historical buildings that surround Madison Square Park include the Flatiron Building, the Toy Center, the New York Life Building, 11 Madison Avenue, the Met Life Tower, and One Madison Park. According to a third party market research provider, the estimated 2019 population within a three- and five-mile radius of the 230 Park Avenue South Property was approximately 1,275,932 and 2,911,772, respectively; and the estimated 2019 average household income within the same radii was approximately $136,389 and $116,789, respectively.
According to a third-party market research report, the 230 Park Avenue South Property is situated within the Gramercy Park Office submarket of the New York Office Market. As of September 4, 2019, the Gramercy Park Office submarket reported a total inventory of approximately 28.2 million square feet with a 6.6% vacancy rate and average asking rent of $72.13 per square foot, triple net.
The appraiser identified a competitive set of 26 office properties totaling approximately 8.7 million square feet, with an average occupancy rate of 95.6%. In addition, the appraiser identified nine comparable leases ranging from $82.00 per square foot to $130.00 per square foot, modified gross (with a weighted average of $91.75 per square foot; see table below).
The following table presents certain information relating to the appraisal’s market rent conclusion for the 230 Park Avenue South Property:
Market Rent Summary
| | Office – Floor 2-6 | Office Floor 7-11 | Office Floor 12-14 |
| Market Rent (PSF) | $85.00 | $90.00 | $100.00 |
| Lease Term (Years) | 15 | 15 | 15 |
| Concessions | 12 months | 12 months | 12 months |
| Lease Type (Reimbursements) | MG | MG | MG |
THE INFORMATION IN THIS STRUCTURAL AND COLLATERAL TERM SHEET IS NOT COMPLETE AND MAY BE AMENDED PRIOR TO THE TIME OF SALE. THIS TERM SHEET IS NOT AN OFFER TO SELL THESE SECURITIES AND IT IS NOT A SOLICITATION OF AN OFFER TO BUY THESE SECURITIES IN ANY JURISDICTION WHERE THE OFFER OR SALE IS NOT PERMITTED.
21
| Office – CBD | Loan #2 | Cut-off Date Balance: | | $110,000,000 |
| 230 Park Avenue South | 230 Park Avenue South | Cut-off Date LTV: | | 51.0% |
| New York, NY 10003 | | U/W NCF DSCR: | | 2.64x |
| | | U/W NOI Debt Yield: | | 8.9% |
The following table presents information relating to comparable office property sales for the 230 Park Avenue South Property:
Comparable Property Sale Summary
| |
| Property Name/Location | Sale Date | Year Built/ Renovated | Total NRA (SF) | Occupancy | Sale Price | Sale Price PSF |
230 Park Avenue South Property (Subject) New York, NY | NAP | 1895/2019 | 373,693 | 100.0% | | |
450 West 15th Street New York, NY | May 2019 | 1928/2012 | 320,789 | 94% | $600,000,000 | $1,870 |
875 Washington Street New York, NY | Apr. 2019 | 1900/NAP(1) | 70,263 | 100% | $133,000,000 | $1,893 |
670 Broadway New York, NY | Feb. 2019 | 1900/2016 | 71,929 | 98% | $130,500,000 | $1,814 |
400 Madison Avenue New York, NY | Oct. 2018 | 1929/2013-2015 | 180,181 | 80% | $194,500,000 | $1,079 |
160 Fifth Avenue New York, NY | Dec. 2018 | 1892/2009 | 122,328 | 100% | $180,750,000 | $1,478 |
540 West 26th Street New York, NY | Aug. 2018 | 2018/NAV | 166,966 | 95% | $257,000,000 | $1,539 |
330 Hudson Street New York, NY | Feb. 2018 | 1910/2013 | 466,738 | 76% | $385,000,000 | $825 |
245-249 West 17th Street New York, NY | Oct. 2017 | 1909/NAV | 281,294 | 100% | $324,020,945 | $1,152 |
| (1) | Renovations at 875 Washington Street are ongoing and expected to be completed in 2020. |
The following table presents certain information relating to comparable office leases for the 230 Park Avenue South Property:
Comparable Leases Summary
| Property Name/Location | Year Built/ Renovated | Total GLA (SF) | Occupancy(1) | Distance from Subject | Tenant Name | Lease Date/Term | Lease Area (SF) | Annual Base Rent PSF | Lease Type |
230 Park Avenue South Property(2) (Subject) New York, NY | 1895/2019 | 373,693 | 100.0% | - | Discovery Communications | Apr. 2019 / 17.8 Yrs | 361,214 | $80.69(2) | MG |
114 Fifth Avenue New York, NY | 1972/1995 | 2,522,000 | 100.0% | 0.3 Miles | Unqork | Jun. 2019 / 10.0 Yrs | 38,652 | $88.00 | MG |
100-104 Fifth Avenue New York, NY | 1905/NAP | 305,000 | 100.0% | 0.3 Miles | Bankrate | Feb. 2019 / 10.7 Yrs | 22,800 | $99.00 | MG |
315 Park Avenue South New York, NY | 1910/2007 | 356,330 | 90.1% | 0.3 Miles | PitchBook Data, Inc. | Jan. 2019 / 11.4 Yrs | 17,050 | $95.00 | MG |
155 Avenue of the Americas New York, NY | 1928/NAP | 226,376 | 100.0% | 1.4 Miles | Downtown Music Publishing | Jan. 2019 / 11.0 Yrs | 26,399 | $88.00 | MG |
110 Fifth Avenue New York, NY | 1890/2002 | 174,900 | 100.0% | 0.3 Miles | Compass | Nov. 2018 / 10.9 Yrs | 80,000 | $88.00 | MG |
57-59 East 11th Street New York, NY | 1903/NAP | 68,133 | 100.0% | 0.5 Miles | WeWork | Nov. 2018 / 16.0 Yrs | 57,022 | $90.00 | MG |
888 Broadway New York, NY | 1900/NAP | 175,000 | 100.0% | 0.1 Miles | Netflix | Oct. 2018 / 13.1 Yrs | 37,378 | $130.00 | MG |
315 Park Avenue South New York, NY | 1910/2007 | 356,330 | 90.1% | 0.3 Miles | Fullscreen Media | Jul. 2018 / 3.0-10.8 Yrs | 34,000 | $82.00 | MG |
287 Park Avenue South New York, NY | 1893/NAP | 117,852 | 94.4% | 0.2 Miles | Spaces by Regus | Jun. 2018 / 15.0 Yrs | 103,321 | $85.21 | MG |
| (1) | Information obtained from a third party market research provider. |
| (2) | Information obtained from the borrower sponsor. The rent shown for Discovery represents the tenant’s current contractual rental rate, while the tenant was underwritten to the straight-line average over the remaining loan term of $84.06 PSF due to its investment grade nature. |
THE INFORMATION IN THIS STRUCTURAL AND COLLATERAL TERM SHEET IS NOT COMPLETE AND MAY BE AMENDED PRIOR TO THE TIME OF SALE. THIS TERM SHEET IS NOT AN OFFER TO SELL THESE SECURITIES AND IT IS NOT A SOLICITATION OF AN OFFER TO BUY THESE SECURITIES IN ANY JURISDICTION WHERE THE OFFER OR SALE IS NOT PERMITTED.
22
| Office – CBD | Loan #2 | Cut-off Date Balance: | | $110,000,000 |
| 230 Park Avenue South | 230 Park Avenue South | Cut-off Date LTV: | | 51.0% |
| New York, NY 10003 | | U/W NCF DSCR: | | 2.64x |
| | | U/W NOI Debt Yield: | | 8.9% |
Escrows.
Real Estate Taxes – Upon the occurrence and continuance of a Cash Trap Event Period (see “Lockbox and Cash Management” section), the 230 Park Avenue South Whole Loan documents require ongoing monthly real estate tax reserves in an amount equal to 1/12 of the real estate taxes that the lender estimates will be payable during the next 12 months.
Insurance– Upon the occurrence and continuance of a Cash Trap Event Period, the 230 Park Avenue South Whole Loan documents require ongoing monthly insurance reserves in an amount equal to 1/12 of the insurance premiums that the lender estimates will be payable for the renewal of the coverage during the next 12 months, provided, that so long as no event of default is continuing, to the extent insurance is maintained by the 230 Park Avenue South Borrower under a blanket policy reasonably acceptable to the lender (along with evidence of renewal not less than five business days prior to expiration), the 230 Park Avenue South Borrower is not required to make ongoing monthly insurance reserve deposits applicable to such blanket policy.
Rent Concession Reserve – The 230 Park Avenue South Borrower was required to deposit an upfront reserve of $24,763,070 for future rent credits or abatements under the Discovery lease.
Existing Landlord Obligations Reserve – The 230 Park Avenue South Borrower is required to deposit an upfront reserve of $34,263,578 representing 75% of the landlord lease obligations for Discovery ($8,924,975 landlord work and $36,759,796 tenant allowances, collectively the “Landlord Lease Obligations”) which are payable by the 230 Park Avenue South Borrower but not yet due. The remaining 25% of the Landlord Lease Obligations is required to be paid for by the 230 Park Avenue South Borrower or from capital contributions from the constituent owners of the 230 Park Avenue South Borrower and is fully guaranteed by the Guarantor (along with any potential future cost increases) (the “Guaranteed Portion”). Pursuant to the 230 Park Avenue South Whole Loan documents, (1) the cost of the final 25% of the Landlord Lease Obligations (“the Final Portion”) must be funded from and paid for from the Existing Landlord Obligations Reserve and (2) the 230 Park Avenue South Borrower or its constituent owners are required to have fully funded and paid for the Guaranteed Portion on or before the date when 75% of the Landlord Lease Obligations have been paid for and satisfied. The 230 Park Avenue South Borrower is required to deliver evidence reasonably satisfactory to the lender that the 230 Park Avenue South Borrower has paid for the Guaranteed Portion before the 230 Park Avenue South Borrower may make a request for and receive the Final Portion.
Lockbox and Cash Management.The 230 Park Avenue South Whole Loan documents require that the 230 Park Avenue South Borrower establish and maintain a lender-controlled lockbox account, which is already in place, and that the 230 Park Avenue South Borrower direct all tenants to pay rent directly into such lockbox account. The loan documents also require that all rents received by the 230 Park Avenue South Borrower or the property manager be deposited into the lockbox account within two business days of receipt. Upon the occurrence of a Cash Trap Event Period (as defined below), all funds in the lockbox account are required to be swept each business day into the cash management account controlled by the lender and, on each payment date, all funds in the cash management account are required to be applied in accordance with the 230 Park Avenue South Whole Loan documents. Prior to the occurrence of a Cash Trap Event Period, all funds in the lockbox account will be disbursed to the 230 Park Avenue South Borrower. During a Cash Trap Event Period, any excess cash flow remaining after satisfaction of the waterfall items (subject to the Applicable Sweep Cap described below) are required to be swept into an excess cash flow subaccount to be held by the lender as additional security for the 230 Park Avenue South Whole Loan.
A “Cash Trap Event Period” will commence upon the earlier of the following:
| (i) | the occurrence of an event of default under the 230 Park Avenue South Whole Loan documents; or |
| (ii) | the occurrence of a Material Tenant Sweep Period (as defined below). |
A Cash Trap Event Period will end upon the occurrence of the following:
| ● | with regard to clause (i), the cure of such event of default; or |
| ● | with regard to clause (ii), a Material Tenant Sweep Period Cure (as defined below). |
A “Material Tenant Sweep Period” will commence upon the earlier of the following:
| (i) | the date that the Significant Portion Condition (as defined below) is met; |
| (ii) | the date that the Material Portion Condition (as defined below) is met and the Material Tenant (as defined below) does not have a long-term unsecured debt rating of at least ‘BBB-’ from S&P or an equivalent rating from each of the other rating agencies which rate such entity (“Investment Grade Condition”); |
| (iii) | the Material Tenant giving notice of termination of its lease; |
| (iv) | any termination or cancellation of the Material Tenant lease (including, without limitation, rejection in any bankruptcy or similar insolvency proceeding) and/or the Material Tenant lease failing to otherwise be in full force and effect; |
| (v) | the Material Tenant being subject to a bankruptcy or similar insolvency proceeding; |
| (vi) | the Material Tenant being in (x) monetary default for more than 30 days of (1) its base rent obligations or (2) additional rent obligations, where such unpaid additional rent exceeds $1,000,000, which will be increased by CPI on each anniversary of the loan origination date (except to the extent such nonpayment of additional rent is the result of a good faith dispute on the part of the Material Tenant subject to conditions in the 230 Park Avenue Whole Loan documents) or (y) material non-monetary default beyond all applicable notice and grace periods under such lease; or |
| (vii) | the Material Tenant meeting the Minimum Required Tenant Rating (as defined below) (but not exceeding such rating) or failing to meet the Minimum Required Tenant Rating. |
THE INFORMATION IN THIS STRUCTURAL AND COLLATERAL TERM SHEET IS NOT COMPLETE AND MAY BE AMENDED PRIOR TO THE TIME OF SALE. THIS TERM SHEET IS NOT AN OFFER TO SELL THESE SECURITIES AND IT IS NOT A SOLICITATION OF AN OFFER TO BUY THESE SECURITIES IN ANY JURISDICTION WHERE THE OFFER OR SALE IS NOT PERMITTED.
23
| Office – CBD | Loan #2 | Cut-off Date Balance: | | $110,000,000 |
| 230 Park Avenue South | 230 Park Avenue South | Cut-off Date LTV: | | 51.0% |
| New York, NY 10003 | | U/W NCF DSCR: | | 2.64x |
| | | U/W NOI Debt Yield: | | 8.9% |
A “Material Tenant Sweep Period Cure” will occur upon the following:
| ● | with regard to clause (i), (ii), (v), (vi) and (vii) of the definition of Material Tenant Sweep Period: |
| ○ | the Applicable Sweep Cap being achieved. |
| ● | with regard to clause (iii) of the definition of Material Tenant Sweep Period: |
| ○ | the Material Tenant having rescinded such notice of termination; or |
| ○ | a Material Tenant Re-Tenanting Event (as defined below). |
| ● | with regard to clause (vi) of the definition of Material Tenant Sweep Period: |
| ○ | the Material Tenant no longer being in the respective monetary or material non-monetary default. |
| ● | with regard to clause (i) through (vii) of the definition of Material Tenant Sweep Period: |
| ○ | the premises demised under the Material Tenant lease (or such portion thereof) being re-leased to a replacement tenant or tenants pursuant to a lease approved or deemed approved by the lender, such that the 230 Park Avenue South Property will achieve an adjusted net cash flow debt yield (“NCF DY”) of at least 7.75% for two consecutive quarters (the “Minimum DY Threshold”) (a “Material Tenant Re-Tenanting Event”); |
| ○ | in the case where the Material Tenant is subject to a proceeding under creditor’s rights laws, the applicable Material Tenant’s lease having been affirmed, assigned and assumed in a manner reasonably satisfactory to the lender (other than in the case of an assignment of the Material Tenant lease in accordance with its terms) (“Tenant Bankruptcy Cures”); provided, however, notwithstanding the occurrence of any Tenant Bankruptcy Cure, if a Material Tenant Sweep Period exists as a result of the existence of an event described in clauses (i) through (iv) or (vi) through (vii) of the definition of Material Tenant Sweep Period, then the Material Tenant Sweep Period will not cease but the Applicable Sweep Cap will be recalculated, as appropriate, to reflect the cause of the Material Tenant Sweep Period. |
Additionally, the 230 Park Avenue South Borrower will have the right to partially defease or partially prepay (with the applicable yield maintenance premium) the 230 Park Avenue Whole Loan, provided in each case, such partial defeasance or partial prepayment, as applicable, will not be permitted prior to the defeasance lockout date, so as to satisfy such Minimum DY Threshold (as defined above) or, at its option, by otherwise delivering to the lender cash collateral or a letter of credit in an amount that would, if applied to the repayment of the 230 Park Avenue Whole Loan, satisfy such Minimum DY Threshold. Such cash collateral or letter of credit will be held by the lender as additional collateral for the 230 Park Avenue South Whole Loan.
For purposes of determining a Material Tenant Sweep Period Cure, (1) the entirety of the premises demised under the Material Tenant lease need not be re-leased so long as the 230 Park Avenue South Property satisfies the Minimum DY Threshold, (2) if such Material Tenant is the subject of a proceeding under creditor’s rights laws and assigns such Material Lease to an assignee tenant in accordance with the terms of the Material Lease and such assignee tenant does not satisfy the Base Rating Condition (as defined below) then a Material Tenant Sweep Period will remain in effect, and/or (3) if the 230 Park Avenue South Borrower cures a Material Tenant Sweep Period by entering into two replacement Material Tenant leases approved by the lender and the 230 Park Avenue South Property achieves the Minimum DY Threshold for two consecutive quarters, then there will no longer be a Material Tenant Sweep Period in place, but because 100% of the demised premises is not leased to one successor tenant, the definition of “Cash Trap Event Period” will be revised on and after such cure to remove a Material Tenant Sweep Period as a trigger in clause (ii) of such definitions and replace such clause (ii) of such definition with the DY Trigger (as defined below) (i.e. 6.50%) as more particularly set forth in the definition of “Material Tenant”.
“Material Tenant” means Discovery (together with any lease guarantor, and any successor guarantor, that guarantees the obligations of the Material Tenant under the applicable Material Tenant lease, any successor tenant (each, a “Successor Tenant”)). If there is a Successor Tenant or Successor Tenants under a lease(s) in accordance with the 230 Park Avenue South Whole Loan documents, the “Material Tenant Sweep Periods,” the cures of such “Material Tenant Sweep Periods”, and the “Applicable Sweep Cap” relating to such applicable Successor Tenant and/or Successor Tenants will be restructured and/or modified as follows: If the Material Tenant vacates and the Discovery lease is terminated and the premises demised thereunder are released to a replacement Successor Tenant or Successor Tenants in accordance with the 230 Park Avenue Whole Loan documents and (1)(A) such replacement Successor Tenant leases and occupies 100% of the demised premises which are leased to Discovery under its lease (i.e., 14 floors in the improvements or 361,214 square feet in the aggregate), (B) such replacement Material Tenant lease is on the same or better economic terms as the Discovery lease as determined by the lender, and (C) such replacement Successor Tenant meets the Investment Grade Condition, then the “Material Tenant Sweep Periods,” the cures of such “Material Tenant Sweep Periods” and the “Applicable Sweep Cap” will be the same as are in place currently with the Discovery tenant as the initial Material Tenant hereunder or (2) in the event that any one or more of the clauses above are not met, then there will not be a Material Tenant Sweep Period in the definition of “Cash Trap Event Period” hereunder but such respective clauses of the definition will be replaced with the following trigger event and cure: the date upon which the NCF DY for the 230 Park Avenue South Property fails to be at least 6.50% (the “DY Trigger”) and such DY Trigger will be cured if the NCF DY equals or exceeds 6.50% for two consecutive calendar quarters.
“Significant Portion Condition” means, with respect to any premises demised under a Material Tenant lease, that the applicable Material Tenant ceases operating its business (“goes dark”), or otherwise fails to be in actual, physical occupancy of, in a Significant Portion (as defined below) of the applicable Material Tenant premises; provided that, for purposes of this definition and the definitions of Material Portion Condition and Substantial Occupancy Condition, (i) after the Material Tenant has taken initial occupancy of the demised premises and commenced the operation of its business in the demised premises, the Material Tenant will be deemed to be in actual physical occupancy of space that is the subject of alterations or repairs by the Material Tenant or the 230 Park Avenue South Borrower, including as a result of casualty, (ii) with respect to the Discovery lease only, occupancy by the Material Tenant’s affiliates, related parties and permitted users, each as permitted under the Discovery lease, will be deemed operation of Discovery Tenant’s business and actual physical occupancy by Discovery Tenant in the Material Tenant premises demised under the Discovery lease and (iii) with respect to the Discovery lease only, there will be an initial period following loan origination, subject to force majeure, to allow the
THE INFORMATION IN THIS STRUCTURAL AND COLLATERAL TERM SHEET IS NOT COMPLETE AND MAY BE AMENDED PRIOR TO THE TIME OF SALE. THIS TERM SHEET IS NOT AN OFFER TO SELL THESE SECURITIES AND IT IS NOT A SOLICITATION OF AN OFFER TO BUY THESE SECURITIES IN ANY JURISDICTION WHERE THE OFFER OR SALE IS NOT PERMITTED.
24
| Office – CBD | Loan #2 | Cut-off Date Balance: | | $110,000,000 |
| 230 Park Avenue South | 230 Park Avenue South | Cut-off Date LTV: | | 51.0% |
| New York, NY 10003 | | U/W NCF DSCR: | | 2.64x |
| | | U/W NOI Debt Yield: | | 8.9% |
Material Tenant the opportunity to take initial occupancy of the Material Tenant premises and the Material Tenant will be deemed to be in operation of the premises, subject to conditions outlined in the 230 Park Avenue South Whole Loan documents, including (1) the Material Tenant lease being in full force and effect, (2) the 230 Park Avenue South Borrower is required to commence certain landlord fit-out or base building work as described in the Discovery lease and complete such landlord work on or before the applicable milestone date set forth in the Discovery lease, but no later than May 1, 2020 with respect to the last component of landlord work (such date is subject to extension as set forth in the 230 Park Avenue South Whole Loan documents), (3) the Material Tenant is required to perform tenant’s initial alterations and certain HVAC work on the 14th floor of the 230 Park Avenue South Property as described in the Discovery lease and complete such work on or before June 30, 2021, subject to extension as set forth in the 230 Park Avenue South Whole Loan documents, (4) no contingency termination rights being set forth in the Material Tenant lease except for customary termination rights for landlord’s failure to perform the work prior to tenant taking occupancy provided (A) at the time of determination, no event of default exists under the 230 Park Avenue South Whole Loan documents and (B) the lender has reserved for the cost of such work and (5) Material Tenant is paying full unabated rent (or such abated rent has been fully reserved for by the lender).
“Substantial Occupancy Condition” means that the applicable Material Tenant is in actual, physical occupancy and operating its business (“not dark”) in 75% of its rentable square footage; “Material Portion Condition” means that the applicable Material Tenant ceases to operate its business (“goes dark”) or otherwise fails to be in actual physical occupancy of a Material Portion of the demised premises; “Material Portion” means 25% or more of rentable square footage of a particular space, but less than 50% of the rentable square footage such space; “Significant Portion” means 50% or more of the rentable square footage of the tenant’s premises (provided that the courtyard premises will only be included when the premises is delivered to the tenant (expected to be February 2021)).
“Applicable Sweep Cap” means:
| ● | with respect to any Material Tenant Sweep Period that is the result of the applicable Material Tenant failing to maintain a long-term unsecured debt rating of at least ‘BB’ from S&P or an equivalent rating from each of the other rating agency which rate such entity (“Minimum Required Tenant Rating”): |
| ○ | provided the Substantial Occupancy Condition is met, $25 per square foot of the applicable Material Tenant premises; or |
| ○ | provided the Substantial Occupancy Condition is not met (i.e., either the Significant Portion Condition or the Material Portion Condition are met), $75 per square foot of the applicable Material Tenant Premises. |
| ● | if the Minimum Required Rating is met (but is not exceeded): |
| ○ | provided the Substantial Occupancy Condition is met, $15 per square foot of the applicable Material Tenant premises; |
| ○ | provided the Material Portion Condition is met, $50 per square foot of the applicable Material Tenant premises; or |
| ○ | provided the Significant Portion Condition is met, $75 per square foot of the applicable Material Tenant Premises. |
| ● | with respect to any Material Tenant Sweep Period occurring at such time as the long term unsecured debt rating of at least ‘BB+’ (but less than ‘BBB-’) from S&P or an equivalent rating from each of the other rating agencies which rate such entity (“Base Rating Condition”) and: |
| ○ | provided the Material Portion Condition is met, $25 per square foot of the applicable Material Tenant Premises; or |
| ○ | provided the Significant Portion Condition is met, $75 per square foot of the applicable Material Tenant Premises |
| ● | with respect to any Material Tenant Sweep Period occurring at such time as the Investment Grade Condition and the Significant Portion Condition are met, $25 per square foot of the applicable Material Tenant Premises. |
| ● | with respect to any Material Tenant Sweep Period occurring as the result of clauses (v) and/or (vi) of the definition thereof, $75 per square foot of the applicable Material Tenant Premises. |
Property Management. The 230 Park Avenue South Property is managed by an affiliate of the 230 Park Avenue South Borrower.
Partial Release.Not permitted.
Real Estate Substitution.Not permitted.
Subordinate and Mezzanine Indebtedness. Not permitted.
Ground Lease. None.
Letter of Credit. None.
Right of First Offer. Discovery has a right of first offer to purchase (i) the 230 Park Avenue South Property or (ii) all of the direct equity interests in the 230 Park Avenue South Borrower, if the 230 Park Avenue South Borrower markets the 230 Park Avenue South Property or such equity interests, as applicable, for sale up to and including April 1, 2023 (the “ROFO”) provided that, among other things, no event of default has occurred or is continuing under the Discovery lease. The ROFO is not extinguished by foreclosure, provided the conditions relating to non-disturbance are satisfied as set forth in the subordination, non-disturbance and attornment agreement obtained by Discover at closing, however, the ROFO does not apply to foreclosure or deed-in-lieu thereof or the first subsequent transfer following either one of the foregoing occurrences.
Terrorism Insurance.The 230 Park Avenue South Whole Loan documents require that the “all risk” insurance policy required to be maintained by the 230 Park Avenue South Borrower provide coverage for terrorism in an amount equal to the full replacement cost of the 230 Park Avenue South Property, as well as business interruption insurance covering no less than the 24-month period following the occurrence of a casualty event, together with a 6-month extended period of indemnity (provided that if TRIPRA or a similar statute is not in effect, the 230 Park Avenue South Borrower will not be obligated to pay terrorism insurance premiums in excess of two times
THE INFORMATION IN THIS STRUCTURAL AND COLLATERAL TERM SHEET IS NOT COMPLETE AND MAY BE AMENDED PRIOR TO THE TIME OF SALE. THIS TERM SHEET IS NOT AN OFFER TO SELL THESE SECURITIES AND IT IS NOT A SOLICITATION OF AN OFFER TO BUY THESE SECURITIES IN ANY JURISDICTION WHERE THE OFFER OR SALE IS NOT PERMITTED.
25
| Office – CBD | Loan #2 | Cut-off Date Balance: | | $110,000,000 |
| 230 Park Avenue South | 230 Park Avenue South | Cut-off Date LTV: | | 51.0% |
| New York, NY 10003 | | U/W NCF DSCR: | | 2.64x |
| | | U/W NOI Debt Yield: | | 8.9% |
the premium for the casualty and business interruption coverage on a stand-alone basis at the time any terrorism coverage was excluded from the applicable policy).
THE INFORMATION IN THIS STRUCTURAL AND COLLATERAL TERM SHEET IS NOT COMPLETE AND MAY BE AMENDED PRIOR TO THE TIME OF SALE. THIS TERM SHEET IS NOT AN OFFER TO SELL THESE SECURITIES AND IT IS NOT A SOLICITATION OF AN OFFER TO BUY THESE SECURITIES IN ANY JURISDICTION WHERE THE OFFER OR SALE IS NOT PERMITTED.
26
| Office – CBD | Loan #3 | Cut-off Date Balance: | | $88,475,000 |
| 1100 15th Street, Northwest | Midtown Center | Cut-off Date LTV: | | 39.8% |
| Washington, D.C. 20005 | | U/W NCF DSCR: | | 3.97x |
| | | U/W NOI Debt Yield: | | 12.6% |

THE INFORMATION IN THIS STRUCTURAL AND COLLATERAL TERM SHEET IS NOT COMPLETE AND MAY BE AMENDED PRIOR TO THE TIME OF SALE. THIS TERM SHEET IS NOT AN OFFER TO SELL THESE SECURITIES AND IT IS NOT A SOLICITATION OF AN OFFER TO BUY THESE SECURITIES IN ANY JURISDICTION WHERE THE OFFER OR SALE IS NOT PERMITTED.
27
| No. 3 – Midtown Center |
| |
| Mortgage Loan Information | | Mortgaged Property Information |
| Mortgage Loan Seller: | Wells Fargo Bank, National Association Bank of America, N.A. | | Single Asset/Portfolio: | Single Asset |
Credit Assessment (DBRS/Fitch/S&P): | [AA(low)/NR/NR] | | Property Type – Subtype: | Office – CBD |
| Original Principal Balance(1): | $88,475,000 | | Location: | Washington, D.C. |
| Cut-off Date Balance(1): | $88,475,000 | | Size: | 867,654 SF |
| % of Initial Pool Balance: | 7.4% | | Cut-off Date Balance Per SF(1): | $440.27 |
| Loan Purpose: | Refinance | | Maturity Date or ARD Balance Per SF(1): | $440.27 |
| Borrower Sponsor: | Carr Properties OC LLC | | Year Built/Renovated: | 2017/NAP |
| Guarantor: | Carr Properties OC LLC | | Title Vesting: | Fee |
| Mortgage Rate(2): | 3.0850% | | Property Manager: | Self-managed |
| Note Date: | September 30, 2019 | | Current Occupancy (As of): | 99.7% (8/31/2019) |
| Anticipated Repayment Date(3): | October 11, 2029 | | YE 2018 Occupancy: | 89.8% |
| Seasoning: | 1 month | | YE 2017 Occupancy(6): | NAV |
| Final Maturity Date: | September 30, 2033 | | YE 2016 Occupancy(6): | NAP |
| IO Period: | 120 months | | YE 2015 Occupancy(6): | NAP |
| Loan Term (Original): | 120 months | | As-Is Appraised Value: | $960,000,000 |
| Amortization Term (Original): | NAP | | As-Is Appraised Value Per SF: | $1,106.43 |
| Loan Amortization Type(3): | Interest-only, ARD | | As-Is Appraisal Valuation Date: | August 23, 2019 |
| Call Protection(4): | L(25),D(88),O(7) | | | |
| Lockbox Type: | Hard/Springing Cash Management | | Underwriting and Financial Information |
| Additional Debt: | Yes | | TTM NOI(7): | NAV |
| Additional Debt Type (Balance): | Pari Passu($293,525,000) / Subordinate ($143,000,000) | | YE 2018 NOI(7): | NAV |
| | | | YE 2017 NOI(7): | NAV |
| | | | YE 2016 NOI(7): | NAP |
| | | | U/W Revenues: | $68,757,739 |
| | | | U/W Expenses: | $20,725,125 |
| Escrows and Reserves(5) | | U/W NOI: | $48,032,614 |
| | Initial | Monthly | Cap | | U/W NCF: | $47,551,162 |
| Taxes | $0 | Springing | NAP | | U/W DSCR based on NOI/NCF(1): | 4.01x / 3.97x |
| Insurance | $0 | Springing | NAP | | U/W Debt Yield based on NOI/NCF(1): | 12.6% / 12.4% |
| Replacement Reserve | $0 | Springing | $433,827 | | U/W Debt Yield at Maturity based on NOI/NCF(1): | 12.6% / 12.4% |
| TI/LC Reserve | $0 | Springing | $1,735,308 | | Cut-off Date LTV Ratio(1): | 39.8% |
| Rent Concession Reserve | $1,166,184 | $0 | NAP | | LTV Ratio at Maturity or ARD(1): | 39.8% |
| Existing TI/LC Obligations Reserve | $31,164,159 | $0 | NAP | | | |
| | | | | | | |
| | | | | | | | |
| Sources and Uses |
| Sources | | | | | Uses | | | |
| Original senior loan amount | $382,000,000 | | 72.8% | | Loan payoff | $472,344,264 | | 90.0% |
| Subordinate companion loan | 143,000,000 | | 27.2 | | Upfront reserves | 32,330,343 | | 6.2 |
| | | | | | Closing costs | 3,221,662 | | 0.6 |
| | | | | | Return of equity | 17,103,731 | | 3.3 |
| Total Sources | $525,000,000 | | 100.0% | | Total Uses | $525,000,000 | | 100.0% |
| (1) | The Cut-off Date Balance Per SF, Maturity Date or ARD Balance Per SF, U/W DSCR based on NOI/NCF, U/W Debt Yield based on NOI/NCF, U/W Debt Yield at Maturity or ARD based on NOI/NCF, Cut-off Date LTV Ratio and LTV Ratio at Maturity or ARD numbers presented above are based on the Midtown Center Senior Loan (as defined below). The U/W DSCR based on NOI/NCF, U/W Debt Yield based on NOI/NCF, U/W Debt Yield at Maturity or ARD based on NOI/NCF, Cut-off Date LTV Ratio and LTV Ratio at Maturity or ARD based upon the Midtown Center Whole Loan (as defined below) are 2.92x/2.89x, 9.1%/9.1%, 9.1%/9.1%, 54.7% and 54.7%, respectively. |
| (2) | Both the Midtown Center Senior Loan and the Midtown Center Subordinate Companion Loan (as defined below) have an interest rate of 3.0850%. |
| (3) | The Midtown Center Whole Loan has an anticipated repayment date of October 11, 2029 (the “Anticipated Repayment Date” or “ARD”) and a final maturity date of September 30, 2033. See “The Mortgage Loan” below for further discussion of the mortgage rate after the ARD. In the event of a Fannie Mae Termination Event (see the “Lockbox and Cash Management” section below) prior to or contemporaneously with the Anticipated Repayment Date, the final maturity date will be accelerated to the Anticipated Repayment Date. |
| (4) | Defeasance of the Midtown Center Whole Loan is permitted at any time after the earlier to occur of (a) the end of the two-year period commencing on the closing date of the securitization of the last promissory note representing a portion of the Midtown Center Whole Loan to be securitized and (b) November 11, 2022. The assumed defeasance lockout period of 25 payments is based on the closing date of this transaction in November 2019. |
| (5) | See “Escrows” section. |
| (6) | The Midtown Center Property was built in 2017, and the majority of leases did not commence until May 2018 or thereafter. |
THE INFORMATION IN THIS STRUCTURAL AND COLLATERAL TERM SHEET IS NOT COMPLETE AND MAY BE AMENDED PRIOR TO THE TIME OF SALE. THIS TERM SHEET IS NOT AN OFFER TO SELL THESE SECURITIES AND IT IS NOT A SOLICITATION OF AN OFFER TO BUY THESE SECURITIES IN ANY JURISDICTION WHERE THE OFFER OR SALE IS NOT PERMITTED.
28
| Office – CBD | Loan #3 | Cut-off Date Balance: | | $88,475,000 |
| 1100 15th Street, Northwest | Midtown Center | Cut-off Date LTV: | | 39.8% |
| Washington, D.C. 20005 | | U/W NCF DSCR: | | 3.97x |
| | | U/W NOI Debt Yield: | | 12.6% |
| (7) | Historical operating statements were not obtained and were not considered relevant to the lender’s underwriting, as the majority of leases did not commence until May 2018 or thereafter. |
The Mortgage Loan. The mortgage loan (the “Midtown Center Mortgage Loan”) is part of a whole loan (the “Midtown Center Whole Loan”) that is evidenced by 10pari passusenior promissory notes in the aggregate original principal amount of $382,000,000 (the “Midtown Center Senior Loan”) and threepari passusubordinate promissory notes in the aggregate original principal amount of $143,000,000 (the “Midtown Center Subordinate Companion Loan”). The Midtown Center Whole Loan is secured by a first priority fee mortgage encumbering a 14-story, trophy class office building located in Washington, D.C. (the “Midtown Center Property”). The Midtown Center Whole Loan was co-originated on September 30, 2019 by Wells Fargo Bank, National Association, Bank of America, N.A. and Goldman Sachs Bank USA.
The Midtown Center Mortgage Loan is evidenced by the non-controlling promissory Notes A-2-1, A-2-2, A-2-3, A-2-4 and A-2-5 in the aggregate original principal amount of $88,475,000. As shown in the “Note Summary” table below, six promissory notes, including the controlling promissory note, in the original aggregate principal amount of $404,000,000 were contributed to the DCOT 2019-MTC securitization trust. The Midtown Center Whole Loan will be serviced pursuant to the trust and servicing agreement for the DCOT 2019-MTC securitization trust. The remaining Midtown Center Senior Loanpari passu notes are referred to herein as the “Midtown CenterPari Passu Companion Loans”. See “Description of the Mortgage Pool—The Whole Loans—The Non-Serviced AB Whole Loans” and “Pooling and Servicing Agreement-Servicing of the Non-Serviced Mortgage Loans” in the Preliminary Prospectus.
Note Summary
| Notes | Original Balance | Cut-off Date Balance | Note Holder | Controlling Piece |
| Midtown Center Senior Loan |
| A-1-1 | $135,950,000 | $135,950,000 | DCOT 2019-MTC | Yes |
| A-1-2 | $52,525,000 | $52,525,000 | DCOT 2019-MTC | No |
| A-1-3 | $72,525,000 | $72,525,000 | DCOT 2019-MTC | No |
| A-2-1 | $12,068,966 | $12,068,966 | BANK 2019-BNK22 | No |
| A-2-2 | $13,881,034 | $13,881,034 | BANK 2019-BNK22 | No |
| A-2-3 | $10,000,000 | $10,000,000 | BANK 2019-BNK22 | No |
| A-2-4 | $37,931,034 | $37,931,034 | BANK 2019-BNK22 | No |
| A-2-5 | $14,593,966 | $14,593,966 | BANK 2019-BNK22 | No |
| A-2-6 | $6,262,500 | $6,262,500 | Goldman Sachs Bank USA | No |
| A-2-7 | $26,262,500 | $26,262,500 | Goldman Sachs Bank USA | No |
| Total (Senior Loan) | $382,000,000 | $382,000,000 | | |
| |
| Midtown Center Subordinate Companion Loan |
| B-1-1 | $64,350,000 | $64,350,000 | DCOT 2019-MTC | No |
| B-1-2 | $39,325,000 | $39,325,000 | DCOT 2019-MTC | No |
| B-1-3 | $39,325,000 | $39,325,000 | DCOT 2019-MTC | No |
| Total (Subordinate Companion Loan) | $143,000,000 | $143,000,000 | | |
| Total (Whole Loan) | $525,000,000 | $525,000,000 | | |
The Midtown Center Whole Loan is structured with an Anticipated Repayment Date of October 11, 2029 and a final maturity date of September 30, 2033. From and after the Anticipated Repayment Date, the Midtown Center Whole Loan accrues interest at a fixed rate that is equal to the greater of (a) 3.085% plus 2.50%; and (b) the mid-market swap rate with a maturity date with the closest approximation of September 30, 2033 plus 4.00% (the “Revised Interest Rate”). The Anticipated Repayment Date automatically triggers a Cash Trap Event Period (see “Lockbox and Cash Management” section) whereby all excess cash flow, after payments of debt service on the Midtown Center Whole Loan, required deposits to escrows and reserves and budgeted operating expenses, is required to be used to pay down the principal balance of the Midtown Center Whole Loan (with paydown priority given to the Midtown Center Senior Loan). Any interest due with respect to the Revised Interest Rate in excess of the Mortgage Rate will be deferred and is required to be paid on the final maturity date, after payment in full of the principal balance of the Midtown Center Whole Loan (to the extent not paid sooner by the Midtown Center Borrower). In the event of a Fannie Mae Termination Event (see the “Lockbox and Cash Management” section below) prior to or contemporaneously with the Anticipated Repayment Date, the final maturity date will be accelerated to the Anticipated Repayment Date.
The Borrower and Borrower Sponsor.The borrower is 1100 15th Street LLC, a Delaware limited liability company and single purpose entity with one independent director (the “Midtown Center Borrower”). Legal counsel to the borrower delivered a non-consolidation opinion in connection with the origination of the Midtown Center Mortgage Loan.
The borrower sponsor and nonrecourse carveout guarantor for the Midtown Center Whole Loan is Carr Properties OC LLC (“Carr Properties”). Carr Properties is a privately held real estate investment trust that owns, manages, acquires, and develops properties in Washington, D.C. and Boston, Massachusetts. The company currently owns a portfolio of 14 commercial office properties totaling approximately 3.8 million square feet and maintains a pipeline of five development projects that is expected to add a further 2.4 million square feet to its portfolio of properties.
THE INFORMATION IN THIS STRUCTURAL AND COLLATERAL TERM SHEET IS NOT COMPLETE AND MAY BE AMENDED PRIOR TO THE TIME OF SALE. THIS TERM SHEET IS NOT AN OFFER TO SELL THESE SECURITIES AND IT IS NOT A SOLICITATION OF AN OFFER TO BUY THESE SECURITIES IN ANY JURISDICTION WHERE THE OFFER OR SALE IS NOT PERMITTED.
29
| Office – CBD | Loan #3 | Cut-off Date Balance: | | $88,475,000 |
| 1100 15th Street, Northwest | Midtown Center | Cut-off Date LTV: | | 39.8% |
| Washington, D.C. 20005 | | U/W NCF DSCR: | | 3.97x |
| | | U/W NOI Debt Yield: | | 12.6% |
The Property.The Midtown Center Property comprises a 14-story, trophy class office building totaling 867,654 square feet and a three-level underground parking garage located at the southeast intersection of 15th Street Northwest and L Street Northwest within downtown Washington, D.C. Constructed in 2017, the Midtown Center Property is situated on a 2.2-acre parcel, features a glass and copper-clad façade and was designed to achieve LEED Certified Gold designation (but was not yet formally approved as of October 2019).
Designed by New York–based SHoP Architects, the improvements of the Midtown Center Property replaced the former headquarters building of The Washington Post, which the borrower sponsor demolished in 2016 after acquiring the site in 2014. The Midtown Center comprises two towers (the “East Tower” and the “West Tower”) that are connected by a series of three bridges. Amenities at the Midtown Center Property include a fitness center with a golf practice room, a 5,000 square foot rooftop terrace and a 1,000 square foot rooftop conference room, a bike room with bike repair station and electric car charging stations within the parking garage. The Midtown Center Property features a private alley, located between the retail plaza and the neighboring property, with over 10,000 square feet of outdoor space available for outdoor seating and programming. Per the zoning report, parking is not required at the Midtown Center Property, however, the Midtown Center Property contains an underground parking garage with 546 parking spaces, resulting in a parking ratio of approximately 0.6 spaces per 1,000 square feet of net rentable area.
As of August 31, 2019, the Midtown Center Property was 99.7% leased to nine tenants. Approximately 4.8% of the net rentable area and 3.8% of the underwritten base rent at the Midtown Center Property is attributed to seven ground floor and lower level retail tenants with frontage along 15th Street, including restaurants and a coffee shop.
Major Tenants.
Fannie Mae (713,500 square feet; 82.2% of net rentable area; 82.9% of underwritten base rent; 9/30/2033 lease expiration) – Fannie Mae (AAA/Aaa/AA+ by Fitch/Moody’s/S&P) signed a lease in 2015 to move their global headquarters to the Midtown Center Property. Fannie Mae, a government sponsored enterprise, provides housing finance for homebuyers, rentals and multifamily rental properties in the United States. Fannie Mae provides liquidity to the single-family market by purchasing and guaranteeing mortgage loans that are made by its lender customers and issuing debt securities that attract global investors to finance U.S. housing. Fannie Mae operates regional offices in Virginia, Texas, Georgia, Illinois, California, Pennsylvania, Maryland, Massachusetts and New York.
Fannie Mae occupies the entire West Tower and a portion of the East Tower (floors 6-14, a portion of floor 5, bridges and below grade space). Fannie Mae’s lease commenced in phases in November 2017 (“Phase One”; 43.7% of total Fannie Mae NRA) and May 2018 (“Phase Two”; 56.3% of total Fannie Mae NRA).
Contraction Option: Fannie Mae has the right to contract its leased premises by one full floor each lease year for the Phase Two premises (subject to the conditions below) on the 6th, 7th, 8th, and 9th anniversaries of the rent commencement date for the Phase Two premises (May 31, 2019), each with 18 months’ prior notice.
| ● | First contraction right to be exercised: Fannie Mae has the option to contract all of the space leased on the then lowest floor of East Tower. |
| ● | Second contraction right to be exercised: Fannie Mae has the option to contract all of the space leased on the then lowest floor of West Tower excluding the 3rd and 4th floors. |
| ● | Third contraction right to be exercised: Fannie Mae has the option to contract all of the space leased on the then lowest floor of (i) if Fannie Mae has expanded its premises, the East Tower or (ii) if the premises have not been expanded, the West Tower (excluding the 3rd and 4th Floors). |
| ● | Fourth contraction right to be exercised: Fannie Mae has the option to contract all of the space leased on the then lowest floor of (i) if the third contraction space was located in the East Tower, the West Tower (excluding the 3rd and 4th floors) or (ii) if the third contraction space was located in the West Tower, the East Tower. |
Fannie Mae is required to pay a contraction fee equal to the prorated portion (based on the proportion of the entire Fannie Mae demised premises) of (A) the tenant allowance actually expended, applied, or credited by the Midtown Center Borrower, (B) the brokerage commissions paid by the Midtown Center Borrower, (C) $2,800,000 for the Midtown Center Borrower’s base building obligations and tenant improvement items, (D) $8,000,000 for the Midtown Center Borrower’s base building work acceleration costs, and (E) $15,000,000 for the Midtown Center Borrower’s early termination of lease of the preexisting tenant (collectively, the “Required Fees”). The contraction fee is required to be amortized monthly, with six percent annual interest thereon, on a straight-line basis during the initial term of the Midtown Center Whole Loan (i.e., through the Anticipated Repayment Date).
Termination Option: Fannie Mae has the right to terminate its lease effective as of May 31, 2029, with 32 months’ prior notice. Fannie Mae is required to pay a termination fee of the unamortized portion of landlord’s lease costs as of the termination date (which such amount is $66,191,869 if Fannie Mae’s premises is neither expanded nor contracted as of the termination date). In addition, Fannie Mae exercising its termination option triggers a Cash Trap Event Period (see “Lockbox and Cash Management” section below).
Fannie Mae has the right to extend its lease for two periods of: (i) with respect to the first renewal, either (A) five years or (B) 10 years, and (ii) with respect to the second renewal, either (A) if the first renewal is five years, either (x) five years or (y) nine years and seven months or (B) if the first renewal is 10 years, four years and seven months, in any event, each with 30 months’ notice, at the fair market rental rate.
WeWork (109,943 square feet, 12.7% of net rentable area; 13.4% of underwritten base rent; November 30, 2036 lease expiration). WeWork Companies Inc. (rated CCC+/B- by Fitch/S&P) provides furnished and fully-serviced shared workspaces, primarily to small
THE INFORMATION IN THIS STRUCTURAL AND COLLATERAL TERM SHEET IS NOT COMPLETE AND MAY BE AMENDED PRIOR TO THE TIME OF SALE. THIS TERM SHEET IS NOT AN OFFER TO SELL THESE SECURITIES AND IT IS NOT A SOLICITATION OF AN OFFER TO BUY THESE SECURITIES IN ANY JURISDICTION WHERE THE OFFER OR SALE IS NOT PERMITTED.
30
| Office – CBD | Loan #3 | Cut-off Date Balance: | | $88,475,000 |
| 1100 15th Street, Northwest | Midtown Center | Cut-off Date LTV: | | 39.8% |
| Washington, D.C. 20005 | | U/W NCF DSCR: | | 3.97x |
| | | U/W NOI Debt Yield: | | 12.6% |
and midmarket enterprises. According to a third party report, WeWork currently leases approximately 10 million square feet of space across 280 locations in 86 cities, including cities in the United States, Israel, Mexico, China, France, South Korea, Australia, the United Kingdom, Hong Kong, Germany, and the Netherlands. The entity on the WeWork lease is 1100 15th Street NW Tenant LLC, and the lease is guaranteed by WeWork Companies Inc. The initial maximum aggregate liability of the lease guarantor is limited to 12 months of (i) monthly base rent, (ii) imputed gross up for tenant’s proportional share of operating expenses and real estate taxes equal to $25.00 per rentable square foot, and (iii) guaranty enforcement costs (collectively, the “Guaranteed Obligations”). As long as the tenant is not then in default under its lease beyond any applicable notice and cure periods, the lease guarantor’s cap on liability will be reduced to 10 months of the Guaranteed Obligations beginning in September 2024, eight months of the Guaranteed Obligations beginning September 2025, four months of the Guaranteed Obligations beginning in September 2026, three months of the Guaranteed Obligations beginning in September 2029, two months of the Guaranteed Obligations beginning in September 2031 and the lease guarantors liability will be reduced to $0 from September 2033 through the remainder of the lease term. WeWork’s lease at the Midtown Center Property commenced in September 2019 and has one, 5-year renewal option remaining, with 18 months’ notice, at the fair market rental rate following its November 2036 lease expiration. The borrower deposited into the Rent Concession Reserve $1,166,184 representing future rent credits and abatements (from October to December 2019) under the WeWork lease at the time of origination of the Midtown Center Whole Loan (see the “Escrows” section below for further information).
In the event the WeWork lease is terminated due to a lease default or bankruptcy, the Midtown Center Borrower will deliver WeWork’s 39,785 square foot space on the 4th floor of the West Tower (“4W Space”; 36.2% of the total WeWork NRA) to Fannie Mae, and Fannie Mae will be obligated to begin paying monthly rent on such space. Fannie Mae is required to pay the Midtown Center Borrower the proportional share of WeWork’s losses in the 4W Space (as a proportion of WeWork’s total 109,943 square foot space).
Other than Fannie Mae and WeWork, no tenant makes up more than 1.4% of net rentable area or 1.2% of underwritten base rent at the Midtown Center Property.
The following table presents certain information relating to the tenancy at the Midtown Center Property:
Major Tenant
| Tenant Name | Credit Rating (Fitch/
Moody’s/
S&P)(1) | Tenant
NRSF | % of
NRSF | Annual U/W
Base Rent
PSF | Annual
U/W Base
Rent | % of Total
Annual
U/W Base
Rent | Lease
Expiration
Date | Extension
Options | Termination
Option (Y/N) |
| Major Tenant | | | | | | | | |
| Fannie Mae | AAA/Aaa/AA+ | 713,500 | 82.2% | $49.83(2) | $35,552,358(2) | 82.9% | 9/30/2033 | Y(3) | Y(4) |
| WeWork | CCC+/NR/B-(5) | 109,943 | 12.7% | $52.19(6) | $5,737,623(6) | 13.4% | 11/30/2036 | 1, 5-year | N |
| Total Major Tenants | 823,443 | 94.9% | $50.14 | $41,289,981 | 96.2% | | | |
| | | | | | | | | |
| Non-Major Tenants(7) | 41,728 | 4.8% | $38.65 | $1,612,993 | 3.8% | | | |
| | | | | | | | | |
| Occupied Collateral Total | 865,171 | 99.7% | $49.59 | $42,902,974 | 100.0% | | | |
| | | | | | | | | |
| Vacant Space | 2,483 | 0.3% | | | | | | |
| | | | | | | | | |
| Collateral Total | 867,654 | 100.0% | | | | | | |
| | | | | | | | | | |
| (1) | Certain ratings are those of the parent entity whether or not the parent entity guarantees the lease. |
| (2) | The Annual U/W Base Rent and Annual U/W Base Rent PSF shown above represent Fannie Mae’s rental rate including its contractual rent step in December 2019. The lender’s underwriting gives separate credit for straight-line rent averaging through the remaining loan term to the Anticipated Repayment Date. The total implied underwritten rental rate for Fannie Mae, inclusive of the rent step and straight line credit, is approximately $55.21 per square foot. See “Underwritten Net Cash Flow” below. |
| (3) | See “The Property” section above for information pertaining to Fannie Mae’s extension options. |
| (4) | Fannie Mae has a contraction options and a termination option that are further detailed in “The Property” section above. |
| (5) | The entity on the WeWork lease is 1100 15th Street NW Tenant LLC, and the lease is guaranteed by WeWork Companies Inc. (which is the rated entity). The maximum aggregate liability of the lease guarantor is detailed in “The Property” section above. |
| (6) | The Annual U/W Base Rent and Annual U/W Base Rent PSF shown above represent WeWork’s rental rate including its contractual rent step in September 2020. The lender’s underwriting gives separate credit for straight-line rent averaging through the remaining loan term to the Anticipated Repayment Date for solely the 4W Space, which is implicitly guaranteed by Fannie Mae (see “The Property” section above). The total implied underwritten rental rate for WeWork, inclusive of the rent step and straight line credit for the 4W Space, is approximately $53.92 per square foot. See “Underwritten Net Cash Flow” below. $1,166,184 representing future rent credits and abatements under the WeWork lease were reserved for at the time of origination of the Midtown Center Whole Loan. |
| (7) | Non-Major Tenants include seven ground floor and lower level retail tenants. |
THE INFORMATION IN THIS STRUCTURAL AND COLLATERAL TERM SHEET IS NOT COMPLETE AND MAY BE AMENDED PRIOR TO THE TIME OF SALE. THIS TERM SHEET IS NOT AN OFFER TO SELL THESE SECURITIES AND IT IS NOT A SOLICITATION OF AN OFFER TO BUY THESE SECURITIES IN ANY JURISDICTION WHERE THE OFFER OR SALE IS NOT PERMITTED.
31
| Office – CBD | Loan #3 | Cut-off Date Balance: | | $88,475,000 |
| 1100 15th Street, Northwest | Midtown Center | Cut-off Date LTV: | | 39.8% |
| Washington, D.C. 20005 | | U/W NCF DSCR: | | 3.97x |
| | | U/W NOI Debt Yield: | | 12.6% |
The following table presents certain information relating to the lease rollover schedule at the Midtown Center Property:
Lease Expiration Schedule(1)(2)
Year Ending
December 31, | No. of
Leases
Expiring |
Expiring
NRSF | % of
Total
NRSF | Cumulative
Expiring
NRSF | Cumulative
% of
Total NRSF | Annual
U/W
Base Rent(3) | % of Total
Annual U/W
Base Rent | Annual
U/W
Base Rent
PSF(3) |
| MTM | 0 | 0 | 0.0% | 0 | 0.0% | $0 | 0.0% | $0.00 |
| 2019 | 0 | 0 | 0.0% | 0 | 0.0% | $0 | 0.0% | $0.00 |
| 2020 | 0 | 0 | 0.0% | 0 | 0.0% | $0 | 0.0% | $0.00 |
| 2021 | 0 | 0 | 0.0% | 0 | 0.0% | $0 | 0.0% | $0.00 |
| 2022 | 0 | 0 | 0.0% | 0 | 0.0% | $0 | 0.0% | $0.00 |
| 2023 | 0 | 0 | 0.0% | 0 | 0.0% | $0 | 0.0% | $0.00 |
| 2024 | 0 | 0 | 0.0% | 0 | 0.0% | $0 | 0.0% | $0.00 |
| 2025 | 0 | 0 | 0.0% | 0 | 0.0% | $0 | 0.0% | $0.00 |
| 2026 | 0 | 0 | 0.0% | 0 | 0.0% | $0 | 0.0% | $0.00 |
| 2027 | 0 | 0 | 0.0% | 0 | 0.0% | $0 | 0.0% | $0.00 |
| 2028 | 1 | 2,055 | 0.2% | 2,055 | 0.2% | $95,249 | 0.2% | $46.35 |
| 2029 | 6 | 21,432 | 2.5% | 23,487 | 2.7% | $762,963 | 1.8% | $35.60 |
| Thereafter | 14 | 841,684 | 97.0% | 865,171 | 99.7% | $42,044,762 | 98.0% | $49.95 |
| Vacant | 0 | 2,483 | 0.3% | 867,654 | 100.0% | $0 | 0.0% | $0.00 |
| Total/Weighted Average | 21 | 867,654 | 100.0% | | | $42,902,974 | 100.0% | $49.59 |
| (1) | Information obtained from the underwritten rent roll. |
| (2) | Certain tenants may have lease termination options that are exercisable prior to the originally stated expiration date of the subject lease and that are not considered in the Lease Expiration Schedule. |
| (3) | Total/Weighted Average Annual U/W Base Rent and Annual U/W Base Rent PSF exclude vacant space. |
The following table presents historical occupancy percentages at the Midtown Center Property:
Historical Occupancy
12/31/2015(1) | 12/31/2016(1) | 12/31/2017(1) | 12/31/2018(2) | 8/31/2019(3) |
| NAP | NAP | NAV | 89.8% | 99.7% |
| (1) | The Midtown Center Property was completed in 2017, and the majority of leases did not commence until May 2018 or thereafter. |
| (2) | Information obtained from a third party market research provider. |
| (3) | Information obtained from the underwritten rent roll. |
THE INFORMATION IN THIS STRUCTURAL AND COLLATERAL TERM SHEET IS NOT COMPLETE AND MAY BE AMENDED PRIOR TO THE TIME OF SALE. THIS TERM SHEET IS NOT AN OFFER TO SELL THESE SECURITIES AND IT IS NOT A SOLICITATION OF AN OFFER TO BUY THESE SECURITIES IN ANY JURISDICTION WHERE THE OFFER OR SALE IS NOT PERMITTED.
32
| Office – CBD | Loan #3 | Cut-off Date Balance: | | $88,475,000 |
| 1100 15th Street, Northwest | Midtown Center | Cut-off Date LTV: | | 39.8% |
| Washington, D.C. 20005 | | U/W NCF DSCR: | | 3.97x |
| | | U/W NOI Debt Yield: | | 12.6% |
Underwritten Net Cash Flow. The following table presents certain information relating to the underwritten net cash flow at the Midtown Center Property:
Cash Flow Analysis(1)
| | U/W | %(2) | U/W $ per SF |
| Base Rent | $41,996,504 | 60.5% | $48.40 |
| Rent Average Benefit(3) | 4,031,666 | 5.8 | 4.65 |
| Contractual Rent Step(4) | 906,470 | 1.3 | 1.04 |
| Grossed Up Vacant Space | 124,150 | 0.2 | 0.14 |
| Gross Potential Rent | $47,058,790 | 67.8% | $54.24 |
| Other Income | 1,980,000 | 2.9 | 2.28 |
| Total Recoveries | 20,408,599 | 29.4 | 23.52 |
| Net Rental Income | $69,447,389 | 100.0% | $80.04 |
| (Vacancy & Credit Loss) | (689,650) | (1.5)(5) | (0.79) |
| Effective Gross Income | $68,757,739 | 99.0% | $79.25 |
| | | | |
| Real Estate Taxes | 11,734,113 | 17.1 | 13.52 |
| Insurance | 189,402 | 0.3 | 0.22 |
| Management Fee | 1,000,000 | 1.5 | 1.15 |
| Other Operating Expenses | 7,801,610 | 11.3 | 8.99 |
| Total Operating Expenses | $20,725,125 | 30.1% | $23.89 |
| | | | |
| Net Operating Income | $48,032,614 | 69.9% | $55.36 |
| Replacement Reserves | 173,531 | 0.3 | 0.20 |
| TI/LC | 307,921 | 0.4 | 0.35 |
| Net Cash Flow | $47,551,162 | 69.2% | $54.80 |
| | | | |
| NOI DSCR(6) | 4.01x | | |
| NCF DSCR(6) | 3.97x | | |
| NOI Debt Yield(6) | 12.6% | | |
| NCF Debt Yield(6) | 12.4% | | |
| (1) | Historical operating statements were not obtained and were not considered relevant to the lender’s underwriting, as the majority of leases at the Midtown Center Property did not commence until May 2018 or thereafter. |
| (2) | Represents (i) percent of Net Rental Income for all revenue fields, (ii) percent of Gross Potential Rent for Vacancy & Credit Loss and (iii) percent of Effective Gross Income for all other fields. |
| (3) | Represents straight-line rent averaging for Fannie Mae and WeWork’s 4W Space through the loan term to the Anticipated Repayment Date (see “The Property” section above). |
| (4) | Represents contractual rent steps through September 2020. |
| (5) | The underwritten economic vacancy is 1.5%. The Midtown Center Property was 99.7% occupied as of August 31, 2019. |
| (6) | The debt service coverage ratios and debt yields are based on the Midtown Center Senior Loan. |
Appraisal.The appraiser concluded to an “as-is” Appraised Value for the Midtown Center Property of $960,000,000 as of August 23, 2019. The appraiser also concluded to a hypothetical market value “as dark” of $510,000,000 as of August 23, 2019.
Environmental Matters. According to the Phase I environmental site assessment dated September 9, 2019, there was no evidence of any recognized environmental conditions at the Midtown Center Property.
Market Overview and Competition.The Midtown Center Property is located at the intersection of 15th Street Northwest and L Street Northwest, within the downtown area of the Washington, D.C. CBD. The Midtown Center Property is situated approximately 2 blocks north of the McPherson Square Metro station (services the Orange (which provides access westbound to Arlington, VA and Fairlee, VA and eastbound to Landover, MD), Silver (which provides access northwest to Reston, VA) and Blue lines (which provides access southbound to Alexandria, VA and the Ronald Reagan Washington National Airport)), 3 blocks east of the Farragut North Metro station (services the Red line, providing access northwest to Bethesda, MA and northeast to Silver Spring, MD), 4 blocks northeast of Lafayette Square and the White House and 6 blocks north of the National Mall. Ronald Reagan Washington National Airport is situated approximately 3.8 miles southwest of the Midtown Center Property.
According to the appraisal, The World Bank is headquartered at 1818 H Street (approximately seven blocks southwest of the Midtown Center Property) and occupies space in several additional buildings nearby. The Department of Justice is headquartered at 950 Pennsylvania Avenue (approximately 1.1 miles southeast of the Midtown Center Property), and other government organizations include the Department of the Interior, which is headquartered at the corner of 18th and C Street and the International Monetary Fund, which
THE INFORMATION IN THIS STRUCTURAL AND COLLATERAL TERM SHEET IS NOT COMPLETE AND MAY BE AMENDED PRIOR TO THE TIME OF SALE. THIS TERM SHEET IS NOT AN OFFER TO SELL THESE SECURITIES AND IT IS NOT A SOLICITATION OF AN OFFER TO BUY THESE SECURITIES IN ANY JURISDICTION WHERE THE OFFER OR SALE IS NOT PERMITTED.
33
| Office – CBD | Loan #3 | Cut-off Date Balance: | | $88,475,000 |
| 1100 15th Street, Northwest | Midtown Center | Cut-off Date LTV: | | 39.8% |
| Washington, D.C. 20005 | | U/W NCF DSCR: | | 3.97x |
| | | U/W NOI Debt Yield: | | 12.6% |
is headquartered at the corner of G Street and 19th Street, each located approximately 1.0 and 0.8 miles southwest of the Midtown Center Property, respectively.
According to a third party market research provider, the estimated 2019 population within a three- and five-mile radius of the Midtown Center Property was approximately 413,747 and 819,282, respectively; and the estimated 2019 average household income within the same radii was approximately $125,586 and $119,630, respectively.
Submarket Information – According to the appraisal, the Midtown Center Property is situated within the East End submarket of the Washington Office Market. As of October 3, 2019, the East End submarket reported a total inventory of approximately 53.1 million square feet with a 14.4% vacancy rate and average asking rents of $57.34, gross. Within a three-mile radius of the Midtown Center Property, as of October 3, 2019, there were 2,256 office properties totaling approximately 165.0 million square feet with a 12.0% vacancy rate, per a third-party market research provider.
The following table presents certain information relating to the appraiser’s market rent conclusions for the Midtown Center Property:
Market Rent Summary(1)
| | Office | Office LL | Retail | LL/STO/MZ Ret |
| Market Rent (PSF) | $52.00-$60.00 | $37.50 | $50.00 | $20.00 |
| Lease Term (Years) | 15 | 10 | 10 | 10 |
| Lease Type (Reimbursements) | Net | Net | Net | Net |
| Rent Increase Projection | 2.5%per annum | 2.5%per annum | 3.0%per annum | 3.0%per annum |
| (1) | Information obtained from the appraisal. |
THE INFORMATION IN THIS STRUCTURAL AND COLLATERAL TERM SHEET IS NOT COMPLETE AND MAY BE AMENDED PRIOR TO THE TIME OF SALE. THIS TERM SHEET IS NOT AN OFFER TO SELL THESE SECURITIES AND IT IS NOT A SOLICITATION OF AN OFFER TO BUY THESE SECURITIES IN ANY JURISDICTION WHERE THE OFFER OR SALE IS NOT PERMITTED.
34
| Office – CBD | Loan #3 | Cut-off Date Balance: | | $88,475,000 |
| 1100 15th Street, Northwest | Midtown Center | Cut-off Date LTV: | | 39.8% |
| Washington, D.C. 20005 | | U/W NCF DSCR: | | 3.97x |
| | | U/W NOI Debt Yield: | | 12.6% |
The following table presents certain information relating to comparable office leases for the Midtown Center Property:
Comparable Leases(1)
Property
Name/Location | Year Built/ Renovated | Total GLA (SF) | Distance from Subject | Occupancy | Tenant | Tenant Size (SF) | Lease Start Date | Lease Term | Annual Base Rent PSF | Lease Type |
WeWork 1701 Rhode Island Avenue, NW Washington, D.C. | 2019/NAV | 101,848 | 0.4 miles | 100% | WeWork (Flrs. 1-8) | 101,848 | May-19 | 16.4 Yrs | $54.75 | NNN |
655 New York Avenue, NW Washington, D.C. | 2018/NAV | 752,987 | 0.8 miles | 84% | The Advisory Board Company | 532,754 | Dec-15 | 16.0 Yrs | $46.50 | NNN |
2000 K Street NW Washington, D.C. | 2017/NAV | 238,616 | 0.7 miles | 89% | Stradley Ronon Ankura Consulting Robbins Russell AECOM | 20,283 40,506 20,283 12,469 | May-21 Sep-19 Apr-19 Apr-19 | 10.5 Yrs 13.0 Yrs 11.0 Yrs 13.7 Yrs | $48.00 $58.00 $48.00 $51.00 | NNN NNN NNN NNN |
Alexander Court North 2000 L Street, NW Washington, D.C. | 1968/2018 | 388,672 | 1.3 miles | 89% | Cornerstone Research Bates & White Akin Gump | 40,000 62,296 182,994 | Jan-18 Jan-18 Jan-18 | 10.0 Yrs 12.0 Yrs 15.0 Yrs | $48.50 $50.00 $56.50 | NNN NNN NNN |
600
Massachusetts
Avenue, NW Washington, D.C. | 2016/NAV | 402,556 | 0.8 miles | 93% | Venable Lower Level Venable LLP Genentech Venable Expansion | 16,661 231,641 12,602 20,232 | Apr-17 Apr-17 Jan-17 Dec-16 | 17.3 Yrs 17.3 Yrs 10.9 Yrs 15.0 Yrs | $25.00 $52.50 $56.00 $52.00 | NNN NNN NNN NNN |
2112 Pennsylvania Avenue NW Washington, D.C. | 2018/NAV | 240,000 | 0.8 miles | 58% | Cleary Gottlieb | 119,000 | Jan-18 | 16.0 Yrs | $57.00 | NNN |
Capitol Crossing 200 Massachusetts Avenue, NW Washington, D.C. | 2018/NAV | 425,420 | 1.2 miles | 61% | American Petroleum Institute | 74,182 | Oct-17 | 12.1 Yrs | $46.00 | NNN |
Anthem Row 700 K Street NW Washington, D.C. | 2019/NAV | 338,320 | 0.8 miles | 88% | Baker Botts Apple | 103,000 29,004 | Jan-19 May-18 | 17.0 Yrs 11.0 Yrs | $52.00 $50.00 | NNN NNN |
| (1) | Information obtained from the appraisal. |
THE INFORMATION IN THIS STRUCTURAL AND COLLATERAL TERM SHEET IS NOT COMPLETE AND MAY BE AMENDED PRIOR TO THE TIME OF SALE. THIS TERM SHEET IS NOT AN OFFER TO SELL THESE SECURITIES AND IT IS NOT A SOLICITATION OF AN OFFER TO BUY THESE SECURITIES IN ANY JURISDICTION WHERE THE OFFER OR SALE IS NOT PERMITTED.
35
| Office – CBD | Loan #3 | Cut-off Date Balance: | | $88,475,000 |
| 1100 15th Street, Northwest | Midtown Center | Cut-off Date LTV: | | 39.8% |
| Washington, D.C. 20005 | | U/W NCF DSCR: | | 3.97x |
| | | U/W NOI Debt Yield: | | 12.6% |
The table below presents certain information relating to comparable sales pertaining to the Midtown Center Property identified by the appraiser:
Comparable Sales(1)
| Property Name | Location | Rentable
Area (SF) | Sale Date | Sale Price | Sale Price (PSF) |
| WeWork @ YMCA | Washington, D.C. | 101,848 | Jul-19 | $105,652,551 | $1,037.36 |
| The Presidential Building | Washington, D.C. | 335,329 | Nov-18 | $338,000,000 | $1,007.97 |
| 900 G Street, NW | Washington, D.C. | 112,635 | Jan-18 | $144,000,000 | $1,278.47 |
| 1440 New York Avenue | Washington, D.C. | 214,093 | Jan-18 | $254,500,000 | $1,188.74 |
| 900 16th Street, NW | Washington, D.C. | 122,362 | Jun-17 | $151,000,000 | $1,234.04 |
| (1) | Information obtained from the appraisal. |
Escrows.
Real Estate Taxes – Upon the occurrence and continuance of a Cash Trap Event Period (see “Lockbox and Cash Management” section), the Midtown Center Whole Loan documents require ongoing monthly real estate tax reserves in an amount equal to one-twelfth of the real estate taxes that the lender estimates will be payable during the next 12 months.
Insurance – Upon the occurrence and continuance of a Cash Trap Event Period, the Midtown Center Whole Loan documents require ongoing monthly insurance reserves in an amount equal to one-twelfth of the insurance premiums that the lender estimates will be payable for the renewal of the coverage during the next 12 months; provided, however, the Midtown Center Whole Loan documents do not require ongoing monthly escrows for insurance premiums as long as (i) no event of default has occurred and is continuing, (ii) the Midtown Center Borrower (or borrower affiliate) provides the lender with evidence that the Midtown Center Property’s insurance coverage is included in a blanket policy and such policy is in full force and effect and (iii) the Midtown Center Borrower pays all applicable insurance premiums and provides the lender with evidence of timely payment of insurance premiums/renewals at least 10 days prior to the policy expiration date.
Replacement Reserve – Upon the occurrence and continuance of a Cash Trap Event Period, the Midtown Center Whole Loan documents require ongoing monthly replacement reserves of $18,076, subject to a cap of $433,827.
Leasing Reserve – Upon the occurrence and continuance of a Cash Trap Event Period, the Midtown Center Whole Loan documents require ongoing monthly leasing reserves of $72,305, subject to a cap of $1,735,308.
Rent Concession Reserve – The Midtown Center Whole Loan documents require an upfront reserve of $1,166,184 for future rent credits and abatements under the WeWork lease.
Existing TI/LC Obligations Reserve – The Midtown Center Whole Loan documents require an upfront reserve of $31,164,159 for outstanding TI/LCs related to eight tenants at the Midtown Center Property, including $20,279,846 related to WeWork tenant improvements.
Lockbox and Cash Management. The Midtown Center Whole Loan documents require that the Midtown Center Borrower establish and maintain a lender-controlled lockbox account, which is already in-place, and that the Midtown Center Borrower direct all tenants to pay rent directly into such lockbox account. The Midtown Center Whole Loan documents also require that all rents received by the Midtown Center Borrower be deposited into the lockbox account within three business days of receipt. Prior to the occurrence of a Cash Trap Event Period (as defined below), all funds on deposit in the lockbox account will be disbursed to the Midtown Center Borrower. During a Cash Trap Event Period, all funds in the lockbox account are required to be swept each business day into the cash management account controlled by the lender and, on each payment date, all funds in the cash management account are required to be applied in accordance with the Midtown Center Whole Loan documents. During a Cash Trap Event Period, any excess cash flow remaining after satisfaction of the waterfall items is required to be swept to an excess cash flow subaccount to be held by the lender as additional security for the Midtown Center Whole Loan.
A “Cash Trap Event Period” will commence upon the earlier of the following:
| (i) | the occurrence and continuance of an event of default under the Midtown Center Whole Loan documents; |
| (ii) | the net operating income debt yield (“NOI DY”) for the Midtown Center Whole Loan (including the Midtown Center Subordinate Companion Loan) falling below 6.0% at the end of any calendar quarter; |
| (iii) | the occurrence of a Fannie Mae Termination Event (as defined below); or |
| (iv) | the Anticipated Repayment Date (see “The Mortgage Loan” section above for additional information). |
A Cash Trap Event Period will end upon the occurrence of the following:
| ● | with regard to clause (i) above, the cure of such event of default; |
| ● | with regard to clause (ii) above, the NOI DY for the Midtown Center Whole Loan being at least 6.0% for one quarter; or |
| ● | with regard to clause (iii), a Fannie Mae Sweep Cure (as defined below). |
THE INFORMATION IN THIS STRUCTURAL AND COLLATERAL TERM SHEET IS NOT COMPLETE AND MAY BE AMENDED PRIOR TO THE TIME OF SALE. THIS TERM SHEET IS NOT AN OFFER TO SELL THESE SECURITIES AND IT IS NOT A SOLICITATION OF AN OFFER TO BUY THESE SECURITIES IN ANY JURISDICTION WHERE THE OFFER OR SALE IS NOT PERMITTED.
36
| Office – CBD | Loan #3 | Cut-off Date Balance: | | $88,475,000 |
| 1100 15th Street, Northwest | Midtown Center | Cut-off Date LTV: | | 39.8% |
| Washington, D.C. 20005 | | U/W NCF DSCR: | | 3.97x |
| | | U/W NOI Debt Yield: | | 12.6% |
A Cash Trap Event Period which is caused by (or continues to exist because of) the occurrence of the Anticipated Repayment Date (clause iv above) is not capable of being cured.
A “Fannie Mae Termination Event” will commence upon the earliest to occur of the following:
| (i) | Fannie Mae exercising its right to fully terminate its lease pursuant to its termination option (as discussed in “The Property” section above); |
| (ii) | Fannie Mae ceasing operations in at least 50% of the rentable area of its space (with any approved sublease being calculated as occupied); |
| (iii) | Fannie Mae otherwise terminating its lease (including, without limitation, rejection in any bankruptcy or similar insolvency proceeding); |
| (iv) | any bankruptcy or similar insolvency of Fannie Mae; or |
| (v) | Fannie Mae being in monetary default under its lease beyond applicable notice and cure periods. |
A “Fannie Mae Sweep Cure” will occur upon:
| ● | with regard to clause (i) through (v), the total amount of funds deposited into the excess cash flow subaccount being at least $49,945,000; |
| ● | solely with regard to clause (ii), an amount equal to the product of (A) $70 and (B) the square footage of the Fannie Mae space in which Fannie Mae ceased operations having been deposited into the excess cash flow subaccount; or |
| ● | solely with regard to clause (v), Fannie Mae having cured the applicable monetary default; |
Property Management. The Midtown Center Property is managed by an affiliate of the Midtown Center Borrower.
Partial Release. Not permitted.
Real Estate Substitution.Not permitted.
Subordinate and Mezzanine Indebtedness.The Midtown Center Property also secures the Midtown CenterPari PassuCompanion Loans, which have an aggregate Cut-off Date principal balance of $293,525,000 and the Midtown Center Subordinate Companion Loans, which have an aggregate Cut-off Date principal balance of $143,000,000. The Midtown CenterPari PassuCompanion Loans and the Midtown Center Subordinate Companion Loan are coterminous with the Midtown Center Mortgage Loan. The Midtown CenterPari PassuCompanion Loans and the Midtown Center Subordinate Companion Loan accrue interest at the same rate as the Midtown Center Mortgage Loan. The Midtown Center Mortgage Loan and the Midtown CenterPari PassuCompanion Loans are eachpari passuin right of payment and together are senior in right of payment to the Midtown Center Subordinate Companion Loan. The holders of the Midtown Center Mortgage Loan, the Midtown CenterPari PassuCompanion Loans and the Midtown Center Subordinate Companion Loan have entered into a co-lender agreement which sets forth the allocation of collections on the Midtown Center Whole Loan. See “Description of the Mortgage Pool—The Whole Loans—The Non-Serviced AB Whole Loan—The Midtown Center Whole Loan” in the Preliminary Prospectus.
The following table presents certain information relating to the Midtown Center Subordinate Companion Loan:
B-Note Summary
| | B-Note Original
Principal
Balance | B-Note
Interest Rate | Original
Term
(mos.) | Original
Amort.
Term (mos.) | Original IO
Term
(mos.) | Total Debt
UW
NCF DSCR | Total Debt
UW
NOI Debt
Yield | Total Debt
Cutoff
Date LTV |
| Midtown Center Subordinate Companion Loan | $143,000,000 | 3.0850% | 120 | 0 | 120 | 2.89x | 9.1% | 54.7% |
| | | | | | | | | | |
Ground Lease. None.
Terrorism Insurance. The Midtown Center Whole Loan documents require that the “all risk” insurance policy required to be maintained by the Midtown Center Borrower provides coverage for terrorism in an amount equal to the full replacement cost of the Midtown Center Property, as well as business interruption insurance covering no less than the 24-month period following the occurrence of a casualty event, together with a 6-month extended period of indemnity (provided that if TRIPRA or a similar statute is not in effect, the Midtown Center Borrower will not be obligated to pay terrorism insurance premiums in excess of two times the premium for the casualty and business interruption coverage on a stand-alone basis).
THE INFORMATION IN THIS STRUCTURAL AND COLLATERAL TERM SHEET IS NOT COMPLETE AND MAY BE AMENDED PRIOR TO THE TIME OF SALE. THIS TERM SHEET IS NOT AN OFFER TO SELL THESE SECURITIES AND IT IS NOT A SOLICITATION OF AN OFFER TO BUY THESE SECURITIES IN ANY JURISDICTION WHERE THE OFFER OR SALE IS NOT PERMITTED.
37
| Self Storage – Self Storage | Loan #4 | Cut-off Date Balance: | | $83,600,000 |
| Various Locations (IL, FL) | Metro 14 Self Storage Portfolio | Cut-off Date LTV: | | 55.4% |
| | | U/W NCF DSCR: | | 3.10x |
| | | U/W NOI Debt Yield: | | 10.2% |

THE INFORMATION IN THIS STRUCTURAL AND COLLATERAL TERM SHEET IS NOT COMPLETE AND MAY BE AMENDED PRIOR TO THE TIME OF SALE. THIS TERM SHEET IS NOT AN OFFER TO SELL THESE SECURITIES AND IT IS NOT A SOLICITATION OF AN OFFER TO BUY THESE SECURITIES IN ANY JURISDICTION WHERE THE OFFER OR SALE IS NOT PERMITTED.
38
| No. 4 – Metro 14 Self Storage Portfolio |
| |
| Mortgage Loan Information | | Mortgaged Property Information |
| Mortgage Loan Seller: | Wells Fargo Bank, National Association | | Single Asset/Portfolio: | Portfolio |
Credit Assessment (DBRS/Fitch/S&P): | NR/NR/NR | | Property Type – Subtype: | Self Storage – Self Storage |
| Original Principal Balance: | $83,600,000 | | Location: | Various |
| Cut-off Date Balance: | $83,600,000 | | Size: | 939,242 SF |
| % of Initial Pool Balance: | 6.9% | | Cut-off Date Balance Per SF: | $89.01 |
| Loan Purpose: | Refinance | | Maturity Date Balance Per SF: | $89.01 |
| Borrower Sponsors: | Matthew M. Nagel; K. Blair Nagel | | Year Built/Renovated: | Various |
| Guarantors: | Matthew M. Nagel; K. Blair Nagel | | Title Vesting: | Fee |
| Mortgage Rate: | 3.1900% | | Property Manager: | Self-managed |
| Note Date: | September 4, 2019 | | Current Occupancy (As of): | 91.0% (7/31/2019) |
| Seasoning: | 2 months | | 2018 Occupancy(2): | 90.3% |
| Maturity Date: | September 11, 2029 | | 2017 Occupancy(2): | 92.6% |
| IO Period: | 120 months | | 2016 Occupancy(2): | 92.8% |
| Loan Term (Original): | 120 months | | 2015 Occupancy(2): | 90.0% |
| Amortization Term (Original): | NAP | | As-Is Appraised Value(3): | $151,000,000 |
| Loan Amortization Type: | Interest-only, Balloon | | As-Is Appraised Value Per SF(3): | $160.77 |
| Call Protection: | L(26),D(89),O(5) | | As-Is Appraisal Valuation Date: | August 1, 2019 |
| Lockbox Type: | Springing | | Underwriting and Financial Information |
| Additional Debt: | None | | TTM NOI (8/31/2019): | $8,138,876 |
| Additional Debt Type (Balance): | NAP | | YE 2018 NOI: | $8,438,616 |
| | | | YE 2017 NOI: | $8,710,982 |
| | | | YE 2016 NOI: | $8,357,129 |
| | | | U/W Revenues: | $13,730,052 |
| | | | U/W Expenses: | $5,180,700 |
| Escrows and Reserves(1) | | U/W NOI: | $8,549,353 |
| | Initial | Monthly | Cap | | U/W NCF: | $8,408,466 |
| | | | | | U/W DSCR based on NOI/NCF: | 3.15x / 3.10x |
| Taxes | $684,910 | $143,113 | NAP | | U/W Debt Yield based on NOI/NCF: | 10.2% / 10.1% |
| Insurance | $0 | Springing | NAP | | U/W Debt Yield at Maturity based on
NOI/NCF: | 10.2% / 10.1% |
| | | | | | Cut-off Date LTV Ratio(3): | 55.4% |
| Replacement Reserves | $0 | $7,826 | $187,834 | | LTV Ratio at Maturity(3): | 55.4% |
| | | | | | | |
| | | | | | | |
| | | | | | | | |
| Sources and Uses |
| Sources | | | | | Uses | | | |
| Original loan amount | $83,600,000 | | 100.0% | | Loan payoff(4) | $73,482,942 | | 87.9% |
| | | | | | Upfront reserves | 684,910 | | 0.8 |
| | | | | | Closing costs | 1,029,250 | | 1.2 |
| | | | | | Return of equity | 8,402,897 | | 10.1 |
| Total Sources | $83,600,000 | | 100.0% | | Total Uses | $83,600,000 | | 100.0% |
| (1) | See “Escrows” section below. |
| (2) | Represents the average occupancy rate over the course of each year. |
| (3) | The individual property level appraised values total $136,600,000, which would equate to a Cut-off Date LTV Ratio and LTV Ratio at Maturity of 61.2% and 61.2%, respectively; however, the appraiser concluded to a portfolio value of $151,000,000 based on the assumption that the individual properties would be sold as part of a multi-property portfolio. |
| (4) | The Metro 14 Self Storage Portfolio Properties were previously securitized in the COMM 2013-CR11 securitization trust. The loan payoff amount shown includes approximately $8.4 million of defeasance fees related to the prior CMBS loan. |
The Mortgage Loan. The mortgage loan (the “Metro 14 Self Storage Portfolio Mortgage Loan”) is evidenced by a single promissory note secured by a first mortgage encumbering the fee interest in 14 self storage properties in Florida and Illinois (the “Metro 14 Self Storage Portfolio Properties”).
The Borrowers and Borrower Sponsors.The borrower comprises eight entities, each a Delaware limited liability company and single purpose entity with one independent director (collectively, the “Metro 14 Self Storage Portfolio Borrower”). Legal counsel to the Metro 14 Self Storage Portfolio Borrower delivered a non-consolidation opinion in connection with the origination of the Metro 14 Self Storage Portfolio Mortgage Loan. The non-recourse carve-out guarantors and borrower sponsors of the Metro 14 Self Storage Portfolio Mortgage Loan are Matthew M. Nagel and K. Blair Nagel.
THE INFORMATION IN THIS STRUCTURAL AND COLLATERAL TERM SHEET IS NOT COMPLETE AND MAY BE AMENDED PRIOR TO THE TIME OF SALE. THIS TERM SHEET IS NOT AN OFFER TO SELL THESE SECURITIES AND IT IS NOT A SOLICITATION OF AN OFFER TO BUY THESE SECURITIES IN ANY JURISDICTION WHERE THE OFFER OR SALE IS NOT PERMITTED.
39
| Self Storage – Self Storage | Loan #4 | Cut-off Date Balance: | | $83,600,000 |
| Various Locations (IL, FL) | Metro 14 Self Storage Portfolio | Cut-off Date LTV: | | 55.4% |
| | | U/W NCF DSCR: | | 3.10x |
| | | U/W NOI Debt Yield: | | 10.2% |
Matthew M. Nagel and K. Blair Nagel serve as the Chairman and Chief Executive Officer, respectively, of Metro Storage LLC (“Metro Storage”), which they also co-own. Established in 1973 and based in the Chicago area, Metro Storage is the 5th largest privately-held self storage company in the United States, currently owning or operating over 125 properties across 14 states totaling approximately 6.5 million square feet. Since joining the company in 1985, Matthew M. Nagel has also served as Director of Acquisitions, Chief Financial Officer, President and Chief Executive Officer, and has been involved in hundreds of self storage properties representing over a billion dollars’ worth of financings, developments, acquisitions, dispositions and management transactions. K. Blair Nagel has served on various industry boards, including the Board of Governors of the Self Storage Association Foundation, National Board Member of the Self Storage Association (“SSA”) and President and former Secretary of the SSA’s Central Region.
The Properties.The Metro 14 Self Storage Portfolio Properties comprise 14 self storage properties located in Florida (12 properties) and Illinois (2 properties) totaling 939,242 square feet of rentable area, including 8,721 traditional self storage units and 305 RV storage spaces. All of the Metro 14 Self Storage Portfolio Properties are operated under the Metro Self Storage brand. Approximately 62.2% of the traditional self storage units at the Metro 14 Self Storage Portfolio Properties are climate controlled with individual properties ranging from 24.9% to 99.4%. Built between 1979 and 2011, each of the Metro 14 Self Storage Portfolio Properties is situated on a site ranging in size from 0.8 acres to 7.6 acres. As of July 31, 2019 the Metro 14 Self Storage Portfolio Properties were 91.0% occupied with individual property occupancy rates ranging from 84.8% to 94.9%. Since 2014, the Metro 14 Self Storage Portfolio Properties have averaged 90.5% occupancy, never dropping below 83.5% in the aggregate.
The following table presents certain information relating to the Metro 14 Self Storage Portfolio Properties:
| Property Name – Location | Allocated
Cut-off Date
Balance | % of
ALA | Appraised
Value(1) | Allocated
LTV | UW NCF | % UW
NCF |
| N Desplaines – Chicago, IL | $14,550,000 | 17.4% | $22,750,000 | 64.0% | $1,165,546 | 13.9% |
| N Kirk Road – Batavia, IL | $6,600,000 | 7.9% | $10,550,000 | 62.6% | $652,725 | 7.8% |
| St. Road 54 (WC) – Wesley Chapel, FL | $6,450,000 | 7.7% | $12,000,000 | 53.8% | $733,871 | 8.7% |
| Starkey Road – Largo, FL | $6,200,000 | 7.4% | $9,900,000 | 62.6% | $667,910 | 7.9% |
| S Belcher Road – Seminole, FL | $5,900,000 | 7.1% | $9,000,000 | 65.6% | $637,611 | 7.6% |
| W Fletcher Avenue – Tampa, FL | $5,825,000 | 7.0% | $9,300,000 | 62.6% | $563,898 | 6.7% |
| Gunn Highway – Tampa, FL | $5,800,000 | 6.9% | $8,900,000 | 65.2% | $584,556 | 7.0% |
| W MLK – Tampa, FL | $5,700,000 | 6.8% | $9,200,000 | 62.0% | $589,416 | 7.0% |
| E Fletcher Ave – Tampa, FL | $5,500,000 | 6.6% | $8,300,000 | 66.3% | $490,078 | 5.8% |
| Bruce B. Downs – Tampa, FL | $4,900,000 | 5.9% | $8,700,000 | 56.3% | $485,078 | 5.8% |
| St. Road 54 (Lutz) – Lutz, FL | $4,900,000 | 5.9% | $9,000,000 | 54.4% | $558,461 | 6.6% |
| Barclay Road – Spring Hill, FL | $4,575,000 | 5.5% | $7,000,000 | 65.4% | $505,031 | 6.0% |
| Boyette Road – Riverview, FL | $3,700,000 | 4.4% | $6,500,000 | 56.9% | $392,162 | 4.7% |
| Robin Road – Lakeland, FL | $3,000,000 | 3.6% | $5,500,000 | 54.5% | $382,122 | 4.5% |
| Total/Weighted Average | $83,600,000 | 100.0% | $151,000,000(1) | 55.4%(1) | $8,408,466 | 100.0% |
| (1) | The individual property level appraised values total $136,600,000, which would equate to a Cut-off Date LTV Ratio and LTV Ratio at Maturity of 61.2% and 61.2%, respectively; however, the appraiser concluded to a portfolio value of $151,000,000 based on the assumption that the individual properties would be sold as part of a multi-property portfolio. |
THE INFORMATION IN THIS STRUCTURAL AND COLLATERAL TERM SHEET IS NOT COMPLETE AND MAY BE AMENDED PRIOR TO THE TIME OF SALE. THIS TERM SHEET IS NOT AN OFFER TO SELL THESE SECURITIES AND IT IS NOT A SOLICITATION OF AN OFFER TO BUY THESE SECURITIES IN ANY JURISDICTION WHERE THE OFFER OR SALE IS NOT PERMITTED.
40
| Self Storage – Self Storage | Loan #4 | Cut-off Date Balance: | | $83,600,000 |
| Various Locations (IL, FL) | Metro 14 Self Storage Portfolio | Cut-off Date LTV: | | 55.4% |
| | | U/W NCF DSCR: | | 3.10x |
| | | U/W NOI Debt Yield: | | 10.2% |
The following table presents information with respect to the unit mix of the Metro 14 Self Storage Portfolio Properties:
| Property Name – Location | Year Built/ Renovated | Net
Rentable
Area (SF)(1) | % GLA | Self Storage
Units | % Climate
Controlled | RV Parking
Units | Current
Occupancy
(7/31/2019) |
| N Desplaines – Chicago, IL | 2004/NAP | 99,250 | 10.6% | 1,115 | 99.4% | 7 | 94.1% |
| N Kirk Road – Batavia, IL | 1988/2001 | 87,050 | 9.3% | 743 | 63.8% | 0 | 92.2% |
| St. Road 54 (WC) – Wesley Chapel, FL | 2000/NAP | 76,095 | 8.1% | 659 | 67.8% | 0 | 89.0% |
| Starkey Road – Largo, FL | 1979/NAP | 75,672 | 8.1% | 785 | 40.5% | 45 | 84.8% |
| S Belcher Road – Seminole, FL | 2001/NAP | 70,730 | 7.5% | 659 | 82.5% | 0 | 90.9% |
| W Fletcher Avenue – Tampa, FL | 2003/NAP | 63,348 | 6.7% | 586 | 39.9% | 16 | 94.0% |
| Gunn Highway – Tampa, FL | 2001/NAP | 71,800 | 7.6% | 696 | 58.0% | 0 | 90.1% |
| W MLK – Tampa, FL | 2000/NAP | 59,235 | 6.3% | 509 | 58.6% | 22 | 91.4% |
| E Fletcher Ave – Tampa, FL | 2011/NAP | 72,362 | 7.7% | 669 | 61.2% | 44 | 91.5% |
| Bruce B. Downs – Tampa, FL | 2006/NAP | 56,295 | 6.0% | 423 | 91.0% | 20 | 91.2% |
| St. Road 54 (Lutz) – Lutz, FL | 2001/NAP | 59,350 | 6.3% | 602 | 44.1% | 8 | 87.4% |
| Barclay Road – Spring Hill, FL | 2004/NAP | 54,400 | 5.8% | 390 | 26.7% | 64 | 93.8% |
| Boyette Road – Riverview, FL | 2002/NAP | 46,275 | 4.9% | 435 | 24.9% | 58 | 89.7% |
| Robin Road – Lakeland, FL | 2005/NAP | 47,380 | 5.0% | 450 | 84.7% | 21 | 94.9% |
| Total/Weighted Average | | 939,242 | 100.0% | 8,721 | 62.2% | 305 | 91.0% |
The following table presents historical occupancy percentages at the Metro 14 Self Storage Portfolio Properties:
Historical Occupancy
2015(1)(2) | 2016(1)(2) | 2017(1)(2) | 2018(1)(2) | 7/31/2019(3) |
| 90.0% | 92.8% | 92.6% | 90.3% | 91.0% |
| (1) | Information obtained from the borrower. |
| (2) | Represents the average occupancy rate over the course of each year. |
| (3) | Information obtained from the underwritten rent roll. |
THE INFORMATION IN THIS STRUCTURAL AND COLLATERAL TERM SHEET IS NOT COMPLETE AND MAY BE AMENDED PRIOR TO THE TIME OF SALE. THIS TERM SHEET IS NOT AN OFFER TO SELL THESE SECURITIES AND IT IS NOT A SOLICITATION OF AN OFFER TO BUY THESE SECURITIES IN ANY JURISDICTION WHERE THE OFFER OR SALE IS NOT PERMITTED.
41
| Self Storage – Self Storage | Loan #4 | Cut-off Date Balance: | | $83,600,000 |
| Various Locations (IL, FL) | Metro 14 Self Storage Portfolio | Cut-off Date LTV: | | 55.4% |
| | | U/W NCF DSCR: | | 3.10x |
| | | U/W NOI Debt Yield: | | 10.2% |
Operating History and Underwritten Net Cash Flow. The following table presents certain information relating to the historical operating performance and underwritten net cash flow at the Metro 14 Self Storage Portfolio Properties:
Cash Flow Analysis
| | 2016 | 2017 | 2018 | TTM
8/31/2019 | U/W | %(1) | U/W $
per SF |
| Base Rent | $12,277,982 | $12,955,295 | $13,104,535 | $12,911,113 | $13,747,608 | 85.8% | $14.64 |
| Grossed Up Vacant Space | 0 | 0 | 0 | 0 | 1,459,020 | 9.1 | 1.55 |
| Gross Potential Rent | $12,277,982 | $12,955,295 | $13,104,535 | $12,911,113 | $15,206,628 | 94.9% | $16.19 |
| Other Income | 939,606 | 910,277 | 838,845 | 820,423 | 820,423 | 5.1 | 0.87 |
| Net Rental Income | $13,217,588 | $13,865,571 | $13,943,380 | $13,731,536 | $16,027,051 | 100.0% | $17.06 |
| (Vacancy) | 0 | 0 | 0 | 0 | (1,516,395) | (10.0) | (1.61) |
| (Concessions & Credit Loss) | 0 | 0 | 0 | 0 | (780,603) | (5.1) | (0.83) |
| Effective Gross Income | $13,217,588 | $13,865,571 | $13,943,380 | $13,731,536 | $13,730,052 | 85.7% | $14.62 |
| | | | | | | | |
| Real Estate Taxes | 1,360,792 | 1,492,313 | 1,712,027 | 1,796,242 | 1,796,242 | 13.1 | 1.91 |
| Insurance | 193,061 | 256,998 | 282,525 | 297,925 | 297,925 | 2.2 | 0.32 |
| Management Fee | 797,596 | 834,216 | 836,634 | 823,862 | 411,902 | 3.0 | 0.44 |
| Other Operating Expenses | 2,509,009 | 2,571,063 | 2,673,578 | 2,674,631 | 2,674,631 | 19.5 | 2.85 |
| Total Operating Expenses | $4,860,458 | $5,154,590 | $5,504,764 | $5,592,660 | $5,180,700 | 37.7% | $5.52 |
| | | | | | | | |
| Net Operating Income | $8,357,129 | $8,710,982 | $8,438,616 | $8,138,876 | $8,549,353 | 62.3% | $9.10 |
| Replacement Reserves | 0 | 0 | 0 | 0 | 140,886 | 1.0 | 0.15 |
| Net Cash Flow | $8,357,129 | $8,710,982 | $8,438,616 | $8,138,876 | $8,408,466 | 61.2% | $8.95 |
| | | | | | | | |
| NOI DSCR | 3.08x | 3.21x | 3.11x | 3.00x | 3.15x | | |
| NCF DSCR | 3.08x | 3.21x | 3.11x | 3.00x | 3.10x | | |
| NOI Debt Yield | 10.0% | 10.4% | 10.1% | 9.7% | 10.2% | | |
| NCF Debt Yield | 10.0% | 10.4% | 10.1% | 9.7% | 10.1% | | |
| (1) | Represents (i) percent of Net Rental Income for all revenue fields, (ii) percent of Gross Potential Rent for Vacancy and Concessions & Credit Loss and (iii) percent of Effective Gross Income for all other fields. |
| (2) | The underwritten economic vacancy is 10.0%. The Metro 14 Self Storage Portfolio Properties were 91.0% physically occupied as of July 31, 2019. |
Appraisals.The appraiser concluded to an “as-is” appraised value for the Metro 14 Self Storage Portfolio Properties of $151,000,000 as of August 1, 2019, based on the assumption that the individual properties would be sold as a multi-property portfolio. The sum of the individual “as-is” appraised values for each of the Metro 14 Self Storage Portfolio Properties equates to $136,600,000, as of July 23, 2019 to July 26, 2019.
Environmental Matters. Based on Phase I environmental site assessments dated from August 6, 2019 to August 13, 2019, there is no evidence of any recognized environmental conditions at 13 of the Metro 14 Self Storage Portfolio Properties.
With respect to the Starkey Road (Largo, Florida), W Fletcher Avenue (Tampa, Florida) and Bruce B. Downs (Tampa, Florida) properties, the lender obtained an environmental insurance policy with a $3,000,000 limit and 13-year term. With respect to certain environmental conditions at these three properties, the lender obtained opinion of probable cost letters for a reasonable worst-case scenario with an aggregate cost estimate of $436,000, with a noted 90% confidence level in the cost estimate.
Based on a Phase I environmental site assessment performed for the Starkey Road (Largo, Florida) property, dated August 12, 2019, two adjoining underground storage tanks (“USTs”) were identified as a recognized environmental condition due to an ongoing release from the tanks. The releases are currently awaiting funding for cleanup, and the consultant recommended a file review be completed to determine the risks to the subject site. The lender obtained an opinion of probable cost from an environmental consultant of $57,000, with a 90% confidence.
Based on a Phase I environmental site assessment performed for the W Fletcher Avenue (Tampa, Florida) property, dated August 13, 2019, there is no evidence of any recognized environmental conditions; however, the site was previously improved with several small commercial structures including automotive repair and body work facilities from the late 1960s to the 1990s. A Phase II environmental site assessment was recommended; however, the aforementioned environmental insurance policy was obtained in lieu of performing such additional testing. While the site has been redeveloped, there does not appear to have been any investigation into whether these historical operations have impacted the property.
Based on a Phase I environmental site assessment performed for the Bruce B. Downs (Tampa, Florida) property, dated August 13, 2019, there is no evidence of any recognized environmental conditions; however, a 2013 Phase I assessment for the property identified lead in drinking water from the manager’s residence. Based on the known elevated levels found in 2013, further testing of the drinking water in the manager’s residence was recommended.
THE INFORMATION IN THIS STRUCTURAL AND COLLATERAL TERM SHEET IS NOT COMPLETE AND MAY BE AMENDED PRIOR TO THE TIME OF SALE. THIS TERM SHEET IS NOT AN OFFER TO SELL THESE SECURITIES AND IT IS NOT A SOLICITATION OF AN OFFER TO BUY THESE SECURITIES IN ANY JURISDICTION WHERE THE OFFER OR SALE IS NOT PERMITTED.
42
| Self Storage – Self Storage | Loan #4 | Cut-off Date Balance: | | $83,600,000 |
| Various Locations (IL, FL) | Metro 14 Self Storage Portfolio | Cut-off Date LTV: | | 55.4% |
| | | U/W NCF DSCR: | | 3.10x |
| | | U/W NOI Debt Yield: | | 10.2% |
Market Overview and Competition.The Metro 14 Self Storage Portfolio Properties are located within the MSAs of Tampa, Florida (12 properties, 74.7% of ALA) and Chicago, Illinois (2 properties, 25.3% of ALA).
The following table presents certain local demographic data related to the Metro 14 Self Storage Portfolio Properties:
| Property Name – Location | 2018 Population
(within 1-mi. / 3-mi. / 5-mi. Radius) | 2018 Average Household Income
(within 1-mi. / 3-mi. / 5-mi. Radius) |
| N Desplaines – Chicago, IL(1) | 15,478 / 58,850 / 223,186 | $166,744 / $143,002 / $143,672 |
| N Kirk Road – Batavia, IL | NAV / 38,962 / 134,923 | NAV / $121,947 / $116,150 |
| St. Road 54 (WC) – Wesley Chapel, FL | 2,783 / 29,743 / 72,998 | $93,403 / $88,319 / $89,983 |
| Starkey Road – Largo, FL | 10,933 / 110,591 / NAV | $55,137 / $59,493 / NAV |
| S Belcher Road – Seminole, FL | 6,345 / 97,437 / NAV | $87,528 / $63,787 / NAV |
| W Fletcher Avenue – Tampa, FL | 10,935 / 105,929 / 284,732 | $73,405 / $67,129 / $65,971 |
| Gunn Highway – Tampa, FL | 13,734 / 109,750 / 306,468 | $76,995 / $72,660 / $66,681 |
| W MLK – Tampa, FL | 9,358 / 62,985 / NAV | $67,698 / $72,892 / NAV |
| E Fletcher Ave – Tampa, FL | 26,426 / 117,840 / 268,111 | $32,401 / $52,806 / $65,759 |
| Bruce B. Downs – Tampa, FL | 8,477 / 54,763 / 101,921 | $104,051 / $111,281 / $109,278 |
| St. Road 54 (Lutz) – Lutz, FL | NAV / 39,953 / 86,999 | NAV / $99,115 / $102,146 |
| Barclay Road – Spring Hill, FL | 5,870 / 39,424 / NAV | $69,729 / $64,157 / NAV |
| Boyette Road – Riverview, FL | 6,931 / 60,626 / 179,445 | $73,568 / $76,303 / $79,058 |
| Robin Road – Lakeland, FL | 8,837 / 69,014 / 144,275 | $73,398 / $70,955 / $68,922 |
| (1) | The population and average household income statistics shown for the N Desplaines property represent the 0.5 mile / 1-mile / 2-mile radii. |
The following table presents certain information relating to certain self storage lease comparables provided in the appraisals for the Metro 14 Self Storage Portfolio Properties:
| Property Name – Location | Current
Occupancy
(7/31/2019) | Competitive
Set Average
Occupancy
Rate | Monthly
Underwritten Rent/Unit | Appraiser’s
Monthly Market
Rent/Unit |
| N Desplaines – Chicago, IL | 94.1% | 91.0% | $183 | $187 |
| N Kirk Road – Batavia, IL | 92.2% | 91.0% | $131 | $139 |
| St. Road 54 (WC) – Wesley Chapel, FL | 89.0% | 75.0% | $159 | $166 |
| Starkey Road – Largo, FL | 84.8% | 89.1% | $120 | $133 |
| S Belcher Road – Seminole, FL | 90.9% | 90.8% | $136 | $140 |
| W Fletcher Avenue – Tampa, FL | 94.0% | 89.1% | $134 | $130 |
| Gunn Highway – Tampa, FL | 90.1% | 92.0% | $120 | $127 |
| W MLK – Tampa, FL | 91.4% | 91.6% | $162 | $164 |
| E Fletcher Ave – Tampa, FL | 91.5% | 88.9% | $117 | $127 |
| Bruce B. Downs – Tampa, FL | 91.2% | 90.6% | $173 | $179 |
| St. Road 54 (Lutz) – Lutz, FL | 87.4% | 87.4% | $125 | $131 |
| Barclay Road – Spring Hill, FL | 93.8% | 89.0% | $145 | $165 |
| Boyette Road – Riverview, FL | 89.7% | 75.4% | $127 | $134 |
| Robin Road – Lakeland, FL | 94.9% | 87.8% | $120 | $136 |
Escrows.
Real Estate Taxes – The Metro 14 Self Storage Portfolio Mortgage Loan documents require an upfront real estate tax reserve of $684,910 and ongoing monthly real estate tax reserves in an amount equal to one-twelfth of the real estate taxes that the lender estimates will be payable during the next twelve months (initially $143,113).
Insurance – The Metro 14 Self Storage Portfolio Mortgage Loan documents do not require ongoing monthly escrows for insurance premiums so long as (i) no event of default has occurred and is continuing, (ii) the Metro 14 Self Storage Portfolio Borrower provides the lender with evidence that the Metro 14 Self Storage Portfolio Properties are insured pursuant to a blanket policy and such policy is in full force and effect, and (iii) the Metro 14 Self Storage Portfolio Borrower provides the lender with evidence of timely payment of the insurance premiums and renewals.
Replacement Reserve – The Metro 14 Self Storage Portfolio Mortgage Loan documents require ongoing monthly replacement reserves of $7,826 (subject to a cap of $187,834), which the lender may require the Metro 14 Self Storage Portfolio Borrower to increase (not
THE INFORMATION IN THIS STRUCTURAL AND COLLATERAL TERM SHEET IS NOT COMPLETE AND MAY BE AMENDED PRIOR TO THE TIME OF SALE. THIS TERM SHEET IS NOT AN OFFER TO SELL THESE SECURITIES AND IT IS NOT A SOLICITATION OF AN OFFER TO BUY THESE SECURITIES IN ANY JURISDICTION WHERE THE OFFER OR SALE IS NOT PERMITTED.
43
| Self Storage – Self Storage | Loan #4 | Cut-off Date Balance: | | $83,600,000 |
| Various Locations (IL, FL) | Metro 14 Self Storage Portfolio | Cut-off Date LTV: | | 55.4% |
| | | U/W NCF DSCR: | | 3.10x |
| | | U/W NOI Debt Yield: | | 10.2% |
more than once per year) if the lender reasonably determines such increase is necessary to maintain the proper operation of the Metro 14 Self Storage Portfolio Properties.
Lockbox and Cash Management. Upon the occurrence and continuance of a Cash Trap Event Period (as defined below), the Metro 14 Self Storage Portfolio Borrower is required to establish a lender-controlled lockbox account and the Metro 14 Self Storage Portfolio Borrower and property manager are required to (i) cause all credit card receipts to be deposited directly into the lockbox account and (ii) deposit all additional rents (other than credit card receipts) into the lockbox account on a weekly basis. During a Cash Trap Event Period, funds in the lockbox account are required to be swept to a lender-controlled cash management account, and all excess funds are required to be swept to an excess cash flow subaccount controlled by the lender.
A “Cash Trap Event Period” will commence upon the earlier of the following:
| (i) | the occurrence and continuance of an event of default; and |
| (ii) | the net cash flow debt service coverage ratio (based on a hypothetical 30-year amortization term; “NCF DSCR”) being less than 1.10x (tested quarterly) for two consecutive calendar quarters. |
A Cash Trap Event Period will end upon the occurrence of the following:
| ● | with regard to clause (i), the cure of such event of default; and |
| ● | with regard to clause (ii), the NCF DSCR being greater than or equal to 1.15x for two consecutive calendar quarters. |
Property Management. The Metro 14 Self Storage Portfolio Properties are managed by an affiliate of the Metro 14 Self Storage Portfolio Borrower.
Partial Release. Provided no event of default is ongoing, the Metro 14 Self Storage Portfolio Borrower has the right, at any time after the lockout period and prior to the open period start date, to obtain the release of any of the Metro 14 Self Storage Portfolio Properties from the lien of the Metro 14 Self Storage Portfolio Mortgage Loan, provided that certain conditions are satisfied, including, but not limited to, the following:
| (i) | partial defeasance in an amount equal to at least 125% of the allocated loan amount for the property being released; |
| (ii) | the net cash flow debt service coverage ratio immediately following the release being equal to or greater than the greater of (a) 1.94x (based on a hypothetical 30-year amortization period) and (b) the net cash flow debt service coverage ratio immediate prior to the release; |
| (iii) | the net cash flow debt yield immediately following the release being equal to or greater than the greater of (1) 9.6% and (2) the net cash flow debt yield immediately prior to the release; |
| (iv) | the loan-to-value ratio immediately following the release being less than or equal to the lesser of (x) 55.4% and (y) the loan-to-value ratio immediately prior to the release; |
| (v) | compliance with all applicable REMIC requirements; and |
| (vi) | rating agency confirmation that such release will not result in a downgrade, withdrawal or qualification of the respective ratings assigned to the BANK 2019-BNK22 certificates. |
Real Estate Substitution.Not permitted.
Subordinate and Mezzanine Indebtedness.Not permitted.
Ground Lease. None.
Terrorism Insurance.The Metro 14 Self Storage Portfolio Mortgage Loan documents require that the “all risk” insurance policy required to be maintained by the Metro 14 Self Storage Portfolio Borrower provides coverage for terrorism in an amount equal to the full replacement cost of the Metro 14 Self Storage Portfolio Properties, as well as business interruption insurance covering no less than the 18-month period following the occurrence of a casualty event, together with a 6-month extended period of indemnity.
THE INFORMATION IN THIS STRUCTURAL AND COLLATERAL TERM SHEET IS NOT COMPLETE AND MAY BE AMENDED PRIOR TO THE TIME OF SALE. THIS TERM SHEET IS NOT AN OFFER TO SELL THESE SECURITIES AND IT IS NOT A SOLICITATION OF AN OFFER TO BUY THESE SECURITIES IN ANY JURISDICTION WHERE THE OFFER OR SALE IS NOT PERMITTED.
44
| Self Storage | Loan #5 | Cut-off Date Balance: | | $65,000,000 |
| Property Addresses - Various | Storage Post Portfolio | Cut-off Date LTV: | | 65.2% |
| | | U/W NCF DSCR: | | 1.97x |
| | | U/W NOI Debt Yield: | | 7.9% |
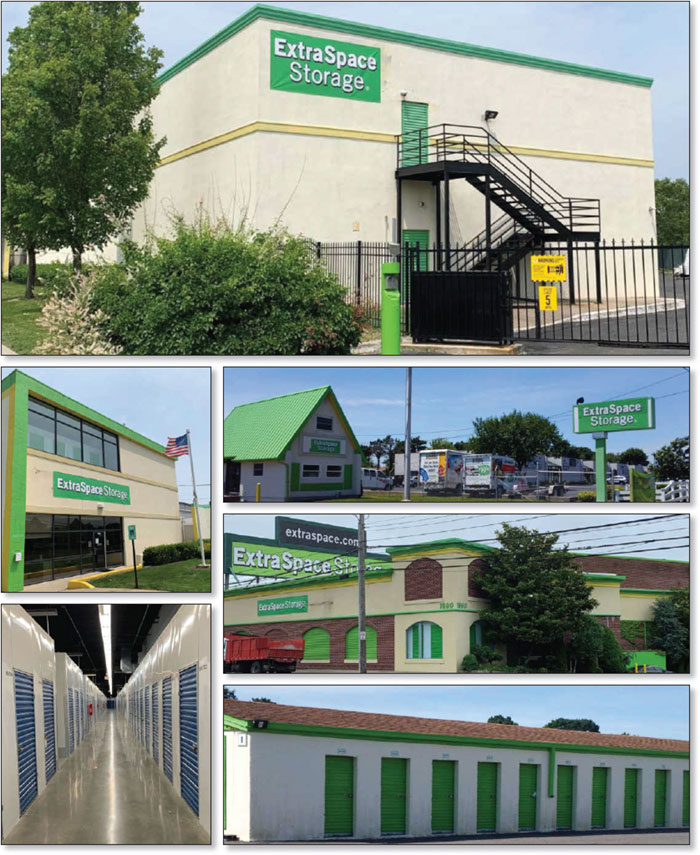
THE INFORMATION IN THIS STRUCTURAL AND COLLATERAL TERM SHEET IS NOT COMPLETE AND MAY BE AMENDED PRIOR TO THE TIME OF SALE. THIS TERM SHEET IS NOT AN OFFER TO SELL THESE SECURITIES AND IT IS NOT A SOLICITATION OF AN OFFER TO BUY THESE SECURITIES IN ANY JURISDICTION WHERE THE OFFER OR SALE IS NOT PERMITTED.
45
| No. 5 – Storage Post Portfolio |
| |
| Mortgage Loan Information | | Mortgaged Property Information |
| Mortgage Loan Seller: | Morgan Stanley Mortgage Capital Holdings LLC | | Single Asset/Portfolio: | Portfolio |
Credit Assessment (DBRS/Fitch/S&P): | NR/NR/NR | | Property Type – Subtype: | Self Storage – Self Storage |
| Original Principal Balance(1): | $65,000,000 | | Location: | Various |
| Cut-off Date Balance(1): | $65,000,000 | | Size: | 1,173,842 SF |
| % of Initial Pool Balance: | 5.4% | | Cut-off Date Balance Per SF(1): | $127.79 |
| Loan Purpose: | Acquisition | | Maturity Date Balance Per SF(1): | $127.79 |
| Borrower Sponsor: | Extra Space Storage Inc. | | Year Built/Renovated: | Various |
| Guarantor: | Extra Space Storage Inc. | | Title Vesting: | Fee |
| Mortgage Rate: | 3.8900% | | Property Manager: | Self-managed |
| Note Date: | September 13, 2019 | | Current Occupancy (As of): | 92.4% (5/31/2019) |
| Seasoning: | 1 month | | YE 2018 Occupancy: | 93.7% |
| Maturity Date: | October 1, 2029 | | YE 2017 Occupancy: | 93.8% |
| IO Period: | 120 months | | YE 2016 Occupancy: | 93.0% |
| Loan Term (Original): | 120 months | | YE 2015 Occupancy: | 91.7% |
| Amortization Term (Original): | NAP | | As-Is Appraised Value(3): | $230,000,000 |
| Loan Amortization Type: | Interest-only, Balloon | | As-Is Appraised Value Per SF(3): | $195.94 |
| Call Protection: | L(25),D(88),O(7) | | As-Is Appraisal Valuation Date(3): | August 1, 2019 |
| Lockbox Type: | Springing | | Underwriting and Financial Information |
| Additional Debt(1): | Yes | | TTM NOI (7/31/2019)(2): | $11,554,063 |
| Additional Debt Type (Balance)(1): | Pari Passu($85,000,000); Future Mezzanine | | YE 2018 NOI: | $11,665,446 |
| | | | YE 2017 NOI: | $11,908,645 |
| | | | YE 2016 NOI: | $11,459,179 |
| | | | U/W Revenues: | $19,869,791 |
| | | | U/W Expenses: | $7,978,149 |
| Escrows and Reserves(2) | | U/W NOI(2): | $11,891,642 |
| | Initial | Monthly | Cap | | U/W NCF: | $11,656,874 |
| Taxes | $0 | Springing | NAP | | U/W DSCR based on NOI/NCF(1): | 2.01x / 1.97x |
| Insurance | $0 | Springing | NAP | | U/W Debt Yield based on NOI/NCF(1): | 7.9% / 7.8% |
| | | | | | U/W Debt Yield at Maturity based on NOI/NCF(1) | 7.9% / 7.8% |
| | | | | | Cut-off Date LTV Ratio(1)(3): | 65.2% |
| | | | | | LTV Ratio at Maturity(1)(3): | 65.2% |
| | | | | | | |
| | | | | | | | | |
| Sources and Uses |
| Sources | | | | | Uses | | | |
| Original whole loan amount(1) | $150,000,000 | | 65.1% | | Purchase Price(4) | $228,500,000 | | 99.2% |
| Borrower Equity | 80,339,324 | | 34.9 | | Closing Costs | 1,839,324 | | 0.8 |
| Total Sources | $230,339,324 | | 100.0% | | Total Uses: | $230,339,324 | | 100.0% |
| (1) | The Storage Post Portfolio Mortgage Loan (as defined below) is a part of the Storage Post Portfolio Whole Loan (as defined below) with an original aggregate principal balance of $150,000,000. The Cut-off Date Balance per SF, Maturity Date Balance per SF, U/W DSCR based on NOI/NCF, U/W Debt Yield based on NOI/NCF, U/W Debt Yield at Maturity based on NOI/NCF, Cut-off Date LTV Ratio and LTV Ratio at Maturity numbers presented above are based on the Storage Post Portfolio Whole Loan. |
| (2) | See “Escrows” section for a full description of Escrows and Reserves. |
| (3) | The Appraised Value is the “as is portfolio” appraised value of the Storage Post Portfolio Properties (as defined below) as a whole, which reflects an 8.7% premium to the aggregate appraised value of the individual properties. The aggregate appraised value for the individual properties as of July 18, 2019 or July 19, 2019, as applicable, is $211,600,000, which results in a Cut-off Date LTV Ratio and a LTV Ratio at Maturity of 70.9%. |
| (4) | The Storage Post Properties were acquired in May 2019 and at loan closing a bridge loan of $150,204,500 and a bridge loan fee of $1,050,000 were paid off. |
The Mortgage Loan. The xx mortgage loan (the “Storage Post Portfolio Mortgage Loan”) is a part of a whole loan (the “Storage Post Portfolio Whole Loan”) that is evidenced by threepari passu promissory notes in the original aggregate principal amount of $150,000,000. The Storage Post Portfolio Whole Loan is secured by a first priority fee mortgage encumbering 11 self storage properties located throughout New York and Florida (the “Storage Post Portfolio Properties”). The Storage Post Portfolio Mortgage Loan is evidenced by the non-controlling promissory Notes A-2 and A-3 in the original aggregate principal amount of $65,000,000. The controlling promissory Note A-1 (the “Storage Post Portfolio Non-ServicedPari PassuCompanion Loan”), in the original principal amount of $85,000,000, is expected to be contributed to the BANK 2019-BNK21 securitization trust. The Storage Post Portfolio Whole Loan will be serviced pursuant to the pooling and servicing agreement for the BANK 2019-BNK21 securitization trust. See “Description of the Mortgage Pool—The Whole Loans—The Non-Serviced Pari Passu Whole Loans” and “Pooling and Servicing Agreement—Servicing of the Non-Serviced Mortgage Loans” in the Preliminary Prospectus.
THE INFORMATION IN THIS STRUCTURAL AND COLLATERAL TERM SHEET IS NOT COMPLETE AND MAY BE AMENDED PRIOR TO THE TIME OF SALE. THIS TERM SHEET IS NOT AN OFFER TO SELL THESE SECURITIES AND IT IS NOT A SOLICITATION OF AN OFFER TO BUY THESE SECURITIES IN ANY JURISDICTION WHERE THE OFFER OR SALE IS NOT PERMITTED.
46
| Self Storage | Loan #5 | Cut-off Date Balance: | | $65,000,000 |
| Property Addresses - Various | Storage Post Portfolio | Cut-off Date LTV: | | 65.2% |
| | | U/W NCF DSCR: | | 1.97x |
| | | U/W NOI Debt Yield: | | 7.9% |
Note Summary
| Notes | Original Principal
Balance | Cut-off Date
Balance | Anticipated Note Holder | Controlling Piece |
| A-1 | $85,000,000 | $85,000,000 | BANK 2019-BNK21(1) | Yes |
| A-2 | $45,000,000 | $45,000,000 | BANK 2019-BNK22 | No |
| A-3 | $20,000,000 | $20,000,000 | BANK 2019-BNK22 | No |
| Total | $150,000,000 | $150,000,000 | | |
| (1) | Anticipated to be transferred to the BANK 2019-BNK21 securitization transaction upon the closing date of such securitization. |
The Borrowers and the Borrower Sponsor. The borrowers are ESS-NYFL JV Florida Sub II LLC and ESS-NYFL JV New York Sub LLC (collectively, the “Storage Post Portfolio Borrowers”), each a Delaware limited liability company structured to be bankruptcy-remote with two independent directors. Extra Space Storage Inc. (“Extra Space Storage”) is the borrower sponsor and non-recourse carveout guarantor with respect to the Storage Post Portfolio Whole Loan. Extra Space Storage is headquartered in Salt Lake City, Utah and owned or operated over 1,700 self-storage locations across 40 states, Washington, D.C. and Puerto Rico as of June 30, 2019. The Storage Post Portfolio Borrowers are owned by a limited partnership of which the general partner is an affiliate of Extra Space Storage and the limited partners consist of an affiliate of Extra Space Storage (16%) and two unaffiliated entities owned or managed by GIC Real Estate, Inc. (45%) or Rosewood Investment Corporation (39%). GIC Real Estate, Inc. is an affiliate of an investment firm established in 1981 to manage Singapore’s foreign reserves. Rosewood Investment Corporation is a privately-held company. In some circumstances, the unaffiliated limited partners are entitled to purchase the entirety of the general and limited partnership interests of such affiliates of Extra Space Storage, provided that the unaffiliated limited partners provide a replacement non-recourse carveout guarantor that meets certain net worth and liquidity requirements and is reasonably approved by the lender.
The Properties.The Storage Post Portfolio Properties are comprised of 11 self storage properties containing a total of 10,680 units, comprised of approximately 36.7% non-climate controlled units, approximately 57.5% climate controlled units and approximately 5.9% recreational vehicle (“RV”) storage units. The Storage Post Portfolio Properties range in size from approximately 44,000 square feet to 194,000 square feet, and average unit size is 95 SF. The Storage Post Portfolio Properties are located in Florida (8 properties representing 75.6% of total square feet and 60.6% of TTM NOI) and New York (3 properties representing 24.4% of total square feet and 39.4% of TTM NOI). Excluding New Hyde Park and Station Square, no single property accounts for more than 9.1% of TTM NOI or 12.0% of total square feet. The Storage Post Portfolio Properties have exhibited stable occupancy, having averaged 93.3% occupancy since 2016, with no property dropping below 90% occupancy during that time. As of May 31, 2019, the Storage Post Portfolio Properties were 92.4% occupied. The Storage Post Portfolio Properties were built between 1946 and 2003 and one property was renovated in 1999. According to the Storage Post Portfolio Borrowers, approximately $1.5 million has been spent in capital expenditures across the portfolio since 2017 and the borrower sponsor currently plans to spend approximately $5.9 million in capital improvements predominantly on asphalt and roofing renovations. However, such capital improvements are not required or reserved for under the Storage Post Portfolio Whole Loan documents.
The following table presents certain information relating to the Storage Post Portfolio Properties:
Storage Post Portfolio Summary
| Property Name | City | State | Year Built | Total GLA(SF) | Units(1) | Cut-off Date
Allocated Loan
Amount | % of ALA | Appraised Value(2) | % of Appraised
Value(2) |
| New Hyde Park | New Hyde Park | NY | 2003 | 151,284 | 1,948 | $41,363,000 | 27.6% | $65,000,000 | 30.7% |
| Station Square | Pompano Beach | FL | 1967-1986 | 193,735 | 1,198 | $22,403,000 | 14.9% | $30,100,000 | 14.2% |
| Mills Pond Park | Fort Lauderdale | FL | 1989-1994 | 117,230 | 1,093 | $12,988,000 | 8.7% | $17,400,000 | 8.2% |
| Huntington | Huntington Station | NY | 1946 | 44,059 | 603 | $12,004,000 | 8.0% | $18,000,000 | 8.5% |
| Islandia | Islandia | NY | 1985 | 90,753 | 874 | $12,003,000 | 8.0% | $18,000,000 | 8.5% |
| Lauderdale Manors | Fort Lauderdale | FL | 1973 | 124,501 | 1,082 | $11,248,000 | 7.5% | $14,000,000 | 6.6% |
| Wilton Manors | Fort Lauderdale | FL | 1968 | 56,842 | 759 | $9,870,000 | 6.6% | $12,500,000 | 5.9% |
| Franklin Park | Fort Lauderdale | FL | 1972-1987 | 140,735 | 1,192 | $9,441,000 | 6.3% | $12,700,000 | 6.0% |
| Oakland Park | Oakland Park | FL | 1959-1970 | 90,540 | 518 | $7,820,000 | 5.2% | $9,900,000 | 4.7% |
| Lauderhill | Lauderhill | FL | 1984 | 91,372 | 1,039 | $6,310,000 | 4.2% | $8,500,000 | 4.0% |
| Dixie Highway | Pompano Beach | FL | 1966-1970 | 72,792 | 374 | $4,550,000 | 3.0% | $5,500,000 | 2.6% |
| Total: | | | | 1,173,842 | 10,680 | $150,000,000 | 100.0% | $230,000,000 | 100.0% |
| (1) | Based on the underwritten rent roll. |
| (2) | The Total Appraised Value is the “as is portfolio” appraised value of the Storage Post Portfolio Properties as a whole, which reflects an 8.7% premium to the aggregate appraised value of the individual properties. The aggregate appraised value for the individual properties as of July 18, 2019 or July 19, 2019, as applicable, is $211,600,000, which results in a Cut-off Date LTV Ratio and a Maturity Date LTV Ratio of 70.9%. The % of Appraised Value is based on the aggregate appraised value for the individual properties. |
THE INFORMATION IN THIS STRUCTURAL AND COLLATERAL TERM SHEET IS NOT COMPLETE AND MAY BE AMENDED PRIOR TO THE TIME OF SALE. THIS TERM SHEET IS NOT AN OFFER TO SELL THESE SECURITIES AND IT IS NOT A SOLICITATION OF AN OFFER TO BUY THESE SECURITIES IN ANY JURISDICTION WHERE THE OFFER OR SALE IS NOT PERMITTED.
47
| Self Storage | Loan #5 | Cut-off Date Balance: | | $65,000,000 |
| Property Addresses - Various | Storage Post Portfolio | Cut-off Date LTV: | | 65.2% |
| | | U/W NCF DSCR: | | 1.97x |
| | | U/W NOI Debt Yield: | | 7.9% |
The following table presents certain information relating to the unit mix and net operating income of the Storage Post Portfolio Properties:
Storage Post Portfolio Summary(1)
| Property Name | City / State | Non-
Climate
Controlled
Units |
Climate
Controlled
Units |
RV Units | Non-
Climate
Controlled
Square
Feet | Climate
Controlled Square
Feet | RV SF | 7/31/2019
TTM NOI | % of Total 7/31/2019 TTM NOI |
| New Hyde Park | New Hyde Park, NY | 11 | 1,876 | 61 | 1,162 | 137,922 | 12,200 | $2,822,926 | 24.4% |
| Station Square | Pompano Beach, FL | 87 | 953 | 158 | 13,870 | 78,831 | 101,034 | $1,807,703 | 15.6% |
| Mills Pond Park | Fort Lauderdale, FL | 290 | 794 | 9 | 43,291 | 61,534 | 12,405 | $1,050,689 | 9.1% |
| Huntington | Huntington Station, NY | 314 | 276 | 13 | 24,931 | 17,895 | 1,233 | $866,420 | 7.5% |
| Islandia | Islandia, NY | 846 | 0 | 28 | 86,401 | 0 | 4,352 | $866,214 | 7.5% |
| Lauderdale Manors | Fort Lauderdale, FL | 417 | 632 | 33 | 66,266 | 49,035 | 9,200 | $968,297 | 8.4% |
| Wilton Manors | Fort Lauderdale, FL | 0 | 755 | 4 | 0 | 56,202 | 640 | $837,917 | 7.3% |
| Franklin Park | Fort Lauderdale, FL | 539 | 445 | 208 | 78,900 | 20,571 | 41,264 | $761,212 | 6.6% |
| Oakland Park | Oakland Park, FL | 472 | 31 | 15 | 74,284 | 1,846 | 14,410 | $664,196 | 5.7% |
| Lauderhill | Lauderhill, FL | 714 | 298 | 27 | 72,007 | 15,045 | 4,320 | $507,898 | 4.4% |
| Dixie Highway | Pompano Beach, FL | 225 | 79 | 70 | 48,602 | 3,660 | 20,530 | $400,592 | 3.5% |
| Total: | | 3,915 | 6,139 | 626 | 509,713 | 442,541 | 221,588 | $11,554,063 | 100.0% |
| (1) | Based on the underwritten rent roll. |
Operating History and Underwritten Net Cash Flow. The following table presents certain information relating to the operating history and underwritten net cash flow at the Storage Post Portfolio:
Cash Flow Analysis
| | 2016 | 2017 | 2018 | 7/31/2019
TTM | U/W | %(1) | U/W $ per SF |
| Rents in Place | $19,746,811 | $20,403,182 | $20,571,192 | $20,292,015 | $20,292,015 | 96.8% | $17.29 |
| Contractual Rent Steps | 0 | 0 | 0 | 0 | 0 | 0.0 | 0.00 |
| Gross Potential Rent | $19,746,811 | $20,403,182 | $20,571,192 | $20,292,015 | $20,292,015 | 96.8% | $17.29 |
| Other Income | 1,113,534 | 1,102,803 | 1,089,766 | 1,220,708 | 1,220,708 | 5.8 | 1.04 |
| Bad Debt | (691,882) | (729,089) | (671,444) | (554,451) | (554,451) | (2.6) | (0.47) |
| Net Rental Income | $20,168,463 | $20,776,896 | $20,989,515 | $20,958,272 | $20,958,272 | 100.0% | $17.85 |
| Concessions | (948,118) | (1,004,688) | (1,090,117) | (1,088,481) | (1,088,481) | (5.2) | (0.93) |
| (Vacancy & Credit Loss) | 0 | 0 | 0 | 0 | 0 | 0.0(2) | 0.00 |
| Effective Gross Income | $19,220,345 | $19,772,208 | $19,899,398 | $19,869,791 | $19,869,791 | 94.8% | $16.93 |
| | | | | | | | |
| Real Estate Taxes | 2,192,374 | 2,378,144 | 2,568,249 | 2,687,202 | 2,687,202 | 13.5 | 2.29 |
| Insurance | 338,048 | 336,791 | 348,950 | 373,959 | 373,959 | 1.9 | 0.32 |
| Management Fee | 1,203,403 | 1,243,268 | 1,398,312 | 1,331,068 | 993,490 | 5.0 | 0.85 |
| Other Operating Expenses | 4,027,340 | 3,905,360 | 3,918,442 | 3,923,499 | 3,923,499 | 19.7 | 3.34 |
| Total Operating Expenses | $7,761,165 | $7,863,563 | $8,233,952 | $8,315,728 | $7,978,149 | 40.2% | $6.80 |
| | | | | | | | |
| Net Operating Income(1) | $11,459,179 | $11,908,645 | $11,665,446 | $11,554,063 | $11,891,642 | 59.8% | $10.13 |
| Replacement Reserves | 0 | 0 | 0 | 0 | 234,768 | 1.2 | 0.20 |
| Net Cash Flow | $11,459,179 | $11,908,645 | $11,665,446 | $11,554,063 | $11,656,874 | 58.7% | $9.93 |
| | | | | | | | |
| NOI DSCR(3) | 1.94x | 2.01x | 1.97x | 1.95x | 2.01x | | |
| NCF DSCR(3) | 1.94x | 2.01x | 1.97x | 1.95x | 1.97x | | |
| NOI Debt Yield(3) | 7.6% | 7.9% | 7.8% | 7.7% | 7.9% | | |
| NCF Debt Yield(3) | 7.6% | 7.9% | 7.8% | 7.7% | 7.8% | | |
| (1) | Represents (i) percent of Net Rental Income for all revenue fields, (ii) percent of Gross Potential Rent for Vacancy & Credit Loss and (iii) percent of Effective Gross Income for all other fields. |
| (2) | The Storage Post Portfolio is 92.4% leased as of May 31, 2019. |
| (3) | Debt service coverage ratios and debt yields are based on the Storage Post Portfolio Whole Loan. |
THE INFORMATION IN THIS STRUCTURAL AND COLLATERAL TERM SHEET IS NOT COMPLETE AND MAY BE AMENDED PRIOR TO THE TIME OF SALE. THIS TERM SHEET IS NOT AN OFFER TO SELL THESE SECURITIES AND IT IS NOT A SOLICITATION OF AN OFFER TO BUY THESE SECURITIES IN ANY JURISDICTION WHERE THE OFFER OR SALE IS NOT PERMITTED.
48
| Self Storage | Loan #5 | Cut-off Date Balance: | | $65,000,000 |
| Property Addresses - Various | Storage Post Portfolio | Cut-off Date LTV: | | 65.2% |
| | | U/W NCF DSCR: | | 1.97x |
| | | U/W NOI Debt Yield: | | 7.9% |
Appraisal.The appraised value is $230,000,000 and represents the “as is portfolio” appraised value of the Storage Post Portfolio Properties as a whole, which reflects an 8.7% premium to the aggregate appraised value of the individual properties. The aggregate appraised value for the individual properties as of July 18, 2019 or July 19, 2019, as applicable, is $211,600,000, which results in a Cut-off Date LTV Ratio and a Maturity Date LTV Ratio of 70.9%.
Environmental Matters. According to Phase I environmental site assessments dated between August 1, 2019 and August 5, 2019, there was no evidence of any recognized environmental conditions at the Storage Post Portfolio.
Market Overview and Competition.The Storage Post Portfolio Properties are located across New York and Florida. Eight properties are located in Florida (75.6% of total SF and 60.6% of TTM NOI) and three properties are located in New York (24.4% of total SF and 39.4% of TTM NOI).
The following table presents the geographical distribution of the Storage Post Portfolio Properties:
Storage Post Portfolio Summary
| State | Total GLA
(SF)(1) | Units(1) | Cut-off Date
Allocated
Loan Amount | % of ALA | 5/31/2019 Occ.(1) | Non-
Climate
Controlled
Units(1) | Climate
Controlled
Units(1) | RV Units(1) | 7/31/2019
TTM NOI |
| Florida | 887,745 | 7,255 | $84,630,000 | 56.4% | 92.7% | 2,744 | 3,987 | 524 | $6,998,503 |
| New York | 286,096 | 3,425 | $65,370,000 | 43.6% | 91.6% | 1,171 | 2,152 | 102 | $4,555,560 |
| Total/Wtd. Avg.: | 1,173,842 | 10,680 | $150,000,000 | 100.0% | 92.4% | 3,915 | 6,139 | 626 | $11,554,063 |
| (1) | Based on the underwritten rent roll. |
The following table presents the local demographics data at the Storage Post Portfolio Properties:
Local Demographics Summary
| Property Name | City | State | 2018 Population (within 1-mi. / 3-mi. / 5-mi. Radius) | 2018 Average Household Income (within 1-mi. / 3-mi. / 5-mi. Radius) |
| New Hyde Park | New Hyde Park | NY | 26,252 / 234,615 / 662,557 | NAV / $139,757 / NAV |
| Station Square | Pompano Beach | FL | 21,465 / 117,140 / 273,488 | $53,558 / $69,931 / $76,808 |
| Mills Pond Park | Fort Lauderdale | FL | 17,330 / 186,745 / 418,337 | $49,630 / $61,815 / $71,432 |
| Huntington | Huntington Station | NY | 13,201 / 77,193 / 167,554 | $116,382 / $148,257 / $172,807 |
| Islandia | Islandia | NY | 8,299 / 90,070 / 254,301 | NAV / $116,413 / NAV |
| Lauderdale Manors | Fort Lauderdale | FL | 17,049 / 190,826 / 435,608 | $46,590 / $56,621 / $70,549 |
| Wilton Manors | Fort Lauderdale | FL | 24,075 / 143,718 / 301,366 | $76,314 / $84,602 / $78,142 |
| Franklin Park | Fort Lauderdale | FL | 18,386 / 181,533 / 386,514 | $43,549 / $62,827 / $70,938 |
| Oakland Park | Oakland Park | FL | 20,708 / 145,430 / 362,521 | $61,073 / $79,732 / $73,825 |
| Lauderhill | Lauderhill | FL | 17,947 / 194,008 / 434,170 | $51,339 / $54,786 / $65,140 |
| Dixie Highway | Pompano Beach | FL | 16,874 / 118,465 / 272,879 | $59,993 / $73,906 / $74,475 |
Source: Appraisals
THE INFORMATION IN THIS STRUCTURAL AND COLLATERAL TERM SHEET IS NOT COMPLETE AND MAY BE AMENDED PRIOR TO THE TIME OF SALE. THIS TERM SHEET IS NOT AN OFFER TO SELL THESE SECURITIES AND IT IS NOT A SOLICITATION OF AN OFFER TO BUY THESE SECURITIES IN ANY JURISDICTION WHERE THE OFFER OR SALE IS NOT PERMITTED.
49
| Self Storage | Loan #5 | Cut-off Date Balance: | | $65,000,000 |
| Property Addresses - Various | Storage Post Portfolio | Cut-off Date LTV: | | 65.2% |
| | | U/W NCF DSCR: | | 1.97x |
| | | U/W NOI Debt Yield: | | 7.9% |
The following table presents certain information relating to certain self-storage lease comparables provided in the appraisals for the Storage Post Portfolio Properties:
Competitive Set Summary
| Property Name | City | State | Occupancy
Rates As of
5/31/2019 | Competitive
Set Average
Occupancy
Rates | Asking Rent | Market Rent |
| New Hyde Park | New Hyde Park | NY | 90.1% | 88.5% | $220 | $203 |
| Station Square | Pompano Beach | FL | 93.3% | 82.4% | $124 | $136 |
| Mills Pond Park | Fort Lauderdale | FL | 91.2% | 89.8% | $129 | $135 |
| Huntington | Huntington Station | NY | 92.2% | 89.0% | $249 | $221 |
| Islandia | Islandia | NY | 93.6% | 91.0% | $169 | $164 |
| Lauderdale Manors | Fort Lauderdale | FL | 91.7% | 90.2% | $131 | $134 |
| Wilton Manors | Fort Lauderdale | FL | 94.3% | 91.2% | $157 | $155 |
| Franklin Park | Fort Lauderdale | FL | 92.4% | 91.2% | $102 | $113 |
| Oakland Park | Oakland Park | FL | 92.8% | 90.0% | $183 | $183 |
| Lauderhill | Lauderhill | FL | 90.8% | 91.2% | $109 | $109 |
| Dixie Highway | Pompano Beach | FL | 96.6% | 83.0% | $224 | $214 |
Source: Appraisals and underwritten rent roll.
Escrows.
Taxes– Monthly reserves for real estate taxes are not required so long as (i) Extra Space Storage Inc. is the non-recourse carveout guarantor of the Storage Post Portfolio Whole Loan, (ii) no Cash Sweep Event Period (as defined below) has occurred and is continuing, and (iii) the Storage Post Portfolio Borrowers provide the lender with paid receipts for real estate taxes upon lender’s written request and by no later than three business days prior to the date on which such real estate taxes would be delinquent. If such conditions are not satisfied, the Storage Post Portfolio Borrowers will be required to deposit monthly reserves for real estate taxes in an amount equal to 1/12 of the real estate taxes that the lender estimates will be payable during the next twelve months.
Insurance– Monthly reserves for insurance premiums are not required so long as (i) Extra Space Storage Inc. is the non-recourse carveout guarantor of the Storage Post Portfolio Whole Loan, (ii) no event of default is continuing, (iii) the insurance coverage for each Storage Post Portfolio Property is included in a blanket or umbrella policy approved by the lender in its reasonable discretion, and (iv) the Storage Post Portfolio Borrowers provide the lender with evidence of payment of the insurance premiums and renewals of the insurance policies, no later than ten days prior to the expiration of the current policy. If such conditions are not satisfied, the Storage Post Portfolio Borrowers will be required to deposit monthly reserves for insurance premiums in an amount equal to 1/12 of the insurance premiums that the lender estimates will be payable for the renewal of coverage upon the expiration of the insurance policies.
Lockbox and Cash Management.The Storage Post Portfolio Whole Loan is structured with a springing soft lockbox and springing cash management. Upon the first occurrence of a Cash Sweep Event Period, the Storage Post Portfolio Borrowers are required to establish (i) a lockbox account into which, during a Cash Sweep Event Period, the Storage Post Portfolio Borrowers are required to directly deposit, or cause to be deposited, all rents, and all De Minimis Revenue (as defined below) (less anticipated costs for debits for credit and chargebacks, fees and refunded items) from the Storage Post Portfolio Properties, and (ii) a lender-controlled cash management account, into which the Storage Post Portfolio Borrowers are required to cause all sums in the lockbox account to be transferred on each business day during a Cash Sweep Event Period. During the continuance of a Cash Sweep Event Period, provided no event of default is continuing, all funds in the cash management account are required to be applied on each monthly payment date: (i) to make deposits into an account for payment of tenant insurance premiums, sales tax, and packing supply cash receipts (“De Minimis Revenue”), which are to be disbursed to the Storage Post Portfolio Borrowers within five business days of delivery to the lender of a budget for such expenses, (ii) to make the monthly deposits into the real estate tax and insurance reserves, if any, as described above under “Escrows and Reserves,” (iii) to pay debt service on the Storage Post Portfolio Whole Loan, (iv) to pay operating expenses set forth in the annual budget (which is required to be approved by the lender during a Cash Sweep Event Period) and lender-approved extraordinary expenses, and (v) to deposit any remainder into an excess cash flow subaccount to be held as additional security for the Storage Post Portfolio Whole Loan during such Cash Sweep Event Period. If no Cash Sweep Event Period exists, funds in the lockbox account are required to be disbursed to the Storage Post Portfolio Borrowers.
A “Cash Sweep Event Period” means a period:
| (i) | commencing upon the occurrence of an event of default under the Storage Post Portfolio Whole Loan documents and ending upon the cure of such event of default; or |
| (ii) | commencing upon the debt service coverage ratio on the Storage Post Portfolio Whole Loan falling below 1.10x based upon the trailing-twelve months (calculated at the end of each calendar quarter assuming a 30 year amortization schedule), and ending on the date the debt service coverage ratio equals or exceeds 1.25x for two consecutive calendar quarters (calculated assuming a 30 year amortization schedule). |
THE INFORMATION IN THIS STRUCTURAL AND COLLATERAL TERM SHEET IS NOT COMPLETE AND MAY BE AMENDED PRIOR TO THE TIME OF SALE. THIS TERM SHEET IS NOT AN OFFER TO SELL THESE SECURITIES AND IT IS NOT A SOLICITATION OF AN OFFER TO BUY THESE SECURITIES IN ANY JURISDICTION WHERE THE OFFER OR SALE IS NOT PERMITTED.
50
| Self Storage | Loan #5 | Cut-off Date Balance: | | $65,000,000 |
| Property Addresses - Various | Storage Post Portfolio | Cut-off Date LTV: | | 65.2% |
| | | U/W NCF DSCR: | | 1.97x |
| | | U/W NOI Debt Yield: | | 7.9% |
Property Management.The Storage Post Portfolio is managed by Extra Space Management, Inc., an affiliate of the Storage Post Portfolio Borrowers.
Partial Release.After the expiration of the defeasance lockout period for the Storage Post Portfolio Whole Loan, the Storage Post Portfolio Borrowers have the right to obtain a release of any of the individual Storage Post Portfolio Properties, provided certain conditions are satisfied, including: (i) no event of default is continuing, (ii) the Storage Post Portfolio Borrowers partially defease the Storage Post Portfolio Whole Loan in a principal amount equal to 125% of the allocated loan amount of the related individual property, (iii) the debt yield for all remaining Storage Post Portfolio Properties is not less than the debt yield immediately preceding the release, and (iv) customary REMIC requirements are satisfied.
In addition, the Storage Post Portfolio Borrowers are permitted to obtain the release of an approximately 0.45 acre release parcel included in the Station Square property (the “Release Parcel”), in connection with an arm’s length third party sale of the Release Parcel, provided that certain conditions are satisfied, including, (i) if applicable, the Release Parcel Release Price (as defined below) is defeased, (ii) customary REMIC requirements are satisfied and (iii) following the release, the remaining portion of the Station Square property (the “Remaining Station Square Property”) complies with legal requirements, including zoning and parking requirements, and constitutes a separate tax lot.
“Release Parcel Release Price” means 125% of the amount required such that the Release Parcel Loan-To-Value-Ratio does not exceed 73.9%.
“Release Parcel Loan-To-Value Ratio” means a percentage calculated by multiplying (i) a fraction, the (x) numerator of which is the outstanding principal balance of the allocated loan amount for the Station Square property, and (y) denominator of which is the value of the Remaining Station Square Property based on a current appraisal thereof, in the case of each of (x) and (y), as determined immediately prior to the release of the Release Parcel, by (ii) 100%.
Real Estate Substitution. Not permitted.
Subordinate and Mezzanine Indebtedness.A constituent party or parties (direct or indirect) of the Storage Post Portfolio Borrowers (the “Mezzanine Borrower”) has a one-time right to obtain a mezzanine loan (the “Mezzanine Debt”) from a third-party lender secured by a pledge of up to 49% of such Mezzanine Borrower’s direct or indirect equity interests in the Storage Post Portfolio Borrowers, provided certain conditions are satisfied, including (a) no event of default is continuing, (b) the aggregate loan-to-value ratio of the Storage Post Portfolio Whole Loan and the Mezzanine Debt is equal to or less than 65% (based on an updated appraisal acceptable to the lender), (c) the aggregate debt yield of the Storage Post Portfolio Whole Loan and the Mezzanine Debt is not less than 8.0%, (d) the maturity date of the Mezzanine Debt is coterminous with or longer than the maturity date of the Storage Post Portfolio Whole Loan, (e) the lender and the mezzanine lender enter into an intercreditor agreement in form and substance reasonably acceptable to the lender, and (f) the lender has received a rating agency confirmation as to the implementation of the Mezzanine Debt.
Ground Lease.None.
Right of First Offer/Right of First Refusal.None.
Letter of Credit.None.
Terrorism Insurance. The Storage Post Portfolio Borrowers are required to obtain and maintain an “all risk” property insurance policy that covers perils of terrorism and acts of terrorism in an amount equal to the “full replacement cost” of the Storage Post Portfolio Properties, together with business income insurance covering not less than the 18-month period commencing at the time of loss, together with an extended period of indemnity endorsement of not less than 12 months. Notwithstanding the foregoing, for so long as the Terrorism Risk Insurance Act of 2002, as extended and modified by the Terrorism Risk Insurance Program Reauthorization Act of 2015 (“TRIPRA”) is in effect (including any extensions thereof or if another federal governmental program is in effect relating to “acts of terrorism” which provides substantially similar protections as TRIPRA), and covers both domestic and foreign acts of terrorism, the lender is required to accept terrorism insurance which insures against “covered acts” as defined by TRIPRA (or such other program). See“Risk Factors—Risks Relating to the Mortgage Loans—Terrorism Insurance May Not Be Available for All Mortgaged Properties”in the Preliminary Prospectus.
THE INFORMATION IN THIS STRUCTURAL AND COLLATERAL TERM SHEET IS NOT COMPLETE AND MAY BE AMENDED PRIOR TO THE TIME OF SALE. THIS TERM SHEET IS NOT AN OFFER TO SELL THESE SECURITIES AND IT IS NOT A SOLICITATION OF AN OFFER TO BUY THESE SECURITIES IN ANY JURISDICTION WHERE THE OFFER OR SALE IS NOT PERMITTED.
51
| Property Types – Various | Loan #6 | Cut-off Date Balance: | | $62,527,000 |
| Property Addresses – Various | ExchangeRight Net Leased Portfolio #29 | Cut-off Date LTV: | | 61.8% |
| | | U/W NCF DSCR: | | 2.36x |
| | | U/W NOI Debt Yield: | | 9.5% |

THE INFORMATION IN THIS STRUCTURAL AND COLLATERAL TERM SHEET IS NOT COMPLETE AND MAY BE AMENDED PRIOR TO THE TIME OF SALE. THIS TERM SHEET IS NOT AN OFFER TO SELL THESE SECURITIES AND IT IS NOT A SOLICITATION OF AN OFFER TO BUY THESE SECURITIES IN ANY JURISDICTION WHERE THE OFFER OR SALE IS NOT PERMITTED.
52
| No. 6 – ExchangeRight Net Leased Portfolio #29 |
| |
| Mortgage Loan Information | | Mortgaged Property Information |
| Mortgage Loan Seller: | Morgan Stanley Mortgage Capital Holdings LLC | | Single Asset/Portfolio: | Portfolio |
Credit Assessment
(DBRS/Fitch/S&P): | NR/NR/NR | | Property Type – Subtype(1): | Various |
| Original Principal Balance: | $62,527,000 | | Location(1): | Various |
| Cut-off Date Balance: | $62,527,000 | | Size: | 350,043 SF |
| % of Initial Pool Balance: | 5.2% | | Cut-off Date Balance Per SF: | $178.63 |
| Loan Purpose: | Acquisition | | Maturity Date Balance Per SF: | $178.63 |
| Borrower Sponsor: | ExchangeRight Real Estate, LLC | | Year Built/Renovated(1): | Various/Various |
| Guarantors: | Warren Thomas; David Fisher; Joshua Ungerecht | | Title Vesting: | Fee |
| Mortgage Rate: | 3.8380% | | Property Manager: | NLP Management, LLC |
| Note Date: | September 4, 2019 | | Current Occupancy (As of): | 100.0% (11/1/2019) |
| Seasoning: | 1 month | | YE 2017 Occupancy(2): | NAV |
| Maturity Date: | October 1, 2029 | | YE 2016 Occupancy(2): | NAV |
| IO Period: | 120 months | | YE 2015 Occupancy(2): | NAV |
| Loan Term (Original): | 120 months | | YE 2014 Occupancy(2): | NAV |
| Amortization Term (Original): | NAP | | As-Is Appraised Value: | $101,200,000 |
| Loan Amortization Type: | Interest-only, Balloon | | As-Is Appraisal Value Per SF: | $289.11 |
| Call Protection: | L(25),D(91),O(4) | | As-Is Appraisal Valuation Date: | Various |
| Lockbox Type: | Hard/Springing Cash Management | | | |
| Additional Debt: | None | | Underwriting and Financial Information |
| Additional Debt Type (Balance): | NAP | | YE 2018 NOI(2): | NAV |
| | | | YE 2017 NOI(2): | NAV |
| | | | YE 2016 NOI(2): | NAV |
| | | | YE 2015 NOI(2): | NAV |
| | | | U/W Revenues: | $6,801,070 |
| | | | U/W Expenses: | $870,660 |
| Escrows and Reserves(3) | | U/W NOI: | $5,930,410 |
| | Initial | Monthly | Cap | | U/W NCF: | $5,737,697 |
| Taxes | $526,625 | Springing | NAP | | U/W DSCR based on NOI/NCF: | 2.44x / 2.36x |
| Insurance | $0 | Springing | NAP | | U/W Debt Yield based on NOI/NCF: | 9.5% / 9.2% |
Replacement Reserve TI/LC Reserve | $102,000 $500,000 | $2,338 Springing | NAP NAP | | U/W Debt Yield at Maturity based on NOI/NCF | 9.5% / 9.2% |
| Required Repair Reserve | $406,929 | $0 | NAP | | Cut-off Date LTV Ratio: | 61.8% |
| BioLife Rollover Reserve | $0 | Springing | NAP | | LTV Ratio at Maturity: | 61.8% |
| | | | | | | | |
| Sources and Uses |
| Sources | | | | | Uses | | | |
| Original loan amount | $62,527,000 | | 60.2 | % | | Purchase price(4) | $100,583,336 | | 96.8 | % |
| Cash equity contribution | 41,386,226 | | 39.8 | | | Closing costs | 1,794,336 | | 1.7 | |
| | | | | | Reserves | 1,535,554 | | 1.5 | |
| Total Sources | $103,913,226 | | 100.0 | % | | Total Uses | $103,913,226 | | 100.0 | % |
| (1) | See “The Properties” section. |
| (2) | Historical occupancy and NOI are unavailable as the ExchangeRight Properties (as defined below) were acquired by the borrower sponsor between February 21, 2019 and August 5, 2019. |
| (3) | See “Escrows” section. |
| (4) | The ExchangeRight Properties were acquired between February 21, 2019 and August 5, 2019 and at loan closing several short term loans, with an aggregate payoff amount of $29,345,778, were paid off. |
The Mortgage Loan. The mortgage loan (the “ExchangeRight Net Leased Portfolio #29 Mortgage Loan”) is evidenced by a single promissory note secured by the fee interests in twenty four cross-collateralized, net leased, single-tenant retail and medical office properties located across ten states (the “ExchangeRight Properties”). The proceeds of the ExchangeRight Net Leased Portfolio #29 Mortgage Loan were used to acquire the ExchangeRight Properties, to payoff a number of short term loans, to fund reserve escrows and to pay closing costs.
The Borrower and Borrower Sponsor.The borrower is ExchangeRight Net Leased Portfolio 29 DST, a Delaware statutory trust (the “ExchangeRight Net Leased Portfolio #29 Borrower”) structured to be bankruptcy-remote with an independent trustee. See“Description of the Mortgage Pool—Mortgage Pool Characteristics—Delaware Statutory Trusts”in the Preliminary Prospectus. Legal counsel to the ExchangeRight Net Leased Portfolio #29 Borrower delivered a non-consolidation opinion in connection with the origination of the ExchangeRight Net Leased Portfolio #29 Mortgage Loan. The borrower sponsor is ExchangeRight Real Estate, LLC.
THE INFORMATION IN THIS STRUCTURAL AND COLLATERAL TERM SHEET IS NOT COMPLETE AND MAY BE AMENDED PRIOR TO THE TIME OF SALE. THIS TERM SHEET IS NOT AN OFFER TO SELL THESE SECURITIES AND IT IS NOT A SOLICITATION OF AN OFFER TO BUY THESE SECURITIES IN ANY JURISDICTION WHERE THE OFFER OR SALE IS NOT PERMITTED.
53
| Property Types – Various | Loan #6 | Cut-off Date Balance: | | $62,527,000 |
| Property Addresses – Various | ExchangeRight Net Leased Portfolio #29 | Cut-off Date LTV: | | 61.8% |
| | | U/W NCF DSCR: | | 2.36x |
| | | U/W NOI Debt Yield: | | 9.5% |
ExchangeRight Real Estate, LLC has more than 14 million square feet under management. ExchangeRight Real Estate, LLC has more than 600 investment-grade retail and Class B/B+ multifamily properties located across 38 states. David Fisher, Joshua Ungerecht and Warren Thomas, the owners of ExchangeRight Real Estate, LLC, are the guarantors of certain non-recourse carveout liabilities under the ExchangeRight Net Leased Portfolio #29 Mortgage Loan. Warren Thomas was subject to a foreclosure sale in November, 2009. See “Description of the Mortgage Pool – Loan Purpose; Default History, Bankruptcy Issues and Other Proceedings” in the Preliminary Prospectus.
The ExchangeRight Net Leased Portfolio #29 Borrower has master leased the ExchangeRight Properties to a master tenant (the “ExchangeRight Net Leased Portfolio #29 Master Tenant”) owned by ExchangeRight Real Estate, LLC, which is in turn owned by the ExchangeRight Net Leased Portfolio #29 Mortgage Loan non-recourse carveout guarantors. The ExchangeRight Net Leased Portfolio #29 Master Tenant is a Delaware limited liability company structured to be bankruptcy-remote and has one independent director. The master lease generally imposes responsibility on the ExchangeRight Net Leased Portfolio #29 Master Tenant for the operation, maintenance and management of the ExchangeRight Properties and pay all expenses incurred in the maintenance and repair of the Exchange Right Properties other than capital expenses (but replacement reserves under the ExchangeRight Net Leased Portfolio #29 Mortgage Loan may be made available to the ExchangeRight Net Leased Portfolio #29 Master Tenant for the payment of capital expenses). The ExchangeRight Net Leased Portfolio #29 Master Tenant’s interest in all tenant rents was assigned to the ExchangeRight Net Leased Portfolio #29 Borrower, which in turn collaterally assigned its interest to the lender. The master lease is subordinate to the ExchangeRight Net Leased Portfolio #29 Mortgage Loan and, upon an event of default under the ExchangeRight Net Leased Portfolio #29 Mortgage Loan, the lender has the right to cause the ExchangeRight Net Leased Portfolio #29 Borrower to terminate the master lease. A default under the master lease is an event of default under the ExchangeRight Net Leased Portfolio #29 Mortgage Loan and gives rise to recourse liability to the non-recourse carveout guarantors for losses unless such default arises solely in connection with the failure of the ExchangeRight Net Leased Portfolio #29 Master Tenant to pay rent as a result of the ExchangeRight Properties not generating sufficient cash flow for the payment of such rent.
The lender has the right to require the ExchangeRight Net Leased Portfolio #29 Borrower to convert from a Delaware statutory trust to a limited liability company upon (i) an event of default or the lender’s determination of imminent default, (ii) the lender’s determination that the ExchangeRight Net Leased Portfolio #29 Borrower will be unable to make a material decision or take a material action required in connection with the operation and maintenance of any ExchangeRight Property, and (iii) 90 days prior to the stated maturity date of the ExchangeRight Net Leased Portfolio #29 Mortgage Loan if an executed commitment from an institutional lender to refinance the ExchangeRight Net Leased Portfolio #29 Mortgage Loan is not delivered to the lender.
Any time after September 4, 2020, the borrower sponsor has the right to effect a one-time transfer of all (but not less than all) of the outstanding ownership interests in the ExchangeRight Net Leased Portfolio #29 Borrower to an Approved Transferee (as defined below) and to replace the non-recourse carveout guarantors as the person who controls the ExchangeRight Net Leased Portfolio #29 Borrower with such Approved Transferee, provided that certain conditions are satisfied, including among others: (i) no event of default has occurred and is continuing, (ii) the Approved Transferee owns at least 100% of the beneficial ownership interests in the ExchangeRight Net Leased Portfolio #29 Borrower and ExchangeRight Net Leased Portfolio #29 Master Tenant, (iii) the Approved Transferee executes a full payment guarantee and indemnity pursuant to which it agrees to be liable (from and after the transfer) for all indemnity obligations (including environmental liabilities and obligations) for which the existing non-recourse carveout guarantors are liable under the non-recourse carveout guaranty (iv) the delivery of a REMIC opinion, an insolvency opinion and other opinions required by the lender and (v) the receipt of rating agency confirmation that such transfer and guarantor replacement will not result in a downgrade of the respective ratings assigned to the BANK 2019-BNK22 Certificates (such a transfer and replacement, a “Qualified Transfer”). A Cash Management Period (as defined below) will be triggered if a Qualified Transfer does not occur by October 1, 2026 (36 months prior to the stated maturity date of the ExchangeRight Net Leased Portfolio #29 Mortgage Loan). See “Lockbox and Cash Management”.
“Approved Transferee” means (A) a depository institution that satisfies certain ratings criteria and is wholly-owned and controlled by a bank, savings and loan association, investment bank, insurance company, trust company, real estate investment trust, commercial credit corporation, pension plan, pension fund or pension advisory firm, mutual fund, government entity or plan or institution similar to any of the foregoing or (B) any person that (1)(i) has never been indicted or convicted of, or pled guilty or no contest to a felony, (ii) has never been indicted or convicted of, or pled guilty or no contest to a Patriot Act offense and is not on any government watch list, (iii) has never been the subject of a voluntary or involuntary (to the extent the same has not been discharged) bankruptcy proceeding, (iv) has no material outstanding judgments against it or its interests and (v) is not crowdfunded, (2) is regularly engaged in the business of owning or operating commercial properties, or interests therein, which are similar to the ExchangeRight Properties, (3) owns interests in, or operates, at least five retail properties with a minimum of 750,000 square feet in the aggregate, (4) satisfies certain net worth or ratings criteria and (5) causes a conversion of the ExchangeRight Net Leased Portfolio #29 Borrower into a Delaware limited liability company.
The Properties.The ExchangeRight Properties are comprised of 21 single-tenant retail and three single-tenant medical office properties totaling 350,043 square feet and located across ten states. The ExchangeRight Properties are located in Louisiana (five properties, 17.8% of NRA), Ohio (six properties, 16.4% of NRA), Tennessee (one property, 15.9% of NRA), Texas (two properties, 11.7% of NRA) and Missouri (three properties, 8.7% of NRA), with the seven remaining ExchangeRight Properties located in Minnesota, North Carolina, Indiana, Arizona and Pennsylvania. Built between 1984 and 2019, with 13 of the 24 properties built between 2014 and 2019 (inclusive), the ExchangeRight Properties range in size from 7,489 square feet to 55,668 square feet.
The ExchangeRight Properties are leased to seven nationally recognized tenants in diverse retail segments, which tenants consist of Walgreens, Dollar General, BioLife Plasma Services L.P., Fresenius Medical Care, Tractor Supply, Hobby Lobby and CVS Pharmacy. Four of the seven tenants are subsidiaries of investment grade-rated entities (20 properties, 67.7% of NRA and 74.1% of underwritten base rent). The ExchangeRight Properties have a weighted average remaining lease term of approximately 12.1 years. Leases representing 79.2% of NRA and 76.0% of the underwritten base rent expire after the stated maturity date of the ExchangeRight Net
THE INFORMATION IN THIS STRUCTURAL AND COLLATERAL TERM SHEET IS NOT COMPLETE AND MAY BE AMENDED PRIOR TO THE TIME OF SALE. THIS TERM SHEET IS NOT AN OFFER TO SELL THESE SECURITIES AND IT IS NOT A SOLICITATION OF AN OFFER TO BUY THESE SECURITIES IN ANY JURISDICTION WHERE THE OFFER OR SALE IS NOT PERMITTED.
54
| Property Types – Various | Loan #6 | Cut-off Date Balance: | | $62,527,000 |
| Property Addresses – Various | ExchangeRight Net Leased Portfolio #29 | Cut-off Date LTV: | | 61.8% |
| | | U/W NCF DSCR: | | 2.36x |
| | | U/W NOI Debt Yield: | | 9.5% |
Leased Portfolio #29 Mortgage Loan. For the purposes of the preceding two sentences, the Walgreens leases, which grant early termination rights to Walgreens, were assumed to expire on the date when the earliest termination right under the lease, if exercised, would be effective.
The following table presents certain information relating to the ExchangeRight Properties.
ExchangeRight Properties Summary
Tenant Name City, State | Year Built/ Renovated | Tenant NRSF | %of Portfolio NRSF | Lease Expiration Date | Appraised Value | % of Portfolio Appraised Value | Annual UW Base Rent | Annual UW Base Rent PSF | % of Annual UW Base Rent |
| Fresenius Medical Care(1)Fayetteville, NC | 2017/NAP | 23,529 | 6.7% | 1/31/2031 | $11,700,000 | 11.6% | $792,833 | $33.70 | 12.2% |
BioLife Plasma Services L.P.(2) Mesa, AZ | 2019/NAP | 16,694 | 4.8% | 5/31/2034 | $9,750,000 | 9.6% | $574,731 | $34.43 | 8.9% |
Hobby Lobby(3) Johnson City, TN | 1994/2019 | 55,668 | 15.9% | 1/31/2034 | $8,475,000 | 8.4% | $517,712 | $9.30 | 8.0% |
Walgreens(4) Levittown, PA | 2005/NAP | 14,820 | 4.2% | 3/31/2029 | $6,200,000 | 6.1% | $387,000 | $26.11 | 6.0% |
Walgreens(5) Lafayette, LA | 2009/NAP | 14,820 | 4.2% | 6/30/2034 | $5,920,000 | 5.8% | $370,000 | $24.97 | 5.7% |
Walgreens(6) Abita Springs, LA | 2008/NAP | 14,490 | 4.1% | 6/30/2033 | $5,810,000 | 5.7% | $363,000 | $25.05 | 5.6% |
Walgreens(7) Coon Rapids, MN | 2000/NAP | 14,490 | 4.1% | 6/30/2029 | $5,700,000 | 5.6% | $358,000 | $24.71 | 5.5% |
Walgreens(8) Gonzales, LA | 2008/NAP | 14,820 | 4.2% | 10/31/2032 | $5,560,000 | 5.5% | $347,370 | $23.44 | 5.4% |
CVS Pharmacy(9) Mounds View, MN | 2004/NAP | 13,013 | 3.7% | 1/31/2031 | $5,200,000 | 5.1% | $323,113 | $24.83 | 5.0% |
Fresenius Medical Care(10) Muncie, IN | 1984/NAP | 12,111 | 3.5% | 1/31/2029 | $5,000,000 | 4.9% | $401,271 | $33.13 | 6.2% |
Tractor Supply(11) Angleton, TX | 2016/NAP | 21,702 | 6.2% | 12/31/2030 | $4,900,000 | 4.8% | $298,191 | $13.74 | 4.6% |
Tractor Supply(11) Bartonville, TX | 2019/NAP | 19,097 | 5.5% | 12/31/2033 | $4,800,000 | 4.7% | $294,999 | $15.45 | 4.5% |
Walgreens(12) St. Louis, MO | 1997/NAP | 13,905 | 4.0% | 1/31/2031 | $3,500,000 | 3.5% | $236,000 | $16.97 | 3.6% |
Walgreens(13) Canton, OH | 1994/NAP | 13,500 | 3.9% | 7/31/2024 | $3,000,000 | 3.0% | $204,487 | $15.15 | 3.1% |
Dollar General(14) Harvey, LA | 2014/NAP | 9,100 | 2.6% | 11/30/2029 | $2,200,000 | 2.2% | $142,721 | $15.68 | 2.2% |
Dollar General(15) Springfield, OH | 2013/NAP | 9,026 | 2.6% | 1/31/2029 | $1,675,000 | 1.7% | $115,730 | $12.82 | 1.8% |
Dollar General(16) Middletown, OH | 2018/NAP | 9,100 | 2.6% | 6/30/2033 | $1,590,000 | 1.6% | $104,968 | $11.53 | 1.6% |
Dollar General(15) Griffith, IN | 2019/NAP | 9,026 | 2.6% | 11/30/2034 | $1,550,000 | 1.5% | $99,728 | $11.05 | 1.5% |
Dollar General(15) Painesville, OH | 2019/NAP | 9,100 | 2.6% | 8/31/2034 | $1,490,000 | 1.5% | $96,839 | $10.64 | 1.5% |
Dollar General(15) Cleveland, OH | 2019/NAP | 7,489 | 2.1% | 8/31/2034 | $1,465,000 | 1.4% | $93,618 | $12.50 | 1.4% |
Dollar General(14) Lafayette, LA | 2019/NAP | 9,026 | 2.6% | 6/30/2034 | $1,450,000 | 1.4% | $93,350 | $10.34 | 1.4% |
Dollar General(14) Uniontown, OH | 2014/NAP | 9,026 | 2.6% | 11/30/2029 | $1,440,000 | 1.4% | $95,040 | $10.53 | 1.5% |
Dollar General(14) St. Joseph, MO (50th Street) | 2019/NAP | 9,002 | 2.6% | 8/31/2024 | $1,425,000 | 1.4% | $91,641 | $10.18 | 1.4% |
Dollar General(14) St. Joseph, MO (Frederick Avenue) | 2019/NAP | 7,489 | 2.1% | 7/31/2034 | $1,400,000 | 1.4% | $90,051 | $12.02 | 1.4% |
| Total/Weighted Average | | 350,043 | 100.0% | | $101,200,000 | 100.0% | $6,492,393 | $18.55 | 100.0% |
| (1) | Fresenius Medical Carehas three five-year renewal options upon 180 days’ notice at fixed rents. |
| (2) | BioLife Plasma Services L.P.has the right to terminate its lease upon providing 30 days written notice and payment of a lease termination payment equal to the net present value of the total obligation for base rent and additional rent for the remainder of the current term, using an annual discount rate equal to the prime rate as reported in The Wall Street Journal on the date of the termination, provided that such rate does not exceed 8.25%. The components of additional rent for the remainder of the term must be calculated using the actual amount of each such component for the most recently completed lease year, increased by 2.50% annually for each remaining lease year of the term. See “Escrows—BioLife Rollover Reserve”. |
| (3) | Hobby Lobby has three five-year renewal options upon six months notice at fixed rents. |
| (4) | Walgreenshas a stated lease expiration date of March 31, 2079 and the right to terminate the lease effective as of March 31, 2029, or the end of any five-year period thereafter, upon twelve months’ prior notice. The lease expiration date presented in the table is the date when the earliest termination right, if exercised, would be effective. |
| (5) | Walgreenshas a stated lease expiration date of June 30, 2084 and the right to terminate the lease effective as of June 30, 2034, or as of the last day of any month thereafter, upon 12 months’ prior notice. The lease expiration date presented in the table is the date when the earliest termination right, if exercised, would be effective. |
| (6) | Walgreenshas a stated lease expiration date of June 30, 2083 and the right to terminate the lease effective as of June 30, 2033, or as of the last day of any month thereafter, upon 12 months’ prior notice. The lease expiration date presented in the table is the date when the earliest termination right, if exercised, would be effective. |
THE INFORMATION IN THIS STRUCTURAL AND COLLATERAL TERM SHEET IS NOT COMPLETE AND MAY BE AMENDED PRIOR TO THE TIME OF SALE. THIS TERM SHEET IS NOT AN OFFER TO SELL THESE SECURITIES AND IT IS NOT A SOLICITATION OF AN OFFER TO BUY THESE SECURITIES IN ANY JURISDICTION WHERE THE OFFER OR SALE IS NOT PERMITTED.
55
| Property Types – Various | Loan #6 | Cut-off Date Balance: | | $62,527,000 |
| Property Addresses – Various | ExchangeRight Net Leased Portfolio #29 | Cut-off Date LTV: | | 61.8% |
| | | U/W NCF DSCR: | | 2.36x |
| | | U/W NOI Debt Yield: | | 9.5% |
| (7) | Walgreenshas a stated lease expiration date of June 30, 2061 and the right to terminate the lease effective as of June 30, 2029, or the end of any five-year period thereafter, upon six months’ prior notice. The lease expiration date presented in the table is the date when the earliest termination right, if exercised, would be effective. |
| (8) | Walgreenshas a stated lease expiration date of September 30, 2082 and the right to terminate the lease effective as of October 31, 2032, or as of the last day of any month thereafter, upon 12 months’ prior notice. The lease expiration date presented in the table is the date when the earliest termination right, if exercised, would be effective. |
| (9) | CVS Pharmacy has four five-year renewal options upon 180 days’ notice at fixed rents. |
| (10) | Fresenius Medical Carehas two five-year renewal options upon 180 days’ notice at fixed rents. |
| (11) | Tractor Supply has four five-year renewal options upon 180 days’ notice at fixed rents. |
| (12) | Walgreenshas a stated lease expiration date of January 31, 2058 and the right to terminate the lease effective as of January 31, 2031, or the end of any five-year period thereafter, upon 12 months’ prior notice. The lease expiration date presented in the table is the date when the earliest termination right, if exercised, would be effective. |
| (13) | Walgreenshas a stated lease expiration date of July 31, 2044 and the right to terminate the lease effective as of July 31, 2024, or the end of any five-year period thereafter, upon 12 months’ prior notice. The lease expiration date presented in the table is the date when the earliest termination right, if exercised, would be effective. |
| (14) | Dollar General has four five-year renewal options upon 180 days’ notice at fixed rents. |
| (15) | Dollar General has five five-year renewal options upon 180 days’ notice at fixed rents. |
| (16) | Dollar General has three five-year renewal options upon 180 days’ notice at fixed rents. |
Major Tenants. The following table presents certain information relating to the major tenants at the ExchangeRight Properties:
Major Tenants
| Tenant Name | Credit Rating (S&P/Moody’s/Fitch)(1) | No of Prop. | Tenant NRSF | % of
NRSF | Annual
U/W Base Rent | Annual U/W Base Rent PSF | % of Total Annual U/W Base Rent |
| Major Tenants | | | | | | | |
| Walgreens | BBB / Baa2 / BBB | 7 | 100,845 | 28.8% | $2,265,857 | $22.47 | 34.9% |
| Dollar General | BBB / Baa2 / NR | 10 | 87,384 | 25.0% | $1,023,686 | $11.71 | 15.8% |
| BioLife Plasma Services L.P. | NR / NR / NR | 1 | 16,694 | 4.8% | $574,731 | $34.43 | 8.9% |
| Fresenius Medical Care | BBB / Baa3 / BBB- | 2 | 35,640 | 10.2% | $1,194,104 | $33.50 | 18.4% |
| Tractor Supply | NR / NR / NR | 2 | 40,799 | 11.7% | $593,190 | $14.54 | 9.1% |
| Hobby Lobby | NR / NR / NR | 1 | 55,668 | 15.9% | $517,712 | $9.30 | 8.0% |
| CVS Pharmacy | BBB / Baa2 / NR | 1 | 13,013 | 3.7% | $323,113 | $24.83 | 5.0% |
| Total Major Tenants | 24 | 350,043 | 100.0% | $6,492,393 | $18.55 | 100.0% |
| | | | | | | | |
| Vacant Space | | 0 | 0.0% | | | |
| | | | | | | |
| Collateral Total | | 350,043 | 100.0% | | | |
| | | | | | | | |
| (1) | Certain ratings are those of the parent company whether or not the parent company guarantees the lease. |
The following table presents certain information relating to the lease expiration schedule at the ExchangeRight Properties:
Lease Expiration Schedule(1)(2)
Year Ending
December 31, | No. of Leases Expiring | Expiring NRSF | % of Total NRSF | Cumulative Expiring NRSF | Cumulative % of Total NRSF | Annual
U/W
Base Rent | % of Total Annual U/W Base Rent | Annual
U/W
Base Rent
PSF |
| 2019 | 0 | 0 | 0.0% | 0 | 0.0% | $0 | 0.0% | $0.00 |
| 2020 | 0 | 0 | 0.0% | 0 | 0.0% | $0 | 0.0% | $0.00 |
| 2021 | 0 | 0 | 0.0% | 0 | 0.0% | $0 | 0.0% | $0.00 |
| 2022 | 0 | 0 | 0.0% | 0 | 0.0% | $0 | 0.0% | $0.00 |
| 2023 | 0 | 0 | 0.0% | 0 | 0.0% | $0 | 0.0% | $0.00 |
| 2024 | 2 | 22,502 | 6.4% | 22,502 | 6.4% | $296,128 | 4.6% | $13.16 |
| 2025 | 0 | 0 | 0.0% | 22,502 | 6.4% | $0 | 0.0% | $0.00 |
| 2026 | 0 | 0 | 0.0% | 22,502 | 6.4% | $0 | 0.0% | $0.00 |
| 2027 | 0 | 0 | 0.0% | 22,502 | 6.4% | $0 | 0.0% | $0.00 |
| 2028 | 0 | 0 | 0.0% | 22,502 | 6.4% | $0 | 0.0% | $0.00 |
| 2029 | 6 | 68,573 | 19.6% | 91,075 | 26.0% | $1,499,762 | 23.1% | $21.87 |
| Thereafter | 16 | 258,968 | 74.0% | 350,043 | 100.0% | $4,696,504 | 72.3% | $18.14 |
| Vacant | 0 | 0 | 0.0% | 350,043 | 100.0% | $0 | 0.0% | $0.00 |
| Total/Weighted Average | 24 | 350,043 | 100.0% | | | $6,492,393 | 100.0% | $18.55 |
| (1) | Information obtained from the underwritten rent roll. |
| (2) | For the purposes of the table and loan underwriting, the Walgreens leases, which grant early termination rights to Walgreens, were assumed to expire on the date as of when the earliest termination right under the lease, if exercised, would be effective. |
THE INFORMATION IN THIS STRUCTURAL AND COLLATERAL TERM SHEET IS NOT COMPLETE AND MAY BE AMENDED PRIOR TO THE TIME OF SALE. THIS TERM SHEET IS NOT AN OFFER TO SELL THESE SECURITIES AND IT IS NOT A SOLICITATION OF AN OFFER TO BUY THESE SECURITIES IN ANY JURISDICTION WHERE THE OFFER OR SALE IS NOT PERMITTED.
56
| Property Types – Various | Loan #6 | Cut-off Date Balance: | | $62,527,000 |
| Property Addresses – Various | ExchangeRight Net Leased Portfolio #29 | Cut-off Date LTV: | | 61.8% |
| | | U/W NCF DSCR: | | 2.36x |
| | | U/W NOI Debt Yield: | | 9.5% |
The following table presents historical occupancy percentages at the ExchangeRight Properties:
Historical Occupancy
12/31/2014(1) | 12/31/2015(1) | 12/31/2016(1) | 12/31/2017(1) | 11/1/2019 |
| NAV | NAV | NAV | NAV | 100.0% |
| (1) | The ExchangeRight Properties were acquired by the borrower sponsor between February 21, 2019 and August 5, 2019. Historical occupancy for the portfolio of ExchangeRight Properties is not available. |
Underwritten Net Cash Flow. The following table presents certain information relating to the underwritten net cash flow at the ExchangeRight Properties:
Cash Flow Analysis(1)
| | U/W | % of
Effective
Gross
Income | U/W $
per SF |
| Base Rent(2) | $6,492,393 | 95.5% | $18.55 |
| Reimbursements | $666,628 | 9.8 | 1.90 |
| (Vacancy & Credit Loss)(3) | (357,951) | (5.3) | (1.02) |
| Effective Gross Income | $6,801,070 | 100.0% | $19.43 |
| | | | |
| Total Expenses(4) | $870,660 | 12.8% | $2.49 |
| | | | |
| Net Operating Income | $5,930,410 | 87.2% | $16.94 |
| TI/LC | 157,708 | 2.3 | 0.45 |
| Replacement Reserves | 35,004 | 0.5 | 0.10 |
| Net Cash Flow | $5,737,697 | 84.4% | $16.39 |
| | | | |
| NOI DSCR | 2.44x | | |
| NCF DSCR | 2.36x | | |
| NOI Debt Yield | 9.5% | | |
| NCF Debt Yield | 9.2% | | |
| (1) | The ExchangeRight Properties were acquired by the borrower sponsor between February 21, 2019 and August 5, 2019. Accordingly, historical operating statements are not available. |
| (2) | Base Rent is inclusive of straight-line rent credit averaged over the shorter of the lease term or loan term for BioLife Plasma Services L.P. - Mesa, AZ, Dollar General - Springfield, OH, Fresenius Medical Care - Fayetteville, NC and Fresenius Medical Care - Muncie, IN totaling $161,263. |
| (3) | The ExchangeRight Properties were 100.0% occupied as of November 1,2019 |
| (4) | Total Operating Expenses consist of a 3.0% property management fee, real estate taxes and insurance. |
Appraisal.The ExchangeRight Properties were valued individually, with the individual values reflecting a cumulative “as-is” appraised value of $101,200,000. The appraisals are valued from March 29, 2019 to August 8, 2019.
Environmental Matters. The Phase I environmental site assessments for the ExchangeRight Properties are dated from March 14, 2019 to August 16, 2019. The Phase I environmental site assessment for the Walgreens – Canton, OH Property identified a recognized environmental condition related to the historic use of the site as a service station and auto service facility, which identification was based in part on the exclusion of groundwater sampling from earlier subsurface investigations and the absence of soil confirmation sampling after earlier environmental remediation. The Phase I environmental site assessment for the Walgreens – St. Louis, MO ExchangeRight Property identified a recognized environmental condition related to the former operation of a dry cleaner (from at least 1958 to 1993) at the site, which identification was based in part on the limited information available regarding the dry cleaner’s operations and the possible use of chlorinated solvents in the dry cleaning process. On or about the origination date, the borrowers obtained a premises environmental liability insurance policy issued by Great American E & S Insurance Company with respect to pre-existing pollution conditions at the Walgreens – Canton, OH ExchangeRight Property and the Walgreens – St. Louis, MO ExchangeRight Property. The policy expires on September 4, 2032 (approximately 2 years and 11 months following the scheduled maturity date), with no extended reporting period. Coverage under the policy is generally subject to a limit equal to $2,000,000 for each pollution condition, a policy aggregate limit of liability equal to $2,000,000 and a self-insured retention equal to $50,000 (or, with respect to certain coverages, $25,000) for each coverage category. In addition, the Phase I environmental site assessment for the Walgreens – Levittown, PA ExchangeRight Property identified a controlled recognized environmental condition related to the historic occupancy of a gasoline service station and automobile repair shop at the site from the 1960s until 2003, which identification was based in part on the existence of regulatory database listings of the site in connection with earlier removals of underground storage tanks and hydraulic lifts and earlier soil and groundwater remediation. Finally, the Phase I environmental site assessment for the Dollar General –
THE INFORMATION IN THIS STRUCTURAL AND COLLATERAL TERM SHEET IS NOT COMPLETE AND MAY BE AMENDED PRIOR TO THE TIME OF SALE. THIS TERM SHEET IS NOT AN OFFER TO SELL THESE SECURITIES AND IT IS NOT A SOLICITATION OF AN OFFER TO BUY THESE SECURITIES IN ANY JURISDICTION WHERE THE OFFER OR SALE IS NOT PERMITTED.
57
| Property Types – Various | Loan #6 | Cut-off Date Balance: | | $62,527,000 |
| Property Addresses – Various | ExchangeRight Net Leased Portfolio #29 | Cut-off Date LTV: | | 61.8% |
| | | U/W NCF DSCR: | | 2.36x |
| | | U/W NOI Debt Yield: | | 9.5% |
Cleveland, OH ExchangeRight Property identified a controlled recognized environmental condition related to the former use of the site as a gas station from at least 1956 to approximately 2002, which identification was based in part on the issuance of an earlier no further action letter with a property restriction to the effect that a ground water ingestion pathway should be eliminated. See “Description of the Mortgage Pool—Environmental Considerations” in the Preliminary Prospectus.
Escrows.
Real Estate Taxes –The ExchangeRight Net Leased Portfolio #29 Mortgage Loan documents require upfront escrows in the amount of $526,625 for real estate taxes. Commencing in November 2020, the ExchangeRight Net Leased Portfolio #29 Borrower will be required to make monthly deposits in an amount equal to 1/12th of the real estate taxes that the lender estimates will be payable during the next 12 months, initially $43,885, except that no deposits will be required on account of taxes with respect to the Direct Pay Tenants (as defined below for this purpose) for so long as (i) no event of default under the ExchangeRight Net Leased Portfolio #29 Mortgage Loan has occurred and is continuing, (ii) the ExchangeRight Net Leased Portfolio #29 Borrower provides proof of payment by the tenant (or the ExchangeRight Net Leased Portfolio #29 Borrower) directly to the taxing authority on or before 15 days prior to the last date on which the taxes can be paid without the accrual of interest or penalties, (iii) the tenant’s lease is not subject to any default beyond any applicable grace or notice and cure period by either the ExchangeRight Net Leased Portfolio #29 Borrower or the tenant, and (iv) no material adverse change has (in the lender’s reasonable determination) occurred with respect to the applicable tenant such that its ability to timely pay the taxes has been materially jeopardized. For the purpose of real estate taxes, “Direct Pay Tenant” means any tenant which has the right or the obligation pursuant to its lease to pay taxes for the applicable ExchangeRight Property directly to the applicable taxing authority and is actually exercising such right or complying with such obligation, as applicable. The ExchangeRight Net Leased Portfolio #29 Mortgage Loan documents provide that the initial such Direct Pay Tenants are the tenants at the BioLife Plasma Services L.P., Walgreens – Levittown, PA, Walgreens – Coon Rapids, MN, Walgreens – St. Louis, MO, Walgreens – Canton, OH, Walgreens – Abita Springs, LA, Walgreens – Lafayette, LA, Walgreens – Gonzales, LA, Tractor Supply – Bartonville, TX and Tractor Supply – Angleton, TX Properties.
Insurance – If the casualty and liability insurance with respect to the ExchangeRight Net Leased Portfolio #29 are not maintained under a lender-approved blanket policy, the ExchangeRight Net Leased Portfolio #29 Borrower will be required to make monthly deposits into an insurance reserve in an amount equal to 1/12th of the insurance premiums that the lender estimates will be payable for the renewal of the coverage afforded by the insurance policies upon the expiration thereof, except that no deposits will be required on account of insurance premiums with respect to the Direct Pay Tenants (as defined below for this purpose) for so long as (i) no event of default under the ExchangeRight Net Leased Portfolio #29 Mortgage Loan has occurred and is continuing, (ii) the ExchangeRight Net Leased Portfolio #29 Borrower provides proof of payment by the tenant (or the ExchangeRight Net Leased Portfolio #29 Borrower) directly to the insurance company on or before 15 days prior to the due date for insurance premiums, (iii) the tenant’s lease is not subject to any default beyond any applicable grace or notice and cure period by either the ExchangeRight Net Leased Portfolio #29 Borrower or the tenant, and (iv) no material adverse change has (in the lender’s reasonable determination) occurred with respect to the applicable tenant such that its ability to timely pay the insurance premiums has been materially jeopardized. For the purpose of insurance premiums, “Direct Pay Tenant” means any tenant which has the right or the obligation pursuant to its lease to maintain all or a portion of the insurance for the applicable ExchangeRight Property and to pay insurance premiums directly to the applicable insurance company and is actually exercising such right or complying with such obligation, as applicable. The ExchangeRight Net Leased Portfolio #29 Mortgage Loan documents provide that the initial such Direct Pay Tenants are the tenants at the Dollar General – Cleveland, OH, Dollar General – Griffith, IN, Dollar General – Lafayette, LA, Dollar General – Middletown, OH, Dollar General – Painesville, OH, Dollar General – St. Joseph, MO (50th Street) and Dollar General – St. Joseph, MO (Frederick Avenue) Properties.
Replacement Reserve –The ExchangeRight Net Leased Portfolio #29 Mortgage Loan documents require an upfront replacement reserve in the amount of $102,000, which may be used only in connection with replacing the roof at the Walgreens – Coon Rapids, MN Property. The ExchangeRight Net Leased Portfolio #29 Mortgage Loan documents also require monthly deposits into a replacement reserve. The required amount of the monthly deposit into the replacement reserve is equal to 1/12th of the product obtained by multiplying $0.15 by the aggregate number of rentable square feet of space at the ExchangeRight Properties, except that no such deposit need be made in respect of the aggregate number of rentable square feet at the BioLife Plasma Services, L.P. – Mesa, AZ, Dollar General – Springfield, OH, Dollar General – Painesville, OH, Dollar General – Harvey, LA, Dollar General – Uniontown, OH, Dollar General – Cleveland, OH, Dollar General – Middletown, OH, Dollar General – Griffith, IN, Dollar General – St. Joseph (Frederick Ave.), MO, Dollar General – St. Joseph (50th Street), MO, Dollar General – Lafayette, LA, Walgreens – Levittown, PA, Walgreens – Abita Springs, LA, Walgreens – Lafayette, LA and Walgreens – Gonzales, LA ExchangeRight Properties (with respect to which the ExchangeRight Net Leased Portfolio Mortgage Loan documents include an acknowledgement that the tenants are required to pay capital expenses under their leases) for so long as (i) no event of default has occurred and continuing, (ii) the borrowers provide proof of payment by all such tenants of the payment of all such capital expenses promptly following request by the lender, (iii) the leases with the applicable tenants continue in full force and effect and are not subject to any default beyond any applicable grace or notice and cure period by either the borrower or the tenant, and (iv) no material adverse change has occurred with respect to the applicable tenant such that the ability to timely pay the capital expenses for its respective premises pursuant to its lease has, in the lender’s reasonable determination, been materially jeopardized. The initial amount of the required monthly deposits into the replacement reserve is equal to $2,338.
Tenant Improvements and Leasing Commissions Reserve -The ExchangeRight Net Leased Portfolio #29 Mortgage Loan documents require upfront escrows in the amount of $500,000 for tenant improvements and leasing commissions. Upon an event of default, the ExchangeRight Net Leased Portfolio #29 Borrower will be required to make monthly deposits in the amount of $20,419 for tenant improvements and leasing commissions.
Required Repair Reserve – The ExchangeRight Net Leased Portfolio #29 Mortgage Loan documents require an upfront reserve in the amount of $406,929 for specified repairs, including the replacement of the roof system at each of the Walgreens – Canton, OH Property
THE INFORMATION IN THIS STRUCTURAL AND COLLATERAL TERM SHEET IS NOT COMPLETE AND MAY BE AMENDED PRIOR TO THE TIME OF SALE. THIS TERM SHEET IS NOT AN OFFER TO SELL THESE SECURITIES AND IT IS NOT A SOLICITATION OF AN OFFER TO BUY THESE SECURITIES IN ANY JURISDICTION WHERE THE OFFER OR SALE IS NOT PERMITTED.
58
| Property Types – Various | Loan #6 | Cut-off Date Balance: | | $62,527,000 |
| Property Addresses – Various | ExchangeRight Net Leased Portfolio #29 | Cut-off Date LTV: | | 61.8% |
| | | U/W NCF DSCR: | | 2.36x |
| | | U/W NOI Debt Yield: | | 9.5% |
(at an estimated cost of $110,462) and the Walgreens – St. Louis, MO ExchangeRight Property (at an estimated cost of $77,115) and the replacement of the roof membrane at Fresenius Medical Care – Muncie, IN Property (at an estimated cost of $72,666). All of the specified repairs are required to be completed within 180 days following the origination date.
BioLife Rollover Reserve – If BioLife Plasma Services L.P. exercises its option to terminate its lease at the BioLife Plasma Services L.P. upon 30 days’ notice (see footnote (2) to the table titled “ExchangeRight Properties Summary”), the ExchangeRight Net Leased Portfolio #29 Borrower is required to (or cause the ExchangeRight Net Leased Portfolio #29 Master Tenant or the property manager to) deposit the lease termination payment into a tenant-specific rollover reserve. Amounts in the tenant-specific rollover reserve are thereafter required to be applied to make monthly disbursements to the ExchangeRight Net Leased Portfolio #29 Borrower (or, during a Cash Management Period (as defined below), to the cash management account) equal to one-month’s rent that would then have been due under the lease had it remained in effect; to pay lender-approved tenant improvements and leasing commissions with respect to the BioLife Plasma Services L.P. Property; and to release the remaining amount to the ExchangeRight Net Leased Portfolio #29 Borrower if and when the BioLife Plasma Services L.P. Property is fully re-leased pursuant to one or more lender-approved replacement leases and each replacement tenant has taken occupancy and opened for business.
Lockbox and Cash Management.The ExchangeRight Net Leased Portfolio #29 Mortgage Loan is structured with a hard lockbox and springing cash management. The ExchangeRight Net Leased Portfolio #29 Borrower is required to (or to cause the ExchangeRight Net Leased Portfolio #29 Master Tenant or property manager to) cause all rents relating to the ExchangeRight Properties to be transmitted directly by the tenants of each property into the lockbox account and, to the extent that such rents are received by the ExchangeRight Net Leased Portfolio #29 Borrower (or ExchangeRight Net Leased Portfolio #29 Master Tenant or property manager), cause such amounts to be deposited into the clearing account within two business days following receipt. The clearing account bank is required to sweep such funds into the ExchangeRight Net Leased Portfolio #29 Master Tenant’s operating account on each business day other than during a Cash Management Period. Upon the delivery of notice by the lender of the commencement of the initial Cash Management Period, if any, the ExchangeRight Net Leased Portfolio #29 Borrower is required to establish a lender-controlled cash management account, into which account all funds in the lockbox account will be required to be deposited periodically so long as a Cash Management Period is continuing. So long as a Cash Management Period is continuing, funds in the cash management account are required to be applied (i) to make the next monthly deposits (to the extent required) into the real estate taxes and insurance reserves as described above under “—Escrows”, (ii) to reserve the next monthly debt service payment due on the ExchangeRight Net Leased Portfolio #29 Mortgage Loan, (iii) to make the next monthly deposits into the replacement reserve and the tenant improvements and leasing commissions reserve as described above under “—Escrows”, (iv) to pay operating expenses set forth in the annual budget (which is required to be approved by the lender) and additional operating expenses reasonably approved by the lender and (v) to deposit any remainder into a cash collateral subaccount to be held as additional security for the ExchangeRight Net Leased Portfolio #29 Mortgage Loan during such Cash Management Period. Upon cessation of a Cash Management Period, all available amounts on deposit in the cash management account must be deposited in the ExchangeRight Net Leased Portfolio #29 Borrower’s operating account.
A “Cash Management Period” means a period:
| (i) | commencing upon the stated maturity date of the ExchangeRight Net Leased Portfolio #29 Mortgage Loan, or |
| (ii) | commencing upon a default or an event of default under the ExchangeRight Net Leased Portfolio #29 Mortgage Loan and ending if and when such event of default has been cured (and no other event of default has occurred), or |
| (iii) | commencing if and when the interest-only debt service coverage ratio (based on net operating income for the trailing 12 months) as of the end of any calendar quarter is less than 1.50x and ending if and when the interest-only debt service coverage ratio (based on net operating income for the trailing 12 months) is at least 1.55x as of the ends of each of two consecutive calendar quarters, or |
| (iv) | commencing on October 1, 2026 (36 months before the stated maturity date of the ExchangeRight Net Leased Portfolio #29 Mortgage Loan), unless a Qualified Transfer has occurred as of such date (see “The Borrower and the Borrower Sponsor” above), and ending if and when a Qualified Transfer occurs. |
Property Management. The ExchangeRight Properties are managed by NLP Management, LLC, an affiliate of the ExchangeRight Net Leased Portfolio #29 Borrower.
Partial Release. Not permitted.
Real Estate Substitution.Not permitted.
Subordinate and Mezzanine Indebtedness.Not permitted
Ground Lease. None.
Rights of First Refusal.The related single tenant at each of eight ExchangeRight Properties -- the Walgreens – Levittown, PA, Walgreens – Coon Rapids, MN, Walgreens – St. Louis, MO, Walgreens – Abita Springs, LA, Walgreens – Lafayette, LA, Walgreens – Gonzales, LA, Tractor Supply – Bartonville, TX, and Tractor Supply – Angleton, TX ExchangeRight Properties – has a right of first refusal to purchase the related ExchangeRight Property. In each case, the tenant executed a subordination, non-disturbance and attornment agreement that subordinates the right of first refusal, with the effect that the right would not apply in connection with a foreclosure, deed-in-lieu thereof or other enforcement action under the ExchangeRight Net Leased Portfolio #29 Mortgage Loan (but would apply in connection with any subsequent transfer). In addition, Verizon Wireless, which leases a parcel at the BioLife Plasma Services L.P. –
THE INFORMATION IN THIS STRUCTURAL AND COLLATERAL TERM SHEET IS NOT COMPLETE AND MAY BE AMENDED PRIOR TO THE TIME OF SALE. THIS TERM SHEET IS NOT AN OFFER TO SELL THESE SECURITIES AND IT IS NOT A SOLICITATION OF AN OFFER TO BUY THESE SECURITIES IN ANY JURISDICTION WHERE THE OFFER OR SALE IS NOT PERMITTED.
59
| Property Types – Various | Loan #6 | Cut-off Date Balance: | | $62,527,000 |
| Property Addresses – Various | ExchangeRight Net Leased Portfolio #29 | Cut-off Date LTV: | | 61.8% |
| | | U/W NCF DSCR: | | 2.36x |
| | | U/W NOI Debt Yield: | | 9.5% |
Mesa, AZ ExchangeRight Property on which it has constructed and owns a cell tower, or any successor tenant under the Verizon Wireless lease, has a right of first refusal to purchase the entire BioLife Plasma Services L.P. – Mesa, AZ ExchangeRight Property in connection with any sale or other transfer of all or a portion of the BioLife Plasma Services L.P. – Mesa, AZ ExchangeRight Property or the grant to a third party of an easement over the leased parcel for the operation of a communications facility. The Verizon Wireless right of first refusal is not subject to a subordination and standstill agreement. The non-recourse careveout guaranty requires the non-recourse carveout guarantors to pay any loss incurred by the lender arising out of or in connection with any claim or demand that the tenant of the cell tower parcel at the BioLife Plasma Services L.P. – Mesa, AZ ExchangeRight Property is or was entitled to exercise a right of first refusal to purchase the BioLife Plasma Services L.P. – Mesa, AZ ExchangeRight Property pursuant to the Verizon Wireless lease as a result of (or the right of first refusal was otherwise triggered by) a foreclosure, deed-in-lieu of foreclosure or other exercise by the lender of its rights and/or remedies under the ExchangeRight Net Leased Portfolio #29 Mortgage Loan documents, except that in no event will such liability exceed the sum of $6,045,000 and the lender’s actual costs and expenses. There is no liability under the non-recourse carveout guaranty for losses or liabilities arising out of or in connection with the Verizon Wireless right of first refusal with respect to any subsequent transfer. This non-recourse carveout liability with respect to the Verizon Wireless right of first refusal will terminate if and when Verizon Wireless (or its successor) delivers a subordination, non-disturbance and attornment agreement expressly subordinating the lease and stating that the right of first refusal will not apply to a foreclosure, a deed in lieu of foreclosure or other exercise by the lender of its rights and/or remedies under the ExchangeRight Net Leased Portfolio #29 Mortgage Loan documents. See “Description of the Mortgage Pool—Tenant Leases—Purchase Options and Rights of First Refusal” in the Preliminary Prospectus.
Terrorism Insurance.The ExchangeRight Net Leased Portfolio #29 Mortgage Loan documents require that the property insurance policy required to be maintained by the ExchangeRight Net Leased Portfolio #29 Borrower provide coverage, provided that such coverage is available, for perils and acts of terrorism in an amount equal to 100% of the full replacement cost of the ExchangeRight Properties plus loss of rents or business income for a period of not less than 18 months for the initial period of restoration. See“Risk Factors—Risks Relating to the Mortgage Loans—Terrorism Insurance May Not Be Available for All Mortgaged Properties”in the Preliminary Prospectus.
THE INFORMATION IN THIS STRUCTURAL AND COLLATERAL TERM SHEET IS NOT COMPLETE AND MAY BE AMENDED PRIOR TO THE TIME OF SALE. THIS TERM SHEET IS NOT AN OFFER TO SELL THESE SECURITIES AND IT IS NOT A SOLICITATION OF AN OFFER TO BUY THESE SECURITIES IN ANY JURISDICTION WHERE THE OFFER OR SALE IS NOT PERMITTED.
60
| Other – Leased Fee | Loan # 7 | Cut-off Date Balance: | | $61,000,000 |
| 127 West 25thStreet | 127 West 25th Street | Cut-off Date LTV: | | 64.9% |
| New York, NY 10001 | | U/W NCF DSCR: | | 1.71x |
| | | U/W NOI Debt Yield: | | 6.7% |
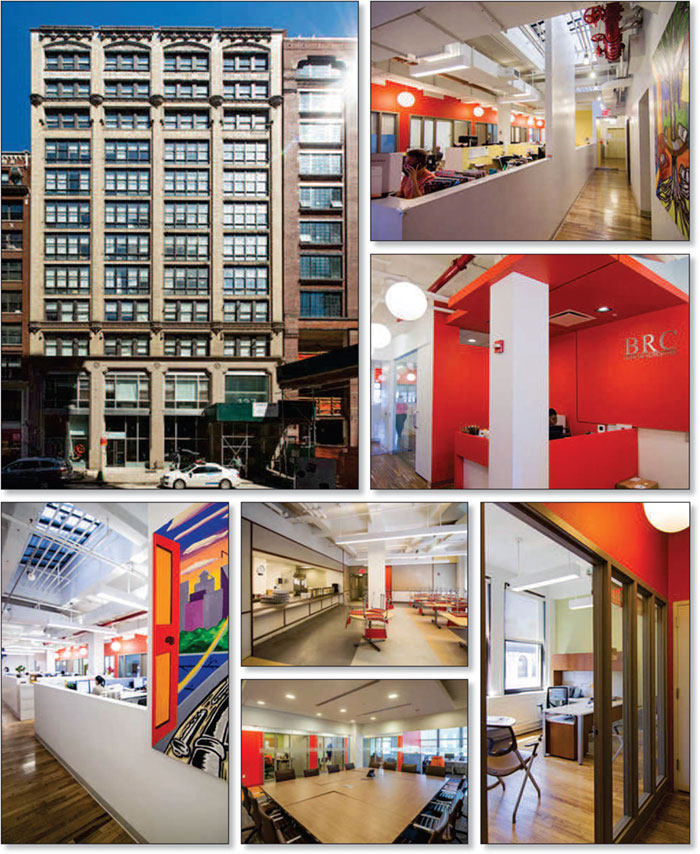
THE INFORMATION IN THIS STRUCTURAL AND COLLATERAL TERM SHEET IS NOT COMPLETE AND MAY BE AMENDED PRIOR TO THE TIME OF SALE. THIS TERM SHEET IS NOT AN OFFER TO SELL THESE SECURITIES AND IT IS NOT A SOLICITATION OF AN OFFER TO BUY THESE SECURITIES IN ANY JURISDICTION WHERE THE OFFER OR SALE IS NOT PERMITTED.
61
| No. 7– 127 West 25th Street |
| |
| Mortgage Loan Information | | Mortgaged Property Information |
| Mortgage Loan Seller: | Bank of America, National Association | | Single Asset/Portfolio: | Single Asset |
| Credit Assessment (DBRS/Fitch/S&P): | NR/NR/NR | | Property Type – Subtype: | Other – Leased Fee |
| Original Principal Balance: | $61,000,000 | | Location: | New York, NY |
| Cut-off Date Balance: | $61,000,000 | | Size: | 104,000 SF |
| % of Initial Pool Balance: | 5.1% | | Cut-off Date Balance Per SF: | $587 |
| Loan Purpose: | Refinance | | Maturity Date/ARD Balance Per SF(1): | $587 |
| Borrower Sponsor: | Foremost Real Estate | | Year Built/Renovated: | 1912/2012 |
| Guarantor: | Dan Shavolian | | Title Vesting: | Fee |
| Mortgage Rate: | 3.8400% | | Property Manager: | Self-managed |
| Note Date: | October 4, 2019 | | Current Occupancy (As of): | 100.0% (11/1/2019) |
| Seasoning: | 0 months | | YE 2018 Occupancy: | 100.0% |
| Anticipated Repayment Date(1): | November 1, 2029 | | YE 2017 Occupancy: | 100.0% |
| Maturity Date(1): | November 1, 2034 | | | |
| IO Period: | 120 months | | YE 2016 Occupancy: | 100.0% |
| Loan Term (Original)(1): | 120 months | | YE 2015 Occupancy: | 100.0% |
| Amortization Term (Original): | NAP | | As-Is Appraised Value: | $94,000,000 |
| Loan Amortization Type: | Interest-only, ARD | | As-Is Appraised Value Per SF: | $904 |
| Call Protection: | L(24),D(92),O(4) | | As-Is Appraisal Valuation Date: | September 13, 2019 |
| Lockbox Type: | Hard/Upfront Cash Management | | Underwriting and Financial Information |
| Additional Debt: | NAP | | YE 2018 NOI: | $4,286,685 |
| Additional Debt Type (Balance): | NAP | | YE 2017 NOI: | $4,229,588 |
| | | | YE 2016 NOI: | $4,149,650 |
| | | | U/W Revenues: | $4,072,351 |
| | | | U/W Expenses: | $0 |
| Escrows and Reserves(2) | | U/W NOI: | $4,072,351 |
| | Initial | Monthly | Cap | | U/W NCF: | $4,072,351 |
| Taxes | $0 | Springing | NAP | | U/W DSCR based on NOI/NCF: | 1.71x / 1.71x |
| Insurance | $0 | Springing | NAP | | U/W Debt Yield based on NOI/NCF: | 6.7% / 6.7% |
| Replacement Reserve | $0 | Springing | NAP | | U/W Debt Yield at Maturity/ARD based on NOI/NCF(1): | 6.7% / 6.7% |
| TI/LC | $0 | Springing | NAP | | Cut-off Date LTV Ratio: | 64.9% |
| | | | | | LTV Ratio at Maturity/ARD(1): | 64.9% |
| Sources and Uses |
| Sources | | | | | Uses | | | |
| Loan Amount | $61,000,000 | | 100.0% | | Loan payoff | $47,797,646 | | 78.4% |
| | | | | | Return of equity | 10,717,497 | | 17.6 |
| | | | | | Closing costs | 2,484,857 | | 4.1 |
| Total Sources | $61,000,000 | | 100.0% | | Total Uses | $61,000,000 | | 100.0% |
| (1) | The 127 West 25th Street Mortgage Loan is structured with a 120-month loan term until the Anticipated Repayment Date (“ARD”) of November 1, 2029 and will be interest-only prior to the ARD. From and after the ARD, the 127 West 25th Street Mortgage Loan will accrue additional interest at a fixed rate of 3.0000% plus the greater of (a) the ten-year treasury rate as of the ARD plus 2.400% or (b) 3.8400%, which will be deferred and due and payable on the Maturity Date of November 1, 2034 (or earlier repayment in full of the 127 West 25th Street Mortgage Loan.) The ARD automatically triggers a Cash Sweep Period (see “Lockbox and Cash Management”) whereby all excess cash flow is required to be used to pay down the principal balance of the 127 West 25th Street Mortgage Loan and repay the additional accrued interest. |
| (2) | See “Escrows” below for further discussion of reserve requirements. |
The Mortgage Loan. The seventh largest mortgage loan (the “127 West 25th Street Mortgage Loan”), in the original principal amount of $61,000,000, is secured by a leased fee mortgage on a 104,000 square foot office building located in New York, New York (the “127 West 25th Street Property”).
The Borrower and the Borrower Sponsor.The borrower is 127 West 25th Group LLC, a Delaware limited liability company, structured to be bankruptcy-remote with at least one independent director (the “127 West 25th Street Borrower”). The borrower sponsor is Foremost Real Estate, a New York real estate owner and developer that has developed and redeveloped retail strips, residential condominiums, office buildings and a medical building. Foremost Real Estate’s current portfolio includes 469 7th Avenue, 145 East 32nd Street and the 127 West 25th Street Property in New York, New York. Dan Shavolian, the owner and CEO of Foremost Real Estate, is the non-recourse carveout guarantor for the 127 West 25th Street Mortgage Loan.
THE INFORMATION IN THIS STRUCTURAL AND COLLATERAL TERM SHEET IS NOT COMPLETE AND MAY BE AMENDED PRIOR TO THE TIME OF SALE. THIS TERM SHEET IS NOT AN OFFER TO SELL THESE SECURITIES AND IT IS NOT A SOLICITATION OF AN OFFER TO BUY THESE SECURITIES IN ANY JURISDICTION WHERE THE OFFER OR SALE IS NOT PERMITTED.
62
| Other – Leased Fee | Loan # 7 | Cut-off Date Balance: | | $61,000,000 |
| 127 West 25thStreet | 127 West 25th Street | Cut-off Date LTV: | | 64.9% |
| New York, NY 10001 | | U/W NCF DSCR: | | 1.71x |
| | | U/W NOI Debt Yield: | | 6.7% |
The Property. The 127 West 25th Street Property is comprised of a twelve-story, 104,000 square foot, Class B office building located on 25th Street between Avenue of the Americas and Seventh Avenue in the Chelsea neighborhood of Manhattan, New York. The borrower sponsor acquired the 127 West 25th Street Property in 2007 and spent a reported $17.0 million on renovations between 2010 and 2012 to replace and upgrade the electrical and mechanical systems, windows, roof, and lobby. The 127 West 25th Street Property is located within walking distance of Madison Square Park and New York Penn Station, and is served by various subway lines including the F train within one block, the R/W and No. 1 trains within two blocks, and the No. 6 train within four blocks, as well as public bus access.
Major Tenant.
Bowery Residents’ Committee (“BRC”) is a certified 501(c)(3) not-for-profit organization founded in 1971 and focused on providing housing and non-residential services for New York City’s needy individuals. BRC operates under the jurisdiction of the New York City Department of Homeless Service (“DHS”) and the New York State Office of Temporary and Disability Assistance and currently has 30 programs throughout New York City including street outreach for the unsheltered homeless, substance abuse recovery, health and mental health support, temporary housing and shelter, employment training, permanent housing and senior support. BRC’s funding comes primarily from a combination of federal, state, and City renewable grants, with the remaining funding from Medicaid, charitable donations, rental income and special events revenue. As of its fiscal year-end 2018, BRC had total revenues of $88,313,464 and $5,829,765 cash on hand.
BRC leases the 127 West 25th Street Property on a long term, triple-net ground lease which commenced on February 18, 2010 and expires in February 2043. The BRC lease does not contain any termination rights or renewal options. The annual rent is currently $4,286,685 ($41.22 per square foot), which includes a portion of remaining capital expenditures from the 2012 renovation. In June 2022, the annual base rent will be $3,676,657 ($35.35 per square foot), which will reset in June 2027 to the greater of $3,918,750 ($37.68 per square foot) or 90% of then fair market value. Annual base rent will reset again in June 2036 at the greater of $4,441,250 ($42.70 per square foot) or 90% of then fair market value. The appraiser’s concluded current market rent of $65.16 per square foot, which when adjusted to a triple-net equivalent based on 2019 operating expenses is equal to $52.76 per square foot.
BRC is headquartered at the 127 West 25th Street Property and uses its space at the property to administer its programs and to conduct its administrative, training and back office functions in connection with its other locations and programs. The basement level consists of approximately 4,445 square feet of storage. The first floor includes retail space (approximately 6,203 square feet) occupied by a sub-tenant (Senior Planet), the freight entrance, the main building lobby and a commercial kitchen. The second floor consists of a dining room and assembly rooms. The third through ninth floors have administrative offices at the front portion of each floor and living space at the rear portion. The tenth through twelfth floors are fully dedicated as administrative offices. At the 127 West 25th Street Property, BRC is currently accommodating four multi-year contracts with DHS and the New York City Department of Health and Mental Hygiene, which agencies pay contract rental payments monthly in an amount equal to $346,874 ($4,162,493 annually). 24.2% of BRC’s annual rent is reimbursed by one contract that expires in 2023 and 89.3% of BRC’s annual rent is reimbursed by the three other contracts that expire between 2029 and 2041. Two of the four contracts were most recently renewed in July 2019.
The following table presents certain information relating to the tenant at the 127 West 25th Street Property:
Major Tenant(1)
| Tenant Name | Credit Rating
(Fitch/Moody’s/
S&P) | Tenant
NRSF | % of
NRSF | Annual
U/W Base
Rent PSF | Annual
U/W Base
Rent(2) | % of
Total
Annual
U/W
Base
Rent | Lease
Expiration
Date | Extension Options | Termination
Option
(Y/N) |
| Bowery Residents’ Committee(2) | NR/NR/NR | 104,000 | 100.0% | $41.22(3) | $4,286,685 | 100.0% | 2/18/2043 | N/A | N |
| Total/Wtd. Avg. | 104,000 | 100.0% | $41.22 | $4,286,685 | 100.0% | | | |
| | | | | | | | | | |
| Collateral Total | 104,000 | 100.0% | | | | | | |
| | | | | | | | | | |
| (1) | Information based on the underwritten rent roll. |
| (2) | Bowery Residents’ Committee subleases approximately 6,203 square feet (6.0% of NSRF) on the ground floor at an annual rent of $124,192. |
| (3) | The current in-place base rent of $4,286,685 will adjust to $3,676,657 as of June 1, 2022. The rent will then step up to the greater of $3,918,750 or 90% of the then fair market value as of June 1, 2027 and again step up to the greater of $4,441,250 or 90% of the then fair market value as of June 1, 2036. |
THE INFORMATION IN THIS STRUCTURAL AND COLLATERAL TERM SHEET IS NOT COMPLETE AND MAY BE AMENDED PRIOR TO THE TIME OF SALE. THIS TERM SHEET IS NOT AN OFFER TO SELL THESE SECURITIES AND IT IS NOT A SOLICITATION OF AN OFFER TO BUY THESE SECURITIES IN ANY JURISDICTION WHERE THE OFFER OR SALE IS NOT PERMITTED.
63
| Other – Leased Fee | Loan # 7 | Cut-off Date Balance: | | $61,000,000 |
| 127 West 25thStreet | 127 West 25th Street | Cut-off Date LTV: | | 64.9% |
| New York, NY 10001 | | U/W NCF DSCR: | | 1.71x |
| | | U/W NOI Debt Yield: | | 6.7% |
The following table presents certain information relating to the lease rollover schedule at the 127 West 25th Street Property:
Lease Expiration Schedule(1)
Year Ending
December 31, | No. of
Leases Expiring | Expiring
NRSF | % of
Total
NRSF | Cumulative Expiring
NRSF | Cumulative
% of Total
NRSF | Annual
U/W
Base Rent | % of Total
Annual
U/W Base
Rent | Annual
U/W
Base Rent
PSF |
| 2019 | 0 | 0 | 0.0% | 0 | 0.0% | $0 | 0.0% | $0.00 |
| 2020 | 0 | 0 | 0.0% | 0 | 0.0% | $0 | 0.0% | $0.00 |
| 2021 | 0 | 0 | 0.0% | 0 | 0.0% | $0 | 0.0% | $0.00 |
| 2022 | 0 | 0 | 0.0% | 0 | 0.0% | $0 | 0.0% | $0.00 |
| 2023 | 0 | 0 | 0.0% | 0 | 0.0% | $0 | 0.0% | $0.00 |
| 2024 | 0 | 0 | 0.0% | 0 | 0.0% | $0 | 0.0% | $0.00 |
| 2025 | 0 | 0 | 0.0% | 0 | 0.0% | $0 | 0.0% | $0.00 |
| 2026 | 0 | 0 | 0.0% | 0 | 0.0% | $0 | 0.0% | $0.00 |
| 2027 | 0 | 0 | 0.0% | 0 | 0.0% | $0 | 0.0% | $0.00 |
| 2028 | 0 | 0 | 0.0% | 0 | 0.0% | $0 | 0.0% | $0.00 |
| 2029 | 0 | 0 | 0.0% | 0 | 0.0% | $0 | 0.0% | $0.00 |
| Thereafter | 1 | 104,000 | 100.0% | 104,000 | 100.0% | $4,286,685 | 100.0% | $41.22 |
| Vacant | 0 | 0 | 0.0% | 104,000 | 100.0% | $0 | 0.0% | $0.00 |
| Total/Weighted Average | 1 | 104,000 | 100.0% | | | $4,286,685 | 100.0% | $41.22 |
| (1) | Information based on the underwritten rent roll. |
The following table presents historical occupancy percentages at the 127 West 25th Street Property:
Historical Occupancy
2015 | 2016 | 2017 | 2018 | 11/1/2019 |
| 100.0% | 100.0% | 100.0% | 100.0% | 100.0% |
Operating History and Underwritten Net Cash Flow. The following table presents certain information relating to the operating history and underwritten net cash flow at the 127 West 25th Street Property:
Cash Flow Analysis
| | 2016 | 2017 | 2018 | U/W | %(1) | U/W $ per
SF |
| Base Rent(2) | $4,149,650 | $4,229,588 | $4,286,685 | $4,286,685 | 100.0% | $41.22 |
| Vacancy | $0 | $0 | $0 | ($214,334) | (5.0%) | ($2.06) |
| Effective Gross Income | $4,149,650 | $4,229,588 | $4,286,685 | $4,072,351 | 95.0% | $39.16 |
| | | | | | | |
| Total Operating Expenses | $0 | $0 | $0 | $0 | 0.0% | $0.00 |
| | | | | | | |
| Net Operating Income | $4,149,650 | $4,229,588 | $4,286,685 | $4,072,351 | 100.0% | $39.16 |
| Net Cash Flow | $4,149,650 | $4,229,588 | $4,286,685 | $4,072,351 | 100.0% | $39.16 |
| | | | | | | |
| NOI DSCR | 1.75x | 1.78x | 1.80x | 1.71x | | |
| NCF DSCR | 1.75x | 1.78x | 1.80x | 1.71x | | |
| NOI Debt Yield | 6.8% | 6.9% | 7.0% | 6.7% | | |
| NCF Debt Yield | 6.8% | 6.9% | 7.0% | 6.7% | | |
| (1) | Represents (i) percent of Base Rent for Base Rent and Effective Gross Income and (ii) percent of Effective Gross Income for all other fields. |
| (2) | UW Base Rent is based on the current in-place rent. The current in-place base rent of $4,286,685 will adjust to $3,676,657 as of June 1, 2022. The rent will then step up to the greater of $3,918,750 or 90% of the then fair market value as of June 1, 2027 and again step up to the greater of $4,441,250 or 90% of the then fair market value as of June 1, 2036. |
Appraisal.The appraiser concluded to an “as-is” value as of September 13, 2019 of $94,000,000 which results in both a Cut-off Date LTV Ratio and LTV Ratio at Maturity/ARD of 64.9%. The appraiser also provided an “as dark” value as of September 13, 2019 of $70,000,000, which results in both a Cut-off Date LTV Ratio and LTV Ratio at Maturity/ARD of 87.1%.
Environmental Matters.According to the Phase I environmental site assessment dated September 19, 2019, there was no evidence of any recognized environmental conditions at the 127 West 25th Street Property.
THE INFORMATION IN THIS STRUCTURAL AND COLLATERAL TERM SHEET IS NOT COMPLETE AND MAY BE AMENDED PRIOR TO THE TIME OF SALE. THIS TERM SHEET IS NOT AN OFFER TO SELL THESE SECURITIES AND IT IS NOT A SOLICITATION OF AN OFFER TO BUY THESE SECURITIES IN ANY JURISDICTION WHERE THE OFFER OR SALE IS NOT PERMITTED.
64
| Other – Leased Fee | Loan # 7 | Cut-off Date Balance: | | $61,000,000 |
| 127 West 25thStreet | 127 West 25th Street | Cut-off Date LTV: | | 64.9% |
| New York, NY 10001 | | U/W NCF DSCR: | | 1.71x |
| | | U/W NOI Debt Yield: | | 6.7% |
Market Overview.The 127 West 25th Street Property is located in the Chelsea submarket of the Midtown South office market. According to the appraiser, as of the second quarter of 2019, the Midtown South office market had a vacancy rate of 4.2% and average asking rents of $76.09 per square foot, with surrounding markets such as Hudson Square/Meatpacking and NoHo/SoHo achieving asking rents of $94.51 per square foot and $85.31 per square foot, respectively. There is a current lack of large contiguous leasable space in the Midtown South market; reportedly as of the end of the second quarter of 2019, there were only four blocks available of space greater than 100,000 square feet. The Midtown South market has a strong concentration of technology, advertising, media, and information (TAMI) companies, including as tenants Google, Facebook, Spotify, Amazon, Salesforce, LinkedIn, Yelp, Microsoft and Twitter.
According to the appraiser, as of the second quarter of 2019, the Chelsea submarket had office inventory of approximately 25.3 million square feet, with a 5.1% vacancy rate and average asking rents of $71.91 per square foot.
The estimated 2018 population within a 0.25-, 0.5 and 1.0-mile radius of the 127 West 25th Street Property was 16,267, 69,992, and 255,351, respectively. The 2018 median household income within the same radii was $126,318, $115,055 and $108,377, respectively.
The following table presents certain information relating to the appraiser’s market rent conclusion for the 127 West 25th Street Property:
Market Rent Summary
| | Office | Retail | Basement Storage |
| Market Rent (PSF) | $64.00 | $115.00 | $20.00 |
| Lease Term (Years) | 10 | 10 | 10 |
| Rent Increase Projection | 3.0%per annum | 3.0%per annum | 3.0%per annum |
The following table presents certain information from the appraisal relating to comparable properties to the 127 West 25th Street Property:
Comparable Properties
| Property Address | Year Built | Property
Size (SF) | Occupancy | Avg.
Asking
Rent |
20 West 20th Street (btw 5th/6th Aves) | 1906 | 94,622 | 100.0% | $60.00 |
54 West 21st Street (btw 5th/6th Aves) | 1910 | 150,000 | 91.72% | $65.00 |
118 West 22nd Street (btw 6th/7th Aves) | 1911 | 99,000 | 91.67% | $61.00 |
125 West 25th Street (btw 6th/7th Aves) | 1906 | 138,000 | 95.0% | $65.00 |
138 West 25th Street (btw 6th/7th Aves) | 1911 | 104,000 | 100.0% | $61.00 |
12 West 27th Street (btw Broadway/6th Ave) | 1927 | 99,340 | 100.0% | $64.00 |
| Total/Wtd. Avg. | | 684,962 | 96.40% | $62.67 |
THE INFORMATION IN THIS STRUCTURAL AND COLLATERAL TERM SHEET IS NOT COMPLETE AND MAY BE AMENDED PRIOR TO THE TIME OF SALE. THIS TERM SHEET IS NOT AN OFFER TO SELL THESE SECURITIES AND IT IS NOT A SOLICITATION OF AN OFFER TO BUY THESE SECURITIES IN ANY JURISDICTION WHERE THE OFFER OR SALE IS NOT PERMITTED.
65
| Other – Leased Fee | Loan # 7 | Cut-off Date Balance: | | $61,000,000 |
| 127 West 25thStreet | 127 West 25th Street | Cut-off Date LTV: | | 64.9% |
| New York, NY 10001 | | U/W NCF DSCR: | | 1.71x |
| | | U/W NOI Debt Yield: | | 6.7% |
The following table presents certain information from the appraisal relating to comparable leasing to the 127 West 25th Street Property:
Comparable Leases
| Property Address | Year Built | Property
Size (SF) /
Building
Class | Tenant | Lease Area
(SF)/ Floor
Leased | Lease
Date | Initial
Rent
PSF
MG | Lease Term (Mos.) |
TI
PSF |
127 West 25th Street (Subject)(1) | 1912 | 104,000 / B | BRC | 104,000 / 2-12 | Feb-10 | $41.22 | 396 | $38 |
| 30 East 23rd Street | 1912 | 36,900 / C | Vertica Capital Management, LLC | 3,000 / 6 | May-19 | $76 | 60 | $100 |
| 38-44 East 30th Street | 1915 | 95,000 / B | WeWork | 16,000 / 9-10 | Apr-19 | $59 | 101 | $65 |
| 37 East 18th Street | 1900 | 75,000 / C | Tanya Taylor Designs | 7,500 / 9 | Mar-19 | $66 | 60 | $0 |
| 7 West 18th Street | 1900 | 48,998 / B | Pendo.io | 5,377 / 2 | Jan-19 | $69 | 36 | $0 |
| 11 East 26th Street | 1913 | 246,660 / B | Butterfly Network, Inc. | 24,166 / 7-8 | Jan-19 | $67 | 124 | $75 |
| 49 West 27th Street | 1907 | 87,122 / B | WeWork | 32,411 / Mezz,2-4 | Jan-19 | $60 | 189 | $70 |
| 31 West 27th Street | 1910 | 145,856 / C | Stonehill & Taylor Architects | 17,112 / 5-6 | Jan-19 | $66 | 126 | $0 |
| 45 West 25th Street | 1909 | 118,284 / C | DoorDash | 16,324 / 10 | Aug-18 | $61 | 103 | $0 |
| 111 West 19th Street | 1901 | 185,000 / C | Flexport Inc. | 23,000 / 2 | Mar-18 | $59 | 64 | $85 |
| 45 West 27th Street | 1912 | 66,797 / B | Pinerock Productions | 5,702 / 6 | Feb-18 | $63 | 123 | $80 |
| (1) | Information obtained from the underwritten rent roll and BRC lease. |
Escrows.
Taxes and Insurance Reserves -The BRC lease is structured so that the 127 West 25th Street Property while leased to BRC is 100% exempt from real estate taxes. Monthly escrows for taxes and insurance will be waived so long as (w) no Reserve Trigger exists, (x) BRC pays (as applicable) all property taxes and insurance premiums directly, prior to becoming delinquent, (y) BRC or its lease guarantor is not insolvent or a debtor in any bankruptcy proceedings and (z) as it relates to insurance escrows, the 127 West 25th Street Property is covered by a blanket insurance policy.
Replacement Reserve –Monthly escrows of $2,167 for replacement reserves will be waived so long as (x) no Reserve Trigger exists, (y) BRC or its lease guarantor is not insolvent or a debtor in any bankruptcy proceedings, and (z) BRC maintains the 127 West 25th Street Property in a manner acceptable to the lender.
TI/LC Reserve –Monthly escrows of $8,667 for leasing reserves will be waived so long as no Reserve Trigger exists.
A “Reserve Trigger” means any of (i) the BRC lease failing to be in full force and effect or (ii) the occurrence of a Tenant Sweep Trigger Period (as defined below).
Lockbox and Cash Management.The 127 West 25th Street Mortgage Loan documents require a hard lockbox with upfront cash management. During a Cash Sweep Period, if prior to the ARD, all excess cash flow is required to be held as additional security for the 127 West 25th Street Mortgage Loan until the discontinuance of the Cash Sweep Period. If a Cash Sweep Period continues after the ARD, all excess cash collected will be applied to the reduction of principal, then to pay off additional accrued interest. A Cash Sweep Period may be cured four times; if a Cash Sweep Period occurs a fifth time or occurs after the ARD, it will continue until the full repayment of the 127 West 25th Street Mortgage Loan.
A “Cash Sweep Period” will occur: (a) when the debt service coverage ratio is less than 1.30x for any calendar quarter based on the trailing twelve month period, and ending when either the debt service coverage ratio is equal to or greater than 1.30x for two consecutive calendar quarters or when the 127 West 25th Street Borrower deposits with the lender cash or a letter of credit in the amount which if applied to pay down the 127 West 25th Street Mortgage Loan would cause the debt service coverage ratio to equal or exceed 1.30x, (b) during a Tenant Sweep Trigger Period until cured or (c) one month prior to the ARD until the full repayment of the 127 West 25th Street Mortgage Loan.
A “Tenant Sweep Trigger Period” will commence when:
(a) a Major Tenant (i) has its lease terminated (in whole or in part), (ii) has its lease fail to be in full force and effect, (iii) gives notice of its intent not to renew its lease or (iv) does not extend its lease prior to the date required pursuant to the lease;
(b) a Major Tenant has a monetary or material non-monetary default under its lease beyond any cure period;
(c) a Major Tenant becomes insolvent or a debtor in any bankruptcy proceedings, or has its lease guarantor become insolvent or a debtor in any bankruptcy proceedings;
(d) a Major Tenant goes dark or vacates any portion of its leased space; or
THE INFORMATION IN THIS STRUCTURAL AND COLLATERAL TERM SHEET IS NOT COMPLETE AND MAY BE AMENDED PRIOR TO THE TIME OF SALE. THIS TERM SHEET IS NOT AN OFFER TO SELL THESE SECURITIES AND IT IS NOT A SOLICITATION OF AN OFFER TO BUY THESE SECURITIES IN ANY JURISDICTION WHERE THE OFFER OR SALE IS NOT PERMITTED.
66
| Other – Leased Fee | Loan # 7 | Cut-off Date Balance: | | $61,000,000 |
| 127 West 25thStreet | 127 West 25th Street | Cut-off Date LTV: | | 64.9% |
| New York, NY 10001 | | U/W NCF DSCR: | | 1.71x |
| | | U/W NOI Debt Yield: | | 6.7% |
(e) (i) BRC defaults under any NYC Homeless Services contract beyond any applicable cure period or (ii) the party BRC contracts with under a NYC Homeless Services contract gives notice to or otherwise terminates, surrenders or cancels the NYC Homeless Services contract.
A Tenant Sweep Trigger Period will end when:
| ● | if triggered by (a) above, (i) the Major Tenant revokes its termination or rescinds its notice, (ii) the Major Tenant lease is extended with respect to all of the space on terms acceptable to the lender provided the Major Tenant is in occupancy, operating normal business, and paying full rent with no outstanding tenant allowances, (iii) all of the space being re-leased to a replacement tenant on terms acceptable to the lender, provided the replacement tenant is in occupancy, operating normal business, and paying full rent with no outstanding tenant allowances; |
| ● | if triggered by (b) above, the default is cured; |
| ● | if triggered by (c) above, the lease is affirmed in the bankruptcy proceeding provided the Major Tenant is paying all rents due, or if applicable, the lease guarantor is discharged from the bankruptcy proceeding and there is not a material adverse effect on such lease guarantor’s ability to perform its guaranty obligations; |
| ● | if triggered by (d) above, the Major Tenantre-commences its operations at all of the space leased space and has not vacated; |
| ● | if triggered by (e)(i) above, the event of default is cured; and |
| ● | if triggered by (e)(ii) above, BRC has entered into a replacement contract with the New York City Department of Homeless Services or similar quasi-governmental agency to cover the space previously occupied by the agency that terminated, surrendered or cancelled its NYC Homeless Services contract, on terms acceptable to the lender, including allocated rent to be paid by the agency at least equal to the rent under the terminated, surrendered or cancelled NYC Homeless Services contract. |
A “Major Tenant” means: (a) BRC, (b) a tenant leasing space that represents either (x) 5% or more of the 127 West 25th Street Property’s rental income, or (y) at least 10,000 square feet (c) a tenant with any option, offer or right of first refusal to purchase any portion of the 127 West 25th Street Property or (d) a borrower affiliate.
Release of Property. Not permitted.
Right of First Refusal/Offer.None
Letter of Credit.None.
Terrorism Insurance.The 127 West 25th Street Borrower is required to obtain and maintain property insurance that covers perils of terrorism and acts of terrorism in an amount equal to the full replacement cost of the 127 West 25th Street Property and business interruption insurance for eighteen months with a six month extended period of indemnity. See “Risk Factors—Risks Relating to the Mortgage Loans—Terrorism Insurance May Not Be Available for All Mortgaged Properties” in the Preliminary Prospectus.
THE INFORMATION IN THIS STRUCTURAL AND COLLATERAL TERM SHEET IS NOT COMPLETE AND MAY BE AMENDED PRIOR TO THE TIME OF SALE. THIS TERM SHEET IS NOT AN OFFER TO SELL THESE SECURITIES AND IT IS NOT A SOLICITATION OF AN OFFER TO BUY THESE SECURITIES IN ANY JURISDICTION WHERE THE OFFER OR SALE IS NOT PERMITTED.
67
| Office – Suburban | Loan #8 | Cut-off Date Balance: | | $55,000,000 |
| 360 North Crescent, 9370 Santa Monica | 360 North Crescent Drive | Cut-off Date LTV: | | 52.2% |
| Boulevard and 375 North Crescent | | U/W NCF DSCR: | | 2.31x |
| Beverly Hills, CA 90210 | | U/W NOI Debt Yield: | | 8.3% |
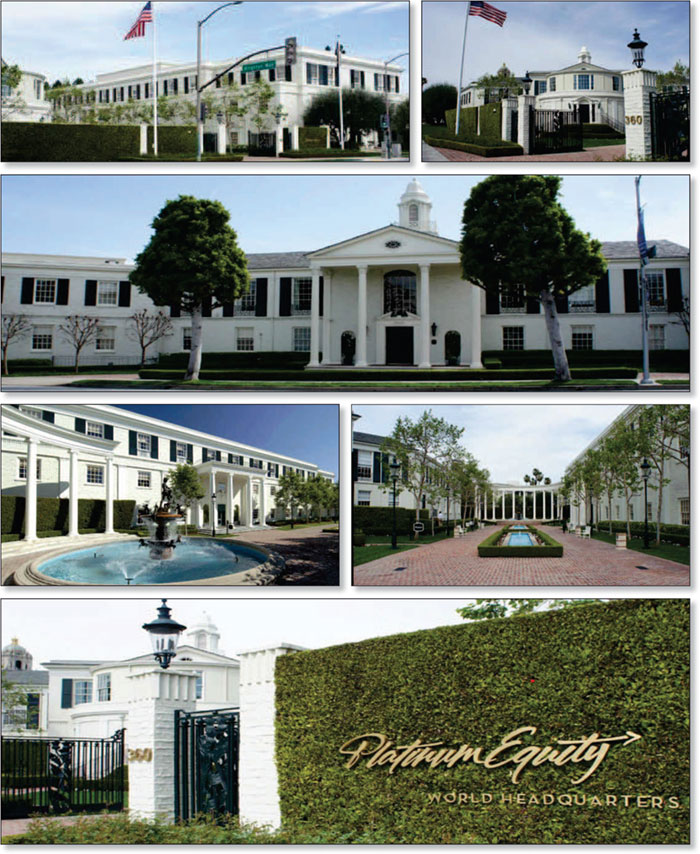
THE INFORMATION IN THIS STRUCTURAL AND COLLATERAL TERM SHEET IS NOT COMPLETE AND MAY BE AMENDED PRIOR TO THE TIME OF SALE. THIS TERM SHEET IS NOT AN OFFER TO SELL THESE SECURITIES AND IT IS NOT A SOLICITATION OF AN OFFER TO BUY THESE SECURITIES IN ANY JURISDICTION WHERE THE OFFER OR SALE IS NOT PERMITTED.
68
| No. 8 – 360 North Crescent Drive |
| |
| Mortgage Loan Information | | Mortgaged Property Information |
| Mortgage Loan Seller: | Wells Fargo Bank, National Association | | Single Asset/Portfolio: | Single Asset |
| Credit Assessment (Fitch/DBRS/S&P): | NR/NR/NR | | Property Type – Subtype: | Office – Suburban |
| Original Principal Balance(1): | $55,000,000 | | Location: | Beverly Hills, CA |
| Cut-off Date Balance(1): | $55,000,000 | | Size: | 123,848 SF |
| % of Initial Pool Balance: | 4.6% | | Cut-off Date Balance Per SF(1): | $1,038.37 |
| Loan Purpose: | Refinance | | Maturity Date Balance Per SF(1): | $1,038.37 |
| Borrower Sponsors: | Tom Gores; The Gores Trust | | Year Built/Renovated: | 1938/2003 |
| Guarantors: | Tom Gores; The Gores Trust | | Title Vesting: | Fee |
| Mortgage Rate: | 3.4500% | | Property Manager: | Self-managed |
| Note Date: | September 30, 2019 | | Current Occupancy (As of): | 100.0% (11/1/2019) |
| Seasoning: | 1 month | | YE 2018 Occupancy: | 100.0% |
| Maturity Date: | October 11, 2029 | | YE 2017 Occupancy: | 100.0% |
| IO Period: | 120 months | | YE 2016 Occupancy: | 100.0% |
| Loan Term (Original): | 120 months | | YE 2015 Occupancy: | 100.0% |
| Amortization Term (Original): | NAP | | As-Is Appraised Value: | $246,500,000 |
| Loan Amortization Type: | Interest-only, Balloon | | Appraised Value Per SF: | $1,990.34 |
| Call Protection(2): | L(24),GRTR 1% or YM(1),GRTR 1% or YM or D(88),O(7) | | Appraisal Valuation Date: | August 29, 2019 |
| Lockbox Type: | Hard/Upfront Cash Management | | Underwriting and Financial Information |
| Additional Debt(1): | Yes | | YE 2018 NOI(4): | $8,488,260 |
| Additional Debt Type (Balance)(1): | Pari Passu($73,600,000) | | YE 2017 NOI: | $7,922,910 |
| | | | YE 2016 NOI: | $7,769,225 |
| | | | YE 2015 NOI: | $8,695,369 |
| | | | U/W Revenues: | $14,143,880 |
| | | | U/W Expenses: | $3,480,740 |
| Escrows and Reserves(3) | | U/W NOI(4): | $10,663,140 |
| | Initial | Monthly | Cap | | U/W NCF: | $10,423,919 |
| Taxes | $69,628 | $69,628 | NAP | | U/W DSCR based on NOI/NCF(1): | 2.36x / 2.31x |
| Insurance | $0 | Springing | NAP | | U/W Debt Yield based on NOI/NCF(1): | 8.3% / 8.1% |
| Replacement Reserve | $600,000 | Springing | NAP | | U/W Debt Yield at Maturity based on NOI/NCF(1): | 8.3% / 8.1% |
| TI/LC Reserve | $0 | Springing | NAP | | Cut-off Date LTV Ratio(1): | 52.2% |
| | | | | | LTV Ratio at Maturity(1): | 52.2% |
| | | | | | | |
| | | | | | | |
| | | | | | | | |
| Sources and Uses |
| Sources | | | | | Uses | | | |
| Original whole loan amount(1) | $128,600,000 | | 100.0% | | Loan payoff(3) | $77,437,345 | | 60.2 | % |
| | | | | | Upfront reserves | 669,628 | | 0.5 | |
| | | | | | Closing costs | 1,489,975 | | 1.2 | |
| | | | | | Return of equity | 49,003,051 | | 38.1 | |
| Total Sources | $128,600,000 | | 100.0% | | Total Uses | $128,600,000 | | 100.0 | % |
| (1) | The Cut-off Date Balance Per SF, Maturity Date Balance Per SF, U/W DSCR based on NOI/NCF, U/W Debt Yield based on NOI/NCF, U/W Debt Yield at Maturity based on NOI/NCF, Cut-off Date LTV Ratio and LTV Ratio at Maturity numbers presented above are based on the 360 North Crescent Drive Whole Loan (as defined below). |
| (2) | Defeasance of the 360 North Crescent Drive Whole Loan is permitted at any time after the earlier to occur of (a) September 30, 2022 and (b) two years from the closing date of the securitization of the last note of the 360 North Crescent Drive Whole Loan to be securitized (“Defeasance Lockout Release Date”), and prior to April 11, 2029. The assumed defeasance lockout period of 25 payments is based on the closing date of this transaction in November 2019. In addition, prepayment of the 360 North Crescent Drive Whole Loan (along with any applicable yield maintenance premiums) is permitted on any date on or after November 12, 2021 (“Prepayment Lockout Release Date”). |
| (3) | See “Escrows” section. |
| (4) | See “Operating History and Underwritten Net Cash Flow” below for a further discussion of the increase from most recent NOI to UW NOI. |
| (5) | The 360 North Crescent Drive Property was previously securitized in the JPMCC 2012-LC9 securitization trust, with a $65,000,000 A-Note held in the trust and an $8,000,000 subordinate B-Note held outside the trust. The loan payoff includes approximately $6,301,169 in prepayment premiums related to both the A and B notes. |
The Mortgage Loan. The mortgage loan (the “360 North Crescent Drive Mortgage Loan”) is part of a whole loan (the “360 North Crescent Drive Whole Loan”) that is evidenced by twopari passupromissory notes in the aggregate original principal amount of
THE INFORMATION IN THIS STRUCTURAL AND COLLATERAL TERM SHEET IS NOT COMPLETE AND MAY BE AMENDED PRIOR TO THE TIME OF SALE. THIS TERM SHEET IS NOT AN OFFER TO SELL THESE SECURITIES AND IT IS NOT A SOLICITATION OF AN OFFER TO BUY THESE SECURITIES IN ANY JURISDICTION WHERE THE OFFER OR SALE IS NOT PERMITTED.
69
| Office – Suburban | Loan #8 | Cut-off Date Balance: | | $55,000,000 |
| 360 North Crescent, 9370 Santa Monica | 360 North Crescent Drive | Cut-off Date LTV: | | 52.2% |
| Boulevard and 375 North Crescent | | U/W NCF DSCR: | | 2.31x |
| Beverly Hills, CA 90210 | | U/W NOI Debt Yield: | | 8.3% |
$128,600,000. The 360 North Crescent Drive Whole Loan is secured by a first priority fee mortgage encumbering two adjacent office buildings and a parking garage located in Beverly Hills, California (the “360 North Crescent Drive Property”). The 360 North Crescent Mortgage Loan is evidenced by the non-controlling promissory note A-2 in the original principal amount of $55,000,000. The 360 North Crescent Whole Loan will initially be serviced pursuant to the pooling and servicing agreement for the BANK 2019-BNK22 securitization trust, and from and after the securitization of the controlling Note A-1, will be serviced pursuant to the pooling and servicing agreement for the securitization to which Note A-1 is contributed. See “Description of the Mortgage Pool—The Whole Loans— The Serviced Pari Passu Whole Loans” and “—The Non-Serviced Pari Passu Whole Loans” and “Pooling and Servicing Agreement” in the Preliminary Prospectus.
Note Summary
| Notes | Original Balance | Cut-off Date Balance | Note Holder | Controlling Piece |
| A-1 | $73,600,000 | $73,600,000 | Wells Fargo Bank, National Association | Yes |
| A-2 | $55,000,000 | $55,000,000 | BANK 2019-BNK22 | No |
| Total | $128,600,000 | $128,600,000 | | |
The Borrower and Borrower Sponsors.The borrower is 360 N. Crescent, LLC (the “360 North Crescent Drive Borrower”), a Delaware limited liability company and single purpose entity with two independent directors. Legal counsel to the 360 North Crescent Drive Borrower delivered a non-consolidation opinion in connection with the origination of the 360 North Crescent Drive Whole Loan.
The borrower sponsors and non-recourse carve-out guarantors are Tom Gores and The Gores Trust (collectively, the “360 North Crescent Drive “Guarantor”). Tom Gores is the founder, CEO and Chairman of Platinum Equity, the sole tenant at the 360 North Crescent Drive Property. Mr. Gores oversees more than 25 companies with approximately $19.4 billion in assets and is also the owner of the NBA Detroit Pistons basketball team. According to a nationally recognized business publication, Mr. Gores is estimated to be number 118 on their list of billionaires, with an estimated net worth as of October 2019 of approximately $5.6 billion.
The 360 North Crescent Drive Whole Loan documents provide a cap on the 360 North Crescent Drive Guarantor’s liability, with respect to environmental liabilities, of $40,000,000. The limit will not apply to any successor or substitute guarantor unless the successor or substitute is (i) a sibling, parent, spouse, child, grandchild or other lineal descendant (“Immediate Family Member”) of Tom Gores, or (ii) wholly owned (directly or indirectly) and controlled by Tom Gores or an Immediate Family Member.
Various affiliates of Tom Gores were involved in a Chapter 11 bankruptcy filing related to an auto parts casting company in 2015 and a mortgage default and deed-in-lieu foreclosure related to an airport hotel property in 2018 (see”[ ]” in the Preliminary Prospectus).
The Property.The 360 North Crescent Drive Property consists of two adjacent office buildings (the “Office Parcel”) and a parking garage, which is located on a separate parcel (the “Parking Parcel”). The Office Parcel, totaling 123,848 square feet, features a campus-like setting and has served as the headquarters for several companies including Litton Industries, Global Crossing, Music Corporation of America and currently Platinum Equity. As of November 1, 2019, the 360 North Crescent Drive Property was 100.0% leased to Platinum Equity.
The Office Parcel consists of two adjacent office buildings, the “South Building” and the “North Building”:
| ● | The South Building, containing 100,395 square feet (81.1% of net rentable area), is a three-story office building completed in 1968 and extensively renovated in 1999 and 2003. The South Building includes two levels of subterranean parking with 104 spaces. The South Building has high-quality features and amenities, including a bar/restaurant, two kitchen facilities, two gyms, high quality office finishes, an executive parking area with polished floors, and extensive landscaping. |
| ● | The North Building is a two-story office building completed in 1938, containing 23,453 square feet (18.9% of net rentable area). While fully leased to Platinum Equity, the North Building is currently vacant and was reportedly previously subleased to Paradigm Talent Agency, a national talent agency controlled by the brother of the borrower sponsor for the 360 North Crescent Drive Whole Loan. |
The Parking Parcel is situated directly west of the Office Parcel (across Crescent Drive) with pedestrian access provided via a signalized crosswalk. The Parking Parcel comprises a four-story, 432-space parking structure, which, together with the 104 parking spaces at the South Building, equates to a parking ratio of approximately 4.3 spaces per 1,000 square feet of rentable area. Per the terms of its lease, Platinum Equity is entitled to 436 of the 536 total parking spaces, consisting of 104 spaces within the South building subterranean parking and an additional 332 spaces in the Parking Parcel, which are leased at a monthly rental rate of $200 per space; and the remaining 100 spaces are designated for public use. The Parking Parcel is managed by LAZ Parking and generates additional income from transient parking, validation, and monthly reserved and unreserved parking. The 360 North Crescent Drive Borrower has the right to release the Parking Parcel from the collateral of the 360 North Crescent Drive Whole Loan (see “Partial Release” section).
Major Tenant.
Platinum Equity (123,848 square feet, 100.0% of net rentable area; 100.0% of underwritten base rent). Platinum Equity is a global investment firm which specializes in mergers, acquisitions and operations of companies that provide mission critical products, services and solutions in diverse industries. Founded in 1995, the company has completed over 250 acquisitions. Currently, the company has over $13 billion in assets under management in a portfolio of approximately 40 operating companies. Tom Gores, the CEO and Chairman of Platinum Equity (and also the borrower sponsor of the 360 North Crescent Drive Whole Loan) acquired the 360 North Crescent Drive
THE INFORMATION IN THIS STRUCTURAL AND COLLATERAL TERM SHEET IS NOT COMPLETE AND MAY BE AMENDED PRIOR TO THE TIME OF SALE. THIS TERM SHEET IS NOT AN OFFER TO SELL THESE SECURITIES AND IT IS NOT A SOLICITATION OF AN OFFER TO BUY THESE SECURITIES IN ANY JURISDICTION WHERE THE OFFER OR SALE IS NOT PERMITTED.
70
| Office – Suburban | Loan #8 | Cut-off Date Balance: | | $55,000,000 |
| 360 North Crescent, 9370 Santa Monica | 360 North Crescent Drive | Cut-off Date LTV: | | 52.2% |
| Boulevard and 375 North Crescent | | U/W NCF DSCR: | | 2.31x |
| Beverly Hills, CA 90210 | | U/W NOI Debt Yield: | | 8.3% |
Property in 2003 and the company has been headquartered at the property since. Platinum Equity executed a new 15-year lease in September 2019 at an initial rental rate of $78.00 per square foot, triple net, with 3% annual increases, and three, five-year renewal options at the fair market rental rate following its lease expiration in September 2034.
The following table presents certain information relating to the tenancy at the 360 North Crescent Drive Property:
Major Tenant
| Tenant Name | Credit Rating (Fitch/ Moody’s/
S&P) | Tenant NRSF | % of
NRSF | Annual U/W Base Rent PSF | Annual
U/W Base Rent | % of Total Annual U/W Base Rent | Lease
Expiration
Date | Extension Options | Termination Option (Y/N) |
| Major Tenants | | | | | | | | |
| Platinum Equity | NR/NR/NR | 123,848(1) | 100.0% | $80.34(2) | $9,949,948(2) | 100.0% | 9/30/2034 | 3, 5-year | N |
| Occupied Collateral Total | 123,848 | 100.0% | $80.34 | $9,949,948 | 100.0% | | | |
| | | | | | | | | |
| Vacant Space | 0 | 0.0% | | | | | | |
| | | | | | | | | |
| Collateral Total | 123,848 | 100.0% | | | | | | |
| | | | | | | | | | |
| | | | | | | | | | | | | | |
| (1) | Platinum Equity is not currently utilizing the North Building (23,453 square feet). |
| (2) | The Annual U/W Base Rent and Annual U/W Base Rent PSF shown above give credit for the rent bump occurring in October 2020. Platinum Equity currently pays a base rental rate of $78.00 per square foot. |
The following table presents certain information relating to the lease rollover schedule at the 360 North Crescent Drive Property:
Lease Expiration Schedule(1)
Year Ending
December 31, | No. of Leases Expiring | Expiring NRSF | % of Total NRSF | Cumulative Expiring NRSF | Cumulative % of Total NRSF | Annual
U/W
Base Rent | % of Total Annual U/W Base Rent | Annual
U/W
Base Rent
PSF |
| MTM | 0 | 0 | 0.0% | 0 | 0.0% | $0 | 0.0% | $0.00 |
| 2019 | 0 | 0 | 0.0% | 0 | 0.0% | $0 | 0.0% | $0.00 |
| 2020 | 0 | 0 | 0.0% | 0 | 0.0% | $0 | 0.0% | $0.00 |
| 2021 | 0 | 0 | 0.0% | 0 | 0.0% | $0 | 0.0% | $0.00 |
| 2022 | 0 | 0 | 0.0% | 0 | 0.0% | $0 | 0.0% | $0.00 |
| 2023 | 0 | 0 | 0.0% | 0 | 0.0% | $0 | 0.0% | $0.00 |
| 2024 | 0 | 0 | 0.0% | 0 | 0.0% | $0 | 0.0% | $0.00 |
| 2025 | 0 | 0 | 0.0% | 0 | 0.0% | $0 | 0.0% | $0.00 |
| 2026 | 0 | 0 | 0.0% | 0 | 0.0% | $0 | 0.0% | $0.00 |
| 2027 | 0 | 0 | 0.0% | 0 | 0.0% | $0 | 0.0% | $0.00 |
| 2028 | 0 | 0 | 0.0% | 0 | 0.0% | $0 | 0.0% | $0.00 |
| 2029 | 0 | 0 | 0.0% | 0 | 0.0% | $0 | 0.0% | $0.00 |
| Thereafter | 1 | 123,848 | 100.0% | 123,848 | 100.0% | $9,949,948 | 100.0% | $80.34 |
| Vacant | 0 | 0 | 0.0% | 123,848 | 100.0% | $0 | 0.0% | $0.00 |
| Total/Weighted Average | 1 | 123,848 | 100.0% | | | $9,949,948 | 100.0% | $80.34 |
| (1) | Information obtained from the underwritten rent roll. |
The following table presents historical occupancy percentages at the 360 North Crescent Drive Property:
Historical Occupancy
12/31/2015(1) | 12/31/2016(1) | 12/31/2017(1) | 12/31/2018(1) | 11/1/2019(2) |
| 100.0% | 100.0% | 100.0% | 100.0% | 100.0% |
| (1) | Information obtained from third party research provider. |
| (2) | Information obtained from the underwritten rent roll. |
THE INFORMATION IN THIS STRUCTURAL AND COLLATERAL TERM SHEET IS NOT COMPLETE AND MAY BE AMENDED PRIOR TO THE TIME OF SALE. THIS TERM SHEET IS NOT AN OFFER TO SELL THESE SECURITIES AND IT IS NOT A SOLICITATION OF AN OFFER TO BUY THESE SECURITIES IN ANY JURISDICTION WHERE THE OFFER OR SALE IS NOT PERMITTED.
71
| Office – Suburban | Loan #8 | Cut-off Date Balance: | | $55,000,000 |
| 360 North Crescent, 9370 Santa Monica | 360 North Crescent Drive | Cut-off Date LTV: | | 52.2% |
| Boulevard and 375 North Crescent | | U/W NCF DSCR: | | 2.31x |
| Beverly Hills, CA 90210 | | U/W NOI Debt Yield: | | 8.3% |
Operating History and Underwritten Net Cash Flow. The following table presents certain information relating to the historical operating performance and underwritten net cash flow at the 360 North Crescent Drive Property:
Cash Flow Analysis
| | 2015 | 2016 | 2017 | 2018(1) | U/W(1) | %(2) | U/W $ per SF |
| Base Rent | $12,617,693(3) | $11,891,734(3) | $12,269,360(3) | $12,908,457(3) | $9,949,948(4) | 68.0% | $80.34 |
| Grossed Up Vacant Space | 0 | 0 | 0 | 0 | 0 | 0.0 | 0.0 |
| Gross Potential Rent | $12,617,693 | $11,891,734 | $12,269,360 | $12,908,457 | $9,949,948 | 68.0% | $80.34 |
| Parking/Other | 240,100(3) | 286,399(3) | 478,708(3) | 392,414(3) | 1,384,726(5) | 9.5 | 11.18 |
| Total Recoveries | 0(3) | 0(3) | 0(3) | 0(3) | 3,306,703 | 22.6 | 26.70 |
| Net Rental Income | $12,857,793 | $12,178,133 | $12,748,068 | $13,300,871 | $14,641,377 | 100.0% | $118.22 |
| (Vacancy & Credit Loss) | 0 | 0 | 0 | 0 | (497,497)(6) | (5.0) | (4.02) |
| Effective Gross Income | $12,857,793 | $12,178,133 | $12,748,068 | $13,300,871 | $14,143,880 | 96.6% | $114.20 |
| | | | | | | | |
| Real Estate Taxes | 694,873 | 720,607 | 744,156 | 759,863 | 1,516,411 | 10.7 | 12.24 |
| Insurance(7) | 571,085 | 504,548 | 486,959 | 457,388 | 104,819 | 0.7 | 0.85 |
| Management Fee | 0 | 0 | 0 | 0 | 424,316 | 3.0 | 3.43 |
| Other Operating Expenses(8) | 2,896,466 | 3,183,753 | 3,594,043 | 3,595,360 | 1,435,193 | 10.1 | 11.59 |
| Total Operating Expenses | $4,162,424 | $4,408,908 | $4,825,158 | $4,812,611 | $3,480,740 | 24.6% | $28.10 |
| | | | | | | | |
| Net Operating Income | $8,695,369 | $7,769,225 | $7,922,910 | $8,488,260 | $10,663,140 | 75.4% | $86.10 |
| Replacement Reserves | 0 | 0 | 0 | 0 | 83,692 | 0.6 | 0.68 |
| TI/LC | 0 | 0 | 0 | 0 | 155,530 | 1.1 | 1.26 |
| Net Cash Flow | $8,695,369 | $7,769,225 | $7,922,910 | $8,488,260 | $10,423,919 | 73.7% | $84.17 |
| | | | | | | | |
| NOI DSCR(9) | 1.93x | 1.72x | 1.76x | 1.88x | 2.36x | | |
| NCF DSCR(9) | 1.93x | 1.72x | 1.76x | 1.88x | 2.31x | | |
| NOI Debt Yield(9) | 6.8% | 6.0% | 6.2% | 6.6% | 8.3% | | |
| NCF Debt Yield(9) | 6.8% | 6.0% | 6.2% | 6.6% | 8.1% | | |
| | | | | | | | | |
| (1) | Increase in UW net operating income is primarily due to Platinum Equity executing a new lease September 30, 2019 at a base rental rate of $78.00 per square foot. |
| (2) | Represents (i) percent of Net Rental Income for all revenue fields, (ii) percent of Gross Potential Rent for Vacancy & Credit Loss and (iii) percent of Effective Gross Income for all other fields. |
| (3) | Historical Base Rent numbers shown include base rent, expense reimbursements, and parking income related to the Plantinum Equity lease. |
| (4) | Base rent includes credit for Platinum Equity’s October 2020 rent bump totaling $289,904. |
| (5) | The UW Parking/Other line item includes parking income related to the Platinum Equity lease and public users (see “The Property” section above |
| (6) | The UW economic vacancy is 5.0%. The 360 North Crescent Drive Property was 100.0% leased as of November 1, 2019. |
| (7) | Underwritten Insurance is based on the actual premiums in place, excluding earthquake insurance premium as it is not required by the 360 North Crescent Drive Whole Loan documents. Historical Insurance included earthquake insurance premiums. |
| (8) | The 360 North Crescent Drive Property is occupied by an affiliate of the borrower sponsor, and the historical operating statements include certain business and capital expenses, which were not considered relevant for the lender’s underwriting. The underwritten Other Operating Expenses line item is based on appraisal assumptions. |
| (9) | The debt service coverage ratios and debt yields are based on the 360 North Crescent Drive Whole Loan. |
Appraisal.The appraiser concluded to an “as-is” value of $246,500,000 as of August 29, 2019. The appraiser also concluded to a Hypothetical Market Value “As Dark” of $177,000,000 as of August 29, 2019 and a Land Value of $109,000,000. The appraiser provided a separate allocation of value for the Parking Parcel of $29,000,000. The “as-is” and “As Dark” values each include the Parking Parcel allocated value and the Land Value includes a $21,000,000 allocated land value for the Parking Parcel.
Environmental Matters. According to the Phase I environmental site assessment dated September 11, 2019, there was no evidence of any recognized environmental conditions at the 360 North Crescent Drive Property.
Market Overview and Competition.The 360 North Crescent Drive Property is located on the south side of Santa Monica Boulevard in Beverly Hills, California. The asset is located approximately 0.3 miles from the retail shops and restaurants along Rodeo Drive and approximately 1.0 mile from luxury hotels including The Waldorf Astoria Beverly Hills, The Beverly Hilton and the Peninsula Beverly Hills. The 360 North Crescent Property is situated approximately 10.8 miles north of the Los Angeles International Airport and 5.7 miles northeast of the Santa Monica Airport. The asset is proximate to several major interstates including Interstate 405 (approximately 3.3 miles west) and Interstate 10 (2.0 miles south).
According to a third-party market research report, the estimated 2019 population within a one-, three- and five-mile radius of the 360 North Crescent Drive Property was approximately 30,826, 258,925 and 712,299, respectively; and the estimated 2019 average household income within the same radii was approximately $132,173, $121,839 and $107,145, respectively.
According to a third-party market research report, the 360 North Crescent Drive Property is situated within the Beverly Hills Office submarket of the Los Angeles Office Market. As of October 4, 2019, the Beverly Hills Office submarket reported a total inventory of
THE INFORMATION IN THIS STRUCTURAL AND COLLATERAL TERM SHEET IS NOT COMPLETE AND MAY BE AMENDED PRIOR TO THE TIME OF SALE. THIS TERM SHEET IS NOT AN OFFER TO SELL THESE SECURITIES AND IT IS NOT A SOLICITATION OF AN OFFER TO BUY THESE SECURITIES IN ANY JURISDICTION WHERE THE OFFER OR SALE IS NOT PERMITTED.
72
| Office – Suburban | Loan #8 | Cut-off Date Balance: | | $55,000,000 |
| 360 North Crescent, 9370 Santa Monica | 360 North Crescent Drive | Cut-off Date LTV: | | 52.2% |
| Boulevard and 375 North Crescent | | U/W NCF DSCR: | | 2.31x |
| Beverly Hills, CA 90210 | | U/W NOI Debt Yield: | | 8.3% |
approximately 11.2 million square feet with a 9.4% vacancy rate and average asking rent of $66.19 per square foot, triple net. The submarket vacancy rate has averaged 8.6% from 2015 through the third quarter of 2019. The appraiser identified a submarket subset of “Top Tier” buildings on the Westside of Los Angeles. This subset consisted of 19 premier, class A buildings, totaling approximately 8.3 million square feet with a weighted average vacancy rate of 9.7% and asking rental rates ranging from $71.40 to $96.00 per square foot, full service gross.
The following table presents certain information relating to the appraisal’s market rent conclusion for the 360 North Crescent Drive Property:
Market Rent Summary
| | Office |
| Market Rent (PSF) | $78.00 |
| Lease Term (Years) | 7 |
| Lease Type (Reimbursements) | NNN |
| Rent Increase Projection | 3.0%per annum |
The following table presents information relating to comparable office property sales for the 360 North Crescent Drive Property:
Comparable Property Sale Summary
| Property Name/Location | Sale Date | Year Built/ Renovated | Total NRA (SF) | Occupancy | Sale Price | Adjusted Sale Price(1) | Sale Price PSF | Appraiser’s Adjusted Sale Price PSF(1) |
3003 & 3301 Exposition Blvd Santa Monica, CA | Jul. 2019 | 2000/NAP | 201,922 | 100% | $220,000,000 | $313,584,866 | $1,090 | $1,553 |
11975-12015 Bluff Creek Dr. Los Angeles, CA | May. 2019 | 2015/NAP | 205,130 | 100% | $235,000,000 | $334,977,290 | $1,146 | $1,633 |
8942 Wilshire Blvd Beverly Hills, CA | Apr. 2019 | 1989/NAP | 82,886 | 100% | $107,500,000 | $153,173,328 | $1,297 | $1,848 |
2900 & 3000 Olympic Blvd Santa Monica, CA | Mar. 2019 | 1959/NAP | 275,968 | 95% | $346,000,000 | $545,036,800 | $1,254 | $1,975 |
9336-9348 Civic Center Dr. Beverly Hills, CA | Dec. 2018 | 1925/NAP | 234,361 | 100% | $244,200,000 | $366,306,243 | $1,042 | $1,563 |
9460 Wilshire Blvd Beverly Hills, CA | Jan. 2018 | 1959/NAP | 97,035 | 91% | $132,000,000 | $188,733,075 | $1,360 | $1,945 |
9665 Wilshire Blvd Beverly Hills, CA | Jul. 2017 | 1972/NAP | 171,114 | 85% | $184,700,000 | $279,086,934 | $1,079 | $1,631 |
1299 Ocean Ave Santa Monica, CA | Apr. 2017 | 1980/NAP | 205,713 | 79% | $285,000,000 | $454,831,443 | $1,385 | $2,211 |
100 N Crescent Dr Beverly Hills, CA | Jul. 2015 | 1989/NAP | 116,207 | 97% | $130,000,000 | $180,004,643 | $1,119 | $1,549 |
| (1) | Adjusted sale price for all cash equivalency, lease-up and/or deferred maintenance (as applicable). Information obtained from the appraisal. |
THE INFORMATION IN THIS STRUCTURAL AND COLLATERAL TERM SHEET IS NOT COMPLETE AND MAY BE AMENDED PRIOR TO THE TIME OF SALE. THIS TERM SHEET IS NOT AN OFFER TO SELL THESE SECURITIES AND IT IS NOT A SOLICITATION OF AN OFFER TO BUY THESE SECURITIES IN ANY JURISDICTION WHERE THE OFFER OR SALE IS NOT PERMITTED.
73
| Office – Suburban | Loan #8 | Cut-off Date Balance: | | $55,000,000 |
| 360 North Crescent, 9370 Santa Monica | 360 North Crescent Drive | Cut-off Date LTV: | | 52.2% |
| Boulevard and 375 North Crescent | | U/W NCF DSCR: | | 2.31x |
| Beverly Hills, CA 90210 | | U/W NOI Debt Yield: | | 8.3% |
Escrows.
Real Estate Taxes - The 360 North Crescent Drive Borrower is required to deposit an upfront real estate tax reserve of $69,628 and ongoing monthly escrows in an amount equal to one-twelfth of the real estate taxes that the lender estimates will be payable during the next 12 months (initially $69,628).
Insurance –The 360 North Crescent Drive Whole Loan documents require ongoing monthly insurance reserves in an amount equal to one-twelfth of the insurance premiums that the lender estimates will be payable for the renewal of the coverage during the next 12 months. Notwithstanding the foregoing, the 360 North Crescent Drive Whole Loan documents do not require ongoing monthly escrows for insurance so long as (i) no event of default has occurred and is continuing, (ii) the 360 North Crescent Drive Borrower provides lender with evidence that the 360 North Crescent Drive Property is insured pursuant to a blanket policy and such policy is in full force and effect, and (iii) the 360 North Crescent Drive Borrower provides lender with evidence of timely payment of insurance premiums and renewals.
Replacement Reserve – The 360 North Crescent Drive Borrower is required to deposit an upfront replacement reserve of $600,000. Upon the occurrence of a Cash Sweep Event Period (as defined below), or if the 360 North Crescent Drive Borrower fails to maintain the property in good and safe condition and make all repairs required by the annual budget, the 360 North Crescent Drive Whole Loan documents require ongoing monthly replacement reserves of $2,580.
Leasing Reserve – Upon the occurrence and continuance of a Cash Sweep Event Period, or if the 360 North Crescent Drive Borrower fails to pay leasing expenses when due and payable, the 360 North Crescent Drive Whole Loan documents require ongoing monthly leasing reserves of $20,641.
Lockbox and Cash Management.The 360 North Crescent Drive Whole Loan documents require that the 360 North Crescent Drive Borrower establish and maintain a lender-controlled lockbox account, which is already in-place, and that the 360 North Crescent Drive Borrower direct all tenants to pay rent directly into such lockbox account. The 360 North Crescent Drive Whole Loan documents also require that all rents received by the 360 North Crescent Drive Borrower or the property manager be deposited into the lockbox account within one business days of receipt. All funds in the lockbox account are required to be swept each business day into the cash management account controlled by the lender and, on each payment date, all funds in the cash management account are required to be applied in accordance with the 360 North Crescent Drive Whole Loan documents. Prior to the occurrence of a Cash Sweep Event Period, any excess cash flow will be disbursed to the 360 North Crescent Drive Borrower. During a Cash Sweep Event Period, any excess cash flow remaining after satisfaction of the waterfall items are required to be swept to an excess cash flow subaccount to be held by the lender as additional security for the 360 North Crescent Drive Loan during the continuance of the Cash Sweep Event Period.
A “Cash Sweep Event Period” will commence upon the earlier of the following:
| (i) | the occurrence of an event of default under the 360 North Crescent Drive Whole Loan documents; |
| (ii) | the debt service coverage ratio based on a hypothetical 30-year amortization schedule (“Amortizing DSCR”) being less than 1.10x based on the trailing twelve month period; or |
| (iii) | the occurrence of a Platinum Trigger Event (as defined below) |
A Cash Sweep Event Period will end upon the occurrence of the following:
| ● | with regard to clause (i), the cure of such event of default; |
| ● | with regard to clause (ii), the Amortizing DSCR for the 360 North Crescent Whole Drive Whole Loan being equal to or greater than 1.15x for two consecutive quarters; |
| ● | with regard to clause (iii), of a Platinum Trigger Event Cure (as defined below). |
A “Platinum Trigger Event” will commence upon either of the following:
| (i) | Platinum Equity ceasing to operate, vacating or abandoning 25% or more of its space, provided that a closing for a commercially reasonable period in connection with restoration in connection with casualty or condemnation, required repairs or replacements, will not be considered a cessation of operation; or |
| (ii) | the commencement of any bankruptcy action with respect to Platinum Equity, any successor tenant or any Acceptable Replacement Tenant (as defined below). |
A “Platinum Trigger Event Cure” will occur upon the following:
| ● | with regard to clause (i), (A) Platinum Equity occupying and re-commencing operations at all or a portion of the applicable space for a period of two consecutive calendar quarters, and/or all or a portion of the applicable space being leased to one or more Acceptable Replacement Tenants and (B) at least 76% of the space leased to Platinum Equity is leased and occupied; and |
| ● | with regard to clause (ii), either (a) upon the applicable bankruptcy action having been terminated and the applicable Platinum Lease having been affirmed or (b) assumed or the Platinum Equity lease having been assumed and assigned to a third party approved by the lender. |
“Acceptable Replacement Tenants” means tenants (i) that are reasonably acceptable to the lender, (ii) that have executed a replacement lease reasonably acceptable to lender, (iii) that have delivered an acceptable estoppel confirming that such tenant is open for business and paying full contractual rent with no abatement, and that no default exists under the lease and all borrower obligations have been complied with in full, and (iv) with respect to which, the 360 North Crescent Drive Borrower has paid for all
THE INFORMATION IN THIS STRUCTURAL AND COLLATERAL TERM SHEET IS NOT COMPLETE AND MAY BE AMENDED PRIOR TO THE TIME OF SALE. THIS TERM SHEET IS NOT AN OFFER TO SELL THESE SECURITIES AND IT IS NOT A SOLICITATION OF AN OFFER TO BUY THESE SECURITIES IN ANY JURISDICTION WHERE THE OFFER OR SALE IS NOT PERMITTED.
74
| Office – Suburban | Loan #8 | Cut-off Date Balance: | | $55,000,000 |
| 360 North Crescent, 9370 Santa Monica | 360 North Crescent Drive | Cut-off Date LTV: | | 52.2% |
| Boulevard and 375 North Crescent | | U/W NCF DSCR: | | 2.31x |
| Beverly Hills, CA 90210 | | U/W NOI Debt Yield: | | 8.3% |
outstanding tenant improvement and leasing commission costs and expenses under the related replacement lease, or such costs have been escrowed with lender.
Property Management. The 360 North Crescent Drive Property is managed by an affiliate of the 360 North Crescent Drive Borrower.
Partial Release. Following the Defeasance Lockout Release Date or the Prepayment Lockout Release Date but prior to April 11, 2019, as applicable, the 360 North Crescent Drive Borrower may obtain the release of the Parking Parcel, provided that, among other things, and in accordance with the 360 North Crescent Drive Whole Loan Documents,
| (i) | the Parking Parcel will be conveyed to an unaffiliated third party; |
| (ii) | following the release, the Amortizing DSCR is greater than the greater of (a) the Amortizing DSCR immediately prior to the release and (b) 1.51x; |
| (iii) | following the release, the NCF Debt Yield is greater than the greater of (a) the NCF Debt Yield immediately prior to the release and (b) 8.1%; |
| (iv) | following the release, the Loan to Value Ratio (“LTV”) is not greater than the lesser of (a) the LTV immediately prior to the release and (b) 52.2%; |
| (v) | either (a) defeasance of the 360 North Crescent Drive Whole Loan in the amount equal to the Release Price (as defined below) or (b) prepayment of the 360 North Crescent Drive Whole Loan in the amount equal to the Release Price, along with any yield maintenance premiums, as applicable |
| (vi) | the lender has received reasonably satisfactory evidence that, following the release of the Parking Parcel, the 360 North Crescent Drive Property complies with all applicable zoning and parking requirements and that the release will not have an adverse impact on the property or any tenant at the property and will not violate any lease; |
| (vii) | a legal opinion covering compliance in all respects with all laws, rules and regulations governing REMICs has been delivered; and |
| (viii) | rating agency confirmation is received. |
“Release Price” means 110% of the Parking Parcel allocated loan amount of $15,130,000.
The 360 North Crescent Drive Borrower may satisfy the conditions in clauses (ii), (iii), and (iv) above by partially prepaying the 360 North Crescent Drive Whole Loan in an amount that would be necessary to satisfy those conditions.
Real Estate Substitution.Not permitted.
Subordinate and Mezzanine Indebtedness.Not permitted
Ground Lease. None.
Right of First Refusal. None
Letter of Credit. None
Terrorism Insurance.The 360 North Crescent Drive Whole Loan documents require that the “all risk” insurance policy required to be maintained by the 360 North Crescent Borrower provide coverage for terrorism in an amount equal to the full replacement cost of the 360 North Crescent Property, as well as business interruption insurance covering no less than the 18-month period following the occurrence of a casualty event, together with a 6-month extended period of indemnity.
Earthquake Insurance.While the 360 North Crescent Drive Whole Loan documents do not require earthquake insurance, the 360 North Crescent Property insurance policy does include earthquake coverage. The seismic report dated September 20, 2019 indicated a probable maximum loss of 19.0% for the 360 North Crescent Drive Property.
THE INFORMATION IN THIS STRUCTURAL AND COLLATERAL TERM SHEET IS NOT COMPLETE AND MAY BE AMENDED PRIOR TO THE TIME OF SALE. THIS TERM SHEET IS NOT AN OFFER TO SELL THESE SECURITIES AND IT IS NOT A SOLICITATION OF AN OFFER TO BUY THESE SECURITIES IN ANY JURISDICTION WHERE THE OFFER OR SALE IS NOT PERMITTED.
75
| Office – Suburban | Loan #9 | Cut-off Date Balance: | | $45,000,000 |
| 7900 Tysons One Place | Tysons Tower | Cut-off Date LTV: | | 52.1% |
| McLean, VA 22102 | | U/W NCF DSCR: | | 3.06x |
| | | U/W NOI Debt Yield: | | 11.0% |

THE INFORMATION IN THIS STRUCTURAL AND COLLATERAL TERM SHEET IS NOT COMPLETE AND MAY BE AMENDED PRIOR TO THE TIME OF SALE. THIS TERM SHEET IS NOT AN OFFER TO SELL THESE SECURITIES AND IT IS NOT A SOLICITATION OF AN OFFER TO BUY THESE SECURITIES IN ANY JURISDICTION WHERE THE OFFER OR SALE IS NOT PERMITTED.
76
| No. 9 – Tysons Tower |
| |
| Mortgage Loan Information | | Mortgaged Property Information |
| Mortgage Loan Seller(1): | Wells Fargo Bank, National Association | | Single Asset/Portfolio: | Single Asset |
Credit Assessment (DBRS/Fitch/Moody’s): | NR/NR/NR | | Property Type – Subtype: | Office – Suburban |
| Original Principal Balance(2): | $45,000,000 | | Location: | McLean, VA |
| Cut-off Date Balance(2): | $45,000,000 | | Size: | 528,730 SF |
| % of Initial Pool Balance: | 3.7% | | Cut-off Date Balance Per SF(2): | $359.35 |
| Loan Purpose: | Recapitalization | | Maturity Date Balance Per SF(2): | $359.35 |
| Borrower Sponsor: | The Macerich Partnership, L.P.; Alaska Permanent Fund Corporation | | Year Built/Renovated: | 2014/NAP |
| Guarantors: | NAP | | Title Vesting: | Fee |
| Mortgage Rate: | 3.3300% | | Property Manager: | Hines Interests Limited Partnership |
| Note Date: | September 12, 2019 | | Current Occupancy (As of): | 100.0% (8/30/2019) |
| Seasoning: | 1 month | | YE 2018 Occupancy: | 100.0% |
| Maturity Date: | October 11, 2029 | | YE 2017 Occupancy: | 98.4% |
| IO Period: | 120 months | | YE 2016 Occupancy: | 96.1% |
| Loan Term (Original): | 120 months | | YE 2015 Occupancy: | 76.5% |
| Amortization Term (Original): | NAP | | As-Is Appraised Value: | $365,000,000 |
| Loan Amortization Type: | Interest-only, Balloon | | As-Is Appraised Value Per SF: | $690.33 |
| Call Protection(3): | L(25),GRTR 1% or YM(90),O(5) | | As-Is Appraisal Valuation Date: | August 12, 2019 |
| Lockbox Type: | Hard/Springing Cash Management | | |
| Additional Debt(2): | Yes | | Underwriting and Financial Information |
| Additional Debt Type (Balance)(2): | Pari Passu ($145,000,000) | | TTM NOI (6/30/2019): | $21,702,519 |
| | | | YE 2018 NOI: | $20,965,668 |
| | | | YE 2017 NOI: | $17,880,418 |
| | | | YE 2016 NOI: | $12,562,865 |
| | | | U/W Revenues: | $31,434,407 |
| | | | U/W Expenses: | $10,604,603 |
| Escrows and Reserves(4) | | U/W NOI: | $20,829,804 |
| | Initial | Monthly | Cap | | U/W NCF: | $19,666,598 |
| Taxes | $0 | Springing | NAP | | U/W DSCR based on NOI/NCF(2): | 3.24x / 3.06x |
| Insurance | $0 | Springing | NAP | | U/W Debt Yield based on NOI/NCF(2): | 11.0% / 10.4% |
| Replacement Reserve | $0 | Springing | $1,000,000 | | U/W Debt Yield at Maturity based on NOI/NCF(2): | 11.0% / 10.4% |
| TI/LC | $0 | Springing | $1,321,825 | | Cut-off Date LTV Ratio(2): | 52.1% |
| | | | | | LTV Ratio at Maturity(2): | 52.1% |
| | | | | | | |
| | | | | | | | |
| Sources and Uses |
| Sources | | | | | Uses | | | |
| Whole loan amount | $190,000,000 | | 100.0% | | Return of Equity(5) | $188,546,123 | | 99.2% |
| | | | | | Closing costs | 1,453,877 | | 0.8 |
| Total Sources | $190,000,000 | | 100.0% | | Total Uses | $190,000,000 | | 100.0% |
| (1) | The Tysons Tower Whole Loan (as defined below) was co-originated by JPMorgan Chase Bank, N.A. and Wells Fargo Bank, National Association on September 12, 2019. |
| (2) | The Tysons Tower Mortgage Loan (as defined below) is part of the Tysons Tower Whole Loan (as defined below), which is comprised of sevenpari passupromissory notes with an aggregate original principal balance of $190,000,000. The Cut-off Date Balance per SF, Maturity Date Balance per SF, U/W Debt Yield based on NOI/NCF, U/W Debt Yield at Maturity based on NOI/NCF, U/W DSCR based on NOI/NCF, Cut-off Date LTV Ratio and LTV Ratio at Maturity numbers presented above are based on the Tysons Tower Whole Loan. |
| (3) | Prepayment of the Tysons Tower Whole Loan is permitted at any time after the earlier to occur of (a) the end of the two-year period commencing on the closing date of the securitization of the last promissory note representing a portion of the Tysons Tower Whole Loan to be securitized and (b) November 11, 2022 upon payment of the yield maintenance premium. The assumed prepayment lockout period of 25 payments is based on the closing date of this transaction in November 2019. |
| (4) | See “Escrows” Section. |
| (5) | The Tysons Tower Property (as defined below) was previously unencumbered. The borrower sponsors constructed the Tysons Tower Property (as defined below) in 2014 at a total cost of approximately $218.2 million ($413 per square foot). |
The Mortgage Loan. The mortgage loan (the “Tysons Tower Mortgage Loan”) is part of a whole loan (the “Tysons Tower Whole Loan”) evidenced by sevenpari passu promissory notes with an aggregate original principal balance of $190,000,000. The Tysons Tower Whole Loan is secured by a first priority fee mortgage encumbering a 528,730 square foot suburban office building located in McLean, Virginia (the “Tysons Tower Property”). The Tysons Tower Mortgage Loan represents the non-controlling Notes A-2 and A-3 with an original principal balance of $25,000,000 and $20,000,000, respectively. The below table summarizes the Tysons Tower Whole Loan, including the remaining promissory notes, which are currently held by JPMorgan Chase Bank, N.A. and may otherwise be transferred at any time. The mortgage loan seller provides no assurances that the non-securitizedpari passu notes will not be split further. The Tysons Tower Whole Loan will be serviced pursuant to the pooling and servicing agreement for the BANK 2019-BNK21 securitization
THE INFORMATION IN THIS STRUCTURAL AND COLLATERAL TERM SHEET IS NOT COMPLETE AND MAY BE AMENDED PRIOR TO THE TIME OF SALE. THIS TERM SHEET IS NOT AN OFFER TO SELL THESE SECURITIES AND IT IS NOT A SOLICITATION OF AN OFFER TO BUY THESE SECURITIES IN ANY JURISDICTION WHERE THE OFFER OR SALE IS NOT PERMITTED.
77
| Office – Suburban | Loan #9 | Cut-off Date Balance: | | $45,000,000 |
| 7900 Tysons One Place | Tysons Tower | Cut-off Date LTV: | | 52.1% |
| McLean, VA 22102 | | U/W NCF DSCR: | | 3.06x |
| | | U/W NOI Debt Yield: | | 11.0% |
trust. See “Description of the Mortgage Pool—The Whole Loans—The Non-Serviced Pari Passu Whole Loans” and “Pooling and Servicing Agreement—Servicing of the Non-Serviced Mortgage Loans” in the Preliminary Prospectus.
Note Summary
| Notes | Original Balance | Cut-off Date Balance | Note Holder | Controlling
Piece |
| A-2, A-3 | $45,000,000 | $45,000,000 | BANK 2019-BNK22 | No |
| A-1 | $50,000,000 | $50,000,000 | BANK 2019-BNK21 | Yes |
| A-4 | $40,000,000 | $40,000,000 | JPMorgan Chase Bank, N.A. | No |
| A-5 | $10,000,000 | $10,000,000 | JPMorgan Chase Bank, N.A. | No |
| A-6 | $15,000,000 | $15,000,000 | JPMorgan Chase Bank, N.A. | No |
| A-7 | $30,000,000 | $30,000,000 | JPMorgan Chase Bank, N.A. | No |
| Total | $190,000,000 | $190,000,000 | | |
The Borrower and Borrower Sponsors.The borrower is Tysons Corner Office I LLC (the “Tysons Tower Borrower”), a Delaware limited liability company and single purpose entity with two independent directors. The borrower sponsors are The Macerich Partnership, L.P. (“MPLP”) and Alaska Permanent Fund Corporation (“APFC”), which each have a 50.0% joint venture ownership interest in the Tysons Tower Borrower.
MPLP is an affiliate of The Macerich Company (“Macerich”) (NYSE: MAC) which maintained an equity market capitalization of approximately $4.7 billion as of June 30, 2019. Macerich is a self-administered and self-managed real estate investment trust involved in the acquisition, ownership, development, redevelopment, management, and leasing of regional and community shopping centers located throughout the United States. Macerich specializes in retail properties in many of the country’s most densely populated markets, with a significant presence on the West Coast, Arizona, Chicago and in the corridor from the greater New York metropolitan area to Washington D.C. As of June 30, 2019, Macerich had ownership interest in commercial real estate assets totaling approximately 51 million square feet consisting primarily of 47 regional shopping centers, including the Tysons Corner Center super-regional mall located adjacent to the Tysons Tower Property (see “The Property” section).
APFC is a sovereign wealth fund created in 1980 by the Alaska Legislature and is the largest state-level fund of its kind in the United States. APFC’s investment strategy employs a combination of internally managed direct investments alongside externally-managed fund investments. Major asset classes include public equities, fixed-income, private equity, real estate, infrastructure, and absolute return strategies. As of June 30, 2019, APFC’s real estate portfolio included partial or complete ownership in 54 properties valued at approximately $4.1 billion. As of June 30, 2019, APFC had a total fund value of approximately $66.3 billion.
The Property. The Tysons Tower Property is a 20-story, 528,730 square foot, Class A, LEED Gold certified suburban office building located in McLean, Virginia, approximately 11.4 miles west of Washington, D.C. The borrower sponsors constructed the Tysons Tower Property in 2014 at a total cost of approximately $218.2 million ($413 per square foot). Amenities at the Tysons Tower Property include a fitness center with locker rooms, a full service restaurant, covered bike storage, a rooftop garden with panoramic views of Washington, D.C. and the Blue Ridge Mountains, and 1,204 surface and garage parking spaces, resulting in a parking ratio of 2.3 spaces per 1,000 square feet of net rentable area. As of August 30, 2019, the Tysons Tower Property was 100.0% occupied by 20 tenants.
The Tysons Tower Property is part of a three-building complex known as the Tysons Corner Campus, which also includes the 28-story Vita Apartments and the 300-room Hyatt Regency Tysons Corner hotel (each owned by affiliates of Macerich, but not part of the collateral for the Tysons Tower Whole Loan). The Tysons Corner Campus is connected via an elevated, 1.5-acre pedestrian plaza that features games, a children’s play area, outdoor common areas, as well as space to host concerts and events. The Tysons Corner Campus is also connected via an elevated walkway to the Macerich-owned, approximately 2.0 million square foot Tysons Corner Center super-regional mall, which is located across the street from the Tysons Tower Property. With more than 300 shops, dining and entertainment options, Tysons Corner Center is one of the largest shopping centers in the United States. Major retailers at Tysons Corner Center include Nordstrom, Bloomingdale’s, Macy’s, Apple, Dyson, Uniqlo, American Girl, Louis Vuitton, Gucci, Michael Kors, Lacoste, and The Disney Store, among others.
Major Tenants.
Intelsat Global Service Corporation (212,572 square feet, 40.2% of net rentable area; 41.5% of underwritten base rent; July 31, 2029 expiration)Intelsat Global Service Corporation (“Intelsat”) is a provider of global satellite services serving billions of people worldwide. Intelsat executed its lease at the Tysons Tower Property in July 2014 and was one of the first tenants to take occupancy in the building. Intelsat occupies floors 12 through 20 at the Tysons Tower Property, which serves as the company’s administrative headquarters. Intelsat has two renewal options with 18 months’ notice at the fair market rental rate at the maximum extension of 15 years (in the aggregate, at tenant’s discretion).
Deloitte, LLP (94,378 square feet, 17.8% of net rentable area; 17.2% of underwritten base rent; August 31, 2027 expiration) Deloitte, LLP (“Deloitte”) provides clients with a broad range of audit and assurance, consulting, financial advisory, risk, and tax services. Deloitte executed its lease at the Tysons Tower Property in August 2014 and was one of the first tenants to take occupancy in the building. Deloitte originally occupied floors seven through nine, and exercised an expansion right for a portion of the sixth floor in
THE INFORMATION IN THIS STRUCTURAL AND COLLATERAL TERM SHEET IS NOT COMPLETE AND MAY BE AMENDED PRIOR TO THE TIME OF SALE. THIS TERM SHEET IS NOT AN OFFER TO SELL THESE SECURITIES AND IT IS NOT A SOLICITATION OF AN OFFER TO BUY THESE SECURITIES IN ANY JURISDICTION WHERE THE OFFER OR SALE IS NOT PERMITTED.
78
| Office – Suburban | Loan #9 | Cut-off Date Balance: | | $45,000,000 |
| 7900 Tysons One Place | Tysons Tower | Cut-off Date LTV: | | 52.1% |
| McLean, VA 22102 | | U/W NCF DSCR: | | 3.06x |
| | | U/W NOI Debt Yield: | | 11.0% |
2019. Deloitte has the option to elect either (i) one, 10-year renewal option, or (ii) two, 5-year renewal options, each with 18 months’ notice at the fair market rental rate.
Splunk Inc. (57,521 square feet, 10.9% of net rentable area; 11.9% of underwritten base rent; May 31, 2022 expiration) Splunk Inc. (“Splunk”) provides software solutions that enable organizations to gain real-time operational intelligence in the United States and internationally. Splunk serves cloud and online services, education, financial services, government, healthcare/pharmaceuticals, industrials/manufacturing, media/entertainment, retail/e-commerce, technology, and telecommunications industries. Splunk initially took occupancy in the eleventh floor in phases in November 2014 and May 2015, and expanded to occupy the tenth floor in December 2017. Splunk has one, 5-year option to renew with 10 months’ notice at the fair market rental rate.
The following table presents certain information relating to the tenancy at the Tysons Tower Property:
Major Tenants
| Tenant Name | Credit Rating
(Fitch/ Moody’s/
S&P)(1) | Tenant
NRSF | % of
NRSF | Annual U/W
Base Rent
PSF(2) | Annual
U/W Base Rent(2) | % of Total
Annual
U/W Base
Rent | Lease
Expiration
Date | Extension
Options | Termination
Option
(Y/N) |
| Major Tenants | | | | | | | | |
| Intelsat | NR/NR/CCC+ | 212,572 | 40.2% | $58.48 | $12,430,903 | 41.5% | 7/31/2029 | 2, 5-yr and 10-yr(3) | N |
| Deloitte | NR/NR/NR | 94,378 | 17.8% | $54.51 | $5,144,545 | 17.2% | 8/31/2027 | 1, 10-yr or 2, 5-yr(4) | N |
| Splunk | NR/NR/NR | 57,521 | 10.9% | $61.86 | $3,558,249 | 11.9% | 5/31/2022 | 1, 5-year(5) | N |
| Morgan Franklin(6) | NR/NR/NR | 28,553 | 5.4% | $55.73 | $1,591,259 | 5.3% | 2/28/2027 | 1, 5-year(7) | Y(8) |
| Reed Smith LLP | NR/NR/NR | 28,553 | 5.4% | $52.34 | $1,494,324 | 5.0% | 7/31/2029 | 2, 5-year(9) | Y(10) |
| Total Major Tenants | 421,577 | 79.7% | $57.45 | $24,219,280 | 80.8% | | | |
| | | | | | | | | |
| Non-Major Tenants | 107,153 | 20.3% | $53.56 | $5,738,760 | 19.2% | | | |
| | | | | | | | | |
| Occupied Collateral Total | 528,730 | 100.0% | $56.66 | $29,958,040 | 100.0% | | | |
| | | | | | | | | |
| Vacant Space | 0 | 0.0% | | | | | | |
| | | | | | | | | |
| Collateral Total | 528,730 | 100.0% | | | | | | |
| | | | | | | | | | |
| | | | | | | | | | | |
| (1) | Certain ratings are those of the parent company whether or not the parent guarantees the lease. |
| (2) | The Annual UW Base Rent and Annual UW Base Rent PSF shown above include rent steps through September 2020 totaling $751,235. The lender’s underwriting gives separate credit for straight-line rent averaging for Bank of NY Mellon, an investment grade tenant, over its remaining lease term totaling $18,013. The Annual UW Base Rent and Annual UW Base Rent PSF shown in the Major Tenants table above do not include credit given for straight-line rent averaging for such investment grade tenant. |
| (3) | Intelsat has two options to renew with 18 months’ notice at the fair market rental rate that, combined, permit a maximum of 15 years’ extension. |
| (4) | Deloitte has the option to elect either (i) one, 10-year renewal option, or (ii) two, 5-year renewal options, each with 18 months’ notice at the fair market rental rate. |
| (5) | Splunk has one, 5-year option to renew with 10 months’ notice at the fair market rental rate. |
| (6) | Morgan Franklin subleases approximately 3,990 square feet to BackOffice Associates, LLC at a base rental rate of $49.92 per square foot through January 30, 2020. |
| (7) | Morgan Franklin has one, 5-year option to renew with 12 months’ notice at the fair market rental rate. |
| (8) | Morgan Franklin has the one-time right to terminate its lease effective February 28, 2024, with 12 months’ prior notice, subject to a termination fee equal to the then-unamortized amount of tenant improvements and leasing commissions, as of the effective date of termination. |
| (9) | Reed Smith LLP has two, 5-year options to renew, each with 15 months’ notice at the fair market rental rate. |
| (10) | Reed Smith LLP has the one-time right to terminate its lease effective August 1, 2027, with 15 months’ prior notice, subject to a termination fee equal to (i) three months of base rent and (ii) the then-unamortized amount of tenant improvements and leasing commissions, as of the effective date of termination. |
THE INFORMATION IN THIS STRUCTURAL AND COLLATERAL TERM SHEET IS NOT COMPLETE AND MAY BE AMENDED PRIOR TO THE TIME OF SALE. THIS TERM SHEET IS NOT AN OFFER TO SELL THESE SECURITIES AND IT IS NOT A SOLICITATION OF AN OFFER TO BUY THESE SECURITIES IN ANY JURISDICTION WHERE THE OFFER OR SALE IS NOT PERMITTED.
79
| Office – Suburban | Loan #9 | Cut-off Date Balance: | | $45,000,000 |
| 7900 Tysons One Place | Tysons Tower | Cut-off Date LTV: | | 52.1% |
| McLean, VA 22102 | | U/W NCF DSCR: | | 3.06x |
| | | U/W NOI Debt Yield: | | 11.0% |
The following table presents certain information relating to the lease rollover schedule at the Tysons Tower Property:
Lease Expiration Schedule(1)(2)
Year Ending
December 31, | No. of
Leases
Expiring | Expiring
NRSF | % of
Total
NRSF | Cumulative
Expiring
NRSF | Cumulative
% of Total
NRSF | Annual
U/W
Base Rent | % of Total
Annual
U/W Base
Rent | Annual
U/W
Base Rent
PSF |
| MTM | 1 | 1,821 | 0.3% | 1,821 | 0.3% | $0 | 0.0% | $0.00 |
| 2019 | 0 | 0 | 0.0% | 1,821 | 0.3% | $0 | 0.0% | $0.00 |
| 2020 | 0 | 0 | 0.0% | 1,821 | 0.3% | $0 | 0.0% | $0.00 |
| 2021 | 0 | 0 | 0.0% | 1,821 | 0.3% | $0 | 0.0% | $0.00 |
| 2022 | 6 | 79,811 | 15.1% | 81,632 | 15.4% | $4,736,831 | 15.8% | $59.35 |
| 2023 | 2 | 10,176 | 1.9% | 91,808 | 17.4% | $548,523 | 1.8% | $53.90 |
| 2024 | 3 | 19,880 | 3.8% | 111,688 | 21.1% | $1,095,158 | 3.7% | $55.09 |
| 2025 | 6 | 28,966 | 5.5% | 140,654 | 26.6% | $1,523,660 | 5.1% | $52.60 |
| 2026 | 3 | 18,377 | 3.5% | 159,031 | 30.1% | $1,043,433 | 3.5% | $56.78 |
| 2027 | 7 | 128,574 | 24.3% | 287,605 | 54.4% | $7,085,208 | 23.7% | $55.11 |
| 2028 | 0 | 0 | 0.0% | 287,605 | 54.4% | $0 | 0.0% | $0.00 |
| 2029 | 12 | 241,125 | 45.6% | 528,730 | 100.0% | $13,925,227 | 46.5% | $57.75 |
| Thereafter | 0 | 0 | 0.0% | 528,730 | 100.0% | $0 | 0.0% | $0.00 |
| Vacant | 0 | 0 | 0.0% | 528,730 | 100.0% | $0 | 0.0% | $0.00 |
| Total/Weighted Average | 40 | 528,730 | 100.0% | | | $29,958,040 | 100.0% | $56.66 |
| (1) | Information obtained from the underwritten rent roll. |
| (2) | Certain tenants may have lease termination options that are exercisable prior to the originally stated expiration date of the subject lease and that are not considered in the Lease Rollover Schedule. |
The following table presents historical occupancy percentages at the Tysons Tower Property:
Historical Occupancy
12/31/2015(1) | 12/31/2016(1) | 12/31/2017(1) | 12/31/2018(1) | 8/30/2019(2) |
| 76.5% | 96.1% | 98.4% | 100.0% | 100.0% |
| (1) | Information obtained from the Tysons Tower Borrower. |
| (2) | Information obtained from the underwritten rent roll. |
THE INFORMATION IN THIS STRUCTURAL AND COLLATERAL TERM SHEET IS NOT COMPLETE AND MAY BE AMENDED PRIOR TO THE TIME OF SALE. THIS TERM SHEET IS NOT AN OFFER TO SELL THESE SECURITIES AND IT IS NOT A SOLICITATION OF AN OFFER TO BUY THESE SECURITIES IN ANY JURISDICTION WHERE THE OFFER OR SALE IS NOT PERMITTED.
80
| Office – Suburban | Loan #9 | Cut-off Date Balance: | | $45,000,000 |
| 7900 Tysons One Place | Tysons Tower | Cut-off Date LTV: | | 52.1% |
| McLean, VA 22102 | | U/W NCF DSCR: | | 3.06x |
| | | U/W NOI Debt Yield: | | 11.0% |
Operating History and Underwritten Net Cash Flow. The following table presents certain information relating to the historical operating performance and underwritten net cash flow at the Tysons Tower Property:
Cash Flow Analysis
| | 2015 | 2016 | 2017 | 2018 | TTM 6/30/2019 | U/W | %(1) | U/W $
per SF |
| Base Rent | $13,536,398 | $19,206,816 | $25,076,626 | $27,814,508 | $28,183,964 | $29,206,805 | 84.8% | $55.24 |
| Rent Average Benefit(2) | 0 | 0 | 0 | 0 | 0 | 18,013 | 0.1 | 0.03 |
| Contractual Rent Steps(3) | 0 | 0 | 0 | 0 | 0 | 751,235 | 2.2 | 1.42 |
| Grossed Up Vacant Space | 0 | 0 | 0 | 0 | 0 | 0 | 0.0 | 0.00 |
| Gross Potential Rent | $13,536,398 | $19,206,816 | $25,076,626 | $27,814,508 | $28,183,964 | $29,976,053 | 87.1% | $56.69 |
| Other Income(4) | 1,674,432 | 2,229,538 | 2,448,899 | 2,636,988 | 2,721,855 | 2,721,855 | 7.9 | 5.15 |
| Total Recoveries | 52,157 | 208,561 | 367,411 | 896,729 | 1,296,894 | 1,732,303 | 5.0 | 3.28 |
| Net Rental Income | $15,262,987 | $21,644,915 | $27,892,936 | $31,348,225 | $32,202,713 | $34,430,211 | 100.0% | $65.12 |
| (Vacancy & Credit Loss) | 0 | 0 | 0 | 0 | 0 | (2,995,804)(5) | (10.0) | (5.67) |
| Effective Gross Income | $15,262,987 | $21,644,915 | $27,892,936 | $31,348,225 | $32,202,713 | $31,434,407 | 91.3% | $59.45 |
| | | | | | | | | |
| Real Estate Taxes | 2,816,447 | 3,219,674 | 3,570,905 | 3,927,437 | 4,057,334 | 4,048,719 | 12.9 | 7.66 |
| Insurance | 35,075 | 55,262 | 77,406 | 72,857 | 74,750 | 74,936 | 0.2 | 0.14 |
| Management Fee | 710,770 | 561,491 | 1,288,906 | 941,707 | 982,189 | 943,032 | 3.0 | 1.78 |
| Other Operating Expenses | 4,893,592 | 5,245,623 | 5,075,301 | 5,440,556 | 5,385,921 | 5,537,916 | 17.6 | 10.47 |
| Total Operating Expenses | $8,455,884 | $9,082,050 | $10,012,518 | $10,382,557 | $10,500,194 | $10,604,603 | 33.7% | $20.06 |
| | | | | | | | | |
| Net Operating Income | $6,807,103 | $12,562,865 | $17,880,418 | $20,965,668 | $21,702,519 | $20,829,804 | 66.3% | $39.40 |
| Replacement Reserves | 0 | 0 | 0 | 0 | 0 | 105,746 | 0.3 | 0.20 |
| TI/LC | 0 | 0 | 0 | 0 | 0 | 1,057,460 | 3.4 | 2.00 |
| Net Cash Flow | $6,807,103 | $12,562,865 | $17,880,418 | $20,965,668 | $21,702,519 | $19,666,598 | 62.6% | $37.20 |
| | | | | | | | | |
| NOI DSCR(6) | 1.06x | 1.95x | 2.78x | 3.26x | 3.37x | 3.24x | | |
| NCF DSCR(6) | 1.06x | 1.95x | 2.78x | 3.26x | 3.37x | 3.06x | | |
| NOI Debt Yield(6) | 3.6% | 6.6% | 9.4% | 11.0% | 11.4% | 11.0% | | |
| NCF Debt Yield(6) | 3.6% | 6.6% | 9.4% | 11.0% | 11.4% | 10.4% | | |
| (1) | Represents (i) percent of Net Rental Income for all revenue fields, (ii) percent of Gross Potential Rent for Vacancy & Credit Loss and (iii) percent of Effective Gross Income for all other fields. |
| (2) | Represents straight-line rent averaging for Bank of NY Mellon, an investment grade tenant, over its remaining lease term totaling $18,013. |
| (3) | Represents rent steps through September 2020 totaling $751,235. |
| (4) | Other Income represents parking income and percentage rent. |
| (5) | The underwritten economic vacancy is 9.5%. The Tysons Tower Property was 100.0% occupied as of August 30, 2019. |
| (6) | The debt service coverage ratios and debt yields are based on the Tysons Tower Whole Loan. |
Appraisal.The appraiser concluded to a “Market Value As-Is” of $365,000,000 as of August 12, 2019.
Environmental Matters. According to the Phase I environmental site assessment dated August 13, 2019, there was no evidence of any recognized environmental conditions at the Tysons Tower Property.
Market Overview and Competition.The Tysons Tower Property is situated on the northwest corner of the intersection of Tysons One Place and Westpark Drive within the Tysons Corner submarket of McLean, Virginia. The Tysons Tower Property is situated approximately two blocks southeast of the Tysons Corner Metrorail station, which operates on the Silver Metro rail line that travels east-west through Washington D.C. The Tysons Corner Metrorail station was built as part of Phase I of the Dulles Corridor Metrorail project, an extension of the Metrorail system through Tysons Corner to Dulles International Airport and Loudoun County, which began operation in 2014. Additionally, the Tysons Tower Property is located adjacent to the Capital Beltway (Interstate-495) and Route 123 interchange, approximately 15.0 miles east of the Dulles International Airport, and approximately 13.1 miles west of the Ronald Reagan Washington Airport.
Tysons Corner is the largest office submarket in Northern Virginia, consisting of approximately 29.0 million square feet of office space. Several Fortune 500 companies have headquarters within the Tysons Corner submarket, including Freddie Mac, Capital One Financial, SAIC, Hilton Worldwide and Gannett. Tysons Corner also features over 5.7 million square feet of retail space including the aforementioned Tysons Corner Center super-regional mall as well as Tysons Galleria, which features Saks Fifth Avenue and Neiman Marcus. Residential uses in Tysons Corner feature numerous garden-style, mid-rise and high-rise apartment and condominium projects. Additionally, during the last 20 years, a significant number of luxury townhouse and single-family detached communities have been developed on in-fill parcels within and surrounding Tysons Corner. According to a third party market research provider, the estimated 2019 population within a three- and five-mile radius of the Tysons Tower Property was approximately 105,483 and 268,473,
THE INFORMATION IN THIS STRUCTURAL AND COLLATERAL TERM SHEET IS NOT COMPLETE AND MAY BE AMENDED PRIOR TO THE TIME OF SALE. THIS TERM SHEET IS NOT AN OFFER TO SELL THESE SECURITIES AND IT IS NOT A SOLICITATION OF AN OFFER TO BUY THESE SECURITIES IN ANY JURISDICTION WHERE THE OFFER OR SALE IS NOT PERMITTED.
81
| Office – Suburban | Loan #9 | Cut-off Date Balance: | | $45,000,000 |
| 7900 Tysons One Place | Tysons Tower | Cut-off Date LTV: | | 52.1% |
| McLean, VA 22102 | | U/W NCF DSCR: | | 3.06x |
| | | U/W NOI Debt Yield: | | 11.0% |
respectively; and the estimated 2019 average household income within the same radii was approximately $156,464 and $163,643, respectively.
According to a third-party market research report, the Tysons Tower Property is situated within the Tysons Corner submarket of the Washington D.C. office market. As of the second quarter of 2019, the Tysons Corner Class A submarket reported a total inventory of approximately 19.2 million square feet with a 13.3% vacancy rate and average asking rent of $40.76 per square foot, gross.
The following table presents certain information relating to the appraisal’s market rent conclusion for the Tysons Tower Property:
Market Rent Summary(1)
| | Upper Office
(Floors 10-20) | Office (Floors 2-10) | Restaurant | Bank |
| Market Rent (PSF) | $58.00 | $56.00 | $50.00 | $65.00 |
| Lease Term (Years) | 10 | 8 | 10 | 10 |
| Lease Type (Reimbursements) | Full Service(1) | Full Service(1) | Full Service(1) | NNN |
| Rent Increase Projection | 2.75% per annum | 2.75% per annum | 3.00% per annum | 3.00% per annum |
| (1) | Information obtained from the appraisal. |
The table below presents certain information relating to comparable sales pertaining to the Tysons Tower Property identified by the appraiser:
Comparable Sales(1)
| Property Name | Location | Year Built | Rentable
Area (SF) | Sale Date | Sale Price | Sale Price
(PSF) |
| Tysons Tower (Subject) | McLean, VA | 2014 | 528,730 | NAP | | |
| One Liberty Center | Arlington, VA | 2005 | 319,327 | June 2019 | $151,200,000 | $473 |
| 2000 Duke | Alexandria, VA | 1997 | 156,746 | Feb. 2019 | $75,000,000 | $478 |
| Carlyle Overlook | Alexandria, VA | 2008 | 121,908 | Sept. 2018 | $59,000,000 | $484 |
| 1300 North 17th | Arlington, VA | 1980 | 397,724 | Jan. 2018 | $250,000,000 | $629 |
| Waterview | Rosslyn, VA | 2006 | 633,908 | May 2017 | $460,000,000 | $726 |
| (1) | Information obtained from the appraisal. |
THE INFORMATION IN THIS STRUCTURAL AND COLLATERAL TERM SHEET IS NOT COMPLETE AND MAY BE AMENDED PRIOR TO THE TIME OF SALE. THIS TERM SHEET IS NOT AN OFFER TO SELL THESE SECURITIES AND IT IS NOT A SOLICITATION OF AN OFFER TO BUY THESE SECURITIES IN ANY JURISDICTION WHERE THE OFFER OR SALE IS NOT PERMITTED.
82
| Office – Suburban | Loan #9 | Cut-off Date Balance: | | $45,000,000 |
| 7900 Tysons One Place | Tysons Tower | Cut-off Date LTV: | | 52.1% |
| McLean, VA 22102 | | U/W NCF DSCR: | | 3.06x |
| | | U/W NOI Debt Yield: | | 11.0% |
The following table presents certain information relating to comparable leases related to Tysons Tower Property:
Comparable Leases(1)
| Property Name/Location | Year
Built/
Renovated | Total GLA (SF) | Distance
from
Subject | Occupancy(2) | Tenant | Tenant Size | Lease
Term | Annual
Base
Rent PSF | Lease
Type(3) |
Tysons Tower Property (Subject) 7900 Tysons One Place McLean, VA 22102 | 2014/NAP | 528,730 | - | 100.0% | | | | | |
The Loft 1640 Boro Place McLean, Virginia | 2019/NAP | 143,606 | 0.8 Miles | 82.1% | Spaces | 51,422 | 12.0 Yrs | $54.00 | Full Service |
Boro Tower 8350 Broad Street McLean, Virginia | 2019/NAP | 438,169 | 0.9 miles | 76.7% | Alion Science & Technology | 13,800 | 11.1 Yrs | $57.00 | Full Service |
| Womble Bond Dickinson | 24,239 | 10.0 Yrs | $59.00 | Full Service |
| KPMG | 168,399 | 15.0 Yrs | $52.50 | Full Service |
| Hogan Lovells US LLP | 44,500 | 11.5 Yrs | $55.00 | Full Service |
Towers Crescent 1850 Towers Crescent Plaza McLean, Virginia | 2009/NAP | 295,031 | 0.4 Miles | 99.1% | MicroStrategy | 213,060 | 13.0 Yrs | $47.50 | Full Service |
Reston Station 1900 Reston Metro Plaza Reston, Virginia | 2017/NAP | 368,413 | 8.0 Miles | 46.4% | Google | 90,000 | 12.0 Yrs | $47.00 | Full Service |
Reston Town Center – 17Fifty(4) 1750 Presidents Street Reston, Virginia | 2020/NAP | 276,000 | 9.1 Miles | 99.3% | Leidos | 276,000 | 10.3 Yrs | $55.00 | Full Service |
1812 North Moore Street Arlington, Virginia | 2013/NAP | 539,552 | 9.3 Miles | 62.2% | Ablevets | 8,261 | 11.0 Yrs | $55.00 | Full Service |
| Nestle USA | 205,251 | 15.0 Yrs | $60.00 | Full Service |
Central Place Tower 1201 Wilson Boulevard Arlington, Virginia | 2018/NAP | 552,540 | 9.3 Miles | 92.9% | WeWork | 83,294 | 16.0 Yrs | $63.00 | Full Service |
| Accenture LLP | 29,000 | 10.0 Yrs | $60.00 | Full Service |
| (1) | Information obtained from the appraisal, unless otherwise noted. |
| (2) | Information obtained from a third party market research provider. |
| (3) | The appraiser’s ‘Full Service’ designation assumes tenants reimburse the landlord for future increases over the base year. |
| (4) | Reston Town Center – 17Fifty is currently under construction, 99.3% preleased, and expected to open in 2020. |
Escrows.
Real Estate Taxes – Upon the occurrence and continuance of a Cash Trap Event Period (see “Lockbox and Cash Management” section), the Tysons Tower Whole Loan documents require ongoing monthly real estate tax reserves in an amount equal to 1/12 of the real estate taxes that the lender estimates will be payable during the next 12 months.
Insurance– Upon (i) the occurrence and continuance of a Cash Trap Event Period, the Tysons Tower Whole Loan documents require ongoing monthly insurance reserves in an amount equal to 1/12 of the insurance premiums that the lender estimates will be payable for the renewal of the coverage during the next 12 months, (ii) the occurrence and continuance of an event of default or (iii) the failure of the Tysons Tower Borrower to provide evidence of timely payment of insurance premiums, the Tysons Tower Borrower is required to make ongoing monthly insurance reserve deposits applicable to insurance policies for the Tysons Tower Property.
Replacement Reserve – Upon the occurrence and continuance of a Cash Trap Event Period, the Tysons Tower Whole Loan documents require ongoing monthly replacement reserves of $50,000, subject to a cap of $1,000,000.
TI/LC Reserve – Upon the occurrence and continuance of a Cash Trap Event Period, the Tysons Tower Whole Loan documents require ongoing monthly TI/LC reserves of $110,152, subject to a cap of $1,321,825.
Lockbox and Cash Management. The Tysons Tower Whole Loan is structured with a hard lockbox, which is already in place, and springing cash management. The Tysons Tower Borrower is required to direct tenants to pay rent directly into such lockbox account and all rents received directly by the Tysons Tower Borrower or the property manager are required to be deposited into the lockbox account within three business days of receipt. Prior to the occurrence of a Cash Trap Event Period, all funds in the lockbox account are required to be distributed to The Tysons Tower Borrower. During a Cash Trap Event Period, funds in the lockbox account are required
THE INFORMATION IN THIS STRUCTURAL AND COLLATERAL TERM SHEET IS NOT COMPLETE AND MAY BE AMENDED PRIOR TO THE TIME OF SALE. THIS TERM SHEET IS NOT AN OFFER TO SELL THESE SECURITIES AND IT IS NOT A SOLICITATION OF AN OFFER TO BUY THESE SECURITIES IN ANY JURISDICTION WHERE THE OFFER OR SALE IS NOT PERMITTED.
83
| Office – Suburban | Loan #9 | Cut-off Date Balance: | | $45,000,000 |
| 7900 Tysons One Place | Tysons Tower | Cut-off Date LTV: | | 52.1% |
| McLean, VA 22102 | | U/W NCF DSCR: | | 3.06x |
| | | U/W NOI Debt Yield: | | 11.0% |
to be swept on each business day to a lender-controlled cash management account. Any excess cash flow remaining after satisfaction of the waterfall items outlined in the loan documents is required to be swept to an excess cash flow subaccount controlled by the lender as additional security for the Tysons Tower Whole Loan during the continuance of the Cash Trap Event Period.
A “Cash Trap Event Period” will commence upon the earlier of the following:
| (i) | the occurrence of an event of default under the Tysons Tower Whole Loan documents; or |
| (ii) | the net cash flow debt service coverage ratio (“NCF DSCR”), calculated on a hypothetical fully amortizing 30-year schedule, being less than 1.15x at the end of any calendar quarter. |
A Cash Trap Event Period will end upon the occurrence of the following:
| ● | with regard to clause (i), the cure of such event of default; or |
| ● | with regard to clause (ii), the NCF DSCR, calculated on a hypothetical fully amortizing 30-year schedule, being greater than or equal to 1.20x for two consecutive calendar quarters. |
Property Management. The Tysons Tower Property is managed by Hines Interests Limited Partnership, a real estate investment company that has managed properties since its inception in 1957. As of October 2019, Hines Interest Limited Partnership manages more than 222 million square feet across 514 properties including assets in Australia, Brazil, Canada, China, Denmark, Finland, France, Germany, Greece, India, Ireland, Italy, Mexico, the Netherlands, Panama, Poland, Russia, Spain, the United Kingdom and the United States.
Partial Release. Not permitted.
Real Estate Substitution.Not permitted.
Subordinate and Mezzanine Indebtedness.Not permitted.
Ground Lease. None.
Right of First Offer. Not permitted.
Terrorism Insurance.The Tysons Tower Whole Loan documents require that the “all risk” insurance policy required to be maintained by the Tysons Tower Borrower provide coverage for terrorism in an amount equal to the full replacement cost of the Tysons Tower Property, as well as business interruption insurance covering no less than the 24-month period following the occurrence of a casualty event, together with a 6-month extended period of indemnity (provided that if TRIPRA or a similar statute is not in effect, the Tysons Tower Borrower will not be obligated to pay terrorism insurance premiums in excess of two times the premium for the casualty and business interruption coverage on a stand-alone basis).
THE INFORMATION IN THIS STRUCTURAL AND COLLATERAL TERM SHEET IS NOT COMPLETE AND MAY BE AMENDED PRIOR TO THE TIME OF SALE. THIS TERM SHEET IS NOT AN OFFER TO SELL THESE SECURITIES AND IT IS NOT A SOLICITATION OF AN OFFER TO BUY THESE SECURITIES IN ANY JURISDICTION WHERE THE OFFER OR SALE IS NOT PERMITTED.
84
| Property Types - Various | Loan #10 | Cut-off Date Balance: | | $44,000,000 |
| Property Addresses - Various | East Side Manhattan Multifamily Portfolio | Cut-off Date LTV: | | 48.4% |
| | | U/W NCF DSCR: | | 2.40x |
| | | U/W NOI Debt Yield: | | 8.1% |
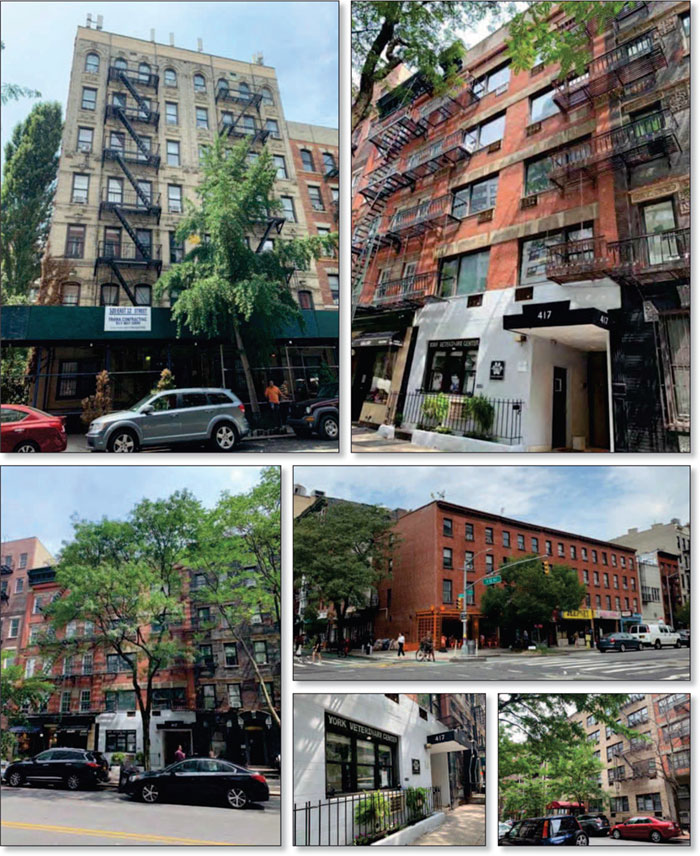
THE INFORMATION IN THIS STRUCTURAL AND COLLATERAL TERM SHEET IS NOT COMPLETE AND MAY BE AMENDED PRIOR TO THE TIME OF SALE. THIS TERM SHEET IS NOT AN OFFER TO SELL THESE SECURITIES AND IT IS NOT A SOLICITATION OF AN OFFER TO BUY THESE SECURITIES IN ANY JURISDICTION WHERE THE OFFER OR SALE IS NOT PERMITTED.
85
| No. 10 – East Side Manhattan Multifamily Portfolio |
| |
| Mortgage Loan Information | | Mortgaged Property Information |
| Mortgage Loan Seller: | Morgan Stanley Mortgage Capital Holdings LLC | | Single Asset/Portfolio: | Portfolio |
Credit Assessment (DBRS/Fitch/S&P): | NR/NR/NR | | Property Type – Subtype: | Various |
| Original Principal Balance: | $44,000,000 | | Location: | New York, NY |
| Cut-off Date Balance: | $44,000,000 | | Size(2): | 125 Units |
| % of Initial Pool Balance: | 3.7% | | Cut-off Date Balance Per Unit: | $352,000 |
| Loan Purpose: | Refinance | | Maturity Date Balance Per Unit: | $352,000 |
| Borrower Sponsor: | Hakim Holdings | | Year Built/Renovated: | Various/NAP |
| Guarantor: | Kambiz Hakim | | Title Vesting: | Fee |
| Mortgage Rate: | 3.2100% | | Property Manager: | The Salon Realty Corp. |
| Note Date: | September 30, 2019 | | Current Occupancy (As of): | 96.0% (9/30/2019) |
| Seasoning: | 1 month | | YE 2018 Occupancy: | 99.1% |
| Maturity Date: | October 1, 2029 | | YE 2017 Occupancy: | 98.4% |
| IO Period: | 120 months | | YE 2016 Occupancy: | 98.1% |
| Loan Term (Original): | 120 months | | YE 2015 Occupancy: | 96.4% |
| Amortization Term (Original): | NAP | | As-Is Appraised Value: | $91,000,000 |
| Loan Amortization Type: | Interest-only, Balloon | | As-Is Appraised Value Per Unit: | $728,000 |
| Call Protection: | L(25),D(90),O(5) | | As-Is Appraisal Valuation Date: | 7/31/2019 |
| Lockbox Type: | Springing | | Underwriting and Financial Information |
| Additional Debt: | None | | TTM NOI (8/31/2019): | $3,196,170 |
| Additional Debt Type (Balance): | NAP | | YE 2018 NOI: | $3,120,171 |
| | | | YE 2017 NOI: | $3,071,642 |
| | | | YE 2016 NOI: | $3,109,985 |
| | | | U/W Revenues: | $5,153,275 |
| | | | U/W Expenses: | $1,606,974 |
| Escrows and Reserves(1) | | U/W NOI(3): | $3,546,301 |
| | Initial | Monthly | Cap | | U/W NCF: | $3,442,205 |
| Taxes | $223,686 | $79,805 | NAP | | U/W DSCR based on NOI/NCF: | 2.48x / 2.40x |
| Insurance | $0 | Springing | NAP | | U/W Debt Yield based on NOI/NCF: | 8.1% / 7.8% |
| Replacement Reserve | $31,250 | Springing | $31,250 | | U/W Debt Yield at Maturity based on NOI/NCF | 8.1% / 7.8% |
| TI/LC Reserve | $0 | Springing | NAP | | Cut-off Date LTV Ratio: | 48.4% |
| Deferred Maintenance | $287,168 | $0 | NAP | | LTV Ratio at Maturity: | 48.4% |
| | | | | | | |
| | | | | | | | | |
| Sources and Uses |
| Sources | | | | | Uses | | | |
| Original loan amount | $44,000,000 | | 100.0% | | Loan Payoff | $32,213,434 | | 73.2 | % |
| | | | | | Return of Equity | 10,521,650 | | 23.9 | |
| | | | | | Closing Costs | 722,812 | | 1.6 | |
| | | | | | Reserves | 542,104 | | 1.2 | |
| Total Sources | $44,000,000 | | 100.0% | | Total Uses: | $44,000,000 | | 100.0 | % |
| (1) | See “Escrows” section for a full description of Escrows and Reserves. |
| (2) | Size comprises the multifamily portion of the East Side Manhattan Multifamily Portfolio (as defined below) and does not include the commercial tenants. |
| (3) | See “Cash Flow Analysis” section for a discussion of the increase in U/W NOI compared to the most recent NOI. |
The Mortgage Loan. The tenth largest mortgage loan (the “East Side Manhattan Multifamily Portfolio Mortgage Loan”) is evidenced by a single promissory note in the original principal balance of $44,000,000. The East Side Manhattan Multifamily Portfolio Mortgage Loan is secured by a first priority fee mortgage encumbering three multifamily properties and one mixed use (multifamily and retail) property located in New York, New York (the “East Side Manhattan Multifamily Portfolio” or “Properties” or “Property” when discussed on an individual basis).
The Borrowers and the Borrower Sponsor. The borrowers are 12th & 1st DE LLC, East-Ville Realty DE LLC, 417 East 72nd Street Associates DE LLC and Shemiran Co. DE LLC (collectively, the “East Side Manhattan Multifamily Portfolio Borrowers”), each a Delaware limited liability company structured to be bankruptcy-remote with one independent director. Legal counsel to the East Side Manhattan Multifamily Portfolio Borrowers delivered a non-consolidation opinion in connection with the origination of the East Side Manhattan Multifamily Portfolio Mortgage Loan. Hakim Holdings is the borrower sponsor and Kambiz Hakim is the non-recourse carveout guarantor with respect to the East Side Manhattan Multifamily Portfolio Mortgage Loan. Hakim Holdings is a Beverly Hills based commercial real
THE INFORMATION IN THIS STRUCTURAL AND COLLATERAL TERM SHEET IS NOT COMPLETE AND MAY BE AMENDED PRIOR TO THE TIME OF SALE. THIS TERM SHEET IS NOT AN OFFER TO SELL THESE SECURITIES AND IT IS NOT A SOLICITATION OF AN OFFER TO BUY THESE SECURITIES IN ANY JURISDICTION WHERE THE OFFER OR SALE IS NOT PERMITTED.
86
| Property Types - Various | Loan #10 | Cut-off Date Balance: | | $44,000,000 |
| Property Addresses - Various | East Side Manhattan Multifamily Portfolio | Cut-off Date LTV: | | 48.4% |
| | | U/W NCF DSCR: | | 2.40x |
| | | U/W NOI Debt Yield: | | 8.1% |
estate holding company which owns multifamily and commercial assets located in New York and Los Angeles. The company is managed by Steven and Alexander Hakim, along with their father Kambiz Hakim.
The Properties.The East Side Manhattan Multifamily Portfolio is comprised of three multifamily properties and one mixed use (multifamily and retail) property totaling 125 multifamily units and nine commercial spaces totaling 125 units located in New York, New York. The Properties were constructed between 1920 and 1950. As of September 30, 2019, the East Side Manhattan Multifamily Portfolio was 96.0% occupied. The East Side Manhattan Multifamily Portfolio includes nine one to seven story buildings containing 125 residential units, 24 of which are rent stabilized units and two of which are rent controlled, and nine ground floor commercial spaces totaling 7,200 SF. The Properties are located at 199, 201, 203, 205 First Avenue and 349, 351 East 12th Street (the “1st and 12th Properties”) (16.8% of units; 26.9% of U/W Base Rent) and 520 East 12th Street (32.0% of units; 34.2% of U/W Base Rent) in the East Village and 418 East 88th Street (36.8% of units; 28.7% of U/W Base Rent) and 417 East 72nd Street (14.4% of units; 10.2% of U/W Base Rent) on the Upper East Side.
The following table presents detailed information with respect to each of the Properties included in the East Side Manhattan Multifamily Portfolio:
East Side Manhattan Multifamily Portfolio Summary
| Building | Occ. %(1) | Units(1) | % of Total Units | Appraised Value | Allocated Loan Amount (“ALA”) | % of ALA | UW NOI | % of UW NOI |
| 199, 201, 203, 205 First Ave. & 349, 351 East 12th St. | 90.5% | 21 | 16.8% | $44,000,000 | $21,274,725 | 48.4% | $1,756,528 | 49.5% |
| 520 East 12th Street | 97.5% | 40 | 32.0% | $23,000,000 | $11,120,879 | 25.3% | $912,918 | 25.7% |
| 418 East 88th Street | 95.7% | 46 | 36.8% | $18,000,000 | $8,703,297 | 19.8% | $649,786 | 18.3% |
| 417 East 72nd Street | 100.0% | 18 | 14.4% | $6,000,000 | $2,901,099 | 6.6% | $227,069 | 6.4% |
| Total/Wtd. Avg. | 96.0% | 125 | 100.0% | $91,000,000 | $44,000,000 | 100.0% | $3,546,301 | 100.0% |
| (1) | Based on the borrower rent roll dated September 30, 2019. Includes multifamily units only, and excludes commercial units. |
The Properties.
199, 201, 203, 205 First Avenue and 349, 351 East 12th Street
The 1st and 12th Properties are comprised of six, four-story mixed use buildings located in New York, New York, within the East Village neighborhood. The 1st and 12th Properties were built in 1920. The unit mix comprises two- and three-bedroom floorplans, an NRA of 14,700 SF and average unit size of 700 SF. As of September 30, 2019, the 1st and 12th Properties were 90.5% occupied, with average in place monthly rent of $4,356/unit ($6.22 PSF). The unit mix is comprised of 21 market rent units and contains no rent stabilized units or rent controlled units. The 1st and 12th Properties contain eight street level commercial spaces, which are 100.0% occupied. All retail tenants have been in place over two years, with five tenants having been in place for over five years. Additionally, there is a contract with Time Warner, allowing the use of the roof of 199 1st Avenue, paying approximately $15,201 annually through January 31, 2023.
The following table presents certain information relating to the retail tenants at the 1st and 12th Properties:
Major Tenants(1)
| Tenant Name | Tenant NRSF | % of NRSF | Annual U/W Rent | Lease Expiration | |
| |
| Major Tenants | | | | | |
| New Phoenix Laundromat & Cleaners | 900 | 13.6% | $153,003 | 5/31/2024 | |
| Beep Beep NYC | 900 | 13.6% | $147,852 | 12/31/2022 | |
| Sao Mai Vietnamese Cuisine | 900 | 13.6% | $175,032 | 9/30/2022 | |
| Tribeca Health Care Management | 900 | 13.6% | $148,560 | 11/30/2025 | |
| Ducks Eatery | 900 | 13.6% | $134,315 | 4/30/2022 | |
| Thai Terminal | 750 | 11.4% | $83,604 | 5/31/2022 | |
| Motorino | 750 | 11.4% | $87,168 | 7/31/2021 | |
| Sarita’s Macaroni & Cheese | 600 | 9.1% | $166,308 | 5/31/2027 | |
| Time Warner Antenna (Roof) | NAP | NAP | $15,657 | 1/31/2023 | |
| Subtotal/Wtd. Avg. | 6,600 | 100.0% | $1,111,499 | | |
| (1) | Based on the borrower rent roll dated September 30, 2019. |
520 East 12th Street
The 520 East 12th Street Property is comprised of a single seven-story, elevator serviced, multifamily building located in New York, New York, within the East Village neighborhood. The 520 East 12th Street Property was built in 1930. The unit mix comprises one-, two-, three- and four-bedroom floorplans, an NRA of 27,775 SF and average unit size of 694 SF. As of September 30, 2019, the 520
THE INFORMATION IN THIS STRUCTURAL AND COLLATERAL TERM SHEET IS NOT COMPLETE AND MAY BE AMENDED PRIOR TO THE TIME OF SALE. THIS TERM SHEET IS NOT AN OFFER TO SELL THESE SECURITIES AND IT IS NOT A SOLICITATION OF AN OFFER TO BUY THESE SECURITIES IN ANY JURISDICTION WHERE THE OFFER OR SALE IS NOT PERMITTED.
87
| Property Types - Various | Loan #10 | Cut-off Date Balance: | | $44,000,000 |
| Property Addresses - Various | East Side Manhattan Multifamily Portfolio | Cut-off Date LTV: | | 48.4% |
| | | U/W NCF DSCR: | | 2.40x |
| | | U/W NOI Debt Yield: | | 8.1% |
East 12th Street Property was 97.5% occupied, with average in place monthly rent of $2,858/unit ($4.09 PSF). The unit mix is made up of 27 market rent units and 13 rent stabilized units, with no rent controlled units. There is a contract in place with Sprint (through June 30, 2022) and Verizon (through April 8, 2020), allowing the use of the roof of the 520 East 12th Street Property, together paying approximately $91,231 annually. Verizon has been a tenant at the 520 East 12th Street Property since 2015 and Sprint has been a tenant at the 520 East 12th Street Property since 2001.
418 East 88th Street
The 418 East 88th Street Property is comprised of a single five-story, elevator serviced, multifamily building located in New York, New York, within the Upper East Side neighborhood. The 418 East 88th Street Property was built in 1950. The unit mix comprises studio, one-, two- and three-bedroom floorplans, an NRA of 21,650 SF and average unit size of 471 SF. As of September 30, 2019, the 418 East 88th Street Property was 95.7% occupied, with average in place monthly rent of $2,155/unit ($4.55 PSF). The unit mix is made up of 37 market rent units, eight rent stabilized units and one rent controlled unit. There is a contract in place with Hercules, allowing the use of the basement of the 418 East 88th Street Property as a laundry facility, paying approximately $6,300 annually through February 28, 2025. Hercules has managed the laundry facility since March 2018 and operates under a seven-year lease.
417 East 72nd Street
The 417 East 72nd Street Property is comprised of a single five-story, elevator serviced, multifamily building located in New York, New York, within the Upper East Side neighborhood. The 417 East 72nd Street Property was built in 1920. The unit mix comprises studio and one-bedroom floorplans, an NRA of 8,250 SF and average unit size of 458 SF. As of September 30, 2019, the 417 East 72nd Street Property was 100.0% occupied, with average in place monthly rent of $1,926/unit ($4.20 PSF). The unit mix is made up of 14 market rent units, three rent stabilized units and one rent controlled unit. The 417 East 72nd Street Property contains one office tenant. Spencer J. Herman, a veterinarian office, has been a tenant at the 417 East 72nd Street Property since May 2018 and operates under a seven year lease (expiring May 31, 2025) with three, one-year extension options, paying approximately $46,968 annually.
Operating History and Underwritten Net Cash Flow. The following table presents certain information relating to the historical operating performance and underwritten net cash flow at the East Side Manhattan Multifamily Portfolio:
The following table presents historical occupancy percentages at the East Side Manhattan Multifamily Portfolio:
Historical Occupancy
12/31/2015(1) | 12/31/2016(1) | 12/31/2017(1) | 12/31/2018(1) | 9/30/2019(2) |
| 96.4% | 98.1% | 98.4% | 99.1% | 96.0% |
| (1) | Information obtained from the borrower. |
| (2) | Information obtained from the underwritten rent roll. |
THE INFORMATION IN THIS STRUCTURAL AND COLLATERAL TERM SHEET IS NOT COMPLETE AND MAY BE AMENDED PRIOR TO THE TIME OF SALE. THIS TERM SHEET IS NOT AN OFFER TO SELL THESE SECURITIES AND IT IS NOT A SOLICITATION OF AN OFFER TO BUY THESE SECURITIES IN ANY JURISDICTION WHERE THE OFFER OR SALE IS NOT PERMITTED.
88
| Property Types - Various | Loan #10 | Cut-off Date Balance: | | $44,000,000 |
| Property Addresses - Various | East Side Manhattan Multifamily Portfolio | Cut-off Date LTV: | | 48.4% |
| | | U/W NCF DSCR: | | 2.40x |
| | | U/W NOI Debt Yield: | | 8.1% |
Cash Flow Analysis
| | 2016 | 2017 | 2018 | 8/31/2019 TTM | U/W | %(1) | U/W $ per Unit |
| Gross Potential Rent | $3,317,165 | $3,486,605 | $3,538,312 | $3,638,479 | $4,082,078 | 75.3% | $32,657 |
| Other Income | 1,136,443 | 980,540 | 1,073,692 | 1,152,666 | 1,342,422 | 24.7 | 10,739 |
| Total Recoveries | 0 | 0 | 0 | 0 | 0 | 0.0 | 0.00 |
| Net Rental Income | $4,453,607 | $4,467,145 | $4,612,004 | $4,791,145 | $5,424,500 | 100.0% | $43,396 |
| Concessions | 0 | 0 | 0 | 0 | 0 | 0.0 | 0.00 |
| (Vacancy & Credit Loss) | 0 | 0 | 0 | 0 | (271,225) | (6.6) | (2,167) |
| Effective Gross Income | $4,453,607 | $4,467,145 | $4,612,004 | $4,791,145 | $5,153,275 | 95.0% | $41,226 |
| | | | | | | | |
| Real Estate Taxes | 790,280 | 859,648 | 933,904 | 958,786 | 957,946 | 18.6 | 7,6634 |
| Insurance | 53,541 | 50,272 | 53,626 | 53,626 | 53,626 | 1.0 | 429 |
| Management Fee | 175,691 | 178,859 | 182,469 | 193,292 | 206,131 | 4.0 | 1,649 |
| Other Operating Expenses | 324,110 | 306,724 | 321,833 | 389,271 | 389,271 | 7.6 | 3,114 |
| Total Operating Expenses | $1,343,622 | $1,395,503 | $1,491,833 | $1,594,975 | $1,606,974 | 31.2% | $12,856 |
| | | | | | | | |
| Net Operating Income(2) | $3,109,985 | $3,071,642 | $3,120,171 | $3,196,170 | $3,546,301 | 68.8% | $28,370 |
| Replacement Reserves | 0 | 0 | 0 | 0 | 44,351 | 0.9 | 355 |
| TI/LC | 0 | 0 | 0 | 0 | 59,745 | 1.2 | 478 |
| Net Cash Flow | $3,109,985 | $3,071,642 | $3,120,171 | $3,196,170 | $3,442,205 | 66.8% | $27,538 |
| | | | | | | | |
| NOI DSCR | 2.17x | 2.14x | 2.18x | 2.23x | 2.48x | | |
| NCF DSCR | 2.17x | 2.14x | 2.18x | 2.23x | 2.40x | | |
| NOI Debt Yield | 7.1% | 7.0% | 7.1% | 7.3% | 8.1% | | |
| NCF Debt Yield | 7.1% | 7.0% | 7.1% | 7.3% | 7.8% | | |
| (1) | Represents (i) percent of Net Rental Income for all revenue fields, (ii) percent of Gross Potential Rent for Vacancy & Credit Loss and (iii) percent of Effective Gross Income for all other fields. |
| (2) | Increase in Net Operating Income from 8/31/2019 TTM to U/W is primarily due to (i) the increase in Other Income, which is comprised of income from commercial leases and antennae contracts and (ii) multiple tenants renewing at higher rents and one vacant unit being leased at the 1st and 12th Properties. |
Appraisal.The Properties were valued individually, with the individual values reflecting a total “as-is” appraised value of $91,000,000. The appraisals are dated as of July 31, 2019.
Environmental Matters. According to Phase I environmental site assessments dated August 9, 2019, there was no evidence of any recognized environmental conditions at the East Side Manhattan Multifamily Portfolio.
Market Overview and Competition.The East Side Manhattan Multifamily Portfolio is located in New York, New York within the New York City multifamily market. According to the appraisal, as of the first quarter of 2019, the vacancy rate in the New York City multifamily market was approximately 4.2%, with average asking rents of $3,726 per unit and inventory of approximately 217,714 units.
The 1st and 12th Properties and the 520 East 12th Street Property are located within the West Village/Downtown submarket of the Manhattan multifamily market. According to the appraisal, as of the first quarter of 2019, the vacancy rate in the West Village/Downtown submarket was approximately 3.3%, with average asking rents of $4,631 per unit and inventory of approximately 26,737 units. The 1st and 12th Properties and the 520 East 12th Street Property are centrally located in the East Village, which is surrounded by the East River, Chinatown, two bridges and the Lower East Side. Major demand drivers in the area includes Tompkins Square Park and the New York University campus and primary access to the area is provided by the B, D and Q trains and the J, M and Z subway lines. Essex Crossing is a 1.87 million SF mixed-use development that is expected to be completed by 2021 in the East Village area. The proposed development is expected to include office and community facility space, park spaces, a new home for the Andy Warhol Museum, retail stores, restaurants, a movie theater, residential condominiums, a new Essex Market, and 1,000 apartments.
The 418 East 88th Street Property and the 417 East 72nd Street Property are located within the Upper East Side submarket of the Manhattan multifamily market. According to the appraisal, as of the first quarter of 2019, the vacancy rate in the Upper East Side submarket was approximately 2.9%, with average asking rents of $4,367 per unit and inventory of approximately 16,744 units. The 418 East 88th Street Property and the 417 East 72nd Street Property are located in the Upper East Side, which incorporates the neighborhoods of Park East, Yorkville and Carnegie Hill. Major demand drivers in the area include the Museum Mile and Hunter College and primary access to the 418 East 88th Street Property and the 417 East 72nd Street Property is primarily provided by the 4, 5, 6 and Q lines, and public bus.
The following table presents certain information relating to the appraiser’s market rent conclusion for the East Side Manhattan Multifamily Portfolio:
THE INFORMATION IN THIS STRUCTURAL AND COLLATERAL TERM SHEET IS NOT COMPLETE AND MAY BE AMENDED PRIOR TO THE TIME OF SALE. THIS TERM SHEET IS NOT AN OFFER TO SELL THESE SECURITIES AND IT IS NOT A SOLICITATION OF AN OFFER TO BUY THESE SECURITIES IN ANY JURISDICTION WHERE THE OFFER OR SALE IS NOT PERMITTED.
89
| Property Types - Various | Loan #10 | Cut-off Date Balance: | | $44,000,000 |
| Property Addresses - Various | East Side Manhattan Multifamily Portfolio | Cut-off Date LTV: | | 48.4% |
| | | U/W NCF DSCR: | | 2.40x |
| | | U/W NOI Debt Yield: | | 8.1% |
Market Rent Summary
| Building | Units(1) | Avg. Size | Avg. Monthly In Place Rent per Unit(1) | Avg. Monthly In Place Rent PSF(1) | Avg. Monthly Market Rent per Unit | Avg. Monthly Market Rent PSF |
| 199, 201, 203, 205 First Ave. & 349, 351 East 12th St. | 21 | 700 | $4,356 | $6.22 | $4,781 | $6.83 |
| 520 East 12th Street | 40 | 694 | $2,858 | $4.09 | $4,680 | $6.74 |
| 418 East 88th Street | 46 | 471 | $2,155 | $4.55 | $2,678 | $5.69 |
| 417 East 72nd Street | 18 | 458 | $1,926 | $4.20 | $2,467 | $5.38 |
Source:Appraisal
| (1) | Based on the borrower rent roll dated September 30, 2019. |
The following table presents certain information relating to comparable rental properties to the 1st and 12th Properties and the 520 East 12th Street Property:
Comparable Rental Properties (1st and 12th Properties and 520 East 12th Street Property)
| Property | Year
Built | # of
Stories | # Units | Unit Mix | Average SF per Unit | Average Monthly Rent per Unit | Average Annual Rent PSF |
| 1st and 12th | 1920 | 4 | 21 | 2BR 3BR | 700 700 | $4,400 $4,363 | $75.43 $74.80 |
| 520 East 12th Street | 1930 | 4 | 40 | 1BR 2BR 3BR 4BR | 692 633 822 850 | $2,001 $2,459 $4,426 $4,450 | $34.71 $46.60 $64.60 $62.82 |
99 East 7th Street New York | 1930 | 5 | 17 | 2BR 3BR | 491 700 | $3,853 $5,099 | $94.17 $87.41 |
112 East 7th Street New York | 1920 | 5 | 20 | 1BR 2BR | 450 575 | $3,292 $4,488 | $87.79 $93.66 |
331 East 9th Street New York | 1900 | 5 | 10 | 1BR 2BR 3BR | 650 1,000 1,000 | $3,847 $5,278 $5,461 | $71.02 $63.34 $65.53 |
647 East 11th Street New York | 1910 | 6 | 34 | 2BR 3BR | 650 725 | $3,400 $5,639 | $62.77 $93.34 |
504 East 12th Street New York | 1930 | 6 | 33 | 2BR 3BR | 624 800 | $4,171 $4,503 | $80.21 $67.55 |
416-418 East 13th Street New York | 1900 | 6 | 35 | 2BR | 600 | $3,891 | $77.82 |
THE INFORMATION IN THIS STRUCTURAL AND COLLATERAL TERM SHEET IS NOT COMPLETE AND MAY BE AMENDED PRIOR TO THE TIME OF SALE. THIS TERM SHEET IS NOT AN OFFER TO SELL THESE SECURITIES AND IT IS NOT A SOLICITATION OF AN OFFER TO BUY THESE SECURITIES IN ANY JURISDICTION WHERE THE OFFER OR SALE IS NOT PERMITTED.
90
| Property Types - Various | Loan #10 | Cut-off Date Balance: | | $44,000,000 |
| Property Addresses - Various | East Side Manhattan Multifamily Portfolio | Cut-off Date LTV: | | 48.4% |
| | | U/W NCF DSCR: | | 2.40x |
| | | U/W NOI Debt Yield: | | 8.1% |
The following table presents certain information relating to comparable rental properties to the 418 East 88th Street Property and the 417 East 72nd Street Property:
Comparable Rental Properties (418 East 88th Street Property and 417 East 72nd Street Property)
| Property | Year
Built | # of
Stories | # Units | Unit Mix | Average SF
per Unit | Average
Monthly Rent
per Unit | Average
Annual Rent
PSF |
| 418 East 88th Street | 1950 | 5 | 46 | Studio 1BR 2BR 3BR | 400 600 600 850 | $1,966 $1,382 $2,696 $3995 | $58.99 $27.63 $53.92 $56.40 |
| 417 East 72nd Street | 1920 | 5 | 18 | Studio 1BR | 400 475 | $1,946 $1,921 | $58.38 $48.53 |
1143-1145 First Avenue New York | 1910 | 5 | 17 | 2BR | 594 | $3,198 | $64.60 |
246-248 East 53rd Street New York | 1900 | 6 | 21 | 1BR 2BR 3BR | 475 475 775 | $2,257 $2,817 $4,000 | $57.02 $71.17 $61.94 |
513 East 82nd Street New York | 1910 | 5 | 20 | Studio 1BR 2BR | 400 450 575 | $2,500 $2,736 $3,525 | $75.00 $72.96 $73.57 |
419 East 82nd Street New York | 1910 | 5 | 20 | Studio 1BR | 325 375 | $2,325 $2,631 | $85.85 $84.19 |
409 East 81st Street New York | 1900 | 5 | 20 | Studio 1BR | 300 375 | $2,308 $2,641 | $92.32 $84.51 |
340 East 61st Street New York | 1910 | 5 | 20 | 1BR | 425 | $2,704 | $76.35 |
338 East 55th Street New York | 1950 | 5 | 10 | 1BR 2BR 3BR | 450 550 875 | $2,750 $3,856 $6,200 | $73.33 $84.13 $85.03 |
443 East 78th Street New York | 1924 | 5 | 20 | Studio 1BR 2BR | 350 450 550 | $2,200 $2,688 $3,167 | $75.43 $71.68 $69.10 |
244 East 78th Street New York | 1910 | 5 | 24 | Studio 1BR 2BR 3BR | 325 375 425 675 | $2,540 $2,745 $3,200 $6,000 | $93.78 $87.84 $90.35 $106.67 |
342 East 76th Street New York | 1910 | 5 | 17 | Studio 1BR 2BR | 375 375 700 | $2,409 $2,770 $3,500 | $77.09 $88.64 $60.00 |
Escrows.
Real Estate Taxes– The East Side Manhattan Multifamily Portfolio Mortgage Loan documents require an upfront reserve of $223,686 for real estate taxes and monthly deposits into a reserve for real estate taxes in an amount equal to 1/12 of the real estate taxes that the lender estimates will be payable during the next twelve months (initially $79,805).
Insurance– Monthly reserves for insurance premiums are not required so long as (i) no event of default is continuing, (ii) the insurance coverage for each Property is included in a blanket or umbrella policy approved by the lender in its reasonable discretion, and (iii) the East Side Manhattan Multifamily Portfolio Borrowers provide the lender with evidence of payment of the insurance premiums and renewals of the insurance policies, no later than ten days prior to the expiration of the current policy. If such conditions are not satisfied, the East Side Manhattan Multifamily Portfolio Borrowers will be required to make monthly deposits into a reserve for insurance premiums in an amount equal to 1/12 of the insurance premiums that the lender estimates will be payable for the renewal of coverage upon the expiration of the insurance policies.
Replacement Reserve– The East Side Manhattan Multifamily Portfolio Mortgage Loan documents require an upfront reserve of $31,250 (the “Replacements Cap”) for replacements and monthly deposits of $2,604 into such replacement reserve, provided that such monthly deposits are not required at any time the amount then on deposit in the replacement reserve equals or exceeds the Replacements Cap.
TI/LC Reserve– Monthly reserves for tenant improvements and leasing commissions are not required so long as the Rollover Conditions Precedent (as defined below) are satisfied. If the Rollover Conditions Precedent are not satisfied, the East Side Manhattan Multifamily Portfolio Mortgage Loan documents require monthly deposits of $9,036 into a reserve for tenant improvements and leasing commissions.
THE INFORMATION IN THIS STRUCTURAL AND COLLATERAL TERM SHEET IS NOT COMPLETE AND MAY BE AMENDED PRIOR TO THE TIME OF SALE. THIS TERM SHEET IS NOT AN OFFER TO SELL THESE SECURITIES AND IT IS NOT A SOLICITATION OF AN OFFER TO BUY THESE SECURITIES IN ANY JURISDICTION WHERE THE OFFER OR SALE IS NOT PERMITTED.
91
| Property Types - Various | Loan #10 | Cut-off Date Balance: | | $44,000,000 |
| Property Addresses - Various | East Side Manhattan Multifamily Portfolio | Cut-off Date LTV: | | 48.4% |
| | | U/W NCF DSCR: | | 2.40x |
| | | U/W NOI Debt Yield: | | 8.1% |
“Rollover Conditions Precedent” means (i) no event of default is continuing under the East Side Manhattan Multifamily Portfolio Mortgage Loan documents and (ii) 80% or more of the total rentable square feet at the Properties has been leased to bona fide, independent third party tenants that are not affiliated with any borrower or guarantor and such 80% occupancy, as determined and calculated by the lender in its reasonable judgment, is evidenced by certified rent rolls provided by the East Side Manhattan Multifamily Portfolio Borrowers.
Deferred Maintenance –The East Side Manhattan Multifamily Portfolio Mortgage Loan documents require an upfront reserve of $287,168 for deferred maintenance, including elevator and other repairs and closing out various building code, fire code and other code violations.
Lockbox and Cash Management.The East Side Manhattan Multifamily Portfolio Mortgage Loan is structured with a springing lockbox and springing cash management. Upon the first occurrence of a Cash Sweep Event Period (as defined below), the East Side Manhattan Multifamily Portfolio Borrowers are required to establish a lockbox account into which, during a Cash Sweep Event Period, the East Side Manhattan Multifamily Portfolio Borrowers and property manager are required to directly deposit, or cause to be deposited, all rents from the East Side Manhattan Multifamily Portfolio Properties, within one business day of receipt thereof. In addition, upon the first occurrence of a Cash Sweep Event Period, the East Side Manhattan Multifamily Portfolio Borrowers will be required to deliver tenant direction letters to all commercial tenants directing them to deposit their rents directly into such lockbox account. Upon the first occurrence of a Cash Sweep Event Period, the lender is required to establish, and the East Side Manhattan Multifamily Portfolio Borrowers are required to cooperate with the cash management bank to establish, a lender-controlled cash management account, into which the East Side Manhattan Multifamily Portfolio Borrowers are required to cause all sums in the lockbox account to be transferred during a Cash Sweep Event Period. During the continuance of a Cash Sweep Event Period, provided no event of default is continuing, all funds in the cash management account are required to be applied on each monthly payment date: (i) to make the monthly deposits into the real estate tax and insurance reserves, if any, as described above under “Escrows,” (ii) to pay debt service on the East Side Manhattan Multifamily Portfolio Mortgage Loan, (iii) to make the monthly deposits into the replacement reserve and rollover reserve, if any, as described above under “Escrows,” (iv) to pay operating expenses set forth in the lender-approved annual budget and lender-approved extraordinary expenses, and (v) to deposit any remainder into an excess cash flow subaccount to be held as additional security for the East Side Manhattan Multifamily Portfolio Mortgage Loan during such Cash Sweep Event Period. If no Cash Sweep Event Period exists, funds in the cash management account are required to be disbursed to the East Side Manhattan Multifamily Portfolio Borrowers.
A “Cash Sweep Event Period” means a period:
| (i) | commencing upon the occurrence of an event of default under the East Side Manhattan Multifamily Portfolio Mortgage Loan documents and ending upon the cure (if applicable) of such event of default; or |
| (ii) | commencing upon the occurrence of a bankruptcy filing (whether voluntary or involuntary) or insolvency of the East Side Manhattan Multifamily Portfolio Borrowers, non-recourse carveout guarantor or property manager and ending upon, in the case of the property manager only, the replacement of the property manager with a qualified manager acceptable to the lender under a replacement management agreement acceptable to the lender; or |
| (iii) | commencing upon the interest-only debt service coverage ratio on the East Side Manhattan Multifamily Portfolio Mortgage Loan falling below 1.70x (a “DSCR Event”), and ending on the date the interest-only debt service coverage ratio equals or exceeds 1.70x for two consecutive calendar quarters. |
The East Side Manhattan Multifamily Portfolio Borrowers may avoid a Cash Sweep Event Period based on a DSCR Event for a period of two consecutive years commencing on the date that the Cash Sweep Event Period was triggered by depositing with the lender cash or a letter of credit meeting the requirements of the East Side Manhattan Multifamily Portfolio Mortgage Loan documents in an amount (i) equal to $500,000 at the time of commencement of the Cash Sweep Event Period caused by the DSCR Event and (ii) equal to $500,000 on or prior to the 180th day, 360th day and 540th day of the Cash Sweep Event Period caused by the DSCR Event; provided, however, if the debt service coverage ratio is not at least 1.70x for two consecutive calendar quarters prior to the end of such two year period, a Cash Sweep Event Period will be deemed to have occurred regardless of whether such cash or letter of credit has been deposited; provided, further, that the Cash Sweep Event Period will end and any cash or letter of credit will be returned to the East Side Manhattan Multifamily Portfolio Borrowers only after the debt service coverage ratio (not taking into account any such cash or letter of credit) is equal to or greater than 1.70x for two consecutive calendar quarters.
Property Management.The East Side Manhattan Multifamily Portfolio is managed by The Salon Realty Corp., a third party property manager.
Partial Release.After the expiration of the defeasance lockout period for the East Side Manhattan Multifamily Portfolio Mortgage Loan, the East Side Manhattan Multifamily Portfolio Borrowers have the right to obtain a release of any of the individual Properties, provided certain conditions are satisfied, including: (i) no event of default has occurred and remains uncured, (ii) the East Side Manhattan Multifamily Portfolio Borrowers partially defease the East Side Manhattan Multifamily Portfolio Mortgage Loan in a principal amount equal to the Release Amount (as defined below) of the related individual Property, (iii) the loan-to-value ratio of the remaining Properties is not greater than the lesser of (A) 48.4%, (B) the loan-to-value ratio at origination and (C) the loan-to-value ratio immediately prior to defeasance, (iv) the debt service coverage ratio of the remaining Properties is equal to or greater than the greater of (A) 1.80x, (B) the debt service coverage ratio at origination and (C) the debt service coverage ratio immediately prior to defeasance,
THE INFORMATION IN THIS STRUCTURAL AND COLLATERAL TERM SHEET IS NOT COMPLETE AND MAY BE AMENDED PRIOR TO THE TIME OF SALE. THIS TERM SHEET IS NOT AN OFFER TO SELL THESE SECURITIES AND IT IS NOT A SOLICITATION OF AN OFFER TO BUY THESE SECURITIES IN ANY JURISDICTION WHERE THE OFFER OR SALE IS NOT PERMITTED.
92
| Property Types - Various | Loan #10 | Cut-off Date Balance: | | $44,000,000 |
| Property Addresses - Various | East Side Manhattan Multifamily Portfolio | Cut-off Date LTV: | | 48.4% |
| | | U/W NCF DSCR: | | 2.40x |
| | | U/W NOI Debt Yield: | | 8.1% |
(v) the debt yield of the remaining Properties is equal to or greater than the greater of (A) 7.8%, (B) the debt yield at origination and (C) the debt yield immediately prior to defeasance, and (vi) customary REMIC requirements are satisfied.
“Release Amount” means the greater of (i) 110% of the allocated loan amount of the individual Property being released; provided, however, that such amount will be reduced to 100% of such allocated loan amount if after the related release, the remaining Properties have a loan-to-value ratio not greater than 45% and a debt yield of at least 8.75% and (ii) the net sales proceeds (gross sales proceeds less reasonable and customary closing costs, not to exceed 8% of the total purchase price) of the individual Property being released.
Real Estate Substitution.Not permitted.
Subordinate and Mezzanine Indebtedness.Not permitted.
Ground Lease.None.
Right of First Offer/Right of First Refusal.None.
Letter of Credit.None. However, a letter of credit may be posted in order to avoid a Cash Sweep Event Period as described above under “Lockbox and Cash Management.”
Terrorism Insurance.The East Side Manhattan Multifamily Portfolio Borrowers are required to obtain and maintain an “all risk” or “special form” property insurance policy that covers perils of terrorism and acts of terrorism in an amount equal to the “full replacement cost” of the East Side Manhattan Multifamily Portfolio Properties, together with business income insurance covering not less than the 18-month period commencing at the time of loss, together with an extended period of indemnity endorsement of not less than six months. Notwithstanding the foregoing, for so long as the Terrorism Risk Insurance Act of 2002, as extended and modified by the Terrorism Risk Insurance Program Reauthorization Act of 2015 (“TRIPRA”) is in effect (including any extensions thereof or if another federal governmental program is in effect relating to “acts of terrorism” which provides substantially similar protections as TRIPRA), and covers both domestic and foreign acts of terrorism, the lender is required to accept terrorism insurance which insures against “covered acts” as defined by TRIPRA (or such other program). See“Risk Factors—Risks Relating to the Mortgage Loans—Terrorism Insurance May Not Be Available for All Mortgaged Properties”in the Preliminary Prospectus.
THE INFORMATION IN THIS STRUCTURAL AND COLLATERAL TERM SHEET IS NOT COMPLETE AND MAY BE AMENDED PRIOR TO THE TIME OF SALE. THIS TERM SHEET IS NOT AN OFFER TO SELL THESE SECURITIES AND IT IS NOT A SOLICITATION OF AN OFFER TO BUY THESE SECURITIES IN ANY JURISDICTION WHERE THE OFFER OR SALE IS NOT PERMITTED.
93
| BANK 2019-BNK22 | Transaction Contact Information |
II. Transaction Contact Information
Questions regarding this Structural and Collateral Term Sheet may be directed to any of the following individuals:
| Wells Fargo Securities, LLC | |
| | |
| Brigid Mattingly | Tel. (312) 269-3062 |
| | |
| A.J. Sfarra | Tel. (212) 214-5613 |
| | |
| Alex Wong | Tel. (212) 214-5615 |
| BofA Merrill Lynch | |
| | |
| Leland F. Bunch, III | Tel. (646) 855-3953 |
| | |
| Danielle Caldwell | Tel. (646) 855-3421 |
| Morgan Stanley & Co. | |
| | |
| Nishant Kapur | Tel. (212) 761-1483 |
| | |
| Jane Lam | Tel. (212) 296-8567 |
| | |
| Brandon Atkins | Tel. (212) 761-4846 |
THE INFORMATION IN THIS STRUCTURAL AND COLLATERAL TERM SHEET IS NOT COMPLETE AND MAY BE AMENDED PRIOR TO THE TIME OF SALE. THIS TERM SHEET IS NOT AN OFFER TO SELL THESE SECURITIES AND IT IS NOT A SOLICITATION OF AN OFFER TO BUY THESE SECURITIES IN ANY JURISDICTION WHERE THE OFFER OR SALE IS NOT PERMITTED.
94