| | | FREE WRITING PROSPECTUS |
| | | FILED PURSUANT TO RULE 433 |
| | | REGISTRATION FILE NO.: 333-226486-13 |
| | | |
Free Writing Prospectus
Structural and Collateral Term Sheet
$962,831,712
(Approximate Initial Pool Balance)
$852,106,000
(Approximate Aggregate Certificate Balance of Offered Certificates)
Wells Fargo Commercial Mortgage Trust 2020-C55
as Issuing Entity
Wells Fargo Commercial Mortgage Securities, Inc.
as Depositor
Wells Fargo Bank, National Association
Barclays Capital Real Estate Inc.
LMF Commercial, LLC (f/k/a Rialto Mortgage Finance, LLC)
Ladder Capital Finance LLC
Rialto Real Estate Fund IV – Debt, LP
Argentic Real Estate Finance LLC
as Sponsors and Mortgage Loan Sellers
Commercial Mortgage Pass-Through Certificates
Series 2020-C55
February 3, 2020
WELLS FARGO SECURITIES Co-Lead Manager and Joint Bookrunner | | BARCLAYS Co-Lead Manager and Joint Bookrunner |
| | |
Academy Securities Co-Manager | | Drexel Hamilton Co-Manager |
STATEMENT REGARDING THIS FREE WRITING PROSPECTUS
The depositor has filed a registration statement (including a prospectus) with the Securities and Exchange Commission (‘‘SEC’’) (SEC File No. 333-226486) for the offering to which this communication relates. Before you invest, you should read the prospectus in the registration statement and other documents the depositor has filed with the SEC for more complete information about the depositor, the issuing entity and this offering. You may get these documents for free by visiting EDGAR on the SEC Web site at www.sec.gov. Alternatively, the depositor, any underwriter, or any dealer participating in the offering will arrange to send you the prospectus after filing if you request it by calling toll free 1-800-745-2063 (8 a.m. – 5 p.m. EST) or by emailing wfs.cmbs@wellsfargo.com.
Nothing in this document constitutes an offer of securities for sale in any jurisdiction where the offer or sale is not permitted. The information contained herein is preliminary as of the date hereof, supersedes any such information previously delivered to you and will be superseded by any such information subsequently delivered and ultimately by the final prospectus relating to the securities. These materials are subject to change, completion, supplement or amendment from time to time.
This free writing prospectus has been prepared by the underwriters for information purposes only and does not constitute, in whole or in part, a prospectus for the purposes of Regulation (EU) 2017/1129 (as amended) and/or Part VI of the Financial Services and Markets Act 2000, as amended, or other offering document.
STATEMENT REGARDING ASSUMPTIONS AS TO SECURITIES, PRICING ESTIMATES AND OTHER INFORMATION
The attached information contains certain tables and other statistical analyses (the “Computational Materials”) which have been prepared in reliance upon information furnished by the Mortgage Loan Sellers. Numerous assumptions were used in preparing the Computational Materials, which may or may not be reflected herein. As such, no assurance can be given as to the Computational Materials’ accuracy, appropriateness or completeness in any particular context; or as to whether the Computational Materials and/or the assumptions upon which they are based reflect present market conditions or future market performance. The Computational Materials should not be construed as either projections or predictions or as legal, tax, financial or accounting advice. You should consult your own counsel, accountant and other advisors as to the legal, tax, business, financial and related aspects of a purchase of these securities. Any weighted average lives, yields and principal payment periods shown in the Computational Materials are based on prepayment and/or loss assumptions, and changes in such prepayment and/or loss assumptions may dramatically affect such weighted average lives, yields and principal payment periods. In addition, it is possible that prepayments or losses on the underlying assets will occur at rates higher or lower than the rates shown in the attached Computational Materials. The specific characteristics of the securities may differ from those shown in the Computational Materials due to differences between the final underlying assets and the preliminary underlying assets used in preparing the Computational Materials. The principal amount and designation of any security described in the Computational Materials are subject to change prior to issuance. None of Wells Fargo Securities, LLC, Barclays Capital Inc., Academy Securities, Inc., Drexel Hamilton, LLC, or any of their respective affiliates, make any representation or warranty as to the actual rate or timing of payments or losses on any of the underlying assets or the payments or yield on the securities. The information in this presentation is based upon management forecasts and reflects prevailing conditions and management’s views as of this date, all of which are subject to change. In preparing this presentation, we have relied upon and assumed, without independent verification, the accuracy and completeness of all information available from public sources or which was provided to us by or on behalf of the Mortgage Loan Sellers or which was otherwise reviewed by us.
This free writing prospectus contains certain forward-looking statements. If and when included in this free writing prospectus, the words “expects”, “intends”, “anticipates”, “estimates” and analogous expressions and all statements that are not historical facts, including statements about our beliefs or expectations, are intended to identify forward-looking statements. Any forward-looking statements are made subject to risks and uncertainties which could cause actual results to differ materially from those stated. Those risks and uncertainties include, among other things, declines in general economic and business conditions, increased competition, changes in demographics, changes in political and social conditions, regulatory initiatives and changes in customer preferences, many of which are beyond our control and the control of any other person or entity related to this offering. The forward-looking statements made in this free writing prospectus are made as of the date stated on the cover. We have no obligation to update or revise any forward-looking statement.
Wells Fargo Securities is the trade name for the capital markets and investment banking services of Wells Fargo & Company and its subsidiaries, including but not limited to Wells Fargo Securities, LLC, a member of NYSE, FINRA, NFA and SIPC, Wells Fargo Prime Services, LLC, a member of FINRA, NFA and SIPC, and Wells Fargo Bank, N.A. Wells Fargo Securities, LLC and Wells Fargo Prime Services, LLC are distinct entities from affiliated banks and thrifts.
IMPORTANT NOTICE REGARDING THE OFFERED CERTIFICATES
The information herein is preliminary and may be supplemented or amended prior to the time of sale. In addition, the Offered Certificates referred to in these materials and the asset pool backing them are subject to modification or revision (including the possibility that one or more classes of certificates may be split, combined or eliminated at any time prior to issuance or availability of a final prospectus) and are offered on a “when, as and if issued” basis.
The underwriters described in these materials may from time to time perform investment banking services for, or solicit investment banking business from, any company named in these materials. The underwriters and/or their affiliates or respective employees may from time to time have a long or short position in any security or contract discussed in these materials.
The information contained herein supersedes any previous such information delivered to any prospective investor and will be superseded by information delivered to such prospective investor prior to the time of sale.
IMPORTANT NOTICE RELATING TO AUTOMATICALLY-GENERATED EMAIL DISCLAIMERS
Any legends, disclaimers or other notices that may appear at the bottom of any email communication to which this free writing prospectus is attached relating to (1) these materials not constituting an offer (or a solicitation of an offer), (2) any representation that these materials are accurate or complete and may not be updated or (3) these materials possibly being confidential, are not applicable to these materials and should be disregarded. Such legends, disclaimers or other notices have been automatically generated as a result of these materials having been sent via Bloomberg or another system.
THE INFORMATION IN THIS STRUCTURAL AND COLLATERAL TERM SHEET IS NOT COMPLETE AND MAY BE AMENDED PRIOR TO THE TIME OF SALE. THIS TERM SHEET IS NOT AN OFFER TO SELL THESE SECURITIES AND IT IS NOT A SOLICITATION OF AN OFFER TO BUY THESE SECURITIES IN ANY JURISDICTION WHERE THE OFFER OR SALE IS NOT PERMITTED.
2
| Wells Fargo Commercial Mortgage Trust 2020-C55 | Transaction Highlights |
I. Certificate Structure
Class | Expected Ratings
(Fitch/KBRA/Moody’s)(1) | Approximate Initial Certificate Balance or Notional Amount(2) | Approximate Initial Available Certificate Balance or Notional Amount(2) | Approximate Initial Retained Certificate Balance or Notional Amount(2)(3) | Approx. Initial Credit Support(4) | Pass-Through Rate Description | Weighted Average Life (Years)(5) | Expected Principal Window(5) | Certificate Principal to Value Ratio(6) | Certificate Principal U/W NOI Debt Yield(7) |
Offered Certificates |
A-1 | AAAsf/AAA(sf)/Aaa(sf) | $20,310,000 | $19,429,000 | $881,000 | 30.000% | (8) | 2.67 | 03/20 – 12/24 | 41.8% | 14.8% |
A-2 | AAAsf/AAA(sf)/Aaa(sf) | $18,218,000 | $17,428,000 | $790,000 | 30.000% | (8) | 4.86 | 12/24 – 01/25 | 41.8% | 14.8% |
A-3 | AAAsf/AAA(sf)/Aaa(sf) | $24,260,000 | $23,207,000 | $1,053,000 | 30.000% | (8) | 6.82 | 12/26 – 01/27 | 41.8% | 14.8% |
A-SB | AAAsf/AAA(sf)/Aaa(sf) | $32,314,000 | $30,911,000 | $1,403,000 | 30.000% | (8) | 7.32 | 01/25 – 10/29 | 41.8% | 14.8% |
A-4 | AAAsf/AAA(sf)/Aaa(sf) | (9) | (9) | (9) | 30.000% | (8) | (9) | (9) | 41.8% | 14.8% |
A-5 | AAAsf/AAA(sf)/Aaa(sf) | (9) | (9) | (9) | 30.000% | (8) | (9) | (9) | 41.8% | 14.8% |
X-A | AAAsf/AAA(sf)/Aaa(sf) | $673,982,000(10) | $644,731,000(10) | $29,251,000(10) | N/A | Variable(11) | N/A | N/A | N/A | N/A |
X-B | A-sf/AAA(sf)/NR | $178,124,000(12) | $170,393,000(12) | $7,731,000(12) | N/A | Variable(13) | N/A | N/A | N/A | N/A |
A-S | AAAsf/AAA(sf)/Aa2(sf) | $96,283,000 | $92,104,000 | $4,179,000 | 20.000% | (8) | 9.88 | 01/30 – 01/30 | 47.8% | 13.0% |
B | AA-sf/AA-(sf)/NR | $44,531,000 | $42,598,000 | $1,933,000 | 15.375% | (8) | 9.89 | 01/30 – 02/30 | 50.6% | 12.3% |
C | A-sf/A-(sf)/NR | $37,310,000 | $35,691,000 | $1,619,000 | 11.500% | (8) | 9.97 | 02/30 – 02/30 | 52.9% | 11.7% |
Non-Offered Certificates | | | | | | | | |
X-D | BBB-sf/BBB-(sf)/NR | $45,734,000(14) | $43,749,000(14) | $1,985,000(14) | N/A | Variable(15) | N/A | N/A | N/A | N/A |
X-F | BB-sf/BB-(sf)/NR | $20,460,000(16) | $19,572,000(16) | $888,000(16) | N/A | Variable(17) | N/A | N/A | N/A | N/A |
X-G | B-sf/B-(sf)/NR | $9,629,000(18) | $9,211,000(18) | $418,000(18) | N/A | Variable(19) | N/A | N/A | N/A | N/A |
D | BBBsf/BBB(sf)/NR | $25,274,000 | $24,177,000 | $1,097,000 | 8.875% | (8) | 9.97 | 02/30 – 02/30 | 54.5% | 11.4% |
E | BBB-sf/BBB-(sf)/NR | $20,460,000 | $19,572,000 | $888,000 | 6.750% | (8) | 9.97 | 02/30 – 02/30 | 55.7% | 11.1% |
F | BB-sf/BB-(sf)/NR | $20,460,000 | $19,572,000 | $888,000 | 4.625% | (8) | 9.97 | 02/30 – 02/30 | 57.0% | 10.9% |
G | B-sf/B-(sf)/NR | $9,629,000 | $9,211,000 | $418,000 | 3.625% | (8) | 9.97 | 02/30 – 02/30 | 57.6% | 10.8% |
H-RR | NR/NR/NR | $34,902,711 | $33,387,711 | $1,515,000 | 0.000% | (8) | 9.97 | 02/30 – 02/30 | 59.8% | 10.4% |
|
Notes: |
(1) | The expected ratings presented are those of Fitch Ratings, Inc. (“Fitch”), Kroll Bond Rating Agency, Inc. (“KBRA”) and Moody’s Investors Service, Inc. (“Moody’s”), which the depositor hired to rate the Offered Certificates. One or more other nationally recognized statistical rating organizations that were not hired by the depositor may use information they receive pursuant to Rule 17g-5 under the Securities Exchange Act of 1934, as amended (the “Exchange Act”) or otherwise, to rate or provide market reports and/or published commentary related to the Offered Certificates. We cannot assure you as to what ratings a non-hired nationally recognized statistical rating organization would assign or that its reports will not express differing, possibly negative, views of the mortgage loans and/or the Offered Certificates. The ratings of each Class of Offered Certificates address the likelihood of the timely distribution of interest and, except in the case of the Class X-A, X-B, X-D, X-F and X-G Certificates, the ultimate distribution of principal due on those Classes on or before the Rated Final Distribution Date. See “Risk Factors—Other Risks Relating to the Certificates—Nationally Recognized Statistical Rating Organizations May Assign Different Ratings to the Certificates; Ratings of the Certificates Reflect Only the Views of the Applicable Rating Agencies as of the Dates Such Ratings Were Issued; Ratings May Affect ERISA Eligibility; Ratings May Be Downgraded” and “Ratings” in the Preliminary Prospectus, expected to be dated February 3, 2020 (the “Preliminary Prospectus”). Fitch, KBRA and Moody’s have informed us that the “sf” designation in their ratings represents an identifier for structured finance product ratings. |
| | |
(2) | The Certificate Balances and Notional Amounts set forth in the table are approximate. The actual initial Certificate Balances and Notional Amounts may be larger or smaller in connection with any variation in the Certificate Balance of the VRR Interest and/or the Horizontal Risk Retention Certificates following the calculation of the actual fair value of all of the ABS interests (as such term is defined in the Credit Risk Retention Rules) issued by the issuing entity, as described under “Credit Risk Retention” in the Preliminary Prospectus. The actual initial Certificate Balances and Notional Amounts also depend on the initial pool balance of the mortgage loans definitively included in the pool of mortgage loans, which aggregate cut-off date balance may be as much as 5% larger or smaller than the amount presented in the Preliminary Prospectus. In addition, the Notional Amounts of the Class X-A, X-B, X-D, X-F and X-G Certificates may vary depending upon the final pricing of the Classes of Principal Balance Certificates (as defined in the Preliminary Prospectus) whose Certificate Balances comprise such Notional Amounts, and, if, as a result of such pricing, the pass-through rate of the Class X-A, X-B, X-D, X-F and X-G Certificates, as applicable, would be equal to zero at all times, such Class of Certificates may not be issued on the closing date of this securitization. |
| | |
(3) | On the Closing Date, the Certificates with the initial Certificate Balances or Notional Amounts, as applicable, set forth in the table above under “Approximate Initial Retained Certificate Balance or Notional Amount” (such Certificates, collectively the “VRR Interest”) are expected to be purchased for cash from the underwriters by a majority-owned affiliate of Rialto Real Estate Fund IV – Debt, LP (a sponsor and affiliate of the special servicer), as the “retaining sponsor” (as such term is defined in the Credit Risk Retention Rules), as further described in “Credit Risk Retention” in the Preliminary Prospectus. |
| | |
(4) | The approximate initial credit support with respect to the Class A-1, A-2, A-3, A-SB, A-4 and A-5 Certificates represents the approximate credit enhancement for the Class A-1, A-2, A-3, A-SB, A-4 and A-5 Certificates in the aggregate. |
| | |
(5) | Weighted Average Lives and Expected Principal Windows are calculated based on an assumed prepayment rate of 0% CPR and the “Structuring Assumptions” described under “Yield and Maturity Considerations—Weighted Average Life” in the Preliminary Prospectus. |
| | |
(6) | The Certificate Principal to Value Ratio for each Class of Certificates (other than the Class A-1, A-2, A-3, A-SB, A-4 and A-5 Certificates) is calculated as the product of (a) the weighted average Cut-off Date LTV Ratio for the mortgage loans and (b) a fraction, the numerator of which is the total initial Certificate Balance of such Class of Certificates and all Classes of Principal Balance Certificates senior to such Class of Certificates and the denominator of which is the total initial Certificate Balance of all of the Principal Balance Certificates. The Certificate Principal to Value Ratio for each of the Class A-1, A-2, A-3, A-SB, A-4 and A-5 Certificates is calculated in the aggregate for those Classes as if they were a single Class and is calculated as the product of (a) the weighted average Cut-off Date LTV Ratio for the mortgage loans and (b) a fraction, the numerator of which is the total initial aggregate Certificate Balances of such Classes of Certificates and the denominator of which is the total initial Certificate Balance of all of the Principal Balance Certificates. In any event, however, excess mortgaged property value associated with a mortgage loan will not be available to offset losses on any other mortgage loan. |
THE INFORMATION IN THIS STRUCTURAL AND COLLATERAL TERM SHEET IS NOT COMPLETE AND MAY BE AMENDED PRIOR TO THE TIME OF SALE. THIS TERM SHEET IS NOT AN OFFER TO SELL THESE SECURITIES AND IT IS NOT A SOLICITATION OF AN OFFER TO BUY THESE SECURITIES IN ANY JURISDICTION WHERE THE OFFER OR SALE IS NOT PERMITTED.
3
| Wells Fargo Commercial Mortgage Trust 2020-C55 | Transaction Highlights |
(7) | The Certificate Principal U/W NOI Debt Yield for each Class of Certificates (other than the Class A-1, A-2, A-3, A-SB, A-4 and A-5 Certificates) is calculated as the product of (a) the weighted average U/W NOI Debt Yield for the mortgage loans and (b) a fraction, the numerator of which is the total initial Certificate Balance of all of the Classes of Principal Balance Certificates and the denominator of which is the total initial Certificate Balance for such Class of Certificates and all Classes of Principal Balance Certificates senior to such Class of Certificates. The Certificate Principal U/W NOI Debt Yield for each of the Class A-1, A-2, A-3, A-SB, A-4 and A-5 Certificates is calculated in the aggregate for those Classes as if they were a single Class and is calculated as the product of (a) the weighted average U/W NOI Debt Yield for the mortgage loans and (b) a fraction, the numerator of which is the total initial Certificate Balance of all of the Classes of Principal Balance Certificates and the denominator of which is the total aggregate initial Certificate Balances for the Class A-1, A-2, A-3, A-SB, A-4 and A-5 Certificates. In any event, however, cash flow from each mortgaged property supports only the related mortgage loan and will not be available to support any other mortgage loan. |
| | |
(8) | The pass-through rates for the Class A-1, A-2, A-3, A-SB, A-4, A-5, A-S, B, C, D, E, F, G and H-RR Certificates in each case will be one of the following: (i) a fixed rate per annum, (ii) a variable rate per annum equal to the weighted average of the net mortgage interest rates on the mortgage loans for the related distribution date, (iii) a variable rate per annum equal to the lesser of (a) a fixed rate and (b) the weighted average of the net mortgage interest rates on the mortgage loans for the related distribution date or (iv) a variable rate per annum equal to the weighted average of the net mortgage interest rates on the mortgage loans for the related distribution date minus a specified percentage. For purposes of the calculation of the weighted average of the net mortgage interest rates on the mortgage loans for each distribution date, the mortgage interest rates will be adjusted as necessary to a 30/360 basis. |
| | |
(9) | The exact initial Certificate Balances of the Class A-4 and A-5 Certificates are unknown and will be determined based on the final pricing of those Classes of Certificates. However, the respective initial Certificate Balances, weighted average lives and principal windows of the Class A-4 and A-5 Certificates are expected to be within the applicable ranges reflected in the following chart. The aggregate initial Certificate Balance of the Class A-4 and A-5 Certificates is expected to be approximately $578,880,000, subject to a variance of plus or minus 5%. In the event that the Class A-4 Certificates are issued with an initial certificate balance of $578,880,000, the Class A-5 Certificates will not be issued. |
Class of
Certificates | | Expected Range of
Approximate Initial
Certificate Balance | | Expected Range of
Weighted Average
Life (Years) | | Expected Range of Principal Window |
Class A-4 | | $50,000,000 - $578,880,000 | | 9.69 – 9.82 | | 10/29 – 11/29 / 10/29 – 01/30 |
Class A-5 | | $290,880,000 - $528,880,000 | | 9.83 – 9.86 | | 11/29 – 01/30 / 12/29 - 01/30 |
(10) | The Class X-A Certificates are notional amount certificates. The Notional Amount of the Class X-A Certificates will be equal to the aggregate Certificate Balance of the Class A-1, A-2, A-3, A-SB, A-4 and A-5 Certificates outstanding from time to time. The Class X-A Certificates will not be entitled to distributions of principal. |
| | |
(11) | The pass-through rate for the Class X-A Certificates for any distribution date will be a per annum rate equal to the excess, if any, of (a) the weighted average of the net mortgage interest rates on the mortgage loans for the related distribution date, over (b) the weighted average of the pass-through rates on the Class A-1, A-2, A-3, A-SB, A-4 and A-5 Certificates for the related distribution date, weighted on the basis of their respective Certificate Balances outstanding immediately prior to that distribution date. For purposes of the calculation of the weighted average of the net mortgage interest rates on the mortgage loans for each distribution date, the mortgage interest rates will be adjusted as necessary to a 30/360 basis. |
| | |
(12) | The Class X-B Certificates are notional amount certificates. The Notional Amount of the Class X-B Certificates will be equal to the aggregate Certificate Balance of the Class A-S, B and C Certificates outstanding from time to time. The Class X-B Certificates will not be entitled to distributions of principal. |
| | |
(13) | The pass-through rate for the Class X-B Certificates for any distribution date will be a per annum rate equal to the excess, if any, of (a) the weighted average of the net mortgage interest rates on the mortgage loans for the related distribution date, over (b) the weighted average of the pass-through rates on the Class A-S, B and C Certificates for the related distribution date, weighted on the basis of their respective Certificate Balances outstanding immediately prior to that distribution date. For purposes of the calculation of the weighted average of the net mortgage interest rates on the mortgage loans for each distribution date, the mortgage interest rates will be adjusted as necessary to a 30/360 basis. |
| | |
(14) | The Class X-D Certificates are notional amount certificates. The Notional Amount of the Class X-D Certificates will be equal to the aggregate Certificate Balance of the Class D and E Certificates outstanding from time to time. The Class X-D Certificates will not be entitled to distributions of principal. |
| | |
(15) | The pass-through rate for the Class X-D Certificates for any distribution date will be a per annum rate equal to the excess, if any, of (a) the weighted average of the net mortgage interest rates on the mortgage loans for the related distribution date, over (b) the weighted average of the pass-through rates on the Class D and E Certificates for the related distribution date, weighted on the basis of their respective Certificate Balances outstanding immediately prior to that distribution date. For purposes of the calculation of the weighted average of the net mortgage interest rates on the mortgage loans for each distribution date, the mortgage interest rates will be adjusted as necessary to a 30/360 basis. |
| | |
(16) | The Class X-F Certificates are notional amount certificates. The Notional Amount of the Class X-F Certificates will be equal to the Certificate Balance of the Class F Certificates outstanding from time to time. The Class X-F Certificates will not be entitled to distributions of principal. |
| | |
(17) | The pass-through rate for the Class X-F Certificates for any distribution date will be a per annum rate equal to the excess, if any, of (a) the weighted average of the net mortgage interest rates on the mortgage loans for the related distribution date, over (b) the pass-through rate on the Class F Certificates for the related distribution date. For purposes of the calculation of the weighted average of the net mortgage interest rates on the mortgage loans for each distribution date, the mortgage interest rates will be adjusted as necessary to a 30/360 basis. |
| | |
(18) | The Class X-G Certificates are notional amount certificates. The Notional Amount of the Class X-G Certificates will be equal to the Certificate Balance of the Class G Certificates outstanding from time to time. The Class X-G Certificates will not be entitled to distributions of principal. |
| | |
(19) | The pass-through rate for the Class X-G Certificates for any distribution date will be a per annum rate equal to the excess, if any, of (a) the weighted average of the net mortgage interest rates on the mortgage loans for the related distribution date, over (b) the pass-through rate on the Class G Certificates for the related distribution date. For purposes of the calculation of the weighted average of the net mortgage interest rates on the mortgage loans for each distribution date, the mortgage interest rates will be adjusted as necessary to a 30/360 basis |
THE INFORMATION IN THIS STRUCTURAL AND COLLATERAL TERM SHEET IS NOT COMPLETE AND MAY BE AMENDED PRIOR TO THE TIME OF SALE. THIS TERM SHEET IS NOT AN OFFER TO SELL THESE SECURITIES AND IT IS NOT A SOLICITATION OF AN OFFER TO BUY THESE SECURITIES IN ANY JURISDICTION WHERE THE OFFER OR SALE IS NOT PERMITTED.
4
Wells Fargo Commercial Mortgage Trust 2020-C55 | Transaction Highlights |
II. Transaction Highlights
Mortgage Loan Sellers:
Mortgage Loan Seller | | Number of
Mortgage Loans | | Number of
Mortgaged
Properties | | Aggregate Cut-off
Date Balance | | % of Initial Pool
Balance |
Wells Fargo Bank, National Association | | 11 | | 11 | | $275,861,009 | | 28.7% |
Barclays Capital Real Estate Inc. | | 9 | | 33 | | 196,225,000 | | 20.4 |
LMF Commercial, LLC (f/k/a Rialto Mortgage Finance, LLC) | | 17 | | 23 | | 176,613,576 | | 18.3 |
Ladder Capital Finance LLC | | 12 | | 12 | | 133,673,185 | | 13.9 |
Rialto Real Estate Fund IV – Debt, LP(1) | | 10 | | 12 | | 97,371,663 | | 10.1 |
Argentic Real Estate Finance LLC | | 7 | | 9 | | 83,087,278 | | 8.6 |
Total | | 66 | | 100 | | $962,831,712 | | 100.0% |
(1) | Rialto Real Estate Fund IV – Debt, LP (“RREF”) acquired the RREF Mortgage Loans from BSPRT CMBS Finance, LLC, an affiliate of Benefit Street Partners L.L.C., and re-underwrote all of the RREF Mortgage Loans in accordance with the underwriting guidelines and processes. With respect to the Scenic Tree Apartments mortgage loan, an affiliate of Benefit Street Partners L.L.C. acquired such mortgage loan from Basis Real Estate Capital II, LLC. |
Loan Pool:
Initial Pool Balance: | $962,831,712 |
Number of Mortgage Loans: | 66 |
Average Cut-off Date Balance per Mortgage Loan: | $14,588,359 |
Number of Mortgaged Properties: | 100 |
Average Cut-off Date Balance per Mortgaged Property(1): | $9,628,317 |
Weighted Average Mortgage Interest Rate: | 3.948% |
Ten Largest Mortgage Loans as % of Initial Pool Balance: | 44.3% |
Weighted Average Original Term to Maturity or ARD (months): | 118 |
Weighted Average Remaining Term to Maturity or ARD (months): | 117 |
Weighted Average Original Amortization Term (months)(2): | 358 |
Weighted Average Remaining Amortization Term (months)(2): | 357 |
Weighted Average Seasoning (month): | 1 |
(1) | Information regarding mortgage loans secured by multiple properties is based on an allocation according to relative appraised values or the allocated loan amounts or property-specific release prices set forth in the related loan documents or such other allocation as the related mortgage loan seller deemed appropriate. |
(2) | Excludes any mortgage loan that does not amortize. |
Credit Statistics:
Weighted Average U/W Net Cash Flow DSCR(1): | 2.27x |
Weighted Average U/W Net Operating Income Debt Yield(1): | 10.4% |
Weighted Average Cut-off Date Loan-to-Value Ratio(1): | 59.8% |
Weighted Average Balloon or ARD Loan-to-Value Ratio(1): | 56.0% |
% of Mortgage Loans with Additional Subordinate Debt(2): | 24.2% |
% of Mortgage Loans with Single Tenants(3): | 20.7% |
(1) | With respect to any mortgage loan that is part of a whole loan, loan-to-value ratio, debt service coverage ratio and debt yield calculations include the related pari passu companion loan(s). The debt service coverage ratio, debt yield and loan-to-value ratio information do not take into account any subordinate debt (whether or not secured by the related mortgaged property), that currently exists or is allowed under the terms of any mortgage loan. See “Description of the Mortgage Pool—Mortgage Pool Characteristics” in the Preliminary Prospectus and Annex A-1 to the Preliminary Prospectus. |
(2) | The percentage figure expressed as “% of Mortgage Loans with Additional Subordinate Debt” is determined as a percentage of the initial pool balance and does not take into account any future subordinate debt (whether or not secured by the mortgaged property), if any, that may be permitted under the terms of any mortgage loan or the pooling and servicing agreement. See “Description of the Mortgage Pool—Additional Indebtedness—Other Unsecured Indebtedness” in the Preliminary Prospectus. |
(3) | Excludes mortgage loans that are secured by multiple single tenant properties. |
THE INFORMATION IN THIS STRUCTURAL AND COLLATERAL TERM SHEET IS NOT COMPLETE AND MAY BE AMENDED PRIOR TO THE TIME OF SALE. THIS TERM SHEET IS NOT AN OFFER TO SELL THESE SECURITIES AND IT IS NOT A SOLICITATION OF AN OFFER TO BUY THESE SECURITIES IN ANY JURISDICTION WHERE THE OFFER OR SALE IS NOT PERMITTED.
5
Wells Fargo Commercial Mortgage Trust 2020-C55 | Transaction Highlights |
Loan Structural Features:
Amortization: Based on the Initial Pool Balance, 36.3% of the mortgage pool (37 mortgage loans) has scheduled amortization, as follows:
19.8% (20 mortgage loans) requires amortization during the entire loan term; and
16.5% (17 mortgage loans) provides for an interest-only period followed by an amortization period.
Interest-Only: Based on the Initial Pool Balance, 63.7% of the mortgage pool (29 mortgage loans) provides for interest-only payments during the entire loan term through maturity or ARD. The Weighted Average Cut-off Date Loan-to-Value Ratio and Weighted Average U/W Net Cash Flow DSCR for those mortgage loans are 56.8% and 2.55x, respectively.
Hard Lockboxes: Based on the Initial Pool Balance, 54.0% of the mortgage pool (22 mortgage loans) have hard lockboxes in place.
Reserves: The mortgage loans require amounts to be escrowed monthly as follows (excluding any mortgage loans with springing provisions):
Real Estate Taxes: | 66.3% of the pool |
Insurance: | 43.6% of the pool |
Capital Replacements: | 59.0% of the pool |
TI/LC: | 37.6% of the pool(1) |
(1) | The percentage of Initial Pool Balance for mortgage loans with TI/LC reserves is based on the aggregate principal balance allocable to loans that include retail, office, mixed use and industrial properties. |
Call Protection/Defeasance: Based on the Initial Pool Balance, the mortgage pool has the following call protection and defeasance features:
76.3% of the mortgage pool (56 mortgage loans) features a lockout period, then defeasance only until an open period;
19.2% of the mortgage pool (6 mortgage loans) features a lockout period, then the greater of a prepayment premium (1%) or yield maintenance until an open period;
4.2% of the mortgage pool (1 mortgage loan) features a lockout period, then the greater of a prepayment premium (1%) or yield maintenance, then the greater of a prepayment premium (1%) or yield maintenance or defeasance until an open period; and
0.3% of the mortgage pool (3 mortgage loans) features yield maintenance, then yield maintenance or defeasance until an open period.
Prepayment restrictions for each mortgage loan reflect the entire life of the mortgage loan. Please refer to Annex A-1 to the Preliminary Prospectus and the footnotes related thereto for further information regarding individual loan call protection.
THE INFORMATION IN THIS STRUCTURAL AND COLLATERAL TERM SHEET IS NOT COMPLETE AND MAY BE AMENDED PRIOR TO THE TIME OF SALE. THIS TERM SHEET IS NOT AN OFFER TO SELL THESE SECURITIES AND IT IS NOT A SOLICITATION OF AN OFFER TO BUY THESE SECURITIES IN ANY JURISDICTION WHERE THE OFFER OR SALE IS NOT PERMITTED.
6
Wells Fargo Commercial Mortgage Trust 2020-C55 | Issue Characteristics |
| III. | Issue Characteristics |
Securities Offered: | $852,106,000 approximate monthly pay, multi-class, commercial mortgage REMIC pass-through certificates consisting of eleven classes (Classes A-1, A-2, A-3, A-SB, A-4, A-5, A-S, B, C, X-A and X-B), which are offered pursuant to a registration statement filed with the SEC (such classes of certificates, the “Offered Certificates”). |
Mortgage Loan Sellers: | Wells Fargo Bank, National Association (“WFB”), Barclays Capital Real Estate Inc. (“Barclays”), LMF Commercial, LLC (f/k/a Rialto Mortgage Finance, LLC) (“LMF”), Ladder Capital Finance LLC (“LCF”), Rialto Real Estate Fund IV – Debt, LP (“RREF”) and Argentic Real Estate Finance LLC (“AREF”). |
Joint Bookrunners and Co-Lead Managers: | Wells Fargo Securities, LLC and Barclays Capital Inc. |
Co-Managers: | Academy Securities, Inc. and Drexel Hamilton, LLC |
Rating Agencies: | Fitch Ratings, Inc., Kroll Bond Rating Agency, Inc. and Moody’s Investors Service, Inc. |
Master Servicer: | Wells Fargo Bank, National Association |
Special Servicer: | Rialto Capital Advisors, LLC |
Certificate Administrator: | Wells Fargo Bank, National Association |
Trustee: | Wilmington Trust, National Association |
Operating Advisor: | Park Bridge Lender Services LLC |
Asset Representations Reviewer: | Park Bridge Lender Services LLC |
Initial Risk Retention Consultation Party: | RREF IV-D WFCM 2020-C55 MOA, LLC, a majority owned affiliate of Rialto Real Estate Fund IV – Debt, LP |
Initial Majority Controlling Class Certificateholder: | RREF IV-D WFCM 2020-C55 MOA-HRR, LLC or another affiliate of Rialto Capital Advisors, LLC and Rialto Real Estate Fund IV – Debt, LP |
U.S. Credit Risk Retention: | For a discussion on the manner in which the U.S. credit risk retention requirements will be satisfied by Rialto Real Estate Fund IV – Debt, LP, as the retaining sponsor, see “Credit Risk Retention” in the Preliminary Prospectus. Rialto Real Estate Fund IV – Debt, LP, the retaining sponsor, intends to retain or cause a separate majority-owned affiliate to retain (i) an “eligible horizontal residual interest” comprised of the Class H-RR Certificates (excluding the portion comprising the VRR Interest) and (ii) an “eligible vertical interest” comprised of a certain percentage of the Certificate Balance, Notional Amount or percentage interest in each Class of Certificates (other than the Class R Certificates) in a manner that satisfies the U.S. credit risk retention requirements. Under the U.S. credit risk retention rules, RREF or the applicable majority-owned affiliate will be permitted to transfer the horizontal risk retention certificates to a subsequent third-party purchaser. For additional information, see “Credit Risk Retention” in the Preliminary Prospectus. |
EU Credit Risk Retention | None of the sponsors, the depositor or any other party to the transaction intends or is required to retain a material net economic interest in the securitization constituted by the issue of the Certificates in a manner that would satisfy the requirements of the European Union Regulation (EU) 2017/2402. In addition, no such person undertakes to take any other action which may be required by any investor for the purposes of its compliance with any applicable requirement under such Regulation. Furthermore, the arrangements described under “Credit Risk Retention” in the Preliminary Prospectus have not been structured with the objective of ensuring compliance by any person with any requirements of such Regulation. |
Cut-off Date: | The Cut-off Date with respect to each mortgage loan is the due date for the monthly debt service payment that is due in February 2020 (or, in the case of any mortgage loan that has its first due date in March 2020, the date that would have been its due date in February 2020 under the terms of that mortgage loan if a monthly debt service payment were scheduled to be due in that month). |
Expected Closing Date: | On or about February 27, 2020. |
Determination Dates: | The 11th day of each month (or if that day is not a business day, the next succeeding business day), commencing in March 2020. |
Distribution Dates: | The fourth business day following the Determination Date in each month, commencing in March 2020. |
THE INFORMATION IN THIS STRUCTURAL AND COLLATERAL TERM SHEET IS NOT COMPLETE AND MAY BE AMENDED PRIOR TO THE TIME OF SALE. THIS TERM SHEET IS NOT AN OFFER TO SELL THESE SECURITIES AND IT IS NOT A SOLICITATION OF AN OFFER TO BUY THESE SECURITIES IN ANY JURISDICTION WHERE THE OFFER OR SALE IS NOT PERMITTED.
7
Wells Fargo Commercial Mortgage Trust 2020-C55 | Issue Characteristics |
Rated Final Distribution Date: | The Distribution Date in February 2053. |
Interest Accrual Period: | With respect to any Distribution Date, the calendar month immediately preceding the month in which such Distribution Date occurs. |
Day Count: | The Offered Certificates will accrue interest on a 30/360 basis. |
Minimum Denominations: | $10,000 for each Class of Offered Certificates (other than the Class X-A and X-B Certificates) and $1,000,000 for the Class X-A and X-B Certificates. Investments may also be made in any whole dollar denomination in excess of the applicable minimum denomination. |
Clean-up Call: | 1.0% |
Delivery: | DTC, Euroclear and Clearstream Banking |
ERISA/SMMEA Status: | Each Class of Offered Certificates is expected to be eligible for exemptive relief under ERISA. No Class of Offered Certificates will be SMMEA eligible. |
Risk Factors: | THE CERTIFICATES INVOLVE CERTAIN RISKS AND MAY NOT BE SUITABLE FOR ALL INVESTORS. SEE THE “RISK FACTORS” SECTION OF THE PRELIMINARY PROSPECTUS. |
Bond Analytics Information: | The Certificate Administrator will be authorized to make distribution date statements, CREFC® reports and certain supplemental reports (other than confidential information) available to certain financial modeling and data provision services, including Bloomberg, L.P., Trepp, LLC, Intex Solutions, Inc., Interactive Data Corp., Markit Group Limited, BlackRock Financial Management, Inc., CMBS.com, Inc., Moody’s Analytics, MBS Data, LLC, Thomson Reuters Corporation and RealINSIGHT. |
Tax Treatment | For U.S. federal income tax purposes, the issuing entity will consist of one or more REMICs and the Offered Certificates will represent REMIC regular interests. |
THE INFORMATION IN THIS STRUCTURAL AND COLLATERAL TERM SHEET IS NOT COMPLETE AND MAY BE AMENDED PRIOR TO THE TIME OF SALE. THIS TERM SHEET IS NOT AN OFFER TO SELL THESE SECURITIES AND IT IS NOT A SOLICITATION OF AN OFFER TO BUY THESE SECURITIES IN ANY JURISDICTION WHERE THE OFFER OR SALE IS NOT PERMITTED.
8
| Wells Fargo Commercial Mortgage Trust 2020-C55 | Characteristics of the Mortgage Pool |
IV. Characteristics of the Mortgage Pool(1)
A. Ten Largest Mortgage Loans
Mortgage Loan
Seller | Mortgage Loan Name | City | State | Number of Mortgage Loans / Mortgaged Properties | Mortgage Loan Cut-off Date Balance ($) | % of Initial Pool Balance (%) | Property
Type | Number
of Units/SF | Cut-off
Date
Balance Per Unit/SF | Cut-off
Date LTV
Ratio (%) | Balloon or ARD LTV
Ratio (%) | U/W NCF
DSCR (x) | U/W NOI
Debt
Yield (%) |
| WFB | Kings Plaza | Brooklyn | NY | 1 / 1 | $82,945,946 | 8.6% | Retail | 811,797 | $600 | 54.1% | 54.1% | 3.06x | 10.7% |
| WFB | 1633 Broadway | New York | NY | 1 / 1 | 70,000,000 | 7.3 | Office | 2,561,512 | 391 | 41.7 | 41.7 | 3.83 | 11.9 |
| Barclays | 650 Madison Avenue | New York | NY | 1 / 1 | 40,000,000 | 4.2 | Mixed Use | 600,415 | 977 | 48.5 | 48.5 | 2.73 | 10.0 |
| Barclays | F5 Tower | Seattle | WA | 1 / 1 | 40,000,000 | 4.2 | Office | 515,518 | 359 | 39.4 | 39.4 | 3.32 | 13.0 |
| LCF | Silver City Plaza | Las Vegas | NV | 1 / 1 | 38,520,000 | 4.0 | Retail | 41,583 | 926 | 63.7 | 63.7 | 1.73 | 7.5 |
| LCF | Axalta Navy Yard | Philadelphia | PA | 1 / 1 | 36,720,000 | 3.8 | Office | 175,000 | 210 | 59.4 | 59.4 | 2.58 | 9.6 |
| Barclays | ExchangeRight Net Leased Portfolio #31 | Various | Various | 1 / 25 | 33,875,000 | 3.5 | Various | 547,761 | 135 | 62.1 | 62.1 | 2.56 | 9.4 |
| Barclays | One Stockton | San Francisco | CA | 1 / 1 | 30,000,000 | 3.1 | Retail | 16,987 | 3,885 | 59.5 | 59.5 | 1.79 | 7.6 |
| WFB | Walgreens - Las Vegas Strip | Las Vegas | NV | 1 / 1 | 27,700,000 | 2.9 | Retail | 14,688 | 1,886 | 72.9 | 72.9 | 1.69 | 7.2 |
| AREF | Highland Village Townhomes | Pittsburgh | PA | 1 / 1 | 26,500,000 | 2.8 | Multifamily | 161 | 164,596 | 62.5 | 62.5 | 1.99 | 8.1 |
| Top Three Total/Weighted Average | | | 3 / 3 | $192,945,946 | 20.0% | | | | 48.4% | 48.4% | 3.27x | 11.0% |
| Top Five Total/Weighted Average | | | 5 / 5 | $271,465,946 | 28.2% | | | | 49.3% | 49.3% | 3.06x | 10.8% |
| Top Ten Total/Weighted Average | | | 10 / 34 | $426,260,946 | 44.3% | | | | 54.2% | 54.2% | 2.73x | 10.0% |
| Non-Top Ten Total/Weighted Average | | | 56 / 66 | $536,570,766 | 55.7% | | | | 64.1% | 57.4% | 1.90x | 10.7% |
| (1) | With respect to any mortgage loan that is part of a whole loan, Cut-off Date Balance Per Unit/SF, loan-to-value ratio, debt service coverage ratio and debt yield calculations include the relatedpari passu companion loan(s) (unless otherwise stated). With respect to each mortgage loan, debt service coverage ratio, debt yield and loan-to-value ratio information do not take into account subordinate debt (whether or not secured by the related mortgaged property), if any, that currently exists or is allowed under the terms of such mortgage loan. |
THE INFORMATION IN THIS STRUCTURAL AND COLLATERAL TERM SHEET IS NOT COMPLETE AND MAY BE AMENDED PRIOR TO THE TIME OF SALE. THIS TERM SHEET IS NOT AN OFFER TO SELL THESE SECURITIES AND IT IS NOT A SOLICITATION OF AN OFFER TO BUY THESE SECURITIES IN ANY JURISDICTION WHERE THE OFFER OR SALE IS NOT PERMITTED.
9
| Wells Fargo Commercial Mortgage Trust 2020-C55 | Characteristics of the Mortgage Pool |
B. Summary of the Whole Loans
| Property Name | Mortgage Loan Seller in
WFCM 2020-C55 | Note(s)(1) | Original Balance | Holder of Note(1) | Lead Servicer
for Whole Loan | Master Servicer Under Lead Securitization Servicing Agreement | Special Servicer Under Lead
Securitization Servicing
Agreement |
| Kings Plaza | WFB | A-1-1 | $70,000,000 | JPMorgan Chase Bank, National Association | Yes | Midland Loan Services, a Division of PNC Bank, National Association(3) | KeyBank National Association(3) |
| A-1-2 | $50,000,000 | Benchmark 2020-B16(2) | No |
| A-2-1 | $60,000,000 | BBCMS 2020-C6(4) | No |
| A-2-2, A-2-3, A-2-4 | $97,945,946 | Societe Generale Financial Corporation | No |
| A-1-3, A-1-4 | $51,108,108 | JPMorgan Chase Bank, National Association | No |
| A-3-1, A-3-4 | $75,000,000 | BANK 2020-BNK25(5) | No |
| A-3-2, A-3-3 | $82,945,946 | WFCM 2020-C55 | No |
| 1633 Broadway | WFB | A-1-S-1, A-2-S-1, A-3-S-1, A-4-S-1 | $1,000,000 | BWAY 2019-1633 | Yes | KeyBank National
Association | Situs Holdings, LLC |
| A-1-C-1, A-1-C-3, A-1-C-4, A-1-C-5, A-1-C-6, A-1-C-7 | $205,000,000 | Goldman Sachs Bank USA | No |
| A-2-C-1-B, A-3-C-1-B | $45,000,000 | Benchmark 2020-B16(2) | No |
| A-2-C-1-A, A-2-C-2, A-2-C-3, A-2-C-4, A-2-C-6, A-2-C-7 | $212,500,000 | DBR Investments Co. Limited | No |
| A-3-C-1-A, A-3-C-2, A-3-C-3, A-3-C-4, A-3-C-5, A-3-C-6, A-3-C-7 | $227,500,000 | JPMorgan Chase Bank, National Association | No |
| A-1-C-2, A-2-C-5 | $60,000,000 | GSMS 2020-GC45 | No |
| A-4-C-1, A-4-C-2 | $100,000,000 | BANK 2020-BNK25(5) | No |
| A-4-C-4, A-4-C-5 | $70,000,000 | WFCM 2020-C55 | No |
| A-4-C-3, A-4-C-6, A-4-C-7 | $80,000,000 | Wells Fargo Bank, N.A | No |
| B-1, B-2, B-3, B-4 | $249,000,000 | BWAY 2019-1633 | Yes |
| 650 Madison Avenue | Barclays | A-1-1 | $50,000,000 | CGCMT 2019-C7 | No | KeyBank National
Association | LNR Partners, LLC |
| A-1-2-1 | $40,000,000 | Cantor Commercial Real Estate Lending L.P. | No |
| A-1-3, A-2-1 | $50,000,000 | GSMS 2020-GC45 | No |
| A-1-4, A-1-6 | $137,900,000 | Citi Real Estate Funding Inc. | No |
| A-1-5 | $45,000,000 | Benchmark 2020-B16(2) | No |
| A-2-2, A-2-3, A-2-4, A-2-5, A-2-6, A-2-7, A-2-8 | $116,450,000 | Goldman Sachs Mortgage Company | No |
| A-3-1 | $60,000,000 | BBCMS 2020-C6(4) | No |
| A-3-2 | $46,450,000 | Barclays | No |
| A-3-3 | $40,000,000 | WFCM 2020-C55 | No |
| A-4, A-5, A-6, A-7, | $1,000,000 | MAD 2019-650M | Yes |
| B-1, B-2, B-3, B-4 | $213,200,000 | MAD 2019-650M | Yes |
THE INFORMATION IN THIS STRUCTURAL AND COLLATERAL TERM SHEET IS NOT COMPLETE AND MAY BE AMENDED PRIOR TO THE TIME OF SALE. THIS TERM SHEET IS NOT AN OFFER TO SELL THESE SECURITIES AND IT IS NOT A SOLICITATION OF AN OFFER TO BUY THESE SECURITIES IN ANY JURISDICTION WHERE THE OFFER OR SALE IS NOT PERMITTED.
10
| Wells Fargo Commercial Mortgage Trust 2020-C55 | Characteristics of the Mortgage Pool |
| F5 Tower | Barclays | A-1-A | $50,000,000 | BBCMS 2020-C6(4) | Yes | Midland Loan Services, a Division of PNC Bank, National Association | Midland Loan Services, a Division of PNC Bank, National Association |
| A-1-B | $40,000,000 | WFCM 2020-C55 | No |
| A-1-C | $39,500,000 | Barclays | No |
| A-2 | $55,500,000 | DBR Investments Co. Limited | No |
| B-1, B-2 | $112,600,000 | BBCMS 2020-C6(4) | Yes |
| ExchangeRight Net Leased Portfolio #31 | Barclays | A-1 | $40,000,000 | BBCMS 2020-C6(4) | Yes | Midland Loan Services, a Division of PNC Bank, National Association | Midland Loan Services, a Division of PNC Bank, National Association |
| A-2 | $33,875,000 | WFCM 2020-C55 | No |
| One Stockton | Barclays | A-1 | $30,000,000 | WFCM 2020-C55 | Yes | Wells Fargo Bank National Association | Rialto Capital Advisors, LLC |
| A-2, A-3 | $36,000,000 | Barclays | No |
| Vernon Tower | RREF | A-1 | $26,450,000 | WFCM 2020-C55 | Yes | Wells Fargo Bank National Association | Rialto Capital Advisors, LLC |
| A-2 | $16,800,000 | RREF | No |
| Exchange on Erwin | Barclays | A-1 | $50,000,000 | BBCMS 2020-C6(4) | Yes | Midland Loan Services, a Division of PNC Bank, National Association | Midland Loan Services, a Division of PNC Bank, National Association |
| A-2 | $25,450,000 | WFCM 2020-C55 | No |
| 4041 Central | WFB | A-1 | $23,000,000 | UBS 2019-C18 | Yes | Wells Fargo Bank National Association | Rialto Capital Advisors, LLC |
| A-2 | $19,500,000 | WFCM 2020-C55 | No |
| Shoppes at Parma | LCF | A-1-A | $35,000,000 | CGCMT 2019-C7 | Yes | Wells Fargo Bank National Association | LNR Partners, LLC |
| A-2-A | $14,000,000 | UBS 2019-C18 | No |
| A-3-A | $8,075,000 | WFCM 2020-C55 | No |
| (1) | Unless otherwise indicated, each note not currently held by a securitization trust is expected to be contributed to a future securitization. No assurance can be provided that any such note will not be split further. |
| (2) | The Benchmark 2020-B16 transaction is expected to close on or about February 12, 2020. |
| (3) | The related whole loan is expected to initially be serviced under the Benchmark 2020-B16 securitization pooling and servicing agreement until the securitization of the related “lead”pari passu note (namely, the relatedpari passu note marked “Yes” in the column entitled “Lead Servicer for Whole Loan”), after which the related whole loan will be serviced under the pooling and servicing agreement governing such securitization of the related “lead”pari passu note. The master servicer and special servicer for such securitization will be identified in a notice, report or statement to holders of the WFCM 2020-C55 Certificates after the closing of such securitization. |
| (4) | The BBCMS 2020-C6 transaction is expected to close on or about February 19, 2020. |
| (5) | The BANK 2020-BNK25 transaction is expected to close on or about February 13, 2020. |
THE INFORMATION IN THIS STRUCTURAL AND COLLATERAL TERM SHEET IS NOT COMPLETE AND MAY BE AMENDED PRIOR TO THE TIME OF SALE. THIS TERM SHEET IS NOT AN OFFER TO SELL THESE SECURITIES AND IT IS NOT A SOLICITATION OF AN OFFER TO BUY THESE SECURITIES IN ANY JURISDICTION WHERE THE OFFER OR SALE IS NOT PERMITTED.
11
| Wells Fargo Commercial Mortgage Trust 2020-C55 | Characteristics of the Mortgage Pool |
C. Mortgage Loans with Additional Secured and Mezzanine Financing
| Loan No. | Mortgage Loan Seller | Mortgage Loan Name | Mortgage
Loan
Cut-off Date Balance ($) | % of Initial Pool Balance (%) | Sub Debt Cut-off Date Balance ($) | Mezzanine Debt Cut-off Date Balance ($) | Total Debt Interest Rate (%)(1) | Mortgage Loan U/W NCF DSCR (x)(2) | Total Debt U/W NCF DSCR (x) | Mortgage Loan Cut-off Date U/W NOI Debt Yield (%)(2) | Total Debt Cut-off Date U/W NOI Debt Yield (%) | Mortgage Loan Cut-off Date LTV Ratio (%)(2) | Total Debt Cut-off Date LTV Ratio (%) |
| 1 | WFB | Kings Plaza | $82,945,946 | 8.6 | % | NAP | | $53,000,000 | | 3.6180 | % | 3.06 | x | 1.73 | x | 10.7 | % | 9.6 | % | 54.1 | % | 60.0 | % |
| 2 | WFB | 1633 Broadway | 70,000,000 | 7.3 | | $249,000,000 | | NAP | | 2.9900 | | 3.83 | | 3.07 | | 11.9 | | 9.5 | | 41.7 | | 52.1 | |
| 3 | Barclays | 650 Madison Avenue | 40,000,000 | 4.2 | | 213,200,000 | | NAP | | 3.4860 | | 2.73 | | 2.00 | | 10.0 | | 7.3 | | 48.5 | | 66.1 | |
| 4 | Barclays | F5 Tower | 40,000,000 | 4.2 | | 112,600,000 | | 48,500,000 | | 4.0422 | | 3.32 | | 1.63 | | 13.0 | | 6.9 | | 39.4 | | 73.6 | |
| Total/Weighted Average | $232,945,946 | 24.2 | % | $574,800,000 | | $101,500,000 | | 3.4795 | % | 3.28 | x | 2.16 | x | 11.3 | % | 8.7 | % | 46.9 | % | 61.0 | % |
| (1) | Total Debt Interest Rate for any specified mortgage loan reflects the weighted average of the interest rates on the respective components of the total debt. |
| (2) | With respect to any mortgage loan that is part of a whole loan, the loan-to-value ratio, debt service coverage ratio and debt yield calculations include the related pari passu companion loan(s). |
THE INFORMATION IN THIS STRUCTURAL AND COLLATERAL TERM SHEET IS NOT COMPLETE AND MAY BE AMENDED PRIOR TO THE TIME OF SALE. THIS TERM SHEET IS NOT AN OFFER TO SELL THESE SECURITIES AND IT IS NOT A SOLICITATION OF AN OFFER TO BUY THESE SECURITIES IN ANY JURISDICTION WHERE THE OFFER OR SALE IS NOT PERMITTED.
12
| Wells Fargo Commercial Mortgage Trust 2020-C55 | Characteristics of the Mortgage Pool |
D. Previous Securitization History(1)
Loan
No. | Mortgage Loan Seller | Mortgage
Loan or Mortgaged
Property Name | City | State | Property
Type | Mortgage Loan
or Mortgaged Property Cut-off Date Balance ($) | % of
Initial Pool Balance
(%) | Previous Securitization |
| 1 | WFB | Kings Plaza | Brooklyn | NY | Retail | $82,945,946 | 8.6 | % | GSMS 2013-KING |
| 3 | Barclays | 650 Madison Avenue | New York | NY | Mixed Use | 40,000,000 | 4.2 | | MAD 2013-650M |
| 11 | RREF | Vernon Tower | Astoria | NY | Multifamily | 26,450,000 | 2.7 | | BSPRT 2018-FL4, BSPRT 2019-FL5 |
| 18 | RREF | Scenic Tree Apartments | Palos Hills | IL | Multifamily | 17,000,000 | 1.8 | | GSMS 2015-GC28 |
| 19 | RREF | Coast Aluminum Industrial Portfolio | Various | Various | Industrial | 16,750,000 | 1.7 | | COMM 2013–CR8 |
| 24 | AREF | Springdale Apartments | Waukesha | WI | Multifamily | 14,025,000 | 1.5 | | MSC 2005-HQ7 |
| 25 | LMF | Pleasant Run | Lancaster | TX | Multifamily | 13,700,000 | 1.4 | | JPMBB 2015-C30 |
| 27 | LCF | 6000 Parkwood | Dublin | OH | Office | 11,968,515 | 1.2 | | BSPRT 2017-FL1 |
| 35.02 | AREF | Myrtle Avenue | Ridgewood | NY | Mixed Use | 4,400,000 | 0.5 | | WMCMS 2005-C1A |
| 38 | AREF | The Commerce Building | Tacoma | WA | Office | 8,200,000 | 0.9 | | BSCMS 2007-PW17 |
| 42 | RREF | Hampton Inn Cumming | Cumming | GA | Hospitality | 7,991,093 | 0.8 | | JMPCC 2007-C1 |
| 50 | RREF | Fairfield Inn by Marriott Lexington Park Patuxent River Naval Air Station | Lexington Park | MD | Hospitality | 5,000,000 | 0.5 | | JPMCC 2006-CB16 |
| Total | | | | | | $248,430,554 | 25.8 | % | |
| (1) | The table above represents the most recent securitization with respect to the mortgaged property securing the related mortgage loan, based on information provided by the related borrower or obtained through searches of a third-party database. While loans secured by the above mortgaged properties may have been securitized multiple times in prior transactions, mortgage loans in this securitization are only listed in the above chart if the mortgage loan paid off a loan in another securitization. The information has not otherwise been confirmed by the mortgage loan sellers. |
THE INFORMATION IN THIS STRUCTURAL AND COLLATERAL TERM SHEET IS NOT COMPLETE AND MAY BE AMENDED PRIOR TO THE TIME OF SALE. THIS TERM SHEET IS NOT AN OFFER TO SELL THESE SECURITIES AND IT IS NOT A SOLICITATION OF AN OFFER TO BUY THESE SECURITIES IN ANY JURISDICTION WHERE THE OFFER OR SALE IS NOT PERMITTED.
13
| Wells Fargo Commercial Mortgage Trust 2020-C55 | Characteristics of the Mortgage Pool |
E. Mortgage Loans with Scheduled Balloon Payments and Related Classes
Class A-2(1)
| Loan No. | Mortgage Loan Seller | Mortgage Loan Name | State | Property Type | Mortgage Loan Cut-off Date Balance ($) | % of Initial Pool
Balance (%) | Mortgage
Loan Balance at Maturity ($) | % of Class
A-2 Certificate Principal
Balance (%)(2) | SF | Loan per
SF ($) | U/W NCF DSCR
(x) | U/W NOI Debt Yield (%) | Cut-off Date LTV Ratio (%) | Balloon or ARD
LTV Ratio (%) | Rem. IO Period (mos.) | Rem. Term to Maturity or ARD (mos.) |
| 26 | LMF | Louisville Self Storage Portfolio | KY | Self Storage | $12,500,000 | | 1.3 | % | $11,934,153 | | 65.5 | % | 134,387 | $93 | | 1.44 | x | 9.4 | % | 64.4 | % | 61.5 | % | 23 | | 59 | |
| 48 | LMF | West Phoenix Self Storage | AZ | Self Storage | $5,300,000 | | 0.6 | | $5,300,000 | | 29.1 | % | 74,740 | $71 | | 1.91 | | 9.7 | | 59.2 | | 59.2 | | 58 | | 58 | |
| Total/Weighted Average | | | $17,800,000 | | 1.8 | % | $17,234,153 | | 94.6 | % | | | | 1.58 | x | 9.5 | % | 62.9 | % | 60.8 | % | 33 | | 59 | |
| (1) | The table above presents the mortgage loan(s) whose balloon payments would be applied to pay down the principal balance of the Class A-2 Certificates, assuming a 0% CPR and applying the “Structuring Assumptions” described in the Preliminary Prospectus, including the assumptions that (i) none of the mortgage loans in the pool experience prepayments prior to maturity (or in the case of an ARD loan, its anticipated repayment date), defaults or losses; (ii) there are no extensions of maturity dates of any mortgage loans in the pool; and (iii) each mortgage loan in the pool is paid in full on its stated maturity date (or, in the case of an ARD loan, its anticipated repayment date). Each Class of Certificates evidences undivided ownership interests in the entire pool of mortgage loans. Debt service coverage ratio, debt yield and loan-to-value ratio information do not take into account subordinate debt (whether or not secured by the related mortgaged property), if any, that currently exists or is allowed under the terms of any mortgage loan. See Annex A-1 to the Preliminary Prospectus. |
| (2) | Reflects the percentage equal to the Balloon Balance divided by the initial Class A-2 Certificate Balance. |
Class A-3(1)
| Loan No. | Mortgage Loan Seller | Mortgage Loan Name | State | Property Type | Mortgage Loan Cut-off Date Balance ($) | % of Initial Pool
Balance (%) | Mortgage
Loan Balance
at Maturity ($) | % of Class
A-3 Certificate Principal
Balance (%)(2) | Room | Loan
per
Room ($) | U/W NCF DSCR
(x) | U/W NOI Debt Yield (%) | Cut-off Date LTV Ratio (%) | Balloon or ARD LTV Ratio (%) | Rem. IO Period (mos.) | Rem. Term to Maturity or ARD (mos.) |
| 16 | WFB | Hilton Garden Inn Charleston / Mt. Pleasant | SC | Hospitality | $18,579,000 | | 1.9 | % | $18,579,000 | | 76.6 | % | 133 | $139,692 | | 3.04 | x | 13.4 | % | 62.6 | % | 62.6 | % | 82 | | 82 | |
| 46 | WFB | Holiday Inn & Suites – Peachtree City | GA | Hospitality | $6,100,000 | | 0.6 | | $5,681,240 | | 23.4 | % | 88 | $69,318 | | 2.21 | | 14.9 | | 61.0 | | 56.8 | | 35 | | 83 | |
| Total/Weighted Average | | | $24,679,000 | | 2.6 | % | $24,260,240 | | 100.0 | % | | | | 2.83 | x | 13.8 | % | 62.2 | % | 61.2 | % | 70 | | 82 | |
| (1) | The table above presents the mortgage loan(s) whose balloon payments would be applied to pay down the principal balance of the Class A-3 Certificates, assuming a 0% CPR and applying the “Structuring Assumptions” described in the Preliminary Prospectus, including the assumptions that (i) none of the mortgage loans in the pool experience prepayments prior to maturity (or, in the case of an ARD loan, its anticipated repayment date), defaults or losses; (ii) there are no extensions of maturity dates of any mortgage loans in the pool; and (iii) each mortgage loan in the pool is paid in full on its stated maturity date (or, in the case of an ARD loan, its anticipated repayment date). Each Class of Certificates evidences undivided ownership interests in the entire pool of mortgage loans. Debt service coverage ratio, debt yield and loan-to-value ratio information do not take into account subordinate debt (whether or not secured by the related mortgaged property), if any, that currently exists or is allowed under the terms of any mortgage loan. See Annex A-1 to the Preliminary Prospectus. |
| (2) | Reflects the percentage equal to the Balloon Balance divided by the initial Class A-3 Certificate Balance. |
THE INFORMATION IN THIS STRUCTURAL AND COLLATERAL TERM SHEET IS NOT COMPLETE AND MAY BE AMENDED PRIOR TO THE TIME OF SALE. THIS TERM SHEET IS NOT AN OFFER TO SELL THESE SECURITIES AND IT IS NOT A SOLICITATION OF AN OFFER TO BUY THESE SECURITIES IN ANY JURISDICTION WHERE THE OFFER OR SALE IS NOT PERMITTED.
14
| Wells Fargo Commercial Mortgage Trust 2020-C55 | Characteristics of the Mortgage Pool |
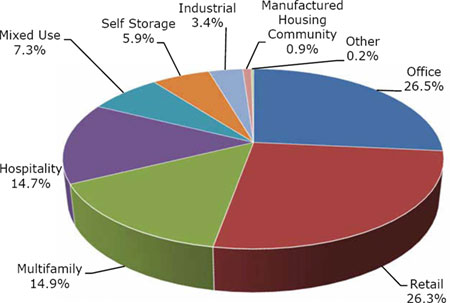
F. Property Type Distribution(1)
| Property Type | | Number of
Mortgaged
Properties | | Aggregate
Cut-off Date
Balance ($) | | % of Initial
Pool
Balance (%) | | Weighted
Average Cut-
off Date LTV
Ratio (%) | | Weighted
Average
Balloon LTV
Ratio (%) | | Weighted
Average
U/W NCF
DSCR (x) | | Weighted
Average U/W
NOI Debt
Yield (%) | | Weighted
Average U/W
NCF Debt Yield
(%) | | Weighted
Average
Mortgage Rate
(%) |
| Office | | 14 | | $255,229,804 | | 26.5 | % | | 54.3 | % | | 50.8 | % | | 2.74 | x | | 11.1 | % | | 10.7 | % | | 3.677 | % |
| CBD | | 4 | | 137,586,052 | | 14.3 | | | 46.8 | | | 44.6 | | | 3.31 | | | 11.9 | | | 11.5 | | | 3.343 | |
| Suburban | | 7 | | 60,192,585 | | 6.3 | | | 65.3 | | | 55.7 | | | 1.78 | | | 10.9 | | | 10.0 | | | 4.213 | |
| R&D | | 1 | | 36,720,000 | | 3.8 | | | 59.4 | | | 59.4 | | | 2.58 | | | 9.6 | | | 9.5 | | | 3.632 | |
| Medical | | 2 | | 20,731,168 | | 2.2 | | | 62.9 | | | 62.9 | | | 1.97 | | | 8.8 | | | 8.7 | | | 4.412 | |
| Retail | | 38 | | 253,565,370 | | 26.3 | | | 60.8 | | | 59.5 | | | 2.29 | | | 9.4 | | | 9.1 | | | 3.826 | |
| Single Tenant | | 32 | | 98,871,402 | | 10.3 | | | 64.0 | | | 63.8 | | | 2.02 | | | 8.3 | | | 8.1 | | | 3.939 | |
| Super Regional Mall | | 1 | | 82,945,946 | | 8.6 | | | 54.1 | | | 54.1 | | | 3.06 | | | 10.7 | | | 10.5 | | | 3.359 | |
| Anchored | | 5 | | 71,748,021 | | 7.5 | | | 64.0 | | | 59.9 | | | 1.77 | | | 9.4 | | | 8.9 | | | 4.210 | |
| Multifamily | | 13 | | 143,144,646 | | 14.9 | | | 66.4 | | | 61.7 | | | 1.74 | | | 8.9 | | | 8.6 | | | 4.168 | |
| Garden | | 10 | | 101,094,646 | | 10.5 | | | 67.4 | | | 61.7 | | | 1.74 | | | 9.2 | | | 8.8 | | | 4.180 | |
| Mid Rise | | 1 | | 26,450,000 | | 2.7 | | | 61.7 | | | 61.7 | | | 1.77 | | | 7.4 | | | 7.3 | | | 4.070 | |
| Various | | 1 | | 10,500,000 | | 1.1 | | | 69.1 | | | 58.5 | | | 1.75 | | | 10.8 | | | 10.3 | | | 4.183 | |
| Low Rise | | 1 | | 5,100,000 | | 0.5 | | | 67.4 | | | 67.4 | | | 1.48 | | | 6.7 | | | 6.6 | | | 4.420 | |
| Hospitality | | 13 | | 141,062,471 | | 14.7 | | | 64.3 | | | 53.8 | | | 2.14 | | | 13.6 | | | 12.1 | | | 4.309 | |
| Limited Service | | 9 | | 81,683,471 | | 8.5 | | | 64.9 | | | 52.1 | | | 2.03 | | | 13.6 | | | 12.2 | | | 4.263 | |
| Select Service | | 3 | | 38,879,000 | | 4.0 | | | 64.2 | | | 58.6 | | | 2.52 | | | 13.5 | | | 11.9 | | | 4.073 | |
| Full Service | | 1 | | 20,500,000 | | 2.1 | | | 62.1 | | | 51.0 | | | 1.85 | | | 13.5 | | | 11.9 | | | 4.940 | |
| Mixed Use | | 3 | | 69,850,000 | | 7.3 | | | 55.5 | | | 55.5 | | | 2.47 | | | 9.0 | | | 8.8 | | | 3.521 | |
| Office/Retail | | 1 | | 40,000,000 | | 4.2 | | | 48.5 | | | 48.5 | | | 2.73 | | | 10.0 | | | 9.7 | | | 3.486 | |
| Multifamily/Office/Retail | | 1 | | 25,450,000 | | 2.6 | | | 64.5 | | | 64.5 | | | 2.23 | | | 7.9 | | | 7.8 | | | 3.421 | |
| Retail/Multifamily/Office | | 1 | | 4,400,000 | | 0.5 | | | 67.4 | | | 67.4 | | | 1.48 | | | 6.7 | | | 6.6 | | | 4.420 | |
| Self Storage | | 11 | | 56,450,000 | | 5.9 | | | 55.9 | | | 52.9 | | | 1.89 | | | 9.8 | | | 9.6 | | | 4.441 | |
| Self Storage | | 11 | | 56,450,000 | | 5.9 | | | 55.9 | | | 52.9 | | | 1.89 | | | 9.8 | | | 9.6 | | | 4.441 | |
| Industrial | | 5 | | 32,981,926 | | 3.4 | | | 62.4 | | | 60.5 | | | 1.82 | | | 9.2 | | | 8.4 | | | 4.366 | |
| Warehouse | | 3 | | 16,750,000 | | 1.7 | | | 57.9 | | | 57.9 | | | 1.84 | | | 9.4 | | | 8.5 | | | 4.570 | |
| Warehouse Distribution | | 1 | | 11,750,000 | | 1.2 | | | 66.3 | | | 66.3 | | | 1.89 | | | 8.2 | | | 8.0 | | | 4.169 | |
| Flex | | 1 | | 4,481,926 | | 0.5 | | | 69.0 | | | 55.2 | | | 1.54 | | | 11.2 | | | 9.0 | | | 4.120 | |
| Manufactured Housing Community | | 2 | | 8,300,000 | | 0.9 | | | 61.4 | | | 56.8 | | | 1.67 | | | 8.9 | | | 8.7 | | | 4.414 | |
| Manufactured Housing Community | | 1 | | 4,300,000 | | 0.4 | | | 69.4 | | | 60.5 | | | 1.49 | | | 9.1 | | | 8.9 | | | 4.360 | |
| Manufactured Housing/Recreational Vehicle Community | | 1 | | 4,000,000 | | 0.4 | | | 52.9 | | | 52.9 | | | 1.87 | | | 8.7 | | | 8.5 | | | 4.472 | |
| Other | | 1 | | 2,247,495 | | 0.2 | | | 44.0 | | | 36.0 | | | 2.03 | | | 13.3 | | | 12.8 | | | 4.800 | |
| RV Parking | | 1 | | 2,247,495 | | 0.2 | | | 44.0 | | | 36.0 | | | 2.03 | | | 13.3 | | | 12.8 | | | 4.800 | |
| Total/Weighted Average: | | 100 | | $962,831,712 | | 100.0 | % | | 59.8 | % | | 56.0 | % | | 2.27 | x | | 10.4 | % | | 9.9 | % | | 3.948 | % |
| (1) | Because this table presents information relating to the mortgaged properties and not the mortgage loans, the information for mortgage loans secured by more than one mortgaged property is based on allocated loan amounts (allocating the principal balance of the mortgage loan to each of those properties according to the relative appraised values of the mortgaged properties or the allocated loan amounts or property-specific release prices set forth in the related mortgage loan documents or such other allocation as the related mortgage loan seller deemed appropriate). With respect to any mortgage loan that is part of a whole loan, the loan-to-value ratio, debt service coverage ratio and debt yield calculations include the related pari passu companion loan(s). With respect to each mortgage loan, debt service coverage ratio, debt yield and loan-to-value ratio information do not take into account any subordinate debt (whether or not secured by the related mortgaged property) that currently exists or is allowed under the terms of such mortgage loan. See Annex A-1 to the Preliminary Prospectus. |
THE INFORMATION IN THIS STRUCTURAL AND COLLATERAL TERM SHEET IS NOT COMPLETE AND MAY BE AMENDED PRIOR TO THE TIME OF SALE. THIS TERM SHEET IS NOT AN OFFER TO SELL THESE SECURITIES AND IT IS NOT A SOLICITATION OF AN OFFER TO BUY THESE SECURITIES IN ANY JURISDICTION WHERE THE OFFER OR SALE IS NOT PERMITTED.
15
| Wells Fargo Commercial Mortgage Trust 2020-C55 | Characteristics of the Mortgage Pool |
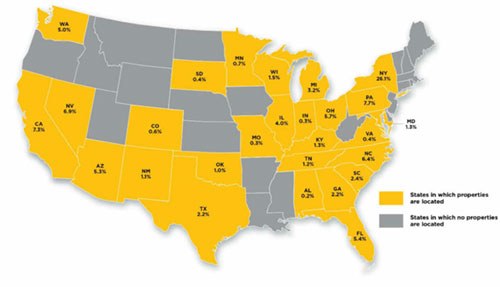
G. Geographic Distribution(1)
| Location | | Number of Mortgaged Properties | | Aggregate Cut-off Date Balance ($) | | % of Initial Pool
Balance (%) | | Weighted Average Cut-off Date LTV Ratio (%) | | Weighted Average Balloon or ARD LTV Ratio (%) | | Weighted Average U/W NCF DSCR (x) | | Weighted Average U/W NOI Debt Yield (%) | | Weighted Average U/W NCF Debt Yield (%) | | Weighted Average Mortgage Rate (%) |
| New York | | 8 | | $251,577,872 | | 26.1 | % | | 52.0 | % | | 51.7 | % | | 2.91 | x | | 10.3 | % | | 10.1 | % | | 3.490 | % |
| Pennsylvania | | 3 | | 73,720,000 | | 7.7 | | | 61.9 | | | 60.4 | | | 2.25 | | | 9.2 | | | 9.0 | | | 3.814 | |
| California | | 6 | | 69,930,756 | | 7.3 | | | 61.5 | | | 59.3 | | | 1.84 | | | 9.0 | | | 8.5 | | | 4.168 | |
| Northern California | | 3 | | 38,762,961 | | 4.0 | | | 59.5 | | | 57.6 | | | 1.83 | | | 8.9 | | | 8.3 | | | 4.235 | |
| Southern California | | 3 | | 31,167,795 | | 3.2 | | | 63.9 | | | 61.4 | | | 1.85 | | | 9.2 | | | 8.8 | | | 4.085 | |
| Nevada | | 2 | | 66,220,000 | | 6.9 | | | 67.5 | | | 67.5 | | | 1.71 | | | 7.4 | | | 7.3 | | | 4.165 | |
| North Carolina | | 7 | | 61,723,715 | | 6.4 | | | 57.9 | | | 55.1 | | | 2.04 | | | 9.2 | | | 9.0 | | | 4.014 | |
| Ohio | | 10 | | 54,571,910 | | 5.7 | | | 66.6 | | | 56.5 | | | 1.81 | | | 10.9 | | | 10.0 | | | 4.249 | |
| Florida | | 5 | | 51,696,628 | | 5.4 | | | 66.0 | | | 55.5 | | | 2.07 | | | 12.9 | | | 11.7 | | | 4.018 | |
| Arizona | | 7 | | 51,295,157 | | 5.3 | | | 64.1 | | | 57.9 | | | 1.90 | | | 9.6 | | | 9.2 | | | 4.081 | |
| Washington | | 2 | | 48,200,000 | | 5.0 | | | 43.6 | | | 43.6 | | | 3.19 | | | 12.7 | | | 12.1 | | | 3.730 | |
| Illinois | | 8 | | 38,137,783 | | 4.0 | | | 69.7 | | | 59.6 | | | 1.84 | | | 10.5 | | | 9.7 | | | 4.104 | |
| Michigan | | 3 | | 31,195,000 | | 3.2 | | | 60.9 | | | 52.0 | | | 1.97 | | | 13.5 | | | 12.1 | | | 4.667 | |
| South Carolina | | 2 | | 23,229,000 | | 2.4 | | | 64.2 | | | 62.3 | | | 2.78 | | | 12.7 | | | 11.5 | | | 3.895 | |
| Georgia | | 7 | | 21,415,171 | | 2.2 | | | 65.2 | | | 57.7 | | | 2.02 | | | 12.2 | | | 11.1 | | | 4.392 | |
| Texas | | 4 | | 20,750,082 | | 2.2 | | | 67.1 | | | 59.3 | | | 1.53 | | | 9.3 | | | 8.7 | | | 4.313 | |
| Wisconsin | | 1 | | 14,025,000 | | 1.5 | | | 74.6 | | | 74.6 | | | 1.95 | | | 8.4 | | | 8.1 | | | 4.088 | |
| Maryland | | 2 | | 12,850,000 | | 1.3 | | | 55.7 | | | 44.8 | | | 1.99 | | | 13.5 | | | 11.9 | | | 4.394 | |
| Kentucky | | 3 | | 12,500,000 | | 1.3 | | | 64.4 | | | 61.5 | | | 1.44 | | | 9.4 | | | 9.2 | | | 4.880 | |
| Tennessee | | 1 | | 11,500,000 | | 1.2 | | | 67.6 | | | 51.3 | | | 2.03 | | | 13.2 | | | 12.0 | | | 3.911 | |
| New Mexico | | 3 | | 10,805,570 | | 1.1 | | | 58.7 | | | 44.3 | | | 1.90 | | | 13.8 | | | 12.6 | | | 4.695 | |
| Oklahoma | | 1 | | 10,000,000 | | 1.0 | | | 65.4 | | | 55.3 | | | 1.89 | | | 11.6 | | | 11.1 | | | 4.170 | |
| Minnesota | | 1 | | 6,465,482 | | 0.7 | | | 62.1 | | | 62.1 | | | 2.56 | | | 9.4 | | | 9.1 | | | 3.494 | |
| Colorado | | 2 | | 6,244,646 | | 0.6 | | | 47.0 | | | 38.8 | | | 1.93 | | | 12.4 | | | 11.4 | | | 4.352 | |
| South Dakota | | 1 | | 4,300,000 | | 0.4 | | | 69.4 | | | 60.5 | | | 1.49 | | | 9.1 | | | 8.9 | | | 4.360 | |
| Virginia | | 3 | | 3,613,071 | | 0.4 | | | 60.3 | | | 60.3 | | | 2.13 | | | 8.8 | | | 8.7 | | | 4.083 | |
| Indiana | | 3 | | 2,702,689 | | 0.3 | | | 65.1 | | | 65.1 | | | 2.29 | | | 9.2 | | | 9.0 | | | 3.961 | |
| Missouri | | 2 | | 2,451,807 | | 0.3 | | | 65.2 | | | 65.2 | | | 2.28 | | | 9.2 | | | 9.0 | | | 3.977 | |
| Alabama | | 3 | | 1,710,372 | | 0.2 | | | 62.1 | | | 62.1 | | | 2.56 | | | 9.4 | | | 9.1 | | | 3.494 | |
| Total/Weighted Average | | 100 | | $962,831,712 | | 100.0 | % | | 59.8 | % | | 56.0 | % | | 2.27 | x | | 10.4 | % | | 9.9 | % | | 3.948 | % |
| (1) | Because this table presents information relating to the mortgaged properties and not the mortgage loans, the information for mortgage loans secured by more than one mortgaged property is based on allocated loan amounts (allocating the principal balance of the mortgage loan to each of those properties according to the relative appraised values of the mortgaged properties or the allocated loan amounts or property-specific release prices set forth in the related mortgage loan documents or such other allocation as the related mortgage loan seller deemed appropriate). With respect to any mortgage loan that is part of a whole loan, the loan-to-value ratio, debt service coverage ratio and debt yield calculations include the related pari passu companion loan(s). With respect to each mortgage loan, debt service coverage ratio, debt yield and loan-to-value ratio information do not take into account any subordinate debt (whether or not secured by the related mortgaged property) that currently exists or is allowed under the terms of such mortgage loan. See Annex A-1 to the Preliminary Prospectus. |
THE INFORMATION IN THIS STRUCTURAL AND COLLATERAL TERM SHEET IS NOT COMPLETE AND MAY BE AMENDED PRIOR TO THE TIME OF SALE. THIS TERM SHEET IS NOT AN OFFER TO SELL THESE SECURITIES AND IT IS NOT A SOLICITATION OF AN OFFER TO BUY THESE SECURITIES IN ANY JURISDICTION WHERE THE OFFER OR SALE IS NOT PERMITTED.
16
| Wells Fargo Commercial Mortgage Trust 2020-C55 | Characteristics of the Mortgage Pool |
H. Characteristics of the Mortgage Pool(1)
| CUT-OFF DATE BALANCE |
| Range of Cut-off Date Balances ($) | Number of
Mortgage
Loans | Aggregate
Cut-off Date
Balance | Percent by
Aggregate Cut-off Date
Pool Balance (%) |
| 945,000 - 1,000,000 | 2 | $1,918,000 | 0.2 | % |
| 1,000,001 - 2,000,000 | 3 | 4,929,000 | 0.5 | |
| 2,000,001 - 3,000,000 | 4 | 10,228,065 | 1.1 | |
| 3,000,001 - 4,000,000 | 1 | 4,000,000 | 0.4 | |
| 4,000,001 - 5,000,000 | 8 | 36,889,936 | 3.8 | |
| 5,000,001 - 6,000,000 | 2 | 11,300,000 | 1.2 | |
| 6,000,001 - 7,000,000 | 1 | 6,100,000 | 0.6 | |
| 7,000,001 - 8,000,000 | 4 | 30,257,175 | 3.1 | |
| 8,000,001 - 9,000,000 | 6 | 49,204,306 | 5.1 | |
| 9,000,001 - 10,000,000 | 3 | 29,250,000 | 3.0 | |
| 10,000,001 - 15,000,000 | 11 | 138,286,138 | 14.4 | |
| 15,000,001 - 20,000,000 | 7 | 121,308,145 | 12.6 | |
| 20,000,001 - 30,000,000 | 7 | 177,100,000 | 18.4 | |
| 30,000,001 - 50,000,000 | 5 | 189,115,000 | 19.6 | |
| 50,000,001 - 80,000,000 | 1 | 70,000,000 | 7.3 | |
| 80,000,001 - 82,945,946 | 1 | 82,945,946 | 8.6 | |
| Total: | 66 | $962,831,712 | 100.0 | % |
| Weighted Average | $14,588,359 | | | |
| UNDERWRITTEN NOI DEBT SERVICE COVERAGE RATIO |
| Range of U/W NOI DSCRs (x) | Number of
Mortgage
Loans | Aggregate Cut-off Date
Balance | Percent by
Aggregate
Cut-off Date
Pool Balance (%) |
| 1.43 - 1.50 | 4 | $47,125,000 | 4.9 | % |
| 1.51 - 1.60 | 5 | 40,000,000 | 4.2 | |
| 1.61 - 1.70 | 1 | 27,700,000 | 2.9 | |
| 1.71 - 1.80 | 8 | 107,182,080 | 11.1 | |
| 1.81 - 1.90 | 10 | 93,362,358 | 9.7 | |
| 1.91 - 2.00 | 9 | 79,827,239 | 8.3 | |
| 2.01 - 2.50 | 17 | 212,715,089 | 22.1 | |
| 2.51 - 3.00 | 7 | 134,895,000 | 14.0 | |
| 3.01 - 3.50 | 4 | 150,024,946 | 15.6 | |
| 3.51 - 3.92 | 1 | 70,000,000 | 7.3 | |
| Total: | 66 | $962,831,712 | 100.0 | % |
| Weighted Average | 2.38x | | |
| UNDERWRITTEN NCF DEBT SERVICE COVERAGE RATIO |
Range of U/W NCF DSCRs (x) | Number of
Mortgage
Loans | Aggregate
Cut-off Date
Balance | Percent by
Aggregate
Cut-off Date
Pool Balance (%) |
| 1.39- 1.40 | 1 | $4,625,000 | 0.5 | % |
| 1.41 - 1.50 | 8 | 82,500,000 | 8.6 | |
| 1.51 - 1.60 | 4 | 22,344,005 | 2.3 | |
| 1.61 - 1.70 | 2 | 35,850,000 | 3.7 | |
| 1.71 - 1.80 | 13 | 195,305,671 | 20.3 | |
| 1.81 - 1.90 | 11 | 94,372,000 | 9.8 | |
| 1.91 - 2.00 | 5 | 67,167,366 | 7.0 | |
| 2.01 - 2.50 | 12 | 116,847,723 | 12.1 | |
| 2.51 - 3.00 | 5 | 123,795,000 | 12.9 | |
| 3.01 - 3.50 | 4 | 150,024,946 | 15.6 | |
| 3.51 - 3.83 | 1 | 70,000,000 | 7.3 | |
| Total: | 66 | $962,831,712 | 100.0 | % |
| Weighted Average | 2.27x | | | |
| LOAN PURPOSE |
| Loan Purpose | Number of
Mortgage
Loans | Aggregate
Cut-off Date
Balance | Percent by
Aggregate
Cut-off Date
Pool Balance (%) |
| Refinance | 37 | $583,439,742 | 60.6 | % |
| Acquisition | 29 | 379,391,969 | 39.4 | |
| Total: | 66 | $962,831,712 | 100.0 | % |
| MORTGAGE RATE |
Range of Mortgage Rates (%) | Number of
Mortgage
Loans | Aggregate Cut-off Date
Balance | Percent by
Aggregate Cut-off Date
Pool Balance (%) |
| 2.990 - 3.500 | 6 | $260,770,946 | 27.1 | % |
| 3.501 - 3.750 | 4 | 101,106,052 | 10.5 | |
| 3.751 - 4.000 | 8 | 111,279,012 | 11.6 | |
| 4.001 - 4.250 | 19 | 258,638,327 | 26.9 | |
| 4.251 - 4.500 | 12 | 80,350,000 | 8.3 | |
| 4.501 - 4.750 | 8 | 63,306,421 | 6.6 | |
| 4.751 - 4.980 | 9 | 87,380,955 | 9.1 | |
| Total: | 66 | $962,831,712 | 100.0 | % |
| Weighted Average | 3.948% | | | |
| UNDERWRITTEN NOI DEBT YIELD |
Range of U/W NOI Debt Yields (%) | Number of
Mortgage
Loans | Aggregate
Cut-off Date
Balance | Percent by
Aggregate
Cut-off Date
Pool Balance (%) |
| 6.7 - 8.0 | 6 | $157,620,000 | 16.4 | % |
| 8.1 - 9.0 | 13 | 111,422,000 | 11.6 | |
| 9.1 - 10.0 | 14 | 209,845,000 | 21.8 | |
| 10.1 - 11.0 | 7 | 138,844,077 | 14.4 | |
| 11.1 - 12.0 | 7 | 121,204,746 | 12.6 | |
| 12.1 - 13.0 | 5 | 86,176,799 | 9.0 | |
| 13.1 - 14.0 | 10 | 104,476,723 | 10.9 | |
| 14.1 - 15.0 | 3 | 28,242,366 | 2.9 | |
| 15.1 | 1 | 5,000,000 | 0.5 | |
| Total: | 66 | $962,831,712 | 100.0 | % |
| Weighted Average | 10.4% | | | |
| UNDERWRITTEN NCF DEBT YIELD |
| Range of U/W NCF Debt Yields (%) | Number of
Mortgage
Loans | Aggregate
Cut-off Date
Balance | Percent by
Aggregate
Cut-off Date
Pool Balance (%) |
| 6.6 - 8.0 | 10 | $205,870,000 | 21.4 | % |
| 8.1 - 9.0 | 14 | 104,403,926 | 10.8 | |
| 9.1 - 10.0 | 16 | 230,461,646 | 23.9 | |
| 10.1 - 11.0 | 5 | 125,835,957 | 13.1 | |
| 11.1 - 12.0 | 10 | 180,712,717 | 18.8 | |
| 12.1 - 13.0 | 9 | 106,841,896 | 11.1 | |
| 13.1 - 13.4 | 2 | 8,705,570 | 0.9 | |
| Total: | 66 | $962,831,712 | 100.0 | % |
| Weighted Average | 9.9% | | | |
| ORIGINAL TERM TO MATURITY or ARD |
| Original Terms to Maturity or ARD (months) | Number of
Mortgage
Loans | Aggregate
Cut-off Date
Balance | Percent by
Aggregate
Cut-off Date
Pool Balance (%) |
| 60 | 2 | $17,800,000 | 1.8 | % |
| 84 | 2 | 24,679,000 | 2.6 | |
| 120 | 62 | 920,352,712 | 95.6 | |
| Total: | 66 | $962,831,712 | 100.0 | % |
| Weighted Average | 118 months | | | |
| (1) | With respect to any mortgage loan that is part of a whole loan, the loan-to-value ratio, debt service coverage ratio and debt yield calculations include the related pari passu companion loan(s) but exclude any related subordinate debt (unless otherwise stated). With respect to each mortgage loan, debt service coverage ratio, debt yield and loan-to-value ratio information do not take into account any subordinate debt (whether or not secured by the related mortgaged property) that currently exists or is allowed under the terms of such mortgage loan. See Annex A-1 to the Preliminary Prospectus. Prepayment provisions for each mortgage loan reflects the entire life of the loan (from origination to maturity or ARD). |
THE INFORMATION IN THIS STRUCTURAL AND COLLATERAL TERM SHEET IS NOT COMPLETE AND MAY BE AMENDED PRIOR TO THE TIME OF SALE. THIS TERM SHEET IS NOT AN OFFER TO SELL THESE SECURITIES AND IT IS NOT A SOLICITATION OF AN OFFER TO BUY THESE SECURITIES IN ANY JURISDICTION WHERE THE OFFER OR SALE IS NOT PERMITTED.
17
| Wells Fargo Commercial Mortgage Trust 2020-C55 | Characteristics of the Mortgage Pool |
| REMAINING TERM TO MATURITY or ARD |
| Range of Remaining Terms to Maturity or ARD (months) | Number of
Mortgage
Loans | Aggregate
Cut-off Date
Balance | Percent by
Aggregate
Cut-off Date
Pool Balance (%) |
| 58 - 60 | 2 | $17,800,000 | 1.8 | % |
| 61 - 84 | 2 | 24,679,000 | 2.6 | |
| 85 - 120 | 62 | 920,352,712 | 95.6 | |
| Total: | 66 | $962,831,712 | 100.0 | % |
| Weighted Average | 117 months | | | |
| ORIGINAL AMORTIZATION TERM(2) |
| Original Amortization Terms (months) | Number of
Mortgage
Loans | Aggregate
Cut-off Date
Balance | Percent by
Aggregate
Cut-off Date
Pool Balance (%) |
| Non-Amortizing | 29 | $613,286,946 | 63.7 | % |
| 300 | 1 | 8,200,000 | 0.9 | |
| 330 | 1 | 11,500,000 | 1.2 | |
| 360 | 35 | 329,844,766 | 34.3 | |
| Total: | 66 | $962,831,712 | 100.0 | % |
| Weighted Average(3) | 358 months | | | |
| | | | | |
(2) The original amortization term shown for any mortgage loan that is interest-only for part of its term does not include the number of months in its interest-only period and reflects only the number of months as of the commencement of amortization remaining from the end of such interest-only period. (3) Excludes the non-amortizing mortgage loans. |
| REMAINING AMORTIZATION TERM(4) |
| Range of Remaining Amortization Terms (months) | Number of
Mortgage
Loans | Aggregate
Cut-off Date
Balance | Percent by
Aggregate
Cut-off Date
Pool Balance (%) |
| Non-Amortizing | 29 | $613,286,946 | 63.7 | % |
| 300 - 357 | 5 | 50,841,692 | 5.3 | |
| 358 - 360 | 32 | 298,703,073 | 31.0 | |
| Total: | 66 | $962,831,712 | 100.0 | % |
| Weighted Average(5) | 357 months | | | |
(4) The remaining amortization term shown for any mortgage loan that is interest-only for part of its term does not include the number of months in its interest-only period and reflects only the number of months as of the commencement of amortization remaining from the end of such interest-only period. (5) Excludes the non-amortizing mortgage loans. |
| LOCKBOXES |
| Type of Lockbox | Number of
Mortgage
Loans | Aggregate
Cut-off Date Balance | Percent by
Aggregate
Cut-off Date
Pool Balance (%) |
| Hard/Springing Cash Management | 16 | $479,215,692 | 49.8 | % |
| Springing | 36 | 338,272,262 | 35.1 | |
| Soft/Springing Cash Management | 7 | 100,325,000 | 10.4 | |
| Hard/Upfront Cash Management | 6 | 40,368,757 | 4.2 | |
| None | 1 | 4,650,000 | 0.5 | |
| Total: | 66 | $962,831,712 | 100.0 | % |
| PREPAYMENT PROVISION SUMMARY(6) |
| Prepayment Provision | Number of
Mortgage
Loans | Aggregate
Cut-off Date
Balance | Percent by
Aggregate
Cut-off Date
Pool Balance (%) |
| Lockout / Defeasance / Open | 56 | $734,889,766 | 76.3 | % |
| Lockout / GRTR 1% or YM / Open | 6 | 184,994,946 | 19.2 | |
| Lockout / GRTR 1% or YM / GRTR 1% or YM or Defeasance / Open | 1 | 40,000,000 | 4.2 | |
| YM / YM or Defeasance / Open | 3 | 2,947,000 | 0.3 | |
| Total: | 66 | $962,831,712 | 100.0 | % |
| | | | | |
(6) As a result of property releases or the application of funds in a performance reserve, partial principal prepayments could occur during a period that voluntary principal prepayments are otherwise prohibited. |
CUT-OFF DATE LOAN-TO-VALUE RATIO |
| Range of Cut-off Date LTV Ratios (%) | Number of
Mortgage
Loans | Aggregate
Cut-off Date
Balance | Percent by
Aggregate
Cut-off Date
Pool Balance (%) |
| 39.4 - 40.0 | 1 | $40,000,000 | 4.2 | % |
| 40.1 - 45.0 | 3 | 76,492,141 | 7.9 | |
| 45.1 - 50.0 | 3 | 51,105,570 | 5.3 | |
| 50.1 - 55.0 | 5 | 120,295,946 | 12.5 | |
| 55.1 - 60.0 | 9 | 114,937,366 | 11.9 | |
| 60.1 - 65.0 | 16 | 276,735,138 | 28.7 | |
| 65.1 - 70.0 | 23 | 195,879,498 | 20.3 | |
| 70.1 - 74.6 | 6 | 87,386,052 | 9.1 | |
| Total: | 66 | $962,831,712 | 100.0 | % |
| Weighted Average | 59.8% | | | |
BALLOON or ARD LOAN-TO-VALUE RATIO | |
| Range of Balloon LTV Ratios (%) | Number of
Mortgage
Loans | Aggregate
Cut-off Date
Balance | Percent by
Aggregate
Cut-off Date
Pool Balance (%) |
| 32.3 - 35.0 | 1 | $4,244,646 | 0.4 | % |
| 35.1 - 40.0 | 3 | 44,853,065 | 4.7 | |
| 40.1 - 45.0 | 2 | 77,850,000 | 8.1 | |
| 45.1 - 50.0 | 8 | 112,903,504 | 11.7 | |
| 50.1 - 55.0 | 12 | 185,069,720 | 19.2 | |
| 55.1 - 60.0 | 15 | 185,639,776 | 19.3 | |
| 60.1 - 65.0 | 17 | 281,724,000 | 29.3 | |
| 65.1 - 70.0 | 6 | 28,822,000 | 3.0 | |
| 70.1 – 74.6 | 2 | 41,725,000 | 4.3 | |
| Total: | 66 | $962,831,712 | 100.0 | % |
| Weighted Average | 56.0% | | | |
AMORTIZATION TYPE |
| Amortization Type | Number of
Mortgage
Loans | Aggregate
Cut-off Date
Balance | Percent by
Aggregate
Cut-off Date
Pool Balance (%) |
| Interest-only, Balloon | 25 | $570,339,946 | 59.2 | % |
| Amortizing Balloon | 20 | 190,219,766 | 19.8 | |
| Interest-only, Amortizing Balloon | 17 | 159,325,000 | 16.5 | |
| Interest-only, ARD | 4 | 42,947,000 | 4.5 | |
| Total: | 66 | $962,831,712 | 100.0 | % |
ORIGINAL TERM OF INTEREST-ONLY PERIOD FOR PARTIAL IO LOANS |
| IO Terms (months) | Number of
Mortgage
Loans | Aggregate
Cut-off Date
Balance | Percent by
Aggregate
Cut-off Date
Pool Balance (%) |
| 12 | 1 | $3,000,000 | 0.3 | % |
| 24 | 5 | 52,000,000 | 5.4 | |
| 36 | 5 | 36,050,000 | 3.7 | |
| 48 | 2 | 18,325,000 | 1.9 | |
| 60 | 4 | 49,950,000 | 5.2 | |
| Total: | 17 | $159,325,000 | 16.5 | % |
| Weighted Average | 41 months | | | |
SEASONING |
| Seasoning (months) | Number of
Mortgage
Loans | Aggregate Cut-off Date
Balance | Percent by
Aggregate
Cut-off Date
Pool Balance (%) |
| 0 | 17 | $168,267,000 | 17.5 | % |
| 1 | 20 | 357,641,547 | 37.1 | |
| 2 | 23 | 376,956,472 | 39.2 | |
| 3 | 5 | 40,580,641 | 4.2 | |
| 4 | 1 | 19,386,052 | 2.0 | |
| Total: | 66 | $962,831,712 | 100.0 | % |
| Weighted Average | 1 month | | | |
THE INFORMATION IN THIS STRUCTURAL AND COLLATERAL TERM SHEET IS NOT COMPLETE AND MAY BE AMENDED PRIOR TO THE TIME OF SALE. THIS TERM SHEET IS NOT AN OFFER TO SELL THESE SECURITIES AND IT IS NOT A SOLICITATION OF AN OFFER TO BUY THESE SECURITIES IN ANY JURISDICTION WHERE THE OFFER OR SALE IS NOT PERMITTED.
18
Wells Fargo Commercial Mortgage Trust 2020-C55 | Certain Terms and Conditions |
V. Certain Terms and Conditions
Interest Entitlements: | The interest entitlement of each Class of Certificates on each Distribution Date generally will be the interest accrued during the related Interest Accrual Period on the related Certificate Balance or Notional Amount at the related pass-through rate, net of any prepayment interest shortfalls allocated to that Class for such Distribution Date as described below. If prepayment interest shortfalls arise from voluntary prepayments (without Master Servicer consent) on particular non-specially serviced loans during any collection period, the Master Servicer is required to make a compensating interest payment to offset those shortfalls, generally up to an amount equal to the portion of its master servicing fees that accrue at 0.25 basis points per annum. The remaining amount of prepayment interest shortfalls will be allocated to reduce the interest entitlement on all Classes of Certificates entitled to interest, on a pro rata basis, based on their respective amounts of accrued interest for the related Distribution Date. If a Class receives less than the entirety of its interest entitlement on any Distribution Date, then the shortfall (excluding any shortfall due to prepayment interest shortfalls), together with interest thereon, will be added to its interest entitlement for the next succeeding Distribution Date. |
| | |
Principal Distribution Amount: | The Principal Distribution Amount for each Distribution Date generally will be the aggregate amount of principal received or advanced in respect of the mortgage loans, net of any non-recoverable advances and interest thereon and workout-delayed reimbursement amounts that are reimbursed to the Master Servicer, the Special Servicer or the Trustee during the related collection period. Non-recoverable advances and interest thereon are reimbursable from principal collections and advances before reimbursement from other amounts. Workout-delayed reimbursement amounts are reimbursable from principal collections. |
| | |
Subordination, Allocation of Losses and Certain Expenses | The chart below describes the manner in which the payment rights of certain Classes of Certificates will be senior or subordinate, as the case may be, to the payment rights of other Classes of Certificates. The chart also shows the corresponding entitlement to receive principal and/or interest of certain Classes of Certificates (other than excess interest that accrues on each mortgage loan that has an anticipated repayment date) on any distribution date in descending order. It also shows the manner in which mortgage loan losses are allocated to certain Classes of Certificates in ascending order (beginning with the Non-Offered Certificates, other than the Class X-D, Class X-F, Class X-G, Class V and Class R Certificates) to reduce the balance of each such Class to zero; provided that no principal payments or mortgage loan losses will be allocated to the Class X-A, Class X-B, Class X-D, Class X-F, Class X-G, Class V or Class R Certificates, although principal payments and losses may reduce the Notional Amounts of the Class X-A, Class X-B, Class X-D, Class X-F and Class X-G Certificates and, therefore, the amount of interest they accrue. |
| 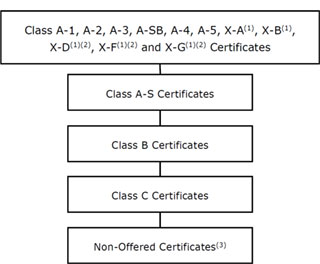
|
| | (1) | The Class X-A, Class X-B, Class X-D, Class X-F and Class X-G Certificates are interest-only certificates |
| | (2) | Non-Offered Certificates |
| | (3) | Other than the Class X-D, Class X-F, Class X-G, Class V and Class R Certificates |
THE INFORMATION IN THIS STRUCTURAL AND COLLATERAL TERM SHEET IS NOT COMPLETE AND MAY BE AMENDED PRIOR TO THE TIME OF SALE. THIS TERM SHEET IS NOT AN OFFER TO SELL THESE SECURITIES AND IT IS NOT A SOLICITATION OF AN OFFER TO BUY THESE SECURITIES IN ANY JURISDICTION WHERE THE OFFER OR SALE IS NOT PERMITTED.
19
Wells Fargo Commercial Mortgage Trust 2020-C55 | Certain Terms and Conditions |
Distributions: | On each Distribution Date, funds available for distribution from the mortgage loans, net of specified trust fees, expenses and reimbursements will generally be distributed in the following amounts and order of priority (in each case to the extent of remaining available funds): |
| | | |
| | 1. | Class A-1, Class A-2, Class A-3, Class A-SB, Class A-4, Class A-5, Class X-A, Class X-B, Class X-D, Class X-F and Class X-G Certificates: To interest on the Class A-1, Class A-2, Class A-3, Class A-SB, Class A-4, Class A-5, Class X-A, Class X-B, Class X-D, Class X-F and Class X-G Certificates, pro rata, according to their respective interest entitlements. |
| | | |
| | 2. | Class A-1, Class A-2, Class A-3, Class A-SB, Class A-4 and Class A-5 Certificates, as follows: To principal on the Class A-1, Class A-2, Class A-3, Class A-SB, Class A-4 and Class A-5 Certificates in the following amounts and order of priority: (i) first, to principal on the Class A-SB Certificates, in an amount up to the Principal Distribution Amount for such Distribution Date until their Certificate Balance is reduced to the Class A-SB Planned Principal Balance for such Distribution Date; (ii) second, to principal on the Class A-1 Certificates until their Certificate Balance is reduced to zero, up to the remainder of the Principal Distribution Amount for such Distribution Date; (iii) third, to principal on the Class A-2 Certificates until their Certificate Balance is reduced to zero, up to the remainder of the Principal Distribution Amount for such Distribution Date; (iv) fourth, to principal on the Class A-3 Certificates until their Certificate Balance is reduced to zero, up to the remainder of the Principal Distribution Amount for such Distribution Date; (v) fifth, to principal on the Class A-4 Certificates until their Certificate Balance is reduced to zero, up to the remainder of the Principal Distribution Amount for such Distribution Date; (vi) sixth, to principal on the Class A-5 Certificates until their Certificate Balance is reduced to zero, up to the remainder of the Principal Distribution Amount for such Distribution Date; and (vii) seventh, to principal on the Class A-SB Certificates until their Certificate Balance is reduced to zero, up to the remainder of the Principal Distribution Amount for such Distribution Date. However, if the Certificate Balance of each Class of Principal Balance Certificates, other than the Class A-1, A-2, A-3, A-SB, A-4 and A-5 Certificates, has been reduced to zero as a result of the allocation of Mortgage Loan losses and expenses and any of the Class A-1, Class A-2, Class A-3, Class A-SB, Class A-4 and Class A-5 Certificates remains outstanding, then the Principal Distribution Amount will be distributed to the Class A-1, Class A-2, Class A-3, Class A-SB, Class A-4 and Class A-5 Certificates, pro rata, based on their respective outstanding Certificate Balances, until their Certificate Balances have been reduced to zero. |
| | | |
| | 3. | Class A-1, Class A-2, Class A-3, Class A-SB, Class A-4 and Class A-5 Certificates: To reimburse the holders of the Class A-1, Class A-2, Class A-3, Class A-SB, Class A-4 and Class A-5 Certificates, pro rata, on the basis of previously allocated unreimbursed losses, for any previously unreimbursed losses (plus interest thereon) on the mortgage loans that were previously allocated in reduction of the Certificate Balances of such Classes. |
| | | |
| | 4. | Class A-S Certificates: To make distributions on the Class A-S Certificates as follows: (a) first, to interest on the Class A-S Certificates in the amount of the interest entitlement for that Class; (b) next, to the extent of the portion of the Principal Distribution Amount remaining after distributions in respect of principal to each Class with a higher distribution priority (in this case, the Class A-1, Class A-2, Class A-3, Class A-SB, Class A-4 and Class A-5 Certificates), to principal on the Class A-S Certificates until their Certificate Balance is reduced to zero; and (c) next, to reimburse the holders of the Class A-S Certificates for any previously unreimbursed losses (plus interest thereon) on the mortgage loans that were previously allocated to that Class in reduction of their Certificate Balance. |
| | | |
| | 5. | Class B Certificates: To make distributions on the Class B Certificates as follows: (a) first, to interest on the Class B Certificates in the amount of the interest entitlement for that Class; (b) next, to the extent of the portion of the Principal Distribution Amount remaining after distributions in respect of principal to each Class with a higher distribution priority (in this case, the Class A-1, Class A-2, Class A-3, Class A-SB, Class A-4, Class A-5 and Class A-S Certificates), to principal on the Class B Certificates until their Certificate Balance is reduced to zero; and (c) next, to reimburse the holders of the Class B Certificates for any previously unreimbursed losses (plus interest thereon) on the mortgage loans that were previously allocated to that Class in reduction of their Certificate Balance. |
| | | |
| | 6. | Class C Certificates: To make distributions on the Class C Certificates as follows: (a) first, to interest on the Class C Certificates in the amount of the interest entitlement for that Class; (b) next, to the extent of the portion of the Principal Distribution Amount remaining after distributions in respect of principal to each Class with a higher distribution priority (in this case, the Class A-1, Class A-2, Class A-3, Class A-SB, Class A-4, Class A-5, Class A-S and Class B Certificates), to principal on the Class C Certificates until their Certificate Balance is reduced to zero; and (c) next, to reimburse the holders of the Class |
THE INFORMATION IN THIS STRUCTURAL AND COLLATERAL TERM SHEET IS NOT COMPLETE AND MAY BE AMENDED PRIOR TO THE TIME OF SALE. THIS TERM SHEET IS NOT AN OFFER TO SELL THESE SECURITIES AND IT IS NOT A SOLICITATION OF AN OFFER TO BUY THESE SECURITIES IN ANY JURISDICTION WHERE THE OFFER OR SALE IS NOT PERMITTED.
20
Wells Fargo Commercial Mortgage Trust 2020-C55 | Certain Terms and Conditions |
| | | C Certificates for any previously unreimbursed losses (plus interest thereon) on the mortgage loans that were previously allocated to that Class in reduction of their Certificate Balance. |
| | | |
| | 7. | After the Class A-1, Class A-2, Class A-3, Class A-SB, Class A-4, Class A-5, Class X-A, Class X-B, Class X-D, Class X-F, Class X-G, Class A-S, Class B and Class C Certificates are paid all amounts to which they are entitled, the remaining funds available for distribution will be used to pay interest, principal and loss reimbursement amounts on the Class D, Class E, Class F, Class G and Class H-RR Certificates sequentially in that order in a manner analogous to the Class C Certificates. |
Allocation of Yield Maintenance Charges and Prepayment Premiums: | If any yield maintenance charge or prepayment premium is collected during any particular collection period with respect to any mortgage loan, then on the Distribution Date corresponding to that collection period, the Certificate Administrator will pay that yield maintenance charge or prepayment premium (net of liquidation fees or workout fees payable therefrom) in the following manner: (1) to each of the Class A-1, Class A-2, Class A-3, Class A-SB, Class A-4, Class A-5, Class A-S, Class B, Class C, Class D and Class E Certificates, the product of (a) the yield maintenance charge or prepayment premium, (b) the related Base Interest Fraction (as defined in the Preliminary Prospectus) for such Class, and (c) a fraction, the numerator of which is equal to the amount of principal distributed to such Class for that Distribution Date, and the denominator of which is the total amount of principal distributed to all Principal Balance Certificates for that Distribution Date, (2) to the Class X-A Certificates, the excess, if any, of (a) the product of (i) such yield maintenance charge or prepayment premium and (ii) a fraction, the numerator of which is equal to the amount of principal distributed to the Class A-1, Class A-2, Class A-3, Class A-SB, Class A-4 and Class A-5 Certificates for that Distribution Date, and the denominator of which is the total amount of principal distributed to all Principal Balance Certificates for that Distribution Date, over (b) the amount of such yield maintenance charge or prepayment premium distributed to the Class A-1, Class A-2, Class A-3, Class A-SB, Class A-4 and Class A-5 Certificates as described above, and (3) to the Class X-B Certificates, any remaining portion of such yield maintenance charge or prepayment premium not distributed as described above. No prepayment premiums or yield maintenance charges will be distributed to the holders of the Class X-D, Class X-F, Class X-G, Class F, Class G, Class H-RR, Class V or Class R Certificates. For a description of when prepayment premiums and yield maintenance charges are generally required on the mortgage loans, see Annex A-1 to the Preliminary Prospectus. See also “Risk Factors—Risks Relating to the Mortgage Loans—Risks Relating to Enforceability of Yield Maintenance Charges, Prepayment Premiums or Defeasance Provisions“ and “Risk Factors—Other Risks Relating to the Certificates—Your Yield May Be Affected by Defaults, Prepayments and Other Factors” in the Preliminary Prospectus. Prepayment premiums and yield maintenance charges will be distributed on each Distribution Date only to the extent they are actually received on the mortgage loans as of the related Determination Date. |
| |
Realized Losses: | The Certificate Balances of the Class A-1, Class A-2, Class A-3, Class A-SB, Class A-4, Class A-5, Class A-S, Class B, Class C, Class D, Class E, Class F, Class G and Class H-RR Certificates will be reduced without distribution on any Distribution Date as a write-off to the extent of any losses realized on the mortgage loans allocated to such Class on such Distribution Date. Such losses will be applied in the following order, in each case until the related Certificate Balance is reduced to zero: first, to the Class H-RR Certificates; second, to the Class G Certificates; third, to the Class F Certificates; fourth, to the Class E Certificates; fifth, to the Class D Certificates; sixth, to the Class C Certificates; seventh, to the Class B Certificates; eighth, to the Class A-S Certificates; and, finally, pro rata, to the Class A-1, Class A-2, Class A-3, Class A-SB, Class A-4 and Class A-5 Certificates based on their outstanding Certificate Balances. The Notional Amount of the Class X-A Certificates will be reduced by the amount of all losses that are allocated to the Class A-1, A-2, A-3, A-SB, A-4 or A-5 Certificates as write-offs in reduction of their Certificate Balances. The Notional Amount of the Class X-B Certificates will be reduced by the amount of all losses that are allocated to the Class A-S, B or C Certificates as write-offs in reduction of their Certificate Balances. Balances. The Notional Amount of the Class X-D Certificates will be reduced by the amount of all losses that are allocated to the Class D or E Certificates as write-offs in reduction of their Certificate Balances. The Notional Amount of the Class X-F Certificates will be reduced by the amount of all losses that are allocated to the Class F Certificates as write-offs in reduction of their Certificate Balances. The Notional Amount of the Class X-G Certificates will be reduced by the amount of all losses that are allocated to the Class G Certificates as write-offs in reduction of their Certificate Balances. |
| |
P&I Advances: | The Master Servicer or, if the Master Servicer fails to do so, the Trustee, will be obligated to advance delinquent debt service payments (other than balloon payments, excess interest and default interest) and assumed debt service payments on mortgage loans with delinquent balloon payments (excluding any related companion loan), except to the extent any such advance is |
THE INFORMATION IN THIS STRUCTURAL AND COLLATERAL TERM SHEET IS NOT COMPLETE AND MAY BE AMENDED PRIOR TO THE TIME OF SALE. THIS TERM SHEET IS NOT AN OFFER TO SELL THESE SECURITIES AND IT IS NOT A SOLICITATION OF AN OFFER TO BUY THESE SECURITIES IN ANY JURISDICTION WHERE THE OFFER OR SALE IS NOT PERMITTED.
21
Wells Fargo Commercial Mortgage Trust 2020-C55 | Certain Terms and Conditions |
| deemed non-recoverable from collections on the related mortgage loan. In addition, if an Appraisal Reduction Amount exists for a given mortgage loan, the interest portion of any P&I advance for such mortgage loan will be reduced, which will have the effect of reducing the amount of interest available for distribution to the Certificates in reverse alphabetical order of their Class designations (except that interest payments on the Class A-1, Class A-2, Class A-3, Class A-SB, Class A-4, Class A-5, Class X-A, Class X-B, Class X-D, Class X-F and Class X-G Certificates would be affected on a pari passu basis). |
| |
Servicing Advances: | The Master Servicer or, if the Master Servicer fails to do so, the Trustee, will be obligated to make servicing advances, including the payment of delinquent property taxes, insurance premiums and ground rent, except to the extent that those advances are deemed non-recoverable from collections on the related mortgage loan. The Master Servicer or the Trustee, as applicable, will have the primary obligation to make any required servicing advances with respect to any serviced whole loan. With respect to any non-serviced whole loan, the master servicer or trustee, as applicable, under the related lead securitization servicing agreement will have the primary obligation to make any required servicing advances with respect to such non-serviced whole loan. |
| |
Appraisal Reduction Amounts and Collateral Deficiency Amounts: | An “Appraisal Reduction Amount” generally will be created in the amount, if any, by which the principal balance of a required appraisal loan (which is a mortgage loan (other than a non-serviced mortgage loan) with respect to which certain defaults, modifications or insolvency events have occurred as further described in the Preliminary Prospectus) plus other amounts overdue or advanced in connection with such mortgage loan exceeds 90% of the appraised value of the related mortgaged property plus certain escrows and reserves (including letters of credit) held with respect to the mortgage loan. With respect to any serviced whole loan, any Appraisal Reduction Amount will be allocated, first, to any related subordinate companion loan and, second, pro rata, to the related mortgage loan and the related pari passu companion loan(s). With respect to any non-serviced mortgage loan, appraisal reduction amounts are expected to be calculated in a similar manner under the related non-serviced pooling and servicing agreement. A mortgage loan will cease to be a required appraisal loan when the same has ceased to be a specially serviced loan (if applicable), has been brought current for at least three consecutive months and no other circumstances exist that would cause such mortgage loan to be a required appraisal loan. A “Collateral Deficiency Amount” will exist with respect to any mortgage loan that is modified into an AB loan structure and remains a corrected mortgage loan and will generally equal the excess of (i) the stated principal balance of such AB modified loan (taking into account the related junior note(s) and any pari passu notes included therein), over (ii) the sum of (in the case of a whole loan, solely to the extent allocable to the subject mortgage loan) (x) the most recent appraised value of the related mortgaged property plus (y) solely to the extent not reflected or taken into account in such appraised value and to the extent on deposit with, or otherwise under the control of, the lender as of the date of such determination, any capital or additional collateral contributed by the related borrower at the time the mortgage loan (and as part of the modification thereto) became an AB modified loan plus (z) any other escrows or reserves (in addition to any amounts set forth in the immediately preceding clause (y) and solely to the extent not reflected or taken into account in the calculation of any related Appraisal Reduction Amount) held by the lender with respect to the mortgage loan as of the date of such determination. A “Cumulative Appraisal Reduction Amount” with respect to any mortgage loan will be the sum of any Appraisal Reduction Amount and any Collateral Deficiency Amount. Appraisal Reduction Amounts will affect the amount of debt service advances in respect of the related mortgage loan. Additionally, Cumulative Appraisal Reduction Amounts will be taken into account in the determination of the identity of the Class whose majority constitutes the “majority controlling class certificateholder” and is entitled to appoint the directing certificateholder. |
| |
Clean-Up Call and Exchange Termination: | On each Distribution Date occurring after the aggregate unpaid principal balance of the pool of mortgage loans is less than 1.0% of the principal balance of the mortgage loans as of the cut-off date, certain specified persons will have the option to purchase all of the remaining mortgage loans (and the trust’s interest in all property acquired through exercise of remedies in respect of any mortgage loan) at the price specified in the Preliminary Prospectus. Exercise of the option will terminate the trust and retire the then-outstanding Certificates. If the aggregate Certificate Balances of each of the Class A-1, Class A-2, Class A-3, Class A-SB, Class A-4, Class A-5, Class A-S, Class B, Class C, Class D and Class E Certificates have been reduced to zero, the trust may also be terminated in connection with an exchange of all the then-outstanding Certificates (other than the Class V and Class R Certificates) for the mortgage loans and REO properties then remaining in the issuing entity, subject to payment of a price specified in the Preliminary Prospectus, but all of the holders of those outstanding Classes of Certificates |
THE INFORMATION IN THIS STRUCTURAL AND COLLATERAL TERM SHEET IS NOT COMPLETE AND MAY BE AMENDED PRIOR TO THE TIME OF SALE. THIS TERM SHEET IS NOT AN OFFER TO SELL THESE SECURITIES AND IT IS NOT A SOLICITATION OF AN OFFER TO BUY THESE SECURITIES IN ANY JURISDICTION WHERE THE OFFER OR SALE IS NOT PERMITTED.
22
Wells Fargo Commercial Mortgage Trust 2020-C55 | Certain Terms and Conditions |
| (other than the Class V and Class R Certificates) would have to voluntarily participate in the exchange. |
| |
Liquidation Loan Waterfall: | Following the liquidation of any mortgage loan or mortgaged property, the net liquidation proceeds generally will be applied (after reimbursement of advances and certain trust fund expenses), first, as a recovery of accrued interest, other than delinquent interest that was not advanced as a result of Appraisal Reduction Amounts, second, as a recovery of principal until all principal has been recovered, and then as a recovery of delinquent interest that was not advanced as a result of Appraisal Reduction Amounts. Please see “Description of the Certificates—Distributions—Application Priority of Mortgage Loan Collections or Whole Loan Collections” in the Preliminary Prospectus. |
| |
Control Eligible Certificates: | The Class G and Class H-RR Certificates. |
| |
Directing Certificateholder/ Controlling Class: | A directing certificateholder may be appointed by the “majority controlling class certificateholder”, which will be the holder(s) of a majority of the Controlling Class. The “Controlling Class” will be, as of any time of determination, the most subordinate Class of Control Eligible Certificates then outstanding that has an aggregate Certificate Balance (as notionally reduced by any Cumulative Appraisal Reduction Amounts allocable to such Class(es)) at least equal to 25% of the initial Certificate Balance of that Class; provided, however, that if at any time the Certificate Balances of the Certificates other than the Control Eligible Certificates have been reduced to zero as a result of principal payments on the Mortgage Loans, then the Controlling Class will be the most subordinate Class of Control Eligible Certificates that has a Certificate Balance greater than zero without regard to any Cumulative Appraisal Reduction Amounts. The Controlling Class as of the Closing Date will be the Class H-RR Certificates. |
| |
Control and Consultation: | The rights of various parties to replace the Special Servicer and approve or consult with respect to major actions of the Special Servicer will vary according to defined periods. A “Control Termination Event” will occur when (i) the Class G Certificates have a Certificate Balance (taking into account the application of any Cumulative Appraisal Reduction Amounts to notionally reduce the Certificate Balance of such Class) of less than 25% of the initial Certificate Balance of that Class or (ii) a holder of the Class G Certificates is the majority Controlling Class Certificateholder and has irrevocably waived its right, in writing, to exercise any of the rights of the Controlling Class Certificateholder and such rights have not been reinstated to a successor controlling class certificateholder as described below; provided that a Control Termination Event will not be deemed continuing in the event that the Certificate Balances of the Certificates other than the Control Eligible Certificates have been reduced to zero as a result of principal payments on the Mortgage Loans. A “Consultation Termination Event” will occur when (i) there is no Class of Control Eligible Certificates that has a then outstanding Certificate Balance at least equal to 25% of the initial Certificate Balance of that Class, in each case, without regard to the application of any Cumulative Appraisal Reduction Amounts; or (ii) a holder of the Class G Certificates is the majority Controlling Class Certificateholder and has irrevocably waived its right, in writing, to exercise any of the rights of the Controlling Class Certificateholder and such rights have not been reinstated to a successor controlling class certificateholder pursuant to the terms of the WFCM 2020-C55 pooling and servicing agreement; provided that no Consultation Termination Event resulting solely from the operation of clause (ii) will be deemed to have existed or be in continuance with respect to a successor holder of the Class G Certificates that has not irrevocably waived its right to exercise any of the rights of the Controlling Class Certificateholder; provided, however, that a Consultation Termination Event will not be deemed continuing in the event that the Certificate Balances of the Certificates other than the Control Eligible Certificates have been reduced to zero as a result of principal payments on the Mortgage Loans. If no Control Termination Event has occurred and is continuing, except with respect to the Excluded Loans (as defined below) with respect to the directing certificateholder (i) the directing certificateholder will be entitled to grant or withhold approval of asset status reports prepared, and material servicing actions proposed, by the Special Servicer, and (ii) the directing certificateholder will be entitled to terminate and replace the Special Servicer with or without cause, and appoint itself or another person as the successor special servicer. It will be a condition to such appointment that Fitch, KBRA and Moody’s (and any rating agency rating any securities backed by any pari passu companion loan(s) serviced under this transaction) confirm that the appointment would not result in a qualification, downgrade or withdrawal of any of their then-current ratings of Certificates (and any Certificates backed by any pari passu companion loan(s) serviced under this transaction). If a Control Termination Event has occurred and is continuing but no Consultation Termination Event has occurred and is continuing, the Special Servicer will be required to consult with the |
THE INFORMATION IN THIS STRUCTURAL AND COLLATERAL TERM SHEET IS NOT COMPLETE AND MAY BE AMENDED PRIOR TO THE TIME OF SALE. THIS TERM SHEET IS NOT AN OFFER TO SELL THESE SECURITIES AND IT IS NOT A SOLICITATION OF AN OFFER TO BUY THESE SECURITIES IN ANY JURISDICTION WHERE THE OFFER OR SALE IS NOT PERMITTED.
23
Wells Fargo Commercial Mortgage Trust 2020-C55 | Certain Terms and Conditions |
| directing certificateholder (other than with respect to Excluded Loans as to such party) in connection with asset status reports and material special servicing actions. If a Consultation Termination Event has occurred and is continuing, no directing certificateholder will be recognized or have any right to terminate the Special Servicer or approve, direct or consult with respect to servicing matters. With respect to each serviced whole loan, the rights of the directing certificateholder described above will be subject to the consultation rights of the holders of the related pari passu companion loans. Those consultation rights will generally extend to asset status reports and material special servicing actions involving the related whole loan, will be as set forth in the related intercreditor agreement, and will be in addition to the rights of the directing certificateholder in this transaction described above. With respect to each non-serviced whole loan, the applicable servicing agreement for the related controlling pari passu companion loan(s) generally grants (or will grant) the directing certificateholder under the related securitization control rights that may include the right to approve or disapprove various material servicing actions involving the related whole loan. The directing certificateholder for this securitization (so long as no Consultation Termination Event has occurred and is occurring) generally will nonetheless have the right to be consulted on a non-binding basis with respect to such actions. For purposes of the servicing of any such whole loan contemplated by this paragraph, the occurrence and continuance of a Control Termination Event or Consultation Termination Event under this securitization will not limit the control or other rights of the directing certificateholder (or equivalent) under the securitization of the related controlling pari passu companion loan(s). The control rights and consent and consultation rights described in the preceding paragraphs are subject to various limitations, conditions and exceptions as described in the Preliminary Prospectus. Notwithstanding any contrary description set forth above, in the event that, with respect to any mortgage loan, the majority controlling class certificateholder or the directing certificateholder is a Borrower Party, the majority controlling class certificateholder and the directing certificateholder will have no right to receive asset status reports or such other information as may be specified in the WFCM 2020-C55 pooling and servicing agreement, to grant or withhold approval of, or consult with respect to, asset status reports prepared, and material servicing actions proposed, by the Special Servicer, with respect to such mortgage loan, and such mortgage loan will be referred to as an “Excluded Loan” as to such party. In addition, notwithstanding any contrary description set forth above, in the event that, with respect to any mortgage loan, a controlling class certificateholder is a Borrower Party, such controlling class certificateholder will have no right to receive asset status reports or such other information as may be specified in the WFCM 2020-C55 pooling and servicing agreement with respect to such mortgage loan. “Borrower Party” means a borrower, a mortgagor or a manager of a mortgaged property, an Accelerated Mezzanine Loan Lender, or any Borrower Party Affiliate. “Accelerated Mezzanine Loan Lender” means a mezzanine lender under a mezzanine loan that has been accelerated or as to which foreclosure or enforcement proceedings have been commenced against the equity collateral pledged to secure such mezzanine loan. “Borrower Party Affiliate” means, with respect to a borrower, a mortgagor, a manager of a Mortgaged Property or an Accelerated Mezzanine Loan Lender, (x) any other person controlling or controlled by or under common control with such borrower, mortgagor, manager or Accelerated Mezzanine Loan Lender, as applicable, or (y) any other person owning, directly or indirectly, 25% or more of the beneficial interests in such borrower, mortgagor, manager or Accelerated Mezzanine Loan Lender. |
| |
Risk Retention Consultation Party: | A risk retention consultation party may be appointed by the holder or holders of more than 50% of the VRR Interest, by Certificate Balance. The holder of the majority of the VRR Interest will have a continuing right to appoint, remove or replace the risk retention consultation party in its sole discretion. This right may be exercised at any time and from time to time. Notwithstanding any contrary description set forth above, in the event that, with respect to any mortgage loan, the holder of the majority of the VRR Interest or the risk retention consultation party is a Borrower Party, such mortgage loan will be referred to as an “Excluded Loan” as to such party. Except with respect to an Excluded Loan as to such party, the risk retention consultation party will be entitled to consult with the Special Servicer, upon request of the risk retention consultation party, with respect to certain material servicing actions proposed by the Special Servicer. |
| |
Replacement of Special Servicer: | If a Control Termination Event has occurred and is continuing, the Special Servicer may be removed and replaced without cause upon the affirmative direction of certificate owners holding |
THE INFORMATION IN THIS STRUCTURAL AND COLLATERAL TERM SHEET IS NOT COMPLETE AND MAY BE AMENDED PRIOR TO THE TIME OF SALE. THIS TERM SHEET IS NOT AN OFFER TO SELL THESE SECURITIES AND IT IS NOT A SOLICITATION OF AN OFFER TO BUY THESE SECURITIES IN ANY JURISDICTION WHERE THE OFFER OR SALE IS NOT PERMITTED.
24
Wells Fargo Commercial Mortgage Trust 2020-C55 | Certain Terms and Conditions |
| not less than 66-2/3% of a certificateholder quorum, following a proposal from certificate owners holding not less than 25% of the appraisal-reduced voting rights of all Principal Balance Certificates. The certificateholders who initiate a vote on a termination and replacement of the Special Servicer without cause must cause Fitch, KBRA and Moody’s to confirm the then-current ratings of the Certificates (or decline to review the matter) and cause the payment of the fees and expenses incurred in the replacement. If no Control Termination Event has occurred and is continuing, the Special Servicer may be replaced by the directing certificateholder, subject to Fitch, KBRA and Moody’s (and any Rating Agency rating any securities backed by any pari passu companion loan(s) serviced under this transaction) confirming the then-current ratings of the Certificates (and any certificates backed by any pari passu companion loans serviced under this transaction) or declining to review the matter. In addition, if at any time the Operating Advisor determines, in its sole discretion exercised in good faith, that (i) the Special Servicer is not performing its duties as required under the pooling and servicing agreement in accordance with the Servicing Standard and (ii) the replacement of the Special Servicer would be in the best interest of the certificateholders as a collective whole, then, the Operating Advisor will have the right to recommend the replacement of the Special Servicer and will submit its formal recommendation to the Trustee and the Certificate Administrator (along with its rationale, its proposed replacement special servicer and other relevant information justifying its recommendation). The Operating Advisor’s recommendation to replace the Special Servicer must be confirmed by an affirmative vote of holders of Principal Balance Certificates evidencing at least a majority of a quorum of certificateholders (which, for this purpose, is the holders of Principal Balance Certificates that (i) evidence at least 20% of the Voting Rights (taking into account the application of any cumulative appraisal reduction amounts to notionally reduce the respective Certificate Balances) of all Principal Balance Certificates on an aggregate basis, and (ii) consist of at least three certificateholders or certificate owners that are not risk retention affiliated with each other). In the event the holders of Principal Balance Certificates evidencing at least a majority of a quorum of certificateholders elect to remove and replace the Special Servicer (which requisite affirmative votes must be received within 180 days of the posting of the notice of the Operating Advisor’s recommendation to replace the Special Servicer to the Certificate Administrator’s website), the Certificate Administrator will be required to receive a Rating Agency Confirmation from each of the Rating Agencies at that time. |
| |
Excluded Special Servicer: | In the event that, with respect to any mortgage loan, the Special Servicer is a Borrower Party, the Special Servicer will be required to resign as special servicer of such mortgage loan (referred to as an “excluded special servicer loan”). If no Control Termination Event has occurred and is continuing, the directing certificateholder will be entitled to appoint (and may replace with or without cause) a separate special servicer that is not a Borrower Party (referred to as an “excluded special servicer”) with respect to such excluded special servicer loan unless such excluded special servicer loan is also an excluded loan. Otherwise, upon resignation of the Special Servicer with respect to an excluded special servicer loan, the resigning Special Servicer will be required to use reasonable efforts to appoint the excluded special servicer. |
| |
Appraisal Remedy: | If the Class of Certificates comprising the Controlling Class loses its status as Controlling Class because of the application of an Appraisal Reduction Amount or Collateral Deficiency Amount, the holders of a majority of the voting rights of such Class may require the Special Servicer to order a second appraisal for any mortgage loan in respect of which an Appraisal Reduction Amount or Collateral Deficiency Amount has been applied. The Special Servicer must thereafter determine whether, based on its assessment of such second appraisal, any recalculation of the Appraisal Reduction Amount or Collateral Deficiency Amount is warranted, and, if so warranted, will recalculate such Appraisal Reduction Amount or Colleteral Deficiency Amount. Such Class will not be able to exercise any direction, control, consent and/or similar rights of the Controlling Class unless and until reinstated as the Controlling Class through such determination; and pending such determination, the rights of the Controlling Class will be exercised by the Control Eligible Certificates, if any, that would be the Controlling Class taking into account the subject appraisal reduction amount. |
| |
Sale of Defaulted Assets: | There will be no “fair value” purchase option. Instead, the WFCM 2020-C55 pooling and servicing agreement will authorize the Special Servicer to sell defaulted mortgage loans serviced by such Special Servicer to the highest bidder in a manner generally similar to sales of REO properties. The sale of a defaulted loan (other than a non-serviced whole loan) for less than par plus accrued interest and certain other fees and expenses owed on the loan will be subject to consent or consultation rights of the directing certificateholder, Operating Advisor and/or risk retention consultation party, as described in the Preliminary Prospectus. Generally speaking, the holder of a companion loan will have consent and/or consultation rights, as described in the Preliminary Prospectus. |
THE INFORMATION IN THIS STRUCTURAL AND COLLATERAL TERM SHEET IS NOT COMPLETE AND MAY BE AMENDED PRIOR TO THE TIME OF SALE. THIS TERM SHEET IS NOT AN OFFER TO SELL THESE SECURITIES AND IT IS NOT A SOLICITATION OF AN OFFER TO BUY THESE SECURITIES IN ANY JURISDICTION WHERE THE OFFER OR SALE IS NOT PERMITTED.
25
Wells Fargo Commercial Mortgage Trust 2020-C55 | Certain Terms and Conditions |
| With respect to any serviced whole loan, if such whole loan becomes a defaulted loan under the WFCM 2020-C55 pooling and servicing agreement, the Special Servicer will generally be required to sell both the mortgage loan and the related companion loan(s) as a single whole loan. With respect to the applicable servicing agreement governing the servicing of such whole loan generally provides (or is expected to provide) that, if the related pari passu companion loan(s) serviced under such agreement become a defaulted loan under such servicing agreement, then the related special servicer may offer to sell to any person (or may offer to purchase) for cash such whole loan during such time as such applicable pari passu companion loan(s) constitutes a defaulted loan under such servicing agreement. Generally speaking, in connection with any such sale, the related special servicer is required to sell both the mortgage loan and the related pari passu companion loan(s) (and, in some cases, any related subordinate companion loan) as a whole loan. The directing certificateholder for this securitization generally will have consent and/or consultation rights as the holder of an interest in the related mortgage loan, as described in the Preliminary Prospectus. The procedures for the sale of any whole loan that becomes a defaulted whole loan, and any associated consultation rights, are subject to various limitations, conditions and exceptions as described in the Preliminary Prospectus. |
| |
“As-Is” Appraisals: | Appraisals must be conducted on an “as-is” basis, and must be no more than 12 months old, for purposes of determining Appraisal Reduction Amounts and market value in connection with REO sales. Required appraisals may consist of updates of prior appraisals. Internal valuations by the Special Servicer are permitted if the principal balance of a mortgage loan is less than $2,000,000. |
| |
Operating Advisor: | The Operating Advisor will have certain review and consultation rights relating to the performance of the Special Servicer and with respect to its actions taken in connection with the resolution and/or liquidation of Specially Serviced Loans. With respect to each mortgage loan (other than a Non-Serviced Mortgage Loan) or serviced whole loan, the Operating Advisor will be responsible for: |
| | ● | reviewing the actions of the Special Servicer with respect to any Specially Serviced Loan; |
| | | |
| | ● | reviewing (i) all reports by the Special Servicer made available to Privileged Persons on the Certificate Administrator’s website and (ii) each Asset Status Report (as defined in the Preliminary Prospectus) (after the occurrence and during the continuance of an Operating Advisor Consultation Event (as defined below)) and Final Asset Status Report (as defined in the Preliminary Prospectus); |
| | | |
| | ● | recalculating and reviewing for accuracy and consistency with the WFCM 2020-C55 pooling and servicing agreement the mathematical calculations by the special servicer and the corresponding application of the non-discretionary portion of the applicable formulas required to be utilized in connection with Appraisal Reduction Amounts, Collateral Deficiency Amounts and net present value calculations used in the Special Servicer’s determination of what course of action to take in connection with the workout or liquidation of a Specially Serviced Loan; and |
| | | |
| | ● | preparing an annual report (if any mortgage loan (other than any Non-Serviced Mortgage Loan) or serviced whole loan was a Specially Serviced Loan at any time during the prior calendar year or an Operating Advisor Consultation Event (as defined below) occurred during the prior calendar year) that sets forth whether the Operating Advisor believes, in its sole discretion exercised in good faith, that the Special Servicer is operating in compliance with the Servicing Standard with respect to its performance of its duties under the pooling and servicing agreement with respect to Specially Serviced Loans (and, after the occurrence and continuance of an Operating Advisor Consultation Event (as defined below), with respect to major decisions on non-Specially Serviced Loans) during the prior calendar year on an “asset-level basis”. The Operating Advisor will identify (1) which, if any, standards the Operating Advisor believes, in its sole discretion exercised in good faith, the Special Servicer has failed to comply with and (2) any material deviations from the Special Servicer’s obligations under the pooling and servicing agreement with respect to the resolution or liquidation of any Specially Serviced Loan or REO Property (other than with respect to any REO Property related to any Non-Serviced Mortgage Loan). In preparing any Operating Advisor Annual Report (as defined in the Preliminary Prospectus), the Operating Advisor will not be required to report on instances of non-compliance with, or deviations from, the Servicing Standard or the Special Servicer’s obligations under the pooling and servicing agreement that the Operating Advisor determines, in its sole discretion exercised in good faith, to be immaterial. |
THE INFORMATION IN THIS STRUCTURAL AND COLLATERAL TERM SHEET IS NOT COMPLETE AND MAY BE AMENDED PRIOR TO THE TIME OF SALE. THIS TERM SHEET IS NOT AN OFFER TO SELL THESE SECURITIES AND IT IS NOT A SOLICITATION OF AN OFFER TO BUY THESE SECURITIES IN ANY JURISDICTION WHERE THE OFFER OR SALE IS NOT PERMITTED.
26
Wells Fargo Commercial Mortgage Trust 2020-C55 | Certain Terms and Conditions |
| With respect to each mortgage loan (other than any Non-Serviced Mortgage Loan) or serviced whole loan, after the Operating Advisor has received notice that an Operating Advisor Consultation Event (as defined below) has occurred and is continuing, in addition to the duties described above, the Operating Advisor will be required to perform the following additional duties: |
| | ● | to consult (on a non-binding basis) with the Special Servicer in respect of asset status reports and |
| | | | |
| | | ● | to consult (on a non-binding basis) with the Special Servicer with respect to “major decisions” processed by the Special Servicer. |
| An “Operating Advisor Consultation Event” will occur when the Certificate Balance of the H-RR Certificates (taking into account the application of any Cumulative Appraisal Reduction Amounts to notionally reduce the Certificate Balances of such Class) is 25% or less of the initial Certificate Balances of such Class. |
| |
Asset Representations Reviewer: | The Asset Representations Reviewer will be required to review certain delinquent mortgage loans after a specified delinquency threshold has been exceeded (an “Asset Review Trigger”) and the required percentage of certificateholders vote to direct a review of such delinquent loans. An Asset Review Trigger will occur when either (1) mortgage loans with an aggregate outstanding principal balance of 25.0% or more of the aggregate outstanding principal balance of all of the mortgage loans (including any REO loans (or a portion of any REO loan in the case of a whole loan)) held by the issuing entity as of the end of the applicable collection period are delinquent loans or (2) at least 15 mortgage loans are delinquent loans as of the end of the applicable collection period and the outstanding principal balance of such delinquent loans in the aggregate constitutes at least 20.0% of the aggregate outstanding principal balance of all of the mortgage loans (including any REO loans (or a portion of any REO loan in the case of a whole loan)) held by the issuing entity as of the end of the applicable collection period. See “Pooling and Servicing Agreement—The Asset Representations Reviewer—Asset Review” in the Preliminary Prospectus. The Asset Representations Reviewer may be terminated and replaced without cause. Upon (i) the written direction of certificateholders evidencing not less than 25% of the voting rights (without regard to the application of any Cumulative Appraisal Reduction Amounts) requesting a vote to terminate and replace the Asset Representations Reviewer with a proposed successor Asset Representations Reviewer that is an eligible asset representations reviewer, and (ii) payment by such holders to the Certificate Administrator of the reasonable fees and expenses to be incurred by the Certificate Administrator in connection with administering such vote, the Certificate Administrator will promptly provide notice to all certificateholders and the Asset Representations Reviewer of such request by posting such notice on its internet website, and by mailing such notice to all certificateholders and the Asset Representations Reviewer. Upon the written direction of certificateholders evidencing at least 75% of a certificateholder quorum (without regard to the application of any Cumulative Appraisal Reduction Amounts), the Trustee will terminate all of the rights and obligations of the Asset Representations Reviewer under the WFCM 2020-C55 pooling and servicing agreement by written notice to the Asset Representations Reviewer, and the proposed successor Asset Representations Reviewer will be appointed. See “Pooling and Servicing Agreement—The Asset Representations Reviewer” in the Preliminary Prospectus. |
| |
Dispute Resolution Provisions: | The mortgage loan sellers will be subject to the dispute resolution provisions set forth in the WFCM 2020-C55 pooling and servicing agreement to the extent those provisions are triggered with respect to any mortgage loan sold to the depositor by a mortgage loan seller and such mortgage loan seller will be obligated under the related mortgage loan purchase agreement to comply with all applicable provisions and to take part in any mediation or arbitration proceedings that may result. Generally, in the event that a Repurchase Request (as defined in the Preliminary Prospectus) is not “Resolved” (as defined below) within 180 days after the related mortgage loan seller receives such Repurchase Request, then the enforcing servicer will be required to send a notice to the “Initial Requesting Certificateholder” (if any) and the Certificate Administrator indicating the enforcing servicer’s intended course of action with respect to the Repurchase Request. If (a) the enforcing servicer’s intended course of action with respect to the Repurchase Request does not involve pursuing further action to exercise rights against the related mortgage loan seller with respect to the Repurchase Request and the Initial Requesting Certificateholder, if any, or any other certificateholder or certificate owner wishes to exercise its right to refer the matter to mediation (including non-binding arbitration) or arbitration, or (b) the enforcing servicer’s intended course of action is to pursue further action to exercise rights against the related mortgage loan seller with respect to the Repurchase Request but the Initial Requesting Certificateholder, if any, or any other certificateholder or certificate owner does not agree with the dispute resolution method selected by the enforcing servicer, then the Initial Requesting |
THE INFORMATION IN THIS STRUCTURAL AND COLLATERAL TERM SHEET IS NOT COMPLETE AND MAY BE AMENDED PRIOR TO THE TIME OF SALE. THIS TERM SHEET IS NOT AN OFFER TO SELL THESE SECURITIES AND IT IS NOT A SOLICITATION OF AN OFFER TO BUY THESE SECURITIES IN ANY JURISDICTION WHERE THE OFFER OR SALE IS NOT PERMITTED.
27
Wells Fargo Commercial Mortgage Trust 2020-C55 | Certain Terms and Conditions |
| Certificateholder, if any, or such other certificateholder or certificate owner may deliver a written notice to the Special Servicer indicating its intent to exercise its right to refer the matter to either mediation or arbitration. “Resolved” means, with respect to a Repurchase Request, (i) that the related Material Defect has been cured, (ii) the related mortgage loan has been repurchased in accordance with the related mortgage loan purchase agreement, (iii) a mortgage loan has been substituted for the related mortgage loan in accordance with the related mortgage loan purchase agreement, (iv) the applicable mortgage loan seller has made a Loss of Value Payment (as defined in the Preliminary Prospectus), (v) a contractually binding agreement is entered into between the enforcing servicer, on behalf of the issuing entity, and the related mortgage loan seller that settles the related mortgage loan seller’s obligations under the related mortgage loan purchase agreement or (vi) the related mortgage loan is no longer property of the issuing entity as a result of a sale or other disposition in accordance with the WFCM 2020-C55 pooling and servicing agreement. See “Pooling and Servicing Agreement—Dispute Resolution Provisions” in the Preliminary Prospectus. |
| |
Investor Communications: | The Certificate Administrator is required to include on any Form 10–D any request received from a certificateholder to communicate with other certificateholders related to certificateholders exercising their rights under the terms of the WFCM 2020-C55 pooling and servicing agreement. Any certificateholder wishing to communicate with other certificateholders regarding the exercise of its rights under the terms of the WFCM 2020-C55 pooling and servicing agreement will be able to deliver a written request signed by an authorized representative of the requesting investor to the Certificate Administrator. |
| |
Certain Fee Offsets: | If a workout fee is earned by the Special Servicer following a loan default with respect to any mortgage loan that it services, then certain limitations will apply based on modification fees paid by the borrower. The modification fee generally must not exceed 1% of the principal balance of the loan as modified in any 12-month period. In addition, if the loan re-defaults, any subsequent workout fee on that loan must be reduced by a portion of the modification fees paid by the borrower in the previous 12-months. Likewise, liquidation fees collected in connection with a liquidation or partial liquidation of a mortgage loan must be reduced by a portion of the modification fees paid by the borrower in the previous 12 months. |
| |
Deal Website: | The Certificate Administrator will be required to maintain a deal website, which will include, among other items: (a) summaries of asset status reports prepared by the Special Servicer, (b) inspection reports, (c) appraisals, (d) various “special notices” described in the Preliminary Prospectus, (e) the “Investor Q&A Forum”, (f) a voluntary “Investor Registry” and (g) the “Risk Retention Special Notices” tab. Investors may access the deal website following execution of a certification and confidentiality agreement. |
| |
Initial Majority Controlling Class Certificateholder: | It is expected that RREF IV-D WFCM 2020-C55 MOA-HRR, LLC or an affiliate will be the initial majority controlling class certificateholder. |
| |
Whole Loans: | Each of the mortgaged properties identified above under “IV. Characteristics of the Mortgage Pool—B. Summary of the Whole Loans” secures both a mortgage loan to be included in the trust fund and one or more other mortgage loans that will not be included in the trust fund, each of which will be pari passu or subordinate in right of payment with the mortgage loan included in the trust fund. We refer to each such group of mortgage loans as a “whole loan”. Such “—Summary of the Whole Loans” section includes further information regarding the various notes in each whole loan, the holders of such notes, the lead servicing agreement for each such whole loan, and the master servicer and special servicer under such lead servicing agreement. |
THE INFORMATION IN THIS STRUCTURAL AND COLLATERAL TERM SHEET IS NOT COMPLETE AND MAY BE AMENDED PRIOR TO THE TIME OF SALE. THIS TERM SHEET IS NOT AN OFFER TO SELL THESE SECURITIES AND IT IS NOT A SOLICITATION OF AN OFFER TO BUY THESE SECURITIES IN ANY JURISDICTION WHERE THE OFFER OR SALE IS NOT PERMITTED.
28
(THIS PAGE INTENTIONALLY LEFT BLANK)
THE INFORMATION IN THIS STRUCTURAL AND COLLATERAL TERM SHEET IS NOT COMPLETE AND MAY BE AMENDED PRIOR TO THE TIME OF SALE. THIS TERM SHEET IS NOT AN OFFER TO SELL THESE SECURITIES AND IT IS NOT A SOLICITATION OF AN OFFER TO BUY THESE SECURITIES IN ANY JURISDICTION WHERE THE OFFER OR SALE IS NOT PERMITTED.
29
Retail – Super Regional Mall | Loan #1 | Cut-off Date Balance: | | $82,945,946 |
5100 Kings Plaza | Kings Plaza | Cut-off Date LTV: | | 54.1% |
Brooklyn, NY 11234 | | U/W NCF DSCR: | | 3.06x |
| | U/W NOI Debt Yield: | | 10.7% |

THE INFORMATION IN THIS STRUCTURAL AND COLLATERAL TERM SHEET IS NOT COMPLETE AND MAY BE AMENDED PRIOR TO THE TIME OF SALE. THIS TERM SHEET IS NOT AN OFFER TO SELL THESE SECURITIES AND IT IS NOT A SOLICITATION OF AN OFFER TO BUY THESE SECURITIES IN ANY JURISDICTION WHERE THE OFFER OR SALE IS NOT PERMITTED.
30
Retail – Super Regional Mall | Loan #1 | Cut-off Date Balance: | | $82,945,946 |
5100 Kings Plaza | Kings Plaza | Cut-off Date LTV: | | 54.1% |
Brooklyn, NY 11234 | | U/W NCF DSCR: | | 3.06x |
| | U/W NOI Debt Yield: | | 10.7% |
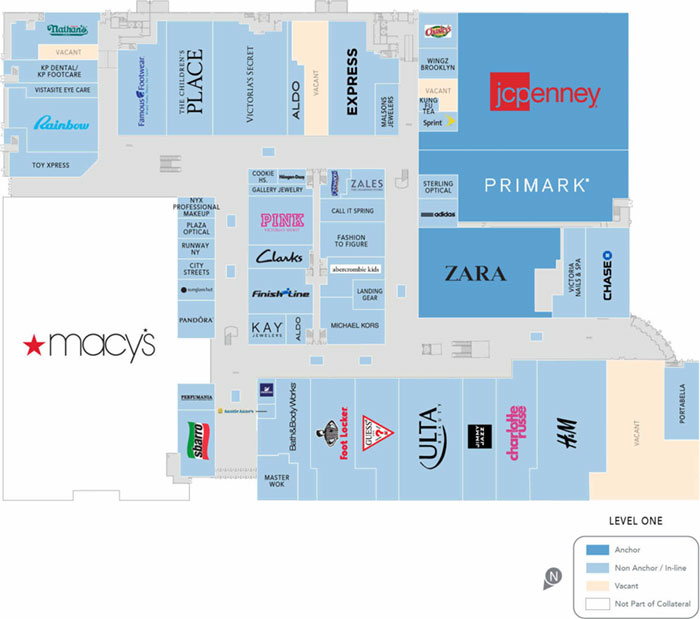
THE INFORMATION IN THIS STRUCTURAL AND COLLATERAL TERM SHEET IS NOT COMPLETE AND MAY BE AMENDED PRIOR TO THE TIME OF SALE. THIS TERM SHEET IS NOT AN OFFER TO SELL THESE SECURITIES AND IT IS NOT A SOLICITATION OF AN OFFER TO BUY THESE SECURITIES IN ANY JURISDICTION WHERE THE OFFER OR SALE IS NOT PERMITTED.
31
Retail – Super Regional Mall | Loan #1 | Cut-off Date Balance: | | $82,945,946 |
5100 Kings Plaza | Kings Plaza | Cut-off Date LTV: | | 54.1% |
Brooklyn, NY 11234 | | U/W NCF DSCR: | | 3.06x |
| | U/W NOI Debt Yield: | | 10.7% |
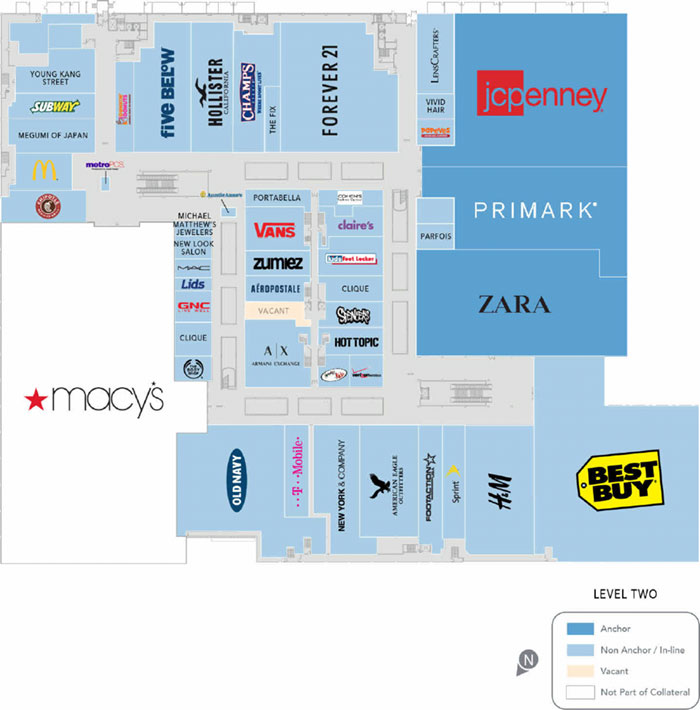
THE INFORMATION IN THIS STRUCTURAL AND COLLATERAL TERM SHEET IS NOT COMPLETE AND MAY BE AMENDED PRIOR TO THE TIME OF SALE. THIS TERM SHEET IS NOT AN OFFER TO SELL THESE SECURITIES AND IT IS NOT A SOLICITATION OF AN OFFER TO BUY THESE SECURITIES IN ANY JURISDICTION WHERE THE OFFER OR SALE IS NOT PERMITTED.
32
Retail – Super Regional Mall | Loan #1 | Cut-off Date Balance: | | $82,945,946 |
5100 Kings Plaza | Kings Plaza | Cut-off Date LTV: | | 54.1% |
Brooklyn, NY 11234 | | U/W NCF DSCR: | | 3.06x |
| | U/W NOI Debt Yield: | | 10.7% |
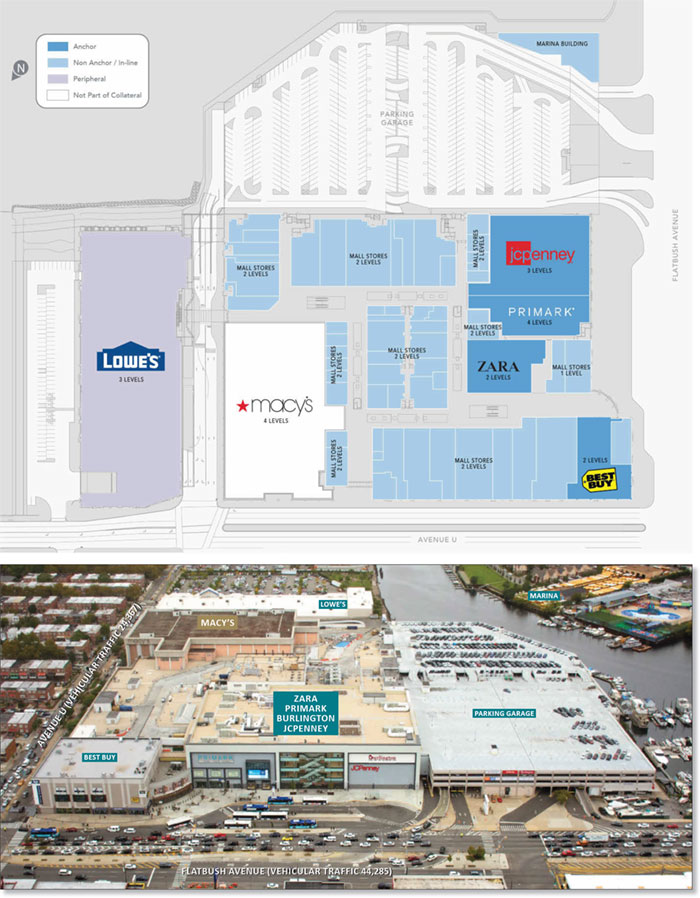
THE INFORMATION IN THIS STRUCTURAL AND COLLATERAL TERM SHEET IS NOT COMPLETE AND MAY BE AMENDED PRIOR TO THE TIME OF SALE. THIS TERM SHEET IS NOT AN OFFER TO SELL THESE SECURITIES AND IT IS NOT A SOLICITATION OF AN OFFER TO BUY THESE SECURITIES IN ANY JURISDICTION WHERE THE OFFER OR SALE IS NOT PERMITTED.
33
Retail – Super Regional Mall | Loan #1 | Cut-off Date Balance: | | $82,945,946 |
5100 Kings Plaza | Kings Plaza | Cut-off Date LTV: | | 54.1% |
Brooklyn, NY 11234 | | U/W NCF DSCR: | | 3.06x |
| | U/W NOI Debt Yield: | | 10.7% |
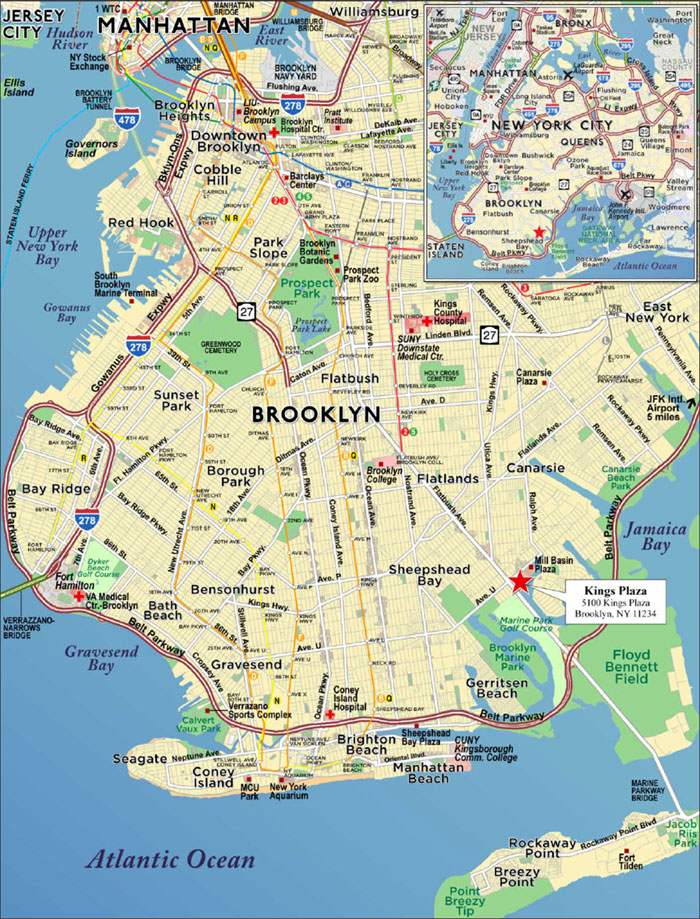
THE INFORMATION IN THIS STRUCTURAL AND COLLATERAL TERM SHEET IS NOT COMPLETE AND MAY BE AMENDED PRIOR TO THE TIME OF SALE. THIS TERM SHEET IS NOT AN OFFER TO SELL THESE SECURITIES AND IT IS NOT A SOLICITATION OF AN OFFER TO BUY THESE SECURITIES IN ANY JURISDICTION WHERE THE OFFER OR SALE IS NOT PERMITTED.
34
Mortgage Loan Information | | Mortgaged Property Information |
Mortgage Loan Seller: | Wells Fargo Bank, National Association | | Single Asset/Portfolio: | Single Asset |
Credit Assessment (KBRA/Fitch/Moody’s): | BBB-(sf)/BBBsf/Baa2(sf) | | Property Type – Subtype: | Retail – Super Regional Mall |
Original Principal Balance(1): | $82,945,946 | | Location: | Brooklyn, NY |
Cut-off Date Balance(1): | $82,945,946 | | Size: | 811,797 SF |
% of Initial Pool Balance: | 8.6% | | Cut-off Date Balance Per SF(1): | $599.90 |
Loan Purpose: | Refinance | | Maturity Date Balance Per SF(1): | $599.90 |
Borrower Sponsor: | The Macerich Partnership, L.P. | | Year Built/Renovated: | 1969 / 2018 |
Guarantor: | The Macerich Partnership, L.P. | | Title Vesting(5): | Fee / Leasehold |
Mortgage Rate: | 3.3588% | | Property Manager: | Self-managed |
Note Date: | December 3, 2019 | | Current Occupancy (As of): | 96.7% (10/31/2019) |
Seasoning: | 1 month | | YE 2018 Occupancy: | 97.9% |
Maturity Date: | January 1, 2030 | | YE 2017 Occupancy: | 96.6% |
IO Period: | 120 months | | YE 2016 Occupancy: | 95.2% |
Loan Term (Original): | 120 months | | YE 2015 Occupancy: | 92.3% |
Amortization Term (Original): | NAP | | As-Is Appraised Value: | $900,000,000 |
Loan Amortization Type: | Interest-only, Balloon | | As-Is Appraised Value Per SF: | $1,108.65 |
Call Protection(2): | L(25),GRTR 1% or YM(90),O(5) | | As-Is Appraisal Valuation Date: | October 17, 2019 |
Lockbox Type: | Hard/Springing Cash Management | | | |
Additional Debt(1)(3): | Yes | | Underwriting and Financial Information |
Additional Debt Type (Balance)(1)(3): | Pari Passu ($404,054,054); Mezzanine ($53,000,000) | | TTM NOI (9/30/2019): | $47,457,344 |
| | | YE 2018 NOI: | $42,088,187 |
| | | YE 2017 NOI: | $39,436,748 |
| | | YE 2016 NOI: | $42,598,711 |
| | | U/W Revenues: | $81,045,187 |
| | | U/W Expenses: | $29,004,262 |
Escrows and Reserves(4) | | U/W NOI: | $52,040,925 |
| Initial | Monthly | Cap | | U/W NCF: | $50,905,970 |
Taxes | $0 | Springing | NAP | | U/W DSCR based on NOI/NCF(1)(3): | 3.13x / 3.06x |
Insurance | $0 | Springing | NAP | | U/W Debt Yield based on NOI/NCF(1)(3): | 10.7% / 10.5% |
Replacement Reserve | $0 | Springing | (4) | | U/W Debt Yield at Maturity based on NOI/NCF(1)(3): | 10.7% / 10.5% |
TI/LC | $0 | Springing | (4) | | Cut-off Date LTV Ratio(1)(3): | 54.1% |
Ground Rent | $0 | Springing | NAP | | LTV Ratio at Maturity(1)(3): | 54.1% |
| | | | | | |
| | | | | | | |
Sources and Uses |
Sources | | | | | Uses | | | |
Original whole loan amount(1) | $487,000,000 | | 90.2% | | Loan payoff(6) | $428,649,060 | | 79.4% |
Mezzanine loan | 53,000,000 | | 9.8 | | Closing costs | 6,113,399 | | 1.1 |
| | | | | Return of equity | 105,237,541 | | 19.5 |
Total Sources | $540,000,000 | | 100.0% | | Total Uses | $540,000,000 | | 100.0% |
(1) | The Cut-off Date Balance Per SF, Maturity Date Balance Per SF, U/W DSCR based on NOI/NCF, U/W Debt Yield based on NOI/NCF, U/W Debt Yield at Maturity based on NOI/NCF, Cut-off Date LTV Ratio and LTV Ratio at Maturity numbers presented above are based on the Kings Plaza Whole Loan (as defined below). |
(2) | The Kings Plaza Borrower (as defined below) has the right to prepay the Kings Plaza Whole Loan in full, together with a yield maintenance premium equal to the greater of yield maintenance or 1% of the outstanding principal balance, at any time after the earlier to occur of (a) the end of the two-year period commencing on the closing date of the securitization of the last promissory note representing a portion of the Kings Plaza Whole Loan to be securitized and (b) February 1, 2023. The assumed lockout period of 25 payments is based on the closing date of this transaction in February 2020. |
(3) | The equity interest in the Kings Plaza Borrower has been pledged to secure mezzanine indebtedness with an outstanding principal balance of $53,000,000 (the “Kings Plaza Mezzanine Loan”). The Cut-off Date Balance Per SF, U/W Debt Yield Based on NOI, U/W DSCR based on NCF, and Cut-off Date LTV Ratio based on the Kings Plaza Whole Loan and the Kings Plaza Mezzanine Loan are $665, 9.6%, 1.73x, and 60.0%, respectively. See “Additional Secured Indebtedness (not including trade debts)” below. |
(4) | See “Escrows” section below. |
(5) | A portion of the Kings Plaza Property totaling approximately 10,278 square feet is subject to a ground lease with the City of New York (see “Ground Lease” section below). |
(6) | The Kings Plaza Property was previously securitized in the GSMS 2013-KING securitization trust. |
The Mortgage Loan. The mortgage loan (the “Kings Plaza Mortgage Loan”) is part of a whole loan (the “Kings Plaza Whole Loan”) that is evidenced by 12 pari passu promissory notes in the aggregate original principal amount of $487,000,000. The Kings Plaza Whole Loan is secured by a first priority mortgage encumbering the fee simple and leasehold interests in a super regional mall located in Brooklyn, New York (the “Kings Plaza Property”). The Kings Plaza Whole Loan was co-originated on December 3, 2019 by Wells Fargo Bank, National Association (“WFB”), Societe Generale Financial Corporation (“SocGen”) and JPMorgan Chase Bank, National Association (“JPMorgan”). The Kings Plaza Mortgage Loan is evidenced by the non-controlling promissory notes A-3-2 and A-3-3. The remaining notes are expected to be contributed to future securitization trusts or may be otherwise transferred at any time. The Kings
THE INFORMATION IN THIS STRUCTURAL AND COLLATERAL TERM SHEET IS NOT COMPLETE AND MAY BE AMENDED PRIOR TO THE TIME OF SALE. THIS TERM SHEET IS NOT AN OFFER TO SELL THESE SECURITIES AND IT IS NOT A SOLICITATION OF AN OFFER TO BUY THESE SECURITIES IN ANY JURISDICTION WHERE THE OFFER OR SALE IS NOT PERMITTED.
35
Retail – Super Regional Mall | Loan #1 | Cut-off Date Balance: | | $82,945,946 |
5100 Kings Plaza | Kings Plaza | Cut-off Date LTV: | | 54.1% |
Brooklyn, NY 11234 | | U/W NCF DSCR: | | 3.06x |
| | U/W NOI Debt Yield: | | 10.7% |
Plaza Whole Loan is expected to be initially serviced pursuant to the pooling and servicing agreement for the Benchmark 2020-B16 securitization. Following the securitization of Note A-1-1, the Kings Plaza Whole Loan will be serviced under the pooling and servicing agreement governing such securitization. See “Description of the Mortgage Pool—The Whole Loans—The Non-Serviced Pari Passu Whole Loans“ and “Pooling and Servicing Agreement—Servicing of the Non-Serviced Mortgage Loans” in the Preliminary Prospectus.
Note Summary
Note | Original Balance | Cut-off Date Balance | Note Holder | Controlling Piece |
A-1-1 | $70,000,000 | $70,000,000 | JPMorgan | Yes |
A-1-2 | $50,000,000 | $50,000,000 | Benchmark 2020-B16(1) | No |
A-1-3 | $30,000,000 | $30,000,000 | JPMorgan | No |
A-1-4 | $21,108,108 | $21,108,108 | JPMorgan | No |
A-2-1 | $60,000,000 | $60,000,000 | BBCMS 2020-C6(2) | No |
A-2-2 | $50,000,000 | $50,000,000 | SocGen | No |
A-2-3 | $35,000,000 | $35,000,000 | SocGen | No |
A-2-4 | $12,945,946 | $12,945,946 | SocGen | No |
A-3-1 | $50,000,000 | $50,000,000 | BANK 2020-BNK25(3) | No |
A-3-2 | $50,000,000 | $50,000,000 | WFCM 2020–C55 | No |
A-3-3 | $32,945,946 | $32,945,946 | WFCM 2020–C55 | No |
A-3-4 | $25,000,000 | $25,000,000 | BANK 2020-BNK25(3) | No |
Total | $487,000,000 | $487,000,000 | | |
(1) | Benchmark 2020-B16 is expected to close on or about February 12, 2020. |
(2) | BBCMS 2020-C6 is expected to close on or about February 19, 2020. |
(3) | BANK 2020-BNK25 is expected to close on or about February 13, 2020. |
The Borrowers and Borrower Sponsor. The borrowers are Brooklyn Kings Plaza LLC and Kings Plaza Ground Lease LLC (collectively, the “Kings Plaza Borrower”), each organized as a Delaware limited liability company and structured to be bankruptcy remote with two independent directors. Legal counsel to the borrower delivered a non-consolidation opinion in connection with the origination of the Kings Plaza Whole Loan. The borrower sponsor and non-recourse carve-out guarantor of the Kings Plaza Whole Loan is The Macerich Partnership, L.P. (the “Kings Plaza Guarantor”). The Macerich Partnership, L.P. is part of the parent organization The Macerich Company (“Macerich”). Founded in 1964, Macerich has a portfolio containing 47 properties in 15 states with a large concentration in California, Arizona and New York. Additionally, Macerich (NYSE:MAC), an S&P 500 company, reported total revenues of approximately $960 million as of December 31, 2018 and approximately $9.0 billion in total assets under management.
The Property. The Kings Plaza Property contains 811,797 square feet of a larger four-story super regional mall containing 1,146,035 square feet. Built in 1969 and renovated in 2018, the Kings Plaza Property is situated on a 19.1-acre parcel and also contains total of 3,739 parking spaces (including a parking garage), resulting in a parking ratio of approximately 4.6 spaces per 1,000 square feet. A portion of the Kings Plaza Property totaling approximately 10,278 square feet is subject to a ground lease with the City of New York as the ground lessor (see “Ground Lease” section below). The Kings Plaza Property was 96.7% occupied as of October 31, 2019 and has averaged 95.4% occupancy since 2012. For the trailing 12-month period ending September 30, 2019, the Kings Plaza Property reported comparable sales for in-line tenants less than 10,000 square feet of approximately $753 per square foot, which is up approximately 2.6% from full year 2018 ($734 per square foot) and 9.9% from full year 2017 ($685 per square foot)(see “Historical Sales” table below).
According to the appraisal, the Kings Plaza Property is the largest enclosed shopping center in Brooklyn. The Kings Plaza Property is anchored by Primark, Best Buy, Lowe’s Home Centers, Burlington, JCPenney and Macy’s (Macy’s is not part of the collateral) with additional major tenants including H&M, Old Navy, Zara, ULTA Beauty and Victoria’s Secret. According to the appraisal, the Kings Plaza Macy’s store was selected as one of Macy’s “Growth 100” locations for 2020 where Macy’s is experimenting with new concepts and improving store fixtures and facilities. Forever 21 currently occupies a 22,828 square foot space at the Kings Plaza Property but was underwritten as vacant due to a September 2019 Chapter 11 bankruptcy filing. Forever 21 has been in occupancy at the Kings Plaza Property since 2010, is currently open for business and has a lease expiration date of January 31, 2020.
Since acquiring the property in 2012, the borrower sponsor has invested approximately $290.3 million in capital improvements including renovations of the mall and parking garage, leasing capital and power plant upgrades. In mid-2016, the borrower sponsor recaptured the former Sears box and completed an approximately $144.7 million redevelopment with a four-story glass atrium, new façade, exterior improvements and new entry with connections to all four levels. The redeveloped space re-opened in summer 2018 and comprises retailers including Primark (the first location in Brooklyn), Zara, Burlington and JCPenney. In 2014-2015, the Kings Plaza Property underwent approximately $22.0 million in interior renovations, including LED lighting, new flooring, improved ambient lighting, new signage, updated seating areas and security upgrades.
The Kings Plaza Property includes a stand-alone power plant located on the roof, which provides all electricity to the shopping center. Tenants at the Kings Plaza Property purchase their utilities directly from the power plant at prevailing Consolidated Edison (ConEd) rates and due to operating cost efficiencies, expenses are kept below the billed rates. In 2019, the borrower sponsor completed a two-year project totaling approximately $17.5 million, which allowed the power plant to interconnect with the local ConEd grid. This
THE INFORMATION IN THIS STRUCTURAL AND COLLATERAL TERM SHEET IS NOT COMPLETE AND MAY BE AMENDED PRIOR TO THE TIME OF SALE. THIS TERM SHEET IS NOT AN OFFER TO SELL THESE SECURITIES AND IT IS NOT A SOLICITATION OF AN OFFER TO BUY THESE SECURITIES IN ANY JURISDICTION WHERE THE OFFER OR SALE IS NOT PERMITTED.
36
Retail – Super Regional Mall | Loan #1 | Cut-off Date Balance: | | $82,945,946 |
5100 Kings Plaza | Kings Plaza | Cut-off Date LTV: | | 54.1% |
Brooklyn, NY 11234 | | U/W NCF DSCR: | | 3.06x |
| | U/W NOI Debt Yield: | | 10.7% |
interconnection allows the Kings Plaza Property to export its surplus electric capacity during peak load demands. This system went live in July 2019 and generates participation revenue as well as operating cost savings through reduced man-hours and engine operation.
The following table presents certain information relating to the tenancy at the Kings Plaza Property:
Major Tenants
Tenant Name | Credit Rating
(Fitch/ Moody’s/
S&P)(1) | Tenant NRSF | % of
NRSF | | Annual U/W
Base Rent
PSF(2) | Annual
U/W Base
Rent(2) | % of
Total
Annual
U/W
Base
Rent | Lease
Expiration
Date | Extension
Options | Termination
Option
(Y/N) |
Non-Collateral Anchor Tenant | | | | | | | | | | |
Macy’s | BBB/Baa3/BBB- | 339,000 | | | ANCHOR-OWNED – NOT PART OF THE COLLATERAL |
| | | | | | |
Anchor Tenants – Collateral | | | | | | | | | | |
Primark | NR/NR/NR | 102,805 | 12.7% | | $35.17 | $3,615,390 | 9.2% | | 7/31/2038 | 3, 5-year | Y(3) |
Best Buy | NR/Baa1/BBB | 53,371 | 6.6% | | $52.80 | $2,817,989 | 7.2% | | 1/31/2032 | None | N |
Lowe’s Home Centers | NR/Baa1/BBB+ | 114,000 | 14.0% | | $19.30 | $2,200,000 | 5.6% | | 5/31/2028 | (4) | N |
Burlington | BB+/NR/BB+ | 55,078 | 6.8% | | $22.25 | $1,225,485 | 3.1% | | 7/31/2028 | 3, 5-year | N |
JCPenney(5) | CCC+/Caa3/CCC | 94,895 | 11.7% | | $7.57(5) | $718,054(5) | 1.8% | | 7/31/2038 | 4, 5-year | N |
Total Anchor Tenants | | 420,149 | 51.8% | | $25.17 | $10,576,918 | 27.0% | | | | |
| | | | | | | | | | | |
Major Tenants | | | | | | | | | | | |
H&M | NR/NR/NR | 25,151 | 3.1% | | $88.44 | $2,224,409 | 5.7% | | 1/31/2024 | 1, 5-year | N |
Old Navy | NR/Baa2/BB | 18,256 | 2.2% | | $68.94 | $1,258,638 | 3.2% | | 1/31/2025 | None | N |
Zara | NR/NR/NR | 33,771 | 4.2% | | $34.22 | $1,155,688 | 2.9% | | 7/31/2028 | 1, 5-year | N |
ULTA Beauty | NR/NR/NR | 10,924 | 1.3% | | $82.50 | $901,230 | 2.3% | | 10/31/2027 | 1, 5-year | N |
Victoria’s Secret | NR/Ba2/BB- | 12,034 | 1.5% | | $69.60 | $837,566 | 2.1% | | 1/31/2023 | None | N |
Total Major Tenants | 100,136 | 12.3% | | $63.69 | $6,377,530 | 16.3% | | | | |
| | | | | | | | | | |
Non-Major Tenants(6) | 264,831 | 32.6% | | $83.98 | $22,239,665 | 56.7% | | | | |
| | | | | | | | | | |
Occupied Collateral Total | 785,116 | 96.7% | | $49.92 | 39,194,113 | 100.0% | | | | |
| | | | | | | | | | |
Vacant Space(7) | 26,681 | 3.3% | | | | | | | | |
| | | | | | | | | | |
Collateral Total | 811,797 | 100.0% | | | | | | | | |
| | | | | | | | | | | |
(1) | Certain ratings are those of the parent company whether or not the parent guarantees the lease. |
(2) | Annual U/W Base Rent PSF and Annual U/W Base Rent shown include (i) contractual rent bumps through February 2021 totaling $1,139,421 and (ii) percent-in-lieu totaling $1,189,076 (for three tenants including JCPenney, Charlotte Russe and Parfois). The lender’s underwriting gave separate credit totaling $735,253 for straight-line rent averaging for investment grade tenants including Best Buy, Old Navy, Michael Kors, Chase, Vans, Verizon Wireless, Haagen-Dazs, Starbucks Coffee and Aeropostale (see “Operating History and Underwritten Net Cash Flow” section below). |
(3) | Primark has the right to terminate its lease on July 7, 2028 with 12 months’ notice provided that, as of the termination date, (i) the Primark tenant is not in default and (ii) there is not another Primark store within a defined market area set forth in the lease. |
(4) | Lowe’s Home Centers has 5, 5-year renewal options and one 47-month renewal option. |
(5) | Per JCPenney’s lease, the tenant’s base rent is equal to 5.0% of the tenant’s net retail sales. JCPenney’s underwritten base rent is on 5.0% of the tenant’s sales for the 12-month period ending September 30, 2019. JCPenney’s lease commenced in July 2018. |
(6) | Includes All Seasons Marine Corp. which is a ground lease tenant and has no underwritten base rent. |
(7) | Forever 21 currently occupies a 22,828 square foot space at the Kings Plaza Property but was underwritten as vacant. Forever 21 has been in occupancy at the Kings Plaza Property since 2010, is currently open for business and has a lease expiring in January 2020. The retailer filed for Chapter 11 bankruptcy in September 2019. |
THE INFORMATION IN THIS STRUCTURAL AND COLLATERAL TERM SHEET IS NOT COMPLETE AND MAY BE AMENDED PRIOR TO THE TIME OF SALE. THIS TERM SHEET IS NOT AN OFFER TO SELL THESE SECURITIES AND IT IS NOT A SOLICITATION OF AN OFFER TO BUY THESE SECURITIES IN ANY JURISDICTION WHERE THE OFFER OR SALE IS NOT PERMITTED.
37
Retail – Super Regional Mall | Loan #1 | Cut-off Date Balance: | | $82,945,946 |
5100 Kings Plaza | Kings Plaza | Cut-off Date LTV: | | 54.1% |
Brooklyn, NY 11234 | | U/W NCF DSCR: | | 3.06x |
| | U/W NOI Debt Yield: | | 10.7% |
The following table presents certain information relating to the historical sales at the Kings Plaza Property:
Historical Sales(1)
| 2015 (PSF) | 2016 (PSF) | 2017 (PSF) | 2018 (PSF) | TTM
September
2019 Sales
(Gross) | TTM
September
2019 Sales
(PSF) | Occupancy
Cost(2) |
Lowe’s Home Center | $406 | $398 | $396 | $390 | $44,601,794 | $391 | 6.3% |
H&M | $587 | $601 | $544 | $459 | $11,101,789 | $441 | 19.2% |
Victoria’s Secret | $839 | $771 | $677 | $704 | $8,479,695 | $705 | 20.5% |
Old Navy | $454 | $435 | $445 | $412 | $7,352,403 | $403 | 19.6% |
JCPenney(3) | NAP | NAP | NAP | NAP | $14,361,075 | $159 | 9.8% |
ULTA Beauty(4) | NAP | NAP | NAP | $593 | $6,960,000 | $637 | 19.3% |
Zara(5) | NAP | NAP | NAP | NAP | $17,275,825 | $512 | 7.3% |
| | | | | | | |
Comparable In-Line Sales (<10,000 SF) | $695 | $718 | $685 | $734 | $137,113,597 | $753 | 19.0% |
(1) | Information obtained from the borrower and underwritten rent roll. |
(2) | Occupancy costs shown are based on each tenant’s actual base rent and reimbursements for the trailing 12-month period ending September 30, 2019. |
(3) | JCPenney’s lease commenced in July 2018. |
(4) | ULTA Beauty’s lease commenced in October 2017. |
(5) | Zara’s lease commenced in September 2018. |
The following table presents certain information relating to the lease rollover schedule at the Kings Plaza Property:
Lease Expiration Schedule(1)(2)
Year Ending
December 31, | No. of
Leases
Expiring | Expiring
NRSF | % of
Total
NRSF | Cumulative
Expiring
NRSF | Cumulative
% of Total
NRSF | Annual
U/W
Base Rent | % of Total
Annual
U/W Base
Rent(3) | Annual
U/W
Base Rent
PSF(3)(4) |
MTM | 1 | 1,260 | 0.2% | 1,260 | 0.2% | $0 | 0.0% | $0.00 |
2020(5) | 40 | 50,406 | 6.2% | 51,666 | 6.4% | $3,051,598 | 7.8% | $60.54 |
2021 | 13 | 21,346 | 2.6% | 73,012 | 9.0% | $1,511,585 | 3.9% | $70.81 |
2022 | 19 | 26,624 | 3.3% | 99,636 | 12.3% | $2,485,936 | 6.3% | $93.37 |
2023 | 13 | 24,161 | 3.0% | 123,797 | 15.2% | $2,299,178 | 5.9% | $95.16 |
2024 | 11 | 43,309 | 5.3% | 167,106 | 20.6% | $3,868,632 | 9.9% | $89.33 |
2025 | 9 | 40,150 | 4.9% | 207,256 | 25.5% | $3,153,268 | 8.0% | $78.54 |
2026 | 13 | 41,603 | 5.1% | 248,859 | 30.7% | $3,894,646 | 9.9% | $93.61 |
2027 | 8 | 29,981 | 3.7% | 278,840 | 34.3% | $2,567,137 | 6.5% | $85.63 |
2028 | 10 | 219,491 | 27.0% | 498,331 | 61.4% | $6,129,071 | 15.6% | $27.92 |
2029 | 13 | 35,714 | 4.4% | 534,045 | 65.8% | $3,081,629 | 7.9% | $86.29 |
2030 | 0 | 0 | 0.0% | 534,045 | 65.8% | $0 | 0.0% | $0.00 |
Thereafter | 3 | 251,071 | 30.9% | 785,116 | 96.7% | $7,151,433 | 18.2% | $28.48 |
Vacant(6) | 0 | 26,681 | 3.3% | 811,797 | 100.0% | $0 | 0.0% | NAP |
Total/Weighted Average | 153 | 811,797 | 100.0% | | | $39,194,113 | 100.0% | $49.92 |
(1) | Information obtained from the underwritten rent roll. |
(2) | Certain tenants may have lease termination options that are exercisable prior to the originally stated expiration date of the subject lease and that are not considered in the Lease Expiration Schedule. |
(3) | Annual U/W Base Rent PSF and Annual U/W Base Rent shown include (i) contractual rent bumps through February 2021 totaling $1,139,421 and (ii) percent-in-lieu totaling $1,189,076 (for three tenants including JCPenney, Charlotte Russe and Parfois). |
(4) | Total/Weighted Average Annual U/W Base Rent and Annual U/W Base Rent PSF exclude vacant space. |
(5) | Includes All Seasons Marine Corp, which is a ground lease tenant at the Kings Plaza Property and has no underwritten base rent. |
(6) | Forever 21 currently occupies a 22,828 square foot space at the Kings Plaza Property but was underwritten as vacant. Forever 21 has been in occupancy at the Kings Plaza Property since 2010, is currently open for business and has a lease expiring in January 2020. The retailer filed for Chapter 11 bankruptcy in September 2019. |
THE INFORMATION IN THIS STRUCTURAL AND COLLATERAL TERM SHEET IS NOT COMPLETE AND MAY BE AMENDED PRIOR TO THE TIME OF SALE. THIS TERM SHEET IS NOT AN OFFER TO SELL THESE SECURITIES AND IT IS NOT A SOLICITATION OF AN OFFER TO BUY THESE SECURITIES IN ANY JURISDICTION WHERE THE OFFER OR SALE IS NOT PERMITTED.
38
Retail – Super Regional Mall | Loan #1 | Cut-off Date Balance: | | $82,945,946 |
5100 Kings Plaza | Kings Plaza | Cut-off Date LTV: | | 54.1% |
Brooklyn, NY 11234 | | U/W NCF DSCR: | | 3.06x |
| | U/W NOI Debt Yield: | | 10.7% |
The following table presents historical occupancy percentages at the Kings Plaza Property:
Historical Occupancy(1)
12/31/2015(2) | 12/31/2016(2) | 12/31/2017(2) | 12/31/2018(2) | 10/31/2019(3) |
92.3% | 95.2% | 96.6% | 97.9% | 96.7% |
(1) | Occupancy includes all signed leases and specialty leasing greater than 6 months. |
(2) | Information obtained from the borrower. |
(3) | Information obtained from the underwritten rent roll. Current occupancy includes temporary tenants which account for 9,065 square feet at the Kings Plaza Property. |
Operating History and Underwritten Net Cash Flow. The following table presents certain information relating to the historical operating statements and underwritten net cash flow at the Kings Plaza Property:
Cash Flow Analysis
| | 2016 | | 2017 | | 2018 | | TTM
9/30/2019(1) | | U/W(1) | | %(2) | | U/W $ per SF | |
Base Rent | | $32,606,560 | | $28,991,086 | | $33,095,904 | | $36,690,592 | | $38,005,038 | | 46.9% | | $46.82 | |
Straight-Line Rent(3) | | 0 | | 0 | | 0 | | 0 | | 735,253 | | 0.9 | | 0.91 | |
Grossed Up Vacant Space | | 0 | | 0 | | 0 | | 0 | | 2,227,628 | | 2.7 | | 2.74 | |
Gross Potential Rent | | 32,606,560 | | 28,991,086 | | $33,095,904 | | 36,690,592 | | $40,967,919 | | 50.5% | | $50.47 | |
Other Reimbursements | | 29,793,723 | | 28,145,401 | | 28,424,111 | | 30,047,457 | | 30,961,099 | | 38.2 | | 38.14 | |
% in Lieu/Percentage Rent(4) | | 293,672 | | 201,320 | | 735,279 | | 1,476,667 | | 2,195,355 | | 2.7 | | 2.70 | |
Gross Potential Income | | $62,693,955 | | $57,337,807 | | $62,255,294 | | $68,214,717 | | $74,124,373 | | 91.5% | | $91.31 | |
Bad Debt | | (265,786) | | (597,346) | | (612,614) | | (338,749) | | 0 | | 0.0 | | 0.00 | |
Vacancy & Credit Loss | | 0 | | 0 | | 0 | | 0 | | (3,678,863)(5) | | (5.0) | | (4.53) | |
Temporary Specialty Leasing | | 3,312,047 | | 2,761,118 | | 2,254,340 | | 2,411,429 | | 2,411,429 | | 3.0 | | 2.97 | |
Power Plant Income | | 0 | | 0 | | 0 | | 960,000 | | 1,804,680(6) | | 2.2 | | 2.22 | |
Other Income(7) | | 6,019,024 | | 5,421,663 | | 5,787,129 | | 5,068,245 | | 6,383,568 | | 7.9 | | 7.86 | |
Effective Gross Income | | $71,759,240 | | $64,923,243 | | $69,684,148 | | $76,315,642 | | $81,045,187 | | 100.0% | | $99.83 | |
| | | | | | | | | | | | | | | |
Real Estate Taxes | | 13,832,938 | | 10,772,620 | | 12,489,143 | | 14,498,321 | | 15,242,004 | | 18.8 | | 18.78 | |
Insurance | | 329,601 | | 266,664 | | 243,524 | | 273,222 | | 320,964 | | 0.4 | | 0.40 | |
Other Operating Expenses | | 14,997,990 | | 14,447,211 | | 14,863,294 | | 14,086,756 | | 13,441,294(8) | | 16.6 | | 16.56 | |
Total Operating Expenses | | $29,160,529 | | $25,486,495 | | $27,595,961 | | $28,858,298 | | $29,004,262 | | 35.8% | | $35.73 | |
| | | | | | | | | | | | | | | |
Net Operating Income | | $42,598,711 | | $39,436,748 | | $42,088,187 | | $47,457,344 | | $52,040,925 | | 64.2% | | $64.11 | |
Replacement Reserves | | 0 | | 0 | | 0 | | 0 | | 139,559 | | 0.2 | | 0.17 | |
TI/LC | | 0 | | 0 | | 0 | | 0 | | 995,395 | | 1.2 | | 1.23 | |
Net Cash Flow | | $42,598,711 | | $39,436,748 | | $42,088,187 | | $47,457,344 | | $50,905,970 | | 62.8% | | $62.71 | |
| | | | | | | | | | | | | | | |
NOI DSCR(9) | | 2.56x | | 2.37x | | 2.53x | | 2.85x | | 3.13x | | | | | |
NCF DSCR(9) | | 2.56x | | 2.37x | | 2.53x | | 2.85x | | 3.06x | | | | | |
NOI Debt Yield(9) | | 8.7% | | 8.1% | | 8.6% | | 9.7% | | 10.7% | | | | | |
NCF Debt Yield(9) | | 8.7% | | 8.1% | | 8.6% | | 9.7% | | 10.5% | | | | | |
(1) | Net Operating Income increased from 2018 to TTM 9/30/2019 and from TTM 9/30/2019 to U/W partially due to (i) leasing activity in 2018 representing 314,661 square feet of rentable area and approximately $9.2 million of base rent (including tenants related to the redevelopment of the former Sears space), (ii) leasing activity in 2019 representing 39,044 square feet of rentable area and approximately $2.5 million of base rent, (iii) Power Plant Income related to the power plant operated at the Kings Plaza Property that went live in July 2019, (iv) utility cost savings related to the power plant operated at the Kings Plaza Property (see “The Property” section above), (v) underwritten straight-line rent averaging for investment grade tenants ($735,253) and (vi) underwritten contractual rent bumps through February 2021 totaling $1,139,421. |
(2) | Represents (i) percent of Gross Potential Income for Vacancy & Credit Loss and (ii) percent of Effective Gross Income for all other fields. |
(3) | Represents straight-line rent averaging credit through the lesser of the loan term and remaining lease term for investment grade rated tenants including Best Buy, Old Navy, Michael Kors, Chase, Vans, Verizon Wireless, Haagen-Dazs, Starbucks Coffee and Aeropostale. |
(4) | Includes percent-in-lieu totaling $1,189,076 for JCPenney, Charlotte Russe and Parfois per the tenants’ leases as well as overage percentage rent totaling $1,006,279 related to 11 tenants. |
(5) | The underwritten economic vacancy is 5.0%. The Kings Plaza Property was 96.7% physically occupied as of October 31, 2019. |
(6) | Power Plant Income is underwritten to the borrower sponsor’s 2020 projection. The power plant system went live in July 2019 (see “The Property” section above). |
(7) | Other Income includes business development, storage income, ground rent income, parking income and other miscellaneous income. |
(8) | U/W Other Operating Expenses are lower than TTM 9/30/2019 partially due to underwritten cost savings related to the power plant operated at the Kings Plaza Property, which went live in July 2019 (see “The Property” section above). |
(9) | Metrics shown are based on the Kings Plaza Whole Loan. |
THE INFORMATION IN THIS STRUCTURAL AND COLLATERAL TERM SHEET IS NOT COMPLETE AND MAY BE AMENDED PRIOR TO THE TIME OF SALE. THIS TERM SHEET IS NOT AN OFFER TO SELL THESE SECURITIES AND IT IS NOT A SOLICITATION OF AN OFFER TO BUY THESE SECURITIES IN ANY JURISDICTION WHERE THE OFFER OR SALE IS NOT PERMITTED.
39
Retail – Super Regional Mall | Loan #1 | Cut-off Date Balance: | | $82,945,946 |
5100 Kings Plaza | Kings Plaza | Cut-off Date LTV: | | 54.1% |
Brooklyn, NY 11234 | | U/W NCF DSCR: | | 3.06x |
| | U/W NOI Debt Yield: | | 10.7% |
Appraisal. The appraiser concluded to an “as-is” Appraised Value of $900,000,000 as of October 17, 2019.
Environmental Matters. Based on a Phase I environmental report dated November 22, 2019, the environmental consultant did not identify any recognized environmental conditions at the Kings Plaza Property. The Phase I ESA consultant identified an open spill case affecting the Kings Plaza Property, and provided an opinion of probable cost for related remedial activity with an upper range cost estimate of $500,000. The borrower has submitted a groundwater remediation plan to the New York State Department of Environmental Conservation that is currently under review. Pursuant to the terms of the Kings Plaza Whole Loan documents, the borrower sponsor is required to continue to perform all remediation work required to obtain final, non-appealable regulatory closure.
Market Overview and Competition. The Kings Plaza Property is situated at the intersection of Flatbush Avenue and Avenue U in Brooklyn, New York. Primary access to the Kings Plaza Property is provided via the Belt Parkway, the region’s primary north-south route, approximately 3.9 miles northeast of the Kings Plaza Property. The Kings Plaza Property is located approximately 1.4 miles southeast of Kings Highway and 10.6 miles southwest of the John F. Kennedy International Airport. Per the appraisal, the estimated 2019 population within a one-, three- and five-mile radius of the Kings Plaza Property was 51,596, 601,221 and 1,737,025, respectively; and the average household income within the same radii was approximately $117,474, $89,529, and $78,194, respectively.
The Kings Plaza Property is located in the South Brooklyn submarket of the New York retail market. According to a third party market research report, as of the fourth quarter of 2019, the New York retail market had an inventory of approximately 593.4 million square feet with a 4.0% vacancy rate and average asking rents of $42.34 per square foot. As of August 2019, the South Brooklyn submarket had an inventory of approximately 42.9 million square foot with a 3.1% vacancy rate and average asking rents of approximately $42.31 per square foot.
The following table presents certain information relating to the primary competition for the Kings Plaza Property:
Competitive Set(1) |
| Distance to Subject
(mi.) | Property Type | Year Built/ Renovated | Total GLA | Total
Occupancy | Sales per
square foot | Anchors |
Kings Plaza | -- | Super Regional Mall | 1969/2018 | 811,797 | 96.7%(2) | $753(3) | Macy’s (non-collateral), Lowe’s Home Centers, Primark, JC Penney, Burlington, Best Buy, Forever 21, H&M, Zara |
Primary Competition | | | | | | | |
| | | | | | | | |
Gateway Center I & II | 6.4 | Power Center | 2001/NAP | 1,200,000 | 97.0% | $450 | BJ’s Wholesale Club, Burlington, Home Depot, JC Penney, Shoprite, Target |
Queens Center | 16.4 | Super Regional Mall | 1973/2004 | 1,172,180 | 99.0% | $1,430 | JC Penney, Macy’s |
| | | | | | | | |
Green Acres Mall | 14.3 | Super Regional Mall | 1956/2016 | 2,075,000 | 96.0% | $615 | JC Penney, Macy’s, Sears, Kohl’s (Vacant) |
Secondary Competition |
| |
Staten Island Mall | 19.0 | Super Regional Mall | 1972/2018 | 1,700,000 | 92.0% | NAV | JC Penney, Macy’s, Primark, Sears (Vacant) |
Roosevelt Field | 28.7 | Super Regional Mall | 1956/2014 | 2,330,000 | 97.0% | $1,200 | Bloomingdales, Dick’s Sporting Goods, JC Penney, Macy’s, Neiman Marcus, Nordstrom |
(1) | Information obtained from the appraisal. |
(2) | Occupancy as of October 31, 2019. |
(3) | Represents comparable in-line sales for stores less than 10,000 square feet for the trailing 12-month period ending September 30, 2019. |
Escrows.
Real Estate Taxes – The Kings Plaza Whole Loan documents require ongoing monthly real estate tax reserves in an amount equal to one-twelfth of the real estate taxes that the lender estimates will be payable during the next 12 months upon (i) the occurrence and continuance of a Cash Trap Event Period (see “Lockbox and Cash Management” section below) and (ii) the Kings Plaza Borrower failing to deliver evidence reasonably satisfactory to the lender that all taxes have been paid in a timely manner.
Insurance – The Kings Plaza Whole Loan documents require ongoing monthly insurance reserves in an amount equal to one-twelfth of the insurance premiums that the lender estimates will be payable during the next 12 months upon (i) the occurrence and continuance of a Cash Trap Event Period and (ii) the Kings Plaza Borrower failing to deliver evidence reasonably satisfactory to the lender that all insurance premiums have been paid in a timely manner.
Replacement Reserve – Upon the occurrence and continuance of a Cash Trap Event Period, the Kings Plaza Whole Loan documents require ongoing monthly replacement reserve deposits equal to the gross leasable area of the Kings Plaza Property (excluding the portion that is occupied by Lowe’s Home Centers and any other tenant that is required to pay for all repairs and maintenance costs for its entire leased premises) multiplied by $0.25 and divided by 12 (subject to a cap of 24 months’ collection).
THE INFORMATION IN THIS STRUCTURAL AND COLLATERAL TERM SHEET IS NOT COMPLETE AND MAY BE AMENDED PRIOR TO THE TIME OF SALE. THIS TERM SHEET IS NOT AN OFFER TO SELL THESE SECURITIES AND IT IS NOT A SOLICITATION OF AN OFFER TO BUY THESE SECURITIES IN ANY JURISDICTION WHERE THE OFFER OR SALE IS NOT PERMITTED.
40
Retail – Super Regional Mall | Loan #1 | Cut-off Date Balance: | | $82,945,946 |
5100 Kings Plaza | Kings Plaza | Cut-off Date LTV: | | 54.1% |
Brooklyn, NY 11234 | | U/W NCF DSCR: | | 3.06x |
| | U/W NOI Debt Yield: | | 10.7% |
TI/LC Reserve – Upon the occurrence and continuance of a Cash Trap Event Period, the Kings Plaza Whole Loan documents require ongoing monthly TI/LC reserve deposits equal to the gross leasable area of the Kings Plaza Property multiplied by $1.50 and divided by 12 (subject to a cap of 24 months’ collection).
Ground Rent Reserve – Upon the occurrence and continuance of a Cash Trap Event Period, the Kings Plaza Whole Loan documents require ongoing monthly deposits equal to one-twelfth of the annual amounts due by the King Plaza Borrower, as applicable, under the ground leases (see “Ground Lease” section below).
Lockbox and Cash Management. The Kings Plaza Whole Loan is structured with a hard lockbox and springing cash management. The Kings Plaza Borrower was required at loan origination to deliver tenant direction letters to the tenants at the Kings Plaza Property to deposit all rents and payments directly into a lender-controlled lockbox account. In addition, Kings Plaza Energy LLC (“KPE”) is required to deposit amounts received by KPE directly into a lockbox account established and maintained by KPE. The Kings Plaza Borrower, the related managers, and KPE are required to deposit any additional funds received into the applicable lockbox account within three business days of receipt. As long as no Cash Trap Event Period (as defined below) is continuing, all funds deposited into each lockbox account are required to be transferred to or at the direction of the Kings Plaza Borrower. Upon the commencement of a Cash Trap Event Period, all funds on deposit in the lockbox accounts are required to be swept on a weekly basis and on the second business day preceding each payment date into a lender-controlled cash management account.
A “Cash Trap Event Period” will commence upon the earlier of the following:
| (i) | an event of default under the Kings Plaza Whole Loan; |
| (ii) | the commencement of a Low Debt Service Period (as defined below); or |
| (iii) | the occurrence of an event of default under the Kings Plaza Mezzanine Loan (as defined below). |
A Cash Trap Event Period will end upon the occurrence of the following:
| ● | with regard to clause (i) above, the cure of such event of default; |
| ● | with regard to clause (ii) above, a Low Debt Service Period Cure Event (as defined below); or |
| ● | with regard to clause (iii) above, the lender has received notice from the applicable mezzanine lender that no event of default under the Kings Plaza Mezzanine Loan is continuing. |
A “Low Debt Service Period” will commence upon the earlier of the following:
| (i) | the net cash flow DSCR (based on a hypothetical 30-year amortization term) under the Kings Plaza Whole Loan being less than 1.43x, or |
| (ii) | the combined DSCR (based on a hypothetical 30-year amortization term) under the Kings Plaza Whole Loan and the Kings Plaza Mezzanine Loan being less than 1.25x. |
A “Low Debt Service Period Cure Event” will occur upon the occurrence of the following:
| ● | with regard to clause (i) above, the amortizing DSCR under the Kings Plaza Whole Loan being equal to or greater than 1.48x for two consecutive calendar quarters, or |
| ● | with regard to clause (ii) above, the combined amortizing DSCR under the Kings Plaza Whole Loan and the Kings Plaza Mezzanine Loan being equal to or greater than 1.30x for two consecutive calendar quarters. |
Property Management. The Kings Plaza Property is managed by Macerich Property Management Company, LLC, a Delaware limited liability company and an affiliate of the Kings Plaza Borrower.
Partial Release. Provided no event of default is ongoing, the Kings Plaza Borrower has the right to transfer and obtain a release of all or a portion of the parking garage structure, provided that, among other conditions outlined in the Kings Plaza Whole Loan documents:
| ● | the release parcel is transferred to an affiliate of the Kings Plaza Borrower; |
| ● | the Kings Plaza Borrower certifies to the lender that the release will not materially and adversely affect the use, value or revenue produced by the remaining improvements at the Kings Plaza Property; |
| ● | the net revenue generated by parking operations at the Kings Plaza Property is not diminished by more than a de minimis amount (other than temporary loss of net revenue during any construction); |
| ● | the remaining Kings Plaza Property constitutes a separate tax lot; |
| ● | the number of parking spaces at the Kings Plaza Property is not reduced below the number of parking spaces required to satisfy zoning requirements; |
| ● | the Kings Plaza Borrower certifies that the development of the release parcel will not materially impair the use of and/or the access to the garage by customers of the mall; and |
| ● | the development of the release parcel is restricted to the development for a non-retail use, provided, however, that up to 10% of the gross leasable area of the completed development may be used for retail purposes, provided, further, that none of the Kings Plaza Borrower (nor any affiliate) or Kings Plaza Guarantor will cause or solicit any existing retail tenant at the Kings Plaza Property to lease space at the release parcel. |
THE INFORMATION IN THIS STRUCTURAL AND COLLATERAL TERM SHEET IS NOT COMPLETE AND MAY BE AMENDED PRIOR TO THE TIME OF SALE. THIS TERM SHEET IS NOT AN OFFER TO SELL THESE SECURITIES AND IT IS NOT A SOLICITATION OF AN OFFER TO BUY THESE SECURITIES IN ANY JURISDICTION WHERE THE OFFER OR SALE IS NOT PERMITTED.
41
Retail – Super Regional Mall | Loan #1 | Cut-off Date Balance: | | $82,945,946 |
5100 Kings Plaza | Kings Plaza | Cut-off Date LTV: | | 54.1% |
Brooklyn, NY 11234 | | U/W NCF DSCR: | | 3.06x |
| | U/W NOI Debt Yield: | | 10.7% |
Real Estate Substitution. Not permitted.
Subordinate and Mezzanine Indebtedness. Concurrently with the funding of the Kings Plaza Loan, JPMorgan, SocGen and WFB funded a mezzanine loan in the amount of $53,000,000 (the “Kings Plaza Mezzanine Loan”), which is held by Prima Capital Advisors LLC. The Kings Plaza Mezzanine Loan is secured by the pledge of the equity interest in the Kings Plaza Borrower and is coterminous with the Kings Plaza Whole Loan. The Kings Plaza Mezzanine Loan accrues interest at a rate of 6.00000% per annum and following a five-year interest only period, is fully amortized by the maturity date of January 1, 2030 pursuant to a fixed amortization schedule.
Mezzanine Debt Summary |
| Original
Principal Balance | Interest Rate | Original
Term
(mos.) | Original
Amort. Term
(mos.) | Original IO Term
(mos.) | Total Debt UW NCF DSCR | Total Debt UW NOI Debt Yield | Total
Debt Cutoff Date LTV |
Kings Plaza Mezzanine Loan | $53,000,000 | 6.0000% | 120 | (1) | 60 | 1.73x | 9.6% | 60.0% |
(1) | Following a five-year interest only period, the Kings Plaza Mezzanine Loan will fully amortize by the maturity date of January 1, 2030 pursuant to a fixed amortization schedule. |
Ground Lease. A portion of the Kings Plaza Property, comprising the parking garage ingress/egress, the marina building (the “Marina Building”) and a portion of the ground under the parking garage covering a total of approximately 10,278 square feet, is subject to a ground lease with the City of New York. The original lease term expired on May 28, 2018 and the Kings Plaza Borrower exercised its 10-year extension option. Three 10-year, and one 9-year extension options remain with a fully-extended expiration date of May 28, 2067. The current annual ground rent payment is $122,957 through the payment date occurring in May 2028, at which point the ground rent will reset to $147,548 through the payment date in May 2038. All Seasons Marine Corp. (the “Ground Lease Subtenant”) currently subleases the Marina Building from the Kings Plaza Borrower. The initial ground sublease term expired in 2005, subsequent to which the Ground Lease Subtenant extended its sublease on a one- and two-year basis. A one-year extension through November 30, 2020 was recently executed by the Ground Lease Subtenant.
Terrorism Insurance. The Kings Plaza Whole Loan documents require that the “all risk” insurance policy required to be maintained by the borrower provides coverage for terrorism in an amount equal to the full replacement cost of the Kings Plaza Property, as well as business interruption insurance covering no less than the 24-month period following the occurrence of a casualty event, together with a 12-month extended period of indemnity (provided that if TRIPRA or a similar statute is not in effect, the Kings Plaza Borrower will not be obligated to pay terrorism insurance premiums in excess of two times the annual premium for the casualty and business interruption coverage).
THE INFORMATION IN THIS STRUCTURAL AND COLLATERAL TERM SHEET IS NOT COMPLETE AND MAY BE AMENDED PRIOR TO THE TIME OF SALE. THIS TERM SHEET IS NOT AN OFFER TO SELL THESE SECURITIES AND IT IS NOT A SOLICITATION OF AN OFFER TO BUY THESE SECURITIES IN ANY JURISDICTION WHERE THE OFFER OR SALE IS NOT PERMITTED.
42
(THIS PAGE INTENTIONALLY LEFT BLANK)
THE INFORMATION IN THIS STRUCTURAL AND COLLATERAL TERM SHEET IS NOT COMPLETE AND MAY BE AMENDED PRIOR TO THE TIME OF SALE. THIS TERM SHEET IS NOT AN OFFER TO SELL THESE SECURITIES AND IT IS NOT A SOLICITATION OF AN OFFER TO BUY THESE SECURITIES IN ANY JURISDICTION WHERE THE OFFER OR SALE IS NOT PERMITTED.
43
Office – CBD | Loan #2 | Cut-off Date Balance: | | $70,000,000 |
1633 Broadway New York, NY 10019 | 1633 Broadway | Cut-off Date LTV: U/W NCF DSCR: U/W NOI Debt Yield: | | 41.7% 3.83x 11.9% |

THE INFORMATION IN THIS STRUCTURAL AND COLLATERAL TERM SHEET IS NOT COMPLETE AND MAY BE AMENDED PRIOR TO THE TIME OF SALE. THIS TERM SHEET IS NOT AN OFFER TO SELL THESE SECURITIES AND IT IS NOT A SOLICITATION OF AN OFFER TO BUY THESE SECURITIES IN ANY JURISDICTION WHERE THE OFFER OR SALE IS NOT PERMITTED.
44
Office – CBD | Loan #2 | Cut-off Date Balance: | | $70,000,000 |
1633 Broadway New York, NY 10019 | 1633 Broadway | Cut-off Date LTV: U/W NCF DSCR: U/W NOI Debt Yield: | | 41.7% 3.83x 11.9% |
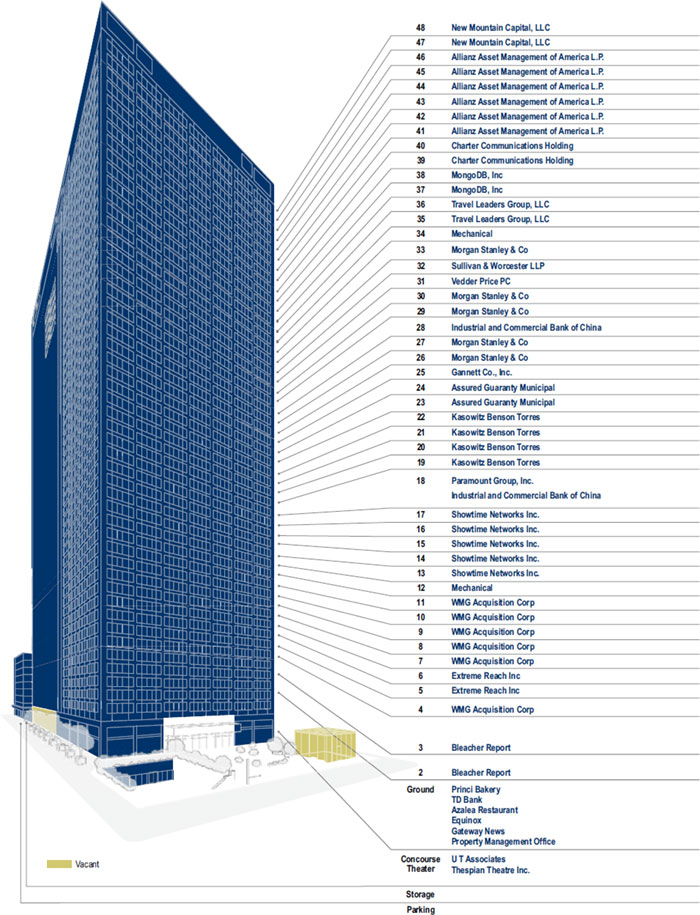
THE INFORMATION IN THIS STRUCTURAL AND COLLATERAL TERM SHEET IS NOT COMPLETE AND MAY BE AMENDED PRIOR TO THE TIME OF SALE. THIS TERM SHEET IS NOT AN OFFER TO SELL THESE SECURITIES AND IT IS NOT A SOLICITATION OF AN OFFER TO BUY THESE SECURITIES IN ANY JURISDICTION WHERE THE OFFER OR SALE IS NOT PERMITTED.
45
Office – CBD | Loan #2 | Cut-off Date Balance: | | $70,000,000 |
1633 Broadway New York, NY 10019 | 1633 Broadway | Cut-off Date LTV: U/W NCF DSCR: U/W NOI Debt Yield: | | 41.7% 3.83x 11.9% |
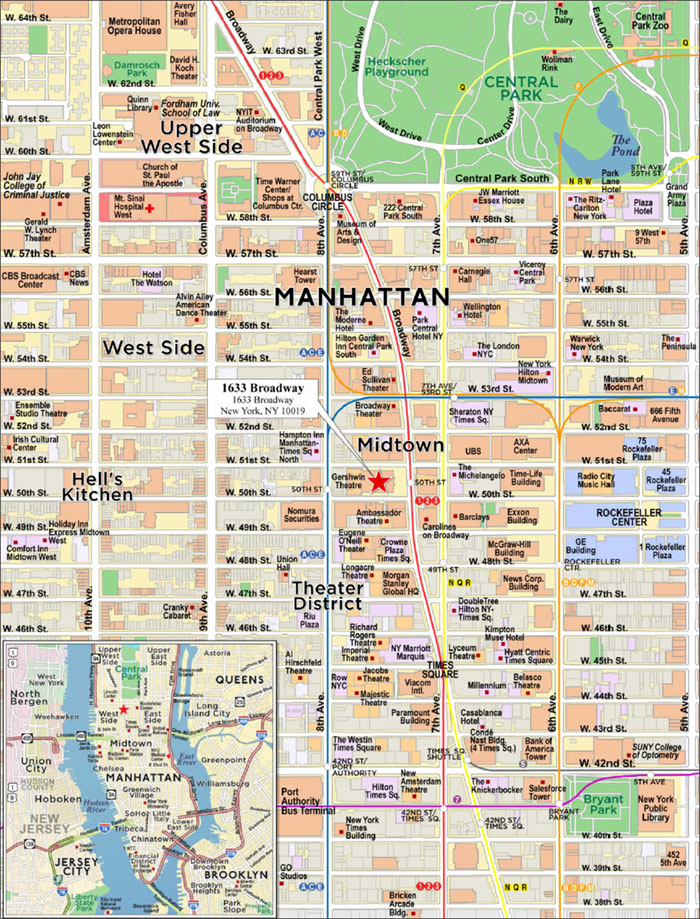
THE INFORMATION IN THIS STRUCTURAL AND COLLATERAL TERM SHEET IS NOT COMPLETE AND MAY BE AMENDED PRIOR TO THE TIME OF SALE. THIS TERM SHEET IS NOT AN OFFER TO SELL THESE SECURITIES AND IT IS NOT A SOLICITATION OF AN OFFER TO BUY THESE SECURITIES IN ANY JURISDICTION WHERE THE OFFER OR SALE IS NOT PERMITTED.
46
No. 2 – 1633 Broadway |
|
| Mortgage Loan Information | | Mortgaged Property Information |
Mortgage Loan Seller: | Wells Fargo Bank, National Association | | Single Asset/Portfolio: | Single Asset |
Credit Assessment (KBRA/Fitch/Moody’s): | A(sf)/BBB-sf/Baa2(sf) | | Property Type – Subtype: | Office – CBD |
Original Principal Balance(1): | $70,000,000 | | Location: | New York, NY |
Cut-off Date Balance(1): | $70,000,000 | | Size: | 2,561,512 SF |
% of Initial Pool Balance: | 7.3% | | Cut-off Date Balance Per SF(1): | $390.78 |
Loan Purpose: | Refinance | | Maturity Date Balance Per SF(1): | $390.78 |
Borrower Sponsor: | Paramount Group Operating Partnership LP | | Year Built/Renovated: | 1972/2013 |
Guarantor: | NAP | | Title Vesting: | Fee |
Mortgage Rate: | 2.9900% | | Property Manager: | Paramount Group Property-Asset Management LLC |
Note Date: | November 25, 2019 | | Current Occupancy (As of): | 98.4% (10/31/2019) |
Seasoning: | 2 months | | YE 2018 Occupancy: | 95.4% |
Maturity Date: | December 6, 2029 | | YE 2017 Occupancy: | 95.4% |
IO Period: | 120 months | | YE 2016 Occupancy: | 86.3% |
Loan Term (Original): | 120 months | | YE 2015 Occupancy: | 92.7% |
Amortization Term (Original): | NAP | | As-Is Appraised Value: | $2,400,000,000 |
Loan Amortization Type: | Interest-only, Balloon | | As-Is Appraised Value Per SF: | $936.95 |
Call Protection(2): | L(26),D(87),O(7) | | As-Is Appraisal Valuation Date: | October 24, 2019 |
| | | | | |
Lockbox Type: | Hard/Springing Cash Management | | Underwriting and Financial Information |
Additional Debt(1)(3): | Yes | | TTM NOI (9/30/2019): | $110,809,315 |
Additional Debt Type (Balance) (1) (3): | Pari Passu ($931,000,000)/ Subordinate ($249,000,000)/ Future Mezzanine/ Future Unsecured | | YE 2018 NOI: | $109,098,450 |
| | | YE 2017 NOI: | $94,190,007 |
| | | YE 2016 NOI: | $93,821,386 |
| | | U/W Revenues: | $190,585,947 |
| | | U/W Expenses: | $71,435,784 |
Escrows and Reserves(4) | | U/W NOI: | $119,150,163 |
| Initial | Monthly | Cap | | U/W NCF: | $116,677,727 |
Taxes | $0 | Springing | NAP | | U/W DSCR based on NOI/NCF(1): | 3.92x / 3.83x |
Insurance | $0 | Springing | NAP | | U/W Debt Yield based on NOI/NCF(1): | 11.9% / 11.7% |
Replacement Reserve | $0 | Springing | $1,024,605 | | U/W Debt Yield at Maturity based on NOI/NCF(1): | 11.9% / 11.7% |
TI/LC Reserve | $0 | Springing | $5,123,024 | | Cut-off Date LTV Ratio(1): | 41.7% |
Unfunded Obligations Reserve | $36,389,727 | $0 | NAP | | LTV Ratio at Maturity(1): | 41.7% |
| | | | | | |
| | | | | | |
Sources and Uses |
Sources | | | | Uses | | | |
Original senior loan amount | $1,001,000,000 | | 80.1% | Loan payoff | $1,052,884,467 | | 84.2% |
Subordinate companion loan amount | 249,000,000 | | 19.9 | Closing costs | 20,840,154 | | 1.7 |
| | | | Reserves | 36,389,727 | | 2.9 |
| | | | Return of equity | 139,885,652 | | 11.2 |
Total Sources | $1,250,000,000 | | 100.0% | Total Uses | $1,250,000,000 | | 100.0% |
(1) | The Cut-off Date Balance Per SF, Maturity Date Balance Per SF, U/W DSCR based on NOI/NCF, U/W Debt Yield based on NOI/NCF, U/W Debt Yield at Maturity based on NOI/NCF, Cut-off Date LTV Ratio and LTV Ratio at Maturity numbers presented above are based on the 1633 Broadway Senior Loan (as defined below). The U/W DSCR based on NOI/NCF, U/W Debt Yield based on NOI/NCF, U/W Debt Yield at Maturity based on NOI/NCF, Cut-off Date LTV Ratio and LTV Ratio at Maturity based upon the 1633 Broadway Whole Loan (as defined below) are 3.14x/3.07x, 9.5%/9.3%, 9.5%/9.3%, 52.1% and 52.1%, respectively. |
(2) | Defeasance of the 1633 Broadway Whole Loan is permitted, in whole or in part without any partial release, at any time after the earlier to occur of (a) the end of the two year period commencing on the closing date of the securitization of the last promissory note representing a portion of the 1633 Broadway Whole Loan to be securitized and (b) November 25, 2022. The assumed defeasance lockout period of 26 payments is based on the closing date of this transaction in February 2020. |
(3) | See “Subordinate and Mezzanine Indebtedness” and “Permitted Equityholder Debt” below for a further discussion of additional debt. |
(4) | See “Escrows” section. |
THE INFORMATION IN THIS STRUCTURAL AND COLLATERAL TERM SHEET IS NOT COMPLETE AND MAY BE AMENDED PRIOR TO THE TIME OF SALE. THIS TERM SHEET IS NOT AN OFFER TO SELL THESE SECURITIES AND IT IS NOT A SOLICITATION OF AN OFFER TO BUY THESE SECURITIES IN ANY JURISDICTION WHERE THE OFFER OR SALE IS NOT PERMITTED.
47
Office – CBD | Loan #2 | Cut-off Date Balance: | | $70,000,000 |
1633 Broadway New York, NY 10019 | 1633 Broadway | Cut-off Date LTV: U/W NCF DSCR: U/W NOI Debt Yield: | | 41.7% 3.83x 11.9% |
The Mortgage Loan. The mortgage loan (the “1633 Broadway Mortgage Loan”) is part of a whole loan (the “1633 Broadway Whole Loan”) that is evidenced by 34 pari passu senior promissory notes in the aggregate original principal amount of $1,001,000,000 (the “1633 Broadway Senior Loan”) and four pari passu subordinate promissory notes in the aggregate original principal amount of $249,000,000 (the “1633 Broadway Subordinate Companion Loan”). The 1633 Broadway Whole Loan is secured by a first priority fee mortgage encumbering a 48-story office tower located in New York, New York (the “1633 Broadway Property”). The 1633 Broadway Whole Loan was co-originated on November 25, 2019 by Goldman Sachs Bank USA, JPMorgan Chase Bank, National Association, DBR Investments Co. Limited and Wells Fargo Bank, National Association. The 1633 Broadway Mortgage Loan is evidenced by the non-controlling promissory notes A-4-C-4 and A-4-C-5 in the aggregate original principal amount of $70,000,000. The remaining 1633 Broadway Senior Loan pari passu notes are referred to herein as the “1633 Broadway Pari Passu Companion Loans”. As shown in the “Note Summary” table below, eight promissory notes in the original aggregate principal amount of $250,000,000 were contributed to the BWAY 2019-1633 securitization trust. The 1633 Broadway Whole Loan will be serviced pursuant to the trust and servicing agreement for the BWAY 2019-1633 securitization trust. See “Description of the Mortgage Pool—The Whole Loans—The Non-Serviced AB Whole Loans—The 1633 Broadway Whole Loan“ and “Pooling and Servicing Agreement—Servicing of the Non-Serviced Mortgage Loans” in the Preliminary Prospectus.
THE INFORMATION IN THIS STRUCTURAL AND COLLATERAL TERM SHEET IS NOT COMPLETE AND MAY BE AMENDED PRIOR TO THE TIME OF SALE. THIS TERM SHEET IS NOT AN OFFER TO SELL THESE SECURITIES AND IT IS NOT A SOLICITATION OF AN OFFER TO BUY THESE SECURITIES IN ANY JURISDICTION WHERE THE OFFER OR SALE IS NOT PERMITTED.
48
| Office – CBD | Loan #2 | Cut-off Date Balance: | | $70,000,000 |
1633 Broadway New York, NY 10019 | 1633 Broadway | Cut-off Date LTV: U/W NCF DSCR: U/W NOI Debt Yield: | | 41.7% 3.83x 11.9% |
Note Summary
Notes | Original Balance | Cut-off Date
Balance | Note Holder | Controlling
Piece |
1633 Broadway Senior Loan |
A-1-S-1 | $250,000 | $250,000 | BWAY 2019-1633 | No |
A-2-S-1 | $250,000 | $250,000 | BWAY 2019-1633 | No |
A-3-S-1 | $250,000 | $250,000 | BWAY 2019-1633 | No |
A-4-S-1 | $250,000 | $250,000 | BWAY 2019-1633 | No |
A-1-C-1 | $50,000,000 | $50,000,000 | Goldman Sachs Bank USA | No(3) |
A-1-C-2 | $45,000,000 | $45,000,000 | GSMS 2020-GC45 | No |
A-1-C-3 | $45,000,000 | $45,000,000 | Goldman Sachs Bank USA | No |
A-1-C-4 | $40,000,000 | $40,000,000 | Goldman Sachs Bank USA | No |
A-1-C-5 | $30,000,000 | $30,000,000 | Goldman Sachs Bank USA | No |
A-1-C-6 | $20,000,000 | $20,000,000 | Goldman Sachs Bank USA | No |
A-1-C-7 | $20,000,000 | $20,000,000 | Goldman Sachs Bank USA | No |
A-2-C-1-A | $27,500,000 | $27,500,000 | DBR Investments Co. Limited | No |
A-2-C-1-B | $22,500,000 | $22,500,000 | Benchmark 2020-B16(1) | No |
A-2-C-2 | $50,000,000 | $50,000,000 | DBR Investments Co. Limited | No |
A-2-C-3 | $40,000,000 | $40,000,000 | DBR Investments Co. Limited | No |
A-2-C-4 | $40,000,000 | $40,000,000 | DBR Investments Co. Limited | No |
A-2-C-5 | $15,000,000 | $15,000,000 | GSMS 2020-GC45 | No |
A-2-C-6 | $35,000,000 | $35,000,000 | DBR Investments Co. Limited | No |
A-2-C-7 | $20,000,000 | $20,000,000 | DBR Investments Co. Limited | No |
A-3-C-1-A | $27,500,000 | $27,500,000 | JPMorgan Chase Bank, National Association | No |
A-3-C-1-B | $22,500,000 | $22,500,000 | Benchmark 2020-B16(1) | No |
A-3-C-2 | $50,000,000 | $50,000,000 | JPMorgan Chase Bank, National Association | No |
A-3-C-3 | $40,000,000 | $40,000,000 | JPMorgan Chase Bank, National Association | No |
A-3-C-4 | $40,000,000 | $40,000,000 | JPMorgan Chase Bank, National Association | No |
A-3-C-5 | $30,000,000 | $30,000,000 | JPMorgan Chase Bank, National Association | No |
A-3-C-6 | $20,000,000 | $20,000,000 | JPMorgan Chase Bank, National Association | No |
A-3-C-7 | $20,000,000 | $20,000,000 | JPMorgan Chase Bank, National Association | No |
A-4-C-1 | $50,000,000 | $50,000,000 | BANK 2020-BNK25(2) | No |
A-4-C-2 | $50,000,000 | $50,000,000 | BANK 2020-BNK25(2) | No |
A-4-C-3 | $40,000,000 | $40,000,000 | Wells Fargo Bank, National Association | No |
A-4-C-4 | $40,000,000 | $40,000,000 | WFCM 2020-C55 | No |
A-4-C-5 | $30,000,000 | $30,000,000 | WFCM 2020-C55 | No |
A-4-C-6 | $20,000,000 | $20,000,000 | Wells Fargo Bank, National Association | No |
A-4-C-7 | $20,000,000 | $20,000,000 | Wells Fargo Bank, National Association | No |
Total (Senior Loan) | $1,001,000,000 | $1,001,000,000 | | |
|
1633 Broadway Subordinate Companion Loan |
B-1 | $62,250,000 | $62,250,000 | BWAY 2019-1633 | Yes(3)(4) |
B-2 | $62,250,000 | $62,250,000 | BWAY 2019-1633 | Yes(3)(4) |
B-3 | $62,250,000 | $62,250,000 | BWAY 2019-1633 | Yes(3)(4) |
B-4 | $62,250,000 | $62,250,000 | BWAY 2019-1633 | Yes(3)(4) |
Total (Subordinate Companion Loan) | $249,000,000 | $249,000,000 | | |
Total (Whole Loan) | $1,250,000,000 | $1,250,000,000 | | |
(1) | Benchmark 2020-B16 is expected to close on or about February 12, 2020. |
(2) | BANK 2020-BNK25 is expected to close on or about February 13, 2020. |
(3) | The initial controlling notes are Note B-1, Note B-2, Note B-3 and Note B-4. During the continuance of a control shift event relating to the BWAY 2019-1633 securitization transaction, Note A-1-C-1 will be the controlling note. |
(4) | The 1633 Broadway Subordinate Companion Loan is subordinate to the 1633 Broadway Senior Loan. |
The Borrowers and Borrower Sponsor. The borrowers are PGREF I 1633 Broadway Tower, L.P. and PGREF I 1633 Broadway Land, L.P., each a Delaware limited partnership with two independent directors (the “1633 Broadway Borrower”). PGREF I 1633 Broadway Land, L.P. owns the 1633 Broadway Property entirely in fee and also ground leases the 1633 Broadway Property to PGREF I 1633 Broadway Tower, L.P. (i.e., both landlord and tenant interests in the ground lease are pledged as collateral, in addition to the fee interest in the 1633 Broadway Property). Legal counsel to the borrowers delivered a non-consolidation opinion in connection with the origination of the 1633 Broadway Whole Loan. There is no non-recourse carveout guarantor or separate environmental indemnitor with respect to the 1633 Broadway Loan.
THE INFORMATION IN THIS STRUCTURAL AND COLLATERAL TERM SHEET IS NOT COMPLETE AND MAY BE AMENDED PRIOR TO THE TIME OF SALE. THIS TERM SHEET IS NOT AN OFFER TO SELL THESE SECURITIES AND IT IS NOT A SOLICITATION OF AN OFFER TO BUY THESE SECURITIES IN ANY JURISDICTION WHERE THE OFFER OR SALE IS NOT PERMITTED.
49
Office – CBD | Loan #2 | Cut-off Date Balance: | | $70,000,000 |
1633 Broadway New York, NY 10019 | 1633 Broadway | Cut-off Date LTV: U/W NCF DSCR: U/W NOI Debt Yield: | | 41.7% 3.83x 11.9% |
The borrower sponsor is Paramount Group Operating Partnership LP, which indirectly owns and controls the borrowers. Paramount Group, Inc. (NYSE: PGRE), an approximately 91% general partner of the borrower sponsor, is a real estate investment trust that currently owns and/or manages a 13.4 million square foot portfolio of 18 Class A office and retail buildings in New York, Washington, D.C., and San Francisco. Paramount Group, Inc. has a New York portfolio that includes: 1633 Broadway, 1301 Avenue of the Americas, 1325 Avenue of the Americas, 31 West 52nd Street, 900 Third Avenue, 712 Fifth Avenue, 60 Wall Street, 745 Fifth Avenue, 718 Fifth Avenue, and 0 Bond Street.
The Property.
The 1633 Broadway Property is an approximately 2.6 million square foot, 48-story office tower that is situated with a full block of Broadway frontage between 50th and 51st Streets in Midtown Manhattan. The 1633 Broadway Property contains views of the Hudson River, Central Park, and Midtown from above the 36th floor. In addition to the office space, the 1633 Broadway Property includes retail space (anchored by Equinox), a parking garage across three levels below grade, two theaters comprising a total of 145,192 square feet (the Gershwin Theatre and Circle in the Square) and storage space comprising 18,384 square feet.
The 1633 Broadway Property is located on a 90,400 square foot parcel comprising the entire western block front of Broadway between West 50th and West 51st Streets within the Westside office submarket of Midtown. The 1633 Broadway Property was constructed in 1972 and was most recently renovated in 2013. Since 2010, the borrower sponsor has invested a total of approximately $41.6 million in lobby renovations, plaza redevelopment, and retail renovations. In addition, the borrower sponsor has invested approximately $230 million in tenant improvements and leasing commissions since 2010. The borrower sponsor provided a 10-year renovation budget which totals approximately $55.98 million; the renovation budget is anticipated to be utilized for items including a roof replacement, structural upgrades, fire alarm system upgrades, Gershwin Theatre upgrades, completion of the terrace on the 47th and 48th floors, and development of the retail space. Such renovations are not required by the 1633 Broadway Whole Loan documents, and have not been reserved for. The lender can provide no assurances that such renovation will proceed as expected or at all.
The 1633 Broadway Property comprises 2,561,512 square feet and was 98.4% leased as of October 31, 2019. The office component of the 1633 Broadway Property is currently 100.0% leased to 17 tenants and represents approximately 93.4% of underwritten base rent. The retail space within the 1633 Broadway Property totals approximately 80,000 square feet of net rentable area and is anchored by Equinox (25,458 square feet) with a lease expiration date in February 2040.
The 1633 Broadway Property features two theatres that comprise 5.7% of the total net rentable area and account for 1.2% of the underwritten rental revenue. The larger of the two theatres is UT Associates (“Gershwin Theatre”), which is notable for having hosting Wicked since 2003. The Gershwin Theatre’s lease contains three, five-year renewal options that could potentially extend the term through May 2042. The 1633 Broadway Property contains an additional theatre known as the Circle in the Square, which encompasses 34,570 square feet and currently hosts the show OKLAHOMA! The 1633 Broadway Property also houses the Circle in the Square Theatre School, the only accredited training conservatory associated with a Broadway theatre, which offers two, two-year training programs, in acting and musical theatre. The tenant currently pays a total contract rent of $864,250, or $25.00 PSF through September 2021.
The parking component within the 1633 Broadway Property consists of a 250-space parking garage across three levels below grade and comprises 64,158 square feet of net rentable area. The space is currently leased to ABM Parking Services, Inc., a parking garage operator, which has a lease expiration date in July 2026. The operator is responsible for a contract rent of approximately $2.39 million, or $10,168 per space, which will increase by at least 1.50% per annum throughout the remainder of the lease.
Major Tenants.
Largest Tenant by UW Base Rent: Allianz Asset Mgmt of America (“Allianz”; AA-/Aa3/AA by Fitch/Moody’s/S&P; 320,911 square feet; 12.5% of net rentable area; 15.7% of underwritten base rent; 1/31/2031 lease expiration) – Allianz occupies six suites with leases expiring in January 2031. Allianz is an asset manager with over 800 investment professionals in 25 offices worldwide and manages assets for individuals, families and institutions. The 1633 Broadway Property serves as the United States headquarters for Allianz.
2nd Largest Tenant by UW Base Rent: Morgan Stanley & Co (“Morgan Stanley”; A/A3/BBB+ by Fitch/Moody’s/S&P; 260,829 square feet; 10.2% of net rentable area; 11.1% of underwritten base rent; 3/31/2032 lease expiration) – Morgan Stanley occupies five suites with leases expiring in March 2032. Morgan Stanley, a financial holding company, provides various financial products and services to corporations, governments, financial institutions and individuals in the Americas, Europe, the Middle East, Africa and Asia. The company operates through three segments: Institutional Securities, Wealth Management and Investment Management.
3rd Largest Tenant by UW Base Rent: WMG Acquisition Corp (“Warner Music Group”; 293,888 square feet; 11.5% of net rentable area; 10.4% of underwritten base rent; 7/31/2029 lease expiration and month-to-month storage space) – Warner Music Group is an American multinational entertainment and record label conglomerate. It is one of the “Big Three” recording companies and the third largest in the global music industry, next to Universal Music Group and Sony Music Entertainment. Warner Music Group is headquartered at the 1633 Broadway Property.
The following table presents certain information relating to the tenancy at the 1633 Broadway Property:
THE INFORMATION IN THIS STRUCTURAL AND COLLATERAL TERM SHEET IS NOT COMPLETE AND MAY BE AMENDED PRIOR TO THE TIME OF SALE. THIS TERM SHEET IS NOT AN OFFER TO SELL THESE SECURITIES AND IT IS NOT A SOLICITATION OF AN OFFER TO BUY THESE SECURITIES IN ANY JURISDICTION WHERE THE OFFER OR SALE IS NOT PERMITTED.
50
Office – CBD | Loan #2 | Cut-off Date Balance: | | $70,000,000 |
1633 Broadway New York, NY 10019 | 1633 Broadway | Cut-off Date LTV: U/W NCF DSCR: U/W NOI Debt Yield: | | 41.7% 3.83x 11.9% |
Major Tenants
Tenant Name | Credit Rating (Fitch/
Moody’s/
S&P)(1) | Tenant
NRSF | % of
NRSF | Annual
U/W
Base
Rent
PSF(2) | Annual
U/W Base
Rent(2) | % of Total Annual
U/W Base Rent | Lease
Expiration
Date | Extension
Options | Term. Option (Y/N) |
Major Tenants | | | | | | | | |
Allianz(3) | AA-/Aa3/AA | 320,911 | 12.5% | $82.66(3) | $26,527,064(3) | 15.7% | 1/31/2031 | 5 or 10 years(4) | N |
Morgan Stanley | A/A3/BBB+ | 260,829 | 10.2% | $71.61 | $18,677,050 | 11.1% | 3/31/2032 | 2, 5-year or 1, 10-year | Y(5) |
WMG Acquisition Corp(6) | NR/NR/NR | 293,888 | 11.5% | $59.62(6) | $17,520,179(6) | 10.4% | Various | 1, 5-year or 10-year | N |
Showtime Networks Inc | BBB/Baa2/BBB | 261,196 | 10.2% | $55.28 | $14,438,861 | 8.6% | 1/31/2026 | 1, 5-year or 10-year | N |
Kasowitz Benson Torres(7) | NR/NR/NR | 203,394 | 7.9% | $68.00(7) | $13,830,452(7) | 8.2% | 3/31/2037 | 2, 5-year | Y(8) |
New Mountain Capital, LLC(9) | NR/NR/NR | 108,374 | 4.2% | $86.00(9) | $9,320,164(9) | 5.5% | 10/15/2035 | 1, 5-year | N |
Charter Communications Holding | NR/Ba2/BB+ | 106,176 | 4.1% | $84.00 | $8,918,784 | 5.3% | 12/15/2025 | None | N |
MongoDB, Inc. | NR/NR/NR | 106,230 | 4.1% | $76.00 | $8,073,480 | 4.8% | 12/31/2029 | 1, 5-year | N |
Travel Leaders Group, LLC | NR/NR/B+ | 107,205 | 4.2% | $74.58 | $7,994,846 | 4.7% | 12/31/2033 | 1, 5-year | N |
Assured Guaranty Municipal | NR/NR/A | 103,838 | 4.1% | $69.88 | $7,256,550 | 4.3% | Various | 1, 5-year | N |
Total Major Tenants | 1,872,041 | 73.1% | $70.81 | $132,557,430 | 78.5% | | | |
| | | | | | | | |
Non-Major Tenant | 649,710 | 25.4% | $55.74 | $36,213,171 | 21.5% | | | |
| | | | | | | | |
Occupied Collateral Total | 2,521,751 | 98.4% | $66.93 | $168,770,601 | 100.0% | | | |
| | | | | | | | |
Vacant Space | 39,761 | 1.6% | | | | | | |
| | | | | | | | |
Collateral Total | 2,561,512 | 100.0% | | | | | | |
| | | | | | | | | |
(1) | Certain ratings are those of the parent company whether or not the parent company guarantees the lease. |
(2) | Annual U/W Base Rent PSF and Annual U/W Base Rent include contractual rent steps through November 2020 totaling $1,272,795. The lender’s underwriting gives separate credit for the net present value of contractual rent step increments over the lease term using a discount rate of 7.0% (for investment grade tenants) totaling $7,558,579 (see “Operating History and Underwritten Net Cash Flow” below). The Annual U/W Base Rent PSF and Annual U/W Base Rent shown in the table above do not include credit given for such investment grade tenants. |
(3) | Allianz Asset Mgmt of America subleases 20,600 square feet of suite 4600 (totaling 54,118 square feet) to Triumph Hospitality at a base rent of $46.80 PSF through December 30, 2030. Triumph Hospitality further subleases 3,000 square feet of suite 4600 to Stein Adler Dabah & Zelkowitz at a base rent of $41.33 PSF through July 31, 2022. Underwritten base rent is based on the contractual rent under the prime lease. |
(4) | Subject to a maximum of 15 years in the aggregate. |
(5) | Morgan Stanley has the option to terminate its lease as to all or any portion (but not less than one full floor) of its space at any time after April 1, 2027, upon 18 months’ notice and payment of a termination fee. |
(6) | WMG Acquisition Corp subleases 3,815 square feet of suite 0400 (totaling 36,854 square feet) to Cooper Investment Partners LLC at a base rent of $58.37 PSF on a month-to-month basis. Underwritten base rent is based on the contractual rent under the prime lease. |
(7) | Kasowitz Benson Torres subleases a collective 32,487 square feet of Suite 2200 (totaling 50,718 square feet) to three tenants. Delcath Systems, Inc. subleases 6,877 square feet and pays a rent of $68.50 PSF through February 28, 2021; Avalonbay Communities subleases 12,145 square feet through October 31, 2026 and pays a current rent of $74.00 PSF; Cresa New York subleases 13,195 square feet and pays a rent of $65.00 PSF through April 30, 2021. Underwritten base rent is based on the contractual rent under the prime lease. |
(8) | Kasowitz Benson Torres has the right to terminate one full floor of the premises located on the uppermost or lowermost floors, effective as of March 31, 2024, upon notice by March 31, 2023. |
(9) | New Mountain Capital, LLC has executed a lease but has not yet taken occupancy or begun paying rent. We cannot assure you that they will take occupancy or begin paying rent as expected or at all. |
THE INFORMATION IN THIS STRUCTURAL AND COLLATERAL TERM SHEET IS NOT COMPLETE AND MAY BE AMENDED PRIOR TO THE TIME OF SALE. THIS TERM SHEET IS NOT AN OFFER TO SELL THESE SECURITIES AND IT IS NOT A SOLICITATION OF AN OFFER TO BUY THESE SECURITIES IN ANY JURISDICTION WHERE THE OFFER OR SALE IS NOT PERMITTED.
51
Office – CBD | Loan #2 | Cut-off Date Balance: | | $70,000,000 |
1633 Broadway New York, NY 10019 | 1633 Broadway | Cut-off Date LTV: U/W NCF DSCR: U/W NOI Debt Yield: | | 41.7% 3.83x 11.9% |
The following table presents certain information relating to the lease rollover schedule at the 1633 Broadway Property:
Lease Expiration Schedule(1)(2)
Year Ending
December 31, | No. of
Leases Expiring | Expiring
NRSF | % of
Total
NRSF | Cumulative
Expiring
NRSF | Cumulative
% of Total
NRSF | Annual
U/W
Base Rent(3) | % of Total
Annual U/W
Base Rent | Annual
U/W
Base Rent
PSF(3) |
MTM | 13 | 9,482 | 0.4% | 9,482 | 0.4% | $638,145 | 0.4% | $67.30 |
2020 | 2 | 960 | 0.0% | 10,442 | 0.4% | $28,800 | 0.0% | $30.00 |
2021 | 3 | 86,460 | 3.4% | 96,902 | 3.8% | $4,756,000 | 2.8% | $55.01 |
2022 | 4 | 116,337 | 4.5% | 213,239 | 8.3% | $2,813,374 | 1.7% | $24.18 |
2023 | 7 | 38,550 | 1.5% | 251,789 | 9.8% | $1,299,854 | 0.8% | $33.72 |
2024 | 1 | 51,276 | 2.0% | 303,065 | 11.8% | $4,666,116 | 2.8% | $91.00 |
2025 | 4 | 106,176 | 4.1% | 409,241 | 16.0% | $8,918,784 | 5.3% | $84.00 |
2026 | 11 | 383,584 | 15.0% | 792,825 | 31.0% | $20,397,741 | 12.1% | $53.18 |
2027 | 3 | 55,247 | 2.2% | 848,072 | 33.1% | $4,584,436 | 2.7% | $82.98 |
2028 | 4 | 90,001 | 3.5% | 938,073 | 36.6% | $6,043,229 | 3.6% | $67.15 |
2029 | 10 | 399,717 | 15.6% | 1,337,790 | 52.2% | $25,579,624 | 15.2% | $63.99 |
2030 | 0 | 0 | 0.0% | 1,337,790 | 52.2% | $0 | 0.0% | $0.00 |
Thereafter | 28 | 1,183,961 | 46.2% | 2,521,751 | 98.4% | $89,044,498 | 52.8% | $75.21 |
Vacant | 0 | 39,761 | 1.6% | 2,561,512 | 100.0% | $0 | 0.0% | $0.00 |
Total/Weighted Average | 90 | 2,561,512 | 100.0% | | | $168,770,601 | 100.0% | $66.93 |
(1) | Information obtained from the underwritten rent roll. |
(2) | Certain tenants may have lease termination options that are exercisable prior to the originally stated expiration date of the subject lease and that are not considered in the Lease Expiration Schedule. |
(3) | Total/Weighted Average Annual U/W Base Rent and Annual U/W Base Rent PSF exclude vacant space. |
The following table presents historical occupancy percentages at the 1633 Broadway Property:
Historical Occupancy
12/31/2015(1) | | 12/31/2016(1) | | 12/31/2017(1) | | 12/31/2018(1) | | 10/31/2019(2) | |
92.7% | | 86.3% | | 95.4% | | 95.4% | | 98.4% | |
(1) | Information obtained from the borrower. |
(2) | Information obtained from the underwritten rent roll. |
THE INFORMATION IN THIS STRUCTURAL AND COLLATERAL TERM SHEET IS NOT COMPLETE AND MAY BE AMENDED PRIOR TO THE TIME OF SALE. THIS TERM SHEET IS NOT AN OFFER TO SELL THESE SECURITIES AND IT IS NOT A SOLICITATION OF AN OFFER TO BUY THESE SECURITIES IN ANY JURISDICTION WHERE THE OFFER OR SALE IS NOT PERMITTED.
52
Office – CBD | Loan #2 | Cut-off Date Balance: | | $70,000,000 |
1633 Broadway New York, NY 10019 | 1633 Broadway | Cut-off Date LTV: U/W NCF DSCR: U/W NOI Debt Yield: | | 41.7% 3.83x 11.9% |
Operating History and Underwritten Net Cash Flow. The following table presents certain information relating to the underwritten net cash flow at the 1633 Broadway Property:
Cash Flow Analysis
| | 2016 | | 2017 | | 2018 | | TTM 9/30/2019 | | U/W | | %(1) | | U/W $ per SF | |
Base Rent | | $141,156,682 | | $143,219,431 | | $160,621,035 | | $161,646,240 | | $167,497,806 | | 84.3% | | $65.39 | |
Contractual Rent Steps(2) | | 0 | | 0 | | 0 | | 0 | | 1,272,795 | | 0.6 | | 0.50 | |
Credit Tenant Rent Average(3) | | 0 | | 0 | | 0 | | 0 | | 7,558,579 | | 3.8 | | 2.95 | |
Grossed Up Vacant Space | | 0 | | 0 | | 0 | | 0 | | 2,879,875 | | 1.4 | | 1.12 | |
Gross Potential Rent | | $141,156,682 | | $143,219,431 | | $160,621,035 | | $161,646,240 | | $179,209,055 | | 90.2% | | $69.96 | |
Other Income(4) | | 5,692,549 | | 5,017,065 | | 4,645,691 | | 4,240,034 | | 4,279,853 | | 2.2 | | 1.67 | |
Total Recoveries | | 9,150,315 | | 11,228,307 | | 13,952,510 | | 16,874,074 | | 15,267,588 | | 7.7 | | 5.96 | |
Net Rental Income | | $155,999,546 | | $159,464,803 | | $179,219,236 | | $182,760,348 | | $198,756,496 | | 100.0% | | $77.59 | |
(Vacancy & Credit Loss) | | (309,756) | | 0 | | 0 | | 0 | | (8,170,549)(5) | | (4.6) | | (3.19) | |
Effective Gross Income | | $155,689,790 | | $159,464,803 | | $179,219,236 | | $182,760,348 | | $190,585,947 | | 95.9% | | $74.40 | |
| | | | | | | | | | | | | | | |
Real Estate Taxes | | 35,413,254 | | 38,391,946 | | 41,366,170 | | 43,693,114 | | 45,478,153 | | 23.9 | | 17.75 | |
Insurance | | 1,061,417 | | 908,564 | | 1,009,544 | | 1,082,131 | | 1,069,190 | | 0.6 | | 0.42 | |
Management Fee | | 2,507,162 | | 2,981,306 | | 3,149,432 | | 3,287,347 | | 1,000,000 | | 0.5 | | 0.39 | |
Other Operating Expenses | | 22,886,571 | | 22,992,980 | | 24,595,640 | | 23,888,441 | | 23,888,441 | | 12.5 | | 9.33 | |
Total Operating Expenses | | $61,868,404 | | $65,274,796 | | $70,120,786 | | $71,951,033 | | $71,435,784 | | 37.5% | | $27.89 | |
| | | | | | | | | | | | | | | |
Net Operating Income | | $93,821,386 | | $94,190,007 | | $109,098,450 | | $110,809,315 | | $119,150,163 | | 62.5% | | $46.52 | |
Replacement Reserves | | 0 | | 0 | | 0 | | 0 | | 461,072 | | 0.2 | | 0.18 | |
TI/LC | | 0 | | 0 | | 0 | | 0 | | 2,011,364 | | 1.1 | | 0.79 | |
Net Cash Flow | | $93,821,386 | | $94,190,007 | | $109,098,450 | | $110,809,315 | | $116,677,727 | | 61.2% | | $45.55 | |
| | | | | | | | | | | | | | | |
NOI DSCR(6) | | 3.08x | | 3.10x | | 3.59x | | 3.64x | | 3.92x | | | | | |
NCF DSCR(6) | | 3.08x | | 3.10x | | 3.59x | | 3.64x | | 3.83x | | | | | |
NOI Debt Yield(6) | | 9.4% | | 9.4% | | 10.9% | | 11.1% | | 11.9% | | | | | |
NCF Debt Yield(6) | | 9.4% | | 9.4% | | 10.9% | | 11.1% | | 11.7% | | | | | |
(1) | Represents (i) percent of Net Rental Income for all revenue fields, (ii) percent of Gross Potential Rent for Vacancy & Credit Loss and (iii) percent of Effective Gross Income for all other fields. |
(2) | Includes contractual rent steps through November 30, 2020. |
(3) | Reflects the net present value of contractual rent step increments over the lease term using a discount rate of 7.0% (for investment grade tenants). |
(4) | Other Income consists of overage rent, storage income, parking income, lease termination income, tenant work order income and other miscellaneous income. |
(5) | The underwritten economic vacancy is 4.6%. The 1633 Broadway Property was 98.4% occupied as of October 31, 2019. |
(6) | The debt service coverage ratios and debt yields are based on the 1633 Broadway Senior Loan and excludes subordinate debt. |
Appraisal. The appraiser concluded to an “as-is” Appraised Value for the 1633 Broadway Property of $2,400,000,000 as of October 24, 2019.
Environmental Matters. According to the Phase I environmental site assessment dated October 30, 2019, there was no evidence of any recognized environmental conditions at the 1633 Broadway Property.
THE INFORMATION IN THIS STRUCTURAL AND COLLATERAL TERM SHEET IS NOT COMPLETE AND MAY BE AMENDED PRIOR TO THE TIME OF SALE. THIS TERM SHEET IS NOT AN OFFER TO SELL THESE SECURITIES AND IT IS NOT A SOLICITATION OF AN OFFER TO BUY THESE SECURITIES IN ANY JURISDICTION WHERE THE OFFER OR SALE IS NOT PERMITTED.
53
Office – CBD | Loan #2 | Cut-off Date Balance: | | $70,000,000 |
1633 Broadway New York, NY 10019 | 1633 Broadway | Cut-off Date LTV: U/W NCF DSCR: U/W NOI Debt Yield: | | 41.7% 3.83x 11.9% |
Market Overview and Competition. The 1633 Broadway Property is located in the Times Square neighborhood of Midtown Manhattan, a high traffic commercial corridor that produces 15% of New York City’s economic output. The neighborhood is bounded by 41st Street to the south and 52nd Street to the north between Avenue of the Americas and Eighth Avenue. The 1633 Broadway Property is located within one block of the 50th Street/Broadway, 50th Street and 49th Street subway stations, which serve the 1, 2, C, E, N, R and W lines.
According to the appraisal, the 1633 Broadway Property is located within the Westside office submarket of Midtown within the Manhattan market. Historically, the submarket has benefitted from the office space located around the boundaries of Central Park along major corridors such as West 57th Street, Broadway and Seventh Avenue, which consist primarily of Class A office product that take advantage of protected Central Park views. The area’s proximity to these locations has assisted with the historically low vacancy and availability rates exhibited by this submarket since 2010. As of the third quarter of 2019, the Westside office submarket had an existing inventory of approximately 25.7 million square feet, a vacancy rate of 5.4% and an average asking rent of $66.21 PSF. As of the third quarter of 2019, the Manhattan office market had an existing inventory of approximately 456.1 million square feet, a vacancy rate of 5.9% and an average asking rent of $79.25 PSF.
The following table presents certain information relating to the appraiser’s market rent conclusions for the 1633 Broadway Property:
Market Rent Summary(1)
| Office Floors 2 to 9 | Office Floors 10 to 18 | Office Floors 19 to 26 | Office Floors 27 to 35 | Office Floors 36 to 43 | Office Floors 44 to 48 |
Market Rent (PSF) | $65.00 | $68.00 | $72.00 | $76.00 | $85.00 | $90.00 |
Lease Term (Years) | 15 | 15 | 15 | 15 | 15 | 15 |
Lease Type (Reimbursements) | MG | MG | MG | MG | MG | MG |
Rent Increase Projection | 10% increase every 5 years | 10% increase every 5 years | 10% increase every 5 years | $10% increase every 5 years | 10% increase every 5 years | 10% increase every 5 years |
(1) | Information obtained from the appraisal. |
The table below presents certain information relating to comparable sales pertaining to the 1633 Broadway Property identified by the appraiser:
Comparable Sales(1)
Property Name | Location | Rentable Area (SF) | Sale Date | Sale Price | Sale Price (PSF) |
150 East 42nd Street | New York, NY | 1,698,603 | Oct-19 | $1,300,000,000 | $765.33 |
330 Madison Avenue | New York, NY | 855,000 | Jul-19 | $900,000,000 | $1,052.63 |
30 Hudson Yards | New York, NY | 1,463,234 | Apr-19 | $2,155,000,000 | $1,472.77 |
237 Park Avenue | New York, NY | 1,260,160 | Jan-19 | $1,200,000,000 | $952.26 |
425 Lexington Avenue | New York, NY | 728,171 | Nov-18 | $701,000,000 | $962.69 |
666 Fifth Avenue | New York, NY | 1,437,546 | Aug-18 | $1,286,082,681 | $894.64 |
1515 Broadway | New York, NY | 1,897,131 | Nov-17 | $1,950,000,000 | $1,027.87 |
825 Eighth Avenue | New York, NY | 2,080,000 | Oct-17 | $1,700,000,000 | $817.31 |
245 Park Avenue | New York, NY | 1,779,515 | May-17 | $2,210,000,000 | $1,241.91 |
(1) | Information obtained from the appraisal. |
THE INFORMATION IN THIS STRUCTURAL AND COLLATERAL TERM SHEET IS NOT COMPLETE AND MAY BE AMENDED PRIOR TO THE TIME OF SALE. THIS TERM SHEET IS NOT AN OFFER TO SELL THESE SECURITIES AND IT IS NOT A SOLICITATION OF AN OFFER TO BUY THESE SECURITIES IN ANY JURISDICTION WHERE THE OFFER OR SALE IS NOT PERMITTED.
54
Office – CBD | Loan #2 | Cut-off Date Balance: | | $70,000,000 |
1633 Broadway New York, NY 10019 | 1633 Broadway | Cut-off Date LTV: U/W NCF DSCR: U/W NOI Debt Yield: | | 41.7% 3.83x 11.9% |
The following tables present certain information relating to comparable office leases for the 1633 Broadway Property:
Comparable Leases(1)
Property Name/Location | Year Built/ Renovated | Total GLA (SF) | Distance from Subject | Occupancy | Tenant | Tenant Size (SF) | Lease Start Date | Lease Term | Annual Base Rent PSF | Lease Type |
1155 Avenue of the Americas New York, NY | 1984/2016 | 752,996 | 1.0 mile | 74.8% | BKD, LLC | 20,899 | Sep-19 | 13.5 Yrs | $77.00 | MG |
1 Rockefeller Plaza New York, NY | 1936/NAV | 603,397 | 0.5 miles | 99.1%(2) | Veteran Advisers, Inc. | 2,552 | Sep-19 | 7.7 Yrs | $83.50 | MG |
1675 Broadway New York, NY | 1990/NAV | 878,321 | 0.4 miles | 96.9% | Davis & Gilbert LLP | 85,852 | Aug-19 | 16.0 Yrs | $72.00 | MG |
142 West 57th Street New York, NY | 1986/NAV | 255,586 | 0.7 miles | 88.2%(2) | Wedbush Securities Inc. | 15,626 | Aug-19 | 10.8 Yrs | $65.00 | MG |
1251 Avenue of the Americas New York, NY | 1971/NAV | 2,364,000 | 0.2 miles | 94.4% | IHI Americas, Inc. | 9,438 | Jul-19 | 10.3 Yrs | $70.50 | MG |
1345 Avenue of the Americas New York, NY | 1969/1988 | 1,998,994 | 0.5 miles | 94.8% | Global Infrastructure Partners | 84,856 | Jun-19 | 17.0 Yrs | $89.50 | MG |
810 Seventh Avenue New York, NY | 1970/NAV | 765,000 | 0.5 miles | 93.3% | Colonial Consulting LLC | 17,320 | May-19 | 12.5 Yrs | $71.00 | MG |
1271 Avenue of the Americas New York, NY | 1957/2019 | 2,100,000 | 0.2 miles | 98.0% | Greenhill & Company AIG – American International Group, Inc. | 77,622 320,237 | May-19 Apr-19 | 15.3 Yrs 16.5 Yrs | $91.00 $97.13 | MG MG |
1700 Broadway New York, NY | 1968/2003 | 625,000 | 0.6 miles | 81.5%(2) | Excel Sports Management, LLC M. Arthur Gensler, Jr. & Associates, Inc. | 17,078 13,237 | Apr-19 Jan-19 | 7.6 Yrs 9.9 Yrs | $79.00 $71.00 | MG MG |
1325 Avenue of the Americas New York, NY | 1989/NAV | 808,998 | 0.5 miles | 88.3% | Dominus Capital, L.P. | 9,361 | Mar-19 | 10.5 Yrs | $75.00 | MG |
1290 Avenue of the Americas New York, NY | 1963/1996 | 2,113,000 | 0.3 miles | 100.0% | Linklaters, LLP | 90,508 | Mar-19 | 16.1 Yrs | $84.00 | MG |
1177 Avenue of the Americas New York, NY | 1992/2013 | 1,000,000 | 0.9 miles | 90.2% | Mill Point Capital | 11,644 | Jan-19 | 10.5 Yrs | $87.00 | MG |
114 West 47th Street New York, NY | 1989/NAV | 658,000 | 0.8 miles | 96.3%(2) | IFM Investments | 18,000 | Oct-18 | 15.0 Yrs | $68.00 | MG |
(1) | Information obtained from the appraisal. |
(2) | Information obtained from a third party market research provider. |
Escrows.
Real Estate Taxes – Upon the occurrence and continuance of a Cash Trap Event Period (see “Lockbox and Cash Management” section), the 1633 Broadway Whole Loan documents require ongoing monthly real estate tax reserves in an amount equal to one-twelfth of the real estate taxes that the lender reasonably estimates will be payable during the next 12 months.
Insurance – Upon the occurrence and continuance of a Cash Trap Event Period, the 1633 Broadway Whole Loan documents require ongoing monthly insurance reserves in an amount equal to one-twelfth of the insurance premiums that the lender reasonably estimates will be payable for the renewal of the coverage during the next 12 months; provided, however, that, notwithstanding any prior springing conditions, the reserve will not be required if the 1633 Broadway Borrower maintains a blanket insurance policy reasonably acceptable to the lender and no event of default is continuing.
THE INFORMATION IN THIS STRUCTURAL AND COLLATERAL TERM SHEET IS NOT COMPLETE AND MAY BE AMENDED PRIOR TO THE TIME OF SALE. THIS TERM SHEET IS NOT AN OFFER TO SELL THESE SECURITIES AND IT IS NOT A SOLICITATION OF AN OFFER TO BUY THESE SECURITIES IN ANY JURISDICTION WHERE THE OFFER OR SALE IS NOT PERMITTED.
55
Office – CBD | Loan #2 | Cut-off Date Balance: | | $70,000,000 |
1633 Broadway New York, NY 10019 | 1633 Broadway | Cut-off Date LTV: U/W NCF DSCR: U/W NOI Debt Yield: | | 41.7% 3.83x 11.9% |
Replacement Reserve – Upon the occurrence and continuance of a Cash Trap Event Period, the 1633 Broadway Whole Loan documents require ongoing monthly replacement reserves of $42,692 subject to a cap of $1,024,605.
TI/LC Reserve – Upon the occurrence and continuance of a Cash Trap Event Period, the 1633 Broadway Whole Loan documents require ongoing monthly rollover reserves of $213,459 subject to a cap of $5,123,024.
Unfunded Obligations Reserve – The 1633 Broadway Whole Loan documents require an upfront deposit of $36,389,727, along with a $4,000,000 guaranty made by Paramount Group Operating Partnership LP, for outstanding tenant improvements, leasing commissions and free rent pertaining to 11 tenants at the 1633 Broadway Property at the time of origination of the 1633 Broadway Whole Loan.
Lockbox and Cash Management. The 1633 Broadway Whole Loan documents require that the 1633 Broadway Borrower establish and maintain a lender-controlled lockbox account, which is already in place, and that the borrower direct all tenants to pay rent directly into such lockbox account and the 1633 Broadway Borrower or property manager deposit any rent received within one business day. Prior to the occurrence of a Cash Trap Event Period (as defined below), all funds on deposit in the lockbox account will be disbursed to the 1633 Broadway Borrower. During a Cash Trap Event Period, all funds in the lockbox account are required to be swept each business day into the cash management account controlled by the lender and, on each payment date, all funds in the cash management account are required to be applied in accordance with the 1633 Broadway Whole Loan documents. During a Cash Trap Event Period, any excess cash flow remaining after satisfaction of the waterfall items is required to be swept to an excess cash flow subaccount to be held by the lender as additional security for the 1633 Broadway Whole Loan and, provided no event of default exists, disbursed for budgeted operating expenses, reserves or to the lender and/or the 1633 Broadway Borrower in accordance with the 1633 Broadway Whole Loan documents.
A “Cash Trap Event Period” will commence upon the earlier of the following:
| (i) | the occurrence and continuance of an event of default; |
| (ii) | the net operating income debt yield (“NOI DY”) for the 1633 Broadway Whole Loan falling below 5.75% at the end of two consecutive calendar quarters; or |
| (iii) | the failure to deliver financial reports to the lender as and when required pursuant to the 1633 Broadway Whole Loan documents. |
A Cash Trap Event Period will end upon the occurrence of the following:
| ● | with regard to clause (i) above, the cure of such event of default; |
| ● | with regard to clause (ii) above: |
| ○ | (a) the NOI DY for the 1633 Broadway Whole Loan being greater than or equal to 5.75% for two consecutive calendar quarters; |
| ○ | (b) provided no event of default is continuing, the 1633 Broadway Borrower delivering to the lender as additional collateral and security a combination of one or more of the following reasonably acceptable to the lender: (x) borrower sponsor guarantees (not to exceed an aggregate notional amount of $4,000,000), (y) letters of credit (subject in the aggregate notional amount, along with any borrower sponsor guarantees, to a cap of 10% of the outstanding principal balance of the 1633 Broadway Whole Loan) and/or (z) cash collateral, which, if applied to the principal balance, would cause the NOI DY to equal or exceed 5.75%; or |
| ● | with regard to clause (iii), such financial reports having been received by the lender and indicating that no Cash Trap Event Period is ongoing. |
Property Management. The 1633 Broadway Property is managed by an affiliate of the borrower sponsor.
Partial Release. Not permitted.
Real Estate Substitution. Not permitted.
Subordinate and Mezzanine Indebtedness. The 1633 Broadway Property also secures the 1633 Broadway Pari Passu Companion Loans, which have an aggregate Cut-off Date principal balance of $931,000,000 and the 1633 Broadway Subordinate Companion Loans, which have an aggregate Cut-off Date principal balance of $249,000,000. The 1633 Broadway Pari Passu Companion Loans and the 1633 Broadway Subordinate Companion Loan are coterminous with the 1633 Broadway Mortgage Loan. The 1633 Broadway Pari Passu Companion Loans accrue interest at the same rate as the 1633 Broadway Mortgage Loan, and the 1633 Broadway Subordinate Companion Loan accrues interest at an interest rate of 2.9900%. The 1633 Broadway Mortgage Loan and the 1633 Broadway Pari Passu Companion Loans are each pari passu in right of payment and together are senior in right of payment to the 1633 Broadway Subordinate Companion Loan. The holders of the 1633 Broadway Mortgage Loan, the 1633 Broadway Pari Passu Companion Loans and the 1633 Broadway Subordinate Companion Loan have entered into a co-lender agreement which sets forth the allocation of collections on the 1633 Broadway Whole Loan. See “Description of the Mortgage Pool—The Whole Loans—The Non-Serviced AB Whole Loans—The 1633 Broadway Whole Loan “ in the Preliminary Prospectus.
THE INFORMATION IN THIS STRUCTURAL AND COLLATERAL TERM SHEET IS NOT COMPLETE AND MAY BE AMENDED PRIOR TO THE TIME OF SALE. THIS TERM SHEET IS NOT AN OFFER TO SELL THESE SECURITIES AND IT IS NOT A SOLICITATION OF AN OFFER TO BUY THESE SECURITIES IN ANY JURISDICTION WHERE THE OFFER OR SALE IS NOT PERMITTED.
56
Office – CBD | Loan #2 | Cut-off Date Balance: | | $70,000,000 |
1633 Broadway New York, NY 10019 | 1633 Broadway | Cut-off Date LTV: U/W NCF DSCR: U/W NOI Debt Yield: | | 41.7% 3.83x 11.9% |
The following table presents certain information relating to the 1633 Broadway Subordinate Companion Loan:
Subordinate Note Summary
| B-Note Original Principal Balance | B-Note Interest Rate | Original Term (mos.) | Original Amort. Term (mos.) | Original IO Term (mos.) | Total Debt UW NCF DSCR | Total Debt UW NOI Debt Yield | Total Debt Cut-off Date LTV |
1633 Broadway Subordinate Companion Loan | $249,000,000 | 2.9900% | 120 | 0 | 120 | 3.07x | 9.5% | 52.1% |
Ground Lease. None.
Permitted Equityholder Debt. The direct or indirect equity owners of the 1633 Broadway Borrower are permitted to incur equityholder debt from an institutional lender secured by a pledge of their direct or indirect equity interests in the 1633 Broadway Borrower so long as, among other conditions pursuant to the 1633 Broadway Whole Loan documents: (a) the lender and such institutional lender have entered into a customary subordination and intercreditor agreement reasonably acceptable to the lender, (b) such loan is coterminous with the 1633 Broadway Whole Loan or is freely pre-payable without premium or penalty from and after the maturity date, (c) immediately after giving effect to the origination of such loan, the net operating income debt yield (as calculated in the 1633 Broadway Whole Loan documents) is not less than 9.35%, (d) immediately after giving effect to the origination of such loan, the loan-to-value ratio (as calculated in the 1633 Broadway Whole Loan documents) does not exceed 52.08%, (e) immediately after giving effect to the origination of such debt, the net operating income debt service coverage ratio (as calculated in the 1633 Broadway Whole Loan documents) is not less than 3.08x, (f) such loan is current-pay only, with no “pay-in-kind” or similar accrual feature, (g) if the permitted equityholder debt bears a floating rate of interest, the borrower acquires and maintains an interest rate cap or swap agreement from a counterparty acceptable to the lender in its reasonable discretion with a notional amount that is not less than the outstanding principal balance of the permitted equityholder debt and with a reasonable strike price; (h) rating agency confirmation is obtained; and (i) the permitted equityholder debt is not closed prior to the date that is at least one year after the origination date of the 1633 Broadway Whole Loan. See “Description of the Mortgage Pool—Additional Indebtedness—Mezzanine Indebtedness” in the Preliminary Prospectus.
Terrorism Insurance. The 1633 Broadway Whole Loan documents require that the “all risk” insurance policy required to be maintained by the 1633 Broadway Borrower provides coverage for terrorism in an amount equal to the full replacement cost of the 1633 Broadway Property, as well as business interruption insurance covering no less than the 24-month period following the occurrence of a casualty event, together with a 12-month extended period of indemnity (provided that if TRIPRA or a similar statute is not in effect, the 1633 Broadway Borrower will not be obligated to pay terrorism insurance premiums in excess of two times the premium for the casualty and business interruption coverage on a stand-alone basis).
THE INFORMATION IN THIS STRUCTURAL AND COLLATERAL TERM SHEET IS NOT COMPLETE AND MAY BE AMENDED PRIOR TO THE TIME OF SALE. THIS TERM SHEET IS NOT AN OFFER TO SELL THESE SECURITIES AND IT IS NOT A SOLICITATION OF AN OFFER TO BUY THESE SECURITIES IN ANY JURISDICTION WHERE THE OFFER OR SALE IS NOT PERMITTED.
57
Mixed Use – Office/Retail | Loan #3 | Cut-off Date Balance: | | $40,000,000 |
650 Madison Avenue | 650 Madison Avenue | Cut-off Date LTV: | | 48.5% |
New York, NY 10022 | | U/W NCF DSCR: | | 2.73x |
| | U/W NOI Debt Yield: | | 10.0% |

THE INFORMATION IN THIS STRUCTURAL AND COLLATERAL TERM SHEET IS NOT COMPLETE AND MAY BE AMENDED PRIOR TO THE TIME OF SALE. THIS TERM SHEET IS NOT AN OFFER TO SELL THESE SECURITIES AND IT IS NOT A SOLICITATION OF AN OFFER TO BUY THESE SECURITIES IN ANY JURISDICTION WHERE THE OFFER OR SALE IS NOT PERMITTED.
58
Mixed Use – Office/Retail | Loan #3 | Cut-off Date Balance: | | $40,000,000 |
650 Madison Avenue | 650 Madison Avenue | Cut-off Date LTV: | | 48.5% |
New York, NY 10022 | | U/W NCF DSCR: | | 2.73x |
| | U/W NOI Debt Yield: | | 10.0% |
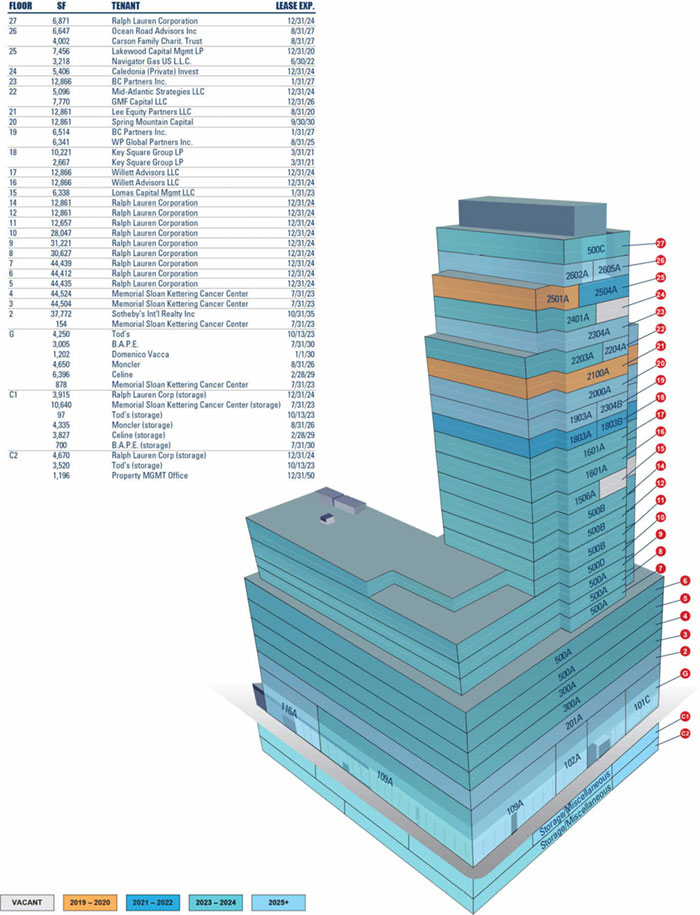
THE INFORMATION IN THIS STRUCTURAL AND COLLATERAL TERM SHEET IS NOT COMPLETE AND MAY BE AMENDED PRIOR TO THE TIME OF SALE. THIS TERM SHEET IS NOT AN OFFER TO SELL THESE SECURITIES AND IT IS NOT A SOLICITATION OF AN OFFER TO BUY THESE SECURITIES IN ANY JURISDICTION WHERE THE OFFER OR SALE IS NOT PERMITTED.
59
Mixed Use – Office/Retail | Loan #3 | Cut-off Date Balance: | | $40,000,000 |
650 Madison Avenue | 650 Madison Avenue | Cut-off Date LTV: | | 48.5% |
New York, NY 10022 | | U/W NCF DSCR: | | 2.73x |
| | U/W NOI Debt Yield: | | 10.0% |
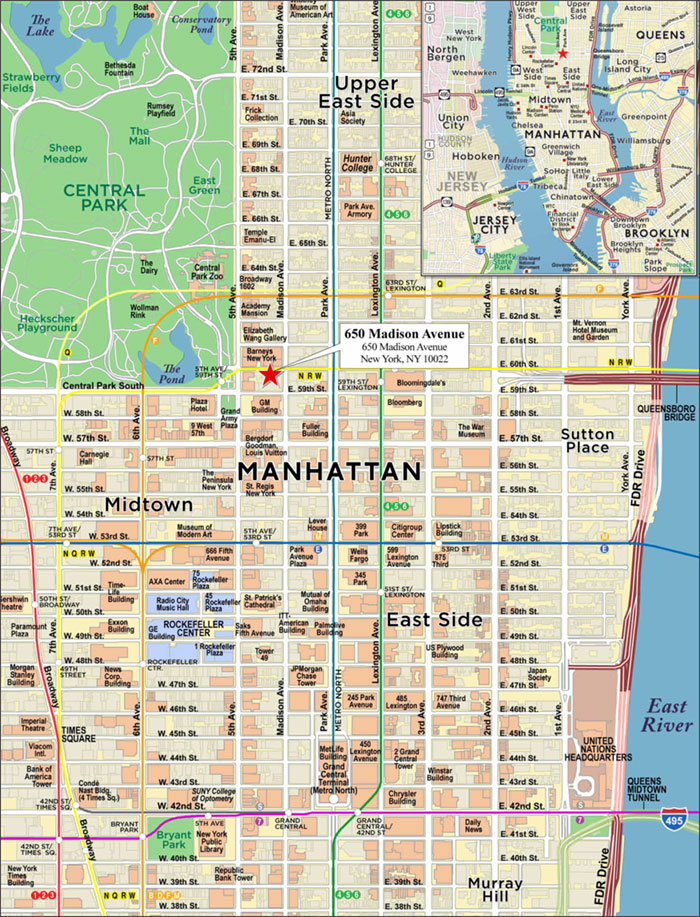
THE INFORMATION IN THIS STRUCTURAL AND COLLATERAL TERM SHEET IS NOT COMPLETE AND MAY BE AMENDED PRIOR TO THE TIME OF SALE. THIS TERM SHEET IS NOT AN OFFER TO SELL THESE SECURITIES AND IT IS NOT A SOLICITATION OF AN OFFER TO BUY THESE SECURITIES IN ANY JURISDICTION WHERE THE OFFER OR SALE IS NOT PERMITTED.
60
No. 3 – 650 Madison Avenue |
|
Mortgage Loan Information | | Mortgaged Property Information |
Mortgage Loan Seller: | Barclays Capital Real Estate Inc. | | Single Asset/Portfolio: | Single Asset |
Credit Assessment (KBRA/Fitch/Moody’s): | BBB-(sf)/BBB-sf/NR | | Property Type – Subtype: | Mixed Use – Office/Retail |
Original Principal Balance(1): | $40,000,000 | | Location: | New York, NY |
Cut-off Date Balance(1): | $40,000,000 | | Size: | 600,415 SF |
% of Initial Pool Balance: | 4.2% | | Cut-off Date Balance Per SF(1): | $977.32 |
Loan Purpose: | Refinance | | Maturity Date Balance Per SF(1): | $977.32 |
Borrower Sponsors: | Vornado Realty L.P.; OPG Investment Holdings (US), LLC | | Year Built/Renovated: | 1957 / 2015 |
Guarantors: | Vornado Realty L.P.; OPG Investment Holdings (US), LLC | | Title Vesting: | Fee |
Mortgage Rate: | 3.48600% | | Property Manager: | Self-managed |
Note Date: | November 26, 2019 | | Current Occupancy (As of): | 97.4% (10/1/2019) |
Seasoning: | 2 months | | YE 2018 Occupancy: | 92.2% |
Maturity Date: | December 8, 2029 | | YE 2017 Occupancy: | 92.6% |
IO Period: | 120 months | | YE 2016 Occupancy: | 94.3% |
Loan Term (Original): | 120 months | | YE 2015 Occupancy(4): | 89.8% |
Amortization Term (Original): | NAP | | Appraised Value(5): | $1,210,000,000 |
Loan Amortization Type: | Interest-only, Balloon | | Appraised Value Per SF(5): | $2,015.27 |
Call Protection(2): | L(26),D(87),O(7) | | Appraisal Valuation Date: | October 31, 2019 |
| | | | | |
Lockbox Type: | Hard/Springing | | Underwriting and Financial Information |
Additional Debt(1): | Yes | | TTM NOI (9/30/2019): | $50,961,537 |
Additional Debt Type (Balance)(1): | Pari Passu ($546,800,000); Subordinate Notes ($213,200,000) | | YE 2018 NOI: | $48,557,496 |
| | | YE 2017 NOI: | $46,541,346 |
| | | YE 2016 NOI: | $42,701,194 |
| | | U/W Revenues: | $87,327,989 |
| | | U/W Expenses: | $28,901,495 |
Escrows and Reserves(3) | | U/W NOI: | $58,426,495 |
| Initial | Monthly | Cap | | U/W NCF: | $56,776,391 |
Taxes | $0 | Springing | NAP | | U/W DSCR based on NOI/NCF(1): | 2.81x / 2.73x |
Insurance | $0 | Springing | NAP | | U/W Debt Yield based on NOI/NCF(1): | 10.0% / 9.7% |
Replacement Reserve | $0 | Springing | NAP | | U/W Debt Yield at Maturity based on NOI/NCF(1): | 10.0% / 9.7% |
TI/LC Reserve | $0 | Springing | NAP | | Cut-off Date LTV Ratio(1): | 48.5% |
Outstanding TI/LC | $3,197,699 | $0 | NAP | | LTV Ratio at Maturity(1): | 48.5% |
Free Rent | $6,378,315 | $0 | NAP | | | |
| | | | | | | |
Sources and Uses |
Sources | | | | | Uses | | | |
Senior loan | $586,800,000 | | 70.7% | | Payoff existing debt | $800,000,000 | | 96.4% |
Junior loan | 213,200,000 | | 25.7 | | Defeasance costs | 14,157,786 | | 1.7 |
Existing debt reserve accounts | 20,051,781 | | 2.4 | | Upfront reserves | 9,576,014 | | 1.2 |
Borrower Sponsor equity | 9,510,787 | | 1.1 | | Closing costs | 5,828,767 | | 0.7 |
Total Sources | $829,562,568 | | 100.0% | | Total Uses | $829,562,568 | | 100.0% |
(1) | The 650 Madison Avenue Mortgage Loan (as defined below) is part of the 650 Madison Avenue Whole Loan (as defined below), which is evidenced by (i) 21 pari passu notes with an aggregate original balance of $586,800,000 and (ii) four subordinate B-notes with an aggregate original principal balance of $213,200,000 (the “650 Madison B-Notes”). The Cut-off Date Balance Per SF, Maturity Date Balance Per SF, U/W NOI Debt Yield, U/W NCF Debt Yield, U/W NOI DSCR, U/W NCF DSCR, Cut-off Date LTV Ratio and LTV Ratio at Maturity or ARD numbers presented above are based on the aggregate principal balance of the promissory notes comprising the 650 Madison Senior Loan, without regard to the 650 Madison B-Notes. The Cut-off Date Balance Per SF, Maturity or ARD Date Balance Per SF, U/W Debt Yield based on NOI/NCF, U/W DSCR based on NOI/NCF, Cut-off Date LTV Ratio and LTV Ratio at Maturity or ARD numbers based on the combined balance of the entire 650 Madison Whole Loan are $1,332.41, 1,332.41, 7.3%, 7.1%, 2.06x, 2.00x, 66.1% and 66.1% respectively. |
(2) | Defeasance of the 650 Madison Avenue Whole Loan is permitted at any time after the earlier to occur of (a) the end of the two-year period commencing on the closing date of the securitization of the last 650 Madison pari passu companion loan to be securitized and (b) November 26, 2022. The assumed lockout period of 26 payments is based on the WFCM 2020-C55 closing date in February 2020. The actual lockout period may be longer. |
(3) | See “Escrows” below for a full description of the Escrows and Reserves. |
(4) | 2015 occupancy was mainly attributable to Crate & Barrel vacating 61,351 square feet of ground level retail and second floor office space. Since then, the borrower sponsors have executed leases with multiple luxury retailers including Celine, Moncler USA Inc. (each utilizing its space as its respective brand’s flagship location) and B.A.P.E. in the ground floor retail space and an institutional tenant, Sotheby’s, in the second floor office space. |
(5) | The appraised value is based on the hypothetical “as-is” appraised value of $1,210,000,000 ($2,015 per square foot), which assumes all outstanding free rent and tenant improvements are funded in upfront reserve accounts by the borrower on the origination date. The “as-is” appraised value is $1,200,000,000 ($1,999 per square foot) and results in Cut-off Date LTV and Maturity Date LTV of 48.9% on the 650 Madison Avenue Senior Loan and a Cut-off Date LTV and Maturity Date LTV of 66.7% on the 650 Madison Avenue Whole Loan. |
THE INFORMATION IN THIS STRUCTURAL AND COLLATERAL TERM SHEET IS NOT COMPLETE AND MAY BE AMENDED PRIOR TO THE TIME OF SALE. THIS TERM SHEET IS NOT AN OFFER TO SELL THESE SECURITIES AND IT IS NOT A SOLICITATION OF AN OFFER TO BUY THESE SECURITIES IN ANY JURISDICTION WHERE THE OFFER OR SALE IS NOT PERMITTED.
61
Mixed Use – Office/Retail | Loan #3 | Cut-off Date Balance: | | $40,000,000 |
650 Madison Avenue | 650 Madison Avenue | Cut-off Date LTV: | | 48.5% |
New York, NY 10022 | | U/W NCF DSCR: | | 2.73x |
| | U/W NOI Debt Yield: | | 10.0% |
The Mortgage Loan. The 650 Madison Avenue mortgage loan (the “650 Madison Mortgage Loan”) is part of a whole loan evidenced by (i) 21 senior pari passu promissory notes with an aggregate original principal balance of $586,800,000 (the “650 Madison Avenue Senior Loan”) and (ii) four B-notes with an aggregate original principal balance of $213,200,000, which are subordinate to the 650 Madison Avenue Senior Loan (the “650 Madison Avenue B-Notes,” and together with the 650 Madison Avenue Senior Loan, the “650 Madison Avenue Whole Loan”). The 650 Madison Avenue Whole Loan was co-originated by Barclays Capital Real Estate Inc., Citi Real Estate Funding Inc., Goldman Sachs Bank USA and BMO Harris Bank N.A. The 650 Madison Avenue Whole Loan is secured by a first lien mortgage encumbering the borrower’s fee interest in a 600,415 square-foot Class A office and retail property located at 650 Madison Avenue in New York City (the “650 Madison Avenue Property”). Promissory Note A-3-3, with an original principal balance of $40,000,000 will be included in the WFCM 2020-C55 securitization trust. The 650 Madison Avenue Whole Loan will be serviced pursuant to the pooling and servicing agreement for the MAD 2019-650M securitization trust. See “Description of the Mortgage Pool—The Whole Loans—The Non-Serviced AB Whole Loans—The 650 Madison Avenue Whole Loan“ and “Pooling and Servicing Agreement—Servicing of the Non-Serviced Mortgage Loans” in the Preliminary Prospectus.
Note Summary
Notes | Original Principal Balance | Cut-off Date
Balance | Note Holder | Controlling Interest |
A-1-1 | $50,000,000 | $50,000,000 | CGCMT 2019-C7 | No(1) |
A-2-1, A-1-3 | $50,000,000 | $50,000,000 | GSMS 2020-GC45 | No |
A-1-4, A-1-6 | $137,900,000 | $137,900,000 | Citi Real Estate Funding Inc. | No |
A-1-5 | $45,000,000 | $45,000,000 | Benchmark 2020-B16(2) | No |
A-1-2-1 | $40,000,000 | $40,000,000 | Cantor Commercial Real Estate Lending L.P. | No |
A-2-2 | $50,000,000 | $50,000,000 | Goldman Sachs Mortgage Company | No |
A-2-3 | $20,000,000 | $20,000,000 | Goldman Sachs Mortgage Company | No |
A-2-4 | $20,000,000 | $20,000,000 | Goldman Sachs Mortgage Company | No |
A-2-5 | $10,000,000 | $10,000,000 | Goldman Sachs Mortgage Company | No |
A-2-6 | $6,450,000 | $6,450,000 | Goldman Sachs Mortgage Company | No |
A-2-7 | $5,000,000 | $5,000,000 | Goldman Sachs Mortgage Company | No |
A-2-8 | $5,000,000 | $5,000,000 | Goldman Sachs Mortgage Company | No |
A-3-1 | $60,000,000 | $60,000,000 | BBCMS 2020-C6 | No |
A-3-2 | $46,450,000 | $46,450,000 | An affiliate of Barclays | No |
A-3-3 | $40,000,000 | $40,000,000 | WFCM 2020-C55 | No |
A-4, A-5, A-6, A-7 | $1,000,000 | $1,000,000 | MAD 2019-650M | No |
B-1, B-2, B-3, B-4 | $213,200,000 | $213,200,000 | MAD 2019-650M | Yes(1) |
Total | $800,000,000 | $800,000,000 | | |
(1) | The initial controlling note is note B-1, so long as no related control appraisal period has occurred and is continuing. If and for so long as a control appraisal period has occurred and is continuing, then the controlling note will be note A-1-1. See “Description of the Mortgage Pool— The Whole Loans—The Non-Serviced AB Whole Loans—The 650 Madison Avenue Whole Loan” in the Preliminary Prospectus. |
(2) | The Benchmark 2020-B16 trust is expected to close on February 12, 2020. |
The Borrower and Borrower Sponsors. The borrower for the 650 Madison Avenue Whole Loan is 650 Madison Owner LLC, a Delaware limited liability company and special purpose entity with two independent directors in its organizational structure. Legal counsel to the borrower delivered a non-consolidation opinion in connection with the origination of the 650 Madison Avenue Whole Loan. The non-recourse carveout guarantors are Vornado Realty L.P. (“Vornado”) and OPG Investment Holdings (US), LLC (“Oxford”). Vornado and Oxford are liable on a several basis, 50% with respect to Vornado and 50% with respect to Oxford, subject to, with respect to each guarantor, an $80,000,000 cap on the full recourse carve-outs relating to bankruptcy and substantive consolidation and a $400,000,000 cap on all other guaranteed obligations.
The borrower sponsors of the 650 Madison Avenue Whole Loan are Vornado and Oxford. Vornado is one of the largest owners and operators of commercial real estate in the United States with a portfolio of Class A office, high-value street retail and other property types, primarily located in New York City, aggregating over 34.6 million square feet. Oxford is a global real estate investor with approximately $45.0 billion of assets under management on behalf of Ontario Municipal Employees Retirement System, one of Canada’s largest pension plans. In New York City, Oxford partnered with Crown Acquisitions to acquire Olympic Tower (a 380,000 square-foot office tower with retail space, which includes the Cartier Mansion, Versace townhouse, Furla and Armani Exchange), and with Related Companies in the development of Hudson Yards. The joint venture of Vornado and Oxford includes other investors, such as Crown Acquisitions. Crown Acquisitions is a real estate firm focused on luxury retail and has previously served as the 650 Madison Avenue Property’s retail operating advisor. The borrower sponsors are subject to pending lawsuits, the majority of which are based on tort. See “Description of the Mortgage Pool—Loan Purpose; Default History, Bankruptcy Issues and Other Proceedings” in the Prospectus.
THE INFORMATION IN THIS STRUCTURAL AND COLLATERAL TERM SHEET IS NOT COMPLETE AND MAY BE AMENDED PRIOR TO THE TIME OF SALE. THIS TERM SHEET IS NOT AN OFFER TO SELL THESE SECURITIES AND IT IS NOT A SOLICITATION OF AN OFFER TO BUY THESE SECURITIES IN ANY JURISDICTION WHERE THE OFFER OR SALE IS NOT PERMITTED.
62
Mixed Use – Office/Retail | Loan #3 | Cut-off Date Balance: | | $40,000,000 |
650 Madison Avenue | 650 Madison Avenue | Cut-off Date LTV: | | 48.5% |
New York, NY 10022 | | U/W NCF DSCR: | | 2.73x |
| | U/W NOI Debt Yield: | | 10.0% |
The Property. The 650 Madison Avenue Property is a 27-story, 600,415 square feet Class A office building with grade level retail located in Midtown Manhattan on Madison Avenue between 59th and 60th Streets. The 650 Madison Avenue Property consists of 564,255 square feet of Class A office space and 36,160 square feet of ground floor retail space, which is inclusive of below-grade storage and flex space. The 650 Madison Avenue Property was originally constructed in 1957 as an eight-story building and in 1987 underwent a significant expansion and renovation that added the office tower and was most recently renovated in 2015. Based on the underwritten rent roll dated October 1, 2019, the 650 Madison Avenue Property is currently 97.4% leased (based on net rentable area (“NRA”)) to a diverse tenant roster including fashion (Ralph Lauren Corporation (“Ralph Lauren”)), healthcare (S.K.I. Realty Inc. doing business as Memorial Sloan Kettering Cancer Center (“MSKCC”)) and luxury goods (Celine Inc. (“Celine”)), as well as finance (“Willett Advisors LLC”). Each of the top three tenants by underwritten rent (see “Major Tenants” below) are investment grade rated and account for 64.6% of NRA and 56.1% of UW rent.
Office (94.5% of Occupied NRA; 72.0% of UW Rent)
The 564,255 square feet of Class A office space at the 650 Madison Avenue Property is currently 97.9% occupied by 17 tenants that collectively contribute 72.0% of underwritten rent (inclusive of storage rent derived from office tenants). 358,491 square feet of the office space (65.9% of Class A office NRA) at the 650 Madison Avenue Property is leased to two investment grade-rated office tenants (Ralph Lauren and MSKCC). The largest office tenant at the 650 Madison Avenue Property, Ralph Lauren (rated A2/A- by Moody’s/S&P), occupies 46.1% of the 650 Madison Avenue Property’s NRA and accounts for 32.5% of underwritten rent. The tenant has occupied space in the 650 Madison Avenue Property since 1989 and has expanded several times. The 650 Madison Avenue Property serves as Ralph Lauren’s international headquarters. Ralph Lauren designs, markets and distributes apparel, accessories, fragrances and home furnishings under a wide range of brands and its operations include wholesale, retail, and licensing.
The second largest office tenant at the 650 Madison Avenue Property, MSKCC (rated AA/Aa3/AA- by Moody’s/Fitch/S&P), occupies 16.8% of the 650 Madison Avenue Property’s NRA and accounts for 12.3% of underwritten rent. MSKCC signed a 10-year lease in 2013 to take over the approximately 100,000 square foot medical office space that was previously occupied by Columbia Doctors, a faculty-run medical practice of Columbia University. The tenant has a separate entrance on the 60th Street side of the 650 Madison Avenue Property and uses the space for medical purposes. MSKCC is a cancer treatment and research institution in New York City and was founded in 1884 as the New York Cancer Hospital. According to the appraisal, MSKCC is the largest and oldest private cancer center in the world, and is one of 50 National Cancer Institute-designated Comprehensive Cancer Centers.
Retail (5.5% of Occupied NRA; 28.0% of UW Rent)
The 36,160 square feet of ground floor retail space at the 650 Madison Avenue Property is currently 88.4% occupied by five tenants that collectively contribute 28.0% of underwritten rent (inclusive of storage rent derived from retail tenants).
The ground floor retail space spans an entire block of the Madison Avenue retail corridor and, along with the second floor office space, was previously primarily occupied by Crate & Barrel until 2015. Since then, the borrower sponsors have executed leases with multiple luxury retailers including Celine, Moncler USA Inc (“Moncler”) (each utilizing its space as its respective brand’s flagship location) and USAPE LLC (“B.A.P.E.”) in the ground floor retail space and an institutional tenant, Sotheby’s Int’l Realty Inc (“Sotheby’s”), in the second floor office space. The re-leasing has further diversified the rent roll at the 650 Madison Avenue Property and, based on UW gross rent, the new leases have extended the weighted average lease expiration date of the space previously occupied by Crate & Barrel (excluding Tod’s, which has been a ground floor retail tenant at the 650 Madison Avenue Property since 1998) to August 2029.
The largest retail tenant by underwritten rent, Celine, is a wholly owned subsidiary of LVMH (rated A1/A+ by Moody’s/S&P), occupies 1.7% of NRA and accounts for 11.3% of underwritten rent. Founded in 1945 by Céline Vipiana, Celine is a French ready-to-wear and leather luxury goods brand that has been owned by LVMH group (OTCMKTS: LVMUY) since 1996. Celine owns approximately 140 stores worldwide and is distributed through a network including department stores such as Saks Fifth Avenue (New York), Harrods (London) and Galeries Lafayette (Paris).The retail space showcases Celine’s NYC flagship store as well as the world’s largest Celine store.
THE INFORMATION IN THIS STRUCTURAL AND COLLATERAL TERM SHEET IS NOT COMPLETE AND MAY BE AMENDED PRIOR TO THE TIME OF SALE. THIS TERM SHEET IS NOT AN OFFER TO SELL THESE SECURITIES AND IT IS NOT A SOLICITATION OF AN OFFER TO BUY THESE SECURITIES IN ANY JURISDICTION WHERE THE OFFER OR SALE IS NOT PERMITTED.
63
Mixed Use – Office/Retail | Loan #3 | Cut-off Date Balance: | | $40,000,000 |
650 Madison Avenue | 650 Madison Avenue | Cut-off Date LTV: | | 48.5% |
New York, NY 10022 | | U/W NCF DSCR: | | 2.73x |
| | U/W NOI Debt Yield: | | 10.0% |
The following table presents certain information relating to the tenancy at the 650 Madison Property:
Major Tenants
Tenant Name | Credit Rating
(Fitch/
Moody’s/
S&P)(1) | Tenant
NRSF(2) | % of
NRSF | Annual
U/W Base
Rent PSF(3) | Annual
U/W Base
Rent(3) | % of Total Annual U/W Base Rent | Lease
Expiration
Date | Extension Options | Termination
Option
(Y/N) |
Major Tenants | | | | | | | | |
Ralph Lauren | NR/A2/A- | 277,016 | 46.1% | $89.41 | $24,767,403 | 32.5% | 12/31/2024 | 1, 10-year | N |
MSKCC | AA/Aa3/AA- | 100,700 | 16.8% | $92.97 | $9,362,079 | 12.3% | 7/31/2023 | 1, 5-year | Y(4) |
Willett Advisors LLC | NR/NR/NR | 25,732 | 4.3% | $155.00 | $3,988,460 | 5.2% | 12/31/2024 | None | N |
Sotheby’s | NR/B3/B+ | 37,772 | 6.3% | $91.60 | $3,459,915 | 4.5% | 10/31/2035 | 1, 5-year | N |
BC Partners Inc. | NR/NR/NR | 19,380 | 3.2% | $118.58 | $2,298,086 | 3.0% | 1/31/2027 | None | N |
Top 5 Office Tenants | | 460,600 | 76.7% | $95.26 | $43,875,943 | 57.6% | | | |
| | | | | | | | | |
Other Office Tenants(5) | | 92,080 | 15.3% | $119.11 | $10,967,991 | 14.4% | | | |
| | | | | | | | | |
Office Tenants Subtotal/Wtd. Avg. | | 552,680 | 92.0% | $99.23 | $54,843,935 | 72.0% | | | |
| | | | | | | | | |
Celine | NR/A1/A+ | 10,223 | 1.7% | $841.24 | $8,600,017 | 11.3% | 2/28/2029 | None | N |
Moncler | NR/NR/NR | 8,985 | 1.5% | 667.78 | $6,000,000 | 7.9% | 8/31/2026 | 1, 5-year | N |
Deva Inc. (“Tod’s”) | NR/NR/NR | 7,867 | 1.3% | 680.90 | $5,356,615 | 7.0% | 10/13/2023 | None | N |
B.A.P.E.(6) | NR/NR/NR | 3,705 | 0.6% | 298.52 | $1,106,000 | 1.5% | 7/31/2030 | None | N |
MB Worldwide LLC(“Domenico Vacca”)(6) | NR/NR/NR | 1,202 | 0.2% | 239.60 | $288,000 | 0.4% | 1/1/2030 | None | N |
Retail Subtotal | 31,982 | 5.3% | $667.58 | $21,350,632 | 28.0% | | | |
| | | | | | | | |
Occupied Collateral Total | 584,662 | 97.4% | $130.32 | $76,194,567 | 100.0% | | | |
Vacant Space(7) | 15,753 | 2.6% | | | | | | |
| | | | | | | | |
Collateral Total | 600,415 | 100.0% | | | | | | |
| | | | | | | | | |
(1) | Certain ratings are those of the parent company whether or not the parent company guarantees the lease. |
(2) | Certain office tenants and retail tenants have storage/miscellaneous square feet included in their respective space. |
(3) | Annual U/W Base Rent includes contractual rent steps through July 2020 for non-investment grade rated tenants and the straight-line average for investment grade rated tenants through the lease term totaling $1,406,588 Other Office Tenants Annual U/W Base Rent includes an elevator marketing contract with Captivate LLC of $10,080 per year, but with no attributable square footage. Vacant Space includes a 1,616 square foot café tenant that is leased on a month-to-month basis with no attributable underwritten base rent. |
(4) | MSKCC has a one-time option to terminate its lease upon at least 18 months prior written notice to the landlord, provided that (a) the termination date is not earlier than July 1, 2020 or not later than June 30, 2022, (b) the termination date is at least 18 months after the termination notice is received by the landlord, and (c) MSKCC has paid to the landlord the termination payment simultaneously with the giving of such termination notice. |
(5) | Other Office Tenants Net Rentable Area (SF) includes a 1,196 square-foot property management office with no attributable U/W Base Rent. |
(6) | B.A.P.E. and Domenico Vacca are currently completing the build-out of their respective spaces and are expected to take occupancy in early 2020. |
(7) | Vacant Net Rentable Area (SF) includes 11,575 square feet of office space and 4,178 square feet of retail space. |
THE INFORMATION IN THIS STRUCTURAL AND COLLATERAL TERM SHEET IS NOT COMPLETE AND MAY BE AMENDED PRIOR TO THE TIME OF SALE. THIS TERM SHEET IS NOT AN OFFER TO SELL THESE SECURITIES AND IT IS NOT A SOLICITATION OF AN OFFER TO BUY THESE SECURITIES IN ANY JURISDICTION WHERE THE OFFER OR SALE IS NOT PERMITTED.
64
Mixed Use – Office/Retail | Loan #3 | Cut-off Date Balance: | | $40,000,000 |
650 Madison Avenue | 650 Madison Avenue | Cut-off Date LTV: | | 48.5% |
New York, NY 10022 | | U/W NCF DSCR: | | 2.73x |
| | U/W NOI Debt Yield: | | 10.0% |
The following table presents certain information relating to the lease rollover schedule at the 650 Madison Property:
Lease Expiration Schedule(1)(2)
Year Ending
December 31, | No. of
Leases
Expiring | Expiring
NRSF | % of
Total
NRSF | Cumulative
Expiring
NRSF | Cumulative
% of Total
NRSF | Annual
U/W
Base Rent(3) | % of Total
Annual
U/W Base
Rent | Annual
U/W
Base Rent
PSF(3) |
MTM | 0 | 0 | 0.0% | 0 | 0.0% | 0 | 0.0% | $0.00 |
2020 | 2 | 20,317 | 3.4% | 20,317 | 3.4% | $2,479,060 | 3.3% | $122.02 |
2021 | 2 | 12,888 | 2.1% | 33,205 | 5.5% | $1,538,559 | 2.0% | $119.38 |
2022 | 1 | 3,218 | 0.5% | 36,423 | 6.1% | $353,980 | 0.5% | $110.00 |
2023 | 4 | 114,905 | 19.1% | 151,328 | 25.2% | $15,320,804 | 20.1% | $133.33 |
2024 | 10 | 313,250 | 52.2% | 464,578 | 77.4% | $30,121,123 | 39.5% | $96.16 |
2025 | 1 | 6,341 | 1.1% | 470,919 | 78.4% | $729,215 | 1.0% | $115.00 |
2026 | 2 | 16,755 | 2.8% | 487,674 | 81.2% | $6,971,250 | 9.1% | $416.07 |
2027 | 4 | 30,029 | 5.0% | 517,703 | 86.2% | $3,866,158 | 5.1% | $128.75 |
2028(4) | 1 | 0 | 0.0% | 517,703 | 86.2% | $10,080 | 0.0% | $0.00 |
2029 | 1 | 10,223 | 1.7% | 527,926 | 87.9% | $8,600,017 | 11.3% | $841.24 |
2030 | 4 | 17,768 | 3.0% | 545,694 | 90.9% | $2,744,405 | 3.6% | $154.46 |
Thereafter(5) | 1 | 38,968 | 6.5% | 584,662 | 97.4% | $3,459,915 | 4.5% | $88.79 |
Vacant | 0 | 15,753 | 2.6% | 600,415 | 100.0% | $0 | 0.0% | $0.00 |
Total/Weighted Average | 33 | 600,415 | 100.0% | | | $76,194,567 | 100.0% | $130.32 |
(1) | Information obtained from the underwritten rent roll. |
(2) | Certain tenants may have lease termination options that are exercisable prior to the originally stated expiration date of the subject lease and that are not considered in the Lease Expiration Schedule. |
(3) | U/W Base Rent includes contractual rent steps through July 2020 for non-investment grade rated tenants and the straight-line average for investment grade rated tenants through the lease term and excludes vacant space. |
(4) | 2028 includes an elevator marketing contract with Captivate LLC with $10,080 of attributable Annual U/W Base Rent, but no attributable square footage. |
(5) | Thereafter includes a property management office that has no attributable underwritten base rent. |
The following table presents historical occupancy percentages at the 650 Madison Property:
Historical Occupancy
12/31/2015(1)(2) | | 12/31/2016(1)(2) | | 12/31/2017(2) | | 12/31/2018(2) | | 10/1/2019(3) |
89.8% | | 94.3% | | 92.6% | | 92.2% | | 97.4% |
| | | | | | | | | |
(1) | 2015 occupancy was mainly attributable to Crate & Barrel vacating 61,351 square feet of ground level retail and second floor office space. Since then, the borrower sponsors have executed leases with multiple luxury retailers including Celine, Moncler (each utilizing its space as its respective brand’s flagship location) and B.A.P.E. in the ground floor retail space and an institutional tenant, Sotheby’s, in the second floor office space. |
(2) | Information obtained from the borrower. |
(3) | Information obtained from the underwritten rent roll. |
THE INFORMATION IN THIS STRUCTURAL AND COLLATERAL TERM SHEET IS NOT COMPLETE AND MAY BE AMENDED PRIOR TO THE TIME OF SALE. THIS TERM SHEET IS NOT AN OFFER TO SELL THESE SECURITIES AND IT IS NOT A SOLICITATION OF AN OFFER TO BUY THESE SECURITIES IN ANY JURISDICTION WHERE THE OFFER OR SALE IS NOT PERMITTED.
65
Mixed Use – Office/Retail | Loan #3 | Cut-off Date Balance: | | $40,000,000 |
650 Madison Avenue | 650 Madison Avenue | Cut-off Date LTV: | | 48.5% |
New York, NY 10022 | | U/W NCF DSCR: | | 2.73x |
| | U/W NOI Debt Yield: | | 10.0% |
Operating History and Underwritten Net Cash Flow. The following table presents certain information relating to the historical operating performance and underwritten net cash flow at the 650 Madison Property:
Cash Flow Analysis
| 2016 | | 2017 | | 2018 | | TTM
9/30/2019(1) | | U/W(1) | | %(2) | | U/W $ per
SF | |
Base Rent | $60,021,833 | | $65,301,771 | | $65,936,214 | | $68,490,075 | | $74,787,979 | | 82.5% | | $124.56 | |
Contractual Rent Steps(3) | 0 | | 0 | | 0 | | 0 | | 1,406,588 | | 1.6 | | 2.34 | |
Grossed Up Vacant Space | 0 | | 0 | | 0 | | 0 | | 3,327,410 | | 3.7 | | 5.54 | |
Gross Potential Rent | $60,021,833 | | $65,301,771 | | $65,936,214 | | $68,490,075 | | $79,521,977 | | 87.7% | | $132.45 | |
Other Income | 222,390 | | 265,643 | | 319,055 | | 362,098 | | 371,407 | | 0.4 | | 0.62 | |
Total Recoveries | 7,020,651 | | 7,750,395 | | 8,784,226 | | 9,361,042 | | 10,762,016 | | 11.9 | | 17.92 | |
Net Rental Income | $67,264,874 | | $73,317,809 | | $75,039,495 | | $78,213,215 | | $90,655,399 | | 100.0% | | $150.99 | |
(Vacancy & Credit Loss) | (86,339) | | (829,105) | | 0 | | 75,003 | | (3,327,410)(4) | | (3.7) | | (5.54) | |
Effective Gross Income | $67,178,535 | | $72,488,704 | | $75,039,495 | | $78,288,218 | | $87,327,989 | | 96.3% | | $145.45 | |
| | | | | | | | | | | | | | |
Real Estate Taxes | 15,935,782 | | 16,699,910 | | 17,606,496 | | 18,301,078 | | 19,659,925 | | 22.5 | | 32.74 | |
Insurance | 396,387 | | 393,355 | | 378,835 | | 380,309 | | 382,942 | | 0.4 | | 0.64 | |
Management Fee | 1,117,542 | | 1,475,379 | | 1,413,137 | | 1,402,802 | | 873,280 | | 1.0 | | 1.45 | |
Other Operating Expenses | 7,027,630 | | 7,378,714 | | 7,083,531 | | 7,242,492 | | 7,985,348 | | 9.1 | | 13.30 | |
Total Operating Expenses | $24,477,341 | | $25,947,358 | | $26,481,999 | | $27,326,681 | | $28,901,495 | | 33.1% | | $48.14 | |
| | | | | | | | | | | | | | |
Net Operating Income | $42,701,194 | | $46,541,346 | | $48,557,496 | | $50,961,537 | | $58,426,495 | | 66.9% | | $97.31 | |
Replacement Reserves | 0 | | 0 | | 0 | | 0 | | 150,104 | | 0.2 | | 0.25 | |
TI/LC | 0 | | 0 | | 0 | | 0 | | 1,500,000 | | 1.7 | | 2.50 | |
Net Cash Flow | $42,701,194 | | $46,541,346 | | $48,557,496 | | $50,961,537 | | $56,776,391 | | 65.0% | | $94.56 | |
| | | | | | | | | | | | | | |
NOI DSCR | 2.05x | | 2.24x | | 2.33x | | 2.45x | | 2.81x | | | | | |
NCF DSCR | 2.05x | | 2.24x | | 2.33x | | 2.45x | | 2.73x | | | | | |
NOI Debt Yield | 7.3% | | 7.9% | | 8.3% | | 8.7% | | 10.0% | | | | | |
NCF Debt Yield | 7.3% | | 7.9% | | 8.3% | | 8.7% | | 9.7% | | | | | |
(1) | The increase in Base Rent from TTM 9/30/2019 to Underwritten is primarily attributable to the signing of six new leases since December 2018. |
(2) | Represents (i) percent of Net Rental Income for all revenue fields and for Vacancy & Credit Loss and (ii) percent of Effective Gross Income for all other fields. |
(3) | Contractual Rent Steps includes contractual rent steps through July 2020 for non-investment grade rated tenants and the straight-line average for investment grade rated tenants through the lease term. |
(4) | The underwritten economic vacancy is 3.7%. The 650 Madison Property was 97.4% physically occupied as of October 1, 2019. |
Appraisal. The appraiser concluded to an “as-is” appraised value of $1,210,000,000 as of October 31, 2019 inclusive of the assumption that the borrower reserved for all outstanding tenant improvements and leasing commissions at loan origination. The borrower reserved $6,378,315 to fund remaining free rent for tenants and $3,197,699 for outstanding tenant improvements and leasing commissions at the 650 Madison Property.
Environmental Matters. According to the Phase I environmental site assessment dated October 29, 2019, there was no evidence of any recognized environmental conditions at the 650 Madison Property.
Market Overview and Competition. The 650 Madison Avenue Property occupies a full block along Madison Avenue between East 59th and 60th Streets within the Plaza District office submarket and the Madison Avenue retail submarket. According to a third party research report, the Plaza District is the largest office submarket by square feet in the country and is bounded by 65th Street to the north, the East River to the east, 47th Street on the south, and Avenue of the Americas on the west. The Madison Avenue retail submarket is located on Madison Avenue between 57th and 72nd Streets. According to the appraisal, Class A office space in the Plaza District had an inventory of approximately 78.2 million square feet of office space, direct asking rents of $99.29 per square foot and a direct vacancy rate of 8.1% as of the third quarter of 2019. According to the appraisal, the 650 Madison Avenue Property is located within the Madison/Fifth Avenue Class A office micro-market. As of the third quarter of 2019, the Madison/Fifth Avenue Class A office micro-market had an inventory of approximately 18.9 million square feet of office space and direct asking rents of $102.23 per square foot. The 650 Madison Avenue Property’s weighted average office underwritten rent per square foot equals $99.21.
THE INFORMATION IN THIS STRUCTURAL AND COLLATERAL TERM SHEET IS NOT COMPLETE AND MAY BE AMENDED PRIOR TO THE TIME OF SALE. THIS TERM SHEET IS NOT AN OFFER TO SELL THESE SECURITIES AND IT IS NOT A SOLICITATION OF AN OFFER TO BUY THESE SECURITIES IN ANY JURISDICTION WHERE THE OFFER OR SALE IS NOT PERMITTED.
66
Mixed Use – Office/Retail | Loan #3 | Cut-off Date Balance: | | $40,000,000 |
650 Madison Avenue | 650 Madison Avenue | Cut-off Date LTV: | | 48.5% |
New York, NY 10022 | | U/W NCF DSCR: | | 2.73x |
| | U/W NOI Debt Yield: | | 10.0% |
The appraiser concluded blended market rents of $108.87 per square foot and $986.96 per square foot for the office and ground level retail space, respectively. Based on the appraisal’s market rents, the 650 Madison Avenue Property’s in place rent is approximately 8.0% below market rent.
Market Rent Analysis (Office) | | Market Rent Analysis (Retail) |
Floors | Rent PSF | | Tenant Category | Rent PSF |
Concourse | $50.00 | | Below Grade | $35.00 |
2 to 7 | $97.00 | | 60th Corner | $1,250.00 |
8 to 10 | $106.00 | | 60th Street | $250.00 |
11 to 15 | $116.00 | | 59th Corner | $1,250.00 |
16 to 18 | $127.00 | | 59th Street | $350.00 |
19 to 22 | $137.00 | | 59th Midblock | $550.00 |
23 to 27 | $147.00 | | Inline | $1,250.00 |
The following table presents certain information relating to comparable office properties to 650 Madison Property:
Comparable Office Leases(1)
Property Name/Location | Year Built | NRA (SF) | Tenant | Lease
Size
(SF) | Rent PSF(2) | Commencement | Lease
Term
(Years) | Lease
Type |
12 East 49th Street | 1967 | 899,000 | Echo Street Capital | 16,200 | $128.15 | Sep-2019 | 10 | Gross |
535 Madison Avenue | 1981 | 444,293 | AGL Credit Management | 9,493 | $123.12 | Sep-2019 | 5 | Gross |
320 Park Avenue | 1994 | 656,436 | Windrose Health Investors | 8,714 | $92.72 | Aug-2019 | 10 | Gross |
65 East 55th Street | 1986 | 528,552 | Addition Financial | 14,901 | $177.11 | Aug-2019 | 12 | Gross |
660 Madison Avenue | 1958 | 475,893 | Trevi Health Capital | 8,320 | $119.92 | Jul-2019 | 8 | Gross |
450 Park Avenue | 1972 | 247,242 | Nitorum Capital | 10,338 | $93.58 | May-2019 | 10 | Gross |
65 East 55th Street | 1986 | 528,552 | Clear | 10,185 | $115.00 | May-2019 | 11 | Gross |
499 Park Avenue | 1980 | 265,000 | Cornell Capital | 11,606 | $109.50 | Apr-2019 | 6 | Gross |
510 Madison Avenue | 2009 | 350,000 | Stone Ridge Asset Management | 5,575 | $148.75 | Apr-2019 | 5 | Gross |
450 Park Avenue | 1972 | 247,242 | Jones Day | 10,338 | $107.20 | Mar-2019 | 10 | Gross |
| (1) | Information obtained from appraisal. |
| (2) | Comparable Rent PSF reflects the appraisal net rent PSF and accounts for certain appraisal adjustments. |
Comparable Retail Leases(1)
Property Name/Location | Tenant | Lease
Size (SF) | Grade Floor
Rent PSF(2) | Average
Rent PSF(2) | Commencement | Lease
Term
(Years) | Lease Type |
645 Madison Avenue | Byredo | 1,192 | $1,154.39 | NAP | Sep-2019 | 10 | Gross |
680 Madison Avenue | Missoni | 4,125 | $1,052.62 | $890.07 | Apr-2019 | 15 | Gross |
432 Park Avenue | Amaffi | 4,000 | $429,96 | NAP | Mar-2019 | 10 | Gross |
680 Madison Avenue | Sergio Rossi | 1,200 | $1,150.49 | $874.50 | Jan-2019 | 10 | Gross |
706 Madison Avenue | Hermes | 34,688 | $1,409.78 | $375.44 | Jan-2019 | 20 | Gross |
57 East 57th Street | Zilli | 2,500 | $550.80 | NAP | Nov-2018 | 10 | Gross |
620 Madison Avenue | Balenciaga | 7,600 | $852.53 | $655.34 | Jul-2018 | 15 | Gross |
655 Madison Avenue | Schutz | 1,656 | $1,309.16 | $945.03 | Jul-2018 | 10 | Gross |
611 Madison Avenue | Deciem | 400 | $1,160.44 | NAP | Jan-2018 | 10 | Gross |
680 Madison Avenue | Ralph & Russo | 5,950 | $1,136.27 | $545.97 | Jan-2018 | 15 | Gross |
(2) | Comparable Average Rent PSF reflects the appraisal net rent PSF and accounts for certain appraisal adjustments. |
THE INFORMATION IN THIS STRUCTURAL AND COLLATERAL TERM SHEET IS NOT COMPLETE AND MAY BE AMENDED PRIOR TO THE TIME OF SALE. THIS TERM SHEET IS NOT AN OFFER TO SELL THESE SECURITIES AND IT IS NOT A SOLICITATION OF AN OFFER TO BUY THESE SECURITIES IN ANY JURISDICTION WHERE THE OFFER OR SALE IS NOT PERMITTED.
67
Mixed Use – Office/Retail | Loan #3 | Cut-off Date Balance: | | $40,000,000 |
650 Madison Avenue | 650 Madison Avenue | Cut-off Date LTV: | | 48.5% |
New York, NY 10022 | | U/W NCF DSCR: | | 2.73x |
| | U/W NOI Debt Yield: | | 10.0% |
Escrows.
Real Estate Taxes – On a monthly basis during a Trigger Period (as defined below) or Specified Tenant Trigger Period (as defined below), the borrower is required to escrow 1/12th of the annual estimated tax payments for the next ensuing 12 months.
Insurance – On a monthly basis during a Trigger Period or Specified Tenant Trigger Period, the borrower is required to escrow 1/12th of the annual estimated insurance premiums. The requirement for the borrower to make monthly deposits to the insurance escrow is waived so long as the 650 Madison Avenue Property is insured under a blanket insurance policy in accordance with the 650 Madison Avenue Whole Loan documents.
Replacement Reserve – On a monthly basis during a Trigger Period, the borrower is required to escrow 1/12th of $0.25 multiplied by the aggregate number of rentable square feet then contained in the 650 Madison Avenue Property (excluding rentable square footage contained in any Condominium Unit (as defined below) that was previously released from the collateral for the 650 Madison Avenue Whole Loan).
TI/LC Reserve – On a monthly basis during a Trigger Period, the borrower is required to escrow $125,000 for ongoing TI/LC reserves.
Outstanding TI/LC Reserve – The borrower was required to deposit $3,197,699 for outstanding tenant improvements and leasing commissions at loan origination.
Outstanding Free Rent – The borrower was required to deposit $6,378,315 into a free rent reserve to fund remaining free rent for tenants at the 650 Madison Avenue Property.
Lockbox and Cash Management. The 650 Madison Avenue Whole Loan documents require a hard lockbox with springing cash management. At origination, the borrower was required to deliver written instructions to tenants directing them to deposit all rents payable under such leases directly into a lender-controlled lockbox account. During the continuance of a Trigger Period or a Specified Tenant Trigger Period, funds on deposit in the lockbox account are required to be swept on each business day into a lender-controlled cash management account and applied on each payment date to the payment of debt service, the funding of required reserves, budgeted monthly operating expenses, and other accounts as required by the 650 Madison Avenue Whole Loan documents. Provided no Trigger Period is continuing, excess cash in the deposit account will be disbursed to the borrower in accordance with the 650 Madison Avenue Whole Loan documents. If a Trigger Period is continuing, excess cash in the deposit account will be transferred to an account held by the lender as additional collateral for the 650 Madison Avenue Whole Loan.
A “Trigger Period” means a period (A) commencing upon the earliest to occur of: (i) the debt yield falling below 6.00% for two consecutive quarters or (ii) an event of default , and (B) terminating upon (x) with respect to clause (i) above, the debt yield being equal or greater than 6.00% for two consecutive quarters or the delivery by borrower to lender of cash collateral or a letter of credit in order to achieve such debt yield or (y) with respect to clause (ii) above, the event of default has been cured.
A “Specified Tenant Trigger Period” means a period commencing upon the earliest of: (i) any bankruptcy of Ralph Lauren (together with any single tenant replacing Ralph Lauren and paying no less than 30% of the total gross rent payable at the 650 Madison Avenue Property (a “Specified Tenant”)), (ii) delivery of any notice of termination or cancellation by a Specified Tenant for all or any portion of the Specified Tenant’s lease and/or if any Specified Tenant’s lease fails to otherwise be in full force and effect, (iii) the Specified Tenant being in monetary default of base rent or any material non-monetary default under the Specified Tenant’s lease beyond applicable notice and cure periods, (iv) the Specified Tenant failing to be in actual, physical possession and operating or dark in the Specified Tenant’s space, provided that it will not be a trigger under this clause (iv) if such Specified Tenant is rated an investment grade rated tenant by at least one of Moody’s, S&P and/or Fitch, or (v) a Specified Tenant’s failure to provide written notice to the borrower of renewal of its lease upon the earlier to occur of 18 months prior to its then current applicable lease expiration and the renewal notice period required under the applicable lease, and ending upon the occurrence of an applicable Specified Tenant Trigger Period Cure.
For the avoidance of doubt, the existence of a Specified Tenant Trigger Period will not, by itself, cause a Trigger Period.
Upon a Specified Tenant Trigger Period and prior to a Specified Tenant Trigger Period Cure (as defined below), a Specified Tenant reserve will be funded monthly until the lender has swept up to $80.00 per square foot for the vacating Specified Tenant space into the Specified Tenant reserve. Funds in the Specified Tenant reserve will be released to the borrower upon the occurrence of an applicable Specified Tenant Trigger Period Cure.
A “Specified Tenant Trigger Period Cure” means as applicable, (a) the Specified Tenant affirming its lease in the applicable bankruptcy proceeding pursuant to a final, non-appealable order, (b) the lender’s receipt of reasonably satisfactory evidence that, among other things, the applicable vacant or dark space referred to in clause (iv) of the definition of “Specified Tenant Trigger Period” is leased, open for business and the applicable tenant is paying full unabated rent, (c) the lender’s receipt of evidence reasonably satisfactory to it that the default under the Specified Tenant’s lease has been cured, (d) the Specified Tenant’s revocation or rescission of all termination or cancellation notices with respect to the Specified Tenant’s lease and reaffirmation that the Specified Tenant’s lease is in full force and effect and/or (e) the lender receives reasonably satisfactory evidence that (i) the Specified Tenant has renewed its lease prior to its then applicable lease expiration or (ii) the Specified Tenant’s space is leased for a minimum term of five years, the replacement tenant has taken actual physical possession of the Specified Tenant’s space and the replacement tenant is paying full unabated rent. A Specified Tenant Trigger Period Cure will also be deemed to have occurred if the debt yield is equal to or greater than
THE INFORMATION IN THIS STRUCTURAL AND COLLATERAL TERM SHEET IS NOT COMPLETE AND MAY BE AMENDED PRIOR TO THE TIME OF SALE. THIS TERM SHEET IS NOT AN OFFER TO SELL THESE SECURITIES AND IT IS NOT A SOLICITATION OF AN OFFER TO BUY THESE SECURITIES IN ANY JURISDICTION WHERE THE OFFER OR SALE IS NOT PERMITTED.
68
Mixed Use – Office/Retail | Loan #3 | Cut-off Date Balance: | | $40,000,000 |
650 Madison Avenue | 650 Madison Avenue | Cut-off Date LTV: | | 48.5% |
New York, NY 10022 | | U/W NCF DSCR: | | 2.73x |
| | U/W NOI Debt Yield: | | 10.0% |
7.5% (excluding gross revenue from any Specified Tenant who is then subject to a Specified Tenant Trigger Period, but including revenue on a pro forma basis from any new lease with respect to all or any portion of the space demised to such Specified Tenant that was entered into in accordance with the terms of the 650 Madison Avenue Whole Loan documents).
Property Management. The 650 Madison Avenue Whole Loan is managed by 650 Madison Office Manager LLC with respect to the office space and 650 Madison Retail Manager LLC with respect to the retail space, each an affiliate of Vornado, pursuant to separate management agreements.
Condominium Conversion. The borrower has the right to convert the entire 650 Madison Avenue Property to a commercial condominium form of ownership (a “Condominium Conversion”), provided that, among other conditions (i) the resulting condominium regime (the “Condominium”) consists exclusively of the three condominium units (collectively, the “Condominium Units”, and each, a “Condominium Unit”) identified in the 650 Madison Avenue Whole Loan documents, (ii) no event of default is continuing, (iii) the condominium declaration and bylaws, all related documents, instruments and agreements (collectively, the “Condominium Documents”) will be in the respective forms indicated in the 650 Madison Avenue Whole Loan documents or as otherwise approved by the lender in writing (which approval must not be unreasonably withheld, conditioned or delayed), (iv) the borrower delivers to the lender such usual and customary documents and other agreements as may be reasonably required by the lender in connection with the Condominium Conversion, including, but not limited to, an amendment to the mortgage and amendments and reaffirmations to the terms and conditions of the 650 Madison Avenue Whole Loan documents reasonably required by the lender, (v) the borrower delivers a REMIC opinion and (vi) the borrower has the right to transfer the Condominium Units to one or more transferee borrowers that will assume on a joint and several basis all of borrower’s obligations under the 650 Madison Avenue Whole Loan documents, provided that (A) such transferee borrowers must be either (I) controlled by an eligible qualified owner in accordance with the 650 Madison Avenue Whole Loan documents that owns (x) by itself, at least 20% of the common equity interest in such transferee borrowers and (y) together with one or more other eligible qualified owner and/or institutional investors, at least 51% of the common equity interest in such transferee borrowers, with any person owning 10% or more of the equity interests in transferee borrower being a qualified transferee or (II) owned and controlled by one or more entities approved by the lender that are qualified transferees and are otherwise qualified to own the 650 Madison Avenue Property, and (B) rating agency confirmation will be required solely with respect to the legal structure of the transferee borrower(s), the documentation of the 650 Madison Avenue Whole Loan assumption and the related legal opinions.
Partial Release. Provided no event of default is continuing and a Condominium Conversion has occurred, the borrower has the right at any time after the earlier of (a) November 26, 2022 and (b) the date that is two years after the closing date of the securitization that includes the last note comprising the 650 Madison Avenue Whole Loan to be securitized, to obtain the release of one or more Condominium Units solely in connection with a partial defeasance, subject to the satisfaction of certain conditions including, without limitation, (i) the defeasance of a portion of the 650 Madison Avenue Whole Loan in an amount that is equal to or greater than 125% of an allocated loan amount for the applicable Condominium Unit determined by dividing the 650 Madison Avenue Whole Loan among the various condominium units pro rata according to their respective appraised values based upon an appraisal of the 650 Madison Avenue Property at the time of the release, provided that (x) the debt yield with respect to the Condominium Unit(s) remaining subject to the lien of the mortgage after such partial defeasance must, in the aggregate, be equal to or greater than 7.3% and (y) the loan-to-value ratio with respect to the Condominium Unit(s) remaining subject to the lien of the mortgage after such partial defeasance must be equal to or less than 67.0%, in each case unless approved by the lender in its reasonable discretion, (ii) after giving effect to the partial defeasance, the debt yield for the four calendar quarters then most recently ended, recalculated to include only income and expense attributable to the portion of the 650 Madison Avenue Property that continues to be subject to the liens of the 650 Madison Avenue Whole Loan documents after the contemplated defeasance and to exclude the interest expense on the aggregate amount defeased, being no less than the greater of (x) 7.3% and (y) the lesser of (a) the debt yield immediately prior to such release and (b) 9.125%, and (iii) at the lender’s request, delivery of a rating agency confirmation.
Real Estate Substitution. Not permitted.
Subordinate and Mezzanine Indebtedness. The 650 Madison Avenue B-Notes, which have an aggregate original principal balance of $213,200,000, are subordinate to the 650 Madison Avenue Senior Loan and accrue interest at a rate of 3.48600% per annum. The 650 Madison Avenue B-Notes are coterminous with the 650 Madison Avenue Senior Loan. The holders of the 650 Madison Avenue B-Notes have entered into a co-lender agreement that sets forth the allocation of collections on the 650 Madison Avenue Whole Loan. Based on the 650 Madison Avenue Whole Loan, the cumulative Cut-off Date LTV, cumulative UW NCF DSCR and cumulative UW NOI Debt Yield are 66.1%, 2.00x and 7.3%, respectively.
Ground Lease. None.
Terrorism Insurance. The 650 Madison Whole Loan documents require that the “all risk” insurance policy required to be maintained by the borrower provides coverage for terrorism in an amount equal to the full replacement cost of the 650 Madison Avenue Property, as well as business interruption insurance covering no less than the 24-month period following the occurrence of a casualty event, together with a 12-month extended period of indemnity.
THE INFORMATION IN THIS STRUCTURAL AND COLLATERAL TERM SHEET IS NOT COMPLETE AND MAY BE AMENDED PRIOR TO THE TIME OF SALE. THIS TERM SHEET IS NOT AN OFFER TO SELL THESE SECURITIES AND IT IS NOT A SOLICITATION OF AN OFFER TO BUY THESE SECURITIES IN ANY JURISDICTION WHERE THE OFFER OR SALE IS NOT PERMITTED.
69
Office - CBD | Loan #4 | Cut-off Date Balance: | | $40,000,000 |
801 5th Avenue | F5 Tower | Cut-off Date LTV: | | 39.4% |
Seattle, WA 98104 | | U/W NCF DSCR: | | 3.32x |
| | U/W NOI Debt Yield: | | 13.0% |
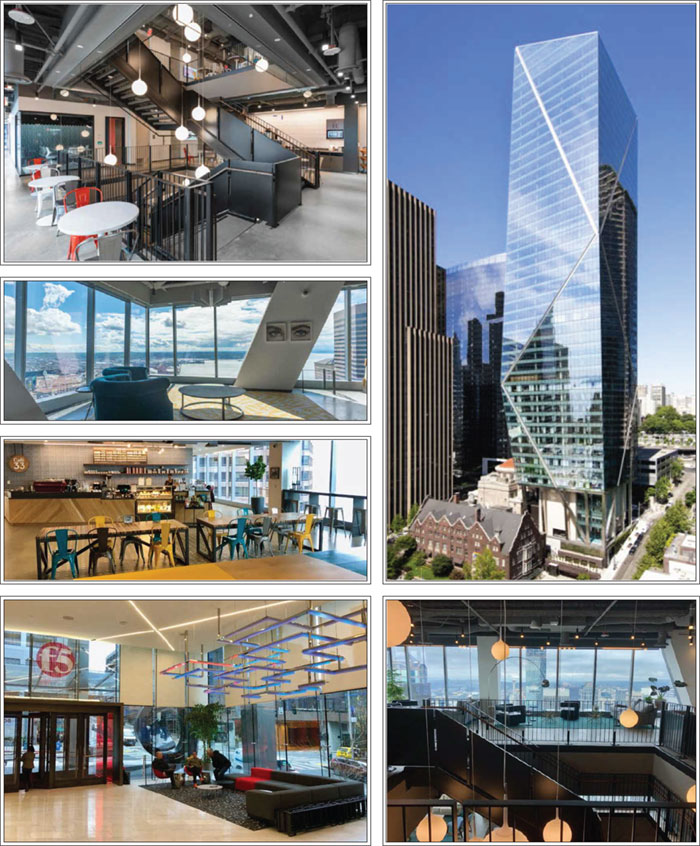
THE INFORMATION IN THIS STRUCTURAL AND COLLATERAL TERM SHEET IS NOT COMPLETE AND MAY BE AMENDED PRIOR TO THE TIME OF SALE. THIS TERM SHEET IS NOT AN OFFER TO SELL THESE SECURITIES AND IT IS NOT A SOLICITATION OF AN OFFER TO BUY THESE SECURITIES IN ANY JURISDICTION WHERE THE OFFER OR SALE IS NOT PERMITTED.
70
Office - CBD | Loan #4 | Cut-off Date Balance: | | $40,000,000 |
801 5th Avenue | F5 Tower | Cut-off Date LTV: | | 39.4% |
Seattle, WA 98104 | | U/W NCF DSCR: | | 3.32x |
| | U/W NOI Debt Yield: | | 13.0% |

THE INFORMATION IN THIS STRUCTURAL AND COLLATERAL TERM SHEET IS NOT COMPLETE AND MAY BE AMENDED PRIOR TO THE TIME OF SALE. THIS TERM SHEET IS NOT AN OFFER TO SELL THESE SECURITIES AND IT IS NOT A SOLICITATION OF AN OFFER TO BUY THESE SECURITIES IN ANY JURISDICTION WHERE THE OFFER OR SALE IS NOT PERMITTED.
71
No. 4 – F5 Tower |
|
Mortgage Loan Information | | Mortgaged Property Information |
Mortgage Loan Seller: | Barclays Capital Real Estate Inc. | | Single Asset/Portfolio: | Single Asset |
Credit Assessment (KBRA/Fitch/Moody’s): | BBB-(sf)/BBB-sf/NR | | Property Type – Subtype: | Office – CBD |
Original Principal Balance(1): | $40,000,000 | | Location: | Seattle, WA |
Cut-off Date Balance(1): | $40,000,000 | | Size: | 515,518 SF |
% of Initial Pool Balance: | 4.2% | | Cut-off Date Balance Per SF(1): | $358.86 |
Loan Purpose: | Acquisition | | Maturity Date Balance Per SF(1): | $358.86 |
Borrower Sponsors: | FS KKR Capital Corp.; FS KKR Capital Corp. II | | Year Built/Renovated: | 2019/NAP |
Guarantors: | FS KKR Capital Corp.; FS KKR Capital Corp. II | | Title Vesting(6): | Fee |
Mortgage Rate: | 3.69868% | | Property Manager: | Urban Renaissance Property Company LLC |
Note Date: | December 19, 2019 | | Current Occupancy (As of): | 100.0% (2/1/2020) |
Seasoning: | 1 month | | YE 2019 Occupancy(7): | NAP |
Anticipated Repayment Date(2): | January 6, 2030 | | YE 2018 Occupancy(7): | NAP |
IO Period: | 120 months | | YE 2017 Occupancy(7): | NAP |
Loan Term (Original): | 120 months | | YE 2016 Occupancy(7): | NAP |
Amortization Term (Original): | NAP | | As-Is Appraised Value: | $470,000,000 |
Loan Amortization Type: | Interest-only, ARD | | As-Is Appraised Value Per SF: | $911.70 |
Call Protection(3): | L(24),GRTR 1% or YM(1),GRTR 1% or YM or D(88),O(7) | | As-Is Appraisal Valuation Date: | November 5, 2019 |
Lockbox Type: | Hard/Springing | | Underwriting and Financial Information |
Additional Debt(1): | Yes | | NOI (Annualized 1 12/31/2019)(8): | $22,378,232 |
| Pari Passu ($145,000,000); | | YE 2018 NOI(7): | NAP |
Additional Debt Type (Balance)(1): | Subordinate Debt ($112,600,000); | | YE 2017 NOI(7): | NAP |
| Mezzanine ($48,500,000) | | YE 2016 NOI(7): | NAP |
| | | U/W Revenues: | $32,787,852 |
| | | U/W Expenses: | $8,792,416 |
Escrows and Reserves(4) | | U/W NOI: | $23,995,436 |
| Initial | Monthly | Cap | | U/W NCF: | $23,119,056 |
Taxes | $644,935 | $214,978 | NAP | | U/W DSCR based on NOI/NCF(1): | 3.45x / 3.32x |
Insurance | $0 | Springing | NAP | | U/W Debt Yield based on NOI/NCF(1): | 13.0% / 12.5% |
Replacement Reserve | $0 | Springing | NAP | | U/W Debt Yield at Maturity based on NOI/NCF(1): | 13.0% / 12.5% |
TI/LC Reserve | $0 | $0 | NAP | | Cut-off Date LTV Ratio(1): | 39.4% |
Lease Sweep Reserve | $0 | Springing | $38,663,850(5) | | LTV Ratio at Maturity or ARD(1): | 39.4% |
| | | | | | | |
Sources and Uses |
Sources | | | | | Uses | | | |
Original whole loan amount | $297,600,000 | | 64.1% | | Purchase price | $458,000,000 | | 98.7% |
Mezzanine loan | 48,500,000 | | 10.5 | | Closing costs | 5,252,485 | | 1.1 |
Borrower Sponsor equity | 117,797,420 | | 25.4 | | Upfront reserves | 644,935 | | 0.1 |
Total Sources | $463,897,420 | | 100.0% | | Total Uses | $463,897,420 | | 100.0% |
(1) | The F5 Tower Mortgage Loan (as defined below) is part of the F5 Tower Whole Loan (as defined below), which is evidenced by (i) four pari passu notes with an aggregate original balance of $185,000,000 (the “F5 Tower Senior Loan”) and (ii) two subordinate B-notes with an aggregate original principal balance of $112,600,000 (the “F5 Tower Subordinate Loan”). The Cut-off Date Balance Per SF, Maturity Date Balance Per SF, U/W Debt Yield based on NOI/NCF, U/W DSCR based on NOI/NCF, Cut-off Date LTV Ratio and LTV Ratio at Maturity or ARD numbers presented above are based on the aggregate principal balance of the promissory notes comprising the F5 Tower Senior Loan, without regard to the F5 Tower Subordinate Loan. The Cut-off Date Balance Per SF, Maturity Date Balance Per SF, U/W Debt Yield based on NOI/NCF, U/W DSCR based on NOI/NCF, Cut-off Date LTV Ratio and LTV Ratio at Maturity or ARD numbers presented above based on the combined balance of the entire F5 Tower Whole Loan are $577.28, $577.28, 8.1%, 7.8%, 2.14x, 2.07x, 63.3% and 63.3%, respectively. |
(2) | The F5 Tower Whole Loan (as defined below) is structured with an anticipated repayment date of January 6, 2030 (the “ARD”). If the F5 Tower Whole Loan is not paid off before the ARD, then the F5 Tower Whole Loan will accrue interest at the Adjusted Interest Rate (as defined below); however, interest accrued at the excess of the Adjusted Interest Rate over the Initial Interest Rate (as defined below) (the “Accrued Interest”) will be deferred and will be paid on the maturity date to the extent not paid sooner by the borrower. In addition, from and after the ARD, all net cash flow from the F5 Tower Property (as defined below) after the payment of the reserves for tax and insurance, condominium charges, and mortgage interest for the F5 Tower Senior Loan and F5 Tower Subordinate Loan (calculated for the F5 Tower Senior Loan and F5 Tower Subordinate Loan at the Initial Interest Rate) and the mezzanine debt service as described in the F5 Tower Mezzanine Loan documents (with interest calculated at the Mezzanine Initial Interest Rate (as defined below)) will be applied on a monthly basis (i) first, to make reserve payments to pay operating costs, (ii) second, (x) to make monthly repayments of the outstanding principal balance of the F5 Tower Senior Loan, in the amount required to fully amortize the outstanding principal balance of the entire F5 Tower Senior Loan (based on a 30-year amortization schedule) and (y) once the F5 Tower Senior Loan has been repaid in full, to make monthly repayments of the outstanding principal balance of the F5 Tower Subordinate Loan in the amount required to fully amortize the outstanding principal balance of the F5 Tower Subordinate Loan (based on a 30-year amortization schedule), (iii) third, if the lender elects, to make reserve payments for capital expenditures, (iv) fourth, to repay the outstanding principal balance of the F5 Tower Senior Loan until the entire outstanding principal balance thereof is paid, (v) fifth, to repay the outstanding principal balance of the F5 Tower Subordinate Loan until |
THE INFORMATION IN THIS STRUCTURAL AND COLLATERAL TERM SHEET IS NOT COMPLETE AND MAY BE AMENDED PRIOR TO THE TIME OF SALE. THIS TERM SHEET IS NOT AN OFFER TO SELL THESE SECURITIES AND IT IS NOT A SOLICITATION OF AN OFFER TO BUY THESE SECURITIES IN ANY JURISDICTION WHERE THE OFFER OR SALE IS NOT PERMITTED.
72
Office - CBD | Loan #4 | Cut-off Date Balance: | | $40,000,000 |
801 5th Avenue | F5 Tower | Cut-off Date LTV: | | 39.4% |
Seattle, WA 98104 | | U/W NCF DSCR: | | 3.32x |
| | U/W NOI Debt Yield: | | 13.0% |
the entire outstanding principal balance thereof is paid, (vi) sixth, to the payment of Accrued Interest owed under the F5 Tower Senior Loan, (vii) seventh, to the payment of Accrued Interest owed under the F5 Tower Subordinate Loan and (viii) eighth, to be remitted to, or at the direction of, the borrower. The final maturity date of the F5 Tower Whole Loan is September 6, 2033, or if F5 Networks (as defined below) exercises its Early Termination Right (as defined below) pursuant to its lease, the maturity date will be September 6, 2030.
(3) | Defeasance of the F5 Tower Whole Loan is permitted at any time after the earlier to occur of (a) the end of the two-year period commencing on the closing date of the securitization of the last F5 Tower Companion Loans (as defined below) to be securitized and (b) December 19, 2022. |
(4) | See “Escrows” below for a full description of the Escrows and Reserves. |
(5) | See the “Lease Sweep Reserve Cap” definition in the “Lockbox and Cash Management” section below. |
(6) | The collateral consists of the borrower’s fee interest in the office condominium, 217 borrower-owned spaces in a parking garage, an easement of over 42 spaces and an additional 63 parking spaces leased from The Rainier Club through September 30, 2026. The 63 parking spaces subject to the leasehold interest account for 19.6% of the spaces and 11.5% of the parking income (0.7% of total effective gross income). |
(7) | Historical occupancy and historical financials are not available due to the F5 Tower Property being constructed in 2019. |
(8) | TTM NOI represents in-place contractual rents, expense reimbursements and parking revenue as of December 2019 annualized for one month. |
The Mortgage Loan. The F5 Tower mortgage loan (the “F5 Tower Mortgage Loan”) is part of a whole loan that was co-originated by Barclays Capital Real Estate Inc. (“Barclays”) and DBR Investments Co. Limited (“DBRI”) and is evidenced by four senior pari passu promissory A-notes with an aggregate original principal balance of $185,000,000 (the “F5 Tower Senior Loan”) and two subordinate B-notes with an aggregate original principal balance of $112,600,000 (the “F5 Tower Subordinate Loan” and collectively with the F5 Tower Senior Loan, the “F5 Tower Whole Loan”). The F5 Tower Subordinate Loan will be an asset of the BBCMS 2020-C6 securitization trust but will not be pooled together with the other mortgage loans, and payments of interest and principal received in respect of the F5 Tower Subordinate Loan will be available to make distributions in respect of the loan-specific classes of certificates only. The F5 Tower Whole Loan is secured by a first lien mortgage encumbering the borrower’s fee interest in the 515,518 square foot office condominium unit and the parking condominium unit of a three condominium unit mixed use building located in the central business district of Seattle, Washington (the “F5 Tower Property”). The non-controlling Note A-1-A was contributed to the BBCMS 2020-C6 trust. Non-controlling note A-1-B had an original principal balance of $40,000,000 and is expected to be contributed to the WFCM 2020-C55 securitization trust. Non-controlling notes A-1-C and A-2 (the “F5 Tower Companion Loans”) are expected to be contributed to future securitization transactions. Prior to the occurrence of a control appraisal period, the holder of the F5 Tower Subordinate Loan (or the related directing holder) will be the controlling noteholder. During a control appraisal period, the holder of Note A-1-B (or the directing holder of the related securitization trust) will be the controlling noteholder. The F5 Tower Mortgage Loan will be serviced pursuant to the pooling and servicing agreement for the BBCMS 2020-C6 securitization.
Note Summary
Notes | Original Principal Balance | Cut-off Date Balance | Note Holder | Controlling Interest |
A-1-A | $50,000,000 | $50,000,000 | BBCMS 2020-C6(2) | No |
A-1-B | $40,000,000 | $40,000,000 | WFCM 2020-C55 | No(1) |
A-1-C | $39,500,000 | $39,500,000 | An affiliate of Barclays | No |
A-2 | $55,500,000 | $55,500,000 | DBRI | No |
B-1 | $78,820,000 | $78,820,000 | BBCMS 2020-C6 (Loan Specific)(2) | Yes(1) |
B-2 | $33,780,000 | $33,780,000 | BBCMS 2020-C6 (Loan Specific)(2) | Yes(1) |
Total | $297,600,000 | $297,600,000 | | |
(1) | The initial controlling note is note B-1, so long as no related control appraisal period has occurred and is continuing. If and for so long as a control appraisal period has occurred and is continuing, then the controlling note will be note A-1-B. See “Description of the Mortgage Pool— The Whole Loans—The Non-Serviced AB Whole Loans—The F5 Tower Whole Loan” in the Preliminary Prospectus. |
(2) | The BBCMS 2020-C6 transaction is expected to close on February 19, 2020. |
The F5 Tower Whole Loan requires interest-only payments through the ARD and accrues interest at a rate of 3.69868% per annum (the “Initial Interest Rate”) through the ARD. Following the ARD, to the extent that the loan is outstanding, the F5 Tower Whole Loan will accrue interest at a rate of (a) 3.69868% per annum (or, when applicable pursuant to the F5 Tower Whole Loan documents, the default rate) plus (b) the positive difference between (x) a rate per annum equal to the greater of (i) the Initial Interest Rate plus 2.50% and (ii) when applicable pursuant to the F5 Tower Whole Loan documents, the default rate and (y) 3.69868% per annum (the “Adjusted Interest Rate”). In addition, after the ARD, to the extent that there is excess cash flow from the cash management account, the excess cash flow will be applied as described in footnote 2 of the Mortgage Loan Information table above and the “Lockbox and Cash Management” section below.
The Borrower and Borrower Sponsor. The borrowing entity for the F5 Tower Whole Loan is Seattle 801 Fifth Owner LLC, a Delaware limited liability company and special purpose entity with two independent directors in its organizational structure. Legal counsel to the borrower delivered a non-consolidation opinion in connection with the origination of the F5 Tower Whole Loan. FS KKR Capital Corp. and FS KKR Capital Corp. II are the borrower sponsors and guarantors, on a several basis, of certain nonrecourse carve-outs and environmental indemnities under the F5 Tower Whole Loan (collectively, the “F5 Tower Guarantor”). If the F5 Tower Guarantor fails to maintain a net worth of $200,000,000 and liquid assets of $20,000,000, the borrower may deliver a supplemental or replacement recourse guaranty and a supplemental or replacement environmental indemnity from a supplemental or replacement guarantor as described in the F5 Tower Whole Loan documents.
THE INFORMATION IN THIS STRUCTURAL AND COLLATERAL TERM SHEET IS NOT COMPLETE AND MAY BE AMENDED PRIOR TO THE TIME OF SALE. THIS TERM SHEET IS NOT AN OFFER TO SELL THESE SECURITIES AND IT IS NOT A SOLICITATION OF AN OFFER TO BUY THESE SECURITIES IN ANY JURISDICTION WHERE THE OFFER OR SALE IS NOT PERMITTED.
73
Office - CBD | Loan #4 | Cut-off Date Balance: | | $40,000,000 |
801 5th Avenue | F5 Tower | Cut-off Date LTV: | | 39.4% |
Seattle, WA 98104 | | U/W NCF DSCR: | | 3.32x |
| | U/W NOI Debt Yield: | | 13.0% |
The F5 Tower Whole Loan borrower sponsors are affiliates of Kohlberg Kravis Roberts (“KKR”) and FS Investments. KKR is a leading global investment firm with over $208.4 billion of assets under management as of September 30, 2019. KKR’s real estate division has been a part of the firm’s strategy since 1981, with over $8 billion of assets under management with over 85 employees across nine countries as of September 30, 2019. FS Investments is a leading asset manager dedicated to helping individuals, financial professionals and institutions design better portfolios. As of March 31, 2019, FS Investments has over $23 billion of assets under management across 10 funds with over 300 employees nationwide.
The Property. The F5 Tower Property is a 515,518 square foot office condominium unit and parking condominium unit of a three condominium unit mixed-use building located in the central business district of Seattle, Washington. The three units of the condominium consist of (i) the 515,518 square-foot office portion fully leased to F5 Networks, Inc. (“F5 Networks”) located on floors 20 to 48 (collateral), (ii) 259 borrower-owned spaces in a parking garage (consisting of the borrower’s fee ownership of 217 parking spaces and an easement with respect to the use of 42 parking spaces) and 63 additional spaces leased from The Rainier Club through September 30, 2026 (collateral) and (iii) a 189-key luxury hotel (non-collateral). The combined ownership interest of the office condominium and the parking garage condominium is 76.54%. As the first major high-rise building built in Seattle in the last decade, the F5 Tower Property has become a fixture of the Seattle skyline. The Class A, LEED Silver certified office building features column-free floor plates and views of the Olympic Mountains, Elliott Bay and the surrounding skyline. As of February 1, 2020, the F5 Tower Property was 100.0% leased to F5 Networks.
Major Tenant.
Sole Tenant: F5 Networks (515,518 square feet; 100.0% of net rentable area; 100.0% of underwritten base rent; 9/30/2033 lease expiration) – F5 Networks (NASDAQ: FFIV) is a leading global technology company that focuses on delivery, security, performance and availability of web applications and technologies used by a wide range of companies. F5 Networks is a supplier of application delivery controllers, which optimize performance, availability and security of network-based applications and owns 45% of market share for application delivery controllers. F5 Networks employs over 4,500 employees in 69 offices across 39 countries. Total revenue for fiscal year 2019 was approximately $2.24 billion, which was a 4% increase over fiscal year 2018. Total revenue was comprised of services revenue of approximately $1.26 billion and product revenue of approximately $986 million. Product revenue included mostly appliance sales, and software revenue grew 60% in fiscal year 2019. F5 Network’s net income for the fiscal year 2019 was approximately $427.7 million calculated using generally accepted accounting principles (“GAAP”), and its non-GAAP net income was estimated to be $643.2 million. F5 Networks has raised no outside debt funding since the company was founded in 1996. The F5 Tower Property is F5 Network’s global headquarters.
The following table presents certain information relating to the tenancy at the F5 Tower Property:
Major Tenants
Tenant Name | Credit Rating (Fitch/
Moody’s/
S&P)(1) | Tenant
NRSF | % of
NRSF | Annual U/W Base Rent PSF(2) | Annual
U/W Base Rent(2) | % of Total Annual U/W Base Rent | Lease
Expiration
Date | Extension Options | Termination Option (Y/N) |
Major Tenants | | | | | | | | |
F5 Networks, Inc.(3) | NR/NR/NR | 515,518 | 100.0% | $46.89 | $24,173,823 | 100.0% | 9/30/2033 | 3, 5-year(4) | Y(5) |
Total Major Tenants | 515,518 | 100.0% | $46.89 | $24,173,823 | 100.0% | | | |
| | | | | | | | |
Non-Major Tenants | 0 | 0.0% | $0.00 | $0 | 0.0% | | | |
| | | | | | | | |
Occupied Collateral Total | 515,518 | 100.0% | $46.89 | $24,173,823 | 100.0% | | | |
| | | | | | | | |
Vacant Space | 0 | 0.0% | | | | | | |
| | | | | | | | |
Collateral Total | 515,518 | 100.0% | | | | | | |
| | | | | | | | | |
(1) | Certain ratings are those of the parent company whether or not the parent company guarantees the lease. |
(2) | Annual U/W Base Rent includes contractual rent steps through November 2020 totaling $528,406 and straight-line rent of $2,509,179. |
(3) | F5 Networks subleases 18,886 square feet (the 22nd floor) to Foursquare Labs, Inc. through November 30, 2022 at a current rental rate of $38.00 per square foot. F5 Networks subleases 18,636 square feet (the 23rd floor) to Grab Technology Corp. through February 28, 2023 at a current rental rate of $55.00. |
(4) | F5 Networks has three, five-year renewal options at the fair market value at the time of the renewal. |
(5) | F5 Networks has a termination option effective as of October 1, 2030 (the “Early Termination Right”) with 19 months’ written notice (March 1, 2029) and a termination payment equal to the then-unamortized portions, calculated using a 5% interest factor, on an equal payment basis over the number of lease months during which base rent is payable during the initial lease term of (a) the tenant improvement allowance, (b) the base rent abatement, and (c) the leasing commissions paid to the tenant’s broker and landlord’s broker in connection with the lease. Additionally, F5 Networks has the right to terminate its lease with respect to the two highest full floors at the F5 Tower Property, effective between September 30, 2025 and September 30, 2026 with 12 months’ notice and payment of a fee equal to the then-unamortized portions, calculated using a 5% interest factor, on an equal payment basis over the number of lease months during which base rent is payable during the initial lease term (determined on per rentable square foot basis for such two floors) of (a) the tenant improvement allowance, (b) the base rent abatement, and (c) leasing commissions paid to the tenant’s broker in connection with the lease. If F5 Networks terminates or provides notice to terminate all or at least 40,000 square feet of its space (or, if a full floor of space is less than 40,000 square feet, a full floor of space), a Lease Sweep Period (as defined below) will commence. See “Lease Sweep Period” below. |
THE INFORMATION IN THIS STRUCTURAL AND COLLATERAL TERM SHEET IS NOT COMPLETE AND MAY BE AMENDED PRIOR TO THE TIME OF SALE. THIS TERM SHEET IS NOT AN OFFER TO SELL THESE SECURITIES AND IT IS NOT A SOLICITATION OF AN OFFER TO BUY THESE SECURITIES IN ANY JURISDICTION WHERE THE OFFER OR SALE IS NOT PERMITTED.
74
Office - CBD | Loan #4 | Cut-off Date Balance: | | $40,000,000 |
801 5th Avenue | F5 Tower | Cut-off Date LTV: | | 39.4% |
Seattle, WA 98104 | | U/W NCF DSCR: | | 3.32x |
| | U/W NOI Debt Yield: | | 13.0% |
The following table presents certain information relating to the lease expiration schedule at the F5 Tower Property:
Lease Expiration Schedule(1)(2)
Year Ending
December 31, | No. of Leases Expiring | Expiring NRSF | % of Total NRSF | Cumulative Expiring NRSF | Cumulative % of Total NRSF | Annual
U/W
Base Rent(3) | % of Total Annual U/W Base Rent | Annual
U/W
Base Rent
PSF(3) |
MTM | 0 | 0 | 0.0% | 0 | 0.0% | $0 | 0.0% | $0.00 |
2020 | 0 | 0 | 0.0% | 0 | 0.0% | $0 | 0.0% | $0.00 |
2021 | 0 | 0 | 0.0% | 0 | 0.0% | $0 | 0.0% | $0.00 |
2022 | 0 | 0 | 0.0% | 0 | 0.0% | $0 | 0.0% | $0.00 |
2023 | 0 | 0 | 0.0% | 0 | 0.0% | $0 | 0.0% | $0.00 |
2024 | 0 | 0 | 0.0% | 0 | 0.0% | $0 | 0.0% | $0.00 |
2025 | 0 | 0 | 0.0% | 0 | 0.0% | $0 | 0.0% | $0.00 |
2026 | 0 | 0 | 0.0% | 0 | 0.0% | $0 | 0.0% | $0.00 |
2027 | 0 | 0 | 0.0% | 0 | 0.0% | $0 | 0.0% | $0.00 |
2028 | 0 | 0 | 0.0% | 0 | 0.0% | $0 | 0.0% | $0.00 |
2029 | 0 | 0 | 0.0% | 0 | 0.0% | $0 | 0.0% | $0.00 |
2030 | 0 | 0 | 0.0% | 0 | 0.0% | $0 | 0.0% | $0.00 |
Thereafter | 1 | 515,518 | 100.0% | 515,518 | 100.0% | $24,173,823 | 100.0% | $46.89 |
Vacant | 0 | 0 | 0.0% | 515,518 | 100.0% | $0 | 0.0% | $0.00 |
Total/Weighted Average | 1 | 515,518 | 100.0% | | | $24,173,823 | 100.0% | $46.89 |
(1) | Information obtained from the underwritten rent roll. |
| (2) | Certain tenants may have lease termination options that are exercisable prior to the originally stated expiration date of the subject lease and that are not considered in the Lease Expiration Schedule. |
| (3) | Annual U/W Base Rent includes contractual rent steps through November 2020 totaling $528,406 and straight-line rent of $2,509,179. |
The following table presents historical occupancy percentages at the F5 Tower Property:
Historical Occupancy
12/31/2016(1) | | 12/31/2017(1) | | 12/31/2018(1) | | 12/31/2019(1) | | 2/1/2020(2) | |
NAP | | NAP | | NAP | | NAP | | 100.0% | |
| (1) | Historical occupancy is not available given the F5 Tower Property was built in 2019. |
(2) | Information obtained from the underwritten rent roll. |
THE INFORMATION IN THIS STRUCTURAL AND COLLATERAL TERM SHEET IS NOT COMPLETE AND MAY BE AMENDED PRIOR TO THE TIME OF SALE. THIS TERM SHEET IS NOT AN OFFER TO SELL THESE SECURITIES AND IT IS NOT A SOLICITATION OF AN OFFER TO BUY THESE SECURITIES IN ANY JURISDICTION WHERE THE OFFER OR SALE IS NOT PERMITTED.
75
Office - CBD | Loan #4 | Cut-off Date Balance: | | $40,000,000 |
801 5th Avenue | F5 Tower | Cut-off Date LTV: | | 39.4% |
Seattle, WA 98104 | | U/W NCF DSCR: | | 3.32x |
| | U/W NOI Debt Yield: | | 13.0% |
Operating History and Underwritten Net Cash Flow. The following table presents certain information relating to the historical operating performance and underwritten net cash flow at the F5 Tower Property:
Cash Flow Analysis(1)
| | Annualized 1 12/31/2019 (2) | | U/W | | %(3) | | U/W $ per SF | |
Base Rent | | $21,136,238 | | $21,136,238 | | 61.4% | | $41.00 | |
Contractual Rent Steps(4) | | 0 | | 3,037,585 | | 8.8 | | 5.89 | |
Grossed Up Vacant Space | | 0 | | 0 | | 0.0 | | 0.00 | |
Gross Potential Rent | | $21,136,238 | | $24,173,823 | | 70.2% | | $46.89 | |
Other Income | | 1,480,769 | | 1,697,833 | | 4.9 | | 3.29 | |
Total Recoveries | | 8,493,154 | | 8,552,513 | | 24.8 | | 16.59 | |
Net Rental Income | | $31,110,161 | | $34,424,169 | | 100.0% | | $66.78 | |
(Vacancy & Credit Loss) | | 0 | | (1,636,317)(5) | | (6.8) | | (3.17) | |
Effective Gross Income | | $31,110,161 | | $32,787,852 | | 95.2% | | $63.60 | |
| | | | | | | | | |
Real Estate Taxes | | 2,458,759 | | 2,458,759 | | 7.5 | | 4.77 | |
Insurance and Condominium Fees | | 895,093 | | 895,093 | | 2.7 | | 1.74 | |
Management Fee | | 595,270 | | 655,757 | | 2.0 | | 1.27 | |
Other Operating Expenses | | 4,782,807 | | 4,782,807 | | 14.6 | | 9.28 | |
Total Operating Expenses | | $8,731,929 | | $8,792,416 | | 26.8% | | $17.06 | |
| | | | | | | | | |
Net Operating Income | | $22,378,232 | | $23,995,436 | | 73.2% | | $46.55 | |
Replacement Reserves | | 0 | | 103,104 | | 0.3 | | 0.20 | |
TI/LC | | 0 | | 773,277 | | 2.4 | | 1.50 | |
Net Cash Flow | | $22,378,232 | | $23,119,056 | | 70.5% | | $44.85 | |
| | | | | | | | | |
NOI DSCR(6) | | 3.22x | | 3.45x | | | | | |
NCF DSCR(6) | | 3.22x | | 3.32x | | | | | |
NOI Debt Yield(6) | | 12.1% | | 13.0% | | | | | |
NCF Debt Yield(6) | | 12.1% | | 12.5% | | | | | |
| (1) | Historical financials prior to TTM are not available due to the F5 Tower Property being built in 2019. |
| (2) | TTM NOI represents in-place contractual rents, expense reimbursements and parking revenue as of December 2019 annualized. |
| (3) | Represents (i) percent of Net Rental Income for all revenue fields, (ii) percent of Gross Potential Rent for Vacancy & Credit Loss and (iii) percent of Effective Gross Income for all other fields. |
| (4) | Underwritten Contractual Rent Steps include $528,406 of rent steps through November 2020 and $2,509,179 of straight line rent for F5 Networks. |
| (5) | The underwritten economic vacancy is 5.0%. The F5 Tower Property was 100.0% physically occupied as of February 1, 2020. |
| (6) | NOI DSCR, NOI DSCR, NOI Debt Yield and NCF Debt Yield are based on the F5 Tower Senior Loan. |
Appraisal. The appraiser concluded to an “as-is” appraised value of $470,000,000 as of November 5, 2019.
Environmental Matters. According to the Phase I environmental site assessment dated November 26, 2019, there was no evidence of any recognized environmental conditions at the F5 Tower Property.
Market Overview and Competition. The F5 Tower Property is located in the financial district of the central business district of Seattle, Washington. Seattle’s financial district contains approximately 50% of the total leasable office space in the Seattle central business district, including a number of trophy office towers such as Columbia Center, Two Union Square, 1201 Third Avenue, the Russell Investments Center, Fourth & Madison and U.S. Bank Centre. The F5 Tower Property is located on 5th Avenue between Marion Street and Columbia Street, a corner that has seen over $1.1 billion of capital investment over the past 18 months, including new Class A office space, luxury hotel keys, restaurants and entertainment. The area is also the center of Seattle’s cultural life including Benaroya Hall (home of the Seattle Symphony), the Seattle Art Museum, Pike Place Market and the Washington State Convention and Trade Center. Primary access through the Seattle metropolitan area is provided by Interstate 5, a north-south highway running from Canada to Mexico, and Highway 99, a recently completed four-lane underground tunnel providing access through downtown Seattle. The area is also served by King County Metro bus transit, Link Light Rail, Sounder Commuter Rail and two streetcar lines. King County Metro was ranked the best large transit system in 2018 by the American Public Transportation Organization. In total, there are 32 transit options within three blocks of the F5 Tower Property.
According to the appraisal, Seattle’s population has grown 18.7% since 2010. In 2018, the city was ranked as the #1 tech growth market in North America by CBRE with over 167,000 tech jobs and over 100 tech firm expansions from the Bay Area. Since 2016, the
THE INFORMATION IN THIS STRUCTURAL AND COLLATERAL TERM SHEET IS NOT COMPLETE AND MAY BE AMENDED PRIOR TO THE TIME OF SALE. THIS TERM SHEET IS NOT AN OFFER TO SELL THESE SECURITIES AND IT IS NOT A SOLICITATION OF AN OFFER TO BUY THESE SECURITIES IN ANY JURISDICTION WHERE THE OFFER OR SALE IS NOT PERMITTED.
76
Office - CBD | Loan #4 | Cut-off Date Balance: | | $40,000,000 |
801 5th Avenue | F5 Tower | Cut-off Date LTV: | | 39.4% |
Seattle, WA 98104 | | U/W NCF DSCR: | | 3.32x |
| | U/W NOI Debt Yield: | | 13.0% |
high-tech job base in Seattle has grown by 26%. Notable technology tenants with presence in the Seattle central business district are Amazon, DocuSign, F5 Networks and Dropbox.
Submarket Information - According to the appraisal, the F5 Tower Property is located in the Downtown Seattle submarket within the Puget Sound office market. As of the third quarter of 2019, the Downtown Seattle office submarket reported a total Class A inventory of approximately 26.9 million square feet with a 5.1% vacancy rate. The concluded market rent, according to the appraisal, is $45.00 per square foot.
The following table presents certain information relating to the appraiser’s market rent conclusions for the F5 Tower Property:
Market Rent Summary(1)
| Floors 20-26 | Floors 27-33 | Floors 34-40 | Floors 41-46 | Floors 47-48 |
Market Rent (PSF) | $42.00 | $44.00 | $46.00 | $48.00 | $50.00 |
Lease Term (Years) | 10 | 10 | 10 | 10 | 10 |
Free Rent Months | 5 | 5 | 5 | 5 | 5 |
Lease Type (Reimbursements) | NNN | NNN | NNN | NNN | NNN |
Rent Increase Projection | 2.75% per annum | 2.75% per annum | 2.75% per annum | 2.75% per annum | 2.75% per annum |
Tenant Improvements (New Tenants) (PSF) | $70.00 | $70.00 | $70.00 | $70.00 | $70.00 |
Tenant Improvements (Renewals) (PSF) | $35.00 | $35.00 | $35.00 | $35.00 | $35.00 |
(1) | Information obtained from the appraisal. |
The table below presents certain information relating to comparable sales pertaining to the F5 Tower Property identified by the appraiser:
Comparable Sales(1)
Property Name | Location | Rentable Area (SF) | Sale Date | Sale Price | Sales Price (PSF) | Indicated Value (PSF) |
Westlake Tower | Seattle, WA | 355,580 | Oct-19 | $236,000,000 | $663.70 | $896.00 |
Troy Block | Seattle, WA | 811,463 | Mar-19 | $740,000,000 | $911.93 | $884.00 |
400 Fairview Building | Seattle, WA | 349,152 | Jul-18 | $338,425,250 | $969.28 | $907.00 |
202 Westlake | Seattle, WA | 130,710 | May-18 | $129,500,000 | $990.74 | $876.00 |
Dexter Station | Seattle, WA | 345,992 | May-17 | $286,000,000 | $826.61 | $848.00 |
| (1) | Information obtained from the appraisal. |
THE INFORMATION IN THIS STRUCTURAL AND COLLATERAL TERM SHEET IS NOT COMPLETE AND MAY BE AMENDED PRIOR TO THE TIME OF SALE. THIS TERM SHEET IS NOT AN OFFER TO SELL THESE SECURITIES AND IT IS NOT A SOLICITATION OF AN OFFER TO BUY THESE SECURITIES IN ANY JURISDICTION WHERE THE OFFER OR SALE IS NOT PERMITTED.
77
Office - CBD | Loan #4 | Cut-off Date Balance: | | $40,000,000 |
801 5th Avenue | F5 Tower | Cut-off Date LTV: | | 39.4% |
Seattle, WA 98104 | | U/W NCF DSCR: | | 3.32x |
| | U/W NOI Debt Yield: | | 13.0% |
The following table presents certain information relating to comparable properties to F5 Tower Property:
Comparable Leases(1)
Property Name/Location | Year Built/ Renovated | Total GLA (SF) | Distance from Subject | Occupancy | Lease Term | Tenant Size (SF) | Annual Base Rent PSF(2) | TI Allowance PSF | Lease Type |
Madison Centre 505 Madison Street Seattle, WA | 2018/NAP | 753,869 | 0.0 miles | 94.0% | 10.0 Yrs | 67,440 | $42.00 | $102.50 | NNN |
Fourth & Madison 925 Fourth Avenue Seattle, WA | 2002/NAP | 845,533 | 0.2 miles | 97.0% | 10.4 Yrs | 11,670 | $42.00 | $100.00 | NNN |
1201 Third 1201 Third Avenue Seattle, WA | 1988/NAP | 1,079,013 | 0.3 miles | 92.0% | 10.0 Yrs | 22,571 | $36.25 | $80.00 | Full Service |
Rainier Square Development 1301 5th Avenue Seattle, WA | 2020/NAP | 994,567 | 0.3 miles | 100.0% | 15.0 Yrs | 722,000 | $39.00 | $75.00 | NNN |
2+U Building 1201 2nd Avenue Seattle, WA | 2019/NAP | 701,000 | 0.4 miles | 60.0% | 14.0 Yrs | 199,221 | $48.00 | $100.00 | NNN |
2+U Building 1201 2nd Avenue Seattle, WA | 2019/NAP | 701,000 | 0.4 miles | 60.0% | 12.3 Yrs | 120,886 | $45.50 | $97.50 | NNN |
2+U Building 1201 2nd Avenue Seattle, WA | 2019/NAP | 701,000 | 0.4 miles | 60.0% | 12.5 Yrs | 90,848 | $42.50 | $90.00 | NNN |
Two Union Square 601 Union Street Seattle, WA | 1989/NAP | 1,164,046 | 0.4 miles | 97.0% | 5.0 Yrs | 7,219 | $47.00 | $15.00 | Full Service |
| (1) | Information obtained from appraisal. |
| (2) | Annual Base Rent PSF captures each tenant’s NNN equivalent rent. |
Escrows.
Real Estate Taxes – At origination, the borrower was required to escrow $644,935 for real estate taxes. The borrower is required to make monthly payments of one-twelfth of the taxes payable during the next twelve months, currently equal to $214,978.
Insurance – The borrower will not be required to make monthly payments of one-twelfth of the insurance premiums the lender estimates will be payable during the next twelve months as long as the borrower maintains a blanket policy acceptable to the lender.
Replacement Reserve – Upon the occurrence and during the continuance of a Trigger Period (as defined below), the cash management bank will be directed to deposit into escrow, and in the event of any shortfall from funds on deposit with the cash management bank, the borrower will pay the lender 1/12th of $0.20 per square foot per annum each month, totaling approximately $8,592 per month.
Lease Sweep Reserve – During the continuance of a Trigger Period, the borrower is required to escrow approximately $64,440 subject to the Lease Sweep Reserve Cap (as defined below) into a lease sweep reserve to be disbursed as described in the F5 Tower Whole Loan documents. During a Trigger Period, the Lease Sweep Reserve will be paid subsequent to the replacement reserves.
Lockbox and Cash Management. The F5 Tower Whole Loan documents require a hard lockbox with springing cash management. At origination, the borrower was required to deliver written instructions to tenants directing them to deposit all rents payable under such leases directly into a lender-controlled lockbox account. The F5 Tower Whole Loan documents require that all rents and other funds from operations received by the borrower or the property manager be deposited into the lockbox within two business days after receipt and that the parking manager deposit parking net operating income into the lockbox on a monthly basis in accordance with the parking management agreement.
Prior to the ARD and in the absence of a Trigger Period, funds in the lockbox account will be transferred daily to a borrower operating account. Prior to the ARD and during a Trigger Period (while no event of default is continuing), (i) all amounts in the lockbox account are to be transferred daily for the payment, among other things, of the debt service under the F5 Tower Whole Loan and F5 Tower Mezzanine Loan (as defined below), monthly escrows and other expenses described in the F5 Tower Whole Loan documents in accordance with the F5 Tower Whole Loan documents and (ii) to the extent that there is excess cash flow after the payment of reserves, the excess cash flow will be applied at the borrower’s request to pay operating costs and expenses, leasing costs, accounting costs, funds sufficient to make required REIT distributions and other expenses reasonably approved by the lender. After the ARD, all amounts in the lockbox account are to be transferred daily for the payment of, among other things, debt service under the F5 Tower Whole Loan and F5 Tower Mezzanine Loan, monthly escrows, Accrued Interest and other expenses described in the F5 Tower Whole Loan documents in accordance with the F5 Tower Whole Loan documents.
THE INFORMATION IN THIS STRUCTURAL AND COLLATERAL TERM SHEET IS NOT COMPLETE AND MAY BE AMENDED PRIOR TO THE TIME OF SALE. THIS TERM SHEET IS NOT AN OFFER TO SELL THESE SECURITIES AND IT IS NOT A SOLICITATION OF AN OFFER TO BUY THESE SECURITIES IN ANY JURISDICTION WHERE THE OFFER OR SALE IS NOT PERMITTED.
78
Office - CBD | Loan #4 | Cut-off Date Balance: | | $40,000,000 |
801 5th Avenue | F5 Tower | Cut-off Date LTV: | | 39.4% |
Seattle, WA 98104 | | U/W NCF DSCR: | | 3.32x |
| | U/W NOI Debt Yield: | | 13.0% |
A “Trigger Period” will commence upon (i) January 6, 2030, (ii) an event of default under the F5 Tower Whole Loan documents, (iii) a Low Debt Yield Period (as defined below), (iv) a Lease Sweep Period or (v) an event of default under the F5 Tower Mezzanine Loan documents. A Trigger Period will cease upon: with respect to clause (ii), the cure and acceptance of the cure by the lender of such event of default; with respect to clause (iii), the end of a Low Debt Yield Period; with respect to clause (iv), the end of such Lease Sweep Period; and with respect to clause (v), receipt of notice from the mezzanine lender that the event of default has been cured or waived.
A “Low Debt Yield Period” will commence if, as of the last day of a calendar quarter, (a) the F5 Tower Property is not fully leased to F5 Networks, one or more investment grade entities in accordance with the F5 Tower Whole Loan documents or tenants otherwise approved by the lender and (b) the F5 Tower Whole Loan debt yield (with a numerator equal to the gross income from operations less expenses and reserves and a denominator equal to the outstanding principal balance of the F5 Tower Whole Loan) is less than 6.4% or the aggregate debt yield is less than 5.5% (with a numerator equal to gross income from operations less expenses and reserves and a denominator equal to the outstanding principal balance of the F5 Tower Whole Loan and the F5 Tower Mezzanine Loan). A Low Debt Yield Period will end when the F5 Tower Whole Loan debt yield is greater than or equal to 6.4% and the aggregate debt yield of the F5 Tower Whole Loan plus the F5 Tower Mezzanine Loan is greater than or equal to 5.5% for at least two consecutive calculation dates. The borrower also has the option to avoid a Low Debt Yield Period by (i) delivering a letter of credit as collateral for the F5 Tower Whole Loan in an amount equal to the Low Debt Yield Avoidance Amount (as defined below) or (ii) after the 24th payment date, prepaying the outstanding principal balance of the F5 Tower Whole Loan in an amount equal to the Low Debt Yield Avoidance Amount in accordance with the F5 Tower Whole Loan documents.
The “Low Debt Yield Avoidance Amount” is the amount that the then outstanding principal balance of the F5 Tower Whole Loan would need to be reduced in order for the F5 Tower Whole Loan debt yield to equal 6.4% and the aggregate debt yield of the F5 Tower Whole Loan plus the F5 Tower Mezzanine Loan to equal 5.5%.
A “Lease Sweep Period” will commence on the first payment date prior to the ARD following the earliest to occur of (i)(a) a Lease Sweep Tenant Party (as defined below) terminating all or at least 40,000 square feet of space (or, if a full floor of space is less than 40,000 square feet, a full floor of space), upon the effective date of such termination or (b) a Lease Sweep Tenant Party delivering written notice to the borrower or property manager of intent to terminate 40,000 or more square feet of space, upon the later of the date that is 36 months prior to the lease expiration date and the date the written notice is received; (ii) the date that is 10 months prior to the ARD unless F5 Networks does not exercise its Early Termination Right; (iii) a Lease Sweep Tenant Party going dark on 50% or more of its space, subject to certain exceptions set forth in the F5 Tower Whole Loan documents; (iv) a monetary default or material non-monetary default under the (a) F5 Networks lease or (b) an F5 Networks replacement lease for at least 75% of the square feet demised under the F5 Networks lease, if applicable; or (v) bankruptcy proceedings of a Lease Sweep Tenant Party. A Lease Sweep Period will end upon the earliest of, with respect to clauses (i) and (ii) above, each of (a) one or more replacement tenants acceptable to the lender executing leases accounting for at least 75% of the rentable square feet demised under the F5 Networks lease, (b) after giving effect to such replacement lease(s), the F5 Tower Whole Loan debt yield being at least 8.14% and the aggregate debt yield of the F5 Tower Whole Loan and F5 Tower Mezzanine Loan being at least 7.00% and (c) certain occupancy conditions as described in the F5 Tower Whole Loan documents are satisfied (and in the case of a Lease Sweep Period under clause (i) above, the borrower may prepay the outstanding principal balance of the F5 Tower Whole Loan in accordance with the F5 Tower Whole Loan documents in order to satisfy such debt yield conditions); with respect to clause (iii) above, either (a) one or more replacement tenants acceptable to the lender executing leases accounting for at least 75% of the rentable square feet demised under the F5 Networks lease and certain occupancy conditions under the F5 Tower Whole Loan being satisfied or (b) the entirety of the space vacated being subleased to an investment grade entity in accordance with the F5 Tower Whole Loan documents that is paying rent at a rate at least equal to the lease for the Lease Sweep Tenant Party; with respect to clause (iv) above, the default being cured and no other default occurring for a period of three consecutive months following such cure; with respect to clause (v) above, the bankruptcy proceeding being terminated or the applicable lease has been affirmed, assumed or assigned in a manner satisfactory to the lender; and with respect to clauses (i), (ii), (iii) and (iv) above, the date on which the aggregate amount of funds transferred to the lease sweep reserve account equals the Lease Sweep Reserve Cap (as defined below).
Other than a Lease Sweep Period regarding an insolvency event, the borrower may prevent the Lease Sweep Period by (i) posting a letter of credit equal to the Lease Sweep Reserve Cap or (ii) (x) delivering a guaranty satisfactory to the lender from up to two guarantors considered investment grade (“BBB-” or equivalent) by at least two of S&P, Fitch and Moody’s and that maintain an aggregate minimum net worth of $350,000,000 and liquidity of $50,000,000 or (y) subject to (A) rating agency confirmation, (b) approval of the mezzanine lender and (C) the lender’s receipt of a guaranty that is satisfactory in form and substance from a guarantor acceptable to the lender in an amount equal to the Lease Sweep Reserve Cap (if more than one event has occurred under a Lease Sweep Period, the applicable amount will be the greatest Lease Sweep Reserve Cap).
The “Lease Sweep Reserve Cap” will mean (a) with respect to a Lease Sweep Period caused by clause (i) above, $75.00 per rentable square foot of the terminated space; (b) with respect to a Lease Sweep Period caused by clause (ii) above, $38,663,850 ($75.00 per rentable square foot leased to F5 Networks); (c) with respect to a Lease Sweep Period caused by clause (iv) above, $75.00 per rentable square foot of the related defaulted lease; or (d) with respect to a Lease Sweep Period caused by clause (iii) above, $75.00 per rentable square foot of applicable dark space; provided that the aggregate Lease Sweep Reserve Cap for all concurrent Lease Sweep Period triggers may not exceed $38,663,850.
THE INFORMATION IN THIS STRUCTURAL AND COLLATERAL TERM SHEET IS NOT COMPLETE AND MAY BE AMENDED PRIOR TO THE TIME OF SALE. THIS TERM SHEET IS NOT AN OFFER TO SELL THESE SECURITIES AND IT IS NOT A SOLICITATION OF AN OFFER TO BUY THESE SECURITIES IN ANY JURISDICTION WHERE THE OFFER OR SALE IS NOT PERMITTED.
79
Office - CBD | Loan #4 | Cut-off Date Balance: | | $40,000,000 |
801 5th Avenue | F5 Tower | Cut-off Date LTV: | | 39.4% |
Seattle, WA 98104 | | U/W NCF DSCR: | | 3.32x |
| | U/W NOI Debt Yield: | | 13.0% |
A “Lease Sweep Tenant Party” will mean (a) F5 Networks, (b) a tenant under one or more F5 Networks replacement leases for at least 75% of the rentable square feet demised under the F5 Networks lease or (c) a direct or indirect parent company of either of the foregoing.
Property Management. The F5 Tower Property is managed by Urban Renaissance Property Company LLC, a full-service commercial real estate firm engaged in acquisitions, development, management and ownership in Seattle and Bellevue, Washington, Portland, Oregon and Denver, Colorado.
Partial Release. Not permitted.
Real Estate Substitution. Not permitted.
Subordinate and Mezzanine Indebtedness. On December 19, 2019, Barclays and DBRI funded the F5 Tower Subordinate Loan in the aggregate amount of $112,600,000. The F5 Tower Subordinate Loan will be an asset of the BBCMS 2020-C6 securitization trust but will not be pooled together with the other mortgage loans and payments of interest and principal received in respect of the F5 Tower Subordinate Loan will be available to make distributions in respect of the loan-specific classes of certificates only. The F5 Tower Subordinate Loan has an initial interest rate of 3.69868% per annum and is coterminous with the F5 Tower Senior Loan. Following the ARD, to the extent that the F5 Tower Whole Loan is outstanding, the F5 Tower Whole Loan will accrue interest at the Adjusted Interest Rate. The relative rights and obligations of the holders of the F5 Tower Senior Loan and the F5 Tower Subordinate Loan are governed by the terms of a co-lender agreement. See “Description of the Mortgage Pool—The Whole Loans—The Non-Serviced AB Whole Loans��The F5 Tower Whole Loan” in the Preliminary Prospectus. Based on the F5 Tower Whole Loan, the Cut-off Date LTV Ratio, Maturity or ARD Date LTV Ratio, UW NCF DSCR and UW NOI Debt Yield are 63.3%, 63.3%, 2.07x and 8.1%, respectively.
Additionally, a $48,500,000 mezzanine loan was funded concurrently with the origination of the F5 Tower Whole Loan (the “F5 Tower Mezzanine Loan”), which is secured by the direct equity ownership in the borrower. Following loan origination, the F5 Tower Mezzanine Loan was sold to a third party investor. The F5 Tower Mezzanine Loan accrues interest at a rate of (i) prior to the ARD, 6.15000% per annum (the “Mezzanine Initial Interest Rate”) (or, when applicable pursuant to the F5 Tower Mezzanine Loan documents, the default rate) and (ii) from and after the ARD, to the extent that the F5 Tower Mezzanine Loan is outstanding, the F5 Tower Mezzanine Loan will accrue interest at a rate equal to the greater of (a) the Mezzanine Initial Interest Rate plus 2.50% and (b) when applicable pursuant to the F5 Tower Mezzanine Loan documents, the default rate (the “Mezzanine Adjusted Interest Rate”). The “Mezzanine Accrued Interest” is the difference between (i) interest accrued on the F5 Tower Mezzanine Loan at the Mezzanine Adjusted Interest Rate and (ii) interest accrued on the F5 Tower Mezzanine Loan at the Mezzanine Initial Interest Rate. The Mezzanine Accrued Interest will be deferred and will be paid on the maturity date for the F5 Tower Mezzanine Loan to the extent not paid sooner by the F5 Tower Mezzanine Loan borrower. The F5 Tower Mezzanine Loan may not be prepaid without a simultaneous prepayment of the F5 Tower Whole Loan. Including the F5 Tower Whole Loan and F5 Tower Mezzanine Loan, the total Cut-off Date LTV, Maturity Date or ARD LTV Ratio, total UW NCF DSCR and total UW NOI Debt Yield are 73.6%, 73.6%, 1.63x and 6.9%, respectively. The lenders of the F5 Tower Whole Loan have entered into an intercreditor agreement with the F5 Tower Mezzanine Loan lenders, which agreement governs their relationship.
Leasehold. The collateral consists of the borrower’s fee interest in the office condominium, 259 borrower-owned spaces in a parking garage (consisting of the borrower’s fee ownership of 217 parking spaces and a permanent easement with to the use of 42 parking spaces) and an additional 63 parking spaces leased from The Rainier Club through September 30, 2026. The 63 parking spaces subject to the leasehold interest account for 19.6% of the spaces and 11.5% of the parking income (0.7% of total effective gross income).
Terrorism Insurance. The F5 Tower Whole Loan documents require that the “all risk” insurance policy required to be maintained by the borrower provides coverage for terrorism in an amount equal to the full replacement cost of the F5 Tower Property, as well as business interruption insurance covering no less than the 24-month period following the occurrence of a casualty event, together with a 12-month extended period of indemnity.
Earthquake Insurance. The F5 Tower Property is located within seismic zone 3 and has a probable maximum loss of 9%. The F5 Tower Whole Loan documents require earthquake insurance in amounts acceptable to the lender in form and substance. The borrower obtained earthquake insurance with a limit of $40.0 million per occurrence and in the annual aggregate.
THE INFORMATION IN THIS STRUCTURAL AND COLLATERAL TERM SHEET IS NOT COMPLETE AND MAY BE AMENDED PRIOR TO THE TIME OF SALE. THIS TERM SHEET IS NOT AN OFFER TO SELL THESE SECURITIES AND IT IS NOT A SOLICITATION OF AN OFFER TO BUY THESE SECURITIES IN ANY JURISDICTION WHERE THE OFFER OR SALE IS NOT PERMITTED.
80
(THIS PAGE INTENTIONALLY LEFT BLANK)
THE INFORMATION IN THIS STRUCTURAL AND COLLATERAL TERM SHEET IS NOT COMPLETE AND MAY BE AMENDED PRIOR TO THE TIME OF SALE. THIS TERM SHEET IS NOT AN OFFER TO SELL THESE SECURITIES AND IT IS NOT A SOLICITATION OF AN OFFER TO BUY THESE SECURITIES IN ANY JURISDICTION WHERE THE OFFER OR SALE IS NOT PERMITTED.
81
Retail - Anchored | Loan #5 | Cut-off Date Balance: | | $38,520,000 |
3001 South Las Vegas Boulevard | Silver City Plaza | Cut-off Date LTV: | | 63.7% |
Las Vegas, NV 89109 | | U/W NCF DSCR: | | 1.73x |
| | U/W NOI Debt Yield: | | 7.5% |
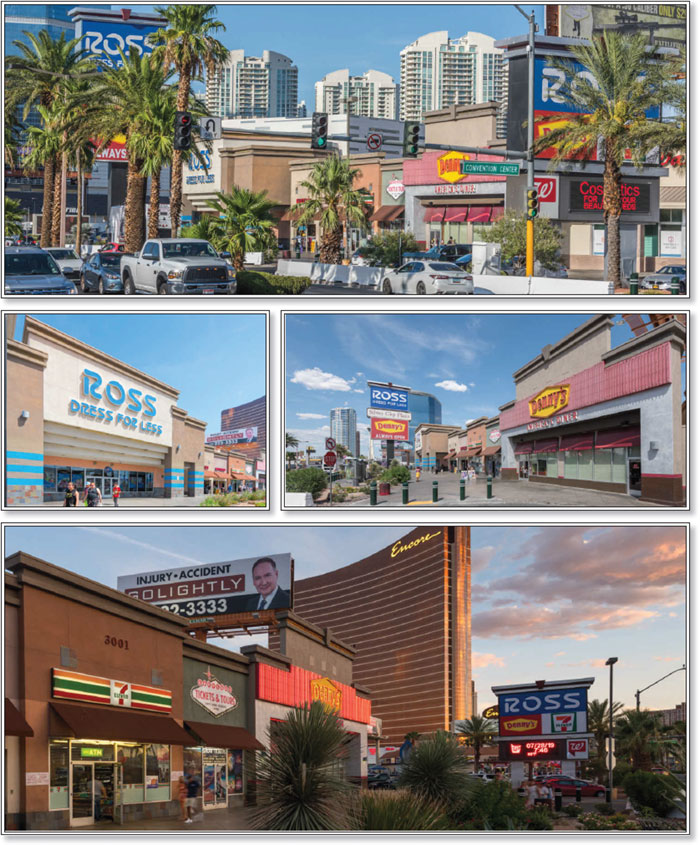
THE INFORMATION IN THIS STRUCTURAL AND COLLATERAL TERM SHEET IS NOT COMPLETE AND MAY BE AMENDED PRIOR TO THE TIME OF SALE. THIS TERM SHEET IS NOT AN OFFER TO SELL THESE SECURITIES AND IT IS NOT A SOLICITATION OF AN OFFER TO BUY THESE SECURITIES IN ANY JURISDICTION WHERE THE OFFER OR SALE IS NOT PERMITTED.
82
Retail - Anchored | Loan #5 | Cut-off Date Balance: | | $38,520,000 |
3001 South Las Vegas Boulevard | Silver City Plaza | Cut-off Date LTV: | | 63.7% |
Las Vegas, NV 89109 | | U/W NCF DSCR: | | 1.73x |
| | U/W NOI Debt Yield: | | 7.5% |
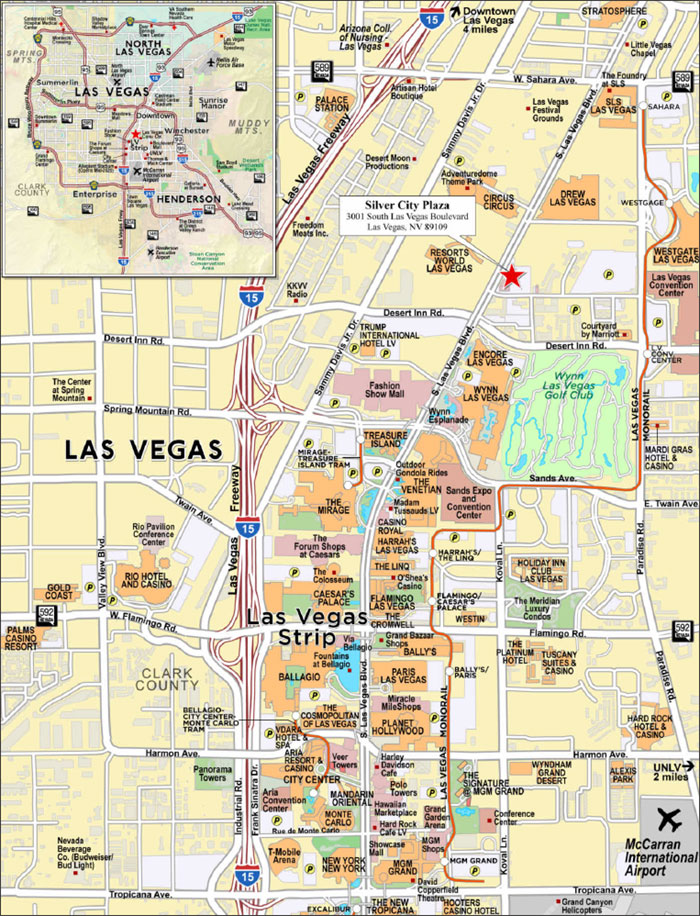
THE INFORMATION IN THIS STRUCTURAL AND COLLATERAL TERM SHEET IS NOT COMPLETE AND MAY BE AMENDED PRIOR TO THE TIME OF SALE. THIS TERM SHEET IS NOT AN OFFER TO SELL THESE SECURITIES AND IT IS NOT A SOLICITATION OF AN OFFER TO BUY THESE SECURITIES IN ANY JURISDICTION WHERE THE OFFER OR SALE IS NOT PERMITTED.
83
No. 5 – Silver City Plaza |
|
Mortgage Loan Information | | Mortgaged Property Information |
Mortgage Loan Seller: | Ladder Capital Finance LLC | | Single Asset/Portfolio: | Single Asset |
Credit Assessment (KBRA/Fitch/Moody’s): | NR/NR/NR | | Property Type – Subtype: | Retail – Anchored |
Original Principal Balance: | $38,520,000 | | Location: | Las Vegas, NV |
Cut-off Date Balance: | $38,520,000 | | Size: | 41,583 SF |
% of Initial Pool Balance: | 4.0% | | Cut-off Date Balance Per SF: | $926.34 |
Loan Purpose: | Acquisition | | Maturity Date Balance Per SF: | $926.34 |
Borrower Sponsor: | Elyahu Cohen | | Year Built/Renovated: | 2005/NAP |
Guarantor: | Elyahu Cohen | | Title Vesting: | Fee |
Mortgage Rate: | 4.1550% | | Property Manager: | Self-managed |
Note Date: | December 27, 2019 | | Current Occupancy (As of): | 100.0% (11/20/2019) |
Seasoning: | 1 month | | YE 2018 Occupancy: | 100.0% |
Maturity Date: | January 6, 2030 | | YE 2017 Occupancy: | 100.0% |
IO Period: | 120 months | | YE 2016 Occupancy: | 100.0% |
Loan Term (Original): | 120 months | | YE 2015 Occupancy: | 100.0% |
Amortization Term (Original): | NAP | | As-Is Appraised Value: | $60,500,000 |
Loan Amortization Type: | Interest-only, Balloon | | As-Is Appraised Value Per SF: | $1,454.92 |
Call Protection: | L(25),D(90),O(5) | | As-Is Appraisal Valuation Date: | November 26, 2019 |
Lockbox Type: | Hard/Springing Cash Management | | Underwriting and Financial Information |
Additional Debt: | None | | TTM NOI (10/31/2019): | $2,660,989 |
Additional Debt Type (Balance): | NAP | | YE 2018 NOI: | $2,629,166 |
| | | YE 2017 NOI: | $2,606,135 |
| | | YE 2016 NOI(2): | NAV |
| | | U/W Revenues: | $3,363,071 |
| | | U/W Expenses: | $492,778 |
Escrows and Reserves(1) | | U/W NOI: | $2,870,293 |
| Initial | Monthly | Cap | | U/W NCF: | $2,812,077 |
Taxes | $38,976 | $7,795 | NAP | | U/W DSCR based on NOI/NCF: | 1.76x / 1.73x |
Insurance | $11,082 | Springing | NAP | | U/W Debt Yield based on NOI/NCF: | 7.5% / 7.3% |
Replacement Reserve | $0 | $520 | NAP | | U/W Debt Yield at Maturity based on NOI/NCF: | 7.5% / 7.3% |
TI/LC Reserve | $0 | $4,332 | NAP | | Cut-off Date LTV Ratio: | 63.7% |
#Hashtag TI/LC Funds | $120,900 | $0 | NAP | | LTV Ratio at Maturity: | 63.7% |
#Hashtag Prepaid Rent | $24,077 | $0 | NAP | | | |
| | | | | | |
| | | | | | | |
Sources and Uses |
Sources | | | | | Uses | | | |
Original loan amount | $38,520,000 | | 64.2% | | Purchase price | $59,250,000 | | 98.8% |
Borrower Sponsor contribution | 21,440,318 | | 35.8 | | Closing costs | 515,283 | | 0.9 |
| | | | | Upfront reserves | 195,035 | | 0.3 |
Total Sources | $59,960,318 | | 100.0% | | Total Uses | $59,960,318 | | 100.0% |
(1) | See “Escrows” section for a full description of Escrows and Reserves. |
(2) | Historical financials prior to 2017 are unavailable as the Silver City Property (as defined below) was acquired in 2020. As such, the borrower sponsor was not provided full historical financials. |
The Mortgage Loan. The mortgage loan (the “Silver City Plaza Mortgage Loan”) is evidenced by a single promissory note secured by a first mortgage encumbering the fee interest in a 41,583 square foot anchored retail center located in Las Vegas, Nevada (the “Silver City Plaza Property”).
The Borrower and Borrower Sponsor. The borrower is EC 3001 South Las Vegas Boulevard LLC (the “Silver City Plaza Borrower”) a Delaware limited liability company and single purpose entity. Legal counsel to the Silver City Plaza Borrower delivered a non-consolidation opinion in connection with the origination of the Silver City Plaza Mortgage Loan. The nonrecourse carve-out guarantor and borrower sponsor of the Silver City Plaza Mortgage Loan is Elyahu Cohen.
Mr. Cohen has 24 years of experience investing in real estate and has a portfolio of 25 properties comprised of hotels, malls, commercial condominiums and mixed-use buildings. Mr. Cohen has ownership in two other properties in Las Vegas, including the Walgreens located adjacent to the Silver City Plaza Property, and Showcase Mall II, and is the owner of Regal Home Collections, an import and wholesales textiles business, based in New York City.
THE INFORMATION IN THIS STRUCTURAL AND COLLATERAL TERM SHEET IS NOT COMPLETE AND MAY BE AMENDED PRIOR TO THE TIME OF SALE. THIS TERM SHEET IS NOT AN OFFER TO SELL THESE SECURITIES AND IT IS NOT A SOLICITATION OF AN OFFER TO BUY THESE SECURITIES IN ANY JURISDICTION WHERE THE OFFER OR SALE IS NOT PERMITTED.
84
Retail - Anchored | Loan #5 | Cut-off Date Balance: | | $38,520,000 |
3001 South Las Vegas Boulevard | Silver City Plaza | Cut-off Date LTV: | | 63.7% |
Las Vegas, NV 89109 | | U/W NCF DSCR: | | 1.73x |
| | U/W NOI Debt Yield: | | 7.5% |
The Property. The Silver City Plaza Property is a 41,583 square foot retail center in Las Vegas, Nevada. Built in 2005, the Silver City Plaza Property is located on the Las Vegas Strip on a 1.9 acre site at the northeast corner of Las Vegas Boulevard and Convention Center Drive. The Silver City Plaza Property is situated adjacent to the Las Vegas Convention Center expansion project, across from Resorts World by Genting Group and in proximity to the Drew, Wynn/Encore and other Las Vegas Strip attractions. The Silver City Plaza Property contains 210 surface parking spaces, resulting in a parking ratio of 5.05 spaces per 1,000 square feet of net rentable area. As of November 20, 2019, the Silver City Plaza Property was 100.0% occupied by 5 national, regional and local tenants. In addition, there are two owned billboard signs that are leased to Lamar Central Outdoor, LLC, which has leased the billboard space since 2014. The largest tenants at the Silver City Plaza Property are Ross Dress for Less and Denny’s, who are original tenants at the Silver City Plaza Property and have exercised multiple extension options. Ross Dress for Less and 7-Eleven have been at the Silver City Plaza Property since 2005. The Silver City Plaza Property has been able to maintain 100% year end occupancy over the last 15 years.
Major Tenants.
Largest Tenant: Ross Dress For Less (A2/A- by Moody’s/S&P; 32,000 square feet; 51.9% of underwritten base rent; 1/31/2025 lease expiration) – According to company financials, Ross Dress for Less is the largest off-price apparel and home fashion chain in the United States. As of February 2019, Ross Dress for Less has approximately 88,100 employees and operates 1,480 locations in 38 states, the District of Columbia, and Guam. As of February 2, 2019, Ross Dress for Less reported a net income of $1.6 billion and retail sales of $15.0 billion. Ross Dress for Less has been a tenant since 2005 with an upcoming lease expiration of January 2025 and 2, 5-year renew options remaining.
2nd Largest Tenant: Denny’s (4,765 square feet; 22.6% of underwritten base rent; 3/25/2025 lease expiration) – Denny’s is one of America’s largest franchised full-service restaurant chains. As of December 2018, Denny’s brand consisted of 1,709 franchised, licensed and company operated restaurants around the world with a combined sales of $2.9 billion, including 1,578 restaurants in the United States and 131 international locations. Denny’s has been a tenant since 2005 with an upcoming lease expiration of March 2025 with 1, 5-year renewal option remaining.
The following table presents certain information relating to the tenancy at the Silver City Plaza Property:
Major Tenants
Tenant Name | Credit Rating (Fitch/Moody’s/
S&P)(1) | Tenant NRSF | % of
NRSF | Annual U/W Base Rent PSF(2) | Annual
U/W Base Rent(2) | % of Total Annual U/W Base Rent | Lease
Expiration
Date | Extension Options | Termination Option (Y/N) |
Anchor Tenants | | | | | | | | |
Ross Dress For Less | NR/A2/A- | 32,000 | 77.0% | $51.28 | $1,640,960 | 51.9% | 1/31/2025 | 2, 5-year | N |
Denny’s | NR/NR/NR | 4,765 | 11.5% | $150.00 | $714,750 | 22.6% | 3/25/2025 | 1, 5-year | N |
#Hashtag Vegas | NR/NR/NR | 2,418 | 5.8% | $109.18 | $264,000 | 8.4% | 1/31/2025 | 1, 5-year | N |
7-Eleven | NR/Baa1/AA- | 2,200 | 5.3% | $142.45 | $313,390 | 9.9% | 10/31/2024 | None | N |
Las Vegas Tickets | NR/NR/NR | 200 | 0.5% | $900.00 | $180,000 | 5.7% | 10/31/2020 | None | N |
Total Major Tenants | | 41,583 | 100.0% | $74.86 | $3,113,100 | 98.5% | | | |
| | | | | | | | | |
Billboard Space(3) | 0 | 0.0% | NAP | $48,000 | 1.5% | | | |
| | | | | | | | |
Occupied Collateral Total | 41,583 | 100.0% | $76.02 | $3,161,100 | 100.0% | | | |
| | | | | | | | |
Vacant Space | 0 | 0.0% | | | | | | |
| | | | | | | | |
Collateral Total | 41,583 | 100.0% | | | | | | |
| | | | | | | | | |
| | | | | | | | |
(1) | Certain ratings are those of the parent company whether or not the parent company guarantees the lease. |
(2) | Annual U/W Base Rent PSF and Annual U/W Base Rent include contractual rent steps through July 2020 totaling $313,865. |
(3) | The billboard space is made up of two rooftop billboards, each generating $24,000 in annual U/W Base Rent pursuant to a lease expiring in December 2020. The tenant has leased the space since September 2014. |
THE INFORMATION IN THIS STRUCTURAL AND COLLATERAL TERM SHEET IS NOT COMPLETE AND MAY BE AMENDED PRIOR TO THE TIME OF SALE. THIS TERM SHEET IS NOT AN OFFER TO SELL THESE SECURITIES AND IT IS NOT A SOLICITATION OF AN OFFER TO BUY THESE SECURITIES IN ANY JURISDICTION WHERE THE OFFER OR SALE IS NOT PERMITTED.
85
Retail - Anchored | Loan #5 | Cut-off Date Balance: | | $38,520,000 |
3001 South Las Vegas Boulevard | Silver City Plaza | Cut-off Date LTV: | | 63.7% |
Las Vegas, NV 89109 | | U/W NCF DSCR: | | 1.73x |
| | U/W NOI Debt Yield: | | 7.5% |
The following table presents certain information relating to tenant sales at the Silver City Plaza Property:
Tenant Sales (PSF)
Major Tenant Name | % of Total Annual U/W Base Rent | 2016 | 2017 | 2018 | Major Tenant Occupancy Cost(1) |
Ross Dress for Less | 51.9% | NAV | NAV | NAV | NAV |
Denny’s | 22.6% | $935 | $1,081 | $1,071 | 12.4% |
#Hashtag Vegas | 8.4% | NAV | NAV | NAV | NAV |
7-Eleven | 9.9% | $712 | $783 | $773 | 20.0% |
Las Vegas Tickets | 5.7% | NAV | NAV | NAV | NAV |
(1) | Major Tenant Occupancy Cost is based on the underwritten base rent and underwritten reimbursements using 2018 tenant sales. |
The following table presents certain information relating to the lease rollover schedule at the Silver City Plaza Property:
Lease Expiration Schedule(1)(2)
Year Ending
December 31, | No. of Leases Expiring | Expiring NRSF | % of Total NRSF | Cumulative Expiring NRSF | Cumulative % of Total NRSF | Annual
U/W
Base Rent | % of Total Annual U/W Base Rent | Annual
U/W
Base Rent
PSF |
MTM | 0 | 0 | 0.0% | 0 | 0.0% | $0 | 0.0% | $0.00 |
2020(3) | 3 | 200 | 0.5% | 200 | 0.5% | $228,000 | 7.2% | $1,140.00 |
2021 | 0 | 0 | 0.0% | 200 | 0.5% | $0 | 0.0% | $0.00 |
2022 | 0 | 0 | 0.0% | 200 | 0.5% | $0 | 0.0% | $0.00 |
2023 | 0 | 0 | 0.0% | 200 | 0.5% | $0 | 0.0% | $0.00 |
2024 | 1 | 2,200 | 5.3% | 2,400 | 5.8% | $313,390 | 9.9% | $142.45 |
2025 | 3 | 39,183 | 94.2% | 41,583 | 100.0% | $2,619,710 | 82.9% | $66.86 |
2026 | 0 | 0 | 0.0% | 41,583 | 100.0% | $0 | 0.0% | $0.00 |
2027 | 0 | 0 | 0.0% | 41,583 | 100.0% | $0 | 0.0% | $0.00 |
2028 | 0 | 0 | 0.0% | 41,583 | 100.0% | $0 | 0.0% | $0.00 |
2029 | 0 | 0 | 0.0% | 41,583 | 100.0% | $0 | 0.0% | $0.00 |
2030 | 0 | 0 | 0.0% | 41,583 | 100.0% | $0 | 0.0% | $0.00 |
Thereafter | 0 | 0 | 0.0% | 41,583 | 100.0% | $0 | 0.0% | $0.00 |
Vacant | 0 | 0 | 0.0% | 41,583 | 100.0% | $0 | 0.0% | $0.00 |
Total/Weighted Average | 7 | 41,583 | 100.0% | | | $3,161,100 | 100.0% | $76.02 |
(1) | Information obtained from the underwritten rent roll. |
(2) | Certain tenants may have lease termination options that are exercisable prior to the originally stated expiration date of the subject lease and that are not considered in the Lease Expiration Schedule. |
(3) | Two of the tenants expiring in 2020 are comprised of two rooftop billboards, each generating $24,000 in annual U/W Base Rent pursuant to a lease expiring in December 2020. The tenant has leased the space since September 2014. |
The following table presents historical occupancy percentages at the Silver City Plaza Property:
Historical Occupancy
12/31/2016(1) | | 12/31/2017(1) | | 12/31/2018(1) | | 11/20/2019(2) |
100.0% | | 100.0% | | 100.0% | | 100.0% |
| | | | | | | |
(1) | Information obtained from the Silver City Plaza Borrower. |
(2) | Information obtained from the underwritten rent roll. |
THE INFORMATION IN THIS STRUCTURAL AND COLLATERAL TERM SHEET IS NOT COMPLETE AND MAY BE AMENDED PRIOR TO THE TIME OF SALE. THIS TERM SHEET IS NOT AN OFFER TO SELL THESE SECURITIES AND IT IS NOT A SOLICITATION OF AN OFFER TO BUY THESE SECURITIES IN ANY JURISDICTION WHERE THE OFFER OR SALE IS NOT PERMITTED.
86
Retail - Anchored | Loan #5 | Cut-off Date Balance: | | $38,520,000 |
3001 South Las Vegas Boulevard | Silver City Plaza | Cut-off Date LTV: | | 63.7% |
Las Vegas, NV 89109 | | U/W NCF DSCR: | | 1.73x |
| | U/W NOI Debt Yield: | | 7.5% |
Operating History and Underwritten Net Cash Flow. The following table presents certain information relating to the underwritten net cash flow at the Silver City Plaza Property:
Cash Flow Analysis
| | 2017 | | 2018 | | TTM 10/31/2019 | | U/W | | %(1) | | U/W $ per SF | |
Rents in Place | | $2,700,751 | | $2,714,751 | | $2,734,752 | | $2,847,235 | | 80.5% | | $68.47 | |
Contractual Rent Steps(2) | | 0 | | 0 | | 0 | | 313,865 | | 8.9 | | 7.55 | |
Grossed Up Vacant Space | | 0 | | 0 | | 0 | | 0 | | 0.0 | | 0.00 | |
Gross Potential Rent | | $2,700,751 | | $2,714,751 | | $2,734,752 | | $3,161,100 | | 89.3% | | $76.02 | |
Other Income | | 51,276 | | $51,174 | | $51,963 | | 30,000(3) | | 0.8 | | 0.72 | |
Total Recoveries | | 307,335 | | 300,101 | | 304,195 | | 347,396 | | 9.8 | | 8.35 | |
Net Rental Income | | $3,059,362 | | $3,066,026 | | $3,090,910 | | $3,538,496 | | 100.0% | | $85.09 | |
(Vacancy & Credit Loss) | | 0 | | 0 | | 0 | | (175,425)(4) | | (5.5) | | (4.22) | |
Effective Gross Income | | $3,059,362 | | $3,066,026 | | $3,090,910 | | $3,363,071 | | 95.0% | | $80.88 | |
| | | | | | | | | | | | | |
Real Estate Taxes | | 86,762 | | 89,868 | | 93,542 | | 93,542 | | 2.8 | | 2.25 | |
Insurance | | 10,309 | | 10,700 | | 10,715 | | 66,492 | | 2.0 | | 1.60 | |
Management Fee | | 92,474 | | 92,974 | | 93,813 | | 100,892 | | 3.0 | | 2.43 | |
Other Operating Expenses | | 263,681 | | 243,318 | | 231,851 | | 231,851 | | 6.9 | | 5.58 | |
Total Operating Expenses | | $453,227 | | $436,860 | | $429,921 | | $492,778 | | 14.7% | | $11.85 | |
| | | | | | | | | | | | | |
Net Operating Income | | $2,606,135 | | $2,629,166 | | $2,660,989 | | $2,870,293 | | 85.3% | | $69.03 | |
Replacement Reserves | | 0 | | 0 | | 0 | | 6,237 | | 0.2 | | 0.15 | |
TI/LC | | 0 | | 0 | | 0 | | 51,979 | | 1.5 | | 1.25 | |
Net Cash Flow | | $2,606,135 | | $2,629,166 | | $2,660,989 | | $2,812,077 | | 83.6% | | $67.63 | |
| | | | | | | | | | | | | |
NOI DSCR | | 1.60x | | 1.62x | | 1.64x | | 1.76x | | | | | |
NCF DSCR | | 1.60x | | 1.62x | | 1.64x | | 1.73x | | | | | |
NOI Debt Yield | | 6.8% | | 6.8% | | 6.9% | | 7.5% | | | | | |
NCF Debt Yield | | 6.8% | | 6.8% | | 6.9% | | 7.3% | | | | | |
(1) | Represents (i) percent of Net Rental Income for all revenue fields, (ii) percent of Gross Potential Rent for Vacancy & Credit Loss and (iii) percent of Effective Gross Income for all other fields. |
(2) | Represents contractual rent steps through July 2020. |
(3) | U/W Other Income consists of Denny’s Signage. |
(4) | The underwritten economic vacancy is 5.0%. The Silver City Plaza Property was 100.0% leased as of November 20, 2019. |
Appraisal. As of the appraisal valuation date of November 26, 2019, the Silver City Plaza Property had an “as-is” appraised value of $60,500,000.
Environmental Matters. According to a Phase I environmental site assessment dated December 5, 2019, there was no evidence of any recognized environmental conditions at the Silver City Plaza Property.
Market Overview and Competition. The Silver City Plaza Property is located on the Las Vegas strip, on the northeast corner of Las Vegas Boulevard and Convention Center Drive. According to a third-party report, average daily traffic counts on the Las Vegas Boulevard and Convention Center Drive are approximately 58,100 and 9,200, respectively.
The Silver City Plaza Property is located one block from the Las Vegas Convention Center, which according to the appraisal, hosts 6.5 million annual convention visitors, and is currently undergoing a renovation that will add an additional 600,000 square feet of exhibit space, which is projected to generate an additional 433,000 convention visitors each year. The Silver City Plaza Property is located across the street from Genting Group’s Resorts World Las Vegas, which is an 88-acre $4.3 billion development. The Genting Group’s Resorts World Las Vegas is expected to be completed in 2020 and consist of over 3,500 hotel rooms and 350,000 Square Feet of meeting space. The Silver City Plaza Property is located one block from the development site for The Drew, a Marriott brand casino hotel which is being developed by Steve Witkoff and is anticipated to open in 2022 with 3,780 rooms, a casino, more than 550,000 Square Fee of convention and meeting space, plus food and beverage, retail spa, and nightlife venues. The Drew development is expected to cost approximately $3.1 billion.
According to the appraisal, the 2019 estimated population within a one-, three-, and five-mile radius is 20,613, 198,220, and 435,423, respectively. The average household income within a one-mile radius is $94,853.
THE INFORMATION IN THIS STRUCTURAL AND COLLATERAL TERM SHEET IS NOT COMPLETE AND MAY BE AMENDED PRIOR TO THE TIME OF SALE. THIS TERM SHEET IS NOT AN OFFER TO SELL THESE SECURITIES AND IT IS NOT A SOLICITATION OF AN OFFER TO BUY THESE SECURITIES IN ANY JURISDICTION WHERE THE OFFER OR SALE IS NOT PERMITTED.
87
Retail - Anchored | Loan #5 | Cut-off Date Balance: | | $38,520,000 |
3001 South Las Vegas Boulevard | Silver City Plaza | Cut-off Date LTV: | | 63.7% |
Las Vegas, NV 89109 | | U/W NCF DSCR: | | 1.73x |
| | U/W NOI Debt Yield: | | 7.5% |
Appraiser’s Comp Set – The appraiser identified three primary competitive properties for the Silver City Plaza Property totaling approximately 325,664 square feet, and which reported an average occupancy rate of approximately 96.8%. The appraiser concluded to net market rents for the Silver City Plaza Property of $70.00 per square foot, for large Las Vegas strip retail space, $165.00 per square foot for Las Vegas strip retail space, and $750.00 per square foot for small Las Vegas retail space.
The following table presents certain information relating to the appraiser’s market rent conclusion for the Silver City Plaza Property:
Market Rent Summary(1)
| Large LV Strip Retail Space | LV Strip Retail Space | Small LV Strip Retail Space |
Market Rent (PSF) | $70.00 | $165.00 | $750.00 |
Lease Term (Years) | 10 | 10 | 5 |
Lease Type (Reimbursements) | NNN | NNN | NNN |
Rent Increase Projection | 10.0% | 3.0% | 3.0% |
(1) | Information obtained from the appraisal. |
The table below presents certain information relating to comparable sales for the Silver City Plaza Property identified by the appraiser:
Comparable Sales(1)
Property Name | Location | Rentable Area (SF) | Sale Date | Sale Price | Sale Price (PSF) |
Bonanza Gift & Souvenir | Las Vegas, NV | 36,000 | Oct-16 | $50,000,000 | $1,388.89 |
Miracle Mile Shops | Las Vegas, NV | 501,522 | Oct-16 | $1,080,000,000 | $2,153.44 |
Fashion Show Mall | Las Vegas, NV | 1,324,798 | Jul-16 | $1,250,000,000 | $943.54 |
Crystals at City Center | Las Vegas, NV | 262,327 | Apr-16 | $1,112,000,000 | $4,238.98 |
Showcase Island Plaza | Las Vegas, NV | 43,530 | Dec-15 | $82,850,000 | $1,903.29 |
Showcase Mall Phase III | Las Vegas, NV | 97,320 | Jan-15 | $139,500,000 | $1,433.42 |
(1) | Information obtained from the appraisal. |
THE INFORMATION IN THIS STRUCTURAL AND COLLATERAL TERM SHEET IS NOT COMPLETE AND MAY BE AMENDED PRIOR TO THE TIME OF SALE. THIS TERM SHEET IS NOT AN OFFER TO SELL THESE SECURITIES AND IT IS NOT A SOLICITATION OF AN OFFER TO BUY THESE SECURITIES IN ANY JURISDICTION WHERE THE OFFER OR SALE IS NOT PERMITTED.
88
Retail - Anchored | Loan #5 | Cut-off Date Balance: | | $38,520,000 |
3001 South Las Vegas Boulevard | Silver City Plaza | Cut-off Date LTV: | | 63.7% |
Las Vegas, NV 89109 | | U/W NCF DSCR: | | 1.73x |
| | U/W NOI Debt Yield: | | 7.5% |
The following table presents certain information relating to four comparable leases of inline tenants to those at the Silver City Plaza Property:
Comparable Leases(1)
Property Name/Location | Year Built/ Renovated | Total GLA (SF) | Distance from Subject | Occupancy | Lease Term | Tenant Size | Annual Base Rent PSF | Lease Type |
Showcase Mall Phase I 3785 S. Las Vegas Blvd. Las Vegas, NV | 1996/2004 | 184,814 | 2.2 miles | 100.0% | 10.0 Yrs | 30,313 SF | $50.00 | NNN |
Showcase Mall Phase I 3785 S. Las Vegas Blvd. Las Vegas, NV | 1996/2004 | 184,814 | 2.2 miles | 100.0% | 10.0 Yrs | 12,885 SF | $123.50 | NNN |
Showcase Mall Phase III 3771 S. Las Vegas Blvd. Las Vegas, NV | 2009/NAP | 97,320 | 2.2 miles | 100.0% | 10.4 Yrs | 30,444 SF | $58.22 | NNN |
(1) | Information obtained from the appraisal. |
Escrows.
Real Estate Taxes – The Silver City Plaza Mortgage Loan documents require an upfront real estate tax reserve of $38,976 and ongoing monthly real estate tax reserves in an amount equal to one-twelfth of the real estate taxes that the lender estimates will be necessary to pay taxes over the then succeeding twelve months (initially $7,795).
Insurance – The Silver City Plaza Mortgage Loan documents require an upfront insurance reserve of $11,082 and ongoing monthly reserves for insurance in an amount equal to one-twelfth of the insurance premiums that the lender estimates will be payable during the next twelve months. Insurance escrows are waived so long as no Cash Management Trigger Event has occurred, an acceptable blanket policy is in place and the Silver City Plaza Borrower provides the lender evidence of renewal of such policy.
Replacement Reserves – The Silver City Plaza Mortgage Loan documents require ongoing monthly replacement reserves of $520.
TI/LC Reserves - The Silver City Plaza Mortgage Loan documents require ongoing monthly tenant improvements and leasing commissions reserves of $4,332.
#Hashtag TI/LC Funds - The Silver City Plaza Mortgage Loan documents require an upfront reserve of $120,900 for tenant improvements for #Hashtag Vegas.
#Hashtag Prepaid Rent - The Silver City Plaza Mortgage Loan documents require an upfront reserve of $24,077 for prepaid rent for #Hashtag Vegas to be used for their February 2020 rent payment.
Lockbox and Cash Management. The Silver City Plaza Mortgage Loan documents require a hard lockbox with springing cash management (which will be triggered upon the occurrence of a Cash Management Trigger Event (as defined below)). The Silver City Plaza Mortgage Loan documents require the Silver City Plaza Borrower to deliver written notification to the tenants to deposit all rents payable under each lease directly into the lockbox account, which is already in place. The Silver City Plaza Mortgage Loan documents also require that all rents received by the Silver City Plaza Borrower or the property manager be deposited into the lockbox account within three (3) business days of receipt. Absent a Cash Management Trigger Event, all funds collected in the lockbox account will disbursed daily to the Silver City Plaza Borrower. During the occurrence of a Cash Management Trigger Event, all amounts in the lockbox account are to be transferred daily into a lender controlled cash management account and distributed monthly for the payment of, among other things, debt service, monthly escrows, and default interest (if applicable).
A “Cash Management Trigger Event” will commence upon the occurrence of the following:
| (i) | an event of default under the loan agreement or by the Silver City Plaza Borrower under the property management agreement; |
| (ii) | the debt service coverage ratio for the Silver City Plaza Property falling below 1.45x; |
| (iii) | any tenant occupying more than 20% (physical or economic occupancy) (a “Significant Tenant”) ceasing to conduct, or giving notice of its intent to cease to conduct, its normal business operations at substantially all of its leased premises (including by subleasing substantially all of its leased premises); |
| (iv) | any Significant Tenant (or such tenant’s parent, if applicable) becoming insolvent or filing for bankruptcy; or |
| (v) | any Significant Tenant failing to extend or renew its lease in accordance with its terms or on terms otherwise acceptable to lender, at least six months prior to the expiration of the applicable Significant Tenant’s lease. |
THE INFORMATION IN THIS STRUCTURAL AND COLLATERAL TERM SHEET IS NOT COMPLETE AND MAY BE AMENDED PRIOR TO THE TIME OF SALE. THIS TERM SHEET IS NOT AN OFFER TO SELL THESE SECURITIES AND IT IS NOT A SOLICITATION OF AN OFFER TO BUY THESE SECURITIES IN ANY JURISDICTION WHERE THE OFFER OR SALE IS NOT PERMITTED.
89
Retail - Anchored | Loan #5 | Cut-off Date Balance: | | $38,520,000 |
3001 South Las Vegas Boulevard | Silver City Plaza | Cut-off Date LTV: | | 63.7% |
Las Vegas, NV 89109 | | U/W NCF DSCR: | | 1.73x |
| | U/W NOI Debt Yield: | | 7.5% |
A Cash Management Trigger Event with end upon the occurrence of:
| ● | with regard to clause (i) above, (a) such event of default having been cured under the Silver City Plaza Mortgage Loan or management agreement, as applicable, or (b) a replacement manager acceptable to the lender having been put in place, as applicable; |
| ● | with regard to clause (ii) above, the Silver City Plaza Property achieving a debt service coverage ratio of 1.50x for two consecutive quarters; |
| ● | with regard to clause (iii) above, (a) the Significant Tenant revoking its notice (if applicable), being open for business, paying full, unabated rent for two (2) consecutive quarters and delivering an acceptable estoppel certificate or (b) the applicable premises being re-tenanted in accordance with the Silver City Plaza Mortgage Loan documents; |
| ● | with regard to clause (iv) above, (a) the Significant Tenant (or its parent) becoming solvent or emerging from bankruptcy, as applicable, and the applicable lease being affirmed in bankruptcy, as applicable, and the Significant Tenant being open and in occupancy of all of its space and paying full unabated rent, in each case for two consecutive quarters, or (b) the subject space being re-tenanted in accordance with the Silver City Plaza Mortgage Loan documents and delivery of an acceptable tenant estoppel certificate; |
| ● | with regard to clause (v) above, the lender’s receipt of evidence that (a) the applicable Significant Tenant has renewed or extended its lease on terms acceptable to the lender and the Silver City Plaza Borrower has delivered an acceptable tenant estoppel certificate from such Significant Tenant, or (b) the subject space is re-tenanted in accordance with the Silver City Plaza Mortgage Loan documents. |
Property Management. The Silver City Plaza Property is self-managed by the Silver City Plaza Borrower.
Partial Release. Not permitted.
Real Estate Substitution. Not permitted.
Subordinate and Mezzanine Indebtedness. Not permitted.
Ground Lease. None.
Terrorism Insurance. The Silver City Plaza Mortgage Loan documents require that the “all risk” insurance policy required to be maintained by the Silver City Plaza Borrower provides coverage for terrorism in an amount equal to the full replacement cost of the Silver City Plaza Property, as well as business interruption insurance covering no less than the 18-month period following the occurrence of a casualty event, together with a 12-month extended period of indemnity.
THE INFORMATION IN THIS STRUCTURAL AND COLLATERAL TERM SHEET IS NOT COMPLETE AND MAY BE AMENDED PRIOR TO THE TIME OF SALE. THIS TERM SHEET IS NOT AN OFFER TO SELL THESE SECURITIES AND IT IS NOT A SOLICITATION OF AN OFFER TO BUY THESE SECURITIES IN ANY JURISDICTION WHERE THE OFFER OR SALE IS NOT PERMITTED.
90
(THIS PAGE INTENTIONALLY LEFT BLANK)
THE INFORMATION IN THIS STRUCTURAL AND COLLATERAL TERM SHEET IS NOT COMPLETE AND MAY BE AMENDED PRIOR TO THE TIME OF SALE. THIS TERM SHEET IS NOT AN OFFER TO SELL THESE SECURITIES AND IT IS NOT A SOLICITATION OF AN OFFER TO BUY THESE SECURITIES IN ANY JURISDICTION WHERE THE OFFER OR SALE IS NOT PERMITTED.
91
Office – R&D | Loan #6 | Cut-off Date Balance: | | $36,720,000 |
1050 Constitution Avenue | Axalta Navy Yard | Cut-off Date LTV: | | 59.4% |
Philadelphia, PA 19112 | | U/W NCF DSCR: | | 2.58x |
| | U/W NOI Debt Yield: | | 9.6% |
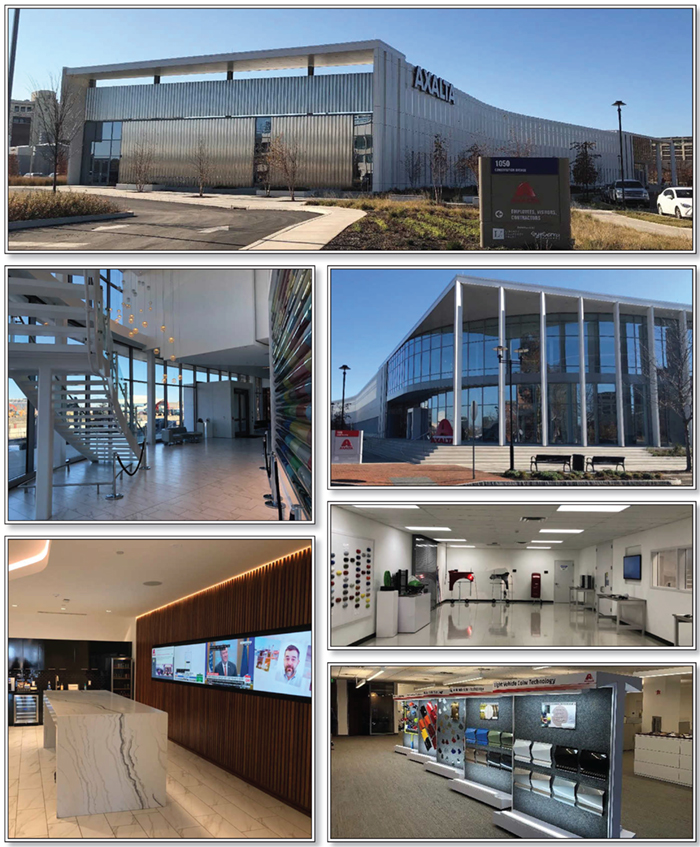
THE INFORMATION IN THIS STRUCTURAL AND COLLATERAL TERM SHEET IS NOT COMPLETE AND MAY BE AMENDED PRIOR TO THE TIME OF SALE. THIS TERM SHEET IS NOT AN OFFER TO SELL THESE SECURITIES AND IT IS NOT A SOLICITATION OF AN OFFER TO BUY THESE SECURITIES IN ANY JURISDICTION WHERE THE OFFER OR SALE IS NOT PERMITTED.
92
Office – R&D | Loan #6 | Cut-off Date Balance: | | $36,720,000 |
1050 Constitution Avenue | Axalta Navy Yard | Cut-off Date LTV: | | 59.4% |
Philadelphia, PA 19112 | | U/W NCF DSCR: | | 2.58x |
| | U/W NOI Debt Yield: | | 9.6% |

THE INFORMATION IN THIS STRUCTURAL AND COLLATERAL TERM SHEET IS NOT COMPLETE AND MAY BE AMENDED PRIOR TO THE TIME OF SALE. THIS TERM SHEET IS NOT AN OFFER TO SELL THESE SECURITIES AND IT IS NOT A SOLICITATION OF AN OFFER TO BUY THESE SECURITIES IN ANY JURISDICTION WHERE THE OFFER OR SALE IS NOT PERMITTED.
93
No. 6 – Axalta Navy Yard |
|
Mortgage Loan Information | | Mortgaged Property Information |
Mortgage Loan Seller: | Ladder Capital Finance LLC | | Single Asset/Portfolio: | Single Asset |
Credit Assessment (KBRA/Fitch/Moody’s): | NR/NR/NR | | Property Type – Subtype: | Office– R&D |
Original Principal Balance: | $36,720,000 | | Location: | Philadelphia, PA |
Cut-off Date Balance: | $36,720,000 | | Size: | 175,000 SF |
% of Initial Pool Balance: | 3.8% | | Cut-off Date Balance Per SF: | $209.83 |
Loan Purpose: | Acquisition | | Maturity Date Balance Per SF: | $209.83 |
Borrower Sponsor(1): | Rasmala Managers Limited | | Year Built/Renovated: | 2017/NAP |
Guarantor(1): | Apex Capital Investments Corporation | | Title Vesting: | Fee |
Mortgage Rate: | 3.6320% | | Property Manager: | Cushman & Wakefield U.S., Inc. |
Note Date: | January 16, 2020 | | Current Occupancy (As of): | 100.0% (2/1/2020) |
Seasoning: | 0 months | | YE 2019 Occupancy: | 100.0% |
| | | YE 2018 Occupancy: | 100.0% |
Maturity Date: | February 6, 2030 | | YE 2017 Occupancy: | 100.0% |
IO Period: | 120 months | | YE 2016 Occupancy: | NAP |
Loan Term (Original): | 120 months | | Appraised Value: | $61,800,000 |
Amortization Term (Original): | NAP | | As-Is Appraised Value Per SF: | $353.14 |
Loan Amortization Type: | Interest-only, Balloon | | As-Is Appraisal Valuation Date: | October 18, 2019 |
Call Protection: | L(23), GRTR 1% or YM(93),O(4) | | | |
Lockbox Type: | Hard/Springing Cash Management | | Underwriting and Financial Information |
Additional Debt: | None | | TTM NOI(3): | NAV |
Additional Debt Type (Balance): | NAP | | YE 2019 NOI(3): | NAV |
| | | YE 2018 NOI(3): | NAV |
| | | YE 2017 NOI(3): | NAV |
| | | U/W Revenues: | $3,628,502 |
| | | U/W Expenses: | $108,855 |
Escrows and Reserves(2) | | U/W NOI: | $3,519,647 |
| Initial | Monthly | Cap | | U/W NCF: | $3,502,147 |
Taxes | $0 | Springing | NAP | | U/W DSCR based on NOI/NCF: | 2.60x / 2.58x |
Insurance | $20,078 | $6,693 | NAP | | U/W Debt Yield based on NOI/NCF: | 9.6% / 9.5% |
Replacement Reserve | $0 | $1,458 | $87,500 | | U/W Debt Yield at Maturity based on NOI/NCF: | 9.6% / 9.5% |
| | | | | Cut-off Date LTV Ratio: | 59.4% |
| | | | | LTV Ratio at Maturity: | 59.4% |
| | | | | | | |
Sources and Uses |
Sources | | | | | Uses | | | |
Original loan amount | $36,720,000 | 57.5 | % | | Purchase Price | $61,200,000 | 95.8 | % |
Borrower Sponsor equity | 27,179,353 | 42.5 | | | Upfront reserves | 20,078 | 0.0 | |
| | | | | Closing costs | 2,679,276 | 4.2 | |
| | | | | | | | |
Total Sources | $63,899,353 | 100.0 | % | | Total Uses | $63,899,353 | 100.0 | % |
| (1) | See “The Borrower and Borrower Sponsor” section below. |
| (2) | See “Escrows” section below. |
| (3) | Historical financials are unavailable as the Axalta Navy Yard Property (as defined below) was acquired in 2020 and is 100% leased to a single tenant on a triple-net lease. |
The Mortgage Loan. The mortgage loan (the “Axalta Navy Yard Mortgage Loan”) is evidenced by a single promissory note secured by a first mortgage encumbering the borrower’s fee interest in a 175,000 square foot office R&D building located in Philadelphia, Pennsylvania (the “Axalta Navy Yard Property”).
The Borrower and Borrower Sponsor. The borrower is L/S 1050 Constitution Avenue, LP, a Pennsylvania limited partnership structured to be bankruptcy-remote with two independent directors in the organizational structure. The Axalta Navy Yard Mortgage Loan is structured as a Shari’ah compliant borrower organizational structure. See “Risk Factors–Risks Relating to the Mortgage Loans–Risks Relating to Shari’ah Compliant Loans“ and “Description of the Mortgage Pool–Mortgage Pool Characteristics-Shari’ah Compliant Loan” in the Preliminary Prospectus. In order to facilitate a Shari’ah compliant borrower organizational structure, the borrower, an unaffiliated third party, master leases the Axalta Navy Yard Property to a master lessee sponsor controlled entity (the “Master Lessee”). The rents under such master lease are equal to the amount that the lender would expect to receive as principal and interest payments
THE INFORMATION IN THIS STRUCTURAL AND COLLATERAL TERM SHEET IS NOT COMPLETE AND MAY BE AMENDED PRIOR TO THE TIME OF SALE. THIS TERM SHEET IS NOT AN OFFER TO SELL THESE SECURITIES AND IT IS NOT A SOLICITATION OF AN OFFER TO BUY THESE SECURITIES IN ANY JURISDICTION WHERE THE OFFER OR SALE IS NOT PERMITTED.
94
Office – R&D | Loan #6 | Cut-off Date Balance: | | $36,720,000 |
1050 Constitution Avenue | Axalta Navy Yard | Cut-off Date LTV: | | 59.4% |
Philadelphia, PA 19112 | | U/W NCF DSCR: | | 2.58x |
| | U/W NOI Debt Yield: | | 9.6% |
under the Axalta Navy Yard Mortgage Loan. Legal counsel to the borrower delivered a non-consolidation opinion in connection with the origination of the Axalta Navy Yard Mortgage Loan.
The non-recourse carve-out guarantor is Apex Capital Investments Corporation (“Apex”). Due to the nature of the organizational structure and the need for the transaction to be Shari’ah compliant, the carveout guaranty is in favor of the borrower (as the master landlord under the Shari’ah compliant master lease) and has been assigned to the lender pursuant to the loan documents and is enforceable by the lender pursuant to its terms. Apex is a U.S. based real estate investment management firm focused on core-plus, value-add and opportunistic investment strategies across asset classes. The principals of the firm have extensive experience investing on behalf of U.S. institutional investors, foreign investment firms and U.S. high net worth investors. Headquartered in Philadelphia, the firm is organized to acquire, finance and manage assets in the net lease, multifamily, office and industrial sectors. Apex’s goal is to provide superior returns to investors while managing risk. Apex’s CEO is John Gaghan, who previously spent 7 years at Lowe Enterprises in Philadelphia.
The Master Lessee Sponsor. The master lessee sponsor is Rasmala Managers Limited.
The Property. The Axalta Navy Yard Property consists of a two-story single tenant 175,000 square foot office R&D property located in Philadelphia, Pennsylvania. Built in 2017, the Axalta Navy Yard Property is located on a 7.4 acre site at the southeast corner of Constitution Avenue and South 11th Street, within the Philadelphia Navy Yard. The Axalta Navy Yard Property also features 349 on-site surface parking spaces resulting in a parking ratio of 2.0 spaces per 1,000 square feet of rentable area. As of February 1, 2020, the Axalta Navy Yard Property was 100.0% leased to Axalta Coating Systems, LLC (“Axalta”) through October 2037 on a triple net basis, with no downsizing or termination options.
Sole Tenant.
Axalta (NR/B1/BB- by Fitch/Moody’s/S&P; 175,000 square feet; 100.0% of net rentable area; 100.0% of underwritten base rent; 10/31/2037 lease expiration) Axalta is a company focused solely on paints and coatings with over 150 years of experience in the coatings industry. The company, which generated approximately $4.7 billion in revenue in 2018, is headquartered in Philadelphia and has 14,000 employees around the world serving more than 100,000 customers. Operating in over 130 countries, Axalta has 50 manufacturing centers, 30 technology laboratories, 47 customer training centers, and 4 global technology centers. Axalta’s R&D center at the Axalta Navy Yard Property is one of their four global innovation centers and is the largest facility the company has. Axalta performance and transportation coatings provide liquid and powder coating systems to a range of markets that include light and commercial vehicles, collision body shops in the refinish aftermarket, and many industrial applications. Coatings are designed to prevent corrosion, increase productivity and enable the materials to last longer. Axalta has four key business areas: transportation coatings for light vehicles, transportation coatings for commercial vehicles, performance coatings for refinish and aftermarket applications and performance coatings for industrial applications. As of January 2020, Axalta had a $6.7 billion market cap.
The following table presents certain information relating to the tenancy at the Axalta Navy Yard Property:
Major Tenant
Tenant Name | Credit Rating (Fitch/
Moody’s/
S&P) | Tenant
NRSF | % of
NRSF | Annual U/W Rent PSF(1) | Annual
U/W Rent(1) | % of Total Annual U/W Rent | Lease
Expiration
Date | Extension Options | Termination Option (Y/N) |
Major Tenant | | | | | | | | |
Axalta(2) | NR/B1/BB- | 175,000 | 100.0% | $21.20 | $3,710,621 | 100.0% | 10/31/2037 | 1, 10-year | N |
| | |
|
|
|
| | |
Vacant Space | 0 | 0.0% |
|
|
|
| | |
| | | | | | | | | |
Collateral Total | 175,000 | 100.0% | | | | | | |
| | | | |
|
|
|
|
|
| (1) | Information obtained from the underwritten rent roll. |
| (2) | Certain ratings are those of the parent company whether or not the parent company guarantees the lease. |
THE INFORMATION IN THIS STRUCTURAL AND COLLATERAL TERM SHEET IS NOT COMPLETE AND MAY BE AMENDED PRIOR TO THE TIME OF SALE. THIS TERM SHEET IS NOT AN OFFER TO SELL THESE SECURITIES AND IT IS NOT A SOLICITATION OF AN OFFER TO BUY THESE SECURITIES IN ANY JURISDICTION WHERE THE OFFER OR SALE IS NOT PERMITTED.
95
Office – R&D | Loan #6 | Cut-off Date Balance: | | $36,720,000 |
1050 Constitution Avenue | Axalta Navy Yard | Cut-off Date LTV: | | 59.4% |
Philadelphia, PA 19112 | | U/W NCF DSCR: | | 2.58x |
| | U/W NOI Debt Yield: | | 9.6% |
The following table presents certain information relating to the lease rollover schedule at the Axalta Navy Yard Property:
Lease Expiration Schedule(1)
Year Ending
December 31, | No. of Leases Expiring | Expiring NRSF | % of Total NRSF | Cumulative Expiring NRSF | Cumulative % of Total NRSF | Annual
U/W
Rent | % of Total Annual U/W Rent | Annual
U/W
Rent
PSF |
MTM | 0 | 0 | 0.0% | 0 | 0.0% | $0 | 0.0% | $0.00 |
2019 | 0 | 0 | 0.0% | 0 | 0.0% | $0 | 0.0% | $0.00 |
2020 | 0 | 0 | 0.0% | 0 | 0.0% | $0 | 0.0% | $0.00 |
2021 | 0 | 0 | 0.0% | 0 | 0.0% | $0 | 0.0% | $0.00 |
2022 | 0 | 0 | 0.0% | 0 | 0.0% | $0 | 0.0% | $0.00 |
2023 | 0 | 0 | 0.0% | 0 | 0.0% | $0 | 0.0% | $0.00 |
2024 | 0 | 0 | 0.0% | 0 | 0.0% | $0 | 0.0% | $0.00 |
2025 | 0 | 0 | 0.0% | 0 | 0.0% | $0 | 0.0% | $0.00 |
2026 | 0 | 0 | 0.0% | 0 | 0.0% | $0 | 0.0% | $0.00 |
2027 | 0 | 0 | 0.0% | 0 | 0.0% | $0 | 0.0% | $0.00 |
2028 | 0 | 0 | 0.0% | 0 | 0.0% | $0 | 0.0% | $0.00 |
2029 | 0 | 0 | 0.0% | 0 | 0.0% | $0 | 0.0% | $0.00 |
Thereafter | 1 | 175,000 | 100.0% | 175,000 | 100.0% | $3,710,621 | 100.0% | $21.20 |
Vacant | 0 | 0 | 0.0% | 175,000 | 100.0% | $0 | 0.0% | $0.00 |
Total/Weighted Average | 1 | 175,000 | 100.0% | | | $3,710,621 | 100.0% | $21.20 |
| (1) | Information obtained from the underwritten rent roll. |
The following table presents historical occupancy percentages at the Axalta Navy Yard Property:
Historical Occupancy
12/31/2017(1) | | 12/31/2018(1) | | 12/31/2019(1) | | 2/1/2020(2) |
100.0% | | 100.0% | | 100.0% | | 100.0% |
| (1) | The Axalta Navy Yard Property has been leased to Axalta since October 2017. |
| (2) | Information obtained from the underwritten rent roll. |
THE INFORMATION IN THIS STRUCTURAL AND COLLATERAL TERM SHEET IS NOT COMPLETE AND MAY BE AMENDED PRIOR TO THE TIME OF SALE. THIS TERM SHEET IS NOT AN OFFER TO SELL THESE SECURITIES AND IT IS NOT A SOLICITATION OF AN OFFER TO BUY THESE SECURITIES IN ANY JURISDICTION WHERE THE OFFER OR SALE IS NOT PERMITTED.
96
Office – R&D | Loan #6 | Cut-off Date Balance: | | $36,720,000 |
1050 Constitution Avenue | Axalta Navy Yard | Cut-off Date LTV: | | 59.4% |
Philadelphia, PA 19112 | | U/W NCF DSCR: | | 2.58x |
| | U/W NOI Debt Yield: | | 9.6% |
Operating History and Underwritten Net Cash Flow. The following table presents certain information relating to the operating performance and underwritten net cash flow at the Axalta Navy Yard Property:
Cash Flow Analysis(1)
| U/W | %(2) | U/W $ per SF |
Base Rent | $3,710,621 | | 97.2% | | $21.20 | |
Contractual Rent Steps | 0 | | 0.0 | | 0.00 | |
Grossed Up Vacant Space | 0 | | 0.0 | | 0.00 | |
Gross Potential Rent | $3,710,621 | | 97.2% | | $21.20 | |
Other Income | 0 | | 0.0 | | 0.00 | |
Total Recoveries | 108,855 | | 2.9 | | 0.62 | |
Net Rental Income | $3,819,476 | | 100.0% | | $21.83 | |
(Vacancy & Credit Loss) | (190,974)(3) | | (5.1) | | (1.09) | |
Effective Gross Income | $3,628,502 | | 95.0% | | $20.73 | |
| | | | | | |
Real Estate Taxes | 0 | | 0.0 | | 0.00 | |
Insurance | 0 | | 0.0 | | 0.00 | |
Management Fee | 108,855 | | 3.0 | | 0.62 | |
Other Operating Expenses | 0 | | 0.0 | | 0.00 | |
Total Operating Expenses | $108,855 | | 3.0% | | $0.62 | |
| | | | | | |
Net Operating Income | $3,519,647 | | 97.0% | | $20.11 | |
Replacement Reserves | 17,500 | | 0.5 | | 0.10 | |
TI/LC | 0 | | 0.0 | | 0.00 | |
Net Cash Flow | $3,502,147 | | 96.5% | | $20.01 | |
| | | | | | |
NOI DSCR | 2.60x | | | | | |
NCF DSCR | 2.58x | | | | | |
NOI Debt Yield | 9.6% | | | | | |
NCF Debt Yield | 9.5% | | | | | |
| (1) | Historical financial information is not available as the Axalta Navy Yard Property was recently acquired. |
| (2) | Represents (i) percent of Net Rental Income for all revenue fields, (ii) percent of Gross Potential Rent for Vacancy & Credit Loss and (iii) percent of Effective Gross Income for all other fields. |
| (3) | The underwritten economic vacancy is 5.0%. The Axalta Navy Yard Property is 100.0% physically occupied as of February 1, 2020. |
Appraisal. The appraiser concluded to an “as-is” appraised value of $61,800,000 as of October 18, 2019. The appraiser also concluded to an “as-dark” appraised value of $41,300,000 as of October 18, 2019.
Environmental Matters. According to the Phase I environmental site assessment dated October 24, 2019, there were no recognized environmental conditions or historical recognized environmental conditions, but there is a controlled recognized environmental condition due to the Axalta Navy Yard Property being situated in the former Philadelphia Navy Yard. The US Government is liable for all contamination arising from the historic navy yard operations. The Axalta Navy Yard Property is also located within a Special Industrial Area (“SIA”) and is subject to SIA agreement between the Pennsylvania Dept. of Environmental Protection (“PADEP”) and the Pennsylvania Authority for Industrial Development (“PAID”). Pursuant to the SIA Agreement and Pennsylvania law, the Axalta Navy Yard Property (including current and successor owners) has liability protections for the identified historic contamination at the site, including claims of citizens or contribution claims by responsible parties. Based upon a baseline environmental investigation in October, 2015, the Axalta Navy Yard Property has certain hazardous substances below the regulated levels for non-used aquifiers. As a result, it was concluded that no remediation was warranted with respect to the use being made of the Axalta Navy Yard Property.
Market Overview and Competition. The Axalta Navy Yard Property is located within the Philadelphia Navy Yard submarket, a 1,200-acre urban waterfront development located along the Delaware River. The Philadelphia Navy Yard is located 6.2 miles from Center City Philadelphia, 6.6 miles from the Philadelphia International Airport and adjacent to I-95 and I-76. According to the appraisal, the Philadelphia Navy Yard serves as home to nearly 15,000 employees and 170 companies, representing a diverse mix of industries such as life sciences, financial services, engineering, manufacturing and research & development. The Philadelphia Navy Yard is home to Urban Outfitters’ global headquarters, GSK’s North American headquarters, Jefferson Health, several life science and technology startups, manufacturers, R&D facilities, U.S. Navy engineering centers and a graduate engineering, business and research campus for Penn State University. The area maintains a historical connection with the U.S. Navy and other governmental and educational bodies
THE INFORMATION IN THIS STRUCTURAL AND COLLATERAL TERM SHEET IS NOT COMPLETE AND MAY BE AMENDED PRIOR TO THE TIME OF SALE. THIS TERM SHEET IS NOT AN OFFER TO SELL THESE SECURITIES AND IT IS NOT A SOLICITATION OF AN OFFER TO BUY THESE SECURITIES IN ANY JURISDICTION WHERE THE OFFER OR SALE IS NOT PERMITTED.
97
Office – R&D | Loan #6 | Cut-off Date Balance: | | $36,720,000 |
1050 Constitution Avenue | Axalta Navy Yard | Cut-off Date LTV: | | 59.4% |
Philadelphia, PA 19112 | | U/W NCF DSCR: | | 2.58x |
| | U/W NOI Debt Yield: | | 9.6% |
and institutions. In addition, the Axalta Navy Yard Property is located in the Keystone Opportunity Zone which offers employers tax benefits, and currently extends to the end of 2025.
According to the appraisal, the 2018 estimated average household income within Philadelphia is $96,140. The office vacancy within the Philadelphia Navy Yard submarket is 5.2% as of the third quarter of 2019 and the market rent is $25.00 per square foot, which is approximately 17.9% above the in place rent of Axalta Navy Yard Property of $21.20 per square foot.
The following table presents certain information relating to the appraiser’s market rent conclusions for the Axalta Navy Yard Property:
Market Rent Summary(1)
| |
Market Rent (PSF) | $25.00 |
Lease Term (Years) | 15 |
Lease Type (Reimbursements) | Net |
Rent Increase Projection | 2.0% per annum |
| (1) | Information obtained from the appraisal. |
The following table presents certain information relating to comparable properties to Axalta Navy Yard Property:
Comparable Leases(1)
Property Name/Location | Year Built/ Renovated | Total GLA (SF) | Distance from Subject | Occupancy | Lease Year | Lease Term | Tenant Size (SF) | Annual Base Rent PSF | Lease Type |
Office/Lab Building 300 Rouse Boulevard Philadelphia, PA | 2020/NAP | 135,814 | 0.3 miles | 100.0% | 2020 | 20.0 Yrs | 135,814 | $28.25 | Net |
Office/R&D Building 400 Rouse Boulevard Philadelphia, PA | 2020/NAP | 95,400 | 0.3 miles | 100.0% | 2020 | 15.0 Yrs | 95,400 | $25.85 | Net |
Lakeside I 801 Lakeview Drive Blue Bell, PA | 1974/NAP | 211,116 | 25.2 miles | NAV | 2018 | 7.0 Yrs | 156,331 | $19.25 | Net |
Office/R&D Building 4701 League Island Boulevard Philadelphia, PA | 2016/NAP | 145,000 | 0.4 miles | 100.0% | 2016 | 12.0 Yrs | 75,777 | $16.34 | Net |
| (1) | Information obtained from appraisal. |
Escrows.
Taxes – At origination, no escrows for taxes were collected. Ongoing collections for taxes will be waived so long as among, other things, the Axalta lease is in full force and effect, Axalta is responsible thereunder for the payment of all taxes directly to the governing authority and timely pays such amounts.
Insurance – At origination, the borrower escrowed into the insurance account $20,078 for insurance premiums. The borrower is required to make monthly payments of one-twelfth of the insurance premiums during the next twelve months, currently equal to $6,693.
Replacement Reserve – The borrower is required to make monthly payments of $1,458 into the replacement reserve account, capped at $87,500.
Lockbox and Cash Management. The Axalta Navy Yard Mortgage Loan requires a hard lockbox with springing cash management. The borrower was required at origination of the Axalta Navy Yard Mortgage Loan to deliver written instructions to the tenant directing it to deposit all rents payable under its lease directly into a lender-controlled lockbox account. The Axalta Navy Yard Mortgage Loan documents require that all rents received by the borrower or the property manager be deposited into the lockbox account within one business day of receipt. Prior to the occurrence of a Cash Management Period (as defined below), all funds on deposit in the lockbox account will be disbursed to the Axalta Navy Yard Mortgage Loan borrower. During a Cash Management Period, all funds in the lockbox account are required to be swept each business day into the cash management account, and all excess cash flow is required to be swept to an excess cash flow subaccount held by the lender.
THE INFORMATION IN THIS STRUCTURAL AND COLLATERAL TERM SHEET IS NOT COMPLETE AND MAY BE AMENDED PRIOR TO THE TIME OF SALE. THIS TERM SHEET IS NOT AN OFFER TO SELL THESE SECURITIES AND IT IS NOT A SOLICITATION OF AN OFFER TO BUY THESE SECURITIES IN ANY JURISDICTION WHERE THE OFFER OR SALE IS NOT PERMITTED.
98
Office – R&D | Loan #6 | Cut-off Date Balance: | | $36,720,000 |
1050 Constitution Avenue | Axalta Navy Yard | Cut-off Date LTV: | | 59.4% |
Philadelphia, PA 19112 | | U/W NCF DSCR: | | 2.58x |
| | U/W NOI Debt Yield: | | 9.6% |
A “Cash Management Period” will commence upon the earlier of the following:
(i) an event of default occurs under the Axalta Navy Yard Mortgage Loan;
(ii) the debt service coverage ratio falls below 1.15x; and/or
(iii) a Significant Tenant (defined below) (a) vacating, surrendering or ceasing to conduct, or giving notice of its intent to cease to conduct, its normal business operations at substantially all of its leased premises (including by subleasing substantially all of its leased premises) or otherwise going dark or (b) becoming insolvent or a debtor in any bankruptcy action or its parent company becoming insolvent or bankrupt.
A Cash Management Period will end upon the occurrence of the following:
(i) with regard to clause (i), such event of default having been cured and such cure having been accepted by the lender in its sole discretion;
(ii) with regard to clause (ii), the Axalta Navy Yard Property having achieved a debt service coverage ratio of 1.35x for 2 consecutive calendar quarters;
(iii) with regard to clause (iii)(a), (A) the applicable Significant Tenant having (1) rescinded any notice and reopened for business and conducted normal business operations at substantially all of its demised premises and (2) paid full, unabated rent under its lease, for two consecutive quarters, and the borrower delivering to the lender an acceptable tenant estoppel certificate from the applicable Significant Tenant certifying, among other things, the foregoing and reaffirming the lease as being in full force and effect, to the lender’s satisfaction in each case, or (B) a Re-tenanting Event (defined below) having occurred; and
(iv) with regard to clause (iii)(b) the Significant Tenant or such Significant Tenant’s parent company, as the case may be, becoming solvent to the lender’s satisfaction for two consecutive quarters or no longer being a debtor in any bankruptcy action and having affirmed its lease pursuant to a final non-appealable order of a court of competent jurisdiction.
A “Significant Tenant” means (i) Axalta and (ii) any tenant that replaces Axalta at the Axalta Navy Yard Property.
A “Re-tenanting Event” means the borrower or master lessee has entered into a new lease or leases with a replacement tenant or tenants acceptable to the lender.
Property Management. The Axalta Navy Yard Property is managed by Cushman & Wakefield U.S., Inc.
Partial Release. Not permitted.
Real Estate Substitution. Not permitted.
Subordinate and Mezzanine Indebtedness. None
Ground Lease. None.
Terrorism Insurance. The Axalta Navy Yard Mortgage Loan documents require that the “all risk” insurance policy required to be maintained by the borrower provides (or otherwise the Axalta Navy Yard Loan borrower will maintain) coverage for terrorism in an amount equal to the full replacement cost of the Axalta Navy Yard Property and provides business interruption insurance covering no less than the 18-month period following the occurrence of a casualty event, together with a 12-month extended period of indemnity. To the extent that Axalta maintains the insurance policies required under its lease and the related conditions set forth in the Axalta Navy Yard Mortgage Loan documents are satisfied, the Axalta Navy Yard Mortgage Loan borrower will not be required to maintain such coverages.
THE INFORMATION IN THIS STRUCTURAL AND COLLATERAL TERM SHEET IS NOT COMPLETE AND MAY BE AMENDED PRIOR TO THE TIME OF SALE. THIS TERM SHEET IS NOT AN OFFER TO SELL THESE SECURITIES AND IT IS NOT A SOLICITATION OF AN OFFER TO BUY THESE SECURITIES IN ANY JURISDICTION WHERE THE OFFER OR SALE IS NOT PERMITTED.
99
Property Type - Various | Loan #7 | Cut-off Date Balance: | | $33,875,000 |
Property Addresses - Various | ExchangeRight Net Leased Portfolio #31 | Cut-off Date LTV: | | 62.1% |
| | U/W NCF DSCR: | | 2.56x |
| | U/W NOI Debt Yield: | | 9.4% |
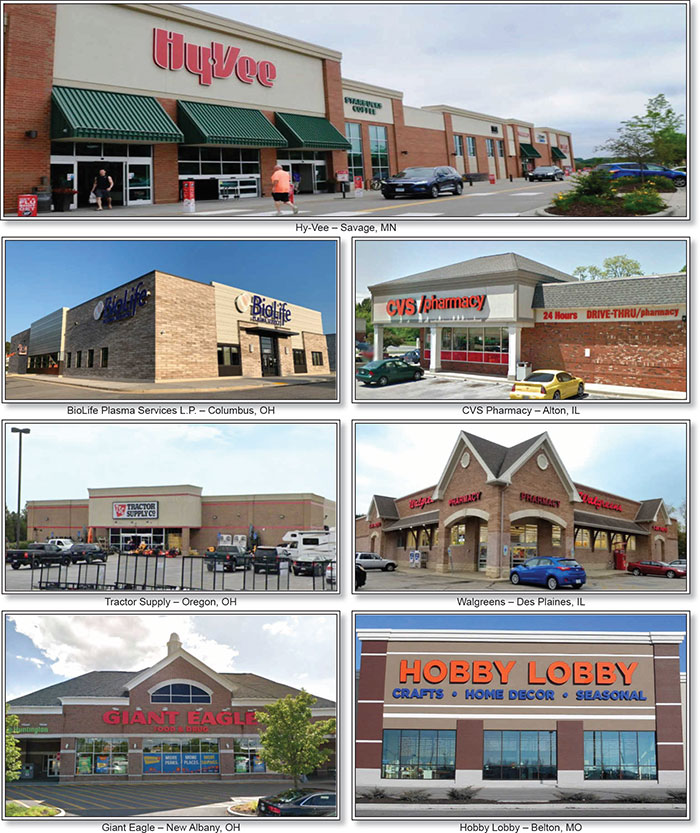
THE INFORMATION IN THIS STRUCTURAL AND COLLATERAL TERM SHEET IS NOT COMPLETE AND MAY BE AMENDED PRIOR TO THE TIME OF SALE. THIS TERM SHEET IS NOT AN OFFER TO SELL THESE SECURITIES AND IT IS NOT A SOLICITATION OF AN OFFER TO BUY THESE SECURITIES IN ANY JURISDICTION WHERE THE OFFER OR SALE IS NOT PERMITTED.
100
Property Type - Various | Loan #7 | Cut-off Date Balance: | | $33,875,000 |
Property Addresses - Various | ExchangeRight Net Leased Portfolio #31 | Cut-off Date LTV: | | 62.1% |
| | U/W NCF DSCR: | | 2.56x |
| | U/W NOI Debt Yield: | | 9.4% |
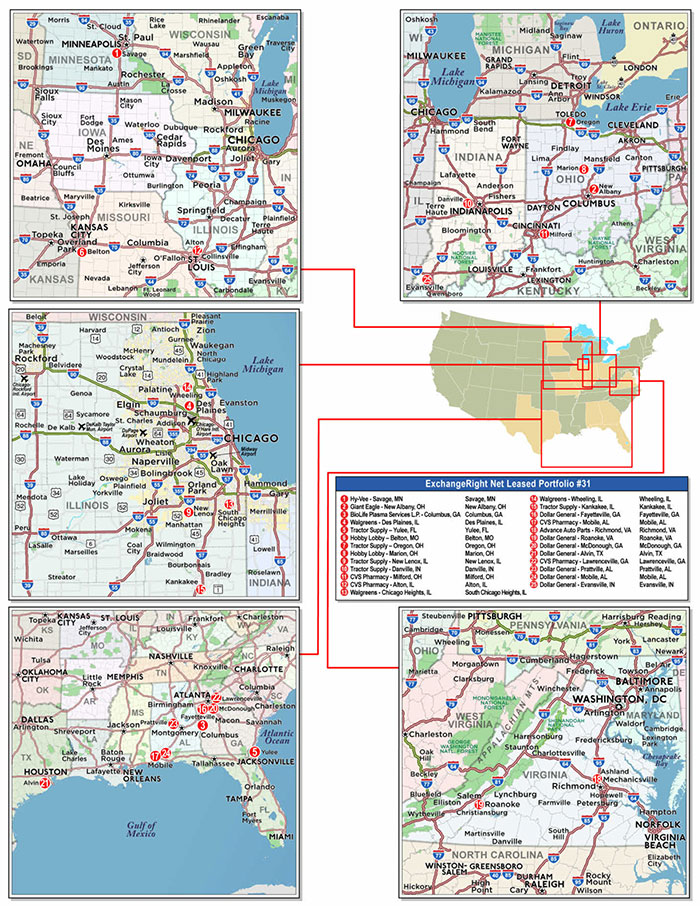
THE INFORMATION IN THIS STRUCTURAL AND COLLATERAL TERM SHEET IS NOT COMPLETE AND MAY BE AMENDED PRIOR TO THE TIME OF SALE. THIS TERM SHEET IS NOT AN OFFER TO SELL THESE SECURITIES AND IT IS NOT A SOLICITATION OF AN OFFER TO BUY THESE SECURITIES IN ANY JURISDICTION WHERE THE OFFER OR SALE IS NOT PERMITTED.
101
No. 7 – ExchangeRight Net Leased Portfolio #31 |
|
Mortgage Loan Information | | Mortgaged Property Information |
Mortgage Loan Seller: | Barclays Capital Real Estate Inc. | | Single Asset/Portfolio: | Portfolio |
Credit Assessment (KBRA/Fitch/Moody’s): | NR/NR/NR | | Property Type – Subtype(3): | Various |
Original Principal Balance(1): | $33,875,000 | | Location(3): | Various |
Cut-off Date Balance(1): | $33,875,000 | | Size: | 547,761 SF |
% of Initial Pool Balance: | 3.5% | | Cut-off Date Balance Per SF(1): | $134.87 |
Loan Purpose: | Acquisition | | Maturity Date Balance Per SF(1): | $134.87 |
Borrower Sponsors: | ExchangeRight Real Estate, LLC, David Fisher, Joshua Ungerecht, and Warren Thomas | | Year Built/Renovated(4): | Various/NAP |
Guarantors: | David Fisher; Joshua Ungerecht; Warren Thomas | | Title Vesting: | Fee |
Mortgage Rate: | 3.4940% | | Property Manager: | Self-managed |
Note Date: | December 9, 2019 | | Current Occupancy (As of): | 100.0% (2/1/2020) |
Seasoning: | 2 months | | YE 2019 Occupancy(4): | NAV |
Maturity Date: | December 6, 2029 | | YE 2018 Occupancy(4): | NAV |
IO Period: | 120 months | | YE 2017 Occupancy(4): | NAV |
Loan Term (Original): | 120 months | | YE 2016 Occupancy(4): | NAV |
Amortization Term (Original): | NAP | | As-Is Appraised Value: | $119,040,000 |
Loan Amortization Type: | Interest-only, Balloon | | As-Is Appraised Value Per SF: | $217.32 |
Call Protection: | L(26),D(90),O(4) | | As-Is Appraisal Valuation Date: | Various |
Lockbox Type: | Hard/Springing Cash Management | | Underwriting and Financial Information |
Additional Debt(1): | Yes | | TTM NOI(4): | NAV |
Additional Debt Type (Balance)(1): | Pari Passu ($40,000,000) | | YE 2018 NOI(4): | NAV |
| | | YE 2017 NOI(4): | NAV |
| | | YE 2016 NOI(4): | NAV |
| | | U/W Revenues: | $7,588,539 |
| | | U/W Expenses: | $627,046 |
| | U/W NOI: | $6,961,493 |
Escrows and Reserves(2) | | U/W NCF: | $6,711,432 |
| Initial | Monthly | Cap | | U/W DSCR based on NOI/NCF(1): | 2.65x / 2.56x |
Taxes | $499,357 | Springing | NAP | | U/W Debt Yield based on NOI/NCF(1): | 9.4% / 9.1% |
Insurance | $0 | Springing | NAP | | U/W Debt Yield at Maturity based on NOI/NCF(1): | 9.4% / 9.1% |
Replacement Reserve | $406,650 | $2,965 | NAP | | Cut-off Date LTV Ratio(1): | 62.1% |
TI/LC Reserve | $500,000 | Springing | NAP | | LTV Ratio at Maturity(1): | 62.1% |
Immediate Repairs | $69,781 | $0 | NAP | | | |
SNDA Holdback | $750,000 | $0 | NAP | | | |
| | | | | | | |
Sources and Uses |
Sources | | | | | Uses | | | |
Original whole loan amount | $73,875,000 | | 61.3% | | Purchase price | $117,413,864 | | 97.4% |
Borrower Sponsors’ new equity contribution | 46,629,534 | | 38.7 | | Upfront reserves | 2,225,788 | | 1.8 |
| | | | | Closing costs(5) | 864,882 | | 0.7 |
Total Sources | $120,504,534 | | 100.0% | | Total Uses | $120,504,534 | | 100.0% |
(1) | The ExchangeRight Net Leased Portfolio #31 Mortgage Loan (as defined below) is part of the ExchangeRight Net Leased Portfolio #31 Whole Loan (as defined below), which comprises two pari passu notes with an aggregate original balance of $73,875,000. All statistical information related to the Cut-off Date Balance per SF, Maturity Date Balance per SF, U/W Debt Yield based on NOI/NCF, U/W Debt Yield at Maturity based on NOI/NCF, U/W DSCR based on NOI/NCF, Cut-off Date LTV Ratio and LTV Ratio at Maturity are based on the ExchangeRight Net Leased Portfolio #31 Whole Loan. |
(2) | See “Escrows” section. |
(3) | See “The Properties” section. |
(4) | The ExchangeRight Net Leased Portfolio #31 Properties were acquired between May 2019 and November 2019. As such, no historical operating history or occupancy is available. |
(5) | Closing costs include a $752,622 closing cost credit relating to the interest rate buy-up by the borrower. |
The Mortgage Loan. The mortgage loan (the “ExchangeRight Net Leased Portfolio #31 Mortgage Loan”) is part of a whole loan (the “ExchangeRight Net Leased Portfolio #31 Whole Loan”) in the original principal balance of $73,875,000. The ExchangeRight Net Leased Portfolio #31 Whole Loan is secured by a first priority fee mortgage encumbering 24 single-tenant retail properties and one medical office property in Ohio, Illinois, Minnesota, Georgia, Alabama, Florida, Indiana, Missouri, Virginia and Texas (the “ExchangeRight Net Leased Portfolio #31 Properties”). Note A-1 had an original principal balance of $40,000,000, has a Cut-off Date Balance of $40,000,000
THE INFORMATION IN THIS STRUCTURAL AND COLLATERAL TERM SHEET IS NOT COMPLETE AND MAY BE AMENDED PRIOR TO THE TIME OF SALE. THIS TERM SHEET IS NOT AN OFFER TO SELL THESE SECURITIES AND IT IS NOT A SOLICITATION OF AN OFFER TO BUY THESE SECURITIES IN ANY JURISDICTION WHERE THE OFFER OR SALE IS NOT PERMITTED.
102
Property Type - Various | Loan #7 | Cut-off Date Balance: | | $33,875,000 |
Property Addresses - Various | ExchangeRight Net Leased Portfolio #31 | Cut-off Date LTV: | | 62.1% |
| | U/W NCF DSCR: | | 2.56x |
| | U/W NOI Debt Yield: | | 9.4% |
and is expected to be contributed to the BBCMS 2020-C6 securitization trust. Note A-2 had an original principal balance of $33,875,000, has a Cut-off Date Balance of $33,875,000 and is expected to be contributed to the WFCM 2020-C55 securitization trust. See “Description of the Mortgage Pool—The Whole Loans—The Non-Serviced Pari Passu Whole Loans“ and “Pooling and Servicing Agreement —Servicing of the Non-Serviced Mortgage Loans” in the Preliminary Prospectus.
Note Summary
Notes | Original Principal Balance | Cut-off Date
Balance | Note Holder | Controlling Interest |
A-1 | $40,000,000 | $40,000,000 | BBCMS 2020-C6(1) | Yes |
A-2 | $33,875,000 | $33,875,000 | WFCM 2020-C55 | No |
Total | $73,875,000 | $73,875,000 | | |
(1) | The BBCMS 2020-C6 securitization transaction is expected to close on February 19, 2020. |
The Borrower and Borrower Sponsor. The borrower is ExchangeRight Net Leased Portfolio 31 DST, a Delaware statutory trust with one trustee that is an independent director. The borrower has master leased the ExchangeRight Net Leased Portfolio #31 Properties to a master lessee affiliated with the guarantors. The master lessee is structured as a special purpose entity with one independent director. The master lessee’s interest in all tenant rents are assigned to the borrower, which in turn assigned its interest to the lender. The lender has the ability to cause the borrower to terminate the master lease. The borrower sponsors have a 100% ownership interest in the master lessee. The master lease is subordinate to the ExchangeRight Net Leased Portfolio #31 Whole Loan. Legal counsel to the borrower delivered a non-consolidation opinion in connection with the origination of the ExchangeRight Net Leased Portfolio #31 Whole Loan.
The borrower sponsors are ExchangeRight Real Estate, LLC (“ExchangeRight”), David Fisher, Joshua Ungerecht and Warren Thomas and the nonrecourse carve-out guarantors are David Fisher, Joshua Ungerecht and Warren Thomas. David Fisher, Joshua Ungerecht and Warren Thomas are the managing members of ExchangeRight. ExchangeRight has more than $2.3 billion in assets under management that includes over 650 properties located across 38 states totaling over 14 million square feet as of June 1, 2019. ExchangeRight’s focus is in providing long-term stable income and asset preservation through long-term net-leased portfolios backed by investment grade corporations.
Warren Thomas, one of the nonrecourse carve-out guarantors, was involved in a foreclosure that settled in 2013 with respect to a property that is unrelated to the ExchangeRight Net Leased Portfolio #31 Properties. See “Description of the Mortgage Pool—Loan Purpose; Default History, Bankruptcy Issues and Other Proceedings” in the Prospectus.
The Property. The ExchangeRight Net Leased Portfolio #31 Properties are comprised of 24 single tenant retail properties and one single tenant medical office property (BioLife Plasma Services L.P. – Columbus, GA) totaling 547,761 square feet located across 10 states. The geographical concentrations by Cut-off Date Balance include Ohio (four properties, 23.0% of the allocated Cut-off Date Balance), Illinois (six properties, 20.5% of the allocated Cut-off Date Balance), Minnesota (one property, 19.1% of the allocated Cut-off Date Balance), Georgia (four properties, 12.8% of the allocated Cut-off Date Balance), Alabama (three properties, 5.0% of the allocated Cut-off Date Balance), Florida (one property, 5.0% of the allocated Cut-off Date Balance), Indiana (two properties, 4.9% of the allocated Cut-off Date Balance), Missouri (one property, 4.4% of the allocated Cut-off Date Balance), Virginia (two properties, 3.7% of the allocated Cut-off Date Balance) and Texas (one property, 1.7% of the allocated Cut-off Date Balance). Built between 1999 and 2019, the ExchangeRight Net Leased Portfolio #31 Properties range in size from 7,000 square feet to 101,278 square feet. As of February 1, 2020, the ExchangeRight Net Leased Portfolio #31 Properties were 100.0% occupied. Sixteen tenants, or their parent entities, representing 31.1% of the aggregate net rentable area and 42.7% of U/W base rent at the ExchangeRight Net Leased Portfolio #31 Properties, are investment grade. As of December 2019, the tenants at the ExchangeRight Net Leased Portfolio #31 Properties have a weighted average remaining lease term of approximately 13.8 years and a weighted average remaining fully extended lease term of approximately 37.8 years.
Largest Tenants.
Hobby Lobby (110,020 square feet; 20.1% of the NRA; 8.2% of underwritten rent): Hobby Lobby is a privately-owned arts and crafts retailer with over 37,500 employees in more than 850 stores across 46 states. Hobby Lobby is primarily an arts-and-crafts store but also includes hobbies, picture framing, jewelry making, fabrics, floral and wedding supplies, cards and party ware, baskets, wearable art, home accents and holiday merchandise. Hobby Lobby’s headquarters is located in Oklahoma City, Oklahoma. Hobby Lobby’s affiliated company, Mardel Christian and Education Supply, offers books, bibles, gifts, church and education supplies, and homeschooling curriculum. Hobby Lobby also maintains offices in Hong Kong, Shenzhen, and Yiwu, China. Two ExchangeRight Net Leased Portfolio #31 Properties are single tenant Hobby Lobby properties.
Hy-Vee (101,278 square feet; 18.5% of the NRA; 18.0% of underwritten rent): Founded in the 1930s, Hy-Vee is one of the top 25 rated supermarket chains in the United States with sales of $10 billion annually. Hy-Vee operates 246 stores with over 84,000 employees located in Iowa, Illinois, Missouri, Kansas, Nebraska, South Dakota, Minnesota and Wisconsin. Hy-Vee’s corporate office is
THE INFORMATION IN THIS STRUCTURAL AND COLLATERAL TERM SHEET IS NOT COMPLETE AND MAY BE AMENDED PRIOR TO THE TIME OF SALE. THIS TERM SHEET IS NOT AN OFFER TO SELL THESE SECURITIES AND IT IS NOT A SOLICITATION OF AN OFFER TO BUY THESE SECURITIES IN ANY JURISDICTION WHERE THE OFFER OR SALE IS NOT PERMITTED.
103
Property Type - Various | Loan #7 | Cut-off Date Balance: | | $33,875,000 |
Property Addresses - Various | ExchangeRight Net Leased Portfolio #31 | Cut-off Date LTV: | | 62.1% |
| | U/W NCF DSCR: | | 2.56x |
| | U/W NOI Debt Yield: | | 9.4% |
located in Des Moines, Iowa. The Hy-Vee – Savage, MN property is the largest of the ExchangeRight Net Leased Portfolio #31 Properties by both net rentable area and underwritten net cash flow.
Tractor Supply (94,886 square feet; 17.3% of the NRA; 17.2% of underwritten rent): Tractor Supply (NASDAQ: TSCO) is the largest operator of rural lifestyle retail stores in America. Founded in 1938, Tractor Supply owns and operates over 1,800 stores in 49 states supplying basic maintenance products to home, land, pet and animal owners. Tractor Supply is based in Brentwood, Tennessee and is a publicly traded company. Five ExchangeRight Net Leased Portfolio #31 Properties are single tenant Tractor Supply properties.
The following table presents certain information relating to the ExchangeRight Net Leased Portfolio #31 Properties:
Tenant Name -
Location | Allocated
Whole Loan
Cut-off
Date
Balance
| % of
Portfolio
Cut-off
Date
Balance
| UW NCF(1) | % of UW
NCF | Year Built/
Renovated | Tenant
NRSF | % of
Portfolio
NRSF | Lease
Expiration | Appraised Value |
Hy-Vee – Savage, MN | $14,100,000 | 19.1% | $1,181,338 | 17.6% | 2016/NAP | 101,278 | 18.5% | 11/30/2039 | $22,400,000 |
Giant Eagle – New Albany, OH | $9,285,000 | 12.6% | $914,428 | 13.6% | 2006/NAP | 71,050 | 13.0% | 8/31/2032 | $16,480,000 |
BioLife Plasma Services L.P. – Columbus, GA | $5,520,000 | 7.5% | $485,569 | 7.2% | 2019/NAP | 14,181 | 2.6% | 9/30/2034 | $7,950,000 |
Walgreens – Des Plaines, IL | $4,390,000 | 5.9% | $368,322 | 5.5% | 2000/NAP | 15,120 | 2.8% | 9/30/2029 | $6,300,000 |
Tractor Supply – Yulee, FL | $3,700,000 | 5.0% | $302,209 | 4.5% | 2019/NAP | 18,800 | 3.4% | 9/15/2034 | $5,560,000 |
Hobby Lobby – Belton, MO | $3,225,000 | 4.4% | $271,690 | 4.0% | 2016/NAP | 55,000 | 10.0% | 2/28/2031 | $5,300,000 |
Tractor Supply – Oregon, OH | $2,750,000 | 3.7% | $232,376 | 3.5% | 2004/NAP | 18,795 | 3.4% | 12/31/2029 | $4,180,000 |
Hobby Lobby – Marion, OH | $2,700,000 | 3.7% | $222,393 | 3.3% | 2007/NAP | 55,020 | 10.0% | 3/31/2031 | $4,200,000 |
Tractor Supply – New Lenox, IL | $2,550,000 | 3.5% | $216,809 | 3.2% | 2019/NAP | 19,097 | 3.5% | 10/31/2034 | $4,050,000 |
Tractor Supply – Danville, IN | $2,500,000 | 3.4% | $207,259 | 3.1% | 2019/NAP | 19,097 | 3.5% | 10/31/2034 | $3,900,000 |
CVS Pharmacy – Milford, OH | $2,250,000 | 3.0% | $191,308 | 2.9% | 1999/NAP | 10,118 | 1.8% | 1/30/2030 | $3,450,000 |
CVS Pharmacy – Alton, IL | $2,200,000 | 3.0% | $187,609 | 2.8% | 2000/NAP | 10,157 | 1.9% | 1/30/2030 | $3,390,000 |
Walgreens – Chicago Heights, IL | $2,085,000 | 2.8% | $234,105 | 3.5% | 2000/NAP | 14,725 | 2.7% | 10/31/2030 | $4,100,000 |
Walgreens – Wheeling, IL | $2,055,000 | 2.8% | $358,477 | 5.3% | 2000/NAP | 14,250 | 2.6% | 6/30/2031 | $5,600,000 |
Tractor Supply – Kankakee, IL | $1,850,000 | 2.5% | $157,842 | 2.4% | 2019/NAP | 19,097 | 3.5% | 10/31/2034 | $3,000,000 |
Dollar General – Fayetteville, GA | $1,400,000 | 1.9% | $117,448 | 1.7% | 2018/NAP | 9,002 | 1.6% | 11/30/2033 | $1,920,000 |
CVS Pharmacy – Mobile, AL | $1,375,000 | 1.9% | $115,123 | 1.7% | 2000/NAP | 10,125 | 1.8% | 1/30/2030 | $2,100,000 |
Advance Auto Parts – Richmond, VA | $1,350,000 | 1.8% | $117,430 | 1.7% | 2005/NAP | 7,000 | 1.3% | 2/28/2030 | $2,180,000 |
Dollar General – Roanoke, VA | $1,350,000 | 1.8% | $114,977 | 1.7% | 2012/NAP | 10,542 | 1.9% | 5/31/2032 | $1,850,000 |
Dollar General – McDonough, GA | $1,325,000 | 1.8% | $111,276 | 1.7% | 2019/NAP | 9,026 | 1.6% | 10/31/2034 | $1,870,000 |
Dollar General – Alvin, TX | $1,225,000 | 1.7% | $100,904 | 1.5% | 2011/NAP | 9,026 | 1.6% | 2/29/2032 | $1,670,000 |
CVS Pharmacy – Lawrenceville, GA | $1,185,000 | 1.6% | $155,942 | 2.3% | 1999/NAP | 10,127 | 1.8% | 1/31/2030 | $2,830,000 |
Dollar General – Prattville, AL | $1,180,000 | 1.6% | $99,765 | 1.5% | 2019/NAP | 9,026 | 1.6% | 11/30/2034 | $1,575,000 |
Dollar General – Mobile, AL | $1,175,000 | 1.6% | $99,520 | 1.5% | 2019/NAP | 9,002 | 1.6% | 11/30/2034 | $1,625,000 |
Dollar General – Evansville, IN | $1,150,000 | 1.6% | $97,314 | 1.4% | 2019/NAP | 9,100 | 1.7% | 7/31/2034 | $1,560,000 |
Total/Weighted Average | $73,875,000 | 100.0% | $6,711,432 | 100.0% | | 547,761 | 100.0% | | $119,040,000 |
| (1) | Total UW NCF includes a $50,000 credit for the $500,000 upfront TI/LC holdback. |
THE INFORMATION IN THIS STRUCTURAL AND COLLATERAL TERM SHEET IS NOT COMPLETE AND MAY BE AMENDED PRIOR TO THE TIME OF SALE. THIS TERM SHEET IS NOT AN OFFER TO SELL THESE SECURITIES AND IT IS NOT A SOLICITATION OF AN OFFER TO BUY THESE SECURITIES IN ANY JURISDICTION WHERE THE OFFER OR SALE IS NOT PERMITTED.
104
Property Type - Various | Loan #7 | Cut-off Date Balance: | | $33,875,000 |
Property Addresses - Various | ExchangeRight Net Leased Portfolio #31 | Cut-off Date LTV: | | 62.1% |
| | U/W NCF DSCR: | | 2.56x |
| | U/W NOI Debt Yield: | | 9.4% |
The following table presents certain information relating to the tenancy at the ExchangeRight Net Leased Portfolio #31 Properties:
Major Tenants
Tenant Name | Credit Rating
(Fitch/Moody’s/
S&P)(1) | No. of
Properties | Tenant
NRSF | % of
NRSF | Annual
U/W Base
Rent PSF | Annual
U/W Base
Rent | % of Total
Annual
U/W Base
Rent |
| | | | | | | |
Major Tenants(2) | | | | | | | |
Hobby Lobby | NR / NR / NR | 2 | 110,020 | 20.1% | $5.50 | $605,100 | 8.2% |
Hy-Vee | NR / NR / NR | 1 | 101,278 | 18.5% | $13.16 | 1,332,807 | 18.0% |
Tractor Supply | NR / NR / NR | 5 | 94,886 | 17.3% | $13.40 | $1,271,900 | 17.2% |
Giant Eagle | NR / NR / NR | 1 | 71,050 | 13.0% | $14.50 | $1,029,916 | 13.9% |
Dollar General | NR / Baa2 / BBB | 7 | 64,724 | 11.8% | $11.73 | $758,958 | 10.3% |
Walgreens | BBB / Baa2 / BBB | 3 | 44,095 | 8.1% | $23.72 | $1,046,000 | 14.1% |
CVS Pharmacy | NR / Baa2 / BBB | 4 | 40,527 | 7.4% | $17.99 | $729,000 | 9.8% |
BioLife Plasma Services L.P.(3) | NR / Baa2 / NR | 1 | 14,181 | 2.6% | $34.95 | $495,569 | 6.7% |
Advance Auto Parts | NR / Baa2 / BBB- | 1 | 7,000 | 1.3% | $19.00 | $133,000 | 1.8% |
Total Major Tenants | | 25 | 547,761 | 100.0% | $13.51 | $7,402,250 | 100.0% |
| | | | | | | |
Vacant Space | | | 0 | 0.0% | | | |
| | | | | | | |
Collateral Total | | | 547,761 | 100.0% | | | |
| | | | | | | |
(1) | Certain ratings are those of the parent company whether or not the parent company guarantees the lease. |
(2) | Each tenant has at least one 5-year renewal option. |
(3) | BioLife Plasma Services L.P. has the right at any time to terminate its lease by providing 30 days’ written notice and payment of the net present value of the total obligation for base rent and any additional rent for the remainder of the lease term using an annual discount rate equal to the prime rate capped at 8.25%. The additional rent component will be calculated using the actual amount of the component for the most recent lease year increased by 2.5% annually for each year remaining on the lease term. Additional rent includes all costs and expenses of operating the property including, but not limited to, (i) real estate taxes, (ii) utilities, (iii) insurance premiums and (iv) repairs and maintenance. |
THE INFORMATION IN THIS STRUCTURAL AND COLLATERAL TERM SHEET IS NOT COMPLETE AND MAY BE AMENDED PRIOR TO THE TIME OF SALE. THIS TERM SHEET IS NOT AN OFFER TO SELL THESE SECURITIES AND IT IS NOT A SOLICITATION OF AN OFFER TO BUY THESE SECURITIES IN ANY JURISDICTION WHERE THE OFFER OR SALE IS NOT PERMITTED.
105
Property Type - Various | Loan #7 | Cut-off Date Balance: | | $33,875,000 |
Property Addresses - Various | ExchangeRight Net Leased Portfolio #31 | Cut-off Date LTV: | | 62.1% |
| | U/W NCF DSCR: | | 2.56x |
| | U/W NOI Debt Yield: | | 9.4% |
The following table presents certain information relating to the lease rollover schedule at the ExchangeRight Net Leased Portfolio #31 Properties:
Lease Expiration Schedule(1)(2)
Year Ending
December 31, | No. of Leases Expiring | Expiring NRSF | % of
Total
NRSF | Cumulative
Expiring
NRSF | Cumulative %
of Total
NRSF | Annual
U/W
Base Rent | % of Total
Annual
U/W Base
Rent | Annual
U/W
Base Rent
PSF |
MTM | 0 | 0 | 0.0% | 0 | 0.0% | $0 | 0.0% | $0.00 |
2020 | 0 | 0 | 0.0% | 0 | 0.0% | $0 | 0.0% | $0.00 |
2021 | 0 | 0 | 0.0% | 0 | 0.0% | $0 | 0.0% | $0.00 |
2022 | 0 | 0 | 0.0% | 0 | 0.0% | $0 | 0.0% | $0.00 |
2023 | 0 | 0 | 0.0% | 0 | 0.0% | $0 | 0.0% | $0.00 |
2024 | 0 | 0 | 0.0% | 0 | 0.0% | $0 | 0.0% | $0.00 |
2025 | 0 | 0 | 0.0% | 0 | 0.0% | $0 | 0.0% | $0.00 |
2026 | 0 | 0 | 0.0% | 0 | 0.0% | $0 | 0.0% | $0.00 |
2027 | 0 | 0 | 0.0% | 0 | 0.0% | $0 | 0.0% | $0.00 |
2028 | 0 | 0 | 0.0% | 0 | 0.0% | $0 | 0.0% | $0.00 |
2029 | 2 | 33,915 | 6.2% | 33,915 | 6.2% | $674,000 | 9.1% | $19.87 |
2030 | 6 | 62,252 | 11.4% | 96,167 | 17.6% | $1,127,000 | 15.2% | $18.10 |
Thereafter | 17 | 451,594 | 82.4% | 547,761 | 100.0% | $5,601,250 | 75.7% | $12.40 |
Vacant | 0 | 0 | 0.0% | 547,761 | 100.0% | $0 | 0.0% | $0.00 |
Total/Weighted Average | 25 | 547,761 | 100.0% | | | $7,402,250 | 100.0% | $13.51 |
(1) | Information obtained from the underwritten rent roll. |
(2) | The three Walgreens tenants have fully extended lease maturity dates of (i) for Walgreens – Des Plaines, IL of September 30, 2069, (ii) for Walgreens – Wheeling, IL of June 30, 2071 and (iii) for Walgreens – Chicago Heights, IL of October 31, 2070. The underwritten rent roll assumes that the first termination option date is the lease expiration date, so the properties are considered to have the following lease expiration dates: (i) for Walgreens – Des Plaines, IL, September 30, 2029, (ii) for Walgreens – Wheeling, IL, June 30, 2031, and (iii) for Walgreens – Chicago Heights, IL, October 31, 2030. |
The following table presents historical occupancy percentages at the ExchangeRight Net Leased Portfolio #31 Properties:
Historical Occupancy
12/31/2016(1) | | 12/31/2017(1) | | 12/31/2018(1) | | 12/31/2019(1) | | 2/1/2020(2) | |
NAV | | NAV | | NAV | | NAV | | 100.0% | |
(1) | The Dollar General – Fayetteville, GA property was constructed in 2018 and the BioLife Plasma Services L.P. – Columbus, GA property, Tractor Supply – Yulee, FL property, Tractor Supply – New Lenox, IL property, Tractor Supply – Danville, IN property, Tractor Supply – Kankakee, IL property, Dollar General – McDonough, GA property, Dollar General Prattville, AL property, Dollar General – Mobile, AL property and Dollar General – Evansville, IN property were constructed in 2019. These tenants are excluded from occupancy figures for the years prior to the respective build dates. Accordingly, historical occupancy is unavailable. |
(2) | Information obtained from the underwritten rent roll. |
THE INFORMATION IN THIS STRUCTURAL AND COLLATERAL TERM SHEET IS NOT COMPLETE AND MAY BE AMENDED PRIOR TO THE TIME OF SALE. THIS TERM SHEET IS NOT AN OFFER TO SELL THESE SECURITIES AND IT IS NOT A SOLICITATION OF AN OFFER TO BUY THESE SECURITIES IN ANY JURISDICTION WHERE THE OFFER OR SALE IS NOT PERMITTED.
106
Property Type - Various | Loan #7 | Cut-off Date Balance: | | $33,875,000 |
Property Addresses - Various | ExchangeRight Net Leased Portfolio #31 | Cut-off Date LTV: | | 62.1% |
| | U/W NCF DSCR: | | 2.56x |
| | U/W NOI Debt Yield: | | 9.4% |
Operating History and Underwritten Net Cash Flow. The following table presents certain information relating to the underwritten net cash flow at the ExchangeRight Net Leased Portfolio #31 Properties:
Cash Flow Analysis(1)
| U/W | | %(2) | U/W $ per SF |
Rents in Place(3) | $7,402,250 | | 94.0% | | $13.51 |
Grossed Up Vacant Space | 0 | | 0.0 | | 0.00 |
Gross Potential Rent | $7,402,250 | | 94.0% | | $13.51 |
Other Income | 0 | | 0.0 | | 0.00 |
Total Recoveries | 475,275 | | 6.0 | | 0.87 |
Net Rental Income | $7,877,525 | | 100.0% | | $14.38 |
(Vacancy & Credit Loss) | (288,986)(4) | | (3.9) | | (0.53) |
Effective Gross Income | $7,588,539 | | 96.3% | | $13.85 |
| | | | | |
Real Estate Taxes | 401,753 | | 5.3 | | 0.73 |
Insurance | 59,772 | | 0.8 | | 0.11 |
Management Fee | 151,771 | | 2.0 | | 0.28 |
Other Operating Expenses | 13,750 | | 0.2 | | 0.03 |
Total Operating Expenses | $627,046 | | 8.3% | | $1.14 |
| | | | | |
Net Operating Income | $6,961,493 | | 91.7% | | $12.71 |
Replacement Reserves | 35,581 | | 0.5 | | 0.06 |
TI/LC(5) | 214,480 | | 2.8 | | 0.39 |
Net Cash Flow | $6,711,432 | | 88.4% | | $12.25 |
| | | | | |
NOI DSCR(6) | 2.65x | | | | |
NCF DSCR(6) | 2.56x | | | | |
NOI Debt Yield(6) | 9.4% | | | | |
NCF Debt Yield(6) | 9.1% | | | | |
(1) | The ExchangeRight Net Leased Portfolio #31 Properties were acquired between May 2019 and November 2019. As such, no historical operating history is available. |
(2) | Represents (i) percent of Net Rental Income for all revenue fields, (ii) percent of Gross Potential Rent for Vacancy & Credit Loss and (iii) percent of Effective Gross Income for all other fields. |
(3) | Underwritten Rents in Place includes (i) in-place base rent of $7,441,250; (ii) straight-line rent of $22,682 for BioLife Plasma Services L.P. – Columbus, GA and (iii) $61,682 of reduced rent for three properties, Walgreens – Chicago Heights, IL, Tractor Supply – Oregon, OH, and Advance Auto Parts – Richmond, VA, each of which recently executed renewals for slightly lower rent than was previously being paid. |
(4) | The underwritten economic vacancy is 5.0% at the property level except for nine properties that are underwritten to a 0.0% economic vacancy. The nine properties are 100.0% occupied by investment grade tenants with at least 11 years remaining on the initial lease term and a fully extended expiration date of 2031 or later. The overall underwritten blended economic vacancy is 3.7%. The ExchangeRight Net Leased Portfolio #31 Properties are 100.0% physically occupied as of February 1, 2020. |
(5) | TI/LC is inclusive of a straight-line credit for the upfront TI/LC Reserve equal to $50,000, which is 10.0% of the upfront TI/LC reserve of $500,000. |
(6) | NOI DSCR, NCF DSCR, NOI Debt Yield and NCF Debt Yield are based on the ExchangeRight Net Leased Portfolio #31 Whole Loan. |
Appraisal. The ExchangeRight Net Leased Portfolio #31 Properties were valued individually, with the individual values reflecting a cumulative “as-is” appraised value of $119,040,000. The valuation dates range from October 19, 2019 to November 25, 2019.
Environmental Matters. According to Phase I environmental assessments dated between October 15, 2019 and November 26, 2019, there was no evidence of any recognized environmental conditions at the ExchangeRight Net Leased Portfolio #31 Properties with the exception of the Walgreens – Wheeling, IL property which formerly operated as a dry cleaner, where a recognized environmental condition was identified due in part to the duration of the dry cleaning operations and use of dry cleaning solvent in large quantities. Environmental insurance was obtained for the Walgreens – Wheeling, IL property from Zurich North America with a $3,000,000 liability limit. Additionally, controlled recognized environmental conditions were discovered at the CVS Pharmacy – Alton, IL property and the Dollar General – Evansville, IL property. See “Environmental Considerations” in the Preliminary Prospectus.
Escrows.
Real Estate Taxes – The ExchangeRight Net Leased Portfolio #31 Whole Loan documents require an upfront real estate tax reserve of $499,357. The borrower is required to escrow 1/12th of the taxes that the lender estimates will be payable during the next 12 months (initially $41,613) provided that the borrower will not be required to escrow such amounts if (i) no Cash Sweep Event (as defined below) has occurred and is continuing, (ii) no default exists under the lease at the applicable ExchangeRight Net Leased Portfolio #31 Properties, (iii) the tenant at the applicable ExchangeRight Net Leased Portfolio #31 Properties is liable for paying all taxes for such ExchangeRight Net Leased Portfolio #31 Properties and (iv) the borrower has provided written evidence that all taxes for such
THE INFORMATION IN THIS STRUCTURAL AND COLLATERAL TERM SHEET IS NOT COMPLETE AND MAY BE AMENDED PRIOR TO THE TIME OF SALE. THIS TERM SHEET IS NOT AN OFFER TO SELL THESE SECURITIES AND IT IS NOT A SOLICITATION OF AN OFFER TO BUY THESE SECURITIES IN ANY JURISDICTION WHERE THE OFFER OR SALE IS NOT PERMITTED.
107
Property Type - Various | Loan #7 | Cut-off Date Balance: | | $33,875,000 |
Property Addresses - Various | ExchangeRight Net Leased Portfolio #31 | Cut-off Date LTV: | | 62.1% |
| | U/W NCF DSCR: | | 2.56x |
| | U/W NOI Debt Yield: | | 9.4% |
ExchangeRight Net Leased Portfolio #31 Properties have been paid in full at least 15 days prior to the due date of such taxes. However, the borrower is required to make monthly taxes described above beginning on the payment date in November 2020 for the BioLife Plasma Services L.P. – Columbus, GA property until the borrower has provided a separate tax parcel identification number for such property.
Insurance – The ExchangeRight Net Leased Portfolio #31 Whole Loan documents do not require escrows for monthly insurance payments of 1/12th of insurance premiums that the lender estimates will be payable during the next 12 months as long as the borrower maintains a blanket policy acceptable to the lender.
Replacement Reserves – The ExchangeRight Net Leased Portfolio #31 Whole Loan documents require an upfront replacement reserve of $406,650 and ongoing monthly replacement reserves of $2,965.
TI/LC Reserve – The ExchangeRight Net Leased Portfolio #31 Whole Loan documents require an upfront TI/LC reserve of $500,000. Payment of the ongoing TI/LC monthly reserve of $31,953 will be waived as long as no event of default has occurred and is continuing.
Immediate Repairs - The ExchangeRight Net Leased Portfolio #31 Whole Loan documents require an upfront reserve of $69,781 for immediate repairs.
SNDA Holdback – The ExchangeRight Net Leased Portfolio #31 Whole Loan documents require an upfront reserve of $750,000 as an SNDA holdback relating to the Tractor Supply – Yulee, FL property.
Lockbox and Cash Management. The ExchangeRight Net Leased Portfolio #31 Whole Loan is structured with a hard lockbox and springing cash management. The borrower was required at origination to establish a lockbox account and deliver letters to the tenants at the ExchangeRight Net Leased Portfolio #31 Properties directing them to pay all rents directly into a lender-controlled lockbox account. Additionally, all revenues and other monies received by the borrower or related property manager are required to be deposited into the lockbox account within two business days upon receipt. During the occurrence and continuance of a Cash Sweep Event (as defined below), all funds are required to be swept each business day into the cash management account controlled by the lender and disbursed on each payment date in accordance with the ExchangeRight Net Leased Portfolio #31 Whole Loan documents, with all excess cash flow to be held as additional security for the ExchangeRight Net Leased Portfolio #31 Whole Loan.
A “Cash Sweep Event” will commence upon any of the following: (i) an event of default under the ExchangeRight Net Leased Portfolio #31 Whole Loan documents; (ii) as of any calculation date, the debt service coverage ratio based on a 30-year amortization schedule is less than 1.45x (2.20x interest-only equivalent) or (iii) December 6, 2026 (a “Qualified Transfer Trigger Event”). A Cash Sweep Event will end, with respect to clause (i), the end of such event of default, with respect to clause (ii) above, the debt service coverage ratio based on a 30-year amortization schedule being greater than or equal to 1.50x (2.28x interest-only equivalent) for two consecutive calendar quarters, or with respect to clause (iii) above, a Qualified Transfer Trigger Event Cure (as defined below).
A “Qualified Transfer Trigger Event Cure” will occur upon a qualified transfer to an Approved Transferee (as defined below) provided that the Approved Transferee (i) at all times must maintain either (a) a minimum net worth of at least $200,000,000 and total assets of at least $400,000,000 or (b) a rating of “BBB-” (or equivalent) or better by two out of three rating agencies that include S&P, Fitch and Moody’s (an “Investment Grade Rating”), (ii) must, in lieu of executing a certain guaranty described under the ExchangeRight Net Leased Portfolio #31 Whole Loan documents and prior to the release of any guarantor, execute and deliver to the lender a full recourse guaranty acceptable to the lender guaranteeing payment of the entire debt, (iii) must at all times own 100% of the legal and beneficial ownership interests in the borrower, (iv) will not be a Delaware statutory trust and (v) will cause the borrower to convert to a Delaware limited liability company.
An “Approved Transferee” is (i) an eligible institution which is, or which is wholly owned and controlled by, a bank, savings and loan association, investment bank, insurance company, trust company, real estate investment trust, commercial credit corporation, pension plan, pension fund or pension advisory firm, mutual fund, government entity or plan or institution similar to the foregoing, (ii) any transferee that (a) is not the target of any sanctions and meets the requirements of a qualified transferee under the ExchangeRight Net Leased Portfolio #31 Whole Loan documents and for whom the lender has received a credit check and bankruptcy, litigation judgment lien and other comparable searches, all of which are reasonably acceptable to the lender, (b) is regularly engaged in the business of owning or operating commercial properties which are similar to the Exchange Right Net Leased Portfolio #31 Properties, (c) owns interest in or operates at least five properties with a minimum of 750,000 square feet and (d) has either (1) total assets of at least $100,000,000 or (2) an Investment Grade Rating, or (iii) an approved real estate investment trust.
Property Management. The ExchangeRight Net Leased Portfolio #31 Properties are managed by an affiliate of the ExchangeRight Net Leased Portfolio #31 Borrower.
Partial Release. Not permitted.
Real Estate Substitution. Not permitted.
Subordinate and Mezzanine Indebtedness. Not permitted.
Ground Lease. None.
THE INFORMATION IN THIS STRUCTURAL AND COLLATERAL TERM SHEET IS NOT COMPLETE AND MAY BE AMENDED PRIOR TO THE TIME OF SALE. THIS TERM SHEET IS NOT AN OFFER TO SELL THESE SECURITIES AND IT IS NOT A SOLICITATION OF AN OFFER TO BUY THESE SECURITIES IN ANY JURISDICTION WHERE THE OFFER OR SALE IS NOT PERMITTED.
108
Property Type - Various | Loan #7 | Cut-off Date Balance: | | $33,875,000 |
Property Addresses - Various | ExchangeRight Net Leased Portfolio #31 | Cut-off Date LTV: | | 62.1% |
| | U/W NCF DSCR: | | 2.56x |
| | U/W NOI Debt Yield: | | 9.4% |
Right of First Refusal. Four tenants at nine of the ExchangeRight Net Leased Portfolio #31 properties have rights of first refusal. See “Description of the Mortgage Pool—Purchase Options and Rights of First Refusal” in the Preliminary Prospectus.
Terrorism Insurance. The ExchangeRight Net Leased Portfolio #31 Whole Loan documents require that the “all risk” insurance policy required to be maintained by the ExchangeRight Net Leased Portfolio #31 Borrower provides coverage for terrorism in an amount equal to the full replacement cost of the ExchangeRight Net Leased Portfolio #31 Properties, as well as business interruption insurance covering no less than the 12-month period following the occurrence of a casualty event, together with a 12-month extended period of indemnity.
THE INFORMATION IN THIS STRUCTURAL AND COLLATERAL TERM SHEET IS NOT COMPLETE AND MAY BE AMENDED PRIOR TO THE TIME OF SALE. THIS TERM SHEET IS NOT AN OFFER TO SELL THESE SECURITIES AND IT IS NOT A SOLICITATION OF AN OFFER TO BUY THESE SECURITIES IN ANY JURISDICTION WHERE THE OFFER OR SALE IS NOT PERMITTED.
109
| Retail – Single Tenant | Loan #8 | Cut-off Date Balance: | | $30,000,000 |
| 1 Stockton Street | One Stockton | Cut-off Date LTV: | | 59.5% |
| San Francisco, CA 94108 | | U/W NCF DSCR: | | 1.79x |
| | | U/W NOI Debt Yield: | | 7.6% |
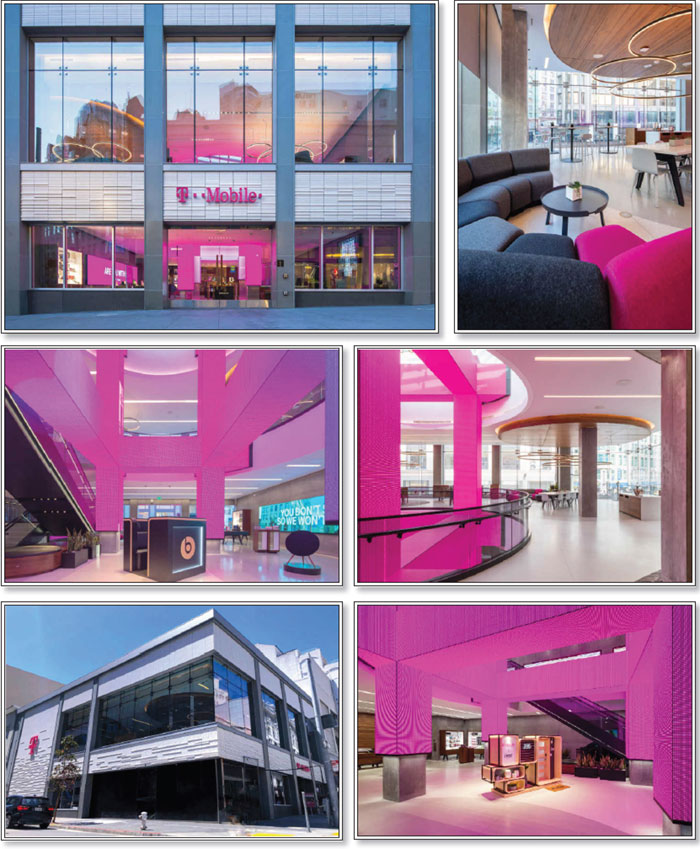
THE INFORMATION IN THIS STRUCTURAL AND COLLATERAL TERM SHEET IS NOT COMPLETE AND MAY BE AMENDED PRIOR TO THE TIME OF SALE. THIS TERM SHEET IS NOT AN OFFER TO SELL THESE SECURITIES AND IT IS NOT A SOLICITATION OF AN OFFER TO BUY THESE SECURITIES IN ANY JURISDICTION WHERE THE OFFER OR SALE IS NOT PERMITTED.
110
| Retail – Single Tenant | Loan #8 | Cut-off Date Balance: | | $30,000,000 |
| 1 Stockton Street | One Stockton | Cut-off Date LTV: | | 59.5% |
| San Francisco, CA 94108 | | U/W NCF DSCR: | | 1.79x |
| | | U/W NOI Debt Yield: | | 7.6% |

THE INFORMATION IN THIS STRUCTURAL AND COLLATERAL TERM SHEET IS NOT COMPLETE AND MAY BE AMENDED PRIOR TO THE TIME OF SALE. THIS TERM SHEET IS NOT AN OFFER TO SELL THESE SECURITIES AND IT IS NOT A SOLICITATION OF AN OFFER TO BUY THESE SECURITIES IN ANY JURISDICTION WHERE THE OFFER OR SALE IS NOT PERMITTED.
111
| No. 8 – One Stockton |
| |
| Mortgage Loan Information | | Mortgaged Property Information |
| Mortgage Loan Seller: | Barclays Capital Real Estate Inc. | | Single Asset/Portfolio: | Single Asset |
Credit Assessment (KBRA/Fitch/Moody’s): | NR/NR/NR | | Property Type – Subtype: | Retail – Single Tenant |
| Original Principal Balance(1): | $30,000,000 | | Location: | San Francisco, CA |
| Cut-off Date Balance(1): | $30,000,000 | | Size: | 16,987 SF |
| % of Initial Pool Balance: | 3.1% | | Cut-off Date Balance Per SF(1): | $3,885.32 |
| Loan Purpose: | Refinance | | Maturity Date Balance Per SF(1): | $3,885.32 |
| Borrower Sponsor: | Ben Ashkenazy | | Year Built/Renovated: | 1973 / 2016 |
| Guarantor: | Ben Ashkenazy | | Title Vesting: | Fee |
| Mortgage Rate: | 4.0400% | | Property Manager: | Self-managed |
| Note Date: | November 15, 2019 | | Current Occupancy (As of): | 100.0% (2/1/2020) |
| Seasoning: | 2 months | | YE 2019 Occupancy: | 100.0% |
| Maturity Date: | December 6, 2029 | | YE 2018 Occupancy: | 100.0% |
| IO Period: | 120 months | | YE 2017 Occupancy: | 100.0% |
| Loan Term (Original): | 120 months | | YE 2016 Occupancy: | 100.0% |
| Amortization Term (Original): | NAP | | As-Is Appraised Value(4): | $111,000,000 |
| Loan Amortization Type: | Interest-only, Balloon | | As-Is Appraised Value Per SF: | $6,534.41 |
| Call Protection(2): | L(26),D(90),O(4) | | As-Is Appraisal Valuation Date: | October 21, 2019 |
| Lockbox Type: | Hard/Springing Cash Management | | | |
| Additional Debt: | Yes | | Underwriting and Financial Information |
| Additional Debt Type (Balance): | Pari Passu($36,000,000) | | TTM NOI (10/31/2019): | $4,930,354 |
| | | | YE 2018 NOI: | $4,911,125 |
| | | | YE 2017 NOI: | $4,871,053 |
| | | | YE 2016 NOI(5): | NAP |
| | | | U/W Revenues: | $6,109,060 |
| | | | U/W Expenses: | $1,114,258 |
| Escrows and Reserves(3) | | U/W NOI: | $4,994,801 |
| | Initial | Monthly | Cap | | U/W NCF: | $4,845,821 |
| Taxes | $166,351 | $55,450 | NAP | | U/W DSCR based on NOI/NCF: | 1.84x / 1.79x |
| Insurance | $0 | Springing | NAP | | U/W Debt Yield based on NOI/NCF: | 7.6% / 7.3% |
| Replacement Reserves | $0 | Springing | NAP | | U/W Debt Yield at Maturity based on NOI/NCF(1): | 7.6% / 7.3% |
| TI/LC Reserve | $0 | $7,078 | $424,675 | | Cut-off Date LTV Ratio(1): | 59.5% |
| | | | | | LTV Ratio at Maturity(1): | 59.5% |
| | | | | | | |
| | | | | | | | |
| Sources and Uses |
| Sources | | | | | Uses | | | |
| Original Loan Amount(1) | $66,000,000 | | 99.6% | | Loan payoff | $65,450,268 | | 98.8% |
| Equity Contribution | 232,982 | | 0.4 | | Upfront reserves | 166,351 | | 0.3 |
| | | | | | Closing costs | 616,362 | | 0.9 |
| Total Sources | $66,232,982 | | 100.0% | | Total Uses | $66,232,982 | | 100.0% |
| (1) | The One Stockton Mortgage Loan (as defined below) is part of a whole loan evidenced by three pari passu notes with an aggregate original principal balance of $66.0 million. The Cut-off Date Balance Per SF, Maturity Date Balance Per SF, U/W Debt Yield based on NOI/NCF, U/W DSCR based on NOI/NCF, Cut-off Date LTV Ratio and LTV Ratio at Maturity or ARD numbers presented above are based on the aggregate principal balance of the promissory notes comprising the One Stockton Whole Loan (as defined below). |
| (2) | Defeasance of the One Stockton Whole Loan is permitted at any time after the earlier of (i) two years after the closing date of the securitization that includes the last note to be securitized and (ii) November 15, 2022. The assumed lockout period of 26 months is based on the WFCM 2020-C55 securitization closing date in February 2020. |
| (3) | See “Escrows” section below. |
| (4) | The appraisal also provided a “Go Dark Value” of $86,500,000 and a “Land Value” equal to $74,300,000. |
| (5) | The tenant, T-Mobile, executed its lease on September 30, 2014 with a rent commencement date of November 28, 2016. |
The Mortgage Loan. The One Stockton mortgage loan is part of a whole loan evidenced by three pari passu promissory notes with an aggregate original principal balance of $66,000,000 (the “One Stockton Whole Loan”). The One Stockton Whole Loan is secured by a first mortgage lien on the borrower’s fee interest in a 16,987 square foot single-tenant retail property located in San Francisco, California (the “One Stockton Property”). The controlling Note A-1, with an original principal balance of $30,000,000, will be included in the WFCM 2020-C55 securitization trust (the “One Stockton Mortgage Loan”). The non-controlling Notes A-2 and A-3, with original principal balances of $21,000,000 and $15,000,000, respectively, are expected to be contributed to future securitization trusts. The One Stockton Whole Loan will be serviced pursuant to the pooling and servicing agreement for the WFCM 2020-C55 securitization trust. See “Description of the Mortgage Pool—The Whole Loans—The Serviced Pari Passu Whole Loans” and “Pooling and Servicing Agreement” in the Preliminary Prospectus. The One Stockton Whole Loan has a 10-year term and is interest-only for the entire term.
THE INFORMATION IN THIS STRUCTURAL AND COLLATERAL TERM SHEET IS NOT COMPLETE AND MAY BE AMENDED PRIOR TO THE TIME OF SALE. THIS TERM SHEET IS NOT AN OFFER TO SELL THESE SECURITIES AND IT IS NOT A SOLICITATION OF AN OFFER TO BUY THESE SECURITIES IN ANY JURISDICTION WHERE THE OFFER OR SALE IS NOT PERMITTED.
112
| Retail – Single Tenant | Loan #8 | Cut-off Date Balance: | | $30,000,000 |
| 1 Stockton Street | One Stockton | Cut-off Date LTV: | | 59.5% |
| San Francisco, CA 94108 | | U/W NCF DSCR: | | 1.79x |
| | | U/W NOI Debt Yield: | | 7.6% |
Note Summary
| Notes | Original Principal Balance | Cut-off Date Balance | Note Holder | Controlling Interest |
| A-1 | $30,000,000 | $30,000,000 | WFCM 2020-C55 | Yes |
| A-2 | $21,000,000 | $21,000,000 | An affiliate of Barclays | No |
| A-3 | $15,000,000 | $15,000,000 | An affiliate of Barclays | No |
| Total | $66,000,000 | $66,000,000 | | |
The Borrowers and Borrower Sponsors.The borrower is One Stockton Realty LLC, a Delaware limited liability company and single purpose entity. The borrower has one independent director. Legal counsel to the borrower delivered a non-consolidation opinion in connection with the origination of the One Stockton Whole Loan. The non-recourse carve-out guarantor of the One Stockton Whole Loan is Ben Ashkenazy.
The borrower sponsor is Ben Ashkenazy. Ben Ashkenazy is the chief executive officer and chairman of Ashkenazy Acquisitions Corporation (“AAC”). AAC is a private real estate investment firm, headquartered in New York City, focusing on retail, hotel and office assets. Since its founding in 1987, AAC has acquired over 15.0 million Square Fee of retail, hospitality, office and residential properties, located throughout the United States, Canada and England. AAC has a portfolio containing more than 100 buildings valued at approximately $12.0 billion. The borrower sponsor has two foreclosures, one discounted payoff and two workouts, all at unrelated properties. See“Description of the Mortgage Pool—Loan Purpose; Default History, Bankruptcy Issues and Other Proceedings”in the Prospectus.
The Property.The One Stockton Property is an approximately 16,987 square foot single tenant retail building located in San Francisco, California. The property is a stand-alone two story building consisting of ground floor and second floor showroom space, with the basement used as back-of-office, storage, and conference/breakroom space. The property was built in 1973, significantly renovated for the prior tenant, Apple, in 2010, and was most recently renovated between 2015 and 2016 prior to the current tenant, T-Mobile, taking occupancy. The One Stockton Property has floor-to-ceiling glass extending along both Stockton and Ellis Streets on both the ground floor and second floor. According to the appraisal, compared to most buildings in the Union Square neighborhood, the One Stockton Property’s most recent construction and design allow for significant window lines, which enhance the desirability of the One Stockton Property’s 2nd floor showroom space, as it allows for a significant amount of natural light, as well as greater visibility from and to the street below. In addition, the 2nd floor is accessed from a wide and relatively short, open staircase abutting a two-story, open atrium, toward the middle of the building, which allows for greater continuity between the two showroom levels than a more typical side-core or elevator design.
The property is located in San Francisco’s Union Square. According to the appraisal, Union Square is one of the nation’s premier retail locations on par with Fifth Avenue in New York City, and Rodeo Drive in Beverly Hills, California. Major department stores located in Union Square include Macy’s, Neiman Marcus, Saks Fifth Avenue, Nordstrom, and Bloomingdales and is also home to other flagship stores. The Powell St. Station is a little over a block away from the property and serves four BART lines that carry commuters throughout the Bay area. The property is also near the planned Union Square/Market Street station that, as part of the larger Central Subway system, is expected to reduce travel times for customers traveling north and south through downtown. Both stations are planned to be accessible via an entrance directly beneath the One Stockton Property when the Union Square/Market Street station opens in 2021.
Major Tenant.
The One Stockton Property is 100.0% occupied by a T-Mobile, and operates as one of T-Mobile’s only six “signature” stores in the US. Other US “signature” stores are located in Times Square, Michigan Avenue, Las Vegas Strip, Miami Beach and the 3rd Street Promenade in Santa Monica. T-Mobile (Nasdaq: TMUS; Fitch/Moody’s/S&P: BBB+/Baa1/BBB+) provides mobile communications services in the United States, Puerto Rico, and United States Virgin Islands. The company offers voice, messaging, and data services to 83.1 million customers. As of December 31, 2018, T-Mobile US, Inc. operated approximately 2,200 T-Mobile and MetroPCS retail locations. T-Mobile has been a tenant since 2016 and has one five-year option remaining on its lease. Rent for the next renewal option will be the greater of (i) a 3.0% annual escalation from year 10 rent, or (ii) 95% of the fair market value. T-Mobile has a lease expiration date of November 30, 2026 and the loan documents require that all excess cash flow is swept into a lender controlled account 18 months prior to such date (see “Cash Sweep Period” below).
THE INFORMATION IN THIS STRUCTURAL AND COLLATERAL TERM SHEET IS NOT COMPLETE AND MAY BE AMENDED PRIOR TO THE TIME OF SALE. THIS TERM SHEET IS NOT AN OFFER TO SELL THESE SECURITIES AND IT IS NOT A SOLICITATION OF AN OFFER TO BUY THESE SECURITIES IN ANY JURISDICTION WHERE THE OFFER OR SALE IS NOT PERMITTED.
113
| Retail – Single Tenant | Loan #8 | Cut-off Date Balance: | | $30,000,000 |
| 1 Stockton Street | One Stockton | Cut-off Date LTV: | | 59.5% |
| San Francisco, CA 94108 | | U/W NCF DSCR: | | 1.79x |
| | | U/W NOI Debt Yield: | | 7.6% |
The following table presents certain information relating to the tenancy at the One Stockton Property:
Major Tenants(1)
| Tenant Name | Credit Rating (Fitch/Moody’s/S&P)(2) | Tenant
NRSF | % of
NRSF | Annual U/W Base Rent PSF | Annual
U/W Base Rent | % of Total Annual U/W Base Rent | Lease
Expiration
Date | Extension Options | Termination Option (Y/N) |
| Major Tenants | | | | | | | | |
| T-Mobile | BBB+/Baa1/BBB+ | 16,987 | 100.0% | $318.03 | $5,402,442 | 100.0% | 11/30/2026 | 1, 5-year | N |
| Total Major Tenants | 16,987 | 100.0% | $318.03 | $5,402,442 | 100.0% | | | |
| | | | | | | | | |
| Non-Major Tenants | 0 | 0.0% | $0.00 | $0 | 0.0% | | | |
| | | | | | | | | |
| Occupied Collateral Total | 16,987 | 100.0% | $318.03 | $5,402,442 | 100.0% | | | |
| | | | | | | | | |
| Vacant Space | 0 | 0.0% | | | | | | |
| | | | | | | | | |
| Collateral Total | 16,987 | 100.0% | | | | | | |
| | | | | | | | | | |
| (1) | Based on the underwritten rent roll. |
| (2) | Ratings provided are for the parent company of the entity listed whether or not the parent company guarantees the lease. |
The following table presents certain information relating to the lease rollover schedule at the One Stockton Property:
Lease Expiration Schedule(1)
Year Ending
December 31, | No. of Leases Expiring | Expiring NRSF | % of Total NRSF | Cumulative Expiring NRSF | Cumulative % of Total NRSF | Annual
U/W
Base Rent | % of Total Annual U/W Base Rent | Annual
U/W
Base Rent
PSF |
| MTM | 0 | 0 | 0.0% | 0 | 0.0% | $0 | 0.0% | $0.00 |
| 2020 | 0 | 0 | 0.0% | 0 | 0.0% | $0 | 0.0% | $0.00 |
| 2021 | 0 | 0 | 0.0% | 0 | 0.0% | $0 | 0.0% | $0.00 |
| 2022 | 0 | 0 | 0.0% | 0 | 0.0% | $0 | 0.0% | $0.00 |
| 2023 | 0 | 0 | 0.0% | 0 | 0.0% | $0 | 0.0% | $0.00 |
| 2024 | 0 | 0 | 0.0% | 0 | 0.0% | $0 | 0.0% | $0.00 |
| 2025 | 0 | 0 | 0.0% | 0 | 0.0% | $0 | 0.0% | $0.00 |
| 2026 | 1 | 16,987 | 100.0% | 16,987 | ��100% | $5,402,442 | 100.0% | $318.03 |
| 2027 | 0 | 0 | 0.0% | 16,987 | 100% | $0 | 0.0% | $0.00 |
| 2028 | 0 | 0 | 0.0% | 16,987 | 100% | $0 | 0.0% | $0.00 |
| 2029 | 0 | 0 | 0.0% | 16,987 | 100% | $0 | 0.0% | $0.00 |
| 2030 | 0 | 0 | 0.0% | 16,987 | 100% | $0 | 0.0% | $0.00 |
| Thereafter | 0 | 0 | 0.0% | 16,987 | 100% | $0 | 0.0% | $0.00 |
| Vacant | 0 | 0 | 0.0% | 16,987 | 100% | $0 | 0.0% | $0.00 |
| Total/Weighted Average | 1 | 16,987 | 100.0% | | | $5,402,442 | 100.0% | $318.03 |
| (1) | Information obtained from the underwritten rent roll. |
The following table presents historical occupancy percentages at the One Stockton Property:
Historical Occupancy
12/31/2016(1)(2) | 12/31/2017(1) | 12/31/2018(1) | 12/31/2019(1) | 2/1/2020(3) |
| 100% | 100.0% | 100.0% | 100.0% | 100.0% |
| (1) | Information obtained from the borrower. |
| (2) | The Tenant, T-Mobile, executed its lease September 30, 2014 with a rent commencement date of November 28, 2016. |
| (3) | Information obtained from the underwritten rent roll. |
THE INFORMATION IN THIS STRUCTURAL AND COLLATERAL TERM SHEET IS NOT COMPLETE AND MAY BE AMENDED PRIOR TO THE TIME OF SALE. THIS TERM SHEET IS NOT AN OFFER TO SELL THESE SECURITIES AND IT IS NOT A SOLICITATION OF AN OFFER TO BUY THESE SECURITIES IN ANY JURISDICTION WHERE THE OFFER OR SALE IS NOT PERMITTED.
114
| Retail – Single Tenant | Loan #8 | Cut-off Date Balance: | | $30,000,000 |
| 1 Stockton Street | One Stockton | Cut-off Date LTV: | | 59.5% |
| San Francisco, CA 94108 | | U/W NCF DSCR: | | 1.79x |
| | | U/W NOI Debt Yield: | | 7.6% |
Operating History and Underwritten Net Cash Flow. The following table presents certain information relating to the underwritten net cash flow at the One Stockton Property:
Cash Flow Analysis
| | 2017 | 2018 | TTM 10/31/2019 | U/W | %(1) | U/W $ per SF |
| Rents in Place | $4,813,200 | $4,958,824 | $5,081,196 | $5,245,090 | 81.6% | $308.77 |
| Contractual Rent Steps | 0 | 0 | 0 | 157,352 | 2.4 | 9.26 |
| Grossed Up Vacant Space | 0 | 0 | 0 | 0 | 0.0 | 0 |
| Gross Potential Rent | $4,813,200 | $4,958,824 | $5,081,196 | $5,402,442 | 84.0% | $318.03 |
| Total Recoveries | 921,659 | 848,067 | 768,933 | 1,028,147 | 16.0 | 60.53 |
| Net Rental Income | $5,734,859 | $5,806,891 | $5,850,129 | $6,430,589 | 100.0% | $378.56 |
| (Vacancy & Credit Loss) | 0 | 0 | 0 | (321,529) | (5.0) | (18.93) |
| Effective Gross Income | $5,734,859 | $5,806,891 | $5,850,129 | $6,109,060 | 95.0% | $359.63 |
| | | | | | | |
| Real Estate Taxes | 624,687 | 633,114 | 651,252 | 665,405 | 10.9 | 39.17 |
| Insurance | 54,226 | 50,776 | 56,091 | 56,091 | 0.9 | 3.30 |
| Management Fee | 174,885 | 172,528 | 174,886 | 122,181 | 2.0 | 7.19 |
| Other Operating Expenses | 10,008 | 39,348 | 37,546 | 270,581 | 4.4 | 15.93 |
| Total Operating Expenses | $863,806 | $895,766 | $919,775 | $1,114,258 | 18.2% | $65.59 |
| | | | | | 0.0 | |
| Net Operating Income | $4,871,053 | $4,911,125 | $4,930,354 | $4,994,801 | 81.8% | $294.04 |
| Replacement Reserves | 0 | 0 | 0 | 2,548 | 0.0 | 0.15 |
| TI/LC | 0 | 0 | 0 | 146,433 | 2.4 | 8.62 |
| Net Cash Flow | $4,871,053 | $4,911,125 | $4,930,354 | $4,845,821 | 79.3% | $285.27 |
| | | | | | | |
| NOI DSCR | 1.80x | 1.81x | 1.82x | 1.84x | | |
| NCF DSCR | 1.80x | 1.81x | 1.82x | 1.79x | | |
| NOI Debt Yield | 7.4% | 7.4% | 7.5% | 7.6% | | |
| NCF Debt Yield | 7.4% | 7.4% | 7.5% | 7.3% | | |
| (1) | Represents (i) percent of Net Rental Income for all revenue fields and for Vacancy & Credit Loss and (ii) percent of Effective Gross Income for all other fields |
Appraisal.The appraiser concluded to an “as-is” Appraised Value of $111,000,000 as of October 21, 2019.
Environmental Matters. According to the Phase I environmental assessment dated October 24, 2019, there was no evidence of any recognized environmental conditions at the One Stockton Property.
Market Overview and Competition.The One Stockton Property is located in the city of San Francisco, along the southern boundary of the Union Square neighborhood. The property is situated at the confluence of Stockton Street, Ellis Street, and Market Street. Market Street is the major commercial thoroughfare that bisects downtown San Francisco, with numerous train, bus and subway stops located along Market Street in close proximity to the property. According to the appraisal, the Union Square Neighborhood is an internationally known upscale downtown shopping district in a class with New York’s Fifth Avenue, Chicago’s North Michigan Avenue and Beverly Hills’ Rodeo Drive. The appraisal also reports that the location at Stockton and Market and the location one block west at Powell and Market are the two most trafficked locations in the city. According to the appraisal, given the location along the major transportation hubs along Market Street, with Stockton Street as the main street leading from Market to Union Square Park, the subject benefits from a significant amount of foot traffic.
According to the appraisal, the One Stockton Property is located within the Union Square Retail Market, which has a reported vacancy rate as of the third quarter of 2019 of 5.9% and the concluded market rent on a triple net basis for One Stockton is $275.00 PSF. According to the appraisal, based on 2019 estimates, the population within a 0.5-, one- and three-mile radius was approximately 30,451, 140,606 and 432,289, respectively. Additionally, for the same period, the median household income within a 0.5, one- and three-mile radius was $46,954, $75,100 and $119,158, respectively.
THE INFORMATION IN THIS STRUCTURAL AND COLLATERAL TERM SHEET IS NOT COMPLETE AND MAY BE AMENDED PRIOR TO THE TIME OF SALE. THIS TERM SHEET IS NOT AN OFFER TO SELL THESE SECURITIES AND IT IS NOT A SOLICITATION OF AN OFFER TO BUY THESE SECURITIES IN ANY JURISDICTION WHERE THE OFFER OR SALE IS NOT PERMITTED.
115
| Retail – Single Tenant | Loan #8 | Cut-off Date Balance: | | $30,000,000 |
| 1 Stockton Street | One Stockton | Cut-off Date LTV: | | 59.5% |
| San Francisco, CA 94108 | | U/W NCF DSCR: | | 1.79x |
| | | U/W NOI Debt Yield: | | 7.6% |
The following table presents certain information relating to the appraiser’s market rent conclusion for the One Stockton Property:
Market Rent Summary(1)
| | Ground Floor | Basement | Second Floor |
| Market Rent (PSF) | $392.00-$859.00 | $40.00 | $75.00 |
| Lease Term (Years) | 10 | 10 | 10 |
| Lease Type (Reimbursements) | Net | Net | Net |
| Rent Increase Projection | 3% per year | 3% per year | 3% per year |
| (1) | Information obtained from the appraisal. |
The table below presents certain information relating to comparable sales for the One Stockton Property identified by the appraiser:
Comparable Sales(1)
| Property Name | Location | Rentable Area (SF) | Sale Date | Sale Price | Sale Price (PSF) | Adjusted Sales Price (PSF) |
| 233 Geary Street | San Francisco, CA | 25,402 | Jan-19 | $190,000,000 | $7,479.73 | $6,731.75 |
| Apple | San Francisco, CA | 15,000 | Jul-19 | $120,000,000 | $8,000.00 | $6,400.00 |
| Williams Sonoma | San Francisco, CA | 20,018 | Oct-18 | $53,000,000 | $2,647.62 | $5,824.76 |
| One Powell St. | San Francisco, CA | 39,108 | Dec-15 | $155,000,000 | $3,963.38 | $6,103.61 |
| 457-459 N. Rodeo Drive | Beverly Hills, CA | 11,625 | Oct-18 | $96,000,000 | $8,258.06 | $6,193.55 |
| (1) | Information obtained from the appraisal. |
Comparable Leases(1)
| Property | Year Built / Renovated | Tenant GLA (square feet) | Est. Rent PSF | Proximity (miles) | Tenant |
| 856 Market St. | 1909 / NAP | 9,073 | $132.26 | <0.1 | New Balance |
| One Powell St. | 1921 / NAP | 24,729 | $186.02 | 0.2 | AT&T |
| 222 Stockton Street | 1908 / NAP | 4,980 | $361.00 | 0.1 | Tory Burch |
| 195 Grant Ave | 1909 / NAP | 5,400 | $389.00 | 0.2 | Fendi |
| 199 Grant Ave | 1909 / NAP | 7,300 | $422.00 | 0.3 | Cartier |
| (1) | Information obtained from the appraisal. |
Escrows.
Real Estate Taxes – At origination, the borrower was required to deposit into escrow $166,351 for property taxes. On a monthly basis, the borrower is required to escrow 1/12th of the annual estimated tax payments, which is currently approximately $55,450.
Insurance – The requirement for the borrower to make monthly deposits for insurance premiums (initially equal to $4,674) is waived as long as the One Stockton Property is covered under a blanket policy acceptable to the lender.
Replacement Reserves – The requirement for the borrower to make monthly deposits into the replacement escrow is waived so long as no event of default or Trigger Period (defined below) exists. Upon a Trigger Period, the borrower will be required to escrow $212 per month for ongoing replacement reserves.
TI/LC Reserve –The borrower is required to escrow $7,078 (approximately $5.00 per square foot annually) on a monthly basis for ongoing tenant improvement and leasing commission reserves. The reserve is subject to a cap of $424,675 (approximately five years of collections).
Lockbox and Cash Management.The loan is structured with a hard lockbox with springing cash management. Tenant direction letters were required to be sent to the tenant upon the origination of the loan instructing it to deposit all rents and payments into the lockbox account controlled by the lender. The funds are then returned to an account controlled by the borrower until the occurrence of a Trigger Period. During a Trigger Period, all funds in the lockbox account are swept weekly to a segregated cash management account under the control of the lender. To the extent there is a Cash Sweep Period (as defined below) continuing caused by a T-Mobile Trigger Event, all excess cash flow after payment of the mortgage debt service, required reserves and other amounts required by the loan documents will be held in a T-Mobile reserve account. To the extent there is a Cash Sweep Period continuing caused by anything
THE INFORMATION IN THIS STRUCTURAL AND COLLATERAL TERM SHEET IS NOT COMPLETE AND MAY BE AMENDED PRIOR TO THE TIME OF SALE. THIS TERM SHEET IS NOT AN OFFER TO SELL THESE SECURITIES AND IT IS NOT A SOLICITATION OF AN OFFER TO BUY THESE SECURITIES IN ANY JURISDICTION WHERE THE OFFER OR SALE IS NOT PERMITTED.
116
| Retail – Single Tenant | Loan #8 | Cut-off Date Balance: | | $30,000,000 |
| 1 Stockton Street | One Stockton | Cut-off Date LTV: | | 59.5% |
| San Francisco, CA 94108 | | U/W NCF DSCR: | | 1.79x |
| | | U/W NOI Debt Yield: | | 7.6% |
other than a T-Mobile Trigger Event, all excess cash flow after payment of the mortgage debt service, required reserves and other amounts required by the loan documents will be held in an excess cash reserve account.
A “Trigger Period” means a period of time (A) commencing upon the earliest of (i) an event of default, (ii) an amortizing debt service coverage ratio being less than 1.20x or (iii) the occurrence of a T-Mobile Trigger Event (as defined below), and (B) expiring upon (w) in connection with clause (i) above, the cure of such event of default, (x) in connection with clause (ii) above, the date that the amortizing debt service coverage ratio is equal to or greater than 1.25x for two consecutive calendar quarters or (y) in connection with clause (iii) above, an T-Mobile Trigger Event cure.
A “Cash Sweep Period” means a period of time (A) commencing upon the earliest of (i) an event of default, (ii) an amortizing debt service coverage ratio being less than 1.20x for two consecutive calendar quarters or (iii) the occurrence of a T-Mobile Trigger Event (as defined below), and (B) expiring upon (w) in connection with clause (i) above, the cure of such event of default, (x) in connection with clause (ii) above, the date that the amortizing debt service coverage ratio is equal to or greater than 1.25x for two consecutive calendar quarters or (y) in connection with clause (iii) above, an T-Mobile Trigger Event cure.
A “T-Mobile Trigger Event” means the occurrence of any of the following: (a) T-Mobile fails to renew their lease by the earlier of (i) 18 months prior to their lease expiration date and (ii) the date on which the tenant is required to provide notice of renewal of such lease, (b) T-Mobile (or parent or guarantor) being subject to bankruptcy or insolvency proceedings, (c) T-Mobile goes dark or provides notice to go dark, (d) T-Mobile defaults under its lease and (e) T-Mobile (i) terminates its lease or (ii) gives notice of its intention to terminate or not renew its lease. T-Mobile does not have any termination options.
In the event of a T-Mobile Trigger Event described in clause (a) or (e) above, the borrower may cure the event by depositing $4,000,000 cash with the lender or by delivering to the lender a letter of credit in the amount of $4,000,000.
Property Management. The One Stockton property is managed by AAC Management Corp., an affiliate of the borrower.
Partial Release. Not permitted.
Real Estate Substitution.Not permitted.
Subordinate and Mezzanine Indebtedness.None
Ground Lease. None
Earthquake Insurance:The property is located in Seismic Zone 4 and has a probable maximum loss of 12%. The borrower obtained seismic insurance coverage of $10.0 million per occurrence and in the annual aggregate and a terrorism deductible of $25,000
Terrorism Insurance.The One Stockton Whole Loan documents require that the “all risk” insurance policy required to be maintained by the borrower provides coverage for terrorism in an amount equal to the full replacement cost of the One Stockton Property, as well as business interruption insurance covering no less than the 18-month period following the occurrence of a casualty event, together with a 12-month extended period of indemnity.
THE INFORMATION IN THIS STRUCTURAL AND COLLATERAL TERM SHEET IS NOT COMPLETE AND MAY BE AMENDED PRIOR TO THE TIME OF SALE. THIS TERM SHEET IS NOT AN OFFER TO SELL THESE SECURITIES AND IT IS NOT A SOLICITATION OF AN OFFER TO BUY THESE SECURITIES IN ANY JURISDICTION WHERE THE OFFER OR SALE IS NOT PERMITTED.
117
| Retail – Single Tenant | Loan #9 | Cut-off Date Balance: | | $27,700,000 |
| 3765 South Las Vegas Boulevard | Walgreens - Las Vegas Strip | Cut-off Date LTV: | | 72.9% |
| Las Vegas, NV 89109 | | U/W NCF DSCR: | | 1.69x |
| | | U/W NOI Debt Yield: | | 7.2% |
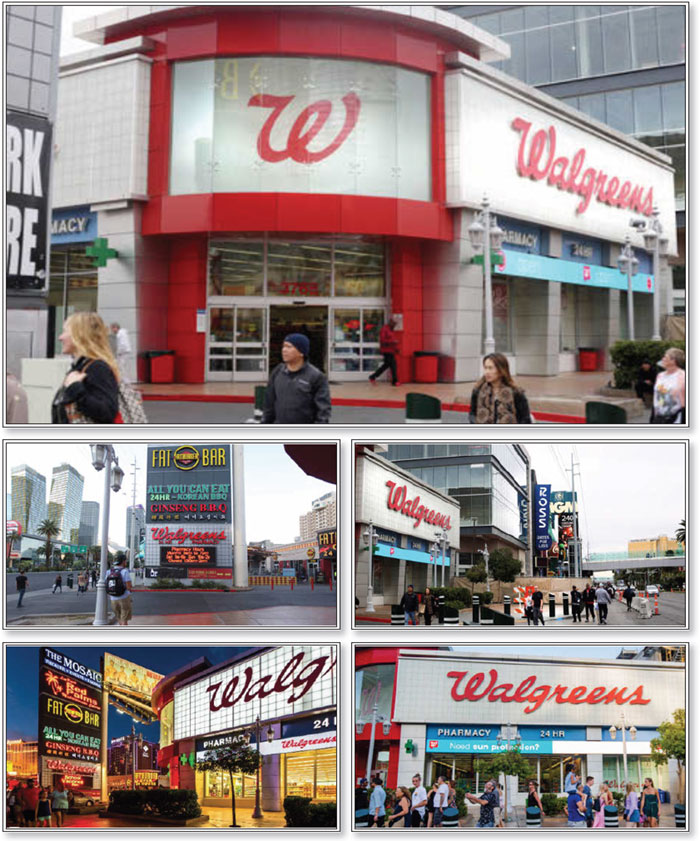
THE INFORMATION IN THIS STRUCTURAL AND COLLATERAL TERM SHEET IS NOT COMPLETE AND MAY BE AMENDED PRIOR TO THE TIME OF SALE. THIS TERM SHEET IS NOT AN OFFER TO SELL THESE SECURITIES AND IT IS NOT A SOLICITATION OF AN OFFER TO BUY THESE SECURITIES IN ANY JURISDICTION WHERE THE OFFER OR SALE IS NOT PERMITTED.
118
| Retail – Single Tenant | Loan #9 | Cut-off Date Balance: | | $27,700,000 |
| 3765 South Las Vegas Boulevard | Walgreens - Las Vegas Strip | Cut-off Date LTV: | | 72.9% |
| Las Vegas, NV 89109 | | U/W NCF DSCR: | | 1.69x |
| | | U/W NOI Debt Yield: | | 7.2% |

THE INFORMATION IN THIS STRUCTURAL AND COLLATERAL TERM SHEET IS NOT COMPLETE AND MAY BE AMENDED PRIOR TO THE TIME OF SALE. THIS TERM SHEET IS NOT AN OFFER TO SELL THESE SECURITIES AND IT IS NOT A SOLICITATION OF AN OFFER TO BUY THESE SECURITIES IN ANY JURISDICTION WHERE THE OFFER OR SALE IS NOT PERMITTED.
119
| No. 9 – Walgreens - Las Vegas Strip |
| |
| Mortgage Loan Information | | Mortgaged Property Information |
| Mortgage Loan Seller: | Wells Fargo Bank, National Association | | Single Asset/Portfolio: | Single Asset |
Credit Assessment (KBRA/Fitch/Moody’s): | NR/NR/NR | | Property Type – Subtype: | Retail – Single Tenant |
| Original Principal Balance: | $27,700,000 | | Location: | Las Vegas, NV |
| Cut-off Date Balance: | $27,700,000 | | Size: | 14,688 SF |
| % of Initial Pool Balance: | 2.9% | | Cut-off Date Balance Per SF: | $1,885.89 |
| Loan Purpose: | Acquisition | | Maturity Date Balance Per SF: | $1,885.89 |
| Borrower Sponsor: | Ryan Tedder; Keith Kantrowitz | | Year Built/Renovated: | 1999/NAP |
| Guarantors: | Ryan Tedder; Keith Kantrowitz | | Title Vesting: | Fee |
| Mortgage Rate: | 4.1800% | | Property Manager: | Tenant-managed |
| Note Date: | December 19, 2019 | | Current Occupancy (As of): | 100.0% (2/1/2020) |
| Seasoning: | 1 month | | YE 2019 Occupancy(3): | 100.0% |
| Maturity Date: | January 11, 2030 | | YE 2018 Occupancy(3): | 100.0% |
| IO Period: | 120 months | | YE 2017 Occupancy(3): | 100.0% |
| Loan Term (Original): | 120 months | | YE 2016 Occupancy(3): | 100.0% |
| Amortization Term (Original)(1): | NAP | | Appraised Value: | $38,000,000 |
| Loan Amortization Type: | Interest-only, Balloon | | Appraised Value Per SF: | $2,587.15 |
| Call Protection: | L(25),D(91),O(4) | | Appraisal Valuation Date: | November 21, 2019 |
| Lockbox Type: | Soft/Springing Cash Management | | | |
| Additional Debt: | None | | Underwriting and Financial Information |
| Additional Debt Type (Balance): | NAP | | YE 2019 NOI(3): | NAV |
| | | | YE 2018 NOI(3): | NAV |
| | | | YE 2017 NOI(3): | NAV |
| | | | YE 2016 NOI(3): | NAV |
| | | | U/W Revenues: | $2,007,983 |
| | | | U/W Expenses: | $20,080 |
| | | U/W NOI: | $1,987,903 |
| Escrows and Reserves(2) | | U/W NCF: | $1,986,435 |
| | Initial | Monthly | Cap | | U/W DSCR based on NOI/NCF: | 1.69x / 1.69x |
| Taxes | $0 | Springing | NAP | | U/W Debt Yield based on NOI/NCF: | 7.2% / 7.2% |
| Insurance | $0 | Springing | NAP | | U/W Debt Yield at Maturity based on NOI/NCF: | 7.2% / 7.2% |
| Replacement Reserve | $0 | Springing | NAP | | Cut-off Date LTV Ratio: | 72.9% |
| TI/LC Reserve | $0 | Springing | NAP | | LTV Ratio at Maturity: | 72.9% |
| Excess Cash Flow Reserve | $0 | Springing | NAP | | | |
| | | | | | | | |
| Sources and Uses |
| Sources | | | | | Uses | | | |
| Original loan amount | $27,700,000 | | 72.0% | | Purchase price | $38,000,000 | | 98.7% |
| Cash equity contribution | 10,797,630 | | 28.0 | | Closing costs | 497,630 | | 1.3 |
| | | | | | | | | |
| Total Sources | $38,497,630 | | 100.0% | | Total Uses | $38,497,630 | | 100.0% |
| (1) | Provided no event of default exists, funds in the Excess Cash Flow Reserve account will be applied to the outstanding principal balance of the Walgreens – Las Vegas Strip Mortgage Loan on the Maturity Date (see “Escrows” section below). |
| (2) | See “Escrows” section below. |
| (3) | Historical operating statements are not available, as the borrower sponsor recently acquired the Walgreens - Las Vegas Strip Property (as defined below) in a sale-leaseback transaction. Walgreens has occupied the Walgreens - Las Vegas Strip Property since it was constructed in 1999. |
The Mortgage Loan. The mortgage loan (the “Walgreens - Las Vegas Strip Mortgage Loan”) is evidenced by a single promissory note secured by a first mortgage encumbering the fee interest in a single tenant retail property located in Las Vegas, Nevada (the “Walgreens - Las Vegas Strip Property”).
The Borrower and Borrower Sponsors.The borrower comprises two tenants-in-common: PREH Las Vegas BLVD, LLC and MRK Vegas Strip LLC (collectively, the “Walgreens - Las Vegas Strip Borrower”), each a single purpose Delaware limited liability. The borrower sponsors and nonrecourse carve-out guarantors of the Walgreens - Las Vegas Strip Mortgage Loan are Ryan Tedder and Keith Kantrowitz.
Mr. Kantrowitz, who has over 30 years of experience as a mortgage broker, is the President of Power Express Mortgage and has interests in more than 24 commercial assets valued at $11.7 million throughout the United States. Mr. Tedder is an American singer, songwriter, musician and record producer and is the lead vocalist for the band OneRepublic. Keith Kantrowitz is a named defendant in
THE INFORMATION IN THIS STRUCTURAL AND COLLATERAL TERM SHEET IS NOT COMPLETE AND MAY BE AMENDED PRIOR TO THE TIME OF SALE. THIS TERM SHEET IS NOT AN OFFER TO SELL THESE SECURITIES AND IT IS NOT A SOLICITATION OF AN OFFER TO BUY THESE SECURITIES IN ANY JURISDICTION WHERE THE OFFER OR SALE IS NOT PERMITTED.
120
| Retail – Single Tenant | Loan #9 | Cut-off Date Balance: | | $27,700,000 |
| 3765 South Las Vegas Boulevard | Walgreens - Las Vegas Strip | Cut-off Date LTV: | | 72.9% |
| Las Vegas, NV 89109 | | U/W NCF DSCR: | | 1.69x |
| | | U/W NOI Debt Yield: | | 7.2% |
an action by a residential tenant alleging fraud and criminal negligence in connection with a 100 year sale-leaseback structure and subsequent eviction proceedings in connection with the tenant’s Brooklyn, New York home. See“Description of the Mortgage Pool–Litigation and Other Considerations”in the Preliminary Prospectus.
The Property.The Walgreens - Las Vegas Strip Property is a single tenant retail property containing 14,688 square feet and located in Las Vegas, Nevada, approximately 6.0 miles south of the Las Vegas central business district. As of February 1, 2020, the Walgreens - Las Vegas Strip Property was 100.0% leased to Walgreen Co. (“Walgreens”). The Walgreens - Las Vegas Strip Property was constructed in 1999 and Walgreens has been the only tenant. The Walgreens - Las Vegas Strip Property is situated on a 0.4-acre site and the Walgreens - Las Vegas Strip Borrower has rights to 140 surface parking spaces located adjacent to the property via a reciprocal easement agreement resulting in a parking ratio of approximately 9.5 spaces per 1,000 square feet of rentable area. The borrower sponsors recently acquired the Walgreens – Las Vegas Strip Property from Walgreens in a sale-leaseback transaction.
Major Tenant.
Walgreens (BBB/Baa2/BBB by Fitch/Moody’s/S&P; 14,688 square feet; 100.0% of net rentable area; 100.0% of underwritten base rent; 12/31/2034 lease expiration) – Walgreens is a subsidiary of Walgreens Boots Alliance (“WBA”) (Nasdaq: WBA), the largest retail pharmacy, health, and daily living destination across the U.S. and Europe. WBA’s portfolio comprises retail and business brands including Walgreens, Duane Reade, and Boots and Alliance Healthcare. As of August 31, 2019, WBA had over 18,750 stores in 11 countries and employed over 440,000 people. Walgreens has occupied the Walgreens - Las Vegas Strip Property since 1999 and recently executed a 15-year triple-net lease through December 2034 with 12, 5-year automatic extension options. The entity on the lease is Walgreen Co., the predecessor company of WBA.
The following table presents certain information relating to the tenancy at the Walgreens - Las Vegas Strip Property:
Major Tenant(1)
| Tenant Name | Credit Rating (Fitch/Moody’s/
S&P) | Tenant NRSF | % of
NRSF | Annual U/W Base Rent PSF(3) | Annual
U/W Base Rent(3) | % of Total Annual U/W Base Rent | Lease
Expiration
Date | Extension Options | Termination Option (Y/N) |
| Major Tenants | | | | | | | | |
| Walgreens | BBB/Baa2/BBB(2) | 14,688 | 100.0% | $139.57 | $2,050,000 | 100.0% | 12/31/2034 | 12, 5-year(4) | N |
| Occupied Collateral Total | 14,688 | 100.0% | $139.57 | $2,050,000 | 100.0% | | | |
| | | | | | | | | |
| Vacant Space | 0 | 0.0% | | | | | | |
| | | | | | | | | |
| Collateral Total | 14,688 | 100.0% | | | | | | |
| | | | | | | | | | |
| (1) | Information obtained from the Underwritten Rent Roll |
| (2) | The ratings shown are for Walgreens Boots Alliance. The entity on the Walgreens lease is Walgreen Co., the predecessor company of Walgreens Boots Alliance. |
| (3) | Walgreens’ current contractual rental rate is $136.17 per square foot. The Annual U/W Base Rent PSF and Annual U/W Base Rent include straight-line rent averaging through the loan term totalling $50,000. Walgreens’ lease is structured with 5.0% contractual rental rate increases every 5 years (including on the first day of each extension option). |
| (4) | Walgreens has 12, 5-year automatic extension options unless Walgreens gives notice to terminate the lease with 12 months’ notice. |
The following table presents certain information relating to major tenant sales at the Walgreens - Las Vegas Strip Property:
Tenant Sales
(TTM 3/31/2019)(1)
| Major Tenant Name | Gross Sales | Sales PSF | Major Tenant Occupancy Cost(2) |
| Walgreens | $12,659,766 | $862 | 16.3% |
| (1) | Sales exclude prescription sales with insurance coverage, total liquor and tobacco sales. |
| (2) | Occupancy Cost is based on TTM sales, underwritten base rent and underwritten reimbursements. |
THE INFORMATION IN THIS STRUCTURAL AND COLLATERAL TERM SHEET IS NOT COMPLETE AND MAY BE AMENDED PRIOR TO THE TIME OF SALE. THIS TERM SHEET IS NOT AN OFFER TO SELL THESE SECURITIES AND IT IS NOT A SOLICITATION OF AN OFFER TO BUY THESE SECURITIES IN ANY JURISDICTION WHERE THE OFFER OR SALE IS NOT PERMITTED.
121
| Retail – Single Tenant | Loan #9 | Cut-off Date Balance: | | $27,700,000 |
| 3765 South Las Vegas Boulevard | Walgreens - Las Vegas Strip | Cut-off Date LTV: | | 72.9% |
| Las Vegas, NV 89109 | | U/W NCF DSCR: | | 1.69x |
| | | U/W NOI Debt Yield: | | 7.2% |
The following table presents certain information relating to the lease rollover schedule at the Walgreens - Las Vegas Strip Property:
Lease Expiration Schedule(1)
Year Ending
December 31, | No. of Leases Expiring | Expiring NRSF | % of Total NRSF | Cumulative Expiring NRSF | Cumulative % of Total NRSF | Annual
U/W
Base Rent | % of Total Annual U/W Base Rent | Annual
U/W
Base Rent
PSF |
| MTM | 0 | 0 | 0.0% | 0 | 0.0% | $0 | 0.0% | $0.00 |
| 2020 | 0 | 0 | 0.0% | 0 | 0.0% | $0 | 0.0% | $0.00 |
| 2021 | 0 | 0 | 0.0% | 0 | 0.0% | $0 | 0.0% | $0.00 |
| 2022 | 0 | 0 | 0.0% | 0 | 0.0% | $0 | 0.0% | $0.00 |
| 2023 | 0 | 0 | 0.0% | 0 | 0.0% | $0 | 0.0% | $0.00 |
| 2024 | 0 | 0 | 0.0% | 0 | 0.0% | $0 | 0.0% | $0.00 |
| 2025 | 0 | 0 | 0.0% | 0 | 0.0% | $0 | 0.0% | $0.00 |
| 2026 | 0 | 0 | 0.0% | 0 | 0.0% | $0 | 0.0% | $0.00 |
| 2027 | 0 | 0 | 0.0% | 0 | 0.0% | $0 | 0.0% | $0.00 |
| 2028 | 0 | 0 | 0.0% | 0 | 0.0% | $0 | 0.0% | $0.00 |
| 2029 | 0 | 0 | 0.0% | 0 | 0.0% | $0 | 0.0% | $0.00 |
| 2030 | 0 | 0 | 0.0% | 0 | 0.0% | $0 | 0.0% | $0.00 |
| Thereafter | 1 | 14,688 | 100.0% | 14,688 | 100.0% | $2,050,000 | 100.0% | $139.57 |
| Vacant | 0 | 0 | 0.0% | 14,688 | 100.0% | $0 | 0.0% | $0.00 |
| Total/Weighted Average | 1 | 14,688 | 100.0% | | | $2,050,000 | 100.0% | $139.57 |
| (1) | Information obtained from the underwritten rent roll. |
The following table presents historical occupancy percentages at the Walgreens - Las Vegas Strip Property:
Historical Occupancy
12/31/2016(1) | 12/31/2017(1) | 12/31/2018(1) | 12/31/2019(1) | 2/1/2020(2) |
| 100.0% | 100.0% | 100.0% | 100.0% | 100.0% |
| (1) | Information obtained from a third-party market research provider. Walgreens has occupied the Walgreens – Las Vegas Strip Property since 1999. |
| (2) | Information obtained from the underwritten rent roll. |
THE INFORMATION IN THIS STRUCTURAL AND COLLATERAL TERM SHEET IS NOT COMPLETE AND MAY BE AMENDED PRIOR TO THE TIME OF SALE. THIS TERM SHEET IS NOT AN OFFER TO SELL THESE SECURITIES AND IT IS NOT A SOLICITATION OF AN OFFER TO BUY THESE SECURITIES IN ANY JURISDICTION WHERE THE OFFER OR SALE IS NOT PERMITTED.
122
| Retail – Single Tenant | Loan #9 | Cut-off Date Balance: | | $27,700,000 |
| 3765 South Las Vegas Boulevard | Walgreens - Las Vegas Strip | Cut-off Date LTV: | | 72.9% |
| Las Vegas, NV 89109 | | U/W NCF DSCR: | | 1.69x |
| | | U/W NOI Debt Yield: | | 7.2% |
Underwritten Net Cash Flow. The following table presents certain information relating to the underwritten net cash flow at the Walgreens - Las Vegas Strip Property:
Cash Flow Analysis(1)
| | U/W | %(2) | U/W $ per SF |
| Rents in Place | $2,000,000 | 96.6% | $136.17 |
| Contractual Rent Steps(3) | 50,000 | 2.4 | 3.40 |
| Grossed Up Vacant Space | 0 | 0.0 | 0.00 |
| Gross Potential Rent | $2,050,000 | 99.1% | $139.57 |
| Other Income | 0 | 0.0 | 0.00 |
| Total Recoveries | 19,483 | 0.9 | 1.33 |
| Net Rental Income | $2,069,483 | 100.0% | $140.90 |
| (Vacancy & Credit Loss)(4) | (61,500) | (3.0) | (4.19) |
| Effective Gross Income | $2,007,983 | 97.0% | $136.71 |
| | | | |
| Real Estate Taxes | 0 | 0.0 | 0.00 |
| Insurance | 0 | 0.0 | 0.00 |
| Management Fee | 20,080 | 1.0 | 1.37 |
| Other Operating Expenses | 0 | 0.0 | 0.00 |
| Total Operating Expenses | $20,080 | 1.0% | $1.37 |
| | | | |
| Net Operating Income | $1,987,903 | 99.0% | $135.34 |
| Replacement Reserves | 1,469 | 0.1 | 0.10 |
| TI/LC | 0 | 0.0 | 0.00 |
| Net Cash Flow | $1,986,435 | 98.9% | $135.24 |
| | | | |
| NOI DSCR | 1.69x | | |
| NCF DSCR | 1.69x | | |
| NOI Debt Yield | 7.2% | | |
| NCF Debt Yield | 7.2% | | |
| (1) | Operating history is not available, as the borrower sponsor recently acquired the Walgreens - Las Vegas Strip Property in a sale-leaseback transaction. |
| (2) | Represents (i) percent of Net Rental Income for all revenue fields, (ii) percent of Gross Potential Rent for Vacancy & Credit Loss and (iii) percent of Effective Gross Income for all other fields. |
| (3) | Represents contractual straight line rent averaging through the loan term due to the investment grade credit of Walgreens (see “Major Tenants” table above). |
| (4) | The underwritten economic vacancy is 3.0%. The Walgreens - Las Vegas Strip Property was 100.0% occupied as of February 1, 2020. |
Appraisal.The appraiser concluded to an “as-is” appraised value of $38,000,000 as of November 21, 2019.
Environmental Matters. According to a Phase I environmental site assessment dated October 5, 2019 there was no evidence of any recognized environmental conditions at the Walgreens - Las Vegas Strip Property.
Market Overview and Competition.The Walgreens - Las Vegas Strip Property is located in Las Vegas, Nevada, along South Las Vegas Boulevard adjacent to New York New York, the Waldorf Astoria and Park MGM and approximately 0.3 miles north of the MGM Grand. According to the appraisal, pedestrian counts are estimated to be approximately 100,000 per day along Las Vegas Boulevard. The Walgreens - Las Vegas Strip Property is located approximately 1.5 miles east of Interstate 15 and 2.4 miles northwest of McCarran International Airport.
The Walgreens - Las Vegas Strip Property is situated across from The Park, a $100 million, 8-acre outdoor destination that includes restaurants, bars, live entertainment and retail attractions. Immediately adjacent to The Park is the Park Theater at Park MGM, which features 5,200 seats. The Park Theater can accommodate configurations for concerts, award shows, sports, and conventions. The Park connects The Strip to the 20,000 seat T-Mobile Arena, located approximately 0.4 miles east of the Walgreens - Las Vegas Strip Property. Built in April 2016, T-Mobile Arena is home to the National Hockey League’s (NHL) Vegas Golden Knights and hosts a variety of events including concerts, conventions, and sports tournaments. According to the appraisal, the T-Mobile Arena is the highest grossing arena in the world and hosts 100 to 150 events per year. In December 2019, a new pedestrian bridge, which stretches over Las Vegas Boulevard to connect the Park MGM and T-Mobile Arena to the Showcase Mal (0.1 miles south of Walgreens - Las Vegas Strip Property), opened to the public.
THE INFORMATION IN THIS STRUCTURAL AND COLLATERAL TERM SHEET IS NOT COMPLETE AND MAY BE AMENDED PRIOR TO THE TIME OF SALE. THIS TERM SHEET IS NOT AN OFFER TO SELL THESE SECURITIES AND IT IS NOT A SOLICITATION OF AN OFFER TO BUY THESE SECURITIES IN ANY JURISDICTION WHERE THE OFFER OR SALE IS NOT PERMITTED.
123
| Retail – Single Tenant | Loan #9 | Cut-off Date Balance: | | $27,700,000 |
| 3765 South Las Vegas Boulevard | Walgreens - Las Vegas Strip | Cut-off Date LTV: | | 72.9% |
| Las Vegas, NV 89109 | | U/W NCF DSCR: | | 1.69x |
| | | U/W NOI Debt Yield: | | 7.2% |
According to a third-party market research report, Las Vegas welcomed approximately 42.1 million visitors in 2018, with average per-trip visitor shopping expenses of $155. According to a third-party market research report, the estimated 2019 population within a three- and five-mile radius of the Walgreens - Las Vegas Strip Property was approximately 135,234, and 367,160, respectively; while the 2019 estimated average household income within the same radii was $52,239, and $63,185, respectively.
According to a third-party market research report, the Walgreens - Las Vegas Strip Property is situated within the Central East Las Vegas Retail submarket of the Las Vegas retail market. As of January 2020, the submarket reported a total inventory of approximately 15.5 million square feet with a 10.2% vacancy rate. Submarket vacancy has decreased from 13.9% in 2011 and has averaged 11.3% over the last nine years. The appraiser concluded to market rent for the Walgreens - Las Vegas Strip Property of $135.25 per square foot.
The following table presents certain information relating to the appraiser’s market rent conclusion for the Walgreens - Las Vegas Strip Property:
Market Rent Summary(1)
| | Retail Space |
| Market Rent (PSF) | $135.25 |
| Lease Term (Years) | 15 |
| Lease Type (Reimbursements) | Absolute Net |
| Rent Increase Projection | 5% every 5 years |
| (1) | Information obtained from the appraisal. |
The following table presents certain information relating to comparable leases to Walgreens - Las Vegas Strip Property:
Comparable Leases(1)
| Property Name/Location | Year Built/ Renovated | Total GLA (SF) | Distance from Subject | Lease Start Date | Lease Term | Annual Base Rent PSF | Lease Type |
Subject Property(2) 3765 South Las Vegas Boulevard Las Vegas, NV 89109 | 1999/NAP | 14,688 | NAP | Dec-2019 | 15.0 Yrs | $136.17 | NNN |
CVS Pharmacy 310 South Michigan Avenue Chicago, IL 60604 | 1923/2005 | 9,476 | 1,525 miles | Oct-2018 | 15.0 Yrs | $84.42 | NNN |
CVS/pharmacy 728 Ocean Drive Miami Beach, FL 33139 | 1953/2017 | 9,512 | 2,182 miles | June-2017 | 15.0 Yrs | $152.10 | NNN |
Proposed Walgreens 2417 South Las Vegas Boulevard Las Vegas, NV 89109 | 2009/NAP | 15,000 | 2.8 miles | Jan-2014 | 25.0 Yrs | $173.00 | NNN |
Walgreens 3717 South Las Vegas Boulevard Las Vegas, NV 89109 | 2012/NAP | 24,271 | 0.3 miles | Dec-2012 | 99.0 Yrs | $137.00 | NNN |
Walgreens–Palazzo–Sale 3339 Las Vegas Boulevard Las Vegas, NV 89109 | 2009/NAP | 23,600 | 1.3 miles | March-2009 | 40.0 Yrs | $126.00 | NNN |
| (1) | Information obtained from the appraisal |
| (2) | Information obtained from the underwritten rent roll. |
THE INFORMATION IN THIS STRUCTURAL AND COLLATERAL TERM SHEET IS NOT COMPLETE AND MAY BE AMENDED PRIOR TO THE TIME OF SALE. THIS TERM SHEET IS NOT AN OFFER TO SELL THESE SECURITIES AND IT IS NOT A SOLICITATION OF AN OFFER TO BUY THESE SECURITIES IN ANY JURISDICTION WHERE THE OFFER OR SALE IS NOT PERMITTED.
124
| Retail – Single Tenant | Loan #9 | Cut-off Date Balance: | | $27,700,000 |
| 3765 South Las Vegas Boulevard | Walgreens - Las Vegas Strip | Cut-off Date LTV: | | 72.9% |
| Las Vegas, NV 89109 | | U/W NCF DSCR: | | 1.69x |
| | | U/W NOI Debt Yield: | | 7.2% |
Escrows.
Real Estate Taxes – The Walgreens – Las Vegas Strip Mortgage Loan documents require ongoing monthly real estate tax reserves in an amount equal to one-twelfth of the real estate taxes that the lender estimates will be payable during the next 12 months upon: (i) Walgreens not being required to pay taxes directly under the lease; (ii) the Walgreens lease not being in full force and effect; (iii) Walgreens not paying taxes prior to interest or penalties being accrued; or (iv) a Cash Trap Event Period (as defined below).
Insurance – The Walgreens – Las Vegas Strip Mortgage Loan documents require ongoing monthly insurance reserves in an amount equal to one-twelfth of the insurance premiums that the lender estimates will be payable during the next 12 months upon: (i) Walgreens not being required to maintain insurance coverage and pay premiums (or self-insure) under the lease; (ii) the Walgreens lease not being in full force and effect; (iii) insurance coverage not being maintained and related premiums not being paid (or the tenant no longer being self-insured); or (iv) a Cash Trap Event Period. If Walgreens no longer maintains insurance coverage the Walgreens – Las Vegas Strip Mortgage Loan documents require ongoing monthly insurance reserves in an amount equal to one-twelfth of the insurance premiums that the lender estimates will be payable during the next 12 months upon: (i) an event of default; (ii) the borrower or borrower affiliate not providing the lender with evidence that the Walgreens – Las Vegas Strip Property’s insurance coverage is included in a blanket policy and such policy is in full force and effect and (iii) the borrower not paying all applicable insurance premiums or providing the lender with evidence of payment of insurance premiums/renewals within ten business days.
Replacement Reserves – The Walgreens – Las Vegas Strip Mortgage Loan documents require ongoing monthly replacement reserves in an amount that the lender estimates will be necessary for replacement upon: (i) an event of default; (ii) the lender reasonably determining that the Walgreens - Las Vegas Strip Property is not being properly maintained; or (ii) the Walgreens lease not being in full force and effect.
TI/LC Reserve – The Walgreens – Las Vegas Strip Mortgage Loan documents require ongoing monthly TI/LC reserves in an amount that the lender determines will be necessary for qualified leasing expenses upon: (i) an event of default; (ii) the lender reasonably determining that the Walgreens - Las Vegas Strip Property is not being properly maintained; (iii) the Walgreens lease not being in full force and effect; or (iv) a Tenant Trigger Event (as defined below).
Excess Cash Flow Reserve - Except upon the occurrence and continuance of a Cash Trap Event Period (as defined below), beginning on the payment date on July 11, 2027 and during the remainder of the loan term, the Walgreens - Las Vegas Strip Borrower is required to make monthly deposits in an amount equal to (i) Walgreens’ monthly rent payment, minus (ii) the scheduled monthly interest due under the Walgreens – Las Vegas Strip Mortgage Loan. The expected monthly excess cash flow reserve deposits from July 11, 2027 through January 11, 2030 total $2,385,618. Upon the cure of a Cash Trap Event Period, the Walgreens – Las Vegas Strip Borrower is required to deposit with the lender an amount equal to the excess cash flow reserve funds which were required to have been deposited but for the occurrence of such Cash Trap Event Period. The excess cash flow reserve funds will be held by the lender as additional collateral for the Walgreens - Las Vegas Strip Mortgage Loan and, provided no event of default exists, applied to the outstanding principal balance of the Walgreens – Las Vegas Strip Mortgage Loan on the Maturity Date.
Lockbox and Cash Management.The Walgreens - Las Vegas Strip Mortgage Loan is structured with a soft lockbox, which is already in place, and springing cash management. Prior to the occurrence of a Cash Trap Event Period, the Walgreens - Las Vegas Strip Mortgage Loan documents require that the Walgreens - Las Vegas Strip Borrower deposit all rents into the lockbox account within three business days of receipt and all funds in the lockbox account are required to be distributed to the Walgreens - Las Vegas Strip Borrower. During a Cash Trap Event Period, funds in the lockbox account are required to be swept to a lender-controlled cash management account and all excess funds are required to be swept to an excess cash flow subaccount controlled by the lender.
A “Cash Trap Event Period” will commence upon the earliest to occur of the following:
(i) an event of default under the Walgreens - Las Vegas Strip Mortgage Loan; or
(ii) a Tenant Trigger Event.
A Cash Trap Event Period will end upon the occurrence of:
| ● | with regard to clause (i) above, the cure of such event of default; or |
| ● | with regard to clause (ii) above, a Tenant Trigger Event Cure (as defined below). |
A “Tenant Trigger Event” will commence upon the earliest to occur of the following:
(i) Walgreens terminating its lease, ceasing to operate, or going dark for 30 consecutive days (unless resulting from a casualty);
(ii) Walgreens having its long-term debt rating downgraded below ‘BBB-’ (or its equivalent) by any rating agency (except due to the withdrawal of the long-term debt rating by any rating agency resulting from Walgreens ceasing to be a public company);
(iii) Walgreens becoming insolvent or filing for bankruptcy; or
(iv) the Walgreens - Las Vegas Strip Borrower entering into a material lease modification with Walgreens without lender consent.
A “Tenant Trigger Event Cure” will occur upon:
| ● | with regard to clause (i) above, the date upon which the lender is in receipt of an estoppel reasonably acceptable to the lender from one or more replacement tenants that certifies that (a) the lease with such replacement tenant is in full force and effect and the Walgreens – Las Vegas Strip Borrower is not in default, (b) all tenant improvements required to be completed by the |
THE INFORMATION IN THIS STRUCTURAL AND COLLATERAL TERM SHEET IS NOT COMPLETE AND MAY BE AMENDED PRIOR TO THE TIME OF SALE. THIS TERM SHEET IS NOT AN OFFER TO SELL THESE SECURITIES AND IT IS NOT A SOLICITATION OF AN OFFER TO BUY THESE SECURITIES IN ANY JURISDICTION WHERE THE OFFER OR SALE IS NOT PERMITTED.
125
| Retail – Single Tenant | Loan #9 | Cut-off Date Balance: | | $27,700,000 |
| 3765 South Las Vegas Boulevard | Walgreens - Las Vegas Strip | Cut-off Date LTV: | | 72.9% |
| Las Vegas, NV 89109 | | U/W NCF DSCR: | | 1.69x |
| | | U/W NOI Debt Yield: | | 7.2% |
| | | landlord have been substantially completed, (c) all conditions to such replacement tenant’s occupancy of the space have been satisfied, (d) such replacement tenant has commenced paying unabated rent, and (e) such replacement tenant is in actual occupancy; |
| ● | with regard to clause (ii) above, Walgreens rating being raised to ‘BBB-’ (or its equivalent) or better by any rating agency; and |
| ● | with regard to clause (iii) above, Walgreens no longer being insolvent or subject to any bankruptcy or insolvency proceedings. |
Property Management. The Walgreens - Las Vegas Strip Property is managed by Walgreens.
Right of First Refusal. Walgreens has a right of first refusal (“ROFR”) to purchase the Walgreens - Las Vegas Strip Property. The ROFR is not extinguished by a foreclosure of the Walgreens - Las Vegas Strip Property; however, the ROFR does not apply to foreclosure or deed in lieu thereof.
Partial Release. Not permitted.
Real Estate Substitution.Not permitted.
Ground Lease. None.
Terrorism Insurance.Subject to the suspension of such borrower insurance requirements and upon satisfaction of certain conditions outlined in the Walgreens - Las Vegas Strip Mortgage Loan documents, including but not limited to the Walgreens - Las Vegas Strip Borrower providing evidence to the lender that Walgreens has satisfied all insurance requirements under its lease and Walgreens maintaining an S&P rating of at least ‘BBB’, the Walgreens - Las Vegas Strip Mortgage Loan documents require that the “all risk” insurance policy required to be maintained by the borrower provide coverage for terrorism in an amount equal to the full replacement cost of the Walgreens - Las Vegas Strip Property and business interruption insurance covering no less than the 12-month period following the occurrence of a casualty event, together with a six-month extended period of indemnity.
THE INFORMATION IN THIS STRUCTURAL AND COLLATERAL TERM SHEET IS NOT COMPLETE AND MAY BE AMENDED PRIOR TO THE TIME OF SALE. THIS TERM SHEET IS NOT AN OFFER TO SELL THESE SECURITIES AND IT IS NOT A SOLICITATION OF AN OFFER TO BUY THESE SECURITIES IN ANY JURISDICTION WHERE THE OFFER OR SALE IS NOT PERMITTED.
126
(THIS PAGE INTENTIONALLY LEFT BLANK)
THE INFORMATION IN THIS STRUCTURAL AND COLLATERAL TERM SHEET IS NOT COMPLETE AND MAY BE AMENDED PRIOR TO THE TIME OF SALE. THIS TERM SHEET IS NOT AN OFFER TO SELL THESE SECURITIES AND IT IS NOT A SOLICITATION OF AN OFFER TO BUY THESE SECURITIES IN ANY JURISDICTION WHERE THE OFFER OR SALE IS NOT PERMITTED.
127
| Multifamily – Garden | Loan #10 | Cut-off Date Balance: | | $26,500,000 |
| 140 Pinehurst Drive | Highland Village Townhomes | Cut-off Date LTV: | | 62.5% |
| Pittsburgh, PA 15229 | | U/W NCF DSCR: | | 1.99x |
| | | U/W NOI Debt Yield: | | 8.1% |
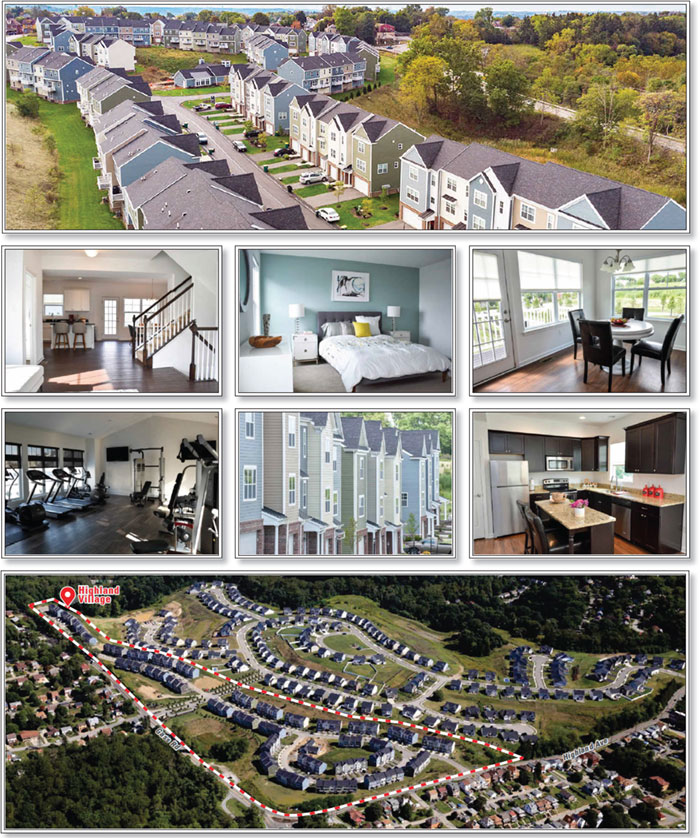
THE INFORMATION IN THIS STRUCTURAL AND COLLATERAL TERM SHEET IS NOT COMPLETE AND MAY BE AMENDED PRIOR TO THE TIME OF SALE. THIS TERM SHEET IS NOT AN OFFER TO SELL THESE SECURITIES AND IT IS NOT A SOLICITATION OF AN OFFER TO BUY THESE SECURITIES IN ANY JURISDICTION WHERE THE OFFER OR SALE IS NOT PERMITTED.
128
| Multifamily – Garden | Loan #10 | Cut-off Date Balance: | | $26,500,000 |
| 140 Pinehurst Drive | Highland Village Townhomes | Cut-off Date LTV: | | 62.5% |
| Pittsburgh, PA 15229 | | U/W NCF DSCR: | | 1.99x |
| | | U/W NOI Debt Yield: | | 8.1% |
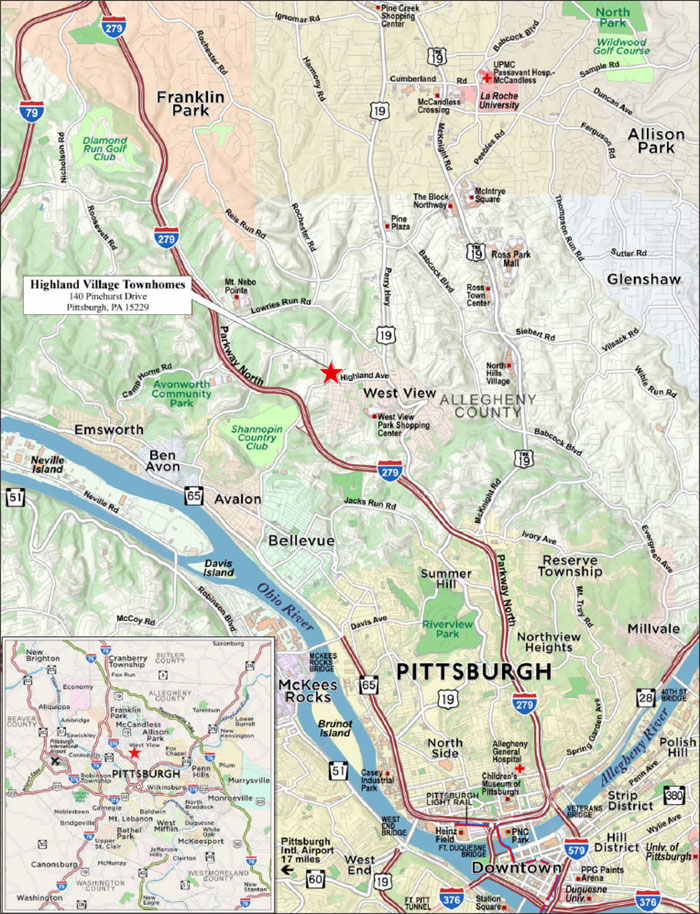
THE INFORMATION IN THIS STRUCTURAL AND COLLATERAL TERM SHEET IS NOT COMPLETE AND MAY BE AMENDED PRIOR TO THE TIME OF SALE. THIS TERM SHEET IS NOT AN OFFER TO SELL THESE SECURITIES AND IT IS NOT A SOLICITATION OF AN OFFER TO BUY THESE SECURITIES IN ANY JURISDICTION WHERE THE OFFER OR SALE IS NOT PERMITTED.
129
| No. 10 – Highland Village Townhomes |
| |
| Mortgage Loan Information | | Mortgaged Property Information |
| Mortgage Loan Seller: | Argentic Real Estate Finance LLC | | Single Asset/Portfolio: | Single Asset |
Credit Assessment (KBRA/Fitch/Moody’s): | NR/NR/NR | | Property Type – Subtype: | Multifamily – Garden |
| Original Principal Balance: | $26,500,000 | | Location: | Pittsburgh, PA |
| Cut-off Date Balance: | $26,500,000 | | Size: | 161 Units |
| % of Initial Pool Balance: | 2.8% | | Cut-off Date Balance Per Unit: | $164,596 |
| Loan Purpose: | Refinance | | Maturity Date Balance Per Unit: | $164,596 |
| Borrower Sponsors: | F. Daniel Caste; E. Martin Gillespie | | Year Built/Renovated: | 2016/NAP |
| Guarantors: | F. Daniel Caste; E. Martin Gillespie | | Title Vesting(1): | Both |
| Mortgage Rate: | 3.9200% | | Property Manager: | Walnut Capital Management, Inc. |
| Note Date: | December 27, 2019 | | Current Occupancy (As of): | 95.7% (1/23/2020) |
| Seasoning: | 1 month | | YE 2019 Occupancy(2): | 92.5% |
| Maturity Date: | January 6, 2030 | | YE 2018 Occupancy(3): | NAV |
| IO Period: | 120 months | | YE 2017 Occupancy(3): | NAV |
| Loan Term (Original): | 120 months | | YE 2016 Occupancy(3): | NAV |
| Amortization Term (Original): | NAP | | As-Is Appraised Value: | $42,400,000 |
| Loan Amortization Type: | Interest-only, Balloon | | As-Is Appraised Value Per Unit: | $263,354 |
| Call Protection: | L(25),D(91),O(4) | | As-Is Appraisal Valuation Date: | 10/23/2019 |
| Lockbox Type: | Soft/Springing Cash Management | | Underwriting and Financial Information |
| Additional Debt(4): | None | | TTM NOI (9/30/2019): | $1,619,679 |
| Additional Debt Type (Balance)(4): | NAP | | YE 2018 NOI(3): | NAV |
| | | | YE 2017 NOI(3): | NAV |
| | | | YE 2016 NOI(3): | NAV |
| | | | U/W Revenues: | $3,611,383 |
| | | | U/W Expenses: | $1,472,949 |
| Escrows and Reserves(5) | | U/W NOI: | $2,138,434 |
| | Initial | Monthly | Cap | | U/W NCF: | $2,098,184 |
| Taxes | $572,875 | $52,080 | NAP | | U/W DSCR based on NOI/NCF: | 2.02x / 1.99x |
| Insurance | $19,692 | $9,846 | NAP | | U/W Debt Yield based on NOI/NCF: | 8.1% / 7.9% |
| Replacement Reserve | $0 | $2,415 | NAP | | U/W Debt Yield at Maturity based on NOI/NCF: | 8.1% / 7.9% |
| Environmental Reserve | $10,750 | $0 | NAP | | Cut-off Date LTV Ratio: | 62.5% |
| Ground Rent Reserve(1) | $20,000 | $0 | NAP | | LTV Ratio at Maturity: | 62.5% |
| | | | | | | |
| | | | | | | | | |
| Sources and Uses |
| Sources | | | | | Uses | | | |
| Original loan amount | $26,500,000 | | 100.0% | | Loan payoff | $24,098,523 | | 90.9% |
| | | | | | Return of equity | 1,199,265 | | 4.5 |
| | | | | | Reserves | 623,318 | | 2.4 |
| | | | | | Closing costs | 578,895 | | 2.2 |
| Total Sources | $26,500,000 | | 100.0% | | Total Uses: | $26,500,000 | | 100.0% |
| (1) | Prior to origination, the borrower sponsors bifurcated the fee and leasehold interests in the Highland Village Townhomes Mortgage Loan (as defined below) pursuant to a ground lease under which a borrower affiliate, Limerick Land Partners, LP, is the related ground lessor and fee owner. Limerick Land Partners, LP is an additional mortgagor under the Highland Village Townhomes Mortgage Loan, which is secured by each of the related fee and leasehold interests in the Highland Village Townhomes Property (as defined below). Despite the Highland Village Townhomes Mortgage Loan being secured by both fee and leasehold interests, the lender escrowed $20,000 into the Ground Rent Reserve upfront which is equal to two months of ground rent under the ground lease. See “Ground Lease” section for a full description of the ground lease. |
| (2) | YE 2019 Occupancy is as of December 2, 2019. |
| (3) | Historical occupancies and cash flows are not available as the Highland Village Townhomes Property was built in phases between 2016 and 2019. |
| (4) | No future debt is allowed except for certain permitted member loans. See “Subordinate and Mezzanine Indebtedness” section for a description. |
| (5) | See “Escrows” section for a description of Escrows and Reserves. |
The Mortgage Loan. The tenth largest mortgage loan (the “Highland Village Townhomes Mortgage Loan”) is evidenced by one promissory note in the original principal balance of $26,500,000. The Highland Village Townhomes Mortgage Loan is secured by a first priority fee and leasehold mortgage encumbering a multifamily property located in Pittsburgh, Pennsylvania (the “Highland Village Townhomes Property”).
The Borrower and Borrower Sponsors.The borrower is Ross Highland Village, LLC (the “Highland Village Townhomes Borrower”), a Delaware limited liability company and single purpose entity with one independent director. Legal counsel to the Highland Village Townhomes Borrower delivered a non-consolidation opinion in connection with the origination of the Highland Village Townhomes Mortgage Loan. The borrower sponsors and non-recourse carveout guarantors are F. Daniel Caste (“Daniel Caste”) and E. Martin Gillespie (“Martin Gillespie”).
THE INFORMATION IN THIS STRUCTURAL AND COLLATERAL TERM SHEET IS NOT COMPLETE AND MAY BE AMENDED PRIOR TO THE TIME OF SALE. THIS TERM SHEET IS NOT AN OFFER TO SELL THESE SECURITIES AND IT IS NOT A SOLICITATION OF AN OFFER TO BUY THESE SECURITIES IN ANY JURISDICTION WHERE THE OFFER OR SALE IS NOT PERMITTED.
130
| Multifamily – Garden | Loan #10 | Cut-off Date Balance: | | $26,500,000 |
| 140 Pinehurst Drive | Highland Village Townhomes | Cut-off Date LTV: | | 62.5% |
| Pittsburgh, PA 15229 | | U/W NCF DSCR: | | 1.99x |
| | | U/W NOI Debt Yield: | | 8.1% |
Daniel Caste and Martin Gillespie are the principals of Laurel Communities, a developer of residential communities located in Pittsburgh, Pennsylvania. Laurel Communities has developed over 5,000 units in the greater Pittsburgh market. See “Description of the Mortgage Pool—Loan Purpose; Default History, Bankruptcy Issues and Other Proceedings” in the Preliminary Prospectus.
The Property.The Highland Village Townhomes Property is comprised of 33, three-story townhome apartment complexes totaling 161 units located in Pittsburgh, Pennsylvania, approximately 8.1 miles from downtown Pittsburgh. The Highland Village Townhomes Property was built in phases between 2016 and 2019 and is situated on 11.8 acres. The townhouses are grouped into clusters of three to five units per parcel. The Highland Village Townhomes Property features amenities such as a barbeque area, a community pool and a combination leasing office/clubhouse that includes a business center and full-service kitchen. The unit mix features 77, two-bedroom units and 84, three-bedroom units, comprising approximately 247,118 square feet with an average unit size of 1,535 square feet. Unit amenities include washer/dryer, stainless steel appliances, wood cabinets, walk-in closets and composite or carpeted floors. The buildings have a three-story design with a ground floor garage and utility area. Living areas are mostly located on floors 2 and 3. The Highland Village Townhomes Property contains approximately 322 garage parking spaces, reflecting an overall parking ratio of 2.00 spaces per unit.
The Highland Village Townhomes Property was previously a golf course that closed in 2011 and was subsequently developed by the borrower sponsors between April 2016 and November 2019. Since construction, an average of four units were delivered per month while an average of three units were leased per month. The online units were approximately 95% occupied from 2017 to 2019. As of January 23, 2020, the Highland Village Townhomes Property was 95.7% occupied, with an average in-place rent of $1,894 per unit.
The following table presents detailed information with respect to each of the units included at the Highland Village Townhomes Property:
Highland Village Townhomes Unit Mix(1)
| Unit Type | Total Units | Occupied
Units | % Occupied | Average SF per Unit | Total SF | Monthly Average Rent per Unit | Concluded Monthly Average Market Rent per Unit(2) |
| Two Bedrooms | 77 | 74 | 96.1% | 1,458 | 112,262 | $1,747 | $1,760 |
| Three Bedrooms | 84 | 80 | 95.2% | 1,605 | 134,856 | $2,030 | $2,000 |
| Total/Wtd. Avg. | 161 | 154 | 95.7% | 1,535 | 247,118 | $1,894 | - |
| (1) | Based on the underwritten rent roll dated January 23, 2020. |
The following table presents historical occupancy percentages at the Highland Village Townhomes Property:
Historical Occupancy
12/31/2016(1) | 12/31/2017(1) | 12/31/2018(1) | 12/2/2019(2) | 1/23/2020(3) |
| NAV | NAV | NAV | 92.5% | 95.7% |
| (1) | Historical occupancies are not available as the Highland Village Townhomes Property was built in phases between 2016 and 2019. |
| (2) | Information obtained from the borrower. |
| (3) | Information obtained from the underwritten rent roll dated January 23, 2020. |
THE INFORMATION IN THIS STRUCTURAL AND COLLATERAL TERM SHEET IS NOT COMPLETE AND MAY BE AMENDED PRIOR TO THE TIME OF SALE. THIS TERM SHEET IS NOT AN OFFER TO SELL THESE SECURITIES AND IT IS NOT A SOLICITATION OF AN OFFER TO BUY THESE SECURITIES IN ANY JURISDICTION WHERE THE OFFER OR SALE IS NOT PERMITTED.
131
| Multifamily – Garden | Loan #10 | Cut-off Date Balance: | | $26,500,000 |
| 140 Pinehurst Drive | Highland Village Townhomes | Cut-off Date LTV: | | 62.5% |
| Pittsburgh, PA 15229 | | U/W NCF DSCR: | | 1.99x |
| | | U/W NOI Debt Yield: | | 8.1% |
Operating History and Underwritten Net Cash Flow. The following table presents certain information relating to the operating history and underwritten net cash flow at the Highland Village Townhomes Property:
Cash Flow Analysis(1)
| | 9/30/2019
TTM | U/W | %(2) | U/W $ per
Unit |
| Gross Potential Rent | $2,787,356 | $3,659,580 | 95.6% | $22,730.31 |
| Other Income(3) | 45,998 | 45,998 | 1.2 | 285.70 |
| Recoveries | 99,105 | 123,950 | 3.2 | 769.88 |
| Net Rental Income | $2,932,459 | $3,829,528 | 100.0% | $23,785.89 |
| Concessions | (100) | (400) | (0.0) | (2.48) |
| (Vacancy & Credit Loss) | 0 | (217,745) | (6.0) | (1,352.45) |
| Effective Gross Income | $2,932,359 | $3,611,383 | 94.3% | $22,430.95 |
| | | | | |
| Real Estate Taxes | 490,421 | 624,955 | 17.3 | 3,881.71 |
| Insurance | 81,966 | 118,153 | 3.3 | 733.87 |
| Management Fee | 144,341 | 108,341 | 3.0 | 672.93 |
| Other Operating Expenses | 595,952 | 621,500 | 17.2 | 3,860.25 |
| Total Operating Expenses | $1,312,680 | $1,472,949 | 40.8% | $9,148.75 |
| | | | | |
| Net Operating Income | $1,619,679 | $2,138,434 | 59.2% | $13,282.20 |
| Replacement Reserves | 0 | 40,250 | 1.1 | 250.00 |
| TI/LC | 0 | 0 | 0.0 | 0.00 |
| Net Cash Flow | $ 1,619,679 | $2,098,184 | 58.1% | $13,032.20 |
| | | | | |
| NOI DSCR | 1.53x | 2.02x | | |
| NCF DSCR | 1.53x | 1.99x | | |
| NOI Debt Yield | 6.1% | 8.1% | | |
| NCF Debt Yield | 6.1% | 7.9% | | |
| (1) | Historical cash flows are not available as the Highland Village Townhomes Property was built in phases between 2016 and 2019. |
| (2) | Represents (i) percent of Net Rental Income for all revenue fields, (ii) percent of Gross Potential Rent for Vacancy & Credit Loss and (iii) percent of Effective Gross Income for all other fields. |
| (3) | Other Income includes pet rent and other miscellaneous revenues. |
Appraisal. The Highland Village Townhomes Property has an “as-is” appraised value of $42,400,000 as of October 23, 2019.
Environmental Matters. According to a Phase I environmental site assessment dated October 28, 2019, there was no evidence of any recognized environmental conditions at the Highland Village Townhomes Property; however, it did note that the Highland Village Townhomes Property is located in “Radon Zone 1”, an area with predicted average concentrations of radon in amounts equal to the EPA recommended action level. It also identified concentrations of radon in excess of recommended EPA action levels in two units located in two separate buildings at the Highland Village Townhomes Property. All of the units at the Highland Village Townhomes Property are currently equipped with passive radon venting systems. The Highland Village Townhomes Property Mortgage Loan documents require the Highland Village Townhomes Property Borrower to (i) perform long-term testing of certain other units in each of the buildings in which elevated concentrations of radon were identified and (ii) convert the passive radon venting systems to active systems for any units for which radon levels exceed applicable environmental action levels. At origination, the Highland Village Townhomes Borrower reserved $10,750, representing approximately 125% of the estimated cost to perform such further environmental testing and remediation. See “—Description of the Mortgage Pool—Mortgage Pool Characteristics—Environmental Considerations” in the Preliminary Prospectus for additional information.
Market Overview and Competition.The Highland Village Townhomes Property is located in Ross Township within Pittsburgh's North Hills area. Overall, the neighborhood is a mature, residential commuting suburb of Pittsburgh proximate to Interstate 279. Interstate 279 provides access to downtown Pittsburgh (approximately 15 minutes by car) and the suburbs of North Hills and also links to Interstate 79 and 376. According to the appraisal, the immediate area is fully developed with limited vacant land available.
Top employers in the Pittsburgh metro area include UPMC Health System, Highmark Inc., University of Pittsburgh, The PNC Financial Services Group Inc., and Wal-Mart Stores Inc. According to the appraisal, the estimated 2019 population within a one-, three-, and five-mile radius of the Highland Village Townhomes Property was 9,492, 70,969, and 182,761, respectively. According to the appraisal, the estimated 2019 average household income within a one-, three-, and five-mile radius of the Highland Village Townhomes Property was $86,989, $83,878, and $84,226, respectively.
THE INFORMATION IN THIS STRUCTURAL AND COLLATERAL TERM SHEET IS NOT COMPLETE AND MAY BE AMENDED PRIOR TO THE TIME OF SALE. THIS TERM SHEET IS NOT AN OFFER TO SELL THESE SECURITIES AND IT IS NOT A SOLICITATION OF AN OFFER TO BUY THESE SECURITIES IN ANY JURISDICTION WHERE THE OFFER OR SALE IS NOT PERMITTED.
132
| Multifamily – Garden | Loan #10 | Cut-off Date Balance: | | $26,500,000 |
| 140 Pinehurst Drive | Highland Village Townhomes | Cut-off Date LTV: | | 62.5% |
| Pittsburgh, PA 15229 | | U/W NCF DSCR: | | 1.99x |
| | | U/W NOI Debt Yield: | | 8.1% |
The Highland Village Townhomes Property is located within the North multifamily submarket. According to the appraisal, as of the second quarter of 2019, the North submarket had an inventory of approximately 19,035 units, vacancy of approximately 6.0%, and average asking rents of $1,132 per unit. The vacancy rate has decreased from 6.4% in 2018. Comparable projects identified by the appraisal were constructed between 2008 and 2018 and individual unit sizes range from 713 to 1,600 square feet. The comparable apartment projects revealed occupancy levels ranging from 81.6% to 98.6%, with an average of 93.4%.
The following table presents certain information relating to comparable rental properties to the Highland Village Townhomes Property:
Comparable Rental Properties
| Property | Year Built | Distance to Subject (miles) | Occupancy % | Number of Units | Average Rent per SF (Two Bedroom) | Average Rent per Month (Two Bedroom) | Average Rent per SF (Three Bedroom) | Average Rent per Month (Three Bedroom) |
| Highland Village Townhomes | 2016 | - | 95.7% | 161 | $1.20 | $1,747 | $1.26 | $2,030 |
| Cosmopolitan Apartments | 2017 | 4.4 | 93.3% | 149 | $1.52 | $1,633 | NAP | NAP |
| Crossings of Wexford | 2008 | 9.7 | 98.2% | 56 | $1.10 | $1,755 | $1.00 | $2,002 |
| Ascent 430 | 2015 | 11.7 | 93.7% | 319 | $1.41 | $1,672 | $1.39 | $2,032 |
| The Haven at Cranberry Woods | 2014 | 14.3 | 95.0% | 302 | $1.52 | $1,634 | $1.22 | $2,139 |
| The Pendleton at Cranberry | 2018 | 14.5 | 81.6% | 320 | $1.64 | $1,857 | $1.50 | $2,494 |
| Kennedy Highlands | 2017 | 8.4 | 98.6% | 288 | $1.44 | $1,482 | $0.99 | $1,670 |
| | | | | | | | | | | | |
Source:Appraisal and underwritten rent roll dated January 23, 2020.
Escrows.
Real Estate Taxes – The Highland Village Townhomes Mortgage Loan documents require an upfront real estate tax reserve of $572,875 and ongoing monthly real estate tax reserves in an amount equal to one-twelfth of the real estate taxes that the lender estimates will be payable during the next twelve months (initially $52,080).
Insurance – The Highland Village Townhomes Mortgage Loan documents require an upfront insurance reserve of $19,692 and ongoing monthly insurance reserves in an amount equal to one-twelfth of the insurance premiums that the lender estimates will be payable for the renewal of the coverage during the next twelve months (initially $9,846).
Replacement Reserve – The Highland Village Townhomes Mortgage Loan documents require an ongoing monthly replacement reserve of $2,415.
Environment Reserve – The Highland Village Townhomes Borrower deposited an upfront reserve of $10,750 for certain immediate repairs of the Highland Village Townhomes Property.
Ground Rent Reserve – The Highland Village Townhomes Mortgage Loan documents require an upfront ground rent reserve of $20,000, which is equal to two months of ground rent under the ground lease.
Lockbox and Cash Management. The Highland Village Townhomes Mortgage Loan is structured with a soft lockbox, which is already in place, and springing cash management. Prior to the occurrence of a Cash Management Period (as defined below), the Highland Village Townhomes Mortgage Loan documents require that the Highland Village Townhomes Borrower or the property manager deposit all rents into the lockbox account within one business day of receipt and all funds in the lockbox account are required to be distributed to the Highland Village Townhomes Borrower. During a Cash Management Period, funds in the lockbox account are required to be swept to a lender-controlled cash management account and all excess funds are required to be swept to an excess cash flow subaccount controlled by the lender.
A “Cash Management Period” will commence upon the earlier of the following:
| (i) | the occurrence and continuance of an event of default; or |
| (ii) | the net cash flow debt service coverage ratio falling below 1.15x at the end of any calendar quarter. |
A Cash Management Period will end upon the occurrence of the following:
| ● | with regard to clause (i), the cure of such event of default; or |
| ● | with regard to clause (ii), the net cash flow debt service coverage ratio being equal to or greater than 1.20x for two consecutive calendar quarters. |
Property Management. Highland Village Townhomes Property is managed by Walnut Capital Management, Inc. which manages approximately 2,500 residential units, 350,000 square feet of retail space and 500,000 square feet of office space all located in the Pittsburgh area.
THE INFORMATION IN THIS STRUCTURAL AND COLLATERAL TERM SHEET IS NOT COMPLETE AND MAY BE AMENDED PRIOR TO THE TIME OF SALE. THIS TERM SHEET IS NOT AN OFFER TO SELL THESE SECURITIES AND IT IS NOT A SOLICITATION OF AN OFFER TO BUY THESE SECURITIES IN ANY JURISDICTION WHERE THE OFFER OR SALE IS NOT PERMITTED.
133
| Multifamily – Garden | Loan #10 | Cut-off Date Balance: | | $26,500,000 |
| 140 Pinehurst Drive | Highland Village Townhomes | Cut-off Date LTV: | | 62.5% |
| Pittsburgh, PA 15229 | | U/W NCF DSCR: | | 1.99x |
| | | U/W NOI Debt Yield: | | 8.1% |
Partial Release.Not permitted.
Real Estate Substitution.Not permitted.
Subordinate and Mezzanine Indebtedness.Not permitted other than the Highland Village Townhomes Borrower is permitted to incur certain “Permitted Member Loans” under the Highland Village Townhomes Mortgage Loan documents, provided that any such loans are,inter alia, unsecured, fully subordinate to the Highland Village Townhomes Mortgage Loan, entered into without recourse to the Highland Village Townhomes Borrower or any other party and do not, in the aggregate, exceed an amount equal to 2% of the outstanding principal balance of the debt.
Ground Lease. Prior to origination, the borrower sponsors bifurcated the fee and leasehold interests in the Highland Village Townhomes Mortgage Loan pursuant to a ground lease under which a borrower affiliate, Limerick Land Partners, LP, is the related ground lessor and fee owner (the “Ground Lessor”) and the Highland Village Townhomes Borrower is the ground lessee (the “Ground Lessee”). Limerick Land Partners, LP is an additional mortgagor under the Highland Village Townhomes Mortgage Loan, which is secured by each of the related fee and leasehold interests in the Highland Village Townhomes Property. The ground lease matures on September 30, 2049 with no renewal options. The Highland Village Townhomes Mortgage Loan was structured with a fee accommodation mortgage granted by both the Ground Lessee and Ground Lessor, whereby the lender will have the right, in an event of default, to foreclose on either or both of the fee interest and/or the leasehold interest, which will enable the lender to realize upon both the ground rents paid by the Ground Lessee and the sub-rents paid by the residential tenants at the Highland Village Townhomes Property to the Highland Village Townhomes Borrower. Notwithstanding the foregoing, at origination, the lender received an estoppel and agreement from the Ground Lessor confirming,inter alia, that (i) the lender will be entitled to receive notices of any defaults thereunder and will have customary opportunities to cure any such defaults (and will waive non-curable defaults); (ii) the lender will be permitted, at its option, to enter into a new ground lease in the event the existing ground lease is terminated for any reason or if the ground lease is rejected in a bankruptcy proceeding; (iii) such ground lease cannot be amended, supplemented, terminated, canceled or otherwise modified without the prior written consent of the lender; and (iv) other customary terms and provisions which are typically in CMBS ground lease financings. Additionally, the Highland Village Townhomes Mortgage Loan documents (including the fee accommodation mortgage executed by the Ground Lessor) include a negative pledge and restriction against the Ground Lessor transferring, encumbering, assigning or otherwise conveying any interest in the fee estate. The Highland Village Townhomes Mortgage Loan is full recourse to the borrower sponsors for any amendment, modification termination, cancellation, or acceptance of a surrender of, or the waiver of any of the material terms or provisions of, the ground lease, in each case in violation of the terms and conditions of the ground lease and/or default by the Highland Village Townhomes Borrower under the ground lease beyond any applicable notice and/or cure period. Given the structure above, the lender did not underwrite the ground rent which is $10,000 per month.
Terrorism Insurance. The Highland Village Townhomes Mortgage Loan documents require that the “all risk” insurance policy required to be maintained by Highland Village Townhomes Borrower provide coverage for terrorism in an amount equal to the full replacement cost of the Highland Village Townhomes Property, as well as business interruption insurance covering no less than the 18-month period following the occurrence of a casualty event, together with a six-month extended period of indemnity.
THE INFORMATION IN THIS STRUCTURAL AND COLLATERAL TERM SHEET IS NOT COMPLETE AND MAY BE AMENDED PRIOR TO THE TIME OF SALE. THIS TERM SHEET IS NOT AN OFFER TO SELL THESE SECURITIES AND IT IS NOT A SOLICITATION OF AN OFFER TO BUY THESE SECURITIES IN ANY JURISDICTION WHERE THE OFFER OR SALE IS NOT PERMITTED.
134
(THIS PAGE INTENTIONALLY LEFT BLANK)
THE INFORMATION IN THIS STRUCTURAL AND COLLATERAL TERM SHEET IS NOT COMPLETE AND MAY BE AMENDED PRIOR TO THE TIME OF SALE. THIS TERM SHEET IS NOT AN OFFER TO SELL THESE SECURITIES AND IT IS NOT A SOLICITATION OF AN OFFER TO BUY THESE SECURITIES IN ANY JURISDICTION WHERE THE OFFER OR SALE IS NOT PERMITTED.
135
| No. 11 – Vernon Tower |
| |
| Mortgage Loan Information | | Mortgaged Property Information |
| Mortgage Loan Seller(1): | RREF | | Single Asset/Portfolio: | Single Asset |
Credit Assessment (KBRA/Fitch/Moody’s): | NR/NR/NR | | Property Type – Subtype: | Multifamily – Mid Rise |
| Original Principal Balance(2): | $26,450,000 | | Location: | Astoria, NY |
| Cut-off Date Balance(2): | $26,450,000 | | Size: | 103 Units |
| % of Initial Pool Balance: | 2.7% | | Cut-off Date Balance Per Unit(2): | $419,903 |
| Loan Purpose: | Refinance | | Maturity Date Balance Per Unit(2): | $419,903 |
| Borrower Sponsors: | Mikhael Heletz; Evelyn Kenigsberg; Jacob Kenigsberg | | Year Built/Renovated: | 2015/NAP |
| Guarantors: | Mikhael Heletz; Evelyn Kenigsberg; Jacob Kenigsberg | | Title Vesting: | Fee |
| Mortgage Rate: | 4.0700% | | Property Manager: | Quantum Property Management, LTD. |
| Note Date: | December 4, 2019 | | Current Occupancy (As of): | 96.1% (11/15/2019) |
| Seasoning: | 2 months | | YE 2018 Occupancy(3): | NAV |
| Maturity Date: | December 6, 2029 | | YE 2017 Occupancy(3): | NAV |
| IO Period: | 120 months | | YE 2016 Occupancy(3): | NAV |
| Loan Term (Original): | 120 months | | YE 2015 Occupancy(3): | NAV |
| Amortization Term (Original): | NAP | | As-Is Appraised Value: | $70,100,000 |
| Loan Amortization Type: | Interest-only, Balloon | | As-Is Appraised Value Per Unit: | $680,583 |
| Call Protection(5): | L(26),D(90),O(4) | | As-Is Appraisal Valuation Date: | November 6, 2019 |
| Lockbox Type(4): | Springing | | Underwriting and Financial Information |
| Additional Debt(2): | Yes | | TTM NOI (10/31/2019): | $1,241,135 |
| Additional Debt Type (Balance)(2): | Pari Passu($16,800,000) | | YE 2018 NOI(3): | NAV |
| | | | YE 2017 NOI(3): | NAV |
| | | | YE 2016 NOI(3): | NAV |
| | | | U/W Revenues: | $3,827,249 |
| | | | U/W Expenses: | $624,852 |
| Escrows and Reserves | | U/W NOI: | $3,202,397 |
| | Initial | Monthly | Cap | | U/W NCF: | $3,170,817 |
| Taxes | $2,858 | $2,858 | NAP | | U/W DSCR based on NOI/NCF(2): | 1.79x / 1.77x |
| Insurance | $12,593 | $6,296 | NAP | | U/W Debt Yield based on NOI/NCF(2): | 7.4% / 7.3% |
| TI/LC Reserve | $150,000 | $459 | NAP | | U/W Debt Yield at Maturity based on NOI/NCF(2): | 7.4% / 7.3% |
| Replacement Reserve | $0 | $2,173 | NAP | | Cut-off Date LTV Ratio(2): | 61.7% |
| | | | | | LTV Ratio at Maturity(2): | 61.7% |
| | | | | | | |
| | | | | | | | |
| Sources and Uses |
| Sources | | | | | Uses | | | |
| Original whole loan amount | $43,250,000 | | 100.0% | | Loan payoff | $38,904,722 | | 90.0% |
| | | | | | Upfront reserves | 165,450 | | 0.4 |
| | | | | | Closing costs | 355,223 | | 0.8 |
| | | | | | Return of equity | 3,824,605 | | 8.8 |
| Total Sources | $43,250,000 | | 100.0% | | Total Uses | $43,250,000 | | 100.0% |
| (1) | The Vernon Tower Whole Loan (as defined below) was originated by BSPRT CMBS Finance, LLC and acquired by RREF, which has re-underwritten such whole loan in accordance with the procedures described under“Transaction Parties—The Sponsors and Mortgage Loan Sellers—Rialto Real Estate Fund IV – Debt, LP”in the Preliminary Prospectus. |
| (2) | All statistical information related to the Cut-off Date Balance Per Unit, Maturity Date Balance Per Unit, U/W DSCR based on NOI/NCF, U/W Debt Yield based on NOI/NCF, U/W Debt Yield at Maturity based on NOI/NCF, Cut-off Date LTV Ratio and LTV Ratio at Maturity numbers presented above are based on the Vernon Tower Whole Loan (as defined below). |
| (3) | The borrower sponsors began construction on the Vernon Tower Property in 2015 and did not receive final certificate of occupancy until August 2019. Accordingly, historical occupancy and financial information is not available. |
| (4) | The Vernon Tower Whole Loan (as defined below) is structured with springing cash management which would be triggered upon (i) an event of default or (ii) if the net cash flow debt service coverage ratio is less than 1.30x at the end of any calendar quarter. |
| (5) | Defeasance of the Vernon Tower Whole Loan is permitted at any time after the end of the two-year period commencing on the closing date of the securitization of the last Vernon Tower Whole Loan promissory note to be securitized. The assumed defeasance lockout period of 26 payments is based on the expected closing date of this transaction in February 2020. |
THE INFORMATION IN THIS STRUCTURAL AND COLLATERAL TERM SHEET IS NOT COMPLETE AND MAY BE AMENDED PRIOR TO THE TIME OF SALE. THIS TERM SHEET IS NOT AN OFFER TO SELL THESE SECURITIES AND IT IS NOT A SOLICITATION OF AN OFFER TO BUY THESE SECURITIES IN ANY JURISDICTION WHERE THE OFFER OR SALE IS NOT PERMITTED.
136
| Multifamily – Mid Rise | Loan #11 | Cut-off Date Balance: | | $26,450,000 |
| 31-43 Vernon Boulevard | Vernon Tower | Cut-off Date LTV: | | 61.7% |
| Astoria, NY 11106 | | U/W NCF DSCR: | | 1.77x |
| | | U/W NOI Debt Yield: | | 7.4% |
The Mortgage Loan. The mortgage loan (the “Vernon Tower Mortgage Loan”) is part of a whole loan (“the Vernon Tower Whole Loan”) in the original principal balance of $43,250,000. The Vernon Tower Whole Loan is secured by a first priority mortgage encumbering the fee interest in a multifamily property located in Astoria, New York (the “Vernon Tower Property”). The Vernon Tower Whole Loan consists of two notes totaling $43,250,000, which arepari passu with each other. The Vernon Tower Mortgage Loan represents the controlling Note A-1, which has an original principal balance of $26,450,000. The Vernon Tower Whole Loan is serviced pursuant to the pooling and servicing agreement for the WFCM 2020-C55 securitization. See “Description of the Mortgage Pool—The Whole Loans—The Serviced Pari Passu Whole Loans” in the Preliminary Prospectus.
Vernon Tower Whole Loan Summary
| Notes | Original
Balance | Cut-off Date
Balance | Note Holder | Controlling
Piece |
| A-1 | $26,450,000 | $26,450,000 | WFCM 2020-C55 | Yes |
| A-2 | $16,800,000 | $16,800,000 | An affiliate of RREF | No |
| Total | $43,250,000 | $43,250,000 | | |
The Property.The Vernon Tower Property is a 103-unit mid rise style multifamily property located in Astoria, New York. Constructed in 2015 and situated on a 0.4-acre site, the Vernon Tower Property consists of one building comprising 16 studio units, 50 one-bedroom units, and 37 two-bedroom units. The Vernon Tower Property includes a parking garage with valet parking for 47 spaces, resulting in a parking ratio of approximately 0.4 spaces per unit. As of November 15, 2019, the Vernon Tower Property was 96.1% occupied.
Common area amenities include a fitness center, a landscaped green roof deck, a doorman, bicycle storage and a club room with a ping pong table. Unit amenities include floor-to-ceiling windows, granite countertops and in-unit washer and dryers. Some units have outdoor spaces, including terraces and private duplex rooftops.
The borrower sponsors purchased two adjacent parcels that make up the site on which the Vernon Tower Property is located for $6,930,000 in November 2013 and January 2014. The site, which was formerly an industrial building, was subsequently demolished. The borrower sponsors began construction in 2015 and spent approximately $25,940,740 in hard costs and $13,016,630 in soft costs. The Vernon Tower Property received a temporary certificate of occupancy in November 2018 and received a final certificate of occupancy in August 2019. The Vernon Tower Property achieved 95% occupancy in September 2019.
The Vernon Tower Property has 2,200 square feet of commercial space leased to M.A. Loft II LLC (“Marie Antoinette Events”) pursuant to a five-year lease, which commenced on November 12, 2019. Marie Antoinette Events will begin paying rent on February 1, 2020. The initial base rent is $120,000per annum ($55 PSF), subject to 3% annual rent increases. The borrower sponsors provided the tenant with a $150,000 tenant improvement package, which was reserved at origination of the Vernon Tower Whole Loan.
The Vernon Tower Property benefits from a 25-year 421-a tax abatement, which commenced in 2018. During the term of the tax abatement, all units at the Vernon Tower Property are subject to rent stabilization laws. After the tax abatement expires, the 82 market-rate units will become free market (i.e., no longer subject to rent stabilization), and the 21 affordable housing units will remain subject to rent stabilization laws indefinitely.
The following table presents certain information relating to the unit mix of the Vernon Tower Property:
Unit Mix Summary(1)
| Unit Type | Total
No. of
Units | % of
Total
Units | Average
Unit Size
(SF) | Average Underwritten
Monthly Rent per Unit (Market Rent) | Average
Underwritten
Monthly Rent per Unit (Regulated) |
| Studio | 16 | 15.5% | 476 | $2,363 | $867 |
| One-Bedroom | 50 | 48.5% | 656 | $3,072 | $931 |
| Two-Bedroom | 37 | 35.9% | 974 | $4,366 | $1,123 |
| Total/Weighted Average | 103 | 100.0% | 742 | $3,400 | $1,016 |
| (1) | Information obtained from the appraisal. |
The following table presents historical occupancy percentages at the Vernon Tower Property:
Historical Occupancy
12/31/2015(1) | 12/31/2016(1) | 12/31/2017(1) | 12/31/2018(1) | 11/15/2019(2) |
| NAV | NAV | NAV | NAV | 96.1% |
| (1) | Borrower sponsors began construction on the Vernon Tower Property in 2015 and did not receive final certificate of occupancy until August 2019. Accordingly, historical occupancy is not available. |
| (2) | Information obtained from the underwritten rent roll. |
THE INFORMATION IN THIS STRUCTURAL AND COLLATERAL TERM SHEET IS NOT COMPLETE AND MAY BE AMENDED PRIOR TO THE TIME OF SALE. THIS TERM SHEET IS NOT AN OFFER TO SELL THESE SECURITIES AND IT IS NOT A SOLICITATION OF AN OFFER TO BUY THESE SECURITIES IN ANY JURISDICTION WHERE THE OFFER OR SALE IS NOT PERMITTED.
137
| Multifamily – Mid Rise | Loan #11 | Cut-off Date Balance: | | $26,450,000 |
| 31-43 Vernon Boulevard | Vernon Tower | Cut-off Date LTV: | | 61.7% |
| Astoria, NY 11106 | | U/W NCF DSCR: | | 1.77x |
| | | U/W NOI Debt Yield: | | 7.4% |
Operating History and Underwritten Net Cash Flow. The following table presents certain information relating to the historical operating performance and underwritten net cash flow at the Vernon Tower Property:
Cash Flow Analysis(1)
| | TTM
10/31/2019 | U/W | %(2) | U/W $
per Unit |
| Base Rent | $1,868,329 | $3,617,303 | 88.9% | $35,119 |
| Commercial Rent | 0 | 120,000 | 2.9 | 1,165 |
| Gross Potential Rent | $1,868,329 | $3,737,303 | 91.8% | $36,284 |
| Other Income(3) | 53,688 | 332,040 | 8.2 | 3,224 |
| Net Rental Income | $1,922,017 | $4,069,343 | 100.0% | $39,508 |
| (Vacancy) | 0 | (242,094) | (6.5) | (2,350) |
| (Concessions & Credit Loss) | (177,650) | 0 | 0 | 0 |
| Effective Gross Income | $1,744,367 | $3,827,249 | 94.1% | $37,158 |
| | | | | |
| Real Estate Taxes(4) | 7,077 | 34,291 | 0.9 | 333 |
| Insurance | 10,614 | 75,556 | 2.0 | 734 |
| Management Fee | 0 | 114,817 | 3.0 | 1,115 |
| Other Operating Expenses | 485,541 | 400,188 | 10.5 | 3,885 |
| Total Operating Expenses | $503,232 | $624,852 | 16.3% | $6,067 |
| | | | | |
| Net Operating Income | $1,241,135 | $3,202,397 | 83.7% | $31,091 |
| Replacement Reserves | 0 | 26,080 | 0.7 | 253 |
| TI/LC | 0 | 5,500 | 0.1 | 53 |
| Net Cash Flow | $1,241,135 | $3,170,817 | 82.8% | $30,785 |
| | | | | |
| NOI DSCR(5) | 0.69x | 1.79x | | |
| NCF DSCR(5) | 0.69x | 1.77x | | |
| NOI Debt Yield(5) | 2.9% | 7.4% | | |
| NCF Debt Yield(5) | 2.9% | 7.3% | | |
| (1) | Historical operating statements prior to 2019 are not available, as the Vernon Tower Property was not open for occupancy until 2019. |
| (2) | Represents (i) percent of Net Rental Income for all revenue fields, (ii) percent of Gross Potential Rent for Vacancy and Concessions & Credit Loss and (iii) percent of Effective Gross Income for all other fields. |
| (3) | Other Income primarily includes utility charges and other miscellaneous income generated from late fees, keys, security deposits, vending machine income, credit checks, and application fees. |
| (4) | The Vernon Tower Property benefits from a 25-year 421-a tax abatement, which commenced in 2018. During the exemption period, all units at the Vernon Tower Property are subject to rent stabilization laws. After the abatement expires, the 82 market rate units will become free-market (no longer subject to rent stabilization), however, the 21 affordable housing units will remain subject to rent stabilization laws indefinitely. |
| (5) | All statistical information related to the Cut-off Date Balance Per Unit, Maturity Date Balance Per Unit, U/W DSCR based on NOI/NCF, U/W Debt Yield based on NOI/NCF, U/W Debt Yield at Maturity based on NOI/NCF, Cut-off Date LTV Ratio and LTV Ratio at Maturity numbers presented above are based on the Vernon Tower Whole Loan. |
Market Overview and Competition.The Vernon Tower Property is located in Astoria, New York which is across the East River from Manhattan, New York, 4.6 miles from Midtown Manhattan, New York and 7.4 miles from Brooklyn, New York.
According to a third party market report, the estimated 2019 population within a three- and five-mile radius of the Vernon Tower Property was 1,269,301 and 3,225,647, respectively, and the estimated 2019 median household income within the same radii was $81,900 and $66,601, respectively.
Submarket Information – According to a third party market research report, the Vernon Tower Property is situated within the Queens County submarket. As of the third quarter of 2019, the submarket reported a total inventory of 36,065 units with a 4.9% vacancy rate and an average asking rental rate of $2,613 per month.
Appraiser’s Competitive Set – The appraiser identified nine primary competitive properties for the Vernon Tower Property. The appraiser concluded to monthly market rents per unit ranging from $2,000 to $5,699.
The following table presents certain information relating to comparable multifamily properties for the Vernon Tower Property:
THE INFORMATION IN THIS STRUCTURAL AND COLLATERAL TERM SHEET IS NOT COMPLETE AND MAY BE AMENDED PRIOR TO THE TIME OF SALE. THIS TERM SHEET IS NOT AN OFFER TO SELL THESE SECURITIES AND IT IS NOT A SOLICITATION OF AN OFFER TO BUY THESE SECURITIES IN ANY JURISDICTION WHERE THE OFFER OR SALE IS NOT PERMITTED.
138
| Multifamily – Mid Rise | Loan #11 | Cut-off Date Balance: | | $26,450,000 |
| 31-43 Vernon Boulevard | Vernon Tower | Cut-off Date LTV: | | 61.7% |
| Astoria, NY 11106 | | U/W NCF DSCR: | | 1.77x |
| | | U/W NOI Debt Yield: | | 7.4% |
Competitive Set(1)
| | Vernon
Tower
(Subject) | Crescent Club | QPS Tower | The Pillar | The Forge | Watermark LIC | Newton21 | Aurora | 1401 Broadway | Hallet’s Point |
| Location | Astoria, NY | Long Island City, NY | Long Island City, NY | Astoria, NY | Long Island City, NY | Long Island City, NY | Astoria, NY | Long Island City, NY | Astoria, NY | Astoria, NY |
| Distance to Subject | -- | 1.4 miles | 1.5 miles | 0.7 miles | 1.8 miles | 1.9 miles | 0.6 miles | 1.7 miles | 0.3 miles | 1.3 miles |
| Year Built | 2015 | 2012 | 2017 | 2015 | 2017 | 2017 | 2019 | 2016 | 2018 | 2017 |
| Number of Units | 103 | 130 | 391 | 79 | 272 | 134 | 49 | 132 | 80 | 406 |
| Average Monthly Rent (per unit) | | | | | | | | | | |
| Studio | $867-$2,363 | $2,566 | $2,999 | $2,000 | $2,527 | $2,529 | NAV | NAV | NAV | $2,995 |
| One- Bedroom | $931-$3,071 | NAV | $3,295 | $2,850 | $3,977 | $4,226 | $2,566 | $3,225 | $2,950 | $3,425 |
| Two- Bedroom | $1,123-$4,366 | $4,766 | $5,478 | NAV | $5,495 | $5,350 | $3,391 | $5,699 | $3,969 | $4,485 |
| (1) | Information obtained from the appraisal and underwritten rent roll. |
THE INFORMATION IN THIS STRUCTURAL AND COLLATERAL TERM SHEET IS NOT COMPLETE AND MAY BE AMENDED PRIOR TO THE TIME OF SALE. THIS TERM SHEET IS NOT AN OFFER TO SELL THESE SECURITIES AND IT IS NOT A SOLICITATION OF AN OFFER TO BUY THESE SECURITIES IN ANY JURISDICTION WHERE THE OFFER OR SALE IS NOT PERMITTED.
139
| No. 12 – Exchange on Erwin |
| |
| Mortgage Loan Information | | Mortgaged Property Information |
| Mortgage Loan Seller: | Barclays Capital Real Estate Inc. | | Single Asset/Portfolio: | Single Asset |
Credit Assessment (/KBRA/Fitch/Moody’s): | NR/NR/NR | | Property Type – Subtype(4): | Mixed Use – Multifamily/Office/Retail |
| Original Principal Balance(1): | $25,450,000 | | Location: | Durham, NC |
| Cut-off Date Balance(1): | $25,450,000 | | Size: | 316,061 SF |
| % of Initial Pool Balance: | 2.6% | | Cut-off Date Balance Per SF(1)(8): | $238.72 |
| Loan Purpose: | Acquisition | | Maturity Date Balance Per SF(1)(8): | $238.72 |
| Borrower Sponsor: | Starwood REIT Operating Partnership, L.P. | | Year Built/Renovated: | 2007, 2017-2018/NAP |
| Guarantor: | Starwood REIT Operating Partnership, L.P. | | Title Vesting: | Fee |
| Mortgage Rate: | 3.4210% | | Property Manager: | VPTC Management Partners, LLC; Highmark Residential, LLC |
| Note Date: | November 21, 2019 | | Current Occupancy (As of)(5): | 97.0% (Various) |
| Seasoning: | 2 months | | YE 2018 Occupancy(6): | NAV |
| Maturity Date: | December 6, 2029 | | YE 2017 Occupancy(6): | NAV |
| IO Period: | 120 months | | YE 2016 Occupancy(6): | NAV |
| Loan Term (Original): | 120 months | | YE 2015 Occupancy(6): | NAV |
| Amortization Term (Original): | NAP | | As-Is Appraised Value(7): | $117,000,000 |
| Loan Amortization Type: | Interest-only, Balloon | | As-Is Appraised Value Per SF(7)(8): | $370.18 |
| Call Protection(2): | L(24),GRTR 1% or YM(92),O(4) | | As-Is Appraisal Valuation Date: | October 31, 2019 |
| Lockbox Type: | Hard/Springing Cash Management | | | |
| Additional Debt: | Yes | | Underwriting and Financial Information |
| Additional Debt Type (Balance): | Pari Passu($50,000,000) | | TTM NOI(6): | NAV |
| | | | YE 2018 NOI(6): | NAV |
| | | | YE 2017 NOI(6): | NAV |
| | | | YE 2016 NOI(6): | NAV |
| | | | U/W Revenues: | $8,935,023 |
| | | | U/W Expenses: | $2,992,779 |
| Escrows and Reserves | | U/W NOI: | $5,942,244 |
| | Initial | Monthly | Cap | | U/W NCF: | $5,858,374 |
| Taxes | $0 | Springing(3) | NAP | | U/W DSCR based on NOI/NCF(1): | 2.26x / 2.23x |
| Insurance | $0 | Springing(3) | NAP | | U/W Debt Yield based on NOI/NCF(1): | 7.9% / 7.8% |
| TI/LC Reserve | $2,500,000 | $0 | NAP | | U/W Debt Yield at Maturity based on NOI/NCF(1): | 7.9% / 7.8% |
| Deferred Maintenance | $30,000 | $0 | NAP | | Cut-off Date LTV Ratio(1): | 64.5% |
| | | | | | LTV Ratio at Maturity(1): | 64.5% |
| | | | | | | | |
| Sources and Uses |
| Sources | | | | | Uses | | | |
| Original Whole loan amount | $75,450,000 | | 64.5% | | Purchase price | $111,250,000 | | 95.1% |
| Borrower sponsor equity | 41,572,366 | | 35.5 | | Closing costs(9) | 3,242,366 | | 2.8 |
| | | | | | Reserve funds | 2,530,000 | | 2.2 |
| Total Sources | $117,022,366 | | 100.0% | | Total Uses | $117,022,366 | | 100.0% |
| (1) | The Exchange on Erwin Mortgage Loan (as defined below) is part of a whole loan evidenced by twopari passu notes with an aggregate original principal balance of $75.45 million. The Cut-off Date Balance Per SF, Maturity Date Balance Per SF, U/W Debt Yield based on NOI/NCF, U/W DSCR based on NOI/NCF, Cut-off Date LTV Ratio and LTV Ratio at Maturity or ARD numbers presented above are based on the aggregate principal balance of the promissory notes comprising the Exchange on Erwin Whole Loan (as defined below). |
| (2) | The borrower may prepay the Exchange on Erwin Whole Loan at any time (subject to the payment of any yield maintenance premiums) in order to achieve the required debt yield set forth in the loan documents to prevent a Trigger Period. A “Trigger Period” will commence upon the earliest of (i) an event of default or (ii) a Debt Yield Trigger. A “Debt Yield Trigger” will occur when the debt yield (as defined in the Exchange on Erwin Whole Loan documents) is less than 6.9% for two consecutive calendar quarters; provided that, to the extent that the amount in the TI/LC reserve is greater than or equal to $1,850,000, any Specified Tenant Event will not trigger a Debt Yield Trigger. A “Specified Tenant Event” will occur if Duke University or Duke University Health Systems delivers notice to vacate all or substantially all of its space or to cancel its lease. |
| (3) | The borrower will be required to make monthly tax escrow payments of 1/12th of annual estimated tax payments for the next ensuing 12 months upon and during the continuance of a Trigger Period as described above. The borrower will be required to make insurance escrow payments of 1/12th of the annual estimated insurance premiums upon and during the continuance of a Trigger Period and if the Exchange on Erwin Property (as defined below) is not covered under a blanket policy acceptable to the lender. |
| (4) | The Exchange on Erwin Property consists of a (i) 96,949 square-foot mixed-use property consisting of (a) 61,540 square feet of office space and (b) 35,409 square feet of retail space and (ii) three mid-rise multifamily buildings totalling 265 units and 219,112 square feet. |
| (5) | The Mixed-Use Property (as defined below) is 95.4% occupied as of November 21, 2019 and the Multifamily Property (as defined below) is 97.7% occupied based on square feet and 97.7% occupied based on units as of December 31, 2019. |
| (6) | Historical occupancy and operating statements are not available as the Multifamily Property was constructed in 2017 and 2018 and stabilized through 2019. |
| (7) | The appraisal assumes that the Initial TI/LC reserve of $2,500,000 was escrowed by the lender and such amount would pass to a future purchaser of the Exchange on Erwin Property. |
THE INFORMATION IN THIS STRUCTURAL AND COLLATERAL TERM SHEET IS NOT COMPLETE AND MAY BE AMENDED PRIOR TO THE TIME OF SALE. THIS TERM SHEET IS NOT AN OFFER TO SELL THESE SECURITIES AND IT IS NOT A SOLICITATION OF AN OFFER TO BUY THESE SECURITIES IN ANY JURISDICTION WHERE THE OFFER OR SALE IS NOT PERMITTED.
140
| Mixed Use – Multifamily/Office/Retail | Loan #12 | Cut-off Date Balance: | | $25,450,000 |
| 2610 Erwin Road | Exchange on Erwin | Cut-off Date LTV: | | 64.5% |
| Durham, NC 27705 | | U/W NCF DSCR: | | 2.23x |
| | | U/W NOI Debt Yield: | | 7.9% |
| (8) | Per SF calculations are based on total net rentable area (“NRA”) of 316,061 square feet which includes the (i) 96,949 square-foot Mixed-Use Property and (ii) 219,112 square-foot Multifamily Property. |
| (9) | Closing costs include $1,052,685 of borrower reserves to be used for working capital and other purposes. |
The Mortgage Loan. The mortgage loan (the “Exchange on Erwin Mortgage Loan”) is evidenced by twopari passu promissory notes secured by a first mortgage encumbering the fee interest in a 316,061 square foot mixed-use multifamily, office and retail property located in Durham, North Carolina (the “Exchange on Erwin Property”). Controlling Note A-1, with an original principal balance of $50,000,000, is expected to be contributed to the BBCMS 2020-C6 securitization trust. Non-controlling Note A-2, with an original principal balance of $25,450,000, is being contributed to the WFCM 2020-C55 securitization trust. See “Description of the Mortgage Pool—The Whole Loans—The Non-Serviced Pari Passu Whole Loans” and “Pooling and Servicing Agreement—Servicing of the Non-Serviced Mortgage Loans” in the Preliminary Prospectus.
Note Summary
| Notes | Original Principal Balance | Cut-off Date Balance | Note Holder | Controlling Interest |
| A-1 | $50,000,000 | $50,000,000 | BBCMS 2020-C6(1) | Yes |
| A-2 | $25,450,000 | $25,450,000 | WFCM 2020-C55 | No |
| Total | $75,450,000 | $75,450,000 | | |
| (1) | The BBCMS 2020-C6 transaction is expected to close on February 19, 2020. |
The Property.The Exchange on Erwin Property consists of (i) three multifamily buildings totaling 265 units and 219,112 square feet of net rentable area (the “Multifamily Property”) and (ii) a 96,949 square-foot mixed-use property (the “Mixed-Use Property”) consisting of (a) 61,540 square feet of office space and (b) 35,409 square feet of retail space. The Multifamily Property was built between 2017 and 2018 and the Mixed-Use Property was built in 2007. The Multifamily Property and Mixed-Use Property are located within the same complex and are adjacent to each other, sitting on a combined approximately 8.80 acres. The Exchange on Erwin Property is part of a condominium structure subject to three owners’ associations as described in the Preliminary Prospectus. The Exchange on Erwin Property benefits from a five-story, 691-space parking deck, in which 346 spaces are allocated to the Multifamily Property and 290 spaces are allocated to the Mixed-Use Property. The remaining 55 spaces are dedicated to the non-collateral residential condo owners.
| Component | Allocated Loan
Amount | % of
Allocated
Loan
Amount | Appraised
Value(1) | % of
Appraised
Value | Underwritten
Revenue | % of
Underwritten
Revenue | SF | % of SF |
| Multifamily Property | $49,100,000 | 65.1% | $76,700,000 | 65.6% | $5,129,500 | 57.4% | 219,112 | 69.3% |
| Mixed-Use Property | 26,350,000 | 34.9 | 40,300,000 | 34.4 | 3,805,523 | 42.6 | 96,949 | 30.7 |
| Total | $75,450,000 | 100.0% | $117,000,000 | 100.0% | $8,935,023 | 100.0% | 316,061 | 100.0% |
| (1) | The Mixed-Use Property appraisal assumes that the Initial TI/LC reserve of $2,500,000 was escrowed by the lender and such amount would pass to a future purchaser of the Exchange on Erwin Property. |
The Multifamily Property
The Multifamily Property consists of the Villas and the Tower. The Villas consist of two five-story multifamily buildings totaling 128 units and 112,044 net rentable square feet. The Tower is a six-story multifamily building totaling 137 units and 107,068 square feet. The Villas were built in 2018 and the Tower was built in 2017. As of December 31, 2019, 259 of the 265 units were occupied resulting in an occupancy rate equal to 97.7%. The Multifamily Property offers 64 studios, 136 one-bedroom units and 65 two-bedroom units. According to the borrower, approximately 76.0% of the residents are Duke University graduate students and the remaining 24.0% are young professionals. All units are leased by the unit (not by the bed) and at least 90% of the leases are for terms of at least one year. Additionally, the Multifamily Property units are restricted to tenants 21 years of age and older. The amenities at the Exchange on Erwin Property include a saltwater pool, meeting and study rooms, and a fitness center. The units are equipped with stainless steel appliances, oversize walk in closets and washer/dryers. Additional site features include barbecue grills, playgrounds, walking paths and a dog park. In addition to parking deck rights, the Villas benefit from 129 surface parking spaces.
| Unit Type | # of Units | % of Units | Occupied
Units | Occupancy(1) | Average
Unit Size
(SF)(1) | Avg. Monthly
Rent Per
Unit(1) |
| Studio | 64 | 24.2% | 62 | 96.9% | 631 | $1,386 |
| 1 Bed/1 Bath | 136 | 51.3 | 134 | 98.5 | 786 | 1,463 |
| 2 Bed/2 Bath | 65 | 24.5 | 63 | 96.9 | 1,105 | 2,104 |
| Total/Wtd. Avg. | 265 | 100.0% | 259 | 97.7% | 827 | $1,600 |
| (1) | Wtd. Avg. is based on number of occupied units of each unit type. |
THE INFORMATION IN THIS STRUCTURAL AND COLLATERAL TERM SHEET IS NOT COMPLETE AND MAY BE AMENDED PRIOR TO THE TIME OF SALE. THIS TERM SHEET IS NOT AN OFFER TO SELL THESE SECURITIES AND IT IS NOT A SOLICITATION OF AN OFFER TO BUY THESE SECURITIES IN ANY JURISDICTION WHERE THE OFFER OR SALE IS NOT PERMITTED.
141
| Mixed Use – Multifamily/Office/Retail | Loan #12 | Cut-off Date Balance: | | $25,450,000 |
| 2610 Erwin Road | Exchange on Erwin | Cut-off Date LTV: | | 64.5% |
| Durham, NC 27705 | | U/W NCF DSCR: | | 2.23x |
| | | U/W NOI Debt Yield: | | 7.9% |
The Mixed-Use Property
The Mixed-Use Property is a three-story building totaling 96,949 square feet comprised of first-floor retail and the majority of office space located on floors two and three.
The office portion of the Mixed-Use Property consists of 61,540 square feet and is 100.0% occupied by Duke University (Moody’s Aa1, S&P AA+) and Duke University Health Systems (Moody’s Aa2, S&P AA, Fitch AA) (together with Duke University, “Duke”). Duke accounts for 63.5% of square feet at the Mixed-Use Property. Duke’s leases expire in various months of 2024 and each lease includes at least one five-year renewal option at fair market value. Duke is required to provide notice of renewal at least 180 days but no more than 240 days prior to lease expiration. If either Duke University or Duke University Health Systems does not exercise its respective renewal option or if it provides notice to cancel its leases and the resulting debt yield of the Exchange on Erwin Whole Loan is less than 6.9%, all excess cash flow will be swept unless the borrower deposits an amount that would result in $1,850,000 being held in the TI/LC reserve account (see “Lockbox / Cash Management” below). Duke uses its space for its Center for Autism and Brain Development, Child & Family Study Center, Autism Clinic, Children’s Evaluation Center, Neuropsychology and Smoking Research Lab, among other things. Duke has occupied space at the Mixed-Use Property since it was built and has since expanded and renewed several times.
The retail portion is located on the first floor of the Mixed-Use Property and consists of 13 units totaling 35,409 square feet, of which 12 units were occupied as of the November 21, 2019 rent roll. The largest retail tenant, Hook & Reel, a Cajun seafood bar and restaurant, occupies 7,254 square feet with a lease expiration in December 2029. Other national retail tenants include Smashburger, Firehouse Subs, Dunkin Donuts, The Noodle Shop, The UPS Store and Chipotle Mexican Grill. In addition to parking deck rights, there are 80 surface parking spaces in front of the retail component of the Mixed-Use Property.
The following table presents certain information relating to the tenancy at the Exchange on Erwin Mixed Use Property:
Major Tenants(1)
| Tenant Name | Credit Rating (Fitch/
Moody’s/
S&P)(2) | Tenant
NRSF | % of
NRSF | Annual
U/W Base
Rent PSF | Annual
U/W Base
Rent | % of Total
Annual
U/W Base
Rent | Lease
Expiration
Date | Extension Options | Termination Option (Y/N) |
| Major Tenants | | | | | | | | | |
| Duke University | NR/Aa1/AA+ | 37,290 | 38.5% | $27.09 | $1,010,364 | 36.9% | Various(3) | Various(4) | N |
| Duke University Health Systems | AA/Aa2/AA | 24,250 | 25.0% | $30.81 | $747,144 | 27.3% | 5/31/2024 | 2, 5-year | N |
| Hook & Reel | NR/NR/NR | 7,254 | 7.5% | $29.00 | $210,372 | 7.7% | 12/31/2029 | 2, 5-year | N |
| Smashburger | NR/NR/NR | 2,974 | 3.1% | $23.00 | $68,400 | 2.5% | 3/31/2024 | 2, 5-year | Y(5) |
| The Noodle Shop | NR/NR/NR | 2,925 | 3.0% | $29.04 | $84,948 | 3.1% | 6/30/2023 | 1, 5-year | N |
| Total Major Tenants | | 74,693 | 77.0% | $28.40 | $2,121,228 | 77.4% | | | |
| | | | | | | | | | |
| Non-Major Tenants | | 17,826 | 18.4% | $34.66 | $617,928 | 22.6% | | | |
| | | | | | | | | | |
| Occupied Collateral Total | 92,519 | 95.4% | $29.61 | $2,739,156 | 100.0% | | | |
| | | | | | | | | |
| Vacant Space | 4,430 | 4.6% | | | | | | |
| | | | | | | | | |
| Collateral Total | 96,949 | 100.0% | | | | | | |
| | | | | | | | | | |
| (1) | Based on the underwritten rent roll dated November 21, 2019. |
| (2) | Certain ratings are those of the parent company whether or not the parent company guarantees the lease. |
| (3) | Duke University has 4,797 square feet that expires on May 31, 2024 and 32,493 square feet that expires on August 31, 2024. |
| (4) | Duke University has one, five-year renewal option remaining on 4,393 square feet of its space (Suites 19A and 19B) and two, five-year renewal options remaining on 32,897 square feet of its space (Suites 202 and 300). |
| (5) | Smashburger has the right to terminate its lease effective at any time by providing 120 days advance written notice subject to simultaneous receipt by the borrower of the tenant’s payment of the unamortized portion of the tenant improvement allowance, the full amount of the rent concession and all pre-paid and unamortized leasing commissions, together with 8% interest from the date of said payments by the borrower, and documentation by tenant that its annual sales for the last 12 months, prior to the 120 days advance notice to the borrower, were not greater than $1,000,000. |
Market Overview and Competition.The Exchange on Erwin Property is located in Durham, North Carolina, across the street from Duke University and Duke University Hospital. According to the Duke University website, Duke employs over 41,000 employees, and according to the appraisal, Duke is the largest employer in the Durham Metro area. Duke University enrolls over 15,000 students with more than half consisting of graduate and professional students. Duke Medicine integrates patient care with the clinical, training and research programs of the Duke University Health System, Duke University School of Medicine and Duke University School of Nursing. Duke University Hospital is the flagship of the broader Health System, which also includes two community hospitals (Durham Regional Hospital and Duke Raleigh Hospital) and more than 200 ambulatory care clinics. According to the Duke University website, current operating revenues equal $5.7 billion and the Duke Endowment has a market value of $8.6 billion as of June 30, 2019. Other major employers in the area include IBM Corp., UNC Chapel-Hill, Blue Cross & Blue Shield Association and Fidelity Investments.
THE INFORMATION IN THIS STRUCTURAL AND COLLATERAL TERM SHEET IS NOT COMPLETE AND MAY BE AMENDED PRIOR TO THE TIME OF SALE. THIS TERM SHEET IS NOT AN OFFER TO SELL THESE SECURITIES AND IT IS NOT A SOLICITATION OF AN OFFER TO BUY THESE SECURITIES IN ANY JURISDICTION WHERE THE OFFER OR SALE IS NOT PERMITTED.
142
| Mixed Use – Multifamily/Office/Retail | Loan #12 | Cut-off Date Balance: | | $25,450,000 |
| 2610 Erwin Road | Exchange on Erwin | Cut-off Date LTV: | | 64.5% |
| Durham, NC 27705 | | U/W NCF DSCR: | | 2.23x |
| | | U/W NOI Debt Yield: | | 7.9% |
According to the appraisal, the Exchange on Erwin Property’s 2018 estimated population within a one-, three-, and five-mile radius is 13,191, 73,367, and 165,184, respectively, with average household income of $48,256, $81,314, and $74,762, respectively. According to the appraisal, the growth of population and total households within a three-mile radius of the subject is projected to outpace both the Durham MSA and North Carolina. According to the appraisal, the Exchange on Erwin Property is well placed in the market to benefit from this projected growth.
The Multifamily Property is located in the Northwest Durham/Downtown Submarket which as of the third quarter of 2019 had an occupancy rate equal to 94.2%. The office portion of the Mixed-Use Property is located in the South Durham Office Submarket, which as of the third quarter of 2019 had an occupancy rate equal to 92.1%. According to the appraisal, the concluded market office rent for the Mixed-Use Property is $30.00 per square foot. The retail portion of the Mixed-Use Property is located in the South Durham Retail Market, which as of the third quarter of 2019 had an occupancy rate equal to 93.0%. According to the appraisal, the concluded market retail rent for the Mixed-Use Property is $32.00 per square foot.
The following table presents certain information relating to the lease rollover schedule at the Exchange on Erwin Mixed Use Property:
Lease Expiration Schedule(1)
Year Ending
December 31, | No. of
Leases
Expiring | Expiring
NRSF | % of Total
NRSF | Cumulative
Expiring
NRSF | Cumulative
% of Total
NRSF | Annual
U/W
Base Rent(2) | % of Total
Annual
U/W Base
Rent | Annual
U/W
Base Rent
PSF(2) |
| MTM | 0 | 0 | 0.0% | 0 | 0.0% | $0 | 0.0% | $0.00 |
| 2020 | 1 | 1,554 | 1.6% | 1,554 | 1.6% | $54,852 | 2.0% | $35.30 |
| 2021 | 3 | 6,432 | 6.6% | 7,986 | 8.2% | $231,420 | 8.4% | $35.98 |
| 2022 | 1 | 2,650 | 2.7% | 10,636 | 11.0% | $83,364 | 3.0% | $31.46 |
| 2023 | 3 | 7,105 | 7.3% | 17,741 | 18.3% | $227,148 | 8.3% | $31.97 |
| 2024 | 5 | 64,514 | 66.5% | 82,255 | 84.8% | $1,825,908 | 66.7% | $28.30 |
| 2025 | 0 | 0 | 0.0% | 82,255 | 84.8% | $0 | 0.0% | $0.00 |
| 2026 | 0 | 0 | 0.0% | 82,255 | 84.8% | $0 | 0.0% | $0.00 |
| 2027 | 1 | 1,280 | 1.3% | 83,535 | 86.2% | $49,620 | 1.8% | $38.77 |
| 2028 | 0 | 0 | 0.0% | 83,535 | 86.2% | $0 | 0.0% | $0.00 |
| 2029 | 2 | 8,984 | 9.3% | 92,519 | 95.4% | $266,844 | 9.7% | $29.70 |
| 2030 | 0 | 0 | 0.0% | 92,519 | 95.4% | $0 | 0.0% | $0.00 |
| Thereafter | 0 | 0 | 0.0% | 92,519 | 95.4% | $0 | 0.0% | $0.00 |
| Vacant | NAP | 4,430 | 4.6% | 96,949 | 100.0% | $0 | 0.0% | $0.00 |
| Total/Weighted Average | 16 | 96,949 | 100.0% | | | $2,739,156 | 100.0% | $29.61 |
| (1) | Information obtained from the underwritten rent roll. |
| (2) | Base Rent includes rent steps through September 1, 2020 totaling $29,988. |
The following table presents historical occupancy percentages at the Exchange on Erwin Property:
Historical Occupancy
12/31/2015(1) | 12/31/2016(1) | 12/31/2017(1) | 12/31/2018(1) | Current(2) |
| NAV | NAV | NAV | NAV | 97.0% |
| (1) | Historical occupancy is not available because the multifamily portion of the Exchange on Erwin Property was built in 2017 and 2018 and stabilized throughout 2019. |
| (2) | The Mixed-Use Property is 95.4% occupied as of November 21, 2019 and the Multifamily Property is 97.7% occupied based on square feet and 97.7% occupied based on units as of December 31, 2019. |
THE INFORMATION IN THIS STRUCTURAL AND COLLATERAL TERM SHEET IS NOT COMPLETE AND MAY BE AMENDED PRIOR TO THE TIME OF SALE. THIS TERM SHEET IS NOT AN OFFER TO SELL THESE SECURITIES AND IT IS NOT A SOLICITATION OF AN OFFER TO BUY THESE SECURITIES IN ANY JURISDICTION WHERE THE OFFER OR SALE IS NOT PERMITTED.
143
| Mixed Use – Multifamily/Office/Retail | Loan #12 | Cut-off Date Balance: | | $25,450,000 |
| 2610 Erwin Road | Exchange on Erwin | Cut-off Date LTV: | | 64.5% |
| Durham, NC 27705 | | U/W NCF DSCR: | | 2.23x |
| | | U/W NOI Debt Yield: | | 7.9% |
The following table presents certain information relating to comparable office properties to the Exchange on Erwin Property identified by the appraiser:
Comparable Leases(1)
| Property Name/Location | Year
Built/ Renovated | Net
Rentable
Area (SF) | Tenant
Size (SF) | Term
(Yrs.) | Distance
from
Subject | Occupancy | Asking
Base Rent
PSF | Concessions | Lease Type |
| Office | | | | | | | | | |
Diamond View II 324 Blackwell Street Durham, NC | NAV | 154,000 | 14,560 | 10.0 Yrs | 3.1 miles | 100.0% | $33.25 | NAV | Full Service |
Venable Center 303 S. Roxboro Street Durham, NC | NAV | 82,170 | 4,552 | 3.0 Yrs | 3.4 miles | 100.0% | $30.00 | NAV | Full Service |
Perimeter Park Six 1010 Sync Street Morrisville, NC | 2018/NAP | 195,587 | 33,115 | 5.0 Yrs | 14.7 miles | 67.0% | $29.50 | NAV | Full Service |
Triangle Woman’s Center 6001 McCrimmon Morrisville, NC | 2019/NAP | 22,650 | 11,000 | 10.0 Yrs | 16.2 miles | NAV | $32.50 | NAV | Full Service |
HealthPark at Kildaire Two 110 Kildaire Park Drive Cary, NC | 2019/NAP | 93,000 | 16,203 | 10.0 Yrs | 27.8 miles | NAV | $32.50 | NAV | Full Service |
| Retail | | | | | | | | | |
One City Center 110 N. Corcoran Street Durham, NC | 2018/NAP | 130,195 | 2,591 | 10.0 Yrs | 3.1 miles | 83.0% | $33.00 | NAV | NNN |
Bank of America 7109 O’Kelly Chapel Road Cary, NC | 2015/NAP | 3,523 | 3,523 | 20.0 Yrs | 13.9 miles | 100.0% | $38.17 | NAV | NNN |
Eastern Gate Café 3625 Hillsborough Street Raleigh, NC | 1991/NAP | 4,942 | 4,942 | 10.0 Yrs | 24.2 miles | 100.0% | $35.20 | NAV | Absolute Net |
Greystone Village 7713 Lead Mine Road Raleigh, NC | 1986/NAP | 78,591 | 1,100 | 5.0 Yrs | 24.5 miles | 100.0% | $23.34 | NAV | NNN |
| (1) | Information obtained from appraisal. |
THE INFORMATION IN THIS STRUCTURAL AND COLLATERAL TERM SHEET IS NOT COMPLETE AND MAY BE AMENDED PRIOR TO THE TIME OF SALE. THIS TERM SHEET IS NOT AN OFFER TO SELL THESE SECURITIES AND IT IS NOT A SOLICITATION OF AN OFFER TO BUY THESE SECURITIES IN ANY JURISDICTION WHERE THE OFFER OR SALE IS NOT PERMITTED.
144
| Mixed Use – Multifamily/Office/Retail | Loan #12 | Cut-off Date Balance: | | $25,450,000 |
| 2610 Erwin Road | Exchange on Erwin | Cut-off Date LTV: | | 64.5% |
| Durham, NC 27705 | | U/W NCF DSCR: | | 2.23x |
| | | U/W NOI Debt Yield: | | 7.9% |
Operating History and Underwritten Net Cash Flow. The following table presents certain information relating to the underwritten net cash flow at the Exchange on Erwin Property:
Cash Flow Analysis(1)
| | U/W | %(2) | U/W $
per Unit(3) |
| Multifamily Rents in Place | $4,957,188 | 96.6% | $18,706 |
| Multifamily Vacant Income | 108,960 | 2.1 | 411 |
| Multifamily Gross Potential Rent | $5,066,148 | 98.8% | $19,118 |
| (Multifamily Vacancy/Credit Loss) | (253,300) | (4.9) | (956) |
| Multifamily Other Revenue(4) | 316,652 | 6.2 | 1,195 |
| Multifamily Net Rental Income | $5,129,500 | 100.0% | $19,357 |
| | | | |
| Commercial Rents In-Place | $2,709,168 | 66.2% | $27.94 |
| Commercial Rent Steps(5) | 108,724 | 2.7 | 1.12 |
| Commercial Vacant Income | 184,010 | 4.5 | 1.90 |
| Commercial Gross Potential Rent | $3,001,902 | 73.3% | $30.96 |
| Commercial Reimbursements | 603,675 | 14.7 | 6.23 |
| Commercial Other Revenue(6) | 487,701 | 11.9 | 5.03 |
| Commercial Net Rental Income | $4,093,278 | 100.0% | $42.22 |
| (Commercial Vacancy/Credit Loss) | (287,755) | (7.0) | (2.97) |
| Commercial Effective Gross Income | $3,805,523 | 93.0% | $39.25 |
| | | | |
| Total Revenue | $8,935,023 | 100.0% | NAP |
| | | | |
| Total Operating Expenses(7) | $2,992,779 | 33.5% | NAP |
| | | | |
| Net Operating Income | $5,942,244 | 66.5% | NAP |
| Replacement Reserves | 83,869 | 0.9 | NAP |
| TI/LC | 0 | 0.0 | NAP |
| Net Cash Flow | $5,858,374 | 65.6% | NAP |
| | | | |
| NOI DSCR | 2.26x | | |
| NCF DSCR | 2.23x | | |
| NOI Debt Yield | 7.9% | | |
| NCF Debt Yield | 7.8% | | |
| (1) | Historical operating history was not included as the Villas was still being constructed in 2018 and ramping up thereafter. In general, underwritten revenue was based off the trailing four-month period ending December 2019 and expenses were based on the borrowers’ year one estimates and taxes are underwritten to the appraiser’s conclusion for unabated taxes. |
| (2) | Percentage column represents percent of Multifamily Net Rental Income for Multifamily revenue fields. Percentage column represents percent of Commercial Net Rental Income for Commercial revenue fields. Percentage Column represents percent of Total Revenue for the remainder of the fields. |
| (3) | Multifamily revenue Per Unit calculations are based on 265 units. Commercial revenue Per Unit calculations are based on 96,949 square feet. |
| (4) | Multifamily Other Revenue includes utility reimbursements and other residential revenue. |
| (5) | Commercial Rent Steps includes underwritten rent steps through September 1, 2020 and straight-line rent for Duke University. |
| (6) | The majority of Commercial Other Revenue is comprised of commercial parking income. |
| (7) | The Multifamily Property was enrolled in the state’s Brownfield program to support the redevelopment with multifamily apartment buildings, and is entitled to tax abatement in the amount of $412,261 for 2019, $313,642 for 2020, $202,205 for 2021, $100,767 for 2022 and $29,646 for 2023, resulting in a total benefit of $1,058,522. The underwriting reflects the appraisals concluded unabated taxes. |
THE INFORMATION IN THIS STRUCTURAL AND COLLATERAL TERM SHEET IS NOT COMPLETE AND MAY BE AMENDED PRIOR TO THE TIME OF SALE. THIS TERM SHEET IS NOT AN OFFER TO SELL THESE SECURITIES AND IT IS NOT A SOLICITATION OF AN OFFER TO BUY THESE SECURITIES IN ANY JURISDICTION WHERE THE OFFER OR SALE IS NOT PERMITTED.
145
No. 13 – Pinnacle Self Storage Portfolio |
|
Mortgage Loan Information | | Mortgaged Property Information |
Mortgage Loan Seller: | LMF Commercial, LLC (formerly known as Rialto Mortgage Finance, LLC) | | Single Asset/Portfolio: | Portfolio |
Credit Assessment (KBRA/Fitch/Moody’s): | NR/NR/NR | | Property Type – Subtype: | Self Storage – Self Storage |
Original Principal Balance: | $20,500,000 | | Location: | Various |
Cut-off Date Balance: | $20,500,000 | | Size: | 306,700 SF |
% of Initial Pool Balance: | 2.1% | | Cut-off Date Balance Per SF: | $66.84 |
Loan Purpose: | Acquisition | | Maturity Date Balance Per SF: | $61.42 |
Borrower Sponsor(1): | Robert Moser | | Year Built/Renovated: | Various/Various |
Guarantor: | Robert Moser | | Title Vesting: | Fee |
Mortgage Rate: | 4.7700% | | Property Manager: | Prime Group Holdings LLC (borrower-affiliate) |
Note Date: | December 23, 2019 | | Current Occupancy (As of): | 75.7% (11/30/2019) |
Seasoning: | 1 month | | YE 2018 Occupancy: | 77.5% |
Maturity Date: | January 6, 2030 | | YE 2017 Occupancy: | 66.6% |
IO Period: | 60 months | | YE 2016 Occupancy: | 72.0% |
Loan Term (Original): | 120 months | | YE 2015 Occupancy: | NAV |
Amortization Term (Original): | 360 months | | As-Is Appraised Value(4): | $40,200,000 |
Loan Amortization Type: | Interest-only, Amortizing Balloon | | As-Is Appraised Value Per SF(4): | $131.07 |
Call Protection(2): | L(25),D(91),O(4) | | As-Is Appraisal Valuation Date: | November 15, 2019 |
Lockbox Type: | Springing | | | |
Additional Debt(3): | Yes | | Underwriting and Financial Information |
Additional Debt Type (Balance)(3): | Future Mezzanine | | TTM NOI (10/31/2019)(5): | $1,852,891 |
| | | YE 2018 NOI(5): | $1,330,590 |
| | | YE 2017 NOI: | $1,101,013 |
| | | YE 2016 NOI: | $997,431 |
| | | U/W Revenues: | $2,718,044 |
| | | U/W Expenses: | $816,786 |
| | U/W NOI: | $1,901,258 |
| | | | | U/W NCF: | $1,855,253 |
Escrows and Reserves | | U/W DSCR based on NOI/NCF: | 1.48x / 1.44x |
| Initial | Monthly | Cap | | U/W Debt Yield based on NOI/NCF: | 9.3% / 9.1% |
Taxes | $4,760 | $4,534 | NAP | | U/W Debt Yield at Maturity based on NOI/NCF: | 10.1% / 9.8% |
Insurance | $14,863 | $2,359 | NAP | | Cut-off Date LTV Ratio(4): | 51.0% |
Replacement Reserve | $0 | $3,834 | NAP | | LTV Ratio at Maturity(4): | 46.9% |
Deferred Maintenance | $44,254 | $0 | NAP | | | |
| | | | | | |
| | | | | | | |
Sources and Uses |
Sources | | | | | Uses | | | |
Original loan amount | $20,500,000 | | 58.9% | | Purchase price | $34,394,030 | | 98.9% |
Borrower Sponsor’s | 14,292,651 | | 41.1 | | Upfront reserves | 63,877 | | 0.2 |
| | | | | Closing costs | 334,744 | | 1.0 |
Total Sources | $34,792,651 | | 100.0% | | Total Uses | $34,792,651 | | 100.0% |
(1) | See “Description of the Mortgage Pool—Litigation and Other Considerations” and “—Loan Purpose; Default History, Bankruptcy Issues and Other Proceedings” in the Preliminary Prospectus. |
(2) | At any time after permitted prepayment date and prior to the free window date, the Pinnacle Self Storage Portfolio Borrowers may release any individual property provided that, among other conditions stated in the Pinnacle Self Storage Portfolio Mortgage Loan documents, (i) no event of default has occurred and is continuing; (ii) the amount of the Pinnacle Self Storage Portfolio Mortgage Loan defeased will be 115% of the allocated loan amount for the related Pinnacle Self Storage Portfolio property being released; (iii) the debt service coverage ratio for the remaining properties after such release is not less than the greater of (a) 1.44x and (b) the debt service coverage ratio for the remaining properties and the property to be released for the preceding 12 months; and (iv) the loan-to-value ratio after such release is less than or equal to the lesser of (a) 51.0% and (b) the loan-to-value ratio for the remaining properties and the property to be released immediately preceding the release of the property. |
(3) | Provided no event of default has occurred and is continuing, the Pinnacle Self Storage Portfolio Mortgage Loan documents permit an affiliate of the Pinnacle Self Storage Portfolio Borrowers to incur future mezzanine debt subject to certain conditions, including (i) the execution of an intercreditor agreement in form and substance reasonably acceptable to the lender; and (ii) based on the Pinnacle Self Storage Portfolio Mortgage Loan and the mezzanine loan, (a) the combined loan-to-value ratio is not greater than 51.0% and (b) the debt service coverage ratio is not less than 1.44x. |
(4) | The Appraised Value, Appraised Value Per Unit, Cut-Off Date LTV Ratio and LTV Ratio at Maturity is based on the as-is Bulk Portfolio Value of $40,200,000. The combined “as-is” individual appraised value is $38,510,000. The Cut-off Date LTV Ratio and LTV Ratio at Maturity on the combined “as-is” individual appraised value is 53.2% and 48.9%, respectively. |
(5) | TTM NOI (10/31/2019) increased compared to YE 2018 NOI is mainly due to (1) an increase in Square Fee of the Highway 70 property of 43,730 Square Fee, and (ii) an increase in occupancy of the whole portfolio from 77.5% in 2018 to 87.5% as of 10/31/2019. |
THE INFORMATION IN THIS STRUCTURAL AND COLLATERAL TERM SHEET IS NOT COMPLETE AND MAY BE AMENDED PRIOR TO THE TIME OF SALE. THIS TERM SHEET IS NOT AN OFFER TO SELL THESE SECURITIES AND IT IS NOT A SOLICITATION OF AN OFFER TO BUY THESE SECURITIES IN ANY JURISDICTION WHERE THE OFFER OR SALE IS NOT PERMITTED.
146
Self Storage – Self Storage | Loan #13 | Cut-off Date Balance: | | $20,500,000 |
Property Addresses – Various | Pinnacle Self Storage Portfolio | Cut-off Date LTV: | | 51.0% |
| | U/W NCF DSCR: | | 1.44x |
| | U/W NOI Debt Yield: | | 9.3% |
The Mortgage Loan. The mortgage loan (the “Pinnacle Self Storage Portfolio Mortgage Loan”) is evidenced by a single promissory note secured by a first mortgage encumbering the fee interest in four self-storage properties located in New Bern, North Carolina, Cedar Point, North Carolina and Newport, North Carolina (the “Pinnacle Self Storage Portfolio Properties” or the “Pinnacle Self Storage Portfolio”).
The Properties. The Pinnacle Self Storage Portfolio include four self storage properties located across North Carolina comprised of 2,191 self storage units. As of November 30, 2019, the Pinnacle Self Storage Portfolio Properties were 75.7% occupied as of November 30, 2019.
The Cedar Point property is located in Cedar Point, North Carolina. The Cedar Point property is comprised of 13 single-story buildings on two separate parcels totaling 6.8 acres. The Cedar Point property was built from 1994 to 2017. The Cedar Point property consists of 552 self storage units, comprising of 294 non-climate controlled self storage units and 258 climate controlled self storage units. The units range in size from 25 square feet to 700 square feet. Amenities include a keypad entry gate, 24-hour video surveillance monitoring, exterior security fence and an on-site manager. In October 2016 and July 2017, an additional 7,000 square feet and 6,275 square feet were added, respectively. The Cedar Point property also generates revenues from 14 parking spaces, six commercial tenants and an apartment.
The Morehead City property is located in Newport, North Carolina. The Morehead City property is comprised of 15 single-story buildings located on two parcels totaling 5.0 acres. The Morehead City property was built from 1985 to 2017. The Morehead City property consists of 575 self storage units which are comprised of 301 non-climate controlled self storage units and 274 climate controlled self storage units. The units range in size from 20 square feet to 672 square feet. Amenities include a keypad entry gate, 24-hour video surveillance monitoring, exterior security fence and an on-site manager. The Morehead City property also generates income from nine parking spaces.
The Highway 70 property is located in New Bern, North Carolina. The Highway 70 property is comprised of nine single-story buildings located on an 8.5 acre site. The Highway 70 property was built in 2007, 2017, and 2019. The Highway 70 property is comprised of 590 self storage units, which is comprised of 256 non-climate controlled self storage units and 334 climate controlled self storage units. The self storage units range in size from 25 square feet to 585 square feet. Amenities include a keypad entry gate, 24-hour video surveillance monitoring, exterior security fence and an on-site manager. From 2017 to 2019, the prior owner added an additional 43,730 square feet of storage space. The Highway 70 property also generates income from 66 parking spaces.
The Neuse Blvd property is located in New Bern, North Carolina. The Neuse Blvd property consists of 13 single-story building located on three parcels totaling 3.8 acres. The Neuse Blvd property was built from 1987 to 2006. The Neuse Blvd property consists of 474 self storage units, which is comprised of 336 non-climate controlled self storage units and 138 climate controlled self storage units. The self storage units range in size from 25 square feet to 250 square feet. Amenities include a keypad entry gate, 24-hour video surveillance monitoring, exterior security fence and an on-site manager. The Neuse Blvd property also generates income from eight parking spaces.
The following table presents certain information regarding the Pinnacle Self Storage Portfolio Properties:
Property Name –
Location | Allocated
Cut-off Date
Balance | % of
Portfolio
Cut-off
Date
Balance | Occupancy(1)(2) | Year Built/
Renovated | Net
Rentable
Area
(SF)(2) | Appraised
Value | UW NOI(2) | % of
UW NOI | Storage
Units(2) |
Cedar Point - Cedar Point, NC | $7,100,000 | 34.6% | 83.3% | 1994/NAP | 80,113 | $12,000,000 | $656,795 | 34.5% | 552 |
Morehead City – Newport, NC | 5,100,000 | 24.9 | 80.3 | 1985/NAP | 67,957 | 9,940,000 | 473,496 | 24.9 | 575 |
Highway 70 – New Bern, NC | 4,700,000 | 22.9 | 65.3 | 2007/NAP | 102,180 | 9,810,000 | 436,303 | 22.9 | 590 |
Neuse Blvd – New Bern, NC | 3,600,000 | 17.6 | 72.2 | 1987/NAP | 56,450 | 6,760,000 | 334,663 | 17.6 | 474 |
Total/Weighted Average | $20,500,000 | 100.0% | 75.3% | | 306,700 | $40,200,000(3) | $1,901,257 | 100.0% | 2,191 |
(1) | Occupancy is based on storage units. |
(2) | Based on the underwritten rent roll. |
(3) | The total Appraised Value is based on the “as-is” Bulk Portfolio Value. The sum of the “as-is” appraised values of the individual properties is $38,510,000, resulting in a Cut-off Date LTV Ratio and LTV Ratio at Maturity of 53.2% and 48.9%, respectively. |
THE INFORMATION IN THIS STRUCTURAL AND COLLATERAL TERM SHEET IS NOT COMPLETE AND MAY BE AMENDED PRIOR TO THE TIME OF SALE. THIS TERM SHEET IS NOT AN OFFER TO SELL THESE SECURITIES AND IT IS NOT A SOLICITATION OF AN OFFER TO BUY THESE SECURITIES IN ANY JURISDICTION WHERE THE OFFER OR SALE IS NOT PERMITTED.
147
Self Storage – Self Storage | Loan #13 | Cut-off Date Balance: | | $20,500,000 |
Property Addresses – Various | Pinnacle Self Storage Portfolio | Cut-off Date LTV: | | 51.0% |
| | U/W NCF DSCR: | | 1.44x |
| | U/W NOI Debt Yield: | | 9.3% |
The following table presents historical occupancy percentages at the Pinnacle Self Storage Portfolio:
Historical Occupancy
12/31/2016(1) | | 12/31/2017(1) | | 12/31/2018(1) | | 11/30/2019(2) | |
72.0% | | 66.6% | | 77.5% | | 75.7% | |
(1) | Occupancy is based on storage units. Information provided by the Pinnacle Self Storage Portfolio Borrower. |
(2) | Based on underwritten rent roll. |
Market Overview and Competition. The Pinnacle Self Storage Portfolio Properties are located across North Carolina.
Craven County
The Highway 70 and Neuse Blvd properties are located in New Bern, Craven County, North Carolina within the New Bern, NC metropolitan statistical area (“New Bern MSA”). The New Bern MSA is comprised of three counties: Craven, Jones and Pamlico. New Bern lies at the meeting of the Trent and Neuse rivers, near the coast of North Carolina. New Bern is approximately 112 miles southeast of Raleigh and 87 miles northeast of Wilmington. The New Bern MSA is home to the Marine Corps Air Station Cherry Point (“MCAS”). The MCAS has approximately 13,164 acres of air station and an additional 15,975 acres for supplementary uses. The MCAS is home to 49,000 service members, including the civilian workforce, retired and active duty marines. Other employers within the New Bern MSA include the Department of Defense, Carolina East Health Systems, Craven County School District, BSH Home Appliances and Moen Incorporated. Carolina East Medical Center is the flagship hospital of Carolina East Health System, a 350-bed acute care facility that provides inpatient and outpatient care.
Carteret County
The Cedar Point property is located in Cedar Point, Carteret County, North Carolina and the Morehead City property is located in Newport, Carteret County, North Carolina. Carteret County is located in southeastern North Carolina and comprises the Morehead City, NC micropolitan statistical area (“Morehead City MSA”), which is included in the New Bern-Morehead City NC combined statistical area. Carteret County is bordered by Craven County to the north, the North Atlantic Ocean to the east and south, and Onslow County to the west. Carteret County’s largest industries include public administration, agriculture/forestry, and real estate. Major employers located in Carteret County include: Carteret County Public School District, Carteret County General Services, Carteret County, Walmart Associates, Inc. and Carteret Community College.
According to the third party market reports, the Pinnacle Self Storage Properties are located in the South Region within the South Atlantic Division with average monthly rents of $106.85 and $130.10 per unit for 10x10 foot non-climate controlled and climate controlled units, respectively. As of the end of the second quarter of 2018, the South Atlantic Division reported a vacancy rate of 10.7% for self storage properties.
THE INFORMATION IN THIS STRUCTURAL AND COLLATERAL TERM SHEET IS NOT COMPLETE AND MAY BE AMENDED PRIOR TO THE TIME OF SALE. THIS TERM SHEET IS NOT AN OFFER TO SELL THESE SECURITIES AND IT IS NOT A SOLICITATION OF AN OFFER TO BUY THESE SECURITIES IN ANY JURISDICTION WHERE THE OFFER OR SALE IS NOT PERMITTED.
148
Self Storage – Self Storage | Loan #13 | Cut-off Date Balance: | | $20,500,000 |
Property Addresses – Various | Pinnacle Self Storage Portfolio | Cut-off Date LTV: | | 51.0% |
| | U/W NCF DSCR: | | 1.44x |
| | U/W NOI Debt Yield: | | 9.3% |
Operating History and Underwritten Net Cash Flow. The following table presents certain information relating to the historical operating performance and underwritten net cash flow at the Pinnacle Self Storage Portfolio Properties:
Cash Flow Analysis
| | 2016 | | 2017 | | 2018 | | TTM 10/31/2019 | | U/W | | %(1) | | U/W $
per SF | |
Base Rent | | $1,585,562 | | $1,771,908 | | $2,142,734 | | $2,781,964 | | $2,674,654 | | 72.2% | | $8.72 | |
Grossed Up Vacant Space | | 0 | | 0 | | 0 | | 0 | | 859,880 | | 23.2 | | 2.80 | |
Gross Potential Rent | | $1,585,562 | | $1,771,908 | | $2,142,734 | | $2,781,964 | | $3,534,534 | | 95.4% | | $11.52 | |
Other Income(2) | | 90,722 | | 102,989 | | 161,020 | | 171,361 | | 171,361 | | 4.6 | | 0.56 | |
Net Rental Income | | 1,676,284 | | $1,874,897 | | $2,303,754 | | $2,953,325 | | $3,705,896 | | 100.0% | | $12.08 | |
(Vacancy & Credit Loss) | | 0 | | 0 | | 0 | | 0 | | (987,852)(3) | | (27.9) | | (3.22) | |
Effective Gross Income | | $1,676,284 | | $1,874,897 | | $2,303,754 | | $2,953,325 | | $2,718,044 | | 73.3% | | $8.86 | |
| | | | | | | | | | | | | | | |
Real Estate Taxes | | 45,722 | | 49,130 | | 52,376 | | 54,066 | | 54,404 | | 2.0 | | 0.18 | |
Insurance | | 43,783 | | 41,982 | | 52,179 | | 67,691 | | 28,310 | | 1.0 | | 0.09 | |
Management Fee | | 83,814 | | 93,745 | | 115,188 | | 147,666 | | 135,902 | | 5.0 | | 0.44 | |
Other Operating Expenses | | 505,533 | | 589,028 | | 753,421 | | 831,011 | | 598,170 | | 22.0 | | 1.95 | |
Total Operating Expenses | | $678,853 | | $773,885 | | $973,164 | | $1,100,434 | | $816,786 | | 30.1% | | $2.66 | |
| | | | | | | | | | | | | | | |
Net Operating Income(4) | | $997,431 | | $1,101,013 | | $1,330,590 | | $1,852,891 | | $1,901,258 | | 69.9% | | $6.20 | |
Replacement Reserves | | 0 | | 0 | | 0 | | 0 | | 46,005 | | 1.7 | | 0.15 | |
TI/LC | | 0 | | 0 | | 0 | | 0 | | 0 | | 0.0 | | 0.00 | |
Net Cash Flow | | $997,431 | | $1,101,013 | | $1,330,590 | | $1,852,891 | | $1,855,253 | | 68.3% | | $6.05 | |
| | | | | | | | | | | | | | | |
NOI DSCR | | 0.78x | | 0.86x | | 1.03x | | 1.44x | | 1.48x | | | | | |
NCF DSCR | | 0.78x | | 0.86x | | 1.03x | | 1.44x | | 1.44x | | | | | |
NOI Debt Yield | | 4.9% | | 5.4% | | 6.5% | | 9.0% | | 9.3% | | | | | |
NCF Debt Yield | | 4.9% | | 5.4% | | 6.5% | | 9.0% | | 9.1% | | | | | |
(1) | Represents (i) percent of Net Rental Income for all revenue fields, (ii) percent of Gross Potential Rent for Vacancy & Credit Loss and (iii) percent of Effective Gross Income for all other fields. |
(2) | Other Income includes insurance income, late fees, application fees, point of sale and other miscellaneous income. |
(3) | The underwritten economic vacancy is 27.9%. The Pinnacle Self Storage Portfolio Properties were 75.3% occupied as of November 30, 2019 base on the self storage units. |
(4) | TTM NOI (10/31/2019) increased compared to YE 2018 NOI is mainly due to (1) an increase in Square Feet of the Highway 70 property of 43,730 Square Feet, and (ii) an increase in occupancy of the whole portfolio from 77.5% in 2018 to 87.5% as of 10/31/2019. |
THE INFORMATION IN THIS STRUCTURAL AND COLLATERAL TERM SHEET IS NOT COMPLETE AND MAY BE AMENDED PRIOR TO THE TIME OF SALE. THIS TERM SHEET IS NOT AN OFFER TO SELL THESE SECURITIES AND IT IS NOT A SOLICITATION OF AN OFFER TO BUY THESE SECURITIES IN ANY JURISDICTION WHERE THE OFFER OR SALE IS NOT PERMITTED.
149
No. 14 – Delta Hotels by Marriott - Detroit Metro Airport |
|
Mortgage Loan Information | | Mortgaged Property Information |
Mortgage Loan Seller: | LMF Commercial, LLC (formerly known as Rialto Mortgage Finance, LLC) | | Single Asset/Portfolio: | Single Asset |
Credit Assessment (KBRA/Fitch/Moody’s): | NR/NR/NR | | Property Type – Subtype: | Hospitality – Full Service |
Original Principal Balance: | $20,500,000 | | Location: | Romulus, MI |
Cut-off Date Balance: | $20,500,000 | | Size: | 271 Rooms |
% of Initial Pool Balance: | 2.1% | | Cut-off Date Balance Per Room: | $75,646 |
Loan Purpose: | Refinance | | Maturity Date Balance Per Room: | $62,068 |
Borrower Sponsor(1): | Jeff Katofsky | | Year Built/Renovated: | 1980/2018 |
Guarantor: | Jeff Katofsky | | Title Vesting: | Fee |
Mortgage Rate: | 4.9400% | | Property Manager: | Real Hospitality Group, LLC |
Note Date: | January 14, 2020 | | Current Occupancy (As of): | 71.4% (12/31/2019) |
Seasoning: | 0 months | | YE 2018 Occupancy(2): | NAV |
Maturity Date: | February 6, 2030 | | YE 2017 Occupancy(2): | NAV |
IO Period: | 0 months | | YE 2016 Occupancy(2): | NAV |
Loan Term (Original): | 120 months | | YE 2015 Occupancy(2): | NAV |
Amortization Term (Original): | 360 months | | As-Is Appraised Value: | $33,000,000 |
Loan Amortization Type: | Amortizing Balloon | | As-Is Appraised Value Per Room: | $121,771 |
Call Protection: | L(24),D(92),O(4) | | As-Is Appraisal Valuation Date: | October 1, 2019 |
Lockbox Type: | Hard/Springing Cash Management | | | |
Additional Debt: | None | | Underwriting and Financial Information |
Additional Debt Type (Balance): | NAP | | YE 2019 NOI: | $2,851,418 |
| | | YE 2018 NOI(2): | NAV |
| | | YE 2017 NOI(2): | NAV |
| | | YE 2016 NOI(2): | NAV |
| | | U/W Revenues: | $8,422,507 |
| | | U/W Expenses: | $5,653,740 |
Escrows and Reserves | | U/W NOI: | $2,768,768 |
| Initial | Monthly | Cap | | U/W NCF: | $2,431,867 |
Taxes | $38,061 | $18,124 | NAP | | U/W DSCR based on NOI/NCF: | 2.11x /1.85x |
Insurance | $98,667 | $18,794 | NAP | | U/W Debt Yield based on NOI/NCF: | 13.5% / 11.9% |
FF&E Reserve | $0 | $27,766 | NAP | | U/W Debt Yield at Maturity based on NOI/NCF: | 16.5% / 14.5% |
PIP Reserve | $187,000 | $0 | NAP | | Cut-off Date LTV Ratio: | 62.1% |
Required Repair Reserve | $7,500 | $0 | NAP | | LTV Ratio at Maturity: | 51.0% |
| | | | | | |
| | | | | | | |
Sources and Uses |
Sources | | | | | Uses | | | |
Original loan amount | $20,500,000 | | 100.0% | | Loan payoff | $18,962,022 | | 92.5% |
| | | | | Upfront reserves | 331,228 | | 1.6 |
| | | | | Closing costs | 441,914 | | 2.2 |
| | | | | Return of equity | 764,836 | | 3.7 |
Total Sources | $20,500,000 | | 100.0% | | Total Uses | $20,500,000 | | 100.0% |
(1) | See “Description of the Mortgage Pool—Loan Purpose; Default History, Bankruptcy Issues and Other Proceedings” in the Preliminary Prospectus. |
(2) | The Delta Hotels by Marriott - Detroit Metro Airport Property (as defined below) went through a $2 million conversion to its current Delta Hotels by Marriott brand from 2017 to 2018; as such, historical figures were not available. |
The Mortgage Loan. The mortgage loan (the “Delta Hotels by Marriott - Detroit Metro Airport Mortgage Loan”) is evidenced by a single promissory note secured by a first mortgage encumbering the fee interest in a 271-room full-service hotel located in Romulus, Michigan (the “Delta Hotels by Marriott - Detroit Metro Airport Property”).
The Property. The Delta Hotels by Marriott - Detroit Metro Airport Property is a 271-room full service hotel located in Romulus, Michigan. The Delta Hotels by Marriott - Detroit Metro Airport Property was constructed in 1980, and most recently renovated in 2018 when the Delta Hotels by Marriott – Detroit Metro Airport Property was converted to the current brand. The improvements are comprised of one four-story building situated on 9.2 acres and 405 surface parking spaces, resulting in a parking ratio of 1.5 spaces per room. Hotel amenities include an indoor / outdoor swimming pool, an indoor whirlpool, a fitness center, a business center, a market pantry and an airport and local shuttle. The Delta Hotels by Marriott - Detroit Metro Airport Property also features two food and beverage facilities, the mETRO pOLIS and Jylian’s Coffee Bar for a combined seating capacity of 112 guests, and six meeting rooms totaling
THE INFORMATION IN THIS STRUCTURAL AND COLLATERAL TERM SHEET IS NOT COMPLETE AND MAY BE AMENDED PRIOR TO THE TIME OF SALE. THIS TERM SHEET IS NOT AN OFFER TO SELL THESE SECURITIES AND IT IS NOT A SOLICITATION OF AN OFFER TO BUY THESE SECURITIES IN ANY JURISDICTION WHERE THE OFFER OR SALE IS NOT PERMITTED.
150
Hospitality – Full Service | Loan #14 | Cut-off Date Balance: | | $20,500,000 |
31500 Wick Road | Delta Hotels by Marriott – Detroit Metro | Cut-off Date LTV: | | 62.1% |
Romulus, MI 48174 | Airport | U/W NCF DSCR: | | 1.85x |
| | U/W NOI Debt Yield: | | 13.5% |
8,825 square feet. The Delta Hotels by Marriott - Detroit Metro Airport Property contains 200 king rooms, 49 double queen rooms, 11 one-bedroom suites and 11 accessible suites.
The borrower sponsor acquired the Delta Hotels by Marriott – Detroit Metro Airport Property as vacant in 2015. Since acquisition, the borrower sponsor has invested approximately $18 million in comprehensive renovation and $2 million for Marriott rebranding costs. Capital improvements consisted of exterior renovations, common area renovations, guestrooms renovations, and structural and miscellaneous upgrades.
The Delta Hotels by Marriott - Detroit Metro Airport Borrower operates as a Delta Hotels by Marriott under a license agreement with Marriott International, Inc. The franchise agreement will expire on June 1, 2038.
The following table presents certain information relating to the 2018 demand analysis with respect to the Delta Hotels by Marriott - Detroit Metro Airport Property based on market segmentation, as provided in the appraisal:
Market Segmentation
Commercial | | Meeting/Group | | Leisure |
65.0% | | 15.0% | | 20.0% |
Market Overview and Competition. The Delta Hotels by Marriott - Detroit Metro Airport Property is located in Romulus, Wayne County, Michigan within the Detroit-Warren-Dearborn, MI metropolitan statistical area (“Detroit MSA”). The Detroit MSA has a diverse economic base driven largely by manufacturing and health care. Major employers within the Detroit MSA include Ford Motor Company, General Motors Company, FCA US LLC, University of Michigan, Beaumont Health, and Henry Ford Health System. According to the appraisal, Metro Detroit is considered the world’s traditional automotive center serving as the headquarters for the big three automakers, Ford, General Motors, and Fiat Chrysler Automobiles. According to the appraisal, the big three automakers are committed to the region, announcing plans of future investment in Detroit. Metro Detroit also ranks among the nation’s top five financial districts, with major financial service employers including Quicken Loans, KPMG, Fifth Third Bank, Comerica, Deloitte, Ernst & Young, and PricewaterhouseCoopers.
The Delta Hotels by Marriott - Detroit Metro Airport Property is located 1.3 miles north of the Detroit Metropolitan Wayne County Airport (“DTW”) and approximately 21 miles southwest of the Detroit central business district. Primary regional access through the area is provided by Interstate 94 and Interstate 75. Interstate 94 traverses in an east/west direction and provides access to Port Huron to the east and Chicago, Illinois to the west. Interstate 75 traverses in a north/south direction providing access to Flint, Michigan and Toledo, Ohio. The Delta Hotels by Marriott - Detroit Metro Airport Property is serviced by the DTW. The neighborhood surrounding the Delta Hotels by Marriott - Detroit Metro Airport Property include restaurants, supermarkets, retail, office buildings, industrial buildings, and hotels.
DTW is the largest airport in the state of Michigan, offers service via 14 passenger airlines, and has approximately 1,100 flights per day, to and from more than 140 destinations on four continents. Other demand generators include Cobo Center, Detroit Zoo, Motown Historical Museum, the Henry Ford, MGM Grand, MotorCity Casino and Greektown Casino. Detroit is also home to the National Football League’s Detroit Lions and the National Basketball Association Detroit Pistons.
THE INFORMATION IN THIS STRUCTURAL AND COLLATERAL TERM SHEET IS NOT COMPLETE AND MAY BE AMENDED PRIOR TO THE TIME OF SALE. THIS TERM SHEET IS NOT AN OFFER TO SELL THESE SECURITIES AND IT IS NOT A SOLICITATION OF AN OFFER TO BUY THESE SECURITIES IN ANY JURISDICTION WHERE THE OFFER OR SALE IS NOT PERMITTED.
151
Hospitality – Full Service | Loan #14 | Cut-off Date Balance: | | $20,500,000 |
31500 Wick Road | Delta Hotels by Marriott – Detroit Metro | Cut-off Date LTV: | | 62.1% |
Romulus, MI 48174 | Airport | U/W NCF DSCR: | | 1.85x |
| | U/W NOI Debt Yield: | | 13.5% |
The following table presents historical occupancy, ADR, RevPAR and penetration rates relating to the Delta Hotels by Marriott - Detroit Metro Airport Property’s competitive set:
Subject and Market Historical Occupancy, ADR and RevPAR
| Competitive Set(1) | | Delta by Marriott - Detroit Metro
Airport(2) | | Penetration Factor | |
Year | Occupancy | ADR | | RevPAR | | Occupancy | | ADR | | RevPAR | | Occupancy | | ADR | | RevPAR | |
TTM 11/30/2019 | 67.5% | $102.78 | | $69.36 | | 70.9% | | $91.25 | | $64.71 | | 105.1% | | 88.8% | | 93.3% | |
TTM 11/30/2018 | 71.3% | $103.15 | | $73.52 | | 61.7% | | $85.25 | | $52.63 | | 86.6% | | 82.6% | | 71.6% | |
TTM 11/30/2017 | 76.0% | $100.65 | | $76.50 | | 28.3% | | $89.54 | | $25.33 | | 37.2% | | 89.0% | | 33.1% | |
(1) | Information obtained from third party hospitality research reports for the month of November, 2019. The competitive set includes Wyndham Garden Hotel Romulus Detroit Metro Airport, Courtyard Detroit Metro Airport Romulus, Sheraton Hotel Detroit Metro Airport, Marriott Detroit Metro Airport, Hilton Garden Inn Detroit Metro Airport Romulus and Holiday Inn Detroit Metro Airport. |
(2) | The variances between the underwriting, the appraisal and the industry report data with respect to Occupancy, ADR and RevPAR at the Delta Hotels by Marriott - Detroit Metro Airport Property are attributable to variances in reporting methodologies and/or timing differences. |
The following table presents certain information relating to the Delta Hotels by Marriott - Detroit Metro Airport Property’s primary competitive set:
Primary Competitive Set(1)
Property Name | Location | Rooms | Year
Built/Renov. | Estimated
2018
Occupancy | Estimated 2018
ADR | Estimated 2018
RevPAR |
Delta Hotels by Marriott - Detroit Metro Airport – Subject | Romulus, MI | 271 | 1980/2018 | 63.5% | $86.67 | $55.03 |
Four Points Detroit Metro Airport | Romulus, MI | 173 | 1986/NAP | 60% - 65% | $90 - $95 | $55 – $60 |
Holiday Inn Detroit Metro Airport | Romulus, MI | 143 | 2011/2016 | 70% - 75% | $100 - $105 | $70 – $75 |
Sheraton Detroit Metro Airport | Romulus, MI | 359 | 1989/NAP | 65% - 70% | $90 - $95 | $65 - $70 |
Detroit Metro Airport Marriott | Romulus, MI | 249 | 1990/2017 | 75% - 80% | $115 - $120 | $90 - $95 |
Source: Appraisal
(1) | The variances between the underwriting, the appraisal and the industry report data with respect to Occupancy, ADR and RevPAR at the Detroit by Marriott – Detroit Metro Airport Property are attributable to variances in reporting methodologies and/or timing differences. |
THE INFORMATION IN THIS STRUCTURAL AND COLLATERAL TERM SHEET IS NOT COMPLETE AND MAY BE AMENDED PRIOR TO THE TIME OF SALE. THIS TERM SHEET IS NOT AN OFFER TO SELL THESE SECURITIES AND IT IS NOT A SOLICITATION OF AN OFFER TO BUY THESE SECURITIES IN ANY JURISDICTION WHERE THE OFFER OR SALE IS NOT PERMITTED.
152
Hospitality – Full Service | Loan #14 | Cut-off Date Balance: | | $20,500,000 |
31500 Wick Road | Delta Hotels by Marriott – Detroit Metro | Cut-off Date LTV: | | 62.1% |
Romulus, MI 48174 | Airport | U/W NCF DSCR: | | 1.85x |
| | U/W NOI Debt Yield: | | 13.5% |
Operating History and Underwritten Net Cash Flow. The following table presents certain information relating to the historical operating performance and the underwritten net cash flow at the Delta Hotels by Marriott - Detroit Metro Airport Property:
Cash Flow Analysis
| | 2019(1) | | U/W | | % of U/W
Total
Revenue(2) | | U/W $ per
Room | |
Occupancy | | 71.4% | | 71.4% | | | | | |
ADR | | $92.46 | | $92.46 | | | | | |
RevPAR | | $66.02 | | $66.02 | | | | | |
| | | | | | | | | |
Rooms Revenue | | $6,530,762 | | $6,530,762 | | 77.5% | | $24,099 | |
Food & Beverage Revenue | | 1,826,483 | | 1,826,483 | | 21.7 | | 6,740 | |
Other Revenue(3) | | 65,262 | | 65,262 | | 0.8 | | 241 | |
Total Revenue | | $8,422,507 | | $8,422,507 | | 100.0% | | $31,079 | |
| | | | | | | | | |
Rooms Expense | | 1,596,104 | | 1,596,104 | | 24.4 | | 5,890 | |
Food & Beverage Expense | | 1,093,722 | | 1,093,722 | | 59.9 | | 4,036 | |
Other Department Expense | | 27,503 | | 27,503 | | 42.1 | | 101 | |
Total Department Expenses | | $2,717,329 | | $2,717,329 | | 32.3% | | $10,027 | |
Gross Operating Income | | $5,705,178 | | $5,705,178 | | 67.7% | | $21,052 | |
| | | | | | | | | |
Total Undistributed Expenses | | 2,576,309 | | 2,577,333 | | 30.6 | | 9,510 | |
Gross Operating Profit | | $3,128,868 | | $3,127,845 | | 37.1% | | $11,542 | |
| | | | | | | | | |
Total Fixed Charges | | 277,450 | | 359,077 | | 4.3 | | 1,325 | |
Total Operating Expenses | | $5,571,089 | | $5,653,740 | | 67.1% | | $20,863 | |
| | | | | | | | | |
Net Operating Income | | $2,851,418 | | $2,768,768 | | 32.9% | | $10,217 | |
FF&E | | 341,144 | | 336,900 | | 4.0 | | 1,243 | |
Net Cash Flow | | $2,510,274 | | $2,431,867 | | 28.9% | | $8,974 | |
| | | | | | | | | |
NOI DSCR | | 2.17x | | 2.11x | | | | | |
NCF DSCR | | 1.91x | | 1.85x | | | | | |
NOI DY | | 13.9% | | 13.5% | | | | | |
NCF DY | | 12.2% | | 11.9% | | | | | |
| | | | | | | | | |
(1) | The Delta Hotels by Marriott - Detroit Metro Airport Property (as defined below) went through a $2 million conversion to its current Delta Hotels by Marriott brand from 2017 to 2018; as such, historical figures were not available. |
(2) | % of U/W Total Revenue for Room Expense, Food & Beverage Expense, and Other Department Expenses are based on their corresponding revenue line items. All other line items represent percent of Total Revenue. |
(3) | Other Revenue includes gift shop sales, laundry, valet and other revenues. |
THE INFORMATION IN THIS STRUCTURAL AND COLLATERAL TERM SHEET IS NOT COMPLETE AND MAY BE AMENDED PRIOR TO THE TIME OF SALE. THIS TERM SHEET IS NOT AN OFFER TO SELL THESE SECURITIES AND IT IS NOT A SOLICITATION OF AN OFFER TO BUY THESE SECURITIES IN ANY JURISDICTION WHERE THE OFFER OR SALE IS NOT PERMITTED.
153
| No. 15 – 4041 Central |
| |
| Mortgage Loan Information | | Mortgaged Property Information |
| Mortgage Loan Seller: | Wells Fargo Bank, National Association | | Single Asset/Portfolio: | Single Asset |
Credit Assessment (KBRA/Fitch/Moody’s): | NR/NR/NR | | Property Type – Subtype: | Office – CBD |
| Original Principal Balance(1): | $19,500,000 | | Location: | Phoenix, AZ |
| Cut-off Date Balance(1): | $19,386,052 | | Size: | 406,453 SF |
| % of Initial Pool Balance: | 2.0% | | Cut-off Date Balance Per SF(1): | $103.95 |
| Loan Purpose: | Refinance | | Maturity Date Balance Per SF(1): | $82.04 |
| Borrower Sponsor(2): | Zaya S. Younan | | Year Built/Renovated: | 1980/2016 |
| Guarantors(2): | Zaya S. Younan; Zaya and Sherry Younan Family Trust | | Title Vesting: | Fee |
| Mortgage Rate: | 3.6600% | | Property Manager: | Self-managed |
| Note Date: | October 3, 2019 | | Current Occupancy (As of): | 68.1% (10/1/2019) |
| Seasoning: | 4 months | | YE 2018 Occupancy: | 73.9% |
| Maturity Date: | October 11, 2029 | | YE 2017 Occupancy: | 78.0% |
| IO Period: | 0 months | | YE 2016 Occupancy: | 76.0% |
| Loan Term (Original): | 120 months | | YE 2015 Occupancy: | 67.9% |
| Amortization Term (Original): | 360 months | | As-Is Appraised Value: | $58,000,000 |
| Loan Amortization Type: | Amortizing Balloon | | As-Is Appraised Value Per SF: | $142.70 |
| Call Protection: | L(28),D(85),O(7) | | As-Is Appraisal Valuation Date: | September 9, 2019 |
| | | | | |
| Lockbox Type: | Hard/Upfront Cash Management | | Underwriting and Financial Information |
| Additional Debt(1): | Yes | | TTM NOI (9/30/2019)(4): | $3,962,776 |
| Additional Debt Type (Balance)(1): | Pari Passu ($22,865,599) | | YE 2018 NOI(3): | $2,840,480 |
| | | | YE 2017 NOI: | $2,455,428 |
| | | | YE 2016 NOI: | $2,793,722 |
| | | | U/W Revenues: | $6,984,424 |
| | | | U/W Expenses: | $2,684,938 |
| Escrows and Reserves | | U/W NOI(3): | $4,299,487 |
| | Initial | Monthly | Cap | | U/W NCF: | $4,044,872 |
| Taxes | $68,387 | $68,387 | NAP | | U/W DSCR based on NOI/NCF(1): | 1.84x / 1.73x |
| Insurance | $219,773 | $19,979 | NAP | | U/W Debt Yield based on NOI/NCF(1): | 10.2% / 9.6% |
| Replacement Reserve | $0 | $6,774(3) | $243,864(3) | | U/W Debt Yield at Maturity based on NOI/NCF(1): | 12.9% / 12.1% |
| TI/LC Reserve | $2,250,000 | $33,817 | $4,000,000 | | Cut-off Date LTV Ratio(1): | 72.8% |
| Common Area Reserve | $250,000 | $0 | NAP | | LTV Ratio at Maturity(1): | 57.5% |
| | | | | | | |
| | | | | | | | |
| Sources and Uses |
| Sources | | | | | Uses | | | |
| Original whole loan amount(1) | $42,500,000 | | 100.0 | % | | Loan payoff | $27,791,608 | | 65.4% |
| | | | | | Upfront reserves | 2,788,160 | | 6.6 |
| | | | | | Closing costs | 1,042,728 | | 2.5 |
| | | | | | Return of equity | 10,877,504 | | 25.6 |
| Total Sources | $42,500,000 | | 100.0 | % | | Total Uses | $42,500,000 | | 100.0% |
| (1) | The 4041 Central Mortgage Loan (as defined below) is part of the 4041 Central Whole Loan (as defined below), which is comprised of twopari passu promissory notes with an aggregate original principal balance of $42,500,000. The Cut-off Date Balance per SF, Maturity Date Balance per SF, U/W DSCR based on NOI/NCF, U/W Debt Yield based on NOI/NCF, U/W Debt Yield at Maturity based on NOI/NCF, Cut-off Date LTV Ratio and LTV Ratio at Maturity presented above are based on the aggregate principal balance of the promissory notes comprising 4041 Central Whole Loan. |
| (2) | Zaya S. Younan reported multiple foreclosures and discounted pay offs that occurred prior to 2014. See “Description of the Mortgage Pool— Loan Purpose; Default History, Bankruptcy Issues and Other Proceedings” in the Preliminary Prospectus. |
| (3) | The lender may require the 4041 Central Borrower (as defined below) to increase the replacements reserve (not more than once per year) if the lender reasonably determines such increase is necessary to maintain the proper operation of the 4041 Central Property. Replacement reserves are required beyond the cap upon (i) the occurrence and continuance of an event of default or (ii) if the 4041 Central Property is not being adequately maintained by the 4041 Central Borrower (as reasonably determined by the lender based on the annual site inspections). |
| (4) | See “Cash Flow Analysis” section for a discussion of the increase in NOI from 2018 to the TTM period and from the TTM period to U/W. |
THE INFORMATION IN THIS STRUCTURAL AND COLLATERAL TERM SHEET IS NOT COMPLETE AND MAY BE AMENDED PRIOR TO THE TIME OF SALE. THIS TERM SHEET IS NOT AN OFFER TO SELL THESE SECURITIES AND IT IS NOT A SOLICITATION OF AN OFFER TO BUY THESE SECURITIES IN ANY JURISDICTION WHERE THE OFFER OR SALE IS NOT PERMITTED.
154
| Office – CBD | Loan #15 | Cut-off Date Balance: | | $19,386,052 |
| 4041 North Central Avenue | 4041 Central | Cut-off Date LTV: | | 72.8% |
| Phoenix, AZ 85012 | | U/W NCF DSCR: | | 1.73x |
| | | U/W NOI Debt Yield: | | 10.2% |
The Mortgage Loan. The mortgage loan (the “4041 Central Mortgage Loan”) is part of a whole loan (the “4041 Central Whole Loan”) evidenced by twopari passu promissory notes with an aggregate original principal balance of $42,500,000. The 4041 Central Whole Loan is secured by a first priority mortgage encumbering the fee interest in a 406,453 square foot office building located in Phoenix, Arizona (the “4041 Central Property”). The 4041 Central Mortgage Loan represents the non-controlling Note A-2 with an original principal balance of $19,500,000. The below table summarizes the 4041 Central Whole Loan. The 4041 Central Whole Loan is serviced pursuant to the pooling and servicing agreement for the UBS 2019-C18 Trust. See “Description of the Mortgage Pool—The Whole Loans—The Non-Serviced Pari Passu Whole Loans” and “Pooling and Servicing Agreement—Servicing of the Non-Serviced Mortgage Loans” in the Preliminary Prospectus.
4041 Central Whole Loan Summary
| Notes | Original Balance | Cut-off Date Balance | Note Holder | Controlling Piece |
| A-1 | $23,000,000 | $22,865,599 | UBS 2019-C18 | Yes |
| A-2 | $19,500,000 | $19,386,052 | WFCM 2020-C55 | No |
| 4041 Central Whole Loan | $42,500,000 | $42,251,651 | | |
The Property.The 4041 Central Property comprises five office buildings totaling 406,453 square feet and an adjacent nine-story parking structure, located in Phoenix, Arizona. The 4041 Central Property’s five buildings comprise the 20-story main tower, which contains 321,517 square feet and four, one- and two-story garden buildings surrounding the main tower, which contain 84,936 square feet in the aggregate. The 4041 Central Property is situated on an approximately 5.7-acre site and includes 1,483 garage parking spaces, resulting in a parking ratio of approximately 3.6 spaces per 1,000 square feet of net rentable area.
Constructed in 1980 and renovated in 2014-2016, the 4041 Central Property was 68.1% leased as of October 1, 2019 to 12 tenants across various industries, including government, public services and technology. Approximately 58.2% of the net rentable area and 87.6% of underwritten base rent at the 4041 Central Property is attributed to investment grade tenants or tenants that are subsidiaries of investment grade-rated entities.
Since 2014, the borrower sponsor has spent approximately $3,075,000 on capital improvements, including modernization of elevators, new key card access system, updated chiller controls, new roofs and floor renovations. Approximately $380,000 in additional renovation work is planned, which includes parking automation and tower lobby and other common area renovations. An amount equal to $250,000 was reserved upfront at the time of origination of the 4041 Central Whole Loan for the common area renovation work, which is expected to be completed on or before October 2021.
Major Tenants.
U.S. Government GSA (“GSA”) (two separate leases; in aggregate, 153,030 square feet, 37.7% of net rentable area, 62.0% of underwritten base rent, September 2028/June 2029 lease expirations). GSA (Fitch/Moody’s/S&P: AAA/Aaa/AA+) has been a tenant at the 4041 Central Property since June 2009 and has two distinct leases, “GSA Lease 1” and “GSA Lease 2” (with the entity on both leases being the General Services Administration):
| ● | U.S. Government (IRS) (“GSA Lease 1”) (116,507 square feet, 28.7% of net rentable area, 46.4% of underwritten base rent, June 2029 lease expiration).GSA Lease 1 includes approximately 75,239 square feet occupied by the Internal Revenue Service (local office serving the Phoenix region) and approximately 41,268 square feet occupied by the Department of Homeland Security (“DHS”) and Immigration and Customs Enforcement (“ICE”). GSA Lease 1 includes space on the 5th, 13th and 16th through 20th floors of the main tower and portions of one garden building. GSA Lease 1 may be terminated at any time with 90 days’ prior written notice. GSA Lease 1 has been in effect since June 2009 and was recently renewed in June 2019 for a 10-year term with no renewal options. |
| ● | U.S. Government GSA (“GSA Lease 2”) (36,523 square feet, 9.0% of net rentable area, 15.6% of underwritten base rent, September 2028 lease expiration).GSA Lease 2 includes approximately 16,305 square feet occupied by DHS and ICE and 16,305 square feet occupied by the Small Business Administration. GSA Lease 2 includes space on the 8th through 10th floors of the main tower. After September 2023, GSA Lease 2 may be terminated with 90 days’ prior written notice. GSA took occupancy in the GSA Lease 2 space in October 2018 with a lease expiration in September 2028 with no renewal options. |
Maricopa County (two separate leases; in aggregate, 83,420 square feet, 20.5% of net rentable area, 25.5% of underwritten base rent, June 2023 lease expiration). Maricopa County (Fitch/Moody’s/S&P: AAA/Aaa/AAA) has been a tenant at the 4041 Central Property since July 2006 and encompasses two distinct leases with the Department of Public Health and the Superintendent of Schools (with the entity on both leases being Maricopa County). Both Maricopa County leases at the 4041 Central Property were renewed in July 2018.
| ● | Maricopa County Dept of Public Health (“DPH”)(50,810 square feet; 12.5% of net rentable area, 15.6% of underwritten base rent). The DPH office at the 4041 Central Property includes the office of community health innovation, epidemiology, healthcare innovation and performance improvement. The DPH currently occupies portions of the 6th, 7th and 14th floors of the main office tower and a portion of one garden building. The lease with the DPH may be terminated by the tenant at the end of each fiscal year (June 30th of each year) due to non-appropriation of funds. The lease has no remaining renewal options following its June 2023 expiration. |
THE INFORMATION IN THIS STRUCTURAL AND COLLATERAL TERM SHEET IS NOT COMPLETE AND MAY BE AMENDED PRIOR TO THE TIME OF SALE. THIS TERM SHEET IS NOT AN OFFER TO SELL THESE SECURITIES AND IT IS NOT A SOLICITATION OF AN OFFER TO BUY THESE SECURITIES IN ANY JURISDICTION WHERE THE OFFER OR SALE IS NOT PERMITTED.
155
| Office – CBD | Loan #15 | Cut-off Date Balance: | | $19,386,052 |
| 4041 North Central Avenue | 4041 Central | Cut-off Date LTV: | | 72.8% |
| Phoenix, AZ 85012 | | U/W NCF DSCR: | | 1.73x |
| | | U/W NOI Debt Yield: | | 10.2% |
| ● | Maricopa County (SOS) (“SOS”) (32,610 square feet, 8.0% of net rentable area, 10.0% of underwritten base rent). The office of the SOS (Superintendent of Schools) is statutorily responsible to provide services supporting school governing board elections, bond and override elections, appointments, school finance, and maintain home-school and private school records. The office of the SOS currently occupies portions of the 11th and 12th floors of the main tower. The lease with the SOS may be terminated by the tenant: (i) at the end of each fiscal year due to non-appropriation of funds or (ii) in no less than 7,500 square foot intervals at any time after June 30, 2020, with 90 days’ written notice. The lease has no remaining renewal options following its June 2023 expiration. |
The following table presents certain information relating to the tenancy at the 4041 Central Property:
Major Tenants
| Tenant Name | Credit Rating (Fitch/ Moody’s/
S&P) | Tenant NRSF | % of
NRSF | Annual U/W Base Rent PSF(1) | Annual
U/W Base Rent(1) | % of Total
Annual
U/W Base
Rent | Lease
Expiration
Date | Extension Options | Termination Option (Y/N) |
| Major Tenants | | | | | | | | |
| GSA Lease 1 | AAA/Aaa/AA+ | 116,507 | 28.7% | $26.17 | $3,049,009 | 46.4% | 6/11/2029 | None | Y(2) |
| GSA Lease 2 | AAA/Aaa/AA+ | 36,523 | 9.0% | $28.13 | $1,027,227 | 15.6% | 9/30/2028 | None | Y(3) |
| Total GSA | | 153,030 | 37.7% | $26.64(4) | $4,076,236(4) | 62.0% | | | |
| | | | | | | | | | |
| Maricopa County Dept of Public Health | AAA/Aaa/AAA | 50,810 | 12.5% | $20.11 | $1,021,635 | 15.6% | 6/30/2023 | None | Y(5) |
| Maricopa County (SOS) | AAA/Aaa/AAA | 32,610 | 8.0% | $20.11 | $655,688 | 10.0% | 6/30/2023 | None | Y(6) |
| Total Maricopa County | | 83,420 | 20.5% | $20.11(7) | $1,677,324(7) | 25.5% | | | |
| | | | | | | | | | |
| Native American Community Health Center | NR/NR/NR | 34,023 | 8.4% | $22.14 | $753,138 | 11.5% | 10/31/2024 | Various(8) | N |
| Total Major Tenants | 270,473 | 66.5% | $24.06 | $6,506,698 | 99.0% | | | |
| | | | | | | | | |
| Non-Major Tenants | 6,242 | 1.5% | $10.07 | $62,860 | 1.0% | | | |
| | | | | | | | | |
| Occupied Collateral Total | 276,715 | 68.1% | $23.74 | $6,569,558 | 100.0% | | | |
| | | | | | | | | |
| Vacant Space | 129,738 | 31.9% | | | | | | |
| | | | | | | | | |
| Collateral Total | 406,453 | 100.0% | | | | | | |
| | | | | | | | | | |
| (1) | Annual U/W Base Rent PSF and Annual U/W Base Rent include contractual rent steps through November 2020 totaling $5,209 and straight-line rent averaging for the investment grade tenants through the lesser of their remaining lease terms totaling $159,105. |
| (2) | GSA Lease 1 may be terminated by the GSA by giving 90 days’ prior notice in writing to the 4041 Central Borrower. |
| (3) | After September 2023, GSA Lease 2 lease may be terminated by the GSA by giving 90 days’ prior notice in writing to the 4041 Central Borrower. |
| (4) | Annual U/W Base Rent PSF and Annual U/W Base Rent includes straight-line rent averaging through the lease term. GSA’s current base rent is $26.06 per square foot. |
| (5) | The lease with the Maricopa County Dept of Public Health may be terminated by the tenant, without any penalty, at the end of each fiscal year (June 30th of each year) due to non-appropriation of funds. |
| (6) | The lease with the Maricopa County (SOS) may be terminated by the tenant: (i) without penalty, at the end of each fiscal year due to non-appropriation of funds or (ii) in no less than 7,500 square foot intervals at any time after June 30, 2020, with 90 days written notice. |
| (7) | Annual U/W Base Rent PSF and Annual U/W Base Rent includes straight-line rent averaging through the lease term. Maricopa County’s current base rent is $19.25 per square foot. |
| (8) | Native American Community Health Center has one, 5-year option to extend its lease for its 25,770 square foot space and two, 5-year options to extend its lease for its 8,253 square foot space, each at the fair market rental rate. |
THE INFORMATION IN THIS STRUCTURAL AND COLLATERAL TERM SHEET IS NOT COMPLETE AND MAY BE AMENDED PRIOR TO THE TIME OF SALE. THIS TERM SHEET IS NOT AN OFFER TO SELL THESE SECURITIES AND IT IS NOT A SOLICITATION OF AN OFFER TO BUY THESE SECURITIES IN ANY JURISDICTION WHERE THE OFFER OR SALE IS NOT PERMITTED.
156
| Office – CBD | Loan #15 | Cut-off Date Balance: | | $19,386,052 |
| 4041 North Central Avenue | 4041 Central | Cut-off Date LTV: | | 72.8% |
| Phoenix, AZ 85012 | | U/W NCF DSCR: | | 1.73x |
| | | U/W NOI Debt Yield: | | 10.2% |
The following table presents certain information relating to the lease rollover schedule at the 4041 Central Property:
Lease Expiration Schedule(1)(2)
Year Ending
December 31, | No. of Leases Expiring | Expiring NRSF | % of Total NRSF | Cumulative Expiring NRSF | Cumulative % of Total NRSF | Annual
U/W
Base Rent(3) | % of Total Annual U/W Base Rent | Annual
U/W
Base Rent
PSF(3) |
| MTM | 2 | 2 | 0.0% | 2 | 0.0% | $0 | 0.0% | $0.00 |
| 2020 | 1 | 1,858 | 0.5% | 1,860 | 0.5% | $0 | 0.0% | $0.00 |
| 2021 | 0 | 0 | 0.0% | 1,860 | 0.5% | $0 | 0.0% | $0.00 |
| 2022 | 2 | 1,364 | 0.3% | 3,224 | 0.8% | $32,200 | 0.5% | $23.61 |
| 2023 | 3 | 83,908 | 20.6% | 87,132 | 21.4% | $1,687,584 | 25.7% | $20.11 |
| 2024 | 1 | 34,023 | 8.4% | 121,155 | 29.8% | $753,138 | 11.5% | $22.14 |
| 2025 | 1 | 2,530 | 0.6% | 123,685 | 30.4% | $20,400 | 0.3% | $8.06 |
| 2026 | 0 | 0 | 0.0% | 123,685 | 30.4% | $0 | 0.0% | $0.00 |
| 2027 | 0 | 0 | 0.0% | 123,685 | 30.4% | $0 | 0.0% | $0.00 |
| 2028 | 1 | 36,523 | 9.0% | 160,208 | 39.4% | $1,027,227 | 15.6% | $28.13 |
| 2029 | 1 | 116,507 | 28.7% | 276,715 | 68.1% | $3,049,009 | 46.4% | $26.17 |
| 2030 | 0 | 0 | 0.0% | 276,715 | 68.1% | $0 | 0.0% | $0.00 |
| Thereafter | 0 | 0 | 0.0% | 276,715 | 68.1% | $0 | 0.0% | $0.00 |
| Vacant | 0 | 129,738 | 31.9% | 406,453 | 100.0% | $0 | 0.0% | $0.00 |
| Total/Weighted Average | 12 | 406,453 | 100.0% | | | $6,569,558 | 100.0% | $23.74 |
| (1) | Information obtained from the underwritten rent roll. |
| (2) | Certain tenants may have lease termination options that are exercisable prior to the originally stated expiration date of the subject lease and that are not considered in the Lease Expiration Schedule. |
| (3) | Total/Weighted Average Annual U/W Base Rent and Annual U/W Base Rent PSF exclude vacant space. |
The following table presents historical occupancy percentages at the 4041 Central Property:
Historical Occupancy
12/31/2015(1) | | 12/31/2016(1) | | 12/31/2017(1) | | 12/31/2018(1) | | 10/1/2019(2) |
| 67.9% | | 76.0% | | 78.0% | | 73.9% | | 68.1% |
| (1) | Information obtained from a third party market research provider. |
| (2) | Information obtained from the underwritten rent roll. |
Market Overview and Competition.The 4041 Central Property is located in Phoenix, Maricopa County, Arizona, approximately 2.4 miles north of Interstate 10 (provides access eastbound to Scottsdale and Tempe, Arizona), 2.5 miles east of Interstate 17 (which provides north-south access through Phoenix), 3.4 miles north of the downtown Phoenix central business district and 6.6 miles northwest of the Phoenix Sky Harbor International Airport. The 4041 Central Property is situated approximately 0.3 miles southwest of the intersection of E Indian School Road and N 3rd Street, which, according to a third party market research provider, had a daily traffic count of approximately 47,578 vehicles as of 2018.
Park Central Mall, an approximately 500,000 square foot mall and office center, is located approximately 0.8 miles southwest of the 4041 Central Property. According to the appraisal, Park Central Mall is currently being renovated to a retail and office space that will feature creative office space, a medical health science center and a hotel. Park Central received a grant from the City of Phoenix to create an urban park on the property, which is expected to include a splash pad, fire pits, seating areas and an outdoor entertainment venue and plans to provide space for local artists and provide the atrium for entertainment events during non-operating office hours. According to the appraisal, the first phase of renovations began in 2018, with the remaining renovations slated for completion in 2021.
According to a third party market research provider, the estimated 2019 population within a three- and five-mile radius of the 4041 Central Property was approximately 184,568 and 459,010, respectively; and the estimated 2019 average household income within the same radii was approximately $69,288 and $65,943, respectively.
Submarket Information – According to a third-party market research report, the 4041 Central Property is situated within the Midtown submarket of the Phoenix Office Market. As of October 16, 2019, the Midtown submarket reported a total inventory of approximately 13.1 million square feet with a 17.5% vacancy rate and average asking rent of $24.88 per square foot, gross. Within a five-mile radius of the 4041 Central Property, as of October 16, 2019, there were 2,278 office properties totaling approximately 53.2 million square feet with a 13.1% vacancy rate, per a third-party market research provider.
THE INFORMATION IN THIS STRUCTURAL AND COLLATERAL TERM SHEET IS NOT COMPLETE AND MAY BE AMENDED PRIOR TO THE TIME OF SALE. THIS TERM SHEET IS NOT AN OFFER TO SELL THESE SECURITIES AND IT IS NOT A SOLICITATION OF AN OFFER TO BUY THESE SECURITIES IN ANY JURISDICTION WHERE THE OFFER OR SALE IS NOT PERMITTED.
157
| Office – CBD | Loan #15 | Cut-off Date Balance: | | $19,386,052 |
| 4041 North Central Avenue | 4041 Central | Cut-off Date LTV: | | 72.8% |
| Phoenix, AZ 85012 | | U/W NCF DSCR: | | 1.73x |
| | | U/W NOI Debt Yield: | | 10.2% |
The following table presents certain information relating to the appraiser’s market rent conclusions for the 4041 Central Property:
Market Rent Summary(1)
| | Office Tower | GSA | Low-Rise Office | Deli |
| Market Rent (PSF) | $21.50 | $26.00 | $21.00 | $9.00 |
| Lease Term (Years) | 5 | 10 | 5 | 3 |
| Lease Type (Reimbursements) | MG | Gross | MG | Gross |
| Rent Increase Projection | $0.50per annum | Flat | $0.50per annum | $0.50per annum |
| (1) | Information obtained from the appraisal. |
The table below presents certain information relating to comparable sales pertaining to the 4041 Central Property identified by the appraiser:
Comparable Sales(1)
| Property Name | Location | Year Built/Renovated | Occupancy | Rentable Area (SF) | Sale Date | Sale Price | Adjusted Sale Price | Adjusted Sale Price (PSF) |
| Great American Tower | Phoenix, AZ | 1985/NAP | 86% | 344,527 | Nov-16 | $49,000,000 | $49,000,000 | $142.22 |
| CBIZ Plaza | Phoenix, AZ | 1980/NAP | 77% | 266,321 | Feb-17 | $26,000,000 | $30,000,000 | $112.65 |
| Central Arts Plaza | Phoenix, AZ | 1991/NAP | 72% | 482,108 | Jan-18 | $80,700,000 | $79,000,000 | $163.86 |
| 2020 on Central | Phoenix, AZ | 1985/2015 | 84% | 247,645 | Mar-19 | $23,888,888 | $24,638,888 | $99.49 |
| Clarendon Place | Phoenix, AZ | 1984/2017 | 96% | 91,353 | Jun-19 | $13,650,000 | $13,650,000 | $149.42 |
| Valley Commerce Center | Phoenix, AZ | 1984/NAP | 84% | 215,663 | Sep-19 | $27,950,000 | $27,950,000 | $129.60 |
| (1) | Information obtained from the appraisal. |
THE INFORMATION IN THIS STRUCTURAL AND COLLATERAL TERM SHEET IS NOT COMPLETE AND MAY BE AMENDED PRIOR TO THE TIME OF SALE. THIS TERM SHEET IS NOT AN OFFER TO SELL THESE SECURITIES AND IT IS NOT A SOLICITATION OF AN OFFER TO BUY THESE SECURITIES IN ANY JURISDICTION WHERE THE OFFER OR SALE IS NOT PERMITTED.
158
| Office – CBD | Loan #15 | Cut-off Date Balance: | | $19,386,052 |
| 4041 North Central Avenue | 4041 Central | Cut-off Date LTV: | | 72.8% |
| Phoenix, AZ 85012 | | U/W NCF DSCR: | | 1.73x |
| | | U/W NOI Debt Yield: | | 10.2% |
The following table presents certain information relating to comparable high-rise office leases related to 4041 Central Property:
Comparable High-Rise Office Leases(1)
| Property Name/Location | Year Built/ Renovated | Total GLA (SF) | Distance from Subject | Occ. | Tenant | Tenant Size (SF) | Lease Start Date | Lease Term | Annual Base Rent PSF | Lease Type |
4041 Central (subject) 4041 North Central Avenue Phoenix, AZ | 1980/2016 | 406,453(2) | - | 68.1%(2) | | | | | | |
Security Title Plaza 3636 North Central Avenue Phoenix, AZ | 1983/NAP | 219,032 | 0.4 miles | 89% | CAVCO GLHN Architects Arizona Children’s Assoc. | 14,994 1,913 44,380 | Aug-18 Jun-18 Jun-18 | 10.0 Yrs 5.4 Yrs 6.5 Yrs | $22.50 $20.00 $23.00 | MG MG MG |
3300 Tower 3300 North Central Avenue Phoenix, AZ | 1978/NAP | 363,655 | 0.7 miles | 67% | AZ Dep of Education Jordin, Baker, Hickman & Houston | 69,555 14,146 | Jun-19 Nov-17 | 5.7 Yrs 2.3 Yrs | $18.53 $24.00 | FSG MG |
Great American Tower 3200 North Central Avenue Phoenix, AZ | 1986/NAP | 338,411 | 0.7 miles | 85% | Crossroads Law The Kenrich Group Trafficade Service Hynes Benefit Consulting | 3,082 4,074 950 1,584 | Apr-19 Apr-19 Feb-19 Feb-19 | 4.3 Yrs 5.0 Yrs 3.2 Yrs 5.5 Yrs | $25.00 $23.89 $25.50 $24.00 | MG MG MG MG |
Phoenix Corporate Center 3003 North Central Avenue Phoenix, AZ | 1964/2006 | 457,595 | 1.1 miles | 68% | Arizona Supreme Court VIP Mortgage Hyland Software Mountain Park Health | 17,453 6,605 13,632 34,506 | Feb-19 Sep-18 Jun-18 Apr-18 | 7.6 Yrs 5.3 Yrs 5.7 Yrs 11.0 Yrs | $21.00 $21.00 $22.00 $21.00 | MG MG MG MG |
2800 Tower 2800 North Central Avenue Phoenix, AZ | 1988/NAP | 359,949 | 1.2 miles | 65% | Solar Mosaic Miller, Pitt, Feldman, et al Advanced Structural Engineering Skanska USA | 10,767 3,155 8,101 6,498 | Mar-19 Oct-18 Sep-18 May-18 | 3.3 Yrs 3.3 Yrs 3.0 Yrs 6.6 Yrs | $27.00 $23.00 $23.00 $23.59 | MG MG MG MG |
2700 Tower 2700 North Central Avenue Phoenix, AZ | 1985/NAP | 222,873 | 1.3 miles | 72% | AZ Coalition BenefitMall | 5,700 10,049 | Oct-18 May-18 | 6.4 Yrs 5.3 Yrs | $24.50 $21.00 | MG MG |
| (1) | Information obtained from the appraisal. |
| (2) | Information obtained from the underwritten rent roll. |
THE INFORMATION IN THIS STRUCTURAL AND COLLATERAL TERM SHEET IS NOT COMPLETE AND MAY BE AMENDED PRIOR TO THE TIME OF SALE. THIS TERM SHEET IS NOT AN OFFER TO SELL THESE SECURITIES AND IT IS NOT A SOLICITATION OF AN OFFER TO BUY THESE SECURITIES IN ANY JURISDICTION WHERE THE OFFER OR SALE IS NOT PERMITTED.
159
| Office – CBD | Loan #15 | Cut-off Date Balance: | | $19,386,052 |
| 4041 North Central Avenue | 4041 Central | Cut-off Date LTV: | | 72.8% |
| Phoenix, AZ 85012 | | U/W NCF DSCR: | | 1.73x |
| | | U/W NOI Debt Yield: | | 10.2% |
The following table presents certain information relating to comparable low-rise office leases related to 4041 Central Property:
Comparable Low-Rise Office Leases(1)
| Property Name/Location | Year Built/ Renovated | Total GLA (SF) | Distance from Subject | Occ. | Tenant | Tenant Size (SF) | Lease Start Date | Lease Term | Annual Base Rent PSF | Lease Type |
4041 Central (subject) 4041 North Central Avenue Phoenix, AZ | 1980/2016 | 406,453(2) | - | 68.1%(2) | | | | | | |
Central Park Forest 2700-2702 North 3rd Street Phoenix, AZ | 1981/NAP | 131,219 | 1.3 miles | 100% | Quoted | --- | --- | --- | $18.50 | MG |
Clarendon Place 300 West Clarendon Avenue Phoenix, AZ | 1984/2017 | 91,353 | 0.6 miles | 100% | First Strategic Arizona Vulva Clinic Pepid LLC Veritas Funding | 2,879 3,550 9,130 2,585 | Feb-19 Jan-19 Oct-18 Sep-18 | 2.9 Yrs 4.0 Yrs 5.0 Yrs 3.3 Yrs | $20.00 $21.00 $20.50 $22.00 | MG MG MG MG |
Siete Square (II) 3707 North 7th Street Phoenix, AZ | 1983/1997 | 54,072 | 0.7 miles | 82% | Undisclosed Undisclosed | 3,097 4,428 | Sep-18 Jul-18 | 3.0 Yrs 1.0 Yrs | $18.50 $19.50 | MG MG |
Siete Square (I & IV) 3737 & 3877 North 7th Street Phoenix, AZ | 1983/NAP | 115,769 | 0.6 miles | 82% | Arizona Legal Support | 2,543 | Sep-19 | 5.0 Yrs | $21.50 | MG |
Valley Commerce Center 4745-4747 North 7th Street Phoenix, AZ | 1984/NAP | 215,663 | 1.5 miles | 80% | Fredenberg Beams ABI Document Support The Young Center for Immigrant Children’s Rights | 1,232 1,920 5,371 | May-19 Jan-19 Oct-18 | 3.3 Yrs 3.3 Yrs 2.5 Yrs | $23.50 $23.50 $23.00 | MG MG MG |
Paragon Plaza 5333 North 7th Avenue Phoenix, AZ | 1984/NAP | 63,936 | 2.3 miles | 85% | Family Involvement Center Law Firm Landmark Capital Corporation Bureau Veritas North America | 8,200 1,800 2,482 1,339 | Aug-19 Mar-19 Mar-18 Jan-18 | 3.2 Yrs 5.0 Yrs 3.3 Yrs 3.0 Yrs | $19.75 $20.00 $20.50 $21.50 | MG MG MG MG |
| (1) | Information obtained from the appraisal. |
| (2) | Information obtained from the underwritten rent roll. |
THE INFORMATION IN THIS STRUCTURAL AND COLLATERAL TERM SHEET IS NOT COMPLETE AND MAY BE AMENDED PRIOR TO THE TIME OF SALE. THIS TERM SHEET IS NOT AN OFFER TO SELL THESE SECURITIES AND IT IS NOT A SOLICITATION OF AN OFFER TO BUY THESE SECURITIES IN ANY JURISDICTION WHERE THE OFFER OR SALE IS NOT PERMITTED.
160
| Office – CBD | Loan #15 | Cut-off Date Balance: | | $19,386,052 |
| 4041 North Central Avenue | 4041 Central | Cut-off Date LTV: | | 72.8% |
| Phoenix, AZ 85012 | | U/W NCF DSCR: | | 1.73x |
| | | U/W NOI Debt Yield: | | 10.2% |
Operating History and Underwritten Net Cash Flow. The following table presents certain information relating to the historical operating performance and underwritten net cash flow at the 4041 Central Property:
Cash Flow Analysis
| | | 2016 | | 2017 | | 2018(1) | | TTM
9/30/2019(1)(2) | | U/W(2) | | %(3) | | U/W $ per SF |
| Base Rent | | $5,001,101 | | $5,034,957 | | $5,182,994 | | $6,335,048 | | $6,405,243 | | 65.8% | | $15.76 | |
| Free Rent Adjustment | | (103,938) | | (258,284) | | 0 | | (3,506) | | 0 | | 0.0 | | 0.00 | |
| Contractual Rent Steps(4) | | 0 | | 0 | | 0 | | 0 | | 164,315 | | 1.7 | | 0.40 | |
| Grossed Up Vacant Space | | 0 | | 0 | | 0 | | 0 | | 2,755,125 | | 28.3 | | 6.78 | |
| Gross Potential Rent | | $4,897,163 | | $4,776,672 | | $5,182,994 | | $6,331,542 | | $9,324,682 | | 95.7% | | $22.94 | |
| Other Income(5) | | 3,849 | | 2,113 | | 725 | | 826 | | 826 | | 0.0 | | 0.00 | |
| Parking Income | | 415,953 | | 355,120 | | 237,640 | | 225,420 | | 225,420 | | 2.3 | | 0.55 | |
| Total Recoveries | | 262,891 | | 258,189 | | 248,176 | | 188,621 | | 188,621 | | 1.9 | | 0.46 | |
| Net Rental Income | | $5,579,856 | | $5,392,094 | | $5,669,535 | | $6,746,409 | | $9,739,549 | | 100.0% | | $23.96 | |
| (Vacancy & Credit Loss) | | 0 | | 0 | | 0 | | 0 | | (2,755,125)(6) | | (29.5) | | (6.78) | |
| Effective Gross Income | | $5,579,856 | | $5,392,094 | | $5,669,535 | | $6,746,409 | | $6,984,424 | | 71.7% | | $17.18 | |
| | | | | | | | | | | | | | | | |
| Real Estate Taxes | | 672,289 | | 706,532 | | 739,043 | | 784,462 | | 781,564 | | 11.2 | | 1.92 | |
| Insurance | | 61,036 | | 61,341 | | 99,969 | | 156,553 | | 219,773 | | 3.1 | | 0.54 | |
| Management Fee | | 223,197 | | 215,767 | | 226,847 | | 270,138 | | 259,664 | | 3.7 | | 0.64 | |
| Other Operating Expenses | | 1,829,613 | | 1,953,026 | | 1,763,196 | | 1,572,479 | | 1,423,937 | | 20.4 | | 3.50 | |
| Total Operating Expenses | | $2,786,134 | | $2,936,666 | | $2,829,055 | | $2,783,632 | | $2,684,938 | | 38.4% | | $6.61 | |
| | | | | | | | | | | | | | | | |
| Net Operating Income | | $2,793,722 | | $2,455,428 | | $2,840,480 | | $3,962,776 | | $4,299,487 | | 61.6% | | $10.58 | |
| Replacement Reserves | | 0 | | 0 | | 0 | | 0 | | 73,162 | | 1.0 | | 0.18 | |
| TI/LC | | 0 | | 0 | | 0 | | 0 | | 181,453 | | 2.6 | | 0.45 | |
| Net Cash Flow | | $2,793,722 | | $2,455,428 | | $2,840,480 | | $3,962,776 | | $4,044,872 | | 57.9% | | $9.95 | |
| | | | | | | | | | | | | | | | |
| NOI DSCR(7) | | 1.20x | | 1.05x | | 1.22x | | 1.70x | | 1.84x | | | | | |
| NCF DSCR(7) | | 1.20x | | 1.05x | | 1.22x | | 1.70x | | 1.73x | | | | | |
| NOI Debt Yield(7) | | 6.6% | | 5.8% | | 6.7% | | 9.4% | | 10.2% | | | | | |
| NCF Debt Yield(7) | | 6.6% | | 5.8% | | 6.7% | | 9.4% | | 9.6% | | | | | |
| (1) | The increase in Net Operating Income from 2018 to TTM 9/30/2019 was driven by (i) two new leases totaling approximately 16.0% of underwritten base rent commencing between October 2018 and June 2019 and (ii) the renewal of both Maricopa County leases in July 2018 (25.5% of underwritten base rent). |
| (2) | The increase in Net Operating Income from TTM 9/30/2019 to U/W was driven by (i) three renewal leases totaling approximately 46.9% of underwritten base rent commencing between June 2019 and January 2020 (including the GSA Lease 1 renewal in June 2019) and (ii) the inclusion of contractual rent steps through November 2020 totaling $5,209 and straight-line rent averaging for the investment grade tenants through the lesser of their remaining lease terms totaling $159,105. |
| (3) | Represents (i) percent of Net Rental Income for all revenue fields, (ii) percent of Gross Potential Rent for Vacancy & Credit Loss and (iii) percent of Effective Gross Income for all other fields. |
| (4) | Represents contractual rent steps through November 2020 and straight-line rent averaging for the investment grade tenants over their remaining lease terms (see “Major Tenants” table above). |
| (5) | Other Income is primarily composed of rent paid by Federal Express Corporation and United Parcel Service plus miscellaneous items. |
| (6) | The underwritten economic vacancy is 29.5%. The 4041 Central Property was 68.1% leased as of October 1, 2019. |
| (7) | The debt service coverage ratios and debt yields are based on the 4041 Central Whole Loan. |
THE INFORMATION IN THIS STRUCTURAL AND COLLATERAL TERM SHEET IS NOT COMPLETE AND MAY BE AMENDED PRIOR TO THE TIME OF SALE. THIS TERM SHEET IS NOT AN OFFER TO SELL THESE SECURITIES AND IT IS NOT A SOLICITATION OF AN OFFER TO BUY THESE SECURITIES IN ANY JURISDICTION WHERE THE OFFER OR SALE IS NOT PERMITTED.
161
| Wells Fargo Commercial Mortgage Trust 2020-C55 | Transaction Contact Information |
VI. Transaction Contact Information
Questions regarding this Structural and Collateral Term Sheet may be directed to any of the following individuals:
| | Wells Fargo Securities, LLC | |
| | | |
| | Brigid Mattingly | Tel. (312) 269-3062 |
| | | |
| | A.J. Sfarra | Tel. (212) 214-5613 |
| | | |
| | Alex Wong | Tel. (212) 214-5615 |
| | Barclays Capital Inc. | |
| | | |
| | Daniel Vinson | Tel. (212) 528-8224 |
| | | |
| | Brian Wiele | Tel. (212) 412-5780 |
THE INFORMATION IN THIS STRUCTURAL AND COLLATERAL TERM SHEET IS NOT COMPLETE AND MAY BE AMENDED PRIOR TO THE TIME OF SALE. THIS TERM SHEET IS NOT AN OFFER TO SELL THESE SECURITIES AND IT IS NOT A SOLICITATION OF AN OFFER TO BUY THESE SECURITIES IN ANY JURISDICTION WHERE THE OFFER OR SALE IS NOT PERMITTED.
162