| | | FREE WRITING PROSPECTUS |
| | | FILED PURSUANT TO RULE 433 |
| | | REGISTRATION 333-226486-14 |
| | | |
Free Writing Prospectus
Structural and Collateral Term Sheet
$731,138,094
(Approximate Initial Pool Balance)
$638,831,000
(Approximate Aggregate Certificate Balance of Offered Certificates)
Wells Fargo Commercial Mortgage Trust 2020-C56
as Issuing Entity
Wells Fargo Commercial Mortgage Securities, Inc.
as Depositor
Column Financial, Inc.
LMF Commercial, LLC
UBS AG
Barclays Capital Real Estate Inc.
Ladder Capital Finance LLC
Argentic Real Estate Finance LLC
Wells Fargo Bank, National Association
as Sponsors and Mortgage Loan Sellers
Commercial Mortgage Pass-Through Certificates
Series 2020-C56
May 21, 2020
WELLS FARGO SECURITIES Co-Lead Manager and Joint Bookrunner | CREDIT SUISSE Co-Lead Manager and Joint Bookrunner | UBS SECURITIES LLC Co-Lead Manager and Joint Bookrunner | BARCLAYS Co-Lead Manager and Joint Bookrunner |
| | | |
Academy Securities Co-Manager | | | Drexel Hamilton Co-Manager |
STATEMENT REGARDING THIS FREE WRITING PROSPECTUS
The depositor has filed a registration statement (including a prospectus) with the Securities and Exchange Commission (“SEC”) (SEC File No. 333-226486) for the offering to which this communication relates. Before you invest, you should read the prospectus in the registration statement and other documents the depositor has filed with the SEC for more complete information about the depositor, the issuing entity and this offering. You may get these documents for free by visiting EDGAR on the SEC Web site at www.sec.gov. Alternatively, the depositor, any underwriter, or any dealer participating in the offering will arrange to send you the prospectus after filing if you request it by calling toll free 1-800-745-2063 (8 a.m. – 5 p.m. EST) or by emailing wfs.cmbs@wellsfargo.com.
Nothing in this document constitutes an offer of securities for sale in any jurisdiction where the offer or sale is not permitted. The information contained herein is preliminary as of the date hereof, supersedes any such information previously delivered to you and will be superseded by any such information subsequently delivered and ultimately by the final prospectus relating to the securities. These materials are subject to change, completion, supplement or amendment from time to time.
This free writing prospectus has been prepared by the underwriters for information purposes only and does not constitute, in whole or in part, a prospectus for the purposes of Regulation (EU) 2017/1129 and/or Part VI of the Financial Services and Markets Act 2000, as amended, or other offering document.
STATEMENT REGARDING ASSUMPTIONS AS TO SECURITIES, PRICING ESTIMATES AND OTHER INFORMATION
The attached information contains certain tables and other statistical analyses (the “Computational Materials”) which have been prepared in reliance upon information furnished by the Mortgage Loan Sellers. Numerous assumptions were used in preparing the Computational Materials, which may or may not be reflected herein. As such, no assurance can be given as to the Computational Materials’ accuracy, appropriateness or completeness in any particular context; or as to whether the Computational Materials and/or the assumptions upon which they are based reflect present market conditions or future market performance. The Computational Materials should not be construed as either projections or predictions or as legal, tax, financial or accounting advice. You should consult your own counsel, accountant and other advisors as to the legal, tax, business, financial and related aspects of a purchase of these securities. Any weighted average lives, yields and principal payment periods shown in the Computational Materials are based on prepayment and/or loss assumptions, and changes in such prepayment and/or loss assumptions may dramatically affect such weighted average lives, yields and principal payment periods. In addition, it is possible that prepayments or losses on the underlying assets will occur at rates higher or lower than the rates shown in the attached Computational Materials. The specific characteristics of the securities may differ from those shown in the Computational Materials due to differences between the final underlying assets and the preliminary underlying assets used in preparing the Computational Materials. The principal amount and designation of any security described in the Computational Materials are subject to change prior to issuance. None of Wells Fargo Securities, LLC, Barclays Capital Inc., Credit Suisse Securities (USA) LLC, UBS Securities LLC, Academy Securities, Inc., Drexel Hamilton, LLC, or any of their respective affiliates, make any representation or warranty as to the actual rate or timing of payments or losses on any of the underlying assets or the payments or yield on the securities. The information in this presentation is based upon management forecasts and reflects prevailing conditions and management’s views as of this date, all of which are subject to change. In preparing this presentation, we have relied upon and assumed, without independent verification, the accuracy and completeness of all information available from public sources or which was provided to us by or on behalf of the Mortgage Loan Sellers or which was otherwise reviewed by us.
This free writing prospectus contains certain forward-looking statements. If and when included in this free writing prospectus, the words “expects”, “intends”, “anticipates”, “estimates” and analogous expressions and all statements that are not historical facts, including statements about our beliefs or expectations, are intended to identify forward-looking statements. Any forward-looking statements are made subject to risks and uncertainties which could cause actual results to differ materially from those stated. Those risks and uncertainties include, among other things, declines in general economic and business conditions, increased competition, changes in demographics, changes in political and social conditions, regulatory initiatives and changes in customer preferences, many of which are beyond our control and the control of any other person or entity related to this offering. The forward-looking statements made in this free writing prospectus are made as of the date stated on the cover. We have no obligation to update or revise any forward-looking statement.
Wells Fargo Securities is the trade name for the capital markets and investment banking services of Wells Fargo & Company and its subsidiaries, including but not limited to Wells Fargo Securities, LLC, a member of NYSE, FINRA, NFA and SIPC, Wells Fargo Prime Services, LLC, a member of FINRA, NFA and SIPC, and Wells Fargo Bank, N.A. Wells Fargo Securities, LLC and Wells Fargo Prime Services, LLC are distinct entities from affiliated banks and thrifts.
IMPORTANT NOTICE REGARDING THE OFFERED CERTIFICATES
The information herein is preliminary and may be supplemented or amended prior to the time of sale. In addition, the Offered Certificates referred to in these materials and the asset pool backing them are subject to modification or revision (including the possibility that one or more classes of certificates may be split, combined or eliminated at any time prior to issuance or availability of a final prospectus) and are offered on a “when, as and if issued” basis.
The underwriters described in these materials may from time to time perform investment banking services for, or solicit investment banking business from, any company named in these materials. The underwriters and/or their affiliates or respective employees may from time to time have a long or short position in any security or contract discussed in these materials.
The information contained herein supersedes any previous such information delivered to any prospective investor and will be superseded by information delivered to such prospective investor prior to the time of sale.
IMPORTANT NOTICE RELATING TO AUTOMATICALLY-GENERATED EMAIL DISCLAIMERS
Any legends, disclaimers or other notices that may appear at the bottom of any email communication to which this free writing prospectus is attached relating to (1) these materials not constituting an offer (or a solicitation of an offer), (2) any representation that these materials are accurate or complete and may not be updated or (3) these materials possibly being confidential, are not applicable to these materials and should be disregarded. Such legends, disclaimers or other notices have been automatically generated as a result of these materials having been sent via Bloomberg or another system.
THE INFORMATION IN THIS STRUCTURAL AND COLLATERAL TERM SHEET IS NOT COMPLETE AND MAY BE AMENDED PRIOR TO THE TIME OF SALE. THIS TERM SHEET IS NOT AN OFFER TO SELL THESE SECURITIES AND IT IS NOT A SOLICITATION OF AN OFFER TO BUY THESE SECURITIES IN ANY JURISDICTION WHERE THE OFFER OR SALE IS NOT PERMITTED.
2
| Wells Fargo Commercial Mortgage Trust 2020-C56 | Certificate Structure |
I. Certificate Structure
| | Class | Expected Ratings
(Fitch/KBRA/Moody’s)(1) | Approximate Initial Certificate Balance or Notional Amount(2) | Approx. Initial Credit Support(3) | Pass-Through Rate Description | Weighted Average Life (Years)(4) | Expected Principal Window(4) | Certificate Principal to Value Ratio(5) | Certificate Principal U/W NOI Debt Yield(6) |
| | Offered Certificates | | | | |
| | A-1 | AAAsf/AAA(sf)/Aaa(sf) | $18,464,000 | 30.000% | (7) | 2.54 | 07/20 – 12/24 | 40.9% | 13.9% |
| | A-2 | AAAsf/AAA(sf)/Aaa(sf) | $54,939,000 | 30.000% | (7) | 4.62 | 12/24 – 02/25 | 40.9% | 13.9% |
| | A-3 | AAAsf/AAA(sf)/Aaa(sf) | $2,605,000 | 30.000% | (7) | 6.70 | 02/27 – 02/27 | 40.9% | 13.9% |
| | A-SB | AAAsf/AAA(sf)/Aaa(sf) | $29,226,000 | 30.000% | (7) | 7.14 | 02/25 – 11/29 | 40.9% | 13.9% |
| | A-4(8) | AAAsf/AAA(sf)/Aaa(sf) | (8)(9) | 30.000% | (7) | (9) | (9) | 40.9% | 13.9% |
| | A-5(8) | AAAsf/AAA(sf)/Aaa(sf) | (8)(9) | 30.000% | (7) | (9) | (9) | 40.9% | 13.9% |
| | X-A | AAAsf/AAA(sf)/Aaa(sf) | $511,796,000(10) | N/A | Variable(11) | N/A | N/A | N/A | N/A |
| | X-B(14) | A-sf/AAA(sf)/NR | $127,035,000(12) | N/A | Variable(13) | N/A | N/A | N/A | N/A |
| | A-S(8) | AAAsf/AAA(sf)/Aa2(sf) | $62,147,000(8) | 21.500% | (7) | 9.78 | 03/30 – 03/30 | 45.8% | 12.4% |
| | B | AA-sf/AA-(sf)/NR | $35,643,000 | 16.625% | (7) | 9.78 | 03/30 – 03/30 | 48.7% | 11.7% |
| | C(14) | A-sf/A-(sf)/NR | $29,245,000 | 12.625% | (7) | 9.79 | 03/30 – 04/30 | 51.0% | 11.2% |
| | Risk Retention Certificates | | | | | | |
| | D-RR(14) | BBB+sf/A-(sf)/NR | $10,967,000 | 11.125% | (7) | 9.86 | 04/30 – 04/30 | 51.9% | 11.0% |
| | E-RR | BBBsf/BBB+(sf)/NR | $10,968,000 | 9.625% | (7) | 9.86 | 04/30 – 04/30 | 52.8% | 10.8% |
| | F-RR(14) | BBB-sf/BBB-(sf)/NR | $16,450,000 | 7.375% | (7) | 9.86 | 04/30 – 04/30 | 54.1% | 10.5% |
| | G-RR | BB+sf/BB+(sf)/NR | $7,312,000 | 6.375% | (7) | 9.86 | 04/30 – 04/30 | 54.7% | 10.4% |
| | H-RR | BB-sf/BB-(sf)/NR | $7,311,000 | 5.375% | (7) | 9.86 | 04/30 – 04/30 | 55.3% | 10.3% |
| | J-RR | B-sf/B-(sf)/NR | $7,311,000 | 4.375% | (7) | 9.86 | 04/30 – 04/30 | 55.8% | 10.2% |
| | K-RR | NR/NR/NR | $31,988,094 | 0.000% | (7) | 9.86 | 04/30 – 04/30 | 58.4% | 9.8% |
Notes: |
(1) | The expected ratings presented are those of Fitch Ratings, Inc. (“Fitch”), Kroll Bond Rating Agency, Inc. (“KBRA”) and Moody’s Investors Service, Inc. (“Moody’s”), which the depositor hired to rate the Offered Certificates. One or more other nationally recognized statistical rating organizations that were not hired by the depositor may use information they receive pursuant to Rule 17g-5 under the Securities Exchange Act of 1934, as amended (the “Exchange Act”) or otherwise, to rate or provide market reports and/or published commentary related to the Offered Certificates. We cannot assure you as to what ratings a non-hired nationally recognized statistical rating organization would assign or that its reports will not express differing, possibly negative, views of the mortgage loans and/or the Offered Certificates. The ratings of each Class of Offered Certificates address the likelihood of the timely distribution of interest and, except in the case of the Class X-A and X-B Certificates, the ultimate distribution of principal due on those Classes on or before the Rated Final Distribution Date. See “Risk Factors—Other Risks Relating to the Certificates—Nationally Recognized Statistical Rating Organizations May Assign Different Ratings to the Certificates; Ratings of the Certificates Reflect Only the Views of the Applicable Rating Agencies as of the Dates Such Ratings Were Issued; Ratings May Affect ERISA Eligibility; Ratings May Be Downgraded” and “Ratings” in the Preliminary Prospectus, expected to be dated May 21, 2020 (the “Preliminary Prospectus”). Fitch, KBRA and Moody’s have informed us that the “sf” designation in their ratings represents an identifier for structured finance product ratings. |
| | |
(2) | The Certificate Balances and Notional Amounts set forth in the table are approximate. The actual initial Certificate Balances and Notional Amounts may be larger or smaller depending on the initial pool balance of the mortgage loans definitively included in the pool of mortgage loans, which aggregate cut-off date balance may be as much as 5% larger or smaller than the amount presented in the Preliminary Prospectus. In addition, the Notional Amounts of the Class X-A and X-B Certificates may vary depending upon the final pricing of the Classes of Principal Balance Certificates (as defined below) or trust components whose Certificate Balances comprise such Notional Amounts, and, if, as a result of such pricing, the pass-through rate of the Class X-A or X-B Certificates, as applicable, would be equal to zero at all times, such Class of Certificates may not be issued on the closing date of this securitization. |
| | |
(3) | The approximate initial credit support with respect to the Class A-1, A-2, A-3, A-SB, A-4 and A-5 Certificates represents the approximate credit enhancement for the Class A-1, A-2, A-3, A-SB, A-4 and A-5 Certificates in the aggregate, taking into account the Certificate Balances of the Class A-4 and Class A-5 trust components. The approximate initial credit support set forth for the Class A-S certificates represents the approximate initial credit enhancement for the underlying Class A-S trust component. |
| | |
(4) | Weighted Average Lives and Expected Principal Windows are calculated based on an assumed prepayment rate of 0% CPR and the “Structuring Assumptions” described under “Yield and Maturity Considerations—Weighted Average Life” in the Preliminary Prospectus. |
| | |
(5) | The Certificate Principal to Value Ratio for each Class of Certificates (other than the Class A-1, A-2, A-3, A-SB, A-4 and A-5 Certificates) is calculated as the product of (a) the weighted average Cut-off Date LTV Ratio for the mortgage loans and (b) a fraction, the numerator of which is the total initial Certificate Balance of such Class of Certificates and all Classes of Principal Balance Certificates (or, with respect to the Class A-4, Class A-5 or Class A-S Certificates, the trust component with the same alphanumeric designation) senior to such Class of Certificates and the denominator of which is the total initial Certificate Balance of all of the Classes of Principal Balance Certificates (or, with respect to the Class A-4, Class A-5 or Class A-S Certificates, the trust component with the same alphanumeric designation). The Certificate Principal to Value Ratio for each of the Class A-1, A-2, A-3, A-SB, A-4 and A-5 Certificates is calculated in the aggregate for those Classes as if they were a single Class and is calculated as the product of (a) the weighted average Cut-off Date LTV Ratio for the mortgage loans and (b) a fraction, the numerator of which is the total initial aggregate Certificate Balances of such Classes of Certificates (or, with respect to the Class A-4 or A-5 Certificates, the trust component with the same alphanumeric designation) and the denominator of which is the total initial Certificate Balance of all of the Classes of Principal Balance Certificates (or, with respect to the Class A-4, Class A-5 or Class A-S Certificates, the trust component with the same alphanumeric designation). In any event, however, excess mortgaged property value associated with a mortgage loan will not be available to offset losses on any other mortgage loan. |
THE INFORMATION IN THIS STRUCTURAL AND COLLATERAL TERM SHEET IS NOT COMPLETE AND MAY BE AMENDED PRIOR TO THE TIME OF SALE. THIS TERM SHEET IS NOT AN OFFER TO SELL THESE SECURITIES AND IT IS NOT A SOLICITATION OF AN OFFER TO BUY THESE SECURITIES IN ANY JURISDICTION WHERE THE OFFER OR SALE IS NOT PERMITTED.
3
| Wells Fargo Commercial Mortgage Trust 2020-C56 | Certificate Structure |
| (6) | The Certificate Principal U/W NOI Debt Yield for each Class of Certificates (other than the Class A-1, A-2, A-3, A-SB, A-4 and A-5 Certificates) is calculated as the product of (a) the weighted average U/W NOI Debt Yield for the mortgage loans and (b) a fraction, the numerator of which is the total initial Certificate Balance of all of the Classes of Principal Balance Certificates (or, with respect to the Class A-4, Class A-5 or Class A-S Certificates, the trust component with the same alphanumeric designation) and the denominator of which is the total initial Certificate Balance for such Class of Certificates or trust component and all Classes of Principal Balance Certificates or trust components senior to such Class of Certificates. The Certificate Principal U/W NOI Debt Yield for each of the Class A-1, A-2, A-3, A-SB, A-4 and A-5 Certificates is calculated in the aggregate for those Classes as if they were a single Class and is calculated as the product of (a) the weighted average U/W NOI Debt Yield for the mortgage loans and (b) a fraction, the numerator of which is the total initial Certificate Balance of all of the Classes of Principal Balance Certificates (or, with respect to the Class A-4, Class A-5 or Class A-S Certificates, the trust component with the same alphanumeric designation) and the denominator of which is the total aggregate initial Certificate Balances for the Class A-1, A-2, A-3 and A-SB Certificates (or, with respect to the Class A-4 and Class A-5 Certificates, the trust component with the same alphanumeric designation). In any event, however, cash flow from each mortgaged property supports only the related mortgage loan and will not be available to support any other mortgage loan. |
| (7) | The pass-through rates for the Class A-1, A-2, A-3, A-SB, A-4, A-5, A-S, B, C, D-RR, E-RR, F-RR, G-RR, H-RR, J-RR and K-RR Certificates in each case will be one of the following: (i) a fixed rate per annum, (ii) a variable rate per annum equal to the weighted average of the net mortgage interest rates on the mortgage loans for the related distribution date, (iii) a variable rate per annum equal to the lesser of (a) a fixed rate and (b) the weighted average of the net mortgage interest rates on the mortgage loans for the related distribution date or (iv) a variable rate per annum equal to the weighted average of the net mortgage interest rates on the mortgage loans for the related distribution date minus a specified percentage. For purposes of the calculation of the weighted average of the net mortgage interest rates on the mortgage loans for each distribution date, the mortgage interest rates will be adjusted as necessary to a 30/360 basis. |
| (8) | The Class A-4-1, A-4-2, A-4-X1, A-4-X2, A-5-1, A-5-2, A-5-X1, A-5-X2, A-S-1, A-S-2, A-S-X1 and A-S-X2 Certificates are also offered certificates. Such Classes of Certificates, together with the Class A-4, Class A-5 and Class A-S Certificates, constitute the “Exchangeable Certificates”. The Class A-1, A-2, A-3, A-SB, B, C, D-RR, E-RR, F-RR, G-RR, H-RR, J-RR and K-RR Certificates, together with the Exchangeable Certificates with a Certificate Balance, are referred to as the “Principal Balance Certificates.” Each class of Exchangeable Certificates will have the Certificate Balance or Notional Amount and pass-through rate described below under “Exchangeable Certificates.” |
| | |
| (9) | The exact initial Certificate Balances or Notional Amounts of the Class A-4, Class A-4-X1, Class A-4-X2, Class A-5, Class A-5-X1 and Class A-5-X2 trust components (and consequently, the exact aggregate initial Certificate Balances or Notional Amounts of the Exchangeable Certificates with an “A-4” or “A-5” designation) are unknown and will be determined based on the final pricing of the Certificates. However, the initial Certificate Balances, weighted average lives and principal windows of the Class A-4 and Class A-5 trust components are expected to be within the applicable ranges reflected in the following chart. The aggregate initial Certificate Balance of the Class A-4 and Class A-5 trust components is expected to be approximately $406,562,000, subject to a variance of plus or minus 5%. The Class A-4-X1 and Class A-4-X2 trust components will have initial Notional Amounts equal to the initial Certificate Balance of the Class A-4 trust component. The Class A-5-X1 and Class A-5-X2 trust components will have initial Notional Amounts equal to the initial Certificate Balance of the Class A-5 trust component. In the event that the Class A-4 Certificates are issued at $406,562,000, the Class A-5 Certificates will not be issued. |
| | Trust
Components | | Expected Range of
Approximate Initial
Certificate Balance | | Expected Range of
Weighted Average
Life (Years) | | Expected Range of Principal Window | |
| | Class A-4 | | $50,000,000 - $406,562,000 | | 9.47 – 9.64 | | 11/29 – 12/29 / 11/29 – 03/30 | |
| | Class A-5 | | $206,562,000 - $356,562,000 | | 9.66 – 9.72 | | 12/29 – 03/30 / 01/30 – 03/30 | |
| (10) | The Class X-A Certificates are notional amount certificates. The Notional Amount of the Class X-A Certificates will be equal to the aggregate Certificate Balance of the Class A-1, A-2, A-3 and A-SB Certificates and the Class A-4 and A-5 trust components outstanding from time to time. The Class X-A Certificates will not be entitled to distributions of principal. |
| (11) | The pass-through rate for the Class X-A Certificates for any distribution date will be a per annum rate equal to the excess, if any, of (a) the weighted average of the net mortgage interest rates on the mortgage loans for the related distribution date, over (b) the weighted average of the pass-through rates on the Class A-1, A-2, A-3 and A-SB Certificates and the Class A-4, A-4-X1, A-4-X2, A-5, A-5-X1 and A-5-X2 trust components for the related distribution date, weighted on the basis of their respective Certificate Balances or Notional Amounts outstanding immediately prior to that distribution date (but excluding trust components with a notional amount in the denominator of such weighted average calculation). For purposes of the calculation of the weighted average of the net mortgage interest rates on the mortgage loans for each distribution date, the mortgage interest rates will be adjusted as necessary to a 30/360 basis. |
| (12) | The Class X-B Certificates are notional amount certificates. The Notional Amount of the Class X-B Certificates will be equal to the aggregate Certificate Balance of the Class A-S trust component and the Class B and C Certificates outstanding from time to time. The Class X-B Certificates will not be entitled to distributions of principal. |
| (13) | The pass-through rate for the Class X-B Certificates for any distribution date will be a per annum rate equal to the excess, if any, of (a) the weighted average of the net mortgage interest rates on the mortgage loans for the related distribution date, over (b) the weighted average of the pass-through rates on the Class A-S, A-S-X1 and A-S-X2 trust components and the Class B and C Certificates for the related distribution date, weighted on the basis of their respective Certificate Balances or Notional Amounts outstanding immediately prior to that distribution date (but excluding trust components with a notional amount in the denominator of such weighted average calculation). For purposes of the calculation of the weighted average of the net mortgage interest rates on the mortgage loans for each distribution date, the mortgage interest rates will be adjusted as necessary to a 30/360 basis. |
| (14) | The initial Certificate Balance of each of the Class C, D-RR and F-RR Certificates are subject to change based on final pricing of all Certificates and the final determination of the Class D-RR, E-RR, F-RR, G-RR, H-RR, J-RR and K-RR Certificates (collectively, the “horizontal risk retention certificates”) that will be retained by the retaining sponsor through a third party purchaser as part of the U.S. risk retention requirements. For more information regarding the methodology and key inputs and assumptions used to determine the sizing of the horizontal risk retention certificates, see “Credit Risk Retention” in the Preliminary Prospectus. Any variation in the initial certificate balance of the Class C Certificates would affect the initial notional amount of the Class X-B Certificates. |
THE INFORMATION IN THIS STRUCTURAL AND COLLATERAL TERM SHEET IS NOT COMPLETE AND MAY BE AMENDED PRIOR TO THE TIME OF SALE. THIS TERM SHEET IS NOT AN OFFER TO SELL THESE SECURITIES AND IT IS NOT A SOLICITATION OF AN OFFER TO BUY THESE SECURITIES IN ANY JURISDICTION WHERE THE OFFER OR SALE IS NOT PERMITTED.
4
| Wells Fargo Commercial Mortgage Trust 2020-C56 | Transaction Highlights |
II. Transaction Highlights
Mortgage Loan Sellers:
Mortgage Loan Seller | | Number of
Mortgage Loans | | Number of
Mortgaged
Properties | | Aggregate Cut-off
Date Balance | | % of Initial Pool
Balance |
Column Financial, Inc. | | 7 | | | 7 | | $152,900,000 | | 20.9 | % |
LMF Commercial, LLC | | 10 | | | 18 | | 142,938,440 | | 19.6 | |
UBS AG | | 13 | | | 16 | | 138,874,472 | | 19.0 | |
Barclays Capital Real Estate Inc. | | 5 | | | 5 | | 112,495,000 | | 15.4 | |
Ladder Capital Finance LLC | | 2 | | | 2 | | 68,148,530 | | 9.3 | |
Argentic Real Estate Finance LLC | | 3 | | | 9 | | 62,300,000 | | 8.5 | |
Wells Fargo Bank, National Association | | 6 | | | 7 | | 53,481,652 | | 7.3 | |
Total | | 46 | | | 64 | | $731,138,094 | | 100.0 | % |
Loan Pool:
Initial Pool Balance: | $731,138,094 |
Number of Mortgage Loans: | 46 |
Average Cut-off Date Balance per Mortgage Loan: | $15,894,306 |
Number of Mortgaged Properties: | 64 |
Average Cut-off Date Balance per Mortgaged Property(1): | $11,424,033 |
Weighted Average Mortgage Interest Rate: | 3.769% |
Ten Largest Mortgage Loans as % of Initial Pool Balance(2): | 51.4% |
Weighted Average Original Term to Maturity or ARD (months): | 115 |
Weighted Average Remaining Term to Maturity or ARD (months): | 111 |
Weighted Average Original Amortization Term (months)(3): | 359 |
Weighted Average Remaining Amortization Term (months)(3): | 357 |
Weighted Average Seasoning (months): | 4 |
| (1) | Information regarding mortgage loans secured by multiple properties is based on an allocation according to relative appraised values or the allocated loan amounts or property-specific release prices set forth in the related loan documents or such other allocation as the related mortgage loan seller deemed appropriate. |
| (2) | Includes the ten largest mortgage loans or group of cross-collateralized underlying mortgage loans. |
| (3) | Excludes any mortgage loan that does not amortize. |
Credit Statistics:
Weighted Average U/W Net Cash Flow DSCR(1)(2): | 2.22x |
Weighted Average U/W Net Operating Income Debt Yield(1)(2): | 9.8% |
Weighted Average Cut-off Date Loan-to-Value Ratio(1)(2): | 58.4% |
Weighted Average Balloon Loan-to-Value Ratio(1)(2): | 53.9% |
% of Mortgage Loans with Additional Subordinate Debt(3): | 20.9% |
% of Mortgage Loans with Single Tenants(4): | 11.6% |
| (1) | With respect to any mortgage loan that is part of a whole loan, loan-to-value ratio, debt service coverage ratio and debt yield calculations include the related pari passu companion loan(s) but exclude any related subordinate companion loan(s) (unless otherwise stated). The debt service coverage ratio, debt yield and loan-to-value ratio information do not take into account any subordinate debt (whether or not secured by the related mortgaged property), that currently exists or is allowed under the terms of any mortgage loan. The information for each mortgaged property that relates to a mortgage loan that is cross-collateralized or cross-defaulted with one or more other mortgage loans is based upon the principal balance of that mortgage loan, except that the applicable loan-to-value ratio, debt service coverage ratio, and debt yield for each such mortgage loan is based upon the ratio or yield (as applicable) for the aggregate indebtedness evidenced by all loans in the group (without regard to any limitation on the amount of indebtedness secured by any mortgaged property in such cross-collateralized group). See “Description of the Mortgage Pool—Mortgage Pool Characteristics” in the Preliminary Prospectus and Annex A-1 to the Preliminary Prospectus. |
| (2) | For many of the mortgage loans, underwritten net cash flow, underwritten net operating income and appraised values of the related mortgaged properties were determined, or were calculated based on information as of a date, prior to the emergence of the novel coronavirus pandemic and the economic disruption resulting from measures to combat the pandemic, and the loan-to-value, debt service coverage and debt yield metrics presented in this term sheet may not reflect current market conditions. |
| (3) | The percentage figure expressed as “% of Mortgage Loans with Additional Subordinate Debt” is determined as a percentage of the initial pool balance and does not take into account any future subordinate debt (whether or not secured by the mortgaged property), if any, that may be permitted under the terms of any mortgage loan or the pooling and servicing agreement. See “Description of the Mortgage Pool—Additional Indebtedness” in the Preliminary Prospectus. |
| (4) | Excludes mortgage loans that are secured by multiple single tenant properties. |
THE INFORMATION IN THIS STRUCTURAL AND COLLATERAL TERM SHEET IS NOT COMPLETE AND MAY BE AMENDED PRIOR TO THE TIME OF SALE. THIS TERM SHEET IS NOT AN OFFER TO SELL THESE SECURITIES AND IT IS NOT A SOLICITATION OF AN OFFER TO BUY THESE SECURITIES IN ANY JURISDICTION WHERE THE OFFER OR SALE IS NOT PERMITTED.
5
| Wells Fargo Commercial Mortgage Trust 2020-C56 | Transaction Highlights |
Loan Structural Features:
Amortization: Based on the Initial Pool Balance, 39.3% of the mortgage pool (20 mortgage loans) has scheduled amortization, as follows:
24.4% (11 mortgage loans) requires amortization during the entire loan term; and
14.9% (9 mortgage loans) provides for an interest-only period followed by an amortization period.
Interest-Only: Based on the Initial Pool Balance, 60.7% of the mortgage pool (26 mortgage loans) provides for interest-only payments during the entire loan term through maturity or ARD. The Weighted Average Cut-off Date Loan-to-Value Ratio and Weighted Average U/W Net Cash Flow DSCR for those mortgage loans are 55.4% and 2.59x, respectively.
Hard Lockboxes: Based on the Initial Pool Balance, 30.0% of the mortgage pool (11 mortgage loans) have hard lockboxes in place.
Reserves: The mortgage loans require amounts to be escrowed monthly as follows (excluding any mortgage loans with springing provisions):
Real Estate Taxes: | 62.9% of the pool |
Insurance: | 49.3% of the pool |
Capital Replacements: | 73.6% of the pool |
TI/LC: | 41.3% of the pool(1) |
(1) The percentage of Initial Pool Balance for mortgage loans with TI/LC reserves is based on the aggregate principal balance allocable to loans that include office, retail, mixed use and industrial properties. |
Call Protection/Defeasance: Based on the Initial Pool Balance, the mortgage pool has the following call protection and defeasance features:
82.6% of the mortgage pool (38 mortgage loans) features a lockout period, then defeasance only until an open period;
5.1% of the mortgage pool (5 mortgage loans) features a lockout period, then the greater of a prepayment premium (1%) or yield maintenance until an open period;
4.9% of the mortgage pool (1 mortgage loan) features the greater of a prepayment premium (0.5%) or yield maintenance, then the greater of a prepayment premium (0.5%) or yield maintenance, or defeasance until an open period;
4.1% of the mortgage pool (1 mortgage loan) features a lockout period, then the greater of a prepayment premium (1%) or yield maintenance, or defeasance until an open period; and
3.4% of the mortgage pool (1 mortgage loan) features yield maintenance until an open period.
Prepayment restrictions for each mortgage loan reflect the entire life of the mortgage loan. Please refer to Annex A-1 to the Preliminary Prospectus and the footnotes related thereto for further information regarding individual loan call protection.
THE INFORMATION IN THIS STRUCTURAL AND COLLATERAL TERM SHEET IS NOT COMPLETE AND MAY BE AMENDED PRIOR TO THE TIME OF SALE. THIS TERM SHEET IS NOT AN OFFER TO SELL THESE SECURITIES AND IT IS NOT A SOLICITATION OF AN OFFER TO BUY THESE SECURITIES IN ANY JURISDICTION WHERE THE OFFER OR SALE IS NOT PERMITTED.
6
| Wells Fargo Commercial Mortgage Trust 2020-C56 | Transaction Highlights |
III. COVID-19 Update
The following table contains information regarding the status of the Mortgage Loans and Mortgaged Properties provided by the respective borrowers as of the date set forth in the “Information As Of Date” column. The cumulative effects of the COVID-19 emergency on the global economy may cause tenants to be unable to pay their rent and borrowers to be unable to pay debt service under the Mortgage Loans. As a result, we cannot assure you that the information in the following table is indicative of future performance or that tenants or borrowers will not seek rent or debt service relief (including forbearance arrangements) or other lease or loan modifications in the future. Such actions may lead to shortfalls and losses on the certificates. Any information in the following table will be superseded by the information contained under the heading “Description of the Mortgage Pool—COVID-19 Considerations” in the Preliminary Prospectus.
| Mortgage Loan Seller | Information as of Date | Origination Date | Property Name | Property Type | April Debt Service Payment Received
(Y/N) | May Debt Service Payment Received
(Y/N) | Forbearance or Other Debt Service Relief Requested
(Y/N) | Other Loan Modification Requested (Y/N) | Lease Modification or Rent Relief Requested (Y/N) | Total SF or Unit Count Making Full April Rent Payment (%) | UW April Base
Rent Paid (%) | Total SF or Unit Count Making Full May Rent Payment (%) | UW May Base
Rent Paid (%) |
| LMF | 5/7/2020 | 1/31/2020 | Supor Industrial Portfolio | Industrial | Y | Y | N | N | N | 100.0% | 100.0% | 100.0% | 100.0% |
| LCF | 5/10/2020 | 3/11/2020 | The Grid | Multifamily | NAP | Y | N | N | Y(1) | 91.0%(2) | 91.0%(3) | 89.0%(2) | 89.0%(3) |
| Column | 5/8/2020 | 12/23/2019 | KPMG Plaza at Hall Arts | Office | Y | Y | N | N | Y(34) | 98.3% | 98.0% | 90.4% | 92.6% |
| UBS AG | 5/7/2020 | 3/10/2020 | Panoramic Berkeley | Multifamily | NAP(4) | Y | N | N | N | 98.5%(5) | 99.8%(6) | 94.1%(5) | 97.7%(6) |
| Column | 5/13/2020 | 10/30/2019 | Solitude at Centennial | Multifamily | Y | Y | N | N | Y(35) | 97.0%(7) | 97.0% | 90.8%(7) | 90.8% |
| WFB | 5/15/2020 | 3/6/2020 | All Aboard Storage – Westport Depot | Self Storage | Y | Y | N | N | Y(8) | 95.8%(9) | 94.8% | 93.2%(9) | 91.4% |
| WFB | 5/15/2020 | 3/6/2020 | All Aboard Storage – Ormond Depot | Self Storage | Y | Y | N | N | N | 93.6%(9) | 89.7% | 91.1%(9) | 84.5% |
| WFB | 5/15/2020 | 3/6/2020 | All Aboard Storage – Port Orange Depot | Self Storage | Y | Y | N | N | N | 96.3%(9) | 95.4% | 93.6%(9) | 91.5% |
| WFB | 5/15/2020 | 3/6/2020 | All Aboard Storage – Holly Hill Depot | Self Storage | Y | Y | N | N | N | 92.0%(9) | 87.3% | 90.3%(9) | 80.7% |
| Barclays | 5/18/2020 | 2/14/2020 | Met Center 15 | Office | Y | Y | N | N | N | 100.0% | 100.0% | 100.0% | 100.0% |
| Column | 5/8/2020 | 12/2/2019 | University Village(10) | Retail | Y | Y | N | (40) | Y(10) | (10) | (10) | (10) | (10) |
| AREF | 5/14/2020 | 2/26/2020 | Bushwick Multifamily Portfolio | Various | Y | Y | N | N | Y(11) | 100.0% | 100.0% | 65.3%(12) | 76.9%(12) |
| Barclays | 5/18/2020 | 2/28/2020 | Liberty Walk at East Gate | Office | Y | Y | N | N | Y(13) | 85.9% | 87.5% | 85.9% | 87.5% |
| Barclays | 5/14/2020 | 11/26/2019 | Parkmerced | Multifamily | Y | Y | N(39) | N | N | 91.5% | 91.5% | 84.4%(14) | 84.4%(14) |
| Barclays | 5/18/2020 | 11/26/2019 | 650 Madison Avenue | Mixed Use | Y | Y | N | N | Y(15) | 96.1% | 79.9% | 94.5% | 72.0% |
| UBS AG | 5/11/2020 | 1/10/2020 | Lafayette Gardens | Multifamily | Y | Y | N | N | N | 87.6%(5) | 93.7% | NAV | NAV |
| AREF | 5/7/2020 | 2/21/2020 | HPE Campus | Office | Y | Y | N | N | N | 100.0% | 100.0% | 100.0% | 100.0% |
| LMF | 5/13/2020 | 2/4/2020 | Maxi-Space Portfolio | Various | Y | Y | N | N | N | NAV | (16) | NAV | (16) |
| Column | 5/15/2020 | 2/5/2020 | Telegraph Lofts(17) | Multifamily | Y | Y | N | N | (36) | 96.0%(7) | 96.0% | 89.2%(7) | 89.2% |
| UBS AG | 5/11/2020 | 1/22/2020 | Sonterra Townhomes & Apartments | Multifamily | Y | Y | N | N | N | 100.0%(5) | 100.0% | 96.7%(5) | 96.6% |
| LCF | 5/10/2020 | 12/20/2019 | Woodland Estates MHC | Manufactured Housing Community | Y | Y | N | N | N | 98.4%(2) | 98.4% | 87.0%(2) | 87.0% |
| LMF | 5/20/2020 | 1/30/2020 | Buffalo Multifamily Portfolio | Multifamily | Y | Y | N | N | N | NAV | 94.2% | NAV | 84.0% |
| LMF | 5/14/2020 | 2/27/2020 | La Jolla Apartments | Multifamily | Y | Y | N | N | N | NAV | 97.0% | NAV | 95.3% |
| AREF | 5/8/2020 | 2/11/2020 | Plaza Gardens Apartments | Multifamily | Y | Y | N | N | Y(18) | 97.4% | 97.3% | 98.7% | 97.8% |
| Column | 5/15/2020 | 2/5/2020 | Villas at Harbor Pointe - Bayview | Multifamily | Y | Y | N | N | (36) | 100.0%(7) | 100.0% | 97.7%(7) | 97.7% |
| LMF | 5/19/2020 | 12/6/2019 | Jurupa Springs | Retail | Y | Y | N | N | Y(19) | 86.8% | 85.6% | 83.1% | 78.6%(19) |
| UBS AG | 5/11/2020 | 2/24/2020 | Central California Portfolio | Various | Y | Y | N | N | Y(37) | 97.2%(20) | 96.9% | 86.6%(20) | 85.1% |
THE INFORMATION IN THIS STRUCTURAL AND COLLATERAL TERM SHEET IS NOT COMPLETE AND MAY BE AMENDED PRIOR TO THE TIME OF SALE. THIS TERM SHEET IS NOT AN OFFER TO SELL THESE SECURITIES AND IT IS NOT A SOLICITATION OF AN OFFER TO BUY THESE SECURITIES IN ANY JURISDICTION WHERE THE OFFER OR SALE IS NOT PERMITTED.
7
| Wells Fargo Commercial Mortgage Trust 2020-C56 | Transaction Highlights |
| Mortgage Loan Seller | Information as of Date | Origination Date | Property Name | Property Type | April Debt Service Payment Received
(Y/N) | May Debt Service Payment Received
(Y/N) | Forbearance or Other Debt Service Relief Requested
(Y/N) | Other Loan Modification Requested (Y/N) | Lease Modification or Rent Relief Requested (Y/N) | Total SF or Unit Count Making Full April Rent Payment (%) | UW April Base Rent Paid (%) | Total SF or Unit Count Making Full May Rent Payment (%) | UW May Base Rent Paid (%) |
| WFB | 5/12/2020 | 1/22/2020 | Treasure Valley Crossing | Retail | Y | Y | N | N | Y(21) | 66.2%(22) | 64.2%(22) | 75.0%(21) | 77.4(22) |
| LMF | 5/13/2020 | 2/7/2020 | Crosstrax and Cherry Road
Storage Portfolio | Self Storage | Y | Y | N | N | N | NAV | (23) | NAV | (23) |
| Column | 5/15/2020 | 2/5/2020 | Exchange Studios | Multifamily | Y | Y | N | N | (36) | 91.0%(7) | 91.0% | 84.3%(7) | 84.3% |
| UBS AG | 5/15/2020 | 12/27/2019 | Gateway Tower | Office | Y | Y | N | N | Y(24) | 96.5% | 96.3%(6) | NAV | NAV |
| LMF | 5/7/2020 | 2/7/2020 | Centennial Technology Place | Office | Y | Y | N | N | N | 100.0% | 100.0% | 100.0% | 100.0% |
| WFB | 5/12/2020 | 2/21/2020 | 550 North 11th Avenue | Retail | NAP(25) | Y | N | N | Y(26) | 100.0% | 100.0% | 59.8%(26) | 91.4(26) |
| LMF | 5/14/2020 | 2/27/2020 | Mira Monte Apartments | Multifamily | Y | Y | N | N | N | NAV | 97.0% | NAV | 95.0% |
| UBS AG | 5/19/2020 | 2/28/2020 | 8300 College Boulevard | Office | Y | Y | N | N | Y(27) | 100.0% | 100.0% | 100.0% | 100.0% |
| UBS AG | 5/11/2020 | 12/30/2019 | 3445 Causeway | Office | Y | Y | N | N | Y(28) | 82.0% | 81.6%(6) | 74.7% | 74.1%(6) |
| UBS AG | 5/11/2020 | 12/5/2019 | American Water - Pensacola | Office | Y | Y | N | N | N | 100.0% | 100.0% | 100.0% | 100.0% |
| Barclays | 5/18/2020 | 1/30/2020 | Commerce Storage | Self Storage | Y | Y | N | N | N | 83.0%(29) | 83.0%(29) | 86.2%(30) | 86.2%(30) |
| LMF | 5/12/2020 | 3/2/2020 | Gardens Professional Arts Building | Office | Y | Y | N | N | Y(31) | 67.2% | 81.9% | 67.2% | 81.9%(31) |
| UBS AG | 5/8/2020 | 2/20/2020 | 5555 Biscayne Blvd | Office | Y | Y | N | N | Y(32) | 62.7% | 61.0%(6) | 62.7% | 61.0%(6) |
| Column | 5/15/2020 | 2/5/2020 | Villas at Harbor Pointe - Sunnyview | Multifamily | Y | Y | N | N | (36) | 82.0%(7) | 82.0% | 70.1%(7) | 70.1% |
| UBS AG | 5/12/2020 | 2/14/2020 | Shoppes at Citiside | Retail | Y | Y | N | N | N | 97.2% | 94.0%(6) | 76.1% | 72.2%(6) |
| UBS AG | 5/8/2020 | 3/12/2020 | Walgreens - Greenfield | Retail | NAP(4) | Y | N | N | N | 100.0% | 100.0% | 100.0% | 100.0% |
| UBS AG | 5/12/2020 | 2/13/2020 | Thirteen08 Apartments | Multifamily | Y | Y | N | N | N | 92.5% | 92.9% | 94.7% | 95.4% |
| WFB | 5/14/2020 | 3/13/2020 | Walgreens – Bridgeville, DE | Retail | NAP(25) | Y | N | N | N | 100.0% | 100.0% | 100.0% | 100.0% |
| UBS AG | 5/11/2020 | 1/27/2020 | Norbrook Arms Apartments | Multifamily | Y | Y | N | N | N | NAV | NAV | NAV | NAV |
| LMF | 5/6/2020 | 1/22/2020 | Travelers Retail Center | Retail | Y | Y | N | N | Y(33) | (33) | (33) | (33) | (33) |
(1) | As of early May 2020, three commercial tenants, representing 5.3% of the underwritten base rent, asked for April 2020 rent deferrals. |
(2) | The percentage of Total SF or Unit Count Making Full April Rent Payment and Total SF or Unit Count Making Full May Rent Payment are in each case based on the percentage of total billed residential rent collected. |
(3) | Represents the percentage of residential rent collections made and excludes rent collected (if any) from the retail portion of the related Mortgaged Property. For April 2020, calculated based on a 90.8% occupancy percentage with respect to the residential units as reflected in the April 22, 2020 rent roll. For May 2020, provided by the related borrower sponsor. |
| (4) | The Panoramic Berkeley and Walgreens - Greenfield mortgage loans were originated in March 2020 and the first due date was May 6, 2020. |
(5) | Calculated based on the number of units for which rent was fully paid divided by the total number of occupied units. |
(6) | Calculated based on UW Base Rent including any underwritten rent steps and percentage rent but excluding any underwritten straight-line rent. |
(7) | The percentage of Tenant Count Making Full April Rent Payment and Tenant Count Making Full May Rent Payment are, in each case, based on the percentage of total billed residential rent collected. |
(8) | Three tenants requested and were granted rent relief in April and one tenant requested and was granted rent relief in May. |
(9) | The percentage of Tenant Count Making Full April and May Rent Payment is based on outstanding rent as a percentage of total self storage units. |
(10) | As of May 8, 2020, the University Village Property is open, however, many tenants are closed. The borrower sponsor is also in active conversations with large and small tenants for payment timing and pursuing collections for April and May rents. As of May 8, 2020 no rental relief agreements have been signed, however, not all rents have been collected. As of the March 2020 rent roll, the University Village Property remains 97.9% occupied. As of the beginning of May, government guidelines around a phased reopening had begun with curbside pick-up for non-essential businesses and some appointment based businesses now being allowed. The University Village Property tenants are preparing for this and several began such services. |
(11) | The borrower sponsors reported that 10 residential tenants representing 8.5% of the total units across the Bushwick Multifamily Portfolio Properties inquired about or requested May rent relief. In response and in place of granting any rent abatements, the borrower sponsors are temporarily waiving late fees for any rent received prior to the 25th of each month. |
(12) | As of May 14, 2020, the borrower sponsor reported that 38 of 111 residential tenants and three of seven commercial tenants at the Mortgaged Properties comprising the Bushwick Multifamily Portfolio have not paid the May 2020 rent. |
(13) | The Liberty Walk at East Gate Property has one tenant, Teknion, LLC, (12.6% of NRA and 12.5% of UW Base Rent) that has requested rent relief. The tenant has reached an agreement with the borrower to continue to pay operating expenses and defer the base rent for April through June 2020 that will be repaid in equal installments over the five-month period from July to November 2020. April and May operating expenses were paid by the tenant. |
(14) | Tenant Count Making Full May Rent Payment (%) and UW May Base Rent Paid (%) are based on rent collections information through May 14, 2020. |
(15) | One of the five ground-floor retail tenants at the 650 Madison Avenue Property paid rent in April, and the five retail tenants did not pay rent in May. These tenants are currently closed for business due to New York’s stay-at-home order. Moncler (1.5% of net rentable area, 7.9% of underwritten base rent) has formally requested rent relief, which has not yet been negotiated. Additionally, Deva Inc. (Tod’s) (1.3% of net rentable area, 7.0% of underwritten base rent) requested a rent deferral that results in 50% of the base and additional rents for May, June and July 2020 being deferred and repaid in 12 monthly installments over the 2021 calendar year. |
(16) | Tenant due dates are based on the monthiversary of their start date (not the first of the month), so collections are not easily tracked on calendar month basis. As of May 14, 2020, 6.5% of tenants (by rent) were 31-60 days due; 1.7% of tenants (by rent) were 60+days due. The Mortgaged Properties were acquired on February 4, 2020 and part of the borrower’s strategy is to clean up delinquencies and put payments on ACH/credit cards. |
(17) | Telegraph Lofts includes commercial income from six commercial tenants totaling 8.3% of UW EGI. As of April 30, 2020 two commercial tenants representing 0.2% of UW EGI had not paid rent. |
THE INFORMATION IN THIS STRUCTURAL AND COLLATERAL TERM SHEET IS NOT COMPLETE AND MAY BE AMENDED PRIOR TO THE TIME OF SALE. THIS TERM SHEET IS NOT AN OFFER TO SELL THESE SECURITIES AND IT IS NOT A SOLICITATION OF AN OFFER TO BUY THESE SECURITIES IN ANY JURISDICTION WHERE THE OFFER OR SALE IS NOT PERMITTED.
8
| Wells Fargo Commercial Mortgage Trust 2020-C56 | Transaction Highlights |
(18) | The borrower sponsors reported that six tenants representing 7.6% of the total units at the Plaza Gardens Property requested for some form of relief pertaining to their leasing obligations. In determination of granting such requests, the borrower sponsors requested the tenants to be in good standing prior to April 2020 and to provide evidence to demonstrate substantial loss of income and a good faith effort to obtain government relief. As of May 8, 2020, the borrower sponsors reported that none of the tenants that requested for relief satisfied the requirements above. |
(19) | Six tenants representing approximately 36.9% of the UW rent and 27.5% of the Property NRA have requested rent relief. One tenant, representing approximately 6.5% of UW rent and 3.1% of Property NRA has reached an agreement to use a portion of its security deposits to cover past due rent and will be repaid in equal installments commencing December 1, 2020. |
(20) | Calculated based on the square footage of units for which rent was fully paid divided by the total square footage of occupied units for multifamily mortgaged properties supporting the related mortgage loan. |
(21) | One tenant, representing 15.1% of UW Rent, has requested and was granted a rent deferral in May and June, to be recaptured over a 12 month period beginning in February 2021. One tenant, representing 13.6% of UW Rent, paid 44.6% of their May base rent. |
(22) | One tenant, representing 35.8% of UW Rent, did not pay their April rent. |
(23) | Tenant due dates are based on the monthiversary of their start date (not the first of the month), so collections are not easily tracked on calendar month basis. As of May 13, 2020, 9.5% of tenants (by rent) were 31-60 days due; 13.2% of tenants (by rent) were 60+days due. The Mortgaged Properties were acquired on February 7, 2020 and part of the borrower’s strategy is to clean up delinquencies and put payments on ACH/credit cards. |
(24) | One tenant representing approximately 0.3% of the UW rent and 0.4% of the Mortgaged Property NRA has requested rent relief. Since making such request, the tenant has fully paid all of its April rent. |
(25) | The 550 North 11th Avenue and Walgreens – Bridgeville, DE mortgage loans were originated on March 13, 2020, and the first due date was May 11, 2020. |
(26) | One tenant, representing 34.6% of UW Rent, has requested and was granted a 25% deferment of its rent payment in May and June, to be recaptured over a six-month period beginning in January 2021. |
(27) | One tenant representing approximately 34.0% of the UW rent and 32.9% of the Mortgaged Property NRA has requested rent relief. Since making such request, the tenant has fully paid all of its April and May rent. |
(28) | Two tenants representing approximately 16.5% of the UW rent and 13.5% of the Mortgaged Property NRA have requested rent relief. Tenants are currently undergoing conversations with the borrower. |
(29) | Tenant Count Making Full April Rent Payment (%) and UW April Base Rent Paid (%) are based on the number of non-delinquent units in the month of April. For the April 2020 TTM Period, the monthly average non-delinquent unit percentage equaled 80.7%. |
(30) | Tenant Count Making Full May Rent Payment (%) and UW May Base Rent Paid (%) are based on the number of non-delinquent units through 5/7/2020. For the April 2020 TTM Period, the monthly average non-delinquent unit percentage equaled 80.7%. |
(31) | Four tenants representing approximately 29.8% of the UW rent and 23.8% of the Property NRA have requested rent relief. Three tenants, representing approximately 18.1% of UW rent and 14.7% of Property NRA have reached agreements to pay operating expenses on a monthly basis, while base rent will be deferred and paid back in monthly installments over the balance of 2020. One tenant, representing approximately 11.7% of the UW rent and 9.1% of the Property NRA has received a rent abatement commencing July 1, 2020 and continuing through August 31, 2020. In exchange, tenant has agreed to exercise one five-year renewal option, extending the lease term from December 31, 2020 to December 31, 2025. |
(32) | One tenant representing approximately 36.2% of the UW rent and 33.3% of the Property NRA has requested rent relief. Tenant is currently undergoing conversations with the borrower. |
(33) | Two tenants representing 33.9% UW Base rent received rent abatements for April, May and June in exchange for executing 5-year lease extensions. April rent collections: three tenants, representing 45.0% UW Base Rent paid in full; two tenants, representing 33.9% UW Base Rent had abated rent; one tenant representing 21.1% UW Base Rent did not pay. May rent collections: two tenants, representing 28.2% UW Base Rent paid in full; two tenants, representing 33.9% UW Base Rent had abated rent; two tenants, representing 37.9% UW Base Rent had not paid as of May 6, 2020. |
(34) | Four tenants representing 11.1% of UW Base Rent have been granted rent deferrals. |
(35) | As of April 30, 2020 two rent deferrals representing 0.4% of total charges were approved. |
(36) | As of May 15, 2020, the sponsor is not providing rent relief to any residential tenants. |
(37) | Three tenants representing approximately 24.6% of UW rent and 23.0% of Property NRA have requested rent relief for retail mortgaged properties supporting the related mortgage loan. Tenants are currently undergoing conversations with the borrower. |
| (38) | As of April 27, 2020, occupancy for the Mortgaged Property was 89.2%, including 11 units leased, but not yet occupied or paying rent, due to the COVID-19 pandemic. Excluding these 11 units, the occupancy rate at the Mortgaged Property as of April 27, 2020 is 84.6%. |
| (39) | On April 8, 2020, the lenders and the servicer of the Mortgage Loan received a communication from the borrower which included a potential request for forbearance of debt service payments, commencing with the debt service payment due in May 2020. However, the borrower proceeded to pay its debt service payments for the month of May 2020. Additionally, the servicer of the Mortgage Loan has since confirmed that forbearance has not officially been requested, and based on conversations with the borrower a forbearance request is not expected. |
| (40) | On May 20, 2020, the mortgage loan seller received a communication from the borrower sponsor in which the borrower sponsor stated that it is considering a request to the servicer of the CSMC 2019-UVIL securitization trust for relief relating to borrower sponsor's ability to make certain lease modifications (including concessions and deferrals) and certain requirements in connection with debt yield trigger events. The borrower sponsor indicated that it expects to continue to pay its obligations under the University Village Mortgage Loan Documents and does not expect to request a forbearance of interest payments. |
THE INFORMATION IN THIS STRUCTURAL AND COLLATERAL TERM SHEET IS NOT COMPLETE AND MAY BE AMENDED PRIOR TO THE TIME OF SALE. THIS TERM SHEET IS NOT AN OFFER TO SELL THESE SECURITIES AND IT IS NOT A SOLICITATION OF AN OFFER TO BUY THESE SECURITIES IN ANY JURISDICTION WHERE THE OFFER OR SALE IS NOT PERMITTED.
9
Wells Fargo Commercial Mortgage Trust 2020-C56 | Issue Characteristics |
Securities Offered: | $638,831,000 approximate monthly pay, multi-class, commercial mortgage REMIC pass-through certificates consisting of twenty-three classes (Classes A-1, A-2, A-3, A-SB, A-4, A-4-1, A-4-2, A-4-X1, A-4-X2, A-5, A-5-1, A-5-2, A-5-X1, A-5-X2, A-S, A-S-1, A-S-2, A-S-X1, A-S-X2, B, C, X-A and X-B), which are offered pursuant to a registration statement filed with the SEC (such classes of certificates, the “Offered Certificates”). |
Mortgage Loan Sellers: | Column Financial, Inc. (“Column”), LMF Commercial, LLC (“LMF”), UBS AG, by and through its branch office at 1285 Avenue of the Americas, New York, New York (“UBS AG”), Barclays Capital Real Estate Inc. (“Barclays”), Ladder Capital Finance LLC (“LCF”), Argentic Real Estate Finance LLC (“AREF”) and Wells Fargo Bank, National Association (“WFB”). |
Joint Bookrunners and Co-Lead Managers: | Wells Fargo Securities, LLC, Barclays Capital Inc., Credit Suisse Securities (USA) LLC and UBS Securities LLC |
Co-Manager: | Academy Securities, Inc. and Drexel Hamilton, LLC |
Rating Agencies: | Fitch Ratings, Inc., Kroll Bond Rating Agency, Inc. and Moody’s Investors Service, Inc. |
Master Servicer: | Wells Fargo Bank, National Association |
Special Servicer: | Midland Loan Services, a Division of PNC Bank, National Association |
Certificate Administrator: | Wells Fargo Bank, National Association |
Trustee: | Wilmington Trust, National Association |
Operating Advisor: | Pentalpha Surveillance LLC |
Asset Representations Reviewer: | Pentalpha Surveillance LLC |
Initial Majority Controlling Class Certificateholder: | KKR CMBS II Aggregator Type 2 L.P. |
U.S. Credit Risk Retention: | For a discussion on the manner in which the U.S. credit risk retention requirements will be satisfied by Wells Fargo Bank, National Association, as the retaining sponsor, see “Credit Risk Retention” in the Preliminary Prospectus. This transaction is being structured with a “third party purchaser” that will acquire an “eligible horizontal residual interest”, which will be comprised of the Class D-RR, E-RR, F-RR, G-RR, H-RR, J-RR and K-RR Certificates (the “horizontal risk retention certificates”). KKR CMBS II Aggregator Type 2 L.P. (in satisfaction of the retention obligations of Wells Fargo Bank, National Association, as the retaining sponsor) will be contractually obligated to retain (or to cause its “majority-owned affiliate” to retain) the horizontal risk retention certificates for a minimum of five years after the closing date, subject to certain permitted exceptions provided for under the risk retention rules. During this time, KKR CMBS II Aggregator Type 2 L.P. will agree to comply with hedging, transfer and financing restrictions that are applicable to third party purchasers under the credit risk retention rules. For additional information, see “Credit Risk Retention” in the Preliminary Prospectus. |
EU Credit Risk Retention | None of the sponsors, the depositor, the underwriters, or their respective affiliates, or any other party to the transaction intends or is required to retain a material net economic interest in the securitization constituted by the issue of the Certificates in a manner that would satisfy the requirements of the European Union Regulation (EU) 2017/2402. In addition, no such person undertakes to take any other action which may be required by any investor for the purposes of its compliance with any applicable requirement under such Regulation. Furthermore, the arrangements described under “Credit Risk Retention” in the Preliminary Prospectus have not been structured with the objective of ensuring compliance by any person with any requirements of such Regulation. |
Cut-off Date: | The Cut-off Date with respect to each mortgage loan is the due date for the monthly debt service payment that is due in June 2020 (or, in the case of any mortgage loan that has its first due date in July 2020, the date that would have been its due date in June 2020 under the terms of that mortgage loan if a monthly debt service payment were scheduled to be due in that month). |
Expected Closing Date: | On or about June 4, 2020. |
Determination Dates: | The 11th day of each month (or if that day is not a business day, the next succeeding business day), commencing in July 2020. |
Distribution Dates: | The fourth business day following the Determination Date in each month, commencing in July 2020. |
THE INFORMATION IN THIS STRUCTURAL AND COLLATERAL TERM SHEET IS NOT COMPLETE AND MAY BE AMENDED PRIOR TO THE TIME OF SALE. THIS TERM SHEET IS NOT AN OFFER TO SELL THESE SECURITIES AND IT IS NOT A SOLICITATION OF AN OFFER TO BUY THESE SECURITIES IN ANY JURISDICTION WHERE THE OFFER OR SALE IS NOT PERMITTED.
10
Wells Fargo Commercial Mortgage Trust 2020-C56 | Issue Characteristics |
Rated Final Distribution Date: | The Distribution Date in June 2053. |
Interest Accrual Period: | With respect to any Distribution Date, the calendar month immediately preceding the month in which such Distribution Date occurs. |
Day Count: | The Offered Certificates will accrue interest on a 30/360 basis. |
Minimum Denominations: | $10,000 for each Class of Offered Certificates (other than the Class X-A and X-B Certificates) and $1,000,000 for the Class X-A and X-B Certificates. Investments may also be made in any whole dollar denomination in excess of the applicable minimum denomination. |
Clean-up Call: | 1.0% |
Delivery: | DTC, Euroclear and Clearstream Banking |
ERISA/SMMEA Status: | Each Class of Offered Certificates is expected to be eligible for exemptive relief under ERISA. No Class of Offered Certificates will be SMMEA eligible. |
Risk Factors: | THE CERTIFICATES INVOLVE CERTAIN RISKS AND MAY NOT BE SUITABLE FOR ALL INVESTORS. SEE THE “RISK FACTORS” SECTION OF THE PRELIMINARY PROSPECTUS. |
Bond Analytics Information: | The Certificate Administrator will be authorized to make distribution date statements, CREFC® reports and certain supplemental reports (other than confidential information) available to certain financial modeling and data provision services, including Bloomberg, L.P., Trepp, LLC, Intex Solutions, Inc., Interactive Data Corp., Markit Group Limited, BlackRock Financial Management, Inc., CMBS.com, Inc., Moody’s Analytics, Inc., KBRA Analytics, Inc., MBS Data, LLC, Thomson Reuters Corporation and RealINSIGHT. |
Tax Treatment | For U.S. federal income tax purposes, the issuing entity will consist of two or more REMICs arranged in a tiered structure and a trust (the “grantor trust”). The upper-most REMIC will issue REMIC regular interests some of which will be held by the grantor trust (such grantor trust-held REMIC regular interests, the “trust components”). The Offered Certificates (other than the Exchangeable Certificates) will represent REMIC regular interests (other than the trust components). The Exchangeable Certificates will represent beneficial ownership of one or more of the trust components held by the grantor trust. |
THE INFORMATION IN THIS STRUCTURAL AND COLLATERAL TERM SHEET IS NOT COMPLETE AND MAY BE AMENDED PRIOR TO THE TIME OF SALE. THIS TERM SHEET IS NOT AN OFFER TO SELL THESE SECURITIES AND IT IS NOT A SOLICITATION OF AN OFFER TO BUY THESE SECURITIES IN ANY JURISDICTION WHERE THE OFFER OR SALE IS NOT PERMITTED.
11
Wells Fargo Commercial Mortgage Trust 2020-C56 | Characteristics of the Mortgage Pool |
V. Characteristics of the Mortgage Pool(1)
A. Ten Largest Mortgage Loans or Groups of Cross-Collateralized Underlying Mortgage Loans
Mortgage Loan
Seller | Mortgage Loan Name | City | State | Number of Mortgage Loans / Mortgaged Properties | Mortgage Loan Cut-off Date Balance ($) | % of Initial Pool Balance (%) | Property
Type | Number
of SF/Units/Beds | Cut-off
Date
Balance
Per SF/Unit/Bed | Cut-off
Date LTV
Ratio (%) | Balloon or ARD LTV
Ratio (%) | U/W NCF
DSCR (x) | U/W NOI
Debt
Yield (%) |
LMF | Supor Industrial Portfolio | Harrison | NJ | 1 / 1 | $52,737,103 | 7.2% | Industrial | 626,134 | $84 | 54.5% | 44.6% | 1.29x | 8.1% |
LCF | The Grid | Worcester | MA | 1 / 1 | 52,348,530 | 7.2 | Multifamily | 466 | 144,432 | 67.4 | 53.3 | 1.41 | 8.1 |
Column | KPMG Plaza at Hall Arts | Dallas | TX | 1 / 1 | 43,700,000 | 6.0 | Office | 461,306 | 242 | 46.6 | 46.6 | 2.90 | 10.5 |
UBS AG | Panoramic Berkeley | Berkeley | CA | 1 / 1 | 42,000,000 | 5.7 | Multifamily | 254 | 165,354 | 56.2 | 56.2 | 2.25 | 8.8 |
Column | Solitude at Centennial | Las Vegas | NV | 1 / 1 | 35,500,000 | 4.9 | Multifamily | 272 | 130,515 | 60.8 | 60.8 | 2.29 | 8.1 |
WFB | All Aboard Storage - Westport Depot & Ormond Depot(2) | Various | FL | 1 / 2 | 21,804,000 | 3.0 | Self Storage | 214,459 | 91 | 63.5 | 63.5 | 2.68 | 9.6 |
WFB | All Aboard Storage - Port Orange Depot(2) | Port Orange | FL | 1 / 1 | 7,972,000 | 1.1 | Self Storage | 96,632 | 91 | 63.5 | 63.5 | 2.68 | 9.6 |
WFB | All Aboard Storage - Holly Hill Depot(2) | Holly Hill | FL | 1 / 1 | 3,224,000 | 0.4 | Self Storage | 52,200 | 91 | 63.5 | 63.5 | 2.68 | 9.6 |
Barclays | Met Center 15 | Austin | TX | 1 / 1 | 31,000,000 | 4.2 | Office | 257,600 | 120 | 57.9 | 48.3 | 1.99 | 12.7 |
Column | University Village | Seattle | WA | 1 / 1 | 30,000,000 | 4.1 | Retail | 597,635 | 418 | 38.5 | 38.5 | 3.39 | 11.8 |
AREF | Bushwick Multifamily Portfolio | Brooklyn | NY | 1 / 7 | 30,000,000 | 4.1 | Various | 117 | 445,085 | 67.5 | 67.5 | 1.82 | 7.2 |
Barclays | Liberty Walk at East Gate | Mount Laurel | NJ | 1 / 1 | 25,695,000 | 3.5 | Office | 234,563 | 110 | 73.8 | 60.6 | 1.87 | 10.9 |
Top Three Total/Weighted Average | | | 3 / 3 | $148,785,633 | 20.3% | | | | 56.7% | 48.2% | 1.81x | 8.8% |
Top Five Total/Weighted Average | | | 5 / 5 | $226,285,633 | 30.9% | | | | 57.3% | 51.7% | 1.96x | 8.7% |
Top Ten Total/Weighted Average | | | 12 / 19 | $375,980,633 | 51.4% | | | | 58.3% | 53.3% | 2.12x | 9.4% |
Non-Top Ten Total/Weighted Average | | | 34 / 45 | $355,157,461 | 48.6% | | | | 58.5% | 54.6% | 2.32x | 10.2% |
(1) | With respect to any mortgage loan that is cross-collateralized or cross-defaulted with other mortgage loans, the loan-to-value ratio, debt service coverage ratio and debt yield for each such mortgage loan is based upon the ratio or yield (as applicable) for the aggregate indebtedness evidenced by all loans in the group (without regard to any limitation on the amount of indebtedness secured by any mortgaged property in such cross-collateralized group). On an individual basis, without regard to the cross-collateralization feature, any mortgage loan that is part of a cross-collateralized group of mortgage loans may have a higher loan-to-value ratio, lower debt service coverage ratio and/or lower debt yield than is presented herein. With respect to any mortgage loan that is part of a whole loan, Cut-off Date Balance Per SF/Unit/Bed, loan-to-value ratio, debt service coverage ratio and debt yield calculations include the related pari passu companion loan(s) (unless otherwise stated). With respect to each mortgage loan, debt service coverage ratio, debt yield and loan-to-value ratio information do not take into account subordinate debt (whether or not secured by the related mortgaged property), if any, that currently exists or is allowed under the terms of such mortgage loan. |
(2) | The All Aboard Storage - Westport Depot & Ormond Depot mortgage loan, All Aboard Storage - Port Orange Depot mortgage loan and All Aboard Storage - Holly Hill Depot mortgage loan are cross-collateralized and cross-defaulted with each other. |
THE INFORMATION IN THIS STRUCTURAL AND COLLATERAL TERM SHEET IS NOT COMPLETE AND MAY BE AMENDED PRIOR TO THE TIME OF SALE. THIS TERM SHEET IS NOT AN OFFER TO SELL THESE SECURITIES AND IT IS NOT A SOLICITATION OF AN OFFER TO BUY THESE SECURITIES IN ANY JURISDICTION WHERE THE OFFER OR SALE IS NOT PERMITTED.
12
Wells Fargo Commercial Mortgage Trust 2020-C56 | Characteristics of the Mortgage Pool |
B. Summary of the Whole Loans
No. | Loan Name | Mortgage Loan Seller in WFCM 2020-C56 | Trust Cut-off Date Balance | Aggregate Pari Passu Companion Loan Cut-off Date Balance(1) | Controlling Pooling/Trust & Servicing Agreement | Master Servicer | Special Servicer | Related Pari Passu Companion Loan(s) Securitizations | Related Pari Passu Companion Loan(s) Original Balance |
2 | The Grid | LCF | $52,348,530 | $67,305,253 | WFCM 2020-C56 | Wells Fargo Bank, National Association | Midland Loan Services, a Division of PNC Bank, National Association | Future Securitization(s) | $15,000,000 |
3 | KPMG Plaza at Hall Arts | Column | $43,700,000 | $111,700,000 | CSAIL 2020-C19 | Midland Loan Services, a Division of PNC Bank, National Association | 3650 REIT Loan Servicing, LLC | CSAIL 2020-C19 | $68,000,000 |
10 | University Village | Column | $30,000,000 | $250,000,000 | CSMC 2019-UVIL(2) | Midland Loan Services, a Division of PNC Bank, National Association | Cohen Financial, a Division of Truist Bank | CSMC 2019-UVIL | $175,000,000 |
| | | | | | CSAIL 2020-C19 | $45,000,000 |
11 | Bushwick Multifamily Portfolio | AREF | $30,000,000 | $52,075,000 | WFCM 2020-C56 | Wells Fargo Bank, National Association | Midland Loan Services, a Division of PNC Bank, National Association | Future Securitization(s) | $22,075,000 |
13 | Parkmerced | Barclays | $25,000,000 | $547,000,000 | MRCD 2019-PARK(2) | KeyBank National Association | KeyBank National Association | CF 2020-P1 | $40,000,000 |
| | | | | | | | MRCD 2019-PARK | $247,000,000 |
| | | | | | | | BBCMS 2020-C6 | $65,000,000 |
| | | | | | | | BMARK 2020-IG1 | $45,000,000 |
| | | | | | | | CGCMT 2020-GC46 | $27,500,000 |
| | | | | | | | GSMS 2020-GC45 | $37,500,000 |
| | | | | | | | Future Securitization(s) | $60,000,000 |
14 | 650 Madison Avenue | Barclays | $25,000,000 | $586,800,000 | MAD 2019-650M(2) | KeyBank National Association | LNR Partners, LLC | MAD 2019-650M | $1,000,000 |
| | | | | | | | CGCMT 2019-C7 | $50,000,000 |
| | | | | | | | GSMS 2020-GC45 | $50,000,000 |
| | | | | | | | Benchmark 2020-B16 | $45,000,000 |
| | | | | | | | BBCMS 2020-C6 | $60,000,000 |
| | | | | | | | WFCM 2020-C55 | $40,000,000 |
| | | | | | | | CGCMT 2020-GC46 | $115,000,000 |
| | | | | | | | Benchmark 2020-B17 | $50,000,000 |
| | | | | | | | Benchmark 2020-IG1 | $37,900,000 |
| | | | | | | | CF 2020-P1 | $40,000,000 |
| | | | | | | | GSMS 2020-GC47 | $51,450,000 |
| | | | | | | | Future Securitization(s) | $21,450,000 |
THE INFORMATION IN THIS STRUCTURAL AND COLLATERAL TERM SHEET IS NOT COMPLETE AND MAY BE AMENDED PRIOR TO THE TIME OF SALE. THIS TERM SHEET IS NOT AN OFFER TO SELL THESE SECURITIES AND IT IS NOT A SOLICITATION OF AN OFFER TO BUY THESE SECURITIES IN ANY JURISDICTION WHERE THE OFFER OR SALE IS NOT PERMITTED.
13
Wells Fargo Commercial Mortgage Trust 2020-C56 | Characteristics of the Mortgage Pool |
No. | Loan Name | Mortgage Loan Seller in WFCM 2020-C56 | Trust Cut-off Date Balance | Aggregate Pari Passu Companion Loan Cut-off Date Balance(1) | Controlling Pooling/Trust & Servicing Agreement | Master Servicer | Special Servicer | Related Pari Passu Companion Loan(s) Securitizations | Related Pari Passu Companion Loan(s) Original Balance |
16 | HPE Campus | AREF | $20,000,000 | $66,770,000 | WFCM 2020-C56(3) | Wells Fargo Bank, National Association(3) | Midland Loan Services, a Division of PNC Bank, National Association(3) | Future Securitization(s) | $46,770,000 |
(1) | The Aggregate Pari Passu Companion Loan Cut-off Date Balance excludes the related Subordinate Companion Loans. |
(2) | Control rights with respect to the related whole loan are currently exercised by the holder of the related Subordinate Companion Loan until the occurrence and continuance of a control appraisal period for the related whole loan, as described under “Description of the Mortgage Pool—The Whole Loans—The Non-Serviced AB Whole Loans” in the Preliminary Prospectus. |
(3) | The related whole loan is expected to initially be serviced under the WFCM 2020-C56 securitization pooling and servicing agreement until the securitization of the related “lead” pari passu note, after which the related whole loan will be serviced under the pooling and servicing agreement governing such securitization of the related “lead” pari passu note. The master servicer and special servicer for such securitization will be identified in a notice, report or statement to holders of the WFCM 2020-C56 certificates after the closing of such securitization. Control rights with respect to the related whole loan will be exercised by the holder of the “lead” pari passu note. |
THE INFORMATION IN THIS STRUCTURAL AND COLLATERAL TERM SHEET IS NOT COMPLETE AND MAY BE AMENDED PRIOR TO THE TIME OF SALE. THIS TERM SHEET IS NOT AN OFFER TO SELL THESE SECURITIES AND IT IS NOT A SOLICITATION OF AN OFFER TO BUY THESE SECURITIES IN ANY JURISDICTION WHERE THE OFFER OR SALE IS NOT PERMITTED.
14
Wells Fargo Commercial Mortgage Trust 2020-C56 | Characteristics of the Mortgage Pool |
C. Mortgage Loans with Additional Secured and Mezzanine Financing
Loan No. | Mortgage Loan Seller | Mortgage Loan Name | Mortgage
Loan
Cut-off Date Balance ($) | % of Initial Pool Balance (%) | Sub Debt Cut-off Date Balance ($) | Mezzanine Debt Cut-off Date Balance ($) | Total Debt Interest Rate (%)(1) | Mortgage Loan U/W NCF DSCR (x)(2) | Total Debt U/W NCF DSCR (x) | Mortgage Loan Cut-off Date U/W NOI Debt Yield (%)(2) | Total Debt Cut-off Date U/W NOI Debt Yield (%) | Mortgage Loan Cut-off Date LTV Ratio (%)(2) | Total Debt Cut-off Date LTV Ratio (%) |
4 | UBS AG | Panoramic Berkeley | $42,000,000 | 5.7% | NAP | $10,000,000 | 4.30000% | 2.25x | 1.63x | 8.8% | 7.1% | 56.2% | 69.6% |
9 | Barclays | Met Center 15 | 31,000,000 | 4.2 | NAP | 10,000,000 | 5.17000 | 1.99 | 1.25 | 12.7 | 9.6 | 57.9 | 76.6 |
10 | Column | University Village | 30,000,000 | 4.1 | $130,000,000 | NAP | 3.30000 | 3.39 | 2.23 | 11.8 | 7.8 | 38.5 | 58.5 |
13 | Barclays | Parkmerced | 25,000,000 | 3.4 | 953,000,000 | 275,000,000 | 4.29577 | 4.00 | 0.78 | 11.1 | 3.4 | 25.9 | 84.1 |
14 | Barclays | 650 Madison Avenue | 25,000,000 | 3.4 | 213,200,000 | NAP | 3.48600 | 2.74 | 2.01 | 10.0 | 7.3 | 48.5 | 66.1 |
| Total/Weighted Average | $153,000,000 | 20.9% | $1,296,200,000 | $295,000,000 | 4.14650% | 2.79x | 1.59x | 10.8% | 7.2% | 46.9% | 70.6% |
(1) | Total Debt Interest Rate for any specified mortgage loan reflects the weighted average of the interest rates on the respective components of the total debt. |
(2) | With respect to any mortgage loan that is part of a whole loan, the loan-to-value ratio, debt service coverage ratio and debt yield calculations include the related pari passu companion loan(s). |
THE INFORMATION IN THIS STRUCTURAL AND COLLATERAL TERM SHEET IS NOT COMPLETE AND MAY BE AMENDED PRIOR TO THE TIME OF SALE. THIS TERM SHEET IS NOT AN OFFER TO SELL THESE SECURITIES AND IT IS NOT A SOLICITATION OF AN OFFER TO BUY THESE SECURITIES IN ANY JURISDICTION WHERE THE OFFER OR SALE IS NOT PERMITTED.
15
Wells Fargo Commercial Mortgage Trust 2020-C56 | Characteristics of the Mortgage Pool |
D. Previous Securitization History(1)
Loan
No. | Mortgage Loan Seller | Mortgage
Loan or Mortgaged
Property Name | City | State | Property
Type | Mortgage Loan
or Mortgaged Property Cut-off Date Balance ($) | % of
Initial Pool Balance
(%) | Previous Securitization |
1 | LMF | Supor Industrial Portfolio | Harrison | NJ | Industrial | $52,737,103 | 7.2% | LNCR 2018-CRE1 , LNCR 2019-CRE2 |
2 | LCF | The Grid(2) | Worcester | MA | Multifamily | 52,348,530 | 7.2 | LCCM 2017-FL1 |
6 | WFB | All Aboard Storage - Westport Depot & Ormond Depot | Various | FL | Self Storage | 21,804,000 | 3.0 | UBSBB 2013-C5 |
13 | Barclays | Parkmerced | San Francisco | CA | Multifamily | 25,000,000 | 3.4 | LCCM 2014-PKMD |
14 | Barclays | 650 Madison Avenue | New York | NY | Mixed Use | 25,000,000 | 3.4 | MAD 2013-650M |
15 | UBS AG | Lafayette Gardens | Lafayette | LA | Multifamily | 22,000,000 | 3.0 | FNA 2012-M5, FNA 2012-M3 |
22 | LMF | La Jolla Apartments | Fort Worth | TX | Multifamily | 13,300,000 | 1.8 | CGCMT 2014-GC23 |
35 | UBS AG | 3445 Causeway | Metairie | LA | Office | 6,000,000 | 0.8 | JPMBB 2014-C26 |
36 | UBS AG | American Water - Pensacola | Pensacola | FL | Office | 5,932,202 | 0.8 | JPMBB 2014-C26 |
41 | UBS AG | Shoppes at Citiside | Charlotte | NC | Retail | 4,580,979 | 0.6 | LBUBS 2007-C6 |
43 | UBS AG | Thirteen08 Apartments | Greensboro | NC | Multifamily | 3,239,142 | 0.4 | FRESB 2018-SB55 |
44 | WFB | Walgreens - Bridgeville, DE | Bridgeville | DE | Retail | 2,990,835 | 0.4 | DBUBS 2011-LC1A |
45 | UBS AG | Norbrook Arms Apartments | Louisville | KY | Multifamily | 2,831,000 | 0.4 | FNA 2017-M11 |
Total | | | | | | $237,763,790 | 32.5% | |
| (1) | The table above represents the most recent securitization with respect to the mortgaged property securing the related mortgage loan, based on information provided by the related borrower or obtained through searches of a third-party database. While loans secured by the above mortgaged properties may have been securitized multiple times in prior transactions, mortgage loans in this securitization are only listed in the above chart if the mortgage loan paid off a loan in another securitization. The information has not otherwise been confirmed by the mortgage loan sellers. |
| (2) | Of the five buildings comprising The Grid mortgaged property, only two such buildings, representing 71.0% of the total residential units, were collateral for the previously securitized loan. Additional collateral (135 units and approximately 28,000 square feet of commercial space), which previously secured a loan with another lender, was included as part of the mortgaged property for The Grid Mortgage Loan at origination. |
THE INFORMATION IN THIS STRUCTURAL AND COLLATERAL TERM SHEET IS NOT COMPLETE AND MAY BE AMENDED PRIOR TO THE TIME OF SALE. THIS TERM SHEET IS NOT AN OFFER TO SELL THESE SECURITIES AND IT IS NOT A SOLICITATION OF AN OFFER TO BUY THESE SECURITIES IN ANY JURISDICTION WHERE THE OFFER OR SALE IS NOT PERMITTED.
16
| Wells Fargo Commercial Mortgage Trust 2020-C56 | Characteristics of the Mortgage Pool |
E. Mortgage Loans with Scheduled Balloon Payments and Related Classes
| Class A-2(1) |
| Loan No. | Mortgage Loan Seller | Mortgage Loan Name | State | Property Type | Mortgage Loan Cut-off Date Balance ($) | % of Initial Pool
Balance (%) | Mortgage
Loan Balance at Maturity or ARD($) | % of Class A-2 Certificate Principal
Balance (%)(2) | Units/SF | Loan per
Unit/SF ($) | U/W NCF DSCR
(x) | U/W NOI Debt Yield (%) | Cut-off Date LTV Ratio (%) | Balloon or ARD
LTV Ratio (%) | Rem. IO Period (mos.) | Rem. Term to Maturity or ARD (mos.) |
| 13 | Barclays | Parkmerced | CA | Multifamily | $25,000,000 | 3.4% | $25,000,000 | 45.5% | 3,165 | $172,828 | 4.00x | 11.1% | 25.9% | 25.9% | 54 | 54 |
| 17 | LMF | Maxi-Space Portfolio | WA | Various | 19,525,000 | 2.7 | 19,525,000 | 35.5 | 171,569 | 114 | 1.66 | 8.8 | 53.6 | 53.6 | 56 | 56 |
| 28 | LMF | Crosstrax and Cherry Road Storage Portfolio | Various | Self Storage | 9,100,000 | 1.2 | 9,100,000 | 16.6 | 170,476 | 53 | 2.01 | 9.8 | 54.5 | 54.5 | 56 | 56 |
| Total/Weighted Average | | | $53,625,000 | 7.3% | $53,625,000 | 97.6% | | | 2.81x | 10.0% | 40.8% | 40.8% | 55 | 55 |
| | | | | | | | | | | | | | | | | | |
| (1) | The table above presents the mortgage loan(s) whose balloon payments would be applied to pay down the principal balance of the Class A-2 Certificates, assuming a 0% CPR and applying the “Structuring Assumptions” described in the Preliminary Prospectus, including the assumptions that (i) none of the mortgage loans in the pool experience prepayments prior to maturity, defaults or losses; (ii) there are no extensions of maturity dates of any mortgage loans in the pool; and (iii) each mortgage loan in the pool is paid in full on its stated maturity date. Each Class of Certificates evidences undivided ownership interests in the entire pool of mortgage loans. Debt service coverage ratio, debt yield and loan-to-value ratio information do not take into account subordinate debt (whether or not secured by the related mortgaged property), if any, that currently exists or is allowed under the terms of any mortgage loan. See Annex A-1 to the Preliminary Prospectus. |
| (2) | Reflects the percentage equal to the Balloon Balance divided by the initial Class A-2 Certificate Balance. |
| Class A-3(1) |
| Loan No. | Mortgage Loan Seller | Mortgage Loan Name | State | Property Type | Mortgage Loan Cut-off Date Balance ($) | % of Initial Pool
Balance (%) | Mortgage
Loan Balance at Maturity or ARD($) | % of Class A-3 Certificate Principal
Balance (%)(2) | Units | Loan per
Unit ($) | U/W NCF DSCR
(x) | U/W NOI Debt Yield (%) | Cut-off Date LTV Ratio (%) | Balloon or ARD
LTV Ratio (%) | Rem. IO Period (mos.) | Rem. Term to Maturity or ARD (mos.) |
| 45 | UBS AG | Norbrook Arms Apartments | KY | Multifamily | $2,831,000 | 0.4% | $2,605,905 | 100.0% | 94 | $30,117 | 1.52x | 10.5% | 64.3% | 59.2% | 20 | 80 |
| Total/Weighted Average | | | $2,831,000 | 0.4% | $2,605,905 | 100.0% | | | 1.52x | 10.5% | 64.3% | 59.2% | 20 | 80 |
| | | | | | | | | | | | | | | | | | | |
| (1) | The table above presents the mortgage loan(s) whose balloon payments would be applied to pay down the principal balance of the Class A-3 Certificates, assuming a 0% CPR and applying the “Structuring Assumptions” described in the Preliminary Prospectus, including the assumptions that (i) none of the mortgage loans in the pool experience prepayments prior to maturity, defaults or losses; (ii) there are no extensions of maturity dates of any mortgage loans in the pool; and (iii) each mortgage loan in the pool is paid in full on its stated maturity date. Each Class of Certificates evidences undivided ownership interests in the entire pool of mortgage loans. Debt service coverage ratio, debt yield and loan-to-value ratio information do not take into account subordinate debt (whether or not secured by the related mortgaged property), if any, that currently exists or is allowed under the terms of any mortgage loan. See Annex A-1 to the Preliminary Prospectus. |
| (2) | Reflects the percentage equal to the Balloon Balance divided by the initial Class A-3 Certificate Balance. |
THE INFORMATION IN THIS STRUCTURAL AND COLLATERAL TERM SHEET IS NOT COMPLETE AND MAY BE AMENDED PRIOR TO THE TIME OF SALE. THIS TERM SHEET IS NOT AN OFFER TO SELL THESE SECURITIES AND IT IS NOT A SOLICITATION OF AN OFFER TO BUY THESE SECURITIES IN ANY JURISDICTION WHERE THE OFFER OR SALE IS NOT PERMITTED.
17
| Wells Fargo Commercial Mortgage Trust 2020-C56 | Characteristics of the Mortgage Pool |
F. Property Type Distribution(1)
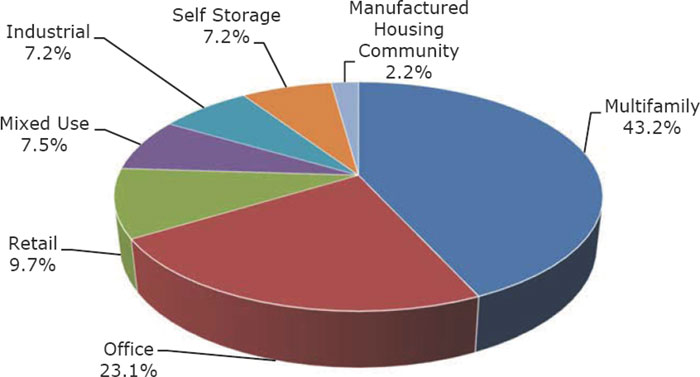
| Property Type | Number of Mortgaged Properties | Aggregate
Cut-off Date
Balance ($) | % of Initial
Pool
Balance (%) | Weighted Average Cut-off Date LTV Ratio (%) | Weighted Average Balloon LTV
Ratio (%) | Weighted Average
U/W NCF DSCR (x) | Weighted Average U/W NOI Debt Yield (%) | Weighted Average U/W NCF Debt Yield (%) | Weighted Average Mortgage Rate (%) |
| Multifamily | 24 | $315,690,630 | 43.2% | 59.6% | 55.1% | 2.17x | 9.0% | 8.8% | 3.658% |
| Garden | 14 | 153,624,433 | 21.0 | 62.1 | 57.5 | 2.05 | 9.2 | 8.9 | 3.750 |
| Mid Rise | 7 | 86,566,197 | 11.8 | 66.6 | 58.0 | 1.78 | 8.2 | 8.1 | 3.706 |
| Student Housing | 1 | 42,000,000 | 5.7 | 56.2 | 56.2 | 2.25 | 8.8 | 8.8 | 3.848 |
| High Rise/Townhome | 1 | 25,000,000 | 3.4 | 25.9 | 25.9 | 4.00 | 11.1 | 10.9 | 2.725 |
| Low Rise | 1 | 8,500,000 | 1.2 | 60.3 | 60.3 | 2.71 | 9.2 | 9.1 | 3.310 |
| Office | 13 | 168,720,397 | 23.1 | 60.1 | 53.8 | 2.33 | 11.4 | 10.4 | 3.594 |
| Suburban | 10 | 118,840,397 | 16.3 | 64.7 | 56.1 | 2.16 | 11.9 | 10.6 | 3.643 |
| CBD | 1 | 43,700,000 | 6.0 | 46.6 | 46.6 | 2.90 | 10.5 | 10.0 | 3.410 |
| Medical | 2 | 6,180,000 | 0.8 | 66.1 | 59.4 | 1.53 | 9.5 | 8.7 | 3.957 |
| Retail | 8 | 71,182,632 | 9.7 | 51.9 | 49.3 | 2.87 | 11.5 | 11.0 | 3.561 |
| Anchored | 4 | 32,731,797 | 4.5 | 63.1 | 58.4 | 2.49 | 11.3 | 10.6 | 3.736 |
| Lifestyle Center | 1 | 30,000,000 | 4.1 | 38.5 | 38.5 | 3.39 | 11.8 | 11.4 | 3.300 |
| Single Tenant | 2 | 6,250,835 | 0.9 | 57.8 | 52.3 | 2.41 | 11.5 | 11.5 | 3.839 |
| Unanchored | 1 | 2,200,000 | 0.3 | 50.5 | 50.5 | 2.82 | 11.2 | 10.7 | 3.730 |
| Mixed Use | 8 | 54,707,333 | 7.5 | 55.0 | 55.0 | 2.20 | 8.9 | 8.7 | 4.035 |
| Office/Retail | 1 | 25,000,000 | 3.4 | 48.5 | 48.5 | 2.74 | 10.0 | 9.7 | 3.486 |
| Self Storage/Office/Retail | 5 | 15,125,000 | 2.1 | 53.6 | 53.6 | 1.66 | 8.8 | 8.6 | 5.100 |
| Multifamily/Retail | 2 | 14,582,333 | 2.0 | 67.5 | 67.5 | 1.82 | 7.2 | 7.2 | 3.870 |
| Industrial | 1 | 52,737,103 | 7.2 | 54.5 | 44.6 | 1.29 | 8.1 | 8.1 | 4.720 |
| Warehouse | 1 | 52,737,103 | 7.2 | 54.5 | 44.6 | 1.29 | 8.1 | 8.1 | 4.720 |
| Self Storage | 9 | 52,300,000 | 7.2 | 61.4 | 60.4 | 2.36 | 9.6 | 9.4 | 3.867 |
| Self Storage | 9 | 52,300,000 | 7.2 | 61.4 | 60.4 | 2.36 | 9.6 | 9.4 | 3.867 |
| Manufactured Housing Community | 1 | 15,800,000 | 2.2 | 60.4 | 60.4 | 1.72 | 7.7 | 7.6 | 4.372 |
| Manufactured Housing Community | 1 | 15,800,000 | 2.2 | 60.4 | 60.4 | 1.72 | 7.7 | 7.6 | 4.372 |
| Total/Weighted Average: | 64 | $731,138,094 | 100.0% | 58.4% | 53.9% | 2.22x | 9.8% | 9.4% | 3.769% |
| (1) | Because this table presents information relating to the mortgaged properties and not the mortgage loans, (a) the information for mortgage loans secured by more than one mortgaged property (other than through cross-collateralization with other mortgage loans) is based on allocated amounts (allocating the principal balance of the mortgage loan to each of those properties according to the relative appraised values of the mortgaged properties or the allocated loan amounts or property-specific release prices set forth in the related mortgage loan documents or such other allocation as the related mortgage loan seller deemed appropriate) and (b) the information for each mortgaged property that relates to a mortgage loan that is cross-collateralized or cross-defaulted with other mortgage loans is based upon the principal balance of that mortgage loan, except that the applicable loan-to-value ratio, debt service coverage ratio and debt yield for each such mortgage loan is based upon the ratio or yield (as applicable) for the aggregate indebtedness evidenced by all loans in the group (without regard to any limitation on the amount of indebtedness secured by any mortgaged property in such cross-collateralized group). On an individual basis, without regard to the cross-collateralization feature, any mortgage loan that is part of a cross-collateralized group of mortgage loans may have a higher loan-to-value ratio, lower debt service coverage ratio and/or lower debt yield than is presented herein. With respect to any mortgage loan that is part of a whole loan, the loan-to-value ratio, debt service coverage ratio and debt yield calculations include the related pari passu companion loan(s) but exclude any related subordinate secured loan(s) (unless otherwise stated). With respect to each mortgage loan, debt service coverage ratio, debt yield and loan-to-value ratio information do not take into account any subordinate debt (whether or not secured by the related mortgaged property) that currently exists or is allowed under the terms of such mortgage loan. See Annex A-1 to the Preliminary Prospectus. |
THE INFORMATION IN THIS STRUCTURAL AND COLLATERAL TERM SHEET IS NOT COMPLETE AND MAY BE AMENDED PRIOR TO THE TIME OF SALE. THIS TERM SHEET IS NOT AN OFFER TO SELL THESE SECURITIES AND IT IS NOT A SOLICITATION OF AN OFFER TO BUY THESE SECURITIES IN ANY JURISDICTION WHERE THE OFFER OR SALE IS NOT PERMITTED.
18
| Wells Fargo Commercial Mortgage Trust 2020-C56 | Characteristics of the Mortgage Pool |
G. Geographic Distribution(1)

| Location | Number of Mortgaged Properties | Aggregate Cut-off
Date Balance ($) | % of Initial Pool
Balance (%) | Weighted Average Cut-off Date LTV Ratio (%) | Weighted Average Balloon or ARD LTV Ratio (%) | Weighted Average U/W NCF DSCR (x) | Weighted Average U/W NOI Debt Yield (%) | Weighted Average U/W NCF Debt Yield (%) | Weighted Average Mortgage Rate (%) |
| California | 13 | $158,870,817 | 21.7% | 55.4% | 54.1% | 2.62x | 9.5% | 9.3% | 3.522% |
| Northern California | 7 | 130,700,000 | 17.9 | 53.2 | 53.2 | 2.77 | 9.5 | 9.4 | 3.421 |
| Southern California | 6 | 28,170,817 | 3.9 | 65.3 | 58.2 | 1.91 | 9.7 | 9.1 | 3.992 |
| Texas | 5 | 113,617,954 | 15.5 | 54.8 | 48.8 | 2.28 | 11.1 | 10.3 | 3.595 |
| New Jersey | 3 | 90,732,103 | 12.4 | 60.8 | 51.3 | 1.65 | 9.1 | 8.7 | 4.077 |
| New York | 10 | 69,916,337 | 9.6 | 60.8 | 57.9 | 2.08 | 8.6 | 8.4 | 3.782 |
| Massachusetts | 2 | 55,608,530 | 7.6 | 67.1 | 53.9 | 1.48 | 8.3 | 8.1 | 3.821 |
| Washington | 8 | 49,525,000 | 6.8 | 44.5 | 44.5 | 2.71 | 10.6 | 10.3 | 4.010 |
| Florida | 7 | 49,432,202 | 6.8 | 64.8 | 61.9 | 2.41 | 9.9 | 9.6 | 3.658 |
| Nevada | 1 | 35,500,000 | 4.9 | 60.8 | 60.8 | 2.29 | 8.1 | 7.9 | 3.391 |
| Louisiana | 2 | 28,000,000 | 3.8 | 62.2 | 62.2 | 2.45 | 10.5 | 9.8 | 3.960 |
| Michigan | 2 | 18,000,000 | 2.5 | 59.2 | 59.2 | 1.85 | 8.1 | 8.0 | 4.294 |
| Kansas | 2 | 15,613,195 | 2.1 | 69.1 | 55.4 | 2.06 | 13.9 | 12.0 | 4.108 |
| North Carolina | 3 | 13,820,121 | 1.9 | 53.6 | 47.9 | 2.03 | 11.4 | 11.0 | 4.508 |
| Idaho | 1 | 9,880,000 | 1.4 | 63.2 | 63.2 | 3.09 | 11.9 | 11.0 | 3.511 |
| Colorado | 1 | 7,900,000 | 1.1 | 59.4 | 53.9 | 1.94 | 12.2 | 11.0 | 3.900 |
| Georgia | 1 | 5,800,000 | 0.8 | 65.9 | 56.8 | 1.66 | 9.5 | 9.3 | 3.850 |
| South Carolina | 1 | 3,100,000 | 0.4 | 54.5 | 54.5 | 2.01 | 9.8 | 9.5 | 4.650 |
| Delaware | 1 | 2,990,835 | 0.4 | 52.5 | 41.0 | 2.21 | 12.0 | 12.0 | 3.500 |
| Kentucky | 1 | 2,831,000 | 0.4 | 64.3 | 59.2 | 1.52 | 10.5 | 9.6 | 4.880 |
| Total/Weighted Average | 64 | $731,138,094 | 100.0% | 58.4% | 53.9% | 2.22x | 9.8% | 9.4% | 3.769% |
| (1) | Because this table presents information relating to the mortgaged properties and not the mortgage loans, (a) the information for mortgage loans secured by more than one mortgaged property (other than through cross-collateralization with other mortgage loans) is based on allocated amounts (allocating the principal balance of the mortgage loan to each of those properties according to the relative appraised values of the mortgaged properties or the allocated loan amounts or property-specific release prices set forth in the related mortgage loan documents or such other allocation as the related mortgage loan seller deemed appropriate) and (b) the information for each mortgaged property that relates to a mortgage loan that is cross-collateralized or cross-defaulted with other mortgage loans is based upon the principal balance of that mortgage loan, except that the applicable loan-to-value ratio, debt service coverage ratio and debt yield for each such mortgage loan is based upon the ratio or yield (as applicable) for the aggregate indebtedness evidenced by all loans in the group (without regard to any limitation on the amount of indebtedness secured by any mortgaged property in such cross-collateralized group). On an individual basis, without regard to the cross-collateralization feature, any mortgage loan that is part of a cross-collateralized group of mortgage loans may have a higher loan-to-value ratio, lower debt service coverage ratio and/or lower debt yield than is presented herein. With respect to any mortgage loan that is part of a whole loan, the loan-to-value ratio, debt service coverage ratio and debt yield calculations include the related pari passu companion loan(s) but exclude any related subordinate secured loan(s) (unless otherwise stated). With respect to each mortgage loan, debt service coverage ratio, debt yield and loan-to-value ratio information do not take into account any subordinate debt (whether or not secured by the related mortgaged property) that currently exists or is allowed under the terms of such mortgage loan. See Annex A-1 to the Preliminary Prospectus. |
THE INFORMATION IN THIS STRUCTURAL AND COLLATERAL TERM SHEET IS NOT COMPLETE AND MAY BE AMENDED PRIOR TO THE TIME OF SALE. THIS TERM SHEET IS NOT AN OFFER TO SELL THESE SECURITIES AND IT IS NOT A SOLICITATION OF AN OFFER TO BUY THESE SECURITIES IN ANY JURISDICTION WHERE THE OFFER OR SALE IS NOT PERMITTED.
19
Wells Fargo Commercial Mortgage Trust 2020-C56 | Characteristics of the Mortgage Pool |
H. Characteristics of the Mortgage Pool(1)
CUT-OFF DATE BALANCE |
Range of Cut-off Date
Balances ($) | Number of
Mortgage
Loans | Aggregate
Cut-off Date
Balance | Percent by Aggregate Cut-off Date Pool Balance (%) |
2,200,000 - 3,000,000 | 3 | $8,021,835 | 1.1% |
3,000,001 - 4,000,000 | 3 | 9,723,142 | 1.3 |
4,000,001 - 5,000,000 | 2 | 9,480,979 | 1.3 |
5,000,001 - 7,000,000 | 5 | 28,232,202 | 3.9 |
7,000,001 - 8,000,000 | 5 | 37,852,597 | 5.2 |
8,000,001 - 9,000,000 | 2 | 16,943,416 | 2.3 |
9,000,001 - 10,000,000 | 3 | 28,880,000 | 4.0 |
10,000,001 - 15,000,000 | 5 | 62,676,337 | 8.6 |
15,000,001 - 20,000,000 | 5 | 92,542,954 | 12.7 |
20,000,001 - 30,000,000 | 7 | 179,499,000 | 24.6 |
30,000,001 - 50,000,000 | 4 | 152,200,000 | 20.8 |
50,000,001 - 52,737,103 | 2 | 105,085,633 | 14.4 |
Total: | 46 | $731,138,094 | 100.0% |
Weighted Average | $15,894,306 | | |
UNDERWRITTEN NOI DEBT SERVICE COVERAGE RATIO |
Range of U/W NOI
DSCRs (x) | Number of
Mortgage
Loans | Aggregate
Cut-off Date
Balance | Percent by Aggregate Cut-off Date Pool Balance (%) |
1.25 - 1.40 | 2 | $55,976,245 | 7.7% |
1.41 - 1.50 | 1 | 52,348,530 | 7.2 |
1.51 - 1.60 | 2 | 22,527,155 | 3.1 |
1.61 - 1.70 | 5 | 43,456,000 | 5.9 |
1.71 - 1.80 | 2 | 21,732,202 | 3.0 |
1.81 - 2.00 | 3 | 61,717,954 | 8.4 |
2.01 - 2.50 | 12 | 206,955,614 | 28.3 |
2.51 - 3.00 | 14 | 151,844,395 | 20.8 |
3.01 - 3.50 | 2 | 53,580,000 | 7.3 |
3.51 - 4.05 | 2 | 36,000,000 | 4.9 |
4.06 | 1 | 25,000,000 | 3.4 |
Total: | 46 | $731,138,094 | 100.0% |
Weighted Average | 2.31x | | |
UNDERWRITTEN NCF DEBT SERVICE COVERAGE RATIO |
Range of U/W NCF DSCRs (x) | Number of
Mortgage
Loans | Aggregate
Cut-off Date
Balance | Percent by Aggregate Cut-off Date Pool Balance (%) |
1.20 - 1.40 | 2 | $55,976,245 | 7.7% |
1.41 - 1.50 | 3 | 69,859,347 | 9.6 |
1.51 - 1.60 | 3 | 23,147,337 | 3.2 |
1.61 - 1.70 | 2 | 25,325,000 | 3.5 |
1.71 - 1.80 | 5 | 60,619,935 | 8.3 |
1.81 - 1.90 | 2 | 55,695,000 | 7.6 |
1.91 - 2.00 | 3 | 46,100,000 | 6.3 |
2.01 - 2.50 | 9 | 141,534,251 | 19.4 |
2.51 - 3.00 | 13 | 182,000,979 | 24.9 |
3.01 – 4.00 | 4 | 70,880,000 | 9.7 |
Total: | 46 | $731,138,094 | 100.0% |
Weighted Average | 2.22x | | |
LOAN PURPOSE |
Loan Purpose | Number of
Mortgage
Loans | Aggregate
Cut-off Date
Balance | Percent by Aggregate Cut-off Date Pool Balance (%) |
Refinance | 29 | $493,377,382 | 67.5% |
Acquisition | 14 | 213,033,557 | 29.1 |
Various | 1 | 14,916,337 | 2.0 |
Recapitalization | 2 | 9,810,817 | 1.3 |
Total: | 46 | $731,138,094 | 100.0% |
| | | |
MORTGAGE RATE |
Range of Mortgage Rates (%) | Number of Mortgage
Loans | Aggregate
Cut-off Date
Balance | Percent by Aggregate Cut-off Date Pool Balance (%) |
2.725 - 3.500 | 15 | $276,885,835 | 37.9% |
3.501 - 3.750 | 7 | 94,240,000 | 12.9 |
3.751 - 4.000 | 13 | 214,328,060 | 29.3 |
4.001 - 4.250 | 3 | 24,108,539 | 3.3 |
4.251 - 4.500 | 3 | 34,143,416 | 4.7 |
4.501 - 4.750 | 2 | 61,837,103 | 8.5 |
4.751 - 5.000 | 2 | 6,070,142 | 0.8 |
5.100 | 1 | 19,525,000 | 2.7 |
Total: | 46 | $731,138,094 | 100.0% |
Weighted Average | 3.769% | | |
UNDERWRITTEN NOI DEBT YIELD |
Range of U/W NOI Debt Yields (%) | Number of
Mortgage
Loans | Aggregate
Cut-off Date
Balance | Percent by Aggregate Cut-off Date Pool Balance (%) |
7.2 - 8.0 | 3 | $50,700,000 | 6.9% |
8.1 - 9.0 | 8 | 224,460,592 | 30.7 |
9.1 - 10.0 | 14 | 184,716,337 | 25.3 |
10.1 - 11.0 | 8 | 122,963,954 | 16.8 |
11.1 - 12.0 | 8 | 90,372,816 | 12.4 |
12.1 - 15.0 | 2 | 38,900,000 | 5.3 |
15.1 - 15.9 | 3 | 19,024,395 | 2.6 |
Total: | 46 | $731,138,094 | 100.0% |
Weighted Average | 9.8% | | |
UNDERWRITTEN NCF DEBT YIELD |
Range of U/W NCF Debt Yields (%) | Number of
Mortgage
Loans | Aggregate
Cut-off Date
Balance | Percent by Aggregate Cut-off Date Pool Balance (%) |
7.2 - 8.0 | 6 | $141,787,672 | 19.4% |
8.1 - 9.0 | 9 | 185,589,258 | 25.4 |
9.1 - 10.0 | 16 | 233,786,000 | 32.0 |
10.1 - 11.0 | 9 | 112,027,733 | 15.3 |
11.1 - 13.0 | 3 | 38,923,036 | 5.3 |
13.1 - 15.0 | 2 | 14,443,416 | 2.0 |
15.1 | 1 | 4,580,979 | 0.6 |
Total: | 46 | $731,138,094 | 100.0% |
Weighted Average | 9.4% | | |
ORIGINAL TERM TO MATURITY OR ARD |
Original Terms to
Maturity or ARD (months) | Number of
Mortgage
Loans | Aggregate
Cut-off Date
Balance | Percent by Aggregate Cut-off Date Pool Balance (%) |
60 | 3 | $53,625,000 | 7.3% |
84 | 1 | 2,831,000 | 0.4 |
120 | 42 | 674,682,094 | 92.3 |
Total: | 46 | $731,138,094 | 100.0% |
Weighted Average | 115 months | | |
| | | | |
(1) | The information for each mortgaged property that relates to a mortgage loan that is cross-collateralized or cross-defaulted with one or more other mortgage loans is based upon the principal balance of that mortgage loan, except that the applicable loan-to-value ratio, debt service coverage ratio, and debt yield for each such mortgage loan is based upon the ratio or yield (as applicable) for the aggregate indebtedness evidenced by all loans in the group (without regard to any limitation on the amount of indebtedness secured by any mortgaged property in such cross-collateralized group). With respect to any mortgage loan that is part of a whole loan, the loan-to-value ratio, debt service coverage ratio and debt yield calculations include the related pari passu companion loan(s) but exclude any related subordinate companion loan(s) (unless otherwise stated). With respect to each mortgage loan, debt service coverage ratio, debt yield and loan-to-value ratio information do not take into account any subordinate debt (whether or not secured by the related mortgaged property) that currently exists or is allowed under the terms of such mortgage loan. See Annex A-1 to the Preliminary Prospectus. Prepayment provisions for each mortgage loan reflects the entire life of the loan (from origination to maturity) and may be currently prepayable. |
THE INFORMATION IN THIS STRUCTURAL AND COLLATERAL TERM SHEET IS NOT COMPLETE AND MAY BE AMENDED PRIOR TO THE TIME OF SALE. THIS TERM SHEET IS NOT AN OFFER TO SELL THESE SECURITIES AND IT IS NOT A SOLICITATION OF AN OFFER TO BUY THESE SECURITIES IN ANY JURISDICTION WHERE THE OFFER OR SALE IS NOT PERMITTED.
20
Wells Fargo Commercial Mortgage Trust 2020-C56 | Characteristics of the Mortgage Pool |
REMAINING TERM TO MATURITY OR ARD |
Range of Remaining Terms to
Maturity or ARD (months) | Number of
Mortgage
Loans | Aggregate
Cut-off Date
Balance | Percent by Aggregate Cut-off Date Pool Balance (%) |
54 - 79 | 3 | $53,625,000 | 7.3% |
80 - 112 | 1 | 2,831,000 | 0.4 |
113 - 118 | 42 | 674,682,094 | 92.3 |
Total: | 46 | $731,138,094 | 100.0% |
Weighted Average | 111 months | | |
ORIGINAL AMORTIZATION TERM(2) |
Original Amortization Terms (months) | Number of
Mortgage
Loans | Aggregate
Cut-off Date
Balance | Percent by Aggregate Cut-off Date Pool Balance (%) |
Non-Amortizing | 26 | $443,725,000 | 60.7% |
300 | 1 | 5,932,202 | 0.8 |
360 | 19 | 281,480,893 | 38.5 |
Total: | 46 | $731,138,094 | 100.0% |
Weighted Average(3) | 359 months | | |
(2) The original amortization term shown for any mortgage loan that is interest-only for part of its term does not include the number of months in its interest-only period and reflects only the number of months as of the commencement of amortization remaining from the end of such interest-only period. (3) Excludes the non-amortizing mortgage loans. |
REMAINING AMORTIZATION TERM(4) |
Range of Remaining Amortization Terms (months) | Number of
Mortgage
Loans | Aggregate
Cut-off Date
Balance | Percent by Aggregate Cut-off Date Pool Balance (%) |
Non-Amortizing | 26 | $443,725,000 | 60.7% |
294 | 1 | 5,932,202 | 0.8 |
355 - 360 | 19 | 281,480,893 | 38.5 |
Total: | 46 | $731,138,094 | 100.0% |
Weighted Average(5) | 357 months | | |
(4) The remaining amortization term shown for any mortgage loan that is interest-only for part of its term does not include the number of months in its interest-only period and reflects only the number of months as of the commencement of amortization remaining from the end of such interest-only period. (5) Excludes the non-amortizing mortgage loans. |
LOCKBOXES |
Type of Lockbox | Number of
Mortgage
Loans | Aggregate
Cut-off Date
Balance | Percent by Aggregate Cut-off Date Pool Balance (%) |
Springing | 27 | $351,854,191 | 48.1% |
Hard/Springing Cash Management | 10 | 216,505,397 | 29.6 |
Soft/Springing Cash Management | 8 | 159,787,672 | 21.9 |
Hard/Upfront Cash Management | 1 | 2,990,835 | 0.4 |
Total: | 46 | $731,138,094 | 100.0% |
PREPAYMENT PROVISION SUMMARY(6) |
Prepayment Provision | Number of
Mortgage
Loans | Aggregate
Cut-off Date
Balance | Percent by Aggregate Cut-off Date Pool Balance (%) |
Lockout / Defeasance / Open | 38 | $603,656,260 | 82.6% |
Lockout / GRTR 1% or YM / Open | 5 | 36,981,835 | 5.1 |
GRTR 0.5% or YM / GRTR 0.5% or YM or D / Open | 1 | 35,500,000 | 4.9 |
Lockout / GRTR 1% or YM or D / Open | 1 | 30,000,000 | 4.1 |
YM / Open | 1 | 25,000,000 | 3.4 |
Total: | 46 | $731,138,094 | 100.0% |
(6) As a result of property releases or the application of funds in a performance reserve, partial principal prepayments could occur during a period that voluntary principal prepayments are otherwise prohibited. |
| | | | |
CUT-OFF DATE LOAN-TO-VALUE RATIO |
Range of Cut-off Date LTV
Ratios (%) | Number of
Mortgage
Loans | Aggregate
Cut-off Date
Balance | Percent by Aggregate Cut-off Date Pool Balance (%) |
25.9 - 30.0 | 1 | $25,000,000 | 3.4% |
35.1 - 45.0 | 1 | 30,000,000 | 4.1 |
45.1 - 50.0 | 3 | 73,280,979 | 10.0 |
50.1 - 55.0 | 6 | 92,552,938 | 12.7 |
55.1 - 60.0 | 6 | 118,017,954 | 16.1 |
60.1 - 65.0 | 16 | 188,570,142 | 25.8 |
65.1 - 70.0 | 11 | 170,851,302 | 23.4 |
70.1 - 73.8 | 2 | 32,864,779 | 4.5 |
Total: | 46 | $731,138,094 | 100.0% |
Weighted Average | 58.4% | | |
BALLOON LOAN-TO-VALUE RATIO | |
Range of Balloon LTV
Ratios (%) | Number of
Mortgage
Loans | Aggregate
Cut-off Date
Balance | Percent by Aggregate Cut-off Date Pool Balance (%) |
25.9 - 35.0 | 1 | $25,000,000 | 3.4% |
35.1 - 40.0 | 2 | 34,580,979 | 4.7 |
40.1 - 45.0 | 3 | 74,145,892 | 10.1 |
45.1 - 50.0 | 3 | 99,700,000 | 13.6 |
50.1 - 55.0 | 12 | 146,704,626 | 20.1 |
55.1 - 60.0 | 7 | 90,211,597 | 12.3 |
60.1 - 65.0 | 15 | 203,695,000 | 27.9 |
65.1 – 67.5 | 3 | 57,100,000 | 7.8 |
Total: | 46 | $731,138,094 | 100.0% |
Weighted Average | 53.9% | | |
AMORTIZATION TYPE |
Amortization Type | Number of
Mortgage
Loans | Aggregate
Cut-off Date
Balance | Percent by Aggregate Cut-off Date Pool Balance (%) |
Interest-only, Balloon | 26 | $443,725,000 | 60.7% |
Amortizing Balloon | 11 | 178,387,094 | 24.4 |
Interest-only, Amortizing Balloon | 9 | 109,026,000 | 14.9 |
Total: | 46 | $731,138,094 | 100.0% |
ORIGINAL TERM OF INTEREST-ONLY PERIOD FOR PARTIAL IO LOANS |
IO Terms (months) | Number of
Mortgage
Loans | Aggregate
Cut-off Date
Balance | Percent by Aggregate Cut-off Date Pool Balance (%) |
24 | 4 | $69,426,000 | 9.5% |
36 | 2 | 19,100,000 | 2.6 |
60 | 3 | 20,500,000 | 2.8 |
Total: | 9 | $109,026,000 | 14.9% |
Weighted Average | 33 months | | |
SEASONING |
Seasoning (months) | Number of
Mortgage
Loans | Aggregate
Cut-off Date
Balance | Percent by Aggregate Cut-off Date Pool Balance (%) |
2 | 5 | $108,210,182 | 14.8% |
3 | 16 | 207,884,900 | 28.4 |
4 | 14 | 187,007,394 | 25.6 |
5 | 5 | 95,943,416 | 13.1 |
6 | 5 | 96,592,202 | 13.2 |
7 | 1 | 35,500,000 | 4.9 |
Total: | 46 | $731,138,094 | 100.0% |
Weighted Average | 4 months | | |
THE INFORMATION IN THIS STRUCTURAL AND COLLATERAL TERM SHEET IS NOT COMPLETE AND MAY BE AMENDED PRIOR TO THE TIME OF SALE. THIS TERM SHEET IS NOT AN OFFER TO SELL THESE SECURITIES AND IT IS NOT A SOLICITATION OF AN OFFER TO BUY THESE SECURITIES IN ANY JURISDICTION WHERE THE OFFER OR SALE IS NOT PERMITTED.
21
Wells Fargo Commercial Mortgage Trust 2020-C56 | Certain Terms and Conditions |
VI. Certain Terms and Conditions
Interest Entitlements: | The interest entitlement of each Class of Certificates or trust component on each Distribution Date generally will be the interest accrued during the related Interest Accrual Period on the related Certificate Balance or Notional Amount at the related pass-through rate, net of any prepayment interest shortfalls allocated to that Class or trust component for such Distribution Date as described below. If prepayment interest shortfalls arise from voluntary prepayments (without Master Servicer consent) on particular non-specially serviced loans during any collection period, the Master Servicer is required to make a compensating interest payment to offset those shortfalls, generally up to an amount equal to the portion of its master servicing fees that accrue at 0.25 basis points per annum. The remaining amount of prepayment interest shortfalls will be allocated to reduce the interest entitlement on all Classes of Certificates (other than the Exchangeable Certificates) and trust components that are entitled to interest, on a pro rata basis, based on their respective amounts of accrued interest for the related Distribution Date. For any Distribution Date, prepayment interest shortfalls allocated to a trust component will be allocated amongst the related Classes of Exchangeable Certificates, pro rata, in accordance with their respective interest accrual amounts for that distribution date. If a Class or trust component receives less than the entirety of its interest entitlement on any Distribution Date, then the shortfall (excluding any shortfall due to prepayment interest shortfalls), together with interest thereon, will be added to its interest entitlement for the next succeeding Distribution Date. |
Principal Distribution Amount: | The Principal Distribution Amount for each Distribution Date generally will be the aggregate amount of principal received or advanced in respect of the mortgage loans, net of any non-recoverable advances and interest thereon and workout-delayed reimbursement amounts that are reimbursed to the Master Servicer, the Special Servicer or the Trustee during the related collection period. Non-recoverable advances and interest thereon are reimbursable from principal collections and advances before reimbursement from other amounts. Workout-delayed reimbursement amounts are reimbursable from principal collections. |
Subordination, Allocation of Losses and Certain Expenses | The chart below describes the manner in which the payment rights of certain Classes of Certificates will be senior or subordinate, as the case may be, to the payment rights of other Classes of Certificates. The chart also shows the corresponding entitlement to receive principal and/or interest of certain Classes of Certificates on any distribution date in descending order. It also shows the manner in which losses are allocated to certain Classes of Certificates in ascending order (beginning with the Non-Offered Certificates, and other than the Class R Certificates) to reduce the Certificate Balance of each such Class to zero; provided that no principal payments or mortgage loan losses will be allocated to the Class X-A, X-B or R Certificates, although principal payments and losses may reduce the Notional Amounts of the Class X-A and X-B Certificates and, therefore, the amount of interest they accrue. |
| 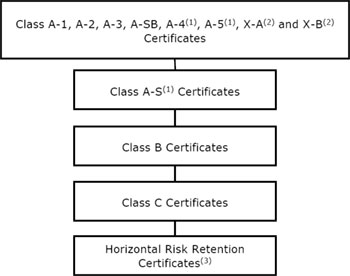 (1) The maximum certificate balances of Class A-4, Class A-5 and Class A-S certificates (subject to the constraint on the aggregate initial principal balance of the Class A-4 and Class A-5 trust components discussed in footnote (9) to the table under “Certificate Structure”) will be issued on the closing date, and the certificate balance or notional amount of each other class of Exchangeable Certificates will be equal to zero on the closing date. The relative priorities of the Exchangeable Certificates are described more fully under “Exchangeable Certificates.” (2) The Class X-A and X-B Certificates are interest-only certificates. (3) Non-Offered Certificates. |
THE INFORMATION IN THIS STRUCTURAL AND COLLATERAL TERM SHEET IS NOT COMPLETE AND MAY BE AMENDED PRIOR TO THE TIME OF SALE. THIS TERM SHEET IS NOT AN OFFER TO SELL THESE SECURITIES AND IT IS NOT A SOLICITATION OF AN OFFER TO BUY THESE SECURITIES IN ANY JURISDICTION WHERE THE OFFER OR SALE IS NOT PERMITTED.
22
Wells Fargo Commercial Mortgage Trust 2020-C56 | Certain Terms and Conditions |
Distributions: | On each Distribution Date, funds available for distribution from the mortgage loans, net of specified trust fees, expenses and reimbursements will generally be distributed in the following amounts and order of priority (in each case to the extent of remaining available funds): |
| 1. Class A-1, A-2, A-3, A-SB, A-4, A-5, X-A and X-B Certificates: To interest on the Class A-1, A-2, A-3, A-SB, X-A and X-B Certificates and the Class A-4, A-4-X1, A-4-X2, A-5, A-5-X1 and A-5-X2 trust components, pro rata, according to their respective interest entitlements. |
| 2. Class A-1, A-2, A-3 and A-SB Certificates and the Class A-4 and A-5 trust components: To principal on the Class A-1, A-2, A-3 and A-SB Certificates and the Class A-4 and A-5 trust components in the following amounts and order of priority: (i) first, to principal on the Class A-SB Certificates, in an amount up to the Principal Distribution Amount for such Distribution Date until their Certificate Balance is reduced to the Class A-SB Planned Principal Balance for such Distribution Date; (ii) second, to principal on the Class A-1 Certificates until their Certificate Balance is reduced to zero, up to the remainder of the Principal Distribution Amount for such Distribution Date; (iii) third, to principal on the Class A-2 Certificates until their Certificate Balance is reduced to zero, up to the remainder of the Principal Distribution Amount for such Distribution Date; (iv) fourth, to principal on the Class A-3 Certificates until their Certificate Balance is reduced to zero, up to the remainder of the Principal Distribution Amount for such Distribution Date; (v) fifth, to principal on the Class A-4 trust component until its Certificate Balance is reduced to zero, up to the remainder of the Principal Distribution Amount for such Distribution Date; (vi) sixth, to principal on the Class A-5 trust component until its Certificate Balance is reduced to zero, up to the remainder of the Principal Distribution Amount for such Distribution Date; and (vii) seventh, to principal on the Class A-SB Certificates until their Certificate Balance is reduced to zero, up to the remainder of the Principal Distribution Amount for such Distribution Date. However, if the Certificate Balance of each Class of Principal Balance Certificates, other than the Class A-1, A-2, A-3 and A-SB Certificates and the Class A-4 and A-5 trust components, has been reduced to zero as a result of the allocation of Mortgage Loan losses and expenses and any of the Class A-1, A-2, A-3 and A-SB Certificates and the Class A-4 and A-5 trust components remains outstanding, then the Principal Distribution Amount will be distributed to the Class A-1, A-2, A-3 and A-SB Certificates and the Class A-4 and A-5 trust components, pro rata, based on their respective outstanding Certificate Balances, until their Certificate Balances have been reduced to zero. |
| 3. Class A-1, A-2, A-3 and A-SB Certificates and the Class A-4 and A-5 trust components: To reimburse the holders of the Class A-1, A-2, A-3 and A-SB Certificates and the Class A-4 and A-5 trust components, pro rata, on the basis of previously allocated unreimbursed losses, for any previously unreimbursed losses (plus interest thereon) on the mortgage loans that were previously allocated in reduction of the Certificate Balances of such Classes or trust components. |
| 4. Class A-S, A-S-X-1 and A-S-X2 trust components: To make distributions on the Class A-S, A-S-X-1 and A-S-X2 trust components as follows: (a) first, to interest on the Class A-S, A-S-X-1 and A-S-X2 trust components, pro rata, according to their respective interest entitlements; (b) next, to the extent of the portion of the Principal Distribution Amount remaining after distributions in respect of principal to each Class with a higher distribution priority (in this case, the Class A-1, A-2, A-3 and A-SB Certificates and the Class A-4 and A-5 trust components), to principal on the Class A-S trust component until its Certificate Balance is reduced to zero; and (c) next, to reimburse the holders of the Class A-S trust component for any previously unreimbursed losses (plus interest thereon) on the mortgage loans that were previously allocated to that trust component in reduction of their Certificate Balance. 5. Class B Certificates: To make distributions on the Class B Certificates as follows: (a) first, to interest on the Class B Certificates in the amount of the interest entitlement for that Class; (b) next, to the extent of the portion of the Principal Distribution Amount remaining after distributions in respect of principal to each Class with a higher distribution priority (in this case, the Class A-1, A-2, A-3 and A-SB Certificates and the Class A-4, A-5 and A-S trust components), to principal on the Class B Certificates until their Certificate Balance is reduced to zero; and (c) next, to reimburse the holders of the Class B Certificates for any previously unreimbursed losses (plus interest thereon) on the mortgage loans that were previously allocated to that Class in reduction of their Certificate Balance. 6. Class C Certificates: To make distributions on the Class C Certificates as follows: (a) first, to interest on the Class C Certificates in the amount of the interest entitlement for |
THE INFORMATION IN THIS STRUCTURAL AND COLLATERAL TERM SHEET IS NOT COMPLETE AND MAY BE AMENDED PRIOR TO THE TIME OF SALE. THIS TERM SHEET IS NOT AN OFFER TO SELL THESE SECURITIES AND IT IS NOT A SOLICITATION OF AN OFFER TO BUY THESE SECURITIES IN ANY JURISDICTION WHERE THE OFFER OR SALE IS NOT PERMITTED.
23
Wells Fargo Commercial Mortgage Trust 2020-C56 | Certain Terms and Conditions |
| that Class; (b) next, to the extent of the portion of the Principal Distribution Amount remaining after distributions in respect of principal to each Class with a higher distribution priority (in this case, the Class A-1, A-2, A-3, A-SB and B Certificates and the Class A-4, A-5 and A-S trust components), to principal on the Class C Certificates until their Certificate Balance is reduced to zero; and (c) next, to reimburse the holders of the Class C Certificates for any previously unreimbursed losses (plus interest thereon) on the mortgage loans that were previously allocated to that Class in reduction of their Certificate Balance. 7. After the Class A-1, A-2, A-3, A-SB, B and C Certificates and the Class A-4, A-5 and A-S trust components are paid all amounts to which they are entitled, the remaining funds available for distribution will be used to pay interest, principal and loss reimbursement amounts on the Class D-RR, E-RR, F-RR, G-RR, H-RR, J-RR and K-RR Certificates sequentially in that order in a manner analogous to the Class C Certificates. Principal and interest payable on the Class A-4, Class A-4-X1, Class A-4-X2, Class A-5, Class A-5-X1, Class A-5-X2, Class A-S, Class A-S-X1 and Class A-S-X2 trust components will be distributed pro rata to the corresponding classes of Exchangeable Certificates representing interests therein in accordance with their Class Percentage Interests therein as described below under “Exchangeable Certificates.” |
Exchangeable Certificates | Each class of Exchangeable Certificates may be exchanged for the corresponding classes of Exchangeable Certificates set forth next to such class in the table below, and vice versa. Following any exchange of one or more classes of Exchangeable Certificates (the applicable “Surrendered Classes”) for one or more classes of other Exchangeable Certificates (the applicable “Received Classes”), the Class Percentage Interests (as defined below) of the outstanding principal balances or notional amounts of the Corresponding Trust Components that are represented by the Surrendered Classes (and consequently their related certificate balances or notional amounts) will be decreased, and those of the Received Classes (and consequently their related certificate balances or notional amounts) will be increased. The dollar denomination of each of the Received Classes of certificates must be equal to the dollar denomination of each of the Surrendered Classes of certificates. No fee will be required with respect to any exchange of Exchangeable Certificates. |
Surrendered Classes (or Received
Classes) of Certificates | | Received Classes (or Surrendered
Classes) of Certificates |
Class A-4 | | Class A-4-1, Class A-4-X1 |
Class A-4 | | Class A-4-2, Class A-4-X2 |
Class A-5 | | Class A-5-1, Class A-5-X1 |
Class A-5 | | Class A-5-2, Class A-5-X2 |
Class A-S | | Class A-S-1, Class A-S-X1 |
Class A-S | | Class A-S-2, Class A-S-X2 |
On the closing date, the issuing entity will issue the following “trust components,” each with the initial principal balance (or, if such trust component has an “X” suffix, notional amount) and pass-through rate set forth next to it in the table below. Each trust component with an “X” suffix will not be entitled to distributions of principal. |
| | | | |
Trust Component | | Initial Certificate Balance or
Notional Amount | | Pass-Through Rate |
Class A-4 | | See footnote (9) to the table under “Certificate Structure” | | Class A-4 Certificate Pass-Through Rate minus 1.00% |
Class A-4-X1 | | Equal to Class A-4 Trust Component Certificate Balance | | 0.50% |
Class A-4-X2 | | Equal to Class A-4 Trust Component Certificate Balance | | 0.50% |
Class A-5 | | See footnote (9) to the table under “Certificate Structure” | | Class A-5 Certificate Pass-Through Rate minus 1.00% |
Class A-5-X1 | | Equal to Class A-5 Trust Component Certificate Balance | | 0.50% |
| | | | | | | |
THE INFORMATION IN THIS STRUCTURAL AND COLLATERAL TERM SHEET IS NOT COMPLETE AND MAY BE AMENDED PRIOR TO THE TIME OF SALE. THIS TERM SHEET IS NOT AN OFFER TO SELL THESE SECURITIES AND IT IS NOT A SOLICITATION OF AN OFFER TO BUY THESE SECURITIES IN ANY JURISDICTION WHERE THE OFFER OR SALE IS NOT PERMITTED.
24
Wells Fargo Commercial Mortgage Trust 2020-C56 | Certain Terms and Conditions |
| Class A-5-X2 | | Equal to Class A-5 Trust Component Certificate Balance | | 0.50% |
Class A-S | | $62,147,000 | | Class A-S Certificate Pass-Through Rate minus 1.00% |
Class A-S-X1 | | Equal to Class A-S Trust Component Certificate Balance | | 0.50% |
Class A-S-X2 | | Equal to Class A-S Trust Component Certificate Balance | | 0.50% |
| | | | |
Each class of Exchangeable Certificates represents an undivided beneficial ownership interest in the trust components set forth next to it in the table below (the “Corresponding Trust Components”). Each class of Exchangeable Certificates has a pass-through rate equal to the sum of the pass-through rates of the Corresponding Trust Components and represents a percentage interest (the related “Class Percentage Interest”) in each Corresponding Trust Component, including principal and interest payable thereon, equal to (x) the certificate balance (or, if such class has an “X” suffix, notional amount) of such class of certificates, divided by (y) the principal balance of the Class A-4 trust component (if such class of Exchangeable Certificates has an “A-4” designation), the Class A-5 trust component (if such class of Exchangeable Certificates has an “A-5” designation) or the Class A-S trust component (if such class of Exchangeable Certificates has an “A-S” designation). |
| | | | |
Group of Exchangeable Certificates | | Class of Exchangeable Certificates | | Corresponding Trust Components |
“Class A-4 Exchangeable Certificates” | | Class A-4 | | Class A-4, Class A-4-X1, Class A-4-X2 |
| Class A-4-1 | | Class A-4, Class A-4-X2 |
| Class A-4-2 | | Class A-4 |
| Class A-4-X1 | | Class A-4-X1 |
| Class A-4-X2 | | Class A-4-X1, Class A-4-X2 |
“Class A-5 Exchangeable Certificates” | | Class A-5 | | Class A-5, Class A-5-X1, Class A-5-X2 |
| Class A-5-1 | | Class A-5, Class A-5-X2 |
| Class A-5-2 | | Class A-5 |
| Class A-5-X1 | | Class A-5-X1 |
| Class A-5-X2 | | Class A-5-X1, Class A-5-X2 |
“Class A-S Exchangeable Certificates” | | Class A-S | | Class A-S, Class A-S-X1, Class A-S-X2 |
| Class A-S-1 | | Class A-S, Class A-S-X2 |
| Class A-S-2 | | Class A-S |
| Class A-S-X1 | | Class A-S-X1 |
| Class A-S-X2 | | Class A-S-X1, Class A-S-X2 |
The maximum certificate balance or notional amount of each class of Class A-4 Exchangeable Certificates that could be issued in an exchange is equal to the certificate balance of the Class A-4 trust component, the maximum certificate balance or notional amount of each class of Class A-5 Exchangeable Certificates that could be issued in an exchange is equal to the certificate balance of the Class A-5 trust component, and the maximum certificate balance or notional amount of each class of Class A-S Exchangeable Certificates that could be issued in an exchange is equal to the certificate balance of the Class A-S trust component. The maximum certificate balances of Class A-4, Class A-5 and Class A-S certificates (subject to the constraint on the aggregate initial principal balance of the Class A-4 and Class A-5 trust components discussed in footnote (9) to table under “Certificate Structures”) will be issued on the closing date, and the certificate balance or notional amount of each other class of Exchangeable Certificates will be equal to zero on the Closing Date. |
THE INFORMATION IN THIS STRUCTURAL AND COLLATERAL TERM SHEET IS NOT COMPLETE AND MAY BE AMENDED PRIOR TO THE TIME OF SALE. THIS TERM SHEET IS NOT AN OFFER TO SELL THESE SECURITIES AND IT IS NOT A SOLICITATION OF AN OFFER TO BUY THESE SECURITIES IN ANY JURISDICTION WHERE THE OFFER OR SALE IS NOT PERMITTED.
25
Wells Fargo Commercial Mortgage Trust 2020-C56 | Certain Terms and Conditions |
| Each class of Class A-4 Exchangeable Certificates, Class A-5 Exchangeable Certificates and Class A-S Exchangeable Certificates will have a certificate balance or notional amount equal to its Class Percentage Interest multiplied by the principal balance of the Class A-4 trust component, Class A-5 trust component or Class A-S trust component, respectively. Each class of Class A-4 Exchangeable Certificates, Class A-5 Exchangeable Certificates and Class A-S Exchangeable Certificates with a certificate balance will have the same approximate initial credit support percentage, Expected Weighted Average Life, Expected Principal Window, Certificate Principal U/W NOI Debt Yield and Certificate Principal to Value Ratio as the Class A-4 Certificates, Class A-5 Certificates or Class A-S Certificates, respectively, shown above. |
Allocation of Yield
Maintenance Charges and
Prepayment Premiums: | If any yield maintenance charge or prepayment premium is collected during any particular collection period with respect to any mortgage loan, then on the Distribution Date corresponding to that collection period, the certificate administrator will pay that yield maintenance charge or prepayment premium (net of liquidation fees payable therefrom) in the following manner: (1) to each class of the Class A-1, Class A-2, Class A-3, Class A-SB, Class A-4, Class A-4-1, Class A-4-2, Class A-5, Class A-5-1, Class A-5-2, Class A-S, Class A-S-1, Class A-S-2, Class B, Class C, Class D-RR, Class E-RR and Class F-RR Certificates, the product of (a) such Yield Maintenance Charge or Prepayment Premium, (b) the related Base Interest Fraction for such class and the applicable principal prepayment, and (c) a fraction, the numerator of which is equal to the amount of principal distributed to such class for that Distribution Date, and the denominator of which is the total amount of principal distributed to the Class A-1, Class A-2, Class A-3, Class A-SB, Class B, Class C, Class D-RR, Class E-RR, Class F-RR, Class G-RR, Class H-RR, Class J-RR and Class K-RR Certificates and the Class A-4 Exchangeable Certificates (collectively), the Class A-5 Exchangeable Certificates (collectively) and the Class A-S Exchangeable Certificates (collectively) for that Distribution Date, (2) to the Class A-4-X1 Certificates, the product of (a) such Yield Maintenance Charge or Prepayment Premium, (b) a fraction, the numerator of which is equal to the amount of principal distributed to the Class A-4-1 Certificates for that Distribution Date, and the denominator of which is the total amount of principal distributed to the Class A-1, Class A-2, Class A-3, Class A-SB, Class B, Class C, Class D-RR, Class E-RR, Class F-RR, Class G-RR, Class H-RR, Class J-RR and Class K-RR Certificates and the Class A-4 Exchangeable Certificates (collectively), the Class A-5 Exchangeable Certificates (collectively) and the Class A-S Exchangeable Certificates (collectively) for that Distribution Date and (c) the difference between (i) the Base Interest Fraction for the Class A-4 Certificates and the applicable principal prepayment and (ii) the Base Interest Fraction for the Class A-4-1 Certificates and the applicable principal prepayment, (3) to the Class A-4-X2 Certificates, the product of (a) such Yield Maintenance Charge or Prepayment Premium, (b) a fraction, the numerator of which is equal to the amount of principal distributed to the Class A-4-2 Certificates for that Distribution Date, and the denominator of which is the total amount of principal distributed to the Class A-1, Class A-2, Class A-3, Class A-SB, Class B, Class C, Class D-RR, Class E-RR, Class F-RR, Class G-RR, Class H-RR, Class J-RR and Class K-RR Certificates and the Class A-4 Exchangeable Certificates (collectively), the Class A-5 Exchangeable Certificates (collectively) and the Class A-S Exchangeable Certificates (collectively) for that Distribution Date and (c) the difference between (i) the Base Interest Fraction for the Class A-4 Certificates and the applicable principal prepayment and (ii) the Base Interest Fraction for the Class A-4-2 Certificates and the applicable principal prepayment, (4) to the Class A-5-X1 Certificates, the product of (a) such Yield Maintenance Charge or Prepayment Premium, (b) a fraction, the numerator of which is equal to the amount of principal distributed to the Class A-5-1 Certificates for that Distribution Date, and the denominator of which is the total amount of principal distributed to the Class A-1, Class A-2, Class A-3, Class A-SB, Class B, Class C, Class D-RR, Class E-RR, Class F-RR, Class G-RR, Class H-RR, Class J-RR and Class K-RR Certificates and the Class A-4 Exchangeable Certificates (collectively), the Class A-5 Exchangeable Certificates (collectively) and the Class A-S Exchangeable Certificates (collectively) for that Distribution Date and (c) the difference between (i) the Base Interest Fraction for the Class A-5 Certificates and the applicable principal prepayment and (ii) the Base Interest Fraction for the Class A-5-1 Certificates and the applicable principal prepayment, (5) to the Class A-5-X2 Certificates, the product of (a) such Yield Maintenance Charge or Prepayment Premium, (b) a fraction, the numerator of which is equal to the |
THE INFORMATION IN THIS STRUCTURAL AND COLLATERAL TERM SHEET IS NOT COMPLETE AND MAY BE AMENDED PRIOR TO THE TIME OF SALE. THIS TERM SHEET IS NOT AN OFFER TO SELL THESE SECURITIES AND IT IS NOT A SOLICITATION OF AN OFFER TO BUY THESE SECURITIES IN ANY JURISDICTION WHERE THE OFFER OR SALE IS NOT PERMITTED.
26
Wells Fargo Commercial Mortgage Trust 2020-C56 | Certain Terms and Conditions |
| amount of principal distributed to the Class A-5-2 Certificates for that Distribution Date, and the denominator of which is the total amount of principal distributed to the Class A-1, Class A-2, Class A-3, Class A-SB, Class B, Class C, Class D-RR, Class E-RR, Class F-RR, Class G-RR, Class H-RR, Class J-RR and Class K-RR Certificates and the Class A-4 Exchangeable Certificates (collectively), the Class A-5 Exchangeable Certificates (collectively) and the Class A-S Exchangeable Certificates (collectively) for that Distribution Date and (c) the difference between (i) the Base Interest Fraction for the Class A-5 Certificates and the applicable principal prepayment and (ii) the Base Interest Fraction for the Class A-5-2 Certificates and the applicable principal prepayment, (6) to the Class A-S-X1 Certificates, the product of (a) such Yield Maintenance Charge or Prepayment Premium, (b) a fraction, the numerator of which is equal to the amount of principal distributed to the Class A-S-1 Certificates for that Distribution Date, and the denominator of which is the total amount of principal distributed to the Class A-1, Class A-2, Class A-3, Class A-SB, Class B, Class C, Class D-RR, Class E-RR, Class F-RR, Class G-RR, Class H-RR, Class J-RR and Class K-RR Certificates and the Class A-4 Exchangeable Certificates (collectively), the Class A-5 Exchangeable Certificates (collectively) and the Class A-S Exchangeable Certificates (collectively) for that Distribution Date and (c) the difference between (i) the Base Interest Fraction for the Class A-S Certificates and the applicable principal prepayment and (ii) the Base Interest Fraction for the Class A-S-1 Certificates and the applicable principal prepayment, (7) to the Class A-S-X2 Certificates, the product of (a) such Yield Maintenance Charge or Prepayment Premium, (b) a fraction, the numerator of which is equal to the amount of principal distributed to the Class A-S-2 Certificates for that Distribution Date, and the denominator of which is the total amount of principal distributed to the Class A-1, Class A-2, Class A-3, Class A-SB, Class B, Class C, Class D-RR, Class E-RR, Class F-RR, Class G-RR, Class H-RR, Class J-RR and Class K-RR Certificates and the Class A-4 Exchangeable Certificates (collectively), the Class A-5 Exchangeable Certificates (collectively) and the Class A-S Exchangeable Certificates (collectively) for that Distribution Date and (c) the difference between (i) the Base Interest Fraction for the Class A-S Certificates and the applicable principal prepayment and (ii) the Base Interest Fraction for the Class A-S-2 Certificates and the applicable principal prepayment, (8) to the Class X-A Certificates, the excess, if any, of (a) the product of (i) such Yield Maintenance Charge or Prepayment Premium and (ii) a fraction, the numerator of which is equal to the amount of principal distributed to the Class A-1, Class A-2, Class A-3 and Class A-SB Certificates and the Class A-4 Exchangeable Certificates (collectively) and the Class A-5 Exchangeable Certificates (collectively) for that Distribution Date, and the denominator of which is the total amount of principal distributed to the Class A-1, Class A-2, Class A-3, Class A-SB, Class B, Class C, Class D-RR, Class E-RR, Class F-RR, Class G-RR, Class H-RR, Class J-RR and Class K-RR Certificates and the Class A-4 Exchangeable Certificates (collectively), the Class A-5 Exchangeable Certificates (collectively) and the Class A-S Exchangeable Certificates (collectively) for that Distribution Date, over (b) the amount of such Yield Maintenance Charge or Prepayment Premium distributed to the Class A-1, Class A-2, Class A-3 and Class A-SB Certificates and the Class A-4 Exchangeable Certificates (collectively) and the Class A-5 Exchangeable Certificates (collectively) as described above, and (9) to the Class X-B Certificates, any remaining portion of such Yield Maintenance Charge or Prepayment Premium not distributed as described above. No prepayment premiums or yield maintenance charges will be distributed to the holders of the Class G-RR, H-RR, J-RR, K-RR or R Certificates. For a description of when prepayment premiums and yield maintenance charges are generally required on the mortgage loans, see Annex A-1 to the Preliminary Prospectus. See also “Risk Factors—Risks Relating to the Mortgage Loans—Risks Relating to Enforceability of Yield Maintenance Charges, Prepayment Premiums or Defeasance Provisions“ and “Risk Factors—Other Risks Relating to the Certificates—Your Yield May Be Affected by Defaults, Prepayments and Other Factors” in the Preliminary Prospectus. Prepayment premiums and yield maintenance charges will be distributed on each Distribution Date only to the extent they are actually received on the mortgage loans as of the related Determination Date. |
Realized Losses: | The Certificate Balances of the Class A-1, A-2, A-3, A-SB, B, C, D, E-RR, F-RR, G-RR, H-RR, J-RR and K-RR Certificates and the Class A-4, A-5 and A-S trust components will be reduced without distribution on any Distribution Date as a write-off to the extent of any losses realized on the mortgage loans allocated to such Class on such Distribution Date. Such losses will be applied in the following order, in each case until the related Certificate Balance is reduced to zero: first, to |
THE INFORMATION IN THIS STRUCTURAL AND COLLATERAL TERM SHEET IS NOT COMPLETE AND MAY BE AMENDED PRIOR TO THE TIME OF SALE. THIS TERM SHEET IS NOT AN OFFER TO SELL THESE SECURITIES AND IT IS NOT A SOLICITATION OF AN OFFER TO BUY THESE SECURITIES IN ANY JURISDICTION WHERE THE OFFER OR SALE IS NOT PERMITTED.
27
Wells Fargo Commercial Mortgage Trust 2020-C56 | Certain Terms and Conditions |
| the Class K-RR Certificates; second, to the Class J-RR Certificates; third, to the Class H-RR Certificates; fourth, to the Class G-RR Certificates; fifth, to the Class F-RR Certificates; sixth, to the Class E-RR Certificates; seventh, to the Class D-RR Certificates; eighth, to the Class C Certificates; ninth, to the Class B Certificates; tenth, to the Class A-S trust component; and, finally, pro rata, to the Class A-1, A-2, A-3 and A-SB Certificates and the Class A-4 and A-5 trust components based on their outstanding Certificate Balances. Any portion of such amount applied to the Class A-4, Class A-5 or Class A-S trust component will reduce the Certificate Balance or Notional Amount of each Class of Certificates in the related group of Exchangeable Certificates by an amount equal to the product of (x) its Certificate Balance or Notional Amount, divided by the Certificate Balance of such trust component prior to the applicable reduction, and (y) the amount applied to such trust component. The Notional Amount of the Class X-A Certificates will be reduced by the amount of all losses that are allocated to the Class A-1, A-2, A-3 and A-SB Certificates and the Class A-4 and A-5 trust components as write-offs in reduction of their Certificate Balances. The Notional Amount of the Class X-B Certificates will be reduced by the amount of all losses that are allocated to the Class A-S trust component and the Class B or C Certificates as write-offs in reduction of their Certificate Balances. |
P&I Advances: | The Master Servicer or, if the Master Servicer fails to do so, the Trustee, will be obligated to advance delinquent debt service payments (other than balloon payments and default interest) and assumed debt service payments on mortgage loans with delinquent balloon payments (excluding any related companion loan), except to the extent any such advance is deemed non-recoverable from collections on the related mortgage loan. In addition, if an Appraisal Reduction Amount exists for a given mortgage loan, the interest portion of any P&I advance for such mortgage loan will be reduced, which will have the effect of reducing the amount of interest available for distribution to the Certificates in reverse alphabetical order of their Class designations (except that interest payments on the Class A-1, A-2, A-3, A-SB, A-4, A-4-X1, A-4-X2, A-5, A-5-X1, A-5-X2, X-A and X-B Certificates would be affected on a pari passu basis). |
Servicing Advances: | The Master Servicer or, if the Master Servicer fails to do so, the Trustee, will be obligated to make servicing advances, including the payment of delinquent property taxes, insurance premiums and ground rent, except to the extent that those advances are deemed non-recoverable from collections on the related mortgage loan. The Master Servicer or the Trustee, as applicable, will have the primary obligation to make any required servicing advances with respect to any serviced whole loan. With respect to any non-serviced whole loan, the master servicer or trustee, as applicable, under the related lead securitization servicing agreement will have the primary obligation to make any required servicing advances with respect to such non-serviced whole loan. |
Appraisal Reduction Amounts and Collateral Deficiency Amounts: | An “Appraisal Reduction Amount” generally will be created in the amount, if any, by which the principal balance of a required appraisal loan (which is a mortgage loan (other than a non-serviced mortgage loan) with respect to which certain defaults, modifications or insolvency events have occurred as further described in the Preliminary Prospectus) plus other amounts overdue or advanced in connection with such mortgage loan exceeds 90% of the appraised value of the related mortgaged property plus certain escrows and reserves (including letters of credit) held with respect to the mortgage loan. With respect to any serviced whole loan, any Appraisal Reduction Amount will be allocated, pro rata, to the related mortgage loan and the related pari passu companion loan(s). With respect to any non-serviced mortgage loan, appraisal reduction amounts are expected to be calculated in a similar manner under the related non-serviced pooling and servicing agreement. A mortgage loan will cease to be a required appraisal loan when the same has ceased to be a specially serviced loan (if applicable), has been brought current for at least three consecutive months and no other circumstances exist that would cause such mortgage loan to be a required appraisal loan. A “Collateral Deficiency Amount” will exist with respect to any mortgage loan that is modified into an AB loan structure and remains a corrected mortgage loan and will generally equal the excess of (i) the stated principal balance of such AB modified loan (taking into account the related junior note(s) and any pari passu notes included therein), over (ii) the sum of (in the case of a whole loan, solely to the extent allocable to the subject mortgage loan) (x) the most recent appraised value of the related mortgaged property plus (y) solely to the extent not reflected or taken into account in such appraised value and to the extent on deposit with, or otherwise under the control of, the lender as of the date of such determination, any capital or additional collateral contributed by the related borrower at the time the mortgage loan (and as part of the modification thereto) became an AB modified loan plus (z) any other escrows or reserves (in addition to any amounts set forth in the immediately preceding clause (y)) held with respect to the mortgage loan as of the date of such determination. |
THE INFORMATION IN THIS STRUCTURAL AND COLLATERAL TERM SHEET IS NOT COMPLETE AND MAY BE AMENDED PRIOR TO THE TIME OF SALE. THIS TERM SHEET IS NOT AN OFFER TO SELL THESE SECURITIES AND IT IS NOT A SOLICITATION OF AN OFFER TO BUY THESE SECURITIES IN ANY JURISDICTION WHERE THE OFFER OR SALE IS NOT PERMITTED.
28
Wells Fargo Commercial Mortgage Trust 2020-C56 | Certain Terms and Conditions |
| A “Cumulative Appraisal Reduction Amount” with respect to any mortgage loan will be the sum of any Appraisal Reduction Amount and any Collateral Deficiency Amount. Appraisal Reduction Amounts will affect the amount of debt service advances in respect of the related mortgage loan. Additionally, Cumulative Appraisal Reduction Amounts will be taken into account in the determination of the identity of the Class whose majority constitutes the “majority controlling class certificateholder” and is entitled to appoint the directing certificateholder. Neither (i) a Payment Accommodation with respect to any mortgage loan or serviced whole loan nor (ii) any default or delinquency that would have existed but for such Payment Accommodation will constitute an appraisal reduction event, for so long as the related borrower is complying with the terms of such Payment Accommodation. A “Payment Accommodation” for any mortgage loan or serviced whole loan means the entering into of any temporary forbearance agreement as a result of the COVID-19 emergency relating to payment obligations or operating covenants under the related mortgage loan documents or the use of funds on deposit in any reserve account or escrow account for any purpose other than the explicit purpose described in the related mortgage loan documents, that in each case require full repayment of deferred payments and escrows within 21 months of the date of the first forbearance for such mortgage loan or serviced whole loan. |
| | |
Clean-Up Call and Exchange Termination: | On each Distribution Date occurring after the aggregate unpaid principal balance of the pool of mortgage loans is less than 1.0% of the principal balance of the mortgage loans as of the cut-off date, certain specified persons will have the option to purchase all of the remaining mortgage loans (and the trust’s interest in all property acquired through exercise of remedies in respect of any mortgage loan) at the price specified in the Preliminary Prospectus. Exercise of the option will terminate the trust and retire the then-outstanding Certificates. If the aggregate Certificate Balances of each of the Class A-1, A-2, A-3, A-SB, B and C Certificates and the Class A-4, A-5 and A-S trust components have been reduced to zero, the trust may also be terminated in connection with an exchange of all the then-outstanding Certificates (other than the Class R Certificates) for the mortgage loans and REO properties then remaining in the issuing entity, subject to payment of a price specified in the Preliminary Prospectus, but all of the holders of those outstanding Classes (other than the Class R Certificates) of Certificates would have to voluntarily participate in the exchange. |
Liquidation Loan Waterfall: | Following the liquidation of any loan or property, the net liquidation proceeds generally will be applied (after reimbursement of advances and certain trust fund expenses), first, as a recovery of accrued interest, other than delinquent interest that was not advanced as a result of Appraisal Reduction Amounts, second, as a recovery of principal until all principal has been recovered, and then as a recovery of delinquent interest that was not advanced as a result of Appraisal Reduction Amounts. Please see “Description of the Certificates—Distributions—Application Priority of Mortgage Loan Collections or Whole Loan Collections” in the Preliminary Prospectus. |
Control Eligible Certificates: | The Class D-RR, E-RR, F-RR, G-RR, H-RR, J-RR and K-RR Certificates. |
Directing Certificateholder/ Controlling Class: | A directing certificateholder may be appointed by the “majority controlling class certificateholder”, which will be the holder(s) of a majority of the Controlling Class. The “Controlling Class” will be, as of any time of determination, the most subordinate Class of Control Eligible Certificates then outstanding that has an aggregate Certificate Balance (as notionally reduced by any Cumulative Appraisal Reduction Amounts allocable to such Class(es)) at least equal to 25% of the initial Certificate Balance of that Class; provided, however, that if at any time the Certificate Balances of the Certificates other than the Control Eligible Certificates have been reduced to zero as a result of principal payments on the Mortgage Loans, then the Controlling Class will be the most subordinate Class of Control Eligible Certificates that has a Certificate Balance greater than zero without regard to any Cumulative Appraisal Reduction Amounts. The Controlling Class as of the Closing Date will be the Class K-RR Certificates. |
Control and Consultation: | The rights of various parties to replace the Special Servicer and approve or consult with respect to major actions of the Special Servicer will vary according to defined periods. A “Control Termination Event” will occur when the Class D-RR Certificates have a Certificate Balance (taking into account the application of any Cumulative Appraisal Reduction Amounts to notionally reduce the Certificate Balance of such Class) of less than 25% of the initial Certificate Balance of that Class; provided, however, that a Control Termination Event will not be deemed continuing in the event that the Certificate Balances of the Certificates other than the Control Eligible Certificates have been reduced to zero as a result of principal payments on the Mortgage Loans. A “Consultation Termination Event” will occur when there is no Class of Control Eligible Certificates that has a then-outstanding Certificate Balance at least equal to 25% of the initial Certificate Balance of that Class, in each case, without regard to the application of any Cumulative |
THE INFORMATION IN THIS STRUCTURAL AND COLLATERAL TERM SHEET IS NOT COMPLETE AND MAY BE AMENDED PRIOR TO THE TIME OF SALE. THIS TERM SHEET IS NOT AN OFFER TO SELL THESE SECURITIES AND IT IS NOT A SOLICITATION OF AN OFFER TO BUY THESE SECURITIES IN ANY JURISDICTION WHERE THE OFFER OR SALE IS NOT PERMITTED.
29
Wells Fargo Commercial Mortgage Trust 2020-C56 | Certain Terms and Conditions |
| Appraisal Reduction Amounts; provided, however, that a Consultation Termination Event will not be deemed continuing in the event that the Certificate Balances of the Certificates other than the Control Eligible Certificates have been reduced to zero as a result of principal payments on the Mortgage Loans. If no Control Termination Event has occurred and is continuing, except with respect to the Excluded Loans (as defined below) and Servicing Shift Whole Loans (as defined below) (i) the directing certificateholder will be entitled to grant or withhold approval of asset status reports prepared, and material servicing actions proposed, by the Special Servicer, and (ii) the directing certificateholder will be entitled to terminate and replace the Special Servicer with or without cause, and appoint itself or another person as the successor special servicer. It will be a condition to such appointment that Fitch, KBRA and Moody’s (and any rating agency rating any securities backed by any pari passu companion loan(s) serviced under this transaction) confirm that the appointment would not result in a qualification, downgrade or withdrawal of any of their then-current ratings of Certificates (and any certificates backed by any pari passu companion loan(s) serviced under this transaction). If a Control Termination Event has occurred and is continuing but no Consultation Termination Event has occurred and is continuing, the Special Servicer will be required to consult with the directing certificateholder (other than with respect to Excluded Loans) in connection with asset status reports and material special servicing actions. If a Consultation Termination Event has occurred and is continuing, no directing certificateholder will be recognized or have any right to terminate the Special Servicer or approve, direct or consult with respect to servicing matters. With respect to each serviced whole loan that is not a Servicing Shift Whole Loan, the rights of the directing certificateholder described above will be subject to the consultation rights of the holders of the related pari passu companion loans. Those consultation rights will generally extend to asset status reports and material special servicing actions involving the related whole loan, will be as set forth in the related intercreditor agreement, and will be in addition to the rights of the directing certificateholder in this transaction described above. With respect to each whole loan marked with footnote (3) under “V. Characteristics of the Mortgage Pool—B. Summary of the Whole Loans” (each, a “Servicing Shift Whole Loan”), prior to the date of securitization of the related controlling pari passu companion loan (such date, a “Servicing Shift Securitization Date”), the holder of the related controlling pari passu companion loan will have certain control rights regarding the servicing of the related whole loan under the WFCM 2020-C56 pooling and servicing agreement, including the right to approve or disapprove various material servicing actions involving the related whole loan. For purposes of the servicing of any such whole loan contemplated by this paragraph, the occurrence and continuance of a Control Termination Event or Consultation Termination Event under this securitization will not limit the control or other rights of the holder of the related controlling pari passu companion loan(s). With respect to (x) each non-serviced whole loan, and (y) each Servicing Shift Whole Loan after its Servicing Shift Securitization Date, the applicable servicing agreement for the related controlling pari passu companion loan(s) generally grants (or will grant) the directing certificateholder under the related securitization control rights that may include the right to approve or disapprove various material servicing actions involving the related whole loan. The directing certificateholder for this securitization (so long as no Consultation Termination Event has occurred and is occurring) generally will nonetheless have the right to be consulted on a non-binding basis with respect to such actions. For purposes of the servicing of any such whole loan contemplated by this paragraph, the occurrence and continuance of a Control Termination Event or Consultation Termination Event under this securitization will not limit the control or other rights of the directing certificateholder (or equivalent) under the securitization of the related controlling pari passu companion loan(s). The control rights and consent and consultation rights described in the preceding paragraphs are subject to various limitations, conditions and exceptions as described in the Preliminary Prospectus. Notwithstanding any contrary description set forth above, in the event that, with respect to any mortgage loan, the majority controlling class certificateholder or the directing certificateholder is a Borrower Party, the majority controlling class certificateholder and the directing certificateholder will have no right to receive asset status reports or such other information as may be specified in the WFCM 2020-C56 pooling and servicing agreement, to grant or withhold approval of, or consult with respect to, asset status reports prepared, and material servicing actions proposed, by the Special Servicer, with respect to such mortgage loan, and such mortgage loan will be referred to as an “Excluded Loan” as to such party. |
THE INFORMATION IN THIS STRUCTURAL AND COLLATERAL TERM SHEET IS NOT COMPLETE AND MAY BE AMENDED PRIOR TO THE TIME OF SALE. THIS TERM SHEET IS NOT AN OFFER TO SELL THESE SECURITIES AND IT IS NOT A SOLICITATION OF AN OFFER TO BUY THESE SECURITIES IN ANY JURISDICTION WHERE THE OFFER OR SALE IS NOT PERMITTED.
30
Wells Fargo Commercial Mortgage Trust 2020-C56 | Certain Terms and Conditions |
| In addition, notwithstanding any contrary description set forth above, in the event that, with respect to any mortgage loan, a controlling class certificateholder is a Borrower Party, such controlling class certificateholder will have no right to receive asset status reports or such other information as may be specified in the WFCM 2020-C56 pooling and servicing agreement with respect to such mortgage loan. “Borrower Party” means a borrower, a mortgagor or a manager of a mortgaged property, an Accelerated Mezzanine Loan Lender, or any Borrower Party Affiliate. “Accelerated Mezzanine Loan Lender” means a mezzanine lender under a mezzanine loan that has been accelerated or as to which foreclosure or enforcement proceedings have been commenced against the equity collateral pledged to secure such mezzanine loan. “Borrower Party Affiliate” means, with respect to a borrower, a mortgagor, a manager of a Mortgaged Property or an Accelerated Mezzanine Loan Lender, (x) any other person controlling or controlled by or under common control with such borrower, mortgagor, manager or Accelerated Mezzanine Loan Lender, as applicable, or (y) any other person owning, directly or indirectly, 25% or more of the beneficial interests in such borrower, mortgagor, manager or Accelerated Mezzanine Loan Lender. |
Replacement of Special Servicer: | If a Control Termination Event has occurred and is continuing, the Special Servicer (other than with respect to a Servicing Shift Whole Loan) may be removed and replaced without cause upon the affirmative direction of certificate owners holding not less than 66-2/3% of a certificateholder quorum, following a proposal from certificate owners holding not less than 25% of the appraisal-reduced voting rights of all Certificates. The certificateholders who initiate a vote on a termination and replacement of the Special Servicer without cause must cause Fitch, KBRA and Moody’s to confirm the then-current ratings of the Certificates (or decline to review the matter) and cause the payment of the fees and expenses incurred in the replacement. If no Control Termination Event has occurred and is continuing, the Special Servicer (other than with respect to a Servicing Shift Whole Loan) may be replaced by the directing certificateholder, subject to Fitch, KBRA and Moody’s (and any Rating Agency rating any securities backed by any pari passu companion loan(s) serviced under this transaction) confirming the then-current ratings of the Certificates (and any certificates backed by any pari passu companion loans serviced under this transaction) or declining to review the matter. In addition, if at any time the Operating Advisor determines, in its sole discretion exercised in good faith, that (i) the Special Servicer is not performing its duties as required under the pooling and servicing agreement in accordance with the Servicing Standard and (ii) the replacement of the Special Servicer would be in the best interest of the certificateholders as a collective whole, then the Operating Advisor will have the right to recommend the replacement of the Special Servicer and will submit its formal recommendation to the Trustee and the Certificate Administrator (along with its rationale, its proposed replacement special servicer and other relevant information justifying its recommendation). The Operating Advisor’s recommendation to replace the Special Servicer must be confirmed by an affirmative vote of holders of Principal Balance Certificates evidencing at least a majority of a quorum of certificateholders (which, for this purpose, is the holders of Principal Balance Certificates that (i) evidence at least 20% of the Voting Rights (taking into account the application of any cumulative appraisal reduction amounts to notionally reduce the respective Certificate Balances) of all Principal Balance Certificates on an aggregate basis, and (ii) consist of at least three certificateholders or certificate owners that are not risk retention affiliated with each other). In the event the holders of Principal Balance Certificates evidencing at least a majority of a quorum of certificateholders elect to remove and replace the Special Servicer (which requisite affirmative votes must be received within 180 days of the posting of the notice of the Operating Advisor’s recommendation to replace the Special Servicer to the Certificate Administrator’s website), the Certificate Administrator will be required to receive a Rating Agency Confirmation from each of the Rating Agencies at that time. |
Excluded Special Servicer: | In the event that, with respect to any mortgage loan, the Special Servicer is a Borrower Party, the Special Servicer will be required to resign as special servicer of such mortgage loan (referred to as an “excluded special servicer loan”). If no Control Termination Event has occurred and is continuing, the directing certificateholder will be entitled to appoint (and may replace with or without cause) a separate special servicer that is not a Borrower Party (referred to as an “excluded special servicer”) with respect to such excluded special servicer loan unless such excluded special servicer loan is also an excluded loan. Otherwise, upon resignation of the Special Servicer with respect to an excluded special servicer loan, the resigning Special Servicer will be required to appoint the excluded special servicer. |
Appraisal Remedy: | If the Class of Certificates comprising the Controlling Class loses its status as Controlling Class because of the application of an Appraisal Reduction Amount or Collateral Deficiency Amount, the holders of a majority of the voting rights of such Class may require the Special Servicer to order a second appraisal for any mortgage loan in respect of which an Appraisal Reduction Amount or Collateral Deficiency Amount has been applied. The Special Servicer must thereafter |
THE INFORMATION IN THIS STRUCTURAL AND COLLATERAL TERM SHEET IS NOT COMPLETE AND MAY BE AMENDED PRIOR TO THE TIME OF SALE. THIS TERM SHEET IS NOT AN OFFER TO SELL THESE SECURITIES AND IT IS NOT A SOLICITATION OF AN OFFER TO BUY THESE SECURITIES IN ANY JURISDICTION WHERE THE OFFER OR SALE IS NOT PERMITTED.
31
Wells Fargo Commercial Mortgage Trust 2020-C56 | Certain Terms and Conditions |
| determine whether, based on its assessment of such second appraisal, any recalculation of the Appraisal Reduction Amount or Collateral Deficiency Amount is warranted. Such Class will not be able to exercise any direction, control, consent and/or similar rights of the Controlling Class unless and until reinstated as the Controlling Class through such determination; and pending such determination, the rights of the Controlling Class will be exercised by the Control Eligible Certificates, if any, that would be the Controlling Class taking into account the subject appraisal reduction amount. |
Sale of Defaulted Assets: | There will be no “fair value” purchase option. Instead, the WFCM 2020-C56 pooling and servicing agreement will authorize the Special Servicer to sell defaulted mortgage loans serviced by such Special Servicer to the highest bidder in a manner generally similar to sales of REO properties. The sale of a defaulted loan (other than a non-serviced whole loan) for less than par plus accrued interest and certain other fees and expenses owed on the loan will be subject to consent or consultation rights of the directing certificateholder and/or Operating Advisor, as described in the Preliminary Prospectus. Generally speaking, the holder of a pari passu companion loan will have consent and/or consultation rights, as described in the Preliminary Prospectus. With respect to (x) any serviced whole loan and (y) any Servicing Shift Whole Loan prior to its Servicing Shift Securitization Date, if such whole loan becomes a defaulted loan under the WFCM 2020-C56 pooling and servicing agreement, the Special Servicer will generally be required to sell both the mortgage loan and the related pari passu companion loan(s) as a single whole loan. With respect to (x) each non-serviced whole loan and (y) each Servicing Shift Whole Loan after its related Servicing Shift Securitization Date, the applicable servicing agreement governing the servicing of such whole loan generally provides (or is expected to provide) that, if the related pari passu companion loan(s) serviced under such agreement become a defaulted loan under such servicing agreement, then the related special servicer may offer to sell to any person (or may offer to purchase) for cash such whole loan during such time as such applicable pari passu companion loan(s) constitutes a defaulted loan under such servicing agreement. Generally speaking, in connection with any such sale, the related special servicer is required to sell both the mortgage loan and the related pari passu companion loan(s) as a whole loan. The directing certificateholder for this securitization generally will have consent and/or consultation rights as the holder of an interest in the related mortgage loan, as described in the Preliminary Prospectus. The procedures for the sale of any whole loan that becomes a defaulted whole loan, and any associated consultation rights, are subject to various limitations, conditions and exceptions as described in the Preliminary Prospectus. |
“As-Is” Appraisals: | Appraisals must be conducted on an “as-is” basis, and must be no more than 12 months old, for purposes of determining Appraisal Reduction Amounts and market value in connection with REO sales. Required appraisals may consist of updates of prior appraisals. Internal valuations by the Special Servicer are permitted if the principal balance of a mortgage loan is less than $2,000,000. |
THE INFORMATION IN THIS STRUCTURAL AND COLLATERAL TERM SHEET IS NOT COMPLETE AND MAY BE AMENDED PRIOR TO THE TIME OF SALE. THIS TERM SHEET IS NOT AN OFFER TO SELL THESE SECURITIES AND IT IS NOT A SOLICITATION OF AN OFFER TO BUY THESE SECURITIES IN ANY JURISDICTION WHERE THE OFFER OR SALE IS NOT PERMITTED.
32
Wells Fargo Commercial Mortgage Trust 2020-C56 | Certain Terms and Conditions |
Operating Advisor: | The Operating Advisor will have certain review and consultation rights relating to the performance of the Special Servicer and with respect to its actions taken in connection with the resolution and/or liquidation of Specially Serviced Loans. With respect to each mortgage loan (other than a Non-Serviced Mortgage Loan) or serviced whole loan, the Operating Advisor will be responsible for: ● reviewing the actions of the Special Servicer with respect to any Specially Serviced Loan; ● reviewing (i) all reports by the Special Servicer made available to Privileged Persons on the Certificate Administrator’s website and (ii) each Asset Status Report (as defined in the Preliminary Prospectus) (after the occurrence and during the continuance of an Operating Advisor Consultation Event (as defined below)) and Final Asset Status Report (as defined in the Preliminary Prospectus); ● recalculating and reviewing for accuracy and consistency with the WFCM 2020-C56 pooling and servicing agreement the mathematical calculations by the special servicer and the corresponding application of the non-discretionary portion of the applicable formulas required to be utilized in connection with Appraisal Reduction Amounts, Collateral Deficiency Amounts and net present value calculations used in the Special Servicer’s determination of what course of action to take in connection with the workout or liquidation of a Specially Serviced Loan; and ● preparing an annual report (if any mortgage loan (other than any Non-Serviced Mortgage Loan) or serviced whole loan was a Specially Serviced Loan at any time during the prior calendar year or an Operating Advisor Consultation Event (as defined below) occurred during the prior calendar year) that sets forth whether the Operating Advisor believes, in its sole discretion exercised in good faith, that the Special Servicer is operating in compliance with the Servicing Standard with respect to its performance of its duties under the pooling and servicing agreement with respect to Specially Serviced Loans (and, after the occurrence and continuance of an Operating Advisor Consultation Event (as defined below), with respect to major decisions on non-Specially Serviced Loans) during the prior calendar year on a “trust-level basis”. The Operating Advisor will identify (1) which, if any, standards the Operating Advisor believes, in its sole discretion exercised in good faith, the Special Servicer has failed to comply with and (2) any material deviations from the Special Servicer’s obligations under the pooling and servicing agreement with respect to the resolution or liquidation of any Specially Serviced Loan or REO Property (other than with respect to any REO Property related to any Non-Serviced Mortgage Loan). In preparing any Operating Advisor Annual Report (as defined in the Preliminary Prospectus), the Operating Advisor will not be required to report on instances of non-compliance with, or deviations from, the Servicing Standard or the Special Servicer’s obligations under the pooling and servicing agreement that the Operating Advisor determines, in its sole discretion exercised in good faith, to be immaterial. With respect to each mortgage loan (other than any Non-Serviced Mortgage Loan) or serviced whole loan, after the Operating Advisor has received notice that an Operating Advisor Consultation Event (as defined below) has occurred and is continuing, in addition to the duties described above, the Operating Advisor will be required to perform the following additional duties: ● to consult (on a non-binding basis) with the Special Servicer in respect of asset status reports and ● to consult (on a non-binding basis) with the Special Servicer with respect to “major decisions” processed by the Special Servicer. An “Operating Advisor Consultation Event” will occur when the Certificate Balances of the Class D-RR, E-RR, F-RR, G-RR, H-RR, J-RR and K-RR Certificates in the aggregate (taking into account the application of any Cumulative Appraisal Reduction Amounts to notionally reduce the Certificate Balances of such Classes) is 25% or less of the initial Certificate Balances of such Classes in the aggregate. |
Asset Representations Reviewer: | The Asset Representations Reviewer will be required to review certain delinquent mortgage loans after a specified delinquency threshold has been exceeded (an “Asset Review Trigger”) and the required percentage of certificateholders vote to direct a review of such delinquent loans. An Asset Review Trigger will occur when either (1) mortgage loans with an aggregate outstanding principal balance of 25.0% or more of the aggregate outstanding principal balance of all of the mortgage loans (including any REO loans (or a portion of any REO loan in the case of a whole loan)) held by the issuing entity as of the end of the applicable collection period are delinquent loans or (2) at least 15 mortgage loans are delinquent loans as of the end of the applicable |
THE INFORMATION IN THIS STRUCTURAL AND COLLATERAL TERM SHEET IS NOT COMPLETE AND MAY BE AMENDED PRIOR TO THE TIME OF SALE. THIS TERM SHEET IS NOT AN OFFER TO SELL THESE SECURITIES AND IT IS NOT A SOLICITATION OF AN OFFER TO BUY THESE SECURITIES IN ANY JURISDICTION WHERE THE OFFER OR SALE IS NOT PERMITTED.
33
Wells Fargo Commercial Mortgage Trust 2020-C56 | Certain Terms and Conditions |
| collection period and the outstanding principal balance of such delinquent loans in the aggregate constitutes at least 20.0% of the aggregate outstanding principal balance of all of the mortgage loans (including any REO loans (or a portion of any REO loan in the case of a whole loan)) held by the issuing entity as of the end of the applicable collection period. See “Pooling and Servicing Agreement—The Asset Representations Reviewer—Asset Review” in the Preliminary Prospectus. The Asset Representations Reviewer may be terminated and replaced without cause. Upon (i) the written direction of certificateholders evidencing not less than 25% of the voting rights (without regard to the application of any Cumulative Appraisal Reduction Amounts) requesting a vote to terminate and replace the Asset Representations Reviewer with a proposed successor Asset Representations Reviewer that is an eligible asset representations reviewer, and (ii) payment by such holders to the certificate administrator of the reasonable fees and expenses to be incurred by the certificate administrator in connection with administering such vote, the certificate administrator will promptly provide notice to all certificateholders and the Asset Representations Reviewer of such request by posting such notice on its internet website, and by mailing such notice to all certificateholders and the Asset Representations Reviewer. Upon the written direction of certificateholders evidencing at least 75% of a certificateholder quorum (without regard to the application of any Cumulative Appraisal Reduction Amounts), the Trustee will terminate all of the rights and obligations of the Asset Representations Reviewer under the WFCM 2020-C56 pooling and servicing agreement by written notice to the Asset Representations Reviewer, and the proposed successor Asset Representations Reviewer will be appointed. See “Pooling and Servicing Agreement—The Asset Representations Reviewer” in the Preliminary Prospectus. |
Dispute Resolution Provisions: | The mortgage loan sellers will be subject to the dispute resolution provisions set forth in the WFCM 2020-C56 pooling and servicing agreement to the extent those provisions are triggered with respect to any mortgage loan sold to the depositor by a mortgage loan seller and such mortgage loan seller will be obligated under the related mortgage loan purchase agreement to comply with all applicable provisions and to take part in any mediation or arbitration proceedings that may result. Generally, in the event that a Repurchase Request (as defined in the Preliminary Prospectus) is not “Resolved” (as defined below) within 180 days after the related mortgage loan seller receives such Repurchase Request, then the enforcing servicer will be required to send a notice to the “Initial Requesting Certificateholder” (if any) and the Certificate Administrator indicating the enforcing servicer’s intended course of action with respect to the Repurchase Request. If (a) the enforcing servicer’s intended course of action with respect to the Repurchase Request does not involve pursuing further action to exercise rights against the related mortgage loan seller with respect to the Repurchase Request and the Initial Requesting Certificateholder, if any, or any other certificateholder or certificate owner wishes to exercise its right to refer the matter to mediation (including non-binding arbitration) or arbitration, or (b) the enforcing servicer’s intended course of action is to pursue further action to exercise rights against the related mortgage loan seller with respect to the Repurchase Request but the Initial Requesting Certificateholder, if any, or any other certificateholder or certificate owner does not agree with the dispute resolution method selected by the enforcing servicer, then the Initial Requesting Certificateholder, if any, or such other certificateholder or certificate owner may deliver a written notice to the Special Servicer indicating its intent to exercise its right to refer the matter to either mediation or arbitration. “Resolved” means, with respect to a Repurchase Request, (i) that the related Material Defect has been cured, (ii) the related mortgage loan has been repurchased in accordance with the related mortgage loan purchase agreement, (iii) a mortgage loan has been substituted for the related mortgage loan in accordance with the related mortgage loan purchase agreement, (iv) the applicable mortgage loan seller has made a Loss of Value Payment (as defined in the Preliminary Prospectus), (v) a contractually binding agreement is entered into between the enforcing servicer, on behalf of the issuing entity, and the related mortgage loan seller that settles the related mortgage loan seller’s obligations under the related mortgage loan purchase agreement or (vi) the related mortgage loan is no longer property of the issuing entity as a result of a sale or other disposition in accordance with the WFCM 2020-C56 pooling and servicing agreement. See “Pooling and Servicing Agreement—Dispute Resolution Provisions” in the Preliminary Prospectus. |
Investor Communications: | The certificate administrator is required to include on any Form 10–D any request received from a certificateholder to communicate with other certificateholders related to certificateholders exercising their rights under the terms of the WFCM 2020-C56 pooling and servicing agreement. Any certificateholder wishing to communicate with other certificateholders regarding the exercise of its rights under the terms of the WFCM 2020-C56 pooling and servicing agreement will be able to deliver a written request signed by an authorized representative of the requesting investor to the certificate administrator. |
THE INFORMATION IN THIS STRUCTURAL AND COLLATERAL TERM SHEET IS NOT COMPLETE AND MAY BE AMENDED PRIOR TO THE TIME OF SALE. THIS TERM SHEET IS NOT AN OFFER TO SELL THESE SECURITIES AND IT IS NOT A SOLICITATION OF AN OFFER TO BUY THESE SECURITIES IN ANY JURISDICTION WHERE THE OFFER OR SALE IS NOT PERMITTED.
34
Wells Fargo Commercial Mortgage Trust 2020-C56 | Certain Terms and Conditions |
Certain Fee Offsets: | If a workout fee is earned by the Special Servicer following a loan default with respect to any mortgage loan that it services, then certain limitations will apply based on modification fees paid by the borrower. The modification fee generally must not exceed 1% of the principal balance of the loan as modified in any 12-month period. In addition, if the loan re-defaults, any subsequent workout fee on that loan must be reduced by a portion of the modification fees paid by the borrower in the previous 12-months. Likewise, liquidation fees collected in connection with a liquidation or partial liquidation of a mortgage loan must be reduced by a portion of the modification fees paid by the borrower in the previous 12 months. |
Deal Website: | The Certificate Administrator will be required to maintain a deal website, which will include, among other items: (a) summaries of asset status reports prepared by the Special Servicer, (b) inspection reports, (c) appraisals, (d) various “special notices” described in the Preliminary Prospectus, (e) the “Investor Q&A Forum”, (f) a voluntary “Investor Registry” and (g) the “Risk Retention Special Notices” tab. Investors may access the deal website following execution of a certification and confidentiality agreement. |
Initial Majority Controlling
Class Certificateholder: | It is expected that KKR CMBS II Aggregator Type 2 L.P. or an affiliate will be the initial majority controlling class certificateholder. |
Whole Loans: | Each of the mortgaged properties identified above under “IV. Characteristics of the Mortgage Pool—B. Summary of the Whole Loans” secures both a mortgage loan to be included in the trust fund and one or more other mortgage loans that will not be included in the trust fund, each of which will be pari passu or subordinate in right of payment with the mortgage loan included in the trust fund. We refer to each such group of mortgage loans as a “whole loan”. Such “—Summary of the Whole Loans” section includes further information regarding the various notes in each whole loan, the holders of such notes, the lead servicing agreement for each such whole loan, and the master servicer and special servicer under such lead servicing agreement. |
THE INFORMATION IN THIS STRUCTURAL AND COLLATERAL TERM SHEET IS NOT COMPLETE AND MAY BE AMENDED PRIOR TO THE TIME OF SALE. THIS TERM SHEET IS NOT AN OFFER TO SELL THESE SECURITIES AND IT IS NOT A SOLICITATION OF AN OFFER TO BUY THESE SECURITIES IN ANY JURISDICTION WHERE THE OFFER OR SALE IS NOT PERMITTED.
35
| Industrial - Warehouse | Loan #1 | Cut-off Date Balance: | | $52,737,103 |
| 505 Manor Avenue and 500 | Supor Industrial Portfolio | Cut-off Date LTV: | | 54.5% |
| Supor Boulevard | | U/W NCF DSCR: | | 1.29x |
| Harrison, NJ 07029 | | U/W NOI Debt Yield: | | 8.1% |

THE INFORMATION IN THIS STRUCTURAL AND COLLATERAL TERM SHEET IS NOT COMPLETE AND MAY BE AMENDED PRIOR TO THE TIME OF SALE. THIS TERM SHEET IS NOT AN OFFER TO SELL THESE SECURITIES AND IT IS NOT A SOLICITATION OF AN OFFER TO BUY THESE SECURITIES IN ANY JURISDICTION WHERE THE OFFER OR SALE IS NOT PERMITTED.
36
| Industrial - Warehouse | Loan #1 | Cut-off Date Balance: | | $52,737,103 |
| 505 Manor Avenue and 500 | Supor Industrial Portfolio | Cut-off Date LTV: | | 54.5% |
| Supor Boulevard | | U/W NCF DSCR: | | 1.29x |
| Harrison, NJ 07029 | | U/W NOI Debt Yield: | | 8.1% |
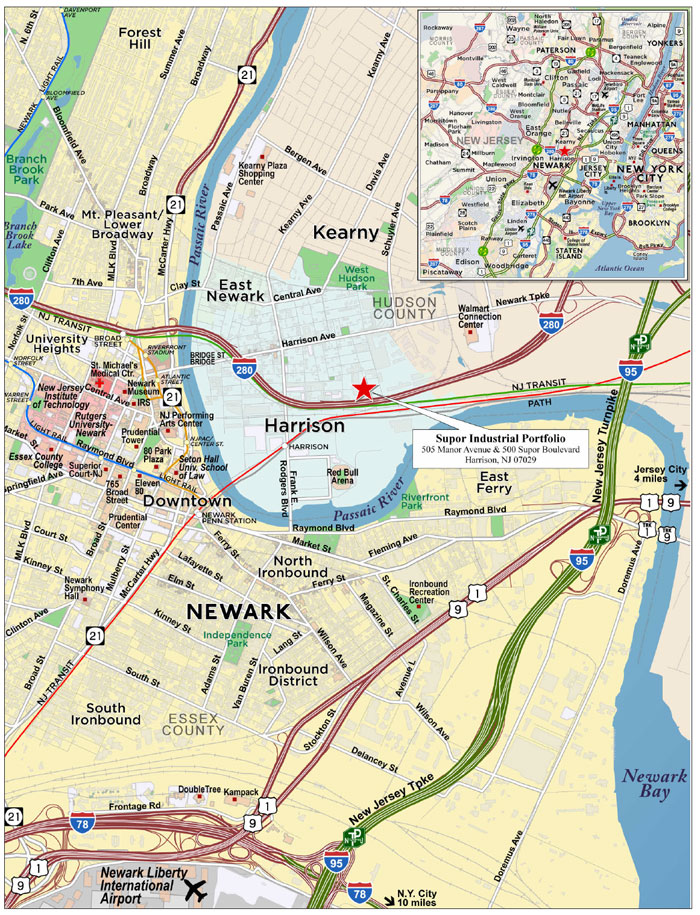
THE INFORMATION IN THIS STRUCTURAL AND COLLATERAL TERM SHEET IS NOT COMPLETE AND MAY BE AMENDED PRIOR TO THE TIME OF SALE. THIS TERM SHEET IS NOT AN OFFER TO SELL THESE SECURITIES AND IT IS NOT A SOLICITATION OF AN OFFER TO BUY THESE SECURITIES IN ANY JURISDICTION WHERE THE OFFER OR SALE IS NOT PERMITTED.
37
| No. 1 – Supor Industrial Portfolio |
| |
| Mortgage Loan Information | | Mortgaged Property Information |
| Mortgage Loan Seller: | LMF Commercial, LLC | | Single Asset/Portfolio: | Single Asset |
Credit Assessment (Fitch/KBRA/Moody’s): | NR/NR/NR | | Property Type – Subtype: | Industrial – Warehouse |
| Original Principal Balance: | $53,000,000 | | Location: | Harrison, NJ |
| Cut-off Date Balance: | $52,737,103 | | Net Rentable Area: | 626,134 SF |
| % of Initial Pool Balance: | 7.2% | | Cut-off Date Balance Per SF: | $84.23 |
| Loan Purpose: | Refinance | | Maturity Date Balance Per SF: | $68.95 |
| Borrower Sponsor(1): | Joseph Supor III | | Year Built/Renovated: | 1930/NAP |
| Guarantor(1): | Joseph Supor III | | Title Vesting: | Fee |
| Mortgage Rate: | 4.7200% | | Property Manager: | Self-managed |
| Note Date: | January 31, 2020 | | Current Occupancy (As of)(4)(5): | 100.0% (6/1/2020) |
| Seasoning: | 4 months | | YE 2019 Occupancy(4): | NAV |
| Maturity Date: | February 6, 2030 | | YE 2018 Occupancy(4): | NAV |
| IO Period: | 0 months | | YE 2017 Occupancy(4): | NAV |
| Loan Term (Original): | 120 months | | YE 2016 Occupancy(4): | NAV |
| Amortization Term (Original): | 360 months | | As-Is Appraised Value(5): | $96,800,000 |
| Loan Amortization Type: | Amortizing Balloon | | As-Is Appraised Value Per SF(5): | $154.60 |
| Call Protection: | L(28),D(88),O(4) | | As-Is Appraisal Valuation Date: | December 20, 2019 |
| Lockbox Type: | Springing | | Underwriting and Financial Information(5) |
| Additional Debt(2): | Yes | | TTM NOI (3/31/2020)(6): | $6,877,516 |
| Additional Debt Type (Balance)(2): | Future Mezzanine | | YE 2019 NOI(6): | $6,313,260 |
| | | | YE 2018 NOI(6): | $3,712,953 |
| | | | YE 2017 NOI(6): | $4,300,264 |
| | | | U/W Revenues: | $7,379,667 |
| | | | U/W Expenses: | $3,129,667 |
| Escrows and Reserves(3) | | U/W NOI(7): | $4,250,000 |
| | Initial | Monthly | Cap | | U/W NCF: | $4,250,000 |
| Taxes | $0 | Springing | NAP | | U/W DSCR based on NOI/NCF: | 1.29x / 1.29x |
| Insurance | $0 | Springing | NAP | | U/W Debt Yield based on NOI/NCF: | 8.1% / 8.1% |
| Replacement Reserve | $0 | Springing | NAP | | U/W Debt Yield at Maturity based on NOI/NCF: | 9.8% / 9.8% |
| | | | | | Cut-off Date LTV Ratio: | 54.5% |
| | | | | | LTV Ratio at Maturity: | 44.6% |
| | | | | | | |
| | | | | | | | |
| Sources and Uses |
| Sources | | | | | Uses | | | |
| Original loan amount | $53,000,000 | | 100.0% | | Loan payoff | $45,233,020 | | 85.3% |
| | | | | | Closing costs | 1,525,786 | | 2.9 |
| | | | | | Return of equity | 6,241,194 | | 11.8 |
| Total Sources | $53,000,000 | | 100.0% | | Total Uses | $53,000,000 | | 100.0% |
| (1) | The borrower sponsor and the Supor Guarantor (as defined below) is Joseph Supor III, both individually and in his capacity as trustee of the Marital Trust Under the Last Will and Testament of Joseph Supor, Jr. See “The Borrowers and Borrower Sponsors” section below. |
| (2) | See “Subordinate and Mezzanine Indebtedness” section below. |
| (3) | See “Escrows” section below. |
| (4) | The Current Occupancy reflects the Supor Operating Lease (as defined below). See “The Property” section below. Historical occupancy is not available because the Supor Operating Lease was signed at origination. |
| (5) | All NOI, NCF and occupancy information, as well as the appraised value, were determined prior to the emergence of the novel coronavirus pandemic and the economic disruption resulting from measures to combat the pandemic, and all DSCR, LTV and Debt Yield metrics were calculated, and the Supor Industrial Portfolio Mortgage Loan was underwritten, based on such prior information. See “Risk Factors—Coronavirus Pandemic Has Adversely Affected the Global Economy and Will Likely Adversely Affect the Performance of the Mortgage Loans” in the Preliminary Prospectus. |
| (6) | The TTM NOI, YE 2019 NOI, YE 2018 NOI and YE 2017 NOI reflect the look-through to the Supor Industrial Portfolio Property (as defined below) operating on a multi-tenant level. At origination, the Supor Operating Lease was put in place, and underwriting is based on the Supor Operating Lease. Increase in YE 2019 NOI from YE 2018 NOI was mainly due to increases in rents charged to the third-party user tenants at the Supor Industrial Portfolio Property. |
| (7) | The Supor Operating Lease is a 20-year, absolute net operating lease. U/W NOI reflects the contractual rent due under the Operating Lease, which such rent is due regardless of the amount of rents collected from end-user tenants. See “The Property” section below. |
The Mortgage Loan. The mortgage loan (the “Supor Industrial Portfolio Mortgage Loan”) is evidenced by a first mortgage encumbering the fee simple interest in a 626,134 square foot industrial warehouse complex property located in Harrison, NJ (the “Supor Industrial Portfolio Property”).
THE INFORMATION IN THIS STRUCTURAL AND COLLATERAL TERM SHEET IS NOT COMPLETE AND MAY BE AMENDED PRIOR TO THE TIME OF SALE. THIS TERM SHEET IS NOT AN OFFER TO SELL THESE SECURITIES AND IT IS NOT A SOLICITATION OF AN OFFER TO BUY THESE SECURITIES IN ANY JURISDICTION WHERE THE OFFER OR SALE IS NOT PERMITTED.
38
| Industrial - Warehouse | Loan #1 | Cut-off Date Balance: | | $52,737,103 |
| 505 Manor Avenue and 500 | Supor Industrial Portfolio | Cut-off Date LTV: | | 54.5% |
| Supor Boulevard | | U/W NCF DSCR: | | 1.29x |
| Harrison, NJ 07029 | | U/W NOI Debt Yield: | | 8.1% |
The Borrowers and Borrower Sponsors.The borrowers are J. Supor Realty Group LLC and Supor Manor Realty Group LLC (collectively, the “Supor Industrial Portfolio Borrowers”), each a Delaware limited liability company structured to be bankruptcy remote, with two independent directors. Legal counsel to the Supor Industrial Portfolio Borrowers delivered a non-consolidation opinion in connection with the origination of the Supor Industrial Portfolio Mortgage Loan. The borrower sponsor and non-recourse carveout guarantor of the Supor Industrial Portfolio Mortgage Loan is Joseph Supor III, individually, and Joseph Supor III as trustee of the Marital Trust Under the Last Will and Testament of Joseph Supor, Jr. (together, “Supor Guarantor”). In addition to the non-recourse carveouts, the Supor Guarantor has guaranteed the payment obligations under the Supor Operating Lease (as defined below).
Joseph Supor III is the principal owner, CEO, and Chairman of J. Supor & Son, a privately held company founded in 1948, which has been a family owned and operated company for 60 years with its headquarters in Kearny, New Jersey. J. Supor & Son specializes in heavy hauling, transportation, rigging, storage and recovery of substantial projects and provides import/export shipping expertise using its indoor/outdoor, industrial grade equipment. J. Supor & Son services include, but are not limited to, the rigging, transportation, permitting, logistics and storage of large and sophisticated industrial cargo, using specially trained operators and heavy machinery. These services span across North America and select international markets.
The Property.The Supor Industrial Portfolio Property is comprised of a 626,134 square foot industrial warehouse complex situated on two separate parcels located approximately 0.2 miles from each other at 500 Supor Boulevard and 505 Manor Avenue, Harrison, New Jersey. The Supor Industrial Portfolio Property is utilized as an industrial storage and staging space for tenants traditionally involved in large manufacturing or infrastructure projects in Manhattan and the greater Tri-state area. The Supor Industrial Portfolio Property is structured with a 20-year, absolute net operating lease agreement (the “Supor Operating Lease”) between the Supor Industrial Portfolio Borrowers and J. Supor Realty LLC & Supor Manor Realty LLC, each of which is a borrower affiliated entity, as the direct tenants under the Supor Operating Lease (together, the “Operating Tenant”). The Operating Tenant enters into subleases with third-party user tenants at the Supor Industrial Portfolio Property. The Supor Operating Lease provides for initial annual triple net rent of $4.25 million subject to a 2.0% rent escalation every five years, beginning in January 2025, and has four, five-year lease extensions. Payments under the Supor Operating Lease are not contingent upon any underlying sub-leases, and the Supor Operating Lease is guaranteed by the Supor Guarantor.
The Supor Industrial Portfolio Property is located approximately 12.9 miles from the Port of New York & New Jersey, and 10.8 miles west of Manhattan. The Supor Industrial Portfolio Property is a staging location for tenants involved in large infrastructure projects such as the LaGuardia and Newark Airports terminal renovations, Hudson Yards, Grand Central Terminal, Port Authority, and the American Dream Mall. Over the past 12 months, the Supor Industrial Portfolio Property has been rented to and utilized by over 80 companies; the three largest sub-tenants at the Supor Industrial Portfolio Property by rent, PSE&G Company (Fitch/Moody’s/S&P: BBB+/Baa1/BBB+), Siemens Energy Inc. (Fitch/Moody’s/S&P: A/A1/A+) and Con Edison (Supor Trucking LLC) (Fitch/Moody’s/S&P: BBB+/Baa1/A-), have been at the Supor Industrial Portfolio Property for over 15 years and represent approximately 39.5% of the third-party rent generated during the fiscal year ended March 2020.
The 500 Supor Boulevard building parcel, situated on a 21.5 acre site, is used for the storage of heavy equipment and machinery with 16 overhead cranes used for the movement of bulk goods. The improvements consist of one, single-story building developed in 1930, with 307,907 square feet of ground level space and an additional 144,763 square feet of useable mezzanine space. The 500 Supor Boulevard building has variable ceiling heights that range from 22 to 80 feet, along with eight grade level doors. Additionally, the 500 Supor Boulevard building includes eight, 160’ x 72’ outdoor storage tents that are anchored into four-square-foot concrete blocks, which tents add an additional 92,160 square feet of covered storage and staging space that are excluded from the net rentable area.
The 505 Manor Avenue building parcel is used for the storage of heavy equipment and machinery with four overhead cranes to assist with the movement of items in and out of the building. The 505 Manor Avenue building is situated on a 5.7-acre site improved with 173,464 square feet of warehouse space.
COVID-19 Update. As of May 15, 2020, the Supor Industrial Portfolio Property is open and operating. All Supor Industrial Portfolio Mortgage Loan May 2020 debt service payments have been made to date. The Operating Tenant underwritten base rent has been paid for May 2020. As of May 1, 2020, the borrower sponsor did not report any sub-tenant’s request for rent relief at the Supor Industrial Portfolio Property. April 2020 rent collection from sub-tenants was on the same level with April 2019 rent collection from sub-tenants. As of the date hereof, the Supor Industrial Portfolio Mortgage Loan is not subject to any modification or forbearance request.
THE INFORMATION IN THIS STRUCTURAL AND COLLATERAL TERM SHEET IS NOT COMPLETE AND MAY BE AMENDED PRIOR TO THE TIME OF SALE. THIS TERM SHEET IS NOT AN OFFER TO SELL THESE SECURITIES AND IT IS NOT A SOLICITATION OF AN OFFER TO BUY THESE SECURITIES IN ANY JURISDICTION WHERE THE OFFER OR SALE IS NOT PERMITTED.
39
| Industrial - Warehouse | Loan #1 | Cut-off Date Balance: | | $52,737,103 |
| 505 Manor Avenue and 500 | Supor Industrial Portfolio | Cut-off Date LTV: | | 54.5% |
| Supor Boulevard | | U/W NCF DSCR: | | 1.29x |
| Harrison, NJ 07029 | | U/W NOI Debt Yield: | | 8.1% |
The following table presents certain information relating to the Supor Operating Lease at the Supor Industrial Portfolio Property:
Operating Tenant(1)
| Tenant Name | Credit Rating (Fitch/Moody’s/
S&P) | Tenant NRSF | % of
NRSF | Annual
U/W Base
Rent PSF | Annual
U/W Base Rent | % of Total Annual U/W Base Rent | Lease
Expiration
Date | Extension Options | Termination Option (Y/N) |
| | | | | | | | | |
| J. Supor Realty LLC & Supor Manor Realty LLC(2) | NR/NR/NR | 626,134 | 100.0%(3) | $6.79 | $4,250,000 | 100.0% | 1/31/2040 | 4, 5-year | N |
| Occupied Collateral Total | 626,134 | 100.0% | $6.79 | $4,250,000 | 100.0% | | | |
| | | | | | | | | |
| Vacant Space | 0 | 0.0% | | | | | | |
| | | | | | | | | |
| Collateral Total | 626,134 | 100.0% | | | | | | |
| | | | | | | | | | |
| (1) | Information is based on the Supor Operating Lease as of 6/1/2020. |
| (2) | J. Supor Realty LLC & Supor Manor Realty LLC are affiliates of the Supor Industrial Portfolio Borrowers and enter into subleases and contracts at the Supor Industrial Portfolio Property with various end-user tenants. |
| (3) | % of NRSF reflects solely the square footage leased under the Supor Operating Lease. For information on the sub-tenants see the table below. |
The following table presents certain information relating to the top 10 sub-tenant accounts/end users at the Supor Industrial Portfolio Property:
Top 10 Sub-tenant Accounts(1)
| Customer | Rental
Revenue | % of
Rental
Revenue(2) | Sub-tenant Start
Date(3) |
| PSE&G Company | $2,178,681 | 21.5% | 2005 |
| Siemens Energy Inc. | $924,034 | 9.1% | 2005 |
| Con Edison (Supor Trucking LLC) | $898,732 | 8.9% | 2004 |
| Permasteelisa N.A. | $606,405 | 6.0% | 2005 |
| Williams-Transco(4) | $576,400 | 5.7% | 2017 |
| Machinery Values(5) | $575,025 | 5.7% | 1994 |
| Harrison Warehouse | $540,000 | 5.3% | 1994 |
| SC Group, LLC | $475,656 | 4.7% | 2018 |
| Elicc Americas Corp | $272,272 | 2.7% | 2013 |
| Owen Steel Company | $248,578 | 2.5% | 2018 |
| | $7,295,782 | 72.0% | |
| (1) | Based on the Supor Industrial Portfolio Borrowers’ customer rent roll. |
| (2) | % of Rental Revenue is based on the trailing 12-month period ending March 31, 2020 and includes rental income, storage and handling charges totaling $10,133,547. |
| (3) | Sub-tenant Start Date refers to the year the related sub-tenant began leasing space at the Supor Industrial Portfolio Property. |
| (4) | As of May 1, 2020, Williams-Transco is no longer utilizing the Supor Industrial Portfolio Property after finishing its project. Increased usage by other tenants has replaced a portion of the revenue previously generated from Williams-Transco. |
| (5) | A portion of the space leased to Machinery Values is included in the Release Parcel (as defined below). See “Release of Property” section below. |
THE INFORMATION IN THIS STRUCTURAL AND COLLATERAL TERM SHEET IS NOT COMPLETE AND MAY BE AMENDED PRIOR TO THE TIME OF SALE. THIS TERM SHEET IS NOT AN OFFER TO SELL THESE SECURITIES AND IT IS NOT A SOLICITATION OF AN OFFER TO BUY THESE SECURITIES IN ANY JURISDICTION WHERE THE OFFER OR SALE IS NOT PERMITTED.
40
| Industrial - Warehouse | Loan #1 | Cut-off Date Balance: | | $52,737,103 |
| 505 Manor Avenue and 500 | Supor Industrial Portfolio | Cut-off Date LTV: | | 54.5% |
| Supor Boulevard | | U/W NCF DSCR: | | 1.29x |
| Harrison, NJ 07029 | | U/W NOI Debt Yield: | | 8.1% |
The following table presents certain information relating to the lease rollover schedule at the Supor Industrial Portfolio Property:
Lease Expiration Schedule(1)
Year Ending
December 31, | No. of
Leases
Expiring | Expiring
NRSF | % of
Total
NRSF | Cumulative
Expiring
NRSF | Cumulative %
of Total
NRSF | Annual
U/W
Base Rent | % of Total Annual U/W Base Rent | Annual
U/W
Base Rent
PSF |
| MTM | 0 | 0 | 0.0% | 0 | 0.0% | $0 | 0.0% | $0.00 |
| 2020 | 0 | 0 | 0.0% | 0 | 0.0% | $0 | 0.0% | $0.00 |
| 2021 | 0 | 0 | 0.0% | 0 | 0.0% | $0 | 0.0% | $0.00 |
| 2022 | 0 | 0 | 0.0% | 0 | 0.0% | $0 | 0.0% | $0.00 |
| 2023 | 0 | 0 | 0.0% | 0 | 0.0% | $0 | 0.0% | $0.00 |
| 2024 | 0 | 0 | 0.0% | 0 | 0.0% | $0 | 0.0% | $0.00 |
| 2025 | 0 | 0 | 0.0% | 0 | 0.0% | $0 | 0.0% | $0.00 |
| 2026 | 0 | 0 | 0.0% | 0 | 0.0% | $0 | 0.0% | $0.00 |
| 2027 | 0 | 0 | 0.0% | 0 | 0.0% | $0 | 0.0% | $0.00 |
| 2028 | 0 | 0 | 0.0% | 0 | 0.0% | $0 | 0.0% | $0.00 |
| 2029 | 0 | 0 | 0.0% | 0 | 0.0% | $0 | 0.0% | $0.00 |
| 2030 | 0 | 0 | 0.0% | 0 | 0.0% | $0 | 0.0% | $0.00 |
| Thereafter | 1 | 626,134 | 100.0% | 626,134 | 100.0% | $4,250,000 | 100.0% | $6.79 |
| Vacant | 0 | 0 | 0.0% | 626,134 | 100.0% | $0 | 0.0% | $0.00 |
| Total/Weighted Average | 1 | 626,134 | 100.0% | | | $4,250,000 | 100.0% | $6.79 |
| (1) | Information is based on the Supor Operating Lease. This table pertains to the Supor Operating Lease with Operating Tenant and does not reflect the expirations of the subleases between Operating Tenant and any sub-tenants. |
The following table presents historical occupancy percentages at the Supor Industrial Portfolio Property:
Historical Occupancy(1)
12/31/2017 | 12/31/2018 | 12/31/2019 | 6/1/2020 |
| | | | |
| NAV | NAV | NAV | 100.0% |
| (1) | June 1, 2020 occupancy reflects the Supor Operating Lease, which lease was effective as of the origination date of the Supor Industrial Portfolio Mortgage Loan. Historical occupancy is not available because the Operating Lease was signed at origination. |
THE INFORMATION IN THIS STRUCTURAL AND COLLATERAL TERM SHEET IS NOT COMPLETE AND MAY BE AMENDED PRIOR TO THE TIME OF SALE. THIS TERM SHEET IS NOT AN OFFER TO SELL THESE SECURITIES AND IT IS NOT A SOLICITATION OF AN OFFER TO BUY THESE SECURITIES IN ANY JURISDICTION WHERE THE OFFER OR SALE IS NOT PERMITTED.
41
| Industrial - Warehouse | Loan #1 | Cut-off Date Balance: | | $52,737,103 |
| 505 Manor Avenue and 500 | Supor Industrial Portfolio | Cut-off Date LTV: | | 54.5% |
| Supor Boulevard | | U/W NCF DSCR: | | 1.29x |
| Harrison, NJ 07029 | | U/W NOI Debt Yield: | | 8.1% |
Operating History and Underwritten Net Cash Flow. The following table presents certain information relating to the underwritten net cash flow at the Supor Industrial Portfolio Property:
Cash Flow Analysis(1)
| | 2017 | 2018 | 2019 | TTM 3/31/2020 | U/W(2)(3) | %(4) | U/W $ per
SF |
| Rents in Place | $6,824,224 | $6,557,044 | $9,328,594 | $10,133,547 | $4,250,000 | 57.6% | $6.79 |
| Contractual Rent Steps | 0 | 0 | 0 | 0 | 0 | 0.0 | 0.00 |
| Grossed Up Vacant Space | 0 | 0 | 0 | 0 | 0 | 0.0 | 0.00 |
| Gross Potential Rent | $6,824,224 | $6,557,044 | $9,328,594 | $10,133,547 | $4,250,000 | 57.6% | $6.79 |
| Other Income | 0 | 0 | 0 | 0 | 0 | 0.0 | 0.00 |
| Total Recoveries | 0 | 0 | 0 | 0 | 3,129,667 | 42.4 | 5.00 |
| Net Rental Income | $6,824,224 | $6,557,044 | $9,328,594 | $10,133,547 | $7,379,667 | 100.0% | $11.79 |
| (Vacancy & Credit Loss) | 0 | 0 | 0 | 0 | (0) | (0.0) | (0.00) |
| Effective Gross Income | $6,824,224 | $6,557,044 | $9,328,594 | $10,133,547 | $7,379,667 | 100.0% | $11.79 |
| | | | | | | | |
| Real Estate Taxes | 710,233 | 837,279 | 842,617 | 843,951 | 843,951 | 11.4 | 1.35 |
| Insurance | 213,901 | 244,766 | 246,223 | 270,779 | 270,779 | 3.7 | 0.43 |
| Management Fee | 198,238 | 271,818 | 391,015 | 421,550 | 295,187 | 4.0 | 0.47 |
| Other Operating Expenses | 1,401,588 | 1,490,228 | 1,535,479 | 1,719,750 | 1,719,750 | 23.3 | 2.75 |
| Total Operating Expenses | $2,523,960 | $2,844,091 | $3,015,334 | $3,256,031 | $3,129,667 | 42.4% | $5.00 |
| | | | | | | | |
| Net Operating Income | $4,300,264 | $3,712,953 | $6,313,260 | $6,877,516 | $4,250,000 | 57.6% | $6.79 |
| Replacement Reserves | 0 | 0 | 0 | 0 | 0 | 0.0 | 0.00 |
| TI/LC | 0 | 0 | 0 | 0 | 0 | 0.0 | 0.00 |
| Net Cash Flow | $4,300,264 | $3,712,953 | $6,313,260 | $6,877,516 | $4,250,000 | 57.6% | $6.79 |
| | | | | | | | |
| NOI DSCR | 1.30x | 1.12x | 1.91x | 2.08x | 1.29x | | |
| NCF DSCR | 1.30x | 1.12x | 1.91x | 2.08x | 1.29x | | |
| NOI Debt Yield | 8.2% | 7.0% | 12.0% | 13.0% | 8.1% | | |
| NCF Debt Yield | 8.2% | 7.0% | 12.0% | 13.0% | 8.1% | | |
| (1) | Cash Flow Analysis is based on the historical operating history, which reflects the look-through to the Supor Industrial Portfolio Property operating on a multi-tenant level prior to origination. At origination, the Supor Operating Lease was put in place, and the U/W analysis is based on the Supor Operating Lease. |
| (2) | U/W reflects the contractual rent due under the Supor Operating Lease from the Operating Tenants, which rent is due regardless of the amount of rents collected from sub-tenants. |
| (3) | For the avoidance of doubt, no COVID-19 specific adjustments have been incorporated in the lender U/W. |
| (4) | Represents (i) percent of Net Rental Income for all revenue fields, (ii) percent of Gross Potential Rent for Vacancy & Credit Loss and (iii) percent of Effective Gross Income for all other fields. |
Appraisal.The appraiser concluded to an “as-is” appraised value of $96,800,000 as of December 20, 2019.
Environmental Matters. According to Phase I environmental site assessments dated December 4, 2019, there was no evidence of any recognized environmental conditions at the Supor Industrial Portfolio Property. The Phase I environmental site assessments identified two controlled recognized environmental conditions (“CREC”) for the Supor Boulevard site and one CREC for the Manor Boulevard site. See “Environmental Considerations” in the Preliminary Prospectus.
Market Overview and Competition.The Supor Industrial Portfolio Property is located in Harrison, Hudson County, New Jersey, within the New York-Newark-Jersey City, NY-NJ-PA metropolitan statistical area (the “New York MSA”). The New York MSA is the most populated area within the United States, according to the appraisal. Hudson County is bordered by the Hudson River and the Upper New York Bay to the east, Kill Van Kull Newark Bay, the Hackensack River and the Passaic River to the west. According to the appraisal, the New York MSA had a 2019 total population of 20.0 million and experienced an annual growth rate of 0.3%.
The Supor Industrial Portfolio Property is located approximately 9.4 miles west of the New York central business district. Primary access to the region is provided by Interstate 280 and Interstate 95. The Supor Industrial Portfolio Property neighborhood is developed primarily for industrial/warehouse use along arterials that are interspersed with multi-family complexes and single-family residential developments removed from arterials. Other developments in the neighborhood include the Red Bull soccer stadium, the new Harrison Port Authority Trans-Hudson (“PATH”) station, Rutgers University at Newark and the New Jersey Institute of Technology. In June 2019, PATH opened the new eastbound PATH station in Harrison, completing the second phase of a $256 million redevelopment project that is anticipated to improve travel for the riders who use the facility daily. This four phase redevelopment program also includes the construction of the westbound station house that opened in October 2018, the renovation of the two existing buildings on the site, and the creation of other amenities and services in the station and vicinity. Additionally, Newark Liberty International Airport is located
THE INFORMATION IN THIS STRUCTURAL AND COLLATERAL TERM SHEET IS NOT COMPLETE AND MAY BE AMENDED PRIOR TO THE TIME OF SALE. THIS TERM SHEET IS NOT AN OFFER TO SELL THESE SECURITIES AND IT IS NOT A SOLICITATION OF AN OFFER TO BUY THESE SECURITIES IN ANY JURISDICTION WHERE THE OFFER OR SALE IS NOT PERMITTED.
42
| Industrial - Warehouse | Loan #1 | Cut-off Date Balance: | | $52,737,103 |
| 505 Manor Avenue and 500 | Supor Industrial Portfolio | Cut-off Date LTV: | | 54.5% |
| Supor Boulevard | | U/W NCF DSCR: | | 1.29x |
| Harrison, NJ 07029 | | U/W NOI Debt Yield: | | 8.1% |
approximately 5.3 miles southwest of the Supor Industrial Portfolio Property. According to a third-party market research report, the 2019 population within a one-, three- and five-mile-radius of the Supor Industrial Portfolio Property was 34,405, 256,433 and 758,393, respectively. The 2019 average household income within a one-, three- and five-mile radius of the Supor Industrial Portfolio Property was $75,821, $61,473 and $70,795.
According to a third-party market report, the Supor Industrial Portfolio Property is located in the Northern New Jersey industrial market and the Lyndhurst/Harrison industrial submarket. As of the third quarter 2019, the Northern New Jersey industrial market consisted of 216.9 million square feet of industrial space. The Northern New Jersey industrial market reported a vacancy rate of 3.8% and asking rents of $8.11 per square foot. As of the third quarter 2019, there was 134,576 square feet under construction and positive net absorption of 939,603 square feet. The Lyndhurst/Harrison industrial submarket consisted of 22.0 million square feet of industrial space. The Lyndhurst/Harrison industrial submarket reported a vacancy rate of 2.0% and asking rents of $10.42 per square foot. As of the third quarter 2019, there was no new construction and positive net absorption of 117,529 square feet.
The table below presents certain information relating to comparable sales for the Supor Industrial Portfolio Property identified by the appraiser:
Comparable Sales(1)
| Property Name | Location | Rentable
Area (SF) | Sale Date | Sale Price | Sale
Price (PSF) |
| 1000-1108 Jefferson Avenue and 2-38 Pershing Avenue | Elizabeth, NJ | 190,000 | May-19 | $24,808,700 | $131 |
| 21 Caven Point Avenue | Jersey City, NJ | 134,500 | Apr-19 | $16,750,000 | $125 |
| 101 Railroad Avenue | Ridgefield, NJ | 330,199 | Sep-19 | $45,750,000 | $139 |
| 75 Mill Road | Edison, NJ | 570,100 | Nov-18 | $83,000,000 | $146 |
| 18 Van Veghten Drive | Bridgewater, NJ | 220,929 | Oct-19 | $28,000,000 | $127 |
| 350 Starke Road | Carlstadt, NJ | 368,175 | Oct-18 | $60,200,000 | $164 |
| (1) | Information obtained from the appraisal. |
The following table presents certain information relating to five comparable leases to those at the Supor Industrial Portfolio Property:
Comparable Leases(1)
| Property Name/Location | Year
Built/
Renovated | Total
GLA
(SF) | Distance
from
Subject | Occupancy | Lease Term | Tenant
Size
(SF) | Annual
Base
Rent
PSF | Reimbursement
Amount
PSF | Lease Type |
5 Ethel Boulevard 5 Ethel Boulevard Wood Ridge, NJ | 2019/NAP | 84,600 | 7.6 miles | 65.0% | 15.3 Yrs | 124,888 | $15.24 | NAV | NNN |
201 Bay Avenue 201 Bay Avenue Elizabeth, NJ | 1980/2013 | 508,202 | 4.5 miles | 100.0% | 2.8 Yrs | 142,874 | $9.25 | NAV | NNN |
100 Industrial Drive 100 Industrial Drive Jersey City, NJ | 2003/NAP | 181,032 | 5.4 miles | 100.0% | 5.0 Yrs | 126,672 | $9.35 | NAV | NNN |
35 State Street 35 State Street Moonacie, NJ | 1967/NAP | 106,841 | 8.3 miles | 100.0% | 10.0 Yrs | 106,841 | $9.50 | NAV | NNN |
Elizabeth Seaport Building 10 North Avenue E Elizabeth, NJ | 2017/NAP | 204,176 | 5.6 miles | 100.0% | 7.0 Yrs | 114,950 | $12.25 | NAV | NNN |
Jersey City Warehouse 25 Colony Road Jersey City, NJ | 2004/NAP | 340,848 | 5.4 miles | 100.0% | 10.3 Yrs | 340,849 | $9.00 | NAV | NNN |
| (1) | Information obtained from the appraisal. |
Escrows.
Real Estate Taxes – The lender did not require an upfront real estate tax reserve. Ongoing monthly real estate tax reserves will not be required as long as (i) no event of default has occurred or is continuing, (ii) the Operating Tenant is obligated to directly pay its required portion of the taxes prior to the due date, (iii) the Supor Operating Lease is in full force and effect, (iv) the Operating Tenant has paid (or caused to be paid) all taxes prior to the due date, (v) the Supor Industrial Portfolio Borrowers have provided (or caused to be provided) to the lender paid receipts or reasonable evidence of payment of taxes and (vi) no Operating Tenant Trigger Event (as defined below) has occurred or is continuing (collectively (i), (ii), (iii), (iv), (v) and (vi), the “Tax Waiver Conditions”). Notwithstanding the foregoing, for so long as the Tax Waiver Conditions are satisfied, the amount of monthly tax deposit will be reduced by the
THE INFORMATION IN THIS STRUCTURAL AND COLLATERAL TERM SHEET IS NOT COMPLETE AND MAY BE AMENDED PRIOR TO THE TIME OF SALE. THIS TERM SHEET IS NOT AN OFFER TO SELL THESE SECURITIES AND IT IS NOT A SOLICITATION OF AN OFFER TO BUY THESE SECURITIES IN ANY JURISDICTION WHERE THE OFFER OR SALE IS NOT PERMITTED.
43
| Industrial - Warehouse | Loan #1 | Cut-off Date Balance: | | $52,737,103 |
| 505 Manor Avenue and 500 | Supor Industrial Portfolio | Cut-off Date LTV: | | 54.5% |
| Supor Boulevard | | U/W NCF DSCR: | | 1.29x |
| Harrison, NJ 07029 | | U/W NOI Debt Yield: | | 8.1% |
percentage of taxes that Operating Tenant is obligated to directly pay under the Supor Operating Lease during the next ensuring 12 month period.
Insurance – The lender did not require an upfront insurance reserve. Ongoing monthly insurance reserves will not be required as long as (i) no event of default has occurred or is continuing, (ii) the Operating Tenant is obligated to directly pay its required portion of insurance premiums prior to the expiration of the policies, (iii) the Supor Operating Lease is in full force and effect, (iv) the Operating Tenant has paid (or caused to be paid) all insurance premiums prior to the expiration of the polices, (v) the Supor Industrial Portfolio Borrowers have provided (or caused to be provided) to the lender evidence that all insurance premiums have been paid and (vi) no Operating Tenant Trigger Event has occurred or is continuing (collectively, (i), (ii), (iii), (iv), (v) and (vi), the “Insurance Waiver Conditions”). Notwithstanding the foregoing, for so long as the Insurance Waiver Conditions are satisfied, the amount of monthly insurance deposit will be reduced by the percentage of insurance premiums that Operating Tenant is obligated to directly pay under the Supor Operating Lease during the next ensuring 12 month period.
Replacement Reserves – The lender did not require an upfront replacement reserve. Ongoing monthly replacement reserves of $5,147 will not be required as long as (i) no event of default has occurred or is continuing, (ii) the Operating Tenant is obligated to directly make and pay for all replacement reserves as required under the Supor Operating Lease, (iii) the Supor Operating Lease being in full force and effect, (iv) the Operating Tenant has made (or caused to be made) and paid (or caused to be paid) for all replacement reserves within the timeframe as set forth within the Supor Operating Lease, (v) the Supor Industrial Portfolio Borrowers has provided (or caused to be provided) to the lender that the replacement reserves have been performed and all costs associated with the replacement reserves have been paid and (vi) no Operating Tenant Trigger Event has occurred or is continuing (collectively, (i), (ii), (iii), (iv), (v) and (vi), the “Replacement Reserves Waiver Conditions”). Notwithstanding the foregoing, for so long as the Replacement Reserve Waiver Conditions is satisfied, the Supor Industrial Portfolio Borrowers will not be required to make monthly replacement reserve payments.
Lockbox and Cash Management.The Supor Industrial Portfolio Mortgage Loan has a springing lockbox with springing cash management. Upon the occurrence and continuance of a Cash Management Trigger Event (as defined below), the Supor Industrial Portfolio Borrowers are required to instruct the Operating Tenant to deposit rents and other amounts due into the lockbox account and funds in the lockbox account are required to be transferred to the cash management account within two business days. All funds in the cash management account are required to be applied on each monthly payment date in accordance with the related mortgage loan documents. Pursuant to the related mortgage loan documents, all excess funds on deposit (after payment of monthly reserve deposits, debt service payment and cash management bank fees) will be applied as follows: (a) to the extent a Cash Sweep Event (as defined below) does not exist, to the Supor Industrial Portfolio Borrowers, (b) if a Cash Sweep Event is in effect due to the existence of an Operating Tenant Trigger Event to the Operating Tenant Trigger TI/LC reserve account until the applicable Operating Tenant Trigger Event cure has occurred and (c) if a Cash Sweep Event is in effect, but an Operating Tenant Trigger Event is not in effect, then to the lender controlled excess cash flow account.
A “Cash Management Trigger Event” will commence upon the occurrence of the following:
| (i) | an event of default under the Supor Industrial Portfolio Mortgage Loan documents; |
| (ii) | a bankruptcy action of any of the Supor Industrial Portfolio Borrowers or the Supor Guarantor; |
| (iii) | at any time the Supor Industrial Portfolio Property is being managed by the property manager, any bankruptcy action of the property manager;provided that, a Cash Management Trigger Event will not occur if the Supor Industrial Portfolio Borrowers replaces the property manager with a qualified manager in accordance with the Supor Industrial Portfolio Mortgage Loan documents within 30 days of the filing of a bankruptcy filing against the property manager; |
| (iv) | a Cash Management DSCR Trigger Event (as defined below); or |
| (v) | an Operating Tenant Trigger Event (as defined below). |
A Cash Management Trigger Event will end upon the occurrence of:
| ● | with regard to clause (i) above, the cure of such event of default and acceptance of such cure by the lender; |
| ● | with regard to clause (ii) above, when such bankruptcy action petition has been discharged, stayed, or dismissed within 60 days of such filing among other conditions for the Supor Industrial Portfolio Borrowers or the Supor Guarantors; |
| ● | with regard to clause (iii) above, when such bankruptcy action petition has been discharged, stayed or dismissed within 120 days among other conditions for the property manager (and the Supor Industrial Portfolio Borrowers have replaced the property manager with a qualified property manager acceptable to the lender); |
| ● | with regard to clause (iv) above, the date the amortizing debt service coverage ratio based on the trailing 12-month period immediately preceding the date of such determination is greater than 1.25x for two consecutive quarters; and |
| ● | with regard to clause (v) above, an Operating Tenant Trigger Event Cure (as defined below). |
A “Cash Management DSCR Trigger Event” will occur on any day the debt service coverage ratio, based on the trailing 12-month period immediately preceding the date of determination, is less than 1.25x.
A “Cash Sweep Event” will commence upon the occurrence of the following:
| (i) | an event of default under the Supor Industrial Portfolio Mortgage Loan documents; |
| (ii) | a bankruptcy action of either of the Supor Industrial Portfolio Borrowers, either of the Supor Guarantors or the property manager,provided that, the Supor Industrial Portfolio Property is being managed by the property manager; |
THE INFORMATION IN THIS STRUCTURAL AND COLLATERAL TERM SHEET IS NOT COMPLETE AND MAY BE AMENDED PRIOR TO THE TIME OF SALE. THIS TERM SHEET IS NOT AN OFFER TO SELL THESE SECURITIES AND IT IS NOT A SOLICITATION OF AN OFFER TO BUY THESE SECURITIES IN ANY JURISDICTION WHERE THE OFFER OR SALE IS NOT PERMITTED.
44
| Industrial - Warehouse | Loan #1 | Cut-off Date Balance: | | $52,737,103 |
| 505 Manor Avenue and 500 | Supor Industrial Portfolio | Cut-off Date LTV: | | 54.5% |
| Supor Boulevard | | U/W NCF DSCR: | | 1.29x |
| Harrison, NJ 07029 | | U/W NOI Debt Yield: | | 8.1% |
| (iii) | a Cash Sweep DSCR Trigger Event (as defined below); or |
| (iv) | an Operating Tenant Trigger Event (as defined below). |
A Cash Sweep Event will end upon the occurrence of:
| ● | with regard to clause (i) above, the cure of such event of default and acceptance of such cure by the lender; |
| ● | with regard to clause (ii) above, when such bankruptcy action petition has been discharged, stayed, or dismissed within 60 days of such filing among other conditions for the Supor Industrial Portfolio Borrowers or either Supor Guarantor, and within 120 days for the property manager (or, solely with respect to the bankruptcy of the property manager, when the Supor Industrial Portfolio Borrowers have replaced the property manager with a qualified property manager acceptable to the lender); |
| ● | with regard to clause (iii) above, the date the amortizing debt service coverage ratio based on the trailing 12-month period immediately preceding the date of such determination is greater than 1.15x for two consecutive quarters; and |
| ● | with regard to clause (iv) above, an Operating Tenant Trigger Event Cure (as defined below). |
A “Cash Sweep DSCR Trigger Event” will occur on any day the debt service coverage ratio, based on the trailing 12-month period immediately preceding the date of determination, is less than 1.15x.
A “Operating Tenant Trigger Event” will occur upon any of the following with respect to the Operating Tenant and the Supor Operating Lease:
| (i) | the applicable Supor Operating Lease is terminated; |
| (ii) | an event of default occurs under the Supor Operating Lease; |
| (iii) | a bankruptcy action of the related Operating Tenant or any guarantors of the Supor Operating Lease occurs; or |
| (iv) | the related Operating Tenant discontinues its normal business operations at its leased premises (other than a temporary cessation of business operations for permitted renovations or necessary repairs). |
A “Operating Tenant Trigger Event Cure” will occur upon:
| ● | with regard to clause (i), above, the date an Operating Tenant Space Re-Tenanting Event (as defined below) has occurred; |
| ● | with regard to clause (ii) above, the cure of the applicable event of default under the related Supor Operating Lease as determined by the lender; |
| ● | with regard to clause (iii) above, the affirmation of the related Supor Operating Lease in the applicable bankruptcy proceeding,provided that the Operating Tenant is paying all rents and other amounts due under its lease; |
| ● | with regard to clause (iv) above, the related Operating Tenant re-commences its normal business operation at its leased premises or an Operating Tenant Space Re-Tenanting Event has occurred. |
A “Operating Tenant Space Re-Tenanting Event” will occur on the date each of the following conditions have been satisfied: (i) the Operating Tenant space has been leased to one or more replacement tenants (or the Operating Tenant) for a term of at least twenty (20) years on terms and conditions that acceptable to the lender, (ii) all tenant improvement costs, leasing commissions and other material costs and expensed related to the re-letting of the Operating Tenant space, if any, have been paid in full and (iii) the replacement tenant(s) have accepted the Operating Tenant Space and are paying full contractual rent as evidenced by a tenant estoppel certificate(s).
Property Management. The Supor Industrial Portfolio Property is managed by an affiliate of the Supor Industrial Portfolio Borrowers.
Partial Release. On or about May 15, 2020 the Supor Industrial Portfolio Borrowers obtained the free permitted release of a 4.9-acre parcel, which was located on a portion of the 500 Supor Boulevard parcel and is described in the related mortgage loan documents (the “Release Parcel”). The Release Parcel was excluded from the appraised value and the underwriting of the Supor Industrial Portfolio Mortgage Loan.
Real Estate Substitution.Not permitted.
Subordinate and Mezzanine Indebtedness.The owners of the direct or indirect equity interest in the Supor Industrial Portfolio Borrowers are permitted to incur mezzanine financing, upon satisfaction of certain terms and conditions including, among others (i) no event of default has occurred or is continuing, (ii) the mezzanine loan is junior and subordinate to the Supor Industrial Portfolio Mortgage Loan, (iii) the term of the mezzanine loan is coterminous with the Supor Industrial Portfolio Mortgage Loan, (iv) the mezzanine loan is a fixed rate loan, (v) the combined loan-to-value ratio does not exceed 55%, (vi) the combined debt service coverage ratio is not less than 1.29x, (vii) the debt service on the mezzanine loan is payable solely from excess cash flow remaining after required payments under the Supor Industrial Portfolio Mortgage Loan, (viii) the mezzanine lender has entered into an intercreditor agreement acceptable to the lender and (ix) the mezzanine lender delivers a rating agency confirmation to the lender.
Ground Lease. None.
Terrorism Insurance.The Supor Industrial Portfolio Mortgage Loan documents require that the “all risk” insurance policy required to be maintained by the Supor Industrial Portfolio Borrowers provides coverage for terrorism in an amount equal to the full replacement cost of the Supor Industrial Portfolio Property, as well as business interruption insurance covering no less than the 18-month period following the occurrence of a casualty event, together with a 6-month extended period of indemnity.
THE INFORMATION IN THIS STRUCTURAL AND COLLATERAL TERM SHEET IS NOT COMPLETE AND MAY BE AMENDED PRIOR TO THE TIME OF SALE. THIS TERM SHEET IS NOT AN OFFER TO SELL THESE SECURITIES AND IT IS NOT A SOLICITATION OF AN OFFER TO BUY THESE SECURITIES IN ANY JURISDICTION WHERE THE OFFER OR SALE IS NOT PERMITTED.
45
| Multifamily – Mid Rise | Loan #2 | Cut-off Date Balance: | | $52,348,530 |
50, 60 and 66, Franklin Street; 507-518
Main Street; 8-16 and 26 Portland Street | The Grid | Cut-off Date LTV: | | 67.4% |
| Worcester, MA 01608 | | U/W NCF DSCR: | | 1.41x |
| | | U/W NOI Debt Yield: | | 8.1% |
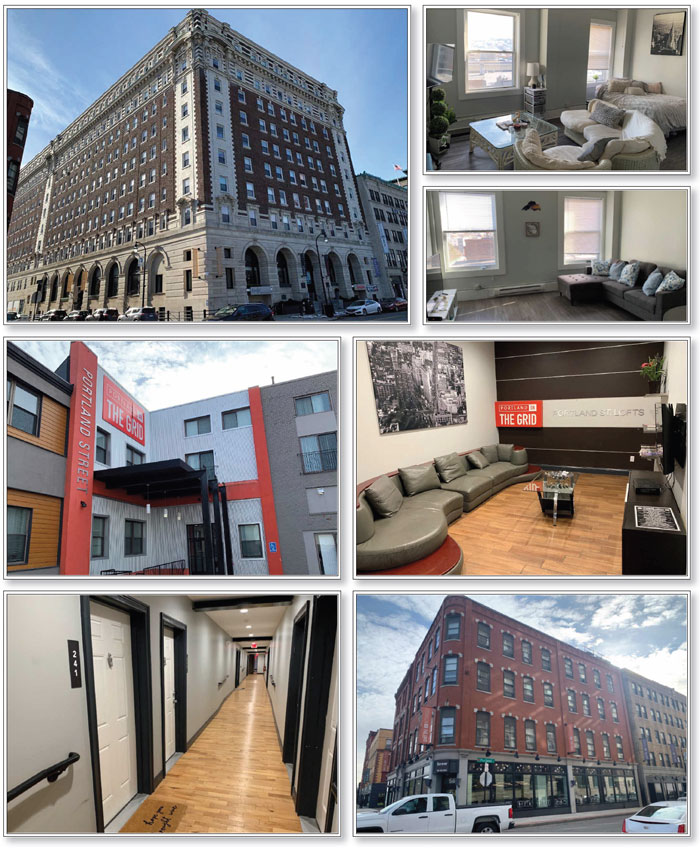
THE INFORMATION IN THIS STRUCTURAL AND COLLATERAL TERM SHEET IS NOT COMPLETE AND MAY BE AMENDED PRIOR TO THE TIME OF SALE. THIS TERM SHEET IS NOT AN OFFER TO SELL THESE SECURITIES AND IT IS NOT A SOLICITATION OF AN OFFER TO BUY THESE SECURITIES IN ANY JURISDICTION WHERE THE OFFER OR SALE IS NOT PERMITTED.
46
| Multifamily – Mid Rise | Loan #2 | Cut-off Date Balance: | | $52,348,530 |
50, 60 and 66, Franklin Street; 507-518
Main Street; 8-16 and 26 Portland Street | The Grid | Cut-off Date LTV: | | 67.4% |
| Worcester, MA 01608 | | U/W NCF DSCR: | | 1.41x |
| | | U/W NOI Debt Yield: | | 8.1% |
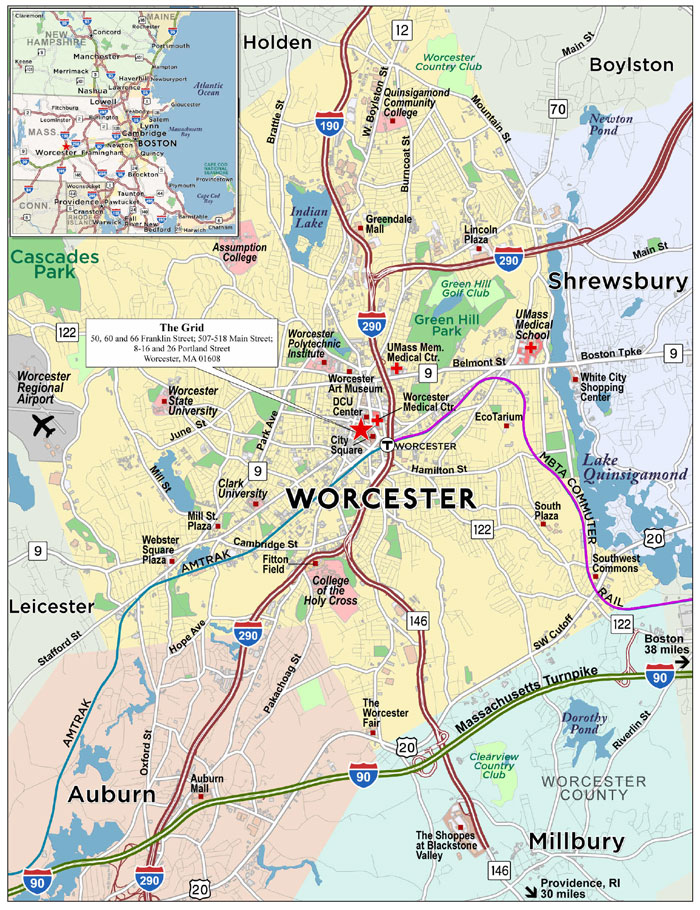
THE INFORMATION IN THIS STRUCTURAL AND COLLATERAL TERM SHEET IS NOT COMPLETE AND MAY BE AMENDED PRIOR TO THE TIME OF SALE. THIS TERM SHEET IS NOT AN OFFER TO SELL THESE SECURITIES AND IT IS NOT A SOLICITATION OF AN OFFER TO BUY THESE SECURITIES IN ANY JURISDICTION WHERE THE OFFER OR SALE IS NOT PERMITTED.
47
| No. 2 – The Grid |
| |
| Mortgage Loan Information | | Mortgaged Property Information |
| Mortgage Loan Seller: | Ladder Capital Finance LLC | | Single Asset/Portfolio: | Single Asset |
Credit Assessment (Fitch/KBRA/Moody’s): | NR/NR/NR | | Property Type – Subtype: | Multifamily – Mid Rise |
| Original Principal Balance(1): | $52,500,000 | | Location: | Worcester, MA |
| Cut-off Date Balance(1): | $52,348,530 | | Size: | 466 Units |
| % of Initial Pool Balance: | 7.2% | | Cut-off Date Balance Per Unit(1): | $144,432 |
| Loan Purpose: | Refinance | | Maturity Date Balance Per Unit(1): | $114,221 |
| Borrower Sponsor: | John McGrail | | Year Built/Renovated: | 1912/2017 |
| Guarantor: | John McGrail | | Title Vesting: | Fee |
| Mortgage Rate: | 3.8000% | | Property Manager: | Self-managed |
| Note Date: | March 11, 2020 | | Current Occupancy (As of)(3): | 98.5% (3/23/2020) |
| Seasoning: | 2 months | | YE 2019 Occupancy: | 97.6% |
| Maturity Date: | April 6, 2030 | | YE 2018 Occupancy: | 79.0% |
| IO Period: | 0 months | | YE 2017 Occupancy: | 77.0% |
| Loan Term (Original): | 120 months | | YE 2016 Occupancy: | 69.0% |
| Amortization Term (Original): | 360 months | | Appraised Value(3): | $99,800,000 |
| Loan Amortization Type: | Amortizing Balloon | | Appraised Value Per Unit: | $214,163 |
| Call Protection: | L(26),D(90),O(4) | | Appraisal Valuation Date: | March 1, 2020 |
| Lockbox Type: | Soft/Springing Cash Management | | Underwriting and Financial Information(3) |
| Additional Debt(1): | Yes | | TTM NOI (3/31/2020)(4): | $4,394,161 |
| Additional Debt Type (Balance)(1): | Pari Passu($14,956,723) | | YE 2019 NOI(4): | $3,329,641 |
| | | | YE 2018 NOI(4): | $1,967,388 |
| | | | YE 2017 NOI(4): | $443,629 |
| | | | U/W Revenues: | $8,830,546 |
| | | | U/W Expenses: | $3,347,813 |
| Escrows and Reserves(2) | | U/W NOI(4): | $5,482,733 |
| | Initial | Monthly | Cap | | U/W NCF: | $5,307,661 |
| Taxes | $45,793 | $45,793 | NAP | | U/W DSCR based on NOI/NCF(1): | 1.45x / 1.41x |
| Insurance | $187,521 | $23,440 | NAP | | U/W Debt Yield based on NOI/NCF(1): | 8.1% / 7.9% |
| TI/LC Reserve | $0 | $4,863 | NAP | | U/W Debt Yield at Maturity based on NOI/NCF(1): | 10.3% / 10.0% |
| Replacement Reserve | $0 | $9,708 | NAP | | Cut-off Date LTV Ratio(1): | 67.4% |
| Outstanding TI/LC Reserve | $162,500 | $0 | NAP | | LTV Ratio at Maturity(1): | 53.3% |
| | | | | | | |
| | | | | | | | |
| Sources and Uses |
| Sources | | | | | Uses | | | |
| Original whole loan amount | $67,500,000 | | 100.0% | | Loan payoff | $60,264,088 | | 89.3% |
| | | | | | Upfront reserves | 395,814 | | 0.6 |
| | | | | | Closing costs | 1,268,720 | | 1.9 |
| | | | | | Return of equity | 5,571,378 | | 8.3 |
| Total Sources | $67,500,000 | | 100.0% | | Total Uses | $67,500,000 | | 100.0% |
| (1) | The Cut-off Date Balance Per Unit, Maturity Date Balance Per Unit, U/W DSCR based on NOI/NCF, U/W Debt Yield based on NOI/NCF, U/W Debt Yield at Maturity based on NOI/NCF, Cut-off Date LTV Ratio and LTV Ratio at Maturity numbers presented above are based on The Grid Whole Loan (as defined below). |
| (2) | See “Escrows” section below. |
| (3) | See“Historical Occupancy”table and“COVID-19 Update”section below. All NOI, NCF and occupancy information, as well as the appraised value, were determined prior to the emergence of the novel coronavirus pandemic, and the economic disruption resulting from measures to combat the pandemic, and all DSCR, LTV and Debt Yield metrics were calculated, and The Grid Whole Loan was underwritten, based on such prior information. See “Risk Factors—Risks Related to Market Conditions and Other External Factors—The Coronavirus Pandemic Has Adversely Affected the Global Economy and Will Likely Adversely Affect the Performance of the Mortgage Loans” in the Preliminary Prospectus. |
| (4) | See “Cash Flow Analysis” table below for an explanation on the increase in NOI from 2017 to U/W. |
The Mortgage Loan. The mortgage loan is part of a whole loan (“The Grid Whole Loan”) that is evidenced by threepari-passupromissory notes in the aggregate original principal amount of $67,500,000. The Grid Whole Loan is secured by a first priority mortgage encumbering the fee interest in a five building multifamily property, with approximately 60,000 square feet of ground floor commercial space, located in Worcester, Massachusetts (“The Grid Property”). The controlling Note A-1 and non-controlling Note A-2, with an aggregate original principal balance of $52,500,000 (“The Grid Mortgage Loan”), will be included in the WFCM 2020-C56 securitization trust. The non-controlling Note A-3, with an original principal balance of $15,000,000, is expected to be contributed to one or more future securitization trusts. The Grid Whole Loan will be serviced pursuant to the pooling and servicing agreement for the WFCM 2020-C56 securitization trust. See “Description of the Mortgage Pool—The Whole Loans—The Serviced Pari Passu Whole Loans” and “Pooling and Servicing Agreement” in the Preliminary Prospectus.
THE INFORMATION IN THIS STRUCTURAL AND COLLATERAL TERM SHEET IS NOT COMPLETE AND MAY BE AMENDED PRIOR TO THE TIME OF SALE. THIS TERM SHEET IS NOT AN OFFER TO SELL THESE SECURITIES AND IT IS NOT A SOLICITATION OF AN OFFER TO BUY THESE SECURITIES IN ANY JURISDICTION WHERE THE OFFER OR SALE IS NOT PERMITTED.
48
| Multifamily – Mid Rise | Loan #2 | Cut-off Date Balance: | | $52,348,530 |
50, 60 and 66, Franklin Street; 507-518
Main Street; 8-16 and 26 Portland Street | The Grid | Cut-off Date LTV: | | 67.4% |
| Worcester, MA 01608 | | U/W NCF DSCR: | | 1.41x |
| | | U/W NOI Debt Yield: | | 8.1% |
Note Summary
| Notes | Original Principal Balance | Cut-off Date
Balance | Note Holder | Controlling Interest |
| A-1 | $36,500,000 | $36,394,692 | WFCM 2020-C56 | Yes |
| A-2 | $16,000,000 | $15,953,838 | WFCM 2020-C56 | No |
| A-3 | $15,000,000 | $14,956,723 | LCF or an affiliate | No |
| Total | $67,500,000 | $67,305,253 | | |
The Borrower and Borrower Sponsor.The borrower is Grid Worcester Holdings, LLC (the “The Grid Borrower”), a Delaware limited liability company and single purpose entity with two independent directors. Legal counsel to The Grid Borrower delivered a non-consolidation opinion in connection with the origination of The Grid Whole Loan. The borrower sponsor and non-recourse carveout guarantor is John McGrail.
Mr. McGrail is the president and CEO of MG2 Group (“MG2”) and has over 25 years of experience in the construction and real estate industries. With a background in construction, he bought his first property in 1991 and founded a construction and remodeling business which expanded to include property maintenance and management. MG2 is a commercial real estate firm, specializing in multifamily development and owns six other properties in Massachusetts. MG2 began as an investment in a three-family home in Dorchester, Massachusetts more than 20 years ago and has grown into a vertically integrated commercial real estate investment and development company. The company focuses on value-add investments, acquiring vacant land or and buildings for redevelopment. MG2 handles all of the aspects of real estate investment process, including development, construction, and property management.
The borrower sponsor had been subject to past charges from the Massachusetts Attorney General, resulting in probation and fines. See“Description of the Mortgage Pool—Litigation and Other Considerations”in the Preliminary Prospectus. Additionally, the borrower sponsor experienced several past property foreclosures. See“Description of the Mortgage Pool—Loan Purpose; Default History, Bankruptcy Issues and Other Proceedings”in the Preliminary Prospectus.
The Property.The Grid Property is a 466-unit Class A multifamily development located in Worcester, Massachusetts. Constructed in 1912, renovated multiple times, most recently in 2017, and situated on a 5.0-acre site, The Grid Property contains five buildings that include 170 studio units, 246 one-bedroom units, 44 two-bedroom units, five three-bedroom units and one five-bedroom unit. There is also approximately 60,000 square feet of ground floor commercial space. The commercial space is largely occupied by restaurants and other food service tenants, which serve as amenities to residents and are leased generally to the borrower sponsor’s affiliates. Other tenants include Santander Bank and various local offices. The Grid Property is located in downtown Worcester directly across from Worcester Common and two blocks from Union Station, which provides direct commuter rail service to Boston and Amtrak service to New York. The Grid Property contains 262 surface parking spaces, resulting in a parking ratio of approximately 0.6 spaces per unit.
Common area amenities at The Grid Property include a complete renovated lobby, on-site business center and a 4,000 square foot fitness center.
According to the appraisal, the current ownership has completed approximately $57.3 million in renovations to the property in the last three years.
COVID-19 Update. As of the May 6, 2020 payment, the residential portion of The Grid Property was open and operating. Given the collection and reporting timing, The Grid Borrower is unable to determine the exact percentage of residential tenants who have not paid, but as of April 2020, the residential portion of The Grid Property was 90.8% occupied. As of early May, three commercial tenants representing 5.3% of U/W base rent asked for April 2020 rent deferrals. The Grid Borrower anticipates that all three tenants will make April’s deferred payment in June 2020. Most commercial tenants at The Grid Property are currently closed by government mandate. The May 2020 debt service payment for The Grid Mortgage Loan has been made by The Grid Borrower. As of the date hereof, The Grid Mortgage Loan is not subject to any modification or forbearance request. See “Description of the Mortgage Pool—COVID-19 Considerations” in the Preliminary Prospectus.
The following table presents certain information relating to the unit mix of The Grid Property:
Unit Mix Summary(1)
| Unit Type | Total
No. of
Units | % of
Total
Units | Average
Unit Size
(SF) | Average
Underwritten
Monthly Rent per Unit |
| Studio | 170 | 36.5% | 342 | $1,106 |
| 1 Bedroom / 1 Bathroom | 246 | 52.8% | 522 | $1,273 |
| 2 Bedroom / 1 Bathroom | 44 | 9.4% | 837 | $1,738 |
| 3 Bedroom / 1 Bathroom | 5 | 1.1% | 1,100 | $2,310 |
| 5 Bedroom / 5 Bathroom | 1 | 0.2% | 1,580 | $3,600 |
| Total/Weighted Average | 466 | 100.0% | 495 | $1,272 |
| (1) | Information obtained from the appraisal. |
THE INFORMATION IN THIS STRUCTURAL AND COLLATERAL TERM SHEET IS NOT COMPLETE AND MAY BE AMENDED PRIOR TO THE TIME OF SALE. THIS TERM SHEET IS NOT AN OFFER TO SELL THESE SECURITIES AND IT IS NOT A SOLICITATION OF AN OFFER TO BUY THESE SECURITIES IN ANY JURISDICTION WHERE THE OFFER OR SALE IS NOT PERMITTED.
49
| Multifamily – Mid Rise | Loan #2 | Cut-off Date Balance: | | $52,348,530 |
50, 60 and 66, Franklin Street; 507-518
Main Street; 8-16 and 26 Portland Street | The Grid | Cut-off Date LTV: | | 67.4% |
| Worcester, MA 01608 | | U/W NCF DSCR: | | 1.41x |
| | | U/W NOI Debt Yield: | | 8.1% |
The following table presents historical occupancy percentages at The Grid Property:
Historical Occupancy
12/31/2016(1)(2) | 12/31/2017(1)(2) | 12/31/2018(1)(2) | 12/31/2019(1)(2) | 3/23/2020(1)(3)(4) |
| 69.0% | 77.0% | 79.0% | 97.6% | 98.5% |
| (1) | The Grid Property also includes approximately 60,000 square feet of ground floor commercial space, which accounts for approximately 19.8% of Gross Potential Rent. The commercial component, which was 87.5% leased as of 3/23/2020, is not reflected in the occupancy percentages provided. |
| (2) | Information obtained from The Grid Borrower. |
| (3) | Information obtained from the underwritten rent roll. |
| (4) | See “COVID-19 Update” section above. |
Operating History and Underwritten Net Cash Flow. The following table presents certain information relating to the historical operating performance and underwritten net cash flow at The Grid Property:
Cash Flow Analysis
| | 2017(1) | 2018(1) | 2019(1) | TTM 3/31/ 2020(1) | U/W(2)(3) | %(4) | U/W $ per Unit |
| Base Rent | $3,740,297 | $5,691,000 | $6,302,407 | $7,171,453 | $8,579,596 | 91.6% | $18,411 |
| Grossed Up Vacant Space | 0 | 0 | 0 | 0 | 286,800 | 3.1 | 615 |
| Gross Potential Rent | $3,740,297 | $5,691,000 | $6,302,407 | $7,171,453 | $8,866,396 | 94.7% | $19,027 |
| Other Income(5) | 353,191 | 376,015 | 410,027 | 455,164 | 500,491 | 5.3 | 1,074 |
| Net Rental Income | $4,093,488 | $6,067,015 | $6,712,435 | $7,626,617 | $9,366,887 | 100.0% | $20,101 |
| (Vacancy) | 0 | 0 | 0 | 0 | (524,003)(6) | (5.9) | (1,124) |
| (Concessions & Credit Loss) | (203,865) | (503,859) | (111,773) | (72,286) | (12,338) | (0.1) | (26) |
| Effective Gross Income | $3,889,623 | $5,563,156 | $6,600,662 | $7,554,331 | $8,830,546 | 94.3% | $18,950 |
| | | | | | | | |
| Real Estate Taxes | 516,018 | 551,925 | 552,222 | 577,715 | 1,003,096 | 11.4 | 2,153 |
| Insurance | 232,217 | 195,296 | 221,630 | 228,521 | 281,282 | 3.2 | 604 |
| Management Fee | 116,689 | 166,895 | 198,020 | 226,630 | 264,916 | 3.0 | 568 |
| Other Operating Expenses | 2,581,070 | 2,681,652 | 2,299,149 | 2,127,305 | 1,798,519 | 20.4 | 3,859 |
| Total Operating Expenses | $3,445,994 | $3,595,768 | $3,271,021 | $3,160,170 | $3,347,813 | 37.9% | $7,184 |
| | | | | | | | |
| Net Operating Income | $443,629 | $1,967,388 | $3,329,641 | $4,394,161 | $5,482,733 | 62.1% | $11,766 |
| Capital Expenditures(7) | 0 | 0 | 0 | 0 | $175,072 | 2.0 | 376 |
| Net Cash Flow | $443,629 | $1,967,388 | $3,329,641 | $4,394,161 | $5,307,661 | 60.1% | $11,390 |
| | | | | | | | |
| NOI DSCR | 0.12x | 0.52x | 0.88x | 1.16x | 1.45x | | |
| NCF DSCR | 0.12x | 0.52x | 0.88x | 1.16x | 1.41x | | |
| NOI Debt Yield | 0.7% | 2.9% | 4.9% | 6.5% | 8.1% | | |
| NCF Debt Yield | 0.7% | 2.9% | 4.9% | 6.5% | 7.9% | | |
| (1) | In 2017 the borrower sponsor began renovating The Grid Property to market towards young professionals. During the renovation, there was a drop in units available, but the borrower sponsor was able to bring the occupancy from 77.0% in 2017 to 98.5% as of March 23, 2020. See “Historical Occupancy” table above. |
| (2) | The borrower sponsor signed 78 new residential unit leases in 2019 and received leases for Santander, Rake Nail Salon and Metro PCS bringing the total U/W occupancy to 94.1%. |
| (3) | For the avoidance of doubt, no COVID-19 specific adjustments have been incorporated in the lender U/W. |
| (4) | Represents (i) percent of Net Rental Income for all revenue fields, (ii) percent of Gross Potential Rent for Vacancy and Concessions & Credit Loss and (iii) percent of Effective Gross Income for all other fields. |
| (5) | Other Income primarily includes Parking Income and other miscellaneous income generated from late fees, laundry income, lease termination fees, pet rent fees, and storage income. |
| (6) | The underwritten economic vacancy is 5.9%. |
| (7) | Capital Expenditures includes $58,572 ($1.00 per square foot) of TI/LCs allocated to the commercial space at The Grid Property. |
THE INFORMATION IN THIS STRUCTURAL AND COLLATERAL TERM SHEET IS NOT COMPLETE AND MAY BE AMENDED PRIOR TO THE TIME OF SALE. THIS TERM SHEET IS NOT AN OFFER TO SELL THESE SECURITIES AND IT IS NOT A SOLICITATION OF AN OFFER TO BUY THESE SECURITIES IN ANY JURISDICTION WHERE THE OFFER OR SALE IS NOT PERMITTED.
50
| Multifamily – Mid Rise | Loan #2 | Cut-off Date Balance: | | $52,348,530 |
50, 60 and 66, Franklin Street; 507-518
Main Street; 8-16 and 26 Portland Street | The Grid | Cut-off Date LTV: | | 67.4% |
| Worcester, MA 01608 | | U/W NCF DSCR: | | 1.41x |
| | | U/W NOI Debt Yield: | | 8.1% |
Appraisal.The appraiser concluded to an “as-is” appraised value for The Grid Property of $99,800,000 as of March 1, 2020.
Environmental Matters. According to the Phase I environmental site assessment dated November 18, 2019, there was no evidence of any recognized environmental conditions at The Grid Property.
Market Overview and Competition.The Grid Property is located in downtown Worcester, Massachusetts directly across from Worcester Common and two blocks from Union Station, which provides direct commuter rail service to Boston and Amtrak service to New York City. Access to The Grid Property is also provided by the Route 9 (1.0 miles south), Route 20 (3.1 miles south), and the Massachusetts Turnpike (3.4 miles south). Worcester has a population of approximately 175,000 making Worcester New England’s second largest city behind Boston (40.0 miles west). According to a third-party market report, Worcester has approximately $2.4 billion of public and private investments underway or planned. Part of this large investment in downtown Worcester includes $30 million to add a 66,000 square foot Cancer and Wellness Center to Saint Vincent Hospital campus (0.4 miles north) and a $75 million investment to acquire and renovate the Mercantile Center, a 640,000 square foot office and retail complex located a block east of The Grid Property. UMass Memorial Health Care has executed a lease at the Mercantile Center for approximately 90,000 square feet of office space that will bring 700 UMass Memorial Health Care employees downtown. Worcester is currently spending $90 million to construct Polar Park (0.6 miles southwest), a 10,000 seat ballpark expected to be completed in 2021 which will house the Boston Red Sox’s AAA farm team.
According to a third-party market report Worcester has an average income of $95,679 and a median household income of $71,024, which is expected to increase by 13.2% over the next five years to reach a median household income of $80,408 by 2024.
Submarket Information – According to a third-party market research report, The Grid Property is situated within the metropolitan Worcester apartment submarket. As of the fourth quarter of 2019, the metropolitan Worcester apartment submarket reported a total inventory of 25,412 units with a 3.4% vacancy rate and an average asking rental rate of $1,455 per month.
Appraiser’s Competitive Set – The appraiser identified eight primary competitive properties for The Grid Property totaling 1,726 units, which reported an average occupancy rate of approximately 97.6%. The appraiser concluded to weighted average monthly market rents per unit at The Grid Property of $1,352 per unit (see “Market Rent Summary” table below).
Market Rent Summary(1)
| Unit Type | Total No. of
Units | Average Unit
Size (SF) | Market Monthly
Rent per Unit |
| Studio | 170 | 343 | $1,025-$1,450 |
| 1 Bedroom / 1 Bathroom | 246 | 518 | $1,250–$1,457 |
| 2 Bedroom / 1 Bathroom | 44 | 852 | $1,675-$1,950 |
| 3 Bedroom / 1 Bathroom | 5 | 1,100 | $2,425 |
| 5 Bedroom / 5 Bathroom | 1 | 1,580 | $3,775 |
| Total/Weighted Average | 466 | 495 | $1,352 |
| (1) | Information obtained from the appraisal. |
The following table presents certain information relating to comparable multifamily properties for The Grid Property:
Competitive Set(1)
| | The Grid
(Subject) | 145 Front at City Square | The
Skymark
Tower | Canal
Lofts | Junction
Shop
Lofts | Voke
Lofts | Audubon Plantation Ridge | Quinn 35 | Wexford
Village |
| Location | Worcester, MA | Worcester, MA | Worcester, MA | Worcester, MA | Worcester, MA | Worcester, MA | Worcester, MA | Shrewsbury, MA | Worcester, MA |
| Distance to Subject | -- | 0.3 miles | 0.2 miles | 0.6 miles | 0.5 miles | 1.0 miles | 3.4 miles | 3.6 miles | 2.9 miles |
| Property Type | Mid Rise | Mid Rise | High Rise | Mid Rise | Mid Rise | Mid Rise | Mid Rise | Mid Rise | Mid Rise |
| Year Built/Renovated | 1912/2017 | 2018/NAP | 1990/2000 | 1890/2011 | 2015/NAP | 2014/NAP | 2004/NAP | 2018/NAP | 1974/NAP |
| Number of Units | 466 | 365 | 196 | 64 | 173 | 84 | 330 | 250 | 264 |
| Average Monthly Rent (per unit) | | | | | | | | | |
| Studio | $725-$2,400 | $1,615-$1,680 | NAP | NAP | NAP | NAP | NAP | $1,635 | $1,271 |
| 1 Bedroom | $892-$2,525 | $1,785-$1,980 | $1,550-$1,650 | $1,240-$1,475 | $1,325- $1,625 | $1,695-$2,245 | $1,590-$1,690 | $1,865 | $1,339-$1,421 |
| | | | | | | | | | |
| 2 Bedroom | $1,400-$2,500 | $2,185-$2,750 | $1,495-1,815 | $1,580-$1,880 | $1,600-$1,650 | $2,139-$2,714 | $1,870-$1,955 | $2,260 | $1,652 |
| | | | | | | | | | |
| Occupancy | 98.5% | 98.0% | 96.0% | 100.0% | 94.0% | 98.0% | 99.0% | 98.0% | 98.0% |
| (1) | Information obtained from the appraisal and underwritten rent roll. |
THE INFORMATION IN THIS STRUCTURAL AND COLLATERAL TERM SHEET IS NOT COMPLETE AND MAY BE AMENDED PRIOR TO THE TIME OF SALE. THIS TERM SHEET IS NOT AN OFFER TO SELL THESE SECURITIES AND IT IS NOT A SOLICITATION OF AN OFFER TO BUY THESE SECURITIES IN ANY JURISDICTION WHERE THE OFFER OR SALE IS NOT PERMITTED.
51
| Multifamily – Mid Rise | Loan #2 | Cut-off Date Balance: | | $52,348,530 |
50, 60 and 66, Franklin Street; 507-518
Main Street; 8-16 and 26 Portland Street | The Grid | Cut-off Date LTV: | | 67.4% |
| Worcester, MA 01608 | | U/W NCF DSCR: | | 1.41x |
| | | U/W NOI Debt Yield: | | 8.1% |
Escrows.
Real Estate Taxes –The Grid Whole Loan documents require an upfront real estate tax reserve of $45,793 and ongoing monthly real estate tax reserves in an amount equal to one-twelfth of the real estate taxes that the lender estimates will be payable during the next twelve months (initially $45,793).
Insurance–The Grid Whole Loan documents require an upfront insurance reserve of $187,521 and ongoing monthly insurance reserves in an amount equal to one-twelfth of the insurance premiums that the lender estimates will be payable for the renewal of the coverage during the next twelve months (initially $23,440).
TI/LC Reserve –The Grid Whole Loan documents require ongoing monthly TI/LC reserves of $4,863.
Replacement Reserve –The Grid Whole Loan documents require ongoing monthly replacement reserves of $9,708.
Outstanding TI/LC Reserve –The Grid Whole Loan documents require an upfront reserve of $162,500 for certain outstanding approved leasing expenses under the lease with Santander Bank.
Lockbox and Cash Management. The Grid Whole Loan is structured with a soft lockbox, which is already in place, and springing cash management. Prior to the occurrence of a Cash Management Trigger Event (as defined below), The Grid Whole Loan documents require that The Grid Borrower or the property manager deposit all rents into the lockbox account within one business day of receipt and all funds in the lockbox account are required to be distributed to The Grid Borrower. During a Cash Management Trigger Event, funds in the lockbox account are required to be swept to a lender-controlled cash management account and all excess funds are required to be swept to an excess cash flow subaccount controlled by the lender.
A “Cash Management Trigger Event” will commence upon the earlier of the following:
| (i) | the occurrence and continuance of an event of default under The Grid Whole Loan; |
| (ii) | the occurrence and continuance of an event of default under the property management agreement beyond any notice or cure; or |
| (iii) | the net cash flow debt service coverage ratio falling below 1.15x. |
A “Cash Management Trigger Event” will end upon the occurrence of the following:
| ● | with regard to clause (i) above, the cure of such event of default; |
| ● | with regard to clause (ii) above, the date on which the default under the property management agreement has been cured or the date on which The Grid Borrower has entered into a replacement property management agreement with a qualified manager; or |
| ● | with regard to clause (iii) above, the net cash flow debt service coverage ratio being equal to or greater than 1.25x for one calendar quarter |
Property Management. The Grid Property is managed by Grid Management, LLC an affiliate of the borrower sponsor.
Partial Release.Not permitted.
Real Estate Substitution.Not permitted.
Subordinate and Mezzanine Indebtedness.Not permitted.
Ground Lease. None.
Terrorism Insurance. The Grid Whole Loan documents require that the “all risk” insurance policy required to be maintained by The Grid Borrower provide coverage for terrorism in an amount equal to the full replacement cost of The Grid Property, as well as business interruption insurance covering no less than the 18-month period following the occurrence of a casualty event, together with a six-month extended period of indemnity.
THE INFORMATION IN THIS STRUCTURAL AND COLLATERAL TERM SHEET IS NOT COMPLETE AND MAY BE AMENDED PRIOR TO THE TIME OF SALE. THIS TERM SHEET IS NOT AN OFFER TO SELL THESE SECURITIES AND IT IS NOT A SOLICITATION OF AN OFFER TO BUY THESE SECURITIES IN ANY JURISDICTION WHERE THE OFFER OR SALE IS NOT PERMITTED.
52
Office – CBD | Loan #3 | Cut-off Date Balance: | | $43,700,000 |
2323 Ross Avenue | KPMG Plaza at Hall Arts | Cut-off Date LTV: | | 46.6% |
Dallas, TX 75201 | | U/W NCF DSCR: | | 2.90x |
| | U/W NOI Debt Yield: | | 10.5% |

THE INFORMATION IN THIS STRUCTURAL AND COLLATERAL TERM SHEET IS NOT COMPLETE AND MAY BE AMENDED PRIOR TO THE TIME OF SALE. THIS TERM SHEET IS NOT AN OFFER TO SELL THESE SECURITIES AND IT IS NOT A SOLICITATION OF AN OFFER TO BUY THESE SECURITIES IN ANY JURISDICTION WHERE THE OFFER OR SALE IS NOT PERMITTED.
53
Office – CBD | Loan #3 | Cut-off Date Balance: | | $43,700,000 |
2323 Ross Avenue | KPMG Plaza at Hall Arts | Cut-off Date LTV: | | 46.6% |
Dallas, TX 75201 | | U/W NCF DSCR: | | 2.90x |
| | U/W NOI Debt Yield: | | 10.5% |
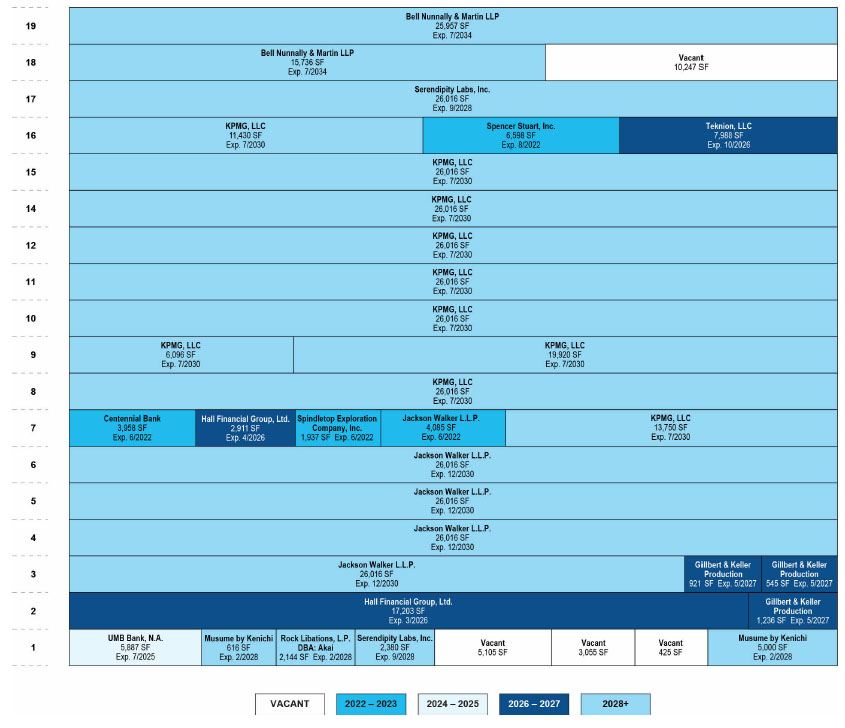
THE INFORMATION IN THIS STRUCTURAL AND COLLATERAL TERM SHEET IS NOT COMPLETE AND MAY BE AMENDED PRIOR TO THE TIME OF SALE. THIS TERM SHEET IS NOT AN OFFER TO SELL THESE SECURITIES AND IT IS NOT A SOLICITATION OF AN OFFER TO BUY THESE SECURITIES IN ANY JURISDICTION WHERE THE OFFER OR SALE IS NOT PERMITTED.
54
Office – CBD | Loan #3 | Cut-off Date Balance: | | $43,700,000 |
2323 Ross Avenue | KPMG Plaza at Hall Arts | Cut-off Date LTV: | | 46.6% |
Dallas, TX 75201 | | U/W NCF DSCR: | | 2.90x |
| | U/W NOI Debt Yield: | | 10.5% |

THE INFORMATION IN THIS STRUCTURAL AND COLLATERAL TERM SHEET IS NOT COMPLETE AND MAY BE AMENDED PRIOR TO THE TIME OF SALE. THIS TERM SHEET IS NOT AN OFFER TO SELL THESE SECURITIES AND IT IS NOT A SOLICITATION OF AN OFFER TO BUY THESE SECURITIES IN ANY JURISDICTION WHERE THE OFFER OR SALE IS NOT PERMITTED.
55
No. 3 – KPMG Plaza at Hall Arts |
|
Mortgage Loan Information | | Mortgaged Property Information |
Mortgage Loan Seller: | Column | | Single Asset/Portfolio: | Single Asset |
Credit Assessment (Fitch/KBRA/Moody’s): | NR/NR/NR | | Property Type – Subtype: | Office – CBD |
Original Principal Balance(1): | $43,700,000 | | Location: | Dallas, TX |
Cut-off Date Balance(1): | $43,700,000 | | Size(3): | 461,306 SF |
% of Initial Pool Balance: | 6.0% | | Cut-off Date Balance Per SF(1): | $242.14 |
Loan Purpose: | Acquisition | | Maturity Date Balance Per SF(1): | $242.14 |
Borrower Sponsor: | Masaveu Real Estate US, Delaware LLC | | Year Built/Renovated: | 2015/NAP |
Guarantor: | Masaveu Real Estate US, Delaware LLC | | Title Vesting: | Fee |
Mortgage Rate: | 3.4100% | | Property Manager: | Stream Realty Partners – DFW, L.P. |
Note Date: | December 23, 2019 | | Current Occupancy (As of)(1): | 95.9% (12/1/2019) |
Seasoning: | 5 months | | YE 2018 Occupancy: | 93.7% |
Maturity Date: | January 6, 2030 | | YE 2017 Occupancy: | 80.8% |
IO Period: | 120 months | | As-Is Appraised Value(1): | $239,800,000 |
Loan Term (Original): | 120 months | | As-Is Appraised Value Per SF(1): | $519.83 |
Amortization Term (Original): | NAP | | As-Is Appraisal Valuation Date: | November 25, 2019 |
Loan Amortization Type: | Interest-only, Balloon | | | |
Call Protection(1): | L(29),D(84),O(7) | | | |
Lockbox Type(2): | Hard/Springing Cash Management | | Underwriting and Financial Information(1) |
Additional Debt(1): | Yes | | TTM NOI (10/31/2019): | $11,227,183 |
Additional Debt Type (Balance)(1): | Pari Passu ($68,000,000) | | YE 2018 NOI: | $11,252,397 |
| | | YE 2017 NOI: | $11,700,496 |
| | | | |
| | | U/W Revenues: | $19,465,123 |
| | | U/W Expenses: | $7,713,107 |
Escrows and Reserves(2) | | U/W NOI(4): | $11,752,016 |
| Initial | Monthly | Cap | | U/W NCF: | $11,198,449 |
Taxes | $0 | Springing | NAP | | U/W DSCR based on NOI/NCF: | 3.04x / 2.90x |
Insurance | $0 | Springing | NAP | | U/W Debt Yield based on NOI/NCF: | 10.5% / 10.0% |
Replacement Reserve | $0 | Springing | NAP | | U/W Debt Yield at Maturity based on NOI/NCF: | 10.5% / 10.0% |
TI/LC Reserve | $0 | Springing | NAP | | Cut-off Date LTV Ratio: | 46.6% |
Unfunded Obligations Reserve(5) | $1,267,335 | $0 | NAP | | LTV Ratio at Maturity: | 46.6% |
| | | | | | |
| | | | | | | |
Sources and Uses |
Sources | | | | | Uses | | | |
Original whole loan | $111,700,000 | | 46.3% | | Purchase price(5) | $237,000,643 | | 98.2% |
Borrower sponsor equity | 129,719,402 | | 53.7 | | Closing costs | 3,151,424 | | 1.3 |
| | | | | Upfront reserves | 1,267,335 | | 0.5 |
Total Sources | $241,419,402 | | 100.0% | | Total Uses | $241,419,402 | | 100.0% |
(1) | The KPMG Plaza at Hall Arts Mortgage Loan (as defined below) is part of the KPMG Plaza at Hall Arts Whole Loan (as defined below), which comprises two pari passu notes with an aggregate original balance of $111,700,000. Cut-off Date Balance Per SF, Maturity Date Balance Per SF, U/W DSCR based on NOI/NCF, U/W Debt Yield based on NOI/NCF, U/W Debt Yield at Maturity based on NOI/NCF, Cut-off Date LTV Ratio and LTV Ratio at Maturity numbers presented above are based on the KPMG Plaza at Hall Arts Whole Loan. Notwithstanding the foregoing, all NOI, NCF and occupancy information, as well as the appraised value, were determined prior to the emergence of the novel coronavirus pandemic, and the economic disruption resulting from measures to combat the pandemic, and all DSCR, LTV and Debt Yield metrics were calculated, and the KPMG Plaza at Hall Arts Mortgage Loan was underwritten, based on such prior information. See “Risk Factors—Coronavirus Pandemic Has Adversely Affected the Global Economy and Will Likely Adversely Affect the Performance of the Mortgage Loans” in the Preliminary Prospectus. |
(2) | See “Escrows” section below. |
(3) | Includes 13,750 square feet of expansion space for KPMG LLP which had a lease start date of November 2019 and for which the tenant is expected to take occupancy in the summer of 2020. The unfunded obligations reserve includes 5 months of free rent for KPMG through May 2020 totaling $274,656. |
(4) | U/W NOI includes $333,243 in straight-line rent associated with the KPMG tenant and year one rent steps. |
(5) | The seller provided a credit to the purchase price in the amount of $1.3 million related to all outstanding TI/LC and free rent for KPMG, which was held in an upfront reserve at origination. |
THE INFORMATION IN THIS STRUCTURAL AND COLLATERAL TERM SHEET IS NOT COMPLETE AND MAY BE AMENDED PRIOR TO THE TIME OF SALE. THIS TERM SHEET IS NOT AN OFFER TO SELL THESE SECURITIES AND IT IS NOT A SOLICITATION OF AN OFFER TO BUY THESE SECURITIES IN ANY JURISDICTION WHERE THE OFFER OR SALE IS NOT PERMITTED.
56
Office – CBD | Loan #3 | Cut-off Date Balance: | | $43,700,000 |
2323 Ross Avenue | KPMG Plaza at Hall Arts | Cut-off Date LTV: | | 46.6% |
Dallas, TX 75201 | | U/W NCF DSCR: | | 2.90x |
| | U/W NOI Debt Yield: | | 10.5% |
The Mortgage Loan. The mortgage loan (the “KPMG Plaza at Hall Arts Mortgage Loan”) is part of a whole loan (the “KPMG Plaza at Hall Arts Whole Loan”) in the original principal balance of $111,700,000. The KPMG Plaza at Hall Arts Whole Loan is secured by a first priority fee mortgage encumbering a 461,306 square foot, Class A+, office tower located in Dallas, Texas (the “KPMG Plaza at Hall Arts Property”). The KPMG Plaza at Hall Arts Mortgage Loan is evidenced by the non-controlling promissory note A-2. The controlling promissory note A-1 was contributed to the CSAIL 2020-C19 securitization trust. The KPMG Plaza at Hall Arts Whole Loan will be serviced pursuant to the CSAIL 2020-C19 pooling and servicing agreement. See “Description of the Mortgage Pool—The Whole Loans—The Non-Serviced Pari Passu Whole Loans“ and “Pooling and Servicing Agreement —Servicing of the Non-Serviced Mortgage Loans” in the Preliminary Prospectus.
Note Summary
Notes | Original Principal Balance | Cut-off Date
Balance | Note Holder | Controlling Interest |
A-1 | $68,000,000 | $68,000,000 | CSAIL 2020-C19 | Yes |
A-2 | $43,700,000 | $43,700,000 | WFCM 2020-C56 | No |
Total | $111,700,000 | $111,700,000 | | |
The Borrower and Borrower Sponsor. The borrowing entity for the KPMG Plaza at Hall Arts Whole Loan is Masaveu Ross Avenue, LLC, a Delaware limited liability company (the “KPMG Plaza at Hall Arts Borrower”) and a special purpose entity with at least one independent director. Legal counsel to the KPMG Plaza at Hall Arts Borrower delivered a non-consolidation opinion in connection with the origination of the KPMG Plaza at Hall Arts Whole Loan. The KPMG Plaza at Hall Arts Borrower is 100% owned and managed by Corporación Masaveu S.A., a corporation domiciled in Spain.
The borrower sponsor and non-recourse carve-out guarantor is Masaveu Real Estate US, Delaware LLC, a subsidiary of Corporación Masaveu S.A. The borrower sponsor acquires, manages and owns real estate assets on behalf of Corporación Masaveu S.A. The borrower sponsor’s U.S. portfolio includes four office properties valued at over $720 million located across Washington D.C., Houston and Miami. As of June 30, 2019, the borrower sponsor reported a net worth of $392.3 million and liquidity of $27.5 million. The guarantor is required to maintain a minimum net worth of $150 million and minimum liquid assets of $7.5 million under the KPMG Plaza at Hall Arts Whole Loan documents.
The Property. The KPMG Plaza at Hall Arts Property is a 461,306 square foot, Class A+, LEED Gold Certified office tower located in Dallas, Texas. The KPMG Plaza at Hall Arts Property is an 18-story building constructed in 2015 and situated on a 1.6-acre site within the Dallas Arts District. The KPMG Plaza at Hall Arts Property is comprised of 442,259 square feet of office space and 19,047 square feet of restaurant and retail space. The KPMG Plaza at Hall Arts Property is 95.9% leased to a collection of 13 tenants with 10.3 years weighted average lease term remaining. The three largest tenants, KPMG LLP (“KPMG”), Jackson Walker L.L.P. (“Jackson Walker”) and Bell Nunnally & Martin LLP (“Bell Nunnally”), account for 77.4% of the net rentable area (“NRA”).
Pursuant to a license agreement (the “Parking Agreement”), the KPMG Plaza at Hall Arts Borrower has the right to use two subterranean parking garages connected below ground. The Parking Agreement provides the KPMG Plaza at Hall Arts Borrower with the right to use 1,266 priority spaces out of the total 2,098 parking spaces, of which 1,750 spaces are in the Hall Arts Garage and 348 are in the connected Cathedral Garage. The inter-connected parking garages are located under the Hall Arts Plaza and under the Cathedral Shrine of the Virgin Guadalupe, located across Crockett Street. The Parking Agreement expires in 2088 with respect to the Hall Arts Garage and in 2047 with respect to the Cathedral Garage. The Parking Agreement includes two automatic 25-year extensions with respect to the Cathedral Garage (unless such extensions are canceled by the Roman Catholic Diocese of Dallas which is the garage fee owner) which provide for extension to 2097. Additionally, the KPMG Plaza at Hall Arts Whole Loan documents include a recourse carveout for losses in the event that there is (a) any termination or cancellation of any superior interests in the parking garages that results in the loss by the KPMG Plaza at Hall Arts Borrower of a valid enforceable license to use the parking spaces or (b) any termination or cancellation of the Parking Agreement.
COVID-19 Update. As of May 4, 2020, the KPMG Plaza at Hall Arts Property is open, however most, if not all, tenants are working remotely. Occupancy at the KPMG Plaza at Hall Arts Property remains 97.1% as of the May 1, 2020 rent roll. The May debt service payment has been made. Tenants representing 98.0% of in-place base rent have paid rent for April 2020. As of May 8, 2020, tenants representing 92.6% of in-place base rent have paid rent for May 2020. Two restaurant tenants, representing approximately 1.5% of underwritten base rent, received rent assistance for April 2020. As of the date hereof, the KPMG Plaza at Hall Arts Whole Loan is not subject to any modification or forbearance request.
Major Tenants. The largest tenant at the KPMG Plaza at Hall Arts Property, KPMG, leases 207,292 square feet (44.9% of NRA) through July 2030 with three, five-year extension options remaining. KPMG has expanded its space twice since initial occupancy, most recently in November 2019. KPMG leases 207,292 square feet, with the most recent 13,750 square foot expansion lease commencing as of November 2019. KPMG is expected to take occupancy of the 13,750 square foot expansion space in the summer of 2020. KPMG was formed in 1987 and provides accounting, consulting, tax and legal, financial advisory and assurance services across 147 countries and territories. During the fiscal year of 2019, KPMG had 189,000 employees and generated $29.75 billion in revenue worldwide. KPMG strategically relocated from its previous Downtown Dallas office building into the Dallas Arts District in 2015 as part of a larger corporate real estate strategy focused on creating workplaces that are intended to recruit and retain top talent. KPMG reportedly grew its Dallas workforce by 20% in the first year at the KPMG Plaza at Hall Arts Property.
THE INFORMATION IN THIS STRUCTURAL AND COLLATERAL TERM SHEET IS NOT COMPLETE AND MAY BE AMENDED PRIOR TO THE TIME OF SALE. THIS TERM SHEET IS NOT AN OFFER TO SELL THESE SECURITIES AND IT IS NOT A SOLICITATION OF AN OFFER TO BUY THESE SECURITIES IN ANY JURISDICTION WHERE THE OFFER OR SALE IS NOT PERMITTED.
57
Office – CBD | Loan #3 | Cut-off Date Balance: | | $43,700,000 |
2323 Ross Avenue | KPMG Plaza at Hall Arts | Cut-off Date LTV: | | 46.6% |
Dallas, TX 75201 | | U/W NCF DSCR: | | 2.90x |
| | U/W NOI Debt Yield: | | 10.5% |
The second largest tenant at the KPMG Plaza at Hall Arts Property, Jackson Walker, leases 108,149 square feet (23.4% of NRA) through December 2030 (104,064 square feet) and June 2022 (4,085 square feet) with three, five-year extension options remaining. Jackson Walker is a Texas-based law firm with more than 360 attorneys. One of the largest law firms in Texas, Jackson Walker has seven offices across Texas and is headquartered at the KPMG Plaza at Hall Arts Property. Jackson Walker has been a tenant at the KPMG Plaza at Hall Arts Property since January 2016 and expanded into an additional 4,085 square feet in November 2018.
The third largest tenant at the KPMG Plaza at Hall Arts Property, Bell Nunnally, leases 41,693 square feet (9.0% of NRA) through July 2034 with two, five-year extension options remaining. Founded in 1980, Bell Nunnally is a full-service law firm that provides transactional and litigation services to a national and international client base ranging from start-up businesses to Fortune 500 companies. With over 60 attorneys, Bell Nunnally is among the 25 largest firms in North Texas and the 60 largest firms in Texas and has been a tenant at the KPMG Plaza at Hall Arts Property since June 2018.
The following table presents certain information relating to the tenancy at the KPMG Plaza at Hall Arts Property:
Major Tenants
Tenant Name | Credit
Rating
(Fitch/
Moody’s/
S&P) | Tenant
NRSF | % of
NRSF | Annual
U/W Base
Rent
PSF(1) | Annual
U/W Base
Rent(1) | % of Total
Annual
U/W Base
Rent | Lease
Expiration | Extension
Options | Term.
Option (Y/N) |
KPMG LLP(2) | NR / NR / NR | 207,292 | 44.9% | $40.33 | $8,359,219 | 44.8% | 7/26/2030 | 3, 5-year | Y |
Jackson Walker L.L.P.(3) | NR / NR / NR | 108,149 | 23.4% | $39.23 | $4,242,884 | 22.8% | 12/31/2030 | 3, 5-year | Y |
Bell Nunnally & Martin LLP(4) | NR / NR / NR | 41,693 | 9.0% | $50.67 | $2,112,668 | 11.3% | 7/31/2034 | 2, 5-year | Y |
Serendipity Labs, Inc. | NR / NR / NR | 28,396 | 6.2% | $48.20 | $1,368,687 | 7.3% | 9/30/2028 | 2, 5-year | N |
Hall Financial Group, Ltd.(5) | NR / NR / NR | 20,114 | 4.4% | $46.90 | $943,278 | 5.1% | 3/31/2026 | None | Y |
Teknion, LLC | NR / NR / NR | 7,988 | 1.7% | $51.58 | $412,021 | 2.2% | 10/31/2026 | None | N |
Spencer Stuart, Inc. | NR / NR / NR | 6,598 | 1.4% | $49.13 | $324,160 | 1.7% | 8/19/2022 | 1, 5-year | N |
UMB Bank, n.a. (6) | A / NR / A- | 5,887 | 1.3% | $48.12 | $283,292 | 1.5% | 7/8/2025 | 2, 5-year | N |
Musume by Kenichi | NR / NR / NR | 5,616 | 1.2% | $35.61 | $200,000 | 1.1% | 2/28/2028 | 2, 5-year | N |
Centennial Bank | NR / NR / NR | 3,958 | 0.9% | $47.39 | $187,570 | 1.0% | 6/30/2022 | 1, 5-year | N |
Gillbert & Keller Production | NR / NR / NR | 2,702 | 0.6% | $10.00 | $27,020 | 0.1% | 5/31/2027 | 2, 5-year | N |
Rock Libations, L.P. | NR / NR / NR | 2,144 | 0.5% | $40.00 | $85,760 | 0.5% | 2/8/2028 | 2, 5-year | N |
Spindletop Exploration Company, Inc. | NR / NR / NR | 1,937 | 0.4% | $50.72 | $98,236 | 0.5% | 6/30/2022 | None | N |
Total Major Tenants: | | 442,474 | 95.9% | $42.14 | $18,644,795 | 100.0% | | | |
Vacant Space(7) | | 18,832 | 4.1% | | | | | | |
Collateral Total | | 461,306 | 100.0% | | | | | | |
| | | | | | | | | |
(1) | Based on the underwritten rent roll, including rent increases occurring through January 2021. |
(2) | KPMG’s rent was underwritten on a straight-line basis. KPMG has a one-time right to terminate its lease for its entire space effective July 2025 with twelve months’ notice and an estimated termination fee of $12.8 million. KPMG also has an option to reduce its leased space by up to 26,094 square feet or one full floor effective July 2025 with twelve months’ notice and estimated contraction fees of $593,000 if it vacates the 16th floor only, or $781,000 if it vacates the 7th floor only. |
(3) | Jackson Walker has a one-time right to terminate its lease effective January 2027 with twelve months’ notice (applicable to 104,064 square feet) and an estimated termination fee of $3.6 million. Alternatively, if Jackson Walker chooses not to exercise the termination option on its original space (104,064 square feet), it will also have an option to reduce its space by up to one full floor effective January 2027 with twelve months’ notice and an estimated contraction fee of $904,000. Jackson Walker has lease expirations in December 2030 (104,064 SF) and June 2022 (4,085 SF). |
(4) | Bell Nunnally has a one-time right to terminate its lease effective July 31, 2029 with twelve months’ notice with an estimated termination fee of $4.0 million. |
(5) | Hall Financial Group, Ltd. has an ongoing termination option effective any time after November 15, 2020 upon 30 days’ notice for Suite 730. The tenant has an ongoing termination option for Suite 200. |
(6) | Ratings provided are for UMB Bank Financial Corporation, which is the guarantor on the lease. |
(7) | Vacant Space includes dark space. |
THE INFORMATION IN THIS STRUCTURAL AND COLLATERAL TERM SHEET IS NOT COMPLETE AND MAY BE AMENDED PRIOR TO THE TIME OF SALE. THIS TERM SHEET IS NOT AN OFFER TO SELL THESE SECURITIES AND IT IS NOT A SOLICITATION OF AN OFFER TO BUY THESE SECURITIES IN ANY JURISDICTION WHERE THE OFFER OR SALE IS NOT PERMITTED.
58
Office – CBD | Loan #3 | Cut-off Date Balance: | | $43,700,000 |
2323 Ross Avenue | KPMG Plaza at Hall Arts | Cut-off Date LTV: | | 46.6% |
Dallas, TX 75201 | | U/W NCF DSCR: | | 2.90x |
| | U/W NOI Debt Yield: | | 10.5% |
The following table presents certain information relating to the lease rollover schedule at the KPMG Plaza at Hall Arts Property:
Lease Expiration Schedule(1)
Year Ending
December 31, | No.
of Leases
Expiring(2) | Expiring
NRSF(2) | % of
Total
NRSF | Cumulative
Expiring
NRSF | Cumulative
% of Total
NRSF | Annual
U/W
Base Rent | % of Total
Annual U/W
Base Rent | Annual U/W
Base Rent PSF |
MTM | 0 | 0 | 0.0% | 0 | 0.0% | $0 | 0.0% | $0.00 |
2020 | 0 | 0 | 0.0% | 0 | 0.0% | $0 | 0.0% | $0.00 |
2021 | 0 | 0 | 0.0% | 0 | 0.0% | $0 | 0.0% | $0.00 |
2022 | 4 | 16,578 | 3.6% | 16,578 | 3.6% | $805,800 | 4.3% | $48.61 |
2023 | 0 | 0 | 0.0% | 16,578 | 3.6% | $0 | 0.0% | $0.00 |
2024 | 0 | 0 | 0.0% | 16,578 | 3.6% | $0 | 0.0% | $0.00 |
2025 | 1 | 5,887 | 1.3% | 22,465 | 4.9% | $283,292 | 1.5% | $48.12 |
2026 | 2 | 28,102 | 6.1% | 50,567 | 11.0% | $1,355,299 | 7.2% | $48.23 |
2027 | 1 | 2,702 | 0.6% | 53,269 | 11.5% | $27,020 | 0.1% | $10.00 |
2028 | 3 | 36,156 | 7.8% | 89,425 | 19.4% | $1,654,447 | 8.8% | $45.76 |
2029 | 0 | 0 | 0.0% | 89,425 | 19.4% | $0 | 0.0% | $0.00 |
2030 | 2 | 311,356 | 67.5% | 400,781 | 86.9% | $12,406,268 | 65.7% | $39.85 |
2031 & Beyond | 1 | 41,693 | 9.0% | 442,474 | 95.9% | $2,112,668 | 11.2% | $50.67 |
Dark(3) | 1 | 5,530 | 1.2% | 448,004 | 97.1% | $226,730 | 1.2% | $41.00 |
Vacant | NAP | 13,302 | 2.9% | 461,306 | 100.0% | $0 | 0.0% | $0.00 |
Total | 15 | 461,306 | 100.0% | | | $18,871,525(4) | 100.0% | $42.12(4) |
| (1) | Based on the underwritten rent roll. Rent includes base rent and rent increases occurring through January 2021. |
| (2) | Certain tenants have more than one lease. In addition, certain tenants may have lease termination options that are exercisable prior to the originally stated expiration date. |
| (3) | The Stephan Pyles restaurant space became dark in January 2020. |
| (4) | Total includes dark space but excludes vacant space. |
The following table presents historical occupancy percentages at the KPMG Plaza at Hall Arts Property:
Historical Occupancy(1)
12/31/2017(2) | | 12/31/2018(2) | | 12/1/2019(3) |
80.8% | | 93.7% | | 95.9% |
(1) | Historical Occupancy based on the date that each of the leases commenced. |
(2) | Information obtained from the KPMG Plaza at Hall Arts Borrower. |
(3) | Based on the December 2019 underwritten rent roll. |
THE INFORMATION IN THIS STRUCTURAL AND COLLATERAL TERM SHEET IS NOT COMPLETE AND MAY BE AMENDED PRIOR TO THE TIME OF SALE. THIS TERM SHEET IS NOT AN OFFER TO SELL THESE SECURITIES AND IT IS NOT A SOLICITATION OF AN OFFER TO BUY THESE SECURITIES IN ANY JURISDICTION WHERE THE OFFER OR SALE IS NOT PERMITTED.
59
Office – CBD | Loan #3 | Cut-off Date Balance: | | $43,700,000 |
2323 Ross Avenue | KPMG Plaza at Hall Arts | Cut-off Date LTV: | | 46.6% |
Dallas, TX 75201 | | U/W NCF DSCR: | | 2.90x |
| | U/W NOI Debt Yield: | | 10.5% |
Operating History and Underwritten Net Cash Flow. The following table presents certain information relating to the underwritten net cash flow at the KPMG Plaza at Hall Arts Property:
Cash Flow Analysis
| 2017 | | 2018 | | TTM
10/31/2019 | | U/W(1)(2) | | %(3) | | U/W $ PSF |
Base Rent | $17,500,290 | | $17,704,659 | | $17,663,797 | | $18,871,525 | | 92.2% | | $40.91 |
Vacant Income | 0 | | 0 | | 0 | | 581,341 | | 2.8 | | 1.26 |
Gross Potential Rent | $17,500,290 | | $17,704,659 | | $17,663,797 | | $19,452,865 | | 95.1% | | $42.17 |
Total Reimbursements | 603,996 | | 704,874 | | 1,069,844 | | 1,010,380 | | 4.9 | | 2.19 |
Net Rental Income | $18,104,286 | | $18,409,533 | | $18,733,641 | | $20,463,246 | | 100.0% | | $44.36 |
Other Income | 13,204 | | 53,441 | | 56,662 | | 25,040 | | 0.1 | | 0.05 |
(Vacancy/Collection Loss) | 0 | | 0 | | 0 | | (1,023,162) | | (5.0) | | (2.22) |
Effective Gross Income | $18,117,490 | | $18,462,974 | | $18,790,303 | | $19,465,123 | | 95.1% | | $42.20 |
Total Expenses | $6,416,994 | | $7,210,577 | | $7,563,120 | | $7,713,107 | | 39.6% | | $16.72 |
Net Operating Income | $11,700,496 | | $11,252,397 | | $11,227,183 | | $11,752,016 | | 60.4% | | $25.48 |
TI/LC | 0 | | 0 | | 0 | | 461,306 | | 2.4 | | 1.00 |
Replacement Reserves | 0 | | 0 | | 0 | | 92,261 | | 0.5 | | 0.20 |
Net Cash Flow | $11,700,496 | | $11,252,397 | | $11,227,183 | | $11,198,449 | | 57.5% | | $24.28 |
| | | | | | | | | | | |
NOI DSCR | 3.03x | | 2.91x | | 2.91x | | 3.04x | | | | |
NCF DSCR | 3.03x | | 2.91x | | 2.91x | | 2.90x | | | | |
NOI Debt Yield | 10.5% | | 10.1% | | 10.1% | | 10.5% | | | | |
NCF Debt Yield | 10.5% | | 10.1% | | 10.1% | | 10.0% | | | | |
| (1) | U/W Base Rent includes $333,243 in straight-line rent associated with the KPMG tenant and rent steps through January 2021. |
| (2) | For the avoidance of doubt, no COVID-19 specific adjustments have been incorporated in the lender U/W. |
| (3) | Represents percent of Net Rental Income for all revenue lines and represents percent of Effective Gross Income for the remainder of fields. |
Appraisal. The appraiser concluded to an “as-is” Appraised Value for the KPMG Plaza at Hall Arts Property of $239,800,000 as of November 25, 2019.
Environmental Matters. According to the Phase I environmental site assessment dated August 2, 2019, there was no evidence of any recognized environmental conditions at the KPMG Plaza at Hall Arts Property.
Market Overview and Competition. The KPMG Plaza at Hall Arts Property is located in the Dallas Arts District, which falls within the Dallas central business district (“CBD”) submarket and is also considered to be part of the Uptown/Turtle Creek office submarket. The transformation of the Dallas Arts District began in 2012 upon the completion of Klyde Warren Park, a 5.2-acre urban green space built over the recessed Woodall Rodgers Freeway between Pearl and St. Paul streets. Klyde Warren Park provides an expansive pedestrian-friendly green space that bridges the gap between the Dallas Arts District and the Uptown area. According to a third-party market data provider, Ross Avenue is now commonly viewed as the new boundary for the Uptown/CBD office markets, with some of the most valuable land in the overall market area now located at this intersection. As a result, the Dallas Arts District office buildings compete with the Uptown submarket for tenants. The Uptown submarket is one of the better performing submarkets in Dallas and is more reflective of the Dallas Arts District location.
According to a third-party market research provider, as of the third quarter of 2019, the Uptown submarket has a total inventory of 16.0 million square feet with rental rates of $42.30 per square foot, representing the highest asking rates across the Dallas submarkets. The Uptown submarket has a vacancy rate of 13.2% and a positive net absorption of 81,470 square feet. The competitive set per the appraisal includes five properties ranging in occupancy from 80.0% to 98.0%, with a weighted average occupancy of 86.9%. The unadjusted asking rents per square foot for office space range from $26.50 to $41.00 per square foot (NNN), with a weighted average of $31.90 per square foot (NNN). Based on the appraiser’s concluded market rents of $48.50 per square foot (NNN) for office space and $40.00 per square foot (NNN) for retail space, the KPMG Plaza at Hall Arts Property’s weighted average underwritten rents are 12.5% and 25.3% below market for office and retail space, respectively.
THE INFORMATION IN THIS STRUCTURAL AND COLLATERAL TERM SHEET IS NOT COMPLETE AND MAY BE AMENDED PRIOR TO THE TIME OF SALE. THIS TERM SHEET IS NOT AN OFFER TO SELL THESE SECURITIES AND IT IS NOT A SOLICITATION OF AN OFFER TO BUY THESE SECURITIES IN ANY JURISDICTION WHERE THE OFFER OR SALE IS NOT PERMITTED.
60
Office – CBD | Loan #3 | Cut-off Date Balance: | | $43,700,000 |
2323 Ross Avenue | KPMG Plaza at Hall Arts | Cut-off Date LTV: | | 46.6% |
Dallas, TX 75201 | | U/W NCF DSCR: | | 2.90x |
| | U/W NOI Debt Yield: | | 10.5% |
The following table presents certain information relating to the appraiser’s market rent conclusions for the KPMG Plaza at Hall Arts Property:
Market Rent Summary(1)
| Office Space | Restaurant/Retail |
NRA (SF) | 445,314 | 15,992 |
Market Rent (PSF) | $47.00 - $49.50 | $38.00 - $42.00 |
Lease Term (Years) | 10 years | 10 years |
Lease Type (Reimbursements) | Base Yr. + Elect | NNN |
Rent Increase Projection | 1%/yr. | $0.50/SF/yr. |
(1) | Information obtained from the appraisal. |
The table below presents certain information relating to comparable sales pertaining to the KPMG Plaza at Hall Arts Property identified by the appraiser:
Comparable Sales(1)
Property Name | Location | Rentable Area (SF) | Sale Date | Actual Sale Price | Adjusted Sale Price | Sale Price (PSF) |
2000 McKinney Office Building | Dallas, TX | 447,595 | Aug-16 | $226,000,000 | $226,000,000 | $505 |
17Seventeen McKinney | Dallas, TX | 369,017 | Sep-16 | $190,000,000 | $190,000,000 | $515 |
2525 McKinnon Office | Dallas, TX | 111,722 | Jan-17 | $46,800,000 | $46,800,000 | $419 |
The Berkshire Office Building | Dallas, TX | 188,920 | Sep-17 | $68,500,000 | $72,490,000 | $384 |
1900 Pearl | Dallas, TX | 261,400 | Apr-17 | $181,500,000 | $181,500,000 | $694 |
Cawley Fourteen 555 Center | Dallas, TX | 258,743 | Sep-17 | $103,000,000 | $104,896,790 | $405 |
| (1) | Information obtained from the appraisal. |
The following tables present certain information relating to comparable office leases for the KPMG Plaza at Hall Arts Property:
Comparable Leases(1)
Property Name/Location | Year Built/ Renovated | NRA (SF) | Distance from Subject | Occupancy | Tenant | Tenant Size (SF) | Lease Start Date | Lease Term (YRS) | Annual Base Rent PSF | Lease Type |
One Arts Plaza 1722 Routh Street, Dallas, TX | 2007 | 530,236 | 0.4 miles | 95% | West Monroe Partners | 11,767 | Jan-19 | 7.5 | $30.00 $25.66 | NNN |
| | | | | | | | | | | |
JP Morgan Chase Tower 2200 Ross Avenue, Dallas, TX | 1987 | 1,253,343 | 0.4 miles | 80% | Gordon Rees, et al Savills Studley Ron Haddock Interests | 9,213 8,131 826 | Nov-18 Feb-18 Sep-17 | 12.5 7.8 3.2 | $34.50 $38.00 $37.00 | NNN |
| | | | | | | | | | | |
1900 Pearl 1900 North Pearl Street, Dallas, TX | 2018 | 261,400 | 0.2 miles | 90% | Quoted | --- | --- | --- | $41.00 | NNN |
| | | | | | | | | | | |
2100 McKinney 2100 McKinney Avenue, Dallas, TX | 1999 | 360,859 | 0.0 miles | 98% | TPG 6TH Vess Benchmark Bank Lobby | 17,500 4,200 1,208 | Jun-19 May-19 Dec-17 | 7.0 7.0 6.0 | $40.25 $37.00 $39.14 | NNN |
| | | | | | | | | | | |
Rosewood Court 2101 Cedar Springs, Dallas, TX | 2008 | 405,291 | 0.2 miles | 86% | Greenhill Legacy Exploration | 15,400 4,192 | Oct-18 Oct-18 | 7.0 10.3 | $35.77 $38.42 | NNN |
| (1) | Information obtained from the appraisal. |
Escrows. At origination, the KPMG Plaza at Hall Arts Borrower deposited into escrow $1,267,335 for outstanding TI/LCs and free rent related to the KPMG expansion space.
Real Estate Taxes Reserve – The requirement to make monthly deposits of 1/12th of the annual estimated tax payments into the tax reserve account is waived unless a Cash Sweep Period (as defined below) is continuing.
THE INFORMATION IN THIS STRUCTURAL AND COLLATERAL TERM SHEET IS NOT COMPLETE AND MAY BE AMENDED PRIOR TO THE TIME OF SALE. THIS TERM SHEET IS NOT AN OFFER TO SELL THESE SECURITIES AND IT IS NOT A SOLICITATION OF AN OFFER TO BUY THESE SECURITIES IN ANY JURISDICTION WHERE THE OFFER OR SALE IS NOT PERMITTED.
61
Office – CBD | Loan #3 | Cut-off Date Balance: | | $43,700,000 |
2323 Ross Avenue | KPMG Plaza at Hall Arts | Cut-off Date LTV: | | 46.6% |
Dallas, TX 75201 | | U/W NCF DSCR: | | 2.90x |
| | U/W NOI Debt Yield: | | 10.5% |
Insurance Reserve – The requirement to make monthly deposits of 1/12th of the estimated insurance premiums into the insurance reserve account is waived unless a Cash Sweep Period is continuing.
Replacement Reserves – During the continuance of a Cash Sweep Period, on a monthly basis, the KPMG Plaza at Hall Arts Borrower is required to deposit $7,688 ($0.20 per rentable square feet annually).
Rollover Reserves – During the continuance of a Cash Sweep Period, on a monthly basis, the KPMG Plaza at Hall Arts Borrower is required to deposit $38,442 ($1.00 per rentable square feet annually).
Lockbox and Cash Management. The KPMG Plaza at Hall Arts Whole Loan is structured with a hard lockbox with springing cash management upon a Cash Sweep Period. At origination, the KPMG Plaza at Hall Arts Borrower and property manager were required to send direction letters to tenants instructing them to deposit all rents and payments into the lockbox account controlled by the lender. All funds in the lockbox account are required to be remitted to the KPMG Plaza at Hall Arts Borrower on a daily basis in the absence of a Cash Sweep Period. During the continuance of a Cash Sweep Period, all excess cash flow, after payments made in accordance with the KPMG Plaza at Hall Arts Whole Loan documents for, amongst other things, debt service, required reserves and operating expenses, will be held as additional collateral for the KPMG Plaza at Hall Arts Mortgage Loan.
A “Cash Sweep Period” means the occurrence of: (a) an event of default, (b) any bankruptcy action of the KPMG Plaza at Hall Arts Borrower or any affiliated or non-affiliated property manager, (c) the debt yield falling below 6.5% for the immediately preceding calendar quarter based upon the preceding trailing 12 month period, or (d) a Parking Agreement Trigger occurs.
A “Parking Agreement Trigger” means the occurrence of (a) a breach or default by the KPMG Plaza at Hall Arts Borrower under any condition or obligation contained in the Parking Agreement, (b) any event or condition that gives parking landlord a right to terminate or cancel the Parking Agreement, or (c) the modification, termination or cancellation of the Parking Agreement without the prior written consent of the lender.
Property Management. The KPMG Plaza at Hall Arts Property is managed by Stream Realty Partners – DFW, L.P., a commercial real estate service company that specializes in property management, leasing and investment sales. With over 173 million square feet of office, industrial, retail and healthcare assignments, the company participates in over $2.9 billion in transactions annually. Founded in 1996, Stream Realty Partners has over 850 real estate professionals in twelve major markets across the United States, including Austin, Dallas, Fort Worth, Houston and San Antonio. In the Dallas/Fort Worth Market, Stream Realty Partners manages over 46 million square feet with 114 property management employees and 370 total dedicated team members.
Partial Release. Not permitted.
Real Estate Substitution. Not permitted.
Subordinate and Mezzanine Indebtedness. Not permitted.
Ground Lease. None.
Terrorism Insurance. The KPMG Plaza at Hall Arts Whole Loan documents require that the “all risk” insurance policy required to be maintained by the KPMG Plaza at Hall Arts Borrower provides coverage for terrorism in an amount equal to the full replacement cost of the KPMG Plaza at Hall Arts Property, together with a 12-month extended period of indemnity.
THE INFORMATION IN THIS STRUCTURAL AND COLLATERAL TERM SHEET IS NOT COMPLETE AND MAY BE AMENDED PRIOR TO THE TIME OF SALE. THIS TERM SHEET IS NOT AN OFFER TO SELL THESE SECURITIES AND IT IS NOT A SOLICITATION OF AN OFFER TO BUY THESE SECURITIES IN ANY JURISDICTION WHERE THE OFFER OR SALE IS NOT PERMITTED.
62
Multifamily - Student Housing | Loan #4 | Cut-off Date Balance: | | $42,000,000 |
2539 Telegraph Avenue | Panoramic Berkeley | Cut-off Date LTV: | | 56.2% |
Berkeley, CA 94704 | | U/W NCF DSCR: | | 2.25x |
| | U/W NOI Debt Yield: | | 8.8% |
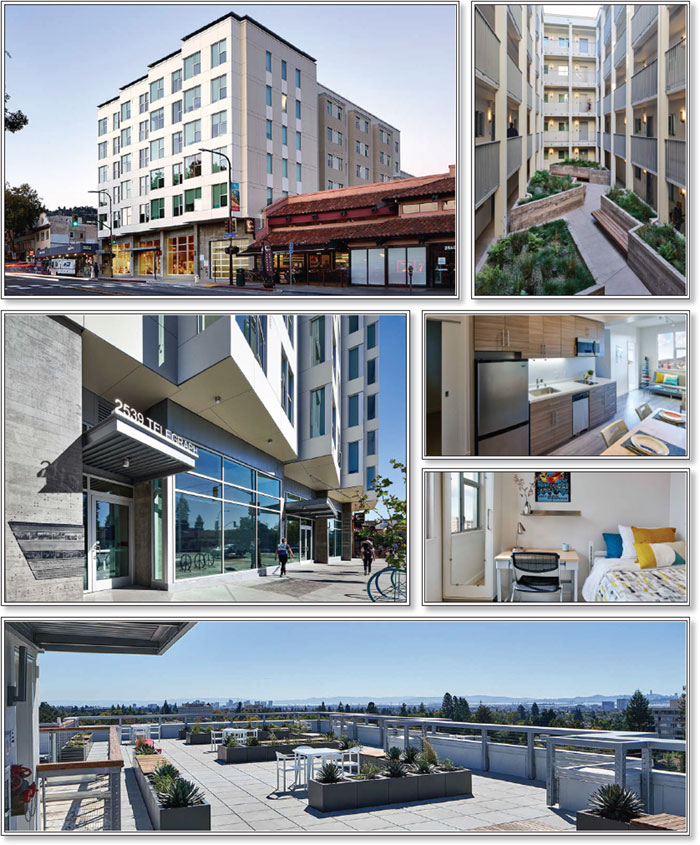
THE INFORMATION IN THIS STRUCTURAL AND COLLATERAL TERM SHEET IS NOT COMPLETE AND MAY BE AMENDED PRIOR TO THE TIME OF SALE. THIS TERM SHEET IS NOT AN OFFER TO SELL THESE SECURITIES AND IT IS NOT A SOLICITATION OF AN OFFER TO BUY THESE SECURITIES IN ANY JURISDICTION WHERE THE OFFER OR SALE IS NOT PERMITTED.
63
Multifamily - Student Housing | Loan #4 | Cut-off Date Balance: | | $42,000,000 |
2539 Telegraph Avenue | Panoramic Berkeley | Cut-off Date LTV: | | 56.2% |
Berkeley, CA 94704 | | U/W NCF DSCR: | | 2.25x |
| | U/W NOI Debt Yield: | | 8.8% |

THE INFORMATION IN THIS STRUCTURAL AND COLLATERAL TERM SHEET IS NOT COMPLETE AND MAY BE AMENDED PRIOR TO THE TIME OF SALE. THIS TERM SHEET IS NOT AN OFFER TO SELL THESE SECURITIES AND IT IS NOT A SOLICITATION OF AN OFFER TO BUY THESE SECURITIES IN ANY JURISDICTION WHERE THE OFFER OR SALE IS NOT PERMITTED.
64
| No. 4 – Panoramic Berkeley |
| |
| Mortgage Loan Information | | Mortgaged Property Information |
| Mortgage Loan Seller: | UBS AG | | Single Asset/Portfolio: | Single Asset |
Credit Assessment (Fitch/KBRA/Moody’s): | NR/NR/NR | | Property Type – Subtype: | Multifamily – Student Housing |
| Original Principal Balance: | $42,000,000 | | Location: | Berkeley, CA |
| Cut-off Date Balance: | $42,000,000 | | Size(4): | 254 Beds |
| % of Initial Pool Balance: | 5.7% | | Cut-off Date Balance Per Bed(1): | $165,354 |
| Loan Purpose: | Refinance | | Maturity Date Balance Per Bed(1): | $165,354 |
| Borrower Sponsors: | Patrick C. Kennedy; Corigin Student Housing LLC; The Patrick and Julie Kennedy Revocable Trust Dated February 18, 2004 | | Year Built/Renovated: | 2019/NAP |
| Guarantors: | Patrick C. Kennedy; Corigin Student Housing LLC; The Patrick and Julie Kennedy Revocable Trust Dated February 18, 2004 | | Title Vesting: | Fee |
| Mortgage Rate: | 3.84762% | | Property Manager: | Self-managed |
| Note Date: | March 10, 2020 | | Current Occupancy (As of)(5): | 96.9% (4/30/2020) |
| Seasoning: | 2 months | | YE 2019 Occupancy(6): | NAP |
| Maturity Date: | April 6, 2030 | | YE 2018 Occupancy(6): | NAP |
| IO Period: | 120 months | | YE 2017 Occupancy(6): | NAP |
| Loan Term (Original): | 120 months | | YE 2016 Occupancy(6): | NAP |
| Amortization Term (Original): | NAP | | Appraised Value(1): | $74,700,000 |
| Loan Amortization Type: | Interest-only, Balloon | | Appraised Value Per Bed(1): | $294,094 |
| Call Protection: | L(26),D(90),O(4) | | Appraisal Valuation Date: | January 28, 2020 |
| Lockbox Type: | Hard/Springing Cash Management | | Underwriting and Financial Information |
| Additional Debt(1)(2): | Yes | | TTM NOI(6): | NAP |
| Additional Debt Type (Balance)(1)(2): | Mezzanine ($10,000,000) | | YE 2019 NOI(6): | NAP |
| | | | YE 2018 NOI(6): | NAP |
| | | | YE 2017 NOI(6): | NAP |
| | | | U/W Revenues: | $4,582,850 |
| Escrows and Reserves(3) | | U/W Expenses: | $866,004 |
| | Initial | Monthly | Cap | | U/W NOI: | $3,716,846 |
| Taxes | $33,600 | $21,000 | NAP | | U/W NCF: | $3,690,559 |
| Insurance | $81,199 | $7,660 | NAP | | U/W DSCR based on NOI/NCF(1): | 2.27x / 2.25x |
| Replacement Reserve | $0 | $2,193 | NAP | | U/W Debt Yield based on NOI/NCF(1): | 8.8% / 8.8% |
| TI/LC Reserve | $0 | Springing | NAP | | U/W Debt Yield at Maturity based on NOI/NCF(1): | 8.8% / 8.8% |
| Tenant Obligation Funds | $347,076 | $0 | NAP | | Cut-off Date LTV Ratio(1): | 56.2% |
| UC Regents Non-Renewal Major Tenant Trigger Suspension | $0 | Springing | NAP | | LTV Ratio at Maturity(1): | 56.2% |
| | | | | | | |
| | | | | | | | |
| Sources and Uses |
| Sources | | | | | Uses | | | |
| Original loan amount | $42,000,000 | | 80.8% | | Loan payoff | $27,252,384 | | 52.4% |
| Mezzanine loan amount | 10,000,000 | | 19.2% | | Other debt | 11,910,033 | | 22.9 |
| | | | | | Closing costs | 665,845 | | 1.3 |
| | | | | | Upfront reserves | 461,875 | | 0.9 |
| | | | | | Return of equity | 11,709,863 | | 22.5 |
| Total Sources | $52,000,000 | | 100.0% | | Total Uses | $52,000,000 | | 100.0% |
| (1) | All statistical information related to the balance per unit, loan-to-value ratios, debt service coverage ratios and debt yields are based solely on the Panoramic Berkeley Mortgage Loan (as defined below). The Cut-off Date Balance Per Bed, Maturity Date Balance Per Bed, U/W DSCR based on NOI/NCF, U/W Debt Yield based on NOI/NCF, U/W Debt Yield at Maturity based on NOI/NCF, Cut-off Date LTV Ratio and LTV Ratio at Maturity based on the combined Panoramic Berkeley Mortgage Loan and the mezzanine loan are $204,724, $204,724, 1.64x / 1.63x, 7.1% / 7.1%, 7.1% / 7.1%, 69.6% and 69.6%, respectively. Notwithstanding the foregoing, the appraised value was determined prior to the emergence of the novel coronavirus pandemic, and the economic disruption resulting from measures to combat the pandemic, and all LTV metrics were calculated based on such prior information. See “Risk Factors—Coronavirus Pandemic Has Adversely Affected the Global Economy and Will Likely Adversely Affect the Performance of the Mortgage Loans” in the Preliminary Prospectus. |
| (2) | See “Subordinate and Mezzanine Indebtedness” section below. |
| (3) | See “Escrows” section below. |
THE INFORMATION IN THIS STRUCTURAL AND COLLATERAL TERM SHEET IS NOT COMPLETE AND MAY BE AMENDED PRIOR TO THE TIME OF SALE. THIS TERM SHEET IS NOT AN OFFER TO SELL THESE SECURITIES AND IT IS NOT A SOLICITATION OF AN OFFER TO BUY THESE SECURITIES IN ANY JURISDICTION WHERE THE OFFER OR SALE IS NOT PERMITTED.
65
Multifamily - Student Housing | Loan #4 | Cut-off Date Balance: | | $42,000,000 |
2539 Telegraph Avenue | Panoramic Berkeley | Cut-off Date LTV: | | 56.2% |
Berkeley, CA 94704 | | U/W NCF DSCR: | | 2.25x |
| | U/W NOI Debt Yield: | | 8.8% |
(4) | The Panoramic Berkeley Property (as defined below) has 70 units totalling 254 beds. Excluding the one unit leased at below-market rent in the Below Market Rent Program (“BMR Program”) and five units leased under the Section 8 Voucher Program (“Section 8 Program”), the Panoramic Berkeley Property has 235 beds. The Panoramic Berkeley Property also includes 4,434 square feet of ground floor retail space. |
(5) | Current Occupancy is based on per bed leased occupancy for residential units only. Based on number of units, the Panoramic Berkeley Property was 97.1% leased. The retail space is 100.0% leased to 2nd Street USA, Inc. |
(6) | Historical occupancy and historical financials are not available as the Panoramic Berkeley Property was constructed in 2019. |
The Mortgage Loan. The mortgage loan (the “Panoramic Berkeley Mortgage Loan”) is evidenced by two promissory notes secured by a first priority mortgage encumbering the fee interest in a 254-bed student housing property located in Berkeley, California (the “Panoramic Berkeley Property”).
The Borrower and Borrower Sponsors. The borrower is 2539 Telegraph LLC (the “Panoramic Berkeley Borrower”), a Delaware limited liability company and single purpose entity with one independent director. Legal counsel to the Panoramic Berkeley Borrower delivered a non-consolidation opinion in connection with the origination of the Panoramic Berkeley Mortgage Loan. The borrower sponsors and non-recourse carveout guarantors are Patrick C. Kennedy, The Patrick and Julie Kennedy Revocable Trust Dated February 18, 2004, and Corigin Student Housing LLC.
Patrick C. Kennedy is the owner of Panoramic Interests, a development firm that has been building housing, live-work space, and commercial property in San Francisco and Berkeley since 1990. Its work in downtown Berkeley and San Francisco includes 15 projects, including more than 1,000 new units of housing and 100,000 square feet of commercial space. From 1998-2004, Panoramic Interests built seven new mixed-use apartment buildings in downtown Berkeley, becoming the largest private landlord of UC Berkeley students. Equity Residential REIT purchased the portfolio in April 2007 for approximately $146 million, the largest real estate transaction in Berkeley’s history. Panoramic Interests is now building CITYSPACES®, a collection of residences constructed throughout walkable neighborhoods in San Francisco and Berkeley.
Corigin Real Estate Group (“Corigin”), manager of Corigin Student Housing LLC, is a private holding company specializing in real estate and venture capital through Corigin Real Estate Group and Corigin Ventures, respectively. Corigin is based in New York and is led by Ryan Freedman, its chairman and chief executive officer. Corigin’s Real Estate Group is a developer, owner and operator of New York City real estate. Corigin’s platform spans development, multi-family rental apartments, student housing, property management and lending. Corigin Ventures is an early-stage investor of capital and supports tech-enabled startups.
The Property. The Panoramic Berkeley Property is a 70-unit class A multifamily building, containing 254 student housing beds, with 44 units master-leased to The Regents of the University of California (Fitch/Moody’s/S&P: AA-/Aa2/AA), one BMR Program unit, five Section 8 Program units, and 20 market rate units. In addition, the Panoramic Berkeley Property contains 4,434 square feet of ground floor retail space 100.0% leased to 2nd Street USA, Inc. The Panoramic Berkeley Property is located at 2539 Telegraph Avenue in Berkeley, California, approximately five blocks south of the University of California at Berkeley (“UC Berkeley”) campus. Completed in 2019, the Panoramic Berkeley Property is a six-story student housing building totaling 44,893 square feet comprised of six studio one-bath suites, 13 three-bed one-bath suites, six four-bed one-bath suites, 40 four-bed 1.5-bath suites, and five five-bed 1.5-bath suites with an average unit size of 660 square feet, including one three-bed one-bath unit that is part of the BMR Program and one studio one-bath unit, one three-bed one-bath unit and three four-bed 1.5-bath units that are part of the Section 8 Program. The Panoramic Berkeley Property is required under a deed restriction with the City of Berkeley to lease six of the units at below market rents. As of the April 30, 2020 rent roll, the Panoramic Berkeley Property was 96.9% leased.
Unit amenities include single-occupancy studio/one-bath, three-bedroom/one-bath, four-bedroom/one-bath, four-bedroom/1.5-bath and five-bedroom/1.5-bath apartments that are fully furnished and feature 9-foot ceilings, operable windows, engineered soundproofing, bay windows, individually controlled heat and ventilation, and USB plugs in every room. The kitchens in each unit feature high-efficiency stainless steel appliances, Formica countertops, a refrigerator, an electric range/oven, a built-in microwave, a dishwasher, and a sink with garbage disposal. Bathrooms contain a tub/shower combination, a wall-mounted medicine cabinet with vanity mirror, and a heated towel rack.
Community amenities available to all residents include a rooftop deck, a central courtyard, lounge space for study and social gatherings, secured indoor bicycle storage for up to 156 bikes, storage lockers, vending machines, on-site management and maintenance, a controlled entry and elevator system, text messaging laundry services on every floor, automated Luxor One parcel delivery and a garage with nine parking spaces.
Forty-four student housing units containing 180 beds at the Panoramic Berkeley Property (representing 72.3% of underwritten base rent) are master-leased to The Regents of the University of California (Fitch/Moody’s/S&P: AA-/Aa2/AA) at an average rental rate of $5,686 per unit/month or $8.46 PSF, increasing 2% annually throughout the full term of the lease. The Regents of the University of California is the governing board of the University of California system. The Regents of the University of California’s lease has an initial term of five years through August 2024 with no renewal options and no termination options. Twenty multifamily units are leased at market rents at an average rental rate of $4,420 per unit/month or $7.48 PSF, one multifamily unit is leased at below-market rents in the BMR Program at a rental rate of $2,338 per unit/month or $3.71 PSF, and five multifamily units (60.0% leased) are leased under the Section 8 Program at an average rental rate of $2,368 per unit/month or $4.63 PSF.
The ground floor includes a 4,434 square foot retail space that is leased to 2nd Street USA, Inc. on a 10-year lease at an initial annual rent of $30.50 PSF. 2nd Street USA, Inc.’s lease has two, five-year renewal options and a one-time termination option no earlier than the 60th full calendar month following the lease commencement date and effective 120 days after notice is received from the landlord
THE INFORMATION IN THIS STRUCTURAL AND COLLATERAL TERM SHEET IS NOT COMPLETE AND MAY BE AMENDED PRIOR TO THE TIME OF SALE. THIS TERM SHEET IS NOT AN OFFER TO SELL THESE SECURITIES AND IT IS NOT A SOLICITATION OF AN OFFER TO BUY THESE SECURITIES IN ANY JURISDICTION WHERE THE OFFER OR SALE IS NOT PERMITTED.
66
Multifamily - Student Housing | Loan #4 | Cut-off Date Balance: | | $42,000,000 |
2539 Telegraph Avenue | Panoramic Berkeley | Cut-off Date LTV: | | 56.2% |
Berkeley, CA 94704 | | U/W NCF DSCR: | | 2.25x |
| | U/W NOI Debt Yield: | | 8.8% |
along with payment of the unamortized balance, as of the termination date, of the tenant improvement allowance amortized over its useful life. 2nd Street USA, Inc. is expected to open for business in the summer of 2020 according to the borrower sponsors. 2nd Street USA, Inc. is a second-hand clothing store with high quality designer and vintage items, unique and trendy clothing, and shoes.
The following table presents certain information relating to the unit mix of the Panoramic Berkeley Property:
Unit Mix Summary(1)
| Unit Type | Total No. of Beds | % of Total Beds | Total No. of Units | % of Total Units | Occ. %(2) | Average Unit Size (SF) | Total Size (SF) | Average Underwritten Monthly Rent per Bed(3) | Average Underwritten Monthly Rent per Unit(3) |
| Studio / 1 Bathroom – Market | 5 | 2.0% | 5 | 7.1% | 100.0% | 352 | 1,760 | $2,480 | $2,480 |
| Studio / 1 Bathroom – Section 8 | 1 | 0.4% | 1 | 1.4% | 100.0% | 352 | 352 | $1,549 | $1,549 |
| 3 Bedroom / 1 Bathroom – UCB | 3 | 1.2% | 1 | 1.4% | 100.0% | 546 | 546 | $1,390 | $4,170 |
| 3 Bedroom / 1 Bathroom – Market | 30 | 11.8% | 10 | 14.3% | 100.0% | 603 | 6,028 | $1,543 | $4,630 |
| 3 Bedroom / 1 Bathroom – BMR | 3 | 1.2% | 1 | 1.4% | 100.0% | 631 | 631 | $779 | $2,338 |
| 3 Bedroom / 1 Bathroom – Section 8 | 3 | 1.2% | 1 | 1.4% | 100.0% | 546 | 546 | $779 | $2,338 |
| 4 Bedroom / 1 Bathroom – UCB | 24 | 9.4% | 6 | 8.6% | 100.0% | 619 | 3,716 | $1,390 | $5,560 |
| 4 Bedroom / 1.5 Bathroom – UCB | 128 | 50.4% | 32 | 45.7% | 100.0% | 663 | 21,212 | $1,390 | $5,560 |
| 4 Bedroom / 1.5 Bathroom – Market | 20 | 7.9% | 5 | 7.1% | 100.0% | 807 | 4,037 | $1,485 | $5,940 |
| 4 Bedroom / 1.5 Bathroom – Section 8 | 12 | 4.7% | 3 | 4.3% | 33.3% | 658 | 1,974 | $804 | $3,217 |
| 5 Bedroom / 1.5 Bathroom – UCB | 25 | 9.8% | 5 | 7.1% | 100.0% | 818 | 4,091 | $1,390 | $6,950 |
| Total/Weighted Average | 254 | 100.0% | 70 | 100.0% | 96.9% | 660 | 44,893 | $1,415 | $5,118 |
(1) | Information obtained from the underwritten rent roll. |
(2) | Occ. % is based on per bed leased occupancy as of April 30, 2020. Based on number of units, the Panoramic Berkeley Property was 97.1% leased. |
(3) | Average Underwritten Monthly Rent per Bed and Average Underwritten Monthly Rent per Unit exclude vacant space. |
The following table presents historical occupancy percentages at the Panoramic Berkeley Property:
Historical Occupancy
12/31/2016(1) | 12/31/2017(1) | 12/31/2018(1) | 12/31/2019(1) | 4/30/2020(2) |
| NAP | NAP | NAP | NAP | 96.9% |
(1) | Historical occupancy is not available as the Panoramic Berkeley Property was constructed in 2019. |
(2) | Information obtained from the underwritten rent roll dated April 30, 2020. Current occupancy is based on per bed leased occupancy for residential units only. Based on number of units, the Panoramic Berkeley Property was 97.1% leased. The retail space is 100.0% leased to 2nd Street USA, Inc. |
COVID-19 Update. As of the May 2020 payment, the residential portion of the Panoramic Berkeley Property was open and operating, however, the common areas have been closed due to the State of California’s stay at home order. As of the date hereof, 99.8% and 97.7% of rent for the leased residential units had been collected for the months of April 2020 and May 2020, respectively. The May 2020 debt service payment for both the mortgage loan and mezzanine loan have been made by the Panoramic Berkeley Borrower. As of the date hereof, the Panoramic Berkeley Mortgage Loan is not subject to any modification or forbearance request.
THE INFORMATION IN THIS STRUCTURAL AND COLLATERAL TERM SHEET IS NOT COMPLETE AND MAY BE AMENDED PRIOR TO THE TIME OF SALE. THIS TERM SHEET IS NOT AN OFFER TO SELL THESE SECURITIES AND IT IS NOT A SOLICITATION OF AN OFFER TO BUY THESE SECURITIES IN ANY JURISDICTION WHERE THE OFFER OR SALE IS NOT PERMITTED.
67
Multifamily - Student Housing | Loan #4 | Cut-off Date Balance: | | $42,000,000 |
2539 Telegraph Avenue | Panoramic Berkeley | Cut-off Date LTV: | | 56.2% |
Berkeley, CA 94704 | | U/W NCF DSCR: | | 2.25x |
| | U/W NOI Debt Yield: | | 8.8% |
Operating History and Underwritten Net Cash Flow. The following table presents certain information relating to the historical operating performance and underwritten net cash flow at the Panoramic Berkeley Property:
Cash Flow Analysis(1)
| | U/W(2)(3) | %(4) | U/W $ per Bed |
| Base Rent | $4,360,691 | 92.3% | $17,168 |
| Grossed Up Vacant Space | 94,680 | 2.0 | 373 |
| Gross Potential Rent | $4,455,371 | 94.3% | $17,541 |
| Other Rental Income(5) | 169,463 | 3.6 | 667 |
| Other Income(6) | 99,390 | 2.1 | 391 |
| Net Rental Income | $4,724,224 | 100.0% | $18,599 |
| (Vacancy) | (141,374)(7) | (3.2) | (557) |
| (Concessions & Credit Loss) | 0 | 0.0 | 0 |
| Effective Gross Income | $4,582,850 | 97.0% | $18,043 |
| | | | |
| Real Estate Taxes(8) | 192,334 | 4.2 | 757 |
| Insurance | 91,923 | 2.0 | 362 |
| Management Fee | 137,485 | 3.0 | 541 |
| Other Operating Expenses | 444,262 | 9.7 | 1,749 |
| Total Operating Expenses | $866,004 | 18.9% | $3,409 |
| | | | |
| Net Operating Income | $3,716,846 | 81.1% | $14,633 |
| Capital Expenditures | 26,287 | 0.6 | 103 |
| Net Cash Flow | $3,690,559 | 80.5% | $14,530 |
| | | | |
| NOI DSCR | 2.27x | | |
| NCF DSCR | 2.25x | | |
| NOI Debt Yield | 8.8% | | |
| NCF Debt Yield | 8.8% | | |
| (1) | Historical cash flows are not available as the Panoramic Berkeley Property was constructed in 2019. |
| (2) | U/W Base Rent includes (i) rent steps totaling $60,048 and (ii) straight-line rent totaling $124,139. |
| (3) | For the avoidance of doubt, no COVID-19 specific adjustments have been incorporated in the lender U/W. |
| (4) | Represents (i) percent of Net Rental Income for all revenue fields, (ii) percent of Gross Potential Rent for Vacancy and Concessions & Credit Loss and (iii) percent of Effective Gross Income for all other fields. |
| (5) | Other Rental Income includes base rent associated with the 4,434 square foot ground floor retail space. |
| (6) | Other Income primarily includes miscellaneous income generated from parking, application fees, ATM fees, and washer/dryer fees. |
| (7) | The underwritten economic vacancy is 3.2%. Based on number of beds, the Panoramic Berkeley Property was 96.9% leased as of April 30, 2020. Based on number of units, the Panoramic Berkeley Property was 97.1% leased. |
| (8) | The units leased to The Regents of the University of California are exempt from real estate taxes. If such units were no longer leased to The Regents of the University of California, the Panoramic Berkeley Property would no longer benefit from such tax exemption. The Panoramic Berkeley Mortgage Loan was underwritten based on real estate taxes as abated by such tax exemption. The appraisal estimated the amount of the tax exemption to be $390,925 in the fifth year of the lease term. |
Appraisal. The appraiser concluded to an “as-is” appraised value for the Panoramic Berkeley Property of $74,700,000 as of January 28, 2020.
Environmental Matters. According to the Phase I environmental site assessment dated February 3, 2020, there was no evidence of any recognized environmental conditions at the Panoramic Berkeley Property.
Market Overview and Competition. The Panoramic Berkeley Property is located in Berkeley in the northwest section of Alameda County directly across the San Francisco Bay from San Francisco, approximately 4.2 miles north of the Oakland central business district. The Panoramic Berkeley Property is approximately five blocks from the UC Berkeley campus at the corner of Dwight Way and Telegraph Avenue. The Panoramic Berkeley Property is located along Interstate 80, which travels southwest to San Francisco and
THE INFORMATION IN THIS STRUCTURAL AND COLLATERAL TERM SHEET IS NOT COMPLETE AND MAY BE AMENDED PRIOR TO THE TIME OF SALE. THIS TERM SHEET IS NOT AN OFFER TO SELL THESE SECURITIES AND IT IS NOT A SOLICITATION OF AN OFFER TO BUY THESE SECURITIES IN ANY JURISDICTION WHERE THE OFFER OR SALE IS NOT PERMITTED.
68
Multifamily - Student Housing | Loan #4 | Cut-off Date Balance: | | $42,000,000 |
2539 Telegraph Avenue | Panoramic Berkeley | Cut-off Date LTV: | | 56.2% |
Berkeley, CA 94704 | | U/W NCF DSCR: | | 2.25x |
| | U/W NOI Debt Yield: | | 8.8% |
northeast to Sacramento, and Highway 24, which travels south to Oakland and east to Walnut Creek. Downtown Berkeley has numerous restaurants, movie theaters, museums, retailers and coffee bars.
There are three Bay Area Rapid Transit (“BART”) stations in Berkeley, providing commuter rail service throughout many parts of the Bay Area. The Downtown Berkeley BART station is located approximately 1.0 miles northwest of the Panoramic Berkeley Property, providing a 22-minute ride to San Francisco’s Financial District and a 23-minute ride to the Coliseum BART Station. The new Downtown Berkeley BART station plaza opened to the public on October 18, 2018, featuring enhanced bus and BART connectivity, pedestrian improvements and modern environmental elements. The project cost $13 million, and includes the addition of cafe tables and chairs to the highly trafficked plaza, additional sidewalk seating along Shattuck Avenue, new lighting and regular live performances.
Berkeley is home to UC Berkeley and the Lawrence Berkeley National Laboratory. Founded in 1868 as the University of California, UC Berkeley offers approximately 350 undergraduate and graduate degree programs in a range of disciplines with approximately 43,000 full-time students in 2019 and is the oldest of the ten major campuses affiliated with the University of California. UC Berkeley also co-manages three United States Department of Energy National Laboratories, including Lawrence Berkeley National Laboratory, and is home to many world-renowned research institutes and organizations. As of October 2019, 107 Nobel laureates have been affiliated with the university as faculty, alumni or researchers, the most of any public university in the United States and third most of any university in the world. UC Berkeley is ranked fourth on a magazine survey of 2018 Best Global Universities rankings conducted in the U.S and nearly 50 other countries.
According to a third-party market report, the estimated 2020 population within a one-, three- and five-mile radius of the Panoramic Berkeley Property was 54,962, 223,393 and 413,086, respectively. The estimated 2020 average household income within the same radii was $112,383, $156,374 and $150,724, respectively.
Submarket Information – According to a third-party market research report, the Panoramic Berkeley Property is situated within the Berkeley multifamily submarket. As of the fourth quarter of 2019, the submarket reported a total inventory of 16,901 units with a 3.8% vacancy rate and an average asking rental rate of $2,568 per unit.
Appraiser’s Competitive Set – The appraiser identified five primary competitive properties for the Panoramic Berkeley Property totaling 633 units, which reported an average occupancy rate of approximately 99.8%. The appraiser concluded to monthly market rents per unit ranging from $465 to $2,600 (see “Market Rent Summary” table below). The appraisal identified three new construction projects in the immediate area that as of the appraisal were expected to come online in the near future. The first, The Durant, a 58-unit, 72-bed facility, was expected to be completed in August 2020. The second, Standard at Berkeley, a 122-unit, 331-bed facility, was expected to be completed in August 2021. The third, The Den, a 40-unit, 160-bed facility, had not yet begun construction. Campus enrollment has grown by 22.4% between the 2010-2011 and 2019-2020 academic years, reaching approximately 43,000 students in total fall average enrollment in 2019. Although the two properties that were under construction at the time of the appraisal were expected to be delivered in 2020 and 2021, it is unclear if the pandemic has or will result in any delay to these properties coming online.
Market Rent Summary(1)
| Unit Type | Total No. of
Beds | Total No. of
Units | Market Monthly
Rent per Unit | Market Monthly
Rent per SF |
| Studio / 1 Bathroom – Market | 5 | 5 | $2,600 | $7.39 |
| Studio / 1 Bathroom – Section 8 | 1 | 1 | $1,549 | $4.40 |
| 3 Bedroom / 1 Bathroom – UCB | 3 | 1 | $1,550 | $8.52 |
| 3 Bedroom / 1 Bathroom – Market | 30 | 10 | $1,650 | $8.21 |
| 3 Bedroom / 1 Bathroom – BMR | 3 | 1 | $465 | $2.21 |
| 3 Bedroom / 1 Bathroom – Section 8 | 3 | 1 | $1,072 | $5.89 |
| 4 Bedroom / 1 Bathroom – UCB | 24 | 6 | $1,450 | $9.36 |
| 4 Bedroom / 1.5 Bathroom – UCB | 128 | 32 | $1,500 | $9.05 |
| 4 Bedroom / 1.5 Bathroom – Market | 20 | 5 | $1,575 | $7.80 |
| 4 Bedroom / 1.5 Bathroom – Section 8 | 12 | 3 | $986 | $6.00 |
| 5 Bedroom / 1.5 Bathroom – UCB | 25 | 5 | $1,500 | $9.17 |
| Total/Weighted Average | 254 | 70 | $1,560 | $8.48 |
(1) | Information obtained from the appraisal. |
THE INFORMATION IN THIS STRUCTURAL AND COLLATERAL TERM SHEET IS NOT COMPLETE AND MAY BE AMENDED PRIOR TO THE TIME OF SALE. THIS TERM SHEET IS NOT AN OFFER TO SELL THESE SECURITIES AND IT IS NOT A SOLICITATION OF AN OFFER TO BUY THESE SECURITIES IN ANY JURISDICTION WHERE THE OFFER OR SALE IS NOT PERMITTED.
69
Multifamily - Student Housing | Loan #4 | Cut-off Date Balance: | | $42,000,000 |
2539 Telegraph Avenue | Panoramic Berkeley | Cut-off Date LTV: | | 56.2% |
Berkeley, CA 94704 | | U/W NCF DSCR: | | 2.25x |
| | U/W NOI Debt Yield: | | 8.8% |
The following table presents certain information relating to comparable multifamily properties for the Panoramic Berkeley Property:
Competitive Set(1)
| Panoramic Berkeley (Subject) | Garden Village | StoneFire Apartments | Metropolitan | Varsity Berkeley | Maximinio Martinez Commons |
Location | Berkeley, CA | Berkeley, CA | Berkeley, CA | Berkeley, CA | Berkeley, CA | Berkeley, CA |
Distance to Subject | -- | 0.4 miles | 0.8 miles | 0.4 miles | 0.6 miles | 0.2 miles |
Property Subtype | Student Housing | Student Housing | Student Housing | Student Housing | Student Housing | Student Housing |
Year Built/Renovated | 2019/NAP | 2016/NAP | 2017/NAP | 2014/NAP | 2015/NAP | 2012/NAP |
Number of Units | 70 | 236 | 98 | 163 | 79 | 57 |
Average Monthly Rent (per unit) | | | | | | |
Studio | $1,549-$2,480 | NAP | $3,333 | $2,100-$2,200 | $2,800-$3,000 | NAP |
3 Bedroom | $2,338-$4,630 | NAP | NAP | $1,675-$1,725 | $1,840-$1,940 | NAP |
4 Bedroom | $3,217-$5,940 | $1,694 | NAP | $1,550-$1,700 | NAP | $1,347 |
5 Bedroom | $6,950 | NAP | NAP | NAP | NAP | NAP |
Occupancy | 96.9%(2) | 100.0% | 99.0% | 100.0% | 100.0% | 100.0% |
| (1) | Information obtained from the appraisal and underwritten rent roll. |
| (2) | Occupancy is based on per bed leased occupancy for residential units only. Based on number of units, the Panoramic Berkeley Property was 97.1% leased. The retail space is 100.0% leased to 2nd Street USA, Inc. |
Escrows.
Real Estate Taxes – The Panoramic Berkeley Mortgage Loan documents require an upfront real estate tax reserve of $33,600 and ongoing monthly real estate tax reserves in an amount equal to one-twelfth of the real estate taxes that the lender estimates will be payable during the next 12 months (initially $21,000).
Insurance – The Panoramic Berkeley Mortgage Loan documents require an upfront insurance reserve of $81,199 and ongoing monthly insurance reserves in an amount equal to one-twelfth of the insurance premiums that the lender estimates will be payable for the renewal of the coverage during the next 12 months (initially $7,660, currently in place). Insurance escrows are waived so long as an acceptable blanket policy is in place and the Panoramic Berkeley Borrower provides the lender evidence of renewal of such policy.
Replacement Reserve – The Panoramic Berkeley Mortgage Loan documents require ongoing monthly replacement reserves of $2,193.
TI/LC Reserve –If any commercial or retail tenant at the Panoramic Berkeley Property does not extend or renew its lease upon terms and conditions reasonably acceptable to the lender, on or prior to 12 months prior to the then applicable expiration date under its lease, the Panoramic Berkeley Mortgage Loan documents require ongoing monthly rollover reserves (or letter of credit in lieu thereof) equal to $25 per square foot of the space then demised under the applicable lease for tenant improvements and leasing commissions that may be incurred with respect to the commercial and retail portions of the Panoramic Berkeley Property.
Tenant Obligation Funds – The Panoramic Berkeley Mortgage Loan documents require an upfront unfunded TI/LC funds reserve of $347,076. The unfunded TI/LC funds reserve consists of (i) $56,349 for free rent under the retail lease, (ii) $221,700 for tenant improvements allowance under the retail lease, (iii) $35,000 for floor slab allowance under the retail lease and (iv) $34,027 for leasing commissions under or relating to the retail lease.
UC Regents Non-Renewal Major Tenant Trigger Suspension – Provided no other Major Tenant Trigger Event (as defined below) has occurred and is continuing, upon the occurrence of a Major Tenant Trigger Event described in clause (i) of the definition thereof with respect to The Regents of the University of California, the Panoramic Berkeley Borrower will have the right to deposit with the lender cash or a letter of credit in an amount equal to $750,000 (the “UC Regents Non-Renewal Major Tenant Trigger Suspension Deposit”). Upon making such deposit, such Major Tenant Trigger Event will be deemed not to occur.
Lockbox and Cash Management. The Panoramic Berkeley Mortgage Loan is structured with a hard lockbox, which is already in place, and springing cash management. The Panoramic Berkeley Borrower is required to direct tenants to pay rent directly into such lockbox account and all rents received directly by the Panoramic Berkeley Borrower or the property manager are required to be deposited into the lockbox account within three business days of receipt. Prior to the occurrence of a Cash Management Trigger Event (as defined below), all funds in the lockbox account are required to be distributed to the Panoramic Berkeley Borrower. During a Cash Management Trigger Event, funds in the lockbox account are required to be swept to a lender-controlled cash management account and applied to debt service, reserves and operating expenses as provided in the Panoramic Berkeley Mortgage Loan documents, and during a Cash Sweep Event Period (as defined below), all excess funds are required to be swept to an excess cash flow subaccount controlled by the lender.
A “Cash Management Trigger Event” will commence upon the earlier of the following:
| (i) | the occurrence and continuance of an event of default; |
| (ii) | any bankruptcy action involving the Panoramic Berkeley Borrower, the guarantors, or the property manager; |
| (iii) | the net operating income combined debt service coverage ratio falling below 1.05x; |
| (iv) | the indictment for fraud of misappropriation of funds by Panoramic Berkeley Borrower, the guarantors, or the property manager; or |
| (v) | a Major Tenant Trigger Event. |
THE INFORMATION IN THIS STRUCTURAL AND COLLATERAL TERM SHEET IS NOT COMPLETE AND MAY BE AMENDED PRIOR TO THE TIME OF SALE. THIS TERM SHEET IS NOT AN OFFER TO SELL THESE SECURITIES AND IT IS NOT A SOLICITATION OF AN OFFER TO BUY THESE SECURITIES IN ANY JURISDICTION WHERE THE OFFER OR SALE IS NOT PERMITTED.
70
Multifamily - Student Housing | Loan #4 | Cut-off Date Balance: | | $42,000,000 |
2539 Telegraph Avenue | Panoramic Berkeley | Cut-off Date LTV: | | 56.2% |
Berkeley, CA 94704 | | U/W NCF DSCR: | | 2.25x |
| | U/W NOI Debt Yield: | | 8.8% |
A Cash Management Trigger Event will end upon the occurrence of the following:
| ● | with regard to clause (i), the cure of such event of default; |
| ● | with regard to clause (ii), the filing being discharged, stayed or dismissed within 90 days for the Panoramic Berkeley Borrower or the guarantors, or within 120 days for the property manager, and lender’s determination that such filing does not materially affect the Panoramic Berkeley Borrower’s, the guarantors’, or the property manager’s monetary obligations; |
| ● | with regard to clause (iii), the net operating income combined debt service coverage ratio being equal to or greater than 1.05x for two consecutive quarters or the delivery of cash or a letter of credit in an amount to cause combined debt service coverage ratio to equal 1.05x; |
| ● | with regard to clause (iv), the dismissal or acquittal of such related indictment; or |
| ● | with regard to clause (v), the Major Tenant Trigger Event is cured as set forth in the definition of such term below. |
A “Cash Sweep Event Period” will commence upon the earlier of the following:
| (i) | the occurrence and continuance of an event of default; |
| (ii) | any bankruptcy action involving the Panoramic Berkeley Borrower, the guarantors, or the property manager; or |
| (iii) | the net operating income combined debt service coverage ratio falling below 1.05x. |
A Cash Sweep Event Period will end upon the occurrence of the following:
| ● | with regard to clause (i), the cure of such event of default; |
| ● | with regard to clause (ii), the filing being discharged, stayed or dismissed within 90 days for the Panoramic Berkeley Borrower or the guarantors, or within 120 days for the property manager, and lender’s determination that such filing does not materially affect the Panoramic Berkeley Borrower’s, the guarantors’, or the property manager’s monetary obligations; or |
| ● | with regard to clause (iii), the net operating income combined debt service coverage ratio being equal to or greater than 1.05x for two consecutive quarters or the delivery of cash or a letter of credit in an amount to cause the combined debt service coverage ratio to equal 1.05x. |
A “Major Tenant Trigger Event” will commence upon the occurrence of:
| (i) | on or prior to 12 months prior to the expiration date of a Major Tenant’s lease, the related Major Tenant failing to extend or renew its lease; |
| (ii) | an event of default under a Major Tenant lease that continues for 30 days or longer beyond any applicable notice and cure period; |
| (iii) | any Major Tenant or any guarantor of the applicable Major Tenant lease becoming insolvent or a debtor in any bankruptcy action; |
| (iv) | a Major Tenant lease being terminated; |
| (v) | any Major Tenant “going dark”, vacating or ceasing to occupy or conduct business at its space; or |
| (vi) | the rating of any debt obligation issued by The Regents of the University of California being downgraded below BBB- by any of the rating agencies. |
A Major Tenant Trigger Event will end upon the occurrence of:
| ● | with regard to clauses (i) through (v) above, the net operating income combined debt service coverage ratio being equal to or greater than 1.05x for two consecutive quarters or the delivery of cash or a letter of credit in an amount to cause the combined debt service coverage ratio to equal 1.05x; |
| ● | with regard to clause (i) above, (x) an acceptable Major Tenant lease extension with respect to such Major Tenant space or (y) with respect to The Regents of the University of California, the Panoramic Berkeley Borrower will deposit with the lender cash or a letter of credit in an amount equal to $750,000; |
| ● | with regard to clause (ii) above, a cure of the applicable event of default under the applicable Major Tenant lease; |
| ● | with regard to clause (iii) above, an affirmation of the Major Tenant lease in the applicable bankruptcy proceeding and confirmation that the Major Tenant is actually paying all rents and other amounts due under its lease; |
| ● | with regard to clause (iv) above, all of the applicable Major Tenant space being leased to a replacement tenant; |
| ● | with regard to clause (v) above, the applicable Major Tenant having re-opened for business or the applicable Major Tenant space being leased to an acceptable replacement tenant at the Panoramic Berkeley Property; or |
| ● | with regard to clause (vi) above, the rating of the relevant debt obligation issued by The Regents of the University of California is raised to no lower than BBB-. |
A “Major Tenant” means (i) The Regents of the University of California or (ii) any tenant whose leases, either individually or when taken together with any other lease with the same tenant or affiliate tenant, (x) cover no less than 25% of the net rentable area at the Panoramic Berkeley Property or (y) require the payment of base rent that is no less than 25% of the total in-place base rent at the Panoramic Berkeley Property.
Property Management. The Panoramic Berkeley Property is managed by Panoramic Management, LLC, an affiliate of the borrower sponsors.
Partial Release. Not permitted.
THE INFORMATION IN THIS STRUCTURAL AND COLLATERAL TERM SHEET IS NOT COMPLETE AND MAY BE AMENDED PRIOR TO THE TIME OF SALE. THIS TERM SHEET IS NOT AN OFFER TO SELL THESE SECURITIES AND IT IS NOT A SOLICITATION OF AN OFFER TO BUY THESE SECURITIES IN ANY JURISDICTION WHERE THE OFFER OR SALE IS NOT PERMITTED.
71
Multifamily - Student Housing | Loan #4 | Cut-off Date Balance: | | $42,000,000 |
2539 Telegraph Avenue | Panoramic Berkeley | Cut-off Date LTV: | | 56.2% |
Berkeley, CA 94704 | | U/W NCF DSCR: | | 2.25x |
| | U/W NOI Debt Yield: | | 8.8% |
Real Estate Substitution. Not permitted.
Subordinate and Mezzanine Indebtedness. Concurrently with the funding of the Panoramic Berkeley Mortgage Loan, UBS AG funded a mezzanine loan in the amount of $10,000,000 (the “Panoramic Berkeley Mezzanine Loan”), which was sold to a third-party investor. The Panoramic Berkeley Mezzanine Loan is secured by the pledge of the equity interest in the Panoramic Berkeley Borrower and is coterminous with the Panoramic Berkeley Mortgage Loan. The Panoramic Berkeley Mezzanine Loan accrues interest at a rate of 6.20000% per annum. Including the Panoramic Berkeley Mortgage Loan and Panoramic Berkeley Mezzanine Loan, the total Cut-off Date LTV, total Maturity Date LTV Ratio, total UW NCF DSCR and total UW NOI Debt Yield are 69.6%, 69.6%, 1.63x and 7.1%, respectively.
Ground Lease. None.
Terrorism Insurance. The Panoramic Berkeley Mortgage Loan documents require that the “all risk” insurance policy required to be maintained by Panoramic Berkeley Borrower provides coverage for terrorism in an amount equal to the full replacement cost of the Panoramic Berkeley Property, as well as business interruption insurance covering no less than the 18-month period following the occurrence of a casualty event, together with a 12-month extended period of indemnity.
Earthquake Insurance. The Panoramic Berkeley Property is located in Seismic Zone 4 and has a probable maximum loss of 11%. The Panoramic Berkeley Borrower obtained earthquake insurance with a limit of $35.0 million per occurrence and in the annual aggregate.
THE INFORMATION IN THIS STRUCTURAL AND COLLATERAL TERM SHEET IS NOT COMPLETE AND MAY BE AMENDED PRIOR TO THE TIME OF SALE. THIS TERM SHEET IS NOT AN OFFER TO SELL THESE SECURITIES AND IT IS NOT A SOLICITATION OF AN OFFER TO BUY THESE SECURITIES IN ANY JURISDICTION WHERE THE OFFER OR SALE IS NOT PERMITTED.
72
Multifamily – Garden | Loan #5 | Cut-off Date Balance: | | $35,500,000 |
7855 Deer Springs Way | Solitude at Centennial | Cut-off Date LTV: | | 60.8% |
Las Vegas, NV 89131 | | U/W NCF DSCR: | | 2.29x |
| | U/W NOI Debt Yield: | | 8.1% |
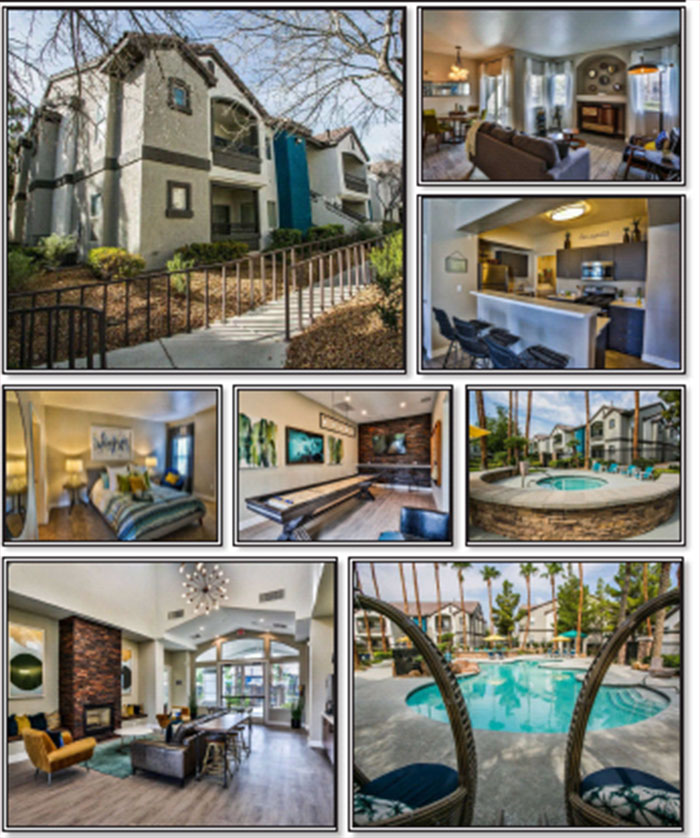
THE INFORMATION IN THIS STRUCTURAL AND COLLATERAL TERM SHEET IS NOT COMPLETE AND MAY BE AMENDED PRIOR TO THE TIME OF SALE. THIS TERM SHEET IS NOT AN OFFER TO SELL THESE SECURITIES AND IT IS NOT A SOLICITATION OF AN OFFER TO BUY THESE SECURITIES IN ANY JURISDICTION WHERE THE OFFER OR SALE IS NOT PERMITTED.
73
Multifamily – Garden | Loan #5 | Cut-off Date Balance: | | $35,500,000 |
7855 Deer Springs Way | Solitude at Centennial | Cut-off Date LTV: | | 60.8% |
Las Vegas, NV 89131 | | U/W NCF DSCR: | | 2.29x |
| | U/W NOI Debt Yield: | | 8.1% |
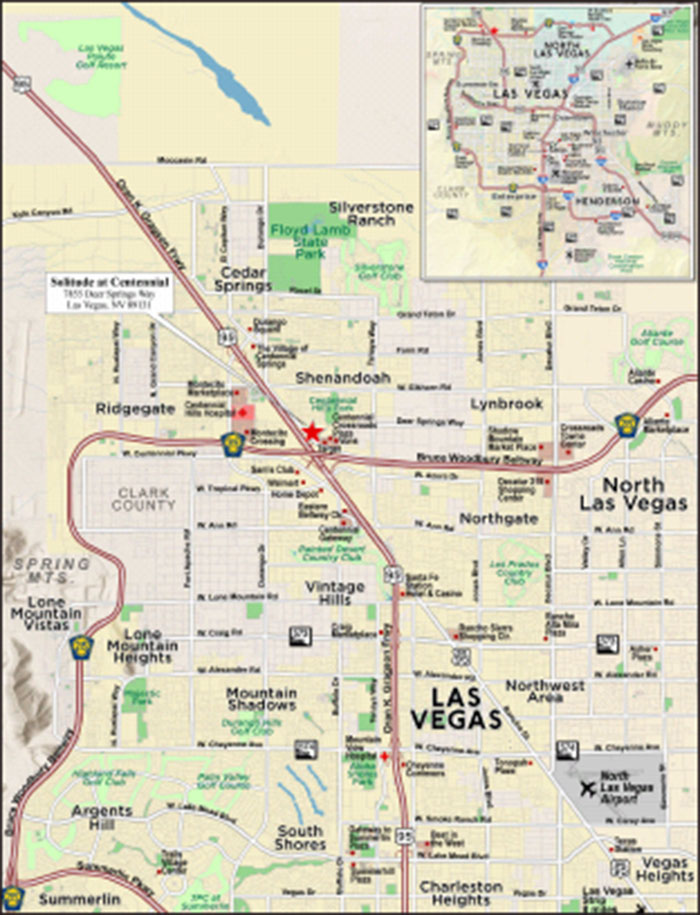
THE INFORMATION IN THIS STRUCTURAL AND COLLATERAL TERM SHEET IS NOT COMPLETE AND MAY BE AMENDED PRIOR TO THE TIME OF SALE. THIS TERM SHEET IS NOT AN OFFER TO SELL THESE SECURITIES AND IT IS NOT A SOLICITATION OF AN OFFER TO BUY THESE SECURITIES IN ANY JURISDICTION WHERE THE OFFER OR SALE IS NOT PERMITTED.
74
No. 5 – Solitude at Centennial |
|
Mortgage Loan Information | | Mortgaged Property Information |
Mortgage Loan Seller: | Column | | Single Asset/Portfolio: | Single Asset |
Credit Assessment (Fitch/KBRA/Moody’s): | NR/NR/NR | | Property Type – Subtype: | Multifamily – Garden |
Original Principal Balance: | $35,500,000 | | Location: | Las Vegas, NV |
Cut-off Date Balance: | $35,500,000 | | Size: | 272 Units |
% of Initial Pool Balance: | 4.9% | | Cut-off Date Balance Per Unit: | $130,515 |
Loan Purpose: | Acquisition | | Maturity Date Balance Per Unit: | $130,515 |
Borrower Sponsors: | Blackstone Real Estate Income Trust; Kennedy Wilson Investment Company | | Year Built/Renovated: | 2000/2019 |
Guarantor: | BREIT MF Holdings LLC | | Title Vesting: | Fee |
Mortgage Rate: | 3.3910% | | Property Manager: | Alliance Southwest, LLC |
Note Date: | October 30, 2019 | | Current Occupancy(1) (As of): | 93.0% (5/4/2020) |
Seasoning: | 7 months | | YE 2019 Occupancy: | 93.9% |
Maturity Date: | November 1, 2029 | | YE 2018 Occupancy: | 93.2% |
IO Period: | 120 months | | YE 2017 Occupancy(3): | NAV |
Loan Term (Original): | 120 months | | As-Is Appraised Value(1): | $58,400,000 |
Amortization Term (Original): | NAP | | As-Is Appraised Value Per Unit(1): | $214,706 |
Loan Amortization Type: | Interest-only, Balloon | | As-Is Appraisal Valuation Date: | October 10, 2019 |
Call Protection: | GRTR 0.5% or YM(31),GRTR 0.5% or YM or D(82),O(7) | | Underwriting and Financial Information(1) |
Lockbox Type: | Soft/Springing Cash Management | | TTM NOI (3/31/2020): | $2,790,465 |
Additional Debt: | None | | YE 2019 NOI: | $2,708,686 |
Additional Debt Type (Balance): | NAP | | YE 2018 NOI: | $2,315,761 |
| | | YE 2017 NOI(3): | NAV |
| | | U/W Revenues: | $4,071,136 |
| | | U/W Expenses: | $1,213,243 |
Escrows and Reserves(2) | | U/W NOI: | $2,857,893 |
| Initial | Monthly | Cap | | U/W NCF: | $2,789,893 |
Taxes | $0 | Springing | NAP | | U/W DSCR based on NOI/NCF: | 2.34x / 2.29x |
Insurance | $0 | Springing | NAP | | U/W Debt Yield based on NOI/NCF: | 8.1% / 7.9% |
Replacement Reserve | $0 | Springing | $68,000 | | U/W Debt Yield at Maturity based on NOI/NCF: | 8.1% / 7.9% |
| | | | | Cut-off Date LTV Ratio: | 60.8% |
| | | | | LTV Ratio at Maturity: | 60.8% |
| | | | | | |
| | | | | | | | | |
Sources and Uses |
Sources | | | | | Uses | | | |
Original loan amount | $35,500,000 | | 62.2% | | Purchase price | $56,300,000 | | 98.7% |
Borrower sponsor equity(4) | 21,539,475 | | 37.8 | | Closing costs | 739,475 | | 1.3 |
Total Sources | $57,039,475 | | 100.0% | | Total Uses: | $57,039,475 | | 100.0% |
| (1) | All NOI, NCF and occupancy information, as well as the appraised value, were determined prior to the emergence of the novel coronavirus pandemic, and the economic disruption resulting from measures to combat the pandemic, and all DSCR, LTV and Debt Yield metrics were calculated, and the Solitude at Centennial Mortgage Loan was underwritten, based on such prior information. See “Risk Factors—Coronavirus Pandemic Has Adversely Affected the Global Economy and Will Likely Adversely Affect the Performance of the Mortgage Loans” in the Preliminary Prospectus. |
| (2) | See “Escrows” section below. |
| (3) | Certain Historical occupancies and cash flows are not available because the Solitude at Centennial Property (as defined below) was acquired by the borrower sponsors at origination. |
| (4) | The borrower sponsor equity includes the BREIT MF Holdings LLC equity contribution of $19.4 million (90% of the total borrower sponsor equity) and the Kennedy Wilson Investment Company deemed equity contribution of $2.2 million (10% of the total borrower sponsor equity). |
The Mortgage Loan. The mortgage loan (the “Solitude at Centennial Mortgage Loan”) is evidenced by one promissory note in the original principal balance of $35,500,000. The Solitude at Centennial Mortgage Loan is secured by a first priority fee interest mortgage encumbering a multifamily property located in Las Vegas, Nevada (the “Solitude at Centennial Property”).
The Borrower and Borrower Sponsors. The borrowing entity is BCORE MF Solitude LLC (the “Solitude at Centennial Borrower”), a Delaware limited liability company and a special purpose entity with one independent director. Legal counsel to the Solitude at Centennial Borrower delivered a non-consolidation opinion in connection with the origination of the Solitude at Centennial Mortgage Loan. The Solitude at Centennial Borrower is owned 90.0% by BREIT MF Holdings LLC and 10.0% by affiliates of Kennedy Wilson Investment Company (“KW”). The nonrecourse carve-out guarantor is BREIT MF Holdings LLC, which is majority owned by Blackstone Real Estate Income Trust, Inc. (“BREIT”), and the borrower sponsors are BREIT and KW. The guarantor’s full recourse obligations with respect to the Solitude at Centennial Borrower filing a voluntary petition under the bankruptcy code without the lender’s consent are capped at 20% of the principal balance of the Solitude at Centennial Mortgage Loan.
THE INFORMATION IN THIS STRUCTURAL AND COLLATERAL TERM SHEET IS NOT COMPLETE AND MAY BE AMENDED PRIOR TO THE TIME OF SALE. THIS TERM SHEET IS NOT AN OFFER TO SELL THESE SECURITIES AND IT IS NOT A SOLICITATION OF AN OFFER TO BUY THESE SECURITIES IN ANY JURISDICTION WHERE THE OFFER OR SALE IS NOT PERMITTED.
75
Multifamily – Garden | Loan #5 | Cut-off Date Balance: | | $35,500,000 |
7855 Deer Springs Way | Solitude at Centennial | Cut-off Date LTV: | | 60.8% |
Las Vegas, NV 89131 | | U/W NCF DSCR: | | 2.29x |
| | U/W NOI Debt Yield: | | 8.1% |
BREIT is a non-traded REIT that was formed in November 2015, and is focused on investing in mostly-stabilized commercial real estate properties diversified by sector. As of March 30, 2020, BREIT owned 1,158 properties including 72,000 multifamily units, 137 million square feet of industrial space, 10,000 owned hotel keys, and 2 million square feet of retail space.
The Property. The Solitude at Centennial Property is 272-unit garden-style multifamily asset located in Las Vegas, Nevada, approximately 25 miles north of the McCarran Airport. The Solitude at Centennial Property was originally built in 2000 on 13.3 acres and most recently renovated in 2019. The Solitude at Centennial Property features amenities such as a business center, clubhouse, courtyard, health club, playground, pool, spa and fitness center.
The unit mix features 112 one-bedroom units (41.2%), 144 two-bedroom units (52.9%), and 16 three-bedroom units (5.9%), totaling approximately 263,984 square feet with an average unit size of 971 square feet. Unit amenities include wood style flooring, new plumbing fixtures, new kitchen appliances, air conditioning, gas cooking ranges, and hot tubs. The complex has also upgraded its rental collection system allowing tenants the option to make rental payments through its online portal. The Solitude at Centennial Property is a two-story apartment building and contains a total of 469 parking spaces, or 1.7 parking spaces per unit, including 145 open spaces, 274 occupied spaces, 40 garage spaces and 10 ADA spaces.
The previous owner, KW acquired the Solitude at Centennial Property in May 2017 and remains in the sponsorship following BREIT’s acquisition. KW invested in excess of $2.1 million ($7,721 per unit) into the Solitude at Centennial Property in deferred maintenance as well as exterior and common area projects. Additional improvements made by KW include the full renovation of 132 units (60 units were renovated by the prior ownership). Post-acquisition BREIT and KW indicated they plan to continue to renovate the 80 units yet to be renovated and 55 of the partially renovated units as they turn. They are budgeting to invest another $2.0 million into the Solitude at Centennial Property. As of May 2020, the Solitude at Centennial Property was 93.0% occupied, with an average in-place rent of $1,181 per unit.
COVID-19 Update. As of May 13, 2020, the Solitude at Centennial Property is open and operating. The May debt service payment has been made. Approximately 97.0% of April 2020 and 90.8% of May 2020 billed residential rent was collected. As of the date hereof, the Solitude at Centennial Mortgage Loan is not subject to any modification or forbearance request.
The following table presents detailed information with respect to each of the units included at the Solitude at Centennial Property:
Solitude at Centennial Unit Mix(1)
Unit Type | Total Units | Occupied
Units | % Occupied | Average SF
per Unit | Total SF | Monthly
Average
Rent per
Unit | Concluded
Monthly
Average Market
Rent per Unit |
One Bedroom, One Bath | 34 | 34 | 100.0% | 786 | 26,724 | $961 | $1,148 |
One Bedroom, One Bath, Renovated | 78 | 73 | 93.6% | 786 | 61,308 | $1,109 | $1,148 |
Two Bedroom, Two Bath | 42 | 41 | 97.6% | 1,083 | 45,494 | $1,144 | $1,389 |
Two Bedroom, Two Bath, Renovated | 102 | 90 | 88.2% | 1,083 | 110,458 | $1,342 | $1,387 |
Three Bedroom, Two Bath | 4 | 3 | 75.0% | 1,250 | 5,000 | $1,414 | $1,550 |
Three Bedroom, Two Bath, Renovated | 12 | 12 | 100.0% | 1,250 | 15,000 | $1,487 | $1,550 |
Total/Wtd. Avg. | 272 | 253 | 93.0% | 971 | 263,984 | $1,199 | $1,298 |
| (1) | Based on the underwritten rent roll dated May 4, 2020. |
The following table presents historical occupancy percentages at the Solitude at Centennial Property:
Historical Occupancy
12/31/2016(1) | | 12/31/2017(1) | | 12/31/2018(2) | | 12/31/2019(2) | | 5/4/2020(3) |
| NAV | | NAV | | 93.2% | | 93.9% | | 93.0% |
| (1) | Historical occupancy is unavailable as the Solitude at Centennial Property was acquired by the borrower sponsors at origination. |
| (2) | Information obtained from the Solitude at Centennial Borrower. |
| (3) | Information obtained from the underwritten rent roll dated May 4, 2020. |
THE INFORMATION IN THIS STRUCTURAL AND COLLATERAL TERM SHEET IS NOT COMPLETE AND MAY BE AMENDED PRIOR TO THE TIME OF SALE. THIS TERM SHEET IS NOT AN OFFER TO SELL THESE SECURITIES AND IT IS NOT A SOLICITATION OF AN OFFER TO BUY THESE SECURITIES IN ANY JURISDICTION WHERE THE OFFER OR SALE IS NOT PERMITTED.
76
Multifamily – Garden | Loan #5 | Cut-off Date Balance: | | $35,500,000 |
7855 Deer Springs Way | Solitude at Centennial | Cut-off Date LTV: | | 60.8% |
Las Vegas, NV 89131 | | U/W NCF DSCR: | | 2.29x |
| | U/W NOI Debt Yield: | | 8.1% |
Operating History and Underwritten Net Cash Flow. The following table presents certain information relating to the operating history and underwritten net cash flow at the Solitude at Centennial Property:
Cash Flow Analysis(1)
| 2018 | | 2019 | | TTM March
2020 | | U/W(2) | | %(3) | | U/W $ per
Unit | |
Rents in Place | $3,149,024 | | $3,479,311 | | $3,557,342 | | $3,640,500 | | 92.6% | | $13,384 | |
Vacant Income | 232,279 | | 225,427 | | 238,544 | | 290,440 | | 7.4 | | 1,068 | |
Gross Potential Rent | $3,381,303 | | $3,704,738 | | $3,795,886 | | $3,930,940 | | 100.0% | | $14,452 | |
(Vacancy & Credit Loss) | (230,714) | | (224,428) | | (244,922) | | (290,440) | | (7.4) | | (1,068) | |
Other Income(4) | 309,436 | | 408,769 | | 430,636 | | 430,636 | | 11.0 | | 1,583 | |
Effective Gross Income | $ 3,460,024 | | $3,889,079 | | $3,981,600 | | $4,071,136 | | 103.6% | | $14,967 | |
| | | | | | | | | | | | |
Real Estate Taxes | 188,195 | | 193,371 | | 196,080 | | 199,225 | | 4.9 | | 732 | |
Insurance | 53,814 | | 62,335 | | 63,905 | | 70,052 | | 1.7 | | 258 | |
Management Fee | 86,463 | | 99,971 | | 99,139 | | 111,956 | | 2.8 | | 412 | |
Other Operating Expenses | 815,791 | | 824,717 | | 832,010 | | 832,010 | | 20.4 | | 3,059 | |
Total Operating Expenses | $1,144,264 | | $1,180,394 | | $1,191,135 | | $1,213,243 | | 29.8% | | $4,460 | |
| | | | | | | | | | | | |
Net Operating Income | $ 2,315,761 | | $2,708,685 | | $2,790,465 | | $2,857,892 | | 70.2% | | $10,507 | |
Replacement Reserves | 0 | | 0 | | 0 | | 68,000 | | 1.7 | | 250 | |
Net Cash Flow | $2,315,761 | | $ 2,708,685 | | $2,790,465 | | $2,789,892 | | 68.5% | | $10,257 | |
| | | | | | | | | | | | |
NOI DSCR | 1.90x | | 2.22x | | 2.29x | | 2.34x | | | | | |
NCF DSCR | 1.90x | | 2.22x | | 2.29x | | 2.29x | | | | | |
NOI Debt Yield | 6.5% | | 7.6% | | 7.9% | | 8.1% | | | | | |
NCF Debt Yield | 6.5% | | 7.6% | | 7.9% | | 7.9% | | | | | |
(1) | Historical cash flows are unavailable before 2018 as the Solitude at Centennial Property was acquired by the borrower sponsors at origination. |
(2) | For the avoidance of doubt, no COVID-19 specific adjustments have been incorporated in the lender U/W. |
(3) | Represents percent of Gross Potential Rent for all revenue lines and represents percent of Effective Gross Income for the remainder of fields. |
(4) | Other Income includes miscellaneous income such as pet fees, late fees, application fees, laundry income and cable income, as well as parking and RUBS income. |
Appraisal. The appraiser concluded that the Solitude at Centennial Property has an “as-is” appraised value of $58,400,000 as of October 10, 2019.
Environmental Matters. According to a Phase I environmental site assessment dated September 20, 2019 there was no evidence of any recognized environmental conditions at the Solitude at Centennial Property.
Market Overview and Competition. The Solitude at Centennial Property is located in the North submarket of the Las Vegas Metropolitan area. The Las Vegas central business district is approximately 4.0 miles southeast of the Solitude at Centennial Property, and the “Las Vegas Strip” is approximately 6.0 miles southeast of the Solitude at Centennial Property. Retail is an important economic segment for the Las Vegas market, with large outlets such as the Forum Shops at Caesars, Fashion Show Mall, the Grand Canal Shoppes at the Venetian, and the Crystals retail district at City Center. Opened in 2016, the T-Mobile Arena is an example of recent development initiatives; several others are planned for the coming years, including an NFL stadium that is currently under construction near the McCarran International Airport and slated to open for the 2020 NFL season.
The Solitude at Centennial Property’s local area is comprised of a mixture of commercial and residential properties. Major retail developments are located south of the Solitude at Centennial Property at the intersection of Centennial Center Blvd and W Tropical Pkwy including a Walmart Supercenter, Home Depot, and Sam’s Club. The retail developments consist of power, community and neighborhood centers and strip retail uses interspersed with professional offices along Centennial Center Blvd. There is also a Target and a Von’s grocery store within the Solitude at Centennial Property’s immediate area. The subject’s immediate area is approximately 85% in development with limited vacant land available.
According to the appraisal, the 2019 population within the Solitude at Centennial Property’s one-, three- and five-mile radius was 12,765, 109,443 and 259,652, respectively, with an average household income of $92,530, $101,330 and $93,498, respectively. The North Las Vegas submarket represents 15.3% of the total inventory in the Las Vegas market. As of the first quarter of 2020, the overall vacancy rate for the region was 4.2%, while the North Las Vegas submarket had a vacancy rate of 2.6%. The average asking rental rate for all types of space within the overall North Las Vegas submarket was $1,058 per month.
THE INFORMATION IN THIS STRUCTURAL AND COLLATERAL TERM SHEET IS NOT COMPLETE AND MAY BE AMENDED PRIOR TO THE TIME OF SALE. THIS TERM SHEET IS NOT AN OFFER TO SELL THESE SECURITIES AND IT IS NOT A SOLICITATION OF AN OFFER TO BUY THESE SECURITIES IN ANY JURISDICTION WHERE THE OFFER OR SALE IS NOT PERMITTED.
77
Multifamily – Garden | Loan #5 | Cut-off Date Balance: | | $35,500,000 |
7855 Deer Springs Way | Solitude at Centennial | Cut-off Date LTV: | | 60.8% |
Las Vegas, NV 89131 | | U/W NCF DSCR: | | 2.29x |
| | U/W NOI Debt Yield: | | 8.1% |
The appraisal identified comparable rental properties, ranging from 154 units to 320 units that were constructed between 1989 and 2011. The competitive set had a weighted average occupancy of approximately 96%, with average rents ranging from $995 to $1,550 per unit. Average rents at the Solitude at Centennial Property are slightly below the competitive set. The properties in the appraisal’s competitive set are all located in Las Vegas within approximately 6.5 miles of the Solitude at Centennial Property and are shown in the below table.
The following table presents certain information relating to comparable rental properties to the Solitude at Centennial Property:
Competitive Set(1)
| Solitude at Centennial (Subject) | Xander 3900 | Estancia
Apartments | The Grove | Inspirado | Tivoli Apartments |
Location | Las Vegas, NV | Las Vegas, NV | Las Vegas, NV | Las Vegas, NV | Las Vegas, NV | Las Vegas, NV |
Distance to Subject | -- | 5.3 miles | 6.5 miles | 6.0 miles | 3.7 miles | 3.7 miles |
Year Built | 2000 | 1997 | 1999 | 1989 | 2011 | 2007 |
Number of Units | 272 | 320 | 175 | 256 | 160 | 154 |
Average Monthly Rent (per unit) | | | | | | |
One- Bedroom | $1,109 | $1,066 | $1,110 | $995 | $1,125 | $1,095 |
Two- Bedroom | $1,144 | $1,199 | $1,330 | $1,150 | $1,350 | $1,285 |
Three- Bedroom | $1,414 | $1,550 | $1,525 | -- | $1,458 | $1,497 |
(1) | Information obtained from the appraisal and underwritten rent roll, dated May 4, 2020. |
Escrows.
Taxes Reserve – The requirement to make monthly deposits to the tax reserve is waived so long as a Trigger Period (as defined below) is not continuing. During the continuance of a Trigger Period, the Solitude at Centennial Borrower is required to make monthly deposits equal to 1/12th of the amount sufficient to pay all taxes and other charges due over the following 12 months at least 30 days prior to the due date.
Insurance Reserve – The requirement to make monthly deposits to the insurance reserve is waived so long as (i) a Trigger Period is not continuing or (ii) no event of default exists and the Solitude at Centennial Borrower provides satisfactory evidence that the Solitude at Centennial Property is insured as part of a blanket policy in accordance with the Solitude at Centennial Mortgage Loan documents. Following the occurrence and during the continuance of a Trigger Period, provided that clause (ii) of the previous sentence has not been satisfied, the Solitude at Centennial Borrower is required to make monthly deposits equal to 1/12th of the amount sufficient to renew the insurance coverage at least 30 days prior to the expiration of the insurance policies.
Replacement Reserves – During the continuance of a Trigger Period, on a monthly basis, the Solitude at Centennial Borrower is required to deposit $5,667 (1/12th of $250 per unit per annum) subject to a cap of $68,000 ($250 per unit).
Lockbox and Cash Management. The Solitude at Centennial Mortgage Loan is structured with a soft lockbox. The Solitude at Centennial Borrower is required to deposit all rents and other income from the properties into the lockbox account. All funds in the lockbox account are required to be remitted to the Solitude at Centennial Borrower on a daily basis in the absence of a Trigger Period. During the continuance of a Trigger Period, all excess cash flow, after payments made in accordance with the Solitude at Centennial Mortgage Loan documents for, amongst other things, debt service, required reserves and operating expenses, will be held as additional collateral for the Solitude at Centennial Mortgage Loan (“Excess Cash”) or, in lieu of the lender trapping such Excess Cash, the Solitude at Centennial Borrower has the right to deliver to the lender either a letter of credit for such amount or a guaranty of up to 15% of the outstanding principal balance of the Solitude at Centennial Mortgage Loan (in which case, the portion of the guaranteed funds will be released to the Solitude at Centennial Borrower), in each case, in accordance with certain requirements set forth in the in the Solitude at Centennial Mortgage Loan documents.
A “Trigger Period” commences upon (i) the occurrence and continuance of an event of default, (ii) any bankruptcy action of the Solitude at Centennial Borrower (which, with respect to an involuntary filing, is not discharged, stayed or dismissed within 90 days), or (iii) the DSCR falling below 1.20x for the two consecutive and immediately preceding calendar quarters based upon the corresponding trailing four calendar quarter period.
Property Management. Solitude at Centennial Property is managed by Alliance Southwest, LLC which manages properties throughout the West, Southwest, South-Central, Southeast, Mid-Atlantic and Northeast. Alliance Southwest, LLC has managed the Solitude at Centennial Property since May 2017 when KW acquired the Solitude at Centennial Property.
Partial Release. Not permitted.
Real Estate Substitution. Not permitted.
Subordinate and Mezzanine Indebtedness. Not permitted.
THE INFORMATION IN THIS STRUCTURAL AND COLLATERAL TERM SHEET IS NOT COMPLETE AND MAY BE AMENDED PRIOR TO THE TIME OF SALE. THIS TERM SHEET IS NOT AN OFFER TO SELL THESE SECURITIES AND IT IS NOT A SOLICITATION OF AN OFFER TO BUY THESE SECURITIES IN ANY JURISDICTION WHERE THE OFFER OR SALE IS NOT PERMITTED.
78
Multifamily – Garden | Loan #5 | Cut-off Date Balance: | | $35,500,000 |
7855 Deer Springs Way | Solitude at Centennial | Cut-off Date LTV: | | 60.8% |
Las Vegas, NV 89131 | | U/W NCF DSCR: | | 2.29x |
| | U/W NOI Debt Yield: | | 8.1% |
Ground Lease. None.
Terrorism Insurance. The Solitude at Centennial Mortgage Loan documents require that the “all risk” insurance policy required to be maintained by the Solitude at Centennial Borrower provides for terrorism in an amount equal to the full replacement cost of the Solitude at Centennial Property, together with a 12-month extended period of indemnity; provided, however, if (a) the Terrorism Risk Insurance Program Reauthorization Act of 2015 (TRIPRA) is not in effect, (b) TRIPRA is modified which results in a material increase in terrorism insurance premiums, or (c) a terrorism event occurs which results in a material increase in terrorism insurance premiums, the Solitude at Centennial Borrower will not be required to pay annual premiums of more than two times the property insurance premium.
THE INFORMATION IN THIS STRUCTURAL AND COLLATERAL TERM SHEET IS NOT COMPLETE AND MAY BE AMENDED PRIOR TO THE TIME OF SALE. THIS TERM SHEET IS NOT AN OFFER TO SELL THESE SECURITIES AND IT IS NOT A SOLICITATION OF AN OFFER TO BUY THESE SECURITIES IN ANY JURISDICTION WHERE THE OFFER OR SALE IS NOT PERMITTED.
79
| Loan #6 - 8 | Cut-off Date Balance: | | $33,000,000 |
Self Storage – Self Storage | All Aboard Storage Crossed Group | Cut-off Date LTV: | | 63.5% |
Property Addresses – Various (FL) | | U/W NCF DSCR: | | 2.68x |
| | U/W NOI Debt Yield: | | 9.6% |
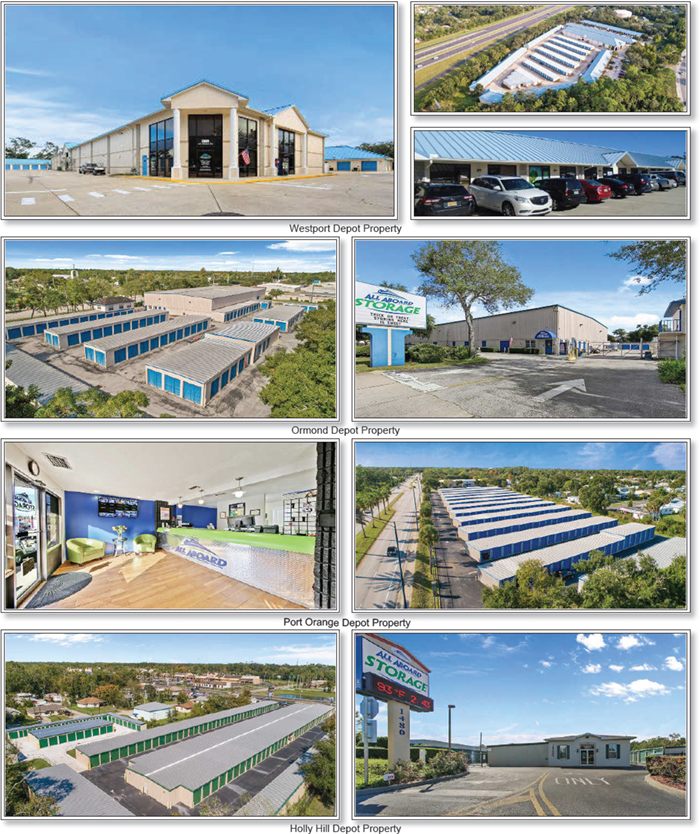
THE INFORMATION IN THIS STRUCTURAL AND COLLATERAL TERM SHEET IS NOT COMPLETE AND MAY BE AMENDED PRIOR TO THE TIME OF SALE. THIS TERM SHEET IS NOT AN OFFER TO SELL THESE SECURITIES AND IT IS NOT A SOLICITATION OF AN OFFER TO BUY THESE SECURITIES IN ANY JURISDICTION WHERE THE OFFER OR SALE IS NOT PERMITTED.
80
| Loan #6 - 8 | Cut-off Date Balance: | | $33,000,000 |
Self Storage – Self Storage | All Aboard Storage Crossed Group | Cut-off Date LTV: | | 63.5% |
Property Addresses – Various (FL) | | U/W NCF DSCR: | | 2.68x |
| | U/W NOI Debt Yield: | | 9.6% |
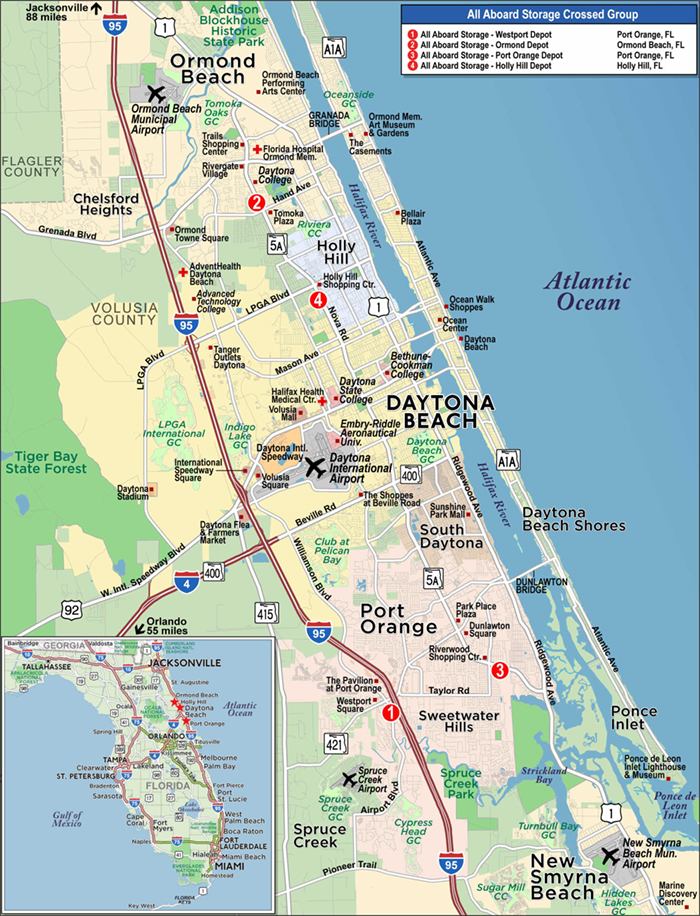
THE INFORMATION IN THIS STRUCTURAL AND COLLATERAL TERM SHEET IS NOT COMPLETE AND MAY BE AMENDED PRIOR TO THE TIME OF SALE. THIS TERM SHEET IS NOT AN OFFER TO SELL THESE SECURITIES AND IT IS NOT A SOLICITATION OF AN OFFER TO BUY THESE SECURITIES IN ANY JURISDICTION WHERE THE OFFER OR SALE IS NOT PERMITTED.
81
No. 6 - 8 – All Aboard Storage Crossed Group(1) |
|
Mortgage Loan Information | | Mortgaged Property Information |
Mortgage Loan Seller: | Wells Fargo Bank, National Association | | Single Asset/Portfolio: | Portfolio |
Credit Assessment (Fitch/KBRA/Moody’s): | NR/NR/NR | | Property Type – Subtype: | Self Storage – Self Storage |
Original Principal Balance: | $33,000,000 | | Location: | Various, FL |
Cut-off Date Balance: | $33,000,000 | | Size: | 363,291 SF |
% of Initial Pool Balance: | 4.5% | | Cut-off Date Balance Per SF: | $90.84 |
Loan Purpose: | Refinance | | Maturity Date Balance Per SF: | $90.84 |
Borrower Sponsor: | D. Andrew Clark | | Year Built/Renovated: | Various – See Table |
Guarantors: | D. Andrew Clark; D. Andrew Clark Revocable Trust | | Title Vesting: | Fee |
Mortgage Rate: | 3.4900% | | Property Manager: | Self-managed |
Note Date: | March 6, 2020 | | Current Occupancy (As of)(3)(7): | 90.9% (4/24/2020) |
Seasoning: | 3 months | | 2019 Occupancy(3): | 92.5% |
Maturity Date: | March 11, 2030 | | 2018 Occupancy(3): | 93.1% |
IO Period: | 120 months | | 2017 Occupancy(3): | 91.9% |
Loan Term (Original): | 120 months | | 2016 Occupancy(3)(4): | 89.5% |
Amortization Term (Original): | NAP | | As-Is Appraised Value(5): | $52,000,000 |
Loan Amortization Type: | Interest-only, Balloon | | As-Is Appraised Value Per SF(5)(7): | $143.14 |
Call Protection: | L(27),D(89),O(4) | | As-Is Appraisal Valuation Date(5): | January 8, 2020 |
Lockbox Type: | Springing | | Underwriting and Financial Information(6) |
Additional Debt: | None | | TTM NOI (3/31/2020)(7): | $3,308,559 |
Additional Debt Type (Balance): | NAP | | YE 2019 NOI: | $3,299,011 |
| | | YE 2018 NOI: | $3,196,672 |
| | | YE 2017 NOI: | $3,043,212 |
| | | U/W Revenues(7): | $4,476,615 |
| | | U/W Expenses(7): | $1,293,403 |
| | U/W NOI(7): | $3,183,212 |
| | | | | U/W NCF(7): | $3,128,718 |
Escrows and Reserves(2) | | U/W DSCR based on NOI/NCF(7): | 2.73x / 2.68x |
| | | | | U/W Debt Yield based on NOI/NCF(7): | 9.6% / 9.5% |
| Initial | Monthly | Cap | | U/W Debt Yield at Maturity based on NOI/NCF(7): | 9.6% / 9.5% |
Taxes | $75,225 | $23,380 | NAP | | Cut-off Date LTV Ratio(7)(8): | 63.5% |
Insurance | $20,684 | $7,543 | NAP | | LTV Ratio at Maturity(7)(8): | 63.5% |
Replacement Reserves | $0 | $4,542 | NAP | | | |
Springing Building Expansion Reserve | $0 | Springing | NAP | | | |
| | | | | | | |
Sources and Uses |
Sources | | | | | Uses | | | |
All Aboard Storage - Westport Depot & Ormond Depot original loan amount | $21,804,000 | | 66.1% | | All Aboard Storage - Westport Depot & Ormond Depot loan payoff(9) | $12,091,835 | | 36.6% |
All Aboard Storage - Port Orange Depot original loan amount | 7,972,000 | | 24.2 | | All Aboard Storage - Port Orange Depot loan payoff | 5,056,919 | | 15.3% |
All Aboard Storage - Holly Hill Depot original loan amount | 3,224,000 | | 9.8 | | All Aboard Storage - Holly Hill Depot loan payoff | 2,901,321 | | 8.8% |
| | | | | Upfront reserves | 95,909 | | 0.3% |
| | | | | Closing costs | 477,720 | | 1.4% |
| | | | | Return of equity | 12,376,296 | | 37.5% |
Total Sources | $33,000,000 | | 100.0% | | Total Uses | $33,000,000 | | 100.0% |
| | | | | | | | | |
(1) | The All Aboard Storage Crossed Mortgage Loans (as defined below) are cross-collateralized and cross-defaulted with one another. All information herein represents the All Aboard Storage Crossed Mortgage Loans presented as one mortgage loan, except as otherwise specified. With respect to each of the individual All Aboard Storage Crossed Mortgage Loans, the applicable loan-to-value ratios, debt service coverage ratios and debt yields for each such mortgage loan are based upon the ratio or yield (as applicable) for the aggregate indebtedness evidenced by each mortgage loan. On an individual basis, without regard to the cross-collateralization feature, a related mortgage loan may have a higher loan-to-value ratio, lower debt service coverage ratio and/or lower debt yield than is presented on the table above. |
(2) | See “Escrows” section below. |
(3) | See “Historical Occupancy” section below for property-level occupancy statistics. |
(4) | 2016 Occupancy excludes the Holly Hill Depot Property, as the borrower sponsor acquired the property in 2017 and such information is not available. |
(5) | See “Appraisal” section below for property-level appraised values. |
(6) | The underwriting and financial information shown represents the All Aboard Storage Crossed Mortgage Loans in aggregate. |
THE INFORMATION IN THIS STRUCTURAL AND COLLATERAL TERM SHEET IS NOT COMPLETE AND MAY BE AMENDED PRIOR TO THE TIME OF SALE. THIS TERM SHEET IS NOT AN OFFER TO SELL THESE SECURITIES AND IT IS NOT A SOLICITATION OF AN OFFER TO BUY THESE SECURITIES IN ANY JURISDICTION WHERE THE OFFER OR SALE IS NOT PERMITTED.
82
| Loan #6 - 8 | Cut-off Date Balance: | | $33,000,000 |
Self Storage – Self Storage | All Aboard Storage Crossed Group | Cut-off Date LTV: | | 63.5% |
Property Addresses – Various (FL) | | U/W NCF DSCR: | | 2.68x |
| | U/W NOI Debt Yield: | | 9.6% |
(7) | All NOI, NCF and occupancy information, as well as the appraised value, were determined prior to the emergence of the novel coronavirus pandemic, and the economic disruption resulting from measures to combat the pandemic, and all DSCR, LTV and Debt Yield metrics were calculated, and the All Aboard Storage Crossed Mortgage Loans were underwritten, based on such prior information. See “Risk Factors—Coronavirus Pandemic Has Adversely Affected the Global Economy and Will Likely Adversely Affect the Performance of the Mortgage Loans” in the Preliminary Prospectus. |
(8) | See table within “The Properties” section below for property-level Cut-off Date LTV Ratios. |
(9) | The Westport Depot Property and The Ormond Depot Property were previously securitized, along with two additional self storage properties, in the UBSBB 2013-C5 trust. Per the closing statement, the All Aboard Storage – Westport Depot & Ormond Depot Mortgage Loan was used to pay off the entire prior loan, totaling $15,893,579 (inclusive of defeasance costs). The amount shown represents the allocated payoff amount attributable to the Westport Depot Property and the Ormond Depot Property (inclusive of defeasance costs) based on the allocated loan amounts presented by a third-party market research provider. |
The Mortgage Loan. The All Aboard Storage – Westport Depot & Ormond Depot Mortgage Loan, the All Aboard Storage – Port Orange Depot Mortgage Loan, and the All Aboard Storage – Holly Hill Depot Mortgage Loan (collectively, the “All Aboard Storage Crossed Mortgage Loans”) are cross-collateralized and cross-defaulted with one another. The All Aboard Storage – Westport Depot & Ormond Depot Mortgage Loan is evidenced by a single promissory note secured by a first mortgage encumbering the fee interest in two self storage properties located in Port Orange and Ormond Beach, Florida (the “Westport Depot Property” and the “Ormond Depot Property”). The All Aboard Storage – Port Orange Mortgage Loan is evidenced by a single promissory note secured by a first mortgage encumbering the fee interest in a self storage property located in Port Orange, Florida (the “Port Orange Depot Property”). The All Aboard Storage – Holly Hill Depot Mortgage Loan is evidenced by a single promissory note secured by a first mortgage encumbering the fee interest in a self storage property located in Holly Hill, Florida (the “Holly Hill Depot Property”).
The Borrowers and Borrower Sponsor. The borrowers are comprised of four entities, each a Florida limited liability company and single purpose entity with one independent director (collectively, the “All Aboard Storage Portfolio Borrowers”). Legal counsel to the All Aboard Storage Portfolio Borrowers delivered non-consolidation opinions in connection with the origination of the All Aboard Storage Crossed Mortgage Loans. The non-recourse carve-out guarantors of the All Aboard Storage Crossed Mortgage Loans are D. Andrew Clark and the D. Andrew Clark Revocable Trust. The borrower sponsor of the All Aboard Storage Crossed Mortgage Loans is D. Andrew Clark.
D. Andrew Clark serves as the President and Chief Executive Officer of All Aboard Properties. Established over 50 years ago, All Aboard Properties currently has a portfolio of over 30 assets including self storage, retail, multifamily, and office space located in the Daytona Beach, Florida area. All Aboard Storage, a subsidiary of All Aboard Properties, has 21 properties under management throughout Florida, 17 of which are owned by the borrower sponsor. The borrower sponsor owned 11 properties (8 mortgage loans) that were subject to foreclosures, short sales and discounted payoffs between 2011 and 2015. See “Description of the Mortgage Pool–Loan Purpose; Default History, Bankruptcy Issues and Other Proceedings” in the Preliminary Prospectus.
The Properties. The Westport Depot & Ormond Depot Properties, the Port Orange Depot Property and the Holly Hill Depot Property (collectively, the “All Aboard Storage Portfolio Properties”) comprise four self storage properties built between 1983 and 2007. As of April 24, 2020 the All Aboard Storage Portfolio Properties were 90.9% occupied with individual property occupancy rates ranging from 81.1% to 96.2%. The All Aboard Storage Portfolio Properties comprise 363,291 square feet of rentable area, including 2,752 traditional self storage units (37.4% climate controlled) and 57 office units (14.2% of underwritten base rent, all at the Westport Depot Property).
Westport Depot Property
The Westport Depot Property is a 695-unit (638 conventional self storage units and 57 office units), 137,503 square-foot (including 39,840 square feet of office space) self storage facility located in Port Orange, Florida, and situated on a 12.5-acre site. The Westport Depot Property comprises 14 one-story buildings and a single two-story building constructed in 2000, 2001 and 2004. Amenities include surveillance cameras, individual locks, and on-site management. Approximately 44.0% of the conventional units are climate controlled. The office component accounts for approximately 34.3% of underwritten base rent. As of April 24, 2020, the Westport Depot Property was 92.6% occupied and has averaged 87.8% occupancy since 2009.
Ormond Depot Property
The Ormond Depot Property is a 863-unit (all conventional self storage units), 76,956 square-foot self storage facility located in Ormond Beach, Florida, and situated on a 6.6-acre site. The Ormond Depot Property comprises 14 one-story buildings and a single two-story building that were constructed in 1985, 1986, and 2006. Amenities include surveillance cameras, individual locks, keypad entry and on-site management. Approximately 46.1% of the units are climate controlled. As of April 24, 2020, the Ormond Depot Property was 96.2% occupied and has averaged 82.3% occupancy since 2009.
Port Orange Depot Property
The Port Orange Depot Property is a 901-unit (all conventional self storage units), 96,632 square-foot self storage facility located in Port Orange, Florida, and situated on a 7.1-acre site. The Port Orange Depot Property comprises 18 one-story buildings and a single two-story building that were constructed in 1983, 1985 and 1997. Amenities include surveillance cameras, individual locks, and on-site management. Approximately 26.3% of the units are climate controlled. As of April 24, 2020, the Port Orange Depot Property was 89.4% occupied and has averaged 86.0% occupancy since 2009.
THE INFORMATION IN THIS STRUCTURAL AND COLLATERAL TERM SHEET IS NOT COMPLETE AND MAY BE AMENDED PRIOR TO THE TIME OF SALE. THIS TERM SHEET IS NOT AN OFFER TO SELL THESE SECURITIES AND IT IS NOT A SOLICITATION OF AN OFFER TO BUY THESE SECURITIES IN ANY JURISDICTION WHERE THE OFFER OR SALE IS NOT PERMITTED.
83
| Loan #6 - 8 | Cut-off Date Balance: | | $33,000,000 |
Self Storage – Self Storage | All Aboard Storage Crossed Group | Cut-off Date LTV: | | 63.5% |
Property Addresses – Various (FL) | | U/W NCF DSCR: | | 2.68x |
| | U/W NOI Debt Yield: | | 9.6% |
Holly Hill Depot Property
The Holly Hill Depot Property is a 350-unit (all conventional self storage units), 52,200 square-foot self storage facility located in Holly Hill, Florida, and situated on a 3.2-acre site. The Holly Hill Depot Property comprises 6 one-story buildings that were constructed in 2007 and 2018. Amenities include surveillance cameras, individual locks, keypad entry and on-site management. Approximately 32.3% of the units are climate controlled. As of April 24, 2020, the Holly Hill Depot Property was 81.1% occupied and has averaged 83.9% occupancy since 2017.
COVID-19 Update. As of May 12, 2020, the All Aboard Storage Portfolio Properties are open and operating with normal business hours. The May debt service payments have been made. Rent payments and collections are on the first of the month. Total accounts receivable as of May 15, 2020 totaled $39,954 (11.3% of total underwritten base rent per month) compared to $39,495 (11.2% of total underwritten base rent per month) as of February 15, 2020. As of the date hereof, the All Aboard Storage Crossed Mortgage Loans are not subject to any modification or forbearance requests.
The following table presents certain information relating to the All Aboard Storage Portfolio Properties:
Property Name – Location | Cut-off Date
Balance | Cut-off Date
Balance PSF | % of Total Balance | Appraised
Value | Cut-off Date
LTV Ratio | U/W NCF | % Total
U/W NCF |
Westport Depot & Ormond Depot | $21,804,000 | $101.67 | 66.1% | $33,700,000 | 64.7% | $2,007,385 | 64.2% |
Westport Depot - Port Orange, FL | $14,383,829 | $104.61 | 43.6% | $22,600,000 | 63.6% | $1,324,843 | 42.3% |
Ormond Depot - Ormond Beach, FL | $7,420,171 | $96.42 | 22.5% | $11,100,000 | 66.8% | $682,542 | 21.8% |
Port Orange Depot - Port Orange, FL | $7,972,000 | $82.50 | 24.2% | $13,150,000 | 60.6% | $824,083 | 26.3% |
Holly Hill Depot - Holly Hill, FL | $3,224,000 | $61.76 | 9.8% | $5,150,000 | 62.6% | $297,250 | 9.5% |
Total/Weighted Average | $33,000,000 | $90.84 | 100.0% | $52,000,000 | 63.5% | $3,128,718 | 100.0% |
The following table presents information with respect to the unit mix of the All Aboard Storage Portfolio Properties:
Property Name – Location | Year Built/ Renovated | Net
Rentable
Area (SF) | % GLA | Self Storage
Units | % Climate
Controlled | Current
Occupancy
(4/24/2020) |
Westport Depot - Port Orange, FL | 2000/NAP | 137,503 | 37.8% | 638(1) | 44.0%(1) | 92.6% |
Ormond Depot - Ormond Beach, FL | 1985/NAP | 76,956 | 21.2% | 863 | 46.1% | 96.2% |
Port Orange Depot - Port Orange, FL | 1983/NAP | 96,632 | 26.6% | 901 | 26.3% | 89.4% |
Holly Hill Depot - Holly Hill, FL | 2007/NAP | 52,200 | 14.4% | 350 | 32.3% | 81.1% |
Total/Weighted Average | | 363,291 | 100.0% | 2,752 | 37.4% | 90.9% |
(1) | Excludes the 57 office units at the Westport Depot Property. |
The following table presents historical occupancy percentages at the All Aboard Storage Portfolio Properties:
Historical Occupancy
Property | | 2016(1)(2) | | 2017(1)(2) | | 2018(1)(2) | | 2019(1)(2) | | 4/24/2020(3) | |
Westport Depot | | 91.4% | | 96.3% | | 96.6% | | 96.8% | | 92.6% | |
Ormond Depot | | 92.9% | | 96.2% | | 97.2% | | 97.6% | | 96.2% | |
Port Orange Depot | | 84.0% | | 86.9% | | 91.0% | | 85.7% | | 89.4% | |
Holly Hill Depot | | NAV(4) | | 83.4% | | 81.8% | | 86.5% | | 81.1% | |
(1) | Information obtained from the borrower. |
(2) | Represents the average occupancy rate over the course of each year. |
(3) | Information obtained from the underwritten rent roll. |
(4) | The borrower sponsor acquired the Holly Hill Depot Property in 2017, therefore, 2016 historical occupancy information is not available. |
THE INFORMATION IN THIS STRUCTURAL AND COLLATERAL TERM SHEET IS NOT COMPLETE AND MAY BE AMENDED PRIOR TO THE TIME OF SALE. THIS TERM SHEET IS NOT AN OFFER TO SELL THESE SECURITIES AND IT IS NOT A SOLICITATION OF AN OFFER TO BUY THESE SECURITIES IN ANY JURISDICTION WHERE THE OFFER OR SALE IS NOT PERMITTED.
84
| Loan #6 - 8 | Cut-off Date Balance: | | $33,000,000 |
Self Storage – Self Storage | All Aboard Storage Crossed Group | Cut-off Date LTV: | | 63.5% |
Property Addresses – Various (FL) | | U/W NCF DSCR: | | 2.68x |
| | U/W NOI Debt Yield: | | 9.6% |
Operating History and Underwritten Net Cash Flow. The following table presents certain information relating to the historical operating performance and underwritten net cash flow at the All Aboard Storage Portfolio Properties:
Cash Flow Analysis
| | 2017 | | 2018 | | 2019 | | TTM 3/31/2020 | | U/W(1) | | %(2) | | U/W $ per SF | |
Base Rent | | $4,292,195 | | $4,528,869 | | $4,708,873 | | $4,729,598 | | $4,255,847 | | 86.6% | | $11.71 | |
Grossed Up Vacant Space | | 0 | | 0 | | 0 | | 0 | | 439,978 | | 8.9 | | 1.21 | |
Gross Potential Rent | | $4,292,195 | | $4,528,869 | | $4,708,873 | | $4,729,598 | | $4,695,826 | | 95.5% | | $12.93 | |
Parking Income(3) | | 67,478 | | 66,371 | | 69,709 | | 72,525 | | 38,476 | | 0.8 | | 0.11 | |
Other Income(4) | | 194,023 | | 195,318 | | 178,731 | | 182,291 | | 182,291 | | 3.7 | | 0.50 | |
Net Rental Income | | $4,553,696 | | $4,790,559 | | $4,957,313 | | $4,984,415 | | $4,916,593 | | 100.0% | | $13.53 | |
(Vacancy) | | (294,435) | | (314,545) | | (397,632) | | (398,009) | | (439,978)(5) | | (9.4) | | (1.21) | |
Effective Gross Income | | $4,259,260 | | $4,476,013 | | $4,559,681 | | $4,586,406 | | $4,476,615 | | 91.1% | | $12.32 | |
| | | | | | | | | | | | | | | |
Real Estate Taxes | | 246,700 | | 251,146 | | 259,512 | | 262,377 | | 294,304 | | 6.6 | | 0.81 | |
Insurance | | 77,874 | | 78,184 | | 82,336 | | 83,825 | | 86,201 | | 1.9 | | 0.24 | |
Management Fee | | 185,226 | | 241,660 | | 241,393 | | 242,577 | | 223,831 | | 5.0 | | 0.62 | |
Other Operating Expenses | | 706,249 | | 708,351 | | 677,429 | | 689,067 | | 689,067 | | 15.4 | | 1.90 | |
Total Operating Expenses | | $1,216,049 | | $1,279,341 | | $1,260,670 | | $1,277,846 | | $1,293,403 | | 28.9% | | $3.56 | |
| | | | | | | | | | | | | | | |
Net Operating Income | | $3,043,212 | | $3,196,672 | | $3,299,011 | | $3,308,559 | | $3,183,212 | | 71.1% | | $8.76 | |
Replacement Reserves | | 0 | | 0 | | 0 | | 0 | | 54,494 | | 1.2 | | 0.15 | |
Net Cash Flow | | $3,043,212 | | $3,196,672 | | $3,299,011 | | $3,308,559 | | $3,128,718 | | 69.9% | | $8.61 | |
| | | | | | | | | | | | | | | |
NOI DSCR | | 2.61x | | 2.74x | | 2.83x | | 2.83x | | 2.73x | | | | | |
NCF DSCR | | 2.61x | | 2.74x | | 2.83x | | 2.83x | | 2.68x | | | | | |
NOI Debt Yield | | 9.2% | | 9.7% | | 10.0% | | 10.0% | | 9.6% | | | | | |
NCF Debt Yield | | 9.2% | | 9.7% | | 10.0% | | 10.0% | | 9.5% | | | | | |
(1) | For the avoidance of doubt, no COVID-19 specific adjustments have been incorporated in the lender U/W. |
(2) | Represents (i) percent of Net Rental Income for all revenue fields, (ii) percent of Gross Potential Rent for Vacancy and (iii) percent of Effective Gross Income for all other fields. |
(3) | Parking income includes income from 38 RV/car/boat parking spaces at the Westport Depot Property and the Port Orange Depot Property. |
(4) | Other income includes late payment charges, locks, shipping, insurance, forfeited deposits, billboard income, and other miscellaneous charges. |
(5) | The underwritten economic vacancy is 9.4%. The All Aboard Storage Portfolio Properties were 90.9% physically occupied as of April 24, 2020. |
Appraisals. The appraiser concluded to an “as-is” appraised value for the Westport Depot Property of $22,600,000 as of January 8, 2020. The appraiser concluded to an “as-is” appraised value for the Ormond Depot Property of $11,100,000 as of January 8, 2020. The appraiser concluded to an “as-is” appraised value for the Port Orange Depot Property of $13,150,000 as of January 8, 2020. The appraiser concluded to an “as-is” appraised value for the Holly Hill Depot Property of $5,150,000 as of January 8, 2020. The sum of the individual “as-is” appraised values for each of the All Aboard Storage Portfolio Properties equates to $52,000,000, as of January 8, 2020.
Environmental Matters. Based on Phase I environmental site assessments dated as of January 14, 2020, there was no evidence of any recognized environmental conditions at any of the All Aboard Storage Portfolio Properties.
Market Overview and Competition. The All Aboard Storage Portfolio Properties are located in the Deltona-Daytona Beach, Florida metropolitan statistical area, within 14.6 miles of each other. The All Aboard Storage Portfolio Properties are located an average of 2.8 miles from Interstate 95 and an average of 7.0 miles from the Daytona International Airport.
According to the appraisals, the All Aboard Storage Portfolio Properties are situated within the Daytona Metrocore submarket, which reported an 11.6% vacancy rate as of 2019. The average asking rents in the Daytona Metrocore submarket were $102.21 per unit per month for a 10x10 non-climate controlled unit and $139.11 per unit per month for a 10x10 climate controlled unit. The appraiser concluded to average market rents for the All Aboard Storage Portfolio Properties of $122 per unit per month for 10x10 non-climate controlled units (compared to average in-place rent of $119) and $146 per unit per month for 10x10 climate controlled units (compared to average in-place rent of $141).
THE INFORMATION IN THIS STRUCTURAL AND COLLATERAL TERM SHEET IS NOT COMPLETE AND MAY BE AMENDED PRIOR TO THE TIME OF SALE. THIS TERM SHEET IS NOT AN OFFER TO SELL THESE SECURITIES AND IT IS NOT A SOLICITATION OF AN OFFER TO BUY THESE SECURITIES IN ANY JURISDICTION WHERE THE OFFER OR SALE IS NOT PERMITTED.
85
| Loan #6 - 8 | Cut-off Date Balance: | | $33,000,000 |
Self Storage – Self Storage | All Aboard Storage Crossed Group | Cut-off Date LTV: | | 63.5% |
Property Addresses – Various (FL) | | U/W NCF DSCR: | | 2.68x |
| | U/W NOI Debt Yield: | | 9.6% |
The following table presents certain local demographic data related to the All Aboard Storage Portfolio Properties:
Property Name – Location | 2019 Population
(within 1-mi. / 3-mi. / 5-mi. Radius) | 2019 Average Household Income
(within 1-mi. / 3-mi. / 5-mi. Radius) |
Westport Depot - Port Orange, FL | 6,824 / 53,318 / 96,625 | $90,648 / $77,090 / $70,735 |
Ormond Depot - Ormond Beach, FL | 10,401 / 54,088 / 106,208 | $55,684 / $63,149 / $62,716 |
Port Orange Depot - Port Orange, FL | 11,329 / 47,846 / 104,303 | $55,461 / $67,574 / $70,708 |
Holly Hill Depot - Holly Hill, FL | 12,839 / 69,658 / 119,800 | $44,461 / $46,501 / 54,333 |
The following table presents certain information relating to some comparable self storage properties for the Westport Depot Property Port Orange Depot Property:
Competitive Set(1)
(Westport Depot Property and Port Orange Depot Property)
| Westport Depot Property (Subject) | Port Orange Depot Property (Subject) | Public Storage | All Aboard Storage(2) | All Aboard Storage(2) | Extra Space Storage |
Location | Port Orange, FL | Port Orange, FL | South Daytona, FL | Port Orange, FL | Port Orange, FL | Port Orange, FL |
Distance to Westport Depot | -- | 2.5 miles | 3.8 miles | 2.7 miles | 2.4 miles | 0.2 miles |
Distance to Port Orange Depot | 2.5 miles | -- | 3.3 miles | 1.8 miles | 1.5 miles | 2.3 miles |
Property Type | Self Storage | Self Storage | Self Storage | Self Storage | Self Storage | Self Storage |
Year Built/ Renovated | 2000 / NAP | 1983 / NAP | 2006/NAP | 1969/NAP | 1982/NAP | 2018/NAP |
Total Units | 695(3)(4) | 901(3) | 450 | 200 | 375 | 785 |
% of Climate Controlled Units | 44.0%(3)(4) | 26.3%(3) | NAV | 0.0% | NAV | NAV |
Total SF | 137,503 SF(3) | 96,632 SF(3) | 52,250 SF | 28,000 SF | 43,185 SF | 74,525 SF |
Total Occupancy | 92.6%(3) | 89.4%(3) | 96.0% | 96.0% | 93.0% | 52.0% |
(1) | Information obtained from the appraisals. The appraiser identified the same competitive set for the both the Westport Depot Property and the Port Orange Depot Property |
(2) | The property is owned by the borrower sponsor but is not collateral for the All Aboard Storage Crossed Mortgage Loans. |
(3) | Information obtained from the underwritten rent rolls as of 4/24/2020. |
(4) | The Westport Depot Property’s 695 total units contain 638 conventional self storage units and 57 office units totaling 39,840 square feet. |
The following table presents certain information relating to some comparable self storage properties for the Ormond Depot Property:
Competitive Set(1)
(Ormond Depot Property)
| Ormond Depot Property (Subject) | Public Storage | All Aboard
Storage(2) | All Aboard
Storage(2) | Simply Self
Storage | Holly Hill Depot
Property |
Location | Ormond Beach, FL | Ormond Beach, FL | Ormond Beach, FL | Ormond Beach, FL | Ormond Beach, FL | Holly Hill, FL |
Distance to Ormond Depot | -- | 1.2 miles | 1.1 miles | 1.4 miles | 1.4 miles | 2.5 miles |
Property Type | Self Storage | Self Storage | Self Storage | Self Storage | Self Storage | Self Storage |
Year Built/Renovated | 1985/NAP | 1999/NAP | 1986/NAP | 1983/NAP | 2002/NAP | 2007/NAP |
Total Units | 863(3) | 515 | 250 | 80 | 605 | 350(3) |
% of Climate Controlled Units | 46.1%(3) | NAV | 0.0% | 0.0% | NAV | 32.3%(3) |
Total SF | 76,956 SF(3) | 59,100 SF | 29,725 SF | 9,900 SF | 69,700 SF | 52,200 SF(3) |
Occupancy | 96.2%(3) | 94.0% | 99.0% | 99.0% | 94.0% | 81.1%(3) |
(1) | Information obtained from the appraisal. |
(2) | The property is owned by the borrower sponsor but is not collateral for the All Aboard Storage Crossed Mortgage Loans. |
(3) | Information obtained from the underwritten rent roll as of 4/24/2020. |
THE INFORMATION IN THIS STRUCTURAL AND COLLATERAL TERM SHEET IS NOT COMPLETE AND MAY BE AMENDED PRIOR TO THE TIME OF SALE. THIS TERM SHEET IS NOT AN OFFER TO SELL THESE SECURITIES AND IT IS NOT A SOLICITATION OF AN OFFER TO BUY THESE SECURITIES IN ANY JURISDICTION WHERE THE OFFER OR SALE IS NOT PERMITTED.
86
| Loan #6 - 8 | Cut-off Date Balance: | | $33,000,000 |
Self Storage – Self Storage | All Aboard Storage Crossed Group | Cut-off Date LTV: | | 63.5% |
Property Addresses – Various (FL) | | U/W NCF DSCR: | | 2.68x |
| | U/W NOI Debt Yield: | | 9.6% |
The following table presents certain information relating to some comparable self storage properties for the Holly Hill Depot Property:
Competitive Set(1)
(Holly Hill Depot Property)
| Holly Hill Depot Property (Subject) | CubeSmart | All Aboard Storage(2) | U-Store | Public Storage | All Aboard Storage(2) |
Location | Holly Hill, FL | Daytona Beach, FL | Daytona Beach, FL | Daytona Beach, FL | Daytona Beach, FL | Daytona Beach, FL |
Distance to Holly Hill Depot | -- | 0.6 miles | 1.8 miles | 1.9 miles | 2.0 miles | 2.4 miles |
Property Type | Self Storage | Self Storage | Self Storage | Self Storage | Self Storage | Self Storage |
Year Built/Renovated | 2007/NAP | 1979/NAP | 1987/NAP | 1976/NAP | 1983/NAP | 1973/NAP |
Total Units | 350(3) | 741 | 875 | 325 | 300 | 500 |
% of Climate Controlled Units | 32.3%(3) | 5.0% | NAV | NAV | NAV | NAV |
Total SF | 52,200 SF(3) | 62,205 SF | 100,450 SF | 37,475 SF | 34,400 SF | 58,225 SF |
Occupancy | 81.1%(3) | 78.0% | 95.0% | 93.0% | 98.0% | 94.0% |
(1) | Information obtained from the appraisal. |
(2) | The property is owned by the borrower sponsor but is not collateral for the All Aboard Storage Crossed Mortgage Loans. |
(3) | Information obtained from the underwritten rent roll as of 4/24/2020. |
Escrows.
Real Estate Taxes – The loan documents for all of the All Aboard Storage Crossed Mortgage Loans require upfront real estate tax reserves in an aggregate amount of $75,225 and ongoing monthly real estate tax reserves in an amount equal to one-twelfth of the real estate taxes that the lender estimates will be payable during the next 12 months (initially totaling $23,380).
Insurance – The loan documents for all of the All Aboard Storage Crossed Mortgage Loans require upfront insurance reserves in an aggregate amount of $20,684 and ongoing monthly insurance reserves in an amount equal to one-twelfth of the insurance premiums that the lender estimates will be payable during the next 12 months (initially totaling $7,543).
Replacement Reserve – The loan documents for all of the All Aboard Storage Crossed Mortgage Loans require ongoing monthly replacement reserves in an aggregate amount of $4,542.
Springing Building Expansion Reserve – The All Aboard Storage – Westport Depot & Ormond Depot Mortgage Loan documents require a springing deposit of 120% of the total estimated costs to construct approximately 130 to 180 new climate controlled units at the Ormond Depot Property. If constructed, the new units would require lender approval and would serve as collateral for The All Aboard Storage – Westport Depot & Ormond Depot Mortgage Loan.
Lockbox and Cash Management. Upon the occurrence and continuance of a Cash Trap Event Period (as defined below), the All Aboard Storage Portfolio Borrowers are required to establish lender-controlled lockbox accounts and the All Aboard Storage Portfolio Borrowers and property managers are required to deposit all rents into the lockbox account within three business days. During a Cash Trap Event Period, funds in the lockbox accounts are required to be swept to a lender-controlled cash management account, and all excess funds are required to be swept to an excess cash flow subaccount controlled by the lender.
A “Cash Trap Event Period” will commence upon the earlier of the following:
| (i) | the occurrence and continuance of an event of default on any of the All Aboard Storage Crossed Mortgage Loans; or |
| (ii) | the “Aggregate Net Cash Flow Debt Yield” (calculated based on the aggregate net cash flow from all four All Aboard Storage Portfolio Properties divided by the aggregate outstanding loan balance of all of the All Aboard Storage Crossed Mortgage Loans) being less than 7.5% (tested quarterly). |
A Cash Trap Event Period will end upon the occurrence of the following:
| ● | with regard to clause (i), the cure of such event of default; or |
| ● | with regard to clause (ii), the Aggregate Net Cash Flow Debt Yield being at least 8.0% for two consecutive calendar quarters. |
Property Management. The All Aboard Storage Portfolio Properties are managed by an affiliate of the All Aboard Storage Portfolio Borrowers.
Partial Release. Not permitted.
Real Estate Substitution. Not permitted.
Subordinate and Mezzanine Indebtedness. Not permitted.
THE INFORMATION IN THIS STRUCTURAL AND COLLATERAL TERM SHEET IS NOT COMPLETE AND MAY BE AMENDED PRIOR TO THE TIME OF SALE. THIS TERM SHEET IS NOT AN OFFER TO SELL THESE SECURITIES AND IT IS NOT A SOLICITATION OF AN OFFER TO BUY THESE SECURITIES IN ANY JURISDICTION WHERE THE OFFER OR SALE IS NOT PERMITTED.
87
| Loan #6 - 8 | Cut-off Date Balance: | | $33,000,000 |
Self Storage – Self Storage | All Aboard Storage Crossed Group | Cut-off Date LTV: | | 63.5% |
Property Addresses – Various (FL) | | U/W NCF DSCR: | | 2.68x |
| | U/W NOI Debt Yield: | | 9.6% |
Ground Lease. None.
Terrorism Insurance. The All Aboard Storage Crossed Mortgage Loans documents require that the “all risk” insurance policies required to be maintained by the All Aboard Storage Portfolio Borrowers provides coverage for terrorism in an amount equal to the full replacement cost of the All Aboard Storage Portfolio Properties, as well as business interruption insurance covering no less than the 12-month period following the occurrence of a casualty event, together with a 6-month extended period of indemnity.
THE INFORMATION IN THIS STRUCTURAL AND COLLATERAL TERM SHEET IS NOT COMPLETE AND MAY BE AMENDED PRIOR TO THE TIME OF SALE. THIS TERM SHEET IS NOT AN OFFER TO SELL THESE SECURITIES AND IT IS NOT A SOLICITATION OF AN OFFER TO BUY THESE SECURITIES IN ANY JURISDICTION WHERE THE OFFER OR SALE IS NOT PERMITTED.
88
Office - Suburban | Loan #9 | Cut-off Date Balance: | | $31,000,000 |
7301 Metro Center Drive | Met Center 15 | Cut-off Date LTV: | | 57.9% |
Austin, TX 78744 | | U/W NCF DSCR: | | 1.99x |
| | U/W NOI Debt Yield: | | 12.7% |
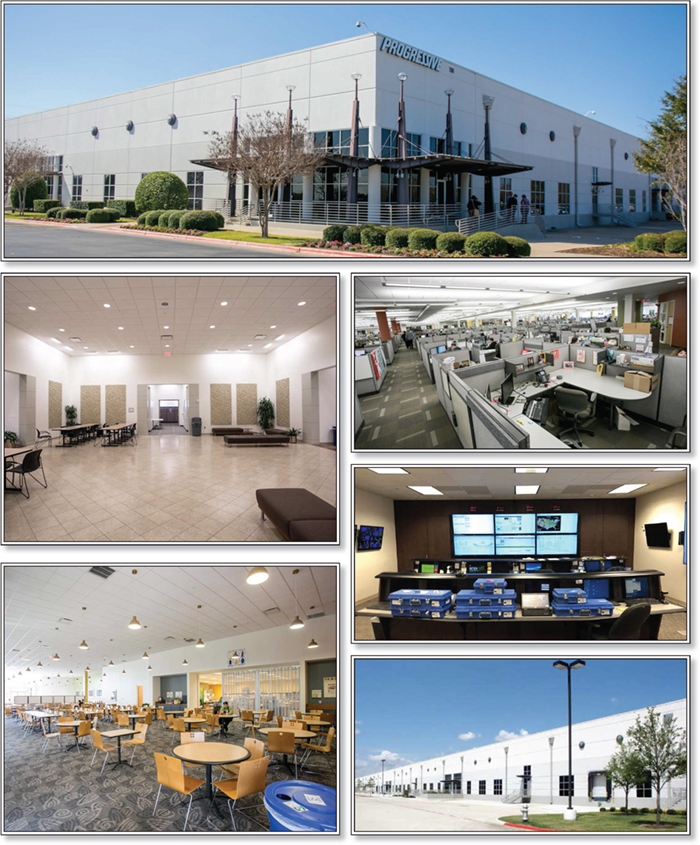
THE INFORMATION IN THIS STRUCTURAL AND COLLATERAL TERM SHEET IS NOT COMPLETE AND MAY BE AMENDED PRIOR TO THE TIME OF SALE. THIS TERM SHEET IS NOT AN OFFER TO SELL THESE SECURITIES AND IT IS NOT A SOLICITATION OF AN OFFER TO BUY THESE SECURITIES IN ANY JURISDICTION WHERE THE OFFER OR SALE IS NOT PERMITTED.
89
Office - Suburban | Loan #9 | Cut-off Date Balance: | | $31,000,000 |
7301 Metro Center Drive | Met Center 15 | Cut-off Date LTV: | | 57.9% |
Austin, TX 78744 | | U/W NCF DSCR: | | 1.99x |
| | U/W NOI Debt Yield: | | 12.7% |
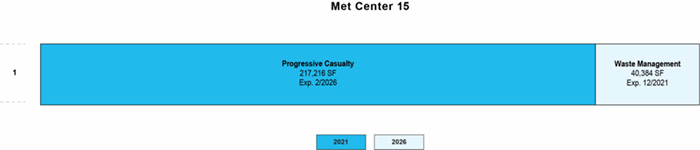
THE INFORMATION IN THIS STRUCTURAL AND COLLATERAL TERM SHEET IS NOT COMPLETE AND MAY BE AMENDED PRIOR TO THE TIME OF SALE. THIS TERM SHEET IS NOT AN OFFER TO SELL THESE SECURITIES AND IT IS NOT A SOLICITATION OF AN OFFER TO BUY THESE SECURITIES IN ANY JURISDICTION WHERE THE OFFER OR SALE IS NOT PERMITTED.
90
Office - Suburban | Loan #9 | Cut-off Date Balance: | | $31,000,000 |
7301 Metro Center Drive | Met Center 15 | Cut-off Date LTV: | | 57.9% |
Austin, TX 78744 | | U/W NCF DSCR: | | 1.99x |
| | U/W NOI Debt Yield: | | 12.7% |

THE INFORMATION IN THIS STRUCTURAL AND COLLATERAL TERM SHEET IS NOT COMPLETE AND MAY BE AMENDED PRIOR TO THE TIME OF SALE. THIS TERM SHEET IS NOT AN OFFER TO SELL THESE SECURITIES AND IT IS NOT A SOLICITATION OF AN OFFER TO BUY THESE SECURITIES IN ANY JURISDICTION WHERE THE OFFER OR SALE IS NOT PERMITTED.
91
Mortgage Loan Information | | Mortgaged Property Information |
Mortgage Loan Seller: | Barclays Capital Real Estate Inc. | | Single Asset/Portfolio: | Single Asset |
Credit Assessment (Fitch/KBRA/Moody’s): | NR/NR/NR | | Property Type – Subtype: | Office – Suburban |
Original Principal Balance(1): | $31,000,000 | | Location: | Austin, TX |
Cut-off Date Balance(1): | $31,000,000 | | Net Rentable Size: | 257,600 SF |
% of Initial Pool Balance: | 4.2% | | Cut-off Date Balance Per SF(1): | $120.34 |
Loan Purpose: | Refinance | | Maturity Date Balance Per SF(1): | $100.26 |
Borrower Sponsors: | Quynh Palomino; Lloyd W. Kendall, Jr. | | Year Built/Renovated: | 2001/NAP |
Guarantors: | Quynh Palomino; Lloyd W. Kendall, Jr. | | Title Vesting: | Fee |
Mortgage Rate: | 3.61193% | | Property Manager(3): | Cushman and Wakefield U.S. Inc. |
Note Date: | February 14, 2020 | | Current Occupancy (As of): | 100.0% (5/5/2020) |
Seasoning: | 3 months | | YE 2018 Occupancy: | 100.0% |
Maturity Date: | March 6, 2030 | | YE 2017 Occupancy: | 100.0% |
IO Period: | 24 months | | YE 2016 Occupancy: | 100.0% |
Loan Term (Original): | 120 months | | YE 2015 Occupancy: | 100.0% |
Amortization Term (Original): | 360 months | | As-Is Appraised Value(5): | $53,500,000 |
Loan Amortization Type: | Interest-only, Amortizing Balloon | | As-Is Appraised Value Per SF(5): | $207.69 |
Call Protection: | L(27),D(89),O(4) | | As-Is Appraisal Valuation Date: | November 7, 2019 |
Lockbox Type: | Hard/Springing | | Underwriting and Financial Information |
Additional Debt(1): | Yes | | TTM (3/31/2020) NOI(4): | $3,284,730 |
Additional Debt Type (Balance)(1): | Mezzanine ($10,000,000) | | YE 2019 NOI: | $3,265,007 |
| | | YE 2018 NOI: | $3,192,980 |
| | | YE 2017 NOI: | $2,893,906 |
| | | U/W Revenues: | $5,650,935 |
| | | U/W Expenses: | $1,701,129 |
Escrows and Reserves(2) | | U/W NOI(4): | $3,949,806 |
| Initial | Monthly | Cap | | U/W NCF: | $3,374,493 |
Immediate Repairs | $137,669 | $0 | NAP | | U/W DSCR based on NOI/NCF(1): | 2.33x / 1.99x |
Taxes | $263,321 | $87,774 | NAP | | U/W Debt Yield based on NOI/NCF(1): | 12.7% / 10.9% |
Insurance | $0 | Springing | NAP | | U/W Debt Yield at Maturity based on NOI/NCF(1): | 15.3% / 13.1% |
Replacement Reserve | $0 | $6,869 | NAP | | Cut-off Date LTV Ratio(1): | 57.9% |
TI/LC Reserve | $0 | $26,833 | $1,932,000 | | LTV Ratio at Maturity or ARD(1): | 48.3% |
Outstanding TI/LC | $1,629,120 | $0 | NAP | | | |
Free Rent Reserve | $909,592 | $0 | NAP | | | |
| | | | | | | |
Sources and Uses |
Sources | | | Uses | | |
Original mortgage loan amount | $31,000,000 | 75.6 | % | Loan payoff(6) | $36,496,830 | 89.0% |
Mezzanine loan | 10,000,000 | 24.4 | | Upfront reserves | 2,939,702 | 7.2 |
| | | Return of equity | 847,500 | 2.1 |
| | | Closing costs | 715,968 | 1.7 |
Total Sources | $41,000,000 | 100.0 | % | Total Uses | $41,000,000 | 100.0% |
(1) | The Met Center 15 Whole Loan (as defined below) is evidenced by (i) the Met Center 15 Mortgage Loan (as defined below) with an original balance of $31,000,000 and (ii) the Met Center 15 Mezzanine Loan (as defined below) with an original balance of $10,000,000. The Cut-off Date Balance Per SF, Maturity Date Balance Per SF, U/W Debt Yield based on NOI/NCF, U/W DSCR based on NOI/NCF, Cut-off Date LTV Ratio and LTV Ratio at Maturity or ARD numbers presented above are based on the Met Center 15 Mortgage Loan. The Cut-off Date Balance Per SF, Maturity Date Balance Per SF, U/W Debt Yield based on NOI/NCF, U/W DSCR based on NOI/NCF, Cut-off Date LTV Ratio and LTV Ratio at Maturity or ARD numbers presented above based on the combined balance of the Met Center 15 Whole Loan are $159.16, $139.08, 9.6%/8.2%, 1.46x/1.25x, 76.6% and 67.0%, respectively. |
(2) | See “Escrows” section below. |
(3) | See “Property Management” section below for additional details. |
(4) | The increase from TTM 3/31/2020 NOI to U/W NOI is primarily due to $972,111 of underwritten rent steps through March 2021. |
(5) | The appraised value was determined prior to the emergence of the novel coronavirus pandemic and the economic disruption resulting from measures to combat the pandemic, and all LTV metrics were calculated based on such prior information. See “Risk Factors—Coronavirus Pandemic Has Adversely Affected the Global Economy and Will Likely Adversely Affect the Performance of the Mortgage Loans” in the Preliminary Prospectus. |
(6) | Loan payoff includes a $7,921,623 preferred equity payoff. |
The Mortgage Loan. The mortgage loan (the “Met Center 15 Mortgage Loan”) is evidenced by a single promissory note secured by a first mortgage encumbering the fee interest in a 257,600 square foot office flex building located in Austin, Texas (the “Met Center 15 Property”).
THE INFORMATION IN THIS STRUCTURAL AND COLLATERAL TERM SHEET IS NOT COMPLETE AND MAY BE AMENDED PRIOR TO THE TIME OF SALE. THIS TERM SHEET IS NOT AN OFFER TO SELL THESE SECURITIES AND IT IS NOT A SOLICITATION OF AN OFFER TO BUY THESE SECURITIES IN ANY JURISDICTION WHERE THE OFFER OR SALE IS NOT PERMITTED.
92
Office - Suburban | Loan #9 | Cut-off Date Balance: | | $31,000,000 |
7301 Metro Center Drive | Met Center 15 | Cut-off Date LTV: | | 57.9% |
Austin, TX 78744 | | U/W NCF DSCR: | | 1.99x |
| | U/W NOI Debt Yield: | | 12.7% |
The Borrower and Borrower Sponsor. The borrowing entity for the Met Center 15 Mortgage Loan is MC 15 Owner, LLC, a Delaware limited liability company and a special purpose entity with one independent director in its organizational structure. Legal counsel to the borrower delivered a non-consolidation opinion in connection with the origination of the Met Center 15 Mortgage Loan. Quynh Palomino and Lloyd W. Kendall, Jr. are the borrower sponsors and guarantors of certain nonrecourse carve-outs and environmental indemnities under the Met Center 15 Mortgage Loan.
Borrower sponsors, Quynh Palomino and Lloyd W. Kendall, Jr., are both principals of Virtua Partners LLC (“Virtua”). Virtua is a global private equity firm that specializes in commercial real estate focusing on investment grade office, industrial, and hospitality properties. Transactions include value-add properties that are repositioned, core properties that are held for cash flow and ground-up development projects. Virtua manages approximately 3.2 million square feet of commercial real estate investments across the United States. Virtua originally became the borrower sponsor of the Met Center 15 Property in 2016 when the prior owner declared bankruptcy due to problems with the building’s foundation and underlying soil treatment. Virtua settled disputes with the special servicer and spent approximately $4.5 million remediating the building’s foundation. Additionally, Quynh Palomino had experienced a previous foreclosure related to a vacant land parcel in California. See “Description of the Mortgage Pool—Loan Purpose; Default History, Bankruptcy Issues and Other Proceedings” in the Preliminary Prospectus.
The Property. The Met Center 15 Property is a 257,600 square-foot office property located approximately five miles southeast of the Austin, Texas central business district and adjacent to the Austin-Bergstrom Airport. Built in 2001, the Met Center 15 Property has undergone approximately $5.4 million in capital expenditures since 2015. The Met Center 15 Property is part of the larger Met Center Business Park, a 550-acre master planned mixed-use development. Amenities in the Met Center Business Park include seven hotels with conference facilities, 24-hour restaurants, a sports complex, multiple fiber optic lines, hike-and-bike trails and an 18-hole disc golf course. The Met Center 15 Property is part of the Met Center Property Owners Association, which consists of 19 buildings of the Met Center Business Park. The Met Center 15 Property is responsible for its pro-rata share of the common area expenses (approximately 17.393%) that are passed through to the tenants at the Met Center 15 Property. Parking at the Met Center 15 Property is provided by 1,605 surface spaces, resulting in a parking ratio of 6.2 spaces per 1,000 square feet. As of May 5, 2020, the Met Center 15 Property was 100.0% occupied by two investment-grade rated tenants.
COVID-19 Update. As of May 6, 2020, the Met Center 15 Property is open. The State of Texas’s stay-at-home order expired on April 30, 2020; however, some tenants have employees working remotely or operating with limited employees on-site. The May debt service payment has been made. All of the tenants by count, square footage and underwritten base rent have paid rent for May 2020. As of the date hereof, the Met Center 15 Mortgage Loan is not subject to any modification or forbearance request.
Major Tenants.
Largest Tenant: Progressive Casualty (217,216 square feet; 84.3% of net rentable area; 85.1% of underwritten base rent; 2/28/2026 lease expiration; NYSE: PGR) – Founded in 1937, Progressive Casualty is currently one of the largest auto insurance groups in the United States. Progressive Casualty has more than 10 million policies in force and offers policies for automobiles, boats, motorcycles and RVs. Progressive Casualty primarily uses their space at the Met Center 15 Property as a customer service and claims processing center. Approximately 1,500 employees work at the Met Center 15 Property in customer service, sales and claims. This location is the Austin corporate campus for Progressive Casualty and includes amenities such as a cafeteria, fitness center, employee training center and health center. Progressive Casualty has been a tenant at the Met Center 15 Property since 2005 when they purchased the Met Center 15 Property in order to consolidate their corporate campus in the area and entered into a sale/leaseback with the former ownership group. In November 2019, Progressive Casualty executed an early lease renewal extending the term from February 2021 to February 2026, and increasing their base rent by 35.6%. Progressive Casualty’s lease expiration is February 28, 2026 with three remaining three-year renewal options. Progressive Casualty has the right to terminate its lease effective as of February 29, 2024 or any calendar month thereafter with nine months’ prior notice and a termination payment equal to the unamortized portion of $1,629,120 (the “Construction Allowance”) plus $1,500,000. If Progressive Casualty were to provide notice to terminate any of its space, a cash flow sweep would commence. See “Trigger Period” section below.
Second Largest Tenant: Waste Management (40,384 square feet; 15.7% of net rentable area; 14.9% of underwritten base rent; 12/31/2021 lease expiration; NYSE: WM) – Waste Management is the largest environmental solutions provider in North America, serving more than 20 million customers in the United States, Canada and Puerto Rico. Waste Management has the largest network of recycling facilities, transfer stations and landfills in the industry. The company is also a renewable energy provider by recovering naturally-occurring gas inside landfills to generate electricity. Waste Management operates its data and disaster recovery center at the Met Center 15 Property. Their facility includes fiber and redundant power, which the tenant has invested a significant amount upgrading their space over the last several years. Additionally, the Met Center 15 Property serves as the tenant’s main data storage facility for the United States. Waste Management has been a tenant at the Met Center 15 Property since 2003, recently renewed its lease in 2017 and has a current lease expiration date of December 31, 2021 with two additional five-year renewal options.
THE INFORMATION IN THIS STRUCTURAL AND COLLATERAL TERM SHEET IS NOT COMPLETE AND MAY BE AMENDED PRIOR TO THE TIME OF SALE. THIS TERM SHEET IS NOT AN OFFER TO SELL THESE SECURITIES AND IT IS NOT A SOLICITATION OF AN OFFER TO BUY THESE SECURITIES IN ANY JURISDICTION WHERE THE OFFER OR SALE IS NOT PERMITTED.
93
Office - Suburban | Loan #9 | Cut-off Date Balance: | | $31,000,000 |
7301 Metro Center Drive | Met Center 15 | Cut-off Date LTV: | | 57.9% |
Austin, TX 78744 | | U/W NCF DSCR: | | 1.99x |
| | U/W NOI Debt Yield: | | 12.7% |
The following table presents certain information relating to the tenancy at the Met Center 15 Property:
Major Tenants
Tenant Name | Credit Rating (Fitch/
Moody’s/
S&P)(1) | Tenant
NRSF | % of
NRSF | Annual U/W Base Rent PSF(2) | Annual
U/W Base
Rent(2) | % of Total Annual U/W Base Rent | Lease
Expiration
Date | Extension Options | Termination Option (Y/N) |
Major Tenants | | | | | | | | |
Progressive Casualty | AA/Aa2/AA | 217,216 | 84.3% | $16.75 | $3,638,368 | 85.1% | 2/28/2026 | 3, 3-year | Y(3) |
Waste Management | BBB+/Baa1/A- | 40,384 | 15.7% | $15.76 | $636,335 | 14.9% | 12/31/2021 | 2, 5-year | N |
Total Major Tenants | 257,600 | 100.0% | $16.59 | $4,274,703 | 100.0% | | | |
| | | | | | | | |
Non-Major Tenants | 0 | 0.0% | $0.00 | $0 | 0.0% | | | |
| | | | | | | | |
Occupied Collateral Total | 257,600 | 100.0% | $16.59 | $4,274,703 | 100.0% | | | |
| | | | | | | | |
Vacant Space | 0 | 0.0% | | | | | | |
| | | | | | | | |
Collateral Total | 257,600 | 100.0% | | | | | | |
| | | | | | | | | |
(1) | Certain ratings are those of the parent company whether or not the parent company guarantees the lease. |
(2) | Annual U/W Base Rent includes contractual rent steps for Progressive Casualty through March 2021 totaling $953,578 and contractual rent steps for Waste Management through January 2021 totaling $18,533. |
(3) | Progressive Casualty has the right to terminate its lease effective February 29, 2024 or at the end of any calendar month thereafter with 9 months’ written notice and a termination payment equal to the unamortized portion of the Construction Allowance plus $1,500,000. If Progressive Casualty were to terminate March 1, 2024, the total estimated termination fee would equal approximately $2,151,648. |
The following table presents certain information relating to the lease expiration schedule at the Met Center 15 Property:
Lease Expiration Schedule(1)(2)
Year Ending
December 31, | No. of Leases Expiring | Expiring NRSF | % of Total NRSF | Cumulative Expiring NRSF | Cumulative % of Total NRSF | Annual
U/W
Base Rent(3) | % of Total Annual U/W Base Rent(3) | Annual
U/W
Base Rent
PSF(3) |
MTM | 0 | 0 | 0.0% | 0 | 0.0% | $0 | 0.0% | $0.00 |
2020 | 0 | 0 | 0.0% | 0 | 0.0% | $0 | 0.0% | $0.00 |
2021 | 1 | 40,384 | 15.7% | 40,384 | 15.7% | $636,335 | 14.9% | $15.76 |
2022 | 0 | 0 | 0.0% | 40,384 | 15.7% | $0 | 0.0% | $0.00 |
2023 | 0 | 0 | 0.0% | 40,384 | 15.7% | $0 | 0.0% | $0.00 |
2024 | 0 | 0 | 0.0% | 40,384 | 15.7% | $0 | 0.0% | $0.00 |
2025 | 0 | 0 | 0.0% | 40,384 | 15.7% | $0 | 0.0% | $0.00 |
2026 | 1 | 217,216 | 84.3% | 257,600 | 100.0% | $3,638,368 | 85.1% | $16.75 |
2027 | 0 | 0 | 0.0% | 257,600 | 100.0% | $0 | 0.0% | $0.00 |
2028 | 0 | 0 | 0.0% | 257,600 | 100.0% | $0 | 0.0% | $0.00 |
2029 | 0 | 0 | 0.0% | 257,600 | 100.0% | $0 | 0.0% | $0.00 |
2030 | 0 | 0 | 0.0% | 257,600 | 100.0% | $0 | 0.0% | $0.00 |
Thereafter | 0 | 0 | 0.0% | 257,600 | 100.0% | $0 | 0.0% | $0.00 |
Vacant | 0 | 0 | 0.0% | 257,600 | 100.0% | $0 | 0.0% | $0.00 |
Total/Weighted Average | 2 | 257,600 | 100.0% | | | $4,274,703 | 100.0% | $16.59 |
(1) | Information obtained from the underwritten rent roll dated May 5, 2020. |
(2) | Certain tenants may have lease termination options that are exercisable prior to the originally stated expiration date of the subject lease and that are not considered in the Lease Expiration Schedule. |
(3) | Annual U/W Base Rent includes contractual rent steps through March 2021 totaling $972,111. |
THE INFORMATION IN THIS STRUCTURAL AND COLLATERAL TERM SHEET IS NOT COMPLETE AND MAY BE AMENDED PRIOR TO THE TIME OF SALE. THIS TERM SHEET IS NOT AN OFFER TO SELL THESE SECURITIES AND IT IS NOT A SOLICITATION OF AN OFFER TO BUY THESE SECURITIES IN ANY JURISDICTION WHERE THE OFFER OR SALE IS NOT PERMITTED.
94
Office - Suburban | Loan #9 | Cut-off Date Balance: | | $31,000,000 |
7301 Metro Center Drive | Met Center 15 | Cut-off Date LTV: | | 57.9% |
Austin, TX 78744 | | U/W NCF DSCR: | | 1.99x |
| | U/W NOI Debt Yield: | | 12.7% |
The following table presents historical occupancy percentages at the Met Center 15 Property:
Historical Occupancy
12/31/2016(1) | | 12/31/2017(1) | | 12/31/2018(1) | | 12/31/2019(1) | | 5/5/2020(2) |
100.0% | | 100.0% | | 100.0% | | 100.0% | | 100.0% |
(1) | Information obtained from the borrower. |
(2) | Information obtained from the underwritten rent roll. |
Operating History and Underwritten Net Cash Flow. The following table presents certain information relating to the historical operating performance and underwritten net cash flow at the Met Center 15 Property:
Cash Flow Analysis
| | 12/31/2016 | | 12/31/2017 | | 12/31/2018 | | 12/31/2019 | | TTM 3/31/2020 | | U/W(1) | | %(2) | | U/W $ per SF |
Base Rent | | $2,831,829 | | $3,169,654 | | $3,222,325 | | $3,266,195 | | $3,277,337 | | $3,302,593 | | 56.3% | | $12.82 | |
Contractual Rent Steps(3) | | 0 | | 0 | | 0 | | 0 | | 0 | | 972,111 | | 16.6 | | 3.77 | |
Grossed Up Vacant Space | | 0 | | 0 | | 0 | | 0 | | 0 | | 0 | | 0.0 | | 0.00 | |
Gross Potential Rent | | $2,831,829 | | $3,169,654 | | $3,222,325 | | $3,266,195 | | $3,277,337 | | $4,274,704 | | 72.9% | | $16.59 | |
Other Income | | 1,608 | | (209,733) | | 26,783 | | (2,620) | | (4,237) | | 0 | | 0.0 | | 0.00 | |
Total Recoveries | | 1,772,007 | | 1,481,664 | | 1,599,348 | | 1,640,052 | | 1,658,912 | | 1,589,967 | | 27.1 | | 6.17 | |
Net Rental Income | | $4,605,444 | | $4,441,585 | | $4,848,456 | | $4,903,627 | | $4,932,012 | | $5,864,671 | | 100.0% | | $22.77 | |
(Vacancy & Credit Loss) | | 0 | | 0 | | 0 | | 0 | | 0 | | (213,735)(4) | | (3.6) | | (0.83) | |
Effective Gross Income | | $4,605,444 | | $4,441,585 | | $4,848,456 | | $4,903,627 | | $4,932,012 | | $5,650,935 | | 96.4% | | $21.94 | |
| | | | | | | | | | | | | | | | | |
Real Estate Taxes | | 723,256 | | 943,587 | | 955,275 | | 922,650 | | 984,878 | | 1,022,604 | | 18.1 | | 3.97 | |
Insurance | | 32,783 | | 51,786 | | 50,363 | | 55,249 | | 55,272 | | 61,488 | | 1.1 | | 0.24 | |
Management Fee | | 112,579 | | 156,028 | | 193,804 | | 213,212 | | 190,480 | | 169,528 | | 3.0 | | 0.66 | |
Other Operating Expenses | | 469,528 | | 396,278 | | 456,034 | | 447,509 | | 416,652 | | 447,509 | | 7.9 | | 1.74 | |
Total Operating Expenses | | $1,338,146 | | $1,547,679 | | $1,655,476 | | $1,638,620 | | $1,647,282 | | $1,701,129 | | 30.1% | | $6.60 | |
| | | | | | | | | | | | | | | | | |
Net Operating Income | | $3,267,298 | | $2,893,906 | | $3,192,980 | | $3,265,007 | | $3,284,730 | | $3,949,806 | | 69.9% | | $15.33 | |
Replacement Reserves | | 0 | | 0 | | 0 | | 0 | | 0 | | 82,432 | | 1.5 | | 0.32 | |
TI/LC | | 0 | | 0 | | 0 | | 0 | | 0 | | 492,881 | | 8.7 | | 1.91 | |
Net Cash Flow | | $3,267,298 | | $2,893,906 | | $3,192,980 | | $3,265,007 | | $3,284,730 | | $3,374,493 | | 59.7% | | $13.10 | |
| | | | | | | | | | | | | | | | | |
NOI DSCR(5) | | 1.93x | | 1.71x | | 1.89x | | 1.93x | | 1.94x | | 2.33x | | | | | |
NCF DSCR(5) | | 1.93x | | 1.71x | | 1.89x | | 1.93x | | 1.94x | | 1.99x | | | | | |
NOI Debt Yield(5) | | 10.5% | | 9.3% | | 10.3% | | 10.5% | | 10.6% | | 12.7% | | | | | |
NCF Debt Yield(5) | | 10.5% | | 9.3% | | 10.3% | | 10.5% | | 10.6% | | 10.9% | | | | | |
(1) | For the avoidance of doubt, no COVID-19 specific adjustments have been incorporated in the lender U/W. |
(2) | Represents (i) percent of Net Rental Income for all revenue fields and for Vacancy & Credit Loss and (ii) percent of Effective Gross Income for all other fields. |
(3) | Underwritten Contractual Rent Steps include $972,111 of rent steps through March 2021. |
(4) | The underwritten economic vacancy is 5.0%. The Met Center 15 Property was 100.0% physically occupied as of May 5, 2020. |
(5) | NOI DSCR, NOI DSCR, NOI Debt Yield and NCF Debt Yield are based on the Met Center 15 Mortgage Loan. |
Appraisal. The appraiser concluded to an “as-is” appraised value of $53,500,000 as of November 7, 2019.
Environmental Matters. According to the Phase I environmental site assessment dated November 19, 2019, there was no evidence of any recognized environmental conditions at Met Center 15 Property.
THE INFORMATION IN THIS STRUCTURAL AND COLLATERAL TERM SHEET IS NOT COMPLETE AND MAY BE AMENDED PRIOR TO THE TIME OF SALE. THIS TERM SHEET IS NOT AN OFFER TO SELL THESE SECURITIES AND IT IS NOT A SOLICITATION OF AN OFFER TO BUY THESE SECURITIES IN ANY JURISDICTION WHERE THE OFFER OR SALE IS NOT PERMITTED.
95
Office - Suburban | Loan #9 | Cut-off Date Balance: | | $31,000,000 |
7301 Metro Center Drive | Met Center 15 | Cut-off Date LTV: | | 57.9% |
Austin, TX 78744 | | U/W NCF DSCR: | | 1.99x |
| | U/W NOI Debt Yield: | | 12.7% |
Market Overview and Competition. The Met Center 15 Property is located approximately five miles southeast of the central business district of Austin, Texas. The Met Center 15 Property is located within the larger Met Center business park. Met Center is a 550-acre business park featuring over two million square feet of office and industrial flex space occupied by Electric Reliability Council of Texas, Pharmaceutical Product Development, Cyrus One, Iron Mountain, Waste Management, Progressive Casualty, Seton, General Motors, the Department of Veterans Affairs and others. Met Center is served by a redundant electric and telecommunications infrastructure, making it one of the most reliable business centers in the United States. Primary access to the Met Center 15 Property is provided by Interstate Highway 35, a north/south freeway that transverses the greater Austin area, and US Highway 183, a highway extending from Lampasas on the west through the greater Austin area. The Austin-Bergstrom International Airport is located adjacent to the east of the Met Center 15 Property. According to the appraisal, the Austin-Bergstrom International Airport offers over 150 daily departures to 44 destinations in the United States, Mexico and the United Kingdom.
Submarket Information - According to the appraisal, the Met Center 15 Property is located in the Southeast submarket within the Austin office market. As of the third quarter of 2019, the Southeast office submarket reported a total inventory of approximately 1.0 million square feet with a 9.3% vacancy rate and average asking rents of $30.96 per square foot.
The following table presents certain information relating to the appraiser’s market rent conclusions for the Met Center 15 Property:
Market Rent Summary(1)
| Office |
Market Rent (PSF) | $16.75 |
Lease Term (Years) | 7 |
Free Rent Months | 3 |
Lease Type (Reimbursements) | Net |
Rent Increase Projection | 2.00% per annum |
Tenant Improvements (New Tenants) (PSF) | $15.00 |
Tenant Improvements (Renewals) (PSF) | $5.00 |
(1) | Information obtained from the appraisal. |
The table below presents certain information relating to comparable sales pertaining to the Met Center 15 Property identified by the appraiser:
Comparable Sales(1)
Property Name | Location | Rentable Area (SF) | Sale Date | Sale Price | Sales Price (PSF) | Adjusted Sales Price (PSF) |
3100 Alvin Devane Boulevard | Austin, TX | 70,388 | Oct-19 | $18,500,000 | $262.83 | $210.26 |
Research Park Plaza I & II | Austin, TX | 271,889 | Jun-19 | $123,500,000 | $454.23 | $204.40 |
Upcycle Building | Austin, TX | 81,660 | May-19 | $49,200,000 | $602.50 | $210.87 |
Travesia Corporate Park | Austin, TX | 176,668 | Mar-19 | $40,900,000 | $231.51 | $196.78 |
South Park G | Austin, TX | 206,418 | Apr-18 | $65,100,000 | $315.38 | $198.69 |
(1) | Information obtained from the appraisal. |
THE INFORMATION IN THIS STRUCTURAL AND COLLATERAL TERM SHEET IS NOT COMPLETE AND MAY BE AMENDED PRIOR TO THE TIME OF SALE. THIS TERM SHEET IS NOT AN OFFER TO SELL THESE SECURITIES AND IT IS NOT A SOLICITATION OF AN OFFER TO BUY THESE SECURITIES IN ANY JURISDICTION WHERE THE OFFER OR SALE IS NOT PERMITTED.
96
Office - Suburban | Loan #9 | Cut-off Date Balance: | | $31,000,000 |
7301 Metro Center Drive | Met Center 15 | Cut-off Date LTV: | | 57.9% |
Austin, TX 78744 | | U/W NCF DSCR: | | 1.99x |
| | U/W NOI Debt Yield: | | 12.7% |
The following table presents certain information relating to comparable properties to the Met Center 15 Property:
Comparable Leases(1)
Property Name/Location | Year Built/ Renovated | Total GLA (SF) | Distance from Subject | Occupancy | Lease Term | Tenant Size (SF) | Annual Base Rent PSF | TI Allowance PSF | Lease Type |
Former AMD Building 5202 E. Ben White Austin, TX | 1984/NAV | 330,000 | 3.0 miles | NAV | 7.0 Yrs | 122,301 | $19.75 | $0.00 | Net |
Northview Business Center 9001 N IH-35 Austin, TX | 1971/NAV | 262,067 | 12.8 miles | NAV | 10.0 Yrs | 70,508 | $20.00 | $60.00 | Net |
Stonehollow 1 11525 Stonehollow Drive Austin, TX | 1996/NAV | 69,035 | 16.5 miles | NAV | 6.0 Yrs | 42,374 | $16.80 | $0.00 | Net |
Farmers Group Building 15700 Long Vista Drive Austin, TX | 1991/NAV | 189,967 | 20.6 miles | NAV | 5.0 Yrs | 189,967 | $16.75 | $7.50 | Net |
The Preserve at 620 8201 Ranch Road 620 North Austin, TX | 2006/NAV | 226,329 | 27.0 miles | NAV | 7.0 Yrs | 39,889 | $21.50 | $50.00 | Net |
(1) | Information obtained from appraisal. |
Escrows.
Immediate Repairs – At origination, the borrower was required to escrow $137,669 for immediate repairs.
Real Estate Taxes – At origination, the borrower was required to escrow $263,321 for real estate taxes. The borrower is required to make monthly payments of one-twelfth of the taxes payable during the next twelve months, currently equal to $87,774.
Insurance – The borrower will not be required to make monthly payments of one-twelfth of the insurance premiums the lender estimates will be payable during the next twelve months as long as the borrower maintains a blanket policy acceptable to the lender.
Replacement Reserve – The borrower is required to make monthly deposits of $6,869 ($0.32 per square foot annually) for replacement reserves.
TI/LC Reserve – The borrower is required to make monthly deposits of $26,833 ($1.25 per square foot annually) for tenant improvements and leasing commissions.
Outstanding TI/LC – At origination, the borrower was required to escrow $1,629,120 for outstanding tenant improvements and leasing commissions for the Progressive Casualty lease.
Free Rent Reserve – At origination, the borrower was required to escrow $909,592 representing three months of outstanding free rent obligations under the Progressive Casualty lease.
Lockbox and Cash Management. The Met Center 15 Mortgage Loan documents require a hard lockbox with springing cash management. At origination, the borrower was required to deliver written instructions to tenants directing them to deposit all rents payable under such leases directly into a lender-controlled lockbox account. The Met Center 15 Mortgage Loan documents require that all rents and other funds from operations received by the borrower or the property manager be deposited into the lockbox within one business day after receipt.
Prior to a Trigger Period (as defined below), funds in the lockbox account will be transferred daily to a borrower operating account. During a Trigger Period, all amounts in the lockbox account are to be transferred daily to the cash management account for the payment, among other things, of the debt service under the Met Center 15 Mortgage Loan and Met Center 15 Mezzanine Loan (as defined below), monthly escrows and other expenses described in the Met Center 15 Mortgage Loan documents. To the extent that there is excess cash flow following these disbursements, the excess cash will be held by the lender as additional security for the Met Center 15 Mortgage Loan.
A “Trigger Period” will commence upon the earliest of (i) an event of default under the Met Center 15 Mortgage Loan documents or under the Met Center 15 Mezzanine Loan documents, (ii) the debt service coverage ratio of the Met Center 15 Property being less than 1.20x or (iii) a Progressive Trigger Event (as defined below). A Trigger Period will cease upon: with respect to clause (i), the cure and acceptance of the cure by the lender of such event of default; with respect to clause (ii), the debt service coverage ratio being greater than or equal to 1.25x for two consecutive calendar quarters; with respect to clause (iii), the occurrence of a Progressive Trigger Event Cure (as defined below).
THE INFORMATION IN THIS STRUCTURAL AND COLLATERAL TERM SHEET IS NOT COMPLETE AND MAY BE AMENDED PRIOR TO THE TIME OF SALE. THIS TERM SHEET IS NOT AN OFFER TO SELL THESE SECURITIES AND IT IS NOT A SOLICITATION OF AN OFFER TO BUY THESE SECURITIES IN ANY JURISDICTION WHERE THE OFFER OR SALE IS NOT PERMITTED.
97
Office - Suburban | Loan #9 | Cut-off Date Balance: | | $31,000,000 |
7301 Metro Center Drive | Met Center 15 | Cut-off Date LTV: | | 57.9% |
Austin, TX 78744 | | U/W NCF DSCR: | | 1.99x |
| | U/W NOI Debt Yield: | | 12.7% |
A “Progressive Trigger Event” will commence upon the occurrence of (i) the borrower failing to satisfy the Progressive Renewal Criteria (as defined below) on or before the earlier of (x) February 28, 2025 (one year prior to lease expiration) and (y) the date which Progressive Casualty is required to deliver notice of its lease renewal under its lease, (ii) Progressive Casualty terminating, giving notice of its intent to terminate or not renewing its lease, (iii) Progressive Casualty “going dark,” vacating or abandoning all or part of its leased space, (iv) bankruptcy or insolvency of Progressive Casualty, its parent company or lease guarantor, (v) Progressive Casualty defaulting under its lease or (vi) Progressive Casualty’s credit rating falling below BBB- or the equivalent by two out of three of Moody’s, S&P or Fitch. A Progressive Trigger Event will end upon a Progressive Trigger Event Cure.
A “Progressive Trigger Event Cure” will occur upon, with regard to a Progressive Trigger Event caused by clause (i) above, the satisfaction of the Progressive Renewal Criteria or Progressive Replacement Lease Criteria (as defined below), with respect to clause (ii) above, the satisfaction of the Progressive Replacement Lease Criteria, with respect to clause (iii) above, the satisfaction of the Progressive Replacement Lease Criteria or the borrower providing evidence that Progressive has resumed occupancy and is operating out of its entire leased space, with respect to clause (iv) above, the satisfaction of the Progressive Replacement Lease Criteria or Progressive no longer being subject to bankruptcy or insolvency proceedings, with respect to clause (v) above, the satisfaction of the Progressive Replacement Lease Criteria or Progressive being cured of such event of default or with respect to clause (vi) above, the satisfaction of the Progressive Replacement Lease Criteria or the lender’s receipt of satisfactory evidence that Progressive’s credit rating is at or above BBB-.
The “Progressive Renewal Criteria” means that the lender has received (i) evidence that the Progressive lease has been renewed under the terms of its lease for a term not less than three years and (ii) receipt of an updated estoppel satisfactory to the lender under the Met Center 15 Mortgage Loan documents.
The “Progressive Replacement Lease Criteria” is satisfied under the following conditions: (i) the borrower has entered into a lease or leases with tenant(s) acceptable under the Met Center 15 Mortgage Loan documents, (ii) each replacement tenant being in physical occupancy and paying full contractual rent and (iii) the borrower providing the lender with a copy of the replacement lease(s), estoppel(s) in form and substance acceptable to the lender, a subordination, non-disturbance and attornment agreement if requested by the lender, evidence that the borrower has performed and paid for all tenant improvements and leasing commissions under the replacement leases and an updated rent roll.
Property Management. The Met Center 15 Property is managed by Clear Vista Management (US), LLC. Clear Vista Management (US), LLC subcontracts the property management services at the Met Center 15 Property to Cushman & Wakefield U.S., Inc.
Partial Release. Not permitted.
Real Estate Substitution. Not permitted.
Subordinate and Mezzanine Indebtedness. On February 14, 2020, Barclays Capital Real Estate Inc. funded a $10,000,000 mezzanine loan (the “Met Center 15 Mezzanine Loan”) to MC 15 Member, LLC, a Delaware limited liability company owing 100.0% of the borrower under the Met Center 15 Mortgage Loan documents. The Met Center 15 Mezzanine Loan was sold to a third-party investor subsequent to origination (together with the Met Center 15 Mortgage Loan, the “Met Center 15 Whole Loan”). The Met Center 15 Mezzanine Loan accrues at a rate of 10.000% per annum and requires interest-only payments through the maturity date of March 6, 2030. The rights of the lender of the Met Center 15 Mezzanine Loan are further described under “Description of the Mortgage Pool – Additional Indebtedness – Mezzanine Indebtedness” in the Preliminary Prospectus.
Terrorism Insurance. The Met Center 15 Mortgage Loan documents require that the “all risk” insurance policy required to be maintained by the borrower provides coverage for terrorism in an amount equal to the full replacement cost of the Met Center 15 Property, as well as business interruption insurance covering no less than the 18-month period following the occurrence of a casualty event, together with a 6-month extended period of indemnity.
THE INFORMATION IN THIS STRUCTURAL AND COLLATERAL TERM SHEET IS NOT COMPLETE AND MAY BE AMENDED PRIOR TO THE TIME OF SALE. THIS TERM SHEET IS NOT AN OFFER TO SELL THESE SECURITIES AND IT IS NOT A SOLICITATION OF AN OFFER TO BUY THESE SECURITIES IN ANY JURISDICTION WHERE THE OFFER OR SALE IS NOT PERMITTED.
98
Retail – Lifestyle Center | Loan #10 | Cut-off Date Balance: | | $30,000,000 |
2623 Northeast University Village Street | University Village | Cut-off Date LTV: | | 38.5% |
Seattle, WA 98105 | | U/W NCF DSCR: | | 3.39x |
| | U/W NOI Debt Yield: | | 11.8% |

THE INFORMATION IN THIS STRUCTURAL AND COLLATERAL TERM SHEET IS NOT COMPLETE AND MAY BE AMENDED PRIOR TO THE TIME OF SALE. THIS TERM SHEET IS NOT AN OFFER TO SELL THESE SECURITIES AND IT IS NOT A SOLICITATION OF AN OFFER TO BUY THESE SECURITIES IN ANY JURISDICTION WHERE THE OFFER OR SALE IS NOT PERMITTED.
99
Retail – Lifestyle Center | Loan #10 | Cut-off Date Balance: | | $30,000,000 |
2623 Northeast University Village Street | University Village | Cut-off Date LTV: | | 38.5% |
Seattle, WA 98105 | | U/W NCF DSCR: | | 3.39x |
| | U/W NOI Debt Yield: | | 11.8% |

THE INFORMATION IN THIS STRUCTURAL AND COLLATERAL TERM SHEET IS NOT COMPLETE AND MAY BE AMENDED PRIOR TO THE TIME OF SALE. THIS TERM SHEET IS NOT AN OFFER TO SELL THESE SECURITIES AND IT IS NOT A SOLICITATION OF AN OFFER TO BUY THESE SECURITIES IN ANY JURISDICTION WHERE THE OFFER OR SALE IS NOT PERMITTED.
100
Retail – Lifestyle Center | Loan #10 | Cut-off Date Balance: | | $30,000,000 |
2623 Northeast University Village Street | University Village | Cut-off Date LTV: | | 38.5% |
Seattle, WA 98105 | | U/W NCF DSCR: | | 3.39x |
| | U/W NOI Debt Yield: | | 11.8% |
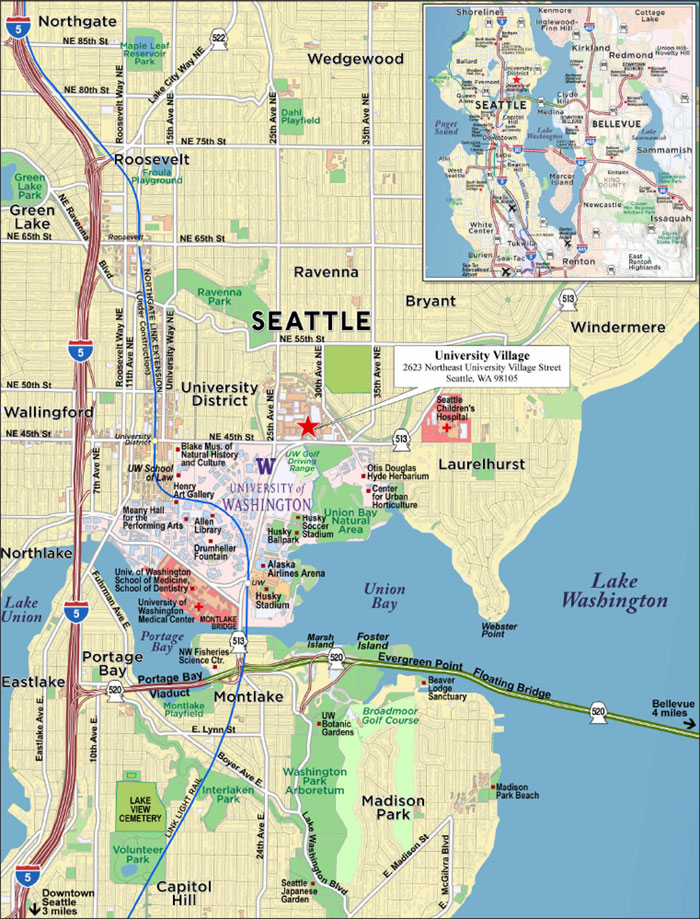
THE INFORMATION IN THIS STRUCTURAL AND COLLATERAL TERM SHEET IS NOT COMPLETE AND MAY BE AMENDED PRIOR TO THE TIME OF SALE. THIS TERM SHEET IS NOT AN OFFER TO SELL THESE SECURITIES AND IT IS NOT A SOLICITATION OF AN OFFER TO BUY THESE SECURITIES IN ANY JURISDICTION WHERE THE OFFER OR SALE IS NOT PERMITTED.
101
| No. 10 – University Village |
| |
| Mortgage Loan Information | | Mortgaged Property Information |
| Mortgage Loan Seller: | Column | | Single Asset/Portfolio: | Single Asset |
Credit Assessment (Fitch/KBRA/Moody’s): | BBB+(sf) / BBB-sf / Aa2(sf) | | Property Type – Subtype: | Retail – Lifestyle Center |
| Original Principal Balance(1): | $30,000,000 | | Location: | Seattle, WA |
| Cut-off Date Balance(1): | $30,000,000 | | Size: | 597,635 SF |
| % of Initial Pool Balance: | 4.1% | | Cut-off Date Balance Per SF(1): | $418.32 |
| Loan Purpose: | Refinance | | Maturity Date Balance Per SF(1): | $418.32 |
| Borrower Sponsor: | Stuart M. Sloan | | Year Built/Renovated: | 1956/2019 |
| Guarantor: | Stuart M. Sloan | | Title Vesting: | Fee |
| Mortgage Rate: | 3.3000% | | Property Manager: | Self-Managed |
| Note Date: | December 2, 2019 | | Current Occupancy (As of)(1)(2): | 100% (11/18/2019) |
| Seasoning: | 6 months | | YE 2018 Occupancy: | 98.8% |
| Maturity Date: | December 6, 2029 | | YE 2017 Occupancy: | 97.6% |
| IO Period: | 120 months | | YE 2016 Occupancy: | 98.1% |
| Loan Term (Original): | 120 months | | As-Is Appraised Value(1): | $650,000,000 |
| Amortization Term (Original): | NAP | | As-Is Appraised Value Per SF(1): | $1,087.62 |
| Loan Amortization Type: | Interest-only, Balloon | | As-Is Appraisal Valuation Date: | October 23, 2019 |
| Call Protection: | L(30),GRTR 1% or YM or D(83),O(7) | | | |
| Lockbox Type: | Hard/Springing Cash Management | | Underwriting and Financial Information(1) |
| Additional Debt(1): | Yes | | TTM NOI (9/30/2019): | $27,753,154 |
| Additional Debt Type (Balance)(1): | Pari Passu($220,000,000) ; Subordinate ($130,000,000) | | YE 2018 NOI: | $27,318,862 |
| | | | YE 2017 NOI: | $25,539,420 |
| | | | YE 2016 NOI: | NAV |
| | | | U/W Revenues(3): | $41,651,294 |
| | | | U/W Expenses: | $12,188,610 |
| Escrows and Reserves(4) | | U/W NOI: | $29,462,684 |
| | Initial | Monthly | Cap | | U/W NCF: | $28,377,547 |
| Taxes | $0 | Springing | NAP | | U/W DSCR based on NOI/NCF: | 3.52x / 3.39x |
| Insurance | $0 | Springing | NAP | | U/W Debt Yield based on NOI/NCF: | 11.8% / 11.4% |
| Capital Expenditure Reserve | $0 | Springing | $298,818 | | U/W Debt Yield at Maturity based on NOI/NCF: | 11.8% / 11.4% |
| TI/LC Reserve | $0 | Springing | $1,792,905 | | Cut-off Date LTV Ratio: | 38.5% |
| Alterations Reserve | $14,189,947(5) | $0 | NAP | | LTV Ratio at Maturity: | 38.5% |
| Unfunded Obligations Reserve | $3,299,128 | $0 | NAP | | | |
| | | | | | | |
| Sources and Uses |
| Sources | | | | | Uses | | | |
| Original senior loan amount | $250,000,000 | | 65.8% | | Payoff existing debt | $247,800,021 | | 65.2% |
| Subordinate companion loan amount | 130,000,000 | | 34.2 | | Repayment of development costs | 56,985,715 | | 15.0 |
| | | | | | Return of equity | 54,550,891 | | 14.4 |
| | | | | | Upfront reserves | 17,489,075 | | 4.6 |
| | | | | | Closing costs | 3,174,298 | | 0.8 |
| Total Sources | $380,000,000 | | 100.0% | | Total Uses | $380,000,000 | | 100.0% |
| (1) | The Cut-off Date Balance Per SF, Maturity Date Balance Per SF, U/W DSCR based on NOI/NCF, U/W Debt Yield based on NOI/NCF, U/W Debt Yield at Maturity based on NOI/NCF, Cut-off Date LTV Ratio and LTV Ratio at Maturity numbers presented above are based on the University Village Senior Loan (as defined below). The U/W DSCR based on NOI/NCF, U/W Debt Yield based on NOI/NCF, U/W Debt Yield at Maturity based on NOI/NCF, Cut-off Date LTV Ratio and LTV Ratio at Maturity based upon the University Village Whole Loan (as defined below) are 2.32x/2.23x, 7.8%/7.5%, 7.8%/7.5%, 58.5% and 58.5%, respectively. All NOI, NCF and occupancy information, as well as the appraised value, were determined prior to the emergence of the novel coronavirus pandemic, and the economic disruption resulting from measures to combat the pandemic, and all DSCR, LTV and Debt Yield metrics were calculated, and the University Village Whole Loan was underwritten, based on such prior information. See “Risk Factors-Coronavirus Pandemic Has Adversely Affected the Global Economy and Will Likely Adversely Affect the Performance of the Mortgage Loans” in the Preliminary Prospectus. |
| (2) | Based on the November 2019 underwritten rent roll including three temporary tenants. Excluding temporary tenants, the University Village Property is 97.6% leased. |
| (3) | U/W Revenues includes Base Rent, Year-1 Rent Steps ($581,098), Overage Rent ($568,966), Credit Tenant Rent Steps ($201,721) and Signed-Not-Occupied Rent ($606,875). |
| (4) | See “Escrows” section below. |
| (5) | As of April 8, 2020, approximately $11.6 million has been released to the borrower for completed construction. |
THE INFORMATION IN THIS STRUCTURAL AND COLLATERAL TERM SHEET IS NOT COMPLETE AND MAY BE AMENDED PRIOR TO THE TIME OF SALE. THIS TERM SHEET IS NOT AN OFFER TO SELL THESE SECURITIES AND IT IS NOT A SOLICITATION OF AN OFFER TO BUY THESE SECURITIES IN ANY JURISDICTION WHERE THE OFFER OR SALE IS NOT PERMITTED.
102
Retail – Lifestyle Center | Loan #10 | Cut-off Date Balance: | | $30,000,000 |
2623 Northeast University Village Street | University Village | Cut-off Date LTV: | | 38.5% |
Seattle, WA 98105 | | U/W NCF DSCR: | | 3.39x |
| | U/W NOI Debt Yield: | | 11.8% |
The Mortgage Loan. The mortgage loan (the “University Village Mortgage Loan”) is part of a whole loan (the “University Village Whole Loan”) that is evidenced by three pari passu senior promissory notes in the aggregate original principal amount of $250,000,000 (the “University Village Senior Loan”) and one subordinate promissory note in the original principal amount of $130,000,000 (the “University Village Subordinate Companion Loan”). The University Village Whole Loan is secured by a first priority fee mortgage encumbering a 597,635 square foot open air, retail lifestyle center located in Seattle, Washington (the “University Village Property”). The University Village Mortgage Loan is evidenced by the non-controlling senior promissory note A-3 in the original principal amount of $30,000,000. The remaining University Village Senior Loan pari passu notes are referred to herein as the “University Village Pari Passu Companion Loans”. As shown in the “Note Summary” table below, two promissory notes in the original aggregate principal amount of $305,000,000 were contributed to the CSMC 2019-UVIL securitization trust. The University Village Whole Loan will be serviced pursuant to the trust and servicing agreement for the CSMC 2019-UVIL securitization trust. See “Description of the Mortgage Pool—The Whole Loans—The Non-Serviced AB Whole Loans— The University Village Whole Loan“ and “Pooling and Servicing Agreement—Servicing of the Non-Serviced Mortgage Loans” in the Preliminary Prospectus.
Note Summary
Notes | Original Balance | Cut-off Date Balance | Note Holder | Controlling Piece |
A-1 | $175,000,000 | $175,000,000 | CSMC 2019-UVIL | No |
A-2 | 45,000,000 | 45,000,000 | CSAIL 2020-C19 | No |
A-3 | 30,000,000 | 30,000,000 | WFCM 2020-C56 | No |
B | 130,000,000 | 130,000,000 | CSMC 2019-UVIL | Yes |
Total | $380,000,000 | $380,000,000 | | |
The Borrower and Borrower Sponsor. The borrower is University Village Limited Partnership, a Washington limited partnership with one independent director (the “University Village Borrower”). Legal counsel to the University Village Borrower delivered a non-consolidation opinion in connection with the origination of the University Village Whole Loan. The University Village Borrower is indirectly 94.9% owned by Stuart M. Sloan, and the remaining interests are held by minority holders.
The borrower sponsor and nonrecourse carve-out guarantor is Stuart M. Sloan. Mr. Sloan began his career as President and Director of Schuck’s Auto Supply Inc. which he grew from 8 to 58 stores becoming the Pacific Northwest’s dominant retail automotive parts and supply retailer before merging with Seattle-based Pay ‘n Save Corporation. Mr. Sloan went on to found Sloan Capital Companies in 1984 to invest in operating companies and commercial properties and also co-founded Egghead Discount Software in 1984, which then became the nation’s largest reseller of computer software. In 1986, Mr. Sloan acquired the majority interest in Quality Food Centers, Inc., the largest independent retail grocery chain in the Seattle/King County market, which was subsequently merged with Fred Meyer, Inc. The guarantor is required to maintain a minimum net worth (exclusive of the University Village Property) of not less than $100.0 million during the loan term.
The Property. The University Village Property is a 597,635 square foot open-air, retail lifestyle center located in Seattle, Washington. The University Village Property was constructed, renovated, and expanded between 1956 and 2019, with 19 buildings situated on approximately 23.6 acres. The borrower sponsor has transformed the University Village Property since acquisition in 1993 into an upscale lifestyle center with a mix of signature national tenants and local boutiques combined with a distinct collection of restaurants and service providers. Approximately three miles northeast of the Seattle central business district, the University Village Property is adjacent to the University of Washington. The University Village Property is rated A+ by Green Street Advisors, has a TAP score of 99, and is LEED Silver Certified.
There are 2,439 parking spaces at the University Village Property that are included in the collateral, resulting in a parking ratio of 4.1 spaces per 1,000 square feet of net rentable area (“NRA”). The University Village Property was most recently renovated in 2019 when capital expenditures of $71.2 million were allocated to expand parking and retail space. Construction of a new 473-stall parking garage was completed in November 2019.
The University Village Property is anchored by Apple (M/S&P/F: Aa1/AA+/AA, 13,920 square feet), Restoration Hardware Gallery (43,846 square feet) and Crate & Barrel (36,875 square feet). Apple, Restoration Hardware Gallery, and Crate & Barrel have reported sales of approximately $107.9 million ($7,751 per square foot), $23.7 million ($541 per square foot) and $14.2 million ($455 per square foot), respectively, as of the trailing twelve-month period ending July 2019.
As of November 18, 2019, the University Village Property was approximately 100.0% leased by 126 tenants and 97.6% leased when excluding three temporary tenants. The University Village Property’s tenancy caters to high-price and mid-price point customers with tenants that include Apple, Restoration Hardware Gallery, Crate & Barrel, Pottery Barn, Tesla, Microsoft, Amazon Books, and Bartell Drugs. As of July 2019, gross mall sales for all tenants were approximately $515.7 million, while comparable sales for all tenants were $411.6 million during the same period. Sales per square foot for comparable stores less than 15,000 square feet were approximately $1,123, and sales per square foot for comparable stores less than 15,000 square feet (excluding Apple) were $782.
The borrower sponsor is completing a $71.2 million expansion at the University Village Property, which includes a new 473-stall, 217,778 square foot parking garage that opened in November 2019, as well as retail space for Peloton (LXD 1/2031), Shake Shack (LXD 1/2031), and Hello Robin (LXD 4/2030), which have taken occupancy in the spring of 2020 for a total of 7,075 square feet.
THE INFORMATION IN THIS STRUCTURAL AND COLLATERAL TERM SHEET IS NOT COMPLETE AND MAY BE AMENDED PRIOR TO THE TIME OF SALE. THIS TERM SHEET IS NOT AN OFFER TO SELL THESE SECURITIES AND IT IS NOT A SOLICITATION OF AN OFFER TO BUY THESE SECURITIES IN ANY JURISDICTION WHERE THE OFFER OR SALE IS NOT PERMITTED.
103
Retail – Lifestyle Center | Loan #10 | Cut-off Date Balance: | | $30,000,000 |
2623 Northeast University Village Street | University Village | Cut-off Date LTV: | | 38.5% |
Seattle, WA 98105 | | U/W NCF DSCR: | | 3.39x |
| | U/W NOI Debt Yield: | | 11.8% |
Four spaces, totaling 36,023 square feet or 6.0% of total square feet are leased for office use consisting of Virginia Mason (19,909 square feet), Bright Horizons (13,070 square feet), Kumon Learning Center (2,560 square feet) and Benchmark Associates (484 square feet).
The University Village Property is located in the Northgate/Central submarket, one of Seattle’s most affluent retail markets with strong trade demographics. The University Village Property occupies a prime urban infill location with a population of 532,088 within a 5-mile radius, and benefits from its proximity to the University of Washington (47,571 students enrolled in September 2019).
COVID-19 Update. As of May 8, 2020, the University Village Property is open, however, many tenants are closed. The borrower sponsor is also in active conversations with large and small tenants for payment timing and pursuing collections for April 2020 and May 2020 rents. As of May 8, 2020 no rental relief agreements have been signed, however, not all rents have been collected. As of the March 2020 rent roll, the University Village Property remains 97.9% occupied. As of the beginning of May 2020, government guidelines around a phased reopening had begun with curbside pick-up for non-essential businesses and some appointment based businesses now being allowed. The University Village Property tenants are preparing for this and several began such services.
The May debt service payment has been made. As of the date hereof, the University Village Whole Loan is not subject to any modification or forbearance request. On May 20, 2020, the mortgage loan seller received a communication from the borrower sponsor in which the borrower sponsor stated that it is considering a request to the servicer of the CSMC 2019-UVIL securitization trust for relief relating to borrower sponsor's ability to make certain lease modifications (including concessions and deferrals) and certain requirements in connection with debt yield trigger events. The borrower sponsor indicated that it expects to continue to pay its obligations under the University Village Mortgage Loan Documents and does not expect to request a forbearance of interest payments.
Major Tenants. The University Village Property is anchored by Apple (M/S&P/F: Aa1/AA+/AA, 13,920 square feet), Restoration Hardware Gallery (43,846 square feet) and Crate & Barrel (36,875 square feet). Apple, Restoration Hardware Gallery, and Crate & Barrel have reported sales of approximately $107.9 million ($7,751 per square foot), $23.7 million ($541 per square foot) and $14.2 million ($455 per square foot), respectively, as of the trailing twelve-month period ending July 2019.
The following table presents certain information relating to the tenancy at the University Village Property:
Major Tenants
| Tenant Name | Ratings
Moody’s/S&P/
Fitch(1) | NRA
(SF)(2) | % of
Total
NRA | Annual U/W
Base
Rent PSF(3) | Annual U/W
Base Rent | % of
Annual
U/W
Base
Rent | Sales PSF(4) | Occ.
Costs(5) | Lease
Expiration
Date | Extension
Option | Term.
Option
(Y/N) |
| Apple | Aa1 / AA+ / AA | 13,920 | 2.3% | $155.58 | $2,165,722 | 6.7% | $7,751 | 2.1% | 6/30/2028 | 3, 5-year | N |
| Restoration Hardware Gallery | NR / NR / NR | 43,846 | 7.3% | $42.65 | $1,870,000 | 5.8% | $541 | 8.0% | 1/31/2032 | 5, 5-year | N |
| Crate & Barrel | NR / NR / NR | 31,300 | 5.2% | $45.79 | $1,433,330 | 4.4% | $455 | 14.3% | 1/31/2026 | None | N |
| Pottery Barn | NR / NR / NR | 15,135 | 2.5% | $68.00 | $1,029,180 | 3.2% | $452 | 18.3% | 1/31/2029 | None | N |
| Bartell Drugs | NR / NR / NR | 20,633 | 3.5% | $48.57 | $1,002,167 | 3.1% | $904 | 7.4% | 1/31/2024 | None | N |
| Virginia Mason | NR / NR / NR | 19,909 | 3.3% | $43.50 | $866,042 | 2.7% | NAV | NAV | 12/1/2028 | 2, 5-year | N |
| Room & Board | NR / NR / NR | 28,401 | 4.8% | $28.00 | $795,228 | 2.5% | $678 | 4.7% | 9/30/2022 | 1, 5-year | N |
| H&M(6) | NR / NR / NR | 18,560 | 3.1% | $41.82 | $776,179 | 2.4% | $238 | 25.5% | 1/31/2022 | None | Y |
| Williams Sonoma | NR / NR / NR | 10,184 | 1.7% | $63.00 | $641,592 | 2.0% | $459 | 17.9% | 1/31/2030 | None | N |
| Lululemon | NR / NR / NR | 7,847 | 1.3% | $76.28 | $598,573 | 1.8% | $918 | 10.1% | 1/31/2024 | 1, 5-year | N |
| Top 10 Tenants | | 209,735 | 35.1% | $53.30 | $11,178,013 | 34.4% | | | | | |
| Other Tenants | | 348,288 | 58.3% | $59.28 | $20,645,865 | 63.6% | | | | | |
| Storage | | 25,270 | 4.2% | $24.89 | $628,939 | 1.9% | | | | | |
| Total Occupied Collateral | | 583,293 | 97.6% | $55.64 | $32,452,817 | 100.0% | | | | | |
| Vacant(7) | | 14,342 | 2.4% | | | | | | | | |
| Collateral Total | | 597,635 | 100.0% | | | | | | | | |
| (1) | Credit Ratings include ratings for the parent companies of tenants, although such parent companies may not guarantee the related leases. |
| (2) | NRA (SF) for Crate & Barrel, Pottery Barn, Williams Sonoma and Lululemon reflects each tenant’s primary retail space and does not include additional leased storage spaces. |
| (3) | Inclusive of base rent, SNO tenant rent, rent steps, and credit tenant rent steps. |
| (4) | Calculated using square feet of tenants that represent comparable sales as of November 2019. |
| (5) | Calculated based on current UW rent, steps, credit tenant rent steps, overage rent, and recoveries for tenants with comparable sales only. |
| (6) | During the period from February 1, 2019 through January 31, 2022, H&M has the right to terminate its lease upon 270 days’ prior written provided that the tenant is not then in default under the terms of the lease. |
| (7) | Reflects three temporary tenants totalling 14,342 square feet. |
THE INFORMATION IN THIS STRUCTURAL AND COLLATERAL TERM SHEET IS NOT COMPLETE AND MAY BE AMENDED PRIOR TO THE TIME OF SALE. THIS TERM SHEET IS NOT AN OFFER TO SELL THESE SECURITIES AND IT IS NOT A SOLICITATION OF AN OFFER TO BUY THESE SECURITIES IN ANY JURISDICTION WHERE THE OFFER OR SALE IS NOT PERMITTED.
104
Retail – Lifestyle Center | Loan #10 | Cut-off Date Balance: | | $30,000,000 |
2623 Northeast University Village Street | University Village | Cut-off Date LTV: | | 38.5% |
Seattle, WA 98105 | | U/W NCF DSCR: | | 3.39x |
| | U/W NOI Debt Yield: | | 11.8% |
The following table presents certain information relating to tenant sales at the University Village Property:
Tenant Sales (PSF)
| Major Tenant Name | TTM July 2019
Sales PSF(1) | Occupancy Cost(1)(2) |
| Apple | $7,751 | 2.1% |
| Restoration Hardware Gallery | $541 | 8.0% |
| Crate & Barrel | $455 | 14.3% |
| Pottery Barn | $452 | 18.3% |
| Bartell Drugs | $904 | 7.4% |
| Virginia Mason | NAV | NAV |
| Room & Board | $678 | 4.7% |
| H&M | $238 | 25.5% |
| Williams Sonoma | $459 | 17.9% |
| Lululemon | $918 | 10.1% |
| (1) | Calculated using square feet of tenants that represent comparable sales as of November 2019. |
| (2) | Calculated based on current UW rent, steps, credit tenant rent steps, overage rent, and |
| (3) | recoveries for tenants with comparable sales only. |
Historical Sales and Occupancy Cost(1)
| | 2017 | | 2018 | | July 2019 TTM |
| | Sales PSF | Occupancy
Cost(2) | | Sales PSF | Occupancy
Cost(2) | | Sales PSF | Occupancy
Cost(2) |
| Inline Comp Sales (Less than 15,000 SF) | $1,012 | 8.9% | | $1,134 | 7.9% | | $1,123 | 8.0% |
| Inline Comp Sales (Less than 15,000 SF) Excluding Apple(2) | $757 | 11.4% | | $768 | 11.2% | | $782 | 11.0% |
| (1) | Includes current tenants with comparable sales. |
| (2) | Calculated based on current UW rent, steps, credit tenant steps, recoveries, and overage rent. |
The following table presents certain information relating to the lease rollover schedule at the University Village Property:
Lease Expiration Schedule(1)(2)
| Year | No. of Leases Expiring | Expiring
NRSF | % of Total
NRSF | Cumulative NRA Expiring | Cumulative % of NRA Expiring | Annual
U/W
Base Rent(3) | % of Total
Annual U/W
Base Rent | Annual U/W
Base Rent PSF |
| MTM | 0 | 0 | 0.0% | 0 | 0.0% | $0 | 0.0% | $0.00 |
| 2020 | 21 | 23,767 | 4.0% | 23,767 | 4.0% | $1,194,404 | 3.7% | $50.25 |
| 2021 | 21 | 36,304 | 6.1% | 60,071 | 10.1% | $2,579,908 | 7.9% | $71.06 |
| 2022 | 18 | 66,111 | 11.1% | 126,182 | 21.2% | $2,745,555 | 8.5% | $41.53 |
| 2023 | 16 | 50,193 | 8.4% | 176,375 | 29.7% | $2,776,134 | 8.6% | $55.31 |
| 2024 | 24 | 89,214 | 15.0% | 265,589 | 44.7% | $4,856,023 | 15.0% | $54.43 |
| 2025 | 12 | 42,178 | 7.1% | 307,767 | 51.8% | $2,458,759 | 7.6% | $58.29 |
| 2026 | 9 | 56,010 | 9.4% | 363,777 | 61.2% | $2,736,837 | 8.4% | $48.86 |
| 2027 | 15 | 37,048 | 6.2% | 400,825 | 67.5% | $2,405,570 | 7.4% | $64.93 |
| 2028 | 9 | 54,085 | 9.1% | 454,910 | 76.6% | $4,150,962 | 12.8% | $76.75 |
| 2029 | 10 | 41,540 | 7.0% | 496,450 | 83.6% | $2,508,726 | 7.7% | $60.39 |
| 2030 & Beyond | 11 | 83,246 | 14.0% | 579,696 | 97.6% | $4,039,940 | 12.4% | $48.53 |
| Vacant(4) | 3 | 14,342 | 2.4% | 594,038 | 100.0% | $0 | 0.0% | $0.00 |
| Total | 169 | 594,038 | 100.0% | | | $32,452,817 | 100.0% | $55.98 |
| (1) | Excludes the management office of 3,597 square feet. |
| (2) | Certain tenants have more than one lease. In addition, certain tenants may have lease termination options that are exercisable prior to the originally stated expiration date. |
| (3) | Inclusive of Base Rent, Sign-Not-Occupied Rent and Rent Steps. |
| (4) | Vacant reflects three temporary tenants totaling 14,342 square feet. |
THE INFORMATION IN THIS STRUCTURAL AND COLLATERAL TERM SHEET IS NOT COMPLETE AND MAY BE AMENDED PRIOR TO THE TIME OF SALE. THIS TERM SHEET IS NOT AN OFFER TO SELL THESE SECURITIES AND IT IS NOT A SOLICITATION OF AN OFFER TO BUY THESE SECURITIES IN ANY JURISDICTION WHERE THE OFFER OR SALE IS NOT PERMITTED.
105
Retail – Lifestyle Center | Loan #10 | Cut-off Date Balance: | | $30,000,000 |
2623 Northeast University Village Street | University Village | Cut-off Date LTV: | | 38.5% |
Seattle, WA 98105 | | U/W NCF DSCR: | | 3.39x |
| | U/W NOI Debt Yield: | | 11.8% |
The following table presents historical occupancy percentages at the University Village Property:
Historical Occupancy
12/31/2012(1) | 12/31/2013(1) | 12/31/2014(1) | 12/31/2015(1) | 12/31/2016(1) | 12/31/2017(1) | 12/31/2018(1) | 11/18/2019(2) |
| 99.1% | 99.3% | 99.6% | 97.9% | 98.1% | 97.6% | 98.8% | 100.0% |
| (1) | Reflects historical average occupancy and does not include temporary tenants. |
| (2) | Based on the November 2019 underwritten rent roll including three temporary tenants. Excluding temporary tenants, the University Village Property is 97.6% leased to 123 tenants. |
Operating History and Underwritten Net Cash Flow. The following table presents certain information relating to the historical operating performance and underwritten net cash flow at the University Village Property:
Cash Flow Analysis
| | 2017 | 2018 | TTM
9/30/2019 | Budget 2020 | U/W(1) | %(2) | U/W $
per SF |
| Base Rent | $28,102,730 | $29,739,478 | $30,523,086 | $31,312,267 | $31,063,123 | 74.7% | $51.98 |
| Signed Not Occupied Rent(3) | 0 | 0 | 0 | 0 | 606,875 | 1.5 | 1.02 |
| Rent Steps(2) | 0 | 0 | 0 | 0 | 782,820 | 1.9 | 1.31 |
| Overage Rent | 659,113 | 620,251 | 669,246 | 500,000 | 568,966 | 1.4 | 0.95 |
| Total Rent Revenue | $28,761,843 | $30,359,729 | $31,192,332 | $31,812,267 | $33,021,783 | 79.4% | $55.25 |
| Total Recoveries | $7,489,134 | $7,972,617 | $7,871,870 | $8,294,104 | $8,727,103 | 21.0% | $14.60 |
| Gross Up Vacant Space | 0 | 0 | 0 | 0 | 1,162,243 | 2.8 | 1.94 |
| Gross Potential Income | $36,250,977 | $38,332,346 | $39,064,202 | $40,106,371 | $42,911,129 | 103.2% | $71.80 |
| (Vacancy & Credit Loss) | (149,343) | 0 | (47,987) | (90,000) | (1,323,023) | (3.2) | (2.21) |
| Net Rental Income | $36,101,634 | $38,332,346 | $39,016,215 | $40,016,371 | $41,588,106 | 100.0% | $69.59 |
| Other Income | 47,563 | 85,963 | 63,188 | 45,000 | 63,188 | 0.2 | 0.11 |
| Effective Gross Income | $36,149,197 | $38,418,309 | $39,079,403 | $40,061,371 | $41,651,294 | 100.2% | $69.69 |
| Total Expenses | $10,609,777 | $11,099,447 | $11,326,249 | $12,188,610 | $12,188,610 | 29.3% | $20.39 |
| Net Operating Income | $25,539,420 | 27,318,862 | $27,753,154 | $27,872,761 | $29,462,684 | 70.7% | $49.30 |
| Capital Expense Reserve | 0 | 0 | 0 | 0 | 149,409 | 0.4 | 0.25 |
| TI/LC | 0 | 0 | 0 | 0 | 935,728 | 2.2 | 1.57 |
| Net Cash Flow | $25,539,420 | $27,318,862 | $27,753,154 | $27,872,761 | $28,377,547 | 68.1% | $47.48 |
| | | | | | | | |
| NOI DSCR | 3.05x | 3.27x | 3.32x | 3.33x | 3.52x | | |
| NCF DSCR | 3.05x | 3.27x | 3.32x | 3.33x | 3.39x | | |
| NOI Debt Yield | 10.2% | 10.9% | 11.1% | 11.1% | 11.8% | | |
| NCF Debt Yield | 10.2% | 10.9% | 11.1% | 11.1% | 11.4% | | |
| (1) | For the avoidance of doubt, no COVID-19 specific adjustments have been incorporated in the lender U/W. |
| (2) | Represents percent of Net Rental Income for all revenue lines and represents percent of Effective Gross Income for the remainder of fields. |
| (3) | U/W Signed-Not-Occupied Rent includes rent from Shake Shack (3,520 square feet), Hello Robin (1,100 square feet) and Peloton (2,455 square feet). Tenants are part of a new development at the University Village Property and are anticipated to open in the summer of 2020. |
| (4) | U/W Rent Steps includes rent increases occurring through December 31, 2020. |
THE INFORMATION IN THIS STRUCTURAL AND COLLATERAL TERM SHEET IS NOT COMPLETE AND MAY BE AMENDED PRIOR TO THE TIME OF SALE. THIS TERM SHEET IS NOT AN OFFER TO SELL THESE SECURITIES AND IT IS NOT A SOLICITATION OF AN OFFER TO BUY THESE SECURITIES IN ANY JURISDICTION WHERE THE OFFER OR SALE IS NOT PERMITTED.
106
Retail – Lifestyle Center | Loan #10 | Cut-off Date Balance: | | $30,000,000 |
2623 Northeast University Village Street | University Village | Cut-off Date LTV: | | 38.5% |
Seattle, WA 98105 | | U/W NCF DSCR: | | 3.39x |
| | U/W NOI Debt Yield: | | 11.8% |
Appraisal. The appraiser concluded to an “as-is” appraised value of $650,000,000 as of October 23, 2019.
Environmental Matters. Based on a Phase I environmental report dated November 26, 2019, the environmental consultant identified certain RECs and an HREC at the University Village Mortgaged Property in connection with current and historic off-site operations or historic on-site operations, including a gas station and automotive repair operations. The environmental consultant estimated the potential risks associated with such contamination, including total investigation and remediation costs, to be approximately $1,150,000 but did not recommend any further action in connection with such RECs and HREC. The University Village Borrower obtained a $10.0 million environmental liability insurance policy, with a policy period of thirteen years from Great American Insurance Group, covering, among other things, any regulatory required site investigation and remediation of unknown contamination and disclosed known contamination for the University Village Property.
Market Overview and Competition. The University Village Property is located at the northeast corner of 25th Avenue Northeast and Northeast 45th Street in the University District (“U-District”) neighborhood of Seattle, King County, Washington, approximately three miles northeast of the central business district. The U-District is a residential and retail area designed to serve the University of Washington campus, its student body and associated employee base. The U-District is bounded by Interstate 5 to the west, Northeast 55th Street to the north, 40th Avenue Northeast to the east, and Portage Bay/State Route 520 to the south. The subject campus is surrounded by a mix of single-family homes, apartment buildings, and more recently built townhome/condominium projects.
The University Village Property is adjacent to the University of Washington, which recorded 47,571 students enrolled in September 2019. The University of Washington is also one of the region’s largest employers, with an academic and administrative staff of over 20,000. The local area also includes the University of Washington Medical Center and Seattle Children’s Hospital, both of which are major regional hospitals serving patients from across the Pacific Northwest.
According to the appraisal, the University Village Property has a primary trade area consisting of a five-mile radius that contains 532,088 people, with an average household income of $135,950 as of 2019. The secondary trade area, defined as being within a 10-mile radius of the University Village Property, contains approximately 1,202,970 people, with an average household income of $135,570 as of 2019. The University Village Property’s Northgate/Central submarket is the smallest of the 4 submarkets in the Seattle market with 3,513,000 square feet of retail space or 12.9% of total inventory. The submarket vacancy rate was 2.5%, the lowest of the 4 submarkets, with vacancies of 2.8% in community, and 2.3% in neighborhood centers. A third-party market research provider projects vacancy will decline further to 2.1% by 2023. As of third quarter 2019, the average asking rent was $28.05 per square foot, the second highest of the 4 submarkets, and was $28.73 per square foot for community centers, and $27.47 per square foot for neighborhood centers. Since 2014, average asking rent rose 8.7% from $25.80, increased 6.9% from $26.87 per square foot for community centers, and grew 10.5% from $24.87 per square foot for neighborhood centers. A third-party market research provider projects average asking rent will increase 15.4% to $32.36 per square foot by 2023.
The following table presents certain information relating to the primary competition for the University Village Property:
| Competitive Set(1) |
| | Distance
to Subject
(mi.) | Property Type | Year Built/
Renovated | Total Gross
Leasable
Area | Total
Occupancy | Sales per
Square Foot | Anchors |
| University Village | -- | Lifestyle Center | 1956/2019 | 597,635 | 100% | $617-$659 | Anthropologie, Apple, Bartell Drugs, CB2, Crate & Barrel, The Gap, H&M, Pottery Barn, RH Gallery, Room & Board, Williams Sonoma |
| Bellevue Square | 5.5 | Super Regional Mall | 1946/2019 | 845,650 | 100% | $500-$600 | Nordstrom, Macy’s, Zara, Pottery Barn, Uniqlo, Cheesecake Factory, Banana Republic, Apple Store |
| Pacific Place | 4.0 | Urban Specialty Center | 1998/2019 | 330,000 | 75% | $500-$650 | AMC Theaters, Barnes & Noble, Nordstrom (Adjacent) |
| Alderwood Mall | 11.6 | Super Regional Mall | 1979/2009 | 1,438,713 | 100% | NAV | JCPenney, Loews Cineplex, Nordstrom, Macy’s, REI, Forever 21, American Girl, Zara, H&M |
| Southcenter Mall | 14.3 | Super Regional Mall | 1968/2008 | 1,843,292 | 100% | $700-$800 | JCPenney, Macy’s, Nordstrom, Sears, Grill City, Seafood City Supermarket, Round 1, The Container Store |
| Redmond Town Center | 8.3 | Lifestyle Center | 1996 | 138,796 | 97% | NAV | Bed Bath & Beyond, Cost Plus World Market, 24 Hour Fitness, iPic Theatres |
| Shops at Bravern | 5.9 | Lifestyle Center | 1992 | 294,436 | 100% | NAV | Neiman Marcus, Life Time Athletic |
(1) | Information obtained from the appraisal. |
THE INFORMATION IN THIS STRUCTURAL AND COLLATERAL TERM SHEET IS NOT COMPLETE AND MAY BE AMENDED PRIOR TO THE TIME OF SALE. THIS TERM SHEET IS NOT AN OFFER TO SELL THESE SECURITIES AND IT IS NOT A SOLICITATION OF AN OFFER TO BUY THESE SECURITIES IN ANY JURISDICTION WHERE THE OFFER OR SALE IS NOT PERMITTED.
107
Retail – Lifestyle Center | Loan #10 | Cut-off Date Balance: | | $30,000,000 |
2623 Northeast University Village Street | University Village | Cut-off Date LTV: | | 38.5% |
Seattle, WA 98105 | | U/W NCF DSCR: | | 3.39x |
| | U/W NOI Debt Yield: | | 11.8% |
Escrows.
Alterations Reserve –At origination, the University Village Borrower deposited into escrow $14,189,947 into an alterations reserve to complete work related to the West Garage and retail buildouts for space leased to Peloton, Hello Robin, and Shake Shack and $3,299,128 for all outstanding tenant improvements, leasing commissions, free rent, gap rent, or rent abatement obligations. With respect to the alterations reserve, approximately $11.6 million has been released to the University Village Borrower based upon partial completion of the construction.
Real Estate Taxes – During a Trigger Period (as defined below), the University Village Borrower will be required to deposit 1/12th of certain yearly tax obligations within 30 days prior to the date that such taxes are due and payable.
Insurance Reserve – During a Trigger Period (as defined below), the University Village Borrower will be required to deposit 1/12th of annual insurance premiums due (unless there is an approved blanket policy in place) within 30 days prior to the date that such premiums are due and payable.
Capital Expenditures Reserve – During a Trigger Period, the University Village Borrower will be required to deposit 1/12th of $0.25 per rentable square foot (capped at collections for 24 months) to be used for capital expenditures in accordance with the terms of the loan documents.
Leasing Reserve – During a Trigger Period, the University Village Borrower will be required to deposit 1/12th of $1.50 per rentable square foot (capped at collections for 24 months) to be used for tenant improvements and leasing commissions in accordance with the terms of the University Village Whole Loan documents. The University Village Borrower is also required to deposit any termination fees paid by any tenant under a lease into the leasing reserve during a Trigger Period and, in the absence of a Trigger Period, the University Village Borrower is only required to deposit such termination fees that exceed $1,000,000.
Lockbox and Cash Management. The University Village Whole Loan is structured with a hard lockbox with springing cash management during a Trigger Period. At origination, the University Village Borrower and property manager were required to send direction letters to tenants instructing them to deposit all rents and payments into the lockbox account controlled by the lender. During the continuance of a Trigger Period, all funds in the lockbox account are swept daily to a cash management account under the control of the lender and disbursed during each interest period of the term of the University Village Whole Loan in accordance with the University Village Whole Loan documents. During the continuance of a Trigger Period, all excess cash flow, after payments made in accordance with the University Village Whole Loan documents for, amongst other things, debt service, required reserves and operating expenses, will be held as additional collateral for the University Village Whole Loan.
A “Trigger Period” will commence (i) upon a University Village Whole Loan event of default, (ii) if the debt yield falls below 6.0% based on the University Village Whole Loan and ends when the debt yield rises to or above 6.0% based on the University Village Whole Loan for one calendar quarter (tested on the last day of each calendar month)(which may be cured by depositing cash or a letter of credit or partially prepaying the University Village Whole Loan, in each case, in the amount sufficient to reach the required debt yield), or (iii) following the occurrence of a bankruptcy event with respect to the property manager if a replacement property manager has not been appointed by the borrower in accordance with the University Village Whole Loan documents.
Property Management. The University Village Property is managed by UVLP Management, LLC, which is owned and controlled by the borrower sponsor and is an affiliate of the University Village Borrower.
Partial Release. The University Village Borrower may request that the lender release up to four vacant, non-income producing and unimproved (other than surface parking and landscaping) outparcels identified in the University Village Whole Loan documents that are presently being used as parking without any prepayment of the University Village Whole Loan balance and subject to satisfaction of customary outparcel release conditions set forth in the University Village Whole Loan documents, including that if the transfer is made to an affiliate of the University Village Borrower, the University Village Borrower must comply with standard anti-poaching conditions. The University Village Borrower also has the right to execute a declaration of condominium or similar agreement in order to develop separate units with respect to the parking garage on the University Village Property commonly known as the “West Garage”, including a separate unit for the air rights above the parking garage. Following the separation of the air rights unit, such unit can be released, subject to the prior written consent of the lender in its reasonable discretion and the receipt of a rating agency confirmation with respect to the same.
Real Estate Substitution. Not permitted.
Subordinate and Mezzanine Indebtedness. The University Village Property also secures the University Village Pari Passu Companion Loans, which have an aggregate Cut-off Date principal balance of $220,000,000, and the University Village Subordinate Companion Loan, which has an aggregate Cut-off Date principal balance of $130,000,000. The University Village Pari Passu Companion Loans and the University Village Subordinate Companion Loan are coterminous with the University Village Mortgage Loan. The University Village Pari Passu Companion Loans and University Village Subordinate Companion Loan accrue interest at the same rate as the University Village Mortgage Loan. The University Village Mortgage Loan and the University Village Pari Passu Companion Loans are each pari passu in right of payment and together are senior in right of payment to the University Village Subordinate Companion Loan. The holders of the University Village Mortgage Loan, the University Village Pari Passu Companion Loans and the University Village Subordinate Companion Loan have entered into a co-lender agreement which sets forth the allocation of collections on the University
THE INFORMATION IN THIS STRUCTURAL AND COLLATERAL TERM SHEET IS NOT COMPLETE AND MAY BE AMENDED PRIOR TO THE TIME OF SALE. THIS TERM SHEET IS NOT AN OFFER TO SELL THESE SECURITIES AND IT IS NOT A SOLICITATION OF AN OFFER TO BUY THESE SECURITIES IN ANY JURISDICTION WHERE THE OFFER OR SALE IS NOT PERMITTED.
108
Retail – Lifestyle Center | Loan #10 | Cut-off Date Balance: | | $30,000,000 |
2623 Northeast University Village Street | University Village | Cut-off Date LTV: | | 38.5% |
Seattle, WA 98105 | | U/W NCF DSCR: | | 3.39x |
| | U/W NOI Debt Yield: | | 11.8% |
Village Whole Loan. See “Description of the Mortgage Pool—The Whole Loans—The Non-Serviced AB Whole Loans— The University Village Whole Loan” in the Preliminary Prospectus.
The following table presents certain information relating to the University Village Subordinate Companion Loan:
Subordinate Note Summary
| B-Note Original Principal Balance | B-Note Interest Rate | Original Term (mos.) | Original Amort. Term (mos.) | Original IO Term (mos.) | Total Debt UW NCF DSCR | Total Debt UW NOI Debt Yield | Total Debt Cut-off Date LTV |
University Village Subordinate Companion Loan | $130,000,000 | 3.3000% | 120 | 0 | 120 | 2.23x | 7.8% | 58.5% |
Ground Lease. None.
Terrorism Insurance. The University Village Whole Loan documents require that the “all risk” insurance policy required to be maintained by the University Village Borrower provides coverage for terrorism in an amount equal to the full replacement cost of the University Village Property.
THE INFORMATION IN THIS STRUCTURAL AND COLLATERAL TERM SHEET IS NOT COMPLETE AND MAY BE AMENDED PRIOR TO THE TIME OF SALE. THIS TERM SHEET IS NOT AN OFFER TO SELL THESE SECURITIES AND IT IS NOT A SOLICITATION OF AN OFFER TO BUY THESE SECURITIES IN ANY JURISDICTION WHERE THE OFFER OR SALE IS NOT PERMITTED.
109
| Various | Loan #11 | Cut-off Date Balance: | | $30,000,000 |
| Various | Bushwick Multifamily Portfolio | Cut-off Date LTV: | | 67.5% |
| Brooklyn, NY | | U/W NCF DSCR: | | 1.82x |
| | | U/W NOI Debt Yield: | | 7.2% |
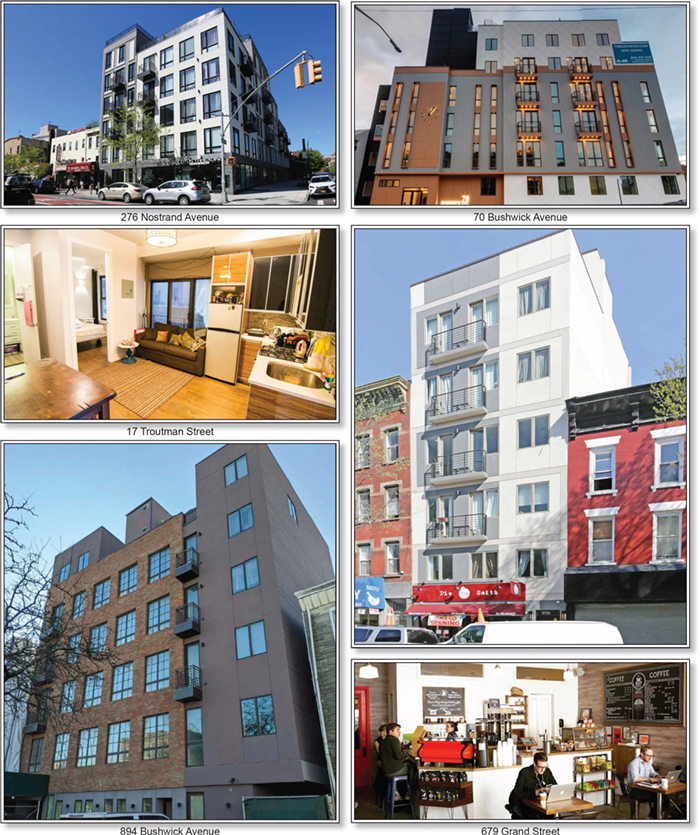
THE INFORMATION IN THIS STRUCTURAL AND COLLATERAL TERM SHEET IS NOT COMPLETE AND MAY BE AMENDED PRIOR TO THE TIME OF SALE. THIS TERM SHEET IS NOT AN OFFER TO SELL THESE SECURITIES AND IT IS NOT A SOLICITATION OF AN OFFER TO BUY THESE SECURITIES IN ANY JURISDICTION WHERE THE OFFER OR SALE IS NOT PERMITTED.
110
| Various | Loan #11 | Cut-off Date Balance: | | $30,000,000 |
| Various | Bushwick Multifamily Portfolio | Cut-off Date LTV: | | 67.5% |
| Brooklyn, NY | | U/W NCF DSCR: | | 1.82x |
| | | U/W NOI Debt Yield: | | 7.2% |

THE INFORMATION IN THIS STRUCTURAL AND COLLATERAL TERM SHEET IS NOT COMPLETE AND MAY BE AMENDED PRIOR TO THE TIME OF SALE. THIS TERM SHEET IS NOT AN OFFER TO SELL THESE SECURITIES AND IT IS NOT A SOLICITATION OF AN OFFER TO BUY THESE SECURITIES IN ANY JURISDICTION WHERE THE OFFER OR SALE IS NOT PERMITTED.
111
| No. 11 – Bushwick Multifamily Portfolio |
| |
| Mortgage Loan Information | | Mortgaged Property Information |
| Mortgage Loan Seller: | AREF | | Single Asset/Portfolio: | Portfolio |
Credit Assessment (Fitch/KBRA/Moody’s): | NR/NR/NR | | Property Type – Subtype: | Various |
| Original Principal Balance(1): | $30,000,000 | | Location: | Brooklyn, NY |
| Cut-off Date Balance(1): | $30,000,000 | | Size(3): | 117 Units |
| % of Initial Pool Balance: | 4.1% | | Cut-off Date Balance Per Unit(1): | $445,085 |
| Loan Purpose: | Refinance | | Maturity Date Balance Per Unit(1): | $445,085 |
| Borrower Sponsors: | Jacob Kohn; Abraham Kohn | | Year Built/Renovated: | Various/Various |
| Guarantors: | Jacob Kohn; Abraham Kohn | | Title Vesting: | Fee |
| Mortgage Rate: | 3.8700% | | Property Manager: | The Jay Group Inc. |
| Note Date: | February 26, 2020 | | Current Occupancy (As of)(3)(5): | 100.0% (5/5/2020) |
| Seasoning: | 3 months | | YE 2019 Occupancy: | 93.6% |
| Maturity Date: | March 6, 2030 | | YE 2018 Occupancy(4): | NAV |
| IO Period: | 120 months | | YE 2017 Occupancy(4): | NAV |
| Loan Term (Original): | 120 months | | YE 2016 Occupancy(4): | NAV |
| Amortization Term (Original): | NAP | | As-Is Appraised Value(5): | $77,150,000 |
| Loan Amortization Type: | Interest-only, Balloon | | As-Is Appraised Value Per Unit(5): | $659,402 |
| Call Protection: | L(27),D(90),O(3) | | As-Is Appraisal Valuation Date(5): | December 23, 2019 |
| Lockbox Type: | Springing | | | |
| Additional Debt(1): | Yes | | Underwriting and Financial Information(4) |
| Additional Debt Type (Balance)(1): | Pari Passu($22,075,000) | | TTM NOI (4/30/2020): | $3,831,718 |
| | | | YE 2019 NOI: | $3,738,501 |
| | | | YE 2018 NOI: | $3,476,955 |
| | | | YE 2017 NOI: | NAV |
| | | | U/W Revenues: | $4,324,172 |
| | | | U/W Expenses: | $567,555 |
| | | U/W NOI(5): | $3,756,617 |
| | | | | | U/W NCF(5): | $3,728,865 |
| | | | | | U/W DSCR based on NOI/NCF(1)(5): | 1.84x / 1.82x |
| Escrows and Reserves(2) | | U/W Debt Yield based on NOI/NCF(1)(5): | 7.2% / 7.2% |
| | Initial | Monthly | Cap | | U/W Debt Yield at Maturity based on NOI/NCF(1)(5): | 7.2% / 7.2% |
| Taxes | $31,856 | $9,102 | NAP | | Cut-off Date LTV Ratio(1)(5): | 67.5% |
| Insurance | $23,137 | $5,784 | NAP | | LTV Ratio at Maturity(1)(5): | 67.5% |
| Replacement Reserves | $0 | $2,313 | NAP | | | |
| | | | | | | | |
| Sources and Uses |
| Sources | | | | | Uses | | | |
| Original Loan Amount | | $52,075,000 | 99.3 | % | | Loan Payoff | $51,681,108 | | 98.5 | % |
| Borrower Sponsor Equity | | 388,457 | 0.7 | | | Closing Costs | 727,356 | | 1.4 | |
| | | | | | Reserves | 54,993 | | 0.1 | |
| Total Sources | | $52,463,457 | 100.0 | % | | Total Uses: | $52,463,457 | | 100.0 | % |
| (1) | The Bushwick Multifamily Portfolio Mortgage Loan (as defined below) is part of the Bushwick Multifamily Portfolio Whole Loan (as defined below), which is comprised of fourpari passu notes with an aggregate original principal balance of $52,075,000. All statistical information related to the Cut-off Date Balance per Unit, Maturity Date Balance per Unit, U/W Debt Yield based on NOI/NCF, U/W Debt Yield at Maturity based on NOI/NCF, U/W DSCR based on NOI/NCF, Cut-off Date LTV Ratio and LTV Ratio at Maturity is based on the Bushwick Multifamily Portfolio Whole Loan. |
| (2) | See “Escrows” section below. |
| (3) | Unit count and Current Occupancy includes commercial units. |
| (4) | Historical occupancy figures were not available as the Bushwick Multifamily Portfolio Properties were either built or substantially renovated between 2014 and 2018. |
| (5) | All NOI, NCF and occupancy information, as well as the appraised value, were determined prior to the emergence of the novel coronavirus pandemic, and the economic disruption resulting from measures to combat the pandemic, and all DSCR, LTV and Debt Yield metrics were calculated, and the Bushwick Multifamily Portfolio Mortgage Loan was underwritten, based on such prior information. See “Risk Factors—Coronavirus Pandemic Has Adversely Affected the Global Economy and Will Likely Adversely Affect the Performance of the Mortgage Loans” in the Preliminary Prospectus. |
The Mortgage Loan. The mortgage loan (the “Bushwick Multifamily Portfolio Mortgage Loan”) is part of a whole loan (the “Bushwick Multifamily Portfolio Whole Loan”) in the original principal balance of $52,075,000. The Bushwick Multifamily Portfolio Whole Loan is secured by a first priority fee mortgage encumbering five multifamily properties and two mixed-use properties in Brooklyn, New York (the “Bushwick Multifamily Portfolio Properties”). Notes A-1 and A-2-1 have an aggregate original principal balance of $30,000,000, an aggregate Cut-off Date Balance of $30,000,000 and are expected to be contributed to the WFCM 2020-C56 securitization trust. Notes A-2-2, and A-3 have an aggregate original principal balance of $22,075,000, an aggregate Cut-off Date Balance of $22,075,000 and are expected to be contributed to future securitization trusts or may be otherwise transferred at any time. See “Description of the
THE INFORMATION IN THIS STRUCTURAL AND COLLATERAL TERM SHEET IS NOT COMPLETE AND MAY BE AMENDED PRIOR TO THE TIME OF SALE. THIS TERM SHEET IS NOT AN OFFER TO SELL THESE SECURITIES AND IT IS NOT A SOLICITATION OF AN OFFER TO BUY THESE SECURITIES IN ANY JURISDICTION WHERE THE OFFER OR SALE IS NOT PERMITTED.
112
| Various | Loan #11 | Cut-off Date Balance: | | $30,000,000 |
| Various | Bushwick Multifamily Portfolio | Cut-off Date LTV: | | 67.5% |
| Brooklyn, NY | | U/W NCF DSCR: | | 1.82x |
| | | U/W NOI Debt Yield: | | 7.2% |
Mortgage Pool—The Whole Loans—The Serviced Pari Passu Whole Loans” and “Pooling and Servicing Agreement” in the Preliminary Prospectus.
Note Summary
| Notes | Original Principal Balance | Cut-off Date Balance | Note Holder | Controlling Interest |
| A-1 | $25,000,000 | $25,000,000 | WFCM 2020-C56 | Yes |
| A-2-1 | $5,000,000 | $5,000,000 | WFCM 2020-C56 | No |
| A-2-2 | $10,000,000 | $10,000,000 | AREF | No |
| A-3 | $12,075,000 | $12,075,000 | AREF | No |
| Total | $52,075,000 | $52,075,000 | | |
The Borrowers and the Borrower Sponsors.The borrowers of the Bushwick Multifamily Portfolio Whole Loan are 17 Troutman LLC, 276 Nostrand LLC, 679 Grand LLC, 737 Bushwick Realty LLC, 894 Bushwick LLC, 934 Lafayette Realty LLC, and Bushwick Powers LLC (the “Bushwick Multifamily Portfolio Borrowers”), each a single purpose New York limited liability company with sole members containing one independent director. Legal counsel to the borrower delivered a non-consolidation opinion in connection with the origination of the Bushwick Multifamily Portfolio Whole Loan.
The borrower sponsors and non-recourse carve-out guarantors are Abraham Kohn and Jacob Kohn. Abraham Kohn is an investor and developer in commercial and residential real estate situated primarily in New York, New Jersey, and Illinois. Abraham Kohn has been actively involved in more than 40 single and multifamily property developments and currently maintains an active portfolio. Jacob Kohn is also an investor and developer in commercial and residential real estate situated primarily in New York, New Jersey, Illinois, Florida, and Ohio. Jacob Kohn has been actively involved in more than 20 single and multifamily property developments and also currently maintains an active portfolio. Mr. Kohn is currently the defendant in a pending civil litigation. See “Description of the Mortgage Pool—Litigation and Other Considerations” in the Preliminary Prospectus.
The Properties.The Bushwick Multifamily Portfolio Properties are comprised of five multifamily properties and two mixed-use properties totaling 111 residential units and six commercial units located in three neighborhoods in Brooklyn, New York. The Bushwick Multifamily Portfolio Properties were constructed between 1899 and 2017. The borrower sponsors developed the 679 Grand Street, 70 Bushwick Avenue, and 894 Bushwick Avenue properties between 2015 and 2017. In addition, the borrower sponsors gut renovated the 735 & 737 Bushwick Avenue, 17 Troutman Street, 934 Lafayette Avenue, and 276 Nostrand Avenue properties following their respective acquisitions between 2014 and 2018. As of May 5, 2020, the Bushwick Multifamily Portfolio Properties were 100.0% leased.
The residential units at the Bushwick Multifamily Portfolio Properties comprise approximately 93.6% of the total net rentable area and contribute approximately 92.7% of the underwritten base rent. The unit mix at the Bushwick Multifamily Portfolio Properties consists of 11 one-bedroom units, 30 two-bedroom units, 58 three-bedroom units, seven four-bedroom units, and five five-bedroom units. Unit amenities, which vary from unit to unit, include dishwashers, hardwood floors, stainless steel appliances, stone countertops, oversized windows, and private balconies/terraces. The 70 Bushwick Avenue, 894 Bushwick Avenue and 276 Nostrand Avenue properties feature fitness centers and finished rooftops. The 679 Grand Street, 70 Bushwick Avenue, 894 Bushwick Avenue and 276 Nostrand Avenue properties benefit from an elevator.
The commercial units are located at the 276 Nostrand Avenue and 679 Grand Street properties and are 100.0% leased by seven tenants, one of which is an antenna tenant as of May 5, 2020. The commercial tenants comprise 6.4% of the total net rentable area and contribute 7.3% of the underwritten base rent. The three largest commercial tenants by square footage are The Jay Group Inc., BK Jani, and Lofts and Flats, LLC. The remaining four tenants consist of a threading salon, barber shop, café and an antenna tenant. The Jay Group Inc. is a borrower-affiliated tenant. The lease is scheduled to expire in December 2027 and is fully guaranteed by the related guarantors of the Bushwick Multifamily Portfolio Mortgage Loan.
Four of the Bushwick Multifamily Portfolio Properties benefit from the 421-a tax abatement program. The 70 Bushwick Avenue, 894 Bushwick Avenue and 679 Grand Street properties each benefit from a 25-year 421-a tax abatement. The 276 Nostrand Avenue property benefits from a 15-year 421-a tax abatement. The 25-year 421-a tax abatements require that at least 20% of the units at each of the 679 Grand Street, 70 Bushwick Avenue and 894 Bushwick Avenue properties be reserved for tenants earning no more than 60% of the area median income. The Bushwick Multifamily Portfolio Mortgage Loan documents provide that the related borrowers are liable for any losses related to the failure to maintain the 421-a tax abatements benefiting the 679 Grand Street, 70 Bushwick Avenue, 894 Bushwick Avenue and 276 Nostrand Avenue properties. In addition, the 735 & 737 Bushwick Avenue property benefits from a 6%/20% tax program, which restricts the City of New York from increasing the assessed value of such property by 6% in any given year and by 20% over any 5-year period. The 934 Lafayette Avenue and 17 Troutman Street properties benefit from an 8%/30% tax program, which restricts the City of New York from increasing the assessed value of such property by 8% in any given year and by 30% over any 5-year period.
THE INFORMATION IN THIS STRUCTURAL AND COLLATERAL TERM SHEET IS NOT COMPLETE AND MAY BE AMENDED PRIOR TO THE TIME OF SALE. THIS TERM SHEET IS NOT AN OFFER TO SELL THESE SECURITIES AND IT IS NOT A SOLICITATION OF AN OFFER TO BUY THESE SECURITIES IN ANY JURISDICTION WHERE THE OFFER OR SALE IS NOT PERMITTED.
113
| Various | Loan #11 | Cut-off Date Balance: | | $30,000,000 |
| Various | Bushwick Multifamily Portfolio | Cut-off Date LTV: | | 67.5% |
| Brooklyn, NY | | U/W NCF DSCR: | | 1.82x |
| | | U/W NOI Debt Yield: | | 7.2% |
The following table presents detailed information with respect to the Bushwick Multifamily Portfolio Properties:
Bushwick Multifamily Portfolio Properties Summary
| Building | Occ. %(1) | Year Built/ Reno | Units(1) | Comm. SF.(1) | % of Total Units(1) | Appraised Value | Allocated Loan Amount (“ALA”) | % of ALA | UW NOI | % of UW NOI |
| 276 Nostrand Avenue | 100.0% | 1970/2018 | 47 | 3,845 | 40.2% | $29,600,000 | $19,980,000 | 38.4% | $1,434,530 | 38.2% |
| 70 Bushwick Avenue | 100.0% | 2016/NAP | 20 | 0 | 17.1% | $13,800,000 | $9,315,000 | 17.9% | $654,370 | 17.4% |
| 894 Bushwick Avenue | 100.0% | 2015/NAP | 20 | 0 | 17.1% | $11,900,000 | $8,032,000 | 15.4% | $581,635 | 15.5% |
| 679 Grand Street | 100.0% | 2017/NAP | 11 | 1,300 | 9.4% | $7,900,000 | $5,332,500 | 10.2% | $427,101 | 11.4% |
| 735 & 737 Bushwick Avenue | 100.0% | 1899/2016 | 7 | 0 | 6.0% | $5,850,000 | $3,948,000 | 7.6% | $281,017 | 7.5% |
| 17 Troutman Street | 100.0% | 1931/2014 | 8 | 0 | 6.8% | $4,600,000 | $3,105,000 | 6.0% | $215,399 | 5.7% |
| 934 Lafayette Avenue | 100.0% | 1931/2016 | 4 | 0 | 3.4% | $3,500,000 | $2,362,500 | 4.5% | $162,563 | 4.3% |
| Total/Wtd. Avg. | 100.0% | | 117 | 5,145 | 100.0% | $77,150,000 | $52,075,000 | 100.0% | $3,756,617 | 100.0% |
| (1) | Based on the underwritten rent roll dated May 5, 2020. Units shown includes six commercial units. |
COVID-19 Update. As of the May 2020 payment, the residential portion of the Bushwick Multifamily Portfolio Properties was open and operating. All commercial tenants are closed due to the state of New York’s stay-at-home order except for The Jay Group Inc., the borrower-affiliated property management company for the Bushwick Multifamily Portfolio Properties, and Lofts and Flats, LLC, a local real estate agency, which are considered essential businesses as well as BK Jani and Burly Café, which are restaurants that are open for pick-up and delivery service. All residential and commercial tenants paid rent in April 2020. The borrower sponsors reported that 10 residential tenants representing 8.5% of the total units across the Bushwick Multifamily Portfolio Properties inquired about or requested rent relief. In response and in place of granting any rent abatements, the borrower sponsors are temporarily waiving late fees for any rent received prior to the 25th of each month. Further, the borrower sponsors reported that approximately 76.9% of total rents due in May 2020 had been collected as of May 14, 2020 with a 78.9% collection rate for residential tenants (or 73 of 111 residential tenants by count) and a 51.4% collection rate for commercial tenants (or four of seven commercial tenants by count). The May 2020 debt service payment for the Bushwick Multifamily Portfolio Whole Loan has been made by the borrowers. As of the date hereof, the Bushwick Multifamily Portfolio Mortgage Loan is not subject to any modification or forbearance request.
THE INFORMATION IN THIS STRUCTURAL AND COLLATERAL TERM SHEET IS NOT COMPLETE AND MAY BE AMENDED PRIOR TO THE TIME OF SALE. THIS TERM SHEET IS NOT AN OFFER TO SELL THESE SECURITIES AND IT IS NOT A SOLICITATION OF AN OFFER TO BUY THESE SECURITIES IN ANY JURISDICTION WHERE THE OFFER OR SALE IS NOT PERMITTED.
114
| Various | Loan #11 | Cut-off Date Balance: | | $30,000,000 |
| Various | Bushwick Multifamily Portfolio | Cut-off Date LTV: | | 67.5% |
| Brooklyn, NY | | U/W NCF DSCR: | | 1.82x |
| | | U/W NOI Debt Yield: | | 7.2% |
Operating History and Underwritten Net Cash Flow. The following table presents certain information relating to the operating history and underwritten net cash flow at the Bushwick Multifamily Portfolio Properties:
Cash Flow Analysis
| | 2018 | 2019 | TTM 4/30/2020 | U/W(1) | %(2) | U/W $ per Unit |
| Gross Potential Rent | $4,001,705 | $4,388,840 | $4,360,609 | $4,054,220 | 89.2% | $34,651 |
| Other Income(3) | 163,106 | 168,039 | 170,075 | 488,588 | 10.8 | 4,175 |
| Total Recoveries | 0 | 0 | 0 | 0 | 0 | 0 |
| Net Rental Income | $4,164,811 | $4,556,879 | $4,530,684 | $4,542,808 | 100.0% | $38,827 |
| Concessions | 0 | 0 | 0 | 0 | 0 | 0 |
| (Vacancy & Credit Loss)(4) | 0 | (268,083) | (149,998) | (218,637) | (5.4) | (1,868) |
| Effective Gross Income | $4,164,811 | $4,288,796 | $4,380,686 | $4,324,172 | 95.2% | $36,958 |
| | | | | | | |
| Real Estate Taxes(5) | 156,148 | 104,541 | 97,611 | 130,003 | 3.0 | 1,111 |
| Insurance | 58,968 | 69,514 | 81,520 | 69,411 | 1.6 | 593 |
| Management Fee | 274,891 | 128,664 | 131,421 | 129,725 | 3.0 | 1,108 |
| Other Operating Expenses | 197,850 | 247,576 | 238,416 | 238,416 | 5.5 | 2,037 |
| Total Operating Expenses | $687,857 | $550,295 | $548,968 | $567,555 | 13.1% | $4,850 |
| | | | | | | |
| Net Operating Income | $3,476,955 | $3,738,501 | $3,831,718 | $3,756,617 | 86.9% | $32,107 |
| Replacement Reserves | 0 | 0 | 0 | 27,752 | 0.6 | 237 |
| TI/LC | 0 | 0 | 0 | 0 | 0.0 | 0 |
| Net Cash Flow | $3,476,955 | $3,738,501 | $3,831,718 | $3,728,865 | 86.2% | $31,870 |
| | | | | | | |
| NOI DSCR(6) | 1.70x | 1.83x | 1.88x | 1.84x | | |
| NCF DSCR(6) | 1.70x | 1.83x | 1.88x | 1.82x | | |
| NOI Debt Yield(6) | 6.7% | 7.2% | 7.4% | 7.2% | | |
| NCF Debt Yield(6) | 6.7% | 7.2% | 7.4% | 7.2% | | |
| (1) | For the avoidance of doubt, no COVID-19 specific adjustments have been incorporated in the lender U/W. |
| (2) | Represents (i) percent of Net Rental Income for all revenue fields, (ii) percent of Gross Potential Rent for Vacancy & Credit Loss and (iii) percent of Effective Gross Income for all other fields. |
| (3) | Other Income is comprised of utility reimbursements as well as other miscellaneous fees and charges. |
| (4) | The underwritten economic vacancy is 5.0%. The Bushwick Multifamily Portfolio Properties were 100.0% occupied as of May 5, 2020. |
| (5) | Real estate taxes were underwritten using the 15-year average abated taxes for the properties benefiting from 421-a tax abatements and in place taxes for the remaining properties. |
| (6) | The Bushwick Multifamily Portfolio Mortgage Loan is part of the Bushwick Multifamily Portfolio Whole Loan, which is comprised of fourpari passu notes with an aggregate original principal balance of $52,075,000. All statistical information related to the NOI DSCR, NCF DSCR, NOI Debt Yield, and NCF Debt Yield is based on the Bushwick Multifamily Portfolio Whole Loan. |
Appraisal.The Bushwick Multifamily Portfolio Properties were valued individually, with the individual values reflecting a cumulative “as-is” appraised value of $77,150,000. The valuation dates of the appraisals are dated December 23, 2019.
Environmental Matters. According to Phase I environmental site assessments dated January 7, 2020, there was no evidence of any recognized environmental conditions at the Bushwick Multifamily Portfolio Properties.
Market Overview and Competition.The Bushwick Multifamily Portfolio Properties are located in the Bushwick, Williamsburg, and Bedford Stuyvesant neighborhoods in Brooklyn, New York.
The 735 & 737 Bushwick Avenue, 894 Bushwick Avenue, 934 Lafayette Avenue, and 17 Troutman Street properties are situated in the Bushwick neighborhood of Brooklyn. Overall, Bushwick is a mostly residential neighborhood, with a mixture of single-family and multifamily housing. Broadway, Myrtle Avenue and Knickerbocker Avenue are the primary commercial thoroughfares in the Bushwick neighborhood and get heavy pedestrian and vehicular traffic. Tenants along these thoroughfares are predominantly local retailers. These buildings typically have office or multifamily units on the upper floors. The neighborhood is served by ample public transportation consisting of regional and local bus services and the J-Z-L and M trains. According to the appraisal, the 2019 population and average household income within the 11221 zip code (Brooklyn) was 88,327 and $65,010, respectively.
The 679 Grand Street and 70 Bushwick Avenue properties are situated in the Williamsburg neighborhood of Brooklyn. Historically, the Greenpoint-Williamsburg neighborhoods were middle income neighborhoods made up of warehouse and manufacturing facilities with residential housing for workers in the area. However, in recent years many of these industrial properties have been torn down or converted to commercial and/or residential uses. Most properties are small, multi-story buildings, with ground floor retail and upper floor residential or office space. The land use consists mainly of industrial and multi-family units, which make up 27.4% and 23.9% of
THE INFORMATION IN THIS STRUCTURAL AND COLLATERAL TERM SHEET IS NOT COMPLETE AND MAY BE AMENDED PRIOR TO THE TIME OF SALE. THIS TERM SHEET IS NOT AN OFFER TO SELL THESE SECURITIES AND IT IS NOT A SOLICITATION OF AN OFFER TO BUY THESE SECURITIES IN ANY JURISDICTION WHERE THE OFFER OR SALE IS NOT PERMITTED.
115
| Various | Loan #11 | Cut-off Date Balance: | | $30,000,000 |
| Various | Bushwick Multifamily Portfolio | Cut-off Date LTV: | | 67.5% |
| Brooklyn, NY | | U/W NCF DSCR: | | 1.82x |
| | | U/W NOI Debt Yield: | | 7.2% |
the neighborhood respectively. Mixed residential units make up 9.5%, while 1-2 family residential units make up 5.3% of land use in the neighborhood. In addition to industrial properties, retail properties are located along North 6th Street and Bedford Avenue, two main commercial corridors in the neighborhood. Most properties are small, multi-story buildings, with ground floor retail and upper floor residential or office space. The L train services the neighborhood and the area is also accessible by automobile via nearby expressways and parkways, including the Brooklyn-Queens Expressway. Furthermore, main roadways in the area include Bedford Avenue, Kent Avenue and Division Avenue. According to the appraisal, the 2019 population and average household income within the 11221 zip code (Brooklyn) was 88,327 and $65,010, respectively.
The 276 Nostrand Avenue property is situated in the Bedford Stuyvesant neighborhood of Brooklyn which is bounded by Flushing Avenue, Atlantic Avenue, Broadway and Classon Avenue. The area is developed by mostly residential housing, mixed-use development and commercial buildings. The neighborhood is served by the G train and has connections to the Long Island Expressway, the Grand Central Parkway, and the Brooklyn-Queens Expressway. The Brooklyn Bridge and the Manhattan Bridge both provide connections to lower Manhattan. Additionally, the Williamsburg Bridge provides access to the lower east side of Manhattan. According to the appraisal, the 2019 population and average household income within the 11205 zip code (Brooklyn) was 48,748 and $95,858, respectively.
According to the appraisal, the Bushwick Multifamily Portfolio Properties are located within the Brooklyn multifamily submarket which as of the third quarter of 2019, has an inventory of approximately 470,903 units and a vacancy rate of approximately 1.5% and effective rents of $2,923 per unit per month.
The following table presents certain information relating to the appraiser’s market rent conclusion for the Bushwick Multifamily Portfolio Properties:
Multifamily Market Rent Summary
| Building | Units(1) | Avg. Size(1) | Avg. Monthly In Place Rent per Unit(1) | Avg. Monthly
In Place
Rent PSF(1) | Avg. Monthly Market Rent per Unit(2) | Avg. Monthly Market Rent PSF(2) |
| 276 Nostrand Avenue | 42 | 598 | $2,995 | $5.01 | $3,014 | $5.04 |
| 70 Bushwick Avenue | 20 | 760 | $3,182 | $4.19 | $3,360 | $4.42 |
| 894 Bushwick Avenue | 20 | 603 | $2,665 | $4.42 | $2,915 | $4.84 |
| 679 Grand Street | 10 | 772 | $3,075 | $3.99 | $3,450 | $4.47 |
| 735 & 737 Bushwick Avenue | 7 | 986 | $3,825 | $3.88 | $3,843 | $3.90 |
| 17 Troutman Street | 8 | 758 | $2,767 | $3.65 | $2,781 | $3.67 |
| 934 Lafayette Avenue | 4 | 695 | $3,863 | $5.56 | $3,863 | $5.56 |
| (1) | Based on the underwritten rent roll dated May 5, 2020. |
| (2) | Based on Appraisal’s concluded market rent. |
The following table presents certain information relating to comparable rental properties for the Bushwick Multifamily Portfolio Properties:
Comparable Rental Properties(1)
| Building | | One-Bedroom Market Rent | Two-Bedroom Market Rent | Three-Bedroom Market Rent | Four-Bedroom Market Rent | Five-Bedroom Market Rent |
| 276 Nostrand Avenue | | $2,300 | | $2,600 | $3,350 | NAP | NAP |
| 70 Bushwick Avenue | | $2,400 | | $3,000 | $3,800 | $4,800 | NAP |
| 894 Bushwick Avenue | | $2,000 | | $2,900 | $3,200 | NAP | NAP |
| 679 Grand Street | | $2,400 | | $3,300 | $3,600 | $4,200 | NAP |
| 735 & 737 Bushwick Avenue | | NAP | | $2,100 | NAP | $3,800 | $3,400-$4,400 |
| 17 Troutman Street | | NAP | | $3,100 | $2,675 | NAP | NAP |
| 934 Lafayette Avenue | | NAP | | NAP | $3,150 | $4,100 | NAP |
| Bushwick Multifamily Portfolio(2) | | $1,562 | | $2,863 | $3,314 | $4,189 | $4,195 |
| Concluded Market Rent | | $2,000-$2,400 | | $2,100-$3,300 | $2,675-$3,800 | $3,800-$4,800 | $3,400-$4,400 |
| (1) | Based on Appraisal’s concluded market rent. |
| (2) | Based on the underwritten rent roll dated May 5, 2020. |
Escrows.
Real Estate Taxes– The Bushwick Multifamily Portfolio Mortgage Loan documents provide for an upfront reserve of approximately $31,856 for real estate taxes and ongoing monthly reserves for real estate taxes in an amount equal to 1/12 of the real estate taxes that the lender estimates will be payable during the next twelve months (initially $9,102).
THE INFORMATION IN THIS STRUCTURAL AND COLLATERAL TERM SHEET IS NOT COMPLETE AND MAY BE AMENDED PRIOR TO THE TIME OF SALE. THIS TERM SHEET IS NOT AN OFFER TO SELL THESE SECURITIES AND IT IS NOT A SOLICITATION OF AN OFFER TO BUY THESE SECURITIES IN ANY JURISDICTION WHERE THE OFFER OR SALE IS NOT PERMITTED.
116
| Various | Loan #11 | Cut-off Date Balance: | | $30,000,000 |
| Various | Bushwick Multifamily Portfolio | Cut-off Date LTV: | | 67.5% |
| Brooklyn, NY | | U/W NCF DSCR: | | 1.82x |
| | | U/W NOI Debt Yield: | | 7.2% |
Insurance– The Bushwick Multifamily Portfolio Mortgage Loan documents provide for an upfront reserve of approximately $23,137 for insurance and ongoing monthly reserves for insurance in an amount equal to 1/12 of the insurance premiums that the lender estimates will be payable during the next twelve months (initially $5,784).
Replacement Reserves– The Bushwick Multifamily Portfolio Mortgage Loan documents provide for ongoing monthly replacement reserves of $2,313 for annual replacements reasonably approved by the lender.
Lockbox and Cash Management. The Bushwick Multifamily Portfolio Mortgage Loan is structured with a springing lockbox and springing cash management. Upon the first occurrence of a Cash Management Period (as defined below), (a) the Bushwick Multifamily Portfolio Borrowers are required to establish a lockbox account for the benefit of the lender, into which all rents and other revenue from the Bushwick Multifamily Portfolio Mortgage Loan are required to be deposited by the Bushwick Multifamily Portfolio Borrowers and property manager within one business day of receipt; and (b) the lender is required to establish, and the Bushwick Multifamily Portfolio Borrowers are required to cooperate with the cash management bank to establish, a lender-controlled cash management account, into which all sums on deposit in the lockbox account are required to be deposited during the continuance of a Cash Management Period.
During the continuance of a Cash Management Period,provided no event of default under the Bushwick Multifamily Portfolio Mortgage Loan documents is continuing, all funds in the cash management account are required to be applied on each monthly payment date: (i) to make the monthly deposits into the real estate tax and insurance reserves as described above under “Escrows”, (ii) to pay debt service on the Bushwick Multifamily Portfolio Mortgage Loan, (iii) to make the monthly deposits into the replacement reserve as described above under “Escrows”, (iv) to pay operating expenses set forth in the annual budget (which is required to be reasonably approved by the lender) and lender-approved extraordinary expenses, and (v) to deposit any remainder into an excess cash flow subaccount to be held as additional security for the Bushwick Multifamily Portfolio Mortgage Loan during the continuance of such Cash Management Period. If no Cash Management Period exists, all funds on deposit in the lockbox account are required to be disbursed to an account designated by the Bushwick Multifamily Portfolio Borrowers.
A “Cash Management Period” will commence upon the earlier of the following:
| (i) | the occurrence and continuance of a default or an event of default; |
| (ii) | the debt service coverage ratio falling below 1.25x at the end of any calendar quarter; |
| (iii) | Debt Yield falling below 6.25% at the end of any calendar quarter; |
| (iv) | Occupancy level falling below 85.0%; |
| (v) | the commencement of a Lease Sweep Period (as defined below); or |
| (vi) | occurrence of the stated maturity date. |
A Cash Management Period will end upon the occurrence of the following:
| ● | with regard to clause (i), the cure of such default or event of default; |
| ● | with regard to clause (ii), the debt service coverage ratio being equal to or greater than 1.35x for two consecutive calendar quarters; |
| ● | with regard to clause (iii), the debt yield being equal to or greater than 7.0% for two consecutive calendar quarters; |
| ● | with regard to clause (iv), the occupancy level being greater than 90.0%; |
| | with regard to clause (v), the end of a Lease Sweep Period; and |
| ● | with regard to clause (vi), the occurrence thereof; |
A “Lease Sweep Period” will commence upon the earliest to occur of the following:
| (i) | the date that is 12 months prior to the end of the term of any Major Lease (as defined below) (including any renewal terms); |
| (ii) | the earlier of (a) the date required under a Major Lease by which the applicable Major Tenant (as defined below) is required to give notice of its exercise of a renewal option thereunder (and such renewal has not been so exercised); or (b) the date the applicable Major Tenant actually gives such notice of its intention not to renew or extend; |
| (iii) | any Major Lease (or any material portion thereof) is surrendered, cancelled or terminated prior to its then current expiration date; |
| (iv) | any Major Tenant will discontinue its business at its premises (i.e., “goes dark”) in any material portion thereof or give notice (whether actual or constructive) that it intends to discontinue its business in any material portion thereof; or |
| (v) | the occurrence and continuance (beyond any applicable notice and cure periods) of a default under any Major Lease by the applicable Major Tenant thereunder; or |
| (vi) | the occurrence of a major tenant insolvency proceeding. |
A “Lease Sweep Period” will end upon the earliest of the following:
| (i) | with respect to a Lease Sweep Period caused by a matter described in clauses (i), (ii), (iii) or (iv) above, upon the earlier to occur of (A) the date on which the subject Major Tenant irrevocably exercises its renewal or extension option with respect to all of the space demised under its Major Lease, and in the lender’s judgment, sufficient funds have been accumulated in the special rollover reserve (during the continuance of the subject Lease Sweep Period) to pay for all anticipated approved Major Lease leasing expenses for such Major Lease and any other anticipated expenses in connection with such renewal or |
THE INFORMATION IN THIS STRUCTURAL AND COLLATERAL TERM SHEET IS NOT COMPLETE AND MAY BE AMENDED PRIOR TO THE TIME OF SALE. THIS TERM SHEET IS NOT AN OFFER TO SELL THESE SECURITIES AND IT IS NOT A SOLICITATION OF AN OFFER TO BUY THESE SECURITIES IN ANY JURISDICTION WHERE THE OFFER OR SALE IS NOT PERMITTED.
117
| Various | Loan #11 | Cut-off Date Balance: | | $30,000,000 |
| Various | Bushwick Multifamily Portfolio | Cut-off Date LTV: | | 67.5% |
| Brooklyn, NY | | U/W NCF DSCR: | | 1.82x |
| | | U/W NOI Debt Yield: | | 7.2% |
| | extension, or (B) the date on which all of the space demised under the subject Major Lease (or portion thereof) that gave rise to the subject Lease Sweep Period has been fully leased pursuant to a replacement lease(s) approved by the lender and all approved Major Lease leasing expenses (and any other expenses in connection with the re-tenanting of such space) have been paid in full; |
| (ii) | with respect to a Lease Sweep Period caused by a matter described in clause (v) above, if the subject Major Tenant default has been cured, and no other Major Tenant default has occurred for a period of six consecutive months following such cure; and |
| (iii) | with respect to a Lease Sweep Period caused by a matter described in clause (vi) above, if the applicable major tenant insolvency proceeding has terminated and the applicable Major Lease has been affirmed, signed in a manner satisfactory to Lender. |
“Major Lease” means any non-residential Lease which covers 25% or more of the improvements or contributes 25% or more of the annual gross revenue from the Bushwick Multifamily Portfolio Properties.
“Major Tenant” means any tenant under either a Major Lease, or under one or more non-residential Leases (leased by such tenant and/or its affiliates), which when taken together cover in the aggregate 25% or more non-residential rentable square feet of the improvements.
Property Management. The Bushwick Multifamily Portfolio Properties are managed by The Jay Group Inc., an affiliate of the Bushwick Multifamily Portfolio Borrowers.
Release of Property.On any payment date after the release date, the Bushwick Multifamily Portfolio Borrowers may obtain the release of any individual property from the lien of the Bushwick Multifamily Portfolio Whole Loan upon a bona fide third-party sale, subject to the satisfaction of certain conditions, including, but not limited to: (i) the Bushwick Multifamily Portfolio Borrowers defease an amount of principal equal to the greater of (A) 115.0% of the allocated loan amount for such property and (B) the amount necessary to cause each of the following to be true: (1) after giving effect to the release of such property and defeasance, the loan-to-value ratio for the remaining properties is not greater than the lesser of (a) the loan-to-value ratio immediately preceding such release and (b) 67.5%; (2) after giving effect to the release of such property and defeasance, the debt yield for the remaining properties is no less than the greater of (a) the debt yield immediately preceding such release and (b) 6.9%; and (3) after giving effect to the release of such property and defeasance, the debt service coverage ratio for the remaining properties is no less than the greater of (a) the debt service coverage ratio immediately preceding such release and (b) 1.75x; (ii) if after taking into account the partial defeasance, the loan-to-value ratio of the remaining properties is greater than 125%, the principal balance of the Bushwick Multifamily Whole loan will be further defeased by an amount such that the related loan-to-value ratio is no more than 125% and (iii) the borrowers obtain a REMIC opinion. In addition, the borrowers may transfer (i) all of the properties in not more than three separate bona fide third-party sales, provided the first two of such sales are for not more than four properties unless all of the properties are included in such sale and (ii) up to four properties in not more than two separate bona fide third-party sales.
Real Estate Substitution. Not permitted.
Subordinate and Mezzanine Indebtedness. Not permitted.
Ground Lease. None.
Letter of Credit. None.
Right of First Offer/Right of First Refusal. None.
Terrorism Insurance. The Bushwick Multifamily Portfolio Borrowers are required to obtain and maintain an “all risk” or “special form” property insurance policy that covers perils of terrorism and acts of terrorism in an amount equal to the “full replacement cost” of the Bushwick Multifamily Portfolio Properties together with business income insurance covering no less than the 18-month period commencing at the time of loss, together with a 6-month extended period of indemnity. Notwithstanding the foregoing, for so long as the Terrorism Risk Insurance Act of 2002, as extended and modified by the Terrorism Risk Insurance Program Reauthorization Act of 2015 (“TRIPRA”) is in effect (including any extensions thereof or if another federal governmental program is in effect relating to “acts of terrorism” which provides substantially similar protections as TRIPRA), and covers both domestic and foreign acts of terrorism, the lender is required to accept terrorism insurance which insures against “covered acts” as defined by TRIPRA (or such other program). See “Risk Factors—Risks Relating to the Mortgage Loans—Terrorism Insurance May Not Be Available for All Mortgaged Properties” in the Prospectus.
THE INFORMATION IN THIS STRUCTURAL AND COLLATERAL TERM SHEET IS NOT COMPLETE AND MAY BE AMENDED PRIOR TO THE TIME OF SALE. THIS TERM SHEET IS NOT AN OFFER TO SELL THESE SECURITIES AND IT IS NOT A SOLICITATION OF AN OFFER TO BUY THESE SECURITIES IN ANY JURISDICTION WHERE THE OFFER OR SALE IS NOT PERMITTED.
118
| Office - Suburban | Loan #12 | Cut-off Date Balance: | | $25,695,000 |
| 300, 302, 330 and 350 Fellowship Road | Liberty Walk at East Gate | Cut-off Date LTV: | | 73.8% |
| Mount Laurel, NJ 08054 | | U/W NCF DSCR: | | 1.87x |
| | | U/W NOI Debt Yield: | | 10.9% |

THE INFORMATION IN THIS STRUCTURAL AND COLLATERAL TERM SHEET IS NOT COMPLETE AND MAY BE AMENDED PRIOR TO THE TIME OF SALE. THIS TERM SHEET IS NOT AN OFFER TO SELL THESE SECURITIES AND IT IS NOT A SOLICITATION OF AN OFFER TO BUY THESE SECURITIES IN ANY JURISDICTION WHERE THE OFFER OR SALE IS NOT PERMITTED.
119
| Office - Suburban | Loan #12 | Cut-off Date Balance: | | $25,695,000 |
| 300, 302, 330 and 350 Fellowship Road | Liberty Walk at East Gate | Cut-off Date LTV: | | 73.8% |
| Mount Laurel, NJ 08054 | | U/W NCF DSCR: | | 1.87x |
| | | U/W NOI Debt Yield: | | 10.9% |
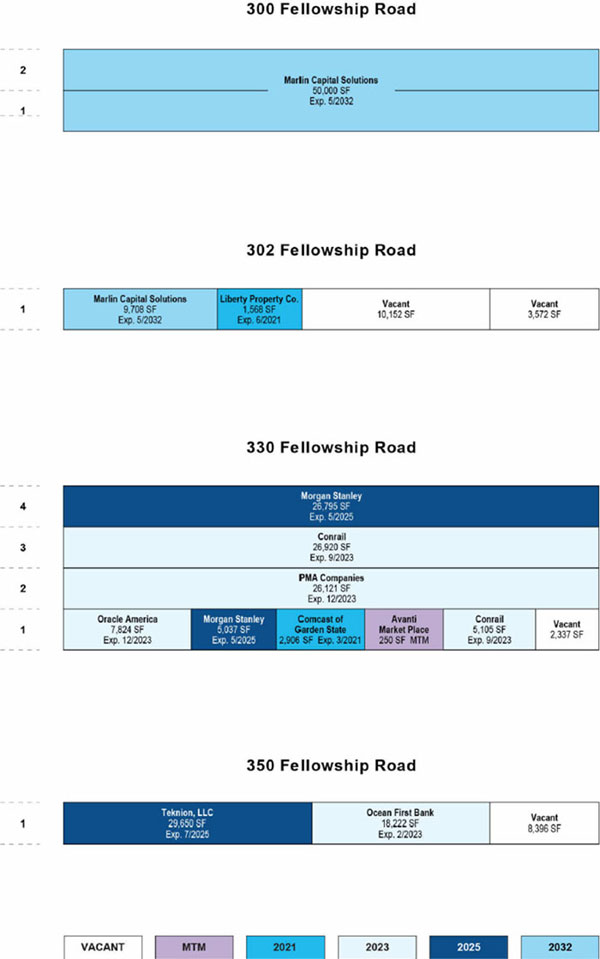
THE INFORMATION IN THIS STRUCTURAL AND COLLATERAL TERM SHEET IS NOT COMPLETE AND MAY BE AMENDED PRIOR TO THE TIME OF SALE. THIS TERM SHEET IS NOT AN OFFER TO SELL THESE SECURITIES AND IT IS NOT A SOLICITATION OF AN OFFER TO BUY THESE SECURITIES IN ANY JURISDICTION WHERE THE OFFER OR SALE IS NOT PERMITTED.
120
| Office - Suburban | Loan #12 | Cut-off Date Balance: | | $25,695,000 |
| 300, 302, 330 and 350 Fellowship Road | Liberty Walk at East Gate | Cut-off Date LTV: | | 73.8% |
| Mount Laurel, NJ 08054 | | U/W NCF DSCR: | | 1.87x |
| | | U/W NOI Debt Yield: | | 10.9% |

THE INFORMATION IN THIS STRUCTURAL AND COLLATERAL TERM SHEET IS NOT COMPLETE AND MAY BE AMENDED PRIOR TO THE TIME OF SALE. THIS TERM SHEET IS NOT AN OFFER TO SELL THESE SECURITIES AND IT IS NOT A SOLICITATION OF AN OFFER TO BUY THESE SECURITIES IN ANY JURISDICTION WHERE THE OFFER OR SALE IS NOT PERMITTED.
121
No. 12 – Liberty Walk at East Gate |
Mortgage Loan Information | | Mortgaged Property Information |
Mortgage Loan Seller: | Barclays Capital Real Estate Inc. | | Single Asset/Portfolio: | Single Asset |
Credit Assessment (Fitch/KBRA/Moody’s): | NR/NR/NR | | Property Type – Subtype: | Office – Suburban |
Original Principal Balance: | $25,695,000 | | Location: | Mount Laurel, NJ |
Cut-off Date Balance: | $25,695,000 | | Size: | 234,563 SF |
% of Initial Pool Balance: | 3.5% | | Cut-off Date Balance Per SF: | $109.54 |
Loan Purpose: | Acquisition | | Maturity Date Balance Per SF: | $89.94 |
Borrower Sponsor: | Ariel T. Nessel | | Year Built/Renovated: | 1990/2019 |
Guarantor: | Ariel T. Nessel | | Title Vesting: | Fee |
Mortgage Rate: | 3.13000% | | Property Manager: | CBRE, Inc. |
Note Date: | February 28, 2020 | | Current Occupancy (As of)(3): | 89.6% (4/14/2020) |
Seasoning: | 3 months | | YE 2019 Occupancy(4): | 75.9% |
Maturity Date: | March 6, 2030 | | YE 2018 Occupancy(4): | 75.9% |
IO Period: | 24 months | | YE 2017 Occupancy(4): | 95.2% |
Loan Term (Original): | 120 months | | YE 2016 Occupancy(4): | 97.7% |
Amortization Term (Original): | 360 months | | As-Is Appraised Value(5): | $34,800,000 |
Loan Amortization Type: | Interest-only, Amortizing Balloon | | As-Is Appraised Value Per SF(5): | $148.36 |
Call Protection: | L(27),D(86),O(7) | | As-Is Appraisal Valuation Date: | January 29, 2020 |
Lockbox Type: | Springing | | Underwriting and Financial Information |
Additional Debt(1): | Yes | | TTM (3/31/2020) NOI(4)(6): | $2,569,089 |
Additional Debt Type (Balance)(1)(2): | Future Mezzanine Debt | | YE 2019 NOI(4): | $2,547,210 |
| | | YE 2018 NOI(4): | $2,986,255 |
| | | YE 2017 NOI: | $3,640,168 |
| | | U/W Revenues: | $5,164,966 |
| | | U/W Expenses: | $2,352,670 |
Escrows and Reserves(2) | | U/W NOI(4)(6): | $2,812,296 |
| Initial | Monthly | Cap | | U/W NCF(3): | $2,466,005 |
Immediate Repairs | $7,375 | $0 | NAP | | U/W DSCR based on NOI/NCF: | 2.13x / 1.87x |
Taxes | $232,021 | $77,340 | NAP | | U/W Debt Yield based on NOI/NCF: | 10.9% / 9.6% |
Insurance | $0 | Springing | NAP | | U/W Debt Yield at Maturity based on NOI/NCF: | 13.3% / 11.7% |
Replacement Reserve | $0 | $3,909 | NAP | | Cut-off Date LTV Ratio(5): | 73.8% |
TI/LC Reserve | $1,173,000 | $39,094 | $1,173,000 | | LTV Ratio at Maturity or ARD(5): | 60.6% |
Outstanding TI/LC | $1,514,382 | $0 | NAP | | | |
Free Rent Reserve | $579,577 | $0 | NAP | | | |
| | | | | | | |
Sources and Uses |
Sources | | | | | Uses | | | |
Original mortgage loan amount | $25,695,000 | | 67.4% | | Purchase price | $33,600,000 | | 88.2% |
Seller credits | 994,702 | | 2.6 | | Upfront reserves | 3,506,355 | | 9.2 |
Sponsor equity | 11,426,675 | | 30.0 | | Closing costs | 1,010,022 | | 2.6 |
Total Sources | $38,116,376 | | 100.0% | | Total Uses | $38,116,376 | | 100.0% |
(1) | The Liberty Walk at East Gate Borrower may incur mezzanine debt from two years following securitization provided (i) no event of default has occurred or is continuing; (ii) the combined LTV ratio would be less than or equal to 73.8%; (iii) the combined debt yield would be greater than 9.82%; (iv) the combined DSCR would be greater than or equal to 1.91x; (v) rating agency confirmation and (vi) other conditions as set forth in the Liberty Walk at East Gate Mortgage Loan documents. See “Subordinate and Mezzanine Indebtedness” section below. |
(2) | See “Escrows” section below. |
(3) | One tenant, Teknion, LLC (12.6% of net rentable area, 12.5% of underwritten base rent) has been granted rent deferment as a result of the novel coronavirus pandemic and the economic disruption resulting from measures to combat the pandemic. Current Occupancy, U/W NOI and U/W NCF are calculated assuming that this tenant is in occupancy and is paying rent. See “COVID-19 Update“ section below for additional details and “Risk Factors—Coronavirus Pandemic Has Adversely Affected the Global Economy and Will Likely Adversely Affect the Performance of the Mortgage Loans” in the Preliminary Prospectus. |
(4) | The decrease in historical occupancy and NOI is primarily driven by (i) two tenants, which formerly leased 26,920 square feet and 10,152 square feet, respectively, vacating the property in 2018 and (ii) two additional non-major tenants downsizing by a combined 10,733 square feet in 2018. Conrail executed a lease for 32,025 square feet in January 2020 backfilling a majority of the vacated space. Conrail is currently completing its buildout and is expected to take occupancy in August 2020. |
(5) | The appraised value was determined prior to the emergence of the novel coronavirus pandemic and the economic disruption resulting from measures to combat the pandemic, and all LTV metrics were calculated based on such prior information. See “Risk Factors—Coronavirus Pandemic Has Adversely Affected the Global Economy and Will Likely Adversely Affect the Performance of the Mortgage Loans” in the Preliminary Prospectus. |
(6) | The increase in NOI from TTM 3/31/2020 to U/W NOI is due to (i) contractual rent steps through March 2021 totalling $41,244, (ii) straight-lined average rent for Conrail and PMA Companies of $33,409 and (iii) the execution of the Conrail lease commencing in August 2020 ($508,890 of underwritten base rent). |
THE INFORMATION IN THIS STRUCTURAL AND COLLATERAL TERM SHEET IS NOT COMPLETE AND MAY BE AMENDED PRIOR TO THE TIME OF SALE. THIS TERM SHEET IS NOT AN OFFER TO SELL THESE SECURITIES AND IT IS NOT A SOLICITATION OF AN OFFER TO BUY THESE SECURITIES IN ANY JURISDICTION WHERE THE OFFER OR SALE IS NOT PERMITTED.
122
| Office - Suburban | Loan #12 | Cut-off Date Balance: | | $25,695,000 |
| 300, 302, 330 and 350 Fellowship Road | Liberty Walk at East Gate | Cut-off Date LTV: | | 73.8% |
| Mount Laurel, NJ 08054 | | U/W NCF DSCR: | | 1.87x |
| | | U/W NOI Debt Yield: | | 10.9% |
The Mortgage Loan. The mortgage loan (the “Liberty Walk at East Gate Mortgage Loan”) is evidenced by a single promissory note secured by a first mortgage encumbering the fee interest in a 234,563 square foot office complex located in Mount Laurel, New Jersey (the “Liberty Walk at East Gate Property”).
The Borrower and Borrower Sponsor. The borrowing entity for the Liberty Walk at East Gate Mortgage Loan is ND XLI, LLC, a Delaware limited liability company and a special purpose entity with one independent director in its organizational structure. Legal counsel to the borrower delivered a non-consolidation opinion in connection with the origination of the Liberty Walk at East Gate Mortgage Loan. Ariel T. Nessel is the borrower sponsor and guarantor of certain nonrecourse carve-outs and environmental indemnities under the Liberty Walk at East Gate Mortgage Loan.
In 1997, Ariel T. Nessel founded Nessel Development, a multi-family property management firm focused on asset management, new construction, property renovation, financing and day-to-day management. Ariel T. Nessel owns seven office buildings in New Jersey totaling approximately 675,000 square feet, a 155,000 square foot manufacturing facility in Connecticut, a 100,000 square foot office building in Kentucky, a 65,000 square foot grocery store in Wisconsin and four retail buildings totaling approximately 40,000 square feet in Texas. Additionally, Ariel T. Nessel has been a general partner or sole owner on the acquisition of over 9,000 multifamily units since 1999. Ariel T. Nessel had credit issues with properties owned during the recession. See “Description of the Mortgage Pool—Loan Purpose; Default History, Bankruptcy Issues and Other Proceedings“ and “Litigation and Other Considerations” in the Preliminary Prospectus.
The Property. The Liberty Walk at East Gate Property is a 234,563 square foot, four-building Class A/B office property located in Mount Laurel, New Jersey, approximately 13 miles east of Philadelphia. The four buildings were built from 1990 to 2007 and include the 300 Fellowship Road building, 302 Fellowship Road building, 330 Fellowship Road building and the 350 Fellowship Road building. The 330 Fellowship Road building is the only LEED Gold Certified building in Southern New Jersey outside the city of Camden. The Liberty Walk at East Gate Property is part of a 20-acre office campus featuring over a mile of interconnected walkways, brick patios, ponds, fountains and sculptures. The Liberty Walk at East Gate Property features 1,060 parking spaces, resulting in a parking ratio of 4.5 spaces per 1,000 square feet. As of April 14, 2020, the Liberty Walk at East Gate Property was 89.6% leased to ten tenants (including a café tenant in the 330 Fellowship Road Building). Approximately 41.7% of the net rentable area is leased to tenants that are investment-grade rated. Five tenants totaling 140,390 square feet representing 59.9% of the net rentable area have been located at the Liberty Walk at East Gate Property for at least ten years.
COVID-19 Update. As of May 14, 2020, the Liberty Walk at East Gate Property is open; however, most, if not all, office tenants are working remotely or operating with limited employees on-site due to the New Jersey’s stay at home order. The May debt service payment has been made. Tenants representing 87.5% of the underwritten base rent have made their rent payments for May. One tenant, Teknion, LLC (12.5% of underwritten base rent), has requested a rent deferment. The tenant has reached an agreement with the Liberty Walk at East Gate Borrower to continue to pay operating expenses and defer the base rent for April through June 2020 that is required to be repaid in equal installments over the five-month period from July to November 2020. As of the date hereof, the Liberty Walk at East Gate Loan is not subject to any modification or forbearance request.
Major Tenants.
Largest Tenant: Marlin Capital Solutions (59,708 square feet; 25.5% of net rentable area; 24.7% of underwritten base rent; 5/31/2032 lease expiration; NASDAQ: MRLN) – Founded in 1997, Marlin Capital Solutions provides loans and leases for the acquisition of approximately 100 categories of commercial equipment and working capital loans to small- to mid-sized businesses in the United States. Marlin Capital Solutions also offers property reinsurance coverage for its financed equipment and operates a commercial bank that issues certificates of deposit and money market demand accounts. Marlin Capital Solutions has been a tenant at the Liberty Walk at East Gate Property since 2004, expanded in June 2014 and most recently renewed its lease in January 2019 through May 2032. In conjunction with the lease renewal, Marlin Capital Solutions underwent approximately $4.8 million in renovations (including $2.8 million invested by prior ownership and $2.0 million invested by the tenant). Marlin Capital Solutions has two, five-year renewal options remaining. Marlin Capital Solutions has a termination option for 9,708 square feet of its space any time after June 1, 2027 with 180 days’ notice and payment of a termination fee equal to the landlord’s unamortized tenant improvement and leasing commissions.
Second Largest Tenant: Conrail (32,025 square feet; 13.7% of net rentable area; 16.2% of underwritten base rent; 9/30/2023 lease expiration; Moody’s/S&P: Baa1/BBB+) – Conrail is a railroad terminal and switching service provider for its owners, CSX Transportation and Norfolk Southern. Conrail provides rail service for local rail freight customers in Detroit, New Jersey and Philadelphia and ensures that customers’ freight shipments are moved between rail sidings and long distance freight trains. Conrail’s lease at the Liberty Walk at East Gate Property was executed in January 2020 and the tenant is expected to take physical occupancy in August 2020. All tenant improvements, leasing commissions and free rent in connection with the Conrail lease were reserved at origination of the Liberty Walk at East Gate Mortgage Loan.
Third Largest Tenant: Morgan Stanley (31,832 square feet; 13.6% of net rentable area; 18.3% of underwritten base rent; 5/31/2025 lease expiration; Fitch/Moody’s/S&P: A+/A1/A+; NYSE: MS) – Morgan Stanley provides investment banking products and services to corporations, governments, financial institutions and individuals. The Liberty Walk at East Gate Property has served as Morgan Stanley’s Mount Laurel wealth management branch office since 2008. The wealth management segment offers brokerage and investment advisory services covering various types of investments including equities, options, futures, foreign currencies, precious metals, fixed-income securities, mutual funds, structured products, alternative investments, unit investment trusts, managed futures, separately managed accounts and mutual fund allocation programs. Morgan Stanley has been a tenant at the Liberty Walk at East Gate Property since 2008, expanded by 5,037 square feet in 2015 and has one, five-year renewal option remaining. Morgan Stanley’s lease contains an expired termination option effective May 2020 requiring 12 months’ prior notice that was not exercised by the tenant. If Morgan
THE INFORMATION IN THIS STRUCTURAL AND COLLATERAL TERM SHEET IS NOT COMPLETE AND MAY BE AMENDED PRIOR TO THE TIME OF SALE. THIS TERM SHEET IS NOT AN OFFER TO SELL THESE SECURITIES AND IT IS NOT A SOLICITATION OF AN OFFER TO BUY THESE SECURITIES IN ANY JURISDICTION WHERE THE OFFER OR SALE IS NOT PERMITTED.
123
| Office - Suburban | Loan #12 | Cut-off Date Balance: | | $25,695,000 |
| 300, 302, 330 and 350 Fellowship Road | Liberty Walk at East Gate | Cut-off Date LTV: | | 73.8% |
| Mount Laurel, NJ 08054 | | U/W NCF DSCR: | | 1.87x |
| | | U/W NOI Debt Yield: | | 10.9% |
Stanley does not renew at least 12 months prior to its lease expiration in 2025, a cash sweep period will commence. See “Major Tenant Event Period” section below.
Fourth Largest Tenant: Teknion, LLC (29,650 square feet; 12.6% of net rentable area; 12.5% of underwritten base rent; 7/31/2025 lease expiration) – Teknion, LLC designs, manufactures and markets office systems and related office furniture products offering furnishings and décor products such as seating, tables, file cabinets, storage units, ergonomic items, mobile furniture, architectural wall systems, storage and filing and other accessories. Teknion, LLC is based in Ontario, Canada and employs approximately 8,900 people worldwide. Teknion, LLC has been a tenant at the Liberty Walk at East Gate Property since 2007, most recently renewed its lease in August 2017 and has one, five-year extension option remaining.
Fifth Largest Tenant: PMA Companies (26,121 square feet; 11.1% of net rentable area; 14.0% of underwritten base rent; 12/31/2023 lease expiration; Moody’s/S&P: A2/A+) – Founded in 1915 following the Pennsylvania Worker’s Compensation Act, PMA Companies is the leader in workers’ compensation, casualty insurance and risk services in Pennsylvania. PMA Companies is part of Old Republic General Insurance Group, the largest business segment within Old Republic International, a Fortune 500 company and one of the nation’s 50 largest shareholder-owned insurance organizations. The Liberty Walk at East Gate Property is PMA Companies’ only location in New Jersey. PMA Companies has been a tenant at the Liberty Walk at East Gate Property since 2008 and renewed its lease in January 2018.
The following table presents certain information relating to the tenancy at the Liberty Walk at East Gate Property:
Major Tenants
Tenant Name | Credit Rating
(Fitch/
Moody’s/
S&P)(1) | Tenant
NRSF | % of
NRSF | Annual
U/W Base
Rent PSF(2) | Annual
U/W Base
Rent(2) | % of Total Annual
U/W
Base Rent | Lease
Expiration
Date | Extension
Options | Termination
Option
(Y/N) |
Major Tenants | | | | | | | | |
Marlin Capital Solutions | NR/NR/NR | 59,708 | 25.5% | $13.00 | $776,204 | 24.7% | 5/31/2032 | 2, 5-year | Y(3) |
Conrail(4) | NR/Baa1/BBB+ | 32,025 | 13.7% | $15.89 | $508,900 | 16.2% | 9/30/2023 | 1, 2-year | N |
Morgan Stanley | A+/A1/A+ | 31,832 | 13.6% | $18.00 | $572,976 | 18.3% | 5/31/2025 | 1, 5-year | N |
Teknion, LLC(5) | NR/NR/NR | 29,650 | 12.6% | $13.25 | $392,863 | 12.5% | 7/31/2025 | 1, 5-year | N |
PMA Companies | NR/A2/A+ | 26,121 | 11.1% | $16.80 | $438,833 | 14.0% | 12/31/2023 | NAP | N |
Total Major Tenants | 179,336 | 76.5% | $15.00 | $2,689,775 | 85.7% | | | |
| | | | | | | | |
Non-Major Tenants | 30,770 | 13.1% | $14.54 | $447,466 | 14.3% | | | |
| | | | | | | | |
Occupied Collateral Total | 210,106 | 89.6% | $14.93 | $3,137,241 | 100.0% | | | |
| | | | | | | | |
Vacant Space | 24,457 | 10.4% | | | | | | |
| | | | | | | | |
Collateral Total | 234,563 | 100.0% | | | | | | |
| | | | | | | | | |
(1) | Certain ratings are those of the parent company whether or not the parent company guarantees the lease. |
(2) | Annual U/W Base Rent and Annual U/W Base Rent PSF include contractual rent steps through March 2021 totalling $41,244 and straight-lined average rent for Conrail and PMA Companies of $33,409. Morgan Stanley’s rent is underwritten to the appraiser’s concluded market rent of $18.00 per square foot. Morgan Stanley’s current in-place rent is $22.00 per square foot ($700,304 total annually). |
(3) | Marlin Capital Solutions has a termination option for 9,708 square feet of its space any time after June 1, 2027 with 180 days’ notice and payment of a termination fee equal to the landlord’s unamortized tenant improvement and leasing commissions. |
(4) | Conrail executed its lease in January 2020 and is expected to take physical occupancy in August 2020. |
(5) | Teknion, LLC has been granted rent deferment as a result of the novel coronavirus pandemic and the economic disruption resulting from measures to combat the pandemic. Teknion, LLC has reached an agreement with the Liberty Walk at East Gate Borrower to continue to pay operating expenses and defer the base rent for April through June 2020 that is required to be repaid in equal installments over the five-month period from July to November 2020. |
THE INFORMATION IN THIS STRUCTURAL AND COLLATERAL TERM SHEET IS NOT COMPLETE AND MAY BE AMENDED PRIOR TO THE TIME OF SALE. THIS TERM SHEET IS NOT AN OFFER TO SELL THESE SECURITIES AND IT IS NOT A SOLICITATION OF AN OFFER TO BUY THESE SECURITIES IN ANY JURISDICTION WHERE THE OFFER OR SALE IS NOT PERMITTED.
124
| Office - Suburban | Loan #12 | Cut-off Date Balance: | | $25,695,000 |
| 300, 302, 330 and 350 Fellowship Road | Liberty Walk at East Gate | Cut-off Date LTV: | | 73.8% |
| Mount Laurel, NJ 08054 | | U/W NCF DSCR: | | 1.87x |
| | | U/W NOI Debt Yield: | | 10.9% |
The following table presents certain information relating to the lease expiration schedule at the Liberty Walk at East Gate Property:
Lease Expiration Schedule(1)(2)
Year Ending
December 31, | No. of Leases Expiring | Expiring
NRSF | % of
Total
NRSF | Cumulative
Expiring
NRSF | Cumulative
% of Total
NRSF | Annual
U/W
Base Rent(3) | % of Total
Annual
U/W Base
Rent | Annual
U/W
Base Rent
PSF(4) |
MTM | 1 | 250 | 0.1% | 250 | 0.1% | $0 | 0.0% | $0.00 |
2020 | 0 | 0 | 0.0% | 250 | 0.1% | $0 | 0.0% | $0.00 |
2021 | 2 | 4,474 | 1.9% | 4,724 | 2.0% | $70,016 | 2.2% | $15.65 |
2022 | 0 | 0 | 0.0% | 4,724 | 2.0% | $0 | 0.0% | $0.00 |
2023 | 4 | 84,192 | 35.9% | 88,916 | 37.9% | $1,325,183 | 42.2% | $15.74 |
2024 | 0 | 0 | 0.0% | 88,916 | 37.9% | $0 | 0.0% | $0.00 |
2025 | 2 | 61,482 | 26.2% | 150,398 | 64.1% | $965,839 | 30.8% | $15.71 |
2026 | 0 | 0 | 0.0% | 150,398 | 64.1% | $0 | 0.0% | $0.00 |
2027 | 0 | 0 | 0.0% | 150,398 | 64.1% | $0 | 0.0% | $0.00 |
2028 | 0 | 0 | 0.0% | 150,398 | 64.1% | $0 | 0.0% | $0.00 |
2029 | 0 | 0 | 0.0% | 150,398 | 64.1% | $0 | 0.0% | $0.00 |
2030 | 0 | 0 | 0.0% | 150,398 | 64.1% | $0 | 0.0% | $0.00 |
Thereafter | 1 | 59,708 | 25.5% | 210,106 | 89.6% | $776,204 | 24.7% | $13.00 |
Vacant | 0 | 24,457 | 10.4% | 234,563 | 100.0% | $0 | 0.0% | $0.00 |
Total/Weighted Average | 10 | 234,563 | 100.0% | | | $3,137,241 | 100.0% | $14.93 |
(1) | Information obtained from the underwritten rent roll dated April 14, 2020. |
| (2) | Certain tenants may have lease termination options that are exercisable prior to the originally stated expiration date of the subject lease and that are not considered in the Lease Expiration Schedule. |
| (3) | Annual U/W Base Rent includes contractual rent steps through March 2021 totaling $41,244 and straight-lined average rent for Conrail and PMA Companies of $33,409. Morgan Stanley’s rent is underwritten to the appraiser’s concluded market rent of $18.00 per square foot. Morgan Stanley’s current in-place rent is $22.00 per square foot ($700,304 total annually). |
| (4) | Annual U/W Base Rent and Annual U/W Base Rent PSF exclude vacant space. |
The following table presents historical occupancy percentages at the Liberty Walk at East Gate Property:
Historical Occupancy
12/31/2016(1) | | 12/31/2017(1)(2) | | 12/31/2018(1)(2) | | 12/31/2019(1)(3) | | 4/14/2020(3)(4) |
97.7% | | 95.2% | | 75.9% | | 75.9% | | 89.6% |
| (1) | Information obtained from the borrower. |
| (2) | The decrease in historical occupancy and NOI is primarily driven by (i) two tenants, which formerly leased 26,920 square feet and 10,152 square feet, respectively, vacating the property in 2018 and (ii) two additional non-major tenants downsizing by a combined 10,733 square feet in 2018. Conrail executed a lease for 32,025 square feet in January 2020 backfilling a majority of the vacated space. Conrail is currently completing its buildout and is expected to take occupancy in August 2020. |
| (3) | The increase in occupancy from 2019 to 4/14/2020 is due to the execution of the 32,025 square foot Conrail lease. |
(4) | Information obtained from the underwritten rent roll. |
THE INFORMATION IN THIS STRUCTURAL AND COLLATERAL TERM SHEET IS NOT COMPLETE AND MAY BE AMENDED PRIOR TO THE TIME OF SALE. THIS TERM SHEET IS NOT AN OFFER TO SELL THESE SECURITIES AND IT IS NOT A SOLICITATION OF AN OFFER TO BUY THESE SECURITIES IN ANY JURISDICTION WHERE THE OFFER OR SALE IS NOT PERMITTED.
125
| Office - Suburban | Loan #12 | Cut-off Date Balance: | | $25,695,000 |
| 300, 302, 330 and 350 Fellowship Road | Liberty Walk at East Gate | Cut-off Date LTV: | | 73.8% |
| Mount Laurel, NJ 08054 | | U/W NCF DSCR: | | 1.87x |
| | | U/W NOI Debt Yield: | | 10.9% |
Operating History and Underwritten Net Cash Flow. The following table presents certain information relating to the historical operating performance and underwritten net cash flow at the Liberty Walk at East Gate Property:
Cash Flow Analysis
| 12/31/2017 | | 12/31/2018 | | 12/31/2019 | | TTM 3/31/2020 | | U/W(1) | | %(2) | | U/W $
per SF | |
Base Rent(1) | $3,578,430 | | $3,255,445 | | $3,008,026 | | $3,003,436 | | $3,189,917 | | 57.9% | | $13.60 | |
Contractual Rent Steps(3) | 0 | | 0 | | 0 | | 0 | | 74,653 | | 1.4 | | 0.32 | |
Marked-to-Market Rent(4) | 0 | | 0 | | 0 | | 0 | | (127,328) | | (2.3) | | (0.54) | |
Grossed Up Vacant Space | 0 | | 0 | | 0 | | 0 | | 325,190 | | 5.9 | | 1.39 | |
Gross Potential Rent | $3,578,430 | | $3,255,445 | | $3,008,026 | | $3,003,436 | | $3,462,432 | | 62.8% | | $14.76 | |
Other Income | 2,215 | | 1,786 | | 90 | | 552 | | 0 | | 0.0 | | 0.00 | |
Total Recoveries | 2,315,253 | | 2,393,676 | | 1,859,451 | | 1,811,827 | | 2,046,906 | | 37.2 | | 8.73 | |
Net Rental Income | $5,895,899 | | $5,650,907 | | $4,867,567 | | $4,815,816 | | $5,509,338 | | 100.0% | | $23.49 | |
(Vacancy & Credit Loss) | 0 | | (228,182) | | 0 | | 0 | | (344,372) | | (6.3)(5) | | (1.47) | |
Effective Gross Income | $5,895,899 | | $5,422,726 | | $4,867,567 | | $4,815,816 | | $5,164,966 | | 93.7% | | $22.02 | |
| | | | | | | | | | | | | | |
Real Estate Taxes | 871,049 | | 894,177 | | 901,053 | | 902,772 | | 923,580 | | 17.9 | | 3.94 | |
Insurance | 26,113 | | 28,222 | | 43,788 | | 46,681 | | 44,653 | | 0.9 | | 0.19 | |
Management Fee | 176,409 | | 162,466 | | 146,027 | | 144,474 | | 154,949 | | 3.0 | | 0.66 | |
Other Operating Expenses | 1,182,159 | | 1,351,605 | | 1,229,489 | | 1,152,800 | | 1,229,489 | | 23.8 | | 5.24 | |
Total Operating Expenses | $2,255,731 | | $2,436,471 | | $2,320,357 | | $2,246,727 | | $2,352,670 | | 45.6% | | $10.03 | |
| | | | | | | | | | | | | | |
Net Operating Income | $3,640,168 | | $2,986,255 | | $2,547,210 | | $2,569,089 | | $2,812,296 | | 54.4% | | $11.99 | |
Replacement Reserves | 0 | | 0 | | 0 | | 0 | | 46,913 | | 0.9 | | 0.20 | |
TI/LC | 0 | | 0 | | 0 | | 0 | | 299,378(6) | | 5.8 | | 1.28 | |
Net Cash Flow | $3,640,168 | | $2,986,255 | | $2,547,210 | | $2,569,089 | | $2,466,005 | | 47.7% | | $10.51 | |
| | | | | | | | | | | | | | |
NOI DSCR | 2.75x | | 2.26x | | 1.93x | | 1.94x | | 2.13x | | | | | |
NCF DSCR | 2.75x | | 2.26x | | 1.93x | | 1.94x | | 1.87x | | | | | |
NOI Debt Yield | 14.2% | | 11.6% | | 9.9% | | 10.0% | | 10.9% | | | | | |
NCF Debt Yield | 14.2% | | 11.6% | | 9.9% | | 10.0% | | 9.6% | | | | | |
| (1) | One tenant, Teknion, LLC (12.6% of net rentable area, 12.5% of underwritten base rent) has been granted rent deferment as a result of the novel coronavirus pandemic and the economic disruption resulting from measures to combat the pandemic. U/W Base Rent is calculated assuming that this tenant is in occupancy and is paying rent. |
| (2) | Represents (i) percent of Net Rental Income for all revenue fields and for Vacancy & Credit Loss and (ii) percent of Effective Gross Income for all other fields. |
| (3) | U/W Contractual Rent Steps include rent steps through March 2021 totalling $41,244 and straight-lined average rent for Conrail and PMA Companies of $33,409. |
| (4) | Morgan Stanley’s rent is underwritten to the appraiser’s concluded market rent of $18.00 per square foot. Morgan Stanley’s current in-place rent is $22.00 per square foot ($700,304 total annually). |
| (5) | The underwritten economic vacancy is 9.9%. The Liberty Walk at East Gate Property was 89.6% physically occupied as of April 14, 2020. |
| (6) | U/W TI/LC includes 10.0% credit for the upfront TI/LC reserve of $1,173,000. |
Appraisal. The appraiser concluded to an “as-is” appraised value of $34,800,000 as of January 29, 2020. The appraised value assumes that $680,000 of outstanding tenant improvements and leasing commissions under the Conrail lease and $1,173,000 of general tenant improvements and leasing commissions are reserved at loan origination. At origination, the borrower reserved $680,210 for the outstanding obligations under the Conrail lease and $1,173,000 for general tenant improvements and leasing commissions.
Environmental Matters. According to the Phase I environmental site assessment dated December 19, 2019, there was no evidence of any recognized environmental conditions at Liberty Walk at East Gate Property.
Market Overview and Competition. The Liberty Walk at East Gate Property is located in Mount Laurel, New Jersey in Burlington County, approximately 13 miles east of Philadelphia. Access to the Liberty Walk at East Gate Property is provided by the New Jersey Turnpike/Interstate 95, within 1.3 miles of the Liberty Walk at East Gate Property and provide access to New Jersey and the greater Philadelphia area. The Liberty Walk at East Gate Property is located within one mile of Moorestown Mall and East Gate Square, two of the region’s most heavily-visited retail hubs offering numerous shopping and restaurant options. The estimated 2020 population within
THE INFORMATION IN THIS STRUCTURAL AND COLLATERAL TERM SHEET IS NOT COMPLETE AND MAY BE AMENDED PRIOR TO THE TIME OF SALE. THIS TERM SHEET IS NOT AN OFFER TO SELL THESE SECURITIES AND IT IS NOT A SOLICITATION OF AN OFFER TO BUY THESE SECURITIES IN ANY JURISDICTION WHERE THE OFFER OR SALE IS NOT PERMITTED.
126
| Office - Suburban | Loan #12 | Cut-off Date Balance: | | $25,695,000 |
| 300, 302, 330 and 350 Fellowship Road | Liberty Walk at East Gate | Cut-off Date LTV: | | 73.8% |
| Mount Laurel, NJ 08054 | | U/W NCF DSCR: | | 1.87x |
| | | U/W NOI Debt Yield: | | 10.9% |
a one-, three- and five-mile radius is 3,433, 65,636 and 190,059, respectively and the average household income in a one-, three- and five-mile radius is $173,748, $131,801 and $134,868, respectively.
Submarket Information - According to the appraisal, the Liberty Walk at East Gate Property is located in the Northern Burlington submarket within the Greater Philadelphia office market. As of year-end 2019, the Burlington office submarket reported a total inventory of approximately 8.3 million square feet with a 9.8% vacancy rate. The submarket is dominated by Class B and Class C office buildings with only 20% of the total office inventory being Class A.
The following table presents certain information relating to the appraiser’s market rent conclusions for the Liberty Walk at East Gate Property:
Market Rent Summary(1)
| Building 300 | Building 302 | Building 350 | Building 330
>10,000 SF | Building 330
<10,000 SF | Building 330 –
Morgan Stanley |
Market Rent (PSF) | $13.00 | $13.00 | $13.25 | $16.00 | $17.00 | $18.00 |
Lease Term (Years) | 10 | 7 | 7 | 7 | 7 | 10 |
Free Rent Months (New/Renew) | 6/3 | 6/3 | 6/3 | 6/3 | 6/3 | 9/4 |
Lease Type (Reimbursements) | NNN | NNN | NNN | NNN | NNN | NNN |
Rent Increase Projection | 3% per annum | 3% per annum | 3% per annum | 3% per annum | 3% per annum | 3% per annum |
Tenant Improvements (New Tenants) (PSF) | $25.00 | $25.00 | $25.00 | $25.00 | $25.00 | $25.00 |
Tenant Improvements (Renewals) (PSF) | $7.50 | $7.50 | $7.50 | $7.50 | $7.50 | $7.50 |
| (1) | Information obtained from the appraisal. |
The table below presents certain information relating to comparable sales pertaining to the Liberty Walk at East Gate Property identified by the appraiser:
Comparable Sales(1)
Property Name | Location | Rentable Area (SF) | Sale Date | Sale Price | Sales Price
(PSF) | Adjusted Sales
Price (PSF) |
Cherry Hill Commerce Center | Cherry Hill, NJ | 153,094 | Feb-18 | $22,136,000 | $144.59 | $151.82 |
Greentree Center | Marlton, NJ | 112,072 | May-18 | $12,120,000 | $108.14 | $147.62 |
Marlton Executive Park & Horizon Corp. Center | Marlton/Mt. Laurel, NJ | 304,732 | Mar-18 | $31,400,000 | $103.04 | $140.65 |
Lippincott Centre | Marlton, NJ | 165,742 | Apr-19 | $32,000,000 | $193.07 | $154.46 |
Cambridge Crossing | Cherry Hill, NJ | 215,465 | Nov-19 | $33,000,000 | $153.16 | $153.16 |
(1) | Information obtained from the appraisal. |
THE INFORMATION IN THIS STRUCTURAL AND COLLATERAL TERM SHEET IS NOT COMPLETE AND MAY BE AMENDED PRIOR TO THE TIME OF SALE. THIS TERM SHEET IS NOT AN OFFER TO SELL THESE SECURITIES AND IT IS NOT A SOLICITATION OF AN OFFER TO BUY THESE SECURITIES IN ANY JURISDICTION WHERE THE OFFER OR SALE IS NOT PERMITTED.
127
| Office - Suburban | Loan #12 | Cut-off Date Balance: | | $25,695,000 |
| 300, 302, 330 and 350 Fellowship Road | Liberty Walk at East Gate | Cut-off Date LTV: | | 73.8% |
| Mount Laurel, NJ 08054 | | U/W NCF DSCR: | | 1.87x |
| | | U/W NOI Debt Yield: | | 10.9% |
The following table presents certain information relating to comparable properties to Liberty Walk at East Gate Property:
Comparable Leases(1)
Property Name/Location | Distance from Subject | Tenant | Lease
Term | Tenant
Size (SF) | Annual
Base Rent
PSF | TI
Allowance
PSF | Lease Type |
305 Fellowship Road Mount Laurel, NJ | 0.4 miles | CACI | 3.1 Yrs | 2,195 | $14.00 | $6.00 | NNN |
523 Fellowship Road Mount Laurel, NJ | 1.3 miles | Virtua Health System | 5.0 Yrs | 30,196 | $11.75 | $10.00 | NNN |
124 Gaither Drive Mount Laurel, NJ | 1.4 miles | ADT | 5.0 Yrs | 13,146 | $11.50 | $11.50 | NNN |
1120 Route 73 Mount Laurel, NJ | 2.0 miles | Insight Telepsychiatry | 5.3 Yrs | 10,500 | $13.50 | $20.00 | NNN |
9000 E Lincoln Drive Marlton, NJ | 3.5 miles | Hillside NJ | 10.0 Yrs | 18,876 | $21.75 | $37.00 | Base Plus Electric |
525 W Lincoln Drive Marlton, NJ | 4.0 miles | Ameriprise | 10.0 Yrs | 3,428 | $22.00 | $45.00 | Base Plus Electric |
525 W Lincoln Drive Marlton, NJ | 4.0 miles | Advocare | 4.6 Yrs | 2,831 | $23.95 | $15.00 | Base Plus Electric |
555 W Lincoln Drive Marlton, NJ | 4.0 miles | Integrity Title Agency | 10.0 Yrs | 5,000 | $23.25 | $25.00 | Base Plus Electric |
406 Lippincott Drive Marlton, NJ | 5.1 miles | South Jersey Gastroenterology | 5.0 Yrs | 9,000 | $13.25 | $7.00 | NNN |
1810 W Chapel Avenue Cherry Hill, NJ | 5.2 miles | Flaster Greenberg | 11.0 Yrs | 25,774 | $24.00 | $48.00 | NNN |
921 Haddonfield Drive Cherry Hill, NJ | 5.9 miles | Avnet | 10.5 Yrs | 19,304 | $23.50 | $64.29 | NNN |
1000 Sagemore Drive Marlton, NJ | 6.2 miles | Leidos Innovations | 3.2 Yrs | 10,914 | $25.00 | $0.00 | NNN |
6000 Sagemore Drive Marlton, NJ | 6.6 miles | Delaware Valley Institute Fertility | 5.0 Yrs | 6,590 | $18.35 | $15.00 | NNN |
(1) | Information obtained from appraisal. |
Escrows.
Immediate Repairs – At origination, the borrower was required to escrow $7,375 for immediate repairs.
Real Estate Taxes – At origination, the borrower was required to escrow $232,021 for real estate taxes. The borrower is required to make monthly payments of one-twelfth of the taxes payable during the next twelve months, currently equal to $77,340.
Insurance – The borrower will not be required to make monthly payments of one-twelfth of the insurance premiums the lender estimates will be payable during the next twelve months as long as the borrower maintains a blanket policy acceptable to the lender.
Replacement Reserve – The borrower is required to make monthly deposits of $3,909 ($0.20 per square foot annually) for replacement reserves.
TI/LC Reserve – At origination, the borrower was required to escrow $1,173,000 for future tenant improvements and leasing commissions. Monthly deposits of $2.00 per square foot per annum ($39,094) are required unless the amount in the tenant improvement and leasing reserve account is greater than or equal to $1,173,000.
Outstanding TI/LC – At origination, the borrower was required to escrow $1,514,382 for outstanding tenant improvements and leasing commissions for the Conrail, Marlin Capital Solutions and Ocean First Bank leases.
Free Rent Reserve – At origination, the borrower was required to escrow $579,577 for outstanding free and gap rent obligations under the Conrail and Marlin Capital Solutions leases.
Lockbox and Cash Management. The Liberty Walk at East Gate Mortgage Loan documents require a springing lockbox with springing cash management. Upon the occurrence of a Cash Management Trigger Period (as defined below), the borrower or manager will be required to establish a lender-controlled lockbox account and instruct tenants to deposit rents into such lockbox account within two business days of receipt. During a Cash Management Trigger Period, all amounts in the lockbox account are to be transferred daily to the cash management account for the payment, among other things, of the debt service under the Liberty Walk at East Gate Mortgage Loan, monthly escrows and other expenses described in the Liberty Walk at East Gate Mortgage Loan documents. To the extent that there is excess cash flow following these disbursements and a Cash Trap Event Period (as defined below) has occurred and is continuing, the excess cash will be held by the lender as additional security for the Liberty Walk at East Gate Mortgage Loan. Additionally, to the extent that a Major Tenant Event Period (as defined below) has occurred and is continuing, the excess cash will be deposited into the major tenant reserve account. In the absence of a Cash Trap Event Period and/or a Major Tenant Event Period, the excess cash will be disbursed to the borrower.
THE INFORMATION IN THIS STRUCTURAL AND COLLATERAL TERM SHEET IS NOT COMPLETE AND MAY BE AMENDED PRIOR TO THE TIME OF SALE. THIS TERM SHEET IS NOT AN OFFER TO SELL THESE SECURITIES AND IT IS NOT A SOLICITATION OF AN OFFER TO BUY THESE SECURITIES IN ANY JURISDICTION WHERE THE OFFER OR SALE IS NOT PERMITTED.
128
| Office - Suburban | Loan #12 | Cut-off Date Balance: | | $25,695,000 |
| 300, 302, 330 and 350 Fellowship Road | Liberty Walk at East Gate | Cut-off Date LTV: | | 73.8% |
| Mount Laurel, NJ 08054 | | U/W NCF DSCR: | | 1.87x |
| | | U/W NOI Debt Yield: | | 10.9% |
A “Cash Management Trigger Period” will commence upon the earliest of (i) an event of default under the Liberty Walk at East Gate Mortgage Loan documents, (ii) the debt service coverage ratio of the Liberty Walk at East Gate Property being less than 1.35x based on a 30-year amortization schedule or (iii) a Cash Trap Event Period. A Cash Management Trigger Period will end upon, with respect to clause (i) above, the end of such event of default; with respect to clause (ii) above, the debt service coverage ratio being greater than or equal to 1.35x based on a 30-year amortization schedule; and with respect to clause (iii), the date on which all Cash Trap Event Periods have expired.
A “Cash Trap Event Period” will commence upon the earlier of (i) an event of default, (ii) the debt service coverage ratio being less than 1.35x for two consecutive calendar quarters based on a 30-year amortization schedule or (iii) a Major Tenant Event Period. A Cash Trap Event Period will end upon, with respect to clause (i) above, the cure of such event of default; with respect to clause (ii) above, the debt service coverage ratio being greater than or equal to 1.40x for two consecutive calendar quarters based on a 30-year amortization schedule; and with respect to clause (iii) above, the termination of such Major Tenant Event Period.
A “Major Tenant Event Period” will occur when (i) a Major Tenant (as defined below) defaults under its lease; (ii) a Major Tenant going dark, vacating or failing to operate under normal business hours; (iii) a Major Tenant filing for bankruptcy or similar insolvency proceedings; (iv) a Major Tenant exercising any option to terminate or reduce its space under its lease; (v) a Major Tenant failing to renew its lease before the earlier of (x) the deadline to renew under its lease or (y) 12 months prior to the expiration of the Major Tenant’s lease; or (vi) a Major Tenant giving notice that it does not intend to renew its lease. Additionally, the borrower has the option to cure a Major Tenant Event Period by posting cash or a letter of credit of $1,500,000 into a major tenant reserve account.
A “Major Tenant” is either (i) Morgan Stanley or (ii) any replacement tenant that enters into a lease for 20,000 square feet or more of Morgan Stanley’s space.
Property Management. The Liberty Walk at East Gate Property is managed by CBRE, Inc.
Partial Release. Not permitted.
Real Estate Substitution. Not permitted.
Subordinate and Mezzanine Indebtedness. The Liberty Walk at East Gate Borrower may incur mezzanine debt from two years following securitization provided (i) no event of default has occurred or is continuing; (ii) the combined LTV ratio would be less than or equal to 73.8%, (iii) the combined debt yield would be greater than 9.82%; (iv) the combined DSCR would be greater than or equal to 1.91x; (v) rating agency confirmation and (vi) other conditions as set forth in the Liberty Walk at East Gate Mortgage Loan documents.
Terrorism Insurance. The Liberty Walk at East Gate Mortgage Loan documents require that the “all risk” insurance policy required to be maintained by the borrower provides coverage for terrorism in an amount equal to the full replacement cost of the Liberty Walk at East Gate Property, as well as business interruption insurance covering no less than the 18-month period following the occurrence of a casualty event, together with a 12-month extended period of indemnity.
THE INFORMATION IN THIS STRUCTURAL AND COLLATERAL TERM SHEET IS NOT COMPLETE AND MAY BE AMENDED PRIOR TO THE TIME OF SALE. THIS TERM SHEET IS NOT AN OFFER TO SELL THESE SECURITIES AND IT IS NOT A SOLICITATION OF AN OFFER TO BUY THESE SECURITIES IN ANY JURISDICTION WHERE THE OFFER OR SALE IS NOT PERMITTED.
129
No. 13 – Parkmerced |
|
Mortgage Loan Information | | Mortgaged Property Information |
Mortgage Loan Seller: | Barclays Capital Real Estate Inc. | | Single Asset/Portfolio: | Single Asset |
Credit Assessment (Fitch/KBRA/Moody’s): | BBB+sf/AA(sf)/NR | | Property Type – Subtype: | Multifamily – High Rise/Townhome |
Original Principal Balance(1): | $25,000,000 | | Location: | San Francisco, CA |
Cut-off Date Balance(1): | $25,000,000 | | Size: | 3,165 Units |
% of Initial Pool Balance: | 3.4% | | Cut-off Date Balance Per Unit(1): | $172,828 |
Loan Purpose: | Refinance | | Maturity Date Balance Per Unit(1): | $172,828 |
Borrower Sponsor: | Robert A. Rosania | | Year Built/Renovated: | 1944/2009 |
Guarantor: | Robert A. Rosania | | Title Vesting: | Fee |
Mortgage Rate: | 2.72457% | | Property Manager: | Self-managed |
Note Date: | November 26, 2019 | | Current Occupancy (As of)(1): | 94.2% (9/10/2019) |
Seasoning: | 6 months | | YE 2018 Occupancy: | 90.5% |
Maturity Date: | December 9, 2024 | | YE 2017 Occupancy: | 89.7% |
IO Period: | 60 months | | YE 2016 Occupancy: | 87.9% |
Loan Term (Original): | 60 months | | YE 2015 Occupancy: | 91.0% |
Amortization Term (Original): | NAP | | Appraised Value(1)(4): | $2,110,000,000 |
Loan Amortization Type: | Interest-only, Balloon | | Appraised Value Per Unit(1)(4): | $666,667 |
Call Protection(2): | YM(57),O(3) | | Appraisal Valuation Date: | September 3, 2019 |
Lockbox Type: | Soft/Springing Cash Management | | Underwriting and Financial Information |
Additional Debt(1): | Yes | | TTM NOI (8/31/2019)(5): | $55,758,363 |
Additional Debt Type (Balance)(1): | Pari Passu ($522,000,000); B-Note ($708,000,000); C-Note ($245,000,000); Mezzanine ($275,000,000) | | YE 2018 NOI: | $53,685,525 |
| | | YE 2017 NOI: | $49,642,357 |
| | | YE 2016 NOI: | $44,204,195 |
| | | U/W Revenues: | $102,983,881 |
| | | U/W Expenses: | $42,514,116 |
Escrows and Reserves | | U/W NOI(1): | $60,469,764 |
| Initial | Monthly | Cap | | U/W NCF(1): | $59,678,514 |
Taxes | $795,083 | $795,083 | NAP | | U/W DSCR based on NOI/NCF(1): | 4.06x / 4.00x |
Insurance | $0 | Springing(3) | NAP | | U/W Debt Yield based on NOI/NCF(1): | 11.1% / 10.9% |
Replacement Reserve | $0 | $65,938 | NAP | | U/W Debt Yield at Maturity based on NOI/NCF(1): | 11.1% / 10.9% |
Immediate Repairs | $108,207 | $0 | NAP | | Cut-off Date LTV Ratio(1): | 25.9% |
| | | | | LTV Ratio at Maturity(1): | 25.9% |
| | | | | | |
| | | | | | | |
Sources and Uses |
Sources | | | | | Uses | | | |
Original Whole Loan Amount | $1,500,000,000 | | 83.6% | | Payoff Existing Debt(6) | $1,581,601,056 | | 88.1% |
Mezzanine Loan | 275,000,000 | | 15.3 | | Rate Buy-Down Fee | 117,525,000 | | 6.5 |
Borrower Sponsor Equity(7) | 19,684,403 | | 1.1 | | Preferred Equity Repayment | 45,145,267 | | 2.5 |
| | | | | Closing costs | 33,769,790 | | 1.9 |
| | | | | Swaption Purchase(8) | 15,740,000 | | 0.9 |
| | | | | Reserves | 903,290 | | 0.1 |
Total Sources | $1,794,684,403 | | 100.0% | | Total Uses | $1,794,684,403 | | 100.0% |
(1) | The Parkmerced Mortgage Loan (as defined below) is part of a whole loan, evidenced by nine senior pari passu notes with an aggregate original principal balance of $547.0 million (the “A Notes”), two senior subordinate notes with an aggregate original principal balance of $708.0 million (the “B Notes”) and two junior subordinate notes with an aggregate original principal balance of $245.0 million (the “C Notes”, collectively with the A Notes and the B Notes, the “Parkmerced Whole Loan”). The sole member of the borrower obtained a $275.0 million mezzanine loan from a third-party at loan origination (the “Parkmerced Mezzanine Loan”, together with the Parkmerced Whole Loan, the “Parkmerced Total Debt”). The Cut-off Date Balance Per Unit, Maturity Date Balance Per Unit, U/W NOI Debt Yield, U/W NCF Debt Yield, U/W NOI DSCR, U/W NCF DSCR, Cut-off Date LTV Ratio and LTV Ratio at Maturity numbers presented above are based on the aggregate principal balance of the promissory notes comprising the A Notes, without regard to the B Notes or C Notes. All NOI, NCF and occupancy information, as well as the appraised value, were determined prior to the emergence of the novel coronavirus pandemic, and the economic disruption resulting from measures to combat the pandemic, and all DSCR, LTV and Debt Yield metrics were calculated, and The Parkmerced Mortgage Loan was underwritten, based on such prior information. See “Risk Factors—Coronavirus Pandemic Has Adversely Affected the Global Economy and Will Likely Adversely Affect the Performance of the Mortgage Loans” in the Preliminary Prospectus. |
(2) | Prior to October 9, 2024, and provided no event of default exists, the Parkmerced Total Debt may be prepaid in whole or in part with the payment of a yield maintenance premium. Prepayments of the Parkmerced Total Debt in whole or in part along with any applicable yield maintenance premiums |
THE INFORMATION IN THIS STRUCTURAL AND COLLATERAL TERM SHEET IS NOT COMPLETE AND MAY BE AMENDED PRIOR TO THE TIME OF SALE. THIS TERM SHEET IS NOT AN OFFER TO SELL THESE SECURITIES AND IT IS NOT A SOLICITATION OF AN OFFER TO BUY THESE SECURITIES IN ANY JURISDICTION WHERE THE OFFER OR SALE IS NOT PERMITTED.
130
Multifamily – High Rise/Townhome | Loan #13 | Cut-off Date Balance: | | $25,000,000 |
3711 19th Avenue | Parkmerced | Cut-off Date LTV: | | 25.9% |
San Francisco, CA 94132 | | U/W NCF DSCR: | | 4.00x |
| | U/W NOI Debt Yield: | | 11.1% |
paid will be applied to the Parkmerced Whole Loan and Parkmerced Mezzanine Loan on a pro rata basis; provided, however, so long as no event of default or Cash Trap Period, as defined in the loan documents, has occurred and is continuing under the Parkmerced Whole Loan, a $75.0 million portion of the Parkmerced Mezzanine Loan may be prepaid in whole or in part at any time (accompanied by a corresponding payment of any accrued and unpaid interest outstanding at the time of such prepayment) without the payment of a yield maintenance premium and without a corresponding pro rata prepayment of the Parkmerced Whole Loan; provided, further, so long as no event of default or Cash Trap Period has occurred and is continuing under the Parkmerced Whole Loan, all accrued and unpaid interest on the Parkmerced Mezzanine Loan may be paid at any time without the simultaneous pro rata prepayment of the Parkmerced Whole Loan.
(3) | The borrower will not be required to make monthly payments of one-twelfth of the insurance premiums the lender estimates will be payable during the next twelve months as long as the borrower maintains a blanket policy acceptable to the lender. |
(4) | The Appraised Value Per Unit, Cut-off Date LTV Ratio and Maturity Date LTV Ratio are based on the appraised “As-Is Value Inclusive of Development Rights (Excluding all of Phase 1)” of $2.110 billion, which reflects the sum of the appraised (i) “As-Is Value (Excluding all of Phase 1)” of $1.741 billion and (ii) “As-Is Value of Development Rights (Excluding all of Phase 1)” of $369.0 million, in each case, as of September 3, 2019. The Cut-off Date LTV Ratio and Maturity Date LTV Ratio for the A Notes based on the appraised “As-Is Value (Excluding all of Phase 1)” of $1.741 billion are 31.4% and 31.4%, respectively. |
(5) | The borrower provided updated financial information resulting in a March 2020 TTM revenue, expense, NOI and NCF of $102,360,823, $45,479,519, $56,881,305, and $56,881,305, respectively. |
(6) | Payoff Existing Debt consists of (i) approximately $440.5 million of outstanding mortgage debt and related fees/interest due thereon, net of credits for escrows and reserves (original balance of $450.0 million) which was securitized in LCCM 2014-PKMD and (ii) payment-in-kind mezzanine debt with an outstanding balance of $1.141 billion (original principal balance of $773.0 million), both of which matured on November 8, 2019. |
(7) | Borrower Sponsor Equity was sourced through a bridge loan secured by the borrower sponsor’s fee simple interest in the non-collateral initial Phase I Property (as described in the “Planned Redevelopment” section below). |
(8) | To manage rate risk for refinance at the maturity date of the Parkmerced Whole Loan, the borrower purchased a European-style swaption at the origination date with a notional amount of $1.5 billion, a fixed rate of 2.78150%, an effective date of December 9, 2024 and a termination date of December 9, 2029. |
The Mortgage Loan. The Parkmerced Mortgage Loan (as defined below) is secured by a first lien mortgage on the borrower’s fee interest in a portion of a 152-acre multifamily development located in San Francisco, California (the “Parkmerced Property”). The whole loan was co-originated by Barclays Capital Real Estate Inc. and Citi Real Estate Funding Inc. and has an outstanding principal balance as of the Cut-off Date of $1.5 billion. The Parkmerced Whole Loan is comprised of nine senior pari passu notes with an aggregate principal balance of $547.0 million, two senior subordinate notes with an aggregate principal balance of $708.0 million and two junior subordinate notes with an aggregate principal balance of $245.0 million. The Parkmerced Whole Loan has a five-year term, is interest-only for the full term of the loan and accrues interest on a 30/360 basis. Note A-7, with an outstanding principal balance as of the Cut-off Date of $25.0 million, is being contributed to the WFCM 2020-C56 securitization trust (the “Parkmerced Mortgage Loan”). Prior to the occurrence of a control appraisal period, Note C-1 will be the controlling noteholder. The Parkmerced Mortgage Loan is serviced pursuant to the trust and servicing agreement for the MRCD 2019-PARK securitization. See “Description of the Mortgage Pool—The Whole Loans—The Non-Serviced A/B Whole Loans—The Parkmerced Whole Loan“ and “Pooling and Servicing Agreement” in the Preliminary Prospectus.
Note Summary
Notes | Original Principal Balance | Cut-off Date Balance | Note Holder | Controlling Interest |
A-1 | $123,500,000 | $123,500,000 | MRCD 2019-PARK | No(1) |
A-2 | $123,500,000 | $123,500,000 | MRCD 2019-PARK | No |
A-3 | $65,000,000 | $65,000,000 | BBCMS 2020-C6 | No |
A-4 | $45,000,000 | $45,000,000 | BMARK 2020-IG1 | No |
A-5 | $60,000,000 | $60,000,000 | An affiliate of Barclays | No |
A-6 | $27,500,000 | $27,500,000 | CGCMT 2020-GC46 | No |
A-7 | $25,000,000 | $25,000,000 | WFCM 2020-C56 | No |
A-9 | $40,000,000 | $40,000,000 | CF 2020-P1 | No |
A-10 | $37,500,000 | $37,500,000 | GSMS 2020-GC45 | No |
B-1 | $354,000,000 | $354,000,000 | MRCD 2019-PARK | No |
B-2 | $354,000,000 | $354,000,000 | MRCD 2019-PARK | No |
C-1 | $122,500,000 | $122,500,000 | MRCD 2019-PRKC | Yes(1) |
C-2 | $122,500,000 | $122,500,000 | MRCD 2019-PRKC | No |
Total | $1,500,000,000 | $1,500,000,000 | | |
(1) | When a control appraisal period is in effect, Note A-1 will be the controlling note, and the directing certificate holder will be entitled to exercise the related control rights. See “Description of the Mortgage Pool—The Whole Loans—The Non-Serviced AB Whole Loans—The Parkmerced Whole Loan” in the Preliminary Prospectus. |
THE INFORMATION IN THIS STRUCTURAL AND COLLATERAL TERM SHEET IS NOT COMPLETE AND MAY BE AMENDED PRIOR TO THE TIME OF SALE. THIS TERM SHEET IS NOT AN OFFER TO SELL THESE SECURITIES AND IT IS NOT A SOLICITATION OF AN OFFER TO BUY THESE SECURITIES IN ANY JURISDICTION WHERE THE OFFER OR SALE IS NOT PERMITTED.
131
Multifamily – High Rise/Townhome | Loan #13 | Cut-off Date Balance: | | $25,000,000 |
3711 19th Avenue | Parkmerced | Cut-off Date LTV: | | 25.9% |
San Francisco, CA 94132 | | U/W NCF DSCR: | | 4.00x |
| | U/W NOI Debt Yield: | | 11.1% |
The Property. Parkmerced is one of the largest multifamily communities in San Francisco, California, spread across 152 acres and containing 3,221 units (of which 3,165 units are collateral for the Parkmerced Whole Loan and comprise the Parkmerced Property). Collateral units include 1,482 townhouse units and 1,683 traditional multifamily units. The majority of the Parkmerced Property was constructed from 1944 to 1951 across 11 high-rise towers and 154 garden style townhome buildings. Amenities at the Parkmerced Property include 2,502 parking spaces, on-site fitness centers, business centers, a community clubhouse, electronic car charging stations, access to Lake Merced and high speed Internet services. Select units provide views of the Pacific Ocean, Lake Merced and various golf courses. From January 2015 to September 2019, approximately $40.3 million was spent on capital expenditures at the Parkmerced Property. With approximately 10,000 residents, the Parkmerced Property is designated the third largest neighborhood in San Francisco by acreage, the largest multifamily development in California and the largest privately-owned urban neighborhood in North America by acreage.
As of September 10, 2019, the Parkmerced Property was 94.2% occupied. Approximately 62.9% of the units are fair market value units, 17.1% of the units are leased to students, and 12.2% of the units are Section 8 units with the remaining 7.8% as a mix of corporate and special circumstance, Good Samaritan, employee leases or unclassified units. All units are governed by the San Francisco Rent Control Ordinance, as are all apartments in San Francisco built before 1979. Under the terms of the ordinance, annual allowable rent increases cannot exceed 60.0% of the percentage increase in the CPI for all urban customers in the San Francisco-Oakland-San Jose region. However, upon a tenant vacating, the ordinance allows for the unit’s rent to be raised to market level. Due to the San Francisco rent controls, the average rents at the Parkmerced Property are approximately 24.4% below estimated market rents. Net operating income has nearly tripled from 2006 to TTM August 2019, with an average net cash flow growth of 9.2% year-over-year, with the net operating income only decreasing twice year-over-year in the past 13 years.
COVID-19 Update.As of May 9, 2020, the residential portion of the Parkmerced Property was open and operating, however, the gym and common areas have been closed due to the state of California’s stay at home order. Collections at the Parkmerced Property were 91.5% for April and 84.4% as of May 14, 2020, which is in line with the collections as of that date in April. The May debt service payment was made by the borrowers. On April 8, 2020, the lenders and the servicer of the Parkmerced Whole Loan received a communication from the borrower which included a potential request for forbearance of debt service payments, commencing with the debt service payment due in May 2020. However, the borrower proceeded to pay its debt service payments for the month of May 2020. Additionally, the servicer of the Mortgage Loan has since confirmed that forbearance has not officially been requested, and based on conversations with the borrower a forbearance request is not expected. As of the date hereof, the Parkmerced Whole Loan is not subject to any modification or forbearance request.
Planned Redevelopment. Pursuant to an agreement (the “Development Agreement”) by and among the City and County of San Francisco, a political subdivision and municipal corporation of the State of California (the “City”), and the borrower as successor in interest to Parkmerced Investors Properties LLC, the Parkmerced Property is currently entitled to develop 5,679 net new additional units, which would expand the total project to 8,900 units. The Development Agreement expires on July 9, 2041. The entitlement is among the largest private entitlements in California history. The Development Agreement had an original term of 30 years and provides a vested right to construct the project (prohibiting the City from applying new laws or regulations to the project that would adversely affect the development rights granted by the Development Agreement) during that 30-year term. Under the terms of the Development Agreement, all 1,538 garden units may be demolished and replaced with newly constructed units, and the replacement units must be completed prior to the demolition or construction of other buildings. In addition to the multifamily units, other planned developments include 6,508 parking stalls, a 64,000 square foot amenity building, 80,000 square feet of office space, 224,000 square feet of retail space, a 25,000 square foot school and 68 acres of open spaces and parks. The Development Plan also includes new San Francisco Municipal Railway (“MUNI”) stations, a property-owned shuttle to the Daly City Bay Area Rapid Transit (“BART”) station and multiple car/bike share hubs. In 2013, the Parkmerced Property received the American Institute of Architecture Urban Design award for its long-term design to create the largest carbon net-neutral neighborhood. Infrastructure improvements under the Development Agreement may include the installation of cogeneration and renewable energy sources, such as wind turbines and photovoltaic cells.
Construction under the Development Agreement is expected to be completed over a 20 to 30 year period but does not require the borrower to commence construction within a certain timeframe. The first phase of redevelopment is scheduled to commence during the Parkmerced Whole Loan term. The first phase, Phase 1 A+B (non-collateral), consists of 1,013 units over approximately three years, inclusive of five buildings containing 56 replacement units and 957 net new units. Phase 1 A+B also includes new utilities and streets, 15 acres of new landscaping, three new play areas, three new parks, community gardens and a dog park. The second phase, Phase 1 C+D, was included in the collateral for the Parkmerced Whole Loan because separate tax parcels have not yet been recorded. The Phase 1 C+D units are expected to be freely released from the collateral within the first 12 months of the Parkmerced Whole Loan term and were not included in the appraised value of the Parkmerced Property (see “Partial Release” section below) and includes demolishing 56 units, building 166 replacement units and 629 net new units. Future phases (included in the collateral for the Parkmerced Whole Loan) include the remaining buildout of 5,409 units (4,093 net new units and 1,316 replacement units to replace the existing garden style units). While only Phase 1 A+B is expected to be contemplated during the Parkmerced Whole Loan term, the borrower sponsor anticipates continuing a long-term redevelopment phased over the next 20 to 30 years.
THE INFORMATION IN THIS STRUCTURAL AND COLLATERAL TERM SHEET IS NOT COMPLETE AND MAY BE AMENDED PRIOR TO THE TIME OF SALE. THIS TERM SHEET IS NOT AN OFFER TO SELL THESE SECURITIES AND IT IS NOT A SOLICITATION OF AN OFFER TO BUY THESE SECURITIES IN ANY JURISDICTION WHERE THE OFFER OR SALE IS NOT PERMITTED.
132
Multifamily – High Rise/Townhome | Loan #13 | Cut-off Date Balance: | | $25,000,000 |
3711 19th Avenue | Parkmerced | Cut-off Date LTV: | | 25.9% |
San Francisco, CA 94132 | | U/W NCF DSCR: | | 4.00x |
| | U/W NOI Debt Yield: | | 11.1% |
The following table presents certain information relating to the tenancy at the Parkmerced Property:
Unit Mix
Unit Type | Collateral Units | % of Collateral Units | Occupied Collateral Units | % of Units Occupied | Total Collateral SF | Average Collateral SF | Average Rent Per Unit(1) |
Studio (Tower) | 11 | 0.3% | 11 | 100.0% | 5,731 | 521 | $2,358 |
One Bed, One Bath (Tower) | 571 | 18.0% | 532 | 93.2% | 450,322 | 789 | $2,423 |
One Bed, One Bath (Townhouse) | 534 | 16.9% | 503 | 94.2% | 389,008 | 728 | $2,388 |
Two Bed, One Bath (Townhouse) | 786 | 24.8% | 745 | 94.8% | 755,865 | 962 | $2,649 |
Two Bed, Two Bath (Tower) | 1,058 | 33.4% | 1,004 | 94.9% | 1,153,124 | 1,090 | $2,830 |
Three Bed, Two Bath (Townhouse) | 120 | 3.8% | 106 | 88.3% | 148,920 | 1,241 | $3,409 |
Three Bed, 2.5 Bath (Townhouse) | 42 | 1.3% | 36 | 85.7% | 58,614 | 1,396 | $3,955 |
Three Bed, Three Bath (Tower) | 43 | 1.4% | 43 | 100.0% | 60,857 | 1,415 | $4,207 |
Collateral Total | 3,165 | 100.0% | 2,980 | 94.2% | 3,022,441 | 955 | $2,690 |
(1) | Average Rent per Unit is calculated using the total rent inclusive of Section 8 subsidies and Occupied Collateral Units. |
The following table presents historical occupancy percentages at the Parkmerced Property:
Historical Occupancy
12/31/2015(1) | | 12/31/2016(1) | | 12/31/2017(1) | | 12/31/2018(1) | | 9/10/2019(2) |
91.0% | | 87.9% | | 89.7% | | 90.5% | | 94.2% |
(1) | Information obtained from the borrower. Occupancies are the annualized occupancies for each respective year |
(2) | Information obtained from the underwritten rent roll. |
Market Overview and Competition. The Parkmerced Property is located in San Francisco, California in the southwest sector of the city, just east of Lake Merced in the Ingleside District. The Parkmerced Property is bounded by 19th Avenue and Junipero Serra Boulevard to the east, Brotherhood Way to the south, Lake Merced Boulevard to the west and Holloway Avenue to the north. The Parkmerced Property is located across the street from San Francisco State University, which currently enrolls nearly 30,000 students, and is also adjacent to Lake Merced, TPC Harding Park Golf Club, San Francisco Golf Club and across the lake from the Olympic Golf Course. The Parkmerced Property is centrally located with access to two of the largest employment centers in the Bay Area, downtown San Francisco and Silicon Valley. Transportation is provided via highways I-280 and SR 1 or public transportation, such as MUNI buses, the BART and Caltrain. Google and Apple also provide private company shuttle services to Parkmerced residents via the 19th Avenue and Winston Drive shuttle stop. The overall San Francisco Bay area continues to record employment growth higher than the region and the nation, with an unemployment rate of only 2.5% in 2019. More than 30 Fortune 500 companies are based in San Francisco (second to only New York City), and the Bay Area is home to three of the five most valuable companies in the world by market cap (Apple, Alphabet and Facebook).
The Parkmerced Property is located within the West San Francisco submarket within the San Francisco-Redwood City-South San Francisco market. The submarket contains 19,525 units with a vacancy rate of 1.5%, lower than the overall market vacancy rate of 4.0%. Average rent per unit for the submarket is $2,943 with effective rents per unit of $2,798. Over the past five years, the submarket has experienced no multifamily construction, resulting in greater demand than supply.
THE INFORMATION IN THIS STRUCTURAL AND COLLATERAL TERM SHEET IS NOT COMPLETE AND MAY BE AMENDED PRIOR TO THE TIME OF SALE. THIS TERM SHEET IS NOT AN OFFER TO SELL THESE SECURITIES AND IT IS NOT A SOLICITATION OF AN OFFER TO BUY THESE SECURITIES IN ANY JURISDICTION WHERE THE OFFER OR SALE IS NOT PERMITTED.
133
Multifamily – High Rise/Townhome | Loan #13 | Cut-off Date Balance: | | $25,000,000 |
3711 19th Avenue | Parkmerced | Cut-off Date LTV: | | 25.9% |
San Francisco, CA 94132 | | U/W NCF DSCR: | | 4.00x |
| | U/W NOI Debt Yield: | | 11.1% |
The following table presents certain information relating to comparable multifamily properties for the Parkmerced Property:
Comparable Rentals(1)
Property | Units | Average SF per Unit | Built / Renovated | Occupancy | Average Asking Rent (Studio)(2) | Average Asking Rent (1 Bed)(2) | Average Asking Rent (2 Beds)(2) | Average Asking Rent (3 Beds)(2) |
Parkmerced | 3,165 | 955 | 1944-1951 / 2009 | 94.2% | $2,405 | $2,880 | $3,896 | $4,929 |
Westlake Village Apartments | 2,910 | 622 | 1968 | 100.0% | $1,883 | $2,213 | $2,800 | $4,233 |
Lakewood Apartments | 722 | 820 | 1973 | 97.0% | $2,203 | $2,514 | $3,612 | NAP |
Avalon Sunset Towers | 243 | 847 | 1961 | 97.0% | $3,156 | $3,638 | $4,777 | NAP |
The Fillmore Center | 1,114 | 1,346 | 1983 | 94.0% | $2,471 | $2,944 | $3,509 | $5,355 |
South City Station Apartments | 360 | 1,111 | 2007 | 95.0% | $2,440 | $3,250 | $3,772 | NAP |
Pacific Place Apartments | 71 | 1,985 | 2010 | 96.0% | NAP | $3,128 | $3,545 | $4,148 |
Avalon Ocean Avenue | 173 | 931 | 2012 | 97.0% | $3,191 | $3,503 | $4,519 | NAP |
Average(3) | 799 | 1,095 | 1988 | 96.6% | $2,557 | $3,027 | $3,791 | $4,579 |
(1) | Source: Appraisal, with the exception of Average Asking Rent and Occupancy figures for Parkmerced which are based on the underwritten rent roll dated September 10, 2019. |
(2) | Average Asking Rent figures for the Parkmerced Property reflect the average of the respective average market rent figures as provided in the underwritten rent roll weighted based on occupied collateral units. |
(3) | Calculated excluding the Parkmerced Property. |
Comparable Sales(1)
Property | Units | Average SF per Unit | Built / Renovated | Occupancy | Sale Date | Sale Price | $/Unit | Adjusted $/Unit | Cap Rate |
Blu Harbor Apartments | 402 | 989 | 2017 / NAP | 97.0% | July 2019 | $326,000,000 | $810,945 | $648,756 | 3.95% |
Lex Apartments | 387 | 876 | 2017 / NAP | 98.0% | June 2019 | $180,500,000 | $466,408 | $447,519 | 4.50% |
Jasper | 320 | 1,077 | 2015 / NAP | 97.0% | May 2019 | $306,500,000 | $957,813 | $435,326 | 3.75% |
Domain Apartments | 444 | 1,032 | 2013 / NAP | 97.0% | May 2019 | $255,500,000 | $575,450 | $523,084 | 4.70% |
Sofi Riverview Park | 271 | 811 | 2015 / NAP | 100.0% | April 2019 | $132,250,000 | $488,007 | $492,887 | N/A |
888 San Mateo | 160 | 850 | 2014 / NAP | 96.0% | November 2018 | $104,850,000 | $655,313 | $668,419 | 4.39% |
Average | 331 | 939 | | 97.5% | | $217,600,000 | $658,989 | $535,999 | 4.26% |
THE INFORMATION IN THIS STRUCTURAL AND COLLATERAL TERM SHEET IS NOT COMPLETE AND MAY BE AMENDED PRIOR TO THE TIME OF SALE. THIS TERM SHEET IS NOT AN OFFER TO SELL THESE SECURITIES AND IT IS NOT A SOLICITATION OF AN OFFER TO BUY THESE SECURITIES IN ANY JURISDICTION WHERE THE OFFER OR SALE IS NOT PERMITTED.
134
Multifamily – High Rise/Townhome | Loan #13 | Cut-off Date Balance: | | $25,000,000 |
3711 19th Avenue | Parkmerced | Cut-off Date LTV: | | 25.9% |
San Francisco, CA 94132 | | U/W NCF DSCR: | | 4.00x |
| | U/W NOI Debt Yield: | | 11.1% |
Operating History and Underwritten Net Cash Flow. The following table presents certain information relating to the historical operating performance and underwritten net cash flow at the Parkmerced Property:
Cash Flow Analysis
| | 2016 | | 2017 | | 2018 | | TTM
8/31/2019(1)(2) | | U/W(1) | | %(3) | | U/W $ per Unit | |
Base Rent | | $92,621,472 | | $96,288,650 | | $99,364,660 | | $101,199,148 | | $104,205,538 | | 72.3% | | $32,924 | |
Loss to Lease | | 38,116,118 | | 41,316,706 | | 32,704,965 | | 36,784,192 | | 32,606,507 | | 22.6 | | 10,302 | |
Gross Potential Rent(4) | | $130,737,590 | | $137,605,356 | | $132,069,625 | | $137,983,340 | | $136,812,045 | | 95.0% | | $43,227 | |
Other Income | | 6,244,183 | | 6,716,424 | | 7,000,388 | | 7,506,263 | | 7,260,065 | | 5.0 | | 2,294 | |
Net Rental Income | | $136,981,773 | | $144,321,780 | | $139,070,013 | | $145,489,603 | | $144,072,110 | | 100.0% | | $45,520 | |
(Vacancy & Credit Loss) | | (15,684,578) | | (12,952,736) | | (11,082,811) | | (9,204,100) | | (8,481,722) | | (5.9) | | (2,680) | |
Loss to Lease | | (38,116,118) | | (41,316,706) | | (32,704,965) | | (36,784,192) | | (32,606,507) | | (22.6) | | (10,302) | |
Effective Gross Income | | $83,181,077 | | $90,052,338 | | $95,282,237 | | $99,501,311 | | $102,983,881 | | 71.5% | | $32,538 | |
| | | | | | | | | | | | | | | |
Real Estate Taxes | | 8,928,249 | | 9,331,791 | | 9,472,531 | | 9,557,541 | | 9,263,099 | | 9.0 | | 2,927 | |
Insurance | | 1,538,832 | | 1,574,966 | | 1,653,418 | | 1,763,537 | | 2,759,808 | | 2.7 | | 872 | |
Management Fee | | 2,465,213 | | 2,653,811 | | 2,761,468 | | 2,930,661 | | 1,000,000 | | 1.0 | | 316 | |
Other Operating Expenses | | 26,044,588 | | 26,849,412 | | 27,709,295 | | 29,491,209 | | 29,491,209 | | 28.6 | | 9,318 | |
Total Operating Expenses | | $38,976,882 | | $40,409,981 | | $41,596,712 | | $43,742,948 | | $42,514,116 | | 41.3% | | $13,433 | |
| | | | | | | | | | | | | | | |
Net Operating Income | | $44,204,195 | | $49,642,357 | | $53,685,525 | | $55,758,363 | | $60,469,764 | | 58.7% | | $19,106 | |
Replacement Reserves | | 0 | | 0 | | 0 | | 0 | | 791,250 | | 0.8 | | 250 | |
TI/LC | | 0 | | 0 | | 0 | | 0 | | 0 | | 0.0 | | 0 | |
Net Cash Flow | | $44,204,195 | | $49,642,357 | | $53,685,525 | | $55,758,363 | | $59,678,514 | | 57.9% | | $18,856 | |
| | | | | | | | | | | | | | | |
NOI DSCR(5) | | 2.97x | | 3.33x | | 3.60x | | 3.74x | | 4.06x | | | | | |
NCF DSCR(5) | | 2.97x | | 3.33x | | 3.60x | | 3.74x | | 4.00x | | | | | |
NOI Debt Yield(5) | | 8.1% | | 9.1% | | 9.8% | | 10.2% | | 11.1% | | | | | |
NCF Debt Yield(5) | | 8.1% | | 9.1% | | 9.8% | | 10.2% | | 10.9% | | | | | |
(1) | The increase in Net Operating Income from TTM to Underwritten is due to the market rent resets for vacant units as described in “The Property” section above. For the avoidance of doubt, no COVID-19 specific adjustments have been incorporated in the lender underwriting. |
(2) | The borrower provided updated financial information resulting in a March TTM revenue, expense, NOI and NCF of $102,360,823, $45,479,519, $56,881,305, and $56,881,305, respectively. |
(3) | Represents (i) percent of Net Rental Income for all revenue fields and for Vacancy & Credit Loss and (ii) percent of Effective Gross Income for all other fields. |
(4) | Underwritten Gross Potential Rent is based on the September 10, 2019 rent roll’s annualized rents including Section 8. |
(5) | The debt service coverage ratios and debt yields are based on the A Notes and exclude the B Notes and C Notes. |
THE INFORMATION IN THIS STRUCTURAL AND COLLATERAL TERM SHEET IS NOT COMPLETE AND MAY BE AMENDED PRIOR TO THE TIME OF SALE. THIS TERM SHEET IS NOT AN OFFER TO SELL THESE SECURITIES AND IT IS NOT A SOLICITATION OF AN OFFER TO BUY THESE SECURITIES IN ANY JURISDICTION WHERE THE OFFER OR SALE IS NOT PERMITTED.
135
No. 14 – 650 Madison Avenue |
|
Mortgage Loan Information | | Mortgaged Property Information |
Mortgage Loan Seller: | Barclays Capital Real Estate Inc. | | Single Asset/Portfolio: | Single Asset |
Credit Assessment (Fitch/KBRA/Moody’s): | BBB-sf/BBB-(sf)/NR | | Property Type – Subtype: | Mixed Use – Office/Retail |
Original Principal Balance(1): | $25,000,000 | | Location: | New York, NY |
Cut-off Date Balance(1): | $25,000,000 | | Size: | 600,415 SF |
% of Initial Pool Balance: | 3.4% | | Cut-off Date Balance Per SF(1): | $977.32 |
Loan Purpose: | Refinance | | Maturity Date Balance Per SF(1): | $977.32 |
Borrower Sponsors: | Vornado Realty L.P.; OPG Investment Holdings (US), LLC | | Year Built/Renovated: | 1957 / 2015 |
Guarantors: | Vornado Realty L.P.; OPG Investment Holdings (US), LLC | | Title Vesting: | Fee |
Mortgage Rate: | 3.48600% | | Property Manager: | Self-managed |
Note Date: | November 26, 2019 | | Current Occupancy (As of)(1): | 97.4% (10/1/2019) |
Seasoning: | 6 months | | YE 2018 Occupancy: | 92.2% |
Maturity Date: | December 8, 2029 | | YE 2017 Occupancy: | 92.6% |
IO Period: | 120 months | | YE 2016 Occupancy: | 94.3% |
Loan Term (Original): | 120 months | | YE 2015 Occupancy(4): | 89.8% |
Amortization Term (Original): | NAP | | Appraised Value(1)(5): | $1,210,000,000 |
Loan Amortization Type: | Interest-only, Balloon | | Appraised Value Per SF(1)(5): | $2,015.27 |
Call Protection(2): | L(30),D(83),O(7) | | Appraisal Valuation Date: | October 31, 2019 |
Lockbox Type: | Hard/Springing | | Underwriting and Financial Information |
Additional Debt(1): | Yes | | TTM NOI (9/30/2019): | $50,961,537 |
Additional Debt Type (Balance)(1): | Pari Passu ($561,800,000); Subordinate Notes ($213,200,000) | | YE 2018 NOI: | $48,557,496 |
| | | YE 2017 NOI: | $46,541,346 |
| | | YE 2016 NOI: | $42,701,194 |
| | | U/W Revenues: | $87,327,989 |
| | | U/W Expenses: | $28,901,495 |
Escrows and Reserves | | U/W NOI(1): | $58,426,495 |
| Initial | Monthly | Cap | | U/W NCF(1): | $56,776,391 |
Taxes | $0 | Springing(3) | NAP | | U/W DSCR based on NOI/NCF(1): | 2.82x / 2.74x |
Insurance | $0 | Springing(3) | NAP | | U/W Debt Yield based on NOI/NCF(1): | 10.0% / 9.7% |
Replacement Reserve | $0 | Springing(3) | NAP | | U/W Debt Yield at Maturity based on NOI/NCF(1): | 10.0% / 9.7% |
TI/LC Reserve | $0 | Springing(3) | NAP | | Cut-off Date LTV Ratio(1): | 48.5% |
Outstanding TI/LC | $3,197,699 | $0 | NAP | | LTV Ratio at Maturity(1): | 48.5% |
Free Rent | $6,378,315 | $0 | NAP | | | |
| | | | | | | |
Sources and Uses |
Sources | | | | | Uses | | | |
Senior loan | $586,800,000 | | 70.7% | | Payoff existing debt | $800,000,000 | | 96.4% |
Junior loan | 213,200,000 | | 25.7 | | Defeasance costs | 14,157,786 | | 1.7 |
Existing debt reserve accounts | 20,051,781 | | 2.4 | | Upfront reserves | 9,576,014 | | 1.2 |
Sponsor equity | 9,510,787 | | 1.1 | | Closing costs | 5,828,767 | | 0.7 |
Total Sources | $829,562,568 | | 100.0% | | Total Uses | $829,562,568 | | 100.0% |
(1) | The 650 Madison Avenue Mortgage Loan (as defined below) is part of the 650 Madison Avenue Whole Loan (as defined below), which is evidenced by (i) 23 senior pari passu notes with an aggregate original balance of $586,800,000 (the “650 Madison Avenue Senior Loan”) and (ii) four subordinate B-notes with an aggregate original principal balance of $213,200,000 (the “650 Madison B-Notes”). The Cut-off Date Balance Per SF, Maturity Date Balance Per SF, U/W NOI Debt Yield, U/W NCF Debt Yield, U/W NOI DSCR, U/W NCF DSCR, Cut-off Date LTV Ratio and LTV Ratio at Maturity or ARD numbers presented above are based on the aggregate principal balance of the 650 Madison Senior Loan, without regard to the 650 Madison B-Notes. The Cut-off Date Balance Per SF, Maturity or ARD Date Balance Per SF, U/W Debt Yield based on NOI/NCF, U/W DSCR based on NOI/NCF, Cut-off Date LTV Ratio and LTV Ratio at Maturity numbers based on the combined balance of the entire 650 Madison Whole Loan are $1,332.41, $1,332.41, 7.3% /7.1%, 2.07x / 2.01x, 66.1% and 66.1%, respectively. All NOI, NCF and occupancy information, as well as the appraised value, were determined prior to the emergence of the novel coronavirus pandemic, and the economic disruption resulting from measures to combat the pandemic, and all DSCR, LTV and Debt Yield metrics were calculated, and the 650 Madison Avenue Mortgage Loan was underwritten, based on such prior information. See “Risk Factors—Coronavirus Pandemic Has Adversely Affected the Global Economy and Will Likely Adversely Affect the Performance of the Mortgage Loans” in the Preliminary Prospectus. |
(2) | Defeasance of the 650 Madison Avenue Whole Loan is permitted at any time after the earlier to occur of (a) the end of the two-year period commencing on the closing date of the securitization of the last 650 Madison senior pari passu companion loan to be securitized and (b) November 26, 2022. The assumed lockout period of 30 payments is based on the WFCM 2020-C56 closing date in June 2020. The actual lockout period may be longer. |
THE INFORMATION IN THIS STRUCTURAL AND COLLATERAL TERM SHEET IS NOT COMPLETE AND MAY BE AMENDED PRIOR TO THE TIME OF SALE. THIS TERM SHEET IS NOT AN OFFER TO SELL THESE SECURITIES AND IT IS NOT A SOLICITATION OF AN OFFER TO BUY THESE SECURITIES IN ANY JURISDICTION WHERE THE OFFER OR SALE IS NOT PERMITTED.
136
Mixed Use – Office/Retail | Loan #14 | Cut-off Date Balance: | | $25,000,000 |
650 Madison Avenue | 650 Madison Avenue | Cut-off Date LTV: | | 48.5% |
New York, NY 10022 | | U/W NCF DSCR: | | 2.74x |
| | U/W NOI Debt Yield: | | 10.0% |
(3) | The borrower will be required to make monthly tax escrow payments of 1/12th of the annual estimated tax payments for the next ensuing 12 months during a Trigger Period or a Specified Tenant Trigger Period. A “Trigger Period” will commence upon the earliest of (i) the debt yield falling below 6.00% for two consecutive quarters or (ii) an event of default. A “Specified Tenant Trigger Period” will commence upon the earliest of (i) any bankruptcy of Ralph Lauren (together with any single tenant replacing Ralph Lauren and paying no less than 30% of the total gross rent payable at the 650 Madison Avenue Property (a “Specified Tenant”)), (ii) delivery of any notice of termination or cancellation by a Specified Tenant for all or any portion of the Specified Tenant’s lease and/or if any Specified Tenant’s lease fails to otherwise be in full force and effect, (iii) the Specified Tenant being in monetary default of base rent or any material non-monetary default under the Specified Tenant’s lease beyond applicable notice and cure periods, (iv) the Specified Tenant failing to be in actual, physical possession and operating or dark in the Specified Tenant’s space, provided that it will not be a trigger under this clause (iv) if such Specified Tenant is rated an investment grade rated tenant by at least one of Moody’s, S&P and/or Fitch, or (v) a Specified Tenant’s failure to provide written notice to the borrower of renewal of its lease upon the earlier to occur of 18 months prior to its then current applicable lease expiration and the renewal notice period required under the applicable lease. The borrower will be required to make monthly insurance escrow payments of 1/12th of the annual estimated insurance premiums during the continuance of a Trigger Period or Specified Tenant Trigger Period and if the 650 Madison Avenue Property (as defined below) is not covered under a blanket policy acceptable to the lender. The borrower will be required to make monthly replacement reserve escrow payments of $0.25 multiplied by 1/12th the aggregate number of rentable square feet then contained in the 650 Madison Avenue Property (excluding rentable square footage contained in any Condominium Unit (as defined below) that was previously released from the collateral for the 650 Madison Avenue Whole Loan) during a Trigger Period. The borrower will be required to make monthly TI/LC reserve escrow payments of $125,000 during a Trigger Period. |
(4) | Crate & Barrel vacated 61,351 square feet of ground level retail and second floor office space since 2015. Since then, the borrower sponsors have executed leases with multiple luxury retailers including Celine Inc., Moncler USA Inc. (each utilizing its space as its respective brand’s flagship location) and USAPE LLC (“B.A.P.E.”) in the ground floor retail space, and an institutional tenant, Sotheby’s Int’l Realty Inc (“Sotheby’s”), in the second floor office space. |
(5) | The appraised value is based on the hypothetical “as-is” appraised value of $1,210,000,000 ($2,015 per square foot), which assumes all outstanding free rent and tenant improvements are funded in upfront reserve accounts by the borrower on the origination date. The “as-is” appraised value is $1,200,000,000 ($1,999 per square foot) and results in Cut-off Date LTV and Maturity Date LTV of 48.9% on the 650 Madison Avenue Senior Loan and a Cut-off Date LTV and Maturity Date LTV of 66.7% on the 650 Madison Avenue Whole Loan. |
The Mortgage Loan. The 650 Madison Avenue mortgage loan (the “650 Madison Mortgage Loan”) is part of a whole loan evidenced by (i) 23 senior pari passu promissory notes with an aggregate original principal balance of $586,800,000 (the “650 Madison Avenue Senior Loan”) and (ii) four B-notes with an aggregate original principal balance of $213,200,000, which are subordinate to the 650 Madison Avenue Senior Loan (the “650 Madison Avenue B-Notes,” and together with the 650 Madison Avenue Senior Loan, the “650 Madison Avenue Whole Loan”). The 650 Madison Avenue Whole Loan was co-originated by Barclays Capital Real Estate Inc., Citi Real Estate Funding Inc., Goldman Sachs Bank USA and BMO Harris Bank N.A. The 650 Madison Avenue Whole Loan is secured by a first lien mortgage encumbering the borrower’s fee interest in a 600,415 square-foot Class A office and retail property located at 650 Madison Avenue in New York City (the “650 Madison Avenue Property”). Promissory Note A-3-2-1, with an original principal balance of $25,000,000 will be included in the WFCM 2020-C56 securitization trust. The 650 Madison Avenue Whole Loan will be serviced pursuant to the pooling and servicing agreement for the MAD 2019-650M securitization trust. See “Description of the Mortgage Pool— The Whole Loans—The Non-Serviced AB Whole Loans—The 650 Madison Avenue Whole Loan“ and “Pooling and Servicing Agreement—Servicing of the Non-Serviced Mortgage Loans” in the Preliminary Prospectus.
Note Summary
Notes | Original Principal Balance | Cut-off Date Balance | Note Holder | Controlling Interest |
A-1-1 | $50,000,000 | $50,000,000 | CGCMT 2019-C7 | No(1) |
A-2-1, A-1-3 | $50,000,000 | $50,000,000 | GSMS 2020-GC45 | No |
A-1-4, A-2-2, A-2-5, A-2-7 | $115,000,000 | $115,000,000 | CGCMT 2020-GC46 | No |
A-1-5 | $45,000,000 | $45,000,000 | Benchmark 2020-B16 | No |
A-1-6 | $50,000,000 | $50,000,000 | Benchmark 2020-B17 | No |
A-1-7 | $37,900,000 | $37,900,000 | Benchmark 2020-IG1 | No |
A-1-2-1 | $40,000,000 | $40,000,000 | CF 2020-P1 | No |
A-2-3, A-2-4, A-2-6, A-2-8 | $51,450,000 | $51,450,000 | GSMS 2020-GC47 | No |
A-3-1 | $60,000,000 | $60,000,000 | BBCMS 2020-C6 | No |
A-3-2-1 | $25,000,000 | $25,000,000 | WFCM 2020-C56 | No |
A-3-2-2 | $21,450,000 | $21,450,000 | An affiliate of Barclays | No |
A-3-3 | $40,000,000 | $40,000,000 | WFCM 2020-C55 | No |
A-4, A-5, A-6, A-7 | $1,000,000 | $1,000,000 | MAD 2019-650M | No |
B-1, B-2, B-3, B-4 | $213,200,000 | $213,200,000 | MAD 2019-650M | Yes(1) |
Total | $800,000,000 | $800,000,000 | | |
(1) | The initial controlling note is note B-1, so long as no related control appraisal period has occurred and is continuing. If and for so long as a control appraisal period has occurred and is continuing, then the controlling note will be note A-1-1. See “Description of the Mortgage Pool— The Whole Loans—The Non-Serviced AB Whole Loans—The 650 Madison Avenue Whole Loan” in the Preliminary Prospectus. |
THE INFORMATION IN THIS STRUCTURAL AND COLLATERAL TERM SHEET IS NOT COMPLETE AND MAY BE AMENDED PRIOR TO THE TIME OF SALE. THIS TERM SHEET IS NOT AN OFFER TO SELL THESE SECURITIES AND IT IS NOT A SOLICITATION OF AN OFFER TO BUY THESE SECURITIES IN ANY JURISDICTION WHERE THE OFFER OR SALE IS NOT PERMITTED.
137
Mixed Use – Office/Retail | Loan #14 | Cut-off Date Balance: | | $25,000,000 |
650 Madison Avenue | 650 Madison Avenue | Cut-off Date LTV: | | 48.5% |
New York, NY 10022 | | U/W NCF DSCR: | | 2.74x |
| | U/W NOI Debt Yield: | | 10.0% |
The Property. The 650 Madison Avenue Property is a 27-story, 600,415 square foot Class A office building with grade level retail located in Midtown Manhattan on Madison Avenue between 59th and 60th Streets. The 650 Madison Avenue Property consists of 564,255 square feet of Class A office space and 36,160 square feet of ground floor retail space, which is inclusive of below-grade storage and flex space. The 650 Madison Avenue Property was originally constructed in 1957 as an eight-story building and in 1987 underwent a significant expansion and renovation that added the office tower and was most recently renovated in 2015. Based on the underwritten rent roll dated October 1, 2019, the 650 Madison Avenue Property is currently 97.4% leased (based on net rentable area (“NRA”)) to a diverse tenant roster including fashion (Ralph Lauren Corporation (“Ralph Lauren”)), healthcare (S.K.I. Realty Inc. doing business as Memorial Sloan Kettering Cancer Center (“MSKCC”)) and luxury goods (Celine Inc. (“Celine”)), as well as finance (“Willett Advisors LLC”). Each of the top three tenants by underwritten rent (see “Major Tenants” below) are investment-grade rated and account for 64.6% of NRA and 56.1% of UW rent.
Office (94.5% of Occupied NRA; 72.0% of UW Rent)
The 564,255 square feet of Class A office space at the 650 Madison Avenue Property is currently 97.9% occupied by 17 tenants that collectively contribute 72.0% of underwritten rent (inclusive of storage rent derived from office tenants). 358,491 square feet of the office space (65.9% of Class A office NRA) at the 650 Madison Avenue Property is leased to two investment grade-rated office tenants (Ralph Lauren and MSKCC). The largest office tenant at the 650 Madison Avenue Property, Ralph Lauren (rated A2/A- by Moody’s/S&P), occupies 46.1% of the 650 Madison Avenue Property’s NRA and accounts for 32.5% of underwritten rent. The tenant has occupied space in the 650 Madison Avenue Property since 1989 and has expanded several times. The 650 Madison Avenue Property serves as Ralph Lauren’s international headquarters. Ralph Lauren designs, markets and distributes apparel, accessories, fragrances and home furnishings under a wide range of brands and its operations include wholesale, retail, and licensing.
The second largest office tenant at the 650 Madison Avenue Property, MSKCC (rated AA/Aa3/AA- by Fitch/Moody’s/S&P), occupies 16.8% of the 650 Madison Avenue Property’s NRA and accounts for 12.3% of underwritten rent. MSKCC signed a 10-year lease in 2013 to take over the approximately 100,000 square foot medical office space that was previously occupied by Columbia Doctors, a faculty-run medical practice of Columbia University. The tenant has a separate entrance on the 60th Street side of the 650 Madison Avenue Property and uses the space for medical purposes. MSKCC is a cancer treatment and research institution in New York City and was founded in 1884 as the New York Cancer Hospital. According to the appraisal, MSKCC is the largest and oldest private cancer center in the world, and is one of 50 National Cancer Institute-designated Comprehensive Cancer Centers.
Retail (5.5% of Occupied NRA; 28.0% of UW Rent)
The 36,160 square feet of ground floor retail space at the 650 Madison Avenue Property is currently 88.4% occupied by five tenants that collectively contribute 28.0% of underwritten rent (inclusive of storage rent derived from retail tenants).
The ground floor retail space spans an entire block of the Madison Avenue retail corridor and, along with the second floor office space, was previously primarily occupied by Crate & Barrel until 2015. Since then, the borrower sponsors have executed leases with multiple luxury retailers including Celine, Moncler USA Inc (“Moncler”) (each utilizing its space as its respective brand’s flagship location) and B.A.P.E. in the ground floor retail space, and an institutional tenant, Sotheby’s, in the second floor office space. The re-leasing has further diversified the rent roll at the 650 Madison Avenue Property and, based on UW gross rent, the new leases have extended the weighted average lease expiration date of the space previously occupied by Crate & Barrel (excluding Tod’s, which has been a ground floor retail tenant at the 650 Madison Avenue Property since 1998) to August 2029.
The largest retail tenant by underwritten rent, Celine, is a wholly-owned subsidiary of LVMH (rated A1/A+ by Moody’s/S&P), occupies 1.7% of NRA and accounts for 11.3% of underwritten rent. Founded in 1945 by Céline Vipiana, Celine is a French ready-to-wear and leather luxury goods brand that has been owned by LVMH group (OTCMKTS: LVMUY) since 1996. Celine owns approximately 140 stores worldwide and is distributed through a network including department stores such as Saks Fifth Avenue (New York), Harrods (London) and Galeries Lafayette (Paris). The retail space showcases Celine’s NYC flagship store as well as the world’s largest Celine store.
COVID-19 Update. As of May 18, 2020, the 650 Madison Avenue Property is open, however all retail tenants are closed and most, if not all, office tenants are working remotely. The May debt service payment has been made. Approximately 96% of the tenants by square footage and 80% of the tenants by underwritten base rent made their April rent payment, and approximately 95% of the tenants by square footage and 72% of the tenants by underwritten base rent made their May rent payment. Two retail tenants representing approximately 15% of underwritten base rent have asked for rent relief. As of the date hereof, the 650 Madison Avenue Whole Loan is not subject to any modification or forbearance request.
THE INFORMATION IN THIS STRUCTURAL AND COLLATERAL TERM SHEET IS NOT COMPLETE AND MAY BE AMENDED PRIOR TO THE TIME OF SALE. THIS TERM SHEET IS NOT AN OFFER TO SELL THESE SECURITIES AND IT IS NOT A SOLICITATION OF AN OFFER TO BUY THESE SECURITIES IN ANY JURISDICTION WHERE THE OFFER OR SALE IS NOT PERMITTED.
138
Mixed Use – Office/Retail | Loan #14 | Cut-off Date Balance: | | $25,000,000 |
650 Madison Avenue | 650 Madison Avenue | Cut-off Date LTV: | | 48.5% |
New York, NY 10022 | | U/W NCF DSCR: | | 2.74x |
| | U/W NOI Debt Yield: | | 10.0% |
The following table presents certain information relating to the tenancy at the 650 Madison Property:
Major Tenants
Tenant Name | Credit Rating (Fitch/
Moody’s/
S&P)(1) | Tenant
NRSF(2) | % of
NRSF | Annual U/W Base Rent PSF(3) | Annual
U/W Base Rent(3) | % of Total Annual U/W Base Rent | Lease
Expiration
Date | Extension Options | Termination Option (Y/N) |
Major Tenants | | | | | | | | |
Ralph Lauren | NR/A2/A- | 277,016 | 46.1% | $89.41 | $24,767,403 | 32.5% | 12/31/2024 | 1, 10-year | N |
MSKCC | AA/Aa3/AA- | 100,700 | 16.8 | $92.97 | 9,362,079 | 12.3 | 7/31/2023 | 1, 5-year | Y(4) |
Willett Advisors LLC | NR/NR/NR | 25,732 | 4.3 | $155.00 | 3,988,460 | 5.2 | 12/31/2024 | NAP | N |
Sotheby’s(5) | NR/B3/B+ | 37,772 | 6.3 | $91.60 | 3,459,915 | 4.5 | 10/31/2035 | 1, 5-year | N |
BC Partners Inc. | NR/NR/NR | 19,380 | 3.2 | $118.58 | 2,298,086 | 3.0 | 1/31/2027 | NAP | N |
Top 5 Office Tenants | | 460,600 | 76.7% | $95.26 | $43,875,943 | 57.6% | | | |
| | | | | | | | | |
Other Office Tenants(5)(6) | | 92,080 | 15.3% | $119.11 | $10,967,991 | 14.4% | | | |
| | | | | | | | | |
Office Tenants Subtotal/Wtd. Avg. | | 552,680 | 92.0% | $99.23 | $54,843,935 | 72.0% | | | |
| | | | | | | | | |
Celine(5) | NR/A1/A+ | 10,223 | 1.7% | $841.24 | $8,600,017 | 11.3% | 2/28/2029 | NAP | N |
Moncler | NR/NR/NR | 8,985 | 1.5 | 667.78 | 6,000,000 | 7.9 | 8/31/2026 | 1, 5-year | N |
Deva Inc. (“Tod’s”) | NR/NR/NR | 7,867 | 1.3 | 680.90 | 5,356,615 | 7.0 | 10/13/2023 | NAP | N |
B.A.P.E.(5)(7) | NR/NR/NR | 3,705 | 0.6 | 298.52 | 1,106,000 | 1.5 | 7/31/2030 | NAP | N |
MB Worldwide LLC(“Domenico Vacca”)(5)(7) | NR/NR/NR | 1,202 | 0.2 | 239.60 | 288,000 | 0.4 | 1/1/2030 | NAP | N |
Retail Subtotal | 31,982 | 5.3% | $667.58 | $21,350,632 | 28.0% | | | |
| | | | | | | | |
Occupied Collateral Total | 584,662 | 97.4% | $130.32 | $76,194,567 | 100.0% | | | |
Vacant Space(8) | 15,753 | 2.6% | | | | | | |
| | | | | | | | |
Collateral Total | 600,415 | 100.0% | | | | | | |
| | | | | | | | | |
(1) | Certain ratings are those of the parent company whether or not the parent company guarantees the lease. |
(2) | Certain office tenants and retail tenants have storage/miscellaneous square feet included in their respective space. |
(3) | Annual U/W Base Rent includes contractual rent steps through July 2020 for non-investment grade rated tenants and the straight-line average for investment grade rated tenants through the lease term totaling $1,406,588. Other Office Tenants Annual U/W Base Rent includes an elevator marketing contract with Captivate LLC of $10,080 per year, but with no attributable square footage. Vacant Space includes a 1,616 square foot café tenant that is leased on a month-to-month basis with no attributable underwritten base rent. |
(4) | MSKCC has a one-time option to terminate its lease upon at least 18 months’ prior written notice to the landlord, provided that (a) the termination date is not earlier than July 1, 2020 and not later than June 30, 2022, (b) the termination date is at least 18 months after the termination notice is received by the landlord, and (c) MSKCC has paid to the landlord the termination payment simultaneously with the giving of such termination notice. |
(5) | At origination, Sotheby’s had 10 months of free rent, occurring from December 2019 to September 2020, totalling $2,883,263. Spring Mountain Capital had five months of free rent, occurring from May 2020 to September 2020, totalling $551,415. W.P. Global & Ranieri (included in Other Office Tenants) had three months of free rent, occurring from May 2020 to July 2020, totalling $182,304. Celine had three months of free rent, which occurred from December 2019 to February 2020, totalling $2,000,000. B.A.P.E had eight months of free rent, occurring from December 2019 to July 2020, totalling $737,333. Domenico Vacca has one month of free rent, which occurred in December 2019, totalling $24,000. The total $6.4 million was escrowed at closing. |
(6) | Other Office Tenants Net Rentable Area (SF) includes a 1,196 square-foot property management office with no attributable U/W Base Rent. |
(7) | B.A.P.E. and Domenico Vacca are currently completing the build-out of their respective spaces and are expected to take occupancy in early 2020. |
(8) | Vacant Net Rentable Area (SF) includes 11,575 square feet of office space and 4,178 square feet of retail space. |
THE INFORMATION IN THIS STRUCTURAL AND COLLATERAL TERM SHEET IS NOT COMPLETE AND MAY BE AMENDED PRIOR TO THE TIME OF SALE. THIS TERM SHEET IS NOT AN OFFER TO SELL THESE SECURITIES AND IT IS NOT A SOLICITATION OF AN OFFER TO BUY THESE SECURITIES IN ANY JURISDICTION WHERE THE OFFER OR SALE IS NOT PERMITTED.
139
Mixed Use – Office/Retail | Loan #14 | Cut-off Date Balance: | | $25,000,000 |
650 Madison Avenue | 650 Madison Avenue | Cut-off Date LTV: | | 48.5% |
New York, NY 10022 | | U/W NCF DSCR: | | 2.74x |
| | U/W NOI Debt Yield: | | 10.0% |
The following table presents certain information relating to the lease rollover schedule at the 650 Madison Property:
Lease Expiration Schedule(1)(2)
Year Ending
December 31, | No. of Leases Expiring | Expiring NRSF | % of Total NRSF | Cumulative Expiring NRSF | Cumulative % of Total NRSF | Annual
U/W
Base Rent(3) | % of Total Annual U/W Base Rent(3) | Annual
U/W
Base Rent
PSF(3) |
MTM | 0 | 0 | 0.0% | 0 | 0.0% | 0 | 0.0% | $0.00 |
2020 | 2 | 20,317 | 3.4% | 20,317 | 3.4% | $2,479,060 | 3.3% | $122.02 |
2021 | 2 | 12,888 | 2.1% | 33,205 | 5.5% | $1,538,559 | 2.0% | $119.38 |
2022 | 1 | 3,218 | 0.5% | 36,423 | 6.1% | $353,980 | 0.5% | $110.00 |
2023 | 4 | 114,905 | 19.1% | 151,328 | 25.2% | $15,320,804 | 20.1% | $133.33 |
2024 | 10 | 313,250 | 52.2% | 464,578 | 77.4% | $30,121,123 | 39.5% | $96.16 |
2025 | 1 | 6,341 | 1.1% | 470,919 | 78.4% | $729,215 | 1.0% | $115.00 |
2026 | 2 | 16,755 | 2.8% | 487,674 | 81.2% | $6,971,250 | 9.1% | $416.07 |
2027 | 4 | 30,029 | 5.0% | 517,703 | 86.2% | $3,866,158 | 5.1% | $128.75 |
2028(4) | 1 | 0 | 0.0% | 517,703 | 86.2% | $10,080 | 0.0% | $0.00 |
2029 | 1 | 10,223 | 1.7% | 527,926 | 87.9% | $8,600,017 | 11.3% | $841.24 |
2030 | 4 | 17,768 | 3.0% | 545,694 | 90.9% | $2,744,405 | 3.6% | $154.46 |
Thereafter(5) | 1 | 38,968 | 6.5% | 584,662 | 97.4% | $3,459,915 | 4.5% | $88.79 |
Vacant | 0 | 15,753 | 2.6% | 600,415 | 100.0% | $0 | 0.0% | $0.00 |
Total/Weighted Average | 33 | 600,415 | 100.0% | | | $76,194,567 | 100.0% | $130.32 |
(1) | Information obtained from the underwritten rent roll. |
(2) | Certain tenants may have lease termination options that are exercisable prior to the originally-stated expiration date of the subject lease and that are not considered in the Lease Expiration Schedule. |
(3) | Annual U/W Base Rent includes contractual rent steps through July 2020 for non-investment grade rated tenants and the straight-line average for investment grade rated tenants through the lease term and excludes vacant space. |
(4) | 2028 includes an elevator marketing contract with Captivate LLC with $10,080 of attributable Annual U/W Base Rent, but no attributable square footage. |
(5) | Thereafter includes a property management office that has no attributable underwritten base rent. |
The following table presents historical occupancy percentages at the 650 Madison Property:
Historical Occupancy
12/31/2015(1)(2) | | 12/31/2016(2) | | 12/31/2017(2) | | 12/31/2018(2) | | 10/1/2019(3) |
89.8% | | 94.3% | | 92.6% | | 92.2% | | 97.4% |
(1) | 2015 occupancy was mainly attributable to Crate & Barrel vacating 61,351 square feet of ground level retail and second floor office space. Since then, the borrower sponsors have executed leases with multiple luxury retailers including Celine, Moncler (each utilizing its space as its respective brand’s flagship location) and B.A.P.E. in the ground floor retail space and an institutional tenant, Sotheby’s, in the second floor office space. |
(2) | Information obtained from the borrower. |
(3) | Information obtained from the underwritten rent roll. |
Market Overview and Competition. The 650 Madison Avenue Property occupies a full block along Madison Avenue between East 59th and 60th Streets within the Plaza District office submarket and the Madison Avenue retail submarket. According to a third-party research report, the Plaza District is the largest office submarket by square feet in the country and is bounded by 65th Street to the north, the East River to the east, 47th Street on the south, and Avenue of the Americas on the west. The Madison Avenue retail submarket is located on Madison Avenue between 57th and 72nd Streets. According to the appraisal, Class A office space in the Plaza District had an inventory of approximately 78.2 million square feet of office space, direct asking rents of $99.29 per square foot and a direct vacancy rate of 8.1% as of the third quarter of 2019. According to the appraisal, the 650 Madison Avenue Property is located within the Madison/Fifth Avenue Class A office micro-market. As of the third quarter of 2019, the Madison/Fifth Avenue Class A office micro-market had an inventory of approximately 18.9 million square feet of office space and direct asking rents of $102.23 per square foot. The 650 Madison Avenue Property’s weighted average office underwritten rent per square foot equals $99.21.
THE INFORMATION IN THIS STRUCTURAL AND COLLATERAL TERM SHEET IS NOT COMPLETE AND MAY BE AMENDED PRIOR TO THE TIME OF SALE. THIS TERM SHEET IS NOT AN OFFER TO SELL THESE SECURITIES AND IT IS NOT A SOLICITATION OF AN OFFER TO BUY THESE SECURITIES IN ANY JURISDICTION WHERE THE OFFER OR SALE IS NOT PERMITTED.
140
Mixed Use – Office/Retail | Loan #14 | Cut-off Date Balance: | | $25,000,000 |
650 Madison Avenue | 650 Madison Avenue | Cut-off Date LTV: | | 48.5% |
New York, NY 10022 | | U/W NCF DSCR: | | 2.74x |
| | U/W NOI Debt Yield: | | 10.0% |
The appraiser concluded blended market rents of $108.87 per square foot and $986.96 per square foot for the office and ground level retail space, respectively. Based on the appraisal’s market rents, the 650 Madison Avenue Property’s in place rent is approximately 8.0% below market rent.
Market Rent Analysis (Office) | | Market Rent Analysis (Retail) |
Floors | Rent PSF | | Tenant Category | Rent PSF |
Concourse | $50.00 | | Below Grade | $35.00 |
2 to 7 | $97.00 | | 60th Corner | $1,250.00 |
8 to 10 | $106.00 | | 60th Street | $250.00 |
11 to 15 | $116.00 | | 59th Corner | $1,250.00 |
16 to 18 | $127.00 | | 59th Street | $350.00 |
19 to 22 | $137.00 | | 59th Midblock | $550.00 |
23 to 27 | $147.00 | | Inline | $1,250.00 |
The following table presents certain information relating to comparable office properties to 650 Madison Property:
Comparable Office Leases(1)
Property Name/Location | Year Built | NRA (SF) | Tenant | Lease Size (SF) | Rent PSF(2) | Commencement | Lease Term (Years) | Lease Type |
12 East 49th Street | 1967 | 899,000 | Echo Street Capital | 16,200 | $128.15 | Sep-2019 | 10 | Gross |
535 Madison Avenue | 1981 | 444,293 | AGL Credit Management | 9,493 | $123.12 | Sep-2019 | 5 | Gross |
320 Park Avenue | 1994 | 656,436 | Windrose Health Investors | 8,714 | $92.72 | Aug-2019 | 10 | Gross |
65 East 55th Street | 1986 | 528,552 | Addition Financial | 14,901 | $177.11 | Aug-2019 | 12 | Gross |
660 Madison Avenue | 1958 | 475,893 | Trevi Health Capital | 8,320 | $119.92 | Jul-2019 | 8 | Gross |
450 Park Avenue | 1972 | 247,242 | Nitorum Capital | 10,338 | $93.58 | May-2019 | 10 | Gross |
65 East 55th Street | 1986 | 528,552 | Clear | 10,185 | $115.00 | May-2019 | 11 | Gross |
499 Park Avenue | 1980 | 265,000 | Cornell Capital | 11,606 | $109.50 | Apr-2019 | 6 | Gross |
510 Madison Avenue | 2009 | 350,000 | Stone Ridge Asset Management | 5,575 | $148.75 | Apr-2019 | 5 | Gross |
450 Park Avenue | 1972 | 247,242 | Jones Day | 10,338 | $107.20 | Mar-2019 | 10 | Gross |
(1) | Information obtained from appraisal. |
(2) | Comparable Rent PSF reflects the appraisal net rent PSF and accounts for certain appraisal adjustments. |
Comparable Retail Leases(1)
Property Name/Location | Tenant | Lease Size (SF) | Grade Floor Rent PSF(2) | Average
Rent
PSF(2) | Commencement | Lease Term (Years) | Lease Type |
645 Madison Avenue | Byredo | 1,192 | $1,154.39 | NAP | Sep-2019 | 10 | Gross |
680 Madison Avenue | Missoni | 4,125 | $1,052.62 | $890.07 | Apr-2019 | 15 | Gross |
432 Park Avenue | Amaffi | 4,000 | $429.96 | NAP | Mar-2019 | 10 | Gross |
680 Madison Avenue | Sergio Rossi | 1,200 | $1,150.49 | $874.50 | Jan-2019 | 10 | Gross |
706 Madison Avenue | Hermes | 34,688 | $1,409.78 | $375.44 | Jan-2019 | 20 | Gross |
57 East 57th Street | Zilli | 2,500 | $550.80 | NAP | Nov-2018 | 10 | Gross |
620 Madison Avenue | Balenciaga | 7,600 | $852.53 | $655.34 | Jul-2018 | 15 | Gross |
655 Madison Avenue | Schutz | 1,656 | $1,309.16 | $945.03 | Jul-2018 | 10 | Gross |
611 Madison Avenue | Deciem | 400 | $1,160.44 | NAP | Jan-2018 | 10 | Gross |
680 Madison Avenue | Ralph & Russo | 5,950 | $1,136.27 | $545.97 | Jan-2018 | 15 | Gross |
(2) | Comparable Average Rent PSF reflects the appraisal net rent PSF and accounts for certain appraisal adjustments. |
THE INFORMATION IN THIS STRUCTURAL AND COLLATERAL TERM SHEET IS NOT COMPLETE AND MAY BE AMENDED PRIOR TO THE TIME OF SALE. THIS TERM SHEET IS NOT AN OFFER TO SELL THESE SECURITIES AND IT IS NOT A SOLICITATION OF AN OFFER TO BUY THESE SECURITIES IN ANY JURISDICTION WHERE THE OFFER OR SALE IS NOT PERMITTED.
141
Mixed Use – Office/Retail | Loan #14 | Cut-off Date Balance: | | $25,000,000 |
650 Madison Avenue | 650 Madison Avenue | Cut-off Date LTV: | | 48.5% |
New York, NY 10022 | | U/W NCF DSCR: | | 2.74x |
| | U/W NOI Debt Yield: | | 10.0% |
Operating History and Underwritten Net Cash Flow. The following table presents certain information relating to the historical Operating History and Underwritten Net Cash Flow. The following table presents certain information relating to the historical operating performance and underwritten net cash flow at the 650 Madison Property:
Cash Flow Analysis
| | 2016 | | 2017 | | 2018 | | TTM 9/30/2019(1) | | U/W(1) | | %(2) | | U/W $ per SF | |
Base Rent | | $60,021,833 | | $65,301,771 | | $65,936,214 | | $68,490,075 | | $74,787,979 | | 82.5% | | $124.56 | |
Contractual Rent Steps(3) | | 0 | | 0 | | 0 | | 0 | | 1,406,588 | | 1.6 | | 2.34 | |
Grossed Up Vacant Space | | 0 | | 0 | | 0 | | 0 | | 3,327,410 | | 3.7 | | 5.54 | |
Gross Potential Rent | | $60,021,833 | | $65,301,771 | | $65,936,214 | | $68,490,075 | | $79,521,977 | | 87.7% | | $132.45 | |
Other Income | | 222,390 | | 265,643 | | 319,055 | | 362,098 | | 371,407 | | 0.4 | | 0.62 | |
Total Recoveries | | 7,020,651 | | 7,750,395 | | 8,784,226 | | 9,361,042 | | 10,762,016 | | 11.9 | | 17.92 | |
Net Rental Income | | $67,264,874 | | $73,317,809 | | $75,039,495 | | $78,213,215 | | $90,655,399 | | 100.0% | | $150.99 | |
(Vacancy & Credit Loss) | | (86,339) | | (829,105) | | 0 | | 75,003 | | (3,327,410)(4) | | (3.7) | | (5.54) | |
Effective Gross Income | | $67,178,535 | | $72,488,704 | | $75,039,495 | | $78,288,218 | | $87,327,989 | | 96.3% | | $145.45 | |
| | | | | | | | | | | | | | | |
Real Estate Taxes | | 15,935,782 | | 16,699,910 | | 17,606,496 | | 18,301,078 | | 19,659,925 | | 22.5 | | 32.74 | |
Insurance | | 396,387 | | 393,355 | | 378,835 | | 380,309 | | 382,942 | | 0.4 | | 0.64 | |
Management Fee | | 1,117,542 | | 1,475,379 | | 1,413,137 | | 1,402,802 | | 873,280 | | 1.0 | | 1.45 | |
Other Operating Expenses | | 7,027,630 | | 7,378,714 | | 7,083,531 | | 7,242,492 | | 7,985,348 | | 9.1 | | 13.30 | |
Total Operating Expenses | | $24,477,341 | | $25,947,358 | | $26,481,999 | | $27,326,681 | | $28,901,495 | | 33.1% | | $48.14 | |
| | | | | | | | | | | | | | | |
Net Operating Income | | $42,701,194 | | $46,541,346 | | $48,557,496 | | $50,961,537 | | $58,426,495 | | 66.9% | | $97.31 | |
Replacement Reserves | | 0 | | 0 | | 0 | | 0 | | 150,104 | | 0.2 | | 0.25 | |
TI/LC | | 0 | | 0 | | 0 | | 0 | | 1,500,000 | | 1.7 | | 2.50 | |
Net Cash Flow | | $42,701,194 | | $46,541,346 | | $48,557,496 | | $50,961,537 | | $56,776,391 | | 65.0% | | $94.56 | |
| | | | | | | | | | | | | | | |
NOI DSCR | | 2.06x | | 2.24x | | 2.34x | | 2.46x | | 2.82x | | | | | |
NCF DSCR | | 2.06x | | 2.24x | | 2.34x | | 2.46x | | 2.74x | | | | | |
NOI Debt Yield | | 7.3% | | 7.9% | | 8.3% | | 8.7% | | 10.0% | | | | | |
NCF Debt Yield | | 7.3% | | 7.9% | | 8.3% | | 8.7% | | 9.7% | | | | | |
(1) | The increase in Base Rent from TTM 9/30/2019 to U/W is primarily attributable to the signing of six new leases since December 2018. For the avoidance of doubt, no COVID-19 specific adjustments have been incorporated in the lender U/W. |
(2) | Represents (i) percent of Net Rental Income for all revenue fields and for Vacancy & Credit Loss and (ii) percent of Effective Gross Income for all other fields. |
(3) | Contractual Rent Steps includes contractual rent steps through July 2020 for non-investment grade rated tenants and the straight-line average for investment grade rated tenants through the lease term. |
(4) | The underwritten economic vacancy is 3.7%. The 650 Madison Property was 97.4% physically occupied as of October 1, 2019. |
THE INFORMATION IN THIS STRUCTURAL AND COLLATERAL TERM SHEET IS NOT COMPLETE AND MAY BE AMENDED PRIOR TO THE TIME OF SALE. THIS TERM SHEET IS NOT AN OFFER TO SELL THESE SECURITIES AND IT IS NOT A SOLICITATION OF AN OFFER TO BUY THESE SECURITIES IN ANY JURISDICTION WHERE THE OFFER OR SALE IS NOT PERMITTED.
142
No. 15 – Lafayette Gardens |
|
Mortgage Loan Information | | Mortgaged Property Information |
Mortgage Loan Seller: | UBS AG | | Single Asset/Portfolio: | Single Asset |
Credit Assessment (Fitch/KBRA/Moody’s): | NR/NR/NR | | Property Type – Subtype: | Multifamily – Garden |
Original Principal Balance: | $22,000,000 | | Location: | Lafayette, LA |
Cut-off Date Balance: | $22,000,000 | | Size: | 240 Units |
% of Initial Pool Balance: | 3.0% | | Cut-off Date Balance Per Unit: | $91,667 |
Loan Purpose: | Refinance | | Maturity Date Balance Per Unit: | $91,667 |
Borrower Sponsor: | Glenn R. Stewart | | Year Built/Renovated: | 2008/NAP |
Guarantor: | Glenn R. Stewart | | Title Vesting: | Fee |
Mortgage Rate: | 3.9810% | | Property Manager: | Self-managed |
Note Date: | January 10, 2020 | | Current Occupancy (As of)(2): | 89.2% (4/27/2020) |
Seasoning: | 5 months | | YE 2019 Occupancy(3): | 90.8% |
Maturity Date: | January 6, 2030 | | YE 2018 Occupancy: | 93.9% |
IO Period: | 120 months | | YE 2017 Occupancy: | 88.2% |
Loan Term (Original): | 120 months | | YE 2016 Occupancy: | 91.0% |
Amortization Term (Original): | NAP | | Appraised Value(1): | $33,800,000 |
Loan Amortization Type: | Interest-only, Balloon | | Appraised Value Per Unit(1): | $140,833 |
Call Protection: | L(29),D(87),O(4) | | Appraisal Valuation Date: | November 11, 2019 |
| | | | | |
Lockbox Type: | Springing | | Underwriting and Financial Information |
Additional Debt: | None | | TTM NOI (3/31/2020): | $1,855,332 |
Additional Debt Type (Balance): | NAP | | TTM NOI (11/30/2019): | $1,930,488 |
| | | YE 2018 NOI: | $2,015,927 |
| | | YE 2017 NOI: | $1,935,883 |
| | | U/W Revenues: | $3,240,494 |
Escrows and Reserves | | U/W Expenses: | $1,234,186 |
| Initial | Monthly | Cap | | U/W NOI: | $2,006,308 |
Taxes | $40,229 | $25,143 | NAP | | U/W NCF: | $1,946,308 |
Insurance | $79,694 | $9,267 | NAP | | U/W DSCR based on NOI/NCF: | 2.26x / 2.19x |
Replacement Reserve | $0 | $6,300 | $226,800 | | U/W Debt Yield based on NOI/NCF: | 9.1% / 8.8% |
| | | | | U/W Debt Yield at Maturity based on NOI/NCF: | 9.1% / 8.8% |
| | | | | Cut-off Date LTV Ratio(1): | 65.1% |
| | | | | LTV Ratio at Maturity(1): | 65.1% |
| | | | | | |
| | | | | | | |
Sources and Uses |
Sources | | | | | Uses | | | |
Original loan amount | $22,000,000 | | 100.0% | | Loan payoff | $18,620,116 | | 84.6% |
| | | | | Closing costs | 402,041 | | 1.8 |
| | | | | Upfront reserves | 119,923 | | 0.5 |
| | | | | Return of equity | 2,857,920 | | 13.0 |
Total Sources | $22,000,000 | | 100.0% | | Total Uses | $22,000,000 | | 100.0% |
(1) | The appraised value, was determined prior to the emergence of the novel coronavirus pandemic, and the economic disruption resulting from measures to combat the pandemic, and all LTV metrics were calculated based on such prior information. See “Risk Factors—Coronavirus Pandemic Has Adversely Affected the Global Economy and Will Likely Adversely Affect the Performance of the Mortgage Loans” in the Preliminary Prospectus. |
(2) | Current Occupancy includes 11 units (4.7% of underwritten base rent) that are leased, but not yet occupied or paying rent due to COVID-19. Excluding the 11 units, the Lafayette Gardens Property (as defined below) was 84.6% occupied as of such date. |
(3) | YE 2019 Occupancy is as of December 16, 2019. |
The Mortgage Loan. The mortgage loan (the “Lafayette Gardens Mortgage Loan”) is evidenced by a promissory note secured by a first priority mortgage encumbering the fee interest in a 240-unit, garden-style multifamily complex located in Lafayette, Louisiana (the “Lafayette Gardens Property”).
COVID-19 Update. As of the May 2020 payment, the residential portion of the Lafayette Gardens Property was open and operating, however, the fitness center, swimming pool and common areas have been closed due to the state of Louisiana’s stay at home order. As of the date hereof, 93.7% of rent for occupied units had been collected for the month of April 2020. Given the collection and reporting timing, the related borrower is unable to determine the percentage of rent for occupied units that has been collected for the month of May 2020. The May debt service payment for the Lafayette Gardens Mortgage Loan has been made by the related borrower. As of the date hereof, the Lafayette Gardens Mortgage Loan is not subject to any modification or forbearance request.
THE INFORMATION IN THIS STRUCTURAL AND COLLATERAL TERM SHEET IS NOT COMPLETE AND MAY BE AMENDED PRIOR TO THE TIME OF SALE. THIS TERM SHEET IS NOT AN OFFER TO SELL THESE SECURITIES AND IT IS NOT A SOLICITATION OF AN OFFER TO BUY THESE SECURITIES IN ANY JURISDICTION WHERE THE OFFER OR SALE IS NOT PERMITTED.
143
Multifamily – Garden 110 East Martial Avenue Lafayette, LA 70508 | Loan #15 Lafayette Gardens | Cut-off Date Balance: Cut-off Date LTV: U/W NCF DSCR: U/W NOI Debt Yield: | | $22,000,000 65.1% 2.19x 9.1% |
The Property. The Lafayette Gardens Property is a 240-unit, garden-style multifamily complex located in Lafayette, Louisiana. Built in 2008, the Lafayette Gardens Property is comprised of eight three-story apartment buildings, one single-story clubhouse, one single-story car care/maintenance building, and five single-story detached garage buildings on 16.2 acres. The Lafayette Gardens Property provides for 421 parking spaces (1.8 spaces per unit).
As of April 27, 2020, the Lafayette Gardens Property was 89.2% occupied, inclusive of 11 units leased, but not yet occupied or paying rent due to COVID-19, with a weighted average asking rent of $1,390 per unit per month. Excluding the 11 leased but not occupied units (which represent 4.7% of underwritten base rent), the Lafayette Gardens Property was 84.6% occupied. The unit mix is comprised of 60 one-bedroom units (25.0% of total units), 132 two-bedroom units (55.0% of total units), and 48 three bedroom units (20.0% of total units), totaling 250,824 square feet of net rentable space. The underwritten rent roll includes 11 furnished units (4.6% of total units), seven of which are currently leased to corporate tenants. Approximately 74 standard unfurnished units at the Lafayette Gardens Property are leased to corporate tenants such as University Hospital Clinics Inc., Lafayette General Medical Center, and Texican. The leases for the standard unfurnished units to corporate tenants generate rental rate premiums of 31.3%, 16.0% and 25.6% above the leases for standard one-bedroom, two-bedroom, and three-bedroom units at the Lafayette Gardens Property, respectively, but also require expenses that are approximately 18.2% higher than expenses for comparable units leased to conventional tenants. According to the borrower sponsor, the Lafayette Gardens Property had an average of 54 active corporate leases per month in 2017, 61 active corporate leases per month in 2018 and 61 active corporate leases per month as of January 2019 through November 2019.
The Lafayette Gardens Property was developed by the borrower sponsor in 2008 for approximately $26.6 million ($110,722 per unit). Including periodic capital improvements to the units and the Lafayette Gardens Property grounds and other soft costs, the borrower sponsor has a total cost basis of $28.2 million ($117,343 per unit). Amenities at the Lafayette Gardens Property include electronically controlled gated access, car care center, beach-front style swimming pool, two pet parks, barbecue/picnic area, basketball court, playground, detached garages and storage units. The Lafayette Gardens Property also features a clubhouse/on-site leasing office along with a coffee bar, 24-hour fitness center, business center, two individual tanning beds, and movie theatre. Additionally, the Lafayette Gardens Property offers 24-hour emergency maintenance.
Unit interiors feature full-sized stainless-steel appliances including a dishwasher, full-size washer/dryer, laminate countertops in the kitchen and bathrooms, wood cabinetry, intrusion alarm, garbage disposal, ceiling fans, walk-in closets, over-sized garden tub/shower, 8” decorative crown molding, and a private patio/balcony. Kitchens, bathrooms and laundry rooms feature ceramic tile flooring. Third floor units also feature vaulted ceilings. Each unit is sub-metered for electrical usage.
The following table presents certain information relating to the unit mix of the Lafayette Gardens Property:
Unit Mix Summary(1)
Unit Type | Total No.
of Units | % of Total
Units | Occupied
Units | Occ. % | Average
Unit Size
(SF) | Total Size
(SF) | Average
Asking
Monthly Rent per Unit(2) | Average
Asking
Monthly Rent PSF(2) |
1 BR/1 BA | 59 | 24.6% | 55 | 93.2% | 846 | 49,914 | $1,171 | $1.38 |
1 BR/1 BA - Corporate Furnished | 1 | 0.4% | 1 | 100.0% | 846 | 846 | $1,300 | $1.54 |
2 BR/2 BA(3) | 124 | 51.7% | 114 | 91.9% | 1,052 | 130,448 | $1,333 | $1.27 |
2 BR/2 BA - Corporate Furnished | 8 | 3.3% | 5 | 62.5% | 1,052 | 8,416 | $2,338 | $2.22 |
3 BR/2 BA(3) | 46 | 19.2% | 38 | 82.6% | 1,275 | 58,650 | $1,610 | $1.26 |
3 BR/2 BA - Corporate Furnished | 2 | 0.8% | 1 | 50.0% | 1,275 | 2,550 | $2,550 | $2.00 |
Total/Weighted Average | 240 | 100.0% | 214 | 89.2% | 1,045 | 250,824 | $1,390 | $1.33 |
(1) | Information obtained from the underwritten rent roll. |
(2) | Average Asking Monthly Rent per Unit and Average Asking Monthly Rent PSF includes vacant gross up at appraisal-concluded market rent. |
(3) | Includes four employee units and one model unit, which are underwritten as occupied. |
THE INFORMATION IN THIS STRUCTURAL AND COLLATERAL TERM SHEET IS NOT COMPLETE AND MAY BE AMENDED PRIOR TO THE TIME OF SALE. THIS TERM SHEET IS NOT AN OFFER TO SELL THESE SECURITIES AND IT IS NOT A SOLICITATION OF AN OFFER TO BUY THESE SECURITIES IN ANY JURISDICTION WHERE THE OFFER OR SALE IS NOT PERMITTED.
144
Multifamily – Garden 110 East Martial Avenue Lafayette, LA 70508 | Loan #15 Lafayette Gardens | Cut-off Date Balance: Cut-off Date LTV: U/W NCF DSCR: U/W NOI Debt Yield: | | $22,000,000 65.1% 2.19x 9.1% |
The following table presents historical occupancy percentages at the Lafayette Gardens Property:
Historical Occupancy
12/31/2011(1) | 12/31/2012(1) | 12/31/2013(1) | 12/31/2014(1) | 12/31/2015(1) | 12/31/2016(1) | 12/31/2017(1) | 12/31/2018(1) | 12/16/2019(1) | 4/27/2020(2) |
| 92.6% | 95.2% | 93.4% | 94.8% | 93.3% | 91.0% | 88.2% | 93.9% | 90.8% | 89.2% |
(1) | Information obtained from the borrower. |
(2) | Information obtained from the underwritten rent roll dated April 27, 2020. Includes 11 units that are leased, but not yet occupied or paying rent due to COVID-19. Excluding those 11 units, the Lafayette Gardens Property was 84.6% occupied. |
Operating History and Underwritten Net Cash Flow. The following table presents certain information relating to the historical operating performance and underwritten net cash flow at the Lafayette Gardens Property:
Cash Flow Analysis
| 2016 | | 2017 | | 2018 | | TTM 11/30/2019 | | TTM 3/31/2020 | | U/W(1)(2) | | %(3) | | U/W $ per Unit |
Base Rent(4) | $3,129,705 | | $2,978,658 | | $3,094,697 | | $2,999,652 | | $2,970,530 | | $3,541,872 | | 86.2% | | $14,758 |
Grossed Up Vacant Space | 0 | | 0 | | 0 | | 0 | | 0 | | 459,960 | | 11.2 | | 1,917 |
Gross Potential Rent | $3,129,705 | | $2,978,658 | | $3,094,697 | | $2,999,652 | | $2,970,530 | | $4,001,832 | | 97.4% | | $16,674 |
Other Rental Income | 14,332 | | 11,417 | | 7,934 | | 13,642 | | 10,375 | | 10,375 | | 0.3 | | 43 |
Other Income(5) | 96,535 | | 129,377 | | 108,433 | | 97,502 | | 98,083 | | 98,083 | | 2.4 | | 409 |
Net Rental Income | $3,240,571 | | $3,119,452 | | $3,211,064 | | $3,110,796 | | $3,078,988 | | $4,110,290 | | 100.0% | | $17,126 |
(Vacancy) | 0 | | 0 | | 0 | | 0 | | 0 | | (533,370)(6) | | (13.3) | | (2,222) |
(Concessions & Credit Loss)(7) | 0 | | 0 | | 0 | | 0 | | 0 | | (336,426) | | (8.4) | | (1,402) |
Effective Gross Income | $3,240,571 | | $3,119,452 | | $3,211,064 | | $3,110,796 | | $3,078,988 | | $3,240,494 | | 78.8% | | $13,502 |
| | | | | | | | | | | | | | | |
Real Estate Taxes | 318,605 | | 306,440 | | 273,280 | | 273,280 | | 301,720 | | 301,720 | | 9.3 | | 1,257 |
Insurance | 100,476 | | 97,469 | | 94,787 | | 96,220 | | 96,221 | | 111,201 | | 3.4 | | 463 |
Management Fee | 97,614 | | 92,894 | | 95,643 | | 92,820 | | 101,665 | | 97,215 | | 3.0 | | 405 |
Other Operating Expenses | 710,801 | | 686,766 | | 731,428 | | 717,988 | | 724,051 | | 724,051 | | 22.3 | | 3,017 |
Total Operating Expenses | $1,227,495 | | $1,183,570 | | $1,195,138 | | $1,180,308 | | $1,223,656 | | $1,234,186 | | 38.1% | | $5,142 |
| | | | | | | | | | | | | | | |
Net Operating Income | $2,013,076 | | $1,935,883 | | $2,015,927 | | $1,930,488 | | $1,855,332 | | $2,006,308 | | 61.9% | | $8,360 |
Capital Expenditures | 0 | | 0 | | 0 | | 0 | | 0 | | 60,000 | | 1.9 | | 250 |
Net Cash Flow | $2,013,076 | | $1,935,883 | | $2,015,927 | | $1,930,488 | | $1,855,332 | | $1,946,308 | | 60.1% | | $8,110 |
| | | | | | | | | | | | | | | |
NOI DSCR | 2.27x | | 2.18x | | 2.27x | | 2.17x | | 2.09x | | 2.26x | | | | |
NCF DSCR | 2.27x | | 2.18x | | 2.27x | | 2.17x | | 2.09x | | 2.19x | | | | |
NOI Debt Yield | 9.2% | | 8.8% | | 9.2% | | 8.8% | | 8.4% | | 9.1% | | | | |
NCF Debt Yield | 9.2% | | 8.8% | | 9.2% | | 8.8% | | 8.4% | | 8.8% | | | | |
| (1) | The standard unfurnished units leased to corporate tenants generate rental rate premiums over units leased to non-corporate tenants. However, such unfurnished units leased to corporate tenants require expenses that are approximately 18.2% higher than expenses for comparable units leased to conventional tenants. If the current standard unfurnished units leased to corporate tenants were leased to conventional tenants at the appraisal’s market rent and expenses related to these corporate tenants were removed, UW NCF would be $1,855,604, or 4.7% below the UW NCF above. |
| (2) | For the avoidance of doubt, no COVID-19 specific adjustments have been incorporated in the lender U/W. |
| (3) | Represents (i) percent of Net Rental Income for all revenue fields, (ii) percent of Gross Potential Rent for Vacancy and Concessions & Credit Loss and (iii) percent of Effective Gross Income for all other fields. |
| (4) | U/W Base Rent includes income from 11 leases (4.7% of U/W Base Rent) that are signed but the units are not yet occupied or paying rent due to COVID-19 as of the April 27, 2020 rent roll. |
| (5) | Other Income primarily includes miscellaneous income generated from application fees, clubhouse/movie rentals, garage/storage fees, late fees, lease cancellation/buy out fees, pet fees, resident fees, vending commissions and transfer fees. |
| (6) | The underwritten economic vacancy is 21.7%. The Lafayette Gardens Property was 89.2% leased as of April 27, 2020, inclusive of 11 units leased, but not yet occupied or paying rent due to COVID-19. Excluding the 11 units, the Lafayette Gardens Property was 84.6% occupied. |
| (7) | U/W Concessions include four employee units underwritten to the appraisal concluded market rents. |
Market Overview and Competition. The Lafayette Gardens Property is located in the southern portion of Lafayette, Louisiana, approximately 5.6 miles north of the Lafayette central business district and 5.0 miles north of the Lafayette Regional Airport. Access to the Lafayette Gardens Property is provided by Interstate 10 (7.9 miles north), US Highway 90 (3.8 miles east), and US Highway 167 (3.2 miles west). The primary industries in Lafayette include manufacturing, healthcare, and oil and gas. According to the appraisal, the primary industries in the local market of the Lafayette Gardens Property are services and retail trade. Major employers in the Lafayette area include Lafayette General Medical Center, Wood Group Production Services, and University of Louisiana at Lafayette.
THE INFORMATION IN THIS STRUCTURAL AND COLLATERAL TERM SHEET IS NOT COMPLETE AND MAY BE AMENDED PRIOR TO THE TIME OF SALE. THIS TERM SHEET IS NOT AN OFFER TO SELL THESE SECURITIES AND IT IS NOT A SOLICITATION OF AN OFFER TO BUY THESE SECURITIES IN ANY JURISDICTION WHERE THE OFFER OR SALE IS NOT PERMITTED.
145
Multifamily – Garden 110 East Martial Avenue Lafayette, LA 70508 | Loan #15 Lafayette Gardens | Cut-off Date Balance: Cut-off Date LTV: U/W NCF DSCR: U/W NOI Debt Yield: | | $22,000,000 65.1% 2.19x 9.1% |
According to a third-party market research report, the 2019 average household income within a one-, three- and five-mile radius of the Lafayette Gardens Property was $106,202, $96,924 and $84,528, respectively. The 2019 estimated populations within a one-, three- and five-mile radius of the Lafayette Gardens Property were 7,870, 64,276 and 141,105, respectively.
According to a third-party market research report, the Lafayette Gardens Property is located in the Lafayette multifamily market. As of October 2019, the Lafayette multifamily market had inventory of 14,107 units with a reported vacancy of 8.8%, reflecting a decrease from the year-end 2018 vacancy of 10.1%. The market reported effective monthly rent of $820 per unit. Over the last ten years, the Lafayette Gardens Property average occupancy of 92.3% has outperformed the average market occupancy of 91.9% over the same period, according to a third-party market research report.
According to a third-party market research report, the Lafayette Gardens Property is located within the Central Lafayette Parish submarket. As of October 2019, the submarket contained 10,485 units with a reported vacancy rate of 8.7% and effective monthly rent of $842 per unit. According to the appraisal, there has not been any new multifamily development in the Central Lafayette Parish submarket over the past two years. As of October 2019, there is one 24-unit building under construction in the submarket.
The following tables present certain information relating to comparable multifamily properties for the Lafayette Gardens Property:
One-Bedroom Comparable Rental Properties(1)
Property | Distance to
Subject | Year
Built/Renovated | Units | Average Unit
Size (SF) | Asking
Monthly Rent
per Unit(2) | Asking
Monthly Rent
PSF(2) |
Lafayette Gardens | – | 2008/NAP | 59 | 846 | $1,171 | $1.38 |
Lafayette Gardens (Corporate Unit) | – | 2008/NAP | 1 | 846 | $1,300 | $1.54 |
Audubon Lake | 1.6 miles | 2003/NAP | 96 | 734 | $925 | $1.26 |
Ansley Walk | 3.1 miles | 2008/NAP | 98 | 723 | $880 | $1.22 |
Chateau Mirage | 4.7 miles | 2011/NAP | 117 | 782 | $1,039 | $1.33 |
Elora Place | 2.5 miles | 2008/2019 | 78 | 895 | $863 | $0.96 |
Total/Weighted Average(3) | | | 389 | 778 | $935 | $1.21 |
(1) | Information obtained from the appraisal and underwritten rent roll. |
(2) | Includes gross up of vacant units. |
(3) | Total/Weighted Average excludes the Lafayette Gardens Property. |
Two-Bedroom Comparable Rental Properties(1)
Property | Distance to
Subject | Year
Built/Renovated | Units | Average Unit
Size (SF) | Asking
Monthly Rent
per Unit(2) | Asking
Monthly Rent
PSF(2) |
Lafayette Gardens | – | 2008/NAP | 124 | 1,052 | $1,333 | $1.27 |
Lafayette Gardens (Corporate Unit) | – | 2008/NAP | 8 | 1,052 | $2,338 | $2.22 |
Audubon Lake | 1.6 miles | 2003/NAP | 96 | 1,072 | $1,002 | $0.93 |
Ansley Walk | 3.1 miles | 2008/NAP | 120 | 1,092 | $949 | $0.87 |
Chateau Mirage | 4.7 miles | 2011/NAP | 98 | 1,254 | $1,305 | $1.04 |
Elora Place | 2.5 miles | 2008/2019 | 109 | 1,206 | $997 | $0.83 |
Total/Weighted Average(3) | | | 423 | 1,154 | $1,056 | $0.91 |
(1) | Information obtained from the appraisal and underwritten rent roll. |
(2) | Includes gross up of vacant units. |
(3) | Total/Weighted Average excludes the Lafayette Gardens Property. |
Three-Bedroom Comparable Rental Properties(1)
Property | Distance to
Subject | Year
Built/Renovated | Units | Average Unit
Size (SF) | Asking
Monthly Rent
per Unit(2) | Asking
Monthly Rent
PSF(2) |
Lafayette Gardens | – | 2008/NAP | 46 | 1,275 | $1,610 | $1.26 |
Lafayette Gardens (Corporate Unit) | – | 2008/NAP | 2 | 1,275 | $2,550 | $2.00 |
Audubon Lake | 1.6 miles | 2003/NAP | 16 | 1,206 | $1,292 | $1.07 |
Ansley Walk | 3.1 miles | 2008/NAP | 24 | 1,314 | $1,131 | $0.86 |
Chateau Mirage | 4.7 miles | 2011/NAP | 65 | 1,452 | $1,527 | $1.05 |
Elora Place | 2.5 miles | 2008/2019 | 79 | 1,402 | $1,244 | $0.89 |
Total/Weighted Average(3) | | | 184 | 1,391 | $1,333 | $0.96 |
(1) | Information obtained from the appraisal and underwritten rent roll. |
(2) | Includes gross up of vacant units. |
(3) | Total/Weighted Average excludes the Lafayette Gardens Property. |
THE INFORMATION IN THIS STRUCTURAL AND COLLATERAL TERM SHEET IS NOT COMPLETE AND MAY BE AMENDED PRIOR TO THE TIME OF SALE. THIS TERM SHEET IS NOT AN OFFER TO SELL THESE SECURITIES AND IT IS NOT A SOLICITATION OF AN OFFER TO BUY THESE SECURITIES IN ANY JURISDICTION WHERE THE OFFER OR SALE IS NOT PERMITTED.
146
No. 16 –HPE Campus |
|
Mortgage Loan Information | | Mortgaged Property Information |
Mortgage Loan Seller: | Argentic Real Estate Finance LLC | | Single Asset/Portfolio: | Single Asset |
Credit Assessment (Fitch/KBRA/Moody’s): | NR/NR/NR | | Property Type – Subtype: | Office – Suburban |
Original Principal Balance(1): | $20,000,000 | | Location: | Roseville, CA |
Cut-off Date Balance(1): | $20,000,000 | | Size: | 447,364 SF |
% of Initial Pool Balance: | 2.7% | | Cut-off Date Balance Per SF(1): | $149.25 |
Loan Purpose: | Acquisition | | Maturity Date Balance Per SF(1): | $149.25 |
Borrower Sponsors: | John Gaghan; Waleed Mohammed; Abdullah Alwehaib | | Year Built/Renovated: | 1981/2019 |
Guarantors: | Apex Capital Investments Corporation | | Title Vesting: | Fee |
Mortgage Rate: | 3.5400% | | Property Manager: | G&E Real Estate Management Services, Inc. |
Note Date: | February 21, 2020 | | Current Occupancy (As of): | 100.0% (6/1/2020) |
Seasoning: | 3 months | | YE 2019 Occupancy(3): | NAV |
Maturity Date: | March 6, 2030 | | YE 2018 Occupancy(3): | NAV |
IO Period: | 120 months | | YE 2017 Occupancy(3): | NAV |
Loan Term (Original): | 120 months | | Appraised Value: | $103,000,000 |
Amortization Term (Original): | NAP | | Appraised Value Per SF: | $230.24 |
Loan Amortization Type: | Interest-only, Balloon | | Appraisal Valuation Date: | January 23, 2020 |
Call Protection: | L(27),D(89),O(4) | | | |
| | | | | |
Lockbox Type(2): | Hard/Springing Cash Management | | Underwriting and Financial Information |
Additional Debt(1): | Yes | | TTM NOI(3): | NAV |
Additional Debt Type (Balance)(1): | Pari Passu ($46,770,000) | | YE 2018 NOI(3): | NAV |
| | | YE 2017 NOI(3): | NAV |
| | | YE 2016 NOI(3): | NAV |
| | | U/W Revenues: | $9,694,440 |
| | | U/W Expenses: | $3,104,706 |
Escrows and Reserves | | U/W NOI: | $6,589,734 |
| Initial | Monthly | Cap | | U/W NCF: | $6,500,261 |
Taxes | $0 | Springing(4) | NAP | | U/W DSCR based on NOI/NCF(1): | 2.75x / 2.71x |
Insurance | $0 | Springing(5) | NAP | | U/W Debt Yield based on NOI/NCF(1): | 9.9% / 9.7% |
Replacement Reserve | $0 | $7,456 | $268,419 | | U/W Debt Yield at Maturity based on NOI/NCF(1): | 9.9% / 9.7% |
TI/LC Reserve | $0 | Springing(6) | NAP | | Cut-off Date LTV Ratio(1): | 64.8% |
Common Charges Reserve | $0 | Springing(7) | NAP | | LTV Ratio at Maturity(1): | 64.8% |
| | | | | | |
| | | | | | | |
Sources and Uses |
Sources | | | | | Uses | | | |
Original Whole Loan amount | $66,770,000 | | 63.6% | | Purchase Price | $101,300,000 | | 96.5% |
Sponsor Contribution | $38,237,086 | | 36.4 | | Closing Cost | 3,707,086 | | 3.5 |
Total Sources | $105,007,086 | | 100.0% | | Total Uses | $105,007,086 | | 100.0% |
(1) | The HPE Campus Mortgage Loan (as defined below) is part of the HPE Campus Whole Loan (as defined below), which is comprised of four pari passu notes with an aggregate original principal balance of $66,770,000. All statistical information related to the Cut-off Date Balance per SF, Maturity Date Balance per SF, U/W Debt Yield based on NOI/NCF, U/W Debt Yield at Maturity based on NOI/NCF, U/W DSCR based on NOI/NCF, Cut-off Date LTV Ratio and LTV Ratio at Maturity is based on the HPE Campus Whole Loan. Notwithstanding the foregoing, all NOI, NCF and occupancy information, as well as the appraised value, were determined prior to the emergence of the novel coronavirus pandemic, and the economic disruption resulting from measures to combat the pandemic, and all DSCR, LTV and Debt Yield metrics were calculated, and the HPE Campus Mortgage Loan was underwritten, based on such prior information. See “Risk Factors—Coronavirus Pandemic Has Adversely Affected the Global Economy and Will Likely Adversely Affect the Performance of the Mortgage Loans” in the Preliminary Prospectus. |
(2) | A Cash Management Period will commence upon the earlier of the following: (i) the occurrence and continuance of an event of default; (ii) the NOI DSCR falling below 1.40x at the end of any calendar quarter; (iii) the commencement of a Lease Sweep Period. A “Lease Sweep Period” will commence upon the occurrence of the following, among others: (a) the payment date occurring in January 2028; (b) HPE (as defined below) or a replacement tenant (“Major Tenant”) discontinues its business at 25% or more of its premises (i.e., “goes dark”), gives written notice that it intends to do the foregoing, or it otherwise becomes public information that it intends to do the foregoing; (c) the credit rating of Major Tenant or major tenant guarantor being downgraded below BBB- by S&P (or its functional equivalent by any other Rating Agency); and (d) the credit rating of Major Tenant or major tenant guarantor being downgraded below BB+ by S&P (or its functional equivalent by any other Rating Agency). With respect to a Lease Sweep Period caused by a matter described in clause (c) above, the Lease Sweep Period will end following the 18th payment date following the commencement of such Lease Sweep Period. |
(3) | Historical cash flows and occupancy figures are not available as the transaction is an acquisition. |
THE INFORMATION IN THIS STRUCTURAL AND COLLATERAL TERM SHEET IS NOT COMPLETE AND MAY BE AMENDED PRIOR TO THE TIME OF SALE. THIS TERM SHEET IS NOT AN OFFER TO SELL THESE SECURITIES AND IT IS NOT A SOLICITATION OF AN OFFER TO BUY THESE SECURITIES IN ANY JURISDICTION WHERE THE OFFER OR SALE IS NOT PERMITTED.
147
| Office – Suburban | Loan #16 | Cut-off Date Balance: | | $20,000,000 |
| 8000-8050 Foothills Boulevard | HPE Campus | Cut-off Date LTV: | | 64.8% |
| Roseville, CA 95747 | | U/W NCF DSCR: | | 2.71x |
| | | U/W NOI Debt Yield: | | 9.9% |
(4) | The HPE Campus Mortgage Loan documents require ongoing monthly real estate tax reserves in an amount equal to 1/12 of the real estate taxes that the lender estimates will be payable during the next twelve months (initially $52,051) subject to the Tax Escrow Waiver Requirements (as defined in the HPE Campus Mortgage Loan documents). |
(5) | The HPE Campus Mortgage Loan documents require ongoing monthly insurance reserves in an amount equal to 1/12 of the insurance premiums that the lender estimates will be payable during the next twelve months (initially $6,033) subject to the Insurance Escrow Waiver Requirements as defined in the HPE Campus Mortgage Loan documents. |
(6) | Springing upon the occurrence of any of the following: (i) an event of default; (ii) the DSCR falls below 1.40x at the end of any calendar quarter; (iii) a Lease Sweep Period (as defined in the HPE Campus Mortgage Loan documents); or (iv) from and after the payment date occurring in April 2025 until the maturity date, the borrower will be required to pay to the lender an amount initially equal to 1/12 of the product obtained by multiplying $1.00 by the aggregate number of rentable square feet of space in the HPE Campus Property (as defined below) (initially $37,280 per month). |
(7) | The borrower is required to deposit with the lender, on each payment date, an amount equal to the common charges payable by the borrower under the related condominium documents that will be payable for the next calendar month. The borrower is not obligated to make deposits into the common charges reserve so long as (i) no event of default has occurred and is continuing, (ii) the HPE lease is in full force and effect, (iii) HPE is required under its lease to reimburse the borrower for the payment of all common charges due to the condominium board and the borrower provides the lender with evidence that HPE has timely reimbursed the borrower for such common charges, and (iv) the borrower has paid all common charges to the related condominium board and the borrower provides the lender with evidence thereof prior to the applicable due date. |
The Mortgage Loan. The mortgage loan (the “HPE Campus Mortgage Loan”) is part of a whole loan (the “HPE Campus Whole Loan”) evidenced by four pari passu promissory notes with an aggregate original principal balance of $66,770,000 secured by a first mortgage encumbering the fee interest in a class A office campus in Roseville, California (the “HPE Campus Property”). The HPE Campus Mortgage Loan consists of the non-controlling Note A-2, which has a Cut-off Date Balance of $20,000,000 and is being contributed to the WFCM 2020-C56 trust. The controlling Note A-1, and the non-controlling Notes A-3 and A-4, which have an original principal balance of $20,000,000, $16,770,000 and $10,000,000, respectively, are all expected to be contributed to one or more future securitizations. See “Description of the Mortgage Pool—The Whole Loans—The Serviced Pari Passu Whole Loans” , “The Non-Serviced Pari Passu Whole Loans” and “Pooling and Servicing Agreement—Servicing of the Servicing Shift Mortgage Loans” in the Preliminary Prospectus.
Note Summary
Notes | Original Balance | Cut-off Date Balance | Note Holder | Controlling Piece |
A-1 | $20,000,000 | $20,000,000 | AREF | Yes |
A-2 | $20,000,000 | $20,000,000 | WFCM 2020-C56 | No |
A-3 | $16,770,000 | $16,770,000 | AREF | No |
A-4 | $10,000,000 | $10,000,000 | AREF | No |
Total | $66,770,000 | $66,770,000 | | |
The Property. The HPE Campus Property is comprised of one, one-story building and two, two-story buildings totaling 447,364 square feet, situated on a 15.1-acre site in Roseville, California, approximately 21.4 miles southwest of downtown Sacramento. The three buildings include “R1” (8000 Foothills Boulevard, 54,486 square feet); “R3” (8030 Foothills Boulevard, 151,423 square feet); and “R5” (8040-8050 Foothills Boulevard, 241,455 square feet). The HPE Campus Property is part of a larger five-building office campus that was developed by Hewlett Packard. The company split off into Hewlett Packard Enterprise (“HPE”) and subsequently sold off the campus and leased it back, eventually downsizing to the current three buildings. The campus was condominiumized, with the HPE Campus Property on one parcel and access shared with the larger campus along with assigned parking areas.
The HPE Campus Property was built between 1981 and 1990. R1 consists of two smaller buildings connected by an interior corridor. The first building is the former reception area which has since been relocated to R3 and is now a small local credit union that serves the campus. The second building is the cafeteria. The R3 building was recently renovated and received a capital investment from HPE, with modern office tenant improvements including upgrades to lobbies, large open cubicle areas, private offices, break-out rooms, conference rooms, large training rooms, and breakrooms. A small portion of R3 and approximately half of R5 are used as improved lab/server room space. Most of these rooms have separate cooling units and expanded electricity and conduit capacity for servers, and some also have raised floors. They typically have vinyl tile floors and drop T-bar ceilings and could be converted to office use if necessary. Both of these buildings also include small shipping areas with both grade level and dock-high roll-up loading doors.
Amenities at the HPE Campus Property include a central quad courtyard with basketball and volleyball courts, two baseball fields – which are a part of the larger development – open seating areas, a large cafeteria, and a fitness center equipped with showers and locker rooms. The HPE Campus Property is served by 2,454 parking spaces, which yields a parking ratio of 5.5 spaces per 1,000 square feet of net rentable area.
The HPE Campus Property is 100.0% leased by HPE and houses multiple divisions of the company. The HPE Campus Property was initially leased by HPE in January 1981, and the lease was subsequently assigned to the master lessee in February 2020.
COVID-19 Update. As of May 7, 2020, the HPE Campus Property is open, however most, if not all, of the employees of the HPE are working remotely. The April and May 2020 debt service payments have been made. HPE leases 100.0% of the HPE Campus Property and paid rent for both April and May 2020. As of the date hereof, the HPE Campus Whole Loan is not subject to any modification or forbearance request.
Major Tenant.
THE INFORMATION IN THIS STRUCTURAL AND COLLATERAL TERM SHEET IS NOT COMPLETE AND MAY BE AMENDED PRIOR TO THE TIME OF SALE. THIS TERM SHEET IS NOT AN OFFER TO SELL THESE SECURITIES AND IT IS NOT A SOLICITATION OF AN OFFER TO BUY THESE SECURITIES IN ANY JURISDICTION WHERE THE OFFER OR SALE IS NOT PERMITTED.
148
| Office – Suburban | Loan #16 | Cut-off Date Balance: | | $20,000,000 |
| 8000-8050 Foothills Boulevard | HPE Campus | Cut-off Date LTV: | | 64.8% |
| Roseville, CA 95747 | | U/W NCF DSCR: | | 2.71x |
| | | U/W NOI Debt Yield: | | 9.9% |
Hewlett Packard Enterprise (447,364 square feet; 100.0% of net rentable area; 100.0% of underwritten base rent; 04/30/2030 lease expiration) HPE offers enterprise security, analytics and data management, applications development and testing, data center care, cloud consulting, and business process services for both individual and corporate use. HPE was founded on November 1, 2015 as a byproduct of the reconfigured Hewlett Packard Company, which built the original HPE Campus Property from 1981-1990. HPE is headquartered in San Jose, California and has over 60,000 employees worldwide. HPE began its current 13 year lease in May 2017 following the initial sale lease-back of the HPE Campus Property and is scheduled to remain in place through the end of its term in April 2030, two months after the HPE Campus Whole Loan matures. HPE has two, five-year extension options under its lease exercisable upon at least 300 days’ prior written notice.
HPE has been in occupancy at the HPE Campus Property since 1981 and currently has six different divisions located on-site including Aruba Networking Research and Development, Global Functions, Technology Services, Hybrid IT, and Enterprise Group Supply Organization and General. The Aruba Networking Research and Development was founded in 2002 and acquired by HPE in 2015. As of December 31, 2019, Aruba Networking Research and Development has reported revenues of over $2.5 billion (8.8% of HPE’s 2019 total revenue) and has over 6,000 employees. Aruba Networking Research and Development operates on both floors of the R3 building. The second division, Global Functions, provides general support functions including HR, Finance, and IT. The third division, Technology Services, provides high-level consulting and infrastructure services (e.g. data center design, complex problem resolution, etc.). The fourth division is known as Hybrid IT, an R&D development group focused in new market segments including HPE’s next generation computing solution known as “The Machine”. The fifth division is the Enterprise Group Supply Chain Organization which provides support for various supply chain functions. The sixth division, General, provides sale and contact support centers serving various divisions.
HPE is a national, publicly traded company and an investment grade tenant with a credit rating of BBB according to S&P and Baa2 per Moody’s. As of February 5, 2020, HPE had a market cap of $19.4 billion and over $3.7 billion of cash and cash equivalents as of October 31, 2019.
The HPE Campus Property is operated pursuant to a master lease between the borrower, as master lessor, and an affiliate of the borrower sponsor, as master lessee, in connection with the Shari’ah compliant loan structure. See “Risk Factors—Risks Relating to the Mortgage Loans—Risks Relating to Shari’ah Compliant Loans“ and “Description of the Mortgage Pool—Mortgage Pool Characteristics—Shari’ah Compliant Loan” and “—Tenant Issues—Affiliated Leases” in the Preliminary Prospectus.
The following table presents certain information relating to the tenancy at the HPE Campus Property:
Major Tenants(1)
| Tenant Name | Credit Rating (Fitch/
Moody’s/
S&P) | Tenant
NRSF | % of
NRSF | Annual
U/W Base
Rent PSF(2) | Annual
U/W Base
Rent(2) | % of Total
Annual
U/W Base
Rent(2) | Lease
Expiration
Date | Extension
Options | Termination
Option
(Y/N) |
| Major Tenants | | | | | | | | |
| Hewlett Packard Enterprise | BBB+/Baa2/BBB | 447,364 | 100.0% | $15.79 | $7,064,579 | 100.0% | 04/30/2030 | Y(3) | N |
| Total Major Tenants | 447,364 | 100.0% | $15.79 | $7,064,579 | 100.0% | | | |
| | | | | | | | | |
| Vacant Space | 0 | 0.0% | | | | | | |
| | | | | | | | | |
| Collateral Total | 447,364 | 100.0% | | | | | | |
| | | | | | | | | | |
(1) | Information obtained from the underwritten rent roll dated June 1, 2020 and includes $1,084,513 in straight-line rent steps through the end of term of the HPE Campus Whole Loan in March 2030. |
(2) | Annual U/W Base Rent PSF and Annual U/W Base Rent include underwritten rent steps. |
(3) | HPE has the option to extend the lease for two, five-year periods upon 300 days’ prior written notice to the master lessee. |
THE INFORMATION IN THIS STRUCTURAL AND COLLATERAL TERM SHEET IS NOT COMPLETE AND MAY BE AMENDED PRIOR TO THE TIME OF SALE. THIS TERM SHEET IS NOT AN OFFER TO SELL THESE SECURITIES AND IT IS NOT A SOLICITATION OF AN OFFER TO BUY THESE SECURITIES IN ANY JURISDICTION WHERE THE OFFER OR SALE IS NOT PERMITTED.
149
| Office – Suburban | Loan #16 | Cut-off Date Balance: | | $20,000,000 |
| 8000-8050 Foothills Boulevard | HPE Campus | Cut-off Date LTV: | | 64.8% |
| Roseville, CA 95747 | | U/W NCF DSCR: | | 2.71x |
| | | U/W NOI Debt Yield: | | 9.9% |
The following table presents certain information relating to the lease rollover schedule at the HPE Campus Property:
Lease Expiration Schedule(1)
Year Ending
December 31, | No. of
Leases
Expiring | Expiring
NRSF | % of
Total
NRSF | Cumulative
Expiring
NRSF | Cumulative
% of Total
NRSF | Annual
U/W
Base Rent(2)(3) | % of
Total
Annual
U/W
Base
Rent | Annual
U/W
Base Rent
PSF(2)(3) |
MTM | 0 | 0 | 0.0% | 0 | 0.0% | $0 | 0.0% | $0.00 |
2019 | 0 | 0 | 0.0% | 0 | 0.0% | $0 | 0.0% | $0.00 |
2020 | 0 | 0 | 0.0% | 0 | 0.0% | $0 | 0.0% | $0.00 |
2021 | 0 | 0 | 0.0% | 0 | 0.0% | $0 | 0.0% | $0.00 |
2022 | 0 | 0 | 0.0% | 0 | 0.0% | $0 | 0.0% | $0.00 |
2023 | 0 | 0 | 0.0% | 0 | 0.0% | $0 | 0.0% | $0.00 |
2024 | 0 | 0 | 0.0% | 0 | 0.0% | $0 | 0.0% | $0.00 |
2025 | 0 | 0 | 0.0% | 0 | 0.0% | $0 | 0.0% | $0.00 |
2026 | 0 | 0 | 0.0% | 0 | 0.0% | $0 | 0.0% | $0.00 |
2027 | 0 | 0 | 0.0% | 0 | 0.0% | $0 | 0.0% | $0.00 |
2028 | 0 | 0 | 0.0% | 0 | 0.0% | $0 | 0.0% | $0.00 |
2029 | 0 | 0 | 0.0% | 0 | 0.0% | $0 | 0.0% | $0.00 |
Thereafter | 1 | 447,364 | 100.0% | 447,364 | 100.0% | $7,064,579 | 100.0% | $15.79 |
Vacant | 0 | 0 | 0.0% | 447,364 | 100.0% | $0 | 0.0% | $0.00 |
Total/Weighted Average | 1 | 447,364 | 100.0% | | | $7,064,579 | 100.0% | $15.79 |
(1) | Information obtained from the underwritten rent roll dated June 1, 2020. |
(2) | Annual U/W Base Rent PSF and Annual U/W Base Rent include underwritten rent steps. |
(3) | Includes $1,084,513 in straight-line rent steps through the end of term of the HPE Campus Whole Loan in March 2030. |
The following table presents historical occupancy percentages at the HPE Campus Property:
Historical Occupancy
12/31/2017(1) | 12/31/2018(1) | 12/31/2019(1) | 6/1/2020(2) |
| NAV | NAV | NAV | 100.0% |
| (1) | Historical occupancy figures are not available as the transaction is an acquisition. |
| (2) | Information obtained from underwritten rent roll dated June 1, 2020. |
THE INFORMATION IN THIS STRUCTURAL AND COLLATERAL TERM SHEET IS NOT COMPLETE AND MAY BE AMENDED PRIOR TO THE TIME OF SALE. THIS TERM SHEET IS NOT AN OFFER TO SELL THESE SECURITIES AND IT IS NOT A SOLICITATION OF AN OFFER TO BUY THESE SECURITIES IN ANY JURISDICTION WHERE THE OFFER OR SALE IS NOT PERMITTED.
150
| Office – Suburban | Loan #16 | Cut-off Date Balance: | | $20,000,000 |
| 8000-8050 Foothills Boulevard | HPE Campus | Cut-off Date LTV: | | 64.8% |
| Roseville, CA 95747 | | U/W NCF DSCR: | | 2.71x |
| | | U/W NOI Debt Yield: | | 9.9% |
Operating History and Underwritten Net Cash Flow. The following table presents certain information relating to the historical operating performance and underwritten net cash flow at the HPE Campus Property:
Cash Flow Analysis(1)
| | U/W | %(2) | U/W $ per SF |
| Base Rent | $5,980,067 | 58.6% | $13.37 |
| Contractual Rent Steps(3) | 1,084,513 | 10.6 | 2.42 |
| Grossed Up Vacant Space | 0 | 0.0 | 0.00 |
| Gross Potential Rent | $7,064,579 | 69.3% | $15.79 |
| Other Income | 79,656 | 0.8 | 0.18 |
| Total Recoveries | 3,056,247 | 30.0 | 6.83 |
| Net Rental Income | $10,200,482 | 100.0% | $22.80 |
| (Vacancy & Credit Loss)(4) | (506,041) | (7.2) | (1.13) |
| Effective Gross Income | $9,694,440 | 95.0% | $21.67 |
| | | | |
| Real Estate Taxes | 1,382,535 | 14.3 | 3.09 |
| Insurance | 72,393 | 0.7 | 0.16 |
| Management Fee | 290,756 | 3.0 | 0.65 |
| Other Operating Expenses | 1,359,023 | 14.0 | 3.04 |
| Total Operating Expenses | $3,104,706 | 32.0% | $6.94 |
| | | | |
| Net Operating Income | $6,589,734 | 68.0% | $14.73 |
| Replacement Reserves | 89,473 | 0.9 | 0.20 |
| TI/LC | 0 | 0 | 0.00 |
| Net Cash Flow | $6,500,261 | 67.1% | $14.53 |
| | | | |
| NOI DSCR | 2.75x | | |
| NCF DSCR | 2.71x | | |
| NOI Debt Yield | 9.9% | | |
| NCF Debt Yield | 9.7% | | |
| (1) | Historical cash flows and occupancy figures are not available as the transaction is an acquisition. For the avoidance of doubt, no COVID-19 specific adjustments have been incorporated in the lender U/W. |
| (2) | Represents (i) percent of Net Rental Income for all revenue fields, (ii) percent of Gross Potential Rent for Vacancy & Credit Loss and (iii) percent of Effective Gross Income for all other fields. |
| (3) | Represents the straight-line rent through the end of term of the HPE Campus Whole Loan in March 2030. |
| (4) | The underwritten economic vacancy was 5.0%. The HPE Campus Property was 100.0% occupied as of June 1, 2020. |
Earthquake Insurance. The HPE Campus Property is located in Seismic Zone 3 and has a probable maximum loss of 3%. The HPE Campus Borrower is not required to obtain earthquake insurance.
Market Overview and Competition. The HPE Campus Property is located along Foothills Boulevard, approximately one mile from the Roseville Bypass Expressway and five miles from Interstate 80 in Roseville, California. Roseville is an affluent suburb of Sacramento, located approximately 21.4 miles southwest of the Sacramento central business district. Roseville is home to several large office and industrial users including FedEx Ground Center, Cokeva Inc., Keysight Technologies, and TSI Semiconductors. The HPE Campus Property is located within an expanding neighborhood comprised mostly of industrial, flex, and office uses, built in the past 20 years. Residential uses are limited and include predominantly single-family homes with some apartment complexes. The HPE Campus Property is in a central location to transportation systems with access to major freeways including US Highway 50, State Highway 99, and Interstates 5 and 80. These freeways provide access to the San Francisco Bay Area to the west, Southern California to the south, Oregon and Washington to the north, and Nevada to the east. Air transportation within the Sacramento MSA is provided by the Sacramento International Airport, which is approximately 24.0 miles west of the HPE Campus Property.
According to the appraisal, the estimated 2019 population within a one-, three-, and five-mile radius of the HPE Campus Property was 7,081, 102,497, and 224,656, respectively. According to the appraisal, the estimated 2019 average household income within a one-, three-, and five-mile radius of the HPE Campus Property was $127,534, $113,230, and 113,495, respectively.
According to a third-party report, the HPE Campus Property is situated within the Sacramento Office Market. As of the fourth quarter of 2019, the Sacramento office market reported a total inventory of approximately 105.5 million square feet of office space with an 8.9% vacancy rate and average asking rent of $22.92 per square foot. According to a third-party report, the HPE Campus Property is
THE INFORMATION IN THIS STRUCTURAL AND COLLATERAL TERM SHEET IS NOT COMPLETE AND MAY BE AMENDED PRIOR TO THE TIME OF SALE. THIS TERM SHEET IS NOT AN OFFER TO SELL THESE SECURITIES AND IT IS NOT A SOLICITATION OF AN OFFER TO BUY THESE SECURITIES IN ANY JURISDICTION WHERE THE OFFER OR SALE IS NOT PERMITTED.
151
| Office – Suburban | Loan #16 | Cut-off Date Balance: | | $20,000,000 |
| 8000-8050 Foothills Boulevard | HPE Campus | Cut-off Date LTV: | | 64.8% |
| Roseville, CA 95747 | | U/W NCF DSCR: | | 2.71x |
| | | U/W NOI Debt Yield: | | 9.9% |
situated within the Roseville and Rocklin submarket of the Sacramento Office Market. As of the fourth quarter of 2019, the Roseville and Rocklin submarket reported a total inventory of approximately 13.2 million square feet of office space with a 9.4% vacancy rate and average asking rent of $23.04 per square foot.
The following table presents certain information relating to the appraiser’s market rent conclusions for the HPE Campus Property:
Office Market Rent Summary(1)
| Sacramento Market | Roseville/Rocklin
Submarket |
Market Rent (PSF)(2) | $22.92 | $23.04 |
Vacancy | 8.9% | 9.4% |
Inventory (SF) | 105,508,348 | 13,153,168 |
Net Absorption (SF) | 318,146 | 222,947 |
Completions (SF) | 254,216 | 194,000 |
| (1) | Information obtained from the appraisal. |
| (2) | The rents are on a gross basis. |
The following table presents certain information relating to comparable office leases to the HPE Campus Property:
Comparable Office Leases(1)
Property Name/Location | Distance
from
Subject | Tenant | Year
Built | Tenant
Size (SF) | Lease
Commencement
Date | Lease
Term (Yrs.) | Annual
Base
Rent
PSF | Lease
Type |
HPE Campus Property Roseville, CA | Subject | Hewlett Packard Enterprise | 1981 | 447,364(2) | May-17(2) | 13.0(2) | $15.79(2) | NNN(2) |
| | | | | | | | | |
Junction Crossing Roseville, CA | 0.8 miles | Listing | 1998 | 77,803 | Jan-20 | NAV | $10.80 | NNN |
| | | | | | | | | |
Lava Ridge Center Roseville, CA | 4.8 miles | American Pacific Mortgage | 2000 | 34,736 | Oct-19 | 4.3 | $25.20 | FSG |
| | | | | | | | | |
Johnson Ranch Roseville, CA | 4.8 miles | Lyon Real Estate | 1988 | 13,543 | Jun-19 | 5.3 | $26.88 | FSG |
| | | | | | | | | |
Roseville Innovation Park Roseville, CA | 0.1 miles | Penumbra | 1993 | 157,518 | Mar-20 | 15.0 | $15.00 | NNN |
| | | | | | | | | |
Olympus Corporate Centre Roseville, CA | 5.4 miles | Private National Mortgage | 1995 | 15,060 | Aug-18 | 5.4 | $25.80 | FSG |
| | | | | | | | | |
Douglas Corporate Center Roseville, CA | 5.2 miles | Composite Engineering, Inc. | 2003 | 40,051 | Aug-18 | 5.3 | $25.80 | FSG |
| | | | | | | | |
| (1) | Information obtained from the appraisal. |
| (2) | Information obtained from the underwritten rent roll dated June 1, 2020. |
THE INFORMATION IN THIS STRUCTURAL AND COLLATERAL TERM SHEET IS NOT COMPLETE AND MAY BE AMENDED PRIOR TO THE TIME OF SALE. THIS TERM SHEET IS NOT AN OFFER TO SELL THESE SECURITIES AND IT IS NOT A SOLICITATION OF AN OFFER TO BUY THESE SECURITIES IN ANY JURISDICTION WHERE THE OFFER OR SALE IS NOT PERMITTED.
152
| Office – Suburban | Loan #16 | Cut-off Date Balance: | | $20,000,000 |
| 8000-8050 Foothills Boulevard | HPE Campus | Cut-off Date LTV: | | 64.8% |
| Roseville, CA 95747 | | U/W NCF DSCR: | | 2.71x |
| | | U/W NOI Debt Yield: | | 9.9% |
The following table presents certain information relating to comparable office sales to the HPE Campus Property:
Comparable Sales(1)
Property Name/Location | Sale Date | Year
Built | NRA | Sale Price | Price/ SF | NOI | NOI/SF | Cap
Rate |
HPE Campus Property Roseville, CA | February 2020(2) | 1981 | 447,364 | $101,300,000 | $226 | NAV | NAV | NAV |
| | | | | | | | | |
Stoneview Plaza Roseville, CA | August 2019 | 2005 | 108,348 | $24,900,000 | $230 | $1,668,300 | $15.40 | 6.70% |
| | | | | | | | | |
Parkway Corporate Center Roseville, CA | February 2019 | 2000 | 287,539 | $79,000,000 | $275 | $4,183,771 | $14.55 | 5.30% |
| | | | | | | | | |
The Summit at Douglas Ridge Roseville, CA | August 2018 | 2003 | 185,841 | $44,500,000 | $239 | $3,276,000 | $17.63 | 7.36% |
| | | | | | | | | |
Stone Point Plaza Roseville, CA | June 2018 | 2004 | 96,377 | $19,550,000 | $203 | $1,571,832 | $16.31 | 8.04% |
| | | | | | | | | |
Eureka Corporate Center Roseville, CA | January 2018 | 2001 | 142,125 | $26,000,000 | $183 | $1,933,873 | $13.61 | 7.44% |
| | | | | | | | | |
Roseville Corporate Center Roseville, CA | October 2017 | 1999 | 109,241 | $23,340,000 | $214 | $1,699,152 | $15.55 | 7.28% |
| | | | | | | | |
| (1) | Information obtained from the appraisal. |
| (2) | Information obtained from the settlement statement of the HPE Campus Whole Loan. |
THE INFORMATION IN THIS STRUCTURAL AND COLLATERAL TERM SHEET IS NOT COMPLETE AND MAY BE AMENDED PRIOR TO THE TIME OF SALE. THIS TERM SHEET IS NOT AN OFFER TO SELL THESE SECURITIES AND IT IS NOT A SOLICITATION OF AN OFFER TO BUY THESE SECURITIES IN ANY JURISDICTION WHERE THE OFFER OR SALE IS NOT PERMITTED.
153
No. 17 – Maxi-Space Portfolio |
|
Mortgage Loan Information | | Mortgaged Property Information |
Mortgage Loan Seller: | LMF Commercial, LLC | | Single Asset/Portfolio: | Portfolio |
Credit Assessment (Fitch/KBRA/Moody’s): | NR/NR/NR | | Property Type – Subtype: | Various – Various |
Original Principal Balance: | $19,525,000 | | Location: | Various, WA |
Cut-off Date Balance: | $19,525,000 | | Size: | 171,569 SF |
% of Initial Pool Balance: | 2.7% | | Cut-off Date Balance Per SF: | $113.80 |
Loan Purpose: | Acquisition | | Maturity Date Balance Per SF: | $113.80 |
Borrower Sponsor: | Robert Moser | | Year Built/Renovated: | Various/Various |
Guarantor: | Robert Moser | | Title Vesting: | Fee |
Mortgage Rate: | 5.1000% | | Property Manager: | Prime Group Holdings LLC (borrower related) |
Note Date: | February 4, 2020 | | Current Occupancy (As of): | 89.9% (4/17/2020) |
Seasoning: | 4 months | | YE 2019 Occupancy: | 97.0% |
Maturity Date: | February 6, 2025 | | YE 2018 Occupancy: | 95.8% |
IO Period: | 60 months | | YE 2017 Occupancy: | 98.5% |
Loan Term (Original): | 60 months | | Appraised Value(4)(5): | $36,400,000 |
Amortization Term (Original): | NAP | | Appraised Value Per SF(4)(5): | $212.16 |
Loan Amortization Type: | Interest-only, Balloon | | Appraisal Valuation Date: | January 10, 2020 |
Call Protection(1): | L(28), D(28), O(4) | | | |
| | | | | |
Additional Debt(2): | Yes | | Underwriting and Financial Information(4) |
Additional Debt Type (Balance)(2): | Future Mezzanine | | YE 2019 NOI: | $1,989,356 |
| | | YE 2018 NOI: | $1,853,016 |
| | | YE 2017 NOI: | $1,759,331 |
| | | U/W Revenues: | $2,603,176 |
| | | U/W Expenses: | $885,463 |
| | U/W NOI: | $1,717,713 |
| | | | | U/W NCF: | $1,672,007 |
Escrows and Reserves | | U/W DSCR based on NOI/NCF: | 1.70x / 1.66x |
| Initial | Monthly | Cap | | U/W Debt Yield based on NOI/NCF: | 8.8% / 8.6% |
Taxes | $0 | $22,978 | NAP | | U/W Debt Yield at Maturity based on NOI/NCF: | 8.8% / 8.6% |
Insurance | $17,706 | $2,409 | NAP | | Cut-off Date LTV Ratio(5): | 53.6% |
Replacement Reserve | $0 | $2,155 | NAP | | LTV Ratio at Maturity(5): | 53.6% |
Deferred Maintenance | $0 | $0 | NAP | | | |
TI/LC | $300,000 | $1,841 | $300,000 | | | |
Environmental Remediation(3) | $637,500 | $0 | NAP | | | |
| | | | | | | |
Sources and Uses |
Sources | | | | | Uses | | | |
Original Loan Amount | $19,525,000 | | 56.5 | % | | Purchase Price | $31,621,000 | | 91.6 | % |
Sponsor’s new equity contribution | 15,005,139 | | 43.5 | | | Closing Costs | 1,953,933 | | 5.7 | |
| | | | | Upfront Reserves | 955,206 | | 2.8 | |
Total Sources | $34,530,139 | | 100.0 | % | | Total Uses | $34,530,139 | | 100.0 | % |
(1) | At any time after the permitted defeasance date and prior to the free window date, the borrowers may obtain the release of any individual property provided that, among other conditions stated in the Maxi-Space Portfolio Mortgage Loan documents, (i) the defeasance amount is at least 115% of the allocated loan amount for the related Maxi-Space Portfolio property being released; (ii) the debt service coverage ratio for the remaining properties after such release is not less than the greater of (a) 1.38x and (b) the debt service coverage ratio for the remaining properties and the property to be released for the preceding 12 months; and (iii) the loan-to-value ratio after such release is less than or equal to the lesser of (a) 53.6% and (b) the loan-to-value ratio for the remaining properties and the property to be released immediately preceding the release of the property. |
(2) | Provided no event of default has occurred and is continuing, the Maxi-Space Portfolio Mortgage Loan documents permit an affiliate of the borrowers to incur future mezzanine debt subject to certain conditions, including but not limited to (i) the execution of an intercreditor agreement in form and substance reasonably acceptable to the lender; and (ii) based on the Maxi-Space Portfolio Mortgage Loan and the mezzanine loan, (a) the combined loan-to-value ratio is not greater than 53.6% and (b) the combined debt service coverage ratio is not less than 1.38x. |
(3) | At origination, the borrowers deposited $637,500 into an Environmental Remediation reserve, which sum represents 125% of the opinion of probable cost to complete environmental work at the 74th Street property, which work includes: (i) achieving regulatory engagement to obtain no further action status and (ii) enrolling in the voluntary cleanup program and submitting existing reports to the Washington Department of Ecology for the purposes of obtaining a no further action letter with respect to the open spill case at the 74th Street property. |
(4) | All NOI, NCF and occupancy information, as well as the appraised value, were determined prior to the emergence of the novel coronavirus pandemic, and the economic disruption resulting from measures to combat the pandemic, and all DSCR, LTV and Debt Yield metrics were calculated, and the Maxi-Space Portfolio Mortgage Loan was underwritten, based on such prior information. See “Risk Factors—Risks Related to Market Conditions and |
THE INFORMATION IN THIS STRUCTURAL AND COLLATERAL TERM SHEET IS NOT COMPLETE AND MAY BE AMENDED PRIOR TO THE TIME OF SALE. THIS TERM SHEET IS NOT AN OFFER TO SELL THESE SECURITIES AND IT IS NOT A SOLICITATION OF AN OFFER TO BUY THESE SECURITIES IN ANY JURISDICTION WHERE THE OFFER OR SALE IS NOT PERMITTED.
154
Various – Various | Loan #17 | Cut-off Date Balance: | | $19,525,000 |
Property Addresses – Various, WA | Maxi-Space Portfolio | Cut-off Date LTV: | | 53.6% |
| | U/W NCF DSCR: | | 1.66x |
| | U/W NOI Debt Yield: | | 8.8% |
Other External Factors—The Coronavirus Pandemic Has Adversely Affected the Global Economy and Will Likely Adversely Affect the Performance of the Mortgage Loans” in the Preliminary Prospectus.
(5) | The Appraised Value, Appraised Value Per SF, Cut-Off Date LTV Ratio and LTV Ratio at Maturity is based on the as-is Bulk Portfolio Value of $36,400,000. The combined “as-is” individual appraised value is $33,110,000. The Cut-off Date LTV Ratio and LTV Ratio at Maturity on the combined “as-is” individual appraised value is 59.0% and 59.0%, respectively. |
The Mortgage Loan. The mortgage loan (the “Maxi-Space Portfolio Mortgage Loan”) is evidenced by a single promissory note secured by a first mortgage encumbering the fee interest in seven self-storage and mixed use properties located in Puyallup, Tacoma and University Place, Washington (each, a “Maxi-Space Portfolio Property” and collectively, the “Maxi-Space Portfolio Properties” or the “Maxi-Space Portfolio”).
The Properties. The Maxi-Space Portfolio includes seven self-storage and mixed use properties located across Washington comprised of 216 self-storage units, 24 parking spaces, 24 band rooms, 17 office/retail/warehouse spaces and 22 office/retail spaces. As of April 17, 2020, the Maxi-Space Portfolio Properties were 89.9% occupied based on square feet.
Meridian
The Meridian property is located in Puyallup, Washington. The Meridian property is comprised of two single-story buildings on 56 contiguous tax parcels totaling 2.1 acres. The Meridian property was built in 2004 and consists of 45 self-storage units. The units range in size from 252 square feet to 770 square feet. The flex-industrial space includes 16 foot clear height and 27 grade level doors. Amenities include a keypad security entrance for each unit and exterior security fencing. In addition to the self-storage units, the Meridian property generates revenues from four office units and six band rooms (totaling 7,641 square feet). The total annual revenue from non-self-storage rental income is $119,364, which is 28.4% of the underwritten base rent at the Meridian property and 4.7% of the Maxi-Space Portfolio underwritten base rent.
The Meridian property is also subject to a condominium declaration. The Meridian borrower owns all but two units in the condominium, which owned units constitute approximately 96.7% of the common elements in the condominium. The board of directors of the condominium association consists of three board members, all of which were appointed by the Meridian borrower at the origination of the Maxi-Space Portfolio Mortgage Loan. The three board members are Robert Moser, who is the borrower sponsor and guarantor, and two additional employees of the property manager, Prime Holdings LLC.
Steele Street
The Steele Street property is located in Tacoma, Washington. The Steele Street property is comprised of three single-story buildings on one separate parcel totaling 2.2 acres. The Steele Street property was built in 1996. The Steele Street property consists of 42 self-storage units. The flex-industrial space includes 16 feet clear height and 48 grade level doors. The units range in size from 308 square feet to 896 square feet. Amenities include a keypad security entrance for each unit and exterior security fencing. In addition to the self-storage units, the Steele Street property generates revenues from three office units and three parking spaces. The total annual revenue from non-self-storage rental income is $46,644, which represents 12.4% of the underwritten base rent at the Steele Street property and 1.9% of the Maxi-Space Portfolio underwritten base rent.
Pacific Avenue
The Pacific Avenue property is located in Tacoma, Washington. The Pacific Avenue property is comprised of three single-story buildings on 43 contiguous tax parcels totaling 1.9 acres. The Pacific Avenue property was built in 1973. The Pacific Avenue property consists of 35 self-storage units. The flex-industrial space includes 16 feet clear height and 30 grade level doors. The units range in size from 240 square feet to 900 square feet. Amenities include a keypad security entrance for each unit and exterior security fencing. In addition to the self-storage units, the Pacific Avenue property generates revenues from six office units. The total annual revenue from non-self-storage rental income is $117,374, which represents 30.9% of the underwritten base rent at the Pacific Avenue property and 4.7% of the Maxi-Space Portfolio underwritten base rent.
The Pacific Avenue property is subject to a condominium declaration. The Maxi-Space Portfolio Borrowers own 100% of the condominium units at the Pacific Avenue property, and all units are collateral for the Maxi-Space Portfolio Mortgage Loan. Pursuant to the Maxi-Space Portfolio Mortgage Loan documents, the Pacific Avenue borrower subordinated the Pacific Avenue condominium declaration to the security instrument.
Steele Street Plaza
The Steele Street Plaza property is located in Tacoma, Washington. The Steele Street Plaza property is comprised of one single-story building on one parcel totaling 2.2 acres. The Steele Street Plaza property was built in 2016. The Steele Street Plaza property consists of 15 self-storage units. The flex-industrial space includes 16 foot clear height and 31 grade level doors. The units range in size from 480 square feet to 640 square feet. Amenities include a keypad security entrance for each unit and exterior security fencing. In addition to the self-storage units, the Steele Street Plaza property generates revenues from one office unit and 18 office/warehouse spaces. The total annual revenue from non-self-storage rental income is $266,760, which represents 70.7% of the underwritten base rent at the Steele Street Plaza property and 10.6% of the Maxi-Space Portfolio underwritten base rent.
THE INFORMATION IN THIS STRUCTURAL AND COLLATERAL TERM SHEET IS NOT COMPLETE AND MAY BE AMENDED PRIOR TO THE TIME OF SALE. THIS TERM SHEET IS NOT AN OFFER TO SELL THESE SECURITIES AND IT IS NOT A SOLICITATION OF AN OFFER TO BUY THESE SECURITIES IN ANY JURISDICTION WHERE THE OFFER OR SALE IS NOT PERMITTED.
155
Various – Various | Loan #17 | Cut-off Date Balance: | | $19,525,000 |
Property Addresses – Various, WA | Maxi-Space Portfolio | Cut-off Date LTV: | | 53.6% |
| | U/W NCF DSCR: | | 1.66x |
| | U/W NOI Debt Yield: | | 8.8% |
Up North
The Up North property is located in University Place, Washington. The Up North property is comprised of four single-story buildings on two parcels totaling 1.8 acres. The Up North property was built in 1991 and consists of 32 self-storage units. The flex-industrial space includes 16 feet clear height and 40 grade level doors. The units range in size from 396 square feet to 3,763 square feet. Amenities include a keypad security entrance for each unit and exterior security fencing. In addition to the self-storage units, the Up North property generates revenues from eight retail/office spaces totaling 9,549 square feet. The total annual revenue from non-self-storage rental income is $139,296, which represents 36.4% of the underwritten base rent at the Up North property and 5.5% of the Maxi-Space Portfolio underwritten base rent.
74th Street
The 74th Street property is located in Tacoma, Washington. The 74th Street property is comprised of one single-story building on two parcels totaling 1.8 acres. The 74th Street property was built in 1984 and renovated in 2004. The 74th Street property consists of 13 self-storage units. The flex-industrial space includes 16 feet clear height and 16 grade level doors. The units range in size from 1,000 square feet to 2,500 square feet. Amenities include a keypad security entrance for each unit and exterior security fencing. In addition to the self-storage units, the 74th Street property generates revenues from 21 parking spaces and 18 band room spaces totaling 4,466 square feet. The total annual revenue from non-self-storage rental income is $137,508, which represents 39.8% of the underwritten base rent at the 74th Street property and 5.5% of the Maxi-Space Portfolio underwritten base rent.
Up South
The Up South property is located in University Place, Washington. The Up South property is comprised of three single-story buildings on one parcel totaling 1.0 acre. The Up South property was built in phases during 1979, 1987 and 1988 and renovated in 1988. The Up South property consists of 34 self-storage units. The units range in size from 160 square feet to 952 square feet. Amenities include a keypad security entrance for each unit and exterior security fencing.
The following table presents certain information regarding the Maxi-Space Portfolio Properties:
Property Name – Location | Allocated Cut-off Date Balance | % of Portfolio Cut-off Date Balance | Occupancy(1) | Year Built/ Renovated | Net Rentable Area (SF)(1) | Appraised Value | UW NOI(1) | % of UW NOI | Storage Units(1) |
Meridian - Puyallup, WA | $3,400,000 | 17.4% | 88.1% | 2004/NAP | 30,673 | $5,500,000 | $285,517 | 16.6% | 45 |
Steele Street - Tacoma, WA | 3,100,000 | 15.9 | 91.7 | 1996/NAP | 24,146 | 5,200,000 | $274,172 | 16.0 | 42 |
Pacific Avenue - Tacoma, WA | 3,000,000 | 15.4 | 91.0 | 1973/NAP | 25,189 | 4,700,000 | $271,990 | 15.8 | 35 |
Steele Street Plaza Property - Tacoma, WA | 2,925,000 | 15.0 | 81.4 | 2016/NAP | 20,776 | 5,370,000 | $269,787 | 15.7 | 15 |
Up North - University Place, WA | 2,700,000 | 13.8 | 97.4 | 1991/NAP | 30,659 | 4,800,000 | $246,054 | 14.3 | 32 |
74th Street - Tacoma, WA | 2,500,000 | 12.8 | 91.2 | 1984/2004 | 23,443 | 4,400,000 | $221,525 | 12.9 | 13 |
Up South - University Place, WA | 1,900,000 | 9.7 | 84.2 | 1979/1988 | 16,683 | 3,140,000 | $148,667 | 8.7 | 34 |
Total/Weighted Average | $19,525,000 | 100.0% | 89.9% | | 171,569 | $36,400,000(2) | $1,717,713 | 100.0% | 216 |
(1) | Based on the underwritten rent roll dated April 17, 2020, and Occupancy is based on square feet of both self-storage and non-self-storage spaces. For the avoidance of doubt, no COVID-19 specific adjustments have been incorporated in the lender U/W. |
(2) | The total Appraised Value is based on the “as-is” Bulk Portfolio Value. The sum of the “as-is” appraised values of each individual Maxi-Space Portfolio Property is $33,110,000, resulting in a Cut-off Date LTV Ratio and LTV Ratio at Maturity of 59.0% and 59.0%, respectively. |
The following table presents historical occupancy percentages at the Maxi-Space Portfolio:
Historical Occupancy
12/31/2017(1) | | 12/31/2018(1) | | 12/31/2019(1) | | 4/17/2020(2) |
| 98.5% | | 95.8% | | 97.0% | | 89.9% |
(1) | Occupancy is based on storage units. Information provided by the borrowers. |
(2) | Based on underwritten rent roll and based on square feet. |
COVID-19 Update. As of May 13, 2020, the Maxi-Space Portfolio Properties are open and operating. The borrowers paid the Maxi-Space Portfolio Mortgage Loan May 2020 debt service payments, and any required monthly reserve deposits have been made. Tenant due dates are based on the date in the month of their start date (the “monthiversary” of their start dates) (which in most cases is not the 1st of month), so collections are not tracked on a calendar month basis. As of May 14, 2020, approximately 6.5% of rent collections are 31 to 60 days due, and 1.7% are more than 60 days due. The Maxi-Space Portfolio Properties were acquired on February 4, 2020, and part of the borrower sponsor’s strategy is to clean up tenant delinquencies and encourage rent payments on ACH/credit cards. As of the date hereof, the borrowers have not requested any modification or forbearance to the Maxi-Space Portfolio Mortgage Loan terms.
THE INFORMATION IN THIS STRUCTURAL AND COLLATERAL TERM SHEET IS NOT COMPLETE AND MAY BE AMENDED PRIOR TO THE TIME OF SALE. THIS TERM SHEET IS NOT AN OFFER TO SELL THESE SECURITIES AND IT IS NOT A SOLICITATION OF AN OFFER TO BUY THESE SECURITIES IN ANY JURISDICTION WHERE THE OFFER OR SALE IS NOT PERMITTED.
156
Various – Various | Loan #17 | Cut-off Date Balance: | | $19,525,000 |
Property Addresses – Various, WA | Maxi-Space Portfolio | Cut-off Date LTV: | | 53.6% |
| | U/W NCF DSCR: | | 1.66x |
| | U/W NOI Debt Yield: | | 8.8% |
Market Overview and Competition. The Maxi-Space Portfolio Properties are located in Puyallup, Tacoma and University Place, Washington, which is within the Seattle-Tacoma-Bellevue metropolitan statistical area (“Seattle MSA”) in Pierce County, Washington. The Seattle MSA is situated within the Puget Sound region in Northwest Washington State. Puget Sound is a body of water which extends through numerous straits and inlets, from the Pacific Ocean to Seattle’s shoreline. The Puget Sound region consists of 12 counties and four MSA’s and encompasses approximately 70% of Washington’s population. The Seattle MSA serves as the center of the Puget Sound region and is situated along Interstate 5, the major north/south corridor in the state, which also provides access to the Cities of Everett, Olympia, and Tacoma.
The Seattle MSA accounts for an estimated gross metropolitan product of $218.8 billion and accounts for an estimated 1.7 million jobs. The Seattle MSA is home to eight Fortune 500 companies: Microsoft, Weyerhaeuser, Nordstrom, Costco Wholesale, Amazon.com, PACCAR, Starbucks, and Expeditors International of Washington. According to the appraisal report, Microsoft, Amazon, Google and Facebook are top performers within the information and communications technology industry in the Seattle MSA, generating annual revenues of $13.6 billion and adding 186,800 jobs locally. Joint Base Lewis-McChord (“JBLM”), located approximately 9.1 miles south-southwest of Tacoma, Washington, is an amalgamation of the United States Army’s Fort Lewis and the United States Air Force’s McChord Air Force Base. JBLM is a training and mobilization center for all services and is the only Army power projection base west of the Rocky Mountains. According to the appraisal, the base currently employs approximately 40,000 military personnel and 15,000 civilian contractors. Education and healthcare also largely contribute to the region’s employment. As the largest school in the Pacific Northwest, the University of Washington enrolls over 50,000 undergraduate and graduate students and is the fifth largest employer in the Seattle MSA. Private universities in the area include Seattle University and Seattle Pacific University.
According to third-party market reports, the Maxi-Space Portfolio Properties are located in the West Region/Pacific Sub Region within the West Pacific division and average monthly rents of $156.74 for 10x10 foot non-climate controlled units. As of the end of the second quarter of 2018, the West Pacific division reported a vacancy rate of 8.3% for self-storage properties.
Operating History and Underwritten Net Cash Flow. The following table presents certain information relating to the historical operating performance and underwritten net cash flow at the Maxi-Space Portfolio Properties:
Cash Flow Analysis
| | | 2017 | | 2018 | | 2019(1) | | U/W(2) | | %(3) | | U/W $ per SF |
| Base Rent | | $2,361,871 | | $2,499,077 | | $2,648,536 | | $2,520,830 | | 86.9% | | $14.69 |
| Grossed Up Vacant Space | | 0 | | 0 | | 0 | | 289,478 | | 10.0 | | 1.69 |
| Gross Potential Rent(4) | | $2,361,871 | | $2,499,077 | | $2,648,536 | | $2,810,308 | | 96.9% | | $16.38 |
| Other Income(5) | | 75,966 | | 80,636 | | 86,926 | | 89,926 | | 3.1 | | 0.52 |
| Net Rental Income | | $2,437,837 | | $2,579,713 | | $2,735,462 | | $2,900,234 | | 100.0% | | $16.90 |
| (Vacancy & Credit Loss) | | 0 | | 0 | | 0 | | (297,057)(6) | | (10.6) | | (1.73) |
| Effective Gross Income | | $2,437,837 | | $2,579,713 | | $2,735,462 | | $2,603,176 | | 89.8% | | $15.17 |
| | | | | | | | | | | | | |
| Real Estate Taxes | | 204,883 | | 244,627 | | 233,508 | | 239,272 | | 9.2 | | 1.39 |
| Insurance | | 29,384 | | 32,611 | | 34,679 | | 34,679 | | 1.3 | | 0.20 |
| Management Fee | | 121,892 | | 133,659 | | 141,797 | | 130,159 | | 5.0 | | 0.76 |
| Other Operating Expenses | | 322,347 | | 315,800 | | 336,123 | | 481,354 | | 18.5 | | 2.81 |
| Total Operating Expenses | | $678,506 | | $726,697 | | $746,106 | | $885,463 | | 34.0% | | $5.16 |
| | | | | | | | | | | | | |
| Net Operating Income | | $1,759,331 | | $1,853,016 | | $1,989,356 | | $1,717,713 | | 66.0% | | $10.01 |
| Replacement Reserves | | 0 | | 0 | | 0 | | 25,735 | | 1.0 | | 0.15 |
| TI/LC | | 0 | | 0 | | 0 | | 19,970 | | 0.8 | | 0.12 |
| Net Cash Flow | | $1,759,331 | | $1,853,016 | | $1,989,356 | | $1,672,007 | | 64.2% | | $9.75 |
| | | | | | | | | | | | | |
| NOI DSCR | | 1.74x | | 1.84x | | 1.97x | | 1.70x | | | | |
| NCF DSCR | | 1.74x | | 1.84x | | 1.97x | | 1.66x | | | | |
| NOI Debt Yield | | 9.0% | | 9.5% | | 10.2% | | 8.8% | | | | |
| NCF Debt Yield | | 9.0% | | 9.5% | | 10.2% | | 8.6% | | | | |
(1) | The borrower sponsor acquired the Maxi-Space Portfolio in February 2020. Due to timing of the acquisition, January 2020 financial information is missing and February 2020 financial information is only partial. |
(2) | For the avoidance of doubt, no COVID-19 specific adjustments have been incorporated in the lender U/W. |
(3) | Represents (i) percent of Net Rental Income for all revenue fields, (ii) percent of Gross Potential Rent for Vacancy & Credit Loss and (iii) percent of Effective Gross Income for all other fields. |
(4) | Gross Potential Rent includes income from both self-storage and non-self-storage spaces. |
(5) | Other Income includes insurance income, late fees, administrative fees, other miscellaneous income and signage income. |
(6) | The underwritten economic vacancy is 10.6%. The Maxi-Space Portfolio Properties were 89.9% occupied as of April 17, 2020 based on square feet. |
THE INFORMATION IN THIS STRUCTURAL AND COLLATERAL TERM SHEET IS NOT COMPLETE AND MAY BE AMENDED PRIOR TO THE TIME OF SALE. THIS TERM SHEET IS NOT AN OFFER TO SELL THESE SECURITIES AND IT IS NOT A SOLICITATION OF AN OFFER TO BUY THESE SECURITIES IN ANY JURISDICTION WHERE THE OFFER OR SALE IS NOT PERMITTED.
157
| Wells Fargo Commercial Mortgage Trust 2020-C56 | Transaction Contact Information |
VII. Transaction Contact Information
Questions regarding this Structural and Collateral Term Sheet may be directed to any of the following individuals:
Wells Fargo Securities, LLC | |
| |
Brigid Mattingly | Tel. (312) 269-3062 |
| |
A.J. Sfarra | Tel. (212) 214-5613 |
| |
Alex Wong | Tel. (212) 214-5615 |
Barclays Capital Inc. | |
| |
Daniel Vinson | Tel. (212) 528-8224 |
| |
Brian Wiele | Tel. (212) 412-5780 |
| |
Credit Suisse Securities (USA) LLC | |
| |
Chuck Lee | Tel. (212) 538-1807 |
| |
Brendan Jordan | Tel. (212) 325-1924 |
| |
Julia Powell | Tel. (212) 325-3294 |
| |
UBS Securities LLC | |
| |
David Schell | Tel. (212) 713-3375 |
| |
Nicholas Galeone | Tel. (212) 713-8832 |
| |
Siho Ham | Tel. (212) 713-1278 |
THE INFORMATION IN THIS STRUCTURAL AND COLLATERAL TERM SHEET IS NOT COMPLETE AND MAY BE AMENDED PRIOR TO THE TIME OF SALE. THIS TERM SHEET IS NOT AN OFFER TO SELL THESE SECURITIES AND IT IS NOT A SOLICITATION OF AN OFFER TO BUY THESE SECURITIES IN ANY JURISDICTION WHERE THE OFFER OR SALE IS NOT PERMITTED.
158