| FREE WRITING PROSPECTUS | ||
| FILED PURSUANT TO RULE 433 | ||
| REGISTRATION FILE NO.: 333-257991-02 | ||
 |  |  |
Free Writing Prospectus
Structural and Collateral Term Sheet
$764,418,400
(Approximate Initial Pool Balance)
$639,244,000
(Approximate Aggregate Certificate Balance of Offered Certificates)
Wells Fargo Commercial Mortgage Trust 2021-C61
as Issuing Entity
Wells Fargo Commercial Mortgage Securities, Inc.
as Depositor
LMF Commercial, LLC
Wells Fargo Bank, National Association
Ladder Capital Finance LLC
Column Financial, Inc.
UBS AG
BSPRT CMBS Finance, LLC
Oceanview Commercial Mortgage Finance, LLC
as Sponsors and Mortgage Loan Sellers
Commercial Mortgage Pass-Through Certificates
Series 2021-C61
November 15, 2021
WELLS FARGO SECURITIES
Co-Lead Manager and Joint Bookrunner | CREDIT SUISSE
Co-Lead Manager and Joint Bookrunner | UBS SECURITIES LLC
Co-Lead Manager and Joint Bookrunner |
Academy Securities Co-Manager
| Drexel Hamilton Co-Manager
| Siebert Williams Shank Co-Manager
|
STATEMENT REGARDING THIS FREE WRITING PROSPECTUS
The depositor has filed a registration statement (including a prospectus) with the Securities and Exchange Commission (“SEC”) (SEC File No. 333-257991) for the offering to which this communication relates. Before you invest, you should read the prospectus in the registration statement and other documents the depositor has filed with the SEC for more complete information about the depositor, the issuing entity and this offering. You may get these documents for free by visiting EDGAR on the SEC Web site at www.sec.gov. Alternatively, the depositor, any underwriter, or any dealer participating in the offering will arrange to send you the prospectus after filing if you request it by calling toll free 1-800-745-2063 (8 a.m. – 5 p.m. EST) or by emailing wfs.cmbs@wellsfargo.com.
Nothing in this document constitutes an offer of securities for sale in any jurisdiction where the offer or sale is not permitted. The information contained herein is preliminary as of the date hereof, supersedes any such information previously delivered to you and will be superseded by any such information subsequently delivered and ultimately by the final prospectus relating to the securities. These materials are subject to change, completion, supplement or amendment from time to time.
This free writing prospectus has been prepared by the underwriters for information purposes only and does not constitute, in whole or in part, a prospectus for the purposes of (i) Regulation (EU) 2017/1129 (as amended), (ii) such Regulation as it forms part of UK domestic law, or (iii) Part VI of the UK Financial Services and Markets Act 2000, as amended; and does not constitute an offering document for any other purpose.
STATEMENT REGARDING ASSUMPTIONS AS TO SECURITIES, PRICING ESTIMATES AND OTHER INFORMATION
The attached information contains certain tables and other statistical analyses (the “Computational Materials”) which have been prepared in reliance upon information furnished by the Mortgage Loan Sellers. Numerous assumptions were used in preparing the Computational Materials, which may or may not be reflected herein. As such, no assurance can be given as to the Computational Materials’ accuracy, appropriateness or completeness in any particular context; or as to whether the Computational Materials and/or the assumptions upon which they are based reflect present market conditions or future market performance. The Computational Materials should not be construed as either projections or predictions or as legal, tax, financial or accounting advice. You should consult your own counsel, accountant and other advisors as to the legal, tax, business, financial and related aspects of a purchase of these securities. Any weighted average lives, yields and principal payment periods shown in the Computational Materials are based on prepayment and/or loss assumptions, and changes in such prepayment and/or loss assumptions may dramatically affect such weighted average lives, yields and principal payment periods. In addition, it is possible that prepayments or losses on the underlying assets will occur at rates higher or lower than the rates shown in the attached Computational Materials. The specific characteristics of the securities may differ from those shown in the Computational Materials due to differences between the final underlying assets and the preliminary underlying assets used in preparing the Computational Materials. The principal amount and designation of any security described in the Computational Materials are subject to change prior to issuance. None of Wells Fargo Securities, LLC, UBS Securities LLC, Credit Suisse Securities (USA) LLC, Academy Securities, Inc., Drexel Hamilton, LLC, Siebert Williams Shank & Co., LLC or any of their respective affiliates, make any representation or warranty as to the actual rate or timing of payments or losses on any of the underlying assets or the payments or yield on the securities. The information in this presentation is based upon management forecasts and reflects prevailing conditions and management’s views as of this date, all of which are subject to change. In preparing this presentation, we have relied upon and assumed, without independent verification, the accuracy and completeness of all information available from public sources or which was provided to us by or on behalf of the Mortgage Loan Sellers or which was otherwise reviewed by us.
This free writing prospectus contains certain forward-looking statements. If and when included in this free writing prospectus, the words “expects”, “intends”, “anticipates”, “estimates” and analogous expressions and all statements that are not historical facts, including statements about our beliefs or expectations, are intended to identify forward-looking statements. Any forward-looking statements are made subject to risks and uncertainties which could cause actual results to differ materially from those stated. Those risks and uncertainties include, among other things, declines in general economic and business conditions, increased competition, changes in demographics, changes in political and social conditions, regulatory initiatives and changes in customer preferences, many of which are beyond our control and the control of any other person or entity related to this offering. The forward-looking statements made in this free writing prospectus are made as of the date stated on the cover. We have no obligation to update or revise any forward-looking statement.
Wells Fargo Securities is the trade name for the capital markets and investment banking services of Wells Fargo & Company and its subsidiaries, including but not limited to Wells Fargo Securities, LLC, a member of NYSE, FINRA, NFA and SIPC, Wells Fargo Prime Services, LLC, a member of FINRA, NFA and SIPC, and Wells Fargo Bank, N.A. Wells Fargo Securities, LLC and Wells Fargo Prime Services, LLC are distinct entities from affiliated banks and thrifts.
IMPORTANT NOTICE REGARDING THE OFFERED CERTIFICATES
The information herein is preliminary and may be supplemented or amended prior to the time of sale. In addition, the Offered Certificates referred to in these materials and the asset pool backing them are subject to modification or revision (including the possibility that one or more classes of certificates may be split, combined or eliminated at any time prior to issuance or availability of a final prospectus) and are offered on a “when, as and if issued” basis.
The underwriters described in these materials may from time to time perform investment banking services for, or solicit investment banking business from, any company named in these materials. The underwriters and/or their affiliates or respective employees may from time to time have a long or short position in any security or contract discussed in these materials.
The information contained herein supersedes any previous such information delivered to any prospective investor and will be superseded by information delivered to such prospective investor prior to the time of sale.
IMPORTANT NOTICE RELATING TO AUTOMATICALLY-GENERATED EMAIL DISCLAIMERS
Any legends, disclaimers or other notices that may appear at the bottom of any email communication to which this free writing prospectus is attached relating to (1) these materials not constituting an offer (or a solicitation of an offer), (2) any representation that these materials are accurate or complete and may not be updated or (3) these materials possibly being confidential, are not applicable to these materials and should be disregarded. Such legends, disclaimers or other notices have been automatically generated as a result of these materials having been sent via Bloomberg or another system.
THE INFORMATION IN THIS STRUCTURAL AND COLLATERAL TERM SHEET IS NOT COMPLETE AND MAY BE AMENDED PRIOR TO THE TIME OF SALE. THIS TERM SHEET IS NOT AN OFFER TO SELL THESE SECURITIES AND IT IS NOT A SOLICITATION OF AN OFFER TO BUY THESE SECURITIES IN ANY JURISDICTION WHERE THE OFFER OR SALE IS NOT PERMITTED.
1
| Wells Fargo Commercial Mortgage Trust 2021-C61 | Certificate Structure |
I. Certificate Structure
| Class | Expected Ratings (Fitch/ KBRA / Moody’s)(1) | Approximate Initial Certificate Balance or Notional Amount(2) | Approx. Initial Credit | Pass-Through Rate Description | Weighted Average Life (Years)(4) | Expected Principal Window(4) | Certificate Principal to Value Ratio(5) | Certificate Principal U/W NOI Debt Yield(6) | ||
| Offered Certificates | ||||||||||
| A-1 | AAAsf/AAA(sf)/Aaa(sf) | $18,512,000 | 30.000% | (7) | 2.48 | 1/22 – 5/26 | 42.0% | 14.9% | ||
| A-2 | AAAsf/AAA(sf)/Aaa(sf) | $108,135,000 | 30.000% | (7) | 4.68 | 5/26 – 12/26 | 42.0% | 14.9% | ||
| A-SB | AAAsf/AAA(sf)/Aaa(sf) | $28,529,000 | 30.000% | (7) | 7.28 | 12/26 – 7/31 | 42.0% | 14.9% | ||
| A-3(8) | AAAsf/AAA(sf)/Aaa(sf) | (8)(9) | 30.000% | (7) | (9) | (9) | 42.0% | 14.9% | ||
| A-4(8) | AAAsf/AAA(sf)/Aaa(sf) | (8)(9) | 30.000% | (7) | (9) | (9) | 42.0% | 14.9% | ||
| X-A | AAAsf/AAA(sf)/Aaa(sf) | $535,092,000(10) | N/A | Variable(11) | N/A | N/A | N/A | N/A | ||
| X-B | A-sf/AAA(sf)/NR | $104,152,000(12) | N/A | Variable(13) | N/A | N/A | N/A | N/A | ||
| A-S(8) | AAAsf/AAA(sf)/Aa2(sf) | $24,844,000(8) | 26.750% | (7) | 9.94 | 11/31 – 11/31 | 43.9% | 14.2% | ||
| B(8) | AA-sf/AA+(sf)/NR | $38,221,000(8) | 21.750% | (7) | 9.94 | 11/31 – 11/31 | 46.9% | 13.3% | ||
| C(8) | A-sf/A+(sf)/NR | $41,087,000(8) | 16.375% | (7) | 9.94 | 11/31 – 11/31 | 50.1% | 12.5% | ||
| Non-Offered Certificates | ||||||||||
| X-D(14) | BBB-sf/BBB(sf)/NR | $36,528,000(15) | N/A | Variable(16) | N/A | N/A | N/A | N/A | ||
| D | BBBsf/BBB+(sf)/NR | $27,711,000 | 12.750% | (7) | 9.96 | 11/31 – 12/31 | 52.3% | 11.9% | ||
| E(14) | BBB-sf/BBB(sf)/NR | $8,817,000 | 11.597% | (7) | 10.03 | 12/31 – 12/31 | 53.0% | 11.8% | ||
| Risk Retention Certificates | ||||||||||
| F-RR(14) | BBB-sf/BBB(sf)/NR | $11,249,000 | 10.125% | (7) | 10.03 | 12/31 – 12/31 | 53.9% | 11.6% | ||
| G-RR | BB+sf/BBB-(sf)/NR | $12,421,000 | 8.500% | (7) | 10.03 | 12/31 – 12/31 | 54.9% | 11.4% | ||
| H-RR | BB-sf/BB(sf)/NR | $10,511,000 | 7.125% | (7) | 10.03 | 12/31 – 12/31 | 55.7% | 11.2% | ||
| J-RR | B-sf/B+(sf)/NR | $10,511,000 | 5.750% | (7) | 10.03 | 12/31 – 12/31 | 56.5% | 11.0% | ||
| K-RR | NR/B-(sf)/NR | $7,644,000 | 4.750% | (7) | 10.03 | 12/31 – 12/31 | 57.1% | 10.9% | ||
| L-RR | NR/NR/NR | $36,310,400 | 0.000% | (7) | 10.03 | 12/31 – 12/31 | 59.9% | 10.4% | ||
Notes:
| (1) | The expected ratings presented are those of Kroll Bond Rating Agency, LLC (“KBRA”), Fitch Ratings, Inc. (“Fitch”), and Moody’s Investors Service, Inc. (“Moody’s”), which the depositor hired to rate the Offered Certificates. One or more other nationally recognized statistical rating organizations that were not hired by the depositor may use information they receive pursuant to Rule 17g-5 under the Securities Exchange Act of 1934, as amended (the “Exchange Act”) or otherwise, to rate or provide market reports and/or published commentary related to the Offered Certificates. We cannot assure you as to what ratings a non-hired nationally recognized statistical rating organization would assign or that its reports will not express differing, possibly negative, views of the mortgage loans and/or the Offered Certificates. The ratings of each Class of Offered Certificates address the likelihood of the timely distribution of interest and, except in the case of the Class X-A and X-B Certificates, the ultimate distribution of principal due on those Classes on or before the Rated Final Distribution Date. See “Risk Factors—Other Risks Relating to the Certificates—Nationally Recognized Statistical Rating Organizations May Assign Different Ratings to the Certificates; Ratings of the Certificates Reflect Only the Views of the Applicable Rating Agencies as of the Dates Such Ratings Were Issued; Ratings May Affect ERISA Eligibility; Ratings May Be Downgraded” and “Ratings” in the Preliminary Prospectus, expected to be dated November 15, 2021 (the “Preliminary Prospectus”). KBRA, Fitch and Moody’s have informed us that the “sf” designation in their ratings represents an identifier for structured finance product ratings. |
| (2) | The Certificate Balances and Notional Amounts set forth in the table are approximate. The actual initial Certificate Balances and Notional Amounts may be larger or smaller depending on the initial pool balance of the mortgage loans definitively included in the pool of mortgage loans, which aggregate cut-off date balance may be as much as 5% larger or smaller than the amount presented in the Preliminary Prospectus. In addition, the Notional Amounts of the Class X-A or X-B Certificates may vary depending upon the final pricing of the Classes of Principal Balance Certificates (as defined below) or trust components whose Certificate Balances comprise such Notional Amounts, and, if, as a result of such pricing, the pass-through rate of the Class X-A or X-B Certificates, as applicable, would be equal to zero at all times, such Class of Certificates may not be issued on the closing date of this securitization. |
| (3) | The approximate initial credit support with respect to the Class A-1, A-2, A-SB, A-3 and A-4 Certificates represents the approximate credit enhancement for the Class A-1, A-2, A-SB, A-3 and A-4 Certificates in the aggregate, taking into account the Certificate Balances of the Class A-3 and Class A-4 trust components. The approximate initial credit support set forth for the Class A-S certificates represents the approximate initial credit enhancement for the underlying Class A-S trust component. The approximate initial credit support set forth for the Class B certificates represents the approximate initial credit enhancement for the underlying Class B trust component. The approximate initial credit support set forth for the Class C certificates represents the approximate initial credit enhancement for the underlying Class C trust component. |
| (4) | Weighted Average Lives and Expected Principal Windows are calculated based on an assumed prepayment rate of 0% CPR and the “Structuring Assumptions” described under “Yield and Maturity Considerations—Weighted Average Life” in the Preliminary Prospectus. |
| (5) | The Certificate Principal to Value Ratio for each Class of Certificates (other than the Class A-1, A-2, A-SB, A-3 and A-4 Certificates) is calculated as the product of (a) the weighted average Cut-off Date LTV Ratio for the mortgage loans and (b) a fraction, the numerator of which is the total initial Certificate Balance of such Class of Certificates and all Classes of Principal Balance Certificates (or, with respect to the Class A-3, A-4, A-S, B or C Certificates, the trust component with the same alphanumeric designation) senior to such Class of Certificates and the denominator of which is the total initial Certificate Balance of all of the Classes of Principal Balance Certificates (or, with respect to the Class A-3, A-4, A-S, B or C Certificates, the trust component with the same alphanumeric designation). The Certificate Principal to Value Ratio for each of the Class A-1, A-2, A-SB, A-3 and A-4 Certificates is calculated in the aggregate for those Classes as if they were a single Class and is calculated as the product of (a) the weighted average Cut-off Date LTV Ratio for the mortgage loans and (b) a fraction, the numerator of which is the total initial Certificate Balance of such Classes of Certificates (or, with respect to the Class A-3 or A-4 Certificates, the trust component with the same alphanumeric designation) and the denominator of which is the total initial Certificate Balance of all of the Classes of Principal Balance Certificates (or, with respect to the Class A-3, A-4, A-S, B or C Certificates, the trust component with the same alphanumeric designation). In any event, however, excess mortgaged property value associated with a mortgage loan will not be available to offset losses on any other mortgage loan. |
THE INFORMATION IN THIS STRUCTURAL AND COLLATERAL TERM SHEET IS NOT COMPLETE AND MAY BE AMENDED PRIOR TO THE TIME OF SALE. THIS TERM SHEET IS NOT AN OFFER TO SELL THESE SECURITIES AND IT IS NOT A SOLICITATION OF AN OFFER TO BUY THESE SECURITIES IN ANY JURISDICTION WHERE THE OFFER OR SALE IS NOT PERMITTED.
3
| Wells Fargo Commercial Mortgage Trust 2021-C61 | Certificate Structure |
| (6) | The Certificate Principal U/W NOI Debt Yield for each Class of Certificates (other than the Class A-1, A-2, A-SB, A-3 and A-4 Certificates) is calculated as the product of (a) the weighted average U/W NOI Debt Yield for the mortgage loans and (b) a fraction, the numerator of which is the total initial Certificate Balance of all of the Classes of Principal Balance Certificates (or, with respect to the Class A-3, A-4, A-S, B or C Certificates, the trust component with the same alphanumeric designation) and the denominator of which is the total initial Certificate Balance of such Class of Certificates and all Classes of Principal Balance Certificates (or, with respect to the Class A-3, A-4, A-S, B or C Certificates, the trust component with the same alphanumeric designation) senior to such Class of Certificates. The Certificate Principal U/W NOI Debt Yield for each of the Class A-1, A-2, A-SB, A-3 and A-4 Certificates is calculated in the aggregate for those Classes as if they were a single Class and is calculated as the product of (a) the weighted average U/W NOI Debt Yield for the mortgage loans and (b) a fraction, the numerator of which is the total initial Certificate Balance of all of the Classes of Principal Balance Certificates (or, with respect to the Class A-3, A-4, A-S, B or C Certificates, the trust component with the same alphanumeric designation) and the denominator of which is the total initial Certificate Balance of such Classes of Certificates (or, with respect to the Class A-3 and Class A-4 Certificates, the trust component with the same alphanumeric designation). In any event, however, cash flow from each mortgaged property supports only the related mortgage loan and will not be available to support any other mortgage loan. | |
| (7) | The pass-through rates for the Class A-1, A-2, A-SB, A-3, A-4, A-S, B, C, D, E, F-RR, G-RR, H-RR, J-RR, K-RR and L-RR Certificates in each case for any distribution date will be one of the following: (i) a fixed rate per annum, (ii) a variable rate per annum equal to the weighted average of the net mortgage interest rates on the mortgage loans for the related distribution date, (iii) a variable rate per annum equal to the lesser of (a) a fixed rate and (b) the weighted average of the net mortgage interest rates on the mortgage loans for the related distribution date or (iv) a variable rate per annum equal to the weighted average of the net mortgage interest rates on the mortgage loans for the related distribution date minus a specified percentage. For purposes of the calculation of the weighted average of the net mortgage interest rates on the mortgage loans for each distribution date, the mortgage interest rates will be adjusted as necessary to a 30/360 basis. | |
| (8) | The Class A-3-1, A-3-2, A-3-X1, A-3-X2, A-4-1, A-4-2, A-4-X1, A-4-X2, A-S-1, A-S-2, A-S-X1, A-S-X2, B-1, B-2, B-X1, B-X2, C-1, C-2, C-X1 and C-X2 Certificates are also offered certificates. Such Classes of Certificates, together with the Class A-3, A-4, A-S, B and C Certificates, constitute the “Exchangeable Certificates”. The Class A-1, A-2, A-SB, D, E, F-RR, G-RR, H-RR, J-RR, K-RR and L-RR Certificates, together with the Exchangeable Certificates with a Certificate Balance, are referred to as the “Principal Balance Certificates”. Each class of Exchangeable Certificates will have the Certificate Balance or Notional Amount and pass-through rate described below under “Exchangeable Certificates”.
| |
| (9) | The exact initial Certificate Balances or Notional Amounts of the Class A-3, A-3-X1, A-3-X2, A-4, A-4-X1 and A-4-X2 trust components (and consequently, the exact initial Certificate Balances or Notional Amounts of the Exchangeable Certificates with an “A-3” or “A-4” designation) are unknown and will be determined based on the final pricing of the Certificates. However, the initial Certificate Balances, weighted average lives and principal windows of the Class A-3 and Class A-4 trust components are expected to be within the applicable ranges reflected in the following chart. The aggregate initial Certificate Balance of the Class A-3 and Class A-4 trust components is expected to be approximately $379,916,000, subject to a variance of plus or minus 5%. The Class A-3-X1 and A-3-X2 trust components will have initial Notional Amounts equal to the initial Certificate Balance of the Class A-3 trust component. The Class A-4-X1 and A-4-X2 trust components will have initial Notional Amounts equal to the initial Certificate Balance of the Class A-4 trust component. In the event that the Class A-4 Certificates are issued at $379,916,000, the Class A-3 Certificates will not be issued. | |
Trust Components | Expected Range of Approximate Initial | Expected Range of Weighted Average Life (Years) | Expected Range of Principal Window |
| Class A-3 | $0 – $175,000,000 | NAP – 9.41 | NAP / 12/29 – 10/31 |
| Class A-4 | $204,916,000 – $379,916,000 | 9.68 – 9.90 | 12/29 – 11/31 / 10/31 – 11/31 |
| (10) | The Class X-A Certificates are notional amount certificates. The Notional Amount of the Class X-A Certificates will be equal to the aggregate Certificate Balance of the Class A-1, A-2 and A-SB Certificates and the Class A-3 and A-4 trust components outstanding from time to time. The Class X-A Certificates will not be entitled to distributions of principal. |
| (11) | The pass-through rate for the Class X-A Certificates for any distribution date will be a per annum rate equal to the excess, if any, of (a) the weighted average of the net mortgage interest rates on the mortgage loans for the related distribution date, over (b) the weighted average of the pass-through rates on the Class A-1, A-2 and A-SB Certificates and the Class A-3, A-3-X1, A-3-X2, A-4, A-4-X1 and A-4-X2 trust components for the related distribution date, weighted on the basis of their respective Certificate Balances or Notional Amounts outstanding immediately prior to that distribution date (but excluding trust components with a Notional Amount in the denominator of such weighted average calculation). For purposes of the calculation of the weighted average of the net mortgage interest rates on the mortgage loans for each distribution date, the mortgage interest rates will be adjusted as necessary to a 30/360 basis. |
| (12) | The Class X-B Certificates are notional amount certificates. The Notional Amount of the Class X-B Certificates will be equal to the aggregate Certificate Balance of the Class A-S, B and C trust components outstanding from time to time. The Class X-B Certificates will not be entitled to distributions of principal. |
| (13) | The pass-through rate for the Class X-B Certificates for any distribution date will be a per annum rate equal to the excess, if any, of (a) the weighted average of the net mortgage interest rates on the mortgage loans for the related distribution date, over (b) the weighted average of the pass-through rates on the Class A-S, A-S-X1, A-S-X2, B, B-X1, B-X2, C, C-X1 and C-X2 trust components for the related distribution date, weighted on the basis of their respective Certificate Balances or Notional Amounts outstanding immediately prior to that distribution date (but excluding trust components with a Notional Amount in the denominator of such weighted average calculation). For purposes of the calculation of the weighted average of the net mortgage interest rates on the mortgage loans for each distribution date, the mortgage interest rates will be adjusted as necessary to a 30/360 basis. |
| (14) | The initial Notional Amount of the Class X-D Certificates and the initial Certificate Balance of each of the Class E and F-RR Certificates are subject to change based on final pricing of all Certificates and the final determination of the horizontal risk retention certificates that will be retained by the retaining sponsor through a third party purchaser as part of the U.S. risk retention requirements. For more information regarding the methodology and key inputs and assumptions used to determine the sizing of the horizontal risk retention certificates, see “Credit Risk Retention” in the Preliminary Prospectus. |
| (15) | The Class X-D Certificates are notional amount certificates. The Notional Amount of the Class X-D Certificates will be equal to the aggregate Certificate Balance of the Class D and E Certificates outstanding from time to time. The Class X-D Certificates will not be entitled to distributions of principal. |
| (16) | The pass-through rate for the Class X-D Certificates for any distribution date will be a per annum rate equal to the excess, if any, of (a) the weighted average of the net mortgage interest rates on the mortgage loans for the related distribution date, over (b) the weighted average of the pass-through rates on the Class D and E Certificates for the related distribution date, weighted on the basis of their respective Certificate Balances outstanding immediately prior to that distribution date. For purposes of the calculation of the weighted average of the net mortgage interest rates on the mortgage loans for each distribution date, the mortgage interest rates will be adjusted as necessary to a 30/360 basis.
|
THE INFORMATION IN THIS STRUCTURAL AND COLLATERAL TERM SHEET IS NOT COMPLETE AND MAY BE AMENDED PRIOR TO THE TIME OF SALE. THIS TERM SHEET IS NOT AN OFFER TO SELL THESE SECURITIES AND IT IS NOT A SOLICITATION OF AN OFFER TO BUY THESE SECURITIES IN ANY JURISDICTION WHERE THE OFFER OR SALE IS NOT PERMITTED.
4
| Wells Fargo Commercial Mortgage Trust 2021-C61 | Transaction Highlights |
II. Transaction Highlights
Mortgage Loan Sellers:
| Mortgage Loan Seller | Number of Mortgage Loans | Number of Mortgaged Properties | Aggregate Cut-off Date Balance | % of Initial Pool Balance | ||||||||
| LMF Commercial, LLC | 20 | 41 | $189,149,596 | 24.7 | % | |||||||
| Wells Fargo Bank, National Association | 10 | 39 | 185,688,995 | 24.3 | ||||||||
| Ladder Capital Finance LLC | 6 | 6 | 117,415,492 | 15.4 | ||||||||
| Column Financial, Inc. | 7 | 16 | 99,917,428 | 13.1 | ||||||||
| UBS AG | 10 | 55 | 70,029,223 | 9.2 | ||||||||
| BSPRT CMBS Finance, LLC | 6 | 6 | 65,102,232 | 8.5 | ||||||||
| Oceanview Commercial Mortgage Finance, LLC | 2 | 2 | 37,115,435 | 4.9 | ||||||||
Total | 61 | 165 | $764,418,400 | 100.0 | % | |||||||
Loan Pool:
| Initial Pool Balance: | $764,418,400 |
| Number of Mortgage Loans: | 61 |
| Average Cut-off Date Balance per Mortgage Loan: | $12,531,449 |
| Number of Mortgaged Properties: | 165 |
| Average Cut-off Date Balance per Mortgaged Property(1): | $4,632,839 |
| Weighted Average Mortgage Interest Rate: | 3.9099% |
| Ten Largest Mortgage Loans as % of Initial Pool Balance: | 45.5% |
| Weighted Average Original Term to Maturity or ARD (months): | 112 |
| Weighted Average Remaining Term to Maturity or ARD (months): | 108 |
| Weighted Average Original Amortization Term (months)(2): | 354 |
| Weighted Average Remaining Amortization Term (months)(2): | 351 |
| Weighted Average Seasoning (months): | 3 |
| (1) | Information regarding mortgage loans secured by multiple properties is based on an allocation according to relative appraised values or the allocated loan amounts or property-specific release prices set forth in the related loan documents or such other allocation as the related mortgage loan seller deemed appropriate. |
| (2) | Excludes any mortgage loan that does not amortize. |
Credit Statistics:
| Weighted Average U/W Net Cash Flow DSCR(1)(2): | 2.15x |
| Weighted Average U/W Net Operating Income Debt Yield(1)(2): | 10.4% |
| Weighted Average Cut-off Date Loan-to-Value Ratio(1)(2): | 59.9% |
| Weighted Average Balloon or ARD Loan-to-Value Ratio(1)(2): | 55.7% |
| % of Mortgage Loans with Additional Subordinate Debt(3): | 5.8% |
| % of Mortgage Loans with Single Tenants(4): | 21.7% |
| (1) | With respect to any mortgage loan that is part of a whole loan, loan-to-value ratio, debt service coverage ratio and debt yield calculations include the related pari passu companion loan(s) but exclude any related subordinate companion loan(s) (unless otherwise stated). The debt service coverage ratio, debt yield and loan-to-value ratio information do not take into account any subordinate debt (whether or not secured by the related mortgaged property), that currently exists or is allowed under the terms of any mortgage loan. The information for each mortgaged property that relates to a mortgage loan that is cross-collateralized or cross-defaulted with one or more other mortgage loans is based upon the principal balance of that mortgage loan, except that the applicable loan-to-value ratio, debt service coverage ratio, and debt yield for each such mortgage loan is based upon the ratio or yield (as applicable) for the aggregate indebtedness evidenced by all loans in the group (without regard to any limitation on the amount of indebtedness secured by any mortgaged property in such cross-collateralized group). See “Description of the Mortgage Pool—Mortgage Pool Characteristics” in the Preliminary Prospectus and Annex A-1 to the Preliminary Prospectus. |
| (2) | For certain of the mortgage loans, underwritten net cash flow, underwritten net operating income and appraised values of the related mortgaged properties were determined, or were calculated based on information as of a date, prior to the emergence of the novel coronavirus pandemic and the economic disruption resulting from measures to combat the pandemic, and the loan-to-value, debt service coverage and debt yield metrics presented in this term sheet may not reflect current market conditions. |
| (3) | The percentage figure expressed as “% of Mortgage Loans with Additional Subordinate Debt” is determined as a percentage of the initial pool balance and does not take into account any future subordinate debt (whether or not secured by the mortgaged property), if any, that may be permitted under the terms of any mortgage loan or the pooling and servicing agreement. See “Description of the Mortgage Pool—Additional Indebtedness” in the Preliminary Prospectus. |
| (4) | Excludes mortgage loans that are secured by multiple single tenant properties. |
THE INFORMATION IN THIS STRUCTURAL AND COLLATERAL TERM SHEET IS NOT COMPLETE AND MAY BE AMENDED PRIOR TO THE TIME OF SALE. THIS TERM SHEET IS NOT AN OFFER TO SELL THESE SECURITIES AND IT IS NOT A SOLICITATION OF AN OFFER TO BUY THESE SECURITIES IN ANY JURISDICTION WHERE THE OFFER OR SALE IS NOT PERMITTED.
5
| Wells Fargo Commercial Mortgage Trust 2021-C61 | Transaction Highlights |
Loan Structural Features:
Amortization: Based on the Initial Pool Balance, 43.0% of the mortgage pool (32 mortgage loans) has scheduled amortization, as follows:
23.4% (17 mortgage loans) requires amortization during the entire loan term; and
19.6% (15 mortgage loans) provides for an interest-only period followed by an amortization period.
Interest-Only: Based on the Initial Pool Balance, 57.0% of the mortgage pool (29 mortgage loans) provides for interest-only payments during the entire loan term through maturity or ARD. The Weighted Average Cut-off Date Loan-to-Value Ratio and Weighted Average U/W Net Cash Flow DSCR for those mortgage loans are 58.4% and 2.39x, respectively.
Hard Lockboxes: Based on the Initial Pool Balance, 47.1% of the mortgage pool (17 mortgage loans) have hard lockboxes in place.
Reserves: The mortgage loans require amounts to be escrowed monthly as follows (excluding any mortgage loans with springing provisions):
| Real Estate Taxes: | 71.9% of the pool |
| Insurance: | 58.5% of the pool |
| Capital Replacements: | 74.0% of the pool |
| TI/LC: | 52.1% of the pool(1) |
| (1) The percentage of Initial Pool Balance for mortgage loans with TI/LC reserves is based on the aggregate principal balance allocable to loans that include office, retail, mixed use and industrial properties. | |
Call Protection/Defeasance: Based on the Initial Pool Balance, the mortgage pool has the following call protection and defeasance features:
81.1% of the mortgage pool (48 mortgage loans) features a lockout period, then defeasance only until an open period;
8.9% of the mortgage pool (7 mortgage loans) features a lockout period, then the greater of a prepayment premium (1.0%) or yield maintenance until an open period;
3.3% of the mortgage pool (1 mortgage loans) features the greater of a prepayment premium (0.5%) or yield maintenance then an open period;
2.8% of the mortgage pool (2 mortgage loans) features a lockout period, then the greater of a prepayment premium (2.0%) or yield maintenance until an open period;
1.8% of the mortgage pool (1 mortgage loans) features a lockout period, then the greater of a prepayment premium (1.0%) or yield maintenance then defeasance until an open period;
1.5% of the mortgage pool (1 mortgage loans) features a lockout period, then the greater of a prepayment premium (3.0%) or yield maintenance then defeasance until an open period;
0.7% of the mortgage pool (1 mortgage loans) features the greater of a prepayment premium (1.0%) or yield maintenance then an open period;
Prepayment restrictions for each mortgage loan reflect the entire life of the mortgage loan. Please refer to Annex A-1 to the Preliminary Prospectus and the footnotes related thereto for further information regarding individual loan call protection.
THE INFORMATION IN THIS STRUCTURAL AND COLLATERAL TERM SHEET IS NOT COMPLETE AND MAY BE AMENDED PRIOR TO THE TIME OF SALE. THIS TERM SHEET IS NOT AN OFFER TO SELL THESE SECURITIES AND IT IS NOT A SOLICITATION OF AN OFFER TO BUY THESE SECURITIES IN ANY JURISDICTION WHERE THE OFFER OR SALE IS NOT PERMITTED.
6
| Wells Fargo Commercial Mortgage Trust 2021-C61 | Transaction Highlights |
III. COVID-19 Update
The following table contains information regarding the status of the mortgage loans and mortgaged properties provided by the respective borrowers as of the date set forth in the “Information As Of Date” column. The information from the borrowers has not been independently verified by the Mortgage Loan Sellers, the Underwriters or any other party, and there can be no assurance that the status of the Mortgage Loans and of the related Mortgaged Properties has not changed since the date in the “Information As-Of Date” column. The cumulative effects of the COVID-19 emergency on the global economy may cause tenants to be unable to pay their rent and borrowers to be unable to pay debt service under the mortgage loans. As a result, we cannot assure you that the information in the following table is indicative of future performance or that tenants or borrowers will not seek rent or debt service relief (including forbearance arrangements) or other lease or loan modifications in the future. Such actions may lead to shortfalls and losses on the certificates. Any information in the following table will be superseded by the information contained under the heading “Description of the Mortgage Pool—COVID-19 Considerations” in the Preliminary Prospectus.
Mortgage Loan Seller | Information As Of Date | Origination Date | Mortgaged Property Name | Mortgaged Property Type | August Debt Service Payment Received (Y/N) | September Debt Service Payment Received (Y/N) | October Debt Service Payment Received (Y/N) | Forbearance or Other Debt Service Relief Requested (Y/N) | Other Loan Modification Requested (Y/N) | Lease Modification or Rent Relief Requested (Y/N) | Total SF or Unit Count Making Full September Rent Payment (%) | UW September Base Rent Paid (%) | Total SF or Unit Count Making Full October Rent Payment (%) | UW October Base Rent Paid (%) |
| LMF | 11/1/2021 | 12/18/2019 | Martin Village | Retail | Y | Y | Y | Y(1) | N(2) | Y(1) | 100.0% | 100.0% | 100.0% | 100.0% |
| UBS AG | 11/4/2021 | 12/30/2019 | Cabela’s - Mitchell | Retail | Y | Y | Y | N | N | Y(3) | 100.0% | 100.0% | 100.0% | 100.0% |
| LCF | 11/3/2021 | 3/6/2020 | Shoppes on University | Retail | Y | Y | Y | N | Y(4) | Y(5) | 97.0% | 97.0% | 97.0% | 97.0% |
| UBS AG | 11/4/2021 | 11/27/2019 | Wyndham National Hotel Portfolio(6) | Hospitality | Y | Y | Y | N | N | N | NAP | NAP | NAP | NAP |
| LCF | 10/29/2021 | 2/28/2020 | Willow Plaza | Retail | Y | Y | Y | N | Y(7) | N | 92.0% | 92.0% | 99.0% | 99.0% |
| (1) | With respect to the Martin Village Mortgage Loan, the largest tenant, Regal Cinemas (“Regal”), representing 65.3% of net rentable area and 77.6% of underwritten base rent, announced it would close all of its theaters in the United States in March 2020 and subsequently reopened its theater at the Martin Village property on August 21, 2020. On October 5, 2020 Regal announced it would again temporally close all theaters in the United States due to a lack of theatrical releases. Regal reopened its theater at the Martin Village property for a second time on May 7, 2021 and the theater continued to be open and operational as of November 12, 2021. Regal paid reduced rent for the periods from April 2020 through July 2020 and November 2020 through June 2021, resulting in approximately $1.37 million in past due rent. While the borrower and Regal have not yet come to an agreement on repayment terms for the approximate $1.37 million in past due rent, Regal has been paying its full contractual rent since July 2021. |
On May 27, 2020 the second largest tenant, Mor Furniture, representing 27.3% of net rentable area and 13.4% of underwritten base rent, entered into a lease modification with the borrower, allowing the tenant to defer a total of $67,500 of rent between April 1, 2020 and June 30, 2020 ($22,500 gross per month). The tenant was required to repay $22,500 of the deferred rent by December 31, 2020, which amount was repaid in full. The remaining $45,000 is required to be repaid in twelve equal monthly payments of $3,750 starting January 1, 2021, which amount has been paid as agreed. Additionally, the lease term has been extended for 12 months.
| (2) | With respect to the Martin Village Mortgage Loan, on June 2, 2020, the lender and the borrower agreed to a loan modification, allowing funds to be drawn from the $1,200,000 Regal Cinema TI Reserve (“Regal Reserve”) to pay shortfalls in operating expenses, debt service and monthly reserves. A total of $91,727 was drawn from the Regal Reserve in June 2020 and such amount was fully repaid in July 2020. On December 29, 2020, the loan modification was reinstated to extend the borrower’s ability to use the Regal Reserve to pay monthly shortfalls. A total of $257,392 was drawn from the Regal Reserve from January 2021 through May 2021, and the total amount drawn was repaid to the Regal Reserve from May 2021 through October 2021. As of November 1, 2021, the Regal Reserve was fully-funded with $1,200,000 and an additional $203,545 had been swept into a separate critical tenant reserve as a result of an ongoing critical tenant cash sweep. |
On July 3, 2020 the third largest tenant, The Rock Pizza, representing 4.2% of net rentable area and 7.1% of underwritten base rent, agreed to a lease modification with the borrower, allowing base rent for April 2020 through September 2020 to be deferred by 50%. The deferred base rent ($34,830) is required to be repaid in 12 equal monthly payments of $2,903 starting January 2021, which amount has been paid as agreed. Additionally, the lease term has been extended for 12 months.
| (3) | The mortgage loan seller approved a lease amendment that allowed the sole tenant, Bass Pro Shop/Cabela’s, to defer May rent totaling $108,333, which was required to be repaid in three equal monthly installments in January, February, and March 2021. As of February 28, 2021, the tenant had repaid the deferred rent in full. The tenant resumed its full rent payments in June 2020 and there has been no interruption in debt service payments since origination in December 2019, as the borrower paid May debt service out-of-pocket. |
| (4) | In 2020, the Shoppes on University Mortgage Loan was modified in a manner that, notwithstanding the occurrence of a debt service coverage-related cash management trigger event, deferred the related borrower’s obligation under the related loan agreement to establish a clearing account and the declaration of such cash management trigger event until, at the lender’s option, the monthly payment date on September 6, 2020. Such modification also provided for, among other things, monthly debt service payments through the September 2020 payment each being paid a month early. |
| (5) | With respect to the Shoppes on University Mortgage Loan, the second largest tenant, Planet Fitness, representing approximately 22.6% of the net rentable area and 18.8% of underwritten base rent at the related Mortgaged Property, was temporarily closed for business during 2020 due to the COVID-19 pandemic and, as such, entered a lease modification whereby the tenant would, commencing April 1, 2020, pay 50% of base rent through the first day of the second month after the tenant would be permitted, by public authority, to re-open to the public, would continue to pay its full share of operating costs during such period and would make the landlord whole on unpaid rent (such deferred rent to be paid in six equal monthly installments commencing on the first day of the second month after the tenant would be permitted, by public authority, to re-open to the public). Planet Fitness officially reopened on May 29, 2020 and was required to begin paying unpaid rent on August 1, 2020. As of February 1, 2021, Planet Fitness has paid all unpaid rent. In addition, tenants Check Mart of Florida and Menchie’s received relief on common area maintenance and tax due in June 2020, and tenant Check Mart of Florida received relief on common area maintenance and tax due in July 2020. |
| (6) | With respect to the Wyndham National Hotel Portfolio Properties, please see Annex A-1 for information relating to occupancy, ADR and RevPAR. |
| (7) | The related borrower requested a modification related to certain debt service coverage ratio tests and the funding of certain reserves in the related loan documents but was not granted the request. |
THE INFORMATION IN THIS STRUCTURAL AND COLLATERAL TERM SHEET IS NOT COMPLETE AND MAY BE AMENDED PRIOR TO THE TIME OF SALE. THIS TERM SHEET IS NOT AN OFFER TO SELL THESE SECURITIES AND IT IS NOT A SOLICITATION OF AN OFFER TO BUY THESE SECURITIES IN ANY JURISDICTION WHERE THE OFFER OR SALE IS NOT PERMITTED.
7
| Wells Fargo Commercial Mortgage Trust 2021-C61 | Issue Characteristics |
IV. Issue Characteristics
| Securities Offered: | $639,244,000 approximate monthly pay, multi-class, commercial mortgage REMIC pass-through certificates consisting of thirty classes (Classes A-1, A-2, A-SB, A-3, A-3-1, A-3-2, A-3-X1, A-3-X2, A-4, A-4-1, A-4-2, A-4-X1, A-4-X2, A-S, A-S-1, A-S-2, A-S-X1, A-S-X2, B, B-1, B-2, B-X1, B-X2, C, C-1, C-2, C-X1, C-X2, X-A and X-B), which are offered pursuant to a registration statement filed with the SEC (such classes of certificates, the “Offered Certificates”). |
| Mortgage Loan Sellers: | LMF Commercial, LLC (“LMF”), Wells Fargo Bank, National Association (“WFB”), Ladder Capital Finance LLC (“LCF”), Column Financial, Inc. (“Column”), UBS AG, by and through its branch office at 1285 Avenue of the Americas, New York, New York (“UBS”), BSPRT CMBS Finance, LLC (“BSPRT”) and Oceanview Commercial Mortgage Finance, LLC (“Oceanview”) |
| Joint Bookrunners and Co-Lead Managers: | Wells Fargo Securities, LLC, UBS Securities LLC and Credit Suisse Securities (USA) LLC |
| Co-Managers: | Academy Securities, Inc., Drexel Hamilton, LLC and Siebert Williams Shank & Co., LLC |
| Rating Agencies: | Kroll Bond Rating Agency, LLC, Fitch Ratings, Inc., and Moody’s Investors Service, Inc. |
| Master Servicer: | Wells Fargo Bank, National Association |
| Special Servicer: | CWCapital Asset Management LLC |
| Certificate Administrator: | Computershare Trust Company, N.A. |
| Trustee: | Wilmington Trust, National Association |
| Operating Advisor: | Pentalpha Surveillance LLC |
| Asset Representations Reviewer: | Pentalpha Surveillance LLC |
| Initial Majority Controlling Class Certificateholder: | LD III Sub IV LLC |
| U.S. Credit Risk Retention: | For a discussion on the manner in which the U.S. credit risk retention requirements will be satisfied by Wells Fargo Bank, National Association, as the retaining sponsor, see “Credit Risk Retention” in the Preliminary Prospectus.
This transaction is being structured with a “third party purchaser” that will acquire an “eligible horizontal residual interest”, which will be comprised of the Class F-RR, G-RR, H-RR, J-RR, K-RR and L-RR Certificates (the “horizontal risk retention certificates”). LD III Sub IV LLC (in satisfaction of the retention obligations of Wells Fargo Bank, National Association, as the retaining sponsor) will be contractually obligated to retain (or to cause its “majority-owned affiliate” to retain) the horizontal risk retention certificates for a minimum of five years after the closing date, subject to certain permitted exceptions provided for under the risk retention rules. During this time, LD III Sub IV LLC will agree to comply with hedging, transfer and financing restrictions that are applicable to third party purchasers under the credit risk retention rules. For additional information, see “Credit Risk Retention” in the Preliminary Prospectus.
|
| EU/UK Credit Risk Retention | None of the sponsors, the depositor, the underwriters, or their respective affiliates, or any other party to the transaction intends to retain a material net economic interest in the securitization constituted by the issue of the Certificates, or take any other action in respect of such securitization, in a manner prescribed or contemplated by (i) Regulation (EU) 2017/2402, or (ii) such Regulation as it forms part of UK domestic law. In particular, no such person undertakes to take any action which may be required by any investor for the purposes of its compliance with any applicable requirement under either such Regulation. Furthermore, the arrangements described under “Credit Risk Retention” in the Preliminary Prospectus have not been structured with the objective of ensuring compliance by any person with any requirements of either such Regulation. See “Risk Factors—Other Risks Relating to the Certificates—EU Securitization Regulation and UK Securitization Regulation Due Diligence Requirements” in the Preliminary Prospectus.
|
| Cut-off Date: | The Cut-off Date with respect to each mortgage loan is the payment due date for the monthly debt service payment that is due in December 2021 (or, in the case of any mortgage loan that has its first payment due date in January 2022, the date that would have been its payment due date in December 2021 under the terms of that mortgage loan if a monthly debt service payment were scheduled to be due in that month). |
| Expected Closing Date: | On or about December 6, 2021. |
THE INFORMATION IN THIS STRUCTURAL AND COLLATERAL TERM SHEET IS NOT COMPLETE AND MAY BE AMENDED PRIOR TO THE TIME OF SALE. THIS TERM SHEET IS NOT AN OFFER TO SELL THESE SECURITIES AND IT IS NOT A SOLICITATION OF AN OFFER TO BUY THESE SECURITIES IN ANY JURISDICTION WHERE THE OFFER OR SALE IS NOT PERMITTED.
8
| Wells Fargo Commercial Mortgage Trust 2021-C61 | Issue Characteristics |
| Determination Dates: | The 11th day of each month (or if that day is not a business day, the next succeeding business day), commencing in January 2022. |
| Distribution Dates: | The 4th business day following the Determination Date in each month, commencing in January 2022. |
| Rated Final Distribution Date: | The Distribution Date in November 2054. |
| Interest Accrual Period: | With respect to any Distribution Date, the calendar month immediately preceding the month in which such Distribution Date occurs. |
| Day Count: | The Offered Certificates will accrue interest on a 30/360 basis. |
| Minimum Denominations: | $10,000 for each Class of Offered Certificates (other than the Class X-A and X-B Certificates) and $1,000,000 for the Class X-A and X-B Certificates. Investments may also be made in any whole dollar denomination in excess of the applicable minimum denomination. |
| Clean-up Call: | 1.0% |
| Delivery: | DTC, Euroclear and Clearstream Banking |
| ERISA/SMMEA Status: | Each Class of Offered Certificates is expected to be eligible for exemptive relief under ERISA. No Class of Offered Certificates will be SMMEA eligible. |
| Risk Factors: | THE CERTIFICATES INVOLVE CERTAIN RISKS AND MAY NOT BE SUITABLE FOR ALL INVESTORS. SEE THE “RISK FACTORS” SECTION OF THE PRELIMINARY PROSPECTUS. |
| Bond Analytics Information: | The Certificate Administrator will be authorized to make distribution date statements, CREFC® reports and certain supplemental reports (other than confidential information) available to certain financial modeling and data provision services, including Bloomberg, L.P., Trepp, LLC, Intex Solutions, Inc., Interactive Data Corp., Markit Group Limited, BlackRock Financial Management, Inc., CMBS.com, Inc., Moody’s Analytics, Inc., Morningstar Credit Information & Analytics, LLC, KBRA Analytics, LLC, MBS Data, LLC, Thomson Reuters Corporation and RealINSIGHT. |
| Tax Treatment | For U.S. federal income tax purposes, the issuing entity will consist of two or more REMICs arranged in a tiered structure and a trust (the “grantor trust”). The upper-most REMIC will issue REMIC regular interests some of which will be held by the grantor trust (such grantor trust-held REMIC regular interests, the “trust components”). The Offered Certificates (other than the Exchangeable Certificates) will represent REMIC regular interests (other than the trust components). The Exchangeable Certificates will represent beneficial ownership of one or more of the trust components held by the grantor trust. |
THE INFORMATION IN THIS STRUCTURAL AND COLLATERAL TERM SHEET IS NOT COMPLETE AND MAY BE AMENDED PRIOR TO THE TIME OF SALE. THIS TERM SHEET IS NOT AN OFFER TO SELL THESE SECURITIES AND IT IS NOT A SOLICITATION OF AN OFFER TO BUY THESE SECURITIES IN ANY JURISDICTION WHERE THE OFFER OR SALE IS NOT PERMITTED.
9
| Wells Fargo Commercial Mortgage Trust 2021-C61 | Characteristics of the Mortgage Pool |
V. Characteristics of the Mortgage Pool
A. Ten Largest Mortgage Loans(1)
| Mortgage Loan Seller | Mortgage Loan Name | City | State | Number of Mortgage Loans / Mortgaged Properties | Mortgage Loan Cut-off Date Balance ($) | % of Initial Pool Balance (%) | Property Type | Number of SF/ Units/Pad | Cut-off Unit/Pad | Cut-off Date LTV Ratio (%) | Balloon or ARD LTV Ratio (%) | U/W NCF DSCR (x) | U/W NOI Debt Yield (%) |
| WFB | 1201 Lake Robbins | The Woodlands | TX | 1 / 1 | $70,000,000 | 9.2% | Office | 807,586 | $310 | 55.3% | 55.3% | 2.26x | 9.2% |
| LCF | 17 West Miami | Miami Beach | FL | 1 / 1 | 55,000,000 | 7.2 | Mixed Use | 63,146 | 871 | 65.9 | 65.9 | 1.90 | 7.5 |
| LMF | Hague + Galleries Mixed Use Portfolio | Various | NY | 1 / 2 | 37,000,000 | 4.8 | Various | 485,248 | 76 | 58.7 | 58.7 | 1.89 | 11.3 |
| LMF | TLR Portfolio | Various | FL | 1 / 3 | 35,000,000 | 4.6 | Multifamily | 688 | 120,640 | 65.4 | 65.4 | 1.78 | 7.4 |
| Column | OmniMax Industrial Portfolio II | Various | Various | 1 / 8 | 33,313,851 | 4.4 | Industrial | 683,992 | 49 | 66.6 | 66.6 | 2.26 | 8.7 |
| Column | 980 Madison | New York | NY | 1 / 1 | 25,000,000 | 3.3 | Mixed Use | 134,843 | 716 | 27.6 | 27.6 | 4.08 | 15.2 |
| LCF | Newhall Crossings | Santa Clarita | CA | 1 / 1 | 25,000,000 | 3.3 | Mixed Use | 77,227 | 324 | 61.7 | 61.7 | 1.90 | 7.5 |
| WFB | ExchangeRight 49 | Various | Various | 1 / 29 | 23,800,000 | 3.1 | Various | 621,901 | 111 | 61.5 | 61.5 | 2.56 | 9.4 |
| Oceanview | 501 Great Circle | Nashville | TN | 1 / 1 | 23,365,435 | 3.1 | Office | 109,295 | 214 | 63.5 | 50.4 | 1.67 | 10.0 |
| LMF | SSA Midwest MHC Portfolio | Various | Various | 1 / 12 | 20,700,000 | 2.7 | Manufactured Housing | 971 | 21,318 | 72.2 | 62.5 | 1.57 | 9.3 |
| Top Three Total/Weighted Average | 3 / 4 | $162,000,000 | 21.2% | 59.7% | 59.7% | 2.05x | 9.1% | ||||||
| Top Five Total/Weighted Average | 5 / 15 | $230,313,851 | 30.1% | 61.5% | 61.5% | 2.04x | 8.8% | ||||||
| Top Ten Total/Weighted Average | 10 / 59 | $348,179,286 | 45.5% | 59.9% | 58.4% | 2.16x | 9.3% | ||||||
| Non-Top Ten Total/Weighted Average | 51 / 106 | $416,239,114 | 54.5% | 60.0% | 53.3% | 2.14x | 11.3% | ||||||
| (1) | With respect to any mortgage loan that is part of a whole loan, Cut-off Date Balance Per SF/Unit/Pad, loan-to-value ratio, debt service coverage ratio and debt yield calculations include the related pari passu companion loan(s) (unless otherwise stated). With respect to each mortgage loan, debt service coverage ratio, debt yield and loan-to-value ratio information do not take into account subordinate debt (whether or not secured by the related mortgaged property), if any, that currently exists or is allowed under the terms of such mortgage loan. |
THE INFORMATION IN THIS STRUCTURAL AND COLLATERAL TERM SHEET IS NOT COMPLETE AND MAY BE AMENDED PRIOR TO THE TIME OF SALE. THIS TERM SHEET IS NOT AN OFFER TO SELL THESE SECURITIES AND IT IS NOT A SOLICITATION OF AN OFFER TO BUY THESE SECURITIES IN ANY JURISDICTION WHERE THE OFFER OR SALE IS NOT PERMITTED.
10
| Wells Fargo Commercial Mortgage Trust 2021-C61 | Characteristics of the Mortgage Pool |
B. Summary of the Whole Loans
| No. | Loan Name | Mortgage Loan Seller in WFCM 2020-C61 | Trust Cut-off Date Balance | Aggregate Pari Passu Companion Loan Cut-off Date Balance(1) | Controlling Pooling/Trust & Servicing Agreement | Master Servicer | Special Servicer | Related Pari Passu Companion Loan(s) Securitizations | Related Pari Passu Companion Loan(s) Original Balance |
| 1 | 1201 Lake Robbins | WFB | $70,000,000 | $250,000,000 | BANK 2021-BNK37(2) | Wells Fargo Bank, N.A. | CWCapital Asset Management LLC | BANK 2021-BNK37 Future Securitization | $180,000,000 |
| 4 | TLR Portfolio | LMF | 35,000,000 | 83,000,000 | WFCM 2021-C61(3) | Wells Fargo Bank, N.A.(3) | CWCapital Asset Management LLC(3) | Future Securitization | 48,000,000 |
| 6 | 980 Madison | Column | 25,000,000 | 96,500,000 | CSMC 2021-980M(4) | KeyBank National Association | Argentic Services Company LP | CSMC 2021-980M | 71,500,000 |
| 8 | ExchangeRight 49 | WFB | 23,800,000 | 68,800,000 | BANK 2021-BNK37(2) | Wells Fargo Bank, N.A. | CWCapital Asset Management LLC | BANK 2021-BNK37 | 45,000,000 |
| 11 | Meadowood Mall | WFB | 19,000,000 | 80,000,000 | WFCM 2021-C61(3) | Wells Fargo Bank, N.A.(3) | CWCapital Asset Management LLC(3) | Future Securitization | 61,000,000 |
| 28 | Wyndham National Hotel Portfolio | UBS AG | 9,499,623 | 137,744,535 | UBS 2019-C18 | Wells Fargo Bank, N.A. | Wells Fargo Bank, N.A. | BBCMS 2021-C10 BBCMS 2021-C11 Future Securitization | 128,244,912 |
| (1) | The Aggregate Pari Passu Companion Loan Cut-off Date Balance excludes any related Subordinate Companion Loans. |
| (2) | The BANK 2021-BNK37 transaction is expected to close on or about November 22, 2021. |
| (3) | The related whole loan is expected to initially be serviced under the WFCM 2021-C61 securitization pooling and servicing agreement until the securitization of the related “lead” pari passu note, after which the related whole loan will be serviced under the pooling and servicing agreement governing such securitization of the related “lead” pari passu note. The master servicer and special servicer for such securitization will be identified in a notice, report or statement to holders of the WFCM 2021-C61 certificates after the closing of such securitization. Control rights with respect to the related whole loan will be exercised by the holder of the “lead” pari passu note or, in the case of the Meadowood Mall Whole Loan, the holder of the subordinate companion note. |
| (4) | Control rights are currently exercised by the holder of the related Subordinate Companion Loan until the occurrence and during the continuation of a control appraisal period for the related whole loan, as described under “Description of the Mortgage Pool—The Whole Loans—The Non-Serviced AB Whole Loan—The 980 Madison Whole Loan in the Preliminary Prospectus. |
THE INFORMATION IN THIS STRUCTURAL AND COLLATERAL TERM SHEET IS NOT COMPLETE AND MAY BE AMENDED PRIOR TO THE TIME OF SALE. THIS TERM SHEET IS NOT AN OFFER TO SELL THESE SECURITIES AND IT IS NOT A SOLICITATION OF AN OFFER TO BUY THESE SECURITIES IN ANY JURISDICTION WHERE THE OFFER OR SALE IS NOT PERMITTED.
11
| Wells Fargo Commercial Mortgage Trust 2021-C61 | Characteristics of the Mortgage Pool |
C. Mortgage Loans with Additional Secured and Mezzanine Financing
| Loan No. | Mortgage Loan Seller | Mortgage Loan Name | Mortgage Loan Cut-off Date Balance ($) | % of Initial Pool Balance (%) | Sub Debt Cut-off Date Balance ($) | Mezzanine Debt Cut-off Date Balance ($) | Total Debt Interest Rate (%)(1) | Mortgage Loan U/W NCF DSCR (x)(2) | Total Debt U/W NCF DSCR (x) | Mortgage Loan Cut-off Date U/W NOI Debt Yield (%)(2) | Total Debt Cut-off Date U/W NOI Debt Yield (%) | Mortgage Loan Cut-off Date LTV Ratio (%)(2) | Total Debt Cut-off Date LTV Ratio (%) |
| 6 | Column | 980 Madison | $25,000,000 | 3.3% | $101,100,000 | $40,000,000 | 4.6770% | 4.08x | 1.28x | 15.2% | 6.2% | 27.6% | 67.9% |
| 9 | Oceanview | 501 Great Circle | 23,365,435 | 3.1 | NAP | 2,800,000 | 4.5171 | 1.67 | 1.31 | 10.0 | 8.9 | 63.5 | 71.2 |
| 11 | WFB | Meadowood Mall | 19,000,000 | 2.5 | 28,000,000 | NAP | 5.6981 | 2.98 | 1.81 | 19.8 | 14.7 | 35.2 | 47.6 |
| Total/Weighted Average | $67,365,435 | 8.8% | $129,100,000 | $42,800,000 | 4.8601% | 2.93x | 1.44x | 14.7% | 9.5% | 42.2% | 63.3% | ||
| (1) | Total Debt Interest Rate for any specified mortgage loan reflects the weighted average of the interest rates on the respective components of the total debt. |
| (2) | With respect to any mortgage loan that is part of a whole loan, the loan-to-value ratio, debt service coverage ratio and debt yield calculations include the related pari passu companion loan(s) but excludes any related subordinate companion loan. |
THE INFORMATION IN THIS STRUCTURAL AND COLLATERAL TERM SHEET IS NOT COMPLETE AND MAY BE AMENDED PRIOR TO THE TIME OF SALE. THIS TERM SHEET IS NOT AN OFFER TO SELL THESE SECURITIES AND IT IS NOT A SOLICITATION OF AN OFFER TO BUY THESE SECURITIES IN ANY JURISDICTION WHERE THE OFFER OR SALE IS NOT PERMITTED.
12
| Wells Fargo Commercial Mortgage Trust 2021-C61 | Characteristics of the Mortgage Pool |
D. Previous Securitization History(1)
| Loan No. | Mortgage Loan Seller | Mortgage Loan or Mortgaged Property Name | City | State | Property Type | Mortgage Loan or Mortgaged Property Cut-off Date Balance ($) | % of Initial Pool Balance (%) | Previous Securitization |
| 4.01 | LMF | Bahia Apartments | Tampa | FL | Multifamily | $17,470,482 | 2.3% | FREMF 2019-KJ26 |
| 4.02 | LMF | Royal Breeze Apartments | Clearwater | FL | Multifamily | 10,466,265 | 1.4 | Fannie Mae AN2360 |
| 4.03 | LMF | Lenox Place Apartments | Tampa | FL | Multifamily | 7,063,253 | 0.9 | Fannie Mae AN2359 |
| 8.01 | WFB | Valspar Industrial - Massillon, OH | Massillon | OH | Industrial | 3,957,624 | 0.5 | WFRBS 2014-C21 |
| 8.07 | WFB | Walgreens - Saint Joseph, MO | Saint Joseph | MO | Retail | 1,095,794 | 0.1 | JPMBB 2015-C30 |
| 10.05 | LMF | Bellevue | Bellevue | MI | Manufactured Housing | 2,055,000 | 0.3 | WFCM 2018-C43 |
| 10.06 | LMF | Edgewood | Springfield | OH | Manufactured Housing | 1,185,000 | 0.2 | WFCM 2018-C43 |
| 10.10 | LMF | Camelot South | Delta | OH | Manufactured Housing | 900,000 | 0.1 | WFCM 2018-C43 |
| 10.12 | LMF | Valley View | Quincy | IL | Manufactured Housing | 844,000 | 0.1 | WFCM 2018-C43 |
| 11 | WFB | Meadowood Mall | Reno | NV | Retail | 19,000,000 | 2.5 | GSMS 2012-GC6 |
| 12 | WFB | Highland Village Plaza | Highland | CA | Retail | 18,115,000 | 2.4 | UBSBB 2013-C5 |
| 13 | BSPRT | Poplar Run | Alexandria | VA | Office | 17,955,000 | 2.3 | CMLT 2008-LS1 |
| 14 | BSPRT | Tech Ridge Office Park | Tulsa | OK | Office | 17,324,688 | 2.3 | JPMCC 2016-JP4 |
| 15 | WFB | StorQuest Thousand Oaks | Thousand Oaks | CA | Self Storage | 14,000,000 | 1.8 | COMM 2015-DC1 |
| 16.01 | Column | Cardinal Creek | Columbus | OH | Multifamily | 5,771,155 | 0.8 | FRESB 2016-SB5 |
| 16.02 | Column | Courtship Village | Lancaster | OH | Multifamily | 4,642,884 | 0.6 | FRESB 2017-SB30 |
| 16.03 | Column | Kingswood Court | Newark | OH | Multifamily | 3,564,537 | 0.5 | FRESB 2018-SB49 |
| 20 | BSPRT | Village East Shopping Center | Salem | OR | Retail | 13,000,000 | 1.7 | BSCMS 2007-PW16 |
| 27.01 | LMF | Olive Properties | Las Vegas | NV | Multifamily | 3,800,000 | 0.5 | Fannie Mae AN5011 |
| 27.02 | LMF | Fremont Gardens | Las Vegas | NV | Multifamily | 3,100,000 | 0.4 | Fannie Mae AN5010 |
| 27.03 | LMF | Casa Bonita Apartments | Las Vegas | NV | Multifamily | 3,100,000 | 0.4 | FRESB 2019-SB68 |
| 44.01 | UBS AG | Walgreens - Greenville | Greenville | MI | Retail | 3,460,000 | 0.5 | WFCM 2014-LC16 |
| 52 | WFB | Walgreens - Socorro | Socorro | TX | Retail | 3,700,000 | 0.5 | MSBAM 2012-C5 |
| Total | $175,570,682 | 23.0% |
| (1) | The table above represents the most recent securitization with respect to the mortgaged property securing the related mortgage loan, based on information provided by the related borrower or obtained through searches of a third-party database. While loans secured by the above mortgaged properties may have been securitized multiple times in prior transactions, mortgage loans in this securitization are only listed in the above chart if the mortgage loan paid off a loan in another securitization. The information has not otherwise been confirmed by the mortgage loan sellers. |
THE INFORMATION IN THIS STRUCTURAL AND COLLATERAL TERM SHEET IS NOT COMPLETE AND MAY BE AMENDED PRIOR TO THE TIME OF SALE. THIS TERM SHEET IS NOT AN OFFER TO SELL THESE SECURITIES AND IT IS NOT A SOLICITATION OF AN OFFER TO BUY THESE SECURITIES IN ANY JURISDICTION WHERE THE OFFER OR SALE IS NOT PERMITTED.
13
| Wells Fargo Commercial Mortgage Trust 2021-C61 | Characteristics of the Mortgage Pool |
E. Mortgage Loans with Scheduled Balloon Payments and Related Classes
| Class A-2(1) | ||||||||||||||||
| Loan No. | Mortgage Loan Seller | Mortgage Loan Name | State | Property Type | Mortgage Loan Cut-off Date Balance ($) | % of Initial Pool Balance (%) | Mortgage Loan Balance at Maturity or ARD($) | % of Class A-2 Certificate Principal Balance (%)(2) | SF | Loan per SF ($) | U/W NCF DSCR (x) | U/W NOI Debt Yield (%) | Cut-off Date LTV Ratio (%) | Balloon or ARD LTV Ratio (%) | Rem. IO Period (mos.) | Rem. Term to Maturity or ARD (mos.) |
| 5 | Column | OmniMax Industrial Portfolio II | Various | Industrial | $33,313,851 | 4.4% | $33,313,851 | 30.8% | 683,992 | $49 | 2.26x | 8.7% | 66.6% | 66.6% | 53 | 53 |
| 6 | Column | 980 Madison | NY | Mixed Use | 25,000,000 | 3.3 | 25,000,000 | 23.1 | 134,843 | 716 | 4.08 | 15.2 | 27.6 | 27.6 | 55 | 55 |
| 8 | WFB | ExchangeRight 49 | Various | Various | 23,800,000 | 3.1 | 23,800,000 | 22.0 | 621,901 | 111 | 2.56 | 9.4 | 61.5 | 61.5 | 57 | 57 |
| 11 | WFB | Meadowood Mall | NV | Retail | 19,000,000 | 2.5 | 16,630,360 | 15.4 | 456,841 | 175 | 2.98 | 19.8 | 35.2 | 30.8 | 0 | 60 |
| 43 | LMF | South Holland Industrial | IL | Industrial | 5,500,000 | 0.7 | 5,500,000 | 5.1 | 202,902 | 27 | 2.15 | 10.2 | 59.8 | 59.8 | 58 | 58 |
| Total/Weighted Average | $106,613,851 | 13.9% | $104,244,211 | 96.4% | 2.88x | 12.4% | 50.4% | 49.6% | 45 | 56 | ||||||
| (1) | The table above presents the mortgage loan(s) whose balloon payments would be applied to pay down the principal balance of the Class A-2 Certificates, assuming a 0% CPR and applying the “Structuring Assumptions” described in the Preliminary Prospectus, including the assumptions that (i) none of the mortgage loans in the pool experience prepayments prior to maturity, defaults or losses; (ii) there are no extensions of maturity dates of any mortgage loans in the pool; and (iii) each mortgage loan in the pool is paid in full on its stated maturity date. Each Class of Certificates evidences undivided ownership interests in the entire pool of mortgage loans. Debt service coverage ratio, debt yield and loan-to-value ratio information do not take into account subordinate debt (whether or not secured by the related mortgaged property), if any, that currently exists or is allowed under the terms of any mortgage loan. See Annex A-1 to the Preliminary Prospectus. |
| (2) | Reflects the percentage equal to the Balloon Balance divided by the initial Class A-2 Certificate Balance. |
THE INFORMATION IN THIS STRUCTURAL AND COLLATERAL TERM SHEET IS NOT COMPLETE AND MAY BE AMENDED PRIOR TO THE TIME OF SALE. THIS TERM SHEET IS NOT AN OFFER TO SELL THESE SECURITIES AND IT IS NOT A SOLICITATION OF AN OFFER TO BUY THESE SECURITIES IN ANY JURISDICTION WHERE THE OFFER OR SALE IS NOT PERMITTED.
14
| Wells Fargo Commercial Mortgage Trust 2021-C61 | Characteristics of the Mortgage Pool |
F. Property Type Distribution(1)
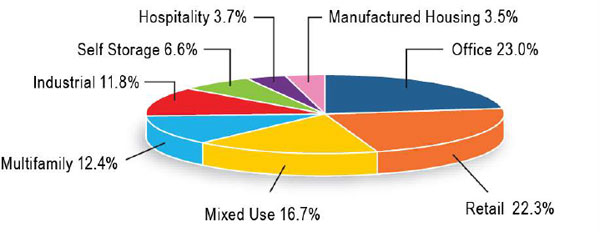
| Property Type | Number of Mortgaged Properties | Aggregate Cut-off Date Balance ($) | % of Initial Pool Balance (%) | Weighted Average Cut-off Date LTV Ratio (%) | Weighted Average Balloon LTV Ratio (%) | Weighted Average U/W NCF DSCR (x) | Weighted Average U/W NOI Debt Yield (%) | Weighted Average U/W NCF Debt Yield (%) | Weighted Average Mortgage Rate (%) |
| Office | 13 | $175,806,556 | 23.0% | 59.9% | 54.7% | 2.04x | 10.3% | 9.4% | 3.9849% |
| Suburban | 5 | 133,147,416 | 17.4 | 59.7 | 53.6 | 2.04 | 10.1 | 9.3 | 3.8055 |
| CBD | 1 | 18,130,000 | 2.4 | 58.7 | 58.7 | 1.89 | 11.3 | 9.7 | 5.0500 |
| Medical | 6 | 17,381,432 | 2.3 | 64.7 | 59.4 | 1.96 | 10.1 | 9.6 | 4.0920 |
| Flex | 1 | 7,147,708 | 0.9 | 53.7 | 53.7 | 2.68 | 13.1 | 11.9 | 4.3650 |
| Retail | 47 | 170,498,950 | 22.3 | 59.4 | 52.2 | 2.09 | 11.7 | 11.1 | 3.8416 |
| Anchored | 8 | 68,644,917 | 9.0 | 65.9 | 55.5 | 1.85 | 11.5 | 10.7 | 3.9442 |
| Single Tenant | 33 | 49,054,961 | 6.4 | 60.7 | 58.1 | 2.11 | 9.5 | 9.3 | 3.8079 |
| Unanchored | 4 | 30,488,995 | 4.0 | 57.3 | 48.7 | 2.02 | 10.6 | 10.1 | 3.6112 |
| Regional Mall | 1 | 19,000,000 | 2.5 | 35.2 | 30.8 | 2.98 | 19.8 | 18.7 | 3.9300 |
| Shadow Anchored | 1 | 3,310,077 | 0.4 | 62.5 | 49.5 | 2.00 | 12.5 | 11.2 | 3.8300 |
| Mixed Use | 5 | 127,840,000 | 16.7 | 56.5 | 56.5 | 2.31 | 9.6 | 9.2 | 3.9764 |
| Multifamily/Retail | 3 | 83,970,000 | 11.0 | 64.7 | 64.7 | 1.88 | 7.5 | 7.4 | 3.8474 |
| Office/Retail | 1 | 25,000,000 | 3.3 | 27.6 | 27.6 | 4.08 | 15.2 | 14.9 | 3.5995 |
| Industrial/Office | 1 | 18,870,000 | 2.5 | 58.7 | 58.7 | 1.89 | 11.3 | 9.7 | 5.0500 |
| Multifamily | 14 | 94,603,577 | 12.4 | 61.9 | 59.3 | 2.07 | 9.0 | 8.7 | 3.7618 |
| Garden | 12 | 78,453,577 | 10.3 | 60.8 | 58.6 | 2.20 | 9.2 | 8.8 | 3.7233 |
| Townhome | 1 | 12,350,000 | 1.6 | 67.1 | 60.9 | 1.42 | 8.1 | 8.0 | 3.8500 |
| Low Rise | 1 | 3,800,000 | 0.5 | 66.7 | 66.7 | 1.62 | 7.1 | 7.0 | 4.2700 |
| Industrial | 16 | 89,830,234 | 11.8 | 60.3 | 58.0 | 2.23 | 9.9 | 9.4 | 3.8496 |
| Flex | 5 | 42,443,759 | 5.6 | 55.1 | 50.3 | 2.17 | 10.8 | 10.1 | 3.9252 |
| Warehouse | 6 | 28,962,802 | 3.8 | 65.3 | 65.3 | 2.24 | 9.0 | 8.7 | 3.8334 |
| Manufacturing | 4 | 13,808,673 | 1.8 | 65.1 | 65.1 | 2.35 | 8.9 | 8.7 | 3.6544 |
| Warehouse Distribution | 1 | 4,615,000 | 0.6 | 62.4 | 62.4 | 2.46 | 10.5 | 9.6 | 3.8400 |
| Self Storage | 8 | 50,480,000 | 6.6 | 60.8 | 59.6 | 2.69 | 9.8 | 9.7 | 3.5306 |
| Self Storage | 8 | 50,480,000 | 6.6 | 60.8 | 59.6 | 2.69 | 9.8 | 9.7 | 3.5306 |
| Hospitality | 46 | 28,475,790 | 3.7 | 64.4 | 51.0 | 2.00 | 14.8 | 13.3 | 4.8305 |
| Limited Service | 46 | 28,475,790 | 3.7 | 64.4 | 51.0 | 2.00 | 14.8 | 13.3 | 4.8305 |
| Manufactured Housing | 16 | 26,883,294 | 3.5 | 66.1 | 56.5 | 1.68 | 10.0 | 9.7 | 3.9960 |
| Manufactured Housing | 16 | 26,883,294 | 3.5 | 66.1 | 56.5 | 1.68 | 10.0 | 9.7 | 3.9960 |
| Total | 165 | 764,418,400 | 100.0% | 59.9% | 55.7% | 2.15x | 10.4% | 9.8% | 3.9099% |
| (1) | Because this table presents information relating to the mortgaged properties and not the mortgage loans, (a) the information for mortgage loans secured by more than one mortgaged property (other than through cross-collateralization with other mortgage loans) is based on allocated loan amounts (allocating the principal balance of the mortgage loan to each of those properties according to the relative appraised values of the mortgaged properties or the allocated loan amounts or property-specific release prices set forth in the related mortgage loan documents or such other allocation as the related mortgage loan seller deemed appropriate) and (b) the information for each mortgaged property that relates to a mortgage loan that is cross-collateralized or cross-defaulted with other mortgage loans is based upon the principal balance of that mortgage loan, except that the applicable loan-to-value ratio, debt service coverage ratio and debt yield for each such mortgage loan is based upon the ratio or yield (as applicable) for the aggregate indebtedness evidenced by all loans in the group (without regard to any limitation on the amount of indebtedness secured by any mortgaged property in such cross-collateralized group). On an individual basis, without regard to the cross-collateralization feature, any mortgage loan that is part of a cross-collateralized group of mortgage loans may have a higher loan-to-value ratio, lower debt service coverage ratio and/or lower debt yield than is presented herein. With respect to any mortgage loan that is part of a whole loan, the loan-to-value ratio, debt service coverage ratio and debt yield calculations include the related pari passu companion loan(s) but exclude any related subordinate secured loan(s) (unless otherwise stated). With respect to each mortgage loan, debt service coverage ratio, debt yield and loan-to-value ratio information do not take into account any subordinate debt (whether or not secured by the related mortgaged property) that currently exists or is allowed under the terms of such mortgage loan. See Annex A-1 to the Preliminary Prospectus. |
THE INFORMATION IN THIS STRUCTURAL AND COLLATERAL TERM SHEET IS NOT COMPLETE AND MAY BE AMENDED PRIOR TO THE TIME OF SALE. THIS TERM SHEET IS NOT AN OFFER TO SELL THESE SECURITIES AND IT IS NOT A SOLICITATION OF AN OFFER TO BUY THESE SECURITIES IN ANY JURISDICTION WHERE THE OFFER OR SALE IS NOT PERMITTED.
15
| Wells Fargo Commercial Mortgage Trust 2021-C61 | Characteristics of the Mortgage Pool |
G. Geographic Distribution(1)(2)
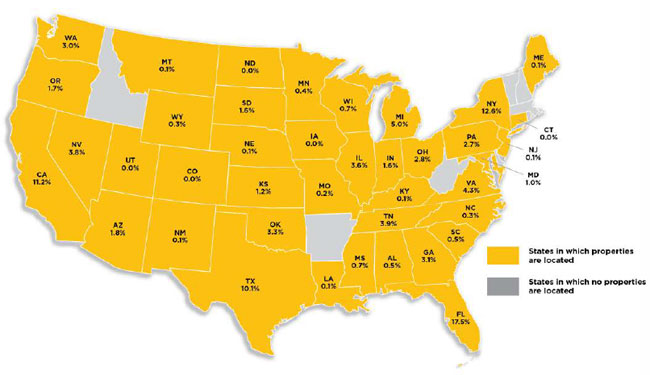
| Location | Number of Mortgaged Properties | Aggregate Cut-off Date Balance ($) | % of Initial Pool Balance (%) | Weighted Average Cut-off Date LTV Ratio (%) | Weighted Average Balloon or ARD LTV Ratio (%) | Weighted Average U/W NCF DSCR (x) | Weighted Average U/W NOI Debt Yield (%) | Weighted Average U/W NCF Debt Yield (%) | Weighted Average Mortgage Rate (%) |
| Florida | 11 | $133,892,467 | 17.5% | 63.9% | 62.5% | 2.09x | 9.2% | 8.8% | 3.8868% |
| New York | 8 | 95,953,743 | 12.6 | 52.1 | 50.6 | 2.28 | 11.1 | 10.3 | 4.3777 |
| California | 10 | 85,836,339 | 11.2 | 59.2 | 55.6 | 2.21 | 9.4 | 9.1 | 3.6551 |
| Texas | 7 | 77,334,331 | 10.1 | 56.2 | 56.1 | 2.25 | 9.2 | 8.8 | 3.8395 |
| Michigan | 21 | 37,863,310 | 5.0 | 63.8 | 58.3 | 1.98 | 9.7 | 9.4 | 3.7800 |
| Other(3) | 108 | 333,538,212 | 43.6 | 61.3 | 54.0 | 2.12 | 11.3 | 10.6 | 3.8813 |
| Total/Weighted Average | 165 | $764,418,400 | 100.0% | 59.9% | 55.7% | 2.15x | 10.4% | 9.8% | 3.9099% |
| (1) | The mortgaged properties are located in 40 states. |
| (2) | Because this table presents information relating to the mortgaged properties and not the mortgage loans, (a) the information for mortgage loans secured by more than one mortgaged property (other than through cross-collateralization with other mortgage loans) is based on allocated amounts (allocating the principal balance of the mortgage loan to each of those properties according to the relative appraised values of the mortgaged properties or the allocated loan amounts or property-specific release prices set forth in the related mortgage loan documents or such other allocation as the related mortgage loan seller deemed appropriate) and (b) the information for each mortgaged property that relates to a mortgage loan that is cross-collateralized or cross-defaulted with other mortgage loans is based upon the principal balance of that mortgage loan, except that the applicable loan-to-value ratio, debt service coverage ratio and debt yield for each such mortgage loan is based upon the ratio or yield (as applicable) for the aggregate indebtedness evidenced by all loans in the group (without regard to any limitation on the amount of indebtedness secured by any mortgaged property in such cross-collateralized group). On an individual basis, without regard to the cross-collateralization feature, any mortgage loan that is part of a cross-collateralized group of mortgage loans may have a higher loan-to-value ratio, lower debt service coverage ratio and/or lower debt yield than is presented herein. With respect to any mortgage loan that is part of a whole loan, the loan-to-value ratio, debt service coverage ratio and debt yield calculations include the related pari passu companion loan(s) but exclude any related subordinate secured loan(s) (unless otherwise stated). With respect to each mortgage loan, debt service coverage ratio, debt yield and loan-to-value ratio information do not take into account any subordinate debt (whether or not secured by the related mortgaged property) that currently exists or is allowed under the terms of such mortgage loan. See Annex A-1 to the Preliminary Prospectus. |
| (3) | Includes 35 other states. |
THE INFORMATION IN THIS STRUCTURAL AND COLLATERAL TERM SHEET IS NOT COMPLETE AND MAY BE AMENDED PRIOR TO THE TIME OF SALE. THIS TERM SHEET IS NOT AN OFFER TO SELL THESE SECURITIES AND IT IS NOT A SOLICITATION OF AN OFFER TO BUY THESE SECURITIES IN ANY JURISDICTION WHERE THE OFFER OR SALE IS NOT PERMITTED.
16
| Wells Fargo Commercial Mortgage Trust 2021-C61 | Characteristics of the Mortgage Pool |
H. Characteristics of the Mortgage Pool(1)
| CUT-OFF DATE BALANCE | |||
| Range of Cut-off Date Balances ($) | Number of Mortgage Loans | Aggregate Cut-off Date Balance | Percent by Aggregate Cut-off Date Pool Balance (%) |
| 1,910,000 - 2,000,000 | 1 | $1,910,000 | 0.2% |
| 2,000,001 - 3,000,000 | 2 | 4,975,000 | 0.7 |
| 3,000,001 - 4,000,000 | 10 | 35,214,495 | 4.6 |
| 4,000,001 - 5,000,000 | 3 | 13,651,054 | 1.8 |
| 5,000,001 - 6,000,000 | 4 | 21,150,000 | 2.8 |
| 6,000,001 - 7,000,000 | 4 | 25,783,294 | 3.4 |
| 7,000,001 - 8,000,000 | 4 | 30,435,492 | 4.0 |
| 8,000,001 - 9,000,000 | 5 | 41,661,462 | 5.5 |
| 9,000,001 - 10,000,000 | 2 | 19,499,623 | 2.6 |
| 10,000,001 - 15,000,000 | 12 | 149,564,007 | 19.6 |
| 15,000,001 - 20,000,000 | 4 | 72,394,688 | 9.5 |
| 20,000,001 - 30,000,000 | 5 | 117,865,435 | 15.4 |
| 30,000,001 - 50,000,000 | 3 | 105,313,851 | 13.8 |
| 50,000,001 - 70,000,000 | 2 | 125,000,000 | 16.4 |
| Total: | 61 | $764,418,400 | 100.0% |
| Average | $12,531,449 |
| |
| UNDERWRITTEN NOI DEBT SERVICE COVERAGE RATIO | |||
| Range of U/W NOI DSCRs (x) | Number of Mortgage Loans | Aggregate Cut-off Date Balance | Percent by Aggregate Cut-off Date Pool Balance (%) |
| 1.31 - 1.50 | 4 | $40,500,000 | 5.3% |
| 1.51 - 2.00 | 23 | 287,652,263 | 37.6 |
| 2.01 - 2.50 | 19 | 273,176,376 | 35.7 |
| 2.51 - 3.00 | 8 | 78,564,761 | 10.3 |
| 3.01 - 3.50 | 3 | 34,525,000 | 4.5 |
| 3.51 - 4.00 | 1 | 13,000,000 | 1.7 |
| 4.01 - 4.50 | 2 | 29,000,000 | 3.8 |
| 4.51 - 5.07 | 1 | 8,000,000 | 1.0 |
| Total: | 61 | $764,418,400 | 100.0% |
| Weighted Average | 2.27x | ||
| UNDERWRITTEN NCF DEBT SERVICE COVERAGE RATIO | |||
Range of U/W NCF DSCRs (x) | Number of Mortgage Loans | Aggregate Cut-off Date Balance | Percent by Aggregate Cut-off Date Pool Balance (%) |
| 1.26 - 1.50 | 4 | $40,500,000 | 5.3% |
| 1.51 - 2.00 | 30 | $386,072,918 | 50.5 |
| 2.01 - 2.50 | 13 | $179,370,721 | 23.5 |
| 2.51 - 3.00 | 8 | $92,949,761 | 12.2 |
| 3.01 - 3.50 | 2 | 15,525,000 | 2.0 |
| 3.51 - 4.00 | 1 | 13,000,000 | 1.7 |
| 4.01 - 4.50 | 2 | 29,000,000 | 3.8 |
| 4.51 - 4.77 | 1 | 8,000,000 | 1.0 |
| Total: | 61 | $764,418,400 | 100.0% |
| Weighted Average | 2.15x | ||
| LOAN PURPOSE | |||
| Loan Purpose | Number of Mortgage Loans | Aggregate Cut-off Date Balance | Percent by Aggregate Cut-off Date Pool Balance (%) |
| Refinance | 32 | $413,647,057 | 54.1% |
| Acquisition | 27 | 260,071,343 | 34.0 |
| Recapitalization | 1 | 70,000,000 | 9.2 |
| Acquisition/Refinance | 1 | 20,700,000 | 2.7 |
| Total: | 61 | $764,418,400 | 100.0% |
| MORTGAGE RATE | |||
Range of Mortgage Rates (%) | Number of Mortgage Loans | Aggregate Cut-off Date Balance | Percent by Aggregate Cut-off Date Pool Balance (%) |
| 3.0150 - 3.2500 | 3 | $24,264,417 | 3.2% |
| 3.2501 - 3.5000 | 8 | 80,303,995 | 10.5 |
| 3.5001 - 3.7500 | 10 | 146,543,481 | 19.2 |
| 3.7501 - 4.0000 | 20 | 345,938,159 | 45.3 |
| 4.0001 - 4.2500 | 7 | 35,058,294 | 4.6 |
| 4.2501 - 4.5000 | 8 | 68,476,730 | 9.0 |
| 4.5001 - 4.7500 | 2 | 6,845,000 | 0.9 |
| 4.7501 - 5.5900 | 3 | 56,988,324 | 7.5 |
| Total: | 61 | $764,418,400 | 100.0% |
| Weighted Average | 3.9099% | ||
| UNDERWRITTEN NOI DEBT YIELD | |||
Range of U/W NOI Debt Yields (%) | Number of Mortgage Loans | Aggregate Cut-off Date Balance | Percent by Aggregate Cut-off Date Pool Balance (%) |
| 7.1 - 8.0 | 8 | $142,970,000 | 18.7% |
| 8.1 - 9.0 | 9 | 86,938,851 | 11.4 |
| 9.1 - 10.0 | 13 | 215,146,978 | 28.1 |
| 10.1 - 11.0 | 8 | 49,881,961 | 6.5 |
| 11.1 - 12.0 | 7 | 117,408,265 | 15.4 |
| 12.1 - 13.0 | 7 | 50,954,260 | 6.7 |
| 13.1 - 14.0 | 2 | 22,138,700 | 2.9 |
| 14.1 - 15.0 | 2 | 13,499,623 | 1.8 |
| 15.1 - 16.0 | 4 | 46,479,761 | 6.1 |
| 16.1 - 19.8 | 1 | 19,000,000 | 2.5 |
| Total: | 61 | $764,418,400 | 100.0% |
| Weighted Average | 10.4% | ||
| UNDERWRITTEN NCF DEBT YIELD | |||
Range of U/W NCF Debt Yields (%) | Number of Mortgage Loans | Aggregate Cut-off Date Balance | Percent by Aggregate Cut-off Date Pool Balance (%) |
| 7.0 - 8.0 | 10 | $158,195,000 | 20.7% |
| 8.1 - 9.0 | 12 | 190,663,851 | 24.9 |
| 9.1 - 10.0 | 16 | 183,853,369 | 24.1 |
| 10.1 - 11.0 | 7 | 61,724,017 | 8.1 |
| 11.1 - 12.0 | 7 | 66,751,948 | 8.7 |
| 12.1 - 13.0 | 3 | 33,750,454 | 4.4 |
| 13.1 - 15.0 | 5 | 50,479,761 | 6.6 |
| 15.1 - 18.7 | 1 | 19,000,000 | 2.5 |
| Totals: | 61 | $764,418,400 | 100.0% |
| Weighted Average | 9.8% | ||
| ORIGINAL TERM TO MATURITY OR ARD | |||
| Original Term to Maturity or ARD (months) | Number of Mortgage Loans | Aggregate Cut-off Date Balance | Percent by Aggregate Cut-off Date Pool Balance (%) |
| 60 | 5 | $106,613,851 | 13.9% |
| 120 | 56 | 657,804,549 | 86.1 |
| Total: | 61 | $764,418,400 | 100.0% |
| Weighted Average | 112 months | ||
| (1) | The information for each mortgaged property that relates to a mortgage loan that is cross-collateralized or cross-defaulted with one or more other mortgage loans is based upon the principal balance of that mortgage loan, except that the applicable loan-to-value ratio, debt service coverage ratio, and debt yield for each such mortgage loan is based upon the ratio or yield (as applicable) for the aggregate indebtedness evidenced by all loans in the group (without regard to any limitation on the amount of indebtedness secured by any mortgaged property in such cross-collateralized group). With respect to any mortgage loan that is part of a whole loan, the loan-to-value ratio, debt service coverage ratio and debt yield calculations include the related pari passu companion loan(s) but exclude any related subordinate debt (unless otherwise stated). With respect to each mortgage loan, debt service coverage ratio, debt yield and loan-to-value ratio information do not take into account any subordinate debt (whether or not secured by the related mortgaged property) that currently exists or is allowed under the terms of such mortgage loan. See Annex A-1 to the Preliminary Prospectus. Prepayment provisions for each mortgage loan reflects the entire life of the loan (from origination to maturity) and may be currently prepayable. |
THE INFORMATION IN THIS STRUCTURAL AND COLLATERAL TERM SHEET IS NOT COMPLETE AND MAY BE AMENDED PRIOR TO THE TIME OF SALE. THIS TERM SHEET IS NOT AN OFFER TO SELL THESE SECURITIES AND IT IS NOT A SOLICITATION OF AN OFFER TO BUY THESE SECURITIES IN ANY JURISDICTION WHERE THE OFFER OR SALE IS NOT PERMITTED.
17
| Wells Fargo Commercial Mortgage Trust 2021-C61 | Characteristics of the Mortgage Pool |
| REMAINING TERM TO MATURITY OR ARD | |||
| Range of Remaining Terms to Maturity or ARD (months) | Number of Mortgage Loans | Aggregate Cut-off Date Balance | Percent by Aggregate Cut-off Date Pool Balance (%) |
| 53 - 60 | 5 | $106,613,851 | 13.9% |
| 61 - 120 | 56 | $657,804,549 | 86.1 |
| Total: | 61 | $764,418,400 | 100.0% |
| Weighted Average | 108 months | ||
| ORIGINAL AMORTIZATION TERM(2) | |||
| Original Amortization Terms (months) | Number of Mortgage Loans | Aggregate Cut-off Date Balance | Percent by Aggregate Cut-off Date Pool Balance (%) |
| Non-Amortizing | 29 | $435,668,851 | 57.0% |
| 270 - 300 | 2 | 28,499,623 | 3.7 |
| 301 - 360 | 30 | 300,249,926 | 39.3 |
| Total: | 61 | $764,418,400 | 100.0% |
| Weighted Average(3) | 354 months | ||
(2) The original amortization term shown for any mortgage loan that is interest-only for part of its term does not include the number of months in its interest-only period and reflects only the number of months as of the commencement of amortization remaining from the end of such interest-only period. (3) Excludes the non-amortizing mortgage loans. | |||
| REMAINING AMORTIZATION TERM(4) | |||
| Range of Remaining Amortization Terms (months) | Number of Mortgage Loans | Aggregate Cut-off Date Balance | Percent by Aggregate Cut-off Date Pool Balance (%) |
| Non-Amortizing | 29 | $435,668,851 | 57.0% |
| 246 - 300 | 2 | 28,499,623 | 3.7 |
| 301 - 360 | 30 | 300,249,926 | 39.3 |
| Total: | 61 | $764,418,400 | 100.0% |
| Weighted Average(5): | 351 months | ||
(4) The remaining amortization term shown for any mortgage loan that is interest-only for part of its term does not include the number of months in its interest-only period and reflects only the number of months as of the commencement of amortization remaining from the end of such interest-only period. (5) Excludes the non-amortizing mortgage loans. | |||
| LOCKBOXES | |||
| Type of Lockbox | Number of Mortgage Loans | Aggregate Cut-off Date Balance | Percent by Aggregate Cut-off Date Pool Balance (%) |
| Springing | 38 | $305,160,083 | 39.9% |
| Hard / Springing Cash Management | 15 | 281,614,740 | 36.8 |
| Soft / Springing Cash Management | 4 | 82,093,577 | 10.7 |
| Hard / In Place Cash Management | 2 | 78,550,000 | 10.3 |
| None | 2 | 17,000,000 | 2.2 |
| Total: | 61 | $764,418,400 | 100.0% |
| PREPAYMENT PROVISION SUMMARY(6) | |||
| Prepayment Provision | Number of Mortgage Loans | Aggregate Cut-off Date Balance | Percent by Aggregate Cut-off Date Pool Balance (%) |
| Lockout / Defeasance / Open | 48 | $619,822,047 | 81.1% |
| Lockout / GRTR 1% or YM / Open | 7 | 67,855,000 | 8.9 |
| GRTR 0.5% or YM / Open | 1 | 25,000,000 | 3.3 |
| Lockout / GRTR 2% or YM / Open | 2 | 21,149,623 | 2.8 |
| Lockout / GRTR 1% or YM / Defeasance / Open | 1 | 13,762,130 | 1.8 |
| Lockout / GRTR 3% or YM / Defeasance / Open | 1 | 11,804,600 | 1.5 |
| GRTR 1% or YM / Open | 1 | 5,025,000 | 0.7 |
| Total: | 61 | $764,418,400 | 100.0% |
| (6) As a result of property releases or the application of funds in a performance reserve, partial principal prepayments could occur during a period that voluntary principal prepayments are otherwise prohibited. | |||
CUT-OFF DATE LOAN-TO-VALUE RATIO | |||
| Range of Cut-off Date LTV Ratios (%) | Number of Mortgage Loans | Aggregate Cut-off Date Balance | Percent by Aggregate Cut-off Date Pool Balance (%) |
| 27.6 - 30.0 | 1 | $25,000,000 | 3.3% |
| 30.1 - 35.0 | 1 | 8,000,000 | 1.0 |
| 35.1 - 40.0 | 2 | 23,000,000 | 3.0 |
| 40.1 - 45.0 | 2 | 14,043,759 | 1.8 |
| 45.1 - 50.0 | 1 | 6,183,294 | 0.8 |
| 50.1 - 55.0 | 5 | 26,351,712 | 3.4 |
| 55.1 - 60.0 | 11 | 195,645,643 | 25.6 |
| 60.1 - 65.0 | 21 | 212,850,949 | 27.8 |
| 65.1 - 70.0 | 14 | 216,736,500 | 28.4 |
| 70.1 - 72.5 | 3 | 36,606,543 | 4.8 |
| Total: | 61 | $764,418,400 | 100.0% |
| Weighted Average | 59.9% | ||
| BALLOON LOAN-TO-VALUE RATIO | |||
| Range of Balloon LTV Ratios (%) | Number of Mortgage Loans | Aggregate Cut-off Date Balance | Percent by Aggregate Cut-off Date Pool Balance (%) |
| 27.6 - 30.0 | 1 | $25,000,000 | 3.3% |
| 30.1 - 35.0 | 2 | 27,000,000 | 3.5 |
| 35.1 - 40.0 | 3 | 14,227,052 | 1.9 |
| 40.1 - 45.0 | 3 | 18,256,712 | 2.4 |
| 45.1 - 50.0 | 5 | 43,649,739 | 5.7 |
| 50.1 - 55.0 | 12 | 143,310,803 | 18.7 |
| 55.1 - 60.0 | 14 | 200,700,243 | 26.3 |
| 60.1 - 65.0 | 14 | 154,740,000 | 20.2 |
| 65.1 - 69.3 | 7 | 137,533,851 | 18.0 |
| Total: | 61 | $764,418,400 | 100.0% |
| Weighted Average | 55.7% | ||
| AMORTIZATION TYPE | |||
| Amortization Type | Number of Mortgage Loans | Aggregate Cut-off Date Balance | Percent by Aggregate Cut-off Date Pool Balance (%) |
| Interest Only | 29 | $435,668,851 | 57.0% |
| Amortizing Balloon | 17 | 179,014,949 | 23.4 |
| Interest Only, Amortizing Balloon | 15 | 149,734,600 | 19.6 |
| Total: | 61 | $764,418,400 | 100.0% |
| ORIGINAL TERM OF INTEREST-ONLY PERIOD FOR PARTIAL IO LOANS | |||
| IO Term (months) | Number of Mortgage Loans | Aggregate Cut-off Date Balance | Percent by Aggregate Cut-off Date Pool Balance (%) |
| 24 | 1 | 8,150,000 | 1.1% |
| 36 | 6 | 74,995,000 | 9.8 |
| 48 | 1 | 1,910,000 | 0.2 |
| 60 | 7 | $64,679,600 | 8.5 |
| Total: | 15 | $149,734,600 | 19.6% |
| Weighted Average | 46 months | ||
| SEASONING | |||
| Seasoning (months) | Number of Mortgage Loans | Aggregate Cut-off Date Balance | Percent by Aggregate Cut-off Date Pool Balance (%) |
| 0 | 4 | $126,955,000 | 16.6% |
| 1 | 30 | 261,890,998 | 34.3 |
| 2 | 16 | 214,740,655 | 28.1 |
| 3 | 2 | 41,915,000 | 5.5 |
| 4 | 1 | 4,000,000 | 0.5 |
| 5 | 2 | 28,700,000 | 3.8 |
| 7 | 1 | 33,313,851 | 4.4 |
| 21 | 2 | 17,836,543 | 2.3 |
| 23 | 2 | 25,566,730 | 3.3 |
| 24 | 1 | 9,499,623 | 1.2 |
| Total: | 61 | $764,418,400 | 100.0% |
| Weighted Average | 3 months | ||
THE INFORMATION IN THIS STRUCTURAL AND COLLATERAL TERM SHEET IS NOT COMPLETE AND MAY BE AMENDED PRIOR TO THE TIME OF SALE. THIS TERM SHEET IS NOT AN OFFER TO SELL THESE SECURITIES AND IT IS NOT A SOLICITATION OF AN OFFER TO BUY THESE SECURITIES IN ANY JURISDICTION WHERE THE OFFER OR SALE IS NOT PERMITTED.
18
| Wells Fargo Commercial Mortgage Trust 2021-C61 | Certain Terms and Conditions |
VI. Certain Terms and Conditions
| Interest Entitlements: | The interest entitlement of each Class of Certificates or trust component on each Distribution Date generally will be the interest accrued during the related Interest Accrual Period on the related Certificate Balance or Notional Amount at the related pass-through rate, net of any prepayment interest shortfalls allocated to that Class or trust component for such Distribution Date as described below. If prepayment interest shortfalls arise from voluntary prepayments (without Master Servicer consent) on particular non-specially serviced loans during any collection period, the Master Servicer is required to make a compensating interest payment to offset those shortfalls, generally up to an amount equal to the portion of its master servicing fees that accrue at 0.25 basis points per annum. The remaining amount of prepayment interest shortfalls will be allocated to reduce the interest entitlement on all Classes of Certificates (other than the Exchangeable Certificates) and trust components that are entitled to interest, on a pro rata basis, based on their respective amounts of accrued interest for the related Distribution Date. For any Distribution Date, prepayment interest shortfalls allocated to a trust component will be allocated amongst the related Classes of Exchangeable Certificates, pro rata, in accordance with their respective interest accrual amounts for that distribution date. If a Class or trust component receives less than the entirety of its interest entitlement on any Distribution Date, then the shortfall (excluding any shortfall due to prepayment interest shortfalls), together with interest thereon, will be added to its interest entitlement for the next succeeding Distribution Date. |
| Principal Distribution Amount: | The Principal Distribution Amount for each Distribution Date generally will be the aggregate amount of principal received or advanced in respect of the mortgage loans, net of any non-recoverable advances and interest thereon and workout-delayed reimbursement amounts that are reimbursed to the Master Servicer, the Special Servicer or the Trustee during the related collection period. Non-recoverable advances and interest thereon are reimbursable from principal collections and advances before reimbursement from other amounts. Workout-delayed reimbursement amounts are reimbursable from principal collections. |
| Subordination, Allocation of Losses and Certain Expenses | The chart below describes the manner in which the payment rights of certain Classes of Certificates will be senior or subordinate, as the case may be, to the payment rights of other Classes of Certificates. The chart also shows the corresponding entitlement to receive principal and/or interest of certain Classes of Certificates on any distribution date in descending order. It also shows the manner in which losses are allocated to certain Classes of Certificates in ascending order (beginning with the Non-Offered Certificates, other than the Class R Certificates) to reduce the Certificate Balance of each such Class to zero; provided that no principal payments or mortgage loan losses will be allocated to the Class X-A, X-B, X-D or R Certificates, although principal payments and losses may reduce the Notional Amounts of the Class X-A, X-B and X-D Certificates and, therefore, the amount of interest they accrue. |
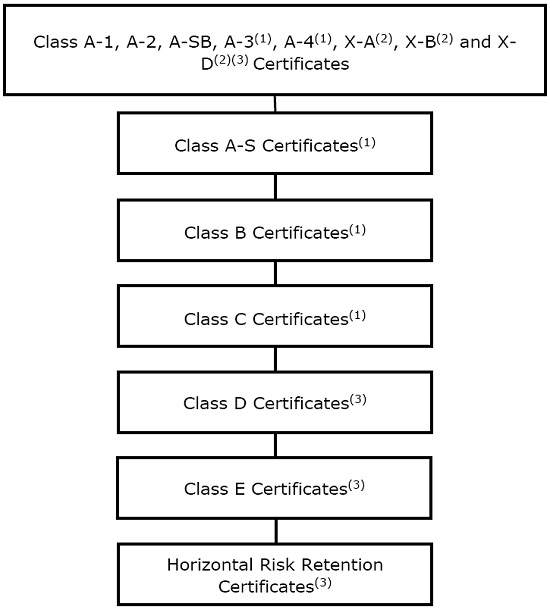 |
THE INFORMATION IN THIS STRUCTURAL AND COLLATERAL TERM SHEET IS NOT COMPLETE AND MAY BE AMENDED PRIOR TO THE TIME OF SALE. THIS TERM SHEET IS NOT AN OFFER TO SELL THESE SECURITIES AND IT IS NOT A SOLICITATION OF AN OFFER TO BUY THESE SECURITIES IN ANY JURISDICTION WHERE THE OFFER OR SALE IS NOT PERMITTED.
19
| Wells Fargo Commercial Mortgage Trust 2021-C61 | Certain Terms and Conditions |
| (1) | The maximum certificate balances of Class A-3, Class A-4, Class A-S, Class B and Class C certificates (subject to the constraint on the aggregate initial certificate balance of the Class A-3 and Class A-4 trust components discussed in footnote (9) to the table under “Certificate Structure”) will be issued on the closing date, and the certificate balance or notional amount of each other class of Exchangeable Certificates will be equal to zero on the closing date. The relative priorities of the Exchangeable Certificates are described more fully under “Exchangeable Certificates”. |
| (2) | The Class X-A, X-B and X-D Certificates are interest-only certificates. |
| (3) | Non-Offered Certificates. |
| Distributions: | On each Distribution Date, funds available for distribution from the mortgage loans, net of specified trust fees, expenses and reimbursements will generally be distributed in the following amounts and order of priority (in each case to the extent of remaining available funds): |
| 1. | Class A-1, A-2, A-SB, X-A, X-B and X-D Certificates and the Class A-3, A-3-X1, A-3-X2, A-4, A-4-X1 and A-4-X2 trust components: To interest on the Class A-1, A-2, A-SB, X-A and X-B Certificates and the Class A-3, A-3-X1, A-3-X2, A-4, A-4-X1 and A-4-X2 trust components, pro rata, according to their respective interest entitlements. |
| 2. | Class A-1, A-2 and A-SB Certificates and the Class A-3 and A-4 trust components: To principal on the Class A-1, A-2 and A-SB Certificates and the Class A-3 and A-4 trust components in the following amounts and order of priority: (i) first, to principal on the Class A-SB Certificates, in an amount up to the Principal Distribution Amount for such Distribution Date until their Certificate Balance is reduced to the Class A-SB Planned Principal Balance for such Distribution Date; (ii) second, to principal on the Class A-1 Certificates until their Certificate Balance is reduced to zero, up to the remainder of the Principal Distribution Amount for such Distribution Date; (iii) third, to principal on the Class A-2 Certificates until their Certificate Balance is reduced to zero, up to the remainder of the Principal Distribution Amount for such Distribution Date; (iv) fourth, to principal on the Class A-3 trust component until its Certificate Balance is reduced to zero, up to the remainder of the Principal Distribution Amount for such Distribution Date; (v) fifth, to principal on the Class A-4 trust component until its Certificate Balance is reduced to zero, up to the remainder of the Principal Distribution Amount for such Distribution Date; and (vi) sixth, to principal on the Class A-SB Certificates until their Certificate Balance is reduced to zero, up to the remainder of the Principal Distribution Amount for such Distribution Date. However, if the Certificate Balance of each Class of Principal Balance Certificates, other than the Class A-1, A-2 and A-SB Certificates and the Class A-3 and A-4 trust components, has been reduced to zero as a result of the allocation of mortgage loan losses and expenses and any of the Class A-1, A-2 and A-SB Certificates and the Class A-3 and A-4 trust components remains outstanding, then the Principal Distribution Amount will be distributed to the Class A-1, A-2 and A-SB Certificates and the Class A-3 and A-4 trust components remaining outstanding, pro rata, based on their respective outstanding Certificate Balances, until their Certificate Balances have been reduced to zero. |
| 3. | Class A-1, A-2 and A-SB Certificates and the Class A-3 and A-4 trust components: To reimburse the holders of the Class A-1, A-2 and A-SB Certificates and the Class A-3 and A-4 trust components, pro rata, on the basis of previously allocated unreimbursed losses, for any previously unreimbursed losses (plus interest thereon) on the mortgage loans that were previously allocated in reduction of the Certificate Balances of such Classes or trust components. |
| 4. | Class A-S, A-S-X1 and A-S-X2 trust components: To make distributions on the Class A-S, A-S-X1 and A-S-X2 trust components as follows: (a) first, to interest on the Class A-S, A-S-X1 and A-S-X2 trust components, pro rata, according to their respective interest entitlements; (b) next, to the extent of the portion of the Principal Distribution Amount remaining after distributions in respect of principal to each Class with a higher distribution priority (in this case, the Class A-1, A-2 and A-SB Certificates and the Class A-3 and A-4 trust components), to principal on the Class A-S trust component until its Certificate Balance is reduced to zero; and (c) next, to reimburse the holders of the Class A-S trust component for any previously unreimbursed losses (plus interest thereon) on the mortgage loans that were previously allocated to that trust component in reduction of their Certificate Balance. |
| 5. | Class B, B-X1, B-X2 trust components: To make distributions on the Class B, B-X1 and B-X2 trust components as follows: (a) first, to interest on the Class B, B-X1 and B-X2 trust components, pro rata, according to their respective interest entitlements; (b) next, to the extent of the portion of the Principal Distribution Amount remaining after distributions in respect of principal to each Class with a higher distribution priority (in this case, the Class A-1, A-2 and A-SB Certificates and the Class A-3, A-4 and A-S trust |
THE INFORMATION IN THIS STRUCTURAL AND COLLATERAL TERM SHEET IS NOT COMPLETE AND MAY BE AMENDED PRIOR TO THE TIME OF SALE. THIS TERM SHEET IS NOT AN OFFER TO SELL THESE SECURITIES AND IT IS NOT A SOLICITATION OF AN OFFER TO BUY THESE SECURITIES IN ANY JURISDICTION WHERE THE OFFER OR SALE IS NOT PERMITTED.
20
| Wells Fargo Commercial Mortgage Trust 2021-C61 | Certain Terms and Conditions |
components), to principal on the Class B trust component until its Certificate Balance is reduced to zero; and (c) next, to reimburse the holders of the Class B trust component for any previously unreimbursed losses (plus interest thereon) on the mortgage loans that were previously allocated to that trust component in reduction of their Certificate Balance.
| |||
| 6. | Class C, C-X1, C-X2 trust components: To make distributions on the Class C, C-X1 and C-X2 trust components as follows: (a) first, to interest on the Class C, C-X1 and C-X2 trust components, pro rata, according to their respective interest entitlements; (b) next, to the extent of the portion of the Principal Distribution Amount remaining after distributions in respect of principal to each Class with a higher distribution priority (in this case, the Class A-1, A-2 and A-SB Certificates and the Class A-3, A-4, A-S and B trust components), to principal on the Class C trust component until its Certificate Balance is reduced to zero; and (c) next, to reimburse the holders of the Class C trust component for any previously unreimbursed losses (plus interest thereon) on the mortgage loans that were previously allocated to that trust component in reduction of their Certificate Balance. |
| 7. | Class D Certificates: To make distributions on the Class D Certificates as follows: (a) first, to interest on the Class D Certificates in the amount of the interest entitlement for that Class; (b) next, to the extent of the portion of the Principal Distribution Amount remaining after distributions in respect of principal to each Class with a higher distribution priority (in this case, the Class A-1, A-2 and A-SB Certificates and the Class A-3, A-4, A-S, B and C trust components), to principal on the Class D Certificates until their Certificate Balance is reduced to zero; and (c) next, to reimburse the holders of the Class D Certificates for any previously unreimbursed losses (plus interest thereon) on the mortgage loans that were previously allocated to that Class in reduction of their Certificate Balance. |
| 8. | Class E Certificates: To make distributions on the Class E Certificates as follows: (a) first, to interest on the Class E Certificates in the amount of the interest entitlement for that Class; (b) next, to the extent of the portion of the Principal Distribution Amount remaining after distributions in respect of principal to each Class with a higher distribution priority (in this case, the Class A-1, A-2 and A-SB and D Certificates and the Class A-3, A-4, A-S, B and C trust components), to principal on the Class E Certificates until their Certificate Balance is reduced to zero; and (c) next, to reimburse the holders of the Class E Certificates for any previously unreimbursed losses (plus interest thereon) on the mortgage loans that were previously allocated to that Class in reduction of their Certificate Balance. |
| 9. | After the Class A-1, A-2, A-SB, D and E Certificates and the Class A-3, A-4, A-S, B and C trust components are paid all amounts to which they are entitled, the remaining funds available for distribution will be used to pay interest, principal and loss reimbursement amounts on the Class F-RR, G-RR, H-RR, J-RR, K-RR and L-RR Certificates sequentially in that order in a manner analogous to the Class E Certificates. |
| Principal and interest payable on the Class A-3, A-3-X1, A-3-X2, A-4, A-4-X1, A-4-X2, A-S, A-S-X1, A-S-X2, B, B-X1, B-X2, C, C-X1 and C-X2 trust components will be distributed pro rata to the corresponding classes of Exchangeable Certificates representing interests therein in accordance with their Class Percentage Interests therein as described below under “Exchangeable Certificates”. | |
| Exchangeable Certificates: | Each class of Exchangeable Certificates may be exchanged for the corresponding classes of Exchangeable Certificates set forth next to such class in the table below, and vice versa. Following any exchange of one or more classes of Exchangeable Certificates (the applicable “Surrendered Classes”) for one or more classes of other Exchangeable Certificates (the applicable “Received Classes”), the Class Percentage Interests (as defined below) of the outstanding certificate balances or notional amounts of the Corresponding Trust Components that are represented by the Surrendered Classes (and consequently their related certificate balances or notional amounts) will be decreased, and those of the Received Classes (and consequently their related certificate balances or notional amounts) will be increased. The dollar denomination of each of the Received Classes of certificates must be equal to the dollar denomination of each of the Surrendered Classes of certificates. No fee will be required with respect to any exchange of Exchangeable Certificates.
|
Surrendered Classes (or Received Classes) of Certificates | Received Classes (or Surrendered Classes) of Certificates |
| Class A-3 | Class A-3-1, Class A-3-X1 |
| Class A-3 | Class A-3-2, Class A-3-X2 |
| Class A-4 | Class A-4-1, Class A-4-X1 |
THE INFORMATION IN THIS STRUCTURAL AND COLLATERAL TERM SHEET IS NOT COMPLETE AND MAY BE AMENDED PRIOR TO THE TIME OF SALE. THIS TERM SHEET IS NOT AN OFFER TO SELL THESE SECURITIES AND IT IS NOT A SOLICITATION OF AN OFFER TO BUY THESE SECURITIES IN ANY JURISDICTION WHERE THE OFFER OR SALE IS NOT PERMITTED.
21
| Wells Fargo Commercial Mortgage Trust 2021-C61 | Certain Terms and Conditions |
Surrendered Classes (or Received Classes) of Certificates | Received Classes (or Surrendered Classes) of Certificates |
| Class A-3 | Class A-3-1, Class A-3-X1 |
| Class A-3 | Class A-3-2, Class A-3-X2 |
| Class A-4 | Class A-4-1, Class A-4-X1 |
| Class A-4 | Class A-4-2, Class A-4-X2 |
| Class A-S | Class A-S-1, Class A-S-X1 |
| Class A-S | Class A-S-2, Class A-S-X2 |
| Class B | Class B-1, Class B-X1 |
| Class B | Class B-2, Class B-X2 |
| Class C | Class C-1, Class C-X1 |
| Class C | Class C-2, Class C-X2 |
| On the closing date, the issuing entity will issue the following “trust components,” each with the initial certificate balance (or, if such trust component has an “X” suffix, notional amount) and pass-through rate set forth next to it in the table below. Each trust component with an “X” suffix will not be entitled to distributions of principal. |
Trust Component | Initial Certificate Balance or Notional Amount | Pass-Through Rate |
| Class A-3 | See footnote (9) to the table under “Certificate Structure” | Class A-3 Certificate Pass-Through Rate minus 1.00% |
| Class A-3-X1 | Equal to Class A-3 Trust Component Certificate Balance | 0.50% |
| Class A-3-X2 | Equal to Class A-3 Trust Component Certificate Balance | 0.50% |
| Class A-4 | See footnote (9) to the table under “Certificate Structure” | Class A-4 Certificate Pass-Through Rate minus 1.00% |
| Class A-4-X1 | Equal to Class A-4 Trust Component Certificate Balance | 0.50% |
| Class A-4-X2 | Equal to Class A-4 Trust Component Certificate Balance | 0.50% |
| Class A-S | $24,844,000 | Class A-S Certificate Pass-Through Rate minus 1.00% |
| Class A-S-X1 | Equal to Class A-S Trust Component Certificate Balance | 0.50% |
| Class A-S-X2 | Equal to Class A-S Trust Component Certificate Balance | 0.50% |
| Class B | $38,221,000 | Class B Certificate Pass-Through Rate minus 1.00% |
| Class B-X1 | Equal to Class B Trust Component Certificate Balance | 0.50% |
| Class B-X2 | Equal to Class B Trust Component Certificate Balance | 0.50% |
| Class C | $41,087,000 | Class C Certificate Pass-Through Rate minus 1.00% |
| Class C-X1 | Equal to Class C Trust Component Certificate Balance | 0.50% |
| Class C-X2 | Equal to Class C Trust Component Certificate Balance | 0.50% |
THE INFORMATION IN THIS STRUCTURAL AND COLLATERAL TERM SHEET IS NOT COMPLETE AND MAY BE AMENDED PRIOR TO THE TIME OF SALE. THIS TERM SHEET IS NOT AN OFFER TO SELL THESE SECURITIES AND IT IS NOT A SOLICITATION OF AN OFFER TO BUY THESE SECURITIES IN ANY JURISDICTION WHERE THE OFFER OR SALE IS NOT PERMITTED.
22
| Wells Fargo Commercial Mortgage Trust 2021-C61 | Certain Terms and Conditions |
| Each class of Exchangeable Certificates represents an undivided beneficial ownership interest in the trust components set forth next to it in the table below (the “Corresponding Trust Components”). Each class of Exchangeable Certificates has a pass-through rate equal to the sum of the pass-through rates of the Corresponding Trust Components and represents a percentage interest (the related “Class Percentage Interest”) in each Corresponding Trust Component, including principal and interest payable thereon, equal to (x) the Certificate Balance (or, if such class has an “X” suffix, Notional Amount) of such class of certificates, divided by (y) the Certificate Balance of the Class A-3 trust component (if such class of Exchangeable Certificates has an “A-3” designation), the Class A-4 trust component (if such class of Exchangeable Certificates has an “A-4” designation), the Class A-S trust component (if such class of Exchangeable Certificates has an “A-S” designation), the Class B trust component (if such class of Exchangeable Certificates has a “B” designation) or the Class C trust component (if such class of Exchangeable Certificates has a “C” designation). |
Group of Exchangeable Certificates | Class of Exchangeable Certificates | Corresponding Trust Components |
| “Class A-3 Exchangeable Certificates” | Class A-3 | Class A-3, Class A-3-X1, Class A-3-X2 |
| Class A-3-1 | Class A-3, Class A-3-X2 | |
| Class A-3-2 | Class A-3 | |
| Class A-3-X1 | Class A-3-X1 | |
| Class A-3-X2 | Class A-3-X1, Class A-3-X2 | |
| “Class A-4 Exchangeable Certificates” | Class A-4 | Class A-4, Class A-4-X1, Class A-4-X2 |
| Class A-4-1 | Class A-4, Class A-4-X2 | |
| Class A-4-2 | Class A-4 | |
| Class A-4-X1 | Class A-4-X1 | |
| Class A-4-X2 | Class A-4-X1, Class A-4-X2 | |
| “Class A-S Exchangeable Certificates” | Class A-S | Class A-S, Class A-S-X1, Class A-S-X2 |
| Class A-S-1 | Class A-S, Class A-S-X2 | |
| Class A-S-2 | Class A-S | |
| Class A-S-X1 | Class A-S-X1 | |
| Class A-S-X2 | Class A-S-X1, Class A-S-X2 | |
| “Class B Exchangeable Certificates” | Class B | Class B, Class B-X1, Class B-X2 |
| Class B-1 | Class B, Class B-X2 | |
| Class B-2 | Class B | |
| Class B-X1 | Class B-X1 | |
| Class B-X2 | Class B-X1, Class B-X2 | |
| “Class C Exchangeable Certificates” | Class C | Class C, Class C-X1, Class C-X2 |
| Class C-1 | Class C, Class C-X2 | |
| Class C-2 | Class C | |
| Class C-X1 | Class C-X1 | |
| Class C-X2 | Class C-X1, Class C-X2 |
The maximum Certificate Balance or Notional Amount of each class of Class A-3 Exchangeable Certificates that could be issued in an exchange is equal to the Certificate Balance of the Class A-3 trust component, the maximum Certificate Balance or Notional Amount of each class of Class A-4 Exchangeable Certificates that could be issued in an exchange is equal to the Certificate Balance of the Class A-4 trust component, the maximum Certificate Balance or Notional Amount of each class of Class A-S Exchangeable Certificates that could be issued in an exchange is equal |
THE INFORMATION IN THIS STRUCTURAL AND COLLATERAL TERM SHEET IS NOT COMPLETE AND MAY BE AMENDED PRIOR TO THE TIME OF SALE. THIS TERM SHEET IS NOT AN OFFER TO SELL THESE SECURITIES AND IT IS NOT A SOLICITATION OF AN OFFER TO BUY THESE SECURITIES IN ANY JURISDICTION WHERE THE OFFER OR SALE IS NOT PERMITTED.
23
| Wells Fargo Commercial Mortgage Trust 2021-C61 | Certain Terms and Conditions |
to the Certificate Balance of the Class A-S trust component, the maximum Certificate Balance or Notional Amount of each class of Class B Exchangeable Certificates that could be issued in an exchange is equal to the Certificate Balance of the Class B trust component, and the maximum Certificate Balance or Notional Amount of each class of Class C Exchangeable Certificates that could be issued in an exchange is equal to the Certificate Balance of the Class C trust component. The maximum Certificate Balances of Class A-3, A-4, A-S, B and C Certificates (subject to the constraints on the aggregate initial Certificate Balance of the Class A-3 and Class A-4 trust components discussed in footnote (9) to the table under “Certificate Structure”) will be issued on the closing date, and the Certificate Balance or Notional Amount of each other class of Exchangeable Certificates will be equal to zero on the closing date.
Each class of Class A-3 Exchangeable Certificates, Class A-4 Exchangeable Certificates, Class A-S Exchangeable Certificates, Class B Exchangeable Certificates and Class C Exchangeable Certificates will have a Certificate Balance or Notional Amount equal to its Class Percentage Interest multiplied by the Certificate Balance of the Class A-3 trust component, Class A-4 trust component, Class A-S trust component, Class B trust component or Class C trust component, respectively. Each class of Class A-3 Exchangeable Certificates, Class A-4 Exchangeable Certificates, Class A-S Exchangeable Certificates, Class B Exchangeable Certificates and Class C Exchangeable Certificates with a Certificate Balance will have the same approximate initial credit support percentage, Expected Weighted Average Life, Expected Principal Window, Certificate Principal U/W NOI Debt Yield and Certificate Principal to Value Ratio as the Class A-3 Certificates, Class A-4 Certificates, Class A-S Certificates, Class B Certificates or Class C Certificates, respectively, shown above.
| |
| Allocation of Yield Maintenance Charges and Prepayment Premiums: | If any Yield Maintenance Charge or Prepayment Premium is collected during any particular collection period with respect to any mortgage loan, then on the Distribution Date corresponding to that collection period, the certificate administrator will pay that Yield Maintenance Charge or Prepayment Premium (net of liquidation fees payable therefrom) in the following manner: |
| (1) | to each class of the Class A-1, A-2, A-SB, A-3, A-3-1, A-3-2, A-4, A-4-1, A-4-2, A-S, A-S-1, A-S-2, B, B-1, B-2, C, C-1, C-2, D, E and F-RR Certificates, the product of (a) such Yield Maintenance Charge or Prepayment Premium, (b) the related Base Interest Fraction for such class and the applicable principal prepayment, and (c) a fraction, the numerator of which is equal to the amount of principal distributed to such class for that Distribution Date, and the denominator of which is the total amount of principal distributed to the Class A-1, A-2, A-SB, D, E, F-RR, G-RR, H-RR, J-RR, K-RR and L-RR Certificates and the Class A-3 Exchangeable Certificates, the Class A-4 Exchangeable Certificates, the Class A-S Exchangeable Certificates, the Class B Exchangeable Certificates and the Class C Exchangeable Certificates for that Distribution Date, |
| (2) | to the Class A-3-X1 Certificates, the product of (a) such Yield Maintenance Charge or Prepayment Premium, (b) a fraction, the numerator of which is equal to the amount of principal distributed to the Class A-3-1 Certificates for that Distribution Date, and the denominator of which is the total amount of principal distributed to the Class A-1, A-2, A-SB, D, E, F-RR, G-RR, H-RR, J-RR, K-RR and L-RR Certificates and the Class A-3 Exchangeable Certificates, the Class A-4 Exchangeable Certificates, the Class A-S Exchangeable Certificates, the Class B Exchangeable Certificates and the Class C Exchangeable Certificates for that Distribution Date and (c) the difference between (i) the Base Interest Fraction for the Class A-3 Certificates and the applicable principal prepayment and (ii) the Base Interest Fraction for the Class A-3-1 Certificates and the applicable principal prepayment, |
| (3) | to the Class A-3-X2 Certificates, the product of (a) such Yield Maintenance Charge or Prepayment Premium, (b) a fraction, the numerator of which is equal to the amount of principal distributed to the Class A-3-2 Certificates for that Distribution Date, and the denominator of which is the total amount of principal distributed to the Class A-1, A-2, A-SB, D, E, F-RR, G-RR, H-RR, J-RR, K-RR and L-RR Certificates and the Class A-3 Exchangeable Certificates, the Class A-4 Exchangeable Certificates, the Class A-S Exchangeable Certificates, the Class B Exchangeable Certificates and the Class C Exchangeable Certificates for that Distribution Date and (c) the difference between (i) the Base Interest Fraction for the Class A-3 Certificates and the applicable principal prepayment and (ii) the Base Interest Fraction for the Class A-3-2 Certificates and the applicable principal prepayment, |
| (4) | to the Class A-4-X1 Certificates, the product of (a) such Yield Maintenance Charge or Prepayment Premium, (b) a fraction, the numerator of which is equal to the amount of principal distributed to the Class A-4-1 Certificates for that Distribution Date, and the denominator of which is the total amount of principal distributed to |
THE INFORMATION IN THIS STRUCTURAL AND COLLATERAL TERM SHEET IS NOT COMPLETE AND MAY BE AMENDED PRIOR TO THE TIME OF SALE. THIS TERM SHEET IS NOT AN OFFER TO SELL THESE SECURITIES AND IT IS NOT A SOLICITATION OF AN OFFER TO BUY THESE SECURITIES IN ANY JURISDICTION WHERE THE OFFER OR SALE IS NOT PERMITTED.
24
| Wells Fargo Commercial Mortgage Trust 2021-C61 | Certain Terms and Conditions |
the Class A-1, A-2, A-SB, D, E, F-RR, G-RR, H-RR, J-RR, K-RR and L-RR Certificates and the Class A-3 Exchangeable Certificates, the Class A-4 Exchangeable Certificates, the Class A-S Exchangeable Certificates, the Class B Exchangeable Certificates and the Class C Exchangeable Certificates for that Distribution Date and (c) the difference between (i) the Base Interest Fraction for the Class A-4 Certificates and the applicable principal prepayment and (ii) the Base Interest Fraction for the Class A-4-1 Certificates and the applicable principal prepayment,
| |||
| (5) | to the Class A-4-X2 Certificates, the product of (a) such Yield Maintenance Charge or Prepayment Premium, (b) a fraction, the numerator of which is equal to the amount of principal distributed to the Class A-4-2 Certificates for that Distribution Date, and the denominator of which is the total amount of principal distributed to the Class A-1, A-2, A-SB, D, E, F-RR, G-RR, H-RR, J-RR, K-RR and L-RR Certificates and the Class A-3 Exchangeable Certificates, the Class A-4 Exchangeable Certificates, the Class A-S Exchangeable Certificates, the Class B Exchangeable Certificates and the Class C Exchangeable Certificates for that Distribution Date and (c) the difference between (i) the Base Interest Fraction for the Class A-4 Certificates and the applicable principal prepayment and (ii) the Base Interest Fraction for the Class A-4-2 Certificates and the applicable principal prepayment, |
| (6) | to the Class A-S-X1 Certificates, the product of (a) such Yield Maintenance Charge or Prepayment Premium, (b) a fraction, the numerator of which is equal to the amount of principal distributed to the Class A-S-1 Certificates for that Distribution Date, and the denominator of which is the total amount of principal distributed to the Class A-1, A-2, A-SB, D, E, F-RR, G-RR, H-RR, J-RR, K-RR and L-RR Certificates and the Class A-3 Exchangeable Certificates, the Class A-4 Exchangeable Certificates, the Class A-S Exchangeable Certificates, the Class B Exchangeable Certificates and the Class C Exchangeable Certificates for that Distribution Date and (c) the difference between (i) the Base Interest Fraction for the Class A-S Certificates and the applicable principal prepayment and (ii) the Base Interest Fraction for the Class A-S-1 Certificates and the applicable principal prepayment, |
| (7) | to the Class A-S-X2 Certificates, the product of (a) such Yield Maintenance Charge or Prepayment Premium, (b) a fraction, the numerator of which is equal to the amount of principal distributed to the Class A-S-2 Certificates for that Distribution Date, and the denominator of which is the total amount of principal distributed to the Class A-1, A-2, A-SB, D, E, F-RR, G-RR, H-RR, J-RR, K-RR and L-RR Certificates and the Class A-3 Exchangeable Certificates, the Class A-4 Exchangeable Certificates, the Class A-S Exchangeable Certificates, the Class B Exchangeable Certificates and the Class C Exchangeable Certificates for that Distribution Date and (c) the difference between (i) the Base Interest Fraction for the Class A-S Certificates and the applicable principal prepayment and (ii) the Base Interest Fraction for the Class A-S-2 Certificates and the applicable principal prepayment, |
| (8) | to the Class B-X1 Certificates, the product of (a) such Yield Maintenance Charge or Prepayment Premium, (b) a fraction, the numerator of which is equal to the amount of principal distributed to the Class B-1 Certificates for that Distribution Date, and the denominator of which is the total amount of principal distributed to the Class A-1, A-2, A-SB, D, E, F-RR, G-RR, H-RR, J-RR, K-RR and L-RR Certificates and the Class A-3 Exchangeable Certificates, the Class A-4 Exchangeable Certificates, the Class A-S Exchangeable Certificates, the Class B Exchangeable Certificates and the Class C Exchangeable Certificates for that Distribution Date and (c) the difference between (i) the Base Interest Fraction for the Class B Certificates and the applicable principal prepayment and (ii) the Base Interest Fraction for the Class B-1 Certificates and the applicable principal prepayment, |
| (9) | to the Class B-X2 Certificates, the product of (a) such Yield Maintenance Charge or Prepayment Premium, (b) a fraction, the numerator of which is equal to the amount of principal distributed to the Class B-2 Certificates for that Distribution Date, and the denominator of which is the total amount of principal distributed to the Class A-1, A-2, A-SB, D, E, F-RR, G-RR, H-RR, J-RR, K-RR and L-RR Certificates and the Class A-3 Exchangeable Certificates, the Class A-4 Exchangeable Certificates, the Class A-S Exchangeable Certificates, the Class B Exchangeable Certificates and the Class C Exchangeable Certificates for that Distribution Date and (c) the difference between (i) the Base Interest Fraction for the Class B Certificates and the applicable principal prepayment and (ii) the Base Interest Fraction for the Class B-2 Certificates and the applicable principal prepayment, |
THE INFORMATION IN THIS STRUCTURAL AND COLLATERAL TERM SHEET IS NOT COMPLETE AND MAY BE AMENDED PRIOR TO THE TIME OF SALE. THIS TERM SHEET IS NOT AN OFFER TO SELL THESE SECURITIES AND IT IS NOT A SOLICITATION OF AN OFFER TO BUY THESE SECURITIES IN ANY JURISDICTION WHERE THE OFFER OR SALE IS NOT PERMITTED.
25
| Wells Fargo Commercial Mortgage Trust 2021-C61 | Certain Terms and Conditions |
| (10) | to the Class C-X1 Certificates, the product of (a) such Yield Maintenance Charge or Prepayment Premium, (b) a fraction, the numerator of which is equal to the amount of principal distributed to the Class C-1 Certificates for that Distribution Date, and the denominator of which is the total amount of principal distributed to the Class A-1, A-2, A-SB, D, E, F-RR, G-RR, H-RR, J-RR, K-RR and L-RR Certificates and the Class A-3 Exchangeable Certificates, the Class A-4 Exchangeable Certificates, the Class A-S Exchangeable Certificates, the Class B Exchangeable Certificates and the Class C Exchangeable Certificates for that Distribution Date and (c) the difference between (i) the Base Interest Fraction for the Class C Certificates and the applicable principal prepayment and (ii) the Base Interest Fraction for the Class C-1 Certificates and the applicable principal prepayment, |
| (11) | to the Class C-X2 Certificates, the product of (a) such Yield Maintenance Charge or Prepayment Premium, (b) a fraction, the numerator of which is equal to the amount of principal distributed to the Class C-2 Certificates for that Distribution Date, and the denominator of which is the total amount of principal distributed to the Class A-1, A-2, A-SB, D, E, F-RR, G-RR, H-RR, J-RR, K-RR and L-RR Certificates and the Class A-3 Exchangeable Certificates, the Class A-4 Exchangeable Certificates, the Class A-S Exchangeable Certificates, the Class B Exchangeable Certificates and the Class C Exchangeable Certificates for that Distribution Date and (c) the difference between (i) the Base Interest Fraction for the Class C Certificates and the applicable principal prepayment and (ii) the Base Interest Fraction for the Class C-2 Certificates and the applicable principal prepayment, |
| (12) | to the Class X-A Certificates, the excess, if any, of (a) the product of (i) such Yield Maintenance Charge or Prepayment Premium and (ii) a fraction, the numerator of which is equal to the total amount of principal distributed to the Class A-1, A-2 and A-SB Certificates and the Class A-3 Exchangeable Certificates and the Class A-4 Exchangeable Certificates for that Distribution Date, and the denominator of which is the total amount of principal distributed to the Class A-1, A-2, A-SB, D, E, F-RR, G-RR, H-RR, J-RR, K-RR and L-RR Certificates and the Class A-3 Exchangeable Certificates, the Class A-4 Exchangeable Certificates, the Class A-S Exchangeable Certificates, the Class B Exchangeable Certificates and the Class C Exchangeable Certificates for that Distribution Date, over (b) the total amount of such Yield Maintenance Charge or Prepayment Premium distributed to the Class A-1, Class A-2 and Class A-SB Certificates and the Class A-3 Exchangeable Certificates and the Class A-4 Exchangeable Certificates as described above, and |
| (13) | to the Class X-B Certificates, any remaining portion of such Yield Maintenance Charge or Prepayment Premium not distributed as described above. |
| No Prepayment Premiums or Yield Maintenance Charges will be distributed to the holders of the Class X-D, G-RR, H-RR, J-RR, K-RR, L-RR or R Certificates. For a description of when Prepayment Premiums and Yield Maintenance Charges are generally required on the mortgage loans, see Annex A-1 to the Preliminary Prospectus. See also “Risk Factors—Risks Relating to the Mortgage Loans—Risks Relating to Enforceability of Yield Maintenance Charges, Prepayment Premiums or Defeasance Provisions” and “Risk Factors—Other Risks Relating to the Certificates—Your Yield May Be Affected by Defaults, Prepayments and Other Factors” in the Preliminary Prospectus. Prepayment Premiums and Yield Maintenance Charges will be distributed on each Distribution Date only to the extent they are actually received on the mortgage loans as of the related Determination Date. | |
| Realized Losses: | The Certificate Balances of the Class A-1, A-2, A-SB, D, E, F-RR, G-RR, H-RR, J-RR, K-RR and L-RR Certificates and the Class A-3, A-4, A-S, B and C trust components will be reduced without distribution on any Distribution Date as a write-off to the extent of any losses realized on the mortgage loans allocated to such Class on such Distribution Date. Such losses will be applied in the following order, in each case until the related Certificate Balance is reduced to zero: first, to the Class L-RR Certificates; second, to the Class K-RR Certificates; third, to the Class J-RR Certificates; fourth, to the Class H-RR Certificates; fifth, to the Class G-RR Certificates; sixth, to the Class F-RR Certificates; seventh, to the Class E Certificates; eighth, to the Class D Certificates; ninth, to the Class C trust component; tenth, to the Class B trust component; eleventh, to the Class A-S trust component; and, finally, pro rata, to the Class A-1, A-2 and A-SB Certificates and the Class A-3 and A-4 trust components based on their outstanding Certificate Balances.
Any portion of such amount applied to the Class A-3, A-4, A-S, B or C trust component will reduce the Certificate Balance or Notional Amount of each Class of Certificates in the related group of |
THE INFORMATION IN THIS STRUCTURAL AND COLLATERAL TERM SHEET IS NOT COMPLETE AND MAY BE AMENDED PRIOR TO THE TIME OF SALE. THIS TERM SHEET IS NOT AN OFFER TO SELL THESE SECURITIES AND IT IS NOT A SOLICITATION OF AN OFFER TO BUY THESE SECURITIES IN ANY JURISDICTION WHERE THE OFFER OR SALE IS NOT PERMITTED.
26
| Wells Fargo Commercial Mortgage Trust 2021-C61 | Certain Terms and Conditions |
Exchangeable Certificates by an amount equal to the product of (x) its Certificate Balance or Notional Amount, divided by the Certificate Balance of such trust component prior to the applicable reduction, and (y) the amount applied to such trust component.
The Notional Amount of the Class X-A Certificates will be reduced by the amount of all losses that are allocated to the Class A-1, A-2 and A-SB Certificates and the Class A-3 and A-4 trust components as write-offs in reduction of their Certificate Balances. The Notional Amount of the Class X-B Certificates will be reduced by the amount of all losses that are allocated to the Class A-S, B or C trust components as write-offs in reduction of their Certificate Balances.
| |
| P&I Advances: | The Master Servicer or, if the Master Servicer fails to do so, the Trustee, will be obligated to advance delinquent debt service payments (other than balloon payments and default interest) and assumed debt service payments on mortgage loans with delinquent balloon payments (excluding any related companion loan), except to the extent any such advance is deemed non-recoverable from collections on the related mortgage loan. In addition, if an Appraisal Reduction Amount exists for a given mortgage loan, the interest portion of any P&I advance for such mortgage loan will be reduced, which will have the effect of reducing the amount of interest available for distribution to the Certificates in reverse alphabetical order of their Class designations (except that interest payments on the Class A-1, A-2, A-SB, A-3, A-3-X1, A-3-X2, A-4, A-4-X1, A-4-X2, X-A, X-B and X-D Certificates would be affected on a pari passu basis). |
| Servicing Advances: | The Master Servicer or, if the Master Servicer fails to do so, the Trustee, will be obligated to make servicing advances, including the payment of delinquent property taxes, insurance premiums and ground rent, except to the extent that those advances are deemed non-recoverable from collections on the related mortgage loan. The Master Servicer or the Trustee, as applicable, will have the primary obligation to make any required servicing advances with respect to any serviced whole loan. With respect to any non-serviced whole loan, the master servicer or trustee, as applicable, under the related lead securitization servicing agreement will have the primary obligation to make any required servicing advances with respect to such non-serviced whole loan. |
Appraisal Reduction Amounts and Collateral Deficiency Amounts:
| An “Appraisal Reduction Amount” generally will be created in the amount, if any, by which the principal balance of a required appraisal loan (which is a mortgage loan (other than a non-serviced mortgage loan) with respect to which certain defaults, modifications or insolvency events have occurred as further described in the Preliminary Prospectus) plus other amounts overdue or advanced in connection with such mortgage loan exceeds 90% of the appraised value of the related mortgaged property plus certain escrows and reserves (including letters of credit) held with respect to the mortgage loan. With respect to any serviced whole loan, any Appraisal Reduction Amount will be allocated, pro rata, to the related mortgage loan and the related pari passu companion loan(s). With respect to any non-serviced mortgage loan, appraisal reduction amounts are expected to be calculated in a similar manner under the related non-serviced pooling and servicing agreement.
A mortgage loan will cease to be a required appraisal loan when the same has ceased to be a specially serviced loan (if applicable), has been brought current for at least three consecutive months and no other circumstances exist that would cause such mortgage loan to be a required appraisal loan.
A “Collateral Deficiency Amount” will exist with respect to any mortgage loan that is modified into an AB loan structure and remains a corrected mortgage loan and will generally equal the excess of (i) the stated principal balance of such AB modified loan (taking into account the related junior note(s) and any pari passu notes included therein), over (ii) the sum of (in the case of a whole loan, solely to the extent allocable to the subject mortgage loan) (x) the most recent appraised value for the related mortgaged property or mortgaged properties plus (y) solely to the extent not reflected or taken into account in such appraised value and to the extent on deposit with, or otherwise under the control of, the lender as of the date of such determination, any capital or additional collateral contributed by the related borrower at the time the mortgage loan became (and as part of the modification related to) such AB modified loan for the benefit of the related mortgaged property or mortgaged properties (provided that in the case of a non-serviced mortgage loan, the amounts set forth in this clause (y) will be taken into account solely to the extent relevant information is received by the master servicer), plus (z) any other escrows or reserves (in addition to any amounts set forth in the immediately preceding clause (y)) held by the lender in respect of such AB modified loan as of the date of such determination.
A “Cumulative Appraisal Reduction Amount” with respect to any mortgage loan will be the sum of (i) all Appraisal Reduction Amounts then in effect, and (ii) with respect to any AB modified loan, any Collateral Deficiency Amount then in effect.
Appraisal Reduction Amounts will affect the amount of debt service advances in respect of the related mortgage loan. Additionally, Cumulative Appraisal Reduction Amounts will be taken into
|
THE INFORMATION IN THIS STRUCTURAL AND COLLATERAL TERM SHEET IS NOT COMPLETE AND MAY BE AMENDED PRIOR TO THE TIME OF SALE. THIS TERM SHEET IS NOT AN OFFER TO SELL THESE SECURITIES AND IT IS NOT A SOLICITATION OF AN OFFER TO BUY THESE SECURITIES IN ANY JURISDICTION WHERE THE OFFER OR SALE IS NOT PERMITTED.
27
| Wells Fargo Commercial Mortgage Trust 2021-C61 | Certain Terms and Conditions |
account in the determination of the identity of the Class whose majority constitutes the “majority controlling class certificateholder” and is entitled to appoint the directing certificateholder.
Neither (i) a Payment Accommodation with respect to any mortgage loan or serviced whole loan nor (ii) any default or delinquency that would have existed but for such Payment Accommodation will constitute an appraisal reduction event, for so long as the related borrower is complying with the terms of such Payment Accommodation.
A “Payment Accommodation” for any mortgage loan or serviced whole loan means the entering into of any temporary forbearance agreement as a result of the COVID-19 emergency (and qualification as a COVID-19 emergency forbearance will be determined by the special servicer in its sole and absolute discretion in accordance with the servicing standard) relating to payment obligations or operating covenants under the related mortgage loan documents or the use of funds on deposit in any reserve account or escrow account for any purpose other than the explicit purpose described in the related mortgage loan documents, that in each case (i) is entered into no later than the date that is 3 months following the cancellation of the COVID emergency and (ii) requires full repayment of deferred payments, reserves and escrows by the date that is 21 months following the date of the first Payment Accommodation for such mortgage loan or serviced whole loan.
| |
Clean-Up Call and Exchange Termination:
| On each Distribution Date occurring after the aggregate unpaid principal balance of the pool of mortgage loans is less than 1.0% of the principal balance of the mortgage loans as of the cut-off date, certain specified persons will have the option to purchase all of the remaining mortgage loans (and the trust’s interest in all property acquired through exercise of remedies in respect of any mortgage loan) at the price specified in the Preliminary Prospectus. Exercise of the option will terminate the trust and retire the then-outstanding Certificates.
If the aggregate Certificate Balances of each of the Class A-1, A-2, A-SB, D and E Certificates and the Class A-3, A-4, A-S, B and C trust components have been reduced to zero, the trust may also be terminated in connection with an exchange of all the then-outstanding Certificates (other than the and Class R Certificates) for the mortgage loans and REO properties then remaining in the issuing entity, subject to payment of a price specified in the Preliminary Prospectus, but all of the holders of those outstanding Classes of Certificates (other than the and Class R Certificates) would have to voluntarily participate in the exchange.
|
| Liquidation Loan Waterfall: | Following the liquidation of any mortgage loan or mortgaged property, the net liquidation proceeds generally will be applied (after reimbursement of advances and certain trust fund expenses), first, as a recovery of accrued interest, other than delinquent interest that was not advanced as a result of Appraisal Reduction Amounts, second, as a recovery of principal until all principal has been recovered, and then as a recovery of delinquent interest that was not advanced as a result of Appraisal Reduction Amounts. Please see “Description of the Certificates—Distributions—Distributions—Application Priority of Mortgage Loan Collections or Whole Loan Collections” in the Preliminary Prospectus.
|
| Control Eligible Certificates: | The Class F-RR, G-RR, H-RR, J-RR, K-RR and L-RR Certificates.
|
| Directing Certificateholder/ Controlling Class: | A directing certificateholder may be appointed by the “majority controlling class certificateholder”, which will be the holder(s) of a majority of the Controlling Class.
The “Controlling Class” will be, as of any time of determination, the most subordinate Class of Control Eligible Certificates then outstanding that has an aggregate Certificate Balance (as notionally reduced by any Cumulative Appraisal Reduction Amounts allocable to such Class(es)) at least equal to 25% of the initial Certificate Balance of that Class; provided, however, that if at any time the Certificate Balances of the Certificates other than the Control Eligible Certificates have been reduced to zero as a result of principal payments on the Mortgage Loans, then the Controlling Class will be the most subordinate Class of Control Eligible Certificates that has a Certificate Balance greater than zero without regard to any Cumulative Appraisal Reduction Amounts. The Controlling Class as of the closing date will be the Class L-RR Certificates.
|
| Control and Consultation: | The rights of various parties to replace the Special Servicer and approve or consult with respect to major actions of the Special Servicer will vary according to defined periods.
A “Control Termination Event” will occur when the Class F-RR Certificates have a Certificate Balance (taking into account the application of any Cumulative Appraisal Reduction Amounts to notionally reduce the Certificate Balance of such Class) of less than 25% of the initial Certificate Balance of that Class; provided that no Control Termination Event may occur with respect to a Loan-Specific Directing Certificateholder, and the term “Control Termination Event” will not be applicable to a Loan-Specific Directing Certificateholder; provided, further, that a Control Termination Event will not be deemed continuing in the event that the Certificate Balances of the |
THE INFORMATION IN THIS STRUCTURAL AND COLLATERAL TERM SHEET IS NOT COMPLETE AND MAY BE AMENDED PRIOR TO THE TIME OF SALE. THIS TERM SHEET IS NOT AN OFFER TO SELL THESE SECURITIES AND IT IS NOT A SOLICITATION OF AN OFFER TO BUY THESE SECURITIES IN ANY JURISDICTION WHERE THE OFFER OR SALE IS NOT PERMITTED.
28
| Wells Fargo Commercial Mortgage Trust 2021-C61 | Certain Terms and Conditions |
Certificates other than the Control Eligible Certificates have been reduced to zero as a result of principal payments on the mortgage loans.
A “Consultation Termination Event” will occur when there is no Class of Control Eligible Certificates that has a then-outstanding Certificate Balance at least equal to 25% of the initial Certificate Balance of that Class, in each case, without regard to the application of any Cumulative Appraisal Reduction Amounts; provided, that no Consultation Termination Event may occur with respect to a Loan-Specific Directing Certificateholder and the term Consultation Termination Event” will not be applicable to a Loan-Specific Directing Certificateholder; provided, further, that a Consultation Termination Event will not be deemed continuing in the event that the Certificate Balances of the Certificates other than the Control Eligible Certificates have been reduced to zero as a result of principal payments on the mortgage loans.
If no Control Termination Event has occurred and is continuing, except with respect to the Excluded Loans (as defined below) and Servicing Shift Whole Loans (as defined below) (i) the directing certificateholder will be entitled to grant or withhold approval of asset status reports prepared, and material servicing actions proposed, by the Special Servicer, and (ii) the directing certificateholder will be entitled to terminate and replace the Special Servicer with or without cause, and appoint itself or another person as the successor special servicer. It will be a condition to such appointment that KBRA, Fitch, and Moody’s (and any rating agency rating any securities backed by any pari passu companion loan(s) serviced under this transaction) confirm that the appointment would not result in a qualification, downgrade or withdrawal of any of their then-current ratings of Certificates (and any certificates backed by any pari passu companion loan(s) serviced under this transaction).
If a Control Termination Event has occurred and is continuing but no Consultation Termination Event has occurred and is continuing, the Special Servicer will be required to consult with the directing certificateholder (other than with respect to Excluded Loans) in connection with asset status reports and material special servicing actions.
If a Consultation Termination Event has occurred and is continuing, no directing certificateholder will be recognized or have any right to terminate the Special Servicer or approve, direct or consult with respect to servicing matters.
With respect to each serviced whole loan this is not a Servicing Shift Whole Loan, the rights of the directing certificateholder described above will be subject to the consultation rights of the holders of the related pari passu companion loans. Those consultation rights will generally extend to asset status reports and material special servicing actions involving the related whole loan, will be as set forth in the related intercreditor agreement, and will be in addition to the rights of the directing certificateholder in this transaction described above.
With respect to each whole loan marked with footnote (3) under “V. Characteristics of the Mortgage Pool—B. Summary of the Whole Loans” (each, a “Servicing Shift Whole Loan”), prior to the date of securitization of the related controlling pari passu companion loan (such date, a “Servicing Shift Securitization Date”), the holder of the related controlling pari passu companion loan will have certain control rights regarding the servicing of the related whole loan under the WFCM 2021-C61 pooling and servicing agreement, including the right to approve or disapprove various material servicing actions involving the related whole loan. For purposes of the servicing of any such whole loan contemplated by this paragraph, the occurrence and continuance of a Control Termination Event or Consultation Termination Event under this securitization will not limit the control or other rights of the holder of the related controlling pari passu companion loan(s). With respect to (x) each non-serviced whole loan and (y) each Servicing Shift Whole Loan after its Servicing Shift Securitization Date, the applicable servicing agreement for the related controlling pari passu companion loan(s) generally grants (or will grant) the directing certificateholder under the related securitization control rights that may include the right to approve or disapprove various material servicing actions involving the related whole loan. The directing certificateholder for this securitization (so long as no Consultation Termination Event has occurred and is occurring) generally will nonetheless have the right to be consulted on a non-binding basis with respect to such actions. For purposes of the servicing of any such whole loan contemplated by this paragraph, the occurrence and continuance of a Control Termination Event or Consultation Termination Event under this securitization will not limit the control or other rights of the directing certificateholder (or equivalent) under the securitization of the related controlling pari passu companion loan(s).
The control rights and consent and consultation rights described in the preceding paragraphs are subject to various limitations, conditions and exceptions as described in the Preliminary Prospectus.
Notwithstanding any contrary description set forth above, in the event that, with respect to any mortgage loan, the majority controlling class certificateholder or the directing certificateholder is
|
THE INFORMATION IN THIS STRUCTURAL AND COLLATERAL TERM SHEET IS NOT COMPLETE AND MAY BE AMENDED PRIOR TO THE TIME OF SALE. THIS TERM SHEET IS NOT AN OFFER TO SELL THESE SECURITIES AND IT IS NOT A SOLICITATION OF AN OFFER TO BUY THESE SECURITIES IN ANY JURISDICTION WHERE THE OFFER OR SALE IS NOT PERMITTED.
29
| Wells Fargo Commercial Mortgage Trust 2021-C61 | Certain Terms and Conditions |
a Borrower Party, the majority controlling class certificateholder and the directing certificateholder will have no right to receive asset status reports or such other information as may be specified in the WFCM 2021-C61 pooling and servicing agreement, to grant or withhold approval of, or consult with respect to, asset status reports prepared, and material servicing actions proposed, by the Special Servicer, with respect to such mortgage loan, and such mortgage loan will be referred to as an “Excluded Loan” as to such party.
In addition, notwithstanding any contrary description set forth above, in the event that, with respect to any mortgage loan, a controlling class certificateholder is a Borrower Party, such controlling class certificateholder will have no right to receive asset status reports or such other information as may be specified in the WFCM 2021-C61 pooling and servicing agreement with respect to such mortgage loan.
“Borrower Party” means a borrower, a mortgagor or a manager of a mortgaged property, an Accelerated Mezzanine Loan Lender, or any Borrower Party Affiliate. “Accelerated Mezzanine Loan Lender” means a mezzanine lender under a mezzanine loan that has been accelerated or as to which foreclosure or enforcement proceedings have been commenced against the equity collateral pledged to secure such mezzanine loan. “Borrower Party Affiliate” means, with respect to a borrower, a mortgagor, a manager of a mortgaged property or an Accelerated Mezzanine Loan Lender, (x) any other person controlling or controlled by or under common control with such borrower, mortgagor, manager or Accelerated Mezzanine Loan Lender, as applicable, or (y) any other person owning, directly or indirectly, 25% or more of the beneficial interests in such borrower, mortgagor, manager or Accelerated Mezzanine Loan Lender, as applicable.
| |
| Replacement of Special Servicer: | If a Control Termination Event has occurred and is continuing, the Special Servicer (other than with respect to a Servicing Shift Whole Loan) may be removed and replaced without cause upon the affirmative direction of certificate owners holding not less than 66-2/3% of a certificateholder quorum, following a proposal from certificate owners holding not less than 25% of the appraisal-reduced voting rights of all Principal Balance Certificates. The certificateholders who initiate a vote on a termination and replacement of the Special Servicer without cause must cause KBRA, Fitch and Moody’s to confirm the then-current ratings of the Certificates (or decline to review the matter) and cause the payment of the fees and expenses incurred in the replacement. If no Control Termination Event has occurred and is continuing, the Special Servicer (other than with respect to a Servicing Shift Whole Loan) may be replaced by the directing certificateholder, subject to KBRA, Fitch and Moody’s (and any Rating Agency rating any securities backed by any pari passu companion loan(s) serviced under this transaction) confirming the then-current ratings of the Certificates (and any certificates backed by any pari passu companion loans serviced under this transaction) or declining to review the matter. In addition, if at any time the Operating Advisor determines, in its sole discretion exercised in good faith, that (i) the Special Servicer is not performing its duties as required under the pooling and servicing agreement in accordance with the Servicing Standard and (ii) the replacement of the Special Servicer would be in the best interest of the certificateholders as a collective whole, then the Operating Advisor will have the right to recommend the replacement of the Special Servicer and will submit its formal recommendation to the Trustee and the Certificate Administrator (along with its rationale, its proposed replacement special servicer and other relevant information justifying its recommendation).
The Operating Advisor’s recommendation to replace the Special Servicer must be confirmed by an affirmative vote of holders of Principal Balance Certificates evidencing at least a majority of a quorum of certificateholders (which, for this purpose, is the holders of Principal Balance Certificates that (i) evidence at least 20% of the Voting Rights (taking into account the application of any cumulative appraisal reduction amounts to notionally reduce the respective Certificate Balances) of all Principal Balance Certificates on an aggregate basis, and (ii) consist of at least three certificateholders or certificate owners that are not risk retention affiliated with each other). In the event the holders of Principal Balance Certificates evidencing at least a majority of a quorum of certificateholders elect to remove and replace the Special Servicer (which requisite affirmative votes must be received within 180 days of the posting of the notice of the Operating Advisor’s recommendation to replace the Special Servicer to the Certificate Administrator’s website), the Certificate Administrator will be required to receive a Rating Agency Confirmation from each of the Rating Agencies at that time, and confirmation from the applicable rating agencies that such replacement will not result in the downgrade, withdrawal or qualification of the then-current ratings of any class of any related serviced pari passu companion loan securities.
|
| Excluded Special Servicer: | In the event that, with respect to any mortgage loan, the Special Servicer is a Borrower Party, the Special Servicer will be required to resign as special servicer of such mortgage loan (referred to as an “excluded special servicer loan”). If no Control Termination Event has occurred and is continuing, the directing certificateholder will be entitled to appoint (and may replace with or without cause) a separate special servicer that is not a Borrower Party (referred to as an “excluded special servicer”) with respect to such excluded special servicer loan unless such excluded special servicer loan is also an excluded loan. Otherwise, upon resignation of the Special |
THE INFORMATION IN THIS STRUCTURAL AND COLLATERAL TERM SHEET IS NOT COMPLETE AND MAY BE AMENDED PRIOR TO THE TIME OF SALE. THIS TERM SHEET IS NOT AN OFFER TO SELL THESE SECURITIES AND IT IS NOT A SOLICITATION OF AN OFFER TO BUY THESE SECURITIES IN ANY JURISDICTION WHERE THE OFFER OR SALE IS NOT PERMITTED.
30
| Wells Fargo Commercial Mortgage Trust 2021-C61 | Certain Terms and Conditions |
| Servicer with respect to an excluded special servicer loan, the resigning Special Servicer will be required to use commercially reasonable efforts to appoint the excluded special servicer. | |
| Appraisal Remedy: | If the Class of Certificates comprising the Controlling Class loses its status as Controlling Class because of the application of an Appraisal Reduction Amount or Collateral Deficiency Amount, the holders of a majority of the voting rights of such Class may require the Special Servicer to order a second appraisal for any mortgage loan in respect of which an Appraisal Reduction Amount or Collateral Deficiency Amount has been applied. The Special Servicer must thereafter determine whether, based on its assessment of such second appraisal, any recalculation of the Appraisal Reduction Amount or Collateral Deficiency Amount is warranted and, if so warranted, will recalculate such Appraisal Reduction Amount or Collateral Deficiency Amount. Such Class will not be able to exercise any direction, control, consent and/or similar rights of the Controlling Class unless and until reinstated as the Controlling Class through such determination; and pending such determination, the rights of the Controlling Class will be exercised by the Control Eligible Certificates, if any, that would be the Controlling Class taking into account the subject appraisal reduction amount. |
| Sale of Defaulted Assets: | There will be no “fair value” purchase option. Instead, the WFCM 2021-C61 pooling and servicing agreement will authorize the Special Servicer to sell defaulted mortgage loans serviced by such Special Servicer to the highest bidder in a manner generally similar to sales of REO properties.
The sale of a defaulted loan (other than a non-serviced whole loan) for less than par plus accrued interest and certain other fees and expenses owed on the loan will be subject to consent or consultation rights of the directing certificateholder and/or Operating Advisor, as described in the Preliminary Prospectus. Generally speaking, the holder of a pari passu companion loan will have consent and/or consultation rights, as described in the Preliminary Prospectus.
With respect to (x) each non-serviced whole loan and (y) each Servicing Shift Whole Loan after its Servicing Shift Securitization Date, if such whole loan becomes a defaulted loan under the WFCM 2021-C61 pooling and servicing agreement, the Special Servicer will generally be required to sell both the mortgage loan and the related pari passu companion loan(s) as a single whole loan.
With respect to (x) each non-serviced whole loan and (y) each Servicing Shift Whole Loan after its Servicing Shift Securitization Date,, the applicable servicing agreement governing the servicing of such whole loan generally provides (or is expected to provide) that, if the related pari passu companion loan(s) serviced under such agreement become a defaulted loan under such servicing agreement, then the related special servicer may offer to sell to any person (or may offer to purchase) for cash such whole loan during such time as such applicable pari passu companion loan(s) constitutes a defaulted loan under such servicing agreement. Generally speaking, in connection with any such sale, the related special servicer is required to sell both the mortgage loan and the related pari passu companion loan(s) (and, in some cases, any related subordinate companion loan) as a whole loan. The directing certificateholder for this securitization generally will have consultation rights as the holder of an interest in the related mortgage loan, as described in the Preliminary Prospectus.
The procedures for the sale of any whole loan that becomes a defaulted whole loan, and any associated consultation rights, are subject to various limitations, conditions and exceptions as described in the Preliminary Prospectus.
|
| “As-Is” Appraisals: | Appraisals must be conducted on an “as-is” basis, and must be no more than 12 months old, for purposes of determining Appraisal Reduction Amounts and market value in connection with REO sales. Required appraisals may consist of updates of prior appraisals. Internal valuations by the Special Servicer are permitted if the principal balance of a mortgage loan is less than $2,000,000. |
THE INFORMATION IN THIS STRUCTURAL AND COLLATERAL TERM SHEET IS NOT COMPLETE AND MAY BE AMENDED PRIOR TO THE TIME OF SALE. THIS TERM SHEET IS NOT AN OFFER TO SELL THESE SECURITIES AND IT IS NOT A SOLICITATION OF AN OFFER TO BUY THESE SECURITIES IN ANY JURISDICTION WHERE THE OFFER OR SALE IS NOT PERMITTED.
31
| Wells Fargo Commercial Mortgage Trust 2021-C61 | Certain Terms and Conditions |
| Operating Advisor: | The Operating Advisor will have certain review and consultation rights relating to the performance of the Special Servicer and with respect to its actions taken in connection with the resolution and/or liquidation of Specially Serviced Loans. With respect to each mortgage loan (other than a Non-Serviced Mortgage Loan) or serviced whole loan, the Operating Advisor will be responsible for: |
| • | reviewing the actions of the Special Servicer with respect to any Specially Serviced Loan; |
| • | reviewing (i) all reports by the Special Servicer made available to Privileged Persons on the Certificate Administrator’s website that are relevant to the Operating Advisor’s obligations under the pooling and servicing agreement and (ii) each Asset Status Report (as defined in the Preliminary Prospectus) (after the occurrence and during the continuance of an Operating Advisor Consultation Event (as defined below)) and Final Asset Status Report (as defined in the Preliminary Prospectus); |
| • | recalculating and reviewing for accuracy and consistency with the WFCM 2021-C61 pooling and servicing agreement the mathematical calculations by the special servicer and the corresponding application of the non-discretionary portion of the applicable formulas required to be utilized in connection with Appraisal Reduction Amounts, Collateral Deficiency Amounts and net present value calculations used in the Special Servicer’s determination of what course of action to take in connection with the workout or liquidation of a Specially Serviced Loan; and |
| • | preparing an annual report (if any mortgage loan (other than any Non-Serviced Mortgage Loan) or serviced whole loan was a Specially Serviced Loan at any time during the prior calendar year or an Operating Advisor Consultation Event (as defined below) occurred during the prior calendar year) that sets forth whether the Operating Advisor believes, in its sole discretion exercised in good faith, that the Special Servicer is operating in compliance with the Servicing Standard with respect to its performance of its duties under the pooling and servicing agreement with respect to Specially Serviced Loans (and, after the occurrence and continuance of an Operating Advisor Consultation Event (as defined below), with respect to major decisions on non-Specially Serviced Loans) during the prior calendar year on a “trust-level basis”. The Operating Advisor will identify (1) which, if any, standards the Operating Advisor believes, in its sole discretion exercised in good faith, the Special Servicer has failed to comply with and (2) any material deviations from the Special Servicer’s obligations under the pooling and servicing agreement with respect to the resolution or liquidation of any Specially Serviced Loan or REO Property (other than with respect to any REO Property related to any Non-Serviced Mortgage Loan). In preparing any Operating Advisor Annual Report (as defined in the Preliminary Prospectus), the Operating Advisor will not be required to report on instances of non-compliance with, or deviations from, the Servicing Standard or the Special Servicer’s obligations under the pooling and servicing agreement that the Operating Advisor determines, in its sole discretion exercised in good faith, to be immaterial. |
With respect to each mortgage loan (other than any Non-Serviced Mortgage Loan) or serviced whole loan, after the Operating Advisor has received notice that an Operating Advisor Consultation Event (as defined below) has occurred and is continuing, in addition to the duties described above, the Operating Advisor will be required to perform the following additional duties: |
| • | to consult (on a non-binding basis) with the Special Servicer in respect of asset status reports and |
| • | to consult (on a non-binding basis) with the Special Servicer with respect to “major decisions” processed by the Special Servicer. |
| An “Operating Advisor Consultation Event” will occur when the Certificate Balances of the Class F-RR, G-RR, H-RR, J-RR, K-RR and L-RR Certificates in the aggregate (taking into account the application of any Cumulative Appraisal Reduction Amounts to notionally reduce the Certificate Balances of such Classes) is 25% or less of the initial Certificate Balances of such Classes in the aggregate. | |
| Asset Representations Reviewer: | The Asset Representations Reviewer will be required to review certain delinquent mortgage loans after a specified delinquency threshold has been exceeded (an “Asset Review Trigger”) and the required percentage of certificateholders vote to direct a review of such delinquent loans. An Asset Review Trigger will occur when either (1) mortgage loans with an aggregate outstanding principal balance of 25.0% or more of the aggregate outstanding principal balance of all of the mortgage loans (including any REO loans (or a portion of any REO loan in the case of a whole loan)) held by the issuing entity as of the end of the applicable collection period are delinquent |
THE INFORMATION IN THIS STRUCTURAL AND COLLATERAL TERM SHEET IS NOT COMPLETE AND MAY BE AMENDED PRIOR TO THE TIME OF SALE. THIS TERM SHEET IS NOT AN OFFER TO SELL THESE SECURITIES AND IT IS NOT A SOLICITATION OF AN OFFER TO BUY THESE SECURITIES IN ANY JURISDICTION WHERE THE OFFER OR SALE IS NOT PERMITTED.
32
| Wells Fargo Commercial Mortgage Trust 2021-C61 | Certain Terms and Conditions |
loans or (2) at least 15 mortgage loans are delinquent loans as of the end of the applicable collection period and the outstanding principal balance of such delinquent loans in the aggregate constitutes at least 20.0% of the aggregate outstanding principal balance of all of the mortgage loans (including any REO loans (or a portion of any REO loan in the case of a whole loan)) held by the issuing entity as of the end of the applicable collection period. See “Pooling and Servicing Agreement—The Asset Representations Reviewer—Asset Review” in the Preliminary Prospectus.
The Asset Representations Reviewer may be terminated and replaced without cause. Upon (i) the written direction of certificateholders evidencing not less than 25% of the voting rights (without regard to the application of any Cumulative Appraisal Reduction Amounts) requesting a vote to terminate and replace the Asset Representations Reviewer with a proposed successor Asset Representations Reviewer that is an eligible asset representations reviewer, and (ii) payment by such holders to the certificate administrator of the reasonable fees and expenses to be incurred by the certificate administrator in connection with administering such vote, the certificate administrator will promptly provide notice to all certificateholders and the Asset Representations Reviewer of such request by posting such notice on its internet website, and by mailing such notice to all certificateholders and the Asset Representations Reviewer. Upon the written direction of certificateholders evidencing at least 75% of a certificateholder quorum (without regard to the application of any Cumulative Appraisal Reduction Amounts), the Trustee will terminate all of the rights and obligations of the Asset Representations Reviewer under the WFCM 2021-C61 pooling and servicing agreement by written notice to the Asset Representations Reviewer, and the proposed successor Asset Representations Reviewer will be appointed. See “Pooling and Servicing Agreement—The Asset Representations Reviewer” in the Preliminary Prospectus.
| |
| Dispute Resolution Provisions: | The mortgage loan sellers will be subject to the dispute resolution provisions set forth in the WFCM 2021-C61 pooling and servicing agreement to the extent those provisions are triggered with respect to any mortgage loan sold to the depositor by a mortgage loan seller and such mortgage loan seller will be obligated under the related mortgage loan purchase agreement to comply with all applicable provisions and to take part in any mediation or arbitration proceedings that may result.
Generally, in the event that a Repurchase Request (as defined in the Preliminary Prospectus) is not “Resolved” (as defined below) within 180 days after the related mortgage loan seller receives such Repurchase Request, then the enforcing servicer will be required to send a notice to the “Initial Requesting Certificateholder” (if any) and the Certificate Administrator indicating the enforcing servicer’s intended course of action with respect to the Repurchase Request. If (a) the enforcing servicer’s intended course of action with respect to the Repurchase Request does not involve pursuing further action to exercise rights against the related mortgage loan seller with respect to the Repurchase Request and the Initial Requesting Certificateholder, if any, or any other certificateholder or certificate owner wishes to exercise its right to refer the matter to mediation (including non-binding arbitration) or arbitration, or (b) the enforcing servicer’s intended course of action is to pursue further action to exercise rights against the related mortgage loan seller with respect to the Repurchase Request but the Initial Requesting Certificateholder, if any, or any other certificateholder or certificate owner does not agree with the dispute resolution method selected by the enforcing servicer, then the Initial Requesting Certificateholder, if any, or such other certificateholder or certificate owner may deliver a written notice to the Special Servicer indicating its intent to exercise its right to refer the matter to either mediation or arbitration.
“Resolved” means, with respect to a Repurchase Request, (i) that the related Material Defect has been cured, (ii) the related mortgage loan has been repurchased in accordance with the related mortgage loan purchase agreement, (iii) a mortgage loan has been substituted for the related mortgage loan in accordance with the related mortgage loan purchase agreement, (iv) the applicable mortgage loan seller makes a Loss of Value Payment (as defined in the Preliminary Prospectus), (v) a contractually binding agreement is entered into between the enforcing servicer, on behalf of the issuing entity, and the related mortgage loan seller that settles the related mortgage loan seller’s obligations under the related mortgage loan purchase agreement or (vi) the related mortgage loan is no longer property of the issuing entity as a result of a sale or other disposition in accordance with the WFCM 2021-C61 pooling and servicing agreement. See “Pooling and Servicing Agreement—Dispute Resolution Provisions” in the Preliminary Prospectus.
|
| Investor Communications: | The certificate administrator is required to include on any Form 10–D any request received from a certificateholder to communicate with other certificateholders related to certificateholders exercising their rights under the terms of the WFCM 2021-C61 pooling and servicing agreement. Any certificateholder wishing to communicate with other certificateholders regarding the exercise of its rights under the terms of the WFCM 2021-C61 pooling and servicing agreement will be able |
THE INFORMATION IN THIS STRUCTURAL AND COLLATERAL TERM SHEET IS NOT COMPLETE AND MAY BE AMENDED PRIOR TO THE TIME OF SALE. THIS TERM SHEET IS NOT AN OFFER TO SELL THESE SECURITIES AND IT IS NOT A SOLICITATION OF AN OFFER TO BUY THESE SECURITIES IN ANY JURISDICTION WHERE THE OFFER OR SALE IS NOT PERMITTED.
33
| Wells Fargo Commercial Mortgage Trust 2021-C61 | Certain Terms and Conditions |
| to deliver a written request signed by an authorized representative of the requesting investor to the certificate administrator. | |
| Certain Fee Offsets: | If a workout fee is earned by the Special Servicer following a loan default with respect to any mortgage loan that it services, then certain limitations will apply based on modification fees paid by the borrower. The modification fee generally must not exceed 1% of the principal balance of the loan as modified in any 12-month period. In addition, if the loan re-defaults, any subsequent workout fee on that loan must be reduced by a portion of the modification fees paid by the borrower in the previous 12-months. Likewise, liquidation fees collected in connection with a liquidation or partial liquidation of a mortgage loan must be reduced by a portion of the modification fees paid by the borrower in the previous 12 months. |
| Deal Website: | The Certificate Administrator will be required to maintain a deal website, which will include, among other items: (a) summaries of asset status reports prepared by the Special Servicer, (b) inspection reports, (c) appraisals, (d) various “special notices” described in the Preliminary Prospectus, (e) the “Investor Q&A Forum”, (f) a voluntary “Investor Registry” and (g) the “Risk Retention Special Notices” tab. Investors may access the deal website following execution of a certification and confidentiality agreement. |
| Initial Majority Controlling Class Certificateholder: | It is expected that LD III Sub IV LLC or an affiliate will be the initial majority controlling class certificateholder. |
| Whole Loans: | Each of the mortgaged properties identified above under “IV. Characteristics of the Mortgage Pool—B. Summary of the Whole Loans” secures both a mortgage loan to be included in the trust fund and one or more other mortgage loans that will not be included in the trust fund, each of which will be pari passu or subordinate in right of payment with the mortgage loan included in the trust fund. We refer to each such group of mortgage loans as a “whole loan”. Such “—Summary of the Whole Loans” section includes further information regarding the various notes in each whole loan, the holders of such notes, the lead servicing agreement for each such whole loan, and the master servicer and special servicer under such lead servicing agreement. |
THE INFORMATION IN THIS STRUCTURAL AND COLLATERAL TERM SHEET IS NOT COMPLETE AND MAY BE AMENDED PRIOR TO THE TIME OF SALE. THIS TERM SHEET IS NOT AN OFFER TO SELL THESE SECURITIES AND IT IS NOT A SOLICITATION OF AN OFFER TO BUY THESE SECURITIES IN ANY JURISDICTION WHERE THE OFFER OR SALE IS NOT PERMITTED.
34
(THIS PAGE INTENTIONALLY LEFT BLANK)
THE INFORMATION IN THIS STRUCTURAL AND COLLATERAL TERM SHEET IS NOT COMPLETE AND MAY BE AMENDED PRIOR TO THE TIME OF SALE. THIS TERM SHEET IS NOT AN OFFER TO SELL THESE SECURITIES AND IT IS NOT A SOLICITATION OF AN OFFER TO BUY THESE SECURITIES IN ANY JURISDICTION WHERE THE OFFER OR SALE IS NOT PERMITTED.
35
| Office – Suburban | Loan #1 | Cut-off Date Balance: | $70,000,000 | |
| 1201 Lake Robbins Drive | 1201 Lake Robbins | Cut-off Date LTV: | 55.3% | |
| The Woodlands, TX 77380 | U/W NCF DSCR: | 2.26x | ||
| U/W NOI Debt Yield: | 9.2% |

THE INFORMATION IN THIS STRUCTURAL AND COLLATERAL TERM SHEET IS NOT COMPLETE AND MAY BE AMENDED PRIOR TO THE TIME OF SALE. THIS TERM SHEET IS NOT AN OFFER TO SELL THESE SECURITIES AND IT IS NOT A SOLICITATION OF AN OFFER TO BUY THESE SECURITIES IN ANY JURISDICTION WHERE THE OFFER OR SALE IS NOT PERMITTED.
36
| Office – Suburban | Loan #1 | Cut-off Date Balance: | $70,000,000 | |
| 1201 Lake Robbins Drive | 1201 Lake Robbins | Cut-off Date LTV: | 55.3% | |
| The Woodlands, TX 77380 | U/W NCF DSCR: | 2.26x | ||
| U/W NOI Debt Yield: | 9.2% |
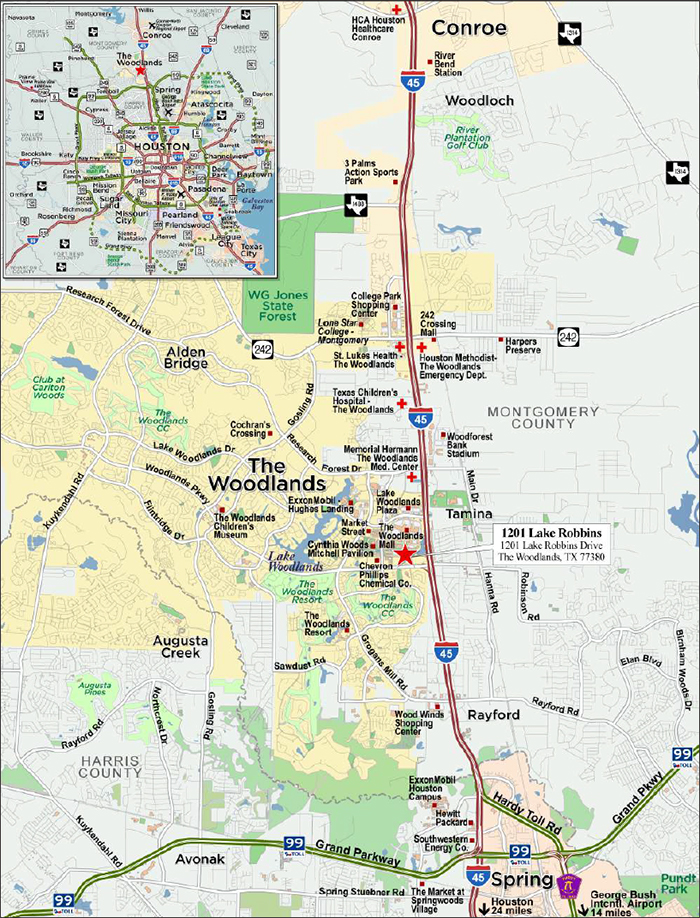
THE INFORMATION IN THIS STRUCTURAL AND COLLATERAL TERM SHEET IS NOT COMPLETE AND MAY BE AMENDED PRIOR TO THE TIME OF SALE. THIS TERM SHEET IS NOT AN OFFER TO SELL THESE SECURITIES AND IT IS NOT A SOLICITATION OF AN OFFER TO BUY THESE SECURITIES IN ANY JURISDICTION WHERE THE OFFER OR SALE IS NOT PERMITTED.
37
| No. 1 – 1201 Lake Robbins | |||||||||
| Mortgage Loan Information | Mortgaged Property Information(4) | ||||||||
| Mortgage Loan Seller: | Wells Fargo Bank, National Association | Single Asset/Portfolio: | Single Asset | ||||||
Credit Assessment (Fitch/KBRA/Moody’s): | NR/NR/NR | Property Type – Subtype: | Office – Suburban | ||||||
| Original Principal Balance(1): | $70,000,000 | Location: | The Woodlands, TX | ||||||
| Cut-off Date Balance(1): | $70,000,000 | Size: | 807,586 SF | ||||||
| % of Initial Pool Balance: | 9.2% | Cut-off Date Balance Per SF(1): | $309.56 | ||||||
| Loan Purpose: | Recapitalization | Maturity Date Balance Per SF(1): | $309.56 | ||||||
| Borrower Sponsors: | The Howard Hughes Corporation | Year Built/Renovated: | 2002/NAP | ||||||
| Guarantor: | The Woodlands Land Development Company, L.P. | Title Vesting: | Fee | ||||||
| Mortgage Rate: | 3.8270% | Property Manager: | Howard Hughes Management Services Company, LLC | ||||||
| Note Date: | October 8, 2021 | Current Occupancy (As of): | 100.0% (12/1/2021) | ||||||
| Seasoning: | 2 months | YE 2020 Occupancy: | 100.0% | ||||||
| Maturity Date: | October 11, 2031 | YE 2019 Occupancy: | 100.0% | ||||||
| IO Period: | 120 months | YE 2018 Occupancy: | 100.0% | ||||||
| Loan Term (Original): | 120 months | YE 2017 Occupancy: | 100.0% | ||||||
| Amortization Term (Original): | NAP | As-Is Appraised Value: | $452,000,000 | ||||||
| Loan Amortization Type: | Interest Only | As-Is Appraised Value Per SF: | $559.69 | ||||||
| Call Protection(2): | L(26),D(87),O(7) | As-Is Appraisal Valuation Date: | August 25, 2021 | ||||||
| Lockbox Type: | Hard/In Place Cash Management | ||||||||
| Additional Debt(1): | Yes | Underwriting and Financial Information(4) | |||||||
| Additional Debt Type (Balance): | Pari Passu ($180,000,000) | TTM NOI (8/31/2021): | $24,086,187 | ||||||
| YE 2020 NOI: | $24,374,004 | ||||||||
| YE 2019 NOI(5): | NAV | ||||||||
| YE 2018 NOI(5): | NAV | ||||||||
| U/W Revenues: | $35,365,647 | ||||||||
| U/W Expenses: | $12,442,182 | ||||||||
| Escrows and Reserves(3) | U/W NOI: | $22,923,465 | |||||||
| Initial | Monthly | Cap | U/W NCF: | $21,954,362 | |||||
| RE Taxes | $0 | Springing | NAP | U/W DSCR based on NOI/NCF(1): | 2.36x / 2.26x | ||||
| Insurance | $0 | Springing | NAP | U/W Debt Yield based on NOI/NCF(1): | 9.2% / 8.8% | ||||
| Replacement Reserve | $0 | Springing | NAP | U/W Debt Yield at Maturity based on NOI/NCF(1): | 9.2% / 8.8% | ||||
| TI/LC Reserve | $0 | Springing | NAP | Cut-off Date LTV Ratio(1): | 55.3% | ||||
| LTV Ratio at Maturity(1): | 55.3% | ||||||||
| Sources and Uses | ||||||||
| Sources | Uses | |||||||
| Original mortgage loan amount | $250,000,000 | 100.0% | Closing costs | $1,866,197 | 0.7% | |||
| Equity Repatriation(6) | 248,133,803 | 99.3 | ||||||
| Total Sources | $250,000,000 | 100.0% | Total Uses | $250,000,000 | 100.0% | |||
| (1) | The 1201 Lake Robbins Mortgage Loan (as defined below) is part of the 1201 Lake Robbins Whole Loan (as defined below) with an original aggregate principal balance of $250,000,000. The Cut-off Date Balance PSF, Maturity Date Balance PSF, U/W Debt Yield based on NOI/NCF, U/W Debt Yield at Maturity Date based on NOI/NCF, U/W DSCR based on NOI/NCF, Cut-off Date LTV Ratio and LTV Ratio at Maturity numbers presented above are based on the 1201 Lake Robbins Whole Loan. |
| (2) | At any time after the earlier of (i) October 8, 2024 and (ii) two years from the closing date of the securitization that includes the last pari passu note of the 1201 Lake Robbins Whole Loan to be securitized, the 1201 Lake Robbins Borrower (as defined below) has the right to defease the 1201 Lake Robbins Whole Loan in whole, but not in part. Additionally, the 1201 Lake Robbins Borrower may prepay the 1201 Lake Robbins Whole Loan with 30 days’ notice on or after April 11, 2031. |
| (3) | See “Escrows” section below. |
| (4) | While the 1201 Lake Robbins Mortgage Loan was originated after the emergence of the novel coronavirus pandemic and the economic disruption resulting from measures to combat the pandemic, the pandemic is an evolving situation and could impact the 1201 Lake Robbins Mortgage Loan more severely than assumed in the underwriting of the 1201 Lake Robbins Mortgage Loan. The pandemic and resulting economic disruption could also adversely affect the NOI, NCF and occupancy information, as well as the appraised value and the DSCR, LTV and Debt Yield metrics presented above. See “Risk Factors—Risks Related to Market Conditions and Other External Factors—Coronavirus Pandemic Has Adversely Affected the Global Economy and Will Likely Adversely Affect the Performance of the Mortgage Loans” in the Preliminary Prospectus. |
| (5) | The 1201 Lake Robbins Borrower purchased the property in December 2019. No prior historical financials are available. |
| (6) | The 1201 Lake Robbins Borrower purchased the property in December 2019 as part of a portfolio acquired by The Howard Hughes Corporation, and was unencumbered. |
THE INFORMATION IN THIS STRUCTURAL AND COLLATERAL TERM SHEET IS NOT COMPLETE AND MAY BE AMENDED PRIOR TO THE TIME OF SALE. THIS TERM SHEET IS NOT AN OFFER TO SELL THESE SECURITIES AND IT IS NOT A SOLICITATION OF AN OFFER TO BUY THESE SECURITIES IN ANY JURISDICTION WHERE THE OFFER OR SALE IS NOT PERMITTED.
38
| Office – Suburban | Loan #1 | Cut-off Date Balance: | $70,000,000 | |
| 1201 Lake Robbins Drive | 1201 Lake Robbins | Cut-off Date LTV: | 55.3% | |
| The Woodlands, TX 77380 | U/W NCF DSCR: | 2.26x | ||
| U/W NOI Debt Yield: | 9.2% |
The following table presents certain information relating to the tenancy at the 1201 Lake Robbins Property:
Major Tenants
| Tenant Name | Credit Moody’s/ | Tenant NRSF | % of NRSF | Annual U/W Base Rent PSF(1) | Annual U/W Base Rent(1) | % of Total Annual U/W Base Rent | Lease Expiration Date | Extension Options | Termination Option (Y/N) | ||||
| Major Tenants | |||||||||||||
| Occidental | BB/Ba2/BB | 807,586 | 100.0% | $30.69 | $24,784,815 | 100.0% | 12/31/2032 | Y(2) | N | ||||
| Total Major Tenants | 807,586 | 100.0% | $30.69 | $24,784,815 | 100.0% | ||||||||
| Non-Major Tenants | 0 | 0.0% | |||||||||||
| Occupied Collateral Total | 807,586 | 100.0% | $30.69 | $24,784,815 | 100.0% | ||||||||
| Vacant Space | 0 | 0.0% | |||||||||||
| Collateral Total | 807,586 | 100.0% | |||||||||||
| (1) | The Annual U/W Base Rent PSF and Annual U/W Base Rent shown above represent the January 1, 2022 rent step. |
| (2) | Tenant has the option of two, 5-year or one, 10-year renewal option for at least 250,000 square feet at 95% of fair market rent. |
The following table presents certain information relating to the lease rollover schedule at the 1201 Lake Robbins Property:
Lease Expiration Schedule(1)
| Year Ending December 31, | No. of Leases Expiring | Expiring NRSF | % of Total NRSF | Cumulative Expiring NRSF | Cumulative % of Total NRSF | Annual U/W Base Rent | % of Total Annual U/W Base Rent | Annual U/W Base Rent PSF |
| MTM | 0 | 0 | 0.0% | 0 | 0.0% | $0 | 0.0% | $0.00 |
| 2021 | 0 | 0 | 0.0% | 0 | 0.0% | $0 | 0.0% | $0.00 |
| 2022 | 0 | 0 | 0.0% | 0 | 0.0% | $0 | 0.0% | $0.00 |
| 2023 | 0 | 0 | 0.0% | 0 | 0.0% | $0 | 0.0% | $0.00 |
| 2024 | 0 | 0 | 0.0% | 0 | 0.0% | $0 | 0.0% | $0.00 |
| 2025 | 0 | 0 | 0.0% | 0 | 0.0% | $0 | 0.0% | $0.00 |
| 2026 | 0 | 0 | 0.0% | 0 | 0.0% | $0 | 0.0% | $0.00 |
| 2027 | 0 | 0 | 0.0% | 0 | 0.0% | $0 | 0.0% | $0.00 |
| 2028 | 0 | 0 | 0.0% | 0 | 0.0% | $0 | 0.0% | $0.00 |
| 2029 | 0 | 0 | 0.0% | 0 | 0.0% | $0 | 0.0% | $0.00 |
| 2030 | 0 | 0 | 0.0% | 0 | 0.0% | $0 | 0.0% | $0.00 |
| 2031 | 0 | 0 | 0.0% | 0 | 0.0% | $0 | 0.0% | $0.00 |
| Thereafter | 1 | 807,586 | 100.0% | 807,586 | 100.0% | $24,784,815 | 100.0% | $30.69 |
| Vacant | 0 | 0 | 0.0% | 807,586 | 100.0% | $0 | 0.0% | $0.00 |
| Total/Weighted Average | 1 | 807,586 | 100.0% | $24,784,815 | 100.0% | $30.69 |
| (1) | Information obtained from the underwritten rent roll. |
The following table presents historical occupancy percentages at the 1201 Lake Robbins Property:
Historical Occupancy
12/31/2017 | 12/31/2018 | 12/31/2019 | 12/31/2020 | 12/1/2021(1) |
| 100.0% | 100.0% | 100.0% | 100.0% | 100.0% |
| (1) | Information obtained from the underwritten rent roll. |
THE INFORMATION IN THIS STRUCTURAL AND COLLATERAL TERM SHEET IS NOT COMPLETE AND MAY BE AMENDED PRIOR TO THE TIME OF SALE. THIS TERM SHEET IS NOT AN OFFER TO SELL THESE SECURITIES AND IT IS NOT A SOLICITATION OF AN OFFER TO BUY THESE SECURITIES IN ANY JURISDICTION WHERE THE OFFER OR SALE IS NOT PERMITTED.
39
| Office – Suburban | Loan #1 | Cut-off Date Balance: | $70,000,000 | |
| 1201 Lake Robbins Drive | 1201 Lake Robbins | Cut-off Date LTV: | 55.3% | |
| The Woodlands, TX 77380 | U/W NCF DSCR: | 2.26x | ||
| U/W NOI Debt Yield: | 9.2% |
Historical Operating Performance and Underwritten Net Cash Flow. The following table presents certain information relating to the historical operating performance and underwritten net cash flow at the 1201 Lake Robbins Center Property:
Cash Flow Analysis
| 2020 | TTM (8/31/2021) | U/W | %(1) | U/W $ per SF | |
| Base Rent | $23,823,787 | $24,141,438 | $24,784,815(2) | 67.7% | $30.69 |
| Grossed Up Vacant Space | 0 | 0 | 0 | 0.0 | 0.00 |
| Gross Potential Rent | $23,823,787 | $24,141,438 | $24,784,815 | 67.7% | $30.69 |
| Other Income | 0 | 0 | 0 | 0.0 | 0.00 |
| Total Recoveries | 12,027,957 | 11,856,395 | 11,820,073 | 32.3 | 14.64 |
| Net Rental Income | $35,851,744 | $35,997,833 | $36,604,888 | 100.0% | $45.33 |
| (Vacancy & Credit Loss) | 0 | 0 | (1,239,241) | (5.0) | (1.53) |
| Effective Gross Income | $35,851,744 | $35,997,833 | $35,365,647 | 96.6% | $43.79 |
| Real Estate Taxes | 4,906,836 | 4,571,446 | 5,138,179 | 14.5 | 6.36 |
| Insurance | 635,236 | 647,661 | 697,633 | 2.0 | 0.86 |
| Management Fee | 1,349,404 | 1,147,138 | 1,060,969 | 3.0 | 1.31 |
| Other Operating Expenses | 4,586,264 | 5,545,401 | 5,545,401 | 15.7 | 6.87 |
| Total Operating Expenses | $11,477,740 | $11,911,646 | $12,442,182 | 35.2% | $15.41 |
| Net Operating Income | $24,374,004 | $24,086,187 | $22,923,465 | 64.8% | $28.39 |
| Replacement Reserves | 0 | 0 | 161,517 | 0.5 | 0.20 |
| TI/LC | 0 | 0 | 807,586 | 2.3 | 1.00 |
| Net Cash Flow | $24,374,004 | $24,086,187 | $21,954,362 | 62.1% | $27.19 |
| NOI DSCR(3) | 2.51x | 2.48x | 2.36x | ||
| NCF DSCR(3) | 2.51x | 2.48x | 2.26x | ||
| NOI Debt Yield(3) | 9.7% | 9.6% | 9.2% | ||
| NCF Debt Yield(3) | 9.7% | 9.6% | 8.8% |
| (1) | Represents (i) percent of Net Rental Income for all revenue fields, (ii) percent of Gross Potential Rent for Vacancy & Credit Loss and (iii) percent of Effective Gross Income for all other fields. |
| (2) | The U/W Base Rent represents the January 1, 2022 rent step. |
| (3) | The NOI and NCF DSCR and NOI and NCF Debt Yield are based on the 1201 Lake Robbins Whole Loan. |
Appraisal. The appraiser concluded an “as-is market value” of $452,000,000 as of August 25, 2021. The appraiser provided an “as dark appraised value” of $223,000,000.
Environmental Matters. According to the Phase I environmental site assessment dated September 3, 2021, there are no significant issues and no further inspection is necessary.
Market Overview and Competition. The 1201 Lake Robbins Property is located in The Woodlands, Texas, approximately 29.5 miles north of Houston. The Woodlands is a mixed-use master-planned development that contains approximately 27,000 acres, of which approximately 20-25% will remain forest preserves, parks, golf courses, lakes and open space. The Woodlands includes over 1,650 companies including major corporations such as Chevron Phillips, Occidental, and Baker Hughes, and employs an estimated 22,629 people. Currently, the Woodlands is home to more than 60,000 residents, contains 3.9 million square feet of retail and commercial space and approximately 6.3 million square feet of office space. At full build out, the community is expected to have 132,500 residents and approximately 82,000 employees. The 1201 Lake Robbins Property is located directly adjacent to the Woodlands Waterway, which winds through the township and connects attractions along the way such as dining, hotels, nightlife and outdoor green space. According to the appraisal, the estimated 2020 population within a one, three and five-mile radius was approximately 5,552, 62,548 and 160,703, respectively and the estimated 2020 average household income within the same radii was approximately $133,550, $132,792 and $141,072, respectively.
The 1201 Lake Robbins Property is located approximately 4.9 miles from the Grand Parkway, the outermost loop around Houston and provides accessibility throughout the area, and 1.1 miles from Interstate 45, a major north south thoroughfare. Additionally, the 1201 Lake Robbins Property is located 0.9 miles to The Woodlands Mall, featuring various dining and entertainment options and tenants such as Apple, Coach, Peloton and Nordstrom. The 1201 Lake Robbins Property is also located approximately 22.5 miles from the George Bush Intercontinental Airport.
According to the appraisal, the property is situated within in the Woodlands/Conroe submarket within the greater Houston office market. As of the second quarter of 2021, the submarket reported a total inventory of approximately 11.0 million square feet with a
THE INFORMATION IN THIS STRUCTURAL AND COLLATERAL TERM SHEET IS NOT COMPLETE AND MAY BE AMENDED PRIOR TO THE TIME OF SALE. THIS TERM SHEET IS NOT AN OFFER TO SELL THESE SECURITIES AND IT IS NOT A SOLICITATION OF AN OFFER TO BUY THESE SECURITIES IN ANY JURISDICTION WHERE THE OFFER OR SALE IS NOT PERMITTED.
40
| Office – Suburban | Loan #1 | Cut-off Date Balance: | $70,000,000 | |
| 1201 Lake Robbins Drive | 1201 Lake Robbins | Cut-off Date LTV: | 55.3% | |
| The Woodlands, TX 77380 | U/W NCF DSCR: | 2.26x | ||
| U/W NOI Debt Yield: | 9.2% |
19.1% vacancy rate and an average asking rent of $40.24 per square foot, net. The appraiser identified nine comparable buildings located within The Woodlands with rents ranging from $21.00 to $30.75 per square foot, net. The appraiser concluded a market rent for the 1201 Lake Robbins Property of $29.00 per square foot, net.
The following table presents certain information relating to the appraisal’s market rent conclusion for the 1201 Lake Robbins Property:
Market Rent Summary(1)
| Market Rent (PSF) | $29.00 |
| Lease Term (Years) | 10 |
| Lease Type (Reimbursements) | Net |
| Rent Increase Projection | $0.50 per annum |
| Tenant Improvements (New/Renewal) | $75.00 / $25.00 |
| Leasing Commissions (New Renewal) | 6.0% / 6.0% |
| Free Rent | 12 months |
| (1) | Information obtained from the appraisal. |
The table below presents certain information relating to comparable sales pertaining to the 1201 Lake Robbins Property identified by the appraiser:
Comparable Sales(1)
| Property Name | Location | Year Built/Renovated | Rentable Area (SF) | Sale Date | Sale Price | Sale Price (PSF) |
Apple at Capital Ridge 320 South Capital of Texas Highway Austin, TX | Austin, TX | 2015/NAP | 216,511 | Aug-2021 | $140,000,000 | $647 |
Waterway Plaza 1 10003 Woodloch Forest Drive The Woodlands, TX | The Woodlands, TX | 2000/NAP | 223,516 | Jan-2021 | $109,000,000 | $488 |
Helios Plaza 201 Helios Way Houston, TX | Houston, TX | 2009/NAP | 377,185 | Aug-2021 | $178,000,000 | $472 |
HP Inc. Plaza in City Place 10300 Energy Drive Spring, TX | Spring, TX | 2018/NAP | 378,402 | Aug-2021 | $217,581,200 | $575 |
Ten West One 17420 Katy Freeway Houston, TX | Houston, TX | 1998/NAP | 199,000 | Aug-2021 | $67,100,000 | $337 |
| (1) | Information obtained from the appraisal. |
THE INFORMATION IN THIS STRUCTURAL AND COLLATERAL TERM SHEET IS NOT COMPLETE AND MAY BE AMENDED PRIOR TO THE TIME OF SALE. THIS TERM SHEET IS NOT AN OFFER TO SELL THESE SECURITIES AND IT IS NOT A SOLICITATION OF AN OFFER TO BUY THESE SECURITIES IN ANY JURISDICTION WHERE THE OFFER OR SALE IS NOT PERMITTED.
41
| Office – Suburban | Loan #1 | Cut-off Date Balance: | $70,000,000 | |
| 1201 Lake Robbins Drive | 1201 Lake Robbins | Cut-off Date LTV: | 55.3% | |
| The Woodlands, TX 77380 | U/W NCF DSCR: | 2.26x | ||
| U/W NOI Debt Yield: | 9.2% |
The following table presents certain information relating to comparable leases related to 1201 Lake Robbins Property:
Comparable Leases(1)
| Property Name/Location | Year Built/ Renovated | Total GLA (SF) | Occupancy(2) | Term | Annual Base Rent PSF(3) | Lease Type |
1201 Lake Robbins (Subject) 1201 Lake Robbins Drive The Woodlands, TX | 2002/NAP | 807,586(4) | 100%(4) | 13 Yrs. | $30.69(5) | NNN |
One, Two & Three Hughes Landing 1780, 1790 & 1800 Hughes Landing Boulevard The Woodlands, TX | 2015/NAP | 716,230 | 86% | 5-10 Yrs. | $30.00 | NNN |
Woodlands Town Center 1 & 2 1330 & 1450 Lake Robbins Drive The Woodlands, TX | 1999/NAP | 280,415 | 82% | 5-10 Yrs. | $24.50 | NNN |
3 Waterway Square Place 3 Waterway Avenue The Woodlands, TX | 2013/NAP | 232,045 | 87% | 3-10 Yrs. | $29.00 | NNN |
4 Waterway Square Place 4 Waterway Avenue The Woodlands, TX | 2008/NAP | 218,551 | 100% | 5 Yrs. | $29.00 | NNN |
21 Waterway 21 Waterway Avenue The Woodlands, TX | 2005/NAP | 102,816 | 99% | 3-10 Yrs. | $30.50 | NNN |
24 Waterway 24 Waterway Avenue The Woodlands, TX | 2008/NAP | 308,000 | 91% | 3-10 Yrs. | $29.00 | NNN |
Waterway Plaza Two 10001 Woodloch Forest Drive The Woodlands, TX | 2000/NAP | 142,270 | 60% | 3-10 Yrs. | $26.50 | NNN |
Wildwood Corporate Centre II 480 WildWood Forest Drive The Woodlands, TX | 2016/NAP | 201,933 | 89% | 5-10 Yrs. | $21.00 | NNN |
The Woodlands Tower 9950 Woodloch Forest Drive The Woodlands, TX | 2014/NAP | 595,854 | 34% | 5-10 Yrs. | $30.75 | NNN |
| (1) | Information obtained from the appraisal. Includes comparable buildings located in The Woodlands, TX. |
| (2) | Represents building occupancy as of September 2021, with the exception of the 1201 Lake Robbins Property |
| (3) | Represents quoted rental rates as of September 2021, with the exception of the 1201 Lake Robbins Property. |
| (4) | Information obtained from the underwritten rent roll. |
| (5) | Represents the underwritten base rent. |
Escrows.
Real Estate Taxes – During a Cash Trap Event Period (as defined below), the loan documents require ongoing monthly real estate tax reserves in an amount equal to 1/12th of the real estate taxes that the lender estimates will be payable during the next 12 months.
Insurance – During a Cash Trap Event Period, the loan documents require ongoing monthly insurance reserves in an amount equal to 1/12th of the insurance premiums that the lender estimates will be payable for the renewal of the coverage afforded by the policies upon the expiration thereof.
Notwithstanding the above, the 1201 Lake Robbins Borrower’s obligation to make insurance reserve payments will be waived so long as (i) no event of default is continuing, (ii) the insurance policies maintained by 1201 Lake Robbins Borrower are part of a blanket or umbrella policy approved by the lender in its reasonable discretion, and (iii) the lender is provided with paid receipts for the payment of the insurance premiums no later than ten business days prior to the expiration dates of said policies.
Replacement Reserve – During a Cash Trap Event Period, the loan documents require an ongoing monthly replacement reserve deposit of $10,095.
TI/LC Reserve – During a Cash Trap Event Period, the loan documents require an ongoing monthly TI/LC reserve deposit of $134,598.
Lockbox and Cash Management. The 1201 Lake Robbins Mortgage Loan is structured with a hard lockbox and in-place cash management. The 1201 Lake Robbins Borrower and property manager are required to direct the tenant to pay rent directly into the lockbox account, and to deposit any rents otherwise received in such account within two business days after receipt. On each business day, the lockbox bank is required to transfer amounts on deposit in the lockbox account into the cash management account, to be applied in accordance with the loan documents. If no Cash Trap Event Period exists, all excess cash flow will be disbursed to, or at the
THE INFORMATION IN THIS STRUCTURAL AND COLLATERAL TERM SHEET IS NOT COMPLETE AND MAY BE AMENDED PRIOR TO THE TIME OF SALE. THIS TERM SHEET IS NOT AN OFFER TO SELL THESE SECURITIES AND IT IS NOT A SOLICITATION OF AN OFFER TO BUY THESE SECURITIES IN ANY JURISDICTION WHERE THE OFFER OR SALE IS NOT PERMITTED.
42
| Office – Suburban | Loan #1 | Cut-off Date Balance: | $70,000,000 | |
| 1201 Lake Robbins Drive | 1201 Lake Robbins | Cut-off Date LTV: | 55.3% | |
| The Woodlands, TX 77380 | U/W NCF DSCR: | 2.26x | ||
| U/W NOI Debt Yield: | 9.2% |
written direction, of the 1201 Lake Robbins Borrower. During the continuance of a Cash Trap Event Period, excess cash flow will be held by the lender as additional collateral.
A “Cash Trap Event Period” will commence upon the earlier of the following:
| (i) | the occurrence of an event of default under the loan documents; |
| (ii) | the net cash flow debt yield being less than 6.0% for any calendar quarter; |
| (iii) | the occurrence of a Material Tenant Event (as defined below). |
A Cash Trap Event Period will end upon the occurrence of the following:
| ● | with regard to clause (i), the cure of such event of default; |
| ● | with regard to clause (ii), the net cash flow debt yield being equal to or greater than 6.0%, tested quarterly, or the 1201 Lake Robbins Borrower delivers cash or a letter of credit in an amount which, if applied to the then principal balance of the 1201 Lake Robbins Mortgage Loan, would result in the debt yield threshold being satisfied; |
| ● | with regard to clause (iii), a Material Tenant Event Cure occurs. |
A “Material Tenant Event” will commence upon the occurrence of any of the following:
| (i) | Occidental defaults under the lease beyond any notice and cure periods; |
| (ii) | Occidental becomes a debtor in a bankruptcy, insolvency or similar proceeding; |
| (iii) | Occidental goes dark in 50% or more of the 1201 Lake Robbins Property, unless it is caused by COVID-19 or any other pandemic event; |
| (iv) | The credit rating of Occidental is downgraded below “B” or the equivalent by any rating agency; |
| (v) | Occidental has not renewed its lease for a minimum of a five-year term on then-current market terms reasonably approved by lender, at least 12 months prior to loan maturity; or |
| (vi) | Occidental terminates, surrenders, or cancels its lease. |
A “Material Tenant Cure” will commence upon the occurrence of any of the following:
| ● | with regard to clause (i), either the event of default has been cured or the 1201 Lake Robbins Borrower has entered into one or more replacement leases for at least a five year term, for either the entire Occidental space or a portion of the space if the aggregate base rent is at least 90% of the base rent otherwise payable under the Occidental lease, and the tenant has taken occupancy and commenced paying full unabated rent as evidenced by an estoppel (“Replacement Lease Condition”); |
| ● | if caused solely by clause (ii), either the bankruptcy has been discharged or dismissed, Occidental has assumed the lease and the bankruptcy trustee has approved the assumption or the occurrence of a Replacement Lease Condition; |
| ● | if caused solely by clause (iii), Occidental has been continuously operating in more than 50% of the 1201 Lake Robbins Property for more than 90 days or if a sublease exists for more than 50% of the space, the sublease occupancy sweep cap of $50.00 PSF for the sublease square footage has been met, and Occidental is operating in the remainder of the 1201 Lake Robbins Property; |
| ● | if caused solely by clause (iv), Occidental has a credit rating of “B” or higher by each rating agency that rates it; |
| ● | if caused solely by clause (v), a binding and enforceable renewal of the Occidental lease approved by the lender has been delivered by Occidental; or |
| ● | if caused solely by clause (vi) the occurrence of a Replacement Lease Condition. |
Property Management. The 1201 Lake Robbins Property is managed by Howard Hughes Management Services Company, LLC.
Real Estate Substitution. Not permitted.
Subordinate and Mezzanine Indebtedness. Not permitted.
Ground Lease. None.
Terrorism Insurance. The loan documents require that the “all risk” insurance policy required to be maintained by the borrower provides coverage for terrorism in an amount equal to the full replacement cost of the property, as well as business interruption insurance covering no less than the 18-month period following the occurrence of a casualty event, together with a 6-month extended period of indemnity. Provided, however, if TRIPRA is not in effect, the 1201 Lake Robbins Borrower is not required to pay premiums in excess of two times the premium for a separate all risk policy insuring the 1201 Lake Robbins Property on a stand along basis.
THE INFORMATION IN THIS STRUCTURAL AND COLLATERAL TERM SHEET IS NOT COMPLETE AND MAY BE AMENDED PRIOR TO THE TIME OF SALE. THIS TERM SHEET IS NOT AN OFFER TO SELL THESE SECURITIES AND IT IS NOT A SOLICITATION OF AN OFFER TO BUY THESE SECURITIES IN ANY JURISDICTION WHERE THE OFFER OR SALE IS NOT PERMITTED.
43
| Mixed Use – Multifamily/Retail | Loan #2 | Cut-off Date Balance: | $55,000,000 | |
| 1698 Alton Road | 17 West Miami | Cut-off Date LTV: | 65.9% | |
| Miami Beach, FL 33139 | U/W NCF DSCR: | 1.90x | ||
| U/W NOI Debt Yield: | 7.5% |
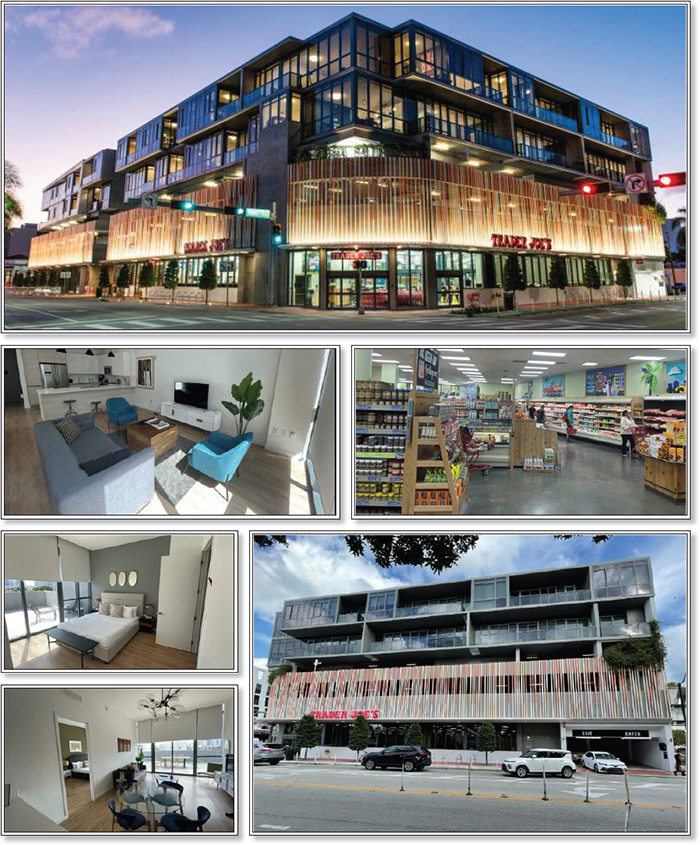
THE INFORMATION IN THIS STRUCTURAL AND COLLATERAL TERM SHEET IS NOT COMPLETE AND MAY BE AMENDED PRIOR TO THE TIME OF SALE. THIS TERM SHEET IS NOT AN OFFER TO SELL THESE SECURITIES AND IT IS NOT A SOLICITATION OF AN OFFER TO BUY THESE SECURITIES IN ANY JURISDICTION WHERE THE OFFER OR SALE IS NOT PERMITTED.
44
| Mixed Use – Multifamily/Retail | Loan #2 | Cut-off Date Balance: | $55,000,000 | |
| 1698 Alton Road | 17 West Miami | Cut-off Date LTV: | 65.9% | |
| Miami Beach, FL 33139 | U/W NCF DSCR: | 1.90x | ||
| U/W NOI Debt Yield: | 7.5% |
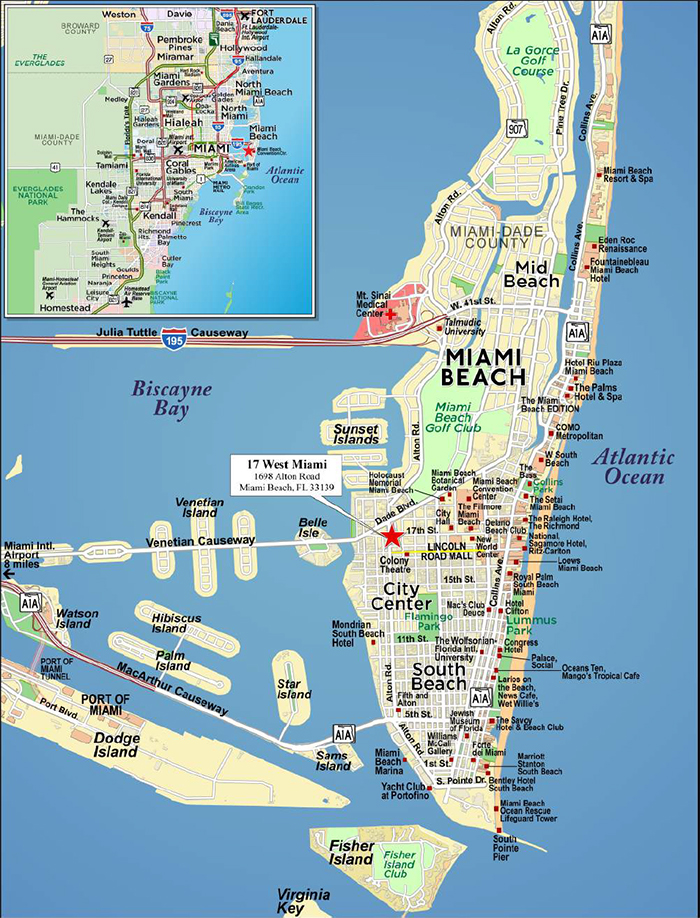
THE INFORMATION IN THIS STRUCTURAL AND COLLATERAL TERM SHEET IS NOT COMPLETE AND MAY BE AMENDED PRIOR TO THE TIME OF SALE. THIS TERM SHEET IS NOT AN OFFER TO SELL THESE SECURITIES AND IT IS NOT A SOLICITATION OF AN OFFER TO BUY THESE SECURITIES IN ANY JURISDICTION WHERE THE OFFER OR SALE IS NOT PERMITTED.
45
| No. 2 – 17 West Miami | |||||||
| Mortgage Loan Information | Mortgaged Property Information | ||||||
| Mortgage Loan Seller: | Ladder Capital Finance LLC | Single Asset/Portfolio: | Single Asset | ||||
Credit Assessment (Fitch/KBRA/Moody’s): | NR/NR/NR | Property Type – Subtype: | Mixed Use –Multifamily/Retail | ||||
| Original Principal Balance: | $55,000,000 | Location: | Miami Beach, FL | ||||
| Cut-off Date Balance: | $55,000,000 | Size: | 63,146 SF | ||||
| % of Initial Pool Balance: | 7.2% | Cut-off Date Balance Per SF: | $871.00 | ||||
| Loan Purpose: | Refinance | Maturity Date Balance Per SF: | $871.00 | ||||
| Borrower Sponsors: | Turnberry Associates, Elion Partners and Privee Capital | Year Built/Renovated: | 2019/NAP | ||||
| Guarantors: | Erwin Sredni, Rock Soffer, Elion Real Estate Fund III, LP and Elion Real Estate Fund III (International), LP | Title Vesting: | Fee | ||||
| Interest Rate: | 3.8100% | Property Manager: | Urban Resource LLC | ||||
| Note Date: | November 9, 2021 | Current Occupancy (As of) (2): | 94.0% (10/11/2021) | ||||
| Seasoning: | 0 months | YE 2020 Occupancy: | 88.2% | ||||
| Maturity Date: | December 6, 2031 | YE 2019 Occupancy: | NAP | ||||
| IO Period: | 120 months | YE 2018 Occupancy: | NAP | ||||
| Loan Term (Original): | 120 months | YE 2017 Occupancy: | NAP | ||||
| Amortization Term (Original): | NAP | As-Is Appraised Value(3): | $83,500,000 | ||||
| Loan Amortization Type: | Interest Only | As-Is Appraised Value Per SF: | $1,322.33 | ||||
| Call Protection: | L(24),D(91),O(5) | As-Is Appraisal Valuation Date(3): | October 7, 2021 | ||||
| Lockbox Type: | Hard/Springing Cash Management | Underwriting and Financial Information(3) | |||||
| Additional Debt: | None | TTM NOI (9/30/2021) (4): | $3,308,157 | ||||
| Additional Debt Type (Balance): | NAP | YE 2020 NOI: | $2,398,368 | ||||
| YE 2019 NOI: | $393,894 | ||||||
| YE 2018 NOI: | NAP | ||||||
| U/W Revenues: | $5,107,365 | ||||||
| U/W Expenses: | $1,008,072 | ||||||
| Escrows and Reserves(1) | U/W NOI(4): | $4,099,292 | |||||
| Initial | Monthly | Cap | U/W NCF: | $4,047,166 | |||
| Taxes | $0 | $41,596 | NAP | U/W DSCR based on NOI/NCF: | 1.93x / 1.90x | ||
| Insurance | $65,848 | $7,316 | NAP | U/W Debt Yield based on NOI/NCF: | 7.5% / 7.4% | ||
| Replacement Reserve | $0 | $1,713 | $61,661 | U/W Debt Yield at Maturity based on NOI/NCF: | 7.5% / 7.4% | ||
| TI/LC Reserve | $412,535 | $2,631 | $94,719 | Cut-off Date LTV Ratio: | 65.9% | ||
| LTV Ratio at Maturity: | 65.9% | ||||||
| Sources and Uses | ||||||||
| Sources | Uses | |||||||
| Original loan amount | $55,000,000 | 100.0% | Loan Payoff | $33,550,522 | 61.0% | |||
| Upfront Reserves | 478,383 | 0.9 | ||||||
| Closing Costs | 1,337,782 | 2.4 | ||||||
| Return of Equity | 19,633,314 | 35.7 | ||||||
| Total Sources | $55,000,000 | 100.0% | Total Uses | $55,000,000 | 100.0% | |||
| (1) | See “Escrows” section for a full description of Escrows and Reserves. |
| (2) | Current Occupancy is calculated by leases in place, including the Sonder (as defined below) master lease, which encompasses 35,789 SF (56.7% of NRA). |
| (3) | While the 17 West Miami Mortgage Loan (as defined below) was originated after the emergence of the novel coronavirus pandemic and the economic disruption resulting from measures to combat the pandemic, the pandemic is an evolving situation and could impact the 17 West Miami Mortgage Loan more severely than assumed in the underwriting of 17 West Miami Mortgage Loan and could adversely affect the NOI, NCF and occupancy information, as well as the appraised value and the DSCR, LTV and Debt Yield metrics presented above. See "Risk Factors - Risks Related to Market Conditions and Other External Factors - Coronavirus Pandemic Has Adversely Affected the Global Economy and Will Likely Adversely Affect the Performance of the Mortgage Loans" in the Prospectus. |
| (4) | The difference between the TTM NOI (9/30/2021) and U/W NOI is attributed to newly signed leases at the 17 West Miami Property (as defined below) throughout 2020 and 2021. |
The Mortgage Loan. The mortgage loan (the “17 West Miami Mortgage Loan”) is evidenced by a single promissory note secured by a first mortgage encumbering the fee interest in a 63,146 square foot mixed use multifamily and retail property located in Miami Beach, Florida (the “17 West Miami Property”).
The Borrower and Borrower Sponsor. The borrowers are 1681 West Ventures, LLC and 1698 Alton Road Ventures LLC (individually and collectively, the “17 West Miami Borrower”), each a Florida limited liability company. The 17 West Miami Borrower has two independent directors.The sole member of each borrower is a single purpose Delaware single member limited liability company with two independent directors. Legal counsel to the 17 West Miami Borrower delivered a non-consolidation opinion in connection with the
THE INFORMATION IN THIS STRUCTURAL AND COLLATERAL TERM SHEET IS NOT COMPLETE AND MAY BE AMENDED PRIOR TO THE TIME OF SALE. THIS TERM SHEET IS NOT AN OFFER TO SELL THESE SECURITIES AND IT IS NOT A SOLICITATION OF AN OFFER TO BUY THESE SECURITIES IN ANY JURISDICTION WHERE THE OFFER OR SALE IS NOT PERMITTED.
46
| Mixed Use – Multifamily/Retail | Loan #2 | Cut-off Date Balance: | $55,000,000 | |
| 1698 Alton Road | 17 West Miami | Cut-off Date LTV: | 65.9% | |
| Miami Beach, FL 33139 | U/W NCF DSCR: | 1.90x | ||
| U/W NOI Debt Yield: | 7.5% |
origination of the 17 West Miami Mortgage Loan. The nonrecourse carve-out guarantors of the 17 West Miami Mortgage Loan are Erwin Sredni, Rock Soffer, Elion Real Estate Fund III, LP and Elion Real Estate Fund III (International), LP.
Elion Partners is a vertically integrated real estate investment firm with experience across both the operational and financial facets of the real estate industry. The firm is led by a team with experience in investing, asset management and real estate operations. Elion's institutional-grade investment platform today manages $1.5 billion in assets.
Turnberry Associates is a closely-held real estate development firm. Since its founding over 50 years ago, Turnberry has developed more than $10 billion of commercial and residential real estate projects, comprised of over 20 million square feet of retail, 7,000 residential units, 15 million square feet of office, and 3,000 hotel and resort rooms.
Privee Capital serves as the family office to the Sredni family, which has been involved in the commercial real estate industry since 1993. With over 30 years of real estate experience, Erwin Sredni (managing member) has a track record in development and asset management for commercial properties.
The Property. The 17 West Miami Property is a five-story mixed use multifamily and retail property located at 1698 Alton Road in Miami Beach, Florida. The 26-unit apartment complex is above 6 units of ground level retail space anchored by Trader Joe’s (as defined below) with other tenants such as Truist and Verizon. The net rentable area is 63,146 square feet total, with 27,357 square feet of retail and 35,789 square feet of multifamily. The building was built in 2019. The 17 West Miami Property amenities include the following: rooftop pool, spa, fitness center and sundeck. There is a 95,250 square foot on-site structured parking garage with 198 parking spots.
As of October 11, 2021, the 17 West Miami Property was 94.0% leased and features ground-floor retail with a 198-space parking garage, and 26 class A loft-style residential units. The retail component is comprised of 27,357 SF and is 86.2% leased to 5 tenants, anchored by Trader Joe’s East Inc (“Trader Joe’s”) (16,278 SF / 28.8% of total UW rent/ 2029 lease expiration), which opened in August 2019, amongst other tenants such as Truist and Verizon. The 35,789 square foot residential component contains 26 units of 1-, 2-, and 3-bedroom floorplans that are 100% master leased to Sonder USA Inc (“Sonder”) (48.1% of total UW rent / 2030 lease expiration), a modern multi-family operator providing optionality for both short- and long-term stays. The lease commenced in January 2020 for a 10-year term on a triple net basis. The 17 West Miami Property is directly accessible from Alton Road and 17th Street, within walking distance to Miami Beach (0.8 miles) and the shops at Lincoln Road (0.7 miles), and steps from Florida’s Intracoastal Waterway, providing access to Miami’s entertainment districts.
Multifamily
The multifamily portion of the 17 West Miami Property consists of 26 multifamily units, which are comprised of 4 one-bedroom units, 13 two-bedroom units, and 9 three-bedroom units. Residential building amenities include a fitness center and a rooftop pool deck with views over the surrounding Miami Beach area. The 17 West Miami Property amenities include the following: Rooftop pool, spa, fitness center and sundeck. There is a 95,250 square foot structured parking garage with 198 parking spots.
Unit Mix Summary(1)(2)
| Unit Type | Total No. of Units | Occupied Units | % of Total Units | Occupancy | Average Unit Size (SF) | Average per Unit |
| 1 Bedroom | 4 | NAP | 15.4% | NAP | 836 | NAP |
| 2 Bedrooms | 13 | NAP | 50.0% | NAP | 1,269 | NAP |
| 3 Bedrooms | 9 | NAP | 34.6% | NAP | 1,771 | NAP |
| Total/Weighted Average | 26 | 100.0% | 1,377 |
| (1) | Information obtained from the underwritten rent roll. |
| (2) | Occupied Units, Occupancy and Average Underwritten Monthly Rent per Unit is unavailable, as Sonder master leases the multifamily units. |
Retail
The 17 West Miami Property is 94.0% leased to six tenants, of which five are retail and anchored by Trader Joes (28.8% of UW rent / 2029 lease expiration); Sonder master-leases 100% of residential units (48.1% of UW rent / 2030 lease expiration).
Trader Joes makes up 28.8% of UW rent at origination and has a remaining lease term of 8.2 years with an additional 20 years of extension options available.
The other four retail tenants provide for a diversified mix inclusive of banking, telecommunications, spa & wellness, and health & fitness; together, these tenants only comprise 23.1% of UW Income, with Truist Bank representing 12.4% of UW Income and the remaining retail tenants each representing less than 5% of UW Income.
Sonder, which operates the 26 multi-family units, accounts for 48.1% of UW rent at origination and has 8.2 years of remaining lease term with an additional 5 years of extension options available, and maintains an $880,409.52 security deposit for the entirety of its term in addition to a corporate guaranty of up to 5 years of rent from the parent company, Sonder Canada Inc.
THE INFORMATION IN THIS STRUCTURAL AND COLLATERAL TERM SHEET IS NOT COMPLETE AND MAY BE AMENDED PRIOR TO THE TIME OF SALE. THIS TERM SHEET IS NOT AN OFFER TO SELL THESE SECURITIES AND IT IS NOT A SOLICITATION OF AN OFFER TO BUY THESE SECURITIES IN ANY JURISDICTION WHERE THE OFFER OR SALE IS NOT PERMITTED.
47
| Mixed Use – Multifamily/Retail | Loan #2 | Cut-off Date Balance: | $55,000,000 | |
| 1698 Alton Road | 17 West Miami | Cut-off Date LTV: | 65.9% | |
| Miami Beach, FL 33139 | U/W NCF DSCR: | 1.90x | ||
| U/W NOI Debt Yield: | 7.5% |
Major Tenants.
Largest Tenant: Sonder (35,789 square feet, 56.7% of net rentable area; 48.1% of underwritten total rent; 1/31/2030 lease expiration) – Sonder is a residential and hospitality startup geared toward making traditional multifamily rental units accessible to more transient customers by providing short- and long-term stays. Originally founded in 2014 in Montreal, Canada, Sonder now offers in excess of 5,500 units for rental in more than 38 markets in eight countries across the world. Locations range from smaller U.S. cities including Phoenix, AZ and Savannah, GA to international locations like Dubai and Rome. Sonder has raised over $550,000,000 to date at a valuation of over $2.2 billion driven by a tech-driven platform. Sonder posted a $880,409.52 security deposit in the form of a surety bond. The bond, along with a dual oblige rider, will be delivered to the lender at closing of the loan.
2nd Largest Tenant: Trader Joe’s (16,278 square feet, 25.8% of net rentable area; 28.8% of underwritten total rent; 12/31/2029 lease expiration) – Founded in 1967, Trader Joe’s is a national chain of neighborhood grocery stores. While a typical grocery store may carry 50,000 items, Trader Joe’s stocks about 4,000 items, 80% of which bear one of its own brand names. With over 10,000 employees spread out over 500 locations across the United States, Trader Joe’s has established itself as one of the nation’s largest grocery chains while keeping its roots as a privately held company. Selective in their location selection, there are currently only twenty-two (22) Trader Joe’s locations in the entire state of Florida, of which only thirteen are in South Florida.
3rd Largest Tenant: Truist Bank (3,600 square feet; 5.7% of net rentable area; 12.4% of underwritten base rent; 1/31/2030 lease expiration) – Truist Bank is an Atlanta, GA based American bank which reported assets of $199 billion in 2018. Established in 1891 as Commercial Travelers’ Savings Bank of Atlanta and undergoing many transformations in its 128-year history, Truist is a publicly traded company (NYSE: STI) with more than 22,000 employees, over 1200 branches and $9 billion in revenue. The bank’s primary businesses include deposits, lending, credit cards, and trust and investment services. Through its various subsidiaries, the company provides corporate and investment banking, capital market services, mortgage banking, and wealth management. SunTrust is currently in process to be acquired by BB&T Corporation in a merger that will form a new company named Truist which will become the 6th largest US bank with assets of $442 billion and a market cap in excess of $66 billion.
COVID-19 Update. As of October 29, 2021, the 17 West Miami Property is open and operating. Collection for June at the 17 West Miami Property was at 93.5% of total square feet and 93.4% of total UW base rent. As of November 9, 2021, 17 West Miami Mortgage Loan is not subject to any modification or forbearance agreement, and the 17 West Miami Borrower has not requested any modification or forbearance to the 17 West Miami Mortgage Loan terms.
THE INFORMATION IN THIS STRUCTURAL AND COLLATERAL TERM SHEET IS NOT COMPLETE AND MAY BE AMENDED PRIOR TO THE TIME OF SALE. THIS TERM SHEET IS NOT AN OFFER TO SELL THESE SECURITIES AND IT IS NOT A SOLICITATION OF AN OFFER TO BUY THESE SECURITIES IN ANY JURISDICTION WHERE THE OFFER OR SALE IS NOT PERMITTED.
48
| Mixed Use – Multifamily/Retail | Loan #2 | Cut-off Date Balance: | $55,000,000 | |
| 1698 Alton Road | 17 West Miami | Cut-off Date LTV: | 65.9% | |
| Miami Beach, FL 33139 | U/W NCF DSCR: | 1.90x | ||
| U/W NOI Debt Yield: | 7.5% |
The following table presents certain information relating to the tenancy at the 17 West Miami Property:
Major Tenants
| Tenant Name | Credit Rating (Fitch/Moody’s/ S&P(1)) | Tenant NRSF | % of NRSF | Annual U/W Base Rent PSF | Annual U/W Commercial Base Rent | % of Total Annual U/W Base Rent | Lease Expiration Date | Extension Options | Termination Option (Y/N) |
| Major Tenants | |||||||||
| Sonder USA Inc | NR/NR/NR | 35,789 | 56.7% | $51.72 | $1,851,008 | 48.1% | 1/31/2030 | 1, 5-year | N |
| Trader Joes East Inc | NR/NR/NR | 16,278 | 25.8% | $67.99 | $1,106,721 | 28.8% | 12/31/2029 | 4, 5-year | N |
| Truist Bank | A+/A+/A- | 3,600 | 5.7% | $132.61 | $477,396 | 12.4% | 1/31/2030 | 3, 5-year | N |
| Total Major Tenants | 55,667 | 88.2% | $61.71 | $3,435,124 | 89.3% | ||||
| Non-Major Tenant | 3,702 | 5.9% | $111.20 | $411,650 | 10.7% | ||||
| Occupied Collateral Total | 59,369 | 94.0% | $64.79 | $3,846,774 | 100.0% | ||||
| Vacant Space | 3,777 | 6.0% | |||||||
| Collateral Total | 63,146 | 100.0% | |||||||
| (1) | Certain ratings are those of the parent company whether or not the parent company guarantees the lease. |
The following table presents certain information relating to the lease rollover schedule at the 17 West Miami Property:
Lease Expiration Schedule(1)(2)
| Year Ending December 31, | No. of Leases Expiring | Expiring NRSF | % of Total NRSF | Cumulative Expiring NRSF | Cumulative % of Total NRSF | Annual U/W Base Rent | % of Total Annual U/W Base Rent | Annual U/W Base Rent PSF |
| MTM | 0 | 0 | 0.0% | 0 | 0.0% | $0 | 0.0% | $0.00 |
| 2021 | 0 | 0 | 0.0% | 0 | 0.0% | $0 | 0.0% | $0.00 |
| 2022 | 1 | 0 | 0.0% | 0 | 0.0% | $102,000 | 2.7% | $0.00 |
| 2023 | 0 | 0 | 0.0% | 0 | 0.0% | $0 | 0.0% | $0.00 |
| 2024 | 0 | 0 | 0.0% | 0 | 0.0% | $0 | 0.0% | $0.00 |
| 2025 | 0 | 0 | 0.0% | 0 | 0.0% | $0 | 0.0% | $0.00 |
| 2026 | 1 | 1,600 | 2.5% | 1,600 | 2.5% | $152,000 | 4.0% | $95.00 |
| 2027 | 0 | 0 | 0.0% | 1,600 | 2.5% | $0 | 0.0% | $0.00 |
| 2028 | 0 | 0 | 0.0% | 1,600 | 2.5% | $0 | 0.0% | $0.00 |
| 2029 | 1 | 16,278 | 25.8% | 17,878 | 28.3% | $1,106,721 | 28.8% | $67.99 |
| 2030 | 2 | 39,389 | 62.4% | 57,267 | 90.7% | $2,328,404 | 60.5% | $59.11 |
| 2031 | 1 | 2,102 | 3.3% | 59,369 | 94.0% | $157,650 | 4.1% | $75.00 |
| Thereafter | 0 | 0 | 0.0% | 59,369 | 94.0% | $0 | 0.0% | $0.00 |
| Vacant | 0 | 3,777 | 6.0% | 63,146 | 100.0% | $0 | 0.0% | $0.00 |
| Total/Weighted Average(2) | 6 | 63,146 | 100.0% | $3,846,774 | 100.0% | $64.79 |
| (1) | Information obtained from the underwritten rent roll. |
| (2) | Total Annual U/W Base Rent PSF excludes vacant space. |
THE INFORMATION IN THIS STRUCTURAL AND COLLATERAL TERM SHEET IS NOT COMPLETE AND MAY BE AMENDED PRIOR TO THE TIME OF SALE. THIS TERM SHEET IS NOT AN OFFER TO SELL THESE SECURITIES AND IT IS NOT A SOLICITATION OF AN OFFER TO BUY THESE SECURITIES IN ANY JURISDICTION WHERE THE OFFER OR SALE IS NOT PERMITTED.
49
| Mixed Use – Multifamily/Retail | Loan #2 | Cut-off Date Balance: | $55,000,000 | |
| 1698 Alton Road | 17 West Miami | Cut-off Date LTV: | 65.9% | |
| Miami Beach, FL 33139 | U/W NCF DSCR: | 1.90x | ||
| U/W NOI Debt Yield: | 7.5% |
The following table presents historical occupancy percentages at the 17 West Miami Property:
Historical Occupancy
12/31/2018(1) | 12/31/2019(1) | 12/31/2020(1) | 10/11/2021(2) |
| NAP | NAP | 88.2% | 94.0% |
| (1) | Information obtained from the borrower’s rent roll. The 17 West Miami Property was built in 2019. As such, information prior is unavailable. |
| (2) | Information obtained from the underwritten rent roll dated October 11, 2021. |
Operating History and Underwritten Net Cash Flow. The following table presents certain information relating to the underwritten net cash flow at the 17 West Miami Property:
Cash Flow Analysis
| 2019 | 2020 | TTM 9/30/2021 | U/W | %(1) | U/W $ per SF | |
| Gross Potential Rent | $528,615 | $2,810,358 | $3,537,728 | $4,115,199 | 75.7% | $65.17 |
| Contractual Rent Steps(2) | 0 | 0 | 0 | 51,648 | 1.0 | 0.82 |
| Grossed Up Vacant Space | 0 | 0 | 0 | 0 | 0.0 | 0.00 |
| Gross Potential Rent | $528,615 | $2,810,358 | $3,537,728 | $4,166,847 | 76.7% | $65.99 |
| Other Income | 30 | 234,204 | 221,120 | 261,167 | 4.8 | 4.14 |
| Total Recoveries | 0 | 337,628 | 574,846 | 1,008,072 | 18.5 | 15.96 |
| Net Rental Income | $528,645 | $3,382,190 | $4,333,695 | $5,436,087 | 100.0% | $86.09 |
| (Vacancy & Credit Loss) | 0 | (140,220) | (275,144) | ($328,722) | (7.9) | (5.21) |
| Effective Gross Income | $528,645 | $3,241,970 | $4,058,550 | $5,107,365 | 94.0% | $80.88 |
| Real Estate Taxes | 0 | 428,895 | $307,339 | 479,185 | 9.4 | 7.59 |
| Insurance | 46,328 | 126,338 | 125,184 | 87,797 | 1.7 | 1.39 |
| Management Fee | 7,250 | 21,000 | 30,000 | 153,221 | 3.0 | 2.43 |
| Other Operating Expenses | 81,173 | 267,369 | 287,869 | 287,869 | 5.6 | 4.56 |
| Total Operating Expenses | $134,751 | $843,602 | $750,393 | $1,008,072 | 19.7% | $15.96 |
| Net Operating Income | $393,894 | $2,398,368 | $3,308,157 | $4,099,292 | 80.3% | $64.92 |
| Replacement Reserves | 0 | 0 | 0 | 20,554 | 0.4 | 0.33 |
| TI/LC | 0 | 0 | 0 | 31,573 | 0.6 | 0.50 |
| Net Cash Flow | $393,894 | $2,398,368 | $3,308,157 | $4,047,166 | 79.2% | $64.09 |
| NOI DSCR | 0.19x | 1.13x | 1.56x | 1.93x | ||
| NCF DSCR | 0.19x | 1.13x | 1.56x | 1.90x | ||
| NOI Debt Yield | 0.7% | 4.4% | 6.0% | 7.5% | ||
| NCF Debt Yield | 0.7% | 4.4% | 6.0% | 7.4% |
| (1) | Represents (i) percent of Net Rental Income for all revenue fields, (ii) percent of Gross Potential Rent for Vacancy & Credit Loss and (iii) percent of Effective Gross Income for all other fields. |
| (2) | Contractual Rent Steps include $51,648 of straight line rent that is attributed to Truist. |
THE INFORMATION IN THIS STRUCTURAL AND COLLATERAL TERM SHEET IS NOT COMPLETE AND MAY BE AMENDED PRIOR TO THE TIME OF SALE. THIS TERM SHEET IS NOT AN OFFER TO SELL THESE SECURITIES AND IT IS NOT A SOLICITATION OF AN OFFER TO BUY THESE SECURITIES IN ANY JURISDICTION WHERE THE OFFER OR SALE IS NOT PERMITTED.
50
| Mixed Use – Multifamily/Retail | Loan #2 | Cut-off Date Balance: | $55,000,000 | |
| 1698 Alton Road | 17 West Miami | Cut-off Date LTV: | 65.9% | |
| Miami Beach, FL 33139 | U/W NCF DSCR: | 1.90x | ||
| U/W NOI Debt Yield: | 7.5% |
Appraisal. As of the appraisal valuation date of October 7, 2021, the 17 West Miami Property had an “as-is” appraised value of $83,500,000.
Environmental Matters. According to a Phase I environmental site assessment dated October 15, 2021, there was no evidence of any recognized environmental conditions or controlled environmental conditions at the 17 West Miami Property.
Market Overview and Competition. The 17 West Miami Property is located within the Downtown Miami/ South Beach submarket and features full block-frontage along 17th street spanning from Alton Road to West Ave. The 17 West Miami Property is also located one block from Lincoln Road, one of South Florida’s outdoor shopping, dining and entertainment destinations. With thousands of residences within walking distance on West Ave and Sunset Harbour, the 17 West Miami Property offers retailers and restaurant operators access to onsite parking as well as prominent signage and visibility to both Alton Road and 17th Street, two heavily trafficked arteries integral to trade in Miami Beach. The 17 West Miami Property is within an urban area and the immediate vicinity can be characterized as a retail and multifamily corridor. The zoning is characterized as CD-2, which allows for commercial and residential uses. Within a 1/2 –mile radius, a third party information provider identified a total of 342 commercial use properties. There are 142 multifamily developments totaling over 6.1 million SF and there are 131 retail developments totaling over 2.1 million SF within the Downtown Miami submarket.
The major east-west thoroughfares providing direct access to the subject area from the Miami mainland include the Venetian Causeway that becomes 17th Street immediately north of the 17 West Miami Property; 5th Street/MacArthur Causeway (US Highway 41/State Road A1A), located south of the 17 West Miami Property; and Arthur Godfrey/Julia Tuttle Causeway (I-195) located north of the 17 West Miami Property. These arteries connect South Beach to mainland Miami to the west, as well as intersect with the primary north-south arteries of Alton Road, Collins Avenue, Washington Avenue and Ocean Drive. The major thoroughfares include Alton Road, Florida State Road A1A, Dade Boulevard, MacArthur Causeway, Interstate 95. According to the appraisal, the 2021 population within a one-, three-, and five-mile radius is 28,295, 71,643 and 306,585, respectively. The average household income within the same radii is $98,185, $111,427, and $89,263, respectively.
According to the appraisal, the 17 West Miami Property is situated within the Downtown Miami/South Beach submarket, which contained approximately 9,262,794 SF of inventory as of the third quarter of 2021. The Miami Beach/South Beach apartment submarket reported a vacancy rate of 1.8% with an average quoted rental rate of $1,899 per unit.
Submarket Information – According to the appraisal, the 17 West Miami Property is located within a retail corridor, which contained approximately 9.3 million square feet of retail space as of the third quarter of 2021. The retail submarket reported a vacancy rate of 6.30% with an average quoted rental rate of $75.22 per square feet. The Downtown Miami/South Beach retail submarket reported positive absorption of 102,578 SF and 99,350 SF Built.
Appraiser’s Retail Sale Comp Set – The appraiser identified four mixed use competitive properties, with retail space, for the 17 West Miami Property totaling approximately 140,104 SF, which reported an average occupancy rate of approximately 93.2%.
Appraiser’s Retail Lease Comp Set – The appraiser identified four primary competitive retail leases for the 17 West Miami Property totaling approximately 16,029 SF. The appraiser concluded to market rents of $75.22 per square foot for retail tenants in the surrounding submarket.
THE INFORMATION IN THIS STRUCTURAL AND COLLATERAL TERM SHEET IS NOT COMPLETE AND MAY BE AMENDED PRIOR TO THE TIME OF SALE. THIS TERM SHEET IS NOT AN OFFER TO SELL THESE SECURITIES AND IT IS NOT A SOLICITATION OF AN OFFER TO BUY THESE SECURITIES IN ANY JURISDICTION WHERE THE OFFER OR SALE IS NOT PERMITTED.
51
| Mixed Use – Multifamily/Retail | Loan #2 | Cut-off Date Balance: | $55,000,000 | |
| 1698 Alton Road | 17 West Miami | Cut-off Date LTV: | 65.9% | |
| Miami Beach, FL 33139 | U/W NCF DSCR: | 1.90x | ||
| U/W NOI Debt Yield: | 7.5% |
The table below presents certain information relating to comparable retail sales for the 17 West Miami Property identified by the appraiser:
Comparable Retail Sales (1)
| Property Name | Location | Rentable Area (SF) | Sale Date | Sale Price | Sale Price (PSF) |
| Stonewall Station Retail | Charlotte, NC | 47,500 | Jun-18 | $34,050,000 | $716.84 |
| Lynmar Retail Building | Miami Beach, FL | 12,966 | May-19 | $8,705,000 | $671.37 |
| 275 NE 18th Street Units 1-10 | Miami, FL | 19,944 | Mar-20 | $15,450,000 | $774.67 |
| Plaza San Remo – Units 100-102 | Coral Gables, FL | 59,694 | May-20 | $46,500,000 | $778.97 |
| (1) | Information obtained from the appraisal. |
The following table presents certain information relating to four comparable leases to those at the 17 West Miami Property:
Comparable Retail Leases(1)
| Property Name/Location | Year Built/ Renovated | Total GLA (SF) | Distance from Subject | Occupancy | Lease Term | Tenant Size (SF) | Annual Base Rent PSF | Reimbursement Amount PSF | Lease Type | ||
| Retail | |||||||||||
| 1428 Alton Road | 1940/NAP | NAP | 0.7 miles | NAP | NAP | 2,239 | $90.00 | NAV | NNN | ||
| 1800 Alton Road | 2018/NAP | NAP | 0.1 miles | NAP | NAP | 5,065 | $121.68 | NAV | NNN | ||
| 1665 Alton Road | 2009/NAP | NAP | 0.3 miles | NAP | NAP | 3,750 | $75.00 | NAV | NNN | ||
| 257 North 3rd Street | 2009/NAP | NAP | 1.9 miles | NAP | NAP | 4,975 | $33.76 | NAV | NNN | ||
| (1) | Information obtained from the appraisal. |
Escrows.
Real Estate Taxes – The 17 West Miami Mortgage Loan documents require ongoing monthly real estate tax reserves in an amount equal to one-twelfth of the real estate taxes that the lender estimates will be necessary to pay taxes over the then succeeding twelve months (initially $41,596).
Insurance – The 17 West Miami Mortgage Loan documents require an upfront insurance reserve of $65,848 and ongoing monthly insurance reserves in an amount equal to one-twelfth of the insurance premiums that the lender estimates will be payable for the renewal of the coverage afforded by the policies upon the expiration thereof (initially $7,316).
Replacement Reserves – The 17 West Miami Mortgage Loan documents require ongoing monthly replacement reserves of approximately $1,713 with a capped balance of $61,661.
TI/LC Reserve – The 17 West Miami Mortgage Loan documents require an upfront deposit of $412,535 and ongoing monthly TI/LC reserves of approximately $2,631 for the TI/LCs and related expenses with respect to the commercial space at the 17 West Miami Property with a capped balance of $94,719 (excluding the initial deposit).
Lockbox and Cash Management. The 17 West Miami Mortgage Loan is structured with a hard lockbox, which will be established post-closing and springing cash management. The 17 West Miami Borrower is required upon the establishment of the lockbox account to deliver tenant direction letters to the major tenants at the 17 West Miami Property to deposit all rents and payments directly into a lender-controlled lockbox account. The 17 West Miami Borrower or property manager is required to deposit all other tenant rent into the lockbox account. As long as no Cash Trap Event Period (as defined below) is continuing, all funds deposited into each lockbox account are required to be transferred to or at the direction of the 17 West Miami Borrower. Upon the commencement of a Cash Trap Event Period, all funds on deposit in the lockbox accounts are required to be swept on a weekly basis into a lender-controlled cash management account, where they are applied to a waterfall, with all excess cash being retained by the lender as additional security for the 17 West Miami Mortgage Loan.
A “Cash Trap Event Period” will commence upon the earlier of the following:
| (i) | an event of default under the 17 West Miami Mortgage Loan; |
| (ii) | an event of default under the property management agreement; |
| (iii) | the debt service coverage ratio falls below 1.50x; |
| (iv) | Sonder, Trader Joes’s or any future tenant occupying more than 15% of the 17 West Miami Property (either physical or economic occupancy) (each, a “Significant Tenant”) ceases to conduct, or gives notice of its intent to cease to conduct, its normal business operations at substantially all of its leased premises (including by subleasing substantially all of its leased premises); |
THE INFORMATION IN THIS STRUCTURAL AND COLLATERAL TERM SHEET IS NOT COMPLETE AND MAY BE AMENDED PRIOR TO THE TIME OF SALE. THIS TERM SHEET IS NOT AN OFFER TO SELL THESE SECURITIES AND IT IS NOT A SOLICITATION OF AN OFFER TO BUY THESE SECURITIES IN ANY JURISDICTION WHERE THE OFFER OR SALE IS NOT PERMITTED.
52
| Mixed Use – Multifamily/Retail | Loan #2 | Cut-off Date Balance: | $55,000,000 | |
| 1698 Alton Road | 17 West Miami | Cut-off Date LTV: | 65.9% | |
| Miami Beach, FL 33139 | U/W NCF DSCR: | 1.90x | ||
| U/W NOI Debt Yield: | 7.5% |
| (v) | any Significant Tenant (or such tenant’s parent, if applicable) becomes insolvent or files for bankruptcy; |
| (vi) | twelve (12) months prior to the expiration of a Significant Tenant’s lease; and/or |
| (vii) | the revocation of the zoning permit or enactment of a law or ordinance which has the effect of revoking the zoning permit such that Sonder can no longer lawfully operate its business at the 17 West Miami property, which through the lapse of time or otherwise will result in or give rise to Sonder being able to exercise the right to terminate its lease. |
A Cash Trap Event Period will end upon the occurrence of the following:
| (i) | with regard to clause (i) above, the cure of such event of default; |
| (ii) | with regard to clause (ii) above, the cure of the event of default under the property management agreement or replacement thereof in accordance with the 17 West Miami Mortgage Loan documents; |
| (iii) | with regard to clause (iii) above, the debt service coverage ratio is above 1.55x for two consecutive calendar quarters; |
| (iv) | with regard to clause (iv) above, the Significant Tenant resumes business in substantially all of its leased premises or a replacement tenant executes a new lease acceptable to the lender for such space, pays full unabated rent for one (1) calendar quarter and is in place and has delivered an estoppel acceptable to the lender; |
| (v) | with regard to clause (v) above at such time as the Significant Tenant emerges from bankruptcy, the respective lease has been affirmed in bankruptcy and/or such tenant has re-taken possession of its space and is open for business and has delivered an estoppel reasonably acceptable to the lender or a replacement tenant executes a new lease for such space pays full unabated rent for one (1) calendar quarter and is in place and has delivered an estoppel acceptable to the lender; |
| (vi) | with regard to clause (vi) above at such time as the renewal of such Significant Tenant’s lease pursuant to its terms or on terms reasonably acceptable to the lender and has delivered an estoppel reasonably acceptable to the lender or a replacement tenant executes a new lease acceptable to the lender and is in place and has delivered an acceptable estoppel; and |
| (vii) | with regard to clause (vii) above, the date on which (a) such termination right of Sonder is no longer effective and Sonder has delivered an acceptable estoppel certificate or (b) a replacement tenant executes a new lease acceptable to the lender and is in place and has delivered an acceptable estoppel. |
In addition, if a Cash Trap Event Period exists with respect to clauses (iv) or (v) above with respect to Sonder, such Cash Trap Event Period can be cured if, among other things, the Sonder lease is converted to direct leases with residential tenants, the occupancy with respect to such portion of the 17 West Miami Property is 80% or greater and the 17 West Miami Property achieves an underwritten net cash flow debt yield of at least seven percent (7%) for at least one (1) quarter.
The 17 West Miami Borrower can avoid a Cash Trap Event Period by posting cash or a letter of credit as additional security for the 17 West Miami Mortgage Loan in the following amounts:
| (i) | with respect to clause (iii) of Cash Trap Event Period, $1,250,000, posted annually; |
| (ii) | with respect to clause (iv) or (v) of Cash Trap Event Period, the lender’s projected excess cash flow, posted annually; |
| (iii) | with respect to clause (vi) of Cash Trap Period, $1,250,000 with respect to Trader Joes and $1,750,000 with respect to Sonder (provided that if the events described in clauses (iv) or (v) of Cash Trap Event Period also exist, the lender’s projected excess cash flow will be required to be posted if greater than the aforesaid amounts). |
Property Management. The 17 West Miami Property is managed by Urban Resource LLC.
Partial Release. Not permitted.
Real Estate Substitution. Not permitted.
Subordinate and Mezzanine Indebtedness. Not permitted.
Ground Lease. None.
Terrorism Insurance. The 17 West Miami Mortgage Loan documents require that the “all risk” insurance policy required to be maintained by the 17 West Miami Borrower provides coverage for terrorism in an amount equal to the full replacement cost of the 17 West Miami Property, as well as business interruption insurance covering no less than the 18-month period following the occurrence of a casualty event, together with a 6-month extended period of indemnity.
THE INFORMATION IN THIS STRUCTURAL AND COLLATERAL TERM SHEET IS NOT COMPLETE AND MAY BE AMENDED PRIOR TO THE TIME OF SALE. THIS TERM SHEET IS NOT AN OFFER TO SELL THESE SECURITIES AND IT IS NOT A SOLICITATION OF AN OFFER TO BUY THESE SECURITIES IN ANY JURISDICTION WHERE THE OFFER OR SALE IS NOT PERMITTED.
53
| Various – Various | Loan #3 | Cut-off Date Balance: | $37,000,000 | |
| Property Addresses – Various | Hague + Galleries Mixed Use Portfolio | Cut-off Date LTV: | 58.7% | |
| U/W NCF DSCR: | 1.89x | |||
| U/W NOI Debt Yield: | 11.3% |
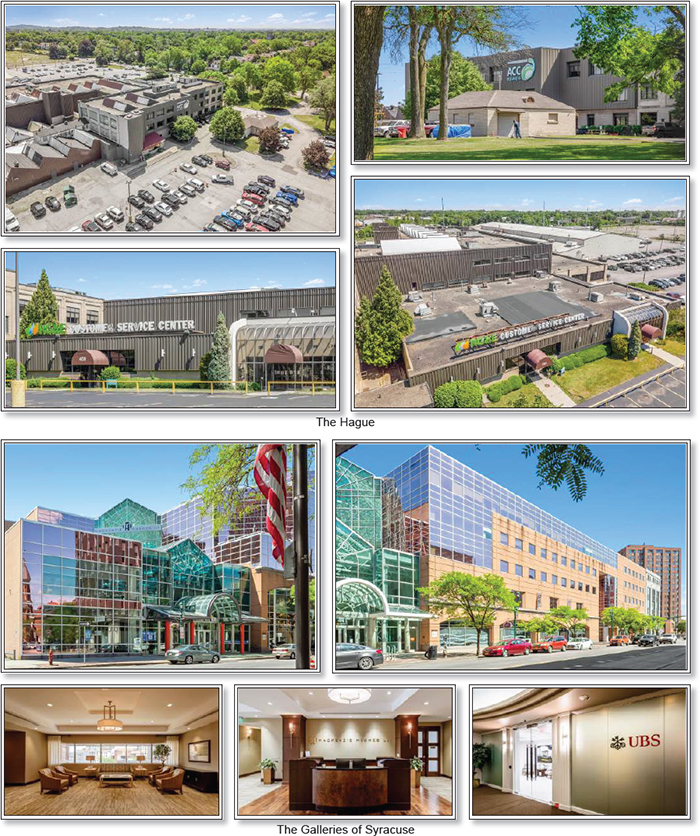
THE INFORMATION IN THIS STRUCTURAL AND COLLATERAL TERM SHEET IS NOT COMPLETE AND MAY BE AMENDED PRIOR TO THE TIME OF SALE. THIS TERM SHEET IS NOT AN OFFER TO SELL THESE SECURITIES AND IT IS NOT A SOLICITATION OF AN OFFER TO BUY THESE SECURITIES IN ANY JURISDICTION WHERE THE OFFER OR SALE IS NOT PERMITTED.
54
| Various – Various | Loan #3 | Cut-off Date Balance: | $37,000,000 | |
| Property Addresses – Various | Hague + Galleries Mixed Use Portfolio | Cut-off Date LTV: | 58.7% | |
| U/W NCF DSCR: | 1.89x | |||
| U/W NOI Debt Yield: | 11.3% |
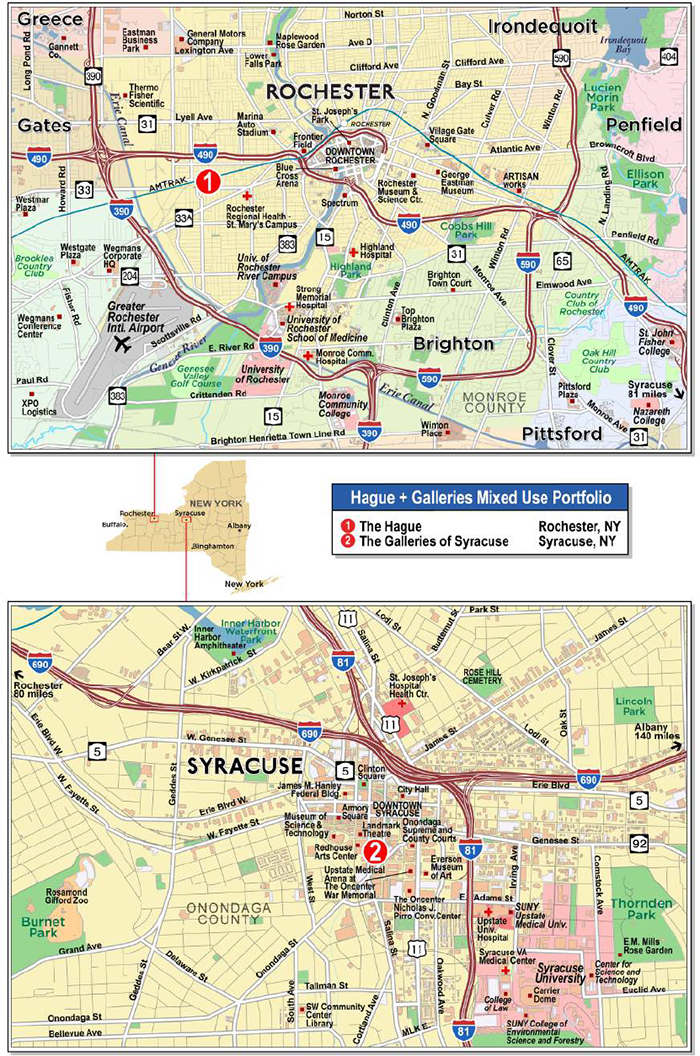
THE INFORMATION IN THIS STRUCTURAL AND COLLATERAL TERM SHEET IS NOT COMPLETE AND MAY BE AMENDED PRIOR TO THE TIME OF SALE. THIS TERM SHEET IS NOT AN OFFER TO SELL THESE SECURITIES AND IT IS NOT A SOLICITATION OF AN OFFER TO BUY THESE SECURITIES IN ANY JURISDICTION WHERE THE OFFER OR SALE IS NOT PERMITTED.
55
| No. 3 – Hague + Galleries Mixed Use Portfolio | |||||||
| Mortgage Loan Information | Mortgaged Property Information | ||||||
| Mortgage Loan Seller: | LMF Commercial, LLC | Single Asset/Portfolio: | Portfolio | ||||
Credit Assessment (Fitch/KBRA/Moody’s): | NR/NR/NR | Property Type – Subtype: | Various/Various | ||||
| Original Principal Balance: | $37,000,000 | Location(2): | Various, NY | ||||
| Cut-off Date Balance: | $37,000,000 | Size(2): | 485,248 SF | ||||
| % of Initial Pool Balance: | 4.8% | Cut-off Date Balance Per SF: | $76.25 | ||||
| Loan Purpose: | Acquisition | Maturity Date Balance Per SF: | $76.25 | ||||
| Borrower Sponsor: | Moshe Rothman | Year Built/Renovated(2): | Various/Various | ||||
| Guarantor: | Moshe Rothman | Title Vesting: | Fee | ||||
| Mortgage Rate: | 5.0500% | Property Manager: | Flaum Management Company, Inc. | ||||
| Note Date: | October 6, 2021 | Current Occupancy (As of): | 100.0% (10/4/2021) | ||||
| Seasoning: | 2 months | YE 2020 Occupancy: | 100.0% | ||||
| Maturity Date: | October 6, 2031 | YE 2019 Occupancy: | 97.5% | ||||
| IO Period: | 120 months | YE 2018 Occupancy: | 89.3% | ||||
| Loan Term (Original): | 120 months | As-Is Appraised Value(3): | $63,000,000 | ||||
| Amortization Term (Original): | NAP | As-Is Appraised Value Per SF: | $129.83 | ||||
| Loan Amortization Type: | Interest Only | As-Is Appraisal Valuation Date: | May 27, 2021 | ||||
| Call Protection: | L(26),D(90),O(4) | ||||||
| Lockbox Type: | Hard/Springing | Underwriting and Financial Information(3) | |||||
| Additional Debt: | No | TTM NOI (7/31/2021): | $4,693,578 | ||||
| Additional Debt Type (Balance): | NAP | YE 2020 NOI: | $4,620,415 | ||||
| YE 2019 NOI: | $4,370,476 | ||||||
| U/W Revenues: | $6,255,981 | ||||||
| U/W Expenses: | $2,091,146 | ||||||
| Escrows and Reserves(1) | U/W NOI: | $4,164,835 | |||||
| Initial | Monthly | Cap | U/W NCF: | $3,582,537 | |||
| Taxes | $162,912 | $38,789 | NAP | U/W DSCR based on NOI/NCF: | 2.20x / 1.89x | ||
| Insurance | $44,612 | $10,622 | NAP | U/W Debt Yield based on NOI/NCF: | 11.3% / 9.7% | ||
| Replacement Reserve | $0 | $8,095 | NAP | U/W Debt Yield at Maturity based on NOI/NCF: | 11.3% / 9.7% | ||
| TI/LC Reserve | $500,000 | $40,447 | $2,000,000 | Cut-off Date LTV Ratio: | 58.7% | ||
| Deferred Maintenance | $454,850 | $0 | NAP | LTV Ratio at Maturity: | 58.7% | ||
| Sources and Uses | ||||||||
| Sources | Uses | |||||||
| Original loan amount | $37,000,000 | 58.1% | Purchase Price | $61,000,000 | 95.8% | |||
| Sponsors new loan contribution | 26,679,318 | 41.9 | Closing Costs | 1,516,943 | 2.4 | |||
| Upfront Reserves | 1,162,375 | 1.8 | ||||||
| Total Sources | $63,679,318 | 100.0% | Total Uses | $63,679,318 | 100.0% | |||
| (1) | See “Escrows” section for a full description of Escrows and Reserves. |
| (2) | See “The Properties” section below. |
| (3) | While the Hague + Galleries Mixed Use Portfolio Mortgage Loan (as defined below) was originated after the emergence of the novel coronavirus pandemic and the economic disruption resulting from measures to combat the pandemic, the pandemic is an evolving situation and could impact the Hague + Galleries Mixed Use Portfolio Mortgage Loan more severely than assumed in the underwriting of the Hague + Galleries Mixed Use Portfolio Mortgage Loan. The pandemic and resulting economic disruption could also adversely affect the NOI, NCF and occupancy information, as well as the appraised value and the DSCR, LTV and Debt Yield metrics presented above. See “Risk Factors—Risks Related to Market Conditions and Other External Factors—Coronavirus Pandemic Has Adversely Affected the Global Economy and Will Likely Adversely Affect the Performance of the Mortgage Loans” in the Preliminary Prospectus. |
The Mortgage Loan. The mortgage loan (the “Hague + Galleries Mixed Use Portfolio Mortgage Loan”) is a evidenced by a single promissory note secured by a first mortgage encumbering the fee interest in one office property located in Syracuse, New York and one mixed use industrial/office property located in Rochester, New York, together totaling 485,248 square feet (collectively, the “Hague + Galleries Mixed Use Portfolio Properties”).
The Borrowers and Borrower Sponsor. The borrowers are 400 West Avenue LLC and 441 South Salina LLC (collectively, the “Hague + Galleries Mixed Use Portfolio Borrower”), each a Delaware limited liability company and single purpose entity with two independent directors. Legal counsel to the Hague + Galleries Mixed Use Portfolio Borrower delivered a non-consolidation opinion in connection with the origination of the Hague + Galleries Mixed Use Portfolio Mortgage Loan. The nonrecourse carve-out guarantor of the Hague + Galleries Mixed Use Portfolio Mortgage Loan is Moshe Rothman.
THE INFORMATION IN THIS STRUCTURAL AND COLLATERAL TERM SHEET IS NOT COMPLETE AND MAY BE AMENDED PRIOR TO THE TIME OF SALE. THIS TERM SHEET IS NOT AN OFFER TO SELL THESE SECURITIES AND IT IS NOT A SOLICITATION OF AN OFFER TO BUY THESE SECURITIES IN ANY JURISDICTION WHERE THE OFFER OR SALE IS NOT PERMITTED.
56
| Various – Various | Loan #3 | Cut-off Date Balance: | $37,000,000 | |
| Property Addresses – Various | Hague + Galleries Mixed Use Portfolio | Cut-off Date LTV: | 58.7% | |
| U/W NCF DSCR: | 1.89x | |||
| U/W NOI Debt Yield: | 11.3% |
The borrower sponsor and nonrecourse carve-out guarantor, Moshe Rothman, is based in upstate New York. Since 2017, Mr. Rothman has partnered with Rodium, Apex, Monarch, ABS Management and FDG Management to buy and acquire new properties. Mr. Rothman’s portfolio includes multifamily and office properties in New York, New Jersey, Ohio, Michigan, and Illinois, Texas and Connecticut.
The Properties. The Hague + Galleries Mixed Use Portfolio Properties comprise one office property located in Syracuse, New York and one mixed use industrial/office property located in Rochester, New York. As of October 4, 2021, the Hague + Galleries Mixed Use Portfolio Properties are 100% occupied by 28 tenants.
The Hague
The Hague property is a mixed-use industrial/office property located in Rochester, New York (“The Hague Property”). The Hague Property consists of one, three-story building totaling 263,045 square feet of net rentable area situated on an 18.28-acre site. The Hague Property was built in 1940 and renovated in 2001. The Hague Property features 10’-35’ ceiling clear heights, 10 drive-in doors, and six dock height loading doors; and 55% of the building is flex space, and 37% office space. Parking is provided by 841 surface parking spaces resulting in a parking ratio of 3.2 spaces per 1,000 square feet. Since 2014, The Hague Property underwent approximately $893,206 in capital improvements. As of October 4, 2021, The Hague Property was 100% occupied by national, regional and local tenants.
The Galleries of Syracuse
The Galleries of Syracuse property is an office property located in Syracuse, New York (“The Galleries of Syracuse Property”). The Galleries of Syracuse Property consists of one, seven-story building totaling 222,203 square feet of net rentable area situated on a 2.0-acre site. The Galleries of Syracuse Property was built in 1988 and renovated in 1994. Parking is provided by 175 surface parking spaces resulting in a parking ratio of 0.79 spaces per 1,000 square feet. The Galleries of Syracuse Property is part of a larger, two-member condominium association, which is 58.45% owned by the Hague + Galleries Mixed Use Portfolio Borrower (the “Commercial Unit”) and 41.55% owned by Onondaga County and occupied by the Onondaga County Public Library (the “Library Unit”). The Galleries of Syracuse Property has control of 4 out of 6 seats on the related condominium board. The Galleries of Syracuse Property was originally developed as a retail mall, but was converted into Class A office space in 1994. Since 2014, The Galleries of Syracuse Property underwent approximately $3.9 million in capital improvements. As of October 4, 2021, The Galleries of Syracuse Property was 100% occupied by national, regional and local tenants.
The Onondaga County Public Library has occupied the Library Unit since 1989, and the current lease runs through December 2038. Pursuant to the condominium documents, each unit owner pays its proportionate share of common expenses, provided that, so long as Onondaga County is the owner of the Library Unit, the Library Unit owner is not responsible for the payment of common expenses until such time as at least 75,000 square feet of the ground level and second level of the Commercial Unit are leased for retail purposes. Given that this leasing condition has not been satisfied (there is no retail space at The Galleries of Syracuse Property as it has all been converted to other uses), the Hague + Galleries Mixed Use Portfolio Borrower is responsible for payment of 100% of the common expenses. In the event that Onondaga County transfers the Library Unit to a third party, that party would then be responsible for payment of its proportionate share of common expenses. Although the Hague + Galleries Mixed Use Portfolio Borrower pays all common expenses, the Onondaga County and the Hague + Galleries Mixed Use Portfolio Borrower have entered into a side letter agreement (the “Side Letter”), which provides that the Hague + Galleries Mixed Use Portfolio Borrower will receive a fixed payment of $189,492 annually as a “Unit Charge” from Onondaga County in exchange for certain services set forth within the Side Letter. The Side Letter payments are subject to Onondaga County receiving adequate appropriations in its annual budget. In addition to the Side Letter, Onondaga County executed a maintenance agreement (the “Maintenance Agreement”) with the Commercial Unit owner pursuant to which the Commercial Unit owner provides certain maintenance services to the SUNY Upstate Medical University tenant that leases the fourth and fifth floor of the Library Unit. The amount that Onondaga County pays the Hague + Galleries Mixed Use Portfolio Borrower is increased by not more than $36,000 annually under the Maintenance Agreement. The Maintenance Agreement currently expires in March of 2022 but is terminable on thirty days’ notice by either party.
The Galleries of Syracuse Property benefits from the 485-B exemption from Onondaga County for recent building renovations. The exemptions were first applied to the 2020 and 2021 tax bills, respectively and will burn off over the next ten years while decreasing by 10% every year.
The following table presents certain information regarding the Hague + Galleries Mixed Use Portfolio Properties:
| Property Name | Allocated Cut-off Date Balance | % of Portfolio Cut-off Date Balance | Occupancy | Year Built/ Renovated | Net Rentable Area (SF) | As-Is Appraised Value | Allocated Cut-off Date LTV | UW NOI | % of UW NOI |
| The Hague | $18,870,000 | 51.0% | 100.0% | 1940/2001 | 263,045 | $36,000,000 | 52.4% | $2,454,984 | 58.9% |
| The Galleries of Syracuse | 18,130,000 | 49.0 | 100.0% | 1988/1994 | 222,203 | 27,000,000 | 67.1% | 1,709,851 | 41.1 |
| Total/Weighted Average | $37,000,000 | 100.0% | 100.0% | 485,248 | $63,000,000 | 58.7% | $4,164,835 | 100.0% |
THE INFORMATION IN THIS STRUCTURAL AND COLLATERAL TERM SHEET IS NOT COMPLETE AND MAY BE AMENDED PRIOR TO THE TIME OF SALE. THIS TERM SHEET IS NOT AN OFFER TO SELL THESE SECURITIES AND IT IS NOT A SOLICITATION OF AN OFFER TO BUY THESE SECURITIES IN ANY JURISDICTION WHERE THE OFFER OR SALE IS NOT PERMITTED.
57
| Various – Various | Loan #3 | Cut-off Date Balance: | $37,000,000 | |
| Property Addresses – Various | Hague + Galleries Mixed Use Portfolio | Cut-off Date LTV: | 58.7% | |
| U/W NCF DSCR: | 1.89x | |||
| U/W NOI Debt Yield: | 11.3% |
Major Tenants.
Largest Tenant: Rochester Gas & Electric Corporation (166,756 square feet, 34.4% of net rentable area; 32.2% of underwritten base rent) – Rochester Gas & Electric Corporation (“RG&E”) serves approximately 385,925 electricity customers and 319,737 natural gas customers in a nine-county region centered in Rochester, New York. As a subsidiary of Avangrid Inc., RG&E is part of Avangrid Networks, which combines eight electric and natural gas utilities serving approximately 3.3 million customers in New York and New England. Avangrid Inc. is a subsidiary of the Spanish utility, IBERDROLA Group. RG&E currently occupies two suites within The Hague Property, has been a tenant at The Hague Property since 1993 and has two, 5-year renewal options remaining with no termination options. RG&E occupies 145,688 square feet of flex space and 21,068 square feet of warehouse space, both expiring on November 30, 2023. RG&E has a right of first refusal (“ROFR”) if the landlord decides to accept a bona fide offer from a third party to purchase all or a portion of The Hague Property; provided, however, that this ROFR is subordinate to the loan documents and does not apply to any transfer of the Property upon a foreclosure or other exercise of remedies by the lender. RG&E also has a ROFR to lease property in any part of or all of the remainder of The Hague Property located in the east area and RG&E has the option to lease additional space on the second and third floors to be exercised upon 60 days prior written notice to landlord, with rent being charged at the same rate per square foot as is then in effect for the rest of the leased premises.
2nd Largest Tenant: TCG Player (79,300 square feet, 16.3% of net rentable area; 13.0% of underwritten base rent) – Founded in 1998, and headquartered in Syracuse, New York, TCG Player develops applications and technologies for the collectibles marketplace by connecting hobby and collectibles businesses with customers around the globe. TCG Player’s ecommerce and data management tools power sales through physical stores, websites, mobile apps and the TCG Player Marketplace, an online service that allows third party sellers to sell their products to buyers. TCG Player has been a tenant at The Galleries of Syracuse Property since 2019 and has two, 5-year renewal options remaining. TCG Player occupies six suites within The Galleries of Syracuse Property. The suites related to Suite A (15,126 square feet), Suite B (14,628 square feet), Suited C (5,500 square feet) and Suite D (8,515 square feet) each have a lease expiration date of June 30, 2029. Suite 300 (33,144 square feet) has a lease expiration date of September 30, 2026 and Suite 116 (2,387 square feet) operates on a month-to-month basis. TCG Player has the option to terminate the lease of the space attributed to Suite D at any time after the 30th month with six months’ notice and the payment of a termination fee equal to the unamortized tenant improvement allowance, free rent, and commission payments or fee in lieu of commission payments allocable to Suite D. Additionally, TCG has the option to terminate the lease of Suite 300 three years after the date the suite was delivered.
3rd Largest Tenant: Action for a Better Community (42,111 square feet; 8.7% of net rentable area; 8.1% of underwritten base rent) – Action for a Better Community (“ABC”) is a non-profit organization that offers opportunities for low-income individuals and families to become self-sufficient. As of 2021, 3,318 individuals and 1,712 families are benefitting from programs offered by ABC, which include, but are not limited to, educating and assisting those impacted by HIV/AIDS, an adult mentoring program to help achieve financial independence, a 4-week training allowing one to receive minimum wage compensation upon hire, early childhood education and family development, preparation classes designed to move people beyond entry-level careers, and aiding prospective and current business owners building businesses. ABC reported total revenues of $27.49 million for the year 2019 with the largest contribution being $24.2 million from government grants and contracts. ABC has been a tenant at The Hague Property since 2018 and has two, 6-year renewal options remaining; the current lease expires on November 30, 2030 for 25,359 SF and November 11, 2030 for 16,752 SF. ABC has the option to terminate its lease upon 60 days written notice in the event there is a substantial loss of funding for its operations or if ABC receives insufficient authorization for its funding or has delays in reauthorization of its funding that in all cases substantially negatively impact’s ABC’s commercially reasonable ability to operate its business at The Hague Property.
COVID-19 Update. As of November 1, 2021, the Hague + Galleries Mixed Use Portfolio Properties are open and operating. As of the date hereof, the Hague + Galleries Mixed Use Portfolio Mortgage Loan is not subject to any modification or forbearance agreement, and the Hague + Galleries Mixed Use Portfolio Borrower has not requested any modification or forbearance to the Hague + Galleries Mixed Use Portfolio Mortgage Loan terms.
THE INFORMATION IN THIS STRUCTURAL AND COLLATERAL TERM SHEET IS NOT COMPLETE AND MAY BE AMENDED PRIOR TO THE TIME OF SALE. THIS TERM SHEET IS NOT AN OFFER TO SELL THESE SECURITIES AND IT IS NOT A SOLICITATION OF AN OFFER TO BUY THESE SECURITIES IN ANY JURISDICTION WHERE THE OFFER OR SALE IS NOT PERMITTED.
58
| Various – Various | Loan #3 | Cut-off Date Balance: | $37,000,000 | |
| Property Addresses – Various | Hague + Galleries Mixed Use Portfolio | Cut-off Date LTV: | 58.7% | |
| U/W NCF DSCR: | 1.89x | |||
| U/W NOI Debt Yield: | 11.3% |
The following table presents certain information relating to the tenancy at the Hague + Galleries Mixed Use Portfolio Properties:
Major Tenants
| Tenant Name | Credit Rating (Fitch/Moody’s/ S&P)(1) | Tenant NRSF | % of NRSF | Annual U/W Base Rent PSF | Annual U/W Base Rent | % of Total Annual U/W Base Rent | Lease Expiration Date | Extension Options | Termination Option (Y/N) |
| Major Tenants | |||||||||
| Rochester Gas & Electric Corporation | BBB+/Baa2/BBB+ | 166,756 | 34.4% | $10.62 | $1,771,112 | 32.2% | 11/30/2023 | 2, 5-year | N |
| TCG Player(2) | NR/NR/NR | 79,300 | 16.3% | $9.02 | $715,380 | 13.0% | Various | 2, 5-year | Y |
| Action for a Better Community(3) | NR/NR/NR | 42,111 | 8.7% | $10.57 | $445,265 | 8.1% | Various | 2, 6-year | Y |
| United States Department of Agriculture(4) | AAA/Aaa/AA+ | 36,477 | 7.5% | $15.00 | $547,155 | 9.9% | 9/14/2026 | None | Y |
| Mackenzie Hughes LLP | NR/NR/NR | 31,562 | 6.5% | $12.64 | $399,000 | 7.3% | 11/30/2027 | 3, 5-year | N |
| Total Major Tenants | 356,206 | 73.4% | $10.89 | $3,877,912 | 70.5% | ||||
| Non-Major Tenant | 129,042 | 26.6% | $12.59 | $1,624,574 | 29.5% | ||||
| Occupied Collateral Total | 485,248 | 100.0% | $11.34 | $5,502,486 | 100.0% | ||||
| Vacant Space | 0 | 0.0% | |||||||
| Collateral Total | 485,248 | 100.0% | |||||||
| (1) | Certain ratings are those of the parent company whether or not the parent company guarantees the lease. |
| (2) | TCG Player occupies six suites within The Galleries of Syracuse Property. The suites related to Suite A (15,126 square feet), Suite B (14,628 square feet), Suited C (5,500 square feet) and Suite D (8,515 square feet) each have a lease expiration date of June 30, 2029. Suite 300 (33,144 square feet) has a lease expiration date of September 30, 2026 and Suite 116 (2,387 square feet) operates on a month-to-month basis. TCG Player has the option to terminate the lease of the space attributed to Suite D at any time after the 30th month with six months’ notice and the payment of a termination fee equal to the unamortized tenant improvement allowance, free rent, and commission payments or fee in lieu of commission payments allocable to Suite D. Additionally, TCG has the option to terminate the lease of Suite 300 three years after the date the suite was delivered. |
| (3) | ABC occupies four suites within The Hague Property. Suite 3 (22,147 square feet), Suite 1B (1,800 square feet) and Suite 3C (1,412 square feet) each have a lease expiration date of November 30, 2030 and Suite 5 (16,752 square feet) has a lease expiration date of November 11, 2030. ABC has the option to terminate its lease upon 60 days written notice in the event there is a substantial loss of funding for its operations or if ABC receives insufficient authorization for its funding or has delays in reauthorization of its funding that in all cases substantially negatively impact’s ABC’s commercially reasonable ability to operate its business at The Hague Property. |
| (4) | United States Department of Agriculture has the right to terminate its lease as of September 15, 2023 with a 120-day written notice period. |
THE INFORMATION IN THIS STRUCTURAL AND COLLATERAL TERM SHEET IS NOT COMPLETE AND MAY BE AMENDED PRIOR TO THE TIME OF SALE. THIS TERM SHEET IS NOT AN OFFER TO SELL THESE SECURITIES AND IT IS NOT A SOLICITATION OF AN OFFER TO BUY THESE SECURITIES IN ANY JURISDICTION WHERE THE OFFER OR SALE IS NOT PERMITTED.
59
| Various – Various | Loan #3 | Cut-off Date Balance: | $37,000,000 | |
| Property Addresses – Various | Hague + Galleries Mixed Use Portfolio | Cut-off Date LTV: | 58.7% | |
| U/W NCF DSCR: | 1.89x | |||
| U/W NOI Debt Yield: | 11.3% |
The following table presents certain information relating to the lease rollover schedule at the Hague + Galleries Mixed Use Portfolio Properties:
Lease Expiration Schedule(1)(2)
| Year Ending December 31, | No. of Leases Expiring | Expiring NRSF | % of Total NRSF | Cumulative Expiring NRSF | Cumulative % of Total NRSF | Annual U/W Base Rent | % of Total Annual U/W Base Rent | Annual U/W Base Rent PSF |
| MTM(3) | 10 | 15,067 | 3.1% | 15,067 | 3.1% | $93,914 | 1.7% | $6.23 |
| 2021 | 4 | 11,186 | 2.3% | 26,253 | 5.4% | $160,388 | 2.9% | $14.34 |
| 2022 | 1 | 2,100 | 0.4% | 28,353 | 5.8% | $31,620 | 0.6% | $15.06 |
| 2023 | 6 | 201,659 | 41.6% | 230,012 | 47.4% | $2,307,262 | 41.9% | $11.44 |
| 2024 | 2 | 28,041 | 5.8% | 258,053 | 53.2% | $339,221 | 6.2% | $12.10 |
| 2025 | 2 | 24,124 | 5.0% | 282,177 | 58.2% | $261,506 | 4.8% | $10.84 |
| 2026 | 2 | 69,621 | 14.3% | 351,798 | 72.5% | $853,737 | 15.5% | $12.26 |
| 2027 | 1 | 31,562 | 6.5% | 383,360 | 79.0% | $399,000 | 7.3% | $12.64 |
| 2028 | 1 | 16,009 | 3.3% | 399,369 | 82.3% | $200,000 | 3.6% | $12.49 |
| 2029 | 4 | 43,769 | 9.0% | 443,138 | 91.3% | $408,798 | 7.4% | $9.34 |
| 2030 | 4 | 42,111 | 8.7% | 485,249 | 100.0% | $445,265 | 8.1% | $10.57 |
| 2031 | 0 | 0 | 0.0% | 485,249 | 100.0% | $0 | 0.0% | $0.00 |
| Thereafter(4) | 1 | 1 | 0.0% | 485,250 | 100.0% | $1,775 | 0.0% | $1775.40 |
| Vacant | 0 | 0 | 0.0% | 485,250 | 100.0% | $0 | 0.0% | $0.00 |
| Total/Weighted Average | 38 | 485,250 | 100.0% | $5,502,486 | 100.0% | $11.34 |
| (1) | Information obtained from the underwritten rent roll. |
| (2) | Certain tenants may have lease termination options that are exercisable prior to the originally stated expiration date of the subject lease and that are not considered in the Lease Expiration Schedule. |
| (3) | Annual U/W Base Rent includes $9,000 in rent associated with an ATM. 1 square foot was assigned to the ATM to underwrite. |
| (4) | Annual U/W Base Rent and Annual U/W Base Rent PSF represents rent attributed to Onondaga County Public Library tenant, whose rent was included in the underwriting analysis, but its square footage was not. 1 square foot was assigned to the Onondaga County Public Library tenant to underwrite rent. |
The following table presents historical occupancy percentages at the Hague + Galleries Mixed Use Portfolio Properties:
Historical Occupancy
12/31/2018(1) | 12/31/2019(1) | 12/31/2020(1) | 10/4/2021(2) |
| 89.3% | 97.5% | 100.0% | 100.0% |
| (1) | Information obtained from the borrower provided rent roll. |
| (2) | Information obtained from the underwritten rent roll dated October 4, 2021. |
THE INFORMATION IN THIS STRUCTURAL AND COLLATERAL TERM SHEET IS NOT COMPLETE AND MAY BE AMENDED PRIOR TO THE TIME OF SALE. THIS TERM SHEET IS NOT AN OFFER TO SELL THESE SECURITIES AND IT IS NOT A SOLICITATION OF AN OFFER TO BUY THESE SECURITIES IN ANY JURISDICTION WHERE THE OFFER OR SALE IS NOT PERMITTED.
60
| Various – Various | Loan #3 | Cut-off Date Balance: | $37,000,000 | |
| Property Addresses – Various | Hague + Galleries Mixed Use Portfolio | Cut-off Date LTV: | 58.7% | |
| U/W NCF DSCR: | 1.89x | |||
| U/W NOI Debt Yield: | 11.3% |
Operating History and Underwritten Net Cash Flow. The following table presents certain information relating to the underwritten net cash flow at the Hague + Galleries Mixed Use Portfolio Properties:
Cash Flow Analysis
| 2019 | 2020 | TTM 07/31/2021 | U/W | %(1) | U/W $ per SF | |
| Rents in Place | $5,427,172 | $5,525,767 | $5,237,809 | $5,502,486 | 83.6% | $11.34 |
| Contractual Rent Steps | 0 | 0 | 0 | 0 | 0.0 | 0.00 |
| Grossed Up Vacant Space | 0 | 0 | 0 | 0 | 0.0 | 0.00 |
| Gross Potential Rent | $5,427,172 | $5,525,767 | $5,237,809 | $5,502,486 | 83.6% | $11.34 |
| Other Income(2) | 0 | 67,216 | 69,665 | 69,665 | 1.1 | 0.14 |
| Total Recoveries | 911,053 | 1,110,887 | 959,559 | 1,009,425 | 15.3 | 2.08 |
| Net Rental Income | $6,338,225 | $6,703,871 | $6,267,034 | $6,581,577 | 100.0% | $13.56 |
| (Vacancy & Credit Loss) | 0 | 0 | 0 | (325,596)(4) | (5.9) | (0.67) |
| Effective Gross Income | $6,338,225 | $6,703,871 | $6,267,034 | $6,255,981 | 95.1% | $12.89 |
| Real Estate Taxes | 469,564 | 493,032 | 262,917 | 465,463 | 7.4 | 0.96 |
| Insurance | 155,529 | 148,665 | 0 | 127,464 | 2.0 | 0.26 |
| Management Fee | 0 | 0 | 0 | 187,679 | 3.0 | 0.39 |
| Other Operating Expenses | 1,342,657 | 1,441,758 | 1,310,540 | 1,310,540 | 20.9 | 2.70 |
| Total Operating Expenses | $1,967,749 | $2,083,455 | $1,573,456 | $2,091,146 | 33.4% | $4.31 |
| Net Operating Income | $4,370,476 | $4,620,415 | $4,693,578 | $4,164,835 | 66.6% | $8.58 |
| Replacement Reserves | 0 | 0 | 0 | 97,050 | 1.6 | 0.20 |
| TI/LC | 0 | 0 | 0 | 485,248 | 7.8 | 1.00 |
| Net Cash Flow | $4,370,476 | $4,620,415 | $4,693,578 | $3,582,537 | 57.3% | $7.38 |
| NOI DSCR | 2.31x | 2.44x | 2.48x | 2.20x | ||
| NCF DSCR | 2.31x | 2.44x | 2.48x | 1.89x | ||
| NOI Debt Yield | 11.8% | 12.5% | 12.7% | 11.3% | ||
| NCF Debt Yield | 11.8% | 12.5% | 12.7% | 9.7% |
| (1) | Represents (i) percent of Net Rental Income for all revenue fields, (ii) percent of Gross Potential Rent for Vacancy & Credit Loss and (iii) percent of Effective Gross Income for all other fields. |
| (2) | Other income consists of parking and miscellaneous income for The Galleries of Syracuse Property. |
| (3) | The underwritten economic vacancy is 5.0%. The Hague + Galleries Mixed Use Portfolio Properties was 100% leased as of October 4, 2021. |
THE INFORMATION IN THIS STRUCTURAL AND COLLATERAL TERM SHEET IS NOT COMPLETE AND MAY BE AMENDED PRIOR TO THE TIME OF SALE. THIS TERM SHEET IS NOT AN OFFER TO SELL THESE SECURITIES AND IT IS NOT A SOLICITATION OF AN OFFER TO BUY THESE SECURITIES IN ANY JURISDICTION WHERE THE OFFER OR SALE IS NOT PERMITTED.
61
| Various – Various | Loan #3 | Cut-off Date Balance: | $37,000,000 | |
| Property Addresses – Various | Hague + Galleries Mixed Use Portfolio | Cut-off Date LTV: | 58.7% | |
| U/W NCF DSCR: | 1.89x | |||
| U/W NOI Debt Yield: | 11.3% |
Appraisal. As of the appraisal valuation date of May 27, 2021, the appraiser concluded to an “as-is” appraised value of $36,000,000 for The Hague Property and $27,000,000 for The Galleries of Syracuse Property. The aggregate “as-is” appraised value for the Hague + Galleries Mixed Use Portfolio Properties is $63,000,000.
Environmental Matters. According to a Phase I environmental site assessment dated June 1, 2021, there was evidence of a recognized environmental condition at The Hague Property related to chlorinated volatile organic compounds (“VOCs”) contamination to the soil and groundwater, a potential vapor intrusion concern related to the VOCs and underground storage tanks. An environmental liability insurance policy in the amount of $3,000,000 per incident and in the aggregate was obtained to address the recognized environmental condition. According to the Phase 1 environmental site assessment dated June 7, 2021, there was no evidence of any recognized environmental conditions at The Galleries of Syracuse Property. See “Description of Mortgage Pool—Environmental Considerations” in the Preliminary Prospectus.
Market Overview and Competition.
The Hague
The Hague Property is located in Rochester, Monroe County, New York within the Finger Lakes region, which is named for the eleven lakes surrounding Rochester. Rochester’s economy is primarily driven by education, healthcare and manufacturing. Rochester is also home to number of international businesses including Kodak, Xerox and Bausch and Lomb. Major employers include the University of Rochester, Rochester Regional Health System, Wegmans Food Markets Inc., Paychex and Rochester Institute of Technology. The University of Rochester is home to approximately 12,000 students and offers over 200 bachelors, masters and doctoral degree programs and certificate offerings.
Primary access to The Hague Property’s neighborhood is provided via Interstates 390 and 480. The Hague Property is located approximately 2.2 miles west of downtown Rochester, which is home to small businesses, museums and restaurants. Since 2000, there has been more than $2.35 billion invested in downtown Rochester rebuilding the infrastructure and developing new amenities, which is transforming the area and bringing in new residents. Entertainment in the area includes: the Strong Museum and Eastman School of Music, Geva Theatre Center, Hochstein School of Music & Dance, Rochester Contemporary Arts Center, and Downstairs Cabaret. According to a third party market research report, the estimated 2021 population within a one, three, and five-mile radius is 20,756, 126,934 and 290,444. The average household income within the same radii is $44,890, $51,215, and $63,281.
Submarket Information (Office) – According to the appraisal, The Hague Property is situated within the Greater Rochester office submarket, which contained approximately 10.8 million square feet of office space as of the first quarter of 2021. The Greater Rochester office submarket reported a vacancy rate of 11.4% with an average quoted rental rate of $15.43 per square feet. The Greater Rochester office submarket reported absorption of 11,390 square feet and no new construction.
Submarket Information (Industrial) – According to the appraisal, The Hague Property is located within the Greater Rochester industrial submarket, which contained approximately 36.8 million square feet of industrial space as of the first quarter of 2021. The Greater Rochester industrial submarket reported a vacancy rate of 4.2% with an average quoted rental rate of $6.16 per square feet. The Greater Rochester industrial submarket reported negative net absorption of 66,374 square feet and no new construction.
Appraiser’s Office and Warehouse/Flex Comp Set – The appraiser identified five office and four warehouse/flex competitive properties for The Hague Property totaling approximately 706,902 square feet, which reported an average occupancy rate of approximately 82.0%. The appraiser concluded to market rents of $15.00 per square foot for office tenants, $11.00 per square foot for flex tenants, and $8.00 per square foot for warehouse tenants.
The following table presents certain information relating to the appraiser’s market rent conclusion for The Hague Property:
Market Rent Summary(1)
| Office | Flex | Warehouse | |
| Market Rent (PSF) | $15.00 | $11.00 | $8.00 |
| Lease Term (Years) | 7.0 | 7.0 | 7.0 |
| Lease Type (Reimbursements) | Mod Gross | NNN | NNN |
| Rent Increase Projection | 3.0% | 3.0% | 3.0% |
(1) Information obtained from the appraisal.
THE INFORMATION IN THIS STRUCTURAL AND COLLATERAL TERM SHEET IS NOT COMPLETE AND MAY BE AMENDED PRIOR TO THE TIME OF SALE. THIS TERM SHEET IS NOT AN OFFER TO SELL THESE SECURITIES AND IT IS NOT A SOLICITATION OF AN OFFER TO BUY THESE SECURITIES IN ANY JURISDICTION WHERE THE OFFER OR SALE IS NOT PERMITTED.
62
| Various – Various | Loan #3 | Cut-off Date Balance: | $37,000,000 | |
| Property Addresses – Various | Hague + Galleries Mixed Use Portfolio | Cut-off Date LTV: | 58.7% | |
| U/W NCF DSCR: | 1.89x | |||
| U/W NOI Debt Yield: | 11.3% |
The table below presents certain information relating to comparable sales, which pertain to The Hague Property as identified by the appraiser:
Comparable Sales(1)
| Property Name | Location | Rentable Area (SF) | Sale Date | Sale Price | Sale Price (PSF) |
| 3441 West Henrietta Road | Rochester, NY | 114,205 | NAV | $6,500,000 | $56.92 |
| 10 Jupiter Lane | Colonie, NY | 138,105 | Dec-20 | $8,300,000 | $60.10 |
| 400 Exchange Street | Buffalo, NY | 232,570 | Oct-20 | $12,500,000 | $53.75 |
| 115 Metropolitan Park Drive | Liverpool, NY | 82,071 | Jun-19 | $6,943,000 | $84.60 |
| 2580 Manitou Road | Rochester, NY | 109,772 | Jan-19 | $13,891,648 | $126.55 |
| (1) | Information obtained from the appraisal. |
The following table presents certain information relating to comparable leases to those at The Hague Property:
Comparable Leases(1)
| Property Name/Location | Year Built/ Renovated | Total GLA (SF) | Distance from Subject | Occupancy | Lease Term | Tenant Size (SF) | Annual Base Rent PSF | Reimbursement Amount PSF | Lease Type | ||
| Office | |||||||||||
South Winton Court 3136 South Winton Road Rochester, NY | 1987/NAP | 47,472 | 8.5 miles | 74.0% | 3.0 Yrs | 8,150 | $15.00 | NAV | MG | ||
Laurelton Building 500 Helendale Road Rochester, NY | 1999/NAP | 58,880 | 8.5 miles | 100.0% | 5.0 Yrs | 5,300 | $16.00 | NAV | MG | ||
1815 South Clinton Avenue 1815 South Clinton Avenue Rochester, NY | 1997/NAP | 75,000 | 4.5 miles | 66.0% | 3.0 Yrs | 15,000 | $14.50 | NAV | MG | ||
Alexander Park Professional Center 330 Monroe Avenue Rochester, NY | 2011/NAP | 80,000 | 2.8 miles | 53.0% | 5.0 Yrs | 37,241 | $16.50 | NAV | NNN | ||
| Warehouse/Flex | |||||||||||
2921 Brighton Henrietta Town Line Road 2921 Brighton Henrietta Town Line Road Rochester, NY | 1985/NAP | 130,000 | 7.3 miles | 100.0% | 5.0 Yrs | 45,000 | $5.95 | NAV | NNN | ||
Building 100 1565 Jefferson Road Rochester, NY | 2010/NAP | 190,000 | 8.9 miles | 76.0% | 5.0 Yrs | 15,280 | $13.50 | NAV | NNN | ||
3490 Winton Place 3490 Winton Place Rochester, NY | 1991/NAP | 30,000 | 8.7 miles | 89.0% | 3.0 Yrs | 6,370 | $11.00 | NAV | NNN | ||
71 Goodway Drive 71 Goodway Drive Rochester, NY | 2000/NAP | 15,550 | 8.6 miles | 100.0% | 3.0 Yrs | 8,913 | $11.00 | NAV | NNN | ||
156 Ames Street 156 Ames Street Rochester, NY | 1920/NAP | 80,000 | 0.5 miles | 81.0% | 3.0 Yrs. | 1,800 | $10.00 | NAV | NNN | ||
| (1) | Information obtained from the appraisal. |
The Galleries of Syracuse
The Galleries of Syracuse Property is located in Syracuse, Onondaga County, New York. According to the appraisal, Syracuse is the fifth most populous city in New York following New York City, Buffalo, Rochester and Yonkers. Syracuse’s top employers are primarily in higher education, research, health care, and services firms. Major employers include State University of New York Upstate Medical University, St. Joseph's Hospital Health Center, Syracuse University, Lockheed Martin Corp. and Wegmans Food Markets. Syracuse is home to Syracuse Univeristy, Le Moyne College, SUNY Upstate Medical University, and SUNY College of Environmental Science & Forestry. Syracuse is the economic and educational hub of Central New York, a region with over one million inhabitants. Primary access to The Galleries of Syracuse Property’s neighborhood is accessed via Interstates 81 and 90. Syracuse offers over 170 parks, fields, and recreation areas, totaling over 1,000 acres. Major parks include Thornden Park, Schiller Park, Sunnycrest Park, Onondaga Park and Kirk Park. According to a third party market research report, the estimated 2021 population within a one-, three-
THE INFORMATION IN THIS STRUCTURAL AND COLLATERAL TERM SHEET IS NOT COMPLETE AND MAY BE AMENDED PRIOR TO THE TIME OF SALE. THIS TERM SHEET IS NOT AN OFFER TO SELL THESE SECURITIES AND IT IS NOT A SOLICITATION OF AN OFFER TO BUY THESE SECURITIES IN ANY JURISDICTION WHERE THE OFFER OR SALE IS NOT PERMITTED.
63
| Various – Various | Loan #3 | Cut-off Date Balance: | $37,000,000 | |
| Property Addresses – Various | Hague + Galleries Mixed Use Portfolio | Cut-off Date LTV: | 58.7% | |
| U/W NCF DSCR: | 1.89x | |||
| U/W NOI Debt Yield: | 11.3% |
, and five-mile radius is 21,102, 141,410 and 219,958. The average household income within the same radii is $43,221, $60,330, and $69,544.
Submarket Information – According to the appraisal, The Galleries of Syracuse Property is situated within the Syracuse CBD office submarket, which contained approximately 7.8 million square feet of office space as of the first quarter of 2021. The Syracuse CBD office submarket reported a vacancy rate of 10.4% with an average quoted rental rate of $17.26 per square feet. The Syracuse CBD office submarket reported negative absorption of 14,807 square feet and no new construction.
Appraiser’s Office and Office Comp Set – The appraiser identified four office competitive properties for The Galleries of Syracuse Property totaling approximately 562,466 square feet, which reported an average occupancy rate of approximately 87.0%. The appraiser concluded to market rents of $14.00 per square foot for office tenants and $8.00 per square foot for storage tenants.
The following table presents certain information relating to the appraiser’s market rent conclusion for The Galleries of Syracuse Property:
Market Rent Summary(1)
| Office | Storage | |
| Market Rent (PSF) | $14.00 | $8.00 |
| Lease Term (Years) | 7.0 | 5.0 |
| Lease Type (Reimbursements) | Mod Gross | Gross |
| Rent Increase Projection | 3.0% | 3.0% |
| (1) | Information obtained from the appraisal. |
The table below presents certain information relating to comparable sales, which pertain The Galleries of Syracuse Property identified by the appraiser:
Comparable Sales(1)
| Property Name | Location | Rentable Area (SF) | Sale Date | Sale Price | Sale Price (PSF) |
| 50 Beaver Street | Albany, NY | 78,321 | Jan-20 | $9,400,000 | $120.02 |
| 130-138 Delaware Avenue | Buffalo, NY | 121,711 | Jun-19 | $16,900,000 | $138.82 |
| 194 Washington Avenue | Albany, NY | 103,200 | Apr-18 | $9,200,000 | $89.15 |
| 401-413 South Salina Street | Syracuse, NY | 235,000 | Current | $23,000,000 | $97.87 |
| (1) | Information obtained from the appraisal. |
THE INFORMATION IN THIS STRUCTURAL AND COLLATERAL TERM SHEET IS NOT COMPLETE AND MAY BE AMENDED PRIOR TO THE TIME OF SALE. THIS TERM SHEET IS NOT AN OFFER TO SELL THESE SECURITIES AND IT IS NOT A SOLICITATION OF AN OFFER TO BUY THESE SECURITIES IN ANY JURISDICTION WHERE THE OFFER OR SALE IS NOT PERMITTED.
64
| Various – Various | Loan #3 | Cut-off Date Balance: | $37,000,000 | |
| Property Addresses – Various | Hague + Galleries Mixed Use Portfolio | Cut-off Date LTV: | 58.7% | |
| U/W NCF DSCR: | 1.89x | |||
| U/W NOI Debt Yield: | 11.3% |
The following table presents certain information relating to comparable leases to those at The Galleries of Syracuse Property:
Comparable Office Leases(1)
| Property Name/Location | Year Built/ Renovated | Total GLA (SF) | Distance from Subject | Occupancy | Lease Term | Tenant Size (SF) | Annual Base Rent PSF | Reimbursement Amount PSF | Lease Type | ||
362-374 South Salina Street Syracuse, NY | 1930/NAP | 151,241 | 0.1 miles | 87.0% | 5.0 Yrs | 2,507 | $14.00 | NAV | MG | ||
220 South Warren Street Syracuse, NY | 2013/NAP | 37,000 | 0.3 miles | 100.0% | 5.0 Yrs. | 5,000 | $12.00 | NAV | MG | ||
211 West Jefferson Street Syracuse, NY | 2009/NAP | 70,000 | 0.2 miles | 89.0% | 10.0 Yrs | 35,000 | $19.75 | NAV | MG | ||
500 Plum Street Syracuse, NY | 1990/NAP | 121,649 | 1.1 miles | 88.0% | 10.0 Yrs | 19,388 | $15.00 | NAV | MG | ||
250 South Clinton Street Syracuse, NY | 1990/NAP | 182,576 | 0.4 miles | 73.0% | 5.0 Yrs | 40,796 | $19.00 | NAV | MG | ||
| (1) | Information obtained from the appraisal. |
Escrows.
Real Estate Taxes – The Hague + Galleries Mixed Use Portfolio Mortgage Loan documents require an upfront tax reserve of $162,912 and ongoing monthly real estate tax reserves in an amount equal to one-twelfth of the real estate taxes that the lender estimates will be necessary to pay taxes over the then succeeding twelve months (initially $38,789).
Insurance – The Hague + Galleries Mixed Use Portfolio Mortgage Loan documents require an upfront insurance reserve of $44,612 and ongoing monthly insurance reserves in an amount equal to one-twelfth of the insurance premiums that the lender estimates will be payable for the renewal of the coverage afforded by the policies upon the expiration thereof (initially $10,622).
Replacement Reserves – The Hague + Galleries Mixed Use Portfolio Mortgage Loan documents require ongoing monthly replacement reserves of $8,095.
TI/LC Reserve – The Hague + Galleries Mixed Use Portfolio Mortgage Loan documents require upfront tenant improvement and leasing commission reserves of $500,000 and ongoing monthly tenant improvement and leasing commission reserves of $40,477, subject to a cap of $2,000,000. In addition to the monthly tenant improvement and leasing commission reserve, the Hague + Galleries Mixed Use Portfolio Borrower is required to deposit into the TI/LC reserve any amounts paid to the Hague + Galleries Mixed Use Portfolio Borrower in connection with a termination, cancellation, sale or other disposition of any lease or any portion thereof, other than amounts paid for rent and other charges in respect of periods prior to the date of such termination, cancellation, surrender, modification, sale or other disposition.
Lockbox and Cash Management. The Hague + Galleries Mixed Use Portfolio Mortgage Loan is structured with a hard lockbox and springing cash management. The Hague + Galleries Mixed Use Portfolio Mortgage Loan documents require the Hague + Galleries Mixed Use Portfolio Borrower and the property manager to deliver tenant instruction letters to each tenant in place and any new tenants instructing such tenants to deposit all rents payable under each lease directly into the lockbox account, which is already in place. The Hague + Galleries Mixed Use Portfolio Mortgage Loan documents also require that all revenues received by the Hague + Galleries Mixed Use Portfolio Borrower or the property manager be deposited into the lockbox account within one business day of receipt. Upon the occurrence of a Cash Management Trigger Event (as defined below) all funds in the lockbox account are required to be swept each business day into the cash management account controlled by the lender and disbursed on each payment date in accordance with the Hague + Galleries Mixed Used Portfolio Mortgage Loan documents. Pursuant to the Hague + Galleries Mixed Use Portfolio Mortgage Loan documents, all excess funds on deposit are required to be applied as follows (a) if a Cash Sweep Event (as defined below) is not in effect, to the Hague + Galleries Mixed Use Portfolio Borrower; and (b) if a Cash Sweep Event is in effect due to the existence of a Critical Tenant Trigger Event (as defined below) to the Critical Tenant TI/LC subaccount until the applicable Critical Tenant Trigger Event cure has occurred. If a Cash Sweep Event is in effect but a Critical Tenant Trigger Event is not in effect, then funds will be applied to the excess cash flow account.
A “Cash Management Trigger Event” will commence upon the occurrence of the following:
| (i) | an event of default; |
| (ii) | the Hague + Galleries Mixed Use Portfolio Borrower’s second late debt service payment within a 12-month period; |
| (iii) | a bankruptcy action of the Hague + Galleries Mixed Use Portfolio Borrower, guarantor or property manager; |
| (iv) | a Cash Management DSCR Trigger Event (as defined below); or |
| (v) | a Critical Tenant Trigger Event (as defined below). |
THE INFORMATION IN THIS STRUCTURAL AND COLLATERAL TERM SHEET IS NOT COMPLETE AND MAY BE AMENDED PRIOR TO THE TIME OF SALE. THIS TERM SHEET IS NOT AN OFFER TO SELL THESE SECURITIES AND IT IS NOT A SOLICITATION OF AN OFFER TO BUY THESE SECURITIES IN ANY JURISDICTION WHERE THE OFFER OR SALE IS NOT PERMITTED.
65
| Various – Various | Loan #3 | Cut-off Date Balance: | $37,000,000 | |
| Property Addresses – Various | Hague + Galleries Mixed Use Portfolio | Cut-off Date LTV: | 58.7% | |
| U/W NCF DSCR: | 1.89x | |||
| U/W NOI Debt Yield: | 11.3% |
A Cash Management Trigger Event will end upon the occurrence of:
| ● | with regard to clause (i) above, the cure of such event of default has been accepted or waived by the lender; |
| ● | with regard to clause (ii) above, when the debt service payments have been paid on time for 12 consecutive months; |
| ● | with regard to clause (iii) above, when such bankruptcy action petition has been discharged, stayed, or dismissed within 30 days of such filing among other conditions for the Hague + Galleries Mixed Use Portfolio Borrower or guarantor and within 120 days for the property manager, with respect to the property manager, the Hague + Galleries Mixed Use Portfolio Borrower replacing the property manager with a qualified property manager acceptable to the lender; |
| ● | with regard to clause (iv) above, the date the amortizing debt service coverage ratio based on the trailing 12-month period immediately preceding the date of such determination is greater than 1.45x for two consecutive quarters; and |
| ● | with regard to clause (v) above, the date the applicable Critical Tenant Trigger Event Cure (as defined below) has occurred. |
A “Cash Management DSCR Trigger Event” will occur on any day the debt service coverage ratio, based on the trailing 12-month period immediately preceding the date of determination, is less than 1.40x.
A “Cash Sweep Event” will commence upon the occurrence of the following:
| (i) | an event of default; |
| (ii) | a bankruptcy action of the Hague + Galleries Mixed Use Portfolio Borrower, guarantor or property manager; |
| (iii) | a Cash Sweep DSCR Trigger Event (as defined below); or |
| (iv) | a Critical Tenant Trigger Event (as defined below). |
A Cash Sweep Event will end upon the occurrence of:
| ● | with regard to clause (i) above, the cure of such event of default has been accepted or waived by the lender; |
| ● | with regard to clause (ii) above, when such bankruptcy action petition has been discharged, stayed, or dismissed within 60 days of such filing among other conditions for the Hague + Galleries Mixed Use Portfolio Borrower or guarantor and within 120 days for the property manager, with respect to the property manager, the Hague + Galleries Mixed Use Portfolio Borrower replacing the property manager with a qualified property manager acceptable to the lender; |
| ● | with regard to clause (iii) above, the date the amortizing debt service coverage ratio based on the trailing 12-month period immediately preceding the date of such determination is greater than 1.45x for two consecutive quarters; and |
| ● | with regard to clause (iv) above, the date the applicable Critical Tenant Trigger Event Cure has occurred. |
A “Cash Sweep DSCR Trigger Event” will occur on any day the debt service coverage ratio, based on the trailing 12-month period immediately preceding the date of determination, is less than 1.40x.
A “Critical Tenant Trigger Event” will occur upon:
| (i) | if RG&E, USDA, TCG and ABC or any other tenant occupying the space currently occupied by such tenant (each, a “Critical Tenant” and each related lease, a “Critical Tenant Lease”) gives notice of its intention to not extend or renew its lease or to terminate its lease or the applicable Critical Tenant Lease is otherwise terminated; |
| (ii) | on the date that is (x) 18 months prior to the related lease expiration date or termination date under the RG&E lease and (y) 12 months prior to the related lease expiration date or termination date under the USDA, ABC or TCG lease, if the Critical Tenant has failed to give notice of its election to renew its lease; |
| (iii) | on or prior to the date on which the Critical Tenant is required under its lease to notify the landlord of its election to renew its lease, and the Critical Tenant fails to give such notice; |
| (iv) | an event of default under the Critical Tenant Lease occurs or is continuing; |
| (v) | if a bankruptcy action with respect to the Critical Tenant or guarantor of any Critical Tenant occurs; |
| (vi) | if the Critical Tenant elects to pay reduced rent (including, without limitation, percentage rent in lieu of fixed rent) pursuant to any right or remedy contained in the applicable Critical Tenant Lease; |
| (vii) | if the Critical Tenant discontinues its normal business operations; or |
| (viii) | if the related Critical Tenant or any guarantor of a Critical Tenant lease or, so long as RG&E is a Critical Tenant, Avangrid, Inc., which is rated by a credit reporting is downgraded below “BBB-” or the equivalent by a credit reporting agency or is rated “BBB-” or the equivalent or higher by any credit reporting agency and thereafter ceases to be rated by any credit reporting agency. |
A “Critical Tenant Trigger Event Cure” will occur upon:
| ● | with regard to clause (i), (ii) or (iii) above, (x) the date that (1) the Critical Tenant Lease extension is executed and delivered to lender by the Hague + Galleries Mixed Use Portfolio Borrower and the related tenant improvement costs, leasing commissions and other material costs and expenses have been deposited into the Critical Tenant TI/LC account; or (2) a Critical Tenant Space Re-Tenanting Event (as defined below) has occurred; |
| ● | with regard to clause (iv) above, after a cure of the applicable default; |
| ● | with regard to clause (v) above, after an affirmation of the Critical Tenant lease in the applicable bankruptcy proceeding and confirmation that the Critical Tenant is actually paying all rents and other amounts under the lease; |
| ● | with regard to clause (vi) above, the Critical Tenant re-commences the payment of full unabated rent; |
THE INFORMATION IN THIS STRUCTURAL AND COLLATERAL TERM SHEET IS NOT COMPLETE AND MAY BE AMENDED PRIOR TO THE TIME OF SALE. THIS TERM SHEET IS NOT AN OFFER TO SELL THESE SECURITIES AND IT IS NOT A SOLICITATION OF AN OFFER TO BUY THESE SECURITIES IN ANY JURISDICTION WHERE THE OFFER OR SALE IS NOT PERMITTED.
66
| Various – Various | Loan #3 | Cut-off Date Balance: | $37,000,000 | |
| Property Addresses – Various | Hague + Galleries Mixed Use Portfolio | Cut-off Date LTV: | 58.7% | |
| U/W NCF DSCR: | 1.89x | |||
| U/W NOI Debt Yield: | 11.3% |
| ● | with regard to clause (vii) above, the Critical Tenant re-commences its normal business operations or a Critical Tenant Space Re-Tenanting Event (as defined below) has occurred; or |
| ● | with regard to clause (viii) above, the date the credit rating of the related Critical Tenant (or guarantor of a Critical Tenant Lease or, in the case of RG&E, Avangrid, Inc.) is no longer less than a “BBB-” or the equivalent by a credit reporting agency. |
A “Critical Tenant Space Re-tenanting Event” will occur on the date each of the following conditions has been satisfied: (i) the related Critical Tenant space is leased to one or more replacement tenants for a term of at least five years and on terms that are acceptable to the lender; (ii) all tenant improvement costs, leasing commissions and other material costs and expenses relating to the re-letting of the related Critical Tenant Space have been paid in full; and (iii) the replacement tenant(s) are conducting normal business operations at the related Critical Tenant space.
Property Management. The Hague + Galleries Mixed Use Portfolio Properties are managed by Flaum Management Company, Inc., which is not an affiliate of the Hague + Galleries Mixed Use Portfolio Borrower.
Partial Release. Not permitted.
Real Estate Substitution. Not permitted.
Subordinate and Mezzanine Indebtedness. Not permitted.
Ground Lease. None.
Terrorism Insurance. The Hague + Galleries Mixed Use Portfolio Mortgage Loan documents require that the “all risk” insurance policy required to be maintained by the Hague + Galleries Mixed Use Portfolio Borrower provides coverage for terrorism in an amount equal to the full replacement cost of the Hague + Galleries Mixed Use Portfolio Properties, as well as business interruption insurance covering no less than the 12-month period following the occurrence of a casualty event, together with a 6-month extended period of indemnity.
THE INFORMATION IN THIS STRUCTURAL AND COLLATERAL TERM SHEET IS NOT COMPLETE AND MAY BE AMENDED PRIOR TO THE TIME OF SALE. THIS TERM SHEET IS NOT AN OFFER TO SELL THESE SECURITIES AND IT IS NOT A SOLICITATION OF AN OFFER TO BUY THESE SECURITIES IN ANY JURISDICTION WHERE THE OFFER OR SALE IS NOT PERMITTED.
67
| Loan #4 | Cut-off Date Balance: | $35,000,000 | ||
| Multifamily – Garden | TLR Portfolio | Cut-off Date LTV: | 65.4% | |
| Property Addresses – Various | U/W NCF DSCR: | 1.78x | ||
| U/W NOI Debt Yield: | 7.4% |
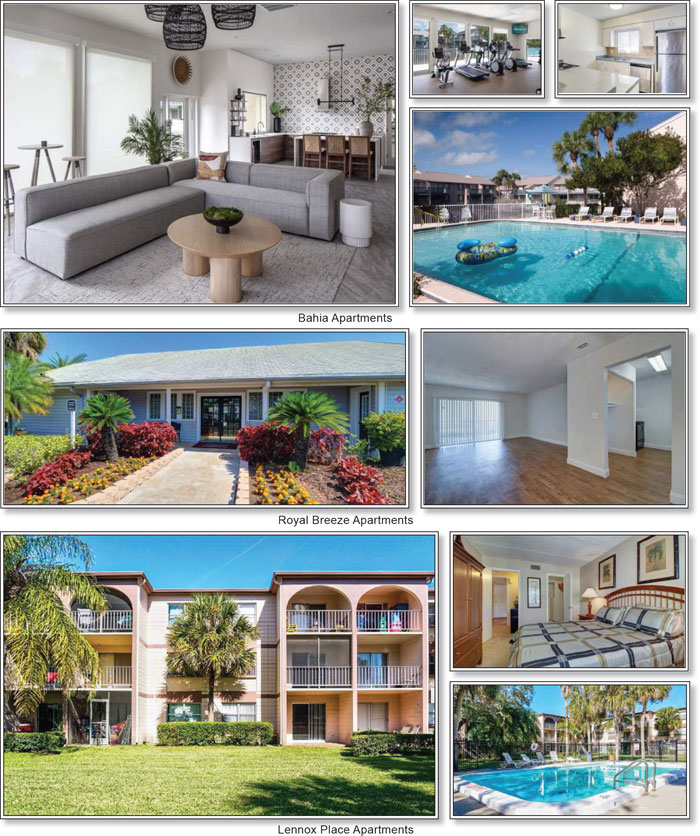
THE INFORMATION IN THIS STRUCTURAL AND COLLATERAL TERM SHEET IS NOT COMPLETE AND MAY BE AMENDED PRIOR TO THE TIME OF SALE. THIS TERM SHEET IS NOT AN OFFER TO SELL THESE SECURITIES AND IT IS NOT A SOLICITATION OF AN OFFER TO BUY THESE SECURITIES IN ANY JURISDICTION WHERE THE OFFER OR SALE IS NOT PERMITTED.
68
| Loan #4 | Cut-off Date Balance: | $35,000,000 | ||
| Multifamily – Garden | TLR Portfolio | Cut-off Date LTV: | 65.4% | |
| Property Addresses – Various | U/W NCF DSCR: | 1.78x | ||
| U/W NOI Debt Yield: | 7.4% |
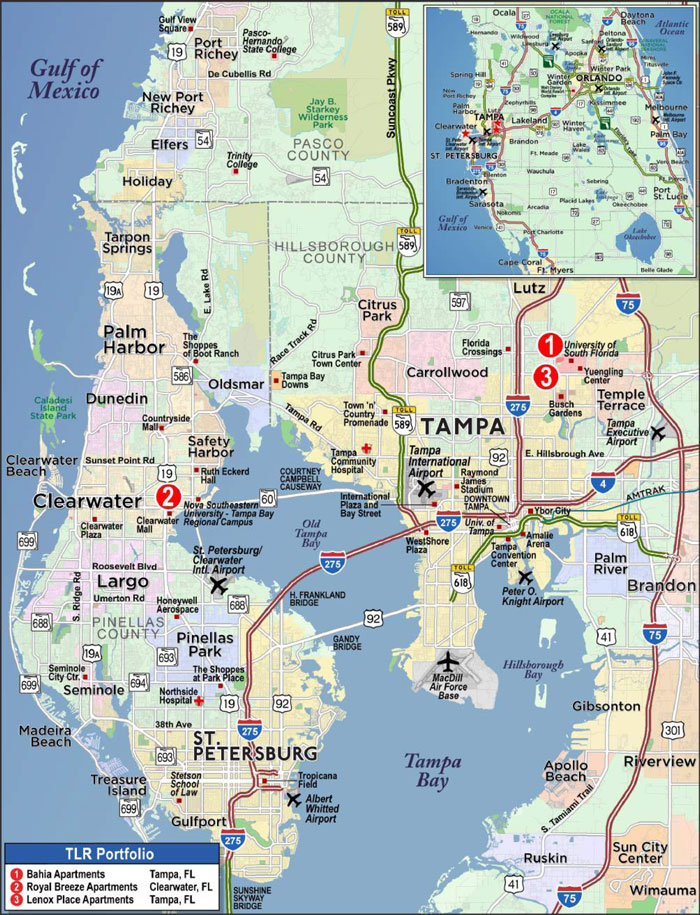
THE INFORMATION IN THIS STRUCTURAL AND COLLATERAL TERM SHEET IS NOT COMPLETE AND MAY BE AMENDED PRIOR TO THE TIME OF SALE. THIS TERM SHEET IS NOT AN OFFER TO SELL THESE SECURITIES AND IT IS NOT A SOLICITATION OF AN OFFER TO BUY THESE SECURITIES IN ANY JURISDICTION WHERE THE OFFER OR SALE IS NOT PERMITTED.
69
| No. 4 – TLR Portfolio | |||||||
| Mortgage Loan Information | Mortgaged Property Information | ||||||
| Mortgage Loan Seller(1): | LMF Commercial, LLC | Single Asset/Portfolio: | Portfolio | ||||
| Credit Assessment (Fitch/KBRA/Moody’s): | NR/NR/NR | Property Type – Subtype: | Multifamily – Garden | ||||
| Original Principal Balance(2): | $35,000,000 | Location: | Various, FL | ||||
| Cut-off Date Balance(2): | $35,000,000 | Size: | 688 Units | ||||
| % of Initial Pool Balance: | 4.6% | Cut-off Date Balance Per Unit: | $120,640 | ||||
| Loan Purpose: | Refinance | Maturity Date Balance Per Unit: | $120,640 | ||||
| Borrower Sponsors: | Rudy Nassri and Vincent Chiara | Year Built/Renovated: | Various/2021 | ||||
| Guarantors: | Rudy Nassri and Vincent Chiara | Title Vesting: | Fee | ||||
| Interest Rate: | 3.9700% | Property Manager: | Borrower-Affillate | ||||
| Note Date: | November 9, 2021 | Current Occupancy (As of): | 97.2% (10/1/2021) | ||||
| Seasoning: | 0 months | YE 2020 Occupancy: | 97.0% | ||||
| Maturity Date: | December 6, 2031 | YE 2019 Occupancy: | 95.2% | ||||
| Interest-Only Period: | 120 months | YE 2018 Occupancy: | 97.9% | ||||
| Loan Term (Original): | 120 months | YE 2017 Occupancy: | 98.0% | ||||
| Amortization Term (Original): | NAP | Appraised Value(4): | $127,000,000 | ||||
| Loan Amortization Type: | Interest Only | Appraised Value Per Unit(4): | $184,593 | ||||
| Call Protection: | L(24),D(93),O(3) | Appraisal Valuation Date(4): | October 13, 2021 | ||||
| Lockbox Type: | Springing | Underwriting and Financial Information(5) | |||||
| Additional Debt(2): | Yes | TTM NOI (9/30/2021): | $5,906,570 | ||||
| Additional Debt Type (Balance)(2): | Pari Passu ($48,000,000) | YE 2020 NOI: | $5,437,057 | ||||
| YE 2019 NOI: | $4,928,618 | ||||||
| YE 2018 NOI: | NAV | ||||||
| U/W Revenues: | $9,477,000 | ||||||
| U/W Expenses: | $3,353,170 | ||||||
| U/W NOI: | $6,123,830 | ||||||
| Escrows and Reserves(3) | U/W NCF: | $5,951,830 | |||||
| Initial | Monthly | Cap | U/W DSCR based on NOI/NCF(2): | 1.83x / 1.78x | |||
| Taxes | $77,287 | $77,287 | NAP | U/W Debt Yield based on NOI/NCF(2): | 7.4% / 7.2% | ||
| Insurance | $282,923 | $28,292 | NAP | U/W Debt Yield at Maturity based on NOI/NCF(2): | 7.4% / 7.2% | ||
| Replacement Reserve | $0 | $14,333 | NAP | Cut-off Date LTV Ratio(2)(4): | 65.4% | ||
| Holdback Reserve | $2,500,000 | $0 | NAP | LTV Ratio at Maturity(2)(4): | 65.4% | ||
| Sources and Uses | ||||||||
| Sources | Uses | |||||||
| Original whole loan amount | $83,000,000 | 100.0% | Loan Payoff | $51,775,784 | 62.4% | |||
| Closing costs | 11,190,181 | 13.5 | ||||||
| Upfront Reserves | 2,860,210 | 3.4 | ||||||
| Return of equity | 17,173,825 | 20.7 | ||||||
| Total Sources | $83,000,000 | 100.0% | Total Uses | $83,000,000 | 100.0% | |||
| (1) | The TLR Portfolio Whole Loan (as defined below) was co-originated by Citi Real Estate Funding Inc. (“CREFI”) and LMF Commercial, LLC (“LMF”). |
| (2) | The TLR Portfolio Mortgage Loan (as defined below) is part of the TLR Portfolio Whole Loan,which is comprised of two pari passu promissory notes with an aggregate original balance of $83,000,000. All statistical information related to the Cut-off Date Balance per Unit, Maturity Date Balance per Unit, U/W Debt Yield based on NOI/NCF, U/W Debt Yield at Maturity based on NOI/NCF, U/W DSCR based on NOI/NCF, Cut-off Date LTV Ratio and LTV Ratio at Maturity is based on the TLR Portfolio Whole Loan. |
| (3) | See “Escrows” section below. |
| (4) | The Appraised Value represents the “As-Portfolio” value of $127,000,000, which includes a diversity premium based on an assumption that all of the mortgaged properties would be sold together as a portfolio. The aggregate “As-Is” appraised value for the TLR Portfolio Properties is $123,500,000. The Cut-off Date LTV Ratio and LTV Ratio at Maturity based on the $123,500,000 aggregate “As-Is” appraised value are 67.2% and 67.2%, respectively. |
| (5) | While the TLR Portfolio Whole Loan was originated after the emergence of the novel coronavirus pandemic and the economic disruption resulting from measures to combat the pandemic, the pandemic is an evolving situation and could impact the TLR Portfolio Whole Loan more severely than assumed in the underwriting of the TLR Portfolio Whole Loan and could adversely affect the NOI, NCF and occupancy information, as well as the appraised value and the DSCR, LTV and Debt Yield metrics presented above. See “Risk Factors—Risks Related to Market Conditions and Other External Factors—The Coronavirus Pandemic Has Adversely Affected the Global Economy and Will Likely Adversely Affect the Performance of the Mortgage Loans” in the Preliminary Prospectus. |
THE INFORMATION IN THIS STRUCTURAL AND COLLATERAL TERM SHEET IS NOT COMPLETE AND MAY BE AMENDED PRIOR TO THE TIME OF SALE. THIS TERM SHEET IS NOT AN OFFER TO SELL THESE SECURITIES AND IT IS NOT A SOLICITATION OF AN OFFER TO BUY THESE SECURITIES IN ANY JURISDICTION WHERE THE OFFER OR SALE IS NOT PERMITTED.
70
| Loan #4 | Cut-off Date Balance: | $35,000,000 | ||
| Multifamily – Garden | TLR Portfolio | Cut-off Date LTV: | 65.4% | |
| Property Addresses – Various | U/W NCF DSCR: | 1.78x | ||
| U/W NOI Debt Yield: | 7.4% |
The Mortgage Loan. The mortgage loan (the “TLR Portfolio Mortgage Loan”) is part of a whole loan (the “TLR Portfolio Whole Loan”) that is evidenced by two pari passu promissory notes in the aggregate original principal amount of $83,000,000. The TLR Portfolio Whole Loan is secured by a first mortgage encumbering the fee interest in three garden style multifamily properties, two of which are located in Tampa, Flordia and one of which is located in Clearwater, Florida (each, a “TLR Portfolio Property”, and collectively, the “TLR Portfolio Properties”). The TLR Portfolio Mortgage Loan consists of the non-controlling Note A-2, which had an original principal balance of $35,000,000, has a Cut-off Date of $35,000,000 and is being contributed to the WFCM 2021-C61 trust. The remaining note had an original principal balance of $48,000,000, has a Cut-off Date Balance of $48,000,000 and is expected to be contributed to one or more future transactions. The TLR Portfolio Whole Loan will be serviced pursuant to the pooling and servicing agreement for the WFCM 2021-C61 trust until the controlling Note A-1 is securitized, whereupon the TLR Portfolio Whole Loan will be serviced pursuant to the pooling and servicing agreement for such future securitization. See “Description of the Mortgage Pool—The Whole Loans—The Serviced Pari Passu Whole Loans”, “The Non-Serviced Pari Passu Whole Loans” and “Pooling and Servicing Agreement—Servicing of the Servicing Shift Mortgage Loans” in the Preliminary Prospectus.
The relationship between the holders of the TLR Portfolio Whole Loan will be governed by a co-lender agreement as described under “Description of the Mortgage Pool—The Whole Loans—The Serviced Pari Passu Whole Loans” in the Preliminary Prospectus.
Note Summary
| Notes | Original Balance | Cut-off Date Balance | Note Holder | Controlling Interest |
| A-1(1) | $48,000,000 | $48,000,000 | CREFI | Yes |
| A-2 | $35,000,000 | $35,000,000 | WFCM 2021-C61 | No |
| Total | $83,000,000 | $83,000,000 |
| (1) Expected to be contributed to one or more future securitization transactions. |
The Borrower and Borrower Sponsors. The borrowers are Park Aberdeen Apartments, LLC, Royal Breeze Apartments, Inc., and Lenox Apartments, Inc. (collectively, the “TLR Portfolio Borrower”), each a single purpose entity with one independent director. Park Aberdeen Apartments, LLC, is a Florida limited liability company. Royal Breeze Apartments, Inc. and Lenox Apartments, Inc. each are Delaware corporations. Legal counsel to the TLR Portfolio Borrower delivered a non-consolidation opinion in connection with the origination of the TLR Portfolio Whole Loan. The non-recourse carveout guarantors and borrower sponsors of the TLR Portfolio Whole Loan are Rudy Nassri and Vincent Chiara.
Rudy Nassri is the founder of the TLR Group. Mr. Nassri has over 25 years of experience in real estate and property management. Mr. Nassri commenced his career as a CPA and in 2001 started working in real estate and property management by working with private sector owners including, SLH Property Management, Groupe Mach, BMHL Equities, and LCN Property Management in the Canadian market. Vincent Chiara is the president of Groupe Mach. In 1999, Mr. Chiara turned his focus to property acquisition and development through his private holding company. Groupe Mach and its affiliates own more than 24 million square feet of real estate, including landmark Montreal properties such as the Stock Exchange Tower, CIBC Tower, Sun Life Building, CBC Tower and University Complex.
The Properties. The TLR Portfolio Properties are comprised of three garden style multifamily properties, two of which are located in Tampa, Florida and one of which is located in Clearwater, Florida. The TLR Portfolio Properties were constructed between 1970 and 1973. The TLR Portfolio Properties comprise 34 studio units (4.9% of unit count), 246 one-bedroom units (35.8% of unit count), 328 two-bedroom units (47.7% of unit count) and 80 three-bedroom units (11.6% of unit count). As of October 1, 2021, the TLR Portfolio Properties were 97.2% occupied.
Bahia Apartments
The Bahia Apartments property is a 320-unit garden multifamily property located in Tampa, Florida. Built in 1972, the Bahia Apartments property consists of 35, two-story residential buildings, a single-story leasing office and a single-story amenity building situated on a 18.27-acre site. The Bahia Apartments property’s unit mix includes 16 studio units, 80 one-bedroom/one-bathroom units, 121 two-bedroom/one-bathroom units, 71 two-bedroom/two-bathroom units and 32 three-bedroom/two-bathroom units, with an average unit size of 893 square feet. Common area amenities at the Bahia Apartments property include a fitness center, lighted tennis courts, picnic and barbecue area, two swimming pools, playground, dog park, on-site Amazon hub and a business center. Unit amenities include dishwashers, ceramic tile, central heat and air and patios or balconies. Since acquisition, the borrower sponsors have invested capital improvements of approximately $6.8 million or $21,194 per unit for interior renovations, common area renovations, painting, roof repairs, pool renovations and amenities renovations. Onsite parking is provided by 579 surface parking spaces, resulting in a parking ratio of approximately 1.8 spaces per unit. As of October 1, 2021, the Bahia Apartments property was 95.9% leased.
Royal Breeze Apartments
The Royal Breeze Apartments property is a 200-unit garden multifamily property located in Clearwater, Florida. Built in 1973, the Royal Breeze Apartments property consists of 25, two-story residential buildings, a single-story leasing office and a single-story amenity building situated on a 12.70-acre site. The Royal Breeze Apartments property’s unit mix includes 52 one-bedroom/one-bathroom units, 100 two-bedroom/one-bathroom units and 48 three-bedroom/two-bathroom units, with an average unit size of 1,021 square feet. Common area amenities at the Royal Breeze Apartments property include a fitness center, barbecue area, two swimming pools, playground, dog park, and a laundry facility. Unit amenities include an appliance package with microwave, laminate countertops, garbage disposal and washer and dryer connections for select two- and three-bedroom units. Since acquisition, the borrower sponsor have invested capital improvements of approximately $2.8 million or $14,120 per unit for interior renovations, common area
THE INFORMATION IN THIS STRUCTURAL AND COLLATERAL TERM SHEET IS NOT COMPLETE AND MAY BE AMENDED PRIOR TO THE TIME OF SALE. THIS TERM SHEET IS NOT AN OFFER TO SELL THESE SECURITIES AND IT IS NOT A SOLICITATION OF AN OFFER TO BUY THESE SECURITIES IN ANY JURISDICTION WHERE THE OFFER OR SALE IS NOT PERMITTED.
71
| Loan #4 | Cut-off Date Balance: | $35,000,000 | ||
| Multifamily – Garden | TLR Portfolio | Cut-off Date LTV: | 65.4% | |
| Property Addresses – Various | U/W NCF DSCR: | 1.78x | ||
| U/W NOI Debt Yield: | 7.4% |
renovations, painting, roof repairs, pool renovations and amenities renovations. Onsite parking is provided by 377 surface parking spaces, resulting in a parking ratio of approximately 1.9 spaces per unit. As of October 1, 2021, the Royal Breeze Apartments property was 99.5% leased.
Lenox Place Apartments
The Lenox Place Apartments property is a 168-unit garden multifamily property located in Tampa, Florida. Built in 1970, the Lenox Place Apartments property consists of two, two-story residential buildings and a single-story leasing office situated on a 5.24-acre site. The Lenox Place Apartments property’s unit mix includes 18 studio units, 114 one-bedroom/one-bathroom units and 36 two-bedroom/one-bathroom units, with an average unit size of 718 square feet. Common area amenities at the Lenox Place Apartments Property include a gated entry, two swimming pools, playground, and dog walk areas. Unit amenities include an appliance package with microwave, laminate countertops and garbage disposals. Since acquisition, the borrower sponsors have invested capital improvements of approximately $2.8 million or $17,229 per unit for interior renovations, common area renovations, painting, roof repairs, pool renovations and amenities renovations. Onsite parking is provided by 250 surface parking spaces, resulting in a parking ratio of approximately 1.5 spaces per unit. As of October 1, 2021, the Lenox Place Apartments Property was 97.0% leased.
The following table presents certain information relating to the TLR Portfolio Properties:
Portfolio Summary(1)
| Property | Year Built/ Renovated | Occ. %(2) | Units(2) | % of Total Units(2) | Appraised Value(3) | Allocated Cut-off Date Whole Loan Balance (“ALA”) | % of ALA | U/W NCF | % of U/W NCF |
| Bahia Apartments | 1972/2021 | 95.9% | 320 | 46.5% | $61,500,000 | $41,430,000 | 49.9% | $3,002,873 | 50.5% |
| Royal Breeze Apartments | 1973/2021 | 99.5% | 200 | 29.1% | $37,200,000 | $24,820,000 | 29.9% | $1,768,425 | 29.7% |
| Lenox Place Apartments | 1970/2021 | 97.0% | 168 | 24.4% | $24,800,000 | $16,750,000 | 20.2% | $1,180,532 | 19.8% |
| Total/Wtd. Avg. | 97.2% | 688 | 100.0% | $127,000,000 | $83,000,000 | 100.0% | $5,951,830 | 100.0% |
| (1) | Information obtained from the appraisals. |
| (2) | Information obtained from the underwritten rent rolls. |
| (3) | The Total Appraised Value represents the “As-Portfolio” value of $127,000,000, which includes a diversity premium based on an assumption that all of the mortgaged properties would be sold together as a portfolio. The aggregate “As-Is” appraised value for the TLR Portfolio Properties is $123,500,000. |
The following table presents certain information relating to the unit mix of the TLR Portfolio Properties:
Portfolio Unit Mix Summary(1)
| Property | NRA | Units | Studio, One Bath | One Bed, One Bath | Two Bed, One Bath | Two Bed, Two Bath | Three Bed, Two Bath |
| Bahia Apartments | 285,568 | 320 | 16 | 80 | 128 | 64 | 32 |
| Royal Breeze Apartments | 204,140 | 200 | 0 | 52 | 0 | 100 | 48 |
| Lenox Place Apartments | 120,600 | 168 | 18 | 114 | 0 | 36 | 0 |
| Total | 610,308 | 688 | 34 | 246 | 128 | 200 | 80 |
| (1) | Information obtained from the underwritten rent rolls. |
The following table presents historical occupancy percentages at the TLR Portfolio Properties:
Historical Occupancy
12/31/2017(1) | 12/31/2018(1) | 12/31/2019(1) | 12/31/2020(1) | 10/1/2021(2) |
| 98.0% | 97.9% | 95.2% | 97.0% | 97.2% |
| (1) | Information obtained from the borrower sponsors. |
| (2) | Information obtained from the underwritten rent rolls. |
COVID-19 Update. As of November 8, 2021, the TLR Portfolio Properties are open and operating. The TLR Portfolio Whole Loan is not subject to any modification or forbearance request. The first debt service payment of the TLR Portfolio Whole Loan is due January 6, 2022.
THE INFORMATION IN THIS STRUCTURAL AND COLLATERAL TERM SHEET IS NOT COMPLETE AND MAY BE AMENDED PRIOR TO THE TIME OF SALE. THIS TERM SHEET IS NOT AN OFFER TO SELL THESE SECURITIES AND IT IS NOT A SOLICITATION OF AN OFFER TO BUY THESE SECURITIES IN ANY JURISDICTION WHERE THE OFFER OR SALE IS NOT PERMITTED.
72
| Loan #4 | Cut-off Date Balance: | $35,000,000 | ||
| Multifamily – Garden | TLR Portfolio | Cut-off Date LTV: | 65.4% | |
| Property Addresses – Various | U/W NCF DSCR: | 1.78x | ||
| U/W NOI Debt Yield: | 7.4% |
Operating History and Underwritten Net Cash Flow. The following table presents certain information relating to the historical operating performance and underwritten net cash flow at the TLR Portfolio Properties:
Cash Flow Analysis
| 2019 | 2020 | TTM 9/30/2021 | U/W | %(1) | U/W $ per Unit | ||||||||
| Base Rent | $7,664,374 | $8,051,013 | $8,300,794 | $8,831,130 | 88.4% | $12,836 | |||||||
| Grossed Up Vacant Space | 0 | 0 | 0 | 0 | 0.0 | 0 | |||||||
| Gross Potential Rent | $7,664,374 | $8,051,013 | $8,300,794 | $8,831,130 | 88.4% | $12,836 | |||||||
| Other Income(2) | 858,907 | 843,899 | 1,067,345 | 1,155,000 | 11.6 | 1,679 | |||||||
| Net Rental Income | $8,523,281 | $8,894,912 | $9,368,140 | $9,986,130 | 100.0% | $14,515 | |||||||
| (Vacancy & Credit Loss) | (295,201) | (171,382) | (144,129) | (509,130)(3) | (5.8)(3) | (740) | |||||||
| Effective Gross Income | $8,228,080 | $8,723,530 | $9,224,011 | $9,477,000 | 94.9% | $13,775 | |||||||
| Real Estate Taxes | 772,408 | 843,077 | 885,100 | 883,279 | 9.3 | 1,284 | |||||||
| Insurance | 276,047 | 337,408 | 293,354 | 323,341 | 3.4 | 470 | |||||||
| Management Fee | 248,532 | 261,706 | 276,720 | 284,310 | 3.0 | 413 | |||||||
| Other Operating Expenses | 2,000,978 | 1,843,569 | 1,862,240 | 1,862,240 | 19.7 | 2,707 | |||||||
| Total Operating Expenses | $3,297,964 | $3,285,759 | $3,317,415 | $3,353,170 | 35.4% | $4,874 | |||||||
| Net Operating Income | $4,930,116 | $5,437,771 | $5,906,596 | $6,123,830 | 64.6% | $8,901 | |||||||
| Capital Expenditures | 0 | 0 | 0 | 172,000 | 1.8 | 250 | |||||||
| Net Cash Flow | $4,930,116 | $5,437,771 | $5,906,596 | $5,951,830 | 62.8% | $8,651 | |||||||
| NOI DSCR | 1.48x | 1.63x | 1.77x | 1.83x | |||||||||
| NCF DSCR | 1.48x | 1.63x | 1.77x | 1.78x | |||||||||
| NOI Debt Yield | 5.9% | 6.6% | 7.1% | 7.4% | |||||||||
| NCF Debt Yield | 5.9% | 6.6% | 7.1% | 7.2% |
| (1) | Represents (i) percent of Net Rental Income for all revenue fields, (ii) percent of Gross Potential Rent for Vacancy & Credit Loss and (iii) percent of Effective Gross Income for all other fields. |
| (2) | Other Income is comprised of application fees, laundry income, parking income, pet fees, late fees, utility reimbursement, miscellaneous income and various other fees. |
| (3) | The underwritten economic vacancy is 5.8%. The TLR Portfolio Properties were 97.2% physically occupied as of October 1, 2021. |
Appraisals. As of the appraisal valuation date of October 13, 2021, the TLR Portfolio Properties had an “as-portfolio” appraised value of $127,000,000 and an aggregate “as-is” appraised value of $123,500,000.
Environmental Matters. According to the Phase I environmental site assessments dated October 21, 2021 and October 25, 2021, there was no evidence of any recognized environmental conditions at the TLR Portfolio Properties.
Market Overview and Competition. The TLR Portfolio Properties are located in Tampa and Clearwater, Florida, within the Tampa-St Petersburg-Clearwater metropolitan statistical area (“Tampa MSA”). The Tampa MSA consists of Hernando, Hillsborough, Pasco and Pinellas counties. The Tampa MSA is the second most populous metropolitan area in Florida, the second most populous on the Gulf Coast, the fourth most populous in the southeast, and the 19th-largest MSA in the United States. Tampa Bay is Florida's largest open-water estuary, extending over 1031 square kilometers.
Tampa Bay offers year-round cultural, social, and sporting events. Some of these include professional baseball, football and hockey; ballet, golf, jazz and art festivals. Annual events specific to the area include the Outback Bowl, the Gasparilla Parade, Florida State Fair and the Honda Grand Prix. The Tampa MSA is also home to numerous professional sports alliances - the national football league’s Tampa Bay Buccaneers, national baseball association’s Tampa Bay Rays, the national hockey league’s Tampa Bay Lighting and New York Yankees’ Spring Training all call this region home. Also, the University of South Florida (Bulls) and University of Tampa (Spartans) provide numerous collegiate sports for the area.
The Tampa Central Business District is approximately 30 minutes east of the Gulf of Mexico, and approximately an hour southwest of Disney and Universal theme parks. In addition to the nearby beaches, other major attractions include: Busch Gardens and Adventure Island, Tampa Bay Performing Arts Center, Florida Aquarium, Lowry Park Zoo, International Plaza and Westshore Mall, and the downtown Tampa Channelside retail complex.
According to the appraisals, the Bahia Apartments and the Lenox Place Apartments are located within the University apartment submarket. As of the second quarter of 2021, the University multifamily submarket had an inventory of approximately 17,386 units, a
THE INFORMATION IN THIS STRUCTURAL AND COLLATERAL TERM SHEET IS NOT COMPLETE AND MAY BE AMENDED PRIOR TO THE TIME OF SALE. THIS TERM SHEET IS NOT AN OFFER TO SELL THESE SECURITIES AND IT IS NOT A SOLICITATION OF AN OFFER TO BUY THESE SECURITIES IN ANY JURISDICTION WHERE THE OFFER OR SALE IS NOT PERMITTED.
73
| Loan #4 | Cut-off Date Balance: | $35,000,000 | ||
| Multifamily – Garden | TLR Portfolio | Cut-off Date LTV: | 65.4% | |
| Property Addresses – Various | U/W NCF DSCR: | 1.78x | ||
| U/W NOI Debt Yield: | 7.4% |
vacancy rate of approximately 3.7% and effective rents of $1,123 per unit per month. As of the second quarter of 2021, the University multifamily submarket reported positive absorption of 31 units and no new construction.
According to the appraisal, the Royal Breeze Apartments are located within the Clearwater multifamily submarket. As of the second quarter of 2021, the Clearwater multifamily submarket had an inventory of approximately 24,777 units, a vacancy rate of approximately 3.0% and effective rents of $1,426 per unit per month. As of the second quarter of 2021, the Clearwater multifamily submarket reported positive absorption of 217 units and 479 units under construction.
The following table presents certain information relating to the appraisals’ market rent conclusion for the TLR Portfolio Properties:
Multifamily Market Rent Summary(1)
| Property | Units | Avg. Size (SF) | Avg. Monthly In-Place Rent per Unit | Avg. Monthly In-Place Rent PSF | Avg. Monthly Market Rent per Unit(2) | Avg. Monthly Market Rent PSF(2) |
| Bahia Apartments | 320 | 892 | $1,042 | $1.17 | $1,259 | $1.41 |
| Royal Breeze Apartments | 200 | 1,021 | $1,157 | $1.13 | $1,353 | $1.33 |
| Lenox Place Apartments | 168 | 718 | $899 | $1.25 | $1,113 | $1.55 |
| Total/Wtd. Avg. | 688 | 887 | $1,041 | $1.17 | $1,251 | $1.42 |
| (1) | Information obtained from the underwritten rent rolls. |
| (2) | Information obtained from the appraisals. |
Escrows.
Real Estate Taxes – The TLR Portfolio Whole Loan documents require an upfront real estate tax reserve of $77,287 and ongoing monthly tax reserves in an amount equal to one-twelfth of the real estate taxes that the lender estimates will be payable during the next 12 months (initially $77,287).
Insurance – The TLR Portfolio Whole Loan documents require an upfront insurance reserve of $282,923, and unless the TLR Portfolio maintains an acceptable blanket policy, ongoing monthly insurance reserves in an amount equal to one-twelfth of the insurance premiums due for the renewal of insurance coverage (initially $28,292).
Replacement Reserves – The TLR Portfolio Whole Loan documents require ongoing monthly replacement reserves of $14,333.
Holdback Reserve – The TLR Portfolio Whole Loan documents require a $2,500,000 upfront holdback reserve as additional security for the payment of sums past due under the TLR Portfolio Whole Loan notes and as additional security for all of the TLR Portfolio Borrower’s obligations under the TLR Portfolio Whole Loan documents. On each quarterly monthly payment date from and after the third monthly payment date, at the TLR Portfolio Borrower’s written request, the lender will calculate the Holdback Debt Yield (as defined below) for purposes of determining whether the Holdback Reserve Funds Release Conditions (as defined below) have been satisfied, and, if so, the lender will disburse the requested amount of holdback reserve funds to the TLR Portfolio Borrower (or, if a Trigger Period (as defined below) then exists, the lender will disburse the same into the lockbox account to be applied pursuant to the TLR Portfolio Whole Loan documents). The TLR Portfolio Borrower is entitled to disbursements of the holdback reserve funds no more than once in any three month period and in no amount less than $500,000 (unless the total amount of the holdback reserve funds remaining on deposit is less than $500,000). In the event the TLR Portfolio Borrower has not qualified for disbursement of all of the holdback reserve funds on or prior to November 9, 2023, then the lender will have the right to hold the holdback reserve funds thereafter as additional collateral for the TLR Portfolio Whole Loan.
The “Holdback Debt Yield” means, as of any calculation date, a ratio conveyed as a percentage in which, (i) the numerator is the holdback underwrittable cash flow and (ii) the denominator is the then outstanding principal balance of the TLR Portfolio Whole Loan, less the amount of any holdback reserve funds that will remain on deposit, if any, following the disbursement of the applicable amount of holdback reserve funds that have been requested by the TLR Portfolio Borrower.
The “Holdback Reserve Funds Release Conditions” means, as of the date the lender calculates the Holdback Debt Yield, (i) no event of default has occurred and is continuing and (ii) the lender has received evidence, in form and substance reasonably satisfactory to the lender, that the Holdback Debt Yield equals or exceeds 7.5%.
Lockbox and Cash Management. Upon the occurrence and continuance of a Trigger Period,the TLR Portfolio Borrower is required to establish a lender-controlled lockbox account and the TLR Portfolio Borrower is required to deposit, or cause the manager to deposit, all rents into the lockbox account. During the continuance of a Trigger Period, all funds in the lockbox account are required to be swept each business day to a lender-controlled cash management account and disbursed in accordance with the TLR Portfolio Whole Loan documents, and all excess funds on deposit in the cash management account (after payment of required monthly reserve deposits, the debt service payment on the TLR Portfolio Whole Loan, operating expenses and cash management bank fees) are required to be applied as follows: (a) if a Trigger Period has occurred and is continuing, to the lender-controlled excess cash flow account or (b) if no Trigger Period has occurred and is continuing, to the TLR Portfolio Borrower.
THE INFORMATION IN THIS STRUCTURAL AND COLLATERAL TERM SHEET IS NOT COMPLETE AND MAY BE AMENDED PRIOR TO THE TIME OF SALE. THIS TERM SHEET IS NOT AN OFFER TO SELL THESE SECURITIES AND IT IS NOT A SOLICITATION OF AN OFFER TO BUY THESE SECURITIES IN ANY JURISDICTION WHERE THE OFFER OR SALE IS NOT PERMITTED.
74
| Loan #4 | Cut-off Date Balance: | $35,000,000 | ||
| Multifamily – Garden | TLR Portfolio | Cut-off Date LTV: | 65.4% | |
| Property Addresses – Various | U/W NCF DSCR: | 1.78x | ||
| U/W NOI Debt Yield: | 7.4% |
A “Trigger Period” will commence upon the earlier of the following:
| (i) | the occurrence of an event of default; or |
| (ii) | the debt yield falling below 5.75%. |
A Trigger Period will end upon the occurrence of the following:
| ● | with regard to clause (i) above, the cure of such event of default; or |
| ● | with regard to clause (ii) above, (a) the date the debt yield is equal to or greater than 6.0% for two consecutive calendar quarters or (b) the satisfaction of the Trigger Period Avoidance Conditions (as defined below). |
The “Trigger Period Avoidance Conditions” will occur when (i) the TLR Portfolio Borrower deposits with the lender an amount equal to the amount of funds that if applied to the outstanding principal balance of the TLR Portfolio Whole Loan would cause the debt yield to be equal to or greater than 6.0% (the “Trigger Period Avoidance Deposit Amount”) and (ii) on or prior to each anniversary of the date the deposit describe in clause (i) was made, the TLR Portfolio Borrower deposits with lender into the same eligible account an amount of funds equal to Trigger Period Avoidance Deposit Amount (it being agreed that upon the expiration of all Trigger Periods then in existence, other than due to the satisfaction of the Trigger Period Avoidance Conditions, all such funds will be disbursed and returned to the TLR Portfolio Borrower).
Property Management. The TLR Portfolio Properties are managed by TLR Property Management Inc., an affiliate of the borrower sponsors.
Partial Release. At any time after the date that is two years from the closing date of the securitization that includes the last note to be securitized, the TLR Portfolio Borrower may obtain a release of an individual property from the lien of the mortgage, subject to satisfaction of certain conditions including, but not limited to (i) no event of default has occurred and is continuing, (ii) the amount of the TLR Portfolio Whole Loan defeased is equal to the greater of (a) 110% of the allocated loan amount for the related individual property being released and (b) the net sales proceeds applicable to such individual property, (iii) the debt service coverage ratio with respect to the remaining TLR Portfolio Properties after the release is not less than the greater of (a) the debt service coverage ratio for the remaining TLR Portfolio Properties and the TLR Portfolio Property to be released immediately prior to such release and (b) 1.80x, each calculated based on the trailing-6 months’ financials, (iv) the debt yield with respect to the remaining TLR Portfolio Properties after release is greater than the debt yield before the release calculated based on the trailing-6 months’ financials and (v) the lender receives a REMIC opinion.
Subordinate and Mezzanine Indebtedness. None.
Ground Lease. None.
Terrorism Insurance. The TLR Portfolio Whole Loan documents require that the “all risk” insurance policy required to be maintained by the TLR Portfolio Borrower provides coverage for terrorism in an amount equal to the full replacement cost of the TLR Portfolio Properties, as well as business interruption insurance covering no less than the 15-month period following the occurrence of a casualty event, together with a 6-month extended period of indemnity.
THE INFORMATION IN THIS STRUCTURAL AND COLLATERAL TERM SHEET IS NOT COMPLETE AND MAY BE AMENDED PRIOR TO THE TIME OF SALE. THIS TERM SHEET IS NOT AN OFFER TO SELL THESE SECURITIES AND IT IS NOT A SOLICITATION OF AN OFFER TO BUY THESE SECURITIES IN ANY JURISDICTION WHERE THE OFFER OR SALE IS NOT PERMITTED.
75
| Industrial – Various | Loan #5 | Cut-off Date Balance: | $33,313,851 | |
| Various Addresses | OmniMax Industrial Portfolio II | Cut-off Date LTV: | 66.6% | |
| U/W NCF DSCR: | 2.26x | |||
| U/W NOI Debt Yield: | 8.7% |
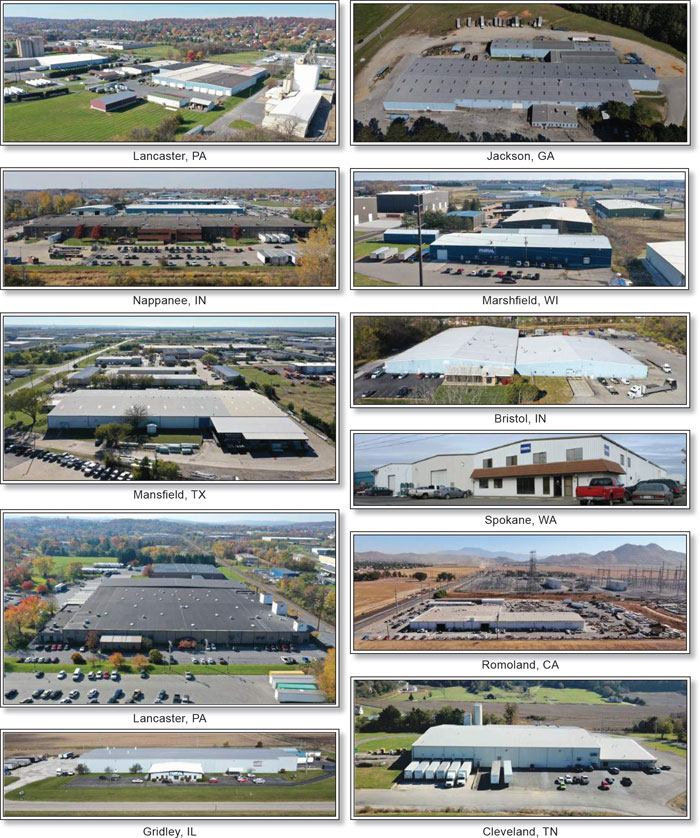
THE INFORMATION IN THIS STRUCTURAL AND COLLATERAL TERM SHEET IS NOT COMPLETE AND MAY BE AMENDED PRIOR TO THE TIME OF SALE. THIS TERM SHEET IS NOT AN OFFER TO SELL THESE SECURITIES AND IT IS NOT A SOLICITATION OF AN OFFER TO BUY THESE SECURITIES IN ANY JURISDICTION WHERE THE OFFER OR SALE IS NOT PERMITTED.
76
| Industrial – Various | Loan #5 | Cut-off Date Balance: | $33,313,851 | |
| Various Addresses | OmniMax Industrial Portfolio II | Cut-off Date LTV: | 66.6% | |
| U/W NCF DSCR: | 2.26x | |||
| U/W NOI Debt Yield: | 8.7% |
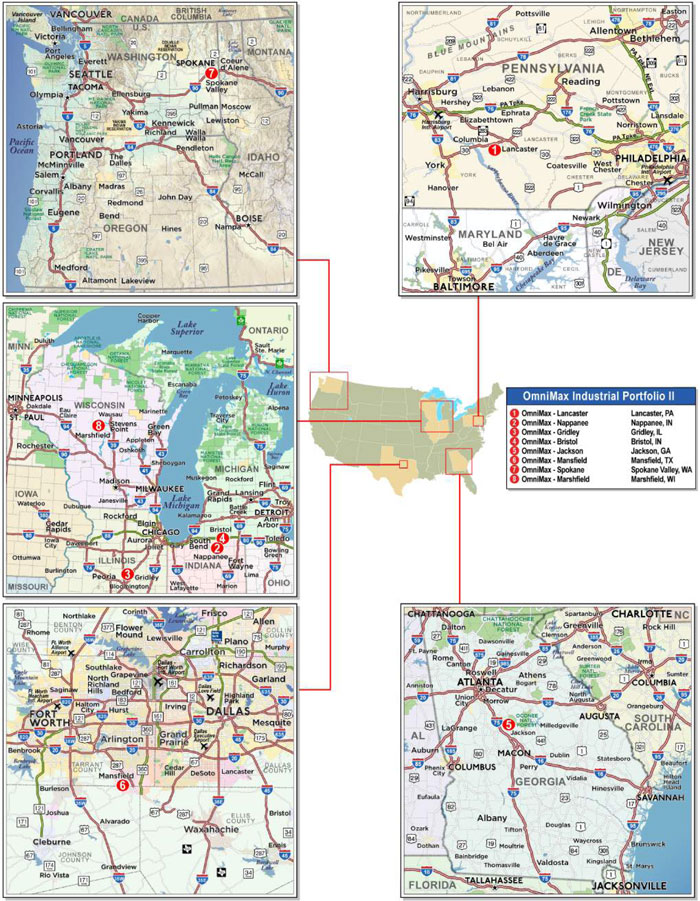
THE INFORMATION IN THIS STRUCTURAL AND COLLATERAL TERM SHEET IS NOT COMPLETE AND MAY BE AMENDED PRIOR TO THE TIME OF SALE. THIS TERM SHEET IS NOT AN OFFER TO SELL THESE SECURITIES AND IT IS NOT A SOLICITATION OF AN OFFER TO BUY THESE SECURITIES IN ANY JURISDICTION WHERE THE OFFER OR SALE IS NOT PERMITTED.
77
| No. 5 – OmniMax Industrial Portfolio II | |||||||
| Mortgage Loan Information | Mortgaged Property Information | ||||||
| Mortgage Loan Seller: | Column Financial, Inc. | Single Asset/Portfolio: | Portfolio | ||||
| Credit Assessment (Fitch/KBRA/Moody’s): | NR/NR/NR | Property Type – Subtype: | Industrial – Various | ||||
| Original Principal Balance: | $33,313,851 | Location: | Various | ||||
| Cut-off Date Balance: | $33,313,851 | Size: | 683,992 SF | ||||
| % of Initial Pool Balance: | 4.4% | Cut-off Date Balance Per SF: | $48.71 | ||||
| Loan Purpose: | Acquisition | Maturity Date Balance Per SF: | $48.71 | ||||
| Sponsor: | U.S. Realty Advisors, LLC | Year Built/Renovated: | Various/Various | ||||
| Guarantor: | USRA Net Lease IV Capital Corp. | Title Vesting: | Fee | ||||
| Mortgage Rate: | 3.7100% | Property Manager: | Self Managed | ||||
| Note Date: | April 28, 2021 | Current Occupancy (As of): | 100.0% (6/30/2021) | ||||
| Seasoning: | 7 months | YE 2020 Occupancy: | 100.0% | ||||
| Maturity Date: | May 6, 2026 | YE 2019 Occupancy: | 100.0% | ||||
| IO Period: | 60 months | YE 2018 Occupancy: | 100.0% | ||||
| Loan Term (Original): | 60 months | As-Is Appraised Value(1): | $50,050,000 | ||||
| Amortization Term (Original): | NAP | As-Is Appraised Value Per SF: | $73.17 | ||||
| Loan Amortization Type: | Interest Only | As-Is Appraisal Valuation Date: | Various | ||||
| Call Protection: | LO(31),D(24),O(5) | ||||||
| Lockbox Type | Hard/Springing Cash Management | Underwriting and Financial Information(1) | |||||
| Additional Debt: | None | TTM NOI (NAP): | NAV(2) | ||||
| Additional Debt Type (Balance): | NAP | YE 2020 NOI: | NAV(2) | ||||
| YE 2019 NOI: | NAV(2) | ||||||
| YE 2018 NOI: | NAV(2) | ||||||
| U/W Revenues: | $3,776,667 | ||||||
| U/W Expenses: | $874,688 | ||||||
| Escrows and Reserves | U/W NOI: | $2,901,979 | |||||
| Initial | Monthly | Cap | U/W NCF: | $2,833,580 | |||
| Taxes | $0 | Springing | NAP | U/W DSCR based on NOI/NCF: | 2.32x / 2.26x | ||
| Insurance | $0 | Springing | NAP | U/W Debt Yield based on NOI/NCF: | 8.7% / 8.5% | ||
| Replacement Reserve | $0 | Springing | NAP | U/W Debt Yield at Maturity based on NOI/NCF: | 8.7% / 8.5% | ||
| TI/LC Reserve | $0 | Springing | NAP | Cut-off Date LTV Ratio: | 66.6% | ||
| LTV Ratio at Maturity: | 66.6% | ||||||
| Sources and Uses | |||||
| Sources | Uses | ||||
| Mortgage Loan | $33,313,851 | 63.6% | Purchase Price | $51,252,081 | 97.8% |
| Sponsor Equity | $19,078,848 | 36.4 | Closing Costs | $1,140,618 | 2.2 |
| Total Sources | $52,392,699 | 100.0% | Total Uses | $52,392,699 | 100.0% |
| (1) | While the OmniMax Industrial Portfolio II (as defined below) was originated after the emergence of the novel coronavirus pandemic and the economic disruption resulting from measures to combat the pandemic, the pandemic is an evolving situation and could impact the OmniMax Industrial Portfolio II Mortgage Loan (as defined below) more severely than assumed in the underwriting of the OmniMax Industrial Portfolio II Mortgage Loan and could adversely affect the NOI, NCF and occupancy information, as well as the appraised value and the DSCR, LTV and Debt Yield metrics presented above. See “Risk Factors—Risks Related to Market Conditions and Other External Factors—Coronavirus Pandemic Has Adversely Affected the Global Economy and Will Likely Adversely Affect the Performance of the Mortgage Loans” in the Preliminary Prospectus. |
| (2) | The borrower sponsors recently acquired the OmniMax Industrial Portfolio II Properties (as defined below) in a sale-leaseback transaction on April 28, 2021. As such, historical cash flows are not available. |
THE INFORMATION IN THIS STRUCTURAL AND COLLATERAL TERM SHEET IS NOT COMPLETE AND MAY BE AMENDED PRIOR TO THE TIME OF SALE. THIS TERM SHEET IS NOT AN OFFER TO SELL THESE SECURITIES AND IT IS NOT A SOLICITATION OF AN OFFER TO BUY THESE SECURITIES IN ANY JURISDICTION WHERE THE OFFER OR SALE IS NOT PERMITTED.
78
| Industrial – Various | Loan #5 | Cut-off Date Balance: | $33,313,851 | |
| Various Addresses | OmniMax Industrial Portfolio II | Cut-off Date LTV: | 66.6% | |
| U/W NCF DSCR: | 2.26x | |||
| U/W NOI Debt Yield: | 8.7% |
The Mortgage Loan. The mortgage loan (the “OmniMax Industrial Portfolio II Mortgage Loan”) is evidenced by two pari-passu promissory notes to facilitate the sale-leaseback of a portfolio of eight industrial buildings (collectively the “OmniMax Industrial Portfolio II Properties”, the “Portfolio” or “Properties”). The Portfolio consists of the fee interests in eight single-tenant industrial buildings, totaling 683,992 SF, and located across seven states: Georgia (1), Illinois (1), Pennsylvania (1), Washington (1), Indiana (2), Texas (1), and Wisconsin (1).
The Borrowers and Borrower Sponsor. Max Comm Property LLC (the “Comm Borrower”) and Max Spec Property LLC (the “Spec Borrower”) (together the “Borrowers”) are subsidiaries of U.S. Realty Advisors LLC.
U.S. Realty Advisors LLC (“USRA” or the “OmniMax Industrial Portfolio II Sponsor”) is a single-tenant net lease real estate investor, manager, fund sponsor, and advisor. USRA was founded in 1989 by Richard Ader, who has acquired over $18 billion in net lease real estate. Mr. Ader continues to serve as CEO and Chief Investment Officer. USRA’s executive team has worked together for nearly three decades and has a combined 150 years of experience in corporate real estate transactions. The firm has over $2.7 billion of assets under management and owns or manages over 200 net leased properties across the United States.
The Portfolio. The OmniMax Industrial Portfolio II Properties include eight of OmniMax International, LLC’s North American
manufacturing facilities. The OmniMax Industrial Portfolio II Properties were sold to the OmniMax Industrial Portfolio II Borrower as a 20-year, triple-net, sale-leaseback transaction with rent under the lease of approximately $4.53 per square foot with allocated rental rates ranging from $3.40 per square foot to $6.25 per square foot. The lease agreement includes 3.0% annual rent increases beginning April 28, 2022 and ending April 28, 2031 and 2.5% annual rent increases beginning April 28, 2031 and thereafter (the “OmniMax Lease”). The OmniMax Lease also includes five, five-year extension options.
Portfolio Overview(1)
| Property/ Address | City/ State | Subtype | SF | Allocated Loan ($mm) | Appraised Value ($mm) | Appraised Value PSF ($) | Base Rent ($) | Base ($) |
| 3449 Hempland Road | Lancaster, PA | Warehouse | 121,569 | 8.320 | 12.500 | 102.82 | 747,649 | 6.15 |
| 26550 US Highway 6 | Nappanee, IN | Warehouse | 186,961 | 8.187 | 12.300 | 65.79 | 775,888 | 4.15 |
| Route 24 West, 17904 East 3100 North Road | Gridley, IL | Manufacturing | 93,307 | 3.994 | 6.000 | 64.30 | 387,224 | 4.15 |
| 206 Kesco Drive | Bristol, IN | Warehouse | 94,784 | 3.461 | 5.200 | 54.86 | 322,266 | 3.40 |
| 308 Alabama Boulevard | Jackson, GA | Manufacturing | 70,000 | 3.062 | 4.600 | 65.71 | 290,500 | 4.15 |
| 700 South 2nd Avenue | Mansfield, TX | Manufacturing | 55,782 | 2.796 | 4.200 | 75.29 | 251,019 | 4.50 |
| 6207 East Desmet Avenue | Spokane Valley, WA | Warehouse | 33,624 | 2.263 | 3.400 | 101.12 | 210,150 | 6.25 |
| 1820 East 26th Street | Marshfield, WI | Warehouse | 27,965 | 1.231 | 1.850 | 66.15 | 116,055 | 4.15 |
| Total | 683,992 | 33.314 | 50.050 | 73.17 | 3,100,751 | 4.53 | ||
(1) Information obtained from appraisals and underwritten rent roll.
Tenant. Founded in 1996, OmniMax is based in Atlanta, Georgia and has 26 manufacturing facilities across the United States and Canada with annual sales of approximately $750 million. OmniMax manufactures products for original equipment manufacturers, distributors, contractors, and home centers throughout North America. OmniMax operates through four main business segments, consumer, outdoor living, commercial, and specialty. OmniMax customers are located predominantly throughout North America and Europe and include distributors, contractors and home improvement retailers, as well as RV, transportation and other original equipment manufacturers. OmniMax has in-house manufacturing and distribution capabilities for more than 1,000 unique products utilizing aluminum, steel, copper, and vinyl through a multi-channel distribution network that serves customers across multiple end markets and geographies.
COVID-19 Update. As of November 6, 2021, the tenants at the OmniMax Industrial Portfolio II Properties are current on rent and have not missed any payments throughout the COVID-19 pandemic. The OmniMax Industrial Portfolio II Loan is not subject to any modification or forbearance requests. See “Risk Factors—Special Risks—Coronavirus Pandemic Has Adversely Affected the Global Economy and Will Likely Adversely Affect the Performance of the Mortgage Loans” in the Preliminary Prospectus.
THE INFORMATION IN THIS STRUCTURAL AND COLLATERAL TERM SHEET IS NOT COMPLETE AND MAY BE AMENDED PRIOR TO THE TIME OF SALE. THIS TERM SHEET IS NOT AN OFFER TO SELL THESE SECURITIES AND IT IS NOT A SOLICITATION OF AN OFFER TO BUY THESE SECURITIES IN ANY JURISDICTION WHERE THE OFFER OR SALE IS NOT PERMITTED.
79
| Industrial – Various | Loan #5 | Cut-off Date Balance: | $33,313,851 | |
| Various Addresses | OmniMax Industrial Portfolio II | Cut-off Date LTV: | 66.6% | |
| U/W NCF DSCR: | 2.26x | |||
| U/W NOI Debt Yield: | 8.7% |
The following table presents certain information relating to the tenancy at the OmniMax Industrial Portfolio II Properties:
Tenant Summary
| Tenant Name | Credit Rating (Moody’s/S&P/Fitch) | Tenant NRSF | % of NRSF | Annual U/W Base Rent PSF | Annual U/W Base Rent | % of Total Annual U/W Base Rent | Lease Expiration Date | Extension Options | Termination Option |
| OmniMax | NR/NR/NR | 683,992 | 100.0% | $4.53 | $3,100,751 | 100.0% | 3/31/2041 | 5, 5 year | N |
| Occupied Collateral Total | 683,992 | 100.0% | $4.53 | $3,100,751 | 100.0% | ||||
| Vacant Space | 0 | 0.0% | |||||||
| Collateral Total | 683,992 | 100.0% |
|
The following table presents certain information relating to the lease rollover schedule for OmniMax Industrial Portfolio II:
Lease Expiration Schedule(1)
| Year Ending December 31, | No. of Leases Expiring | Expiring NRSF | % of Total NRSF | Cumulative Expiring NRSF | Cumulative % of Total NRSF | Annual U/W Base Rent | % of Total Annual U/W Base Rent | Annual U/W Base Rent PSF |
| MTM | 0 | 0 | 0.0% | 0 | 0.0% | $0 | 0.0% | $0.00 |
| 2021 | 0 | 0 | 0.0% | 0 | 0.0% | $0 | 0.0% | $0.00 |
| 2022 | 0 | 0 | 0.0% | 0 | 0.0% | $0 | 0.0% | $0.00 |
| 2023 | 0 | 0 | 0.0% | 0 | 0.0% | $0 | 0.0% | $0.00 |
| 2024 | 0 | 0 | 0.0% | 0 | 0.0% | $0 | 0.0% | $0.00 |
| 2025 | 0 | 0 | 0.0% | 0 | 0.0% | $0 | 0.0% | $0.00 |
| 2026 | 0 | 0 | 0.0% | 0 | 0.0% | $0 | 0.0% | $0.00 |
| 2027 | 0 | 0 | 0.0% | 0 | 0.0% | $0 | 0.0% | $0.00 |
| 2028 | 0 | 0 | 0.0% | 0 | 0.0% | $0 | 0.0% | $0.00 |
| 2029 | 0 | 0 | 0.0% | 0 | 0.0% | $0 | 0.0% | $0.00 |
| 2030 | 0 | 0 | 0.0% | 0 | 0.0% | $0 | 0.0% | $0.00 |
| 2031 | 0 | 0 | 0.0% | 0 | 0.0% | $0 | 0.0% | $0.00 |
| Thereafter | 8 | 683,992 | 100.0% | 683,992 | 100.0% | $3,100,751 | 100.0% | $4.53 |
| Vacant | 0 | 0 | 0.0% | 683,992 | 100.0% | $0 | 0.0% | $0.00 |
| Total/Weighted Average | 8 | 683,992 | 100.00% | $3,100,751 | 100.00% | $4.53 |
(1) Information obtained from the underwritten rent roll.
The following table presents historical occupancy percentages for the OmniMax Industrial Portfolio II:
Historical Occupancy(1)
| 12/31/2018 | 12/31/2019 | 12/31/2020 | 6/30/2021(2) |
| 100.0% | 100.0% | 100.0% | 100.0% |
| (1) | Information obtained from the OmniMax Industrial Portfolio II Borrowers. |
| (2) | Information obtained from the rent roll dated 6/30/2021. |
THE INFORMATION IN THIS STRUCTURAL AND COLLATERAL TERM SHEET IS NOT COMPLETE AND MAY BE AMENDED PRIOR TO THE TIME OF SALE. THIS TERM SHEET IS NOT AN OFFER TO SELL THESE SECURITIES AND IT IS NOT A SOLICITATION OF AN OFFER TO BUY THESE SECURITIES IN ANY JURISDICTION WHERE THE OFFER OR SALE IS NOT PERMITTED.
80
| Industrial – Various | Loan #5 | Cut-off Date Balance: | $33,313,851 | |
| Various Addresses | OmniMax Industrial Portfolio II | Cut-off Date LTV: | 66.6% | |
| U/W NCF DSCR: | 2.26x | |||
| U/W NOI Debt Yield: | 8.7% |
Operating History and Underwritten Net Cash Flow. The following table presents certain information relating to the underwritten net cash flow for the OmniMax Industrial Portfolio II:
Cash Flow Analysis(1)
| UW(2) | UW%(3) | U/W $ Per SF | |
| In-place Base Rent | $3,100,751 | 78.0% | $4.53 |
| CAM / Other Reimbursements | 874,688 | 22.0 | 1.28 |
| Total Gross Income | $3,975,439 | 100.0% | $5.81 |
| Vacancy | (198,772) | -5.0 | (0.29) |
| Effective Gross Income | $3,776,667 | 95% | $5.52 |
| Management Fee | $75,533 | 2.0 | $0.11 |
| Repairs and Maintenance | 296,180 | 7.8 | 0.43 |
| Utilities | 38,668 | 1.0 | 0.06 |
| Real Estate Taxes | 369,976 | 9.8 | 0.54 |
| Insurance | 94,331 | 2.5 | 0.14 |
| Total Expenses | $874,688 | 23.2% | $1.28 |
| Net Operating Income | $2,901,979 | 76.8% | $4.24 |
| Tenant Improvements | $0 | 0.0 | 0.00 |
| Leasing Commissions | 0 | 0.0 | 0.00 |
| Replacement Reserves | 68,399 | 1.8 | 0.10 |
| Total Leasing and Capital Expenses | $68,399 | 1.8% | $0.10 |
| Net Cash Flow | $2,833,580 | 75.0% | $4.14 |
| NOI DSCR | 2.32x | ||
| NCF DSCR | 2.26x | ||
| NOI Debt Yield | 8.7% | ||
| NCF Debt Yield | 8.5% |
| (1) | The borrower sponsor recently acquired the Omnimax Industrial Portfolio II Properties in a sale-leaseback transaction on April 28, 2021. As such, historical cash flows are not available. |
| (2) | Rent steps taken through July 1, 2022. |
| (3) | Represents (i) percent of Total Gross Income for all revenue fields, (ii) percent of Total Gross Income for vacancy & credit loss and (iii) percent of Effective Gross Income for all other fields. |
Appraisal. As of various appraisal valuation dates, the OmniMax Industrial Portfolio II had an “as-is” appraised value of $50,050,000.
Environmental Matters. According to the Phase I environmental site assessments (dated between April 5, 2021 and April 28, 2021) there was no evidence of any recognized environmental conditions at the OmniMax Industrial Portfolio II Properties.
Market Overview and Competition. The OmniMax Industrial Portfolio II Properties are located throughout seven states, which consist of the following by sq. ft.: Indiana (41.2% of NRA; 35.4% of U/W Base Rent), Pennsylvania (17.8% of NRA; 24.1% of U/W Base Rent), Illinois (13.6% of NRA; 12.5% of U/W Base Rent), Georgia (10.2% of NRA; 9.4% of U/W Base Rent), Texas (8.6% of NRA; 8.1% of U/W Base Rent), Washington (4.9% of NRA; 6.8% of U/W Base Rent), Wisconsin (4.1% of NRA; 3.7% of U/W Base Rent)
Market Analysis
| Property | City, State | Market | Inventory (In Millions of SF) | Vacancy | Rent Per Sq. Ft. |
| OmniMax – Jackson | Jackson, GA | Atlanta | 563.3 | 6.20% | $4.42 |
| OmniMax – Gridley | Gridley, IL | Bloomington | 12.2 | 5.10% | $5.88 |
| OmniMax – Lancaster | Lancaster, PA | PA I-81 & I-78 | 306.6 | 7.90% | $5.06 |
| OmniMax – Spokane | Spokane Valley, WA | Spokane | 48.4 | 3.30% | $7.28 |
| OmniMax – Marshfield | Marshfield, WI | Wood County | 6.6 | 6.10% | $4.03 |
| OmniMax – Nappanee | Nappanee, IN | Elkhart | 76.2 | 1.00% | $3.53 |
| OmniMax – Bristol | Bristol, IN | Elkhart | 76.2 | 1.00% | $3.53 |
| OmniMax – Mansfield | Mansfield, TX | Dallas | 548.7 | 7.90% | $4.89 |
THE INFORMATION IN THIS STRUCTURAL AND COLLATERAL TERM SHEET IS NOT COMPLETE AND MAY BE AMENDED PRIOR TO THE TIME OF SALE. THIS TERM SHEET IS NOT AN OFFER TO SELL THESE SECURITIES AND IT IS NOT A SOLICITATION OF AN OFFER TO BUY THESE SECURITIES IN ANY JURISDICTION WHERE THE OFFER OR SALE IS NOT PERMITTED.
81
| Industrial – Various | Loan #5 | Cut-off Date Balance: | $33,313,851 | |
| Various Addresses | OmniMax Industrial Portfolio II | Cut-off Date LTV: | 66.6% | |
| U/W NCF DSCR: | 2.26x | |||
| U/W NOI Debt Yield: | 8.7% |
Escrows. Real Estate Taxes – The OmniMax Industrial Portfolio II Borrowers will be required to pay to the lender on each payment dateduring a Cash Sweep Event (as defined below) one-twelfth (1/12th) of the taxes and other charges that the lender estimates will be payable during the next ensuing twelve (12) months in order to accumulate sufficient funds with the lender to pay all such taxes and other charges at least thirty (30) days prior to their respective due dates.
Insurance – The OmniMax Industrial Portfolio II Borrowers will be required to pay to the lender on each payment date during a Cash Sweep Event one-twelfth (1/12th) of the insurance premiums that the lender reasonably estimates will be payable for the renewal of the coverage afforded by the policies upon the expiration thereof in order to accumulate sufficient funds with the lender to pay all such insurance premiums at least thirty (30) days prior to the expiration of the Policies.
Replacement Reserve – The OmniMax Industrial Portfolio II Borrowers will be required to pay to the lender on each payment date during a Cash Sweep Period Cash Sweep Event an amount equal to one-twelfth (1/12th) of $0.10 per rentable square foot for each Property, which is the amount estimated by the lender in its sole discretion to be due for replacements and repairs required to be made to the applicable Property during the calendar year.
Rollover Reserve – The OmniMax Industrial Portfolio II Borrowers will be required to pay to the lender on each payment date during a Cash Sweep Period Cash Sweep Event an amount equal to one-twelfth (1/12th) of $0.20 per rentable square foot for each Property, which is the amount reasonably estimated by the lender for tenant improvement and leasing commission obligations incurred following the date hereof.
Lockbox and Cash Management. The OmniMax Industrial Portfolio II Mortgage Loan is structured with a hard lockbox with springing cash management upon the occurrence of a Cash Sweep Event. At loan origination, the OmniMax Industrial Portfolio II Borrower was required to send direction letters to tenants instructing them to deposit all rents and payments into the lockbox account controlled by the lender. Upon the occurrence and during the continuance of a Cash Sweep Event, the lockbox bank is required to transfer to the cash management account in immediately available funds by federal wire transfer all amounts on deposit in the lockbox account once every business day throughout the continuance of a Cash Sweep Event in accordance with the terms of the lockbox agreement. Other than during the continuance of a Cash Sweep Event, the lockbox bank will transfer to the OmniMax Industrial Portfolio II Borrowers operating account all amounts on deposit in the lockbox account once every business day in accordance with the terms of the lockbox agreement. Upon the occurrence of a Cash Sweep Event Cure (as defined below) and so long as no event of default or other Cash Sweep Event is then existing, the lender is required to notify the lockbox bank of such Cash Sweep Event Cure and direct the lockbox bank to transfer, in immediately available funds by federal wire, all amounts on deposit in the lockbox account to the OmniMax Industrial Portfolio II operating account as set forth in the lockbox agreement.
A “Cash Sweep Event” means the occurrence of: (i) any event of default under the OmniMax Industrial Portfolio II Mortgage Loan documents, (ii) a Trigger Lease Termination Event (as defined below), (iii) a Trigger Lease Go Dark Event (as defined below), (iv) a Trigger Lease Bankruptcy Event (as defined below), (v) a Manager Bankruptcy Event (as defined below), or (vi) a Debt Yield Trigger Event (as defined below).
A “Cash Sweep Event Cure” means (a) if the Cash Sweep Event is caused by an event of default, the acceptance by the lender of a cure of such event of default (which cure the lender is not obligated to accept and may reject or accept in its sole and absolute discretion), (b) if the Cash Sweep Event is caused by the occurrence of a Debt Yield Trigger Event, the occurrence of a Debt Yield Trigger Cure (as defined below), (c) if the Cash Sweep Event is caused by a Trigger Lease Termination Event, the occurrence of a Trigger Lease Termination Cure (as defined below), (d) if the Cash Sweep Event is caused by a Trigger Lease Go Dark Event, the occurrence of a Trigger Lease Go Dark Cure (as defined below), (e) if the Cash Sweep Event is caused by a Trigger Lease Bankruptcy Event, the occurrence of a Trigger Lease Bankruptcy Cure (as defined below), (f) if the Cash Sweep Event is caused by a Manager Bankruptcy Event, the occurrence of a Manager Bankruptcy Cure (as defined below) or (g) if the Cash Sweep Event is caused by a Trigger Lease Default Event (as defined below), the occurrence of a Trigger Lease Default Cure (as defined below); provided, however, that, such Cash Sweep Event Cure set forth in this definition of “Cash Sweep Event Cure” will be subject to the following conditions: (i) no event of default has occurred and be continuing under the loan agreement or any of the other loan documents at such time and (ii) the OmniMax Industrial Portfolio II Borrowers will be required to have paid all of the lender’s out-of-pocket expenses reasonably incurred in connection with such Cash Sweep Event Cure, including reasonable attorneys’ fees and expenses.
A “Debt Yield Trigger Event” means a debt yield of less than 8.50% on any date of determination for the calendar quarter immediately preceding the date of such determination, based upon the trailing 12 month period immediately preceding such date of determination, as determined by the lender.
A “Debt Yield Trigger Cure” means achievement of a Debt Yield of 8.5% or higher for two (2) consecutive calendar quarters based upon the trailing twelve (12) month period ending as of the last day of the calendar quarter immediately preceding the date on which the Debt Yield is calculated, as reasonably determined by the lender.
A “Manager Bankruptcy Cure” means that (a) the OmniMax Industrial Portfolio II Borrower has replaced the applicable Manager with a qualified manager under a management agreement or (b) the trigger lease tenant self-manages the trigger lease premises that was managed by the Manager with respect to which the applicable Manager Bankruptcy Event occurred.
A “Manager Bankruptcy Event” means any Manager is the subject of a bankruptcy action that has not been discharged or dismissed within 90 days of the filing thereof.
THE INFORMATION IN THIS STRUCTURAL AND COLLATERAL TERM SHEET IS NOT COMPLETE AND MAY BE AMENDED PRIOR TO THE TIME OF SALE. THIS TERM SHEET IS NOT AN OFFER TO SELL THESE SECURITIES AND IT IS NOT A SOLICITATION OF AN OFFER TO BUY THESE SECURITIES IN ANY JURISDICTION WHERE THE OFFER OR SALE IS NOT PERMITTED.
82
| Industrial – Various | Loan #5 | Cut-off Date Balance: | $33,313,851 | |
| Various Addresses | OmniMax Industrial Portfolio II | Cut-off Date LTV: | 66.6% | |
| U/W NCF DSCR: | 2.26x | |||
| U/W NOI Debt Yield: | 8.7% |
“Trigger Lease” shall mean the OmniMax lease or any replacement Lease(s) occupying all or substantially all of the Trigger lease Premises, as such lease(s) may be amended, modified, restated, renewed, extended or assigned from time to time.
“Trigger Lease Tenant” means OmniMax Tenant or any other Tenant under a Trigger Lease, as applicable.
“Trigger Lease Premises” means the demised premises under a Trigger Lease.
“Trigger Lease Guarantor” means OmniMax International, LLC or an OmniMax replacement guarantor or any other guarantor of a Trigger Lease, as applicable.
A “Trigger Lease Termination Cure” means (a) a Trigger Lease Re-Tenanting Event has occurred or (b) if applicable, any written notice of termination or cancellation by Trigger Lease Tenant or the OmniMax Industrial Portfolio II Borrowers has been revoked prior to the termination or cancellation of the applicable trigger lease, as evidenced by an estoppel certificate in form and substance reasonably acceptable to the lender.
A “Trigger Lease Termination Event” means that the Trigger Lease has been terminated or cancelled or either the OmniMax Industrial Portfolio II Borrower or Trigger Lease Tenant have given written notice of its intent to cancel or terminate the Trigger Lease.
A “Trigger Lease Go Dark Cure” means (a) Trigger Lease Tenant recommences operations at all or a portion of the Trigger Lease Premises such that the conditions in clause (a) of the definition of “Trigger Lease Go Dark Event” no longer exist (or, if applicable, has revoked any notice to vacate, as evidenced by a tenant estoppel certificate in form and substance reasonably acceptable to the lender) or (b) Trigger Lease Tenant or Trigger Lease Guarantor is Investment Grade. A “Trigger Lease Go Dark Event” means (a) Trigger Lease Tenant vacates, surrenders or ceases to conduct its normal business operations (except for temporary closures for repairs, restoration, rehabilitation, alterations and/or customary force majeure events), in each such event, at more than 50% of the then trigger lease premises demised under all trigger leases and for more than 60 consecutive days, or has notified the OmniMax Industrial Portfolio II Borrower in writing of the intent to do any of the foregoing and (b) neither Trigger Lease Tenant nor trigger lease guarantor is Investment Grade.
A “Trigger Lease Re-Tenanting Event” means that (a) the Trigger Lease Premises has been leased by Borrower pursuant to one or more replacement Leases entered into in accordance with this Agreement, (b) all replacement tenants are in occupancy of all of the Trigger Lease Premises and paying full, unabated base rent under each such replacement Lease, (c) all required tenant improvements have been completed, all concessions have been satisfied and all applicable costs, expenses and leasing commissions with respect to each such replacement Lease have been paid and (d) each such replacement tenant shall have delivered a tenant estoppel certificate in form and substance reasonably acceptable to Lender.
A “Trigger Lease Bankruptcy Event” means Trigger Lease Tenant or Trigger Lease Guarantor files or becomes the subject of any Bankruptcy Action, or the assets of Trigger Lease Tenant or Trigger Lease Guarantor are made subject to the jurisdiction of a bankruptcy court in a Bankruptcy Action, in each case which has not been discharged or dismissed within ninety days of the filing thereof.
A “Trigger Lease Default Event” means that a monetary default exists under the Trigger Lease after ten days’ notice to Trigger Lease Tenant.
“Trigger Lease Bankruptcy Cure” means (a) the Trigger Lease (in the case of a Trigger Lease Bankruptcy Event with respect to Trigger Lease Tenant) or the guaranty of the Trigger Lease (in the case of a Trigger Lease Bankruptcy Event with respect to Trigger Lease Guarantor) is assumed without alteration of any material terms thereto (as ordered by the bankruptcy court), (b) the assets of Trigger Lease Tenant or Trigger Lease Guarantor, as applicable, are no longer subject to the jurisdiction of the bankruptcy court and the obligations of Trigger Lease Tenant or Trigger Lease Guarantor, as applicable, with respect to the Trigger Lease remain unaltered from the date on which Trigger Lease Tenant, Trigger Lease Guarantor, or the assets of either, became subject to the jurisdiction of the bankruptcy court or (c) a Trigger Lease Re-Tenanting Event shall have occurred.
Property Management. The Property will be managed by OmniMax as long as the OmniMax lease is in full force and effect or, if the OmniMax lease is terminated, one or more managers reasonably acceptable to the lender under property management agreements reasonably acceptable to the lender.
Partial Release. The OmniMax Industrial Portfolio II Borrowers have the right at any time after the permitted defeasance date and prior to the open period to obtain the release of a pool of individual mortgaged properties (each such pool a “Pool” or the “Released Property”) from the lien of the related mortgages provided, among other conditions, (i) the OmniMax Industrial Portfolio II Borrowers deliver defeasance collateral an amount equal to 120% of the allocated loan amount for the respective Pool to be released; (ii) the Released Property will either (a) be conveyed to a person other than the OmniMax Industrial Portfolio II Borrowers, the guarantor or their respective affiliates pursuant to a sale of such Released Property in an arm’s length transaction or (b) be conveyed to an affiliate of the OmniMax Industrial Portfolio II Borrowers (other than another borrower) provided that the lender receives an insolvency opinion, (iii) after giving effect to such release the debt yield with respect to the individual mortgaged properties remaining subject to the lien of the OmniMax Industrial Portfolio II Mortgage Loan is not less than the greater of (1) 9.30% and (2) the debt yield immediately preceding such release, and (iv) the REMIC release requirements are satisfied.
Real Estate Substitution. Not permitted.
THE INFORMATION IN THIS STRUCTURAL AND COLLATERAL TERM SHEET IS NOT COMPLETE AND MAY BE AMENDED PRIOR TO THE TIME OF SALE. THIS TERM SHEET IS NOT AN OFFER TO SELL THESE SECURITIES AND IT IS NOT A SOLICITATION OF AN OFFER TO BUY THESE SECURITIES IN ANY JURISDICTION WHERE THE OFFER OR SALE IS NOT PERMITTED.
83
| Industrial – Various | Loan #5 | Cut-off Date Balance: | $33,313,851 | |
| Various Addresses | OmniMax Industrial Portfolio II | Cut-off Date LTV: | 66.6% | |
| U/W NCF DSCR: | 2.26x | |||
| U/W NOI Debt Yield: | 8.7% |
Subordinate and Mezzanine Indebtedness. Not permitted.
Ground Lease. None.
Terrorism Insurance. The OmniMax Industrial Portfolio II Borrowers will be required to maintain and provide evidence of, property, casualty, liability, business interruption, windstorm, flood, earthquake and other applicable insurance in all cases with no exclusion for acts of terrorism (or, if there is an exclusion for acts of terrorism, the OmniMax Industrial Portfolio II Borrowers will obtain terrorism insurance provided same is available and maintained by institutional owners of comparable properties) in each case reasonably acceptable to the lender.
THE INFORMATION IN THIS STRUCTURAL AND COLLATERAL TERM SHEET IS NOT COMPLETE AND MAY BE AMENDED PRIOR TO THE TIME OF SALE. THIS TERM SHEET IS NOT AN OFFER TO SELL THESE SECURITIES AND IT IS NOT A SOLICITATION OF AN OFFER TO BUY THESE SECURITIES IN ANY JURISDICTION WHERE THE OFFER OR SALE IS NOT PERMITTED.
84
(THIS PAGE INTENTIONALLY LEFT BLANK)
THE INFORMATION IN THIS STRUCTURAL AND COLLATERAL TERM SHEET IS NOT COMPLETE AND MAY BE AMENDED PRIOR TO THE TIME OF SALE. THIS TERM SHEET IS NOT AN OFFER TO SELL THESE SECURITIES AND IT IS NOT A SOLICITATION OF AN OFFER TO BUY THESE SECURITIES IN ANY JURISDICTION WHERE THE OFFER OR SALE IS NOT PERMITTED.
85
| Mixed Use – Office/Retail | Loan #6 | Cut-off Date Balance: | $25,000,000 | |
| 980 Madison Avenue | 980 Madison | Cut-off Date LTV: | 27.6% | |
| New York, NY 10075 | U/W NCF DSCR: | 4.08x | ||
| U/W NOI Debt Yield: | 15.2% |

THE INFORMATION IN THIS STRUCTURAL AND COLLATERAL TERM SHEET IS NOT COMPLETE AND MAY BE AMENDED PRIOR TO THE TIME OF SALE. THIS TERM SHEET IS NOT AN OFFER TO SELL THESE SECURITIES AND IT IS NOT A SOLICITATION OF AN OFFER TO BUY THESE SECURITIES IN ANY JURISDICTION WHERE THE OFFER OR SALE IS NOT PERMITTED.
86
| Mixed Use – Office/Retail | Loan #6 | Cut-off Date Balance: | $25,000,000 | |
| 980 Madison Avenue | 980 Madison | Cut-off Date LTV: | 27.6% | |
| New York, NY 10075 | U/W NCF DSCR: | 4.08x | ||
| U/W NOI Debt Yield: | 15.2% |
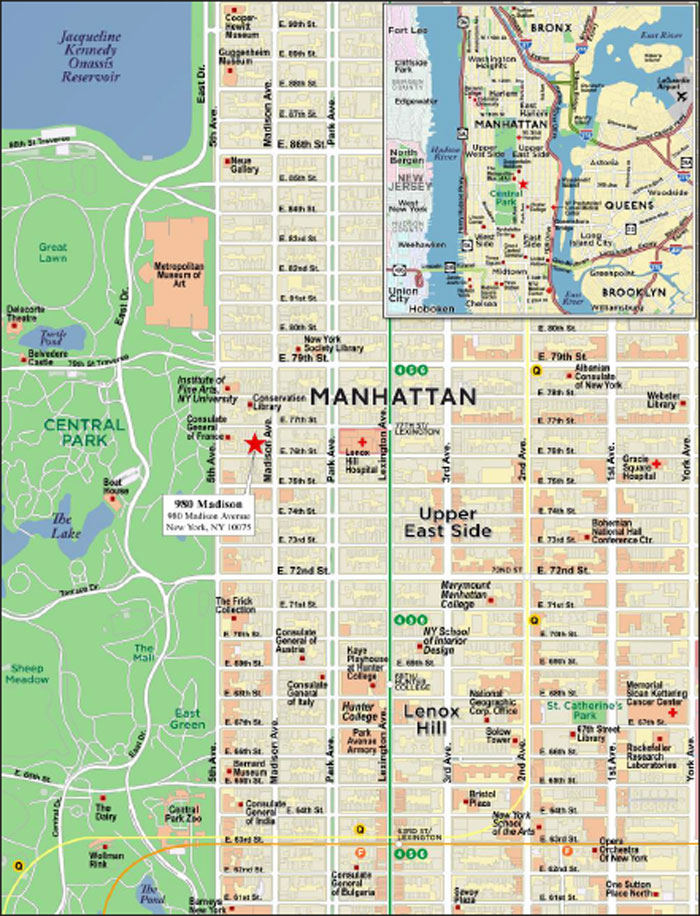
THE INFORMATION IN THIS STRUCTURAL AND COLLATERAL TERM SHEET IS NOT COMPLETE AND MAY BE AMENDED PRIOR TO THE TIME OF SALE. THIS TERM SHEET IS NOT AN OFFER TO SELL THESE SECURITIES AND IT IS NOT A SOLICITATION OF AN OFFER TO BUY THESE SECURITIES IN ANY JURISDICTION WHERE THE OFFER OR SALE IS NOT PERMITTED.
87
| No. 6 – 980 Madison | |||||||
| Mortgage Loan Information | Mortgaged Property Information | ||||||
| Mortgage Loan Seller: | Column Financial, Inc. | Single Asset/Portfolio: | Single Asset | ||||
| Credit Assessment (Fitch/KBRA/Moody’s): | AA-sf/AA-(sf)/A3(sf) | Property Type – Subtype: | Mixed-Use – Office/Retail | ||||
| Original Principal Balance(1): | $25,000,000 | Location: | New York, NY | ||||
| Cut-off Date Balance(1): | $25,000,000 | Size: | 134,843 SF | ||||
| % of Initial Pool Balance: | 3.3% | Cut-off Date Balance Per SF(1): | $715.65 | ||||
| Loan Purpose: | Refinance | Maturity Date Balance Per SF(1): | $715.65 | ||||
| Borrower Sponsor: | RFR Holding LLC | Year Built/Renovated: | 1949/1987, 2014 | ||||
| Guarantors: | Aby Rosen and Michael Fuchs | Title Vesting: | Fee | ||||
| Mortgage Rate: | 3.59946% | Property Manager: | RFR Realty LLC | ||||
| Note Date: | July 6, 2021 | Current Occupancy (As of)(2): | 93.0% (6/29/2021) | ||||
| Seasoning: | 5 months | YE 2020 Occupancy(2): | 98.4% | ||||
| Maturity Date: | July 6, 2026 | YE 2019 Occupancy(2): | 100.0% | ||||
| IO Period: | 60 months | YE 2018 Occupancy(2): | 96.9% | ||||
| Loan Term (Original): | 60 months | As-Is Appraised Value(2): | $350,000,000 | ||||
| Amortization Term (Original): | NAP | As-Is Appraised Value Per SF(2): | $2,595.61 | ||||
| Loan Amortization Type: | Interest Only | As-Is Appraisal Valuation Date: | May 7, 2021 | ||||
| Call Protection: | YM0.5(56),O(4) | ||||||
| Lockbox Type: | Soft/Springing Cash Management | Underwriting and Financial Information(1)(2) | |||||
| Additional Debt(2): | Yes | TTM NOI (5/31/2021): | $13,210,376 | ||||
| Additional Debt Type (Balance)(1): | Pari-Passu ($71,500,000) Subordinate ($101,100,000) Mezzanine ($40,000,000) | YE 2020 NOI: | $14,397,548 | ||||
| YE 2019 NOI: | $14,458,863 | ||||||
| YE 2018 NOI: | $14,069,119 | ||||||
| U/W Revenues: | $22,248,708 | ||||||
| U/W Expenses: | $7,572,110 | ||||||
| Escrows and Reserves | U/W NOI: | $14,676,598 | |||||
| Initial | Monthly | Cap | U/W NCF: | $14,379,941 | |||
| Unfunded Obligations | $1,915,068 | $0 | NAP | ||||
| Taxes | $0 | Springing | NAP | U/W DSCR based on NOI/NCF: | 4.17x / 4.08x | ||
| Insurance | $0 | Springing | NAP | U/W Debt Yield based on NOI/NCF: | 15.2% / 14.9% | ||
| Replacement Reserve | $0 | Springing | NAP | U/W Debt Yield at Maturity based on NOI/NCF: | 15.2% / 14.9% | ||
| Rollover Reserve | $0 | Springing | NAP | Cut-off Date LTV Ratio: | 27.6% | ||
| LTV Ratio at Maturity | 27.6% | ||||||
| Sources and Uses | ||||||||
| Sources | Uses | |||||||
| Senior Loan Amount | $96,500,000 | 40.6% | Loan Payoff | $229,750,906 | 96.7% | |||
| Subordinate Loan Amount | 101,100,000 | 42.6 | Closing Costs | 5,848,410 | 2.5 | |||
| Mezzanine Loan Amount | 40,000,000 | 16.8 | Reserves | 1,915,068 | 0.8 | |||
| Return of Equity | $85,615 | <0.1% | ||||||
| Total Sources | $237,600,000 | 100.0% | Total Uses | $237,600,000 | 100.0% | |||
| (1) | The 980 Madison Mortgage Loan is part of a larger split whole loan evidenced by two senior pari passu notes with an aggregate Cut-off Date balance of $96.5 million (collectively, the “980 Madison A Notes”) and one promissory note that is subordinate to the 980 Madison A Notes with a Cut-off Date balance of $101.1 million (the “980 Madison B Note”), together the “980 Madison Whole Loan.” The financial information presented in the chart above and herein reflects the balance of the 980 Madison A Notes. |
| (2) | While the 980 Madison Mortgage Loan (as defined below) was originated after the emergence of the novel coronavirus pandemic and the economic disruption resulting from measures to combat the pandemic, the pandemic is an evolving situation and could impact the 980 Madison Mortgage Loan more severely than assumed in the underwriting of the 980 Madison Mortgage Loan and could adversely affect the NOI, NCF and occupancy information, as well as the appraised value and the DSCR, LTV and Debt Yield metrics presented above. See “Risk Factors— Risks Related to Market Conditions and Other External Factors—Coronavirus Pandemic Has Adversely Affected the Global Economy and Will Likely Adversely Affect the Performance of the Mortgage Loans” in the Preliminary Prospectus. |
THE INFORMATION IN THIS STRUCTURAL AND COLLATERAL TERM SHEET IS NOT COMPLETE AND MAY BE AMENDED PRIOR TO THE TIME OF SALE. THIS TERM SHEET IS NOT AN OFFER TO SELL THESE SECURITIES AND IT IS NOT A SOLICITATION OF AN OFFER TO BUY THESE SECURITIES IN ANY JURISDICTION WHERE THE OFFER OR SALE IS NOT PERMITTED.
88
| Mixed Use – Office/Retail | Loan #6 | Cut-off Date Balance: | $25,000,000 | |
| 980 Madison Avenue | 980 Madison | Cut-off Date LTV: | 27.6% | |
| New York, NY 10075 | U/W NCF DSCR: | 4.08x | ||
| U/W NOI Debt Yield: | 15.2% |
The Mortgage Loan. The 980 Madison Mortgage Loan is part of a whole loan (the “980 Madison Whole Loan”) that is evidenced by two senior pari passu notes and one subordinate B note (the “980 Madison Subordinate Companion Loan”) with an aggregate original principal balance and outstanding principal balance as of the Cut-Off Date of $197,600,000. The 980 Madison Whole Loan is secured by a first mortgage encumbering the fee simple interest in a 134,843 SF Class A mixed-use building located one block from Central Park in New York City’s Upper East Side neighborhood (the “980 Madison Property”). The 980 Madison Whole Loan has a 5-year term and is interest-only for the term of the loan.
The non-controlling Note A-2 (the “980 Madison Mortgage Loan”) is being contributed to the WFCM 2021-C61 securitization trust. The 980 Madison Whole Loan is serviced under the CSMC 2021-980M trust and servicing agreement. The CSMC 2021-980M Commercial Mortgage Trust is entitled to exercise all of the rights of the controlling noteholder with respect to the 980 Madison Whole Loan; however, the holders of the remaining notes are entitled, under certain circumstances, to consult with respect to certain major decisions. See “Description of the Mortgage Pool—The Whole Loan—The Non-Serviced AB Whole Loans—The 980 Madison Whole Loan” in the Preliminary Prospectus.
Note Summary
| Notes | Original Principal Balance | Cut-off Date Balance | Note Holder | Controlling Interest |
| Note A-1 | $71,500,000 | $71,500,000 | CSMC 2021-980M | Y(1) |
| Note A-2 | 25,000,000 | 25,000,000 | WFCM 2021-C61 | N |
| Note B | 101,100,000 | 101,100,000 | CSMC 2021-980M | Y(1) |
| Total | $197,600,000 | $197,600,000 |
| (1) | Pursuant to the related co-lender agreement, the controlling holder is the CSMC 2021-980M Commercial Mortgage Trust. See “Description of the Mortgage Pool—The Whole Loans—The Non-Serviced AB Whole Loan—The 980 Madison Whole Loan” in the Preliminary Prospectus”. |
The Borrower and Borrower Sponsor. The borrower is 980 Madison Owner LLC, a recycled special-purpose bankruptcy-remote entity (the “980 Madison Borrower”), which owns the fee interest in the 980 Madison Property. The 980 Madison Borrower is required to have one (1) independent director. Legal counsel to the 980 Madison Borrower delivered a non-consolidation opinion in connection with the origination of the 980 Madison Whole Loan. The borrower sponsor of the 980 Madison Mortgage Loan is RFR Holding LLC (the “980 Madison Borrower Sponsor”). The non-recourse carve-out guarantors of the 980 Madison Whole Loan are Aby Rosen and Michael Fuchs (the “Guarantors”). The Guarantors are required to maintain at all times (i) an aggregate net worth (excluding the Guarantors’ interest in the 980 Madison Property) of not less than $200,000,000 and (ii) liquid assets of not less than $20,000,000 in the aggregate.
The Property. The 980 Madison Property is a Class A mixed-use building totaling 134,843 SF across six stories. The 980 Madison Property was originally built in 1949 (as headquarters to Park-Bernet) and was acquired in 2004 and then renovated by the 980 Madison Borrower in 2014 for $8 million ($59 PSF). The building features functional, rectangular floor plates. The 6th floor features two setbacks which are used as private terraces for the Gagosian Gallery, Inc. (“Gagosian Gallery”).
The 980 Madison Property is 93.0% leased as of June 29, 2021 to a mix of 17 tenants and has averaged 96% occupancy since 2009. Approximately 68.1% of the NRA has been in occupancy for at least 7 years and 44.7% of NRA has been in occupancy for at least 10 years. The largest tenant, Gagosian Gallery (41.8% of NRA, 33.0% of UW Rent) has been at the 980 Madison Property since 1989 and this location serves as its global headquarters. Gagosian Gallery has 16 locations worldwide. The tenant has extended its lease and expanded and renovated its premises multiple times over the past three decades, and most recently, reportedly invested approximately $5 million in 2019 to renovate their space on the fifth floor.
Approximately 58.0% of the occupied NRA is leased by art gallery tenants, 19.0% by traditional office tenants and 23.0% by retail tenants. The art gallery tenants located at the 980 Madison Property include Gagosian Gallery (56,331 SF), Yoshii Gallery (2,014 SF), Robiliant + Voena USA LTD. (1,272 SF), Dickinson Roundell Inc. (1,923 SF), Nahem Madison, LLC (2,112 SF), and JN Contemporary (8,752 SF). The office tenants located at the 980 Madison Property include Dontzin Nagy & Fleissig LLP (8,108 SF), Ramsfield Hospitality Finance (10,597 SF), Madison Clinical Services LLC (2,115 SF) and Hazen Polsky Foundation, Inc. (2,928 SF). The retail tenants include Artblock (8,161 SF; an affiliate of Gagosian Gallery), high-end designer clothing stores, such as Vince (3,770 F), Ramy Brook (3,830 SF), Rebecca Taylor (4,338 SF), Sandro (2,051 SF) and Veronica Beard (4,282 SF), as well as Douglas Elliman, LLC (2,838 SF).
The 980 Madison Property has approximately 204 feet of frontage along Madison Avenue, occupying an entire block between East 76th and 77th Streets, within the landmarked Upper East Side Historic District. The ground floor retail component features frontage along the entire block of Madison Avenue, with two of the retail tenants (Vince, LLC and Veronica Beard Madison Avenue LLC) that feature corner frontage. The retail and art galleries located at the 980 Madison Property cater to the surrounding affluent residential neighborhood, as well as guests from the three hotels that face the 980 Madison Property.
The building is situated one block east of Central Park, and is a 5-minute walk from 77th Street Subway Station (4 and 6 lines). The area is well connected by public transportation, with the 4, 5, 6, F lines and Q extension providing access to Times Square, Grand Central Terminal, the Fulton Center, and Bryant Park.
THE INFORMATION IN THIS STRUCTURAL AND COLLATERAL TERM SHEET IS NOT COMPLETE AND MAY BE AMENDED PRIOR TO THE TIME OF SALE. THIS TERM SHEET IS NOT AN OFFER TO SELL THESE SECURITIES AND IT IS NOT A SOLICITATION OF AN OFFER TO BUY THESE SECURITIES IN ANY JURISDICTION WHERE THE OFFER OR SALE IS NOT PERMITTED.
89
| Mixed Use – Office/Retail | Loan #6 | Cut-off Date Balance: | $25,000,000 | |
| 980 Madison Avenue | 980 Madison | Cut-off Date LTV: | 27.6% | |
| New York, NY 10075 | U/W NCF DSCR: | 4.08x | ||
| U/W NOI Debt Yield: | 15.2% |
The area is predominantly residential in nature and benefits from being located within one of the most densely populated residential neighborhoods of Manhattan. The major retailers in the immediate area are located along Madison Avenue while the smaller, local retailers are typically located along the side streets. Typical side street stores within the area are service oriented, local businesses such as restaurants, cafes, boutique stores and spas. A variety of retailers are establishing new storefronts on the Madison Avenue strip, including foreign luxury retailers that are seeking this corridor for their first stores in the United States.
COVID-19 Update. The 980 Madison Borrower executed four new commercial leases at the 980 Madison Property since the beginning of the pandemic in March 2020, encompassing of 16,909 SF (12.5% of NRA). The new tenants include Ramsfield Hospitality Finance II, LLC (“Ramsfield Hospitality Finance”) (10,597 SF), Hazen Polsky Foundation, Inc. (2,928 SF), Robilant + Voena USA LTD. (1,272 SF), and Nahem Madison, LLC (2,112 SF). In addition, two of the existing tenants, Gagosian Gallery and JN Contemporary Art LLC (“JN Contemporary”), have recently expanded into additional space. The 980 Madison Property reported collections of approximately 91% from April 2020 to the present, and only two retail tenants, SMCP 980 Madison, Inc and Ramy Prince Street LLC, have outstanding COVID rent abatement periods remaining. All outstanding free rent and rent abatements have been reserved in the Unfunded Obligations Reserve at loan origination and no deferred payback of rent has been underwritten.
Major Tenants. Largest Tenant by square feet: Gagosian Gallery (56,331 square feet; 41.8% of net rentable area; 33.0% underwritten base rent; April 2025 lease expiration) is a contemporary art dealer and the 980 Madison Property serves as the firm’s global headquarters.
2nd Largest Tenant by square feet: Ramsfield Hospitality Finance ll, LLC (10,597 square feet; 7.9% of net rentable area; 7.5% underwritten base rent; April 2025 lease expiration) is a hotel real estate lender, owner, and asset manager.
3rd Largest Tenant by square feet: JN Contemporary Art LLC (8,752 square feet; 6.5% of net rentable area; 6.3% underwritten base rent; April 2025 lease expiration) is used for a combination of gallery and office space.
The following table presents certain information relating to the tenancy at the 980 Madison Property:
Major Tenants(1)
| Tenant Name | Credit Rating (Moody’s/S&P/Fitch) | Tenant NRSF | % of NRSF | Annual U/W Base Rent PSF | Annual U/W Base Rent | % of Total Annual U/W Base Rent | Lease Expiration Date | Extension Options | Termination Option |
| Major Tenants | |||||||||
| Gagosian Gallery | NR/NR/NR | 56,331 | 41.8% | $116.51 | $6,562,911 | 33.0% | 4/30/2025 | N | N |
| Vince | NR/NR/NR | 3,770 | 2.8% | $397.88 | $1,500,000 | 7.5% | 1/31/2025 | N | N |
| Ramsfield Hospitality | NR/NR/NR | 10,597 | 7.9% | $140.00 | $1,483,580 | 7.5% | 4/30/2025 | N | N |
| Artblock | NR/NR/NR | 8,161 | 6.1% | $177.67 | $1,450,000 | 7.3% | 12/31/2022 | 1, 2-year | N |
| JN Contemporary Art | NR/NR/NR | 8,752 | 6.5% | $144.20 | $1,262,038 | 6.3% | 4/30/2025 | N | N |
| Total Major Tenants | 87,611 | 65.0% | $139.92 | $12,258,529 | 61.7% | ||||
| Non-Major Tenants | 37,811 | 28.0% | $201.61 | $7,623,184 | 38.3% | ||||
| Occupied Collateral Total | 125,422 | 93.0% | $158.52 | $19,881,713 | 100.0% | ||||
| Vacant Space | 9,421 | 7.0% | |||||||
| Collateral Total | 134,843 | 100.0% |
| (1) | Information obtained from the underwritten rent roll dated June 29, 2021. |
THE INFORMATION IN THIS STRUCTURAL AND COLLATERAL TERM SHEET IS NOT COMPLETE AND MAY BE AMENDED PRIOR TO THE TIME OF SALE. THIS TERM SHEET IS NOT AN OFFER TO SELL THESE SECURITIES AND IT IS NOT A SOLICITATION OF AN OFFER TO BUY THESE SECURITIES IN ANY JURISDICTION WHERE THE OFFER OR SALE IS NOT PERMITTED.
90
| Mixed Use – Office/Retail | Loan #6 | Cut-off Date Balance: | $25,000,000 | |
| 980 Madison Avenue | 980 Madison | Cut-off Date LTV: | 27.6% | |
| New York, NY 10075 | U/W NCF DSCR: | 4.08x | ||
| U/W NOI Debt Yield: | 15.2% |
The following table presents certain information relating to the lease rollover schedule at the 980 Madison Property:
Lease Expiration Schedule(1)(2)
| Year Ending December 31, | No. of Leases Expiring | Expiring NRSF | % of Total NRSF | Cumulative Expiring NRSF | Cumulative % of Total NRSF | Annual U/W Base Rent | % of Total Annual U/W Base Rent | Annual U/W Base Rent PSF |
| MTM | 0 | 0 | 0.0% | 0 | 0.0% | $0 | 0.0% | $0.00 |
| 2021 | 1 | 2,014 | 1.5% | 2,014 | 1.5% | $234,465 | 1.2% | $116.42 |
| 2022 | 3 | 12,327 | 9.1% | 14,341 | 10.6% | $2,662,841 | 13.4% | $216.02 |
| 2023 | 5 | 20,330 | 15.1% | 34,671 | 25.7% | $4,253,447 | 21.4% | $209.22 |
| 2024 | 0 | 0 | 0.0% | 34,671 | 25.7% | $0 | 0.0% | $0.00 |
| 2025 | 11 | 90,751 | 67.3% | 125,422 | 93.0% | $12,730,960 | 64.0% | $140.28 |
| Thereafter | 0 | 0 | 0.0% | 125,422 | 93.0% | $0 | 0.0% | $0.00 |
| Vacant | 0 | 9,421 | 7.0% | 134,843 | 100.0% | $0 | 0.0% | $0.00 |
| Total/Weighted Average | 20 | 134,843 | 100.00% | $19,881,713 | 100.00% | $158.52(3) |
| (1) | Information obtained from the underwritten rent roll dated June 29, 2021. |
| (2) | Certain tenants may have lease termination options that are exercisable prior to the originally stated expiration date of the subject lease and that are not considered in the Lease Expiration Schedule. |
| (3) | Weighted Average Annual U/W Base Rent PSF excludes vacant space. |
The following table presents historical occupancy percentages at the 980 Madison Property:
Historical Occupancy
12/31/2018(1) | 12/31/2019(1) | 12/31/2020(1) | 6/29/2021(2) |
| 96.9% | 100.0% | 98.4% | 93.0% |
| (1) | Information obtained from the 980 Madison Borrower. |
| (2) | Information obtained from the underwritten rent roll dated June 29, 2021. |
THE INFORMATION IN THIS STRUCTURAL AND COLLATERAL TERM SHEET IS NOT COMPLETE AND MAY BE AMENDED PRIOR TO THE TIME OF SALE. THIS TERM SHEET IS NOT AN OFFER TO SELL THESE SECURITIES AND IT IS NOT A SOLICITATION OF AN OFFER TO BUY THESE SECURITIES IN ANY JURISDICTION WHERE THE OFFER OR SALE IS NOT PERMITTED.
91
| Mixed Use – Office/Retail | Loan #6 | Cut-off Date Balance: | $25,000,000 | |
| 980 Madison Avenue | 980 Madison | Cut-off Date LTV: | 27.6% | |
| New York, NY 10075 | U/W NCF DSCR: | 4.08x | ||
| U/W NOI Debt Yield: | 15.2% |
Operating History and Underwritten Net Cash Flow. The following table presents certain information relating to the underwritten net cash flow at the 980 Madison Property:
Cash Flow Analysis
| 2018 | 2019 | 2020 | 5/31/2021 TTM | U/W(1) | %(2) | U/W $ PSF | |
| Base Rental Income | $18,794,324 | $19,669,711 | $20,032,701 | $19,934,314 | $19,469,609 | 82.3% | $144.39 |
| Rent Steps | 0 | 0 | 0 | 0 | 412,103 | 1.7 | 3.06 |
| Grossed Up Vacant Space | 0 | 0 | 0 | 0 | 1,413,150 | 6.0 | 10.48 |
| Gross Potential Rent | $18,794,324 | $19,669,711 | $20,032,701 | $19,934,314 | $21,294,863 | 90.0% | $157.92 |
| Other Income(3) | 107,103 | 185,098 | 323,863 | 172,385 | 172,385 | 0.7 | 1.28 |
| Recoveries | 2,172,560 | 2,677,370 | 3,206,618 | 3,359,507 | 2,194,610 | 9.3 | 16.28 |
| Net Rental Income | $21,073,987 | $22,532,179 | $23,563,183 | $23,466,206 | $23,661,858 | 100.0% | $175.48 |
| (Vacancy & Credit Loss)(4) | (8,784) | (454,062) | (1,412,280) | (2,138,295) | (1,413,150) | (6.6) | (10.48) |
| Effective Gross Income | $21,065,203 | $22,078,117 | 22,150,903 | $21,327,911 | $22,248,708 | 94.0% | 165.00 |
| Taxes | 4,355,117 | 4,927,218 | 5,450,293 | 5,692,202 | 4,932,089 | 22.2 | 36.58 |
| Insurance | 63,939 | 77,082 | 86,535 | 88,709 | 85,000 | 0.4 | 0.63 |
| Other Operating Expenses | 2,577,029 | 2,614,954 | 2,216,528 | 2,336,623 | 2,555,022 | 11.5 | 18.95 |
| Total Operating Expenses | $6,996,085 | $7,619,254 | $7,753,355 | $8,117,535 | $7,572,110 | 34.0% | $56.16 |
| Net Operating Income | $14,069,119 | $14,458,863 | $14,397,548 | $13,210,376 | $14,676,598 | 66.0% | $108.84 |
| TI/LC | 0 | 0 | 0 | 0 | 269,688 | 1.2 | 2.00 |
| Capital Expenditures | 0 | 0 | 0 | 0 | 26,969 | 0.1 | 0.20 |
| Net Cash Flow | $14,069,119 | $14,458,863 | $14,397,548 | $13,210,376 | $14,379,941 | 64.6% | $106.64 |
| NOI DSCR(5) | 3.99x | 4.11x | 4.09x | 3.75x | 4.17x | ||
| NCF DSCR(5) | 3.99x | 4.11x | 4.09x | 3.75x | 4.08x | ||
| NOI Debt Yield(5) | 14.6% | 15.0% | 14.9% | 13.7% | 15.2% | ||
| NCF Debt Yield(5) | 14.6% | 15.0% | 14.9% | 13.7% | 14.9% |
| (1) | Rent Steps taken through July 1, 2022. |
| (2) | Represents (i) percent of Net Rental Income for all revenue fields, (ii) percent of Gross Potential Rent for Vacancy & Credit Loss and (iii) percent of Effective Gross Income for all other fields. |
| (3) | Other Income UW to TTM as of May 2021, which includes late fees, miscellaneous income, over-time HVAC and other operating recoveries. Deferred rent repayments, forfeited security deposits and interest income have been adjusted out of the historical cash flows. |
| (4) | Vacancy underwritten to actual economic vacancy of 6.6%. |
| (5) | Ratios are based on the 980 Madison A Notes. |
Appraisal. As of the appraisal valuation date of May 7, 2021, the 980 Madison Property had an “as-is” appraised value of $350,000,000.
Environmental Matters. According to a Phase I environmental site assessment dated May 24, 2021, there was no evidence of a recognized environmental condition at the 980 Madison Property. Due to the age of the 980 Madison Property, there is a potential that ACM are present. Readily visible suspect ACMs were observed to be in good condition. Operations and Maintenance (O&M) Programs are required to be implemented in order to safely manage the suspect ACMs located at the 980 Madison Property.
Market Overview and Competition. The 980 Madison Property is located in the Upper East Side, on the west side of Madison Avenue between East 76th and 77th Streets. The building sits one block east of Central Park, and is a 5-minute walk from 77th Street Subway Station (4 and 6 lines). The area is well connected by public transportation, with the 4, 5, 6, F lines and Q extension providing quick access to Times Square, Grand Central Terminal, the Fulton Center, and Bryant Park. Plans for Phase II of the Second Avenue subway expansion are under way and will connect the Harlem-125th Street station to Hanover Square in Lower Manhattan directly through the Upper East Side.
The area is predominantly residential in nature and benefits from being located within one of the most densely populated residential neighborhoods of Manhattan. The major retailers in the immediate area are located along the Avenues, while the smaller, local retailers are typically located along the side streets. Typical side street stores within the area are service oriented, local businesses such as one-off restaurants, cafes, boutique stores and spas. A variety of retailers are establishing new storefronts on this strip.
New York’s Upper East Side extends from 59th Street at the northern edge of Midtown to 86th Street, where the submarket meets the borders of East Harlem. The neighborhood is also bounded by Fifth Avenue and Central Park to the west and the East River to the east. The Upper East Side is one of the most affluent areas in New York City and incorporates neighborhoods such as Lenox Hill, Carnegie Hill, and Yorkville. Today, the area is home to nearly 220,000 New Yorkers with a median household income of more than $134,200. The Upper East Side is also host to an educated population with 83% of adult residents holding a college degree or higher, compared to 64% of Manhattan residents and 43% of New Yorkers overall.
The Upper East Side Historic District was designated as a city district in 1981 and listed on the National Register of Historic Places in 1984. The city district runs from 59th to 78th Streets along Fifth Avenue, and as far east as Third Avenue at some points. It is composed of residential structures built after the American Civil War; mansions and townhouses built at the beginning of the 20th century; and apartment buildings erected later on. The city district was slightly expanded in 2010 to include an additional 74 buildings. The area is
THE INFORMATION IN THIS STRUCTURAL AND COLLATERAL TERM SHEET IS NOT COMPLETE AND MAY BE AMENDED PRIOR TO THE TIME OF SALE. THIS TERM SHEET IS NOT AN OFFER TO SELL THESE SECURITIES AND IT IS NOT A SOLICITATION OF AN OFFER TO BUY THESE SECURITIES IN ANY JURISDICTION WHERE THE OFFER OR SALE IS NOT PERMITTED.
92
| Mixed Use – Office/Retail | Loan #6 | Cut-off Date Balance: | $25,000,000 | |
| 980 Madison Avenue | 980 Madison | Cut-off Date LTV: | 27.6% | |
| New York, NY 10075 | U/W NCF DSCR: | 4.08x | ||
| U/W NOI Debt Yield: | 15.2% |
also home to the famous Museum Mile which contains one of the densest displays of culture in the world, including museums such as the Metropolitan Museum of Art, the Guggenheim and the Frick Collection.
Submarket Information – According to the appraisal, the 980 Madison Property is situated in the Upper East Side Office submarket, which contained approximately 2.58 million square feet of office space as of the first quarter of 2021. The Upper East Side Office submarket reported an average vacancy rate of 2.5% with an average asking rental rate of $68.96 per square foot.
According to a third-party market report, the 980 Madison Property is situated in the Upper East Side office submarket. For the four quarters ending in Q1 2021, the submarket’s asking rent was $68.96 per square foot, 26.9% higher than Manhattan’s asking rent of $54.36.
Over the last 12 months, submarket absorption totaled 410 square feet, as compared to the average annual absorption rate of -38,746 square feet recorded since the beginning of 2019. The submarket’s average vacancy rate was 2.50% for the trailing four quarters ending in Q1 2021, 78% lower than Manhattan’s office vacancy rate of 11.30% in the same period.
Appraiser’s Comp Set – The appraiser identified ten comparable office properties within the 980 Madison Property’s immediate market area. The appraiser concluded a market rent of $150.00 per square foot for the 980 Madison Property’s office spaces. The appraiser identified seven comparable retail properties within the 980 Madison Property’s immediate market area. The appraiser concluded a market rent of $450.00 per square foot for the subject 980 Madison Property’s corner ground retail spaces and $600.00 per square foot for the subject property’s in-line ground floor space.
THE INFORMATION IN THIS STRUCTURAL AND COLLATERAL TERM SHEET IS NOT COMPLETE AND MAY BE AMENDED PRIOR TO THE TIME OF SALE. THIS TERM SHEET IS NOT AN OFFER TO SELL THESE SECURITIES AND IT IS NOT A SOLICITATION OF AN OFFER TO BUY THESE SECURITIES IN ANY JURISDICTION WHERE THE OFFER OR SALE IS NOT PERMITTED.
93
| Mixed Use – Office/Retail | Loan #6 | Cut-off Date Balance: | $25,000,000 | |
| 980 Madison Avenue | 980 Madison | Cut-off Date LTV: | 27.6% | |
| New York, NY 10075 | U/W NCF DSCR: | 4.08x | ||
| U/W NOI Debt Yield: | 15.2% |
The following tables present certain information relating to the appraiser’s market rent conclusion for the 980 Madison Property:
Art Gallery Rent Comps(1)
| Property Name | Gallery Tenant | Floor/Suite | SF | Lease Type | Lease Term | Base Rent PSF |
| 980 Madison | Various | Various | MG | $121 | ||
| 730 Fifth Avenue | Helen Yarmak Art Gallery | P2 | 3,127 | MG | 10 Years | $206.00 |
| 730 Fifth Avenue | David Benrimon Fine Art | P3 | 5,000 | MG | 10 Years | $212.00 |
| 540 West 25th Street | The Pace Gallery | Entire Building | 74,563 | Gross | 20 Years | $138.64 |
| 531 West 25th Street | Bernaducci Gallery | Grade | 3,149 | MG | 10 Years | $80.00 |
| Average/Wtd Average | 21,460 | $143.22 | ||||
| (1) | Information obtained from appraisal report dated June 30, 2021. |
Office Rent Comps(1)
| Property Name | Office Tenant | Floor/Suite | SF | Lease Type | Lease Term | Base Rent PSF |
| 980 Madison | Various | Various | MG | $127 | ||
| 425 Park Avenue | Hellman & Friedman | E 30-31 | 27,800 | MG | 15 Years | $150.00 |
| 510 Madison Avenue | Declaration Partners | E 20 | 11,500 | MG | 5 Years | $132.50 |
| 712 Fifth Avenue | TSG Consumer Partners | E 35 | 9,804 | MG | 10 Years | $136.50 |
| 65 East 55th Street | RWN Management | E 31 | 15,227 | MG | 11 Years | $140.00 |
| 650 Madison Avenue | Spring Mountain Capital | E 20 | 12,861 | MG | 10 Years | $105.00 |
| Average/Wtd Average | 15,438 | $136.21 | ||||
| (1) | Information obtained from appraisal report dated June 30, 2021. |
Retail Rent Comps(1)
| Property Name | Retail Tenant | Floor/Suite | SF | Lease Type | Lease Term | Base Rent PSF |
| 980 Madison | Various | Ground Floor/Lower Level | MG | $275 | ||
| 689 Madison Avenue | Brunello Cucinelli | Ground Floor/Lower Level | 4,683 | MG | 8 Years | $552.15 |
| 675 Madison Avenue | Agent Provocateur | Ground Floor/2nd Floor | 2,700 | MG | 10 Years | $386.67 |
| 900 Madison Avenue | Frame Denim | Ground Floor/Lower Level | 3,417 | MG | 10 Years | $305.34 |
| 987 Madison Avenue | Orlebar Brown | Ground Floor | 414 | MG | 10 Years | $600.00 |
| 812 Madison Avenue | Oliver Peoples | Ground Floor | 1,150 | MG | 10 Years | $538.04 |
| 818 Madison Avenue | Monique Lhuillier | Ground Floor/Lower Level/2nd Floor | 4,265 | MG | 10 Years | $234.47 |
| 814 Madison Avenue | Mackage | Ground Floor/Lower Level | 3,963 | MG | 3 Years | $378.50 |
| Average/Wtd Average | 2,942 | $390.45 | ||||
| (1) | Information obtained from appraisal report dated June 30, 2021. |
THE INFORMATION IN THIS STRUCTURAL AND COLLATERAL TERM SHEET IS NOT COMPLETE AND MAY BE AMENDED PRIOR TO THE TIME OF SALE. THIS TERM SHEET IS NOT AN OFFER TO SELL THESE SECURITIES AND IT IS NOT A SOLICITATION OF AN OFFER TO BUY THESE SECURITIES IN ANY JURISDICTION WHERE THE OFFER OR SALE IS NOT PERMITTED.
94
| Mixed Use – Office/Retail | Loan #6 | Cut-off Date Balance: | $25,000,000 | |
| 980 Madison Avenue | 980 Madison | Cut-off Date LTV: | 27.6% | |
| New York, NY 10075 | U/W NCF DSCR: | 4.08x | ||
| U/W NOI Debt Yield: | 15.2% |
Comparable Property Sales(1)
| Property Name | Location | Rentable Area (SF) | Sale Date | Sale Price | Sale Price PSF |
| 860 Washington Street | New York, NY | 115,173 | Dec-20 | $232,000,000 | $2,014.36 |
| 424 Fifth Broadway | New York, NY | 680,493 | Mar-20 | $1,289,501,065 | $1,894.95 |
| 530-536 Broadway | New York, NY | 198,700 | Mar-20 | $382,000,000 | $1,922.50 |
| 434 Broadway | New York, NY | 61,882 | Jan-20 | $103,500,000 | $1,672.54 |
| 589 Fifth Avenue | New York, NY | 183,646 | Oct-19 | $355,250,000 | $1,934.43 |
| 711 Fifth Avenue | New York, NY | 354,361 | Sep-19 | $955,000,000 | $2,694.99 |
| 640 Fifth Plaza | New York, NY | 315,886 | Apr-19 | $975,000,000 | $3,086.56 |
| (1) | Information obtained from the appraisal. |
Escrows.
Real Estate Taxes – The 980 Madison Mortgage Loan documents require during a Trigger Period (as defined below) an ongoing monthly real estate tax reserves in an amount equal to one-twelfth of the real estate taxes that the lender estimates will be payable during the next twelve months.
Insurance – The 980 Madison Mortgage Loan documents require that on each payment date after the occurrence and during the continuance of a Trigger Period, the 980 Madison Borrower must deposit 1/12th of the amount sufficient to pay all insurance premiums prior to their due date, provided the 980 Madison Property is not covered by a blanket policy.
Unfunded Obligation – The 980 Madison Mortgage Loan documents required the 980 Madison Borrower to deposit $1,915,067.91 for unfunded obligations (including tenant improvement, leasing commission and free rent obligations).
Replacement Reserve – The 980 Madison Mortgage Loan documents require that the 980 Madison Borrower deposit $2,247.38 on each payment date after the occurrence and during the continuance of the Trigger Period.
Rollover Reserve – The 980 Madison Mortgage Loan documents require that on each payment date during the continuance of a Trigger Period, the 980 Madison Borrower must deposit an amount equal to $11,236.92 in an account for tenant improvements, leasing commissions and free rent that may be incurred following the origination date.
Lockbox and Cash Management. The 980 Madison Mortgage Loan is structured with a soft lockbox with springing cash management upon the occurrence of a Trigger Period.
During the term of the 980 Madison Mortgage Loan, all rent of the 980 Madison Property must be directly deposited into an account under the control of the lender (the “Restricted Account”), which was established by the 980 Madison Borrower at Manufacturers and Traders Trust Company. The lender has a first priority pledge of, and perfected security interest in, the Restricted Account as additional security for the 980 Madison Whole Loan. All amounts deposited into the Restricted Account will be deposited on each business day at the direction of the 980 Madison Borrower unless a Trigger Period exists, in which case such amounts will be transferred on each business day into a cash management account. Provided no event of default exists, on each payment date after the occurrence and during the continuance of a Trigger Period, the lender or servicer, as applicable, will allocate all funds on deposit in the Cash Management Account and disburse such funds in accordance with the 980 Madison Whole Loan documents.
“Trigger Period” means a period (A) commencing upon the earliest of (i) the occurrence and continuance of an event of default or mezzanine event of default (the lender’s receipt of written notice from the mezzanine lender will be conclusive evidence that a mezzanine loan event of default has occurred for purposes of this clause (i)), each beyond any applicable notice and cure periods, (ii) the aggregate debt yield being less than 5.25%, (iii) the date which is 12 months prior to the expiration date under the Gagosian Gallery lease, (iv) any bankruptcy event of the 980 Madison Borrower or the manager that is not discharged, stayed or dismissed within 90 days of the commencement of such bankruptcy event (provided that, if at any time during such 90 day period, the 980 Madison Borrower or the manager, as applicable, fails to diligently contest such bankruptcy event in good faith, the occurrence of such failure will constitute a Trigger Period), and (v) any bankruptcy or similar insolvency of Gagosian Gallery tenant; provided that a Trigger Period will only be deemed to have commenced with respect to an involuntary bankruptcy of Gagosian Gallery tenant pursuant to this clause (v) if such involuntary bankruptcy is not discharged, stayed or dismissed within 60 days of the commencement of such involuntary bankruptcy (provided, further that, if at any time during such 60 day period, the Gagosian Gallery Tenant fails to diligently contest such involuntary bankruptcy in good faith, the occurrence of such failure will constitute a Trigger Period); and (B) expiring upon (v) with regard to any Trigger Period commenced in connection with clause (A)(i) above, the cure of such Mortgage Loan event of default and/or mezzanine loan event of default (as evidenced, with respect to the 980 Madison Mezzanine Loan (as defined below), by the lender’s receipt of written notice of such cure from the mezzanine lender), (w) with regard to any Trigger Period commenced in connection with clause (A)(ii) above, the debt yield being equal to or greater than the minimum debt yield for one calendar quarter, (x) with regard to any Trigger Period commenced in connection with clause (A)(iii) above, the Gagosian Gallery tenant extends or renews the Gagosian Gallery lease with respect to at least 85% of its leased premises for a term of no less than five years and provided
THE INFORMATION IN THIS STRUCTURAL AND COLLATERAL TERM SHEET IS NOT COMPLETE AND MAY BE AMENDED PRIOR TO THE TIME OF SALE. THIS TERM SHEET IS NOT AN OFFER TO SELL THESE SECURITIES AND IT IS NOT A SOLICITATION OF AN OFFER TO BUY THESE SECURITIES IN ANY JURISDICTION WHERE THE OFFER OR SALE IS NOT PERMITTED.
95
| Mixed Use – Office/Retail | Loan #6 | Cut-off Date Balance: | $25,000,000 | |
| 980 Madison Avenue | 980 Madison | Cut-off Date LTV: | 27.6% | |
| New York, NY 10075 | U/W NCF DSCR: | 4.08x | ||
| U/W NOI Debt Yield: | 15.2% |
that, in connection with such extension, the 980 Madison Borrower deposits with the lender all outstanding leasing reserve costs into the leasing reserve account with respect to the extension of the Gagosian Gallery lease, (y) with respect to any Trigger Period commenced in connection with clause (A)(iv) above, such bankruptcy event being discharged, stayed or dismissed or, in the case of the manager, the 980 Madison Borrower has replaced the manager with a qualified manager in accordance with the terms of the Madison Whole Loan documents, and (z) with respect to any Trigger Period commenced in connection with clause (A)(v) above, the Gagosian Gallery tenant is no longer subject to any bankruptcy or insolvency proceeding and has affirmed the Gagosian Gallery lease pursuant to a final non-appealable order of a court of competent jurisdiction.
Notwithstanding the foregoing, the 980 Madison Borrower is permitted to deliver to the lender a letter of credit which satisfies the applicable terms and conditions of the Madison Whole Loan documents in an amount which, when or if applied to the outstanding principal balance of the 980 Madison Whole Loan and the 980 Madison Mezzanine Loan, would be sufficient such that the minimum debt yield is satisfied (the “Minimum Debt Yield Cure Collateral”). Upon the delivery to the lender of the Minimum Debt Yield Cure Collateral, a Trigger Period pursuant to clause (A)(ii) will cease to exist. The Minimum Debt Yield Cure Collateral delivered in the form of a letter of credit will be returned to the 980 Madison Borrower, provided no mortgage loan event of default has occurred and is continuing, at such time as the minimum debt yield is satisfied without reliance on such Minimum Debt Yield Cure Collateral. Notwithstanding the foregoing, a Trigger Period will not be deemed to expire in the event that a Trigger Period then exists for any other reason.
Property Management. The 980 Madison Property is managed by RFR Realty LCC, an affiliate of the 980 Madison Borrower Sponsor.
Partial Release. Not permitted.
Real Estate Substitution. Not permitted.
Subordinate and Mezzanine Indebtedness. The 980 Madison Property also secures the 980 Madison Subordinate Companion Loan, which has an aggregate Cut-off Date principal balance of $101,100,000. The 980 Madison Subordinate Companion Loan accrues interest at an interest rate of 3.59946% per annum. The 980 Madison Senior Loan is senior in right of payment to the 980 Madison Subordinate Companion Loan. At or around loan origination, the holders of the 980 Madison Senior Loan and the 980 Madison Subordinate Companion Loan entered into a co-lender agreement that sets forth the allocation of collections on the 980 Madison Whole Loan. See “Description of the Mortgage Pool—The Whole Loans —The Non-Serviced AB Whole Loan—The 980 Madison Whole Loan” in the Preliminary Prospectus. Concurrently with the origination of the 980 Madison Whole Loan, Column Financial Inc. made a $40,000,000 mezzanine loan (the “980 Madison Mezzanine Loan”) to the third-party purchaser of the 980 Madison Borrower, which is secured by such third-party purchaser’s ownership interest in the 980 Madison Borrower. The 980 Madison Mezzanine Loan is coterminous with the 980 Madison Whole Loan and is subject to an intercreditor agreement. The 980 Madison Mezzanine Loan accrues interest at a fixed per annum rate equal to 10.000% and is interest-only through the 980 Madison Whole Loan term. See “Description of the Mortgage Pool—Additional Indebtedness—Mezzanine Indebtedness” in the Preliminary Prospectus.
| Indebtedness | Original Principal Balance | Interest Rate | Original Term (mos.) | Original Amort. Term (mos.) | Total Debt UW NOI Debt Yield | Total Debt Cutoff Date LTV | Total Debt UW NCF DSCR |
| 980 Madison B-Note | $101,100,000 | 3.59946% | 60 | 0 | 7.4% | 56.5% | 1.99x |
| 980 Madison Mezzanine Loan | $40,000,000 | 10.00000% | 60 | 0 | 6.2% | 67.9% | 1.28x |
Ground Lease. None.
THE INFORMATION IN THIS STRUCTURAL AND COLLATERAL TERM SHEET IS NOT COMPLETE AND MAY BE AMENDED PRIOR TO THE TIME OF SALE. THIS TERM SHEET IS NOT AN OFFER TO SELL THESE SECURITIES AND IT IS NOT A SOLICITATION OF AN OFFER TO BUY THESE SECURITIES IN ANY JURISDICTION WHERE THE OFFER OR SALE IS NOT PERMITTED.
96
(THIS PAGE INTENTIONALLY LEFT BLANK)
THE INFORMATION IN THIS STRUCTURAL AND COLLATERAL TERM SHEET IS NOT COMPLETE AND MAY BE AMENDED PRIOR TO THE TIME OF SALE. THIS TERM SHEET IS NOT AN OFFER TO SELL THESE SECURITIES AND IT IS NOT A SOLICITATION OF AN OFFER TO BUY THESE SECURITIES IN ANY JURISDICTION WHERE THE OFFER OR SALE IS NOT PERMITTED.
97
| Mixed Use – Multifamily/Retail | Loan #7 | Cut-off Date Balance: | $25,000,000 | |
| 24480 Main Street | Newhall Crossings | Cut-off Date LTV: | 61.7% | |
| Santa Clarita, CA 91321 | U/W NCF DSCR: | 1.90x | ||
| U/W NOI Debt Yield: | 7.5% |
THE INFORMATION IN THIS STRUCTURAL AND COLLATERAL TERM SHEET IS NOT COMPLETE AND MAY BE AMENDED PRIOR TO THE TIME OF SALE. THIS TERM SHEET IS NOT AN OFFER TO SELL THESE SECURITIES AND IT IS NOT A SOLICITATION OF AN OFFER TO BUY THESE SECURITIES IN ANY JURISDICTION WHERE THE OFFER OR SALE IS NOT PERMITTED.
98
| Mixed Use – Multifamily/Retail | Loan #7 | Cut-off Date Balance: | $25,000,000 | |
| 24480 Main Street | Newhall Crossings | Cut-off Date LTV: | 61.7% | |
| Santa Clarita, CA 91321 | U/W NCF DSCR: | 1.90x | ||
| U/W NOI Debt Yield: | 7.5% |
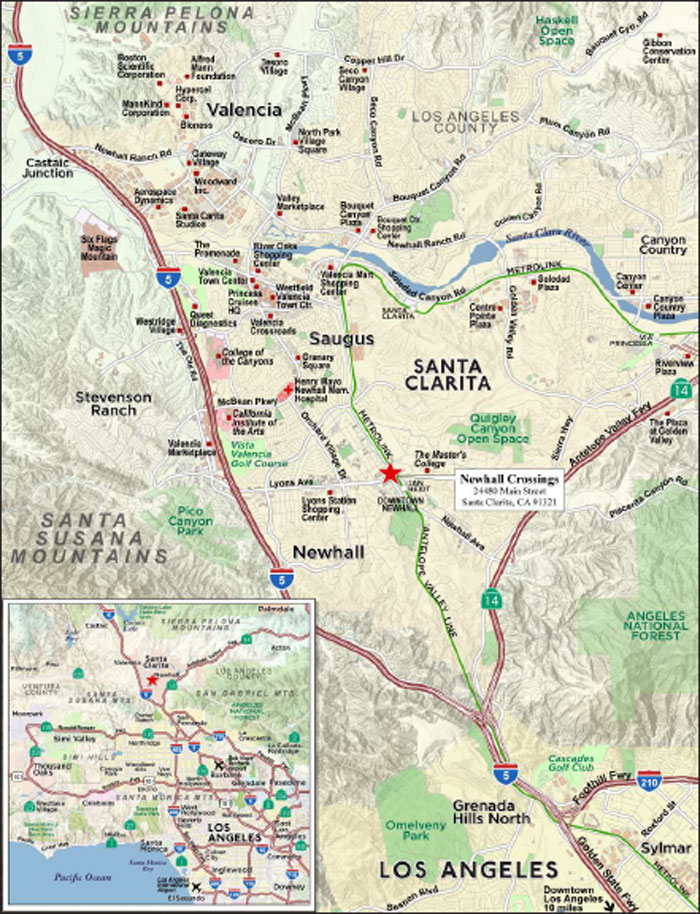
THE INFORMATION IN THIS STRUCTURAL AND COLLATERAL TERM SHEET IS NOT COMPLETE AND MAY BE AMENDED PRIOR TO THE TIME OF SALE. THIS TERM SHEET IS NOT AN OFFER TO SELL THESE SECURITIES AND IT IS NOT A SOLICITATION OF AN OFFER TO BUY THESE SECURITIES IN ANY JURISDICTION WHERE THE OFFER OR SALE IS NOT PERMITTED.
99
| No. 7 – Newhall Crossings | |||||||
| Mortgage Loan Information | Mortgaged Property Information | ||||||
| Mortgage Loan Seller: | Ladder Capital Finance LLC | Single Asset/Portfolio: | Single Asset | ||||
| Credit Assessment (Fitch/KBRA/Moody’s): | NR/NR/NR | Property Type – Subtype: | Mixed Use –Multifamily/Retail | ||||
| Original Principal Balance: | $25,000,000 | Location: | Santa Clarita, CA | ||||
| Cut-off Date Balance: | $25,000,000 | Size(3): | 77,227 SF | ||||
| % of Initial Pool Balance: | 3.3% | Cut-off Date Balance Per SF: | $323.72 | ||||
| Loan Purpose: | Refinance | Maturity Date Balance Per SF: | $323.72 | ||||
| Borrower Sponsors: | Jeffrey W. Paul, Nancy J. Paul, and The Paul Family Trust | Year Built/Renovated: | 2020/ NAP | ||||
| Guarantors: | Jeffrey W. Paul, Nancy J. Paul, and The Paul Family Trust | Title Vesting: | Fee | ||||
| Interest Rate: | 3.7990% | Property Manager: | Moss Management Services, Inc. | ||||
| Note Date: | October 4, 2021 | Current Occupancy (As of) | 96.5% (9/14/2021) | ||||
| Seasoning: | 2 months | YE 2020 Occupancy: | NAP | ||||
| Maturity Date: | October 6, 2031 | YE 2019 Occupancy: | NAP | ||||
| IO Period: | 120 months | YE 2018 Occupancy: | NAP | ||||
| Loan Term (Original): | 120 months | YE 2017 Occupancy: | NAP | ||||
| Amortization Term (Original): | NAP | As-Is Appraised Value(4): | $40,500,000 | ||||
| Loan Amortization Type: | Interest Only | As-Is Appraised Value Per SF(4): | $524.43 | ||||
| Call Protection: | L(26),D(90),O(4) | As-Is Appraisal Valuation Date: | September 1, 2021 | ||||
| Lockbox Type(1): | Soft/Springing Cash Management | Underwriting and Financial Information(4) | |||||
| Additional Debt: | None | TTM NOI (7/31/2021)(5): | $997,772 | ||||
| Additional Debt Type (Balance): | NAP | YE 2020 NOI: | NAP | ||||
| YE 2019 NOI: | NAP | ||||||
| YE 2018 NOI: | NAP | ||||||
| U/W Revenues: | $2,646,220 | ||||||
| U/W Expenses: | $775,808 | ||||||
| Escrows and Reserves(2) | U/W NOI(5): | $1,870,412 | |||||
| Initial | Monthly | Cap | U/W NCF: | $1,833,561 | |||
| Taxes | $235,557 | $23,556 | NAP | U/W DSCR based on NOI/NCF: | 1.94x / 1.90x | ||
| Insurance | $23,017 | $2,877 | NAP | U/W Debt Yield based on NOI/NCF: | 7.5% / 7.3% | ||
| Replacement Reserve | $0 | $1,328 | $47,801 | U/W Debt Yield at Maturity based on NOI/NCF: | 7.5% / 7.3% | ||
| TI/LC Reserve | $0 | $1,743 | $83,762 | Cut-off Date LTV Ratio: | 61.7% | ||
| Rent Concession Reserve | $266,937 | $0 | NAP | LTV Ratio at Maturity: | 61.7% | ||
| Existing TI/LC Obligations Reserve | $616,765 | $0 | NAP | ||||
| Sources and Uses | ||||||||
| Sources | Uses | |||||||
| Original loan amount | $25,000,000 | 98.7% | Loan Payoff | $23,631,832 | 93.3% | |||
| Sponsors equity | 319,525 | 1.3 | Closing Costs | 545,417 | 2.2 | |||
| Upfront Reserves | 1,142,276 | 4.5 | ||||||
| Total Sources | $25,319,525 | 100.0% | Total Uses | $25,319,525 | 100.0% | |||
| (1) | The lockbox is hard for commercial tenant income. Cash management is in place at orgination and will continue until Rustic Burger House, Maggin’s Irish Pub and The Glasshouse LA tenants have each accepted their tenant space and have commenced occupancy and opened for business at the Newhall Crossings Property (as defined below), at which point cash management will revert to springing unless one of the springing triggers described below is met. |
| (2) | See “Escrows” section for a full description of Escrows and Reserves. |
| (3) | The Newhall Crossings Property includes 20,918 SF of ground floor retail space. |
| (4) | While the Newhall Crossings Mortgage Loan (as defined below) was originated after the emergence of the novel coronavirus pandemic and the economic disruption resulting from measures to combat the pandemic, the pandemic is an evolving situation and could impact the Newhall Crossings Mortgage Loan more severely than assumed in the underwriting of Newhall Crossings Mortgage Loan and could adversely affect the NOI, NCF and occupancy information, as well as the appraised value and the DSCR, LTV and Debt Yield metrics presented above. See “Risk Factors- Risks Related to Market Conditions and Other External Factors-Coronavirus Pandemic Has Adversely Affected the Global Economy and Will Likely Adversely Affect the Performance of the Mortgage Loans” in the Prospectus. |
| (5) | That U/W NOI exceeds TTM NOI (7/31/2021) is mainly due to the fact that the Newhall Crossings Property was built in 2020 and was in lease-up. |
THE INFORMATION IN THIS STRUCTURAL AND COLLATERAL TERM SHEET IS NOT COMPLETE AND MAY BE AMENDED PRIOR TO THE TIME OF SALE. THIS TERM SHEET IS NOT AN OFFER TO SELL THESE SECURITIES AND IT IS NOT A SOLICITATION OF AN OFFER TO BUY THESE SECURITIES IN ANY JURISDICTION WHERE THE OFFER OR SALE IS NOT PERMITTED.
100
| Mixed Use – Multifamily/Retail | Loan #7 | Cut-off Date Balance: | $25,000,000 | |
| 24480 Main Street | Newhall Crossings | Cut-off Date LTV: | 61.7% | |
| Santa Clarita, CA 91321 | U/W NCF DSCR: | 1.90x | ||
| U/W NOI Debt Yield: | 7.5% |
The Mortgage Loan. The mortgage loan (the “Newhall Crossings Mortgage Loan”) is evidenced by a single promissory note secured by a first mortgage encumbering the fee interest in a 77,227 square foot mixed use multifamily property with ground floor retail located in Santa Clarita, CA (the “Newhall Crossings Property”).
The Borrower and Borrower Sponsor. The borrower is Newhall Crossing LLC (the “Newhall Crossings Borrower”), a Delaware limited liability company and single purpose entity with one independent director. Legal counsel to the Newhall Crossings Borrower delivered a non-consolidation opinion in connection with the origination of the Newhall Crossings Mortgage Loan. The borrower sponsors and nonrecourse carve-out guarantors of the Newhall Crossings Mortgage Loan are Jeffrey W. Paul, Nancy J. Paul, and The Paul Family Trust.
Jeffrey W. Paul is the managing partner of Pacific Coast Housing Development, a real estate development company. He owns eight other projects in California and three total in Santa Clarita. He was previously the CEO of The Olga Company and formed his own apparel company, Sierra Pacific Apparel. The joint venture partner is Serrano Development Group, which is a real estate investment and development group. Since its inception, Serrano Development Group and its partners have developed multifamily, industrial, commercial and hospitality projects throughout the United States with primary focus on the greater Los Angeles Area.
The Property. The Newhall Crossings Property is a mixed use multifamily property with ground floor retail, located in Santa Clarita, California in Los Angeles County, approximately 33 miles from downtown Los Angeles. Built in 2020, the Newhall Crossings Property is part of a larger development which encompasses the entire city block bounded by Lyons Avenue to the north, Railroad Avenue to the east, 9th street to the south and Main Street to the west. The development includes the Newhall Crossings Property at the northwest and southwest corners of the block, a Laemmle Theater at the northeast corner, and the parking structure at the southeast corner. Open pedestrian walkways and a courtyard separate the buildings. The retail is either on the street front or the courtyard.
The residential portion of the Newhall Crossings Property is a 47-unit multifamily complex with subterranean parking. The residential portion of Newhall Crossings Property consists of two five-story buildings totaling 56,309 residential rentable square-feet situated on a 0.85 acre site. The unit mix includes 5 one-bedroom units, 32 two-bedroom units and 10 three-bedroom units. Amenities at the Newhall Crossings Property include a community lounge, business center, on-site storage, fitness center, bike storage room, package lockers, and on-site retail. Parking is provided by 87 spaces in a dedicated portion of the parking structure. Unit amenities include stainless steel appliances, white shaker cabinetry, vinyl wood plank flooring, keyless entry, LED vanity mirrors, walk-in closets, in-unit washer/dryer, carpet floors, NEST thermostats, pendant lighting, linen closets, and private balconies. As of the September 14, 2021 rent roll, the residential portion of the Newhall Crossings Property was 100% occupied.
The retail portion of the Newhall Crossings Property is comprised of 20,918 square feet. The commercial space is divided between two buildings. Building A is located at the southeast corner of Main Street and Lyons Ave and is comprised of 11,451 square feet and building B is located along Main Street and is comprised of 9,467 square feet.
The Laemmle Theater is not part of the collateral but has acquired an easement across the Newhall Crossings Property at a cost of $75,000 per year for 15 years after opening. Based on public records, the grand opening date was May 1, 2021. The building totals 20,246 square feet in a two-story design with approximately 2,000 square feet of outdoor patio space.
Multifamily
The multifamily portion of Newhall Crossings Property consists of 47 multifamily units, which are comprised of 5 one-bedroom/one-bath units, 32 two-bedroom/two-bath units and 10 three-bedroom/two-bath units. Unit amenities include stainless steel appliances, white shaker cabinetry, vinyl wood plank flooring, keyless entry, LED vanity mirrors, walk-in closets, in-unit washer/dryer, carpet floors, NEST thermostats, pendant lighting, linen closets and private balconies. Community amenities include a community lounge, business center, on-site storage, fitness center, bike storage room, package lockers and on-site retail. According to the rent roll dated September 14, 2021, the multifamily units are 100.0% occupied.
Unit Mix Summary(1)
| Unit Type | Total No. of Units | Occupied Units | % of Total Units | Occupancy | Average Unit Size (SF) | Average Underwritten Monthly Rent per Unit |
| 1 Bedroom / 1 Bathroom | 5 | 5 | 10.6% | 100.0% | 918 | $2,538 |
| 2 Bedrooms / 2 Bathrooms | 32 | 32 | 68.1% | 100.0% | 1,202 | $3,069 |
| 3 Bedrooms / 2 Bathrooms | 10 | 10 | 21.3% | 100.0% | 1,326 | $3,250 |
| Total/Weighted Average | 47 | 47 | 100.0% | 100.0% | 1,198 | $3,051 |
| (1) | Information obtained from the rent roll dated September 14, 2021. |
Retail
The retail portion of the Newhall Crossings Property consists of 11 retail tenants comprising of 20,918 square feet. As of September 14,2021, the retail portion of the Newhall Crossings Property was 87.1% leased. However, six of the eleven retail tenants (totaling 12,002 square feet) are in various stages of buildout and not yet in occupancy.
THE INFORMATION IN THIS STRUCTURAL AND COLLATERAL TERM SHEET IS NOT COMPLETE AND MAY BE AMENDED PRIOR TO THE TIME OF SALE. THIS TERM SHEET IS NOT AN OFFER TO SELL THESE SECURITIES AND IT IS NOT A SOLICITATION OF AN OFFER TO BUY THESE SECURITIES IN ANY JURISDICTION WHERE THE OFFER OR SALE IS NOT PERMITTED.
101
| Mixed Use – Multifamily/Retail | Loan #7 | Cut-off Date Balance: | $25,000,000 | |
| 24480 Main Street | Newhall Crossings | Cut-off Date LTV: | 61.7% | |
| Santa Clarita, CA 91321 | U/W NCF DSCR: | 1.90x | ||
| U/W NOI Debt Yield: | 7.5% |
The following table presents certain information relating to the tenancy at the Newhall Crossings Property:
Major Tenants
| Tenant Name | Credit Rating (Fitch/Moody’s/ S&P) | Tenant NRSF | % of NRSF | Annual U/W Base Rent PSF(1) | Annual U/W Commercial Base Rent(1) | % of Total Annual U/W Base Rent | Lease Expiration Date | Extension Options | Termination Option (Y/N) |
| Major Tenants | |||||||||
| Victory-Public House(2) | NR/NR/NR | 3,166 | 15.1% | $37.08 | $117,395 | 17.4% | 9/30/2031 | 2, 5-year | N |
| Rustic Burger House(2) | NR/NR/NR | 2,286 | 10.9% | $37.08 | $84,765 | 12.6% | 6/30/2031 | 2, 5-year | N |
| Wide Eye Lounge(2) | NR/NR/NR | 1,980 | 9.5% | $36.00 | $71,280 | 10.6% | 11/30/2031 | 2, 5-year | N |
| Grit & Gratitude | NR/NR/NR | 1,770 | 8.5% | $37.08 | $65,632 | 9.7% | 6/30/2026 | 1, 5-year | N |
| C’est L’Amour Nail & Spa(2) | NR/NR/NR | 1,651 | 7.9% | $34.57 | $57,081 | 8.5% | 7/31/2026 | 1, 5-year | N |
| Total Major Tenants | 10,853 | 51.9% | $36.50 | $396,153 | 58.7% | ||||
| Non-Major Tenant | 7,365 | 35.2% | $37.83 | $278,631 | 41.3% | ||||
| Occupied Collateral Total | 18,218 | 87.1% | $37.04 | $674,784 | 100.0% | ||||
| Vacant Space | 2,700 | 12.9% | |||||||
| Collateral Total | 20,918 | 100.0% | |||||||
| (1) | Annual U/W Base Rent PSF and Annual U/W Commercial Base Rent include contractual rent steps through November 2022 totaling $16,878. |
| (2) | Victory-Public House, Rustic Burger House, Wide Eye Lounge and C’est L’Amour Nail & Spa have signed leases but are not yet open for business. Each tenant is in the process of completing its respective buildout. There is a $616,765 upfront reserve for TI/LC and $266,937 upfront reserve for free rent obligations with respect to these tenants. |
The following table presents certain information relating to the lease rollover schedule at the Newhall Crossings Property:
Lease Expiration Schedule(1)(2)
| Year Ending December 31, | No. of Leases Expiring | Expiring NRSF | % of Total NRSF | Cumulative Expiring NRSF | Cumulative % of Total NRSF | Annual U/W Base Rent | % of Total Annual U/W Base Rent | Annual U/W Base Rent PSF |
| MTM | 0 | 0 | 0.0% | 0 | 0.0% | $0 | 0.0% | $0.00 |
| 2021 | 0 | 0 | 0.0% | 0 | 0.0% | $0 | 0.0% | $0.00 |
| 2022 | 0 | 0 | 0.0% | 0 | 0.0% | $0 | 0.0% | $0.00 |
| 2023 | 0 | 0 | 0.0% | 0 | 0.0% | $0 | 0.0% | $0.00 |
| 2024 | 0 | 0 | 0.0% | 0 | 0.0% | $0 | 0.0% | $0.00 |
| 2025 | 0 | 0 | 0.0% | 0 | 0.0% | $0 | 0.0% | $0.00 |
| 2026 | 3 | 4,647 | 22.2% | 4,647 | 22.2% | $168,173 | 24.9% | $36.19 |
| 2027 | 0 | 0 | 0.0% | 4,647 | 22.2% | $0 | 0.0% | $0.00 |
| 2028 | 2 | 2,041 | 9.8% | 6,688 | 32.0% | $81,218 | 12.0% | $39.79 |
| 2029 | 0 | 0 | 0.0% | 6,688 | 32.0% | $0 | 0.0% | $0.00 |
| 2030 | 1 | 1,536 | 7.3% | 8,224 | 39.3% | $56,955 | 8.4% | $37.08 |
| 2031 | 5 | 9,994 | 47.8% | 18,218 | 87.1% | $368,439 | 54.6% | $36.87 |
| Thereafter | 0 | 0 | 0.0% | 18,218 | 87.1% | $0 | 0.0% | $0.00 |
| Vacant | 0 | 2,700 | 12.9% | 20,918 | 100.0% | $0 | 0.0% | $0.00 |
| Total/Weighted Average(3) | 11 | 20,918 | 100.0% | $674,784 | 100.0% | $37.04 |
| (1) | Information obtained from the underwritten rent roll. |
| (2) | Certain tenants may have lease termination options that are exercisable prior to the originally stated expiration date of the subject lease and that are not considered in the Lease Expiration Schedule. |
| (3) | Total Annual UW Base Rent PSF excludes vacant space. |
THE INFORMATION IN THIS STRUCTURAL AND COLLATERAL TERM SHEET IS NOT COMPLETE AND MAY BE AMENDED PRIOR TO THE TIME OF SALE. THIS TERM SHEET IS NOT AN OFFER TO SELL THESE SECURITIES AND IT IS NOT A SOLICITATION OF AN OFFER TO BUY THESE SECURITIES IN ANY JURISDICTION WHERE THE OFFER OR SALE IS NOT PERMITTED.
102
| Mixed Use – Multifamily/Retail | Loan #7 | Cut-off Date Balance: | $25,000,000 | |
| 24480 Main Street | Newhall Crossings | Cut-off Date LTV: | 61.7% | |
| Santa Clarita, CA 91321 | U/W NCF DSCR: | 1.90x | ||
| U/W NOI Debt Yield: | 7.5% |
The following table presents historical occupancy percentages at the Newhall Crossings Property:
Historical Occupancy
12/31/2018(1) | 12/31/2019(1) | 12/31/2020(1) | 9/14/2021(2) |
| NAP | NAP | NAP | 96.5% |
| (1) | The information is unavailable as the Newhall Crossings Property was constructed in 2020 |
| (2) | Information reflects economic occupancy obtained from the underwritten rent roll dated September 14, 2021. |
Operating History and Underwritten Net Cash Flow. The following table presents certain information relating to the underwritten net cash flow at the Newhall Crossings Property:
Cash Flow Analysis
| TTM 7/31/2021 | U/W | %(1) | U/W $ per SF | |
| Residential and Retail Rents in Place | $1,539,855 | $1,720,680 | 63.0% | $22.28 |
| Contractual Rent Steps | 0 | 0 | 0.0 | 0.00 |
| Grossed Up Vacant Space | 0 | 0 | 0.0 | 0.00 |
| Gross Potential Rent | $1,539,855 | $1,720,680 | 63.0% | $22.28 |
| Other Income(2) | 124,285 | 1,011,574 | 37.0 | 13.10 |
| Total Recoveries | 0 | 0 | 0.0 | 0.00 |
| Net Rental Income | $1,664,141 | $2,732,254 | 100.0% | $35.38 |
| (Vacancy & Credit Loss)(3) | 0 | (86,034) | (5.0) | (1.11) |
| Effective Gross Income | $1,664,141 | $2,646,220 | 96.9% | $34.27 |
| Real Estate Taxes | 331,377 | 331,377 | 12.5 | 4.29 |
| Insurance | 27,201 | 34,526 | 1.3 | 0.45 |
| Management Fee | 52,128 | 86,002 | 3.3 | 1.11 |
| Other Operating Expenses | 255,662 | 323,902 | 12.2 | 4.19 |
| Total Operating Expenses | $666,368 | $775,808 | 29.3% | $10.05 |
| Net Operating Income(4) | $997,772 | $1,870,412 | 70.7% | $24.22 |
| Replacement Reserves | 0 | 15,934 | 0.6 | 0.21 |
| TI/LC | 0 | 20,918 | 0.8 | 0.27 |
| Net Cash Flow | $997,772 | $1,833,561 | 69.3% | $23.74 |
| NOI DSCR | 1.04x | 1.94x | ||
| NCF DSCR | 1.04x | 1.90x | ||
| NOI Debt Yield | 4.0% | 7.5% | ||
| NCF Debt Yield | 4.0% | 7.3% |
| (1) | Represents (i) percent of Net Rental Income for all revenue fields, (ii) percent of Gross Potential Rent for Vacancy & Credit Loss and (iii) percent of Effective Gross Income for all other fields. |
| (2) | Other Income consists of commercial income, reimbursements, easement income and RUBS. Retail space was in lease-up during this period. |
| (3) | The underwritten economic vacancy is 5.0%. The Newhall Crossings Property had a 96.5% economic occupancy as of September 14, 2021. |
| (4) | That U/W NOI exceeds TTM Net Operating Income (7/31/2021) is mainly due to the fact that the Newhall Crossings Property was built in 2020 and was in lease-up. |
THE INFORMATION IN THIS STRUCTURAL AND COLLATERAL TERM SHEET IS NOT COMPLETE AND MAY BE AMENDED PRIOR TO THE TIME OF SALE. THIS TERM SHEET IS NOT AN OFFER TO SELL THESE SECURITIES AND IT IS NOT A SOLICITATION OF AN OFFER TO BUY THESE SECURITIES IN ANY JURISDICTION WHERE THE OFFER OR SALE IS NOT PERMITTED.
103
| Mixed Use – Multifamily/Retail | Loan #7 | Cut-off Date Balance: | $25,000,000 | |
| 24480 Main Street | Newhall Crossings | Cut-off Date LTV: | 61.7% | |
| Santa Clarita, CA 91321 | U/W NCF DSCR: | 1.90x | ||
| U/W NOI Debt Yield: | 7.5% |
Appraisal. As of the appraisal valuation date of September 1, 2021, the Newhall Crossings Property had an “as-is” appraised value of $40,500,000.
Environmental Matters. According to a Phase I environmental site assessment dated September 20, 2021, there was no evidence of any recognized environmental conditions at the Newhall Crossings Property.
COVID-19 Update. The Newhall Crossings Mortgage Loan was originated on October 4, 2021. As of November 1, 2021, the borrower sponsors have reported that the Newhall Crossings Property has had no lease modification or rent relief requests, and all tenants have remained current on all rent and lease obligations.
Market Overview and Competition. The Newhall Crossings Property is located within Santa Clarita, Los Angeles County, California, which forms part of the Los Angeles-Long Beach-Glendale Metropolitan Statistical Area (Los Angeles MSA). According to a third-party analytics group, the 2020 population in the Los Angeles MSA was 10,035,700. The population is projected to increase at the rate of 0.1% to 0.2% and reach 10,117,900 by 2026. The total employment in the Los Angeles MSA as of 2020 was 4,148,200. The 2020 unemployment rate in the Los Angeles MSA was 13.0%. The most recent reported unemployment rate for the Los Angeles MSA is 9.5% (June 2021)
Submarket Information (Multifamily) – According to the appraisal, the Newhall Crossings Property is situated within the Santa Clarita Valley/Canyon Country multifamily submarket, which contained approximately 16,291 units as of the second quarter of 2021. The Santa Clarita Valley/Canyon Country apartment submarket reported a vacancy rate of 5.0% with an average quoted rental rate of $1,831 per unit. The Newhall Crossings Property has limited direct competition in the immediate market due to the location in a mature, pedestrian-oriented commercial district in proximity to a train station.
Submarket Information (Retail) – According to the appraisal, the Newhall Crossings Property is located within the Paramount/Downey/East County retail submarket, which contained approximately 9.2 million square feet of retail space as of the second quarter of 2021. The Paramount/Downey/ East County retail submarket reported a vacancy rate of 11.2% with an average quoted rental rate of $25.88 per square feet. Absorption and construction have been relatively minor over the last few years, and projections show absorption will outpace construction in the submarket (11.2% current vacancy, 10.5% projected forward 5-year vacancy).
Appraiser’s Multifamily Competitive Set – The appraiser identified five competitive properties for the Newhall Crossings Property totaling 1,439 units, which reported an average occupancy rate of approximately 87.4%. The appraiser concluded to monthly market rents of $2,215 to $3,050 per unit for one bedroom units, $2,920 to $3,390 per unit for two bedroom units and $2,905 to $3,810 per unit for three bedroom units.
The table below presents certain information relating to five comparable multifamily properties to the Newhall Crossings Property identified by the appraiser:
Competitive Set(1)
| Newhall Crossings (Subject) | Monticello Apartments | IMT Stevenson Ranch Apartments | Jefferson Vista Canyon | The Paseo At Town Center | The Madison at Town Center | |
| Location | Santa Clarita, CA | Valencia, CA | Stevenson Ranch, CA | Santa Clarita, CA | Valencia, CA | Valencia, CA |
| Distance to Subject | -- | 3.9 miles | 2.7 miles | 7.8 miles | 4.5 miles | 4.0 miles |
| Property Type | Mixed Use – Multifamily/Retail | Multifamily | Multifamily | Multifamily | Multifamily | Multifamily |
| Year Built/Renovated | 2020/NAP | 2020/NAP | 1992/2017 | 2020/NAP | 2001/NAP | 2003/NAP |
| Number of Units(2) | 47 | 60 | 510 | 480 | 259 | 130 |
| Average Monthly Rent (per unit) | ||||||
| 1 Bedroom | $2,538 | $3,050 | $2,215 | $2,500 | $2,440 | $2,255 |
| 2 Bedrooms | $3,069 | $3,205 | $2,920 | $3,180 | $3,390 | $2,935 |
| 3 Bedrooms | $3,250 | NAP | $3,365 | $3,670 | $3,810 | $2,905 |
| Occupancy | 100.0% | 68.0% | 98.0% | 69.0% | 99.0% | 100.0% |
| (1) | Information obtained from the appraisal unless otherwise indicated. |
| (2) | Information obtained from the underwritten rent roll dated September 14, 2021. |
THE INFORMATION IN THIS STRUCTURAL AND COLLATERAL TERM SHEET IS NOT COMPLETE AND MAY BE AMENDED PRIOR TO THE TIME OF SALE. THIS TERM SHEET IS NOT AN OFFER TO SELL THESE SECURITIES AND IT IS NOT A SOLICITATION OF AN OFFER TO BUY THESE SECURITIES IN ANY JURISDICTION WHERE THE OFFER OR SALE IS NOT PERMITTED.
104
| Mixed Use – Multifamily/Retail | Loan #7 | Cut-off Date Balance: | $25,000,000 | |
| 24480 Main Street | Newhall Crossings | Cut-off Date LTV: | 61.7% | |
| Santa Clarita, CA 91321 | U/W NCF DSCR: | 1.90x | ||
| U/W NOI Debt Yield: | 7.5% |
Escrows.
Real Estate Taxes – The Newhall Crossings Mortgage Loan documents require an upfront real estate tax reserve of approximately $235,557 and ongoing monthly real estate tax reserves in an amount equal to one-twelfth of the real estate taxes that the lender estimates will be necessary to pay taxes over the then succeeding twelve months (initially approximately $23,556).
Insurance – The Newhall Crossings Mortgage Loan documents require an upfront insurance reserve of approximately $23,017 and ongoing monthly insurance reserves in an amount equal to one-twelfth of the insurance premiums that the lender estimates will be payable for the renewal of the coverage afforded by the policies upon the expiration thereof (initially approximately $2,877).
Replacement Reserves – The Newhall Crossings Mortgage Loan documents require ongoing monthly replacement reserves of approximately $1,328, capped at $47,801.
TI/LC Reserve – The Newhall Crossings Mortgage Loan documents require ongoing monthly TI/LC reserves of approximately $1,743 for the TI/LCs and related expenses with respect to the commercial space at the Newhall Crossings Property, capped at $83,762.
Rent Concession Reserve - The Newhall Crossings Mortgage Loan documents require an upfront free rent reserve of approximately $266,937 for outstanding free rent obligations on the retail space.
Existing TI/LC Obligations Reserve - The Newhall Crossings Mortgage Loan documents require an upfront existing TI/LC Obligations reserve of approximately $616,765 for existing TI/LC obligations on the retail space.
Lockbox and Cash Management. The Newhall Crossings Borrower established at closing a lender-controlled lockbox account. All retail tenants are required to send their rent directly to the lockbox account and the Newhall Crossings Borrower and property manager are required to deposit all residential rents into the lockbox account. Subject to the initial cashflow sweep period described below, upon the occurrence and during the continuance of a Cash Sweep Event Period (as defined below), funds in the lockbox accounts are required to be swept to a lender-controlled cash management account, and all excess funds (after payment of required monthly reserve deposits, debt service, operating and capital expenses) are required to be swept to an excess cash flow subaccount controlled by the lender.
The Newhall Crossings Mortgage Loan is in a cashflow sweep period, which began on the origination date and will be cured when Rustic Burger House, Maginn’s Irish Pub and The Glasshouse LA, LLC have accepted and are occupying their space demised under their lease and open for business. Thereafter, a “Cash Sweep Event Period” will commence upon (i) the occurrence of an event of default under the Newhall Crossings Mortgage Loan documents (ii) an event of default under the property management agreement or (iii) after October 4, 2022 (commencement of month 12 of the loan term), if the debt service coverage ratio is less than 1.50x for the preceding two consecutive calendar quarters and will end (x) with respect to clause (i) above, upon the cure (if applicable) of such event of default, (y) with respect to clause (ii) above, if the default under the property management has been cured or the property management agreement has been replaced in accordance with the Newhall Crossings Mortgage Loan documents and (z) with respect to clause (iii) above, if the Newhall Crossings Property achieves a debt service coverage ratio of at least 1.55x for at least two consecutive quarters.
Property Management. The Newhall Crossings Property is managed by Moss Management Services, Inc.
Partial Release. Not permitted.
Real Estate Substitution. Not permitted.
Subordinate and Mezzanine Indebtedness. Not permitted.
Ground Lease. None.
Terrorism Insurance. The Newhall Crossings Mortgage Loan documents require that the “all risk” insurance policy required to be maintained by the Newhall Crossings Borrower provides coverage for terrorism in an amount equal to the full replacement cost of the Newhall Crossings Property, as well as business interruption insurance covering no less than the 24-month period following the occurrence of a casualty event, together with a 12-month extended period of indemnity.
THE INFORMATION IN THIS STRUCTURAL AND COLLATERAL TERM SHEET IS NOT COMPLETE AND MAY BE AMENDED PRIOR TO THE TIME OF SALE. THIS TERM SHEET IS NOT AN OFFER TO SELL THESE SECURITIES AND IT IS NOT A SOLICITATION OF AN OFFER TO BUY THESE SECURITIES IN ANY JURISDICTION WHERE THE OFFER OR SALE IS NOT PERMITTED.
105
| Property Types – Various | Loan #8 | Cut-off Date Balance: | $23,800,000 | |
| Property Addresses – Various | ExchangeRight 49 | Cut-off Date LTV: | 61.5% | |
| U/W NCF DSCR: | 2.56x | |||
| U/W NOI Debt Yield: | 9.4% |
THE INFORMATION IN THIS STRUCTURAL AND COLLATERAL TERM SHEET IS NOT COMPLETE AND MAY BE AMENDED PRIOR TO THE TIME OF SALE. THIS TERM SHEET IS NOT AN OFFER TO SELL THESE SECURITIES AND IT IS NOT A SOLICITATION OF AN OFFER TO BUY THESE SECURITIES IN ANY JURISDICTION WHERE THE OFFER OR SALE IS NOT PERMITTED.
106
| Property Types – Various | Loan #8 | Cut-off Date Balance: | $23,800,000 | |
| Property Addresses – Various | ExchangeRight 49 | Cut-off Date LTV: | 61.5% | |
| U/W NCF DSCR: | 2.56x | |||
| U/W NOI Debt Yield: | 9.4% |
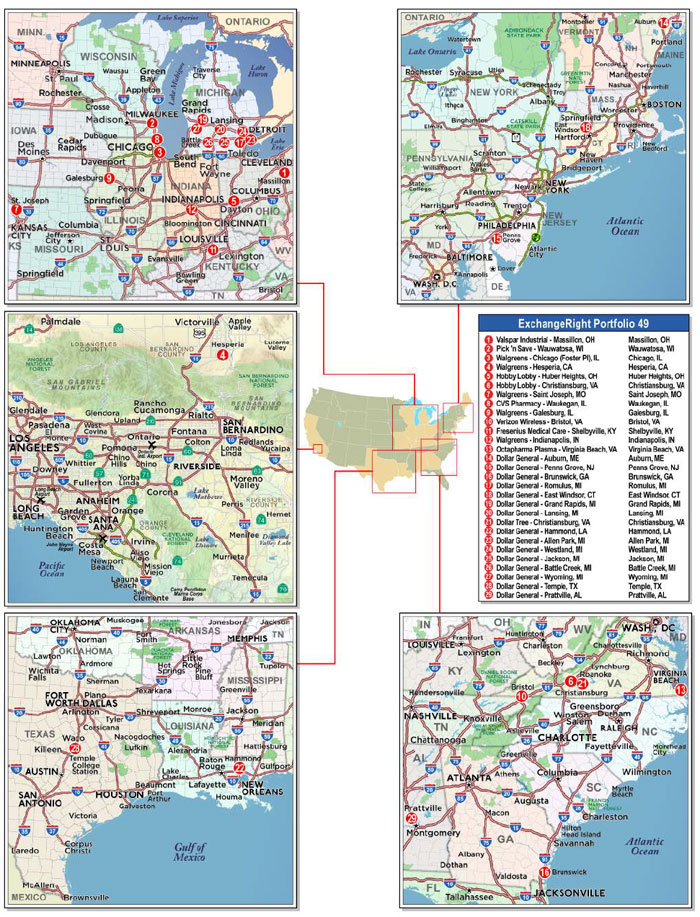
THE INFORMATION IN THIS STRUCTURAL AND COLLATERAL TERM SHEET IS NOT COMPLETE AND MAY BE AMENDED PRIOR TO THE TIME OF SALE. THIS TERM SHEET IS NOT AN OFFER TO SELL THESE SECURITIES AND IT IS NOT A SOLICITATION OF AN OFFER TO BUY THESE SECURITIES IN ANY JURISDICTION WHERE THE OFFER OR SALE IS NOT PERMITTED.
107
| No. 8 – ExchangeRight 49 | |||||||||
| Mortgage Loan Information | Mortgaged Property Information | ||||||||
| Mortgage Loan Seller: | Wells Fargo Bank, National Association | Single Asset/Portfolio: | Portfolio | ||||||
| Credit Assessment (Fitch/KBRA/Moody’s): | NR/NR/NR | Property Type – Subtype: | Various – See Table | ||||||
| Original Principal Balance(1): | $23,800,000 | Location: | Various – See Table | ||||||
| Cut-off Date Balance(1): | $23,800,000 | Size: | 621,901 SF | ||||||
| % of Initial Pool Balance: | 3.1% | Cut-off Date Balance Per SF: | $110.63 | ||||||
| Loan Purpose: | Acquisition | Maturity Date Balance Per SF: | $110.63 | ||||||
| Borrower Sponsor: | ExchangeRight Real Estate, LLC | Year Built/Renovated: | Various – See Table | ||||||
| Guarantors: | David Fisher, Joshua Ungerecht, and Warren Thomas | Title Vesting: | Fee | ||||||
| Mortgage Rate: | 3.5160% | Property Manager: | Self-managed | ||||||
| Note Date: | August 12, 2021 | Current Occupancy (As of)(4): | 100.0% (12/1/2021) | ||||||
| Seasoning: | 3 months | YE 2020 Occupancy(4)(5): | NAV | ||||||
| Maturity Date: | September 11, 2026 | YE 2019 Occupancy(5): | NAV | ||||||
| IO Period: | 60 months | YE 2018 Occupancy(5): | NAV | ||||||
| Loan Term (Original): | 60 months | YE 2017 Occupancy(5): | NAV | ||||||
| Amortization Term (Original): | NAP | As-Is Appraised Value(4): | $111,855,000 | ||||||
| Loan Amortization Type: | Interest Only | As-Is Appraisal Value Per SF(4): | $179.86 | ||||||
| Call Protection(2): | L(27),D(26),O(7) | As-Is Appraisal Valuation Date(6): | Various | ||||||
| Lockbox Type: | Hard/Springing Cash Management | Underwriting and Financial Information(4) | |||||||
| Additional Debt(1): | Yes | YE 2020 NOI(5): | NAV | ||||||
| Additional Debt Type (Balance): | Pari Passu ($45,000,000) | YE 2019 NOI(5): | NAV | ||||||
| YE 2018 NOI(5): | NAV | ||||||||
| YE 2017 NOI(5): | NAV | ||||||||
| Escrows and Reserves(3) | U/W Revenues: | $7,889,751 | |||||||
| Initial | Monthly | Cap | U/W Expenses: | $1,413,678 | |||||
| Real Estate Taxes | $483,162 | $91,275 | NAP | U/W NOI: | $6,476,073 | ||||
| Insurance | $0 | Springing | NAP | U/W NCF: | $6,273,413 | ||||
| Replacement Reserves | $305,914 | $3,973 | NAP | U/W DSCR based on NOI/NCF(1): | 2.64x / 2.56x | ||||
| TI/LC Reserve | $500,000 | Springing | NAP | U/W Debt Yield based on NOI/NCF(1): | 9.4% / 9.1% | ||||
| Immediate Repairs | $327,115 | $0 | NAP | U/W Debt Yield at Maturity based on NOI/NCF(1): | 9.4% / 9.1% | ||||
| CVS Prepaid Rent Reserve | $1,846,374 | $0 | NAP | Cut-off Date LTV Ratio(1): | 61.5% | ||||
| Existing TI/LC Reserve | $15,000 | $0 | NAP | LTV Ratio at Maturity(1): | 61.5% | ||||
| Sources and Uses | ||||||||
| Sources | Uses | |||||||
| Original loan amount | $68,800,000 | 59.4% | Purchase price(7) | $111,044,859 | 95.9% | |||
| Cash equity contribution | 47,032,410 | 40.6 | Reserves | 3,477,565 | 3.0 | |||
| Closing Costs | 1,309,986 | 1.1 | ||||||
| Total Sources | $115,832,410 | 100.0% | Total Uses | $115,832,410 | 100.0% | |||
| (1) | The ExchangeRight 49 Mortgage Loan (as defined below) is part of the ExchangeRight 49 Whole Loan (as defined below) with an original aggregate principal balance of $68,800,000. The Cut-off Date Balance PSF, Maturity Date Balance PSF, U/W Debt Yield based on NOI/NCF, U/W Debt Yield at Maturity Date based on NOI/NCF, U/W DSCR based on NOI/NCF, Cut-off Date LTV Ratio and LTV Ratio at Maturity numbers presented above are based on the ExchangeRight 49 Whole Loan. |
| (2) | At any time after the earlier of (i) October 11, 2024 and (ii) two years from the closing date of the securitization that includes the last pari passu note of the ExchangeRight 49 Whole Loan to be securitized, the ExchangeRight 49 Borrower (as defined below) has the right to defease the ExchangeRight 49 Whole Loan in whole, but not in part. Additionally, the ExchangeRight 49 Borrower may prepay the ExchangeRight 49 Whole Loan with 30 days’ notice on or after March 11, 2026. |
| (3) | See “Escrows” section below. |
| (4) | While the ExchangeRight 49 Whole Loan was originated after the emergence of the novel coronavirus pandemic and the economic disruption resulting from measures to combat the pandemic, the pandemic is an evolving situation and could impact the ExchangeRight 49 Whole Loan more severely than assumed in the underwriting of the ExchangeRight 49 Whole Loan and could adversely affect the NOI, NCF and occupancy information, as well as the appraised value and the DSCR, LTV and Debt Yield metrics presented above. See “Risk Factors—Risks Related to Market Conditions and Other External Factors—The Coronavirus Pandemic Has Adversely Affected the Global Economy and Will Likely Adversely Affect the Performance of the Mortgage Loans” in the Preliminary Prospectus. |
| (5) | Historical occupancy and NOI are unavailable, as the ExchangeRight 49 Properties (as defined below) were acquired by the ExchangeRight 49 Borrower between June 2021 and August 2021, and such information was not provided by the seller. |
| (6) | The individual appraisal valuation dates range from April 19, 2021 to July 23, 2021. |
| (7) | The ExchangeRight 49 Properties were acquired between June 2021 and August 2021. |
THE INFORMATION IN THIS STRUCTURAL AND COLLATERAL TERM SHEET IS NOT COMPLETE AND MAY BE AMENDED PRIOR TO THE TIME OF SALE. THIS TERM SHEET IS NOT AN OFFER TO SELL THESE SECURITIES AND IT IS NOT A SOLICITATION OF AN OFFER TO BUY THESE SECURITIES IN ANY JURISDICTION WHERE THE OFFER OR SALE IS NOT PERMITTED.
108
| Property Types – Various | Loan #8 | Cut-off Date Balance: | $23,800,000 | |
| Property Addresses – Various | ExchangeRight 49 | Cut-off Date LTV: | 61.5% | |
| U/W NCF DSCR: | 2.56x | |||
| U/W NOI Debt Yield: | 9.4% |
The Mortgage Loan. The mortgage loan (the “ExchangeRight 49 Mortgage Loan”) is part of a whole loan (the “ExchangeRight 49 Whole Loan”) that is evidenced by two pari passu promissory notes in the aggregate original principal amount of $68,800,000 and secured by the fee interests in 26 single tenant retail properties, two single tenant medical office properties and one industrial property totaling 621,901 square feet (the “ExchangeRight 49 Properties”) located across 16 states. The ExchangeRight 49 Whole Loan will be serviced under the pooling and servicing agreement for the BANK 2021-BNK37 securitization trust. See “Description of the Mortgage Pool—The Whole Loans—The Serviced Pari Passu Whole Loans” and “Pooling and Servicing Agreement” in the Preliminary Prospectus.
Note Summary
| Notes | Original Balance | Cut-off Date Balance | Note Holder | Controlling Piece |
| A-1 | $45,000,000 | $45,000,000 | BANK 2021-BNK37 | Yes |
| A-2 | $23,800,000 | $23,800,000 | WFCM 2021-C61 | No |
| Total | $68,800,000 | $68,800,000 |
The Borrower and Borrower Sponsor. The borrower is ExchangeRight Net-Leased Portfolio 49 DST (the “ExchangeRight 49 Borrower”), a Delaware statutory trust with at least one independent trustee. Legal counsel to the ExchangeRight 49 Borrower delivered a non-consolidation opinion in connection with the origination of the ExchangeRight 49 Whole Loan. The non-recourse carveout guarantors are David Fisher, Joshua Ungerecht, and Warren Thomas, all of whom serve as managing partners of ExchangeRight Real Estate, LLC. ExchangeRight Real Estate, LLC has more than 17 million square feet under management across over 950 properties across 40 states with a focus on investment grade, necessity-based retail and healthcare. The ExchangeRight 49 Borrower is an affiliate of the ExchangeRight Net Leased Portfolio #51 Borrower, and such borrowers have the same non-recourse carveout guarantors. Warren Thomas was subject to a prior foreclosure sale. See “Description of the Mortgage Pool–Loan Purpose; Default History, Bankruptcy Issues and Other Proceedings” in the Preliminary Prospectus.
The ExchangeRight 49 Borrower has master leased the ExchangeRight 49 Properties to a master tenant (the “ExchangeRight Master Tenant”) owned by ExchangeRight Real Estate, LLC, which is in turn owned by the guarantors. The ExchangeRight Master Tenant is a Delaware limited liability company structured to be bankruptcy-remote, with one independent director. The master lease generally imposes responsibility on the ExchangeRight Master Tenant for the operation, maintenance and management of the ExchangeRight 49 Properties and payment of all expenses incurred in the maintenance and repair of the ExchangeRight 49 Properties, other than capital expenses. The ExchangeRight Master Tenant’s interest in all tenant rents was assigned to the ExchangeRight 49 Borrower, which in turn collaterally assigned its interest to the lender. The master lease is subordinate to the ExchangeRight 49 Mortgage Loan and, upon an event of default under the ExchangeRight 49 Mortgage Loan, the lender has the right to cause the ExchangeRight 49 Borrower to terminate the master lease. A default under the master lease is an event of default under the ExchangeRight 49 Mortgage Loan and gives rise to recourse liability to the guarantors for losses, unless such default arises solely in connection with the failure of the ExchangeRight Master Tenant to pay rent as a result of the ExchangeRight 49 Properties not generating sufficient cash flow for the payment of such rent.
The lender has the right to require the ExchangeRight 49 Borrower to convert from a Delaware statutory trust to a limited liability company upon (i) an event of default or the lender’s good faith determination of imminent default under the ExchangeRight 49 Whole Loan, (ii) the lender’s good faith determination that the ExchangeRight 49 Borrower will be unable to make a material decision or take a material action required in connection with the operation and maintenance of any ExchangeRight 49 Property, and (iii) 90 days prior to the maturity date of the ExchangeRight 49 Whole Loan, if an executed commitment from an institutional lender to refinance the ExchangeRight 49 Whole Loan in full is not delivered to the lender.
COVID-19 Update. As of October 22, 2021, all of the ExchangeRight 49 Properties were open and operating with no outstanding tenant rent relief agreements.
The Properties. The ExchangeRight 49 Properties comprise 26 single tenant retail properties, two single tenant medical office properties and one single tenant industrial property totaling 621,901 square feet and located across 16 states. The ExchangeRight 49 Properties are located in Ohio (two properties, 40.4% of net rentable area), Virginia (four properties, 13.1% of net rentable area), Michigan (eight properties, 11.9% of net rentable area), Wisconsin (1 property, 9.7% of net rentable area), Illinois (3 properties, 6.4% of net rentable area), with the 11 remaining properties located in Alabama, California, Connecticut, Georgia, Indiana, Kentucky, Louisiana, Maine, Missouri, New Jersey, and Texas.
Built between 1942 and 2015 with 12 properties renovated between 1987 and 2020, the ExchangeRight 49 Properties range in size from 5,000 square feet to 189,910 square feet.
The ExchangeRight 49 Properties are net leased to 10 nationally recognized tenants, eight of which (occupying 26 properties and representing 87.3% of underwritten base rent) are investment grade-rated entities or subsidiaries of investment grade-rated entities. All of the ExchangeRight 49 Properties, have leases expiring after the stated maturity date of the ExchangeRight 49 Whole Loan, and no tenants have termination options.
The following table presents certain information relating to the ExchangeRight 49 Properties. As of December 1, 2021, the ExchangeRight 49 Properties are 100.0% occupied.
THE INFORMATION IN THIS STRUCTURAL AND COLLATERAL TERM SHEET IS NOT COMPLETE AND MAY BE AMENDED PRIOR TO THE TIME OF SALE. THIS TERM SHEET IS NOT AN OFFER TO SELL THESE SECURITIES AND IT IS NOT A SOLICITATION OF AN OFFER TO BUY THESE SECURITIES IN ANY JURISDICTION WHERE THE OFFER OR SALE IS NOT PERMITTED.
109
| Property Types – Various | Loan #8 | Cut-off Date Balance: | $23,800,000 | |
| Property Addresses – Various | ExchangeRight 49 | Cut-off Date LTV: | 61.5% | |
| U/W NCF DSCR: | 2.56x | |||
| U/W NOI Debt Yield: | 9.4% |
Properties Summary
Tenant Name City, State | Year Built/ Renovated | Tenant NRSF | %of Portfolio NRSF | Appraised Value | % of Portfolio Appraised Value | Annual U/W Base Rent PSF | % of Annual U/W Base Rent | Lease Expiration Date | Renewal Options | Term. Option? |
Pick ‘n Save Wauwatosa, WI | 2008; 2012/NAP | 60,598 | 9.7% | $18,500,000 | 16.5% | $18.68 | 16.2% | 12/31/2029 | 4 x 5 yrs. | N |
Valspar Industrial Massillon, OH | 1994/2007 | 189,910 | 30.5% | $18,600,000 | 16.6% | $5.63 | 15.3% | 4/30/2034 | None | N |
Walgreens Chicago (Foster Pl), IL | 2004/NAP | 15,330 | 2.5% | $7,900,000 | 7.1% | $30.98 | 6.8% | 12/31/2029 | 10 x 5 yrs. | N |
Walgreens Hesperia, CA | 2004/NAP | 14,560 | 2.3% | $6,000,000 | 5.4% | $25.89 | 5.4% | 5/31/2029 | 10 x 5 yrs. | N |
Hobby Lobby(1) Christiansburg, VA | 1990/2018 | 55,000 | 8.8% | $5,700,000 | 5.1% | $6.75 | 5.3% | 3/31/2028 | 3 x 5 yrs. | N |
Hobby Lobby Huber Heights, OH | 1990/2005 | 61,504 | 9.9% | $5,900,000 | 5.3% | $6.00 | 5.3% | 6/30/2029 | 3 x 5 yrs. | N |
Walgreens Saint Joseph, MO | 2003/NAP | 14,560 | 2.3% | $5,150,000 | 4.6% | $23.01 | 4.8% | 6/30/2028 | 10 x 5 yrs. | N |
CVS Pharmacy Waukegan, IL | 2002/NAP | 10,896 | 1.8% | $4,600,000 | 4.1% | $26.76 | 4.2% | 1/31/2028 | 10 x 5 yrs. | N |
Walgreens Galesburg, IL | 2003/NAP | 13,650 | 2.2% | $4,050,000 | 3.6% | $19.93 | 3.9% | 6/30/2028 | 10 x 5 yrs. | N |
Verizon Wireless Bristol, VA | 2007/NAP | 5,000 | 0.8% | $3,850,000 | 3.4% | $47.50 | 3.4% | 3/31/2029 | None | N |
Fresenius Medical Care Shelbyville, KY | 2013/NAP | 8,459 | 1.4% | $2,650,000 | 2.4% | $19.37 | 2.3% | 9/30/2028 | 3 x 5 yrs. | N |
Walgreens Indianapolis, IN | 1993/NAP | 13,000 | 2.1% | $2,550,000 | 2.3% | $12.31 | 2.3% | 12/31/2028 | 3 x 5 yrs. | N |
Octapharma Plasma Virginia Beach, VA | 1997/2019 | 11,314 | 1.8% | $2,550,000 | 2.3% | $13.00 | 2.1% | 3/31/2030 | 3 x 5 yrs. | N |
Dollar General Auburn, ME | 2015/NAP | 9,026 | 1.5% | $2,150,000 | 1.9% | $14.23 | 1.8% | 3/31/2030 | 3 x 5 yrs. | N |
Dollar General Penns Grove, NJ | 1950/2011 | 9,381 | 1.5% | $1,850,000 | 1.7% | $13.54 | 1.8% | 4/30/2029 | 2 x 5 yrs. | N |
Dollar General East Windsor, CT | 2013/NAP | 9,409 | 1.5% | $1,700,000 | 1.5% | $12.58 | 1.7% | 12/31/2028 | 5 x 5 yrs. | N |
Dollar General Grand Rapids, MI | 1942/2017 | 8,694 | 1.4% | $1,550,000 | 1.4% | $13.00 | 1.6% | 8/31/2027 | 4 x 5 yrs. | N |
Dollar General Brunswick, GA | 2013/NAP | 9,002 | 1.4% | $1,775,000 | 1.6% | $12.34 | 1.6% | 10/31/2028 | 4 x 5 yrs. | N |
Dollar Tree(1) Christiansburg, VA | 1990/2018 | 10,000 | 1.6% | $1,500,000 | 1.3% | $11.00 | 1.6% | 2/28/2030 | 3 x 5 yrs. | N |
Dollar General Romulus, MI | 2013/NAP | 9,100 | 1.5% | $1,720,000 | 1.5% | $12.04 | 1.6% | 6/30/2028 | 5 x 5 yrs. | N |
Dollar General Allen Park, MI | 1984/2012 | 9,600 | 1.5% | $1,300,000 | 1.2% | $10.02 | 1.4% | 5/31/2027 | 4 x 5 yrs. | N |
Dollar General Lansing, MI | 2013/NAP | 9,026 | 1.5% | $1,530,000 | 1.4% | $10.57 | 1.4% | 5/31/2029 | 5 x 5 yrs. | N |
Dollar General Hammond, LA | 2013/NAP | 9,026 | 1.5% | $1,475,000 | 1.3% | $10.56 | 1.4% | 6/30/2028 | 3 x 5 yrs. | N |
Dollar General Westland, MI | 1964/2012 | 9,100 | 1.5% | $1,300,000 | 1.2% | $9.86 | 1.3% | 10/31/2027 | 4 x 5 yrs. | N |
Dollar General Battle Creek, MI | 1979/1987 | 11,766 | 1.9% | $1,250,000 | 1.1% | $7.51 | 1.3% | 2/28/2029 | 4 x 5 yrs. | N |
Dollar General Jackson, MI | 1955/2020 | 8,053 | 1.3% | $1,300,000 | 1.2% | $10.73 | 1.2% | 4/30/2030 | 4 x 5 yrs. | N |
Dollar General Wyoming, MI | 1950/2019 | 8,737 | 1.4% | $1,225,000 | 1.1% | $9.85 | 1.2% | 3/31/2029 | 4 x 5 yrs. | N |
Dollar General Temple, TX | 2007/NAP | 9,100 | 1.5% | $1,155,000 | 1.0% | $7.89 | 1.0% | 10/31/2027 | 3 x 5 yrs. | N |
Dollar General Prattville, AL | 1995/NAP | 9,100 | 1.5% | $1,075,000 | 1.0% | $7.67 | 1.0% | 5/31/2029 | 3 x 5 yrs. | N |
| Total/Weighted Average | 621,901 | 100.0% | $111,855,000 | 100.0% | $11.25 | 100.0% |
| (1) | The Hobby Lobby – Christiansburg, VA property and the Dollar Tree - Christiansburg, VA are located within the same retail center. |
THE INFORMATION IN THIS STRUCTURAL AND COLLATERAL TERM SHEET IS NOT COMPLETE AND MAY BE AMENDED PRIOR TO THE TIME OF SALE. THIS TERM SHEET IS NOT AN OFFER TO SELL THESE SECURITIES AND IT IS NOT A SOLICITATION OF AN OFFER TO BUY THESE SECURITIES IN ANY JURISDICTION WHERE THE OFFER OR SALE IS NOT PERMITTED.
110
| Property Types – Various | Loan #8 | Cut-off Date Balance: | $23,800,000 | |
| Property Addresses – Various | ExchangeRight 49 | Cut-off Date LTV: | 61.5% | |
| U/W NCF DSCR: | 2.56x | |||
| U/W NOI Debt Yield: | 9.4% |
The following table presents certain information relating to the major tenants at the ExchangeRight 49 Properties:
Major Tenants
| Tenant Name | Credit Rating (S&P/Moody’s/Fitch)(1) | No of Prop. | Tenant NRSF | % of NRSF | Annual U/W Base Rent(2) | Annual U/W Base Rent PSF(2) | % of Total Annual U/W Base Rent |
| Major Tenants | |||||||
| Walgreens | BBB / Baa2 / BBB- | 5 | 71,100 | 11.4% | $1,619,000 | $22.77 | 23.1% |
| Dollar General | BBB / Baa2 / NR | 15 | 138,120 | 22.2% | $1,486,758 | $10.76 | 21.2% |
| Pick ‘n Save | BBB / Baa1 / NR | 1 | 60,598 | 9.7% | $1,132,234 | $18.68 | 16.2% |
| Valspar Industrial | BBB / Baa2 / BBB | 1 | 189,910 | 30.5% | $1,068,420 | $5.63 | 15.3% |
| Hobby Lobby | NR / NR / NR | 2 | 116,504 | 18.7% | $740,274 | $6.35 | 10.6% |
| CVS(3) | BBB / Baa2 / NR | 1 | 10,896 | 1.8% | $291,532 | $26.76 | 4.2% |
| Verizon Wireless | BBB+ / Baa1 / A- | 1 | 5,000 | 0.8% | $237,500 | $47.50 | 3.4% |
| Fresenius Medical Care | BBB / Baa3 / BBB- | 1 | 8,459 | 1.4% | $163,824 | $19.37 | 2.3% |
| Octapharma Plasma | NR / NR / NR | 1 | 11,314 | 1.8% | $147,082 | $13.00 | 2.1% |
| Dollar Tree | BBB / Baa2 / NR | 1 | 10,000 | 1.6% | $110,000 | $11.00 | 1.6% |
| Total Major Tenants | 29 | 621,901 | 100.0% | $6,996,624 | $11.25 | 100.0% | |
| Vacant Space | 0 | 0.0% | |||||
| Collateral Total | 621,901 | 100.0% | |||||
| (1) | Certain ratings are those of the parent company whether or not the parent company guarantees the lease. |
| (2) | Annual U/W Base Rent and Annual U/W Base Rent PSF includes rent averaging for investment grade tenants totaling $63,737. |
| (3) | CVS prepaid their rent through the loan term. See “Escrows” section below. |
The following table presents certain information relating to the lease expiration schedule at the ExchangeRight 49 Properties:
Lease Expiration Schedule(1)
| Year Ending December 31, | No. of Leases Expiring | Expiring NRSF | % of Total NRSF | Cumulative Expiring NRSF | Cumulative % of Total NRSF | Annual U/W Base Rent(2) | % of Total Annual U/W Base Rent(2) | Annual U/W Base Rent PSF |
| MTM | 0 | 0 | 0.0% | 0 | 0.0% | $0 | 0.0% | $0.00 |
| 2021 | 0 | 0 | 0.0% | 0 | 0.0% | $0 | 0.0% | $0.00 |
| 2022 | 0 | 0 | 0.0% | 0 | 0.0% | $0 | 0.0% | $0.00 |
| 2023 | 0 | 0 | 0.0% | 0 | 0.0% | $0 | 0.0% | $0.00 |
| 2024 | 0 | 0 | 0.0% | 0 | 0.0% | $0 | 0.0% | $0.00 |
| 2025 | 0 | 0 | 0.0% | 0 | 0.0% | $0 | 0.0% | $0.00 |
| 2026 | 0 | 0 | 0.0% | 0 | 0.0% | $0 | 0.0% | $0.00 |
| Thereafter | 29 | 621,901 | 100.0% | 621,901 | 100.0% | $6,996,624 | 100.0% | $11.25 |
| Vacant | 0 | 0 | 0.0% | 621,901 | 100.0% | $0 | 0.0% | $0.00 |
| Total/Weighted Average | 29 | 621,901 | 100.0% | $6,996,624 | 100.0% | $11.25 |
| (1) | Information obtained from the underwritten rent roll. |
| (2) | Annual U/W Base Rent and Annual U/W Base Rent PSF includes rent averaging for investment grade tenants totaling $63,737. |
The following table presents historical occupancy percentages at the ExchangeRight 49 Properties:
Historical Occupancy
12/31/2017(1) | 12/31/2018(1) | 12/31/2019(1) | 12/31/2020(1) | 12/1/2021(2) |
| NAV | NAV | NAV | NAV | 100.0% |
| (1) | Historical occupancy information is not available, as the ExchangeRight 49 Properties were acquired by the ExchangeRight 49 Borrower between June 2021 and August 2021, and such information was not provided by the seller. |
| (2) | Information obtained from the underwritten rent roll. |
THE INFORMATION IN THIS STRUCTURAL AND COLLATERAL TERM SHEET IS NOT COMPLETE AND MAY BE AMENDED PRIOR TO THE TIME OF SALE. THIS TERM SHEET IS NOT AN OFFER TO SELL THESE SECURITIES AND IT IS NOT A SOLICITATION OF AN OFFER TO BUY THESE SECURITIES IN ANY JURISDICTION WHERE THE OFFER OR SALE IS NOT PERMITTED.
111
| Property Types – Various | Loan #8 | Cut-off Date Balance: | $23,800,000 | |
| Property Addresses – Various | ExchangeRight 49 | Cut-off Date LTV: | 61.5% | |
| U/W NCF DSCR: | 2.56x | |||
| U/W NOI Debt Yield: | 9.4% |
Underwritten Net Cash Flow. The following table presents certain information relating to the underwritten net cash flow at the ExchangeRight 49 Properties:
Cash Flow Analysis(1)
| U/W | %(2) | U/W $ per SF | |
| Base Rent | $6,932,887 | 85.1% | $11.15 |
| IG Rent Averaging | 63,737 | 0.8 | 0.10 |
| Gross Potential Rent | $6,996,624 | 85.9% | $11.25 |
| Total Recoveries | 1,146,357 | 14.1 | 1.84 |
| Net Rental Income | $8,142,981 | 100.0% | $13.09 |
| (Vacancy & Credit Loss) | (253,230)(3) | (3.6) | (0.41) |
| Effective Gross Income | $7,889,751 | 96.9% | $12.69 |
| Real Estate Taxes | $966,320 | 12.2% | $1.55 |
| Insurance | 82,567 | 1.0 | 0.13 |
| Management Fee | 236,693 | 3.0 | 0.38 |
| Other Operating Expenses | 128,098 | 1.6 | 0.21 |
| Total Operating Expenses | $1,413,678 | 17.9% | $2.27 |
| Net Operating Income | $6,476,073 | 82.1% | $10.41 |
| Replacement Reserves | 47,672 | 0.6 | 0.08 |
| TI/LC | 154,988 | 2.0 | 0.25 |
| Net Cash Flow | $6,273,413 | 79.5% | $10.09 |
| NOI DSCR | 2.64x | ||
| NCF DSCR | 2.56x | ||
| NOI Debt Yield | 9.4% | ||
| NCF Debt Yield | 9.1% |
| (1) | Historical operating statements are not available, as the ExchangeRight 49 Borrower acquired the ExchangeRight 49 Properties between June 2021 and August 2021, and such information was not provided by the sellers. |
| (2) | Represents (i) percent of Net Rental Income for all revenue fields, (ii) percent of Gross Potential Rent for Vacancy & Credit Loss and (iii) percent of Effective Gross Income for all other fields. |
| (3) | The ExchangeRight 49 Properties were 100.0% occupied as of December 1, 2021. |
THE INFORMATION IN THIS STRUCTURAL AND COLLATERAL TERM SHEET IS NOT COMPLETE AND MAY BE AMENDED PRIOR TO THE TIME OF SALE. THIS TERM SHEET IS NOT AN OFFER TO SELL THESE SECURITIES AND IT IS NOT A SOLICITATION OF AN OFFER TO BUY THESE SECURITIES IN ANY JURISDICTION WHERE THE OFFER OR SALE IS NOT PERMITTED.
112
| Property Types – Various | Loan #8 | Cut-off Date Balance: | $23,800,000 | |
| Property Addresses – Various | ExchangeRight 49 | Cut-off Date LTV: | 61.5% | |
| U/W NCF DSCR: | 2.56x | |||
| U/W NOI Debt Yield: | 9.4% |
Appraisal. According to the appraisals dated between April 19, 2021 and July 23, 2021 the ExchangeRight 49 Properties had an aggregate “As-is” value of $111,855,000.
Environmental Matters. The Phase I environmental site assessments for the ExchangeRight 49 Properties dated from April 29, 2021 to July 27, 2021 identified recognized environmental conditions at the Valspar Industrial – Massillon, OH property and the Walgreens - Galesburg, IL property and identified controlled recognized environmental conditions at the Pick ‘n Save - Wauwatosa, WI property, the Walgreens - Chicago (Foster Pl), IL property, the Dollar General - East Windsor, CT property, and the Dollar General - Jackson, MI property. No recognized environmental conditions or controlled recognized environmental conditions were identified at the remaining 23 ExchangeRight 49 Properties.
The Valspar Industrial – Massillon, OH property has been utilized as industrial manufacturing facility and hazardous substances were used, stored, and/or generated at the property. The property was identified as a Resource Conservation and Recovery Act Large Quantity Generator of hazardous waste since 1995 and possibly earlier. Violations have been identified and compliance has been met with respect to all violations. A Phase II environmental site assessment was conducted on July 27, 2021 to evaluate the potential impacts of hazardous substances as a consequence of release from current or historical manufacturing operations. Identified contaminants were below applicable remediation levels and no further investigation was recommended.
The Walgreens - Galesburg, IL property operated as a gasoline service station between 1972 and 1994 and had five Underground Storage Tanks (“USTs”), which were removed on December 11, 2001. Prior investigations identified onsite soil and groundwater contamination. Between June 2001 and April 2002, the five USTs were removed, the building was demolished and excavation of the contaminated soils from the area below the former building was completed. Based upon the soil samples obtained, soil contamination exists above applicable residential clean-up standards. The Illinois EPA issued a No Further Remediation (NFR) letter, which included land use restrictions and engineering controls at the property, on September 26, 2002. Because the property contains material levels of contaminants related to the former auto repair and gas station, an environmental insurance policy was obtained in lieu of a Phase II. See “Description of the Mortgage Pool – Environmental Considerations” in the Preliminary Prospectus.
Escrows.
Taxes – The loan documents require an upfront reserve of $483,162 for real estate taxes plus ongoing monthly reserves in an amount equal to 1/12 of the real estate taxes that the lender estimates will be payable during the next twelve months, initially $91,275.
Ongoing monthly reserves for real estate taxes related to any tenant that is required to pay taxes directly pursuant to its leases (“Tax Paying Tenants”) are not required as long as (i) no event of default has occurred and is continuing; (ii) the borrower provides proof of payment directly to the taxing authority by 15 days prior to the delinquency date; (iii) the lease with the applicable Tax Paying Tenant is in full force and effect and not subject to any default beyond any applicable grace or notice and cure period; and (iv) no material change has occurred with respect to the applicable Tax Paying Tenant that would, in the lender’s reasonable determination, jeopardize such tenant’s ability to timely pay the taxes. Tax Paying Tenants currently include the CVS Pharmacy – Waukegan, IL, Valspar Industrial – Massillon, OH, Walgreens – Galesburg, IL, Walgreens – Hesperia, CA, Walgreens – Indianapolis, IN, and Walgreens – Saint Joseph, MO properties.
Insurance – Ongoing monthly reserves for insurance are not required as long as (i) no event of default has occurred and is continuing; (ii) the ExchangeRight 49 Properties are part of a blanked or umbrella policy approved by the lender; (iii) the borrower provides the lender with evidence of renewal of insurance policies; and (iv) the borrower provides the lender with paid receipts for insurance premiums by no later than 10 business days prior to the policy expiration dates.
In addition, the borrower is not required to deposit ongoing monthly insurance reserves related to any tenant who pays all insurance premiums directly to the applicable insurance company pursuant to such tenant’s lease (“Insurance Paying Tenants”) as long as (i) no event of default has occurred and is continuing; (ii) the borrower provides proof of payment by the applicable Insurance Paying Tenant (or borrower) directly to the insurance company by no later than 15 days prior to the due date for such premiums; (iii) the lease with the applicable Insurance Paying Tenant is in full force and effect and not subject to any default beyond any applicable grace or notice and cure period; and (iv) no material change has occurred with respect to the applicable Insurance Paying Tenant that would, in the lender’s reasonable determination, jeopardize such tenant’s ability to timely pay the insurance premiums. Insurance Paying Tenants currently include the CVS Pharmacy – Waukegan, IL, Dollar General – Allen Park, MI, Dollar General – Auburn, ME, Dollar General – Brunswick, GA, Dollar General – Hammond, LA, Dollar General – Lansing, MI, Dollar General – Romulus, MI, Dollar General – Westland, MI, Octapharma Plasma – Virginia Beach, VA, Valspar Industrial – Massillon, OH, Walgreens – Galesburg, IL, Walgreens – Hesperia, CA, and Walgreens – Saint Joseph, MO properties.
Replacement Reserve – The loan documents require an upfront reserve of $305,914 for replacements plus ongoing monthly reserves in an amount equal to $3,973.
In addition, the borrower is not required to deposit ongoing monthly replacement reserves related to any tenant that is obligated under its lease to pay replacements and/or alterations for its premises (“Replacement Reserve Paying Tenants”) as long as (a) no event of default has occurred and is continuing; (b) the borrower provides proof of payment of replacements by all Replacement Reserve Paying Tenants; (c) the lease with the applicable Replacement Reserve Paying Tenant is in full force and effect and not subject to any default beyond any applicable grace or notice and cure period; and (d) no material change has occurred with respect to the applicable Replacement Reserve Paying Tenant that would, in the lender’s reasonable determination, jeopardize such tenant’s ability to timely pay the replacements for its premises. Replacement Reserve Paying Tenants currently include the CVS Pharmacy – Waukegan, IL, Dollar General – Auburn, ME, Dollar General – Brunswick, GA, Dollar General – Hammond, LA, Dollar General – Lansing, MI, Dollar
THE INFORMATION IN THIS STRUCTURAL AND COLLATERAL TERM SHEET IS NOT COMPLETE AND MAY BE AMENDED PRIOR TO THE TIME OF SALE. THIS TERM SHEET IS NOT AN OFFER TO SELL THESE SECURITIES AND IT IS NOT A SOLICITATION OF AN OFFER TO BUY THESE SECURITIES IN ANY JURISDICTION WHERE THE OFFER OR SALE IS NOT PERMITTED.
113
| Property Types – Various | Loan #8 | Cut-off Date Balance: | $23,800,000 | |
| Property Addresses – Various | ExchangeRight 49 | Cut-off Date LTV: | 61.5% | |
| U/W NCF DSCR: | 2.56x | |||
| U/W NOI Debt Yield: | 9.4% |
General – Romulus, MI, Valspar Industrial – Massillon, OH, Walgreens – Chicago (Foster Pl), IL, Walgreens – Galesburg, IL, Walgreens – Hesperia, CA, and Walgreens – Saint Joseph, MO properties.
TI/LC Reserve – The loan documents require an upfront reserve of $500,000 for general tenant improvements and leasing commissions (“TI/LC”). The loan documents also require ongoing monthly general TI/LC reserves in an amount equal to $38,901; provided, however, that as long as no event of default has occurred and is continuing, ongoing monthly TI/LC reserves are not required.
Deferred Maintenance Reserve – The loan documents require an upfront reserve of $327,115 for immediate repairs.
CVS Prepaid Rent Reserve – The loan documents require an upfront reserve of $1,846,374 for the amount of prepaid rent under the tenant’s lease at the CVS Pharmacy – Waukegan, IL property. So long as no event of default is continuing, lender is required to make monthly disbursements in an amount equal to $24,294 beginning in October 2021 through (and including) August 2026.
Existing TI/LC Reserve – The loan documents require an upfront reserve of $15,000 for an outstanding tenant improvement allowance at the Fresenius Medical Care – Shelbyville, KY property.
Lockbox and Cash Management. The ExchangeRight 49 Whole Loan is structured with a hard lockbox with springing cash management, into which the borrower is required to cause all rents to be deposited directly. Prior to a Cash Trap Event Period (as defined below), all funds in the lockbox account are required to be distributed to the borrower’s operating account. During a Cash Trap Event Period, all excess funds are required to be swept to an excess cash flow subaccount controlled by the lender.
A Cash Trap Event Period will commence upon the earlier of the following:
| (i) | the occurrence of an event of default; |
| (ii) | the net cash flow debt service coverage ratio (tested quarterly) being less than 1.50x; and |
| (iii) | the monthly payment date occurring in March 2026 (unless a Permitted Transfer has occurred prior to such date; see “Permitted Transfer” section below). |
A Cash Trap Event Period will end upon the occurrence of the following:
| ● | with regard to clause (i), the cure of such event of default; |
| ● | with regard to clause (ii), the net cash flow debt service coverage ratio being equal to or greater than 1.55x for two consecutive calendar quarters; or |
| ● | with regard to clause (iii), the date a Permitted Transfer occurs. |
Permitted Transfer. A “Permitted Transfer” means either a Qualified Transfer or a Qualified REIT Transfer (as defined below). A Cash Trap Event Period (see “Lockbox and Cash Management Section”) will be triggered if a Permitted Transfer does not occur prior to the monthly payment date occurring in March 2026 (6 months prior to the maturity date of the ExchangeRight 49 Whole Loan).
A “Qualified Transfer” means any time following August 12, 2022, the borrower sponsor has the right to effect a one-time transfer of all (but not less than all) of the outstanding ownership interests in the ExchangeRight 49 Borrower to an Approved Transferee (as defined below) and to replace the non-recourse carveout guarantors as the persons who control the ExchangeRight 49 Borrower with such Approved Transferee (or other approved replacement guarantor); provided that certain conditions are satisfied, including among others: (i) no event of default exists under the ExchangeRight 49 Whole Loan; (ii) ExchangeRight 49 Properties continues to be managed by a qualified manager; (iii) the Approved Transferee executes a payment guaranty and environmental indemnity, pursuant to which it agrees to be liable for all indemnity obligations (including environmental liabilities and obligations) for which the existing non-recourse carveout guarantors are liable under the non-recourse carveout guaranty; (iv) immediately following a transfer, the Approved Transferee is in control of the ExchangeRight 49 Borrower and owns (directly or indirectly) 100% of the legal and beneficial ownership interests in the ExchangeRight 49 Borrower; and (v) if required by the lender, rating agency confirmation from each applicable rating agency.
“Approved Transferee” means either (A) an eligible institution that is, or is wholly-owned and controlled by, a bank, savings and loan association, investment bank, insurance company, trust company, real estate investment trust, commercial credit corporation, pension plan, pension fund or pension advisory firm, mutual fund, government entity or plan or institution similar to any of the foregoing; or (B) any person that (1) is a Qualified Transferee (as defined below), (2) is regularly engaged in the business of owning or operating commercial properties, or interests therein, which are similar to the ExchangeRight 49 Properties, (3) owns interests in, or operates, at least five retail properties with a minimum of 750,000 square feet in the aggregate, (4) maintains either (i) a net worth of at least $200,000,000 and total assets of at least $400,000,000, or (ii) an investment grade rating by S&P or Moody’s, (5) at all times owns no less than 100% of the legal and beneficial ownership of the borrow, and (6) is not a Delaware statutory trust.
An “Qualified Transferee” means a transferee that (i) has never been indicted or convicted of, or pled guilty or no contest to a felony, (ii) has never been indicted or convicted of, or pled guilty or no contest to a Patriot Act offense, is not a sanctioned target, and is not on any government watch list, (iii) has never been the subject of a voluntary or involuntary (to the extent the same has not been discharged) bankruptcy proceeding, (iv) has no material outstanding judgments against it or its interests and (v) is not a crowdfunded entity and is not owned by a crowdfunded entity.
A “Qualified REIT Transfer” means any time following August 12, 2022, the borrower sponsor has the right to effect a one-time transfer of all (but not less than all) of the outstanding ownership interests in the ExchangeRight 49 Borrower to an Approved REIT (as defined below) and to replace the non-recourse carveout guarantors as the persons who control the ExchangeRight 49 Borrower with such Approved REIT (or other approved replacement guarantor); provided that certain conditions are satisfied, including among others: (i)
THE INFORMATION IN THIS STRUCTURAL AND COLLATERAL TERM SHEET IS NOT COMPLETE AND MAY BE AMENDED PRIOR TO THE TIME OF SALE. THIS TERM SHEET IS NOT AN OFFER TO SELL THESE SECURITIES AND IT IS NOT A SOLICITATION OF AN OFFER TO BUY THESE SECURITIES IN ANY JURISDICTION WHERE THE OFFER OR SALE IS NOT PERMITTED.
114
| Property Types – Various | Loan #8 | Cut-off Date Balance: | $23,800,000 | |
| Property Addresses – Various | ExchangeRight 49 | Cut-off Date LTV: | 61.5% | |
| U/W NCF DSCR: | 2.56x | |||
| U/W NOI Debt Yield: | 9.4% |
no event of default exists under the ExchangeRight 49 Whole Loan; (ii) following a transfer, the existing borrower sponsor of the ExchangeRight 49 Whole Loan will (a) own at least a 1% direct or indirect equity ownership interest in each of the ExchangeRight 49 Borrower and any SPE component entity, (b) control the ExchangeRight 49 Borrower and SPE component entity, and (c) control the day-to-day operation of the ExchangeRight 49 Properties; (iii) if required by the lender, rating agency confirmation from each applicable rating agency; (iv) if the transfer would cause the transferee to acquire or to increase its direct or indirect interest in the ExchangeRight 49 Borrower to an amount equal to or greater than 25% (or 10% if such person is not formed, organized or incorporated in, or is not a citizen of the United States of America), such transferee and all other persons that would trigger such ownership thresholds in the ExchangeRight 49 Borrower are required to be a Qualified Transferee; (v) the Approved REIT (or other approved replacement guarantor) executes a payment guaranty and environmental indemnity, pursuant to which it agrees to be liable for all indemnity obligations (including environmental liabilities and obligations) for which the existing non-recourse carveout guarantors are liable under the non-recourse carveout guaranty; and (vi) following a transfer, the Approved REIT will own, directly or indirectly, no less than 51% of the legal and beneficial ownership interests in the ExchangeRight 49 Borrower and SPE component entity (a “Qualified REIT Transfer”).
“Approved REIT” means a real estate investment trust that (i) meets the requirements of a Qualified Transferee and for whom the lender receives a reasonably acceptable credit check; (ii) is at all times (a) owned, directly or indirectly, by the borrower sponsor in an amount that is not less than 1% of all equity interests, and (b) under the control of one or more persons that (1) meet the requirements of a Qualified Transferee and for whom the lender receives a reasonably acceptable credit check, and (2) is at all times owned, directly or indirectly, by the borrower sponsor in an amount not less than 51% of all equity interests, and controlled by the borrower sponsor; and (iii) is otherwise reasonably acceptable to the lender in all respects.
Property Management. The ExchangeRight 49 Properties are managed by NLP Management, LLC, an affiliate of the borrower.
Partial Release. Not permitted.
Real Estate Substitution. Not permitted.
Subordinate and Mezzanine Indebtedness. Not permitted.
Ground Lease. None.
Rights of First Refusal. The single tenant at each of the following seven properties has a right of first refusal (“ROFR”) to purchase the related property: CVS Pharmacy – Waukegan, IL, Pick ‘n Save – Wauwatosa, WI, Valspar Industrial – Massillon, OH, Walgreens – Chicago (Foster Pl), IL, Walgreens – Galesburg, IL, Walgreens – Hesperia, CA, and Walgreens – Saint Joseph, MO. Each ROFR is not extinguished by a foreclosure of the related property; however, each ROFR does not apply to foreclosure or deed-in-lieu thereof. See “Description of the Mortgage Pool—Tenant Leases—Purchase Options and Rights of First Refusal” in the Preliminary Prospectus.
Terrorism Insurance. The loan documents require that the property insurance policy required to be maintained by the borrower provide coverage for perils and acts of terrorism in an amount equal to 100% of the full replacement cost of the ExchangeRight 49 Properties, as well as business interruption insurance covering no less than the 18-month period following the occurrence of a casualty event, together with a 6-month extended period of indemnity. See “Risk Factors—Risks Relating to the Mortgage Loans—Terrorism Insurance May Not Be Available for All Mortgaged Properties” in the Preliminary Prospectus
THE INFORMATION IN THIS STRUCTURAL AND COLLATERAL TERM SHEET IS NOT COMPLETE AND MAY BE AMENDED PRIOR TO THE TIME OF SALE. THIS TERM SHEET IS NOT AN OFFER TO SELL THESE SECURITIES AND IT IS NOT A SOLICITATION OF AN OFFER TO BUY THESE SECURITIES IN ANY JURISDICTION WHERE THE OFFER OR SALE IS NOT PERMITTED.
115
| Office – Suburban | Loan #9 | Cut-off Date Balance: | $23,365,435 | |
| 501 Great Circle Road | 501 Great Circle | Cut-off Date LTV: | 63.5% | |
| Nashville, TN 37228 | U/W NCF DSCR: | 1.67x | ||
| U/W NOI Debt Yield: | 10.0% |

THE INFORMATION IN THIS STRUCTURAL AND COLLATERAL TERM SHEET IS NOT COMPLETE AND MAY BE AMENDED PRIOR TO THE TIME OF SALE. THIS TERM SHEET IS NOT AN OFFER TO SELL THESE SECURITIES AND IT IS NOT A SOLICITATION OF AN OFFER TO BUY THESE SECURITIES IN ANY JURISDICTION WHERE THE OFFER OR SALE IS NOT PERMITTED.
116
| Office – Suburban | Loan #9 | Cut-off Date Balance: | $23,365,435 | |
| 501 Great Circle Road | 501 Great Circle | Cut-off Date LTV: | 63.5% | |
| Nashville, TN 37228 | U/W NCF DSCR: | 1.67x | ||
| U/W NOI Debt Yield: | 10.0% |
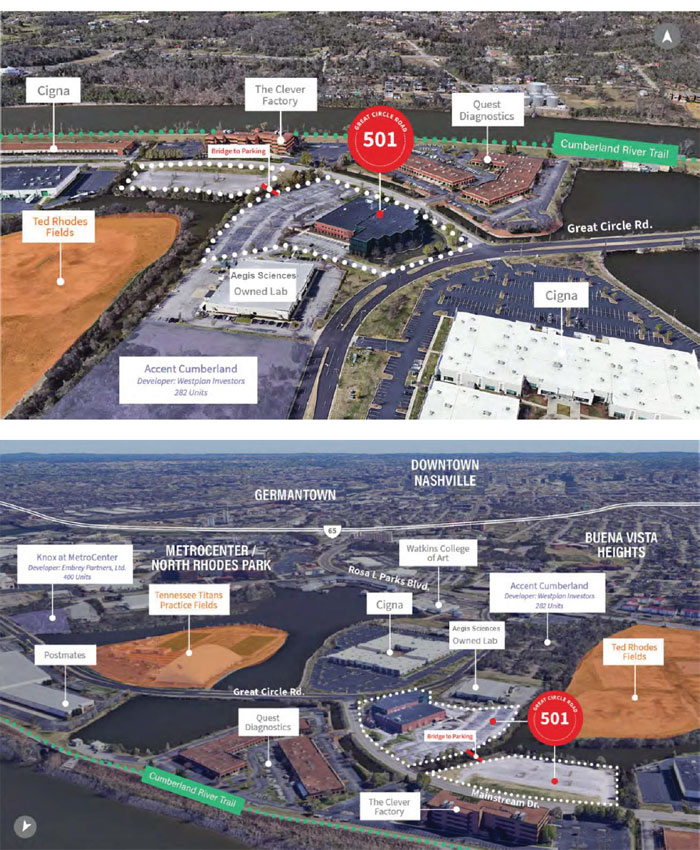
THE INFORMATION IN THIS STRUCTURAL AND COLLATERAL TERM SHEET IS NOT COMPLETE AND MAY BE AMENDED PRIOR TO THE TIME OF SALE. THIS TERM SHEET IS NOT AN OFFER TO SELL THESE SECURITIES AND IT IS NOT A SOLICITATION OF AN OFFER TO BUY THESE SECURITIES IN ANY JURISDICTION WHERE THE OFFER OR SALE IS NOT PERMITTED.
117
| Office – Suburban | Loan #9 | Cut-off Date Balance: | $23,365,435 | |
| 501 Great Circle Road | 501 Great Circle | Cut-off Date LTV: | 63.5% | |
| Nashville, TN 37228 | U/W NCF DSCR: | 1.67x | ||
| U/W NOI Debt Yield: | 10.0% |
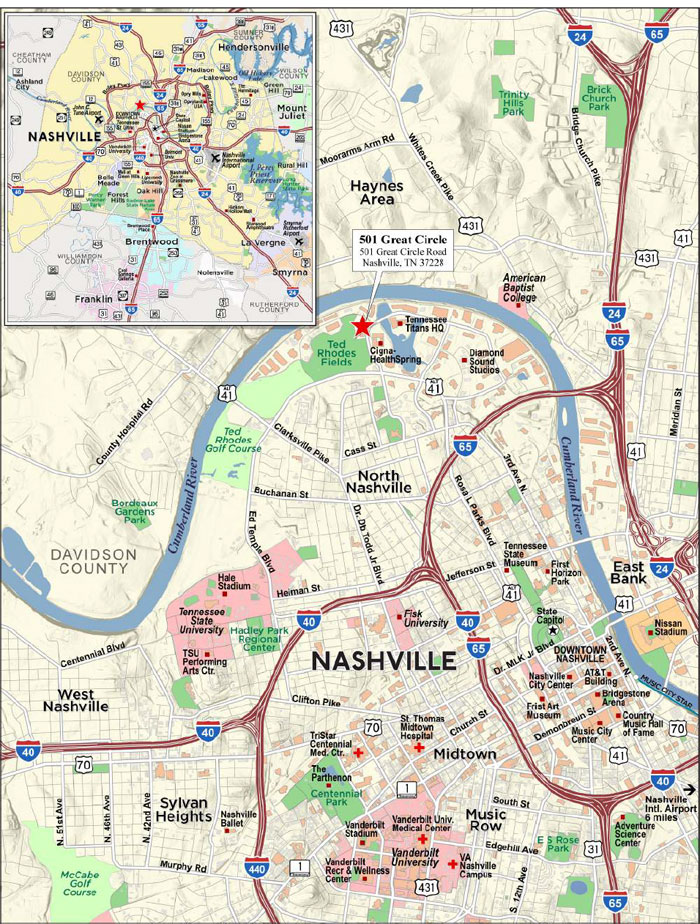
THE INFORMATION IN THIS STRUCTURAL AND COLLATERAL TERM SHEET IS NOT COMPLETE AND MAY BE AMENDED PRIOR TO THE TIME OF SALE. THIS TERM SHEET IS NOT AN OFFER TO SELL THESE SECURITIES AND IT IS NOT A SOLICITATION OF AN OFFER TO BUY THESE SECURITIES IN ANY JURISDICTION WHERE THE OFFER OR SALE IS NOT PERMITTED.
118
| No. 9 – 501 Great Circle | ||||||
| Mortgage Loan Information | Mortgaged Property Information | |||||
| Mortgage Loan Seller: | Oceanview Commercial Mortgage Finance, LLC | Single Asset/Portfolio: | Single Asset | |||
| Credit Assessment (Fitch/KBRA/Moody’s): | NR/NR/NR | Property Type – Subtype: | Office – Suburban | |||
| Original Principal Balance: | $23,400,000 | Location: | Nashville, TN | |||
| Cut-off Date Balance(1): | $23,365,435 | Size: | 109,295 SF | |||
| % of Initial Pool Balance: | 3.1% | Cut-off Date Balance Per SF(1): | $214.10 | |||
| Loan Purpose: | Refinance | Maturity Date Balance Per SF: | $169.63 | |||
| Borrower Sponsor: | Ian L. Ross | Year Built/Renovated: | 1985/2021 | |||
| Guarantor: | Ian L. Ross | Title Vesting: | Fee | |||
| Interest Rate: | 3.8600% | Property Manager: | Southeast Venture, LLC | |||
| Note Date: | November 5, 2021 | Current Occupancy (As of): | 100.0% (10/1/2021) | |||
| Seasoning: | 1 month | 2020 Occupancy(2): | 100.0% | |||
| Maturity Date: | November 6, 2031 | 2019 Occupancy(2): | NAV | |||
| IO Period: | 0 months | 2018 Occupancy(2): | NAV | |||
| Loan Term (Original): | 120 months | 2017 Occupancy(2): | NAV | |||
| Amortization Term (Original): | 360 months | As-Is Appraised Value(7): | $36,775,000 | |||
| Loan Amortization Type: | Amortizing Balloon | As-Is Appraised Value Per SF: | $336.47 | |||
| Call Protection: | L(24),D(92),O(4) | As-Is Appraisal Valuation Date: | August 24, 2021 | |||
| Lockbox Type: | Hard/Springing Cash Management | Underwriting and Financial Information(7) | ||||
| Additional Debt: | Yes | TTM 7/31/2021 NOI(8): | $881,702 | |||
| Additional Debt Type (Balance): | Mezzanine ($2,800,000) | YE 2020 NOI: | $353,691 | |||
| YE 2019 NOI(6): | NAV | |||||
| YE 2018 NOI(6): | NAV | |||||
| U/W Revenues: | $3,346,085 | |||||
| U/W Expenses: | $1,041,193 | |||||
| Escrows and Reserves(2) | U/W NOI(1): | $2,331,892 | ||||
| Initial | Monthly | Cap | U/W NCF: | $2,200,247 | ||
| Taxes | $59,308 | $29,654 | NAP | U/W DSCR based on NOI/NCF(1): | 1.77x / 1.67x | |
| Insurance | $0 | Springing | NAP | U/W Debt Yield based on NOI/NCF(1): | 10.0% / 9.4% | |
| Replacement Reserve | $660,000 | $1,822 | (3) | U/W Debt Yield at Maturity based on NOI/NCF(1): | 12.6% / 11.9% | |
| TI/LC Reserve | $0 | 13,622(4) | NAP | Cut-off Date LTV Ratio(1): | 63.5% | |
| Aegis TI/LC Reserve | $300,000 | $0 | NAP | LTV Ratio at Maturity (1): | 50.4% | |
| Sources and Uses | ||||||||
| Sources | Uses | |||||||
| Original loan amount | $23,400,000 | 89.3% | Refinance Amount | $19,459,536 | 74.3% | |||
| Mezzanine loan | 2,800,000 | 10.7% | Reserves | $1,019,308 | 3.9% | |||
| Closing Costs | $787,050 | 3.0% | ||||||
| Return of Equity | $4,934,106 | 18.8% | ||||||
| Total Sources | $26,200,000 | 100.0% | Total Uses | $26,200,000 | 100.0% | |||
| (1) | The Cut-off Date Balance Per SF, U/W Debt Yield Based on NOI, U/W DSCR based on NCF, and Cut-off Date LTV Ratio based on the 501 Great Circle Mortgage Loan (as defined below) and the 501 Great Circle Mezzanine Loan (as defined below) are $239.72, 8.90%, 1.31x, and 71.2%, respectively. See “Subordinate and Mezzanine Indebtedness” below. |
| (2) | See “Escrows” section below. |
| (3) | The 501 Great Circle Mortgage Loan documents require a replacement reserve cap of $660,000. Once the roof replacement is complete per the Property Conditions Assessment report, the Replacement Reserve Cap is will be reduced to $125,000 and replenished if used at a monthly amount of $1,822. |
| (4) | Monthly TI/LC Reserve shall commence on the payment date of May 6, 2026, an amount equal to $13,662 per month. |
| (5) | Represents annual occupancy for each year. |
| (6) | YE 2018 NOI and YE 2019 NOI are not available due to the acquisition of the 501 Great Circle Property in 2019. |
| (7) | While the 501 Great Circle Mortgage Loan (as defined below) was originated after the emergence of the novel coronavirus pandemic and the economic disruption resulting from measures to combat the pandemic, the pandemic is an evolving situation and could impact the 501 Great Circle Mortgage Loan more severely than assumed in the underwriting of the 501 Great Circle Mortgage Loan and could adversely affect the NOI, NCF and occupancy information, as well as the appraised value and the DSCR, LTV and Debt Yield metrics presented above. See “Risk Factors— Risks Related to Market Conditions and Other External Factors—Coronavirus Pandemic Has Adversely Affected the Global Economy and Will Likely Adversely Affect the Performance of the Mortgage Loans” in the Prospectus. |
THE INFORMATION IN THIS STRUCTURAL AND COLLATERAL TERM SHEET IS NOT COMPLETE AND MAY BE AMENDED PRIOR TO THE TIME OF SALE. THIS TERM SHEET IS NOT AN OFFER TO SELL THESE SECURITIES AND IT IS NOT A SOLICITATION OF AN OFFER TO BUY THESE SECURITIES IN ANY JURISDICTION WHERE THE OFFER OR SALE IS NOT PERMITTED.
119
| Office – Suburban | Loan #9 | Cut-off Date Balance: | $23,365,435 | |
| 501 Great Circle Road | 501 Great Circle | Cut-off Date LTV: | 63.5% | |
| Nashville, TN 37228 | U/W NCF DSCR: | 1.67x | ||
| U/W NOI Debt Yield: | 10.0% |
| (8) | At time of acquisition in 2019, the 501 Great Circle Property (as defined below) was approximately 60% vacant. JumpCrew LLC (“JumpCrew”) executed a 10 year lease term on July 20, 2019 with a June 30, 2020 commencement date, a September 15, 2020 delivery date, and an April 13, 2021 rent commencement date. The increase from TTM 7/31/2021 NOI to U/W NOI is driven by JumpCrew commencing rent payment April 13, 2021 and includes rent steps through July 2022 totaling $292,460. |
The Mortgage Loan. The mortgage loan (the “501 Great Circle Mortgage Loan”) is evidenced by a single promissory note secured by a first mortgage encumbering the fee simple interest in a 109,295 square foot office building located in Nashville, TN (the “501 Great Circle Property”).
The Borrower and Borrower Sponsor. The Borrower is MTP - 501 Great Circle, LLC (the “501 Great Circle Borrower”), a Delaware limited liability company and has one independent director. Legal counsel to the 501 Great Circle Borrower delivered a non-consolidation opinion in connection with the origination of the 501 Great Circle Mortgage Loan.
The Borrower Sponsor and non-recourse carveout guarantor is Ian L. Ross (the “501 Great Circle Borrower Sponsor”), the founder and managing principal of SomeraRoad Inc. (“SomeraRoad”). Mr. Ross is responsible for the oversight and management of the SomeraRoad’splatform across all business verticals. He is the Chairman of the Executive Committee, and as the Chairman, he is responsible for final investment decision making and business plan development. Mr. Ross founded SomeraRoad in 2016 and has since built the firm into a diversified and vertically integrated commercial real estate investment and development firm with over $900 million in deployed equity in 50+ markets with approximately 23 million square feet acquired totaling approximately $2 billion in total transactions. An affiliate of the guarantor is subject to litigation. See “Description of the Mortgage Pool–Loan Purpose; Litigation and Other Considerations” in the Preliminary Prospectus.
The Property. The 501 Great Circle Property is located on a 6.22-acre parcel known as 501 Great Circle Road in Nashville, TN. The 501 Great Circle Property is a suburban 3-story office building originally built in 1985 and renovated in 2021, with access to 540 parking spaces (4.94 per 1,000 SF) under a recorded easement. The 501 Great Circle Property is adjacent to the Tennessee Titans practice facility and the Cumberland River Greenway, a multi-use paved trail that follows the winding course of the Cumberland River to downtown Nashville. Primary access to the subject neighborhood is provided by Interstate Highway 65 and Rosa Parks Boulevard (Hwy 41-A), Mainstream Drive, and Great Circle Road. Interstate Highway 65 is primarily an eight-lane, variable width right-of-way, traversing the neighborhood in an east-west direction. Great Circle Road and Mainstream Drive provide direct access to the 510 Great Circle Property. Post-acquisition, the 501 Great Circle Borrower invested approximately $2.00 million in overall renovations at the 501 Great Circle Property consisting of a full lobby renovation, restrooms, common areas, yoga and locker rooms. The 501 Great Circle Property as of October 1, 2021 is 100% occupied and leased to two tenants: Aegis Sciences Corporation (“Aegis”) and JumpCrew, LLC (“JumpCrew”).
The Aegis and JumpCrew leases at the 501 Great Circle Property require an aggregate of 540 parking spaces between them, but per the survey, the 501 Great Circle Property only contains 384 spaces. There is a parcel of land adjacent to the 501 Great Circle Property that has been used informally for the necessary additional 156 parking spaces. The 501 Great Circle Borrower and adjoining property owner entered into a permanent easement at origination, which provides the 501 Great Circle Property with the right to use at least 156 parking spaces on the adjacent parcel. The zoning report indicates that applicable legal requirements only require 364 parking spaces (including 19 handicapped spaces), while the 501 Great Circle Property has 384 parking spaces (including 19 handicapped spaces).
Major Tenants.
JumpCrew LLC (61,900 square feet; 56.6% of net rentable area; 61.6% of underwritten base rent; April 30, 2031 lease expiration) – JumpCrew leases 61,900 sq. ft. on the second and third floors of the 501 Great Circle Property and serves as its national headquarters. In 2020, JumpCrew consolidated its leased spaces from a variety of Nashville locations to the 501 Great Circle Property. JumpCrew is an acquisition marketing platform focused on integrating digital technology and sales solutions to help their clients increase revenue by building awareness, driving leads, and converting sales. The company works with a growing roster of clients in publishing, healthcare, media, and technology to help them build awareness, increase leads, and convert sales. Since its founding in late 2016, the company has raised over $17.5 million in investment and grown its enterprise client roster to over 50 customers including Alibaba, Zillow, British Petroleum, Experian, Twitter, Waze, and Unilever.
Aegis Sciences Corporation (47,395 square feet; 43.4% of net rentable area; located on the first floor; 38.4% of underwritten base rent; June 30, 2031 lease expiration) - Aegis has occupied the 501 Great Circle Property since 2012, initially occupying 36,000 sq. ft. at the 501 Great Circle Property and later increased and consolidated its space from other locations to the 501 Great Circle Property in 2017. Aegis uses the demised premises as lab space, executive offices, cubicles, flex working space, meeting rooms, and storage. Aegis invested approximately $2 million in 2015 for its tenant space renovations and build-out of a state-of-the-art molecular lab and also invested $1 million for lab expansion in 2020-2021. Aegis delivers information related to medication compliance, substance abuse, and drug-drug interactions through definitive testing of urine, oral fluid, or blood specimens. Their healthcare testing services are designed for the needs of healthcare specialties in the areas of Pain Management, Behavioral and Mental Health, Substance Use Disorder, Prenatal, and Chronic Disease Management. Aegis provides information for enhanced patient care to a wide array of clinicians that serve Medicare, managed Medicaid, the commercially insured, and workers' compensation populations. In addition to healthcare testing services, Aegis offers anti-doping and forensic testing services to professional and amateur sports organizations, and college and university athletic programs. Aegis’s BioPharma lab provides molecular diagnostic services, including clinical trial services, pharmacogenetic testing, and other services. The tenant uses the subject premises for its BioPharma Lab location. Aegis is the largest COVID tester in middle Tennessee.
THE INFORMATION IN THIS STRUCTURAL AND COLLATERAL TERM SHEET IS NOT COMPLETE AND MAY BE AMENDED PRIOR TO THE TIME OF SALE. THIS TERM SHEET IS NOT AN OFFER TO SELL THESE SECURITIES AND IT IS NOT A SOLICITATION OF AN OFFER TO BUY THESE SECURITIES IN ANY JURISDICTION WHERE THE OFFER OR SALE IS NOT PERMITTED.
120
| Office – Suburban | Loan #9 | Cut-off Date Balance: | $23,365,435 | |
| 501 Great Circle Road | 501 Great Circle | Cut-off Date LTV: | 63.5% | |
| Nashville, TN 37228 | U/W NCF DSCR: | 1.67x | ||
| U/W NOI Debt Yield: | 10.0% |
The following table presents certain information relating to the tenancy at the 501 Great Circle Property:
Major Tenants(1)
| Tenant Name | Credit Rating (Fitch/Moody’s/ S&P) | Tenant NRSF | % of NRSF | Annual U/W Base Rent PSF(2) | Annual U/W Base Rent(2) | % of Total Annual U/W Base Rent | Lease Expiration Date | Extension Options | Termination Option (Y/N) | |
| Major Tenants | ||||||||||
| JumpCrew LLC | NR/NR/NR | 61,900 | 56.6% | $26.00 | $1,609,400 | 61.6% | 4/30/2031 | 2-5yr | N | |
| Aegis Sciences Corporation(3) | NR/NR/NR | 47,395 | 43.4% | $21.20 | $1,004,774 | 38.4% | 6/30/2031 | 2-5yr | N | |
| Total Major Tenants | 109,295 | 100.0% | $23.92 | $2,614,174 | 100.0% | |||||
| Occupied Collateral | 109,295 | 100.0% | $23.92 | $2,614,174 | 100.0% | |||||
| Vacant | 0 | 0.0% | ||||||||
| Collateral Total | 109,295 | 100.0% | ||||||||
| ||||||||||
| (1) | Information obtained from the underwritten rent roll dated 10/01/2021. |
| (2) | The Annual U/W Base Rent PSF and Annual U/W Base Rent shown above include rent steps through July 2022 totaling $292,460. |
| (3) | The tenant has a one-time option to reduce its premises by 14,197 RSF, with written notice to the 501 Great Circle Borrower no earlier than July 1, 2022 and no later than June 30, 2024 and taking effect six months later. |
The following table presents certain information relating to the lease rollover schedule at the 501 Great Circle Property:
Lease Expiration Schedule(1)
| Year Ending December 31, | No. of Leases Expiring | Expiring NRSF | % of Total NRSF | Cumulative Expiring NRSF | Cumulative % of Total NRSF(2) | Annual U/W Base Rent | % of Total Annual U/W Base Rent | Annual U/W Base Rent PSF |
| MTM | 0 | 0 | 0.0% | 0 | 0.0% | $0 | 0.0% | $0.00 |
| 2021 | 0 | 0 | 0.0% | 0 | 0.0% | $0 | 0.0% | $0.00 |
| 2022 | 0 | 0 | 0.0% | 0 | 0.0% | $0 | 0.0% | $0.00 |
| 2023 | 0 | 0 | 0.0% | 0 | 0.0% | $0 | 0.0% | $0.00 |
| 2024 | 0 | 0 | 0.0% | 0 | 0.0% | $0 | 0.0% | $0.00 |
| 2025 | 0 | 0 | 0.0% | 0 | 0.0% | $0 | 0.0% | $0.00 |
| 2026 | 0 | 0 | 0.0% | 0 | 0.0% | $0 | 0.0% | $0.00 |
| 2027 | 0 | 0 | 0.0% | 0 | 0.0% | $0 | 0.0% | $0.00 |
| 2028 | 0 | 0 | 0.0% | 0 | 0.0% | $0 | 0.0% | $0.00 |
| 2029 | 0 | 0 | 0.0% | 0 | 0.0% | $0 | 0.0% | $0.00 |
| 2030 | 0 | 0 | 0.0% | 0 | 0.0% | $0 | 0.0% | $0.00 |
| 2031 | 2 | 109,295 | 100.0% | 109,295 | 100.0% | $2,614,174 | 100.0% | $23.92 |
| Thereafter | 0 | 0 | 0.0% | 109,295 | 100.0% | $0 | 0.0% | $0.00 |
| Vacant | 0 | 0.0% | 109,295 | 100.0% | $0 | 0.0% | $0.00 | |
| Total/Weighted Average | 2 | 109,295 | 100.0% | $2,614,174 | 100.0% | $23.92 |
| (1) | Information obtained from the underwritten rent roll dated 10/01/2021. |
| (2) | The Annual U/W Base Rent PSF and Annual U/W Base Rent shown above include rent steps through July 2022 totaling $292,460 |
THE INFORMATION IN THIS STRUCTURAL AND COLLATERAL TERM SHEET IS NOT COMPLETE AND MAY BE AMENDED PRIOR TO THE TIME OF SALE. THIS TERM SHEET IS NOT AN OFFER TO SELL THESE SECURITIES AND IT IS NOT A SOLICITATION OF AN OFFER TO BUY THESE SECURITIES IN ANY JURISDICTION WHERE THE OFFER OR SALE IS NOT PERMITTED.
121
| Office – Suburban | Loan #9 | Cut-off Date Balance: | $23,365,435 | |
| 501 Great Circle Road | 501 Great Circle | Cut-off Date LTV: | 63.5% | |
| Nashville, TN 37228 | U/W NCF DSCR: | 1.67x | ||
| U/W NOI Debt Yield: | 10.0% |
The following table presents historical occupancy percentages at the 501 Great Circle Property:
Historical Occupancy
2019 | 2020 | 10/1/2021(1) |
| NAV | 100.0% | 100.0% |
| (1) | Information obtained from the underwritten rent roll. |
COVID-19 Update. As of October 1, 2021, the 501 Great Circle Property is open and operating. Approximately 100.0% of tenants by underwritten base rent and 100.0% of tenants by net rentable area paid full rent through September. The first payment date for the 501 Great Circle Mortgage Loan will be December 6, 2021.
Operating History and Underwritten Net Cash Flow. The following table presents certain information relating to the historical operating performance and underwritten net cash flow at the 501 Great Circle Property:
Cash Flow Analysis(1)
| 2020 | TTM 7/31/2021 | U/W | %(2) | U/W $ per SF | |
| Base Rent | $1,126,354 | $1,552,685 | $2,614,174(3) | 72.7% | $23.92(3) |
| Grossed Up Vacant Space | 0 | 0 | 0 | 0 | 0.00 |
| Gross Potential Rent | $1,126,354 | $1,552,685 | $2,614,174 | 72.7% | $23.92 |
| Total Recoveries(4) | 224,964 | 983,767 | 27.3 | 9.00 | |
| Net Rental Income | $1,126,354 | $1,777,649 | $3,597,941 | 100.0% | $32.92 |
| (Vacancy & Credit Loss) | 0 | 0 | (251,856) | (7.0) | (2.30) |
| Effective Gross Income | $1,126,354 | $1,777,649 | $3,346,085 | 93.0% | $30.62 |
| Real Estate Taxes | 191,887 | 198,667 | 355,850 | 10.6 | 3.26 |
| Insurance | 28,341 | 27,216 | 38,809 | 1.2 | 0.36 |
| Management Fee | 44,467 | 52,742 | 100,383 | 3.0 | 0.92 |
| Other Operating Expenses | 507,967 | 617,322 | 519,151 | 15.5 | 4.75 |
| Total Operating Expenses | $772,662 | $895,947 | $1,014,193 | 30.3% | $9.28 |
| Net Operating Income(5) | $353,691 | $881,702 | $2,331,892 | 69.7% | $21.34 |
| Replacement Reserves | 16,394 | 0 | 21,859 | 0.7 | 0.20 |
| TI/LC | 0 | 0 | 109,787 | 3.3 | 1.00 |
| Net Cash Flow | $337,297 | $881,702 | $2,200,247 | 65.8% | $20.13 |
| NOI DSCR(6) | 0.27x | 0.67x | 1.77x | ||
| NCF DSCR(6) | 0.26x | 0.67x | 1.67x | ||
| NOI Debt Yield(6) | 1.5% | 3.8% | 10.0% | ||
| NCF Debt Yield(6) | 1.4% | 3.8% | 9.4% |
| (1) | YE 2018 and YE 2019 historical operating performance are not available due to the acquisition of the 501 Great Circle Property in 2019. |
| (2) | Represents (i) percent of Net Rental Income for all revenue fields, (ii) percent of Net Rental Income Vacancy & Credit Loss and (iii) percent of Effective Gross Income for all other fields. |
| (3) | The Annual U/W Base Rent includes rent steps through July 2022 totalling $292,460. |
| (4) | Aegis and JumpCrew leases are triple net leases. |
| (5) | The increase from TTM 7/31/2021 net operating income to U/W net operating income is driven by JumpCrew commencing rent payment April 13, 2021 and includes rent steps through July 2022 totalling $292,460. |
| (6) | The NOI and NCF DSCR and the NOI and NCF Debt Yield are based on the 501 Great Circle Mortgage Loan. |
Appraisal. The appraiser concluded to an “As-Is” market value of $36,775,000 as of August 24, 2021.
Environmental Matters. According to the Phase I environmental site assessment dated September 7, 2021, there are no recognized environmental conditions identified at the 501 Great Circle Property. The 501 Great Circle Property is located on two former landfills, the Metrocenter Municipal Landfill (“Metrocenter Landfill”) and the Metro Center Aladdin Properties Landfill (“Aladdin Landfill”), which overlapped at Great Circle Road with the Metrocenter Landfill to the west of Great Circle Road and the Aladdin Landfill to the east. The two former landfills, which have obtained regulatory closure and which remain subject to institutional and/or engineering controls, constitute controlled recognized environmental conditions for which the assessment recommended no further action to be taken by the 501 Great Circle Borrower. In addition, a 2006 Phase II of the 501 Great Circle Property did not identify impacts to the 501 Great Circle Property above regulatory levels or requiring current action. In case of future redevelopment of the 501 Great Circle Property that
THE INFORMATION IN THIS STRUCTURAL AND COLLATERAL TERM SHEET IS NOT COMPLETE AND MAY BE AMENDED PRIOR TO THE TIME OF SALE. THIS TERM SHEET IS NOT AN OFFER TO SELL THESE SECURITIES AND IT IS NOT A SOLICITATION OF AN OFFER TO BUY THESE SECURITIES IN ANY JURISDICTION WHERE THE OFFER OR SALE IS NOT PERMITTED.
122
| Office – Suburban | Loan #9 | Cut-off Date Balance: | $23,365,435 | |
| 501 Great Circle Road | 501 Great Circle | Cut-off Date LTV: | 63.5% | |
| Nashville, TN 37228 | U/W NCF DSCR: | 1.67x | ||
| U/W NOI Debt Yield: | 10.0% |
would disturb underlying materials, the Phase I environmental assessment recommended that a soil management plan be implemented at the 501 Great Circle Property.
Market Overview and Competition. The 501 Great Circle Property is located in Nashville, Tennessee in the MetroCenter Submarket between the Nations and Germantown neighborhoods. The MetroCenter submarket is well-positioned with close proximity to the Nashville Central Business District (CBD), as well as high-end urban residential areas including Germantown. There are several multifamily developments within 0.5 miles of the 501 Great Circle Property catering to live and work environments. The 501 Great Circle Property is adjacent to the Tennessee Titans practice facility and the Cumberland River Greenway, a multi-use paved trail that follows the winding course of the Cumberland River to Nashville CBD.
Primary access to the subject neighborhood is provided by Interstate Highway 65 located approximately 1.5 miles and Rosa Parks Boulevard (Hwy 41-A) located approximately 0.5 miles, Mainstream Drive, and Great Circle Road. Interstate Highway 65 is primarily an eight-lane, variable width right-of-way, traversing the neighborhood in an east-west direction. Great Circle Road and Mainstream Drive provide direct access to the 501 Great Circle Property.
According to a third-party market research report, the 501 Great Circle Property is situated within the MetroCenter Submarket of Nashville, TN Office Market. As June 30, 2021, the submarket reported a total inventory of approximately 3.4 million square feet, representing approximately 3.5% of Nashville’s Office market.
According to a third party market research report, the estimated 2021 population within a one, three, and five-mile radius is 5,587, 73,750 and 201,432, respectively. The average household income within the same radii is $47,714, $70,409, and $84,198, respectively.
The appraiser identified eight competitive office buildings in the marketplace with direct rents ranging from $22.50 to $33.00 per square foot, triple net basis. The appraiser concluded to a market rent of $26.00 per square foot, triple net basis.
The following table presents certain information relating to the appraiser’s market rent conclusions for the 501 Great Circle Property:
Market Rent Summary(1)
| Office | |
| Market Rent (PSF) | $26.00 |
| Lease Term (Months) | 65 |
| Lease Type (Reimbursements) | NNN |
| Rent Increase Projection | 2.5% per annum |
| Tenant Improvements (New/Renew (PSF) | $40.00 / $20.00 |
| Free Rent (Months) | 5 |
| (1) | Information obtained from the appraisal. |
THE INFORMATION IN THIS STRUCTURAL AND COLLATERAL TERM SHEET IS NOT COMPLETE AND MAY BE AMENDED PRIOR TO THE TIME OF SALE. THIS TERM SHEET IS NOT AN OFFER TO SELL THESE SECURITIES AND IT IS NOT A SOLICITATION OF AN OFFER TO BUY THESE SECURITIES IN ANY JURISDICTION WHERE THE OFFER OR SALE IS NOT PERMITTED.
123
| Office – Suburban | Loan #9 | Cut-off Date Balance: | $23,365,435 | |
| 501 Great Circle Road | 501 Great Circle | Cut-off Date LTV: | 63.5% | |
| Nashville, TN 37228 | U/W NCF DSCR: | 1.67x | ||
| U/W NOI Debt Yield: | 10.0% |
The table below presents certain information relating to comparable sales pertaining to the 501 Great Circle Property identified by the appraiser:
Comparable Sales(1)
| Property Name | Location | Year Built/Renovated | Occupancy | Rentable Area (SF) | Sale Date | Sale Price | Sale Price (PSF) |
The Willoughby 746 Willoughby Avenue | Atlanta, GA | 2018/NAP | 100.0% | 59,594 | Aug-19 | $23,800,000 | $399.37 |
Two Greenway Centre 302 Innovation Drive | Franklin, TN | 2016/NAP | 87.0% | 155,326 | Dec-19 | $43,500,000 | $280.06 |
134 Meeting Street Building 134 Meeting Street | Charleston, SC | 1987/2015 | 93.0% | 71,947 | Sep-20 | $23,750,000 | $330.10 |
Creekside Crossing 6,8,10,12 Cadillac Drive | Brentwood, TN | 1998/2007 | 85.0% | 483,398 | Dec-20 | $129,000,000 | $266.86 |
Morrocroft Centre 6801 & 6805 Morrison Boulevard & 4064 Colony Road | Charlotte, NC | 1992/NAP | 95.0% | 291,792 | Jul-21 | $108,000,000 | $370.13 |
Gateway Plaza I & Maryland Park Center 5409 Maryland Way | Brentwood, TN | 1996/2015 | 95.0% | 126,544 | Jun-19 | $31,825,000 | $251.49 |
| (1) | Information obtained from the appraisal. |
The following table presents certain information relating to comparable office leases related to 501 Great Circle Property:
Comparable Office Leases(1)
| Property Name/Location | Year Built/ Renovated | Total GLA (SF) | Occupancy | Tenant | Tenant Size (SF) | Lease Start Date | Lease Term | Annual Base Rent PSF | Lease Type |
501 Great Circle (subject) Nashville, TN | 1985/2021 | 109,295(2) | 100.0%(2) | ||||||
Werthan Building at Taylor Place 601 Taylor Street Nashville, TN | 2021/NAP | 64,699 | NAV | Smith Gee Studio
| 9,173
| May-2021
| 10 Yrs.
| $29.00
| NNN
|
Nashville House 1 Vantage Way Nashville, TN | 1974/2006
| 192,473
| 97.0%
| NAV
| 39,600
| NAV
| NAV
| $41.50
| FSG
|
Sylvan Supply 4101 Charlotte Avenue Nashville, TN | 2020/NAP | 210,000 | 54.0% | Accenture | 28,201 | Feb-2020 | 10.3 Yrs. | $28.25 | NNN |
Sheds on Charlotte 2204-2212 Charlotte Avenue Nashville, TN | 2017/NAP | 85,032 | 100.0% | Flood, Bumstead, McCready | 8,500
| Oct-2019
| 7.4 Yrs.
| $31.00 | NNN |
Plaza I & II 210-220 Athens Way Nashville, TN | 1985/2005 | 156,279 | 94.0% | BrightSpring Health Services | 3,288 | Jan- 2021 | 5.4 Yrs. | $26.95 | Gross |
Highland Ridge Collection 535 Marriott Drive Nashville, TN | 1988/NAP | 478,423 | 49.0% | BIA (GSA) | 22,275 | June-2020 | 5 Yrs. | $25.50 | BY |
Riverview Office Building 545 Mainstream Drive Nashville, TN | 1982/2015 | 85,519 | 97.0% | ABM Industries | 1,720 | July-2020 | 3 Yrs. | $25.00 | FSG |
| (1) | Information obtained from the appraisal. |
| (2) | Information obtained from the underwritten rent roll. |
THE INFORMATION IN THIS STRUCTURAL AND COLLATERAL TERM SHEET IS NOT COMPLETE AND MAY BE AMENDED PRIOR TO THE TIME OF SALE. THIS TERM SHEET IS NOT AN OFFER TO SELL THESE SECURITIES AND IT IS NOT A SOLICITATION OF AN OFFER TO BUY THESE SECURITIES IN ANY JURISDICTION WHERE THE OFFER OR SALE IS NOT PERMITTED.
124
| Office – Suburban | Loan #9 | Cut-off Date Balance: | $23,365,435 | |
| 501 Great Circle Road | 501 Great Circle | Cut-off Date LTV: | 63.5% | |
| Nashville, TN 37228 | U/W NCF DSCR: | 1.67x | ||
| U/W NOI Debt Yield: | 10.0% |
Escrows.
Taxes - The 501 Great Circle Mortgage Loan documents require an upfront real estate tax reserve of $59,308 and ongoing monthly real estate tax reserves in an amount equal to one-twelfth of the real estate taxes that the lender estimates will be payable during the next 12 months (initially $29,654).
Insurance - The 501 Great Circle Mortgage Loan documents do not require upfront or ongoing monthly insurance reserves so long as no event of default has occurred and is continuing and the 501 Great Circle Property is insured pursuant to an acceptable blanket insurance policy.
Replacement Reserve - The 501 Great Circle Mortgage Loan documents require an upfront replacement reserve (the “Replacement Reserve”) totaling $660,000 (the “Replacement Reserve Cap”). If used, the Replacement Reserve is required to be replenished back to the Replacement Reserve Cap at a monthly amount of $1,822. Once the roof replacement is complete per the Property Conditions Assessment report, the Replacement Reserve Cap is required to be reduced to $125,000 and replenished if used at a monthly amount of $1,822.
Aegis TI/LC Reserve - The 501 Great Circle Mortgage Loan documents require an Aegis TI/LC Reserve of $300,000. Per the Aegis lease, the tenant is to receive from the landlord $300,000 of TI in connection with a one-time option to downsize between January 1, 2023 and January 1, 2025 or, in the event the option to downsize is not exercised, after January 1, 2025.
TI/LC Reserve - Commencing on the payment date of May 6, 2026, an amount equal to $13,662 per month is required to be funded monthly.
Lockbox and Cash Management. The 501 Great Circle Mortgage Loan is structured with a hard lockbox and springing cash management provisions. A cash flow sweep is triggered by the following:
(i) after an event of default occurs under the 501 Great Circle Mortgage Loan (following any required notice and the expiration of the applicable cure periods) and continuing for the term of the 501 Great Circle Mortgage Loan or, provided that there are not more than two cures or a default or any bankruptcy default, until the lender accepts a cure of the related event of default; or
(ii) if the debt service coverage ratio is less than 1.20x until the debt service coverage ratio is equal to or greater than such threshold for two (2) consecutive quarters;
(iii) if the “Trigger Lease Event” (as defined below) is continuing with respect to any “Trigger Lease” (as defined below), until the occurrence of the related “Trigger Lease Cure” (as defined below); and
(iii) after an event of default occurs under the 501 Great Circle Mezzanine Loan (following any required notice and the expiration of the applicable cure periods) and continuing for the term of the 501 Great Circle Mezzanine Loan or until a cure of the related event of default in accordance with the 501 Great Circle Mezzanine Loan documents.
A “Trigger Lease Event” means any of the following with respect to a Trigger Lease (and the related “Trigger Lease Cure” is as noted below):
(i) the tenant is delinquent in payment of rent more than 60 days (but if the applicable tenant has been more than 30 days in arrears at any other time during the previous 12 months, or the rent payable by such tenant, together with the rent payable by all other Trigger Tenants then in arrears, exceeds 10% of all rents, the 60-day period is reduced to 30 days) (until such tenant has been current in the payment of all rent for 90 days);
(ii) that the tenant or its parent company is subject of bankruptcy proceeding (until it has affirmed its lease, without an amendment, and exited bankruptcy under a confirmed plan of reorganization; or, for a tenant’s parent, is solvent to the lender’s satisfaction for two consecutive quarters or is no longer the subject of a bankruptcy proceeding);
(iii) for five (5) consecutive Business Days (except for temporary closures for repairs, restoration, or rehabilitation), the tenant vacates, surrenders or ceases to conduct its normal business operations, in each such event, at substantially all of its demised premises (including without limitation, utilizing substantially less than all of the demised premises, personnel or equipment utilized as of the orignation date, and including by means of subleasing all or substantially all of its demised premises, other than subleases entered into in compliance with this Agreement), or otherwise “goes dark”, or has notified the 501 Great Circle Borrower of the intent to do any of the foregoing, or failed to timely open for business as required by its lease (until the tenant is operating and open for business in substantially all of its space for not less than 90 consecutive days and delivered an acceptable estoppel), provided, however, that such “go-dark” event will not be a “Trigger Lease Event” with respect to Aegis or JumpCrew if such “go-dark” event:
(1)(A) is the result of such tenant complying with (I) a mandatory stay-at-home order (or a similar mandatory order prohibiting such tenant from occupying and operating at the space demised to such tenant
THE INFORMATION IN THIS STRUCTURAL AND COLLATERAL TERM SHEET IS NOT COMPLETE AND MAY BE AMENDED PRIOR TO THE TIME OF SALE. THIS TERM SHEET IS NOT AN OFFER TO SELL THESE SECURITIES AND IT IS NOT A SOLICITATION OF AN OFFER TO BUY THESE SECURITIES IN ANY JURISDICTION WHERE THE OFFER OR SALE IS NOT PERMITTED.
125
| Office – Suburban | Loan #9 | Cut-off Date Balance: | $23,365,435 | |
| 501 Great Circle Road | 501 Great Circle | Cut-off Date LTV: | 63.5% | |
| Nashville, TN 37228 | U/W NCF DSCR: | 1.67x | ||
| U/W NOI Debt Yield: | 10.0% |
pursuant to the applicable lease) issued by a Governmental Authority having jurisdiction over such tenant and/or the 501 Great Circle Property relating to response to any pandemic, including, without limitation, the COVID-19 global pandemic or (II) internal safety compliance and protocols established by such tenant relating to any pandemic, including, without limitation, the COVID-19 global pandemic, and (B) such “go-dark” event lasts no longer than six (6) consecutive calendar months; or
(2) if such tenant “goes dark”, vacates or abandons (25%) or less of the space demised to such tenant pursuant to its Trigger lease;
(iv) that the tenant’s lease will expire in less than 18 months (as of the orgination date, December 31, 2029, for Aegis, and October 31, 2029, for JumpCrew) (until the tenant exercises the next renewal option available); or
(v) that the tenant has terminated or canceled its lease or given notice of intent to do so (until the tenant has revoked such notice and its lease is in full force and effect). Any Trigger Lease Event may be cured at such time as the entire space demised by such lease is leased to a new tenant(s) approved by the lender, and such replacement tenant has delivered an acceptable estoppel).
A “Trigger Lease” means each Lease with a Trigger Tenant, as such Lease may be amended, modified, restated, renewed, extended or assigned from time to time. A “Trigger Tenant” means, individually and collectively, Aegis and JumpCrew, and any replacement Tenant occupying all or portion of the space at the Property leased as of the Closing Date to such Trigger Tenant (and any parent company thereof or guarantor of such replacement Tenant’s Lease, as applicable).
Property Management. The 501 Great Circle Property is managed by Southeast Venture, LLC, a third-party property manager.
Partial Release. Not permitted.
Real Estate Substitution. Not permitted.
Subordinate and Mezzanine Indebtedness. Shortly following the origination of the 501 Great Circle Mortgage Loan, Oceanview Life and Annuity Company, an affiliate of Oceanview Commercial Mortgage Finance, LLC, made a $2,800,000 mezzanine loan (the “501 Great Circle Mezzanine Loan”) to the sole member of the 501 Great Circle Borrower, which is secured by the sole member’s ownership interest in the 501 Great Circle Borrower. The 501 Great Circle Mezzanine Loan is coterminous with the 501 Great Circle Mortgage Loan and subject to an intercreditor agreement. The 501 Great Circle Mezzanine Loan accrues interest at a fixed per annum rate equal to 10.00% and amortizes on a 15 year schedule. See “Description of the Mortgage Pool–Additional Indebtedness-Mezzanine Indebtedness” in the Preliminary Prospectus.
The following table presents certain information relating to 501 Great Circle Mezzanine Loan:
Mezzanine Original Balance | Mezzanine Interest Rate | Original Term (mos.) | Original Term (mos.) | Original IO Term (mos.) | Total Debt NCF DSCR | Total Debt NOI Debt | Total Debt Date LTV | |
| 501 Great Circle Mezzanine Loan | $2,800,000 | 10.000% | 120 | 180 | 0 | 1.31x | 8.9% | 71.2% |
Ground Lease. None.
Terrorism Insurance. The 501 Great Circle Mortgage Loan documents require that the “all risk” insurance policy required to be maintained by the 501 Great Circle Borrower provides coverage for terrorism in an amount equal to the full replacement cost of the 501 Great Circle Property, as well as business interruption insurance covering no less than the 18-month period following the occurrence of a casualty event, together with a 6-month extended period of indemnity.
THE INFORMATION IN THIS STRUCTURAL AND COLLATERAL TERM SHEET IS NOT COMPLETE AND MAY BE AMENDED PRIOR TO THE TIME OF SALE. THIS TERM SHEET IS NOT AN OFFER TO SELL THESE SECURITIES AND IT IS NOT A SOLICITATION OF AN OFFER TO BUY THESE SECURITIES IN ANY JURISDICTION WHERE THE OFFER OR SALE IS NOT PERMITTED.
126
(THIS PAGE INTENTIONALLY LEFT BLANK)
THE INFORMATION IN THIS STRUCTURAL AND COLLATERAL TERM SHEET IS NOT COMPLETE AND MAY BE AMENDED PRIOR TO THE TIME OF SALE. THIS TERM SHEET IS NOT AN OFFER TO SELL THESE SECURITIES AND IT IS NOT A SOLICITATION OF AN OFFER TO BUY THESE SECURITIES IN ANY JURISDICTION WHERE THE OFFER OR SALE IS NOT PERMITTED.
127
| Loan #10 | Cut-off Date Balance: | $20,700,000 | ||
| Manufactured Housing | SSA Midwest MHC Portfolio | Cut-off Date LTV: | 72.2% | |
| Property Addresses - Various | U/W NCF DSCR: | 1.57x | ||
| U/W NOI Debt Yield: | 9.3% |
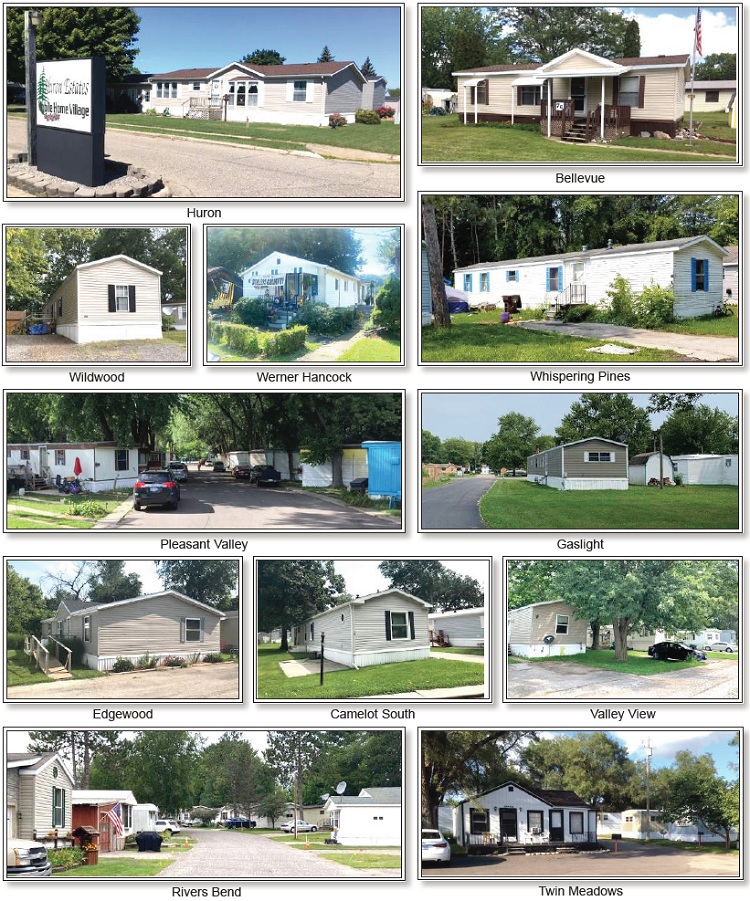
THE INFORMATION IN THIS STRUCTURAL AND COLLATERAL TERM SHEET IS NOT COMPLETE AND MAY BE AMENDED PRIOR TO THE TIME OF SALE. THIS TERM SHEET IS NOT AN OFFER TO SELL THESE SECURITIES AND IT IS NOT A SOLICITATION OF AN OFFER TO BUY THESE SECURITIES IN ANY JURISDICTION WHERE THE OFFER OR SALE IS NOT PERMITTED.
128
| Loan #10 | Cut-off Date Balance: | $20,700,000 | ||
| Manufactured Housing | SSA Midwest MHC Portfolio | Cut-off Date LTV: | 72.2% | |
| Property Addresses - Various | U/W NCF DSCR: | 1.57x | ||
| U/W NOI Debt Yield: | 9.3% |
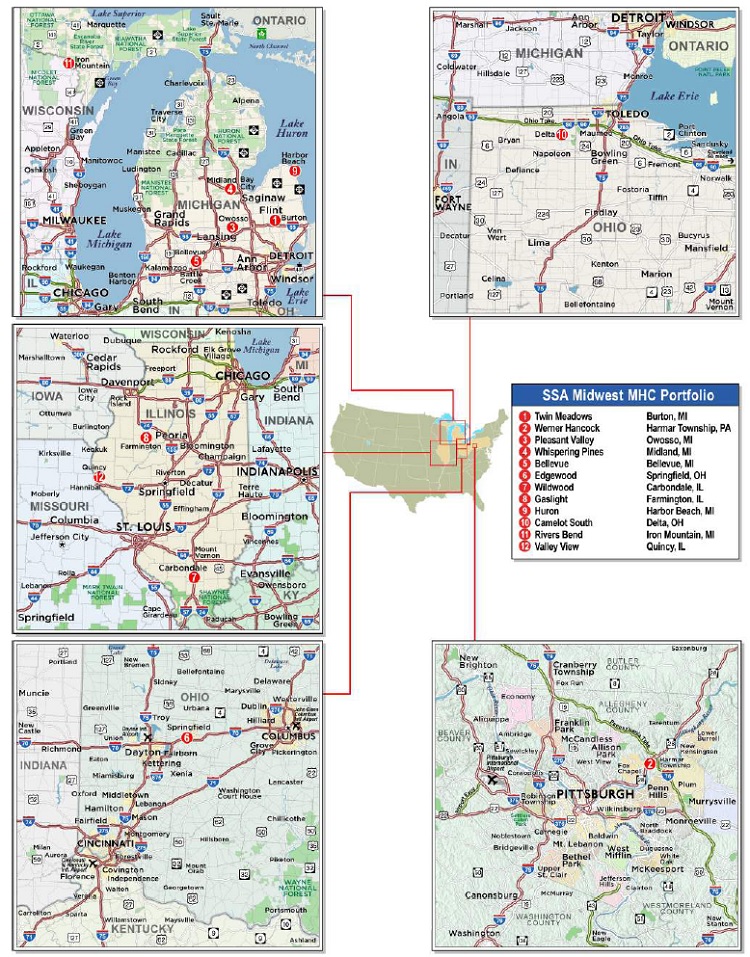
THE INFORMATION IN THIS STRUCTURAL AND COLLATERAL TERM SHEET IS NOT COMPLETE AND MAY BE AMENDED PRIOR TO THE TIME OF SALE. THIS TERM SHEET IS NOT AN OFFER TO SELL THESE SECURITIES AND IT IS NOT A SOLICITATION OF AN OFFER TO BUY THESE SECURITIES IN ANY JURISDICTION WHERE THE OFFER OR SALE IS NOT PERMITTED.
129
| No. 10– SSA Midwest MHC Portfolio | |||||||
| Mortgage Loan Information | Mortgaged Property Information | ||||||
| Mortgage Loan Seller: | LMF Commercial, LLC | Single Asset/Portfolio: | Portfolio | ||||
| Credit Assessment (Fitch/KBRA/Moody’s): | NR/NR/NR | Property Type – Subtype: | Manufactured Housing | ||||
| Original Principal Balance: | $20,700,000 | Location: | Various | ||||
| Cut-off Date Balance: | $20,700,000 | Size: | 971 Pads | ||||
| % of Initial Pool Balance: | 2.7% | Cut-off Date Balance Per Unit: | $21,318 | ||||
| Loan Purpose(1): | Acquisition/Refinance | Maturity Date Balance Per Unit: | $18,454 | ||||
| Borrower Sponsors: | Michael Forrest, Daniel Benedict, Steven Cherin, John Michael Calin and Dr. Anant J. Gandhi, as Trustee of the VGSB Realty Trust, under the Irrevocable Trust Agreement dated August 7, 2020 | Year Built/Renovated: | Various/Various | ||||
| Guarantors: | Michael Forrest, Daniel Benedict, Steven Cherin, John Michael Calin and Dr. Anant J. Gandhi, as Trustee of the VGSB Realty Trust, under the Irrevocable Trust Agreement dated August 7, 2020 | Title Vesting: | Fee | ||||
| Interest Rate: | 3.9500% | Property Manager: | Evergreen Parkes LLC (borrower-affiliate) | ||||
| Note Date: | November 1, 2021 | Current Occupancy (As of): | 81.6% (9/13/2021) | ||||
| Seasoning: | 1 month | YE 2020 Occupancy(3): | NAV | ||||
| Maturity Date: | November 6, 2031 | YE 2019 Occupancy(3): | NAV | ||||
| IO Period: | 36 months | YE 2018 Occupancy(3): | NAV | ||||
| Loan Term (Original): | 120 months | YE 2017 Occupancy(3): | NAV | ||||
| Amortization Term (Original): | 360 months | Appraised Value: | $28,680,000 | ||||
| Loan Amortization Type: | Interest Only, Amortizing Balloon | Appraised Value Per Unit: | $29,537 | ||||
| Call Protection: | L(25),D(91),O(4) | Appraisal Valuation Date(4): | Various | ||||
| Lockbox Type: | Springing | Underwriting and Financial Information(5) | |||||
| Additional Debt: | No | TTM NOI (8/31/2021): | $1,972,604 | ||||
| Additional Debt Type (Balance): | NAP | YE 2020 NOI(3): | NAV | ||||
| YE 2019 NOI(3): | NAV | ||||||
| YE 2018 NOI(3): | NAV | ||||||
| U/W Revenues: | $3,307,088 | ||||||
| U/W Expenses: | $1,384,352 | ||||||
| U/W NOI: | $1,922,736 | ||||||
| U/W NCF: | $1,854,766 | ||||||
| Escrows and Reserves(2) | U/W DSCR based on NOI/NCF: | 1.63x / 1.57x | |||||
| Initial | Monthly | Cap | U/W Debt Yield based on NOI/NCF: | 9.3% / 9.0% | |||
| Taxes | $87,739 | $16,712 | NAP | U/W Debt Yield at Maturity based on NOI/NCF: | 10.7% / 10.4% | ||
| Insurance | $18,642 | $5,918 | NAP | Cut-off Date LTV Ratio: | 72.2% | ||
| Replacement Reserve | $0 | $5,664 | NAP | LTV Ratio at Maturity: | 62.5% | ||
| Deferred Maintenance | $490,866 | $0 | NAP | ||||
| Sewer Reserve | $250,000 | $0 | NAP | ||||
| Sources and Uses | ||||||||
| Sources | Uses | |||||||
| Original loan amount | $20,700,000 | 100.0% | Purchase Price | $11,800,000 | 57.0% | |||
| Loan Payoff | 5,650,060 | 27.3 | ||||||
| Upfront reserves | 847,248 | 4.1 | ||||||
| Closing costs | 1,100,389 | 5.3 | ||||||
| Return of equity | 1,302,303 | 6.3 | ||||||
| Total Sources | $20,700,000 | 100.0% | Total Uses | $20,700,000 | 100.0% | |||
| (1) | The SSA Midwest MHC Portfolio Mortgage Loan (as defined below) was used to acquire seven properties and refinance five properties. |
| (2) | See “Escrows” section for a full description of Escrows and Reserves. |
| (3) | The borrower sponsors acquired the SSA Midwest MHC Portfolio (as defined below) between 2019 and 2021; as such, historical occupancies and cash flows are not available. |
| (4) | Appraisal valuation dates of the SSA Midwest MHC Portfolio range from July 30, 2021 to August 11, 2021. |
THE INFORMATION IN THIS STRUCTURAL AND COLLATERAL TERM SHEET IS NOT COMPLETE AND MAY BE AMENDED PRIOR TO THE TIME OF SALE. THIS TERM SHEET IS NOT AN OFFER TO SELL THESE SECURITIES AND IT IS NOT A SOLICITATION OF AN OFFER TO BUY THESE SECURITIES IN ANY JURISDICTION WHERE THE OFFER OR SALE IS NOT PERMITTED.
130
| Loan #10 | Cut-off Date Balance: | $20,700,000 | ||
| Manufactured Housing | SSA Midwest MHC Portfolio | Cut-off Date LTV: | 72.2% | |
| Property Addresses - Various | U/W NCF DSCR: | 1.57x | ||
| U/W NOI Debt Yield: | 9.3% |
| (5) | While the SSA Midwest MHC Portfolio Mortgage Loan (as defined below) was originated after the emergence of the novel coronavirus pandemic and the economic disruption resulting from measures to combat the pandemic, the pandemic is an evolving situation and could impact the SSA Midwest MHC Portfolio Mortgage Loan more severely than assumed in the underwriting of the SSA Midwest MHC Portfolio Mortgage Loan. The pandemic and resulting economic disruption could also adversely affect the NOI, NCF and occupancy information, as well as the appraised value and the DSCR, LTV and Debt Yield metrics presented above. See “Risk Factors—Risks Related to Market Conditions and Other External Factors—Coronavirus Pandemic Has Adversely Affected the Global Economy and Will Likely Adversely Affect the Performance of the Mortgage Loans” in the Preliminary Prospectus. |
The Mortgage Loan. The mortgage loan (the “SSA Midwest MHC Portfolio Mortgage Loan”) is evidenced by a single promissory note secured by a first mortgage encumbering the fee interest in 12 manufactured housing community (“MHC”) properties located in twelve cities throughout Michigan, Illinois, Ohio and Pennsylvania (each, a “SSA Midwest MHC Portfolio Property”, and collectively, the “SSA Midwest MHC Portfolio”).
The Borrowers and Borrower Sponsors. The borrowers are twelve Delaware special purpose entities structured to be bankruptcy remote (each individually, a “SSA Midwest MHC Portfolio Borrower” and collectively, the “SSA Midwest MHC Portfolio Borrowers”). The borrower sponsors and non-recourse carveout guarantors of the SSA Midwest MHC Portfolio Mortgage Loan are Michael Forrest, Daniel Benedict, Steven Cherin, John Michael Calin and Dr. Anant J. Gandhi, as Trustee of the VGSB Realty Trust, under the Irrevocable Trust Agreement dated August 7, 2020.
Steven Cherin is a co-founder of SSA Capital Partner (“SSA”) and serves as general counsel. John Michael Calin is a member of the general partner of SSA and is responsible for sourcing deals directly from owners and property management. Mr. Calin is involved in all SSA’s properties and works with the on-site managers to ensure the operation of all of the properties. Mr. Calin has managed over 1,000 units and has invested in and managed manufactured housing communities since 2008. Daniel Benedict is the founder and president of Benedict Realty Group, also known as BRG Management, LLC (“BRG”). BRG is a privately held company founded over twenty years ago, which currently owns approximately 5,500 multi-family units in New York City and its boroughs, as well as over a million square feet of commercial properties. Michael Forrest, who is based in Michigan, has been involved in property management of commercial real estate for over 30 years, with 20 years of experience in managing multifamily properties and 10 years in managing manufactured housing properties.
The Properties. The SSA Midwest MHC Portfolio is a twelve-property manufactured housing community portfolio located in twelve different cities throughout Michigan, Illinois, Ohio and Pennsylvania, totaling approximately 971 pad sites. Six of the properties totaling 567 pad sites (58.4% of the SSA Midwest MHC Portfolio pad sites) are located in Michigan, three properties totaling 214 pad sites (22.0% of the SSA Midwest MHC Portfolio pad sites) are located in Illinois, two properties totaling 106 pad sites (10.9% of the SSA Midwest MHC Portfolio pad sites) are located in Ohio, and one property with 84 pad sites (8.7% of the SSA Midwest MHC Portfolio pad sites) is located in Pennsylvania. As of the September 13, 2021 rent rolls, occupancies range from 65.9% at the Twin Meadows property in Burton, Michigan to 94.6% at the Edgewood property in Springfield, Ohio and the SSA Midwest MHC Portfolio has a weighted average physical occupancy of 81.6%.
The SSA Midwest Portfolio Mortgage Loan collateral includes 199 Park Owned Homes (“POHs”) that are owned by the SSA Midwest MHC Portfolio Borrowers, including 47 lease to own homes. Pursuant to the SSA Midwest Portfolio Mortgage Loan documents, the lender has been granted a security interest in all POHs (affiliates of the SSA Midwest MHC Portfolio Borrower are not permitted to own homes in the SSA Midwest MHC Portfolio). The SSA Midwest MHC Portfolio Borrowers are additionally required to deliver all certificates of title to the lender to hold during the term of the SSA Midwest Portfolio Mortgage Loan, including in connection with any new homes acquired by a SSA Midwest MHC Portfolio Borrower. Neither the SSA Midwest MHC Portfolio Borrowers nor any affiliate is permitted to provide any financing of POHs at the SSA Midwest MHC Portfolio, except in connection with any lease purchase option. The SSA Midwest MHC Portfolio Borrowers are permitted to sell the POHs during the term of the SSA Midwest Portfolio Mortgage Loan either in connection with the exercise of a lease purchase option or in an arms’ length sale to the then-current tenant in such home and may also dispose of abandoned homes with no value. The SSA Midwest Portfolio Mortgage Loan documents contain a recourse carveout for losses in connection with the removal, sale, transfer, pledge, disposal or other disposition of any POHs or the creation or existence of any lien or encumbrance on any POHs in violation of the SSA Midwest Portfolio Mortgage Loan documents. No income from the home rentals of the POHs was included in the lender’s underwritten revenues; only the income derived from the related pad sites was underwritten. Under the SSA Midwest MHC Portfolio Mortgage Loan documents, such POHsmay not exceed 25.0% of the total pads at the SSA Midwest MHC Portfolio. See “Description of the Mortgage Pool—Mortgage Pool Characteristics—Manufactured Housing Properties” in the Preliminary Prospectus for limitations on the purchase, sale, and release of homes owned by the SSA Midwest MHC Portfolio Borrowers.
THE INFORMATION IN THIS STRUCTURAL AND COLLATERAL TERM SHEET IS NOT COMPLETE AND MAY BE AMENDED PRIOR TO THE TIME OF SALE. THIS TERM SHEET IS NOT AN OFFER TO SELL THESE SECURITIES AND IT IS NOT A SOLICITATION OF AN OFFER TO BUY THESE SECURITIES IN ANY JURISDICTION WHERE THE OFFER OR SALE IS NOT PERMITTED.
131
| Loan #10 | Cut-off Date Balance: | $20,700,000 | ||
| Manufactured Housing | SSA Midwest MHC Portfolio | Cut-off Date LTV: | 72.2% | |
| Property Addresses - Various | U/W NCF DSCR: | 1.57x | ||
| U/W NOI Debt Yield: | 9.3% |
The following table presents certain information regarding the SSA Midwest MHC Portfolio:
SSA Midwest MHC Portfolio
| Property Name – Location | Allocated Cut-off Date Balance | % of Portfolio Cut-off Date Balance | Occupancy(1) | Year Built/ Renovated | Net Rentable Area (Pads)(1) | Appraised Value | UW NOI(1) | % of UW NOI |
Twin Meadows 1021 East Scottwood Avenue Burton, MI | $4,410,000 | 21.3% | 65.9% | 1958/NAP | 211 | $5,880,000 | $395,696 | 20.6% |
Werner Hancock Werner Camp Road Harmar Township, PA | $3,187,500 | 15.4% | 86.9% | 1950/NAP | 84 | $4,250,000 | $345,045 | 17.9% |
Pleasant Valley 1704 M 52 Owosso, MI | $2,130,000 | 10.3% | 93.1% | 1980/NAP | 65 | $2,840,000 | $167,907 | 8.7% |
Whispering Pines 227 West Olson Road Midland, MI | $2,103,250 | 10.2% | 93.6% | 1970-1980/NAP | 109 | $3,400,000 | $189,900 | 9.9% |
Bellevue 23951 15 Mile Road Bellevue, MI | $2,055,000 | 9.9% | 93.4% | 1970/NAP | 76 | $2,740,000 | $177,650 | 9.2% |
Edgewood 3834 Dayton Springfield Road Springfield, OH | $1,185,000 | 5.7% | 94.6% | 1950/1992 | 56 | $1,580,000 | $82,324 | 4.3% |
Wildwood 173 Wildwood Dr Carbondale, IL | $1,143,750 | 5.5% | 75.0% | 1968/NAP | 104 | $1,525,000 | $129,097 | 6.7% |
Gaslight 101 West Pearl Street Farmington, IL | $937,500 | 4.5% | 85.7% | 1966/NAP | 56 | $1,250,000 | $96,692 | 5.0% |
Huron 163 Nelson Street Harbor Beach, MI | $909,000 | 4.4% | 81.8% | 1980/NAP | 55 | $1,360,000 | $86,712 | 4.5% |
Camelot South 3402 OH-109 Delta, OH | $900,000 | 4.3% | 76.0% | 1970/NAP | 50 | $1,350,000 | $101,925 | 5.3% |
Rivers Bend N 3905 Pine Mountain Road Iron Mountain, MI | $895,000 | 4.3% | 80.4% | 1970/NAP | 51 | $1,380,000 | $66,742 | 3.5% |
Valley View 2507 North 5th Street Quincy, IL | $844,000 | 4.1% | 92.6% | 1960/NAP | 54 | $1,125,000 | $83,046 | 4.3% |
| Total/Weighted Average | $20,700,000 | 100.0% | 81.6% | 971 | $28,680,000 | $1,922,736 | 100.0% |
| (1) | Based on the underwritten rent roll. |
The following table presents historical occupancy percentages at the SSA Midwest MHC Portfolio:
Historical Occupancy
12/31/2018(1) | 12/31/2019(1) | 12/31/2020(1) | 9/13/2021(2) |
| NAV | NAV | NAV | 81.6% |
| (1) | The SSA Midwest MHC Portfolio Borrowers acquired the SSA Midwest MHC Portfolio between 2019 and 2021; as such, historical occupancies are not available. |
| (2) | Information obtained from the underwritten rent roll. |
COVID-19 Update. As of November 5, 2021, the SSA Midwest MHC Portfolio are open and operating. The SSA Midwest MHC Portfolio Mortgage Loan is not subject to any modification or forbearance request. The first debt service payment of the SSA Midwest MHC Portfolio Mortgage Loan is due December 6, 2021.
THE INFORMATION IN THIS STRUCTURAL AND COLLATERAL TERM SHEET IS NOT COMPLETE AND MAY BE AMENDED PRIOR TO THE TIME OF SALE. THIS TERM SHEET IS NOT AN OFFER TO SELL THESE SECURITIES AND IT IS NOT A SOLICITATION OF AN OFFER TO BUY THESE SECURITIES IN ANY JURISDICTION WHERE THE OFFER OR SALE IS NOT PERMITTED.
132
| Loan #10 | Cut-off Date Balance: | $20,700,000 | ||
| Manufactured Housing | SSA Midwest MHC Portfolio | Cut-off Date LTV: | 72.2% | |
| Property Addresses - Various | U/W NCF DSCR: | 1.57x | ||
| U/W NOI Debt Yield: | 9.3% |
Operating History and Underwritten Net Cash Flow. The following table presents certain information relating to the historical operating performance and underwritten net cash flow at the SSA Midwest MHC Portfolio:
Cash Flow Analysis
| TTM 8/31/2020 | U/W | %(1) | U/W $ per Pad | |
| Base Rent | $3,134,095 | $3,102,965 | 76.6% | $3,195.64 |
| Grossed Up Vacant Space | 0 | 694,900 | 17.2 | 715.65 |
| Gross Potential Rent | $3,134,095 | $3,797,864 | 93.8% | $3,911.29 |
| Other Income(2) | 244,436 | 250,764 | 6.2 | 258.25 |
| Net Rental Income | $3,378,531 | $4,048,628 | 100.0% | $4,169.55 |
| (Vacancy & Credit Loss) | (6,313) | (741,540)(3) | (19.5) | (763.69) |
| Effective Gross Income | $3,372,218 | $3,307,088 | 81.7% | $3,405.86 |
| Real Estate Taxes | 205,839 | 200,546 | 6.1 | 206.54 |
| Insurance | 69,001 | 76,155 | 2.3 | 78.43 |
| Management Fee | 173,515 | 198,425 | 6.0 | 204.35 |
| Other Operating Expenses | 951,259 | 909,225 | 27.5 | 936.38 |
| Total Operating Expenses | $1,399,614 | $1,384,352 | 41.9% | $1,425.70 |
| Net Operating Income | $1,972,604 | $1,922,736 | 58.1% | $1,980.16 |
| Replacement Reserves | 0 | 67,970 | 2.1 | 70.00 |
| TI/LC | 0 | 0 | 0.0 | 0.00 |
| Net Cash Flow | $1,972,604 | $1,854,766 | 56.1% | $1,910.16 |
| NOI DSCR | 1.67x | 1.63x | ||
| NCF DSCR | 1.67x | 1.57x | ||
| NOI Debt Yield | 9.5% | 9.3% | ||
| NCF Debt Yield | 9.5% | 9.0% |
| (1) | Represents (i) percent of Net Rental Income for all revenue fields, (ii) percent of Gross Potential Rent for Vacancy & Credit Loss and (iii) percent of Effective Gross Income for all other fields. |
| (2) | Other Income includes utility reimbursement, pet fees, late fees, insufficient fund fees andother miscellaneous income. |
| (3) | The underwritten economic vacancy is 19.5%. The SSA Midwest MHC Portfolio was 81.6% occupied as of September 13, 2021 based on total units. |
Appraisal. As of the appraisal valuation dates of July 30, 2021 through August 11, 2021, the SSA Midwest MHC Portfolio had an appraised value of $28,680,000.
Environmental Matters. According to Phase I environmental site assessments dated from March 11, 2021 through August 16, 2021, there was no evidence of any recognized environmental conditions at the SSA Midwest MHC Portfolio.
Market Overview. The SSA Midwest MHC Portfolio is located across 12 cities in Michigan, Illinois, Ohio and Pennsylvania. The SSA Midwest MHC Portfolio is located across nine metropolitan statistical areas (“MSAs”) across the Midwest in Flint, MI MSA (one property, 21.7% of units, 21.3% of allocated loan amount), Lansing-East, MI MSA (one property, 6.7% of units, 10.3% of allocated loan amount), Saginaw, MI MSA (two properties, 16.9% of units, 14.6% of allocated loan amount), Battle Creek, MI MSA (one property, 7.8% of units, 9.9% of allocated loan amount), Springfield, OH MSA (one property, 5.8% of units, 5.7% of allocated loan amount), Carbondale-Marion, IL MSA (one property, 10.7% of units, 5.5% of allocated loan amount), Peoria, IL MSA (one property 5.8% of units, 4.5% of allocated loan amount), Toledo, OH MSA (one property, 5.1% of units, 4.4% of allocated loan amount), Green Bay, WI MSA (one property, 5.3% of units, 4.3% of allocated loan amount), one micropolitan statistical area in the Midwest in the Quincy, IL-MO MSA (one property, 5.6% of units, 4.1% of allocated loan amount), and one property in the northeast in the Pittsburgh, PA MSA (one property, 8.7% of units, 15.4% of allocated loan amount).
THE INFORMATION IN THIS STRUCTURAL AND COLLATERAL TERM SHEET IS NOT COMPLETE AND MAY BE AMENDED PRIOR TO THE TIME OF SALE. THIS TERM SHEET IS NOT AN OFFER TO SELL THESE SECURITIES AND IT IS NOT A SOLICITATION OF AN OFFER TO BUY THESE SECURITIES IN ANY JURISDICTION WHERE THE OFFER OR SALE IS NOT PERMITTED.
133
| Loan #10 | Cut-off Date Balance: | $20,700,000 | ||
| Manufactured Housing | SSA Midwest MHC Portfolio | Cut-off Date LTV: | 72.2% | |
| Property Addresses - Various | U/W NCF DSCR: | 1.57x | ||
| U/W NOI Debt Yield: | 9.3% |
The following table presents certain information relating to the demographics for the SSA Midwest MHC Portfolio:
Demographics(1)
2021 Population (3-mile radius) | 2021 Population (5-mile radius) | 2021 Avg Household Income (3-mile radius) | 2021 Avg Household Income (5-mile radius) | |
| Twin Meadows | 55,327 | 130,658 | $51,225 | $55,287 |
| Werner Hancock | 31,083 | 85,579 | $105,042 | $97,850 |
| Pleasant Valley | 19,580 | 27,967 | $56,409 | $60,996 |
| Whispering Pines | 4,754 | 14,490 | $79,315 | $86,854 |
| Bellevue | 2,772 | 7,083 | $70,977 | $74,537 |
| Edgewood | 11,379 | 50,668 | $73,240 | $61,761 |
| Wildwood | 9,413 | 28,898 | $49,840 | $50,054 |
| Gaslight | 2,932 | 3,783 | $68,212 | $72,461 |
| Huron | 2,378 | 2,865 | $62,376 | $62,550 |
| Camelot South | 2,537 | 9,197 | $82,267 | $81,039 |
| Rivers Bend | 5,886 | 17,001 | $78,962 | $69,400 |
| Valley View | 25,552 | 43,276 | $60,211 | $67,428 |
| (1) | Information obtained from appraisals. |
The following table presents certain information relating to comparable rental information for the SSA Midwest MHC Portfolio:
Competitive Set Summary(1)
| Pads(2) | In-Place U/W Base Rent(2) | Competitive Set Average Rent | In-Place Vacancy(2) | Competitive Set Vacancy | |
| Twin Meadows | 211 | $387 | $359 | 34.1% | 14.0% |
| Werner Hancock | 84 | $548 | $419 | 13.1% | 18.2% |
| Pleasant Valley | 65 | $364 | $378 | 16.9% | 10.9% |
| Whispering Pines | 109 | $358 | $372 | 6.4% | 14.0% |
| Bellevue | 76 | $286 | $333 | 6.6% | 9.2% |
| Edgewood | 56 | $297 | $337 | 5.4% | 7.8% |
| Wildwood | 104 | $187 | $205 | 25.0% | 13.0% |
| Gaslight | 56 | $211 | $243 | 14.3% | 34.4% |
| Huron | 55 | $285 | $321 | 18.2% | 44.8% |
| Camelot South | 50 | $370 | $347 | 24.0% | 23.0% |
| Rivers Bend | 51 | $236 | $230 | 19.6% | 3.4% |
| Valley View | 54 | $225 | $198 | 7.4% | 4.8% |
| Total/Weighted Average | 971 | $328 | $329 | 18.4% | 17.3% |
| (1) | Information obtained from appraisals. |
| (2) | Information obtained from the underwritten rent roll as of September 13, 2021. |
Escrows.
Real Estate Taxes – The SSA Midwest MHC Portfolio Mortgage Loan documents require an upfront real estate tax reserve of $87,739 and ongoing monthly real estate tax reserves in the amount equal to one-twelfth of the real estate taxes that the lender estimates will be necessary to pay taxes over the then succeeding twelve months (initially $16,712).
Insurance – The SSA Midwest MHC Portfolio Mortgage Loan documents require an upfront insurance reserve of $18,642 and an ongoing monthly insurance premium reserve in the amount equal to one-twelfth of the insurance premiums that the lender estimates will be necessary to pay insurance premiums over the then succeeding twelve months (initially $5,918).
Replacement Reserves – The SSA Midwest MHC Portfolio Mortgage Loan documents require ongoing monthly replacement reserves of $5,664.
Deferred Maintenance – The SSA Midwest MHC Portfolio Mortgage Loan documents require an upfront reserve of $490,866 for deferred maintenance.
Sewer Reserve – The SSA Midwest MHC Portfolio Mortgage Loan documents require an upfront reserve of $250,000 for sewer work at the SSA Midwest MHC Portfolio.
THE INFORMATION IN THIS STRUCTURAL AND COLLATERAL TERM SHEET IS NOT COMPLETE AND MAY BE AMENDED PRIOR TO THE TIME OF SALE. THIS TERM SHEET IS NOT AN OFFER TO SELL THESE SECURITIES AND IT IS NOT A SOLICITATION OF AN OFFER TO BUY THESE SECURITIES IN ANY JURISDICTION WHERE THE OFFER OR SALE IS NOT PERMITTED.
134
| Loan #10 | Cut-off Date Balance: | $20,700,000 | ||
| Manufactured Housing | SSA Midwest MHC Portfolio | Cut-off Date LTV: | 72.2% | |
| Property Addresses - Various | U/W NCF DSCR: | 1.57x | ||
| U/W NOI Debt Yield: | 9.3% |
Lockbox and Cash Management. The SSA Midwest MHC Portfolio Mortgage Loan requires a springing lockbox and springing cash management. Upon the occurrence and continuance of a Cash Management Trigger Event (as defined below), (i) the SSA Midwest MHC Portfolio Borrowers are required to establish a lender-controlled lockbox account and instruct any (1) tenant that, together with affiliates, represent (a) 5% or more of the total rental income for the applicable SSA Midwest MHC Portfolio Property or (b) 5% or more of the leasable pads at an individual SSA Midwest MHC Portfolio Property or (2) any tenant that is an affiliate of the SSA Midwest MHC Portfolio Borrowers to deposit rents into the lockbox account, and (ii) the SSA Midwest MHC Portfolio Borrowers or the property manager is required to deposit all rents received within two business days of receipt. Pursuant to the SSA Midwest MHC Portfolio Mortgage Loan documents, all excess funds on deposit are required to be applied as follows (a) if a Cash Sweep Event (as defined below) is not in effect, to the SSA Midwest MHC Portfolio Borrowers; and (b) if a Cash Sweep Event is in effect, funds will be applied in accordance with the SSA Midwest MHC Portfolio Loan Documents with excess cash flow held in an excess cash flow account controlled by the lender, to be held by the lender as additional security for the SSA Midwest MHC Portfolio Mortgage Loan.
A “Cash Management Trigger Event” will commence upon the occurrence of the following:
| (i) | an event of default; |
| (ii) | the SSA Midwest MHC Portfolio Borrower’s second late debt service payment within a 12-month period; |
| (iii) | a bankruptcy action of the SSA Midwest MHC Portfolio Borrowers, guarantors or property manager; or |
| (iv) | a Cash Management DSCR Trigger Event (as defined below). |
A Cash Management Trigger Event will end upon the occurrence of:
| • | with regard to clause (i) above, the cure of such event of default has been accepted or waived by the lender; |
| • | with regard to clause (ii) above, when the debt service payments have been paid on time for 12 consecutive months; |
| • | with regard to clause (iii) above, when such bankruptcy action petition has been discharged, stayed, or dismissed within 90 days of such filing among other conditions for the SSA Midwest MHC Portfolio Borrowers or guarantor and within 120 days for the property manager, with respect to the manager, the SSA Midwest MHC Portfolio Borrowers replacing the property manager with a qualified manager acceptable to the lender; and |
| • | with regard to clause (iv) above, the date the amortizing debt service coverage ratio based on the trailing 12-month period immediately preceding the date of such determination is greater than 1.20x for two consecutive quarters. |
A “Cash Management DSCR Trigger Event” will occur on any day the debt service coverage ratio, based on the trailing 12-month period immediately preceding the date of determination, is less than 1.20x for the SSA Midwest MHC Portfolio Mortgage Loan.
A “Cash Sweep Event” will commence upon the occurrence of the following:
| (i) | an event of default; |
| (ii) | a bankruptcy action of the SSA Midwest MHC Portfolio Borrowers, guarantors or property manager; or | |
| (iii) | a Cash Sweep DSCR Trigger Event (as defined below). |
A Cash Sweep Event will end upon the occurrence of:
| • | with regard to clause (i) above, the cure of such event of default has been accepted or waived by the lender; |
| • | with regard to clause (ii) above, when such bankruptcy action petition has been discharged, stayed, or dismissed within 90 days of such filing among other conditions for the SSA Midwest MHC Portfolio Borrowers or guarantor and within 120 days for the property manager, with respect to the property manager, the SSA Midwest MHC Portfolio Borrowers replacing the property manager with a qualified manager acceptable to the lender; and |
| • | with regard to clause (iii) above, the date the amortizing debt service coverage ratio based on the trailing 12-month period immediately preceding the date of such determination is greater than 1.20x for two consecutive quarters. |
A “Cash Sweep DSCR Trigger Event” will occur on any day the debt service coverage ratio, based on the trailing 12-month period immediately preceding the date of determination, is less than 1.20x for the SSA Midwest MHC Portfolio Mortgage Loan.
Property Management. The SSA Midwest MHC Portfolio is managed by Evergreen Parkes, LLC, an affiliate of the SSA Midwest MHC Portfolio Borrowers.
Partial Release. After the lockout period and prior to the open period, the SSA Midwest MHC Portfolio Borrowers may obtain the release of an individual SSA Midwest property (the “SSA Release Property”) provided that, among other conditions, (i) no event of default has occurred and is continuing; (ii) the amount of the SSA Midwest MHC Portfolio Mortgage Loan defeased is 115% of the allocated loan amount for the SSA Release Property; (iii) the debt service coverage ratio for the remaining properties after such release is not less than the greater of (a) 1.57x and (b) the debt service coverage ratio for the remaining SSA Midwest MHC Portfolio Properties and the SSA Release Property for the preceding 12 months; and (iv) the loan-to-value ratio after such release is less than or equal to the lesser of (a) 72.2% and (b) the loan-to-value ratio for the remaining SSA Midwest MHC Portfolio Properties and the SSA Release Property to be released immediately preceding such release.
Subordinate and Mezzanine Indebtedness. None.
Ground Lease. None.
THE INFORMATION IN THIS STRUCTURAL AND COLLATERAL TERM SHEET IS NOT COMPLETE AND MAY BE AMENDED PRIOR TO THE TIME OF SALE. THIS TERM SHEET IS NOT AN OFFER TO SELL THESE SECURITIES AND IT IS NOT A SOLICITATION OF AN OFFER TO BUY THESE SECURITIES IN ANY JURISDICTION WHERE THE OFFER OR SALE IS NOT PERMITTED.
135
| Loan #10 | Cut-off Date Balance: | $20,700,000 | ||
| Manufactured Housing | SSA Midwest MHC Portfolio | Cut-off Date LTV: | 72.2% | |
| Property Addresses - Various | U/W NCF DSCR: | 1.57x | ||
| U/W NOI Debt Yield: | 9.3% |
Terrorism Insurance. The SSA Midwest MHC Portfolio Mortgage Loan documents require that the “all risk” insurance policy required to be maintained by the SSA Midwest MHC Portfolio Borrowers provides coverage for terrorism in an amount equal to the full replacement cost of the SSA Midwest MHC Portfolio, as well as business interruption insurance covering no less than the 12-month period following the occurrence of a casualty event, together with a 12-month extended period of indemnity.
THE INFORMATION IN THIS STRUCTURAL AND COLLATERAL TERM SHEET IS NOT COMPLETE AND MAY BE AMENDED PRIOR TO THE TIME OF SALE. THIS TERM SHEET IS NOT AN OFFER TO SELL THESE SECURITIES AND IT IS NOT A SOLICITATION OF AN OFFER TO BUY THESE SECURITIES IN ANY JURISDICTION WHERE THE OFFER OR SALE IS NOT PERMITTED.
136
(THIS PAGE INTENTIONALLY LEFT BLANK)
THE INFORMATION IN THIS STRUCTURAL AND COLLATERAL TERM SHEET IS NOT COMPLETE AND MAY BE AMENDED PRIOR TO THE TIME OF SALE. THIS TERM SHEET IS NOT AN OFFER TO SELL THESE SECURITIES AND IT IS NOT A SOLICITATION OF AN OFFER TO BUY THESE SECURITIES IN ANY JURISDICTION WHERE THE OFFER OR SALE IS NOT PERMITTED.
137
| No. 11 – Meadowood Mall | |||||||
| Mortgage Loan Information | Mortgaged Property Information | ||||||
| Mortgage Loan Seller: | Wells Fargo Bank, National Association | Single Asset/Portfolio: | Single Asset | ||||
Credit Assessment (Moody’s/Fitch/KBRA): | Baa2/NR/BBB- | Property Type – Subtype: | Retail – Regional Mall | ||||
| Original Principal Balance(1): | $19,000,000 | Location: | Reno, NV | ||||
| Cut-off Date Balance(1): | $19,000,000 | Size: | 456,841 SF | ||||
| % of Initial Pool Balance: | 2.5% | Cut-off Date Balance Per SF(1): | $175.12 | ||||
| Loan Purpose: | Refinance | Maturity Date Balance Per SF(1): | $153.28 | ||||
| Borrower Sponsor: | Simon Property Group, L.P. | Year Built/Renovated: | 1978/2013 | ||||
| Guarantor: | Simon Property Group, L.P. | Title Vesting: | Fee | ||||
| Mortgage Rate: | 3.9300% | Property Manager: | MillsService Corp. (affiliate of borrower) | ||||
| Note Date: | November 5, 2021 | Current Occupancy (As of)(5): | 90.0% (10/13/2021) | ||||
| Seasoning: | 0 months | YE 2020 Occupancy(5): | 83.2% | ||||
| Maturity Date: | December 1, 2026 | YE 2019 Occupancy(5): | 86.3% | ||||
| IO Period: | NAP | YE 2018 Occupancy(5): | 85.9% | ||||
| Loan Term (Original): | 60 months | YE 2017 Occupancy(5): | 87.5% | ||||
| Amortization Term (Original): | 300 months | As-Is Appraised Value(6): | $227,100,000 | ||||
| Loan Amortization Type: | Amortizing Balloon | As-Is Appraised Value Per SF(6): | $497.11 | ||||
| Call Protection(2): | L(24),D(29),O(7) | As-Is Appraisal Valuation Date: | October 11, 2021 | ||||
| Lockbox Type: | Hard/Springing Cash Management | Underwriting and Financial Information(6) | |||||
| Additional Debt: | Yes | TTM NOI (8/31/2021)(7): | $14,404,663 | ||||
| Additional Debt Type (Balance): | Pari Passu ($61,000,000) / B-Note ($28,000,000)(3) | YE 2020 NOI(7): | $13,103,258 | ||||
| YE 2019 NOI(7): | $15,476,844 | ||||||
| YE 2018 NOI: | $15,671,837 | ||||||
| U/W Revenues: | $20,594,293 | ||||||
| U/W Expenses: | $4,726,478 | ||||||
| Escrows and Reserves(4) | U/W NOI: | $15,867,815 | |||||
| Initial | Monthly | Cap | U/W NCF: | $14,983,329 | |||
| Real Estate Taxes | $0 | Springing | NAP | U/W DSCR based on NOI/NCF(1)(7): | 3.15x / 2.98x | ||
| Insurance | $0 | Springing | NAP | U/W Debt Yield based on NOI/NCF(1)(7): | 19.8% /18.7% | ||
| Leasing Reserve | $0 | $76,140 | NAP | U/W Debt Yield at Maturity based on NOI/NCF(1): | 22.6% / 21.4% | ||
| Replacement Reserves | $3,000,000 | Springing | $228,420 | Cut-off Date LTV Ratio(1): | 35.2% | ||
| LTV Ratio at Maturity(1): | 30.8% | ||||||
| Sources and Uses | ||||||||
| Sources | Uses | |||||||
| Original loan amount | $80,000,000 | 72.9% | Loan payoff(8) | $106,213,247 | 96.7% | |||
| B-Note | $28,000,000 | 25.5 | Upfront reserves | 3,000,000 | 2.7 | |||
| Cash equity contribution | 1,791,818 | 1.6 | Closing costs | 578,571 | 0.5 | |||
| Total Sources | $109,791,818 | 100.0% | Total Uses | $109,791,818 | 100.0% | |||
| (1) | The Meadowood Mall Mortgage Loan (defined below) is part of the Meadowood Mall Senior Loan (defined below), which is part of the Meadowood Mall Whole Loan (defined below). The Cut-off Date Balance Per SF, Maturity Date Balance Per SF, U/W Debt Yields, U/W Debt Yields at Maturity, U/W DSCRs, Cut-off Date LTV Ratio and LTV Ratio at Maturity numbers presented above are based on the Meadowood Mall Senior Loan. |
| (2) | If the traditional REMIC lockout period (which is 2 years from final piece of the mortgage loan being securitized) has not expired by January 1, 2026, defeasance will not be permitted until such REMIC lockout period expires, pursuant to the Meadowood Mall Whole Loan mortgage documents. Solely in this period in which defeasance is not permitted, the mortgage loan may be paid off in full with a yield maintenance premium. |
| (3) | See “Subordinate and Mezzanine Indebtedness” section. |
| (4) | See “Escrows” section. |
| (5) | Occupancy excludes temporary tenants. |
| (6) | While the Meadowood Mall Whole Loan was originated after the emergence of the novel coronavirus pandemic and the economic disruption resulting from measures to combat the pandemic, the pandemic is an evolving situation and could impact the Meadowood Mall Whole Loan more severely than assumed in the underwriting and could adversely affect the NOI, NCF and occupancy information, as well as the appraised value and the DSCR, LTV and Debt Yield metrics presented above. See “Risk Factors— Risks Related to Market Conditions and Other External Factors—Coronavirus Pandemic Has Adversely Affected the Global Economy and Will Likely Adversely Affect the Performance of the Mortgage Loans” in the Preliminary Prospectus. |
| (7) | See Operating History and Underwritten Net Cash Flow for detail on fluctuation in YE 2019 NOI, YE 2020 NOI, TTM NOI (8/31/2021) and U/W NOI. |
| (8) | The Meadowood Mall Whole Loan pays off an existing CMBS loan, securitized in GSMS 2012-GC6. |
THE INFORMATION IN THIS STRUCTURAL AND COLLATERAL TERM SHEET IS NOT COMPLETE AND MAY BE AMENDED PRIOR TO THE TIME OF SALE. THIS TERM SHEET IS NOT AN OFFER TO SELL THESE SECURITIES AND IT IS NOT A SOLICITATION OF AN OFFER TO BUY THESE SECURITIES IN ANY JURISDICTION WHERE THE OFFER OR SALE IS NOT PERMITTED.
138
| Retail – Regional Mall | Loan #11 | Cut-off Date Balance: | $19,000,000 | |
5000 Meadowood Mall Circle Reno, Nevada 89502 | Meadowood Mall | Cut-off Date LTV: U/W NCF DSCR: U/W NOI Debt Yield: | 35.2% 2.98x 19.8% |
The Mortgage Loan. The mortgage loan (the “Meadowood Mall Mortgage Loan”) is part of a whole loan (the “Meadowood Mall Whole Loan”) that is evidenced by four pari passu promissory notes in the aggregate original principal amount of $80,000,000 (the “Meadowood Mall Senior Loan”) and one subordinate note with an original principal balance of $28,000,000 (the “Meadowood Mall Subordinate Loan”). The Meadowood Mall Whole Loan has an aggregate outstanding principal balance as of the Cut-off Date of $108,000,000 and is secured by a first deed of trust encumbering the borrower’s fee interest in an 456,841 square foot regional mall located in Reno, Nevada (the “Meadowood Mall Property”). The Meadowood Mall Mortgage Loan (evidenced by non-controlling note A-1), having an outstanding principal balance as of the Cut-off Date of $19,000,000, is being contributed to this transaction.
The Meadowood Mall Whole Loan was co-originated by Wells Fargo Bank, National Association, Bank of Montreal (“BMO”), Barclays Capital Real Estate Inc. (“Barclays”), 3650 Real Estate Investment Trust 2 LLC (“3650 A”) and 3650 Cal Bridge Reno LLC (“3650 B”). The borrower sponsor utilized the proceeds of the Meadowood Mall Whole Loan to refinance existing debt on Meadowood Mall Property, fund reserves and pay loan closing costs.
The table below summarizes the promissory notes that comprise the Meadowood Mall Whole Loan. The relationship between the holders of the Meadowood Mall Whole Loan is governed by a co-lender agreement. The Meadowood Mall Whole Loan will be initially serviced pursuant to the pooling and servicing agreement for WFCM 2021-C61. Following the securitization of the A-4 Note, the Meadowood Mall Whole Loan will be serviced under the pooling and servicing agreement governing such securitization. See “Description of the Mortgage Pool—The Whole Loans—The Non-Serviced Pari Passu Whole Loans” and “Pooling and Servicing Agreement” in the Preliminary Prospectus.
Note Summary
| Note | Original Balance | Cut-off Date Balance | Note Holder | Controlling Piece |
| A-1 | $19,000,000 | $19,000,000 | WFCM 2021-C61 | No |
| A-2 | $18,000,000 | $18,000,000 | Barclays | No |
| A-3 | $18,000,000 | $18,000,000 | BMO | No |
| A-4 | $25,000,000 | $25,000,000 | 3650 A | Yes |
| Total Senior Notes | $80,000,000 | $80,000,000 | ||
| Subordinate Note | ||||
| B | $28,000,000 | $28,000,000 | 3650 B | No |
| Total (Whole Loan) | $108,000,000 | $108,000,000 |
The Property. The Meadowood Mall Property is a one level, Class A regional mall totaling 456,841 owned square feet, located in Reno, Nevada. It is a traditional enclosed mall with multiple wings and entrances, containing a food court and department store anchors. Built in 1978 and most recently renovated in 2013, the property is situated on a 48.8-acre parcel and contains 3,368 parking spaces (5.60/1,000 SF). Collateral anchor tenants include Macy’s (“Macy’s (suite XC)”), Dick’s Sporting Goods, and Crunch Fitness. Non-collateral anchors include Macy’s Women’s, JC Penney and Round 1, which is located in a portion of a former Sears anchor box. Additional notable tenants include H&M, Forever 21, Coach, Express/Express Men, American Eagle Outfitters, LensCrafters, and the Cheesecake Factory. In 2013, the mall underwent a renovation consisting of upgrades to the common areas, restrooms, food court and mall entrances. In 2016, a portion of the mall was renovated to make space for Dick’s Sporting Goods, and again in 2018-2019 to accommodate the addition of Crunch Fitness. Additionally, in 2018-2020 approximately $576K was spent to replace the roof and renovate the façade of the main mall, HVAC unit replacements and asphalt paving. The Meadowood Mall is the only enclosed mall within the Reno Metropolitan Statistical Area.
Sales at the Meadowood Mall Property based on the trailing twelve-month sales as of August 31, 2021 are 12.4% above full year 2019 sales for inline tenants. The Meadowood Mall Property averaged 86.2% occupancy (excluding temporary tenants) from 2016-2020, including temporary tenants the average occupancy was 96.9%. As of October 13, 2021, the Meadowood Mall Property was 90.0% leased (excluding temporary tenants) to 82 tenants.
| Inline Sales History(1) | ||||
| 2018 | 2019 | 2020 | 8/31/2021 TTM | |
| Sales PSF (Inline <10,000 SF) | $498 | $500 | $465 | $562 |
| Occupancy Cost (Inline <10,000 SF) | 14.4% | 14.3% | 15.5% | 12.9% |
| (1) | Information is as of August 31, 2021, as provided by the borrower, and only includes tenants that report sales |
THE INFORMATION IN THIS STRUCTURAL AND COLLATERAL TERM SHEET IS NOT COMPLETE AND MAY BE AMENDED PRIOR TO THE TIME OF SALE. THIS TERM SHEET IS NOT AN OFFER TO SELL THESE SECURITIES AND IT IS NOT A SOLICITATION OF AN OFFER TO BUY THESE SECURITIES IN ANY JURISDICTION WHERE THE OFFER OR SALE IS NOT PERMITTED.
139
| Retail – Regional Mall | Loan #11 | Cut-off Date Balance: | $19,000,000 | |
5000 Meadowood Mall Circle Reno, Nevada 89502 | Meadowood Mall | Cut-off Date LTV: U/W NCF DSCR: U/W NOI Debt Yield: | 35.2% 2.98x 19.8% |
Major Tenants.
Largest Tenant by UW Base Rent: Forever 21 (20,022 square feet; 4.4% of net rentable area; 7.7% of underwritten base rent; 1/31/2023 lease expiration) – Forever 21 is an American fast fashion retailer headquartered in Los Angeles, CA. Founded in 1984, the company sells trendy clothing for men and women at low prices. Forever 21 has been a tenant at Meadowood Mall since May 2013 and reported gross sales of approximately $3.9 million ($196 per square foot) for the trailing 12-month period ending August 31, 2021. The tenant executed an amendment in October 2020 to pay percent in lieu of rent at 24.8% of annual sales. The tenant has no renewal options and no termination options.
2nd Largest Tenant by UW Base Rent: Dick’s Sporting Goods (50,133 square feet; 11.0% of net rentable area; 5.8% of underwritten base rent; 1/31/2027 lease expiration) – Headquartered in Pittsburgh, PA, Dick’s Sporting Goods is a leading omni-channel retailer offering an assortment of sporting equipment, apparel, footwear and accessories. The tenant has been at the Meadowood Mall Property since October 2016 and reported gross sales of approximately $9.4 million ($187 per square foot) for the trailing 12-month period ending August 31, 2021. Dick’s Sporting Goods has three, 5-year extension options with 12-months’ notice and does not have any termination options.
3rd Largest Tenant by UW Base Rent: Macy’s (suite XC) (98,721 square feet; 21.6% of net rentable area; 4.9% of underwritten base rent; 3/31/2030 lease expiration) – Macy’s (suite XC), part of the owned collateral, has been a tenant at the Meadowood Mall Property since February 1979 and reported gross sales of approximately $12.6 million ($127 per square foot) for the trailing 12-month period ended August 31, 2021. In 2019, the Meadowood Mall store was included on Macy’s list of 100 stores that will receive investments and upgrades as part of its Growth 150 initiative.
4th Largest Tenant by UW Base Rent: Crunch Fitness (25,183 square feet; 5.5% of net rentable area; 3.0% of underwritten base rent; 8/31/2029 lease expiration) – Crunch Fitness was founded in New York in 1989 and today has over 300 locations throughout the United states. Crunch Fitness gyms offer personal trainers as well as group fitness classes, and other amenities. Crunch Fitness has been a tenant at the Meadowood Mall Property since August 2019. The tenant has two, 5-year renewal options with 180 days’ notice.
COVID-19 Update. As of November 13, 2021 the Meadowood Mall Property is open and operating. The Meadowood Mall Borrower does not provide COVID collection information.
THE INFORMATION IN THIS STRUCTURAL AND COLLATERAL TERM SHEET IS NOT COMPLETE AND MAY BE AMENDED PRIOR TO THE TIME OF SALE. THIS TERM SHEET IS NOT AN OFFER TO SELL THESE SECURITIES AND IT IS NOT A SOLICITATION OF AN OFFER TO BUY THESE SECURITIES IN ANY JURISDICTION WHERE THE OFFER OR SALE IS NOT PERMITTED.
140
| Retail – Regional Mall | Loan #11 | Cut-off Date Balance: | $19,000,000 | |
5000 Meadowood Mall Circle Reno, Nevada 89502 | Meadowood Mall | Cut-off Date LTV: U/W NCF DSCR: U/W NOI Debt Yield: | 35.2% 2.98x 19.8% |
The following table presents certain information relating to the tenancy at the Meadowood Mall Property:
Major Tenants
| Tenant Name | Credit Rating (Fitch/ Moody’s/ | Tenant NRSF | % of NRSF | Annual U/W Base Rent PSF(1) | Annual U/W Base Rent(1) | % of Total Annual U/W Base Rent | Lease Expiration Date | Ext. Options | Term. Option (Y/N) | |
| Anchor Tenants | ||||||||||
| Forever 21 | NR/NR/NR | 20,022 | 4.4% | $48.58 | $972,683(2) | 7.7% | 1/31/2023 | None | N | |
| Dick’s Sporting Goods | NR/NR/NR | 50,133 | 11.0% | $14.75 | $739,462 | 5.8% | 1/31/2027 | 3, 5-year | N | |
| Macy’s (suite XC) | NR/NR/NR | 98,721 | 21.6% | $6.28 | $620,290 | 4.9% | 3/31/2030 | None | N | |
| Crunch Fitness | NR/NR/NR | 25,183 | 5.5% | $15.29 | $385,100 | 3.0% | 8/31/2029 | 2, 5-year | N | |
| 194,059 | 42.5% | $14.00 | $2,717,535 | 21.5% | ||||||
| Major Tenants | ||||||||||
| Tilly’s NR/NR/NR | 7,573 | 1.7% | $48.09 | $364,167 | 2.9% | 1/31/2026 | None | N | ||
| Helzberg Diamonds NR/NR/NR | 1,824 | 0.4% | $196.40 | $358,234 | 2.8% | 5/31/2024 | None | N | ||
| H&M NR/NR/NR | 22,100 | 4.8% | $15.58 | $344,238 | 2.7% | 1/31/2024 | 2, 5-year | N | ||
| Victoria’s Secret NR/NR/NR | 7,290 | 1.6% | $46.00 | $335,340 | 2.7% | 1/31/2022 | None | N | ||
| LensCrafters NR/NR/NR | 6,802 | 1.5% | $45.69 | $310,797 | 2.5% | 1/31/2023 | None | N | ||
| Cheesecake Factory NR/NR/NR | 8,043 | 1.8% | $36.56 | $294,040 | 2.3% | 1/31/2035 | 2, 5-year | N | ||
| 53,632 | 11.7% | $37.42 | $2,006,816 | 15.9% | ||||||
| Non-Major Tenants(3) | 163,376 | 35.8% | $48.52 | $7,927,140 | 62.7% | |||||
| Occupied Collateral Total | 411,067 | 90.0% | $30.78 | $12,651,491 | 100.0% | |||||
| Vacant Space | 45,774 | 10.0% | ||||||||
| Collateral Total | 456,841 | 100.0% | ||||||||
| (1) | Annual U/W Base Rent PSF and Annual U/W Base Rent include contractual rent steps through October 2022 totaling $169,022. |
| (2) | Forever 21 pays percent in lieu rent of 24.8% of annual sales. The Annual U/W Base Rent PSF and Annual U/W Base Rent represent 24.8% of the trailing 12-month sales as of August 31, 2021. |
| (3) | Non-Major Tenants includes one tenant, Windsor with a lease start date of January 1, 2022. This tenant represents 1.1% of net rentable area and 0.9% of underwritten rent. |
THE INFORMATION IN THIS STRUCTURAL AND COLLATERAL TERM SHEET IS NOT COMPLETE AND MAY BE AMENDED PRIOR TO THE TIME OF SALE. THIS TERM SHEET IS NOT AN OFFER TO SELL THESE SECURITIES AND IT IS NOT A SOLICITATION OF AN OFFER TO BUY THESE SECURITIES IN ANY JURISDICTION WHERE THE OFFER OR SALE IS NOT PERMITTED.
141
| Retail – Regional Mall | Loan #11 | Cut-off Date Balance: | $19,000,000 | |
5000 Meadowood Mall Circle Reno, Nevada 89502 | Meadowood Mall | Cut-off Date LTV: U/W NCF DSCR: U/W NOI Debt Yield: | 35.2% 2.98x 19.8% |
The following table presents certain information relating to the lease rollover schedule at the Meadowood Mall Property:
Lease Expiration Schedule(1)(2)
| Year Ending December 31, | No. of Leases Expiring | Expiring NRSF | % of Total NRSF | Cumulative Expiring NRSF | Cumulative % of Total NRSF | Annual U/W Base Rent | % of Total Annual U/W Base Rent(3) | Annual U/W Base Rent PSF(3) |
| MTM | 0 | 0 | 0.0% | 0 | 0.0% | $0 | 0.0% | $0.00 |
| 2021 | 0 | 0 | 0.0% | 0 | 0.0% | $0 | 0.0% | $0.00 |
| 2022 | 15 | 44,268 | 9.7% | 44,268 | 9.7% | $2,267,390 | 17.9% | $51.22 |
| 2023 | 21 | 71,679 | 15.7% | 115,947 | 25.4% | $3,593,330 | 28.4% | $50.13 |
| 2024 | 15 | 63,088 | 13.8% | 179,035 | 39.2% | $2,185,398 | 17.3% | $34.64 |
| 2025 | 5 | 5,908 | 1.3% | 184,943 | 40.5% | $381,320 | 3.0% | $64.54 |
| 2026 | 5 | 12,612 | 2.8% | 197,555 | 43.2% | $683,415 | 5.4% | $54.19 |
| Thereafter | 17 | 213,512 | 46.7% | 411,067 | 90.0% | $3,540,638 | 28.0% | $16.58 |
| Vacant | 0 | 45,774 | 10.0% | 456,841 | 100.0% | $0 | 0.0% | $0.00 |
| Total/Weighted Average | 78 | 456,841 | 100.0% | $12,651,491 | 100.0% | $30.78 |
| (1) | Information obtained from the underwritten rent roll. |
| (2) | Certain tenants may have lease termination options that are exercisable prior to the originally stated expiration date of the subject lease and that are not considered in the Lease Expiration Schedule. |
| (3) | Annual U/W Base Rent excludes vacant space. |
The following table presents historical occupancy percentages at the Meadowood Mall Property:
Historical Occupancy
12/31/2017(1)(2) | 12/31/2018(1)(2) | 12/31/2019(1)(2) | 12/31/2020(1)(2) | 10/13/2021(2)(3) |
| 87.5% | 85.9% | 86.3% | 83.2% | 90.0% |
| (1) | Information obtained from the Meadowood Mall Borrower. |
| (2) | Occupancy numbers do not include temporary tenants. |
| (3) | Information obtained from the underwritten rent roll and includes one tenant, Windsor, with a lease start date of January 1, 2022. This tenant represents 1.1% of net rentable area and 0.9% of underwritten rent. |
The following table presents certain information relating to the historical sales at the Meadowood Mall Property:
Historical Sales(1)
| 2018 Sales (PSF) | 2019 Sales (PSF) | 2020 Sales (PSF) | TTM Sales (Gross) (2) | TTM Sales (PSF) (2) | Occupancy Cost(3) | |
| Forever 21(4) | $166 | $134 | $123 | $3,922,110 | $196 | 24.8% |
| Dick’s Sporting Goods | $132 | $145 | $180 | $9,351,810 | $187 | 10.6% |
| Macy’s (suite XC) | $153 | $158 | $94 | $12,572,119 | $127 | 6.7% |
| Crunch Fitness | NAV | NAV | $16 | $972,316 | $39 | 45.3% |
| Helzberg Diamonds | $1,980 | $2,127 | $2,484 | $5,341,365 | $2,928 | 8.0% |
| Tilly’s | $479 | $458 | $446 | $4,057,159 | $536 | 14.6% |
| H&M | $163 | $177 | $146 | $3,483,402 | $158 | 10.7% |
| Victoria’s Secret | $679 | $658 | $555 | $4,956,325 | $680 | 11.6% |
| LensCrafters | $347 | $400 | $291 | $2,373,082 | $349 | 22.8% |
| Cheesecake Factory | $779 | $765 | $571 | $5,984,957 | $744 | 6.9% |
| (1) | Information obtained from the borrower and underwritten rent roll. |
| (2) | TTM Sales (Gross) and TTM Sales (PSF) are sourced from the Meadowood Mall Borrower’s August 31, 2021 sales report and represent the total sales PSF based on the total actual square footage of each tenant, as listed on the report. |
| (3) | Occupancy Cost is based on underwritten base rent and reimbursements and most recently reported sales. |
| (4) | Forever 21 contractually pays percent in lieu of 24.8% of their annual sales. |
THE INFORMATION IN THIS STRUCTURAL AND COLLATERAL TERM SHEET IS NOT COMPLETE AND MAY BE AMENDED PRIOR TO THE TIME OF SALE. THIS TERM SHEET IS NOT AN OFFER TO SELL THESE SECURITIES AND IT IS NOT A SOLICITATION OF AN OFFER TO BUY THESE SECURITIES IN ANY JURISDICTION WHERE THE OFFER OR SALE IS NOT PERMITTED.
142
| Retail – Regional Mall | Loan #11 | Cut-off Date Balance: | $19,000,000 | |
5000 Meadowood Mall Circle Reno, Nevada 89502 | Meadowood Mall | Cut-off Date LTV: U/W NCF DSCR: U/W NOI Debt Yield: | 35.2% 2.98x 19.8% |
Operating History and Underwritten Net Cash Flow. The following table presents certain information relating to the historical operating performance and underwritten net cash flow at the Meadowood Mall Property:
Cash Flow Analysis
| 2018 | 2019 | 2020 | TTM 8/31/2021 | U/W | %(1) | U/W $ per SF | |
| Base Rent | $12,266,618 | $12,334,476 | $12,079,560 | $11,886,048 | $12,651,491(2)(3) | 55.4% | $27.69 |
| Grossed Up Vacant Space | 0 | 0 | 0 | 0 | 2,253,785 | 9.9 | 4.93 |
| Gross Potential Rent | $12,266,618 | $12,334,476 | $12,079,560 | $11,886,048 | $14,905,276 | 65.2% | $32.63 |
| Other Income | 278,825 | 285,760 | 132,521 | 196,672 | 196,672 | 0.9 | 0.43 |
| Percentage Rent | 384,538 | 358,472 | 156,539 | 318,120 | 429,148 | 1.9 | 0.94 |
| Specialty Leasing | 1,814,814 | 1,783,668 | 1,223,903 | 1,568,168 | 1,692,532 | 7.4 | 3.70 |
| Total Recoveries | 6,091,162 | 6,135,789 | 5,748,164 | 5,707,239 | 5,624,451 | 24.6 | 12.31 |
| Net Rental Income | $20,835,957 | $20,898,165 | $19,340,687 | $19,676,247 | 22,848,078 | 100.0% | $50.01 |
| (Vacancy & Credit Loss) | 0 | 0 | 0 | 0 | (2,253,785)(4) | (15.1) | (4.93) |
| Effective Gross Income | $20,835,957 | $20,898,165 | $19,340,687 | $19,676,247 | $20,594,293 | 90.1% | $45.08 |
| Real Estate Taxes | 662,893 | 693,576 | 716,826 | 735,989 | 766,918 | 3.7 | 1.68 |
| Insurance | 99,806 | 103,873 | 114,038 | 127,128 | 131,016 | 0.6 | 0.29 |
| Management Fee | 962,190 | 968,873 | 732,960 | 732,960 | 617,829 | 3.0 | 1.35 |
| Other Operating Expenses(5) | 3,439,231 | 3,654,999 | 4,673,605 | 3,675,507 | 3,210,715 | 15.6 | 7.03 |
| Total Operating Expenses | $5,164,120 | $5,421,321 | $6,237,429 | $5,271,584 | $4,726,478 | 23.0% | $10.35 |
| Net Operating Income | $15,671,837 | $15,476,844 | $13,103,258(5) | $14,404,663(5) | $15,867,815(5) | 77.0% | $34.73 |
| Replacement Reserves | 0 | 0 | 0 | 0 | 114,210 | 0.6 | 0.25 |
| TI/LC | 0 | 0 | 0 | 0 | 770,276 | 3.7 | 1.69 |
| Net Cash Flow | $15,671,837 | $15,476,844 | $13,103,258 | $14,404,663 | $14,983,329 | 72.8% | $32.80 |
| NOI DSCR(6) | 3.12x | 3.08x | 2.60x | 2.86x | 3.15x | ||
| NCF DSCR(6) | 3.12x | 3.08x | 2.60x | 2.86x | 2.98x | ||
| NOI Debt Yield(6) | 19.6% | 19.3% | 16.4% | 18.0% | 19.8% | ||
| NCF Debt Yield(6) | 19.6% | 19.3% | 16.4% | 18.0% | 18.7% |
| (1) | Represents (i) percent of Net Rental Income for all revenue fields, (ii) percent of Gross Potential Rent for Vacancy & Credit Loss and (iii) percent of Effective Gross Income for all other fields. |
| (2) | U/W Base Rent and U/W $ per SF include contractual rent steps through October 2022 totaling $169,022. |
| (3) | Base Rent includes one tenant, Windsor, with a lease start date of January 1, 2022. This tenant represents 1.1% of net rentable area and 0.9% of underwritten rent. |
| (4) | The underwritten economic vacancy is 15.1%. The Meadowood Mall Property was 90.0% physically occupied as of October 13, 2021. |
| (5) | The large variance in Other Operating Expenses is caused by this expense item including the borrower’s provision for credit loss. In 2019 this provision was $116,565, in 2020 it was $1,921,269, in TTM 8/31/2021 it was $651,745, and in borrower’s budget and U/W it is zero. This variance is also the main driver of the Net Operating Income Variance from 2020 to TTM 8/31/2021 and U/W. |
| (6) | The metrics shown represent the Meadowood Mall Senior Loan. |
Market Overview and Competition. The Meadowood Mall Property is located in the southern central area of Reno, Nevada. The surrounding area is suburban in nature and consists primarily of commercial uses including retail, office and industrial. The Meadowood Mall Property is the largest property and retail use within the immediate area. The property is situated adjacent to McCarran Boulevard and within 1 mile of I-580, providing access through out the region. The Meadowood Mall Property is located proximate to demand drivers including the Reno-Sparks Convention Center and Atlantis Casino Resort and Spa, located 1.5 and 1.6 miles from the property, respectively. The Reno-Tahoe International airport is located 3.3 miles from the property. Technology companies including Amazon, Tesla, Microsoft, Apple and Google have a presence in Reno, including Tesla’s Gigafactory which reportedly covers 5.8 million square feet and is the largest building in the world.
Within a three- and five-mile radius of the Meadowood Mall Property, the 2021 average household income was approximately $80,400 and $88,668, respectively; and within the same radii, the 2021 estimated population was 73,330 and 179,589, respectively. According to the appraisal, the top 5 employers in the surrounding area are University of Nevada-Reno, Silver Legacy Resort Casino, Sierra Nevada Healthcare System, Harrah’s Reno Casino, and St. Mary’s Health Network.
According to the appraisal, the property is situated within the Meadowood submarket of the larger Reno Metro retail market. As of the third quarter of 2021, the submarket reported total inventory of approximately 4.5 million square feet with an 8.0% vacancy rate and average rents of $18.87 per square foot, net. The appraisal did not identify any direct comparables for the Meadowood Mall Property and based leasing assumptions primarily on recent leases at the property.
THE INFORMATION IN THIS STRUCTURAL AND COLLATERAL TERM SHEET IS NOT COMPLETE AND MAY BE AMENDED PRIOR TO THE TIME OF SALE. THIS TERM SHEET IS NOT AN OFFER TO SELL THESE SECURITIES AND IT IS NOT A SOLICITATION OF AN OFFER TO BUY THESE SECURITIES IN ANY JURISDICTION WHERE THE OFFER OR SALE IS NOT PERMITTED.
143
| Retail – Regional Mall | Loan #11 | Cut-off Date Balance: | $19,000,000 | |
5000 Meadowood Mall Circle Reno, Nevada 89502 | Meadowood Mall | Cut-off Date LTV: U/W NCF DSCR: U/W NOI Debt Yield: | 35.2% 2.98x 19.8% |
The following table presents certain information relating to the appraiser’s market rent conclusions for the Meadowood Mall Property:
Market Rent Summary(1)
| Market Rent (PSF) | Lease Term (Yrs.) | Rent Increase Projections | Tenant Improvements | Free Rent | |
| 0-1,500 SF | $103.00 | 7 | 3%/year | $35.00 | None |
| 1,501-2,500 SF | $54.00 | 7 | 3%/year | $35.00 | None |
| 2,501-4,000 SF | $48.00 | 7 | 3%/year | $35.00 | None |
| 4,001-6,500 SF | $45.00 | 7 | 3%/year | $35.00 | None |
| 6,501-10,000 SF | $28.00 | 7 | 3%/year | $35.00 | None |
| Jewelry Space | $135.00 | 7 | 3%/year | $40.00 | None |
| Restaurant Space | $40.00 | 10 | 3%/year | $40.00 | None |
| Snack Bar Space | $120.00 | 10 | 3%/year | $40.00 | None |
| Food Court Space | $90.00 | 10 | 3%/year | $40.00 | None |
| Kiosk Space | $425.00 | 3 | 3%/year | $0.00 | None |
| 20,000 SF + | $15.50 | 10 | 10%/5 yrs. | $20.00 | None |
| 50,000 SF + | $14.00 | 15 | 10%/5 yrs. | $10.00 | None |
| Anchor Space | $5.50 | 20 | 10%/5 yrs. | $10.00 | None |
| (1) | Information obtained from the appraisal. |
The table below presents certain information relating to comparable sales pertaining to the Meadowood Mall Property identified by the appraiser:
Comparable Sales(1)
| Property Name | Location | Year Built/Renov. | Rentable Area (SF) | Sale Date | Sale Price (PSF) |
| King of Prussia Town Center | King of Prussia, PA | 2016/NAP | 263,423 | May-2017 | $695 |
| The Arboretium | Austin, TX | 1998/NAP | 195,302 | May-2017 | $507 |
| Town Square | Enterprise, NV | 2007/NAP | 1,147,202 | Jan-2017 | $342 |
| (1) | Information obtained from the appraisal. Includes only sales that the appraisal placed primary emphasis on. |
Escrows.
Real Estate Taxes – During a Reserve Trigger Event (as defined below) or a Lockbox Event Period (as defined below), the Meadowood Mall Whole Loan documents require ongoing monthly real estate tax reserves in an amount equal to 1/12th of the real estate taxes that the lender estimates will be payable during the next 12 months. As long as no event of default is continuing, the Meadowood Mall Borrower may provide a guaranty, reasonably acceptable to the lender, or a letter of credit in lieu of making monthly deposits into the Real Estate Tax Reserve.
Insurance – During a Reserve Trigger Event or a Lockbox Event Period, if the Meadowood Mall Borrower has not provided satisfactory evidence that the Meadowood Mall Property is covered by policies that are part of a reasonably acceptable blanket incurance policy, the Meadowood Mall Whole Loan documents require ongoing monthly insurance reserves in an amount equal to 1/12th of the insurance premiums that the lender estimates will be payable for the renewal of the coverage afforded by the policies upon the expiration thereof. As long as no event of default is continuing, the Meadowood Mall Borrower may provide a guaranty, reasonably acceptable to the lender, or a letter of credit in lieu of making monthly deposits into the Insurance Reserve.
Leasing Reserve – The Meadowood Mall Whole Loan documents require an ongoing monthly deposit of $76,140 in the TI/LC Reserve. As long as no event of default is continuing, the Meadowood Mall Borrower may provide a guaranty, reasonably acceptable to the lender, or a letter of credit in lieu of making monthly deposits into the TI/LC Reserve
Replacement Reserve – The Meadowood Whole Loan documents require an upfront deposit of $3,000,000. During a Reserve Trigger Event or a Lockbox Event Period, an ongoing monthly replacement reserve deposits of $9,518 is required, if the balance in the Replacement Reserve is less than $228,420. Up to $1,000,000 of the initial reserve may be disbursed to pay for tenant improvement and leasing commissions. As long as no event of default is continuing, the Meadowood Mall Borrower may provide a guaranty, reasonably acceptable to the lender, or a letter of credit in lieu of making monthly deposits into the Replacement Reserve.
THE INFORMATION IN THIS STRUCTURAL AND COLLATERAL TERM SHEET IS NOT COMPLETE AND MAY BE AMENDED PRIOR TO THE TIME OF SALE. THIS TERM SHEET IS NOT AN OFFER TO SELL THESE SECURITIES AND IT IS NOT A SOLICITATION OF AN OFFER TO BUY THESE SECURITIES IN ANY JURISDICTION WHERE THE OFFER OR SALE IS NOT PERMITTED.
144
| Retail – Regional Mall | Loan #11 | Cut-off Date Balance: | $19,000,000 | |
5000 Meadowood Mall Circle Reno, Nevada 89502 | Meadowood Mall | Cut-off Date LTV: U/W NCF DSCR: U/W NOI Debt Yield: | 35.2% 2.98x 19.8% |
A “Reserve Trigger Event” means the net cash flow debt yield being less than 11.5% for two consecutive quarters based on the trailing four quarters. A Reserve Trigger Event will end when the net cash flow debt yield is more than 11.5% for two consecutive quarters.
Lockbox and Cash Management. The Meadowood Mall Whole Loan is structured with an in-place hard lockbox, into which the borrower and property manager are required to cause all rents to be deposited directly by tenants. In the absence of a Lockbox Event Period (as defined below), all funds in the lockbox account are required to be distributed to the borrower’s operating account. During a Lockbox Event Period, all funds in the lockbox account are required to be swept weekly to a lender-controlled cash management account and applied in accordance with the Meadowood Mall Whole Loan waterfall. All excess funds will be swept to an excess cash flow subaccount controlled by the lender and held for so long as such Lockbox Event Period continues.
A “Lockbox Event Period” will commence upon the earlier of the following:
| (i) | the occurrence of an event of default; |
| (ii) | a bankruptcy action of the Meadowood Mall Borrower |
| (iii) | a bankruptcy action of the manager if the manager is an affiliate of the Meadowood Mall Borrower and is not replaced within 60 days; |
| (iv) | the net cash flow debt yield on the Meadowood Mall Whole Loan being less than 11.0% for two consecutive quarters, based on the trailing four quarters (the “Debt Yield Trigger”; |
| (v) | an Anchor Tenant (as defined below) Operations Event (as defined below) has occurred with respect to either Anchor Tenant and the Debt Yield Condition (as defined below) has not been satisfied (the “Anchor Tenant Trigger Event”); |
| (vi) | A Major Tenant (as defined below) goes dark or vacates on a permanent basis, files for bankruptcy or has not renewed six months prior to lease expiration (“Major Tenant Trigger Event”); |
| (vii) | Both Major Tenants simultaneously subject to a Major Tenant Trigger (“Major Tenant Multiple Trigger Event”); |
| (viii) | A Major Tenant Trigger Event and an Anchor Tenant Trigger Event, with respect to a single Anchor Tenant happening simultaneously (“Mixed Tenant Trigger Event”) ; |
| (ix) | The Meadowood Mall Guarantor identifies the Meadowood Mall Property as a non-core asset in its most recent 10-K filing; or |
| (x) | Less than 75% of estoppels have been received, including both Major Tenants, on or before January 3, 2022. |
A Lockbox Event Period will end upon the occurrence of the following:
| • | with regard to clause (i), the cure of such event of default; |
| • | with regard to clauses (iii), the Meadowood Borrower replaces the manager with a qualified manager under a replacement management agreement within 60 days or the bankruptcy action has been dismissed within 90 days without any adverse consequences to the Meadowood Property or loan; |
| • | with regard to clause (iv), the net cash flow debt yield on the Meadowood Mall Whole Loan being equal to or greater than 11.0% for two consecutive quarters; |
| • | with regard to clause (v), the Anchor Tenant Operations Event Cure (as defined below) or the Debt Yield Condition is satisfied (“Anchor Tenant Trigger Event Cure”); |
| • | with regard to clause (vi), the Major Tenant is continuously operating its business for at least 30 days, the Major Tenant lease has been affirmed in an applicable bankruptcy court and the tenant is in full occupancy of its space, or the Major Tenant has renewed its lease on terms approved by the lender or at least 95% of the Major Tenant space has been leased to one or more new tenants as evidenced by and Officer’s Certificate from the Meadowood Mall Borrower (“Major Tenant Trigger Event Cure”) or the Major Tenant Threshold Amount (as defined below) has been deposited into the excess cash flow account; |
| • | with regard to clause (vii), if the Debt Yield Condition has been met, the earlier to occur of the Major Tenant Threshold Amount for both tenants has been deposited into the excess cash account, or a Major Tenant Trigger Event Cure has occurred for both tenants; provided, if the Major Tenant Event Cure occurs with respect to one but not both Major Tenants, the Lockbox Event will continue pursuant to clause (vi) above; |
| • | With regard to clause (vii), if the Debt Yield Condition has not been met, the earlier to occur of (a) when each Major Tenant Event Cure occurs or (b) when the Debt Yield Condition has been met; provided that in the case of (a) if the Major Tenant Event Cure occurs with respect to one but not both Major Tenants, the Lockbox Event will continue pursuant to clause (vi) above and with respect to (b) any amounts previously deposited in the Excess Cash Flow Account shall remain until a Major Tenant Trigger Event Cure has been effected for each Major Tenant. |
| • | With regard to clause (viii), the date on which (a) a Major Tenant Trigger Event Cure has occurred, (b) an Anchor Tenant Trigger Event Cure has occurred or (c) the Major Tenant Threshold Amount with respect to the applicable Major Tenant has been deposited in the excess cash flow account; |
| • | With respect to clause (ix), the Meadowood Mall Property has been designated a core asset in the Meadowood Mall Guarantor’s most recent 10-K filing. |
| • | With respect to clause (x), 75% or more of estoppels have been received. |
An “Anchor Tenant” means J.C. Penney and the Specified Macy’s (suite XB).
An “Anchor Tenant Operations Event” means the date on which an Anchor Tenant goes dark or vacates on a permanent basis (or for 90 Consecutive days with an intent to permanently vacate).
An “Anchor Tenant Operations Event Cure” means, with respect to each Anchor Tenant, the applicable anchor Tenant is continuously operating its business at the Meadowood Mall Property for a period of no less than 30 consecutive days.
A “Major Tenant” means Dick’s Sporting Goods and Non-Specified Macy’s (suite XC).
THE INFORMATION IN THIS STRUCTURAL AND COLLATERAL TERM SHEET IS NOT COMPLETE AND MAY BE AMENDED PRIOR TO THE TIME OF SALE. THIS TERM SHEET IS NOT AN OFFER TO SELL THESE SECURITIES AND IT IS NOT A SOLICITATION OF AN OFFER TO BUY THESE SECURITIES IN ANY JURISDICTION WHERE THE OFFER OR SALE IS NOT PERMITTED.
145
| Retail – Regional Mall | Loan #11 | Cut-off Date Balance: | $19,000,000 | |
5000 Meadowood Mall Circle Reno, Nevada 89502 | Meadowood Mall | Cut-off Date LTV: U/W NCF DSCR: U/W NOI Debt Yield: | 35.2% 2.98x 19.8% |
The “Debt Yield Condition” means the net cash flow debt yield on the Meadowood Mall Whole Loan is as greater than or equal to 12.75% for two consecutive quarters, based on the trailing four quarters
The “Major Tenant Threshold Amount” means $4,936,050 for the Non-Specified Macy’s and $2,506,650 for Dick’s Sporting Goods.
Subordinate and Mezzanine Indebtedness. Concurrently with the funding of the Meadowood Mall Senior Loan, the lender also funded the Meadowood Mall Subordinate Loan in the amount of $28.0 million. The Meadowood Mall Subordinate Loan is co-terminous with the Meadowood Mall Senior Loan. Prior to an event of default, the Meadowood Mall Subordinate Loan will be receive prepayments and repayments of principal on a pro rata basis with the Meadowood Mall Senior Loan. The holders of the promissory note evidencing the Meadowood Mall Whole Loan have entered into a co-lender agreement that sets forth the allocation of collections on the Meadowood Mall Whole Loan. See “Description of the Mortgage Pool—Additional Indebtedness—Subordinate Indebtedness” in the Preliminary Prospectus.
The following table presents certain information relating to the Meadowood Mall Subordinate Loan:
Subordinate Loan Original Principal Balance | Subordinate Loan Interest Rate | Original Term (mos.) | Original Amort. Term (mos.) | Original IO Term (mos.) | Total Debt UW NCF DSCR | Total Debt UW NOI Debt Yield | Total Debt Cutoff Date LTV | |
| Meadowood Mall Subordinate Loan | $28,000,000 | 10.75% | 60 | 300 | 0 | 1.81x | 14.7% | 47.6% |
THE INFORMATION IN THIS STRUCTURAL AND COLLATERAL TERM SHEET IS NOT COMPLETE AND MAY BE AMENDED PRIOR TO THE TIME OF SALE. THIS TERM SHEET IS NOT AN OFFER TO SELL THESE SECURITIES AND IT IS NOT A SOLICITATION OF AN OFFER TO BUY THESE SECURITIES IN ANY JURISDICTION WHERE THE OFFER OR SALE IS NOT PERMITTED.
146
(THIS PAGE INTENTIONALLY LEFT BLANK)
THE INFORMATION IN THIS STRUCTURAL AND COLLATERAL TERM SHEET IS NOT COMPLETE AND MAY BE AMENDED PRIOR TO THE TIME OF SALE. THIS TERM SHEET IS NOT AN OFFER TO SELL THESE SECURITIES AND IT IS NOT A SOLICITATION OF AN OFFER TO BUY THESE SECURITIES IN ANY JURISDICTION WHERE THE OFFER OR SALE IS NOT PERMITTED.
147
| No. 12 – Highland Village Plaza | |||||||
| Mortgage Loan Information | Mortgaged Property Information | ||||||
| Mortgage Loan Seller: | Wells Fargo Bank, National Association | Single Asset/Portfolio: | Single Asset | ||||
Credit Assessment (Fitch/KBRA/Moody’s): | NR/NR/NR | Property Type – Subtype(3): | Retail – Unanchored | ||||
| Original Principal Balance: | $18,115,000 | Location: | Highland, CA | ||||
| Cut-off Date Balance: | $18,115,000 | Size: | 105,455 SF | ||||
| % of Initial Pool Balance: | 2.4% | Cut-off Date Balance Per SF: | $171.78 | ||||
| Loan Purpose: | Acquisition | Maturity Date Balance Per SF: | $147.86 | ||||
| Borrower Sponsor: | Scott Vaughan and David Benz | Year Built/Renovated: | 1991/2005 | ||||
| Guarantor: | Scott Vaughan and David Benz | Title Vesting: | Fee | ||||
| Mortgage Rate: | 3.7200% | Property Manager: | Campus and Main Manager, LLC | ||||
| Note Date: | September 1, 2021 | Current Occupancy (As of): | 86.4% (10/31/2021) | ||||
| Seasoning: | 3 months | YE 2020 Occupancy(4): | NAV | ||||
| Maturity Date: | September 11, 2031 | YE 2019 Occupancy(4): | NAV | ||||
| IO Period: | 36 months | YE 2018 Occupancy(4): | NAV | ||||
| Loan Term (Original): | 120 months | YE 2017 Occupancy(4): | NAV | ||||
| Amortization Term (Original): | 360 months | As-Is Appraised Value(5): | $30,800,000 | ||||
| Loan Amortization Type: | Interest Only, Amortizing Balloon | As-Is Appraised Value Per SF(5): | $292.07 | ||||
| Call Protection: | L(27),D(89),O(4) | As-Is Appraisal Valuation Date: | June 22, 2021 | ||||
| Lockbox Type: | Soft/Springing Cash Management | Underwriting and Financial Information(5) | |||||
| Additional Debt: | None | YE 2020 NOI: | $1,825,942 | ||||
| Additional Debt Type (Balance): | NAP | YE 2019 NOI: | $1,833,147 | ||||
| YE 2018 NOI: | NAV | ||||||
| YE 2017 NOI: | NAV | ||||||
| U/W Revenues: | $2,809,102 | ||||||
| U/W Expenses: | $1,040,883 | ||||||
| Escrows and Reserves | U/W NOI: | $1,768,218 | |||||
| Initial | Monthly | Cap | U/W NCF: | $1,683,096 | |||
| Taxes | $138,306 | $23,051 | NAP | U/W DSCR based on NOI/NCF: | 1.76x / 1.68x | ||
| Insurance | $13,062 | $6,531 | NAP | U/W Debt Yield based on NOI/NCF: | 9.8% / 9.3% | ||
| Replacement Reserves | $0 | $3,051 | $109,818(1) | U/W Debt Yield at Maturity based on NOI/NCF: | 11.3% / 10.8% | ||
| TI/LC | $500,000 | Springing | $500,000(2) | Cut-off Date LTV Ratio: | 58.8% | ||
| LTV Ratio at Maturity: | 50.6% | ||||||
| Sources and Uses | ||||||||
| Sources | Uses | |||||||
| Original Mortgage Loan amount | $18,115,000 | 58.2% | Purchase price | $30,050,000 | 96.6% | |||
| Cash equity contribution | 13,008,497 | 41.8 | Upfront reserves | 651,368 | 2.1 | |||
| Closing costs | 422,129 | 1.4 | ||||||
| Total Sources | $31,123,497 | 100.0% | Total Uses | $31,123,497 | 100.0% | |||
| (1) | Replacement Reserves are required beyond the cap upon (i) the occurrence and continuance of an event of default, (ii) the lender’s determination that the Highland Village Plaza Property (as defined below) is not being adequately maintained, or (iii) the occurrence and continuance of a Cash Trap Event Period. A “Cash Trap Event Period” will occur upon (a) the occurrence and continuance of an event of default; (b) the net cash flow debt yield falling below 6.5% (tested quarterly); or (c) CVS (or any replacement tenant occupying at least 75% of the CVS space) going dark in its space, filing bankruptcy, or failing to renew its lease at least 12 months prior to expiration. |
| (2) | TI/LC reserves are required beyond the cap upon (i) the occurrence and continuance of an event of default, (ii) the physical or economic occupancy level falling below 90% based on the quarterly certified rent roll required to be delivered, (iii) the net cash flow debt yield falling below 9.0%, or (iv) the occurrence and continuance of a Cash Trap Event Period. |
| (3) | The Highland Village Plaza Property is shadow anchored by a corporate-owned Albertson’s grocery store, which physically sits in the middle of the subject property, but is not part of the collateral. |
| (4) | Historical occupancy is not available, as the borrower sponsor recently acquired the Highland Village Plaza Property from two separate sellers, and such information was not provided. However, 84.9% of net rentable area has been in occupancy since December 2020 or earlier; 81.4% of net rentable area has been in occupancy since June 2019 or earlier; 80.6% of net rentable area has been in occupancy since August 2018 or earlier; 72.0% of net rentable area has been in occupancy since July 2013 or earlier; and 57.0% of the net rentable area has been in occupancy since July 2006 or earlier. |
| (5) | While the Highland Village Plaza Mortgage Loan (as defined below) was originated after the emergence of the novel coronavirus pandemic and the economic disruption resulting from measures to combat the pandemic, the pandemic is an evolving situation and could impact the Highland Village Plaza Mortgage Loan more severely than assumed in the underwriting and could adversely affect the NOI, NCF and occupancy information, as well as the appraised value and the DSCR, LTV and Debt Yield metrics presented above. See “Risk Factors— Risks Related to Market Conditions and Other |
THE INFORMATION IN THIS STRUCTURAL AND COLLATERAL TERM SHEET IS NOT COMPLETE AND MAY BE AMENDED PRIOR TO THE TIME OF SALE. THIS TERM SHEET IS NOT AN OFFER TO SELL THESE SECURITIES AND IT IS NOT A SOLICITATION OF AN OFFER TO BUY THESE SECURITIES IN ANY JURISDICTION WHERE THE OFFER OR SALE IS NOT PERMITTED.
148
| Retail – Unanchored | Loan #12 | Cut-off Date Balance: | $18,115,000 | |
7191, 7197, 7199, and 7211-7291 Highland, CA 92346 | Highland Village Plaza | Cut-off Date LTV: U/W NCF DSCR: U/W NOI Debt Yield: | 58.8% 1.68x 9.8% |
External Factors—Coronavirus Pandemic Has Adversely Affected the Global Economy and Will Likely Adversely Affect the Performance of the Mortgage Loans” in the Preliminary Prospectus.
The Mortgage Loan. The twelfth largest mortgage loan (the “Highland Village Plaza Mortgage Loan”) is evidenced by a first priority fee mortgage encumbering an unanchored retail property totaling 105,455 square feet located in Highland, California (the “Highland Village Plaza Property”).
The Property. The Highland Village Plaza Property is an unanchored retail property totaling 105,455 square feet and located in Highland, California, approximately 65.8 miles east of the Los Angeles central business district. The Highland Village Plaza Property is shadow-anchored by a corporate-owned Albertson’s grocery store, which physically sits in the middle of the subject property, but is not part of the collateral. Built in 1991 and most recently renovated in 2005, the Highland Village Plaza Property is situated on a 12.8-acre parcel and contains 931 surface parking spaces, resulting in a parking ration of 8.9 spaces per 1,000 square feet of rentable area. As of October 31, 2021 the Highland Village Plaza Property was 86.4% occupied by 29 tenants, and 57.0% of the net rentable area has been in occupancy since July 2006 or earlier.
Major Tenants.
Largest Tenant by UW Base Rent: CVS (25,500 square feet; 24.2% of net rentable area; 12.2% of underwritten base rent; 2/28/2027 lease expiration) – CVS has been a tenant since 1990 and executed a five-year lease extension in May 2021, effective March 2022, with a February 2027 lease expiration. CVS has two, 5-year renewal options remaining and no termination options. CVS reported gross sales for the trailing 12-month period ending September 30, 2021 of approximately $9.9 million ($386 per square foot; 4.2% occupancy cost), which were up from 2020 gross sales of approximately $9.4 million ($369 per square foot).
2nd Largest Tenant by UW Base Rent: Tutor Time (10,200 square feet; 9.7% of net rentable area; 10.8% of underwritten base rent; 6/30/2022 lease expiration) – Tutor Time operates 18 child care and learning centers in the surrounding area, serving children from 6 weeks to 12 years of age. Tutor Time has been a tenant at the Highland Village Plaza Property since 1996 and has a lease expiration in June 2022 with no renewal options and no termination options.
3rd Largest Tenant by UW Base Rent: Goodwill (12,511 square feet; 11.9% of net rentable area; 10.3% of underwritten base rent; 2/28/2025 lease expiration) – Goodwill operates a store and donation center at the Highland Village Plaza Property and has been a tenant since 2013. Goodwill most recently renewed its lease in March 2020 and has a lease expiration in February 2025. Goodwill has two, five-year renewal options and no termination options.
COVID-19 Update. As of November 3, 2021, the Highland Village Plaza Property was open and operational. Tutor Time (10.8% of underwritten base rent) received nine months of deferred rent from April 2020 through December 2020, which is required to be paid back in equal monthly installments from July 2021 through June 2025. In addition, Highland Village Pet Hospital (3.4% of underwritten base rent) received approximately four months of deferred rent, which was converted into a promissory note to be paid back in 40 equal monthly installments beginning in August 2020. Two tenants totaling 5.5% of net rentable area are delinquent on rent payments; however, these tenants were underwritten as vacant.
THE INFORMATION IN THIS STRUCTURAL AND COLLATERAL TERM SHEET IS NOT COMPLETE AND MAY BE AMENDED PRIOR TO THE TIME OF SALE. THIS TERM SHEET IS NOT AN OFFER TO SELL THESE SECURITIES AND IT IS NOT A SOLICITATION OF AN OFFER TO BUY THESE SECURITIES IN ANY JURISDICTION WHERE THE OFFER OR SALE IS NOT PERMITTED.
149
| Retail – Unanchored | Loan #12 | Cut-off Date Balance: | $18,115,000 | |
7191, 7197, 7199, and 7211-7291 Highland, CA 92346 | Highland Village Plaza | Cut-off Date LTV: U/W NCF DSCR: U/W NOI Debt Yield: | 58.8% 1.68x 9.8% |
The following table presents certain information relating to the tenancy at the Highland Village Plaza Property:
Major Tenants
| Tenant Name | Credit Rating (Fitch/ Moody’s/ | Tenant NRSF | % of NRSF | Annual U/W Base Rent PSF(2) | Annual U/W Base Rent(2) | % of Total Annual U/W Base Rent | Lease Expiration Date | Ext. Options | Term. Option (Y/N) |
| Major Tenants | |||||||||
| CVS | NR/Baa2/BBB | 25,500 | 24.2% | $9.41 | $240,000 | 12.2% | 2/28/2027 | 2, 5-year | N |
| Tutor Time | NR/NR/NR | 10,200 | 9.7% | $20.78 | $211,984 | 10.8% | 6/30/2022 | None | N |
| Goodwill | NR/NR/NR | 12,511 | 11.9% | $16.12 | $201,732 | 10.3% | 2/28/2025 | 2, 5-year | N |
| Arrowhead Credit Union | NR/NR/NR | 4,542 | 4.3% | $28.08 | $127,542 | 6.5% | 1/31/2023 | None | N |
| McCleaners | NR/NR/NR | 1,890 | 1.8% | $56.01 | $105,858 | 5.4% | 9/30/2028 | None | N |
| 54,643 | 51.8% | $16.23 | $887,116 | 45.2% | |||||
| Non-Major Tenants | 36,481 | 34.6% | $29.49 | $1,075,676 | 54.8% | ||||
| Occupied Collateral Total | 91,124 | 86.4% | $21.54 | $1,962,793 | 100.0% | ||||
| Vacant Space | 14,331 | 13.6% | |||||||
| Collateral Total | 105,455 | 100.0% | |||||||
| (1) | Certain ratings are those of the parent company whether or not the parent company guarantees the lease. |
| (2) | Annual U/W Base Rent PSF and Annual U/W Base Rent include contractual rent steps through November 2022 totaling $91,792. |
The following table presents certain information relating to the lease rollover schedule at the Highland Village Plaza Property:
Lease Expiration Schedule(1)(2)
| Year Ending December 31, | No. of Leases Expiring | Expiring NRSF | % of Total NRSF | Cumulative Expiring NRSF | Cumulative % of Total NRSF | Annual U/W Base Rent | % of Total Annual U/W Base Rent | Annual U/W Base Rent PSF |
| MTM | 0 | 0 | 0.0% | 0 | 0.0% | $0 | 0.0% | $0.00 |
| 2021 | 0 | 0 | 0.0% | 0 | 0.0% | $0 | 0.0% | $0.00 |
| 2022 | 4 | 15,244 | 14.5% | 15,244 | 14.5% | $382,062 | 19.5% | $25.06 |
| 2023 | 9 | 15,902 | 15.1% | 31,146 | 29.5% | $432,984 | 22.1% | $27.23 |
| 2024 | 8 | 11,135 | 10.6% | 42,281 | 40.1% | $319,444 | 16.3% | $28.69 |
| 2025 | 4 | 17,583 | 16.7% | 59,864 | 56.8% | $351,671 | 17.9% | $20.00 |
| 2026 | 0 | 0 | 0.0% | 59,864 | 56.8% | $0 | 0.0% | $0.00 |
| 2027 | 2 | 27,810 | 26.4% | 87,674 | 83.1% | $326,674 | 16.6% | $11.75 |
| 2028 | 1 | 1,890 | 1.8% | 89,564 | 84.9% | $105,858 | 5.4% | $56.01 |
| 2029 | 0 | 0 | 0.0% | 89,564 | 84.9% | $0 | 0.0% | $0.00 |
| 2030 | 1 | 1,560 | 1.5% | 91,124 | 86.4% | $44,100 | 2.2% | $28.27 |
| 2031 | 0 | 0 | 0.0% | 91,124 | 86.4% | $0 | 0.0% | $0.00 |
| Thereafter | 0 | 0 | 0.0% | 91,124 | 86.4% | $0 | 0.0% | $0.00 |
| Vacant | 0 | 14,331 | 13.6% | 105,455 | 100.0% | $0 | 0.0% | $0.00 |
| Total/Weighted Average | 29 | 105,455 | 100.0% | $1,962,793 | 100.0% | $21.54 |
| (1) | Information obtained from the underwritten rent roll. |
| (2) | Certain tenants may have termination options, which are not reflected on the table above. |
THE INFORMATION IN THIS STRUCTURAL AND COLLATERAL TERM SHEET IS NOT COMPLETE AND MAY BE AMENDED PRIOR TO THE TIME OF SALE. THIS TERM SHEET IS NOT AN OFFER TO SELL THESE SECURITIES AND IT IS NOT A SOLICITATION OF AN OFFER TO BUY THESE SECURITIES IN ANY JURISDICTION WHERE THE OFFER OR SALE IS NOT PERMITTED.
150
| Retail – Unanchored | Loan #12 | Cut-off Date Balance: | $18,115,000 | |
7191, 7197, 7199, and 7211-7291 Highland, CA 92346 | Highland Village Plaza | Cut-off Date LTV: U/W NCF DSCR: U/W NOI Debt Yield: | 58.8% 1.68x 9.8% |
The following table presents historical occupancy percentages at the Highland Village Plaza Property:
Historical Occupancy
12/31/2017(1) | 12/31/2018(1) | 12/31/2019(1) | 12/31/2020(1) | 10/31/2021(2) |
| NAV | NAV | NAV | NAV | 86.4% |
| (1) | Historical occupancy is not available, as the borrower sponsor recently acquired the Highland Village Plaza Property from two separate sellers, and such information was not provided. However, 84.9% of net rentable area has been in occupancy since December 2020 or earlier; 81.4% of net rentable area has been in occupancy since June 2019 or earlier; 80.6% of net rentable area has been in occupancy since August 2018 or earlier; 72.0% of net rentable area has been in occupancy since July 2013 or earlier; and 57.0% of the net rentable area has been in occupancy since July 2006 or earlier. |
| (2) | Information obtained from the underwritten rent roll. |
Operating History and Underwritten Net Cash Flow. The following table presents certain information relating to the historical operating performance and underwritten net cash flow at the Highland Village Plaza Property:
Cash Flow Analysis(1)
| 2019 | 2020 | U/W | %(2) | U/W $ per SF | |
| Base Rent | $2,185,116 | $2,081,879 | $1,962,793(3) | 61.3% | $18.61 |
| Grossed Up Vacant Space | 0 | 0 | 391,217 | 12.2 | 3.71 |
| Gross Potential Rent | $2,185,116 | $2,081,879 | $2,354,010 | 73.6% | $22.32 |
| Other Income | 12,976 | 19,470 | 12,976 | 0.4 | 0.12 |
| Percentage Rent | 0 | 0 | 25,078 | 0.8 | 0.24 |
| Total Recoveries | 431,246 | 433,278 | 808,255 | 25.3 | 7.66 |
| Net Rental Income | $2,629,338 | $2,534,627 | $3,200,319 | 100.0% | 30.35 |
| (Vacancy & Credit Loss) | 0 | 0 | (391,217)(4) | (16.6) | (3.71) |
| Effective Gross Income | $2,629,338 | $2,534,627 | $2,809,102 | 87.8% | $26.64 |
| Real Estate Taxes | 210,338 | 216,370 | 397,104 | 14.1 | 3.77 |
| Insurance | 44,403 | 35,844 | 74,635 | 2.7 | 0.71 |
| Management Fee | 84,670 | 48,285 | 112,364 | 4.0 | 1.07 |
| Other Operating Expenses | 456,780 | 408,186 | 456,780 | 16.3 | 4.33 |
| Total Operating Expenses | $796,191 | $708,685 | $1,040,883 | 37.1% | $9.87 |
| Net Operating Income | $1,833,147 | $1,825,942 | $1,768,218 | 62.9% | $16.77 |
| Replacement Reserves | 0 | 0 | 36,606 | 1.3 | 0.35 |
| TI/LC | 0 | 0 | 48,516 | 1.7 | 0.46 |
| Net Cash Flow | $1,833,147 | $1,825,942 | $1,683,096 | 59.9% | $15.96 |
| NOI DSCR | 1.83x | 1.82x | 1.76x | ||
| NCF DSCR | 1.83x | 1.82x | 1.68x | ||
| NOI Debt Yield | 10.1% | 10.1% | 9.8% | ||
| NCF Debt Yield | 10.1% | 10.1% | 9.3% |
| (1) | Prior historical and trailing 12-month operating history is not available, as the borrower sponsor recently acquired the Highland Village Plaza Property from two separate sellers and such information was not provided. |
| (2) | Represents (i) percent of Net Rental Income for all revenue fields, (ii) percent of Gross Potential Rent for Vacancy & Credit Loss and (iii) percent of Effective Gross Income for all other fields. |
| (3) | U/W Base Rent includes contractual rent steps through November 2022 totaling $91,792 |
| (4) | The underwritten economic vacancy is 16.6%. The Highland Village Plaza Property was 86.4% physically occupied as of October 31, 2021. |
THE INFORMATION IN THIS STRUCTURAL AND COLLATERAL TERM SHEET IS NOT COMPLETE AND MAY BE AMENDED PRIOR TO THE TIME OF SALE. THIS TERM SHEET IS NOT AN OFFER TO SELL THESE SECURITIES AND IT IS NOT A SOLICITATION OF AN OFFER TO BUY THESE SECURITIES IN ANY JURISDICTION WHERE THE OFFER OR SALE IS NOT PERMITTED.
151
| Retail – Unanchored | Loan #12 | Cut-off Date Balance: | $18,115,000 | |
7191, 7197, 7199, and 7211-7291 Highland, CA 92346 | Highland Village Plaza | Cut-off Date LTV: U/W NCF DSCR: U/W NOI Debt Yield: | 58.8% 1.68x 9.8% |
Market Overview and Competition. The Highland Village Plaza Property is located in Highland, San Bernardino County, California and is part of the Riverside-San Bernardino-Ontario metropolitan area. According to the appraisal, the surrounding area is viewed as suburban, and the immediate area surrounding the Highland Village Plaza Property is a commercial corridor with large retail uses. Primary access is via California Highway-210 (Foothill Freeway) from the west, and California Highway-330 (City Creek Road) from the north. The Highland Village Plaza Property is located approximately 65.8 miles east of the Los Angeles central business district, 6.7 miles northeast of downtown San Bernardino and 4.8 miles northeast of the San Bernardino International Airport. Within a three- and five-mile radius, the 2020 total population was 71,065 and 170,183, respectively; and within the same radii, the 2020 average household income was $86,937 and $76,786, respectively.
According to a third-party market research report, the Highland Village Plaza Property is situated within the Redlands/Loma Linda submarket of the Inland Empire retail market. As of Year-to-date November 3, 2021, the submarket reported total inventory of approximately 9.6 million square feet with a 6.9% vacancy rate and average asking rent of $23.15 per square foot.
The following table presents certain information relating to the appraiser’s market rent conclusions for the Highland Village Plaza Property:
Market Rent Summary(1)
| Inline Space | Majors Space | |
| Market Rent (PSF) | $30.00 | $15.00 |
| Lease Term (Years) | 5 | 10 |
| Lease Type | Net | Net |
| Rent Increase Projection | 3%/year | 3%/year |
(1) Information obtained from the appraisal.
THE INFORMATION IN THIS STRUCTURAL AND COLLATERAL TERM SHEET IS NOT COMPLETE AND MAY BE AMENDED PRIOR TO THE TIME OF SALE. THIS TERM SHEET IS NOT AN OFFER TO SELL THESE SECURITIES AND IT IS NOT A SOLICITATION OF AN OFFER TO BUY THESE SECURITIES IN ANY JURISDICTION WHERE THE OFFER OR SALE IS NOT PERMITTED.
152
(THIS PAGE INTENTIONALLY LEFT BLANK)
THE INFORMATION IN THIS STRUCTURAL AND COLLATERAL TERM SHEET IS NOT COMPLETE AND MAY BE AMENDED PRIOR TO THE TIME OF SALE. THIS TERM SHEET IS NOT AN OFFER TO SELL THESE SECURITIES AND IT IS NOT A SOLICITATION OF AN OFFER TO BUY THESE SECURITIES IN ANY JURISDICTION WHERE THE OFFER OR SALE IS NOT PERMITTED.
153
| No. 13 – Poplar Run | |||||||
| Mortgage Loan Information | Mortgaged Property Information | ||||||
| Mortgage Loan Seller: | BSPRT | Single Asset/Portfolio: | Single Asset | ||||
Credit Assessment (Fitch/KBRA/Moody’s): | NR/NR/NR | Property Type – Subtype: | Office – Suburban | ||||
| Original Principal Balance: | $17,955,000 | Location: | Alexandria, VA | ||||
| Cut-off Date Balance: | $17,955,000 | Size: | 148,881 SF | ||||
| % of Initial Pool Balance: | 2.3% | Cut-off Date Balance Per SF: | $120.60 | ||||
| Loan Purpose: | Refinance | Maturity Date Balance Per SF: | $93.91 | ||||
| Borrower Sponsor: | BRIT Limited Partnership | Year Built/Renovated: | 1989/2021 | ||||
| Guarantor: | BRIT Limited Partnership | Title Vesting: | Fee | ||||
| Mortgage Rate: | 3.3900% | Property Manager: | BECO Management Inc. (an affiliate of the borrower) | ||||
| Note Date: | November 9, 2021 | Current Occupancy (As of): | 83.4% (9/23/2021) | ||||
| Seasoning: | 0 months | YE 2020 Occupancy: | 88.0% | ||||
| Maturity Date: | December 6, 2031 | YE 2019 Occupancy: | 82.0% | ||||
| IO Period: | 0 months | YE 2018 Occupancy(1): | 71.0% | ||||
| Loan Term (Original): | 120 months | YE 2017 Occupancy(1): | 82.0% | ||||
| Amortization Term (Original): | 360 months | As-Is Appraised Value(3): | $25,650,000 | ||||
| Loan Amortization Type: | Amortizing Balloon | As-Is Appraised Value Per SF(3): | $172.29 | ||||
| Call Protection: | L(24),YM1(92),O(4) | As-Is Appraisal Valuation Date: | September 27, 2021 | ||||
| Lockbox Type: | Springing | ||||||
| Additional Debt: | No | Underwriting and Financial Information(3) | |||||
| Additional Debt Type (Balance): | NAP | TTM NOI (8/31/2021): | $1,826,453 | ||||
| YE 2020 NOI: | $1,912,931 | ||||||
| YE 2019 NOI: | $1,314,643 | ||||||
| YE 2018 NOI: | $1,219,981 | ||||||
| U/W Revenues: | $3,215,504 | ||||||
| U/W Expenses: | $1,168,629 | ||||||
| Escrows and Reserves | U/W NOI: | $2,046,875 | |||||
| Initial | Monthly | Cap | U/W NCF: | $1,808,666 | |||
| Taxes | $47,841 | $23,921 | NAP | U/W DSCR based on NOI/NCF: | 2.14x / 1.90x | ||
| Insurance | $0 | Springing(2) | NAP | U/W Debt Yield based on NOI/NCF: | 11.4% / 10.1% | ||
| Replacement Reserve | $0 | $3,102 | $111,661 | U/W Debt Yield at Maturity based on NOI/NCF: | 14.6% / 12.9% | ||
| TI/LC Reserve | $500,000 | $16,749 | $1,000,000 | Cut-off Date LTV Ratio: | 70.0% | ||
| Free Rent Reserve | $200,000 | $0 | NAP | LTV Ratio at Maturity: | 54.5% | ||
| Sources and Uses | ||||||||
| Sources | Uses | |||||||
| Loan Amount | $17,955,000 | 81.3% | Loan Payoff | $20,702,839 | 93.8% | |||
| Borrower Equity | 4,123,881 | 18.7 | Reserves | 747,841 | 3.4 | |||
| Closing Costs | 628,201 | 2.8 | ||||||
| Total Sources | $22,078,881 | 100.0% | Total Uses | $22,078,881 | 100.0% | |||
| (1) | The decrease of occupancy from YE 2017 to YE 2018 is attributable to five tenants totaling 28,803 square feet vacating the Poplar Run Property. A total of 35,097 square feet of new leases in 2019 were signed, bringing occupancy to its current level. |
| (2) | A springing monthly deposit of 1/12th of the estimated annual insurance premium payments is required (i) upon an event of default; (ii) if an acceptable blanket insurance policy is no longer in place for 5 or more commercial properties exclusive of the Poplar Run Property, (iii) the borrower fails to provide the lender with evidence of payment; and (iv) the lender does not receive satisfactory evidence of insurance policies when the same is required under the terms of the loan documents. |
| (3) | While the Poplar Run Mortgage Loan (as defined below) was originated after the emergence of the novel coronavirus pandemic and the economic disruption resulting from measures to combat the pandemic, the pandemic is an evolving situation and could impact the Poplar Run Mortgage Loan more severely than assumed in the underwriting and could adversely affect the NOI, NCF and occupancy information, as well as the appraised value and the DSCR, LTV and Debt Yield metrics presented above. See “Risk Factors— Risks Related to Market Conditions and Other External Factors—Coronavirus Pandemic Has Adversely Affected the Global Economy and Will Likely Adversely Affect the Performance of the Mortgage Loans” in the Preliminary Prospectus. |
The Mortgage Loan. The mortgage loan (the “Poplar Run Mortgage Loan”) is evidenced by a promissory note secured by a first mortgage encumbering the fee interest in a suburban office building totaling 148,881 square feet located in Alexandria, Virginia (the “Poplar Run Property”).
THE INFORMATION IN THIS STRUCTURAL AND COLLATERAL TERM SHEET IS NOT COMPLETE AND MAY BE AMENDED PRIOR TO THE TIME OF SALE. THIS TERM SHEET IS NOT AN OFFER TO SELL THESE SECURITIES AND IT IS NOT A SOLICITATION OF AN OFFER TO BUY THESE SECURITIES IN ANY JURISDICTION WHERE THE OFFER OR SALE IS NOT PERMITTED.
154
| Office – Suburban | Loan #13 | Cut-off Date Balance: | $17,955,688 | |
| 5285 Shawnee Road | Poplar Run | Cut-off Date LTV: | 70.0% | |
| Alexandria, VA 22312 | U/W NCF DSCR: | 1.90x | ||
| U/W NOI Debt Yield: | 11.4% |
The Property. The Poplar Run Property is a six-story, multi-tenant suburban office building consisting of 148,881 rentable square feet situated on 4.6 acres of land. The Poplar Run Property was built in 1989 and includes an atrium, conferencing facility, controlled access/security, Bluebike bikeshare site. Since 2019, the borrower sponsor has spent approximately $614,650 to renovate the building common areas. These renovations include the addition of a new conference center and café/restaurant, installation of digital antenna system to boost cell phone reception, EMS upgrade and compressor replacements. The borrower sponsor has also completed approximately $1.5 million in renovations in 2021, including $370,000 invested in an outdoor nature lounge. The renovations included updates to common area carpet and ceiling tiles, installation of LED lighting, new artwork, lobby improvements, and restroom finish/lighting upgrades. The Poplar Run Property includes 481 surface parking spaces for a ratio of 3.23 spaces per 1,000 square feet. As of September 23, 2021, the Poplar Run Property was 83.4% leased to 21 tenants, with the largest tenant making up 20.1% of the net rentable area and 28.2% of underwritten base rent.
Major Tenants.
Largest Tenant: Modern Technology Solutions, Inc. (29,861 square feet; 20.1% of NRA; 28.2% of U/W base rent; 12/31/2025 lease expiration)- Founded in 1993 and headquartered in the Poplar Run Property, Modern Technology Solutions, Inc. is a 100% employee-owned engineering services and technology solutions company in the areas of missile defense, cyber security, intelligence, unmanned/autonomous systems, aviation, space, and homeland security. Modern Technology Solutions, Inc. has been a tenant at the Poplar Run Property since 2009 and has one, five-year renewal options remaining and no termination options.
Second Largest Tenant: Washington Gas Light Company (A-/A3/A-; F/M/S&P; 24,749 square feet; 16.6% of NRA; 18.3% of U/W base rent; 1/31/2026 lease expiration)- Founded in 1848, Washington Gas Light Company is a regulated utility company that supplies natural gas and electricity to approximately 1.1 million commercial, domestic, and industrial customers in the metropolitan Washington D.C. area and in 25 states. Washington Gas Light Company has been a tenant at the Poplar Run Property for over 30 years and has two five-year renewal options remaining and a one-time early termination option effective January 31, 2024 upon written notice by August 4, 2023 and paying a termination fee equal to two months of rent and the sum of the unamortized amount of the tenant improvement allowance, leasing commissions legal fees and other costs at 10.5% interest. Washington Gas Light Company is not required to pay base rent during the months of February or March of each lease year. At origination, $200,000 was reserved for Free Rent in connection to Washington Gas Light Company wth monthly disbursements of $50,000 on February 6, 2024, March 6, 2024, February 6, 2024 an March 6, 2025.
Third Largest Tenant: E-9 Corporation (12,615 square feet; 8.5% of NRA; 10.3% of U/W base rent; 12/31/2029 lease expiration)- Founded in 2002 and headquartered in the Poplar Run Property, E-9 Corporation is a cyber security company that offers a suite of data protection services including a comprehensive 100% cloud-based platform that reduces response times, as well as asset management and enhanced communications for first responders. E-9 Corporation is an award winning Service-Disabled Veteran-Owned Small Business (SDVOSB) which is comprised of veterans from all branches of the military. E-9 Corporation has been a tenant at the Poplar Run Property since 2018 and has one five-year renewal option remaining and has a one-time early termination option effective April 30, 2026 upon providing nine months’ notice and paying a termination fee equal to the sum of the unamortized amount of the tenant improvement allowance, leasing commissions, legal fees, rent abatements and other costs at 10.5% interest. E-9 Corporation subleases 2,500 square feet to Veteran Enterprise Solutions, Inc. for a current total annual base rent of $63,571 ($25.43 per square foot) expiring on December 31, 2029
THE INFORMATION IN THIS STRUCTURAL AND COLLATERAL TERM SHEET IS NOT COMPLETE AND MAY BE AMENDED PRIOR TO THE TIME OF SALE. THIS TERM SHEET IS NOT AN OFFER TO SELL THESE SECURITIES AND IT IS NOT A SOLICITATION OF AN OFFER TO BUY THESE SECURITIES IN ANY JURISDICTION WHERE THE OFFER OR SALE IS NOT PERMITTED.
155
| Office – Suburban | Loan #13 | Cut-off Date Balance: | $17,955,688 | |
| 5285 Shawnee Road | Poplar Run | Cut-off Date LTV: | 70.0% | |
| Alexandria, VA 22312 | U/W NCF DSCR: | 1.90x | ||
| U/W NOI Debt Yield: | 11.4% |
The following table presents certain information relating to the tenancy at the Poplar Run Property:
Major Tenant
| Tenant Name | Credit Rating (Fitch/Moody’s/ S&P) | Tenant NRSF | % of NRSF | Annual U/W Base Rent PSF(1) | Annual U/W Base Rent(1) | % of Total Annual U/W Base Rent | Lease Expiration Date | Extension Options | Termination Option (Y/N) | ||
| Major Tenants | |||||||||||
| Modern Technology Solutions, Inc. | NR/NR/NR | 29,861 | 20.1% | $29.99 | $895,409 | 28.2% | 12/31/2025 | 1-5yr | N | ||
| Washington Gas Light Company | A-/A3/A- | 24,749 | 16.6% | $23.49 | $581,444 | 18.3% | 1/31/2026 | 2-5yr | Y(2) | ||
| E-9 Corporation(3) | NR/NR/NR | 12,615 | 8.5% | $25.95 | $327,359 | 10.3% | 12/31/2029 | 1-5yr | Y(4) | ||
| Philip Leopold and Marguerite Leopold | NR/NR/NR | 9,422 | 6.3% | $25.55 | $240,711 | 7.6% | 4/30/2024 | 1-5yr | N | ||
| Trinity Security Solutions, LLC | NR/NR/NR | 7,516 | 5.0% | $27.86 | $209,396 | 6.6% | 7/31/2024 | 1-5yr | N | ||
| Total Major Tenants | 84,163 | 56.5% | $26.79 | $2,254,319 | 71.1% | ||||||
Non-Major Tenant | 39,981 | 26.9% | $22.97 | $918,323 | 28.9% | ||||||
| Occupied Collateral | 124,144 | 83.4% | $25.56 | $3,172,641 | 100.0% | ||||||
| Vacant | 24,737 | 16.6% | |||||||||
| Collateral Total | 148,881 | 100.0% | |||||||||
| (1) | The Annual U/W Base Rent PSF and Annual U/W Base Rent shown above include rent steps through October 2022 totalling $82,130. |
| (2) | Washington Gas Light Company has a one-time termination option effective January 31, 2024 upon written notice by August 4, 2023 and paying a termination fee equal to two months of rent and the sum of the unamortized amount of the tenant improvement allowance, leasing commissions legal fees and other costs at 10.5% interest. In addition, Washington Gas Light Company is not required to pay base rent during the months of February and March of each lease year. |
| (3) | E-9 Corporation subleases 2,500 square feet to Veteran Enterprise Solutions, Inc. for a current total annual base rent of $63,571 ($25.23 per square foot) expiring on December 31, 2029. |
| (4) | E-9 Corporation has a one-time termination option effective April 30, 2026 upon providing nine months’ notice and paying a termination fee equal to the sum of the unamortized amount of the tenant improvement allowance, leasing commissions legal fees and other costs at 10.5% interest. |
THE INFORMATION IN THIS STRUCTURAL AND COLLATERAL TERM SHEET IS NOT COMPLETE AND MAY BE AMENDED PRIOR TO THE TIME OF SALE. THIS TERM SHEET IS NOT AN OFFER TO SELL THESE SECURITIES AND IT IS NOT A SOLICITATION OF AN OFFER TO BUY THESE SECURITIES IN ANY JURISDICTION WHERE THE OFFER OR SALE IS NOT PERMITTED.
156
| Office – Suburban | Loan #13 | Cut-off Date Balance: | $17,955,688 | |
| 5285 Shawnee Road | Poplar Run | Cut-off Date LTV: | 70.0% | |
| Alexandria, VA 22312 | U/W NCF DSCR: | 1.90x | ||
| U/W NOI Debt Yield: | 11.4% |
The following table presents certain information relating to the lease rollover schedule at the Poplar Run Property:
Lease Expiration Schedule(1)(2)
| Year Ending December 31, | No. of Leases Expiring | Expiring NRSF | % of Total NRSF | Cumulative Expiring NRSF | Cumulative % of Total NRSF | Annual U/W Base Rent | % of Total Annual U/W Base Rent | Annual U/W Base Rent PSF |
| MTM | 1 | 0 | 0.0% | 0 | 0.0% | $0 | 0.0% | $0.00 |
| 2021 | 2 | 3,341 | 2.2% | 3,341 | 2.2% | $59,528 | 1.9% | $17.82 |
| 2022 | 6 | 9,944 | 6.7% | 13,285 | 8.9% | $203,816 | 6.4% | $20.50 |
| 2023 | 2 | 2,373 | 1.6% | 15,658 | 10.5% | $51,617 | 1.6% | $21.75 |
| 2024 | 7 | 29,186 | 19.6% | 44,844 | 30.1% | $769,491 | 24.3% | $26.37 |
| 2025 | 3 | 29,861 | 20.1% | 74,705 | 50.2% | $895,409 | 28.2% | $29.99 |
| 2026 | 2 | 28,144 | 18.9% | 102,849 | 69.1% | $666,183 | 21.0% | $23.67 |
| 2027 | 0 | 0 | 0.0% | 102,849 | 69.1% | $0 | 0.0% | $0.00 |
| 2028 | 0 | 0 | 0.0% | 102,849 | 69.1% | $0 | 0.0% | $0.00 |
| 2029 | 1 | 12,615 | 8.5% | 115,464 | 77.6% | $327,359 | 10.3% | $25.95 |
| 2030 | 1 | 7,033 | 4.7% | 122,497 | 82.3% | $184,405 | 5.8% | $26.22 |
| 2031 | 1 | 1,647 | 1.1% | 124,144 | 83.4% | $14,832 | 0.5% | $9.01 |
| Thereafter | 0 | 0 | 0.0% | 124,144 | 83.4% | $0 | 0.0% | $0.00 |
| Vacant | 0 | 24,737 | 16.6% | 148,881 | 100.0% | $0 | 0.0% | $0.00 |
| Total/Weighted Average | 26 | 148,881 | 100.0% | $3,172,641 | 100.0% | $25.56(3) |
| (1) | Information obtained from the underwritten rent roll. |
| (2) | Certain tenants may have lease termination options that are exercisable prior to the originally stated expiration date of the subject lease that are not considered in the Lease Expiration Schedule. |
| (3) | Total/Weighted Average Annual U/W Base Rent PSF excludes vacant space. |
The following table presents historical occupancy percentages at the Poplar Run Property:
Historical Occupancy
12/31/2017(1)(2) | 12/31/2018(2)(3) | 12/31/2019(3) | 12/31/2020(3) | 9/23/2021(4) |
| 82.0% | 71.0% | 82.0% | 88.0% | 83.4% |
| (1) | Information obtained from a third party market research report. |
| (2) | The decrease of occupancy from YE 2017 to YE 2018 is attributable to five tenants totalling 28,803 square feet vacating the Poplar Run Property. A total of 35,097 square feet of new leases in 2019 were signed, bringing occupancy to its current level. |
| (3) | Information obtained from the borrower. |
| (4) | Information obtained from the underwritten rent roll. |
COVID-19 Update. As of November 9, 2021 the Poplar Run Property is open and operating. The first debt service payment is due in January 2022. Rent collections for tenants at the Poplar Run Property for the months of September and October were 100.0%.
Market Overview and Competition. The Poplar Run Property is located in Alexandria, Virginia, within the Fairfax County and is approximately 10 miles from Washington D.C.’s central business district. With more than 119.0 million square feet of space, the Fairfax office market is the 2nd largest suburban office market in the nation and the largest in the metro D.C area. The Poplar Run Property’s neighborhood is located immediately south of the Springfield interchange, which serves Interstate 495, Interstate 95 and Interstate 395. The Poplar Run Property is also located approximately 9.1 miles southwest of the new Amazon HQ2 site and 10.1 miles southwest of the Ronald Regan International Airport. The Poplar Run Property is approximately 3.0 miles west of former Landmark Mall, which permanently closed in 2017 and will soon become a 4.0 million square foot re-development mixed-use center which will include medical office buildings, for-rent and for-sale multifamily apartments, retail space, commercial space, entertainment offerings and outdoor parks. Additionally, the development will include a transit hub anchoring the city’s proposed bus rapid network, Dash, and Metrobus. According to a third party report, the estimated 2021 population within a one-, three- and five-mile radius of the Poplar Run Property was approximately 11,403, 167,270 and 448,763, respectively; and the estimated 2021 average household income within the same radii was approximately $132,592, $121,578, and $130,256, respectively.
Submarket Information - According to a third party report, the Poplar Run Property is located in the Springfield/Burke submarket within the Washington D.C. office market. As of the current quarter, the Springfield/Burke submarket reported a total inventory of approximately 7.7 million square feet, with a 17.4% vacancy rate and average asking rents of $29.44 per square foot.
Appraiser’s Competitive Set – The appraiser identified seven primary competitive properties for the Poplar Run Property totaling approximately 653,488 square feet.
THE INFORMATION IN THIS STRUCTURAL AND COLLATERAL TERM SHEET IS NOT COMPLETE AND MAY BE AMENDED PRIOR TO THE TIME OF SALE. THIS TERM SHEET IS NOT AN OFFER TO SELL THESE SECURITIES AND IT IS NOT A SOLICITATION OF AN OFFER TO BUY THESE SECURITIES IN ANY JURISDICTION WHERE THE OFFER OR SALE IS NOT PERMITTED.
157
| Office – Suburban | Loan #13 | Cut-off Date Balance: | $17,955,688 | |
| 5285 Shawnee Road | Poplar Run | Cut-off Date LTV: | 70.0% | |
| Alexandria, VA 22312 | U/W NCF DSCR: | 1.90x | ||
| U/W NOI Debt Yield: | 11.4% |
The following table presents certain information relating to the appraisal’s market rent conclusion for the Poplar Run Property:
Market Rent Summary(1)
| Office | Storage | Deli/Cafe | |
| Market Rent (PSF) | $25.00 | $17.00 | $9.00 |
| Lease Term (Years) | 60 | 60 | 60 |
| Lease Type (Reimbursements) | FS | Net | FS |
| Tenant Improvements (New/Renew (PSF) | $30/$15 | $0/$0 | $0/$0 |
| Free Rent (Months) | 5 | 0 | 0 |
| (1) | Information obtained from the appraisal. |
The table below presents certain information relating to comparable sales pertaining to the Poplar Run Property identified by the appraiser:
Comparable Sales(1)
| Property Name | Location | Year Built/Renovated | Occupancy | Rentable Area (SF) | Sale Date | Sale Price | Sale Price (PSF) |
| Annandale Financial Center | Annandale, VA | 1989/2000 | 87.0% | 64,427 | Mar-2021 | $9,500,000 | $147.45 |
| Pendar Business Park | Fairfax, VA | 2000/NAP | 86.0% | 171,061 | Oct-2020 | $25,100,000 | $146.73 |
| One Jefferson Park | Falls Church, VA | 1973/2018 | 92.0% | 282,542 | Mar-2020 | $52,000,000 | $184.04 |
| Lakeview East & West | Ashburn, VA | 2009/NAP | 95.0% | 204,129 | Jan-2020 | $46,500,000 | $227.80 |
| Tysons Office Center | Vienna, VA | 1981/NAP | 89.0% | 141,991 | Jun-2019 | $30,250,000 | $213.04 |
| (1) | Information obtained from the appraisal. |
THE INFORMATION IN THIS STRUCTURAL AND COLLATERAL TERM SHEET IS NOT COMPLETE AND MAY BE AMENDED PRIOR TO THE TIME OF SALE. THIS TERM SHEET IS NOT AN OFFER TO SELL THESE SECURITIES AND IT IS NOT A SOLICITATION OF AN OFFER TO BUY THESE SECURITIES IN ANY JURISDICTION WHERE THE OFFER OR SALE IS NOT PERMITTED.
158
| Office – Suburban | Loan #13 | Cut-off Date Balance: | $17,955,688 | |
| 5285 Shawnee Road | Poplar Run | Cut-off Date LTV: | 70.0% | |
| Alexandria, VA 22312 | U/W NCF DSCR: | 1.90x | ||
| U/W NOI Debt Yield: | 11.4% |
The following table presents certain information relating to comparable office leases related to the Poplar Run Property:
Comparable Office Leases(1)
| Property Name/Location | Year Built | Total GLA (SF) | Tenant | Tenant Size (SF) | Lease Start Date | Lease Term | Annual Base Rent PSF | Lease Type |
Poplar Run (subject) Alexandria, VA | 1989 | 148,881(2) | ||||||
Heritage I 7617 Little River Turnpike Annandale, VA | 1970 | 82,000 | Carient Heart & Vascular PC | 1,742 | Jul-2021 | 6.5 Yrs. | $28.50 | FS |
Annandale Office Center 6715 Little River Turnpike Annandale, VA | 1986 | 52,000 | National Latina Institute for Reproductive Justice | 2,691 | Jun-2021 | 3.0 Yrs. | $23.50 | FS |
Annandale Financial Center 7010 Little River Turnpike Annandale, VA | 1988 | 64,000 | SAF Cleaning Services LLC | 2,714 | Apr-2021 | 6.0 Yrs. | $23.00 | FS |
Springfield Executive Center 5501 Backlick Road Springfield, VA | 1985 | 83,000 | Seneca Real Estate, Inc. | 4,272 | Apr-2021 | 6.0 Yrs. | $24.00 | FS |
5500 Cherokee Avenue Alexandria, VA | 1986 | 57,304 | Geologics Corporation | 4,564 | Jan-2021 | 1.0 Yrs. | $24.50 | FS |
6800 Versar Center Springfield, VA | 1987 | 115,183 | Hillman Consulting | 4,401 | Dec-2020 | 3.0 Yrs. | $22.00 | FS |
Heritage Center 4 7619 Little River Turnpike Annandale, VA | 2003 | 200,000 | Professional Healthcare Resources Inc. | 10,018 | May-2020 | 4.0 Yrs. | $27.50 | FS |
| (1) | Information obtained from the appraisal. |
| (2) | Information obtained from the underwritten rent roll. |
THE INFORMATION IN THIS STRUCTURAL AND COLLATERAL TERM SHEET IS NOT COMPLETE AND MAY BE AMENDED PRIOR TO THE TIME OF SALE. THIS TERM SHEET IS NOT AN OFFER TO SELL THESE SECURITIES AND IT IS NOT A SOLICITATION OF AN OFFER TO BUY THESE SECURITIES IN ANY JURISDICTION WHERE THE OFFER OR SALE IS NOT PERMITTED.
159
| Office – Suburban | Loan #13 | Cut-off Date Balance: | $17,955,688 | |
| 5285 Shawnee Road | Poplar Run | Cut-off Date LTV: | 70.0% | |
| Alexandria, VA 22312 | U/W NCF DSCR: | 1.90x | ||
| U/W NOI Debt Yield: | 11.4% |
Operating History and Underwritten Net Cash Flow. The following table presents certain information relating to the historical operating performance and underwritten net cash flow at the Poplar Run Property:
Cash Flow Analysis
2018 | 2019 | 2020 | TTM | U/W | %(1) | U/W $ per SF | |
| Gross Potential Rent | $2,384,319 | $2,440,451 | $2,992,295 | $2,880,212 | $3,731,428 | 98.9% | $25.06 |
| Other Income | 20,419 | 20,990 | 22,218 | 25,350 | 25,350 | 0.7 | 0.17 |
| Total Recoveries | 9,266 | 25,394 | 69,096 | 101,403 | 17,513 | 0.5 | 0.12 |
| Net Rental Income | $2,414,005 | $2,486,836 | $3,083,608 | $3,006,965 | $3,774,291 | 100.0% | $25.35 |
| (Vacancy & Credit Loss) | 0 | 0 | 0 | 0 | (558,787) | (15.0)(3) | (3.75) |
| Effective Gross Income | $2,414,005 | $2,486,836 | $3,083,608 | $3,006,965 | $3,215,504 | 85.2% | $21.60 |
Real Estate Taxes | 314,892 | 290,862 | 298,454 | 285,275 | 278,686 | 8.7 | 1.87 |
| Insurance | 21,893 | 22,527 | 30,513 | 33,312 | 33,417 | 1.0 | 0.22 |
| Management Fee | 72,420 | 74,608 | 92,508 | 90,209 | 96,465 | 3.0 | 0.65 |
| Other Operating Expenses | 784,819 | 784,196 | 749,202 | 771,715 | 760,061 | 23.6 | 5.11 |
| Total Operating Expenses | $1,194,023 | $1,172,193 | $1,170,678 | $1,180,512 | $1,168,629 | 36.3% | $7.85 |
| Net Operating Income | $1,219,981 | $1,314,643 | $1,912,931 | $1,826,453 | $2,046,875 | 63.7% | $13.75 |
| Replacement Reserves | 0 | 0 | 0 | 0 | 37,220 | 1.2 | 0.25 |
| TI/LC | 0 | 0 | 0 | 0 | 200,989 | 6.3 | 1.35 |
| Net Cash Flow | $1,219,981 | $1,314,643 | $1,912,931 | $1,826,453 | $1,808,666 | 56.2% | $12.15 |
| NOI DSCR | 1.28x | 1.38x | 2.00x | 1.91x | 2.14x | ||
| NCF DSCR | 1.28x | 1.38x | 2.00x | 1.91x | 1.90x | ||
| NOI Debt Yield | 6.8% | 7.3% | 10.7% | 10.2% | 11.4% | ||
| NCF Debt Yield | 6.8% | 7.3% | 10.7% | 10.2% | 10.1% |
| (1) | Represents (i) percent of Net Rental Income for all revenue fields, (ii) percent of Base Rent for Vacancy & Credit Loss and (iii) percent of Effective Gross Income for all other fields. |
| (2) | Underwritten Gross Potential Rent includes rent steps of $82,130 through October 2022 and vacant space underwritten at market rent. |
| (3) | The underwritten economic vacancy is 14.9%. The Poplar Run Property was 83.4% leased as of September 23, 2021. |
THE INFORMATION IN THIS STRUCTURAL AND COLLATERAL TERM SHEET IS NOT COMPLETE AND MAY BE AMENDED PRIOR TO THE TIME OF SALE. THIS TERM SHEET IS NOT AN OFFER TO SELL THESE SECURITIES AND IT IS NOT A SOLICITATION OF AN OFFER TO BUY THESE SECURITIES IN ANY JURISDICTION WHERE THE OFFER OR SALE IS NOT PERMITTED.
160
(THIS PAGE INTENTIONALLY LEFT BLANK)
THE INFORMATION IN THIS STRUCTURAL AND COLLATERAL TERM SHEET IS NOT COMPLETE AND MAY BE AMENDED PRIOR TO THE TIME OF SALE. THIS TERM SHEET IS NOT AN OFFER TO SELL THESE SECURITIES AND IT IS NOT A SOLICITATION OF AN OFFER TO BUY THESE SECURITIES IN ANY JURISDICTION WHERE THE OFFER OR SALE IS NOT PERMITTED.
161
| No. 14 – Tech Ridge Office Park | |||||||
| Mortgage Loan Information | Mortgaged Property Information | ||||||
| Mortgage Loan Seller: | BSPRT | Single Asset/Portfolio: | Single Asset | ||||
Credit Assessment (Fitch/KBRA/Moody’s): | NR/NR/NR | Property Type – Subtype: | Office – Suburban | ||||
| Original Principal Balance: | $17,350,000 | Location: | Tulsa, OK | ||||
| Cut-off Date Balance: | $17,324,688 | Size: | 550,684 SF | ||||
| % of Initial Pool Balance: | 2.3% | Cut-off Date Balance Per SF: | $31.46 | ||||
| Loan Purpose: | Refinance | Maturity Date Balance Per SF: | $25.03 | ||||
| Borrower Sponsor: | Kamyar Mateen | Year Built/Renovated: | 1975/NAP | ||||
| Guarantor: | Kamyar Mateen | Title Vesting: | Fee | ||||
| Mortgage Rate: | 3.9300% | Property Manager: | Tech Ridge Properties GP, LLC (an affiliate of the borrower) | ||||
| Note Date: | November 5, 2021 | Current Occupancy (As of): | 71.4% (9/30/2021) | ||||
| Seasoning: | 1 month | YE 2020 Occupancy: | 65.4% | ||||
| Maturity Date: | November 6, 2031 | YE 2019 Occupancy: | 69.4% | ||||
| IO Period: | 0 months | YE 2018 Occupancy: | 69.5% | ||||
| Loan Term (Original): | 120 months | YE 2017 Occupancy: | 73.0% | ||||
| Amortization Term (Original): | 360 months | As-Is Appraised Value(1)(2): | $27,380,000 | ||||
| Loan Amortization Type: | Amortizing Balloon | As-Is Appraised Value Per SF(1)(2): | $49.72 | ||||
| Call Protection: | L(25),D(91),O(4) | As-Is Appraisal Valuation Date(1): | October 8, 2021 | ||||
| Lockbox Type: | Hard/Springing Cash Management | ||||||
| Additional Debt: | None | Underwriting and Financial Information(2) | |||||
| Additional Debt Type (Balance): | NAP | TTM NOI (8/31/2021): | $1,992,369 | ||||
| YE 2020 NOI: | $1,950,816 | ||||||
| YE 2019 NOI: | $2,403,045 | ||||||
| YE 2018 NOI: | $2,285,414 | ||||||
| U/W Revenues: | $4,732,637 | ||||||
| U/W Expenses: | $2,737,960 | ||||||
| Escrows and Reserves | U/W NOI: | $1,994,676 | |||||
| Initial | Monthly | Cap | U/W NCF: | $1,609,197 | |||
| Taxes | $256,543 | $28,505 | NAP | U/W DSCR based on NOI/NCF: | 2.02x / 1.63x | ||
| Insurance | $113,126 | $18,854 | NAP | U/W Debt Yield based on NOI/NCF: | 11.5% / 9.3% | ||
| Replacement Reserve | $0 | $11,561 | NAP | U/W Debt Yield at Maturity based on NOI/NCF: | 14.5% / 11.7% | ||
| TI/LC Reserve | $850,000 | $20,651 | $1,250,000 | Cut-off Date LTV Ratio(1): | 63.3% | ||
| Free Rent Reserve | $58,772 | $0 | NAP | LTV Ratio at Maturity(1): | 50.3% | ||
| Deferred Maintenance | $43,830 | $0 | NAP | ||||
| Sources and Uses | ||||||||
| Sources | Uses | |||||||
| Loan Amount | $17,350,000 | 100.0% | Loan Payoff(3) | $15,638,675 | 90.1% | |||
| Reserves | 1,322,270 | 7.6 | ||||||
| Closing Costs | 385,515 | 2.2 | ||||||
| Return of Equity | 3,540 | 0.0 | ||||||
| Total Sources | $17,350,000 | 100.0% | Total Uses | $17,350,000 | 100.0% | |||
| (1) | The As-Is Appraised Value includes land value of $1,380,000 for a parcel that is a parking lot. The Tech Ridge Office Park Mortgage Loan (as defined below) does not permit any release. |
| (2) | While the Tech Ridge Office Park Mortgage Loan (as defined below) was originated after the emergence of the novel coronavirus pandemic and the economic disruption resulting from measures to combat the pandemic, the pandemic is an evolving situation and could impact the Tech Ridge Office Park Mortgage Loan more severely than assumed in the underwriting and could adversely affect the NOI, NCF and occupancy information, as well as the appraised value and the DSCR, LTV and Debt Yield metrics presented above. See “Risk Factors— Risks Related to Market Conditions and Other External Factors—Coronavirus Pandemic Has Adversely Affected the Global Economy and Will Likely Adversely Affect the Performance of the Mortgage Loans” in the Preliminary Prospectus. |
| (3) | Loan Payoff includes $74,584 of interest, $500 of payoff processing fee and $831,111 of reserve balance credit. The Tech Ridge Office Park Mortgage Loan was previously securitized in the JPMCC 2016-JP4 Mortgage Trust. |
The Mortgage Loan. The mortgage loan (the “Tech Ridge Office Park Mortgage Loan”) is evidenced by a single promissory note secured by a first mortgage encumbering the fee interest in a suburban office business park totaling 550,684 square feet located in Tulsa, Oklahoma (the “Tech Ridge Office Park Property”).
THE INFORMATION IN THIS STRUCTURAL AND COLLATERAL TERM SHEET IS NOT COMPLETE AND MAY BE AMENDED PRIOR TO THE TIME OF SALE. THIS TERM SHEET IS NOT AN OFFER TO SELL THESE SECURITIES AND IT IS NOT A SOLICITATION OF AN OFFER TO BUY THESE SECURITIES IN ANY JURISDICTION WHERE THE OFFER OR SALE IS NOT PERMITTED.
162
| Office – Suburban | Loan #14 | Cut-off Date Balance: | $17,324,688 | |
| 9726 East 42nd Street | Tech Ridge Office Park | Cut-off Date LTV: | 63.3% | |
| Tulsa, OK 74146 | U/W NCF DSCR: | 1.63x | ||
| U/W NOI Debt Yield: | 11.5% |
The Property. The Tech Ridge Office Park Property is a 13-building, multi-tenant, Class B suburban office space consisting of 550,684 rentable square feet situated on 39.6 acres of land. The buildings range in size from 6,009 square feet to 61,595 square feet. Two of the buildings are four-story buildings, one is one-story and the remaining ten buildings are two-story. The Tech Ridge Office Park features on-site FedEx and UPS drop boxes, evening and weekend security patrol and a new 4,000 square foot gym plus locker rooms. Since 2018, the sponsor has invested approximately $1.1 million in the Tech Ridge Office Park through general capital expenditures. The Tech Ridge Office Park Property includes 2,608 surface parking spaces for a ratio of 4.74 spaces per 1,000 square feet. As of September 30, 2021, the Tech Ridge Office Park Property was 71.4% leased to 111 tenants, with the largest tenant making up 14.6% of the net rentable area and 19.3% of underwritten base rent.
Major Tenants. Largest Tenant: Community Strategies (80,402 square feet; 14.6% of NRA; 19.3% of U/W base rent; 11/30/2026 lease expiration)- Community Strategies is the governing school board to Epic Charter Schools, Oklahoma’s largest public and virtual school system. Community Strategies has been a tenant at the Tech Ridge Office Park Property since 2013 and has progressively expanded over the years. Community Strategies expanded to 18,807 square feet of additional space at the Tech Ridge Office Property Park Property in September. At origination, $58,772 was reserved for Free Rent in connection to Community Strategies with monthly disbursements of $19,591 from December 6, 2021 to February 6, 2022. Community Strategies currently occupies 13 suites in the Tech Ridge Office Park Property on a lease expiring on November 30,2026 with no renewal remaining or termination options.
Second Largest Tenant: Dove Charter Public School Foundation (52,313 square feet; 9.5% of NRA; 7.3% of U/W base rent; 7/31/2026 lease expiration)- Dove Charter Public School Foundation provides and maintains educational facilities for four Dove charter schools in the Tulsa and Oklahoma City areas. Dove Charter Public School Foundation has been a tenant at the Tech Ridge Office Park Property since 2019 under a lease that commenced on August 1, 2019 and expires on July 31, 2026, with one, five-year renewal option remaining and no termination options.
Third Largest Tenant: Audubon Field Solutions, LLC (18,839 square feet; 3.4% of NRA; 5.2% of U/W base rent; 11/30/2022 lease expiration)- Audubon is a provider of engineering, technical, and management services, utilizing innovative and sustainable solutions with a focus on the energy industry. Audubon currently has 12 locations worldwide. Audubon has been a tenant at the Tech Ridge Office Park Property since 2014 under a lease that commenced on May 1, 2014 and expires on November 30, 2022, with one, five-year or three-year renewal option remaining and no termination options.
The following table presents certain information relating to the tenancy at the Tech Ridge Office Park Property:
Major Tenant
| Tenant Name | Credit Rating (Fitch/Moody’s/ S&P) | Tenant NRSF | % of NRSF | Annual U/W Base Rent PSF(2) | Annual U/W Base Rent(2) | % of Total Annual U/W Base Rent | Lease Expiration Date | Extension Options | Termination Option (Y/N) |
| Major Tenants | |||||||||
| Community Strategies | NR/NR/NR | 80,402 | 14.6% | $11.04 | $887,481 | 19.3% | 11/30/2026 | None | N |
| Dove Charter Public School Foundation | NR/NR/NR | 52,313 | 9.5% | $6.43 | $336,180 | 7.3% | 7/31/2026 | 1-5yr | N |
| Audubon Field Solutions, LLC | NR/NR/NR | 18,839 | 3.4% | $12.67 | $238,690 | 5.2% | 11/30/2022 | 1-3yr or 1-5yr | N |
| Fox Rent A Car | NR/NR/NR | 17,164 | 3.1% | $12.75 | $218,841 | 4.8% | 9/30/2023 | None | N |
| Advanced Pain Management Center of Oklahoma, LLC | NR/NR/NR | 15,559 | 2.8% | $13.00 | $202,267 | 4.4% | 2/28/2026 | 1-5yr | Y(2) |
| Total Major Tenants | 184,277 | 33.5% | $10.22 | $1,883,459 | 41.0% | ||||
Non-Major Tenant
| 208,675
| 37.9%
| $13.00
| $2,712,042
| 59.0%
| ||||
| Occupied Collateral | 392,952 | 71.4% | $11.69 | $4,595,501 | 100.0% | ||||
| Vacant | 157,732 | 28.6% | |||||||
| Collateral Total | 550,684 | 100.0% | |||||||
| (1) | The Annual U/W Base Rent PSF and Annual U/W Base Rent shown above include rent steps through June 2022 totaling $147,340. |
| (2) | Advanced Pain Management Center of Oklahoma, LLC has a one-time termination option effective February 28, 2023 upon six month’ notice and paying a termination fee equal to unamortized leasing commission and unamortized tenant improvement costs, plus an additional four months’ rent. |
THE INFORMATION IN THIS STRUCTURAL AND COLLATERAL TERM SHEET IS NOT COMPLETE AND MAY BE AMENDED PRIOR TO THE TIME OF SALE. THIS TERM SHEET IS NOT AN OFFER TO SELL THESE SECURITIES AND IT IS NOT A SOLICITATION OF AN OFFER TO BUY THESE SECURITIES IN ANY JURISDICTION WHERE THE OFFER OR SALE IS NOT PERMITTED.
163
| Office – Suburban | Loan #14 | Cut-off Date Balance: | $17,324,688 | |
| 9726 East 42nd Street | Tech Ridge Office Park | Cut-off Date LTV: | 63.3% | |
| Tulsa, OK 74146 | U/W NCF DSCR: | 1.63x | ||
| U/W NOI Debt Yield: | 11.5% |
The following table presents certain information relating to the lease rollover schedule at the Tech Ridge Office Park Property:
Lease Expiration Schedule(1)(2)
| Year Ending December 31, | No. of Leases Expiring | Expiring NRSF | % of Total NRSF | Cumulative Expiring NRSF | Cumulative % of Total NRSF | Annual U/W Base Rent | % of Total Annual U/W Base Rent | Annual U/W Base Rent PSF |
| MTM | 1 | 354 | 0.1% | 354 | 0.10% | $1,200 | 0.0% | $3.39 |
| 2021 | 7 | 4,656 | 0.8% | 5,010 | 0.90% | $57,912 | 1.3% | $12.44 |
| 2022 | 41 | 83,569 | 15.2% | 88,579 | 16.1% | $1,139,780 | 24.8% | $13.64 |
| 2023 | 23 | 57,469 | 10.4% | 146,048 | 26.5% | $751,747 | 16.4% | $13.08 |
| 2024 | 20 | 45,323 | 8.2% | 191,371 | 34.8% | $658,403 | 14.3% | $14.53 |
| 2025 | 7 | 23,867 | 4.3% | 215,238 | 39.1% | $289,024 | 6.3% | $12.11 |
| 2026 | 7 | 156,677 | 28.5% | 371,915 | 67.5% | $1,531,591 | 33.3% | $9.78 |
| 2027 | 3 | 5,277 | 1.0% | 377,192 | 68.5% | $72,323 | 1.6% | $13.71 |
| 2028 | 0 | 0 | 0.0% | 377,192 | 68.5% | $0 | 0.0% | $0.00 |
| 2029 | 1 | 5,517 | 1.0% | 382,709 | 69.5% | $67,859 | 1.5% | $12.30 |
| 2030 | 1 | 2,053 | 0.4% | 384,762 | 69.9% | $25,662 | 0.6% | $12.50 |
| 2031 | 0 | 0 | 0.0% | 384,762 | 69.9% | $0 | 0.0% | $0.00 |
| Thereafter(4) | 4 | 8,190 | 1.5% | 392,952 | 71.4% | $0 | 0.0% | $0.00 |
| Vacant | 0 | 157,732 | 28.6% | 550,684 | 100.0% | $0 | 0.0% | $0.00 |
| Total/Weighted Average | 115 | 550,684 | 100.0% | $4,595,501 | 100.0% | $11.69(3)(4) |
| (1) | Information obtained from the underwritten rent roll. |
| (2) | Certain tenants may have lease termination options that are exercisable prior to the originally stated expiration date of the subject lease that are not considered in the Lease Expiration Schedule. |
| (3) | Total/Weighted Average Annual U/W Base Rent PSF excludes vacant space. |
| (4) | Includes a 3,602 square foot non-revenue space attributable to the management office and a 4,588 square foot non-revenue space attributable to the fitness center. |
The following table presents historical occupancy percentages at the Tech Ridge Office Park Property:
Historical Occupancy
12/31/2017(1) | 12/31/2018(2) | 12/31/2019(2) | 12/31/2020(2) | 9/30/2021(3) |
| 73.0% | 69.5% | 69.4% | 65.4% | 71.4% |
| (1) | Information obtained from a third party market research report. |
| (2) | Information obtained from the borrower. |
| (3) | Information obtained from the underwritten rent roll. |
COVID-19 Update. As of November 9, 2021 the Tech Ridge Office Park Property is open and operating. The first debt service payment is due in December 2021. Rent collections for tenants at the Tech Ridge Property for the months of September and October were 95.0%.
Market Overview and Competition. The Tech Ridge Office Park Property is located within the Tulsa, OK Metropolitan Statistical Area (the “Tulsa MSA” and is approximately 8.3 miles from Downtown Tulsa. Primary access to the area is provided by Interstate 44 and Highway 64 located 8.2 miles and 9.2 miles from the Tech Ridge Office Park Property, respectively. The commercial uses along East 41st street east and west of the Tech Ridge Office Park Property is varied and includes fast foods, banks, free standing and strip retail, and office. To the south of the Tech Ridge Office Park Property are primarily industrial type properties and to the north are primarily single family residential. The Tulsa MSA had an unemployment rate of 2.9% as of August 2021. Major employers in the Tulsa MSA include American Airlines, AAON, AEPPublic Service Co, Alorica Inc. and AT&T. According to the appraisal, the estimated 2021 population within a one-, three- and five-mile radius of the Tech Ridge Office Park Property was approximately 9,410, 92,435 and 223,414, respectively; and the estimated 2021 average household income within the same radii was approximately $49,195, $64,193, and $77,359, respectively.
Submarket Information - According to the appraisal report, the Tech Ridge Office Park Property is located in the Midtown submarket within the Tulsa office market. As of the third quarter 2021, the Midtown office submarket reported a total inventory of approximately 6.7 million square feet, with a 11.7% vacancy rate and average asking rents of $15.98 per square foot.
Appraiser’s Competitive Set – The appraiser identified eight primary competitive properties for the Tech Ridge Office Park Property totaling approximately 1.4 million square feet, which reported an average occupancy rate of 84.5%.
THE INFORMATION IN THIS STRUCTURAL AND COLLATERAL TERM SHEET IS NOT COMPLETE AND MAY BE AMENDED PRIOR TO THE TIME OF SALE. THIS TERM SHEET IS NOT AN OFFER TO SELL THESE SECURITIES AND IT IS NOT A SOLICITATION OF AN OFFER TO BUY THESE SECURITIES IN ANY JURISDICTION WHERE THE OFFER OR SALE IS NOT PERMITTED.
164
| Office – Suburban | Loan #14 | Cut-off Date Balance: | $17,324,688 | |
| 9726 East 42nd Street | Tech Ridge Office Park | Cut-off Date LTV: | 63.3% | |
| Tulsa, OK 74146 | U/W NCF DSCR: | 1.63x | ||
| U/W NOI Debt Yield: | 11.5% |
The following table presents certain information relating to the appraisal’s market rent conclusion for the Tech Ridge Office Park Property:
Market Rent Summary(1)
| 0-1,000 SF Office Space | 1,000-2,500 SF Office Space | 2,500-5,000 SF Office Space | Large Office Space | Executive Suite Space | |
| Market Rent (PSF) | $13.00 | $13.00 | $12.50 | $12.50 | $18.00 |
| Lease Term (Years) | 60 | 60 | 60 | 84 | 36 |
| Lease Type (Reimbursements) | FS | FS | FS | FS | FS |
| Tenant Improvements (New/Renew (PSF) | $3/$0.50 | $3/$0.50 | $3/$0.50 | $5/$1 | $0/$0.50 |
| Free Rent (Months) | 0 | 0 | 0 | 0 | 0 |
| (1) | Information obtained from the appraisal. |
The table below presents certain information relating to comparable sales pertaining to the Tech Ridge Office Park Property identified by the appraiser:
Comparable Sales(1)
| Property Name | Location | Year Built/Renovated | Occupancy | Rentable Area (SF) | Sale Date | Sale Price | Sale Price (PSF) |
| Executive Center II | Tulsa, OK | 1984/2018 | 82.0% | 112,000 | Aug-2021 | $9,100,000 | $81.25 |
| LXP-AT&T | Oklahoma City, OK | 1998/NAP | 100.0% | 128,500 | Dec-2020 | $18,574,998 | $144.55 |
| Tollway Tower | Dallas, TX | 1984/2017 | 87.0% | 321,578 | Dec-2020 | $50,000,000 | $155.48 |
| Union Plaza Office Building | Oklahoma City, OK | 1980/NAP | 80.0% | 250,628 | Oct-2019 | $21,850,000 | $87.18 |
| Doctors Building | Little Rock, AR | 1962/1974 | 95.0% | 173,000 | Sep-2019 | $16,500,000 | $95.38 |
| (1) | Information obtained from the appraisal. |
THE INFORMATION IN THIS STRUCTURAL AND COLLATERAL TERM SHEET IS NOT COMPLETE AND MAY BE AMENDED PRIOR TO THE TIME OF SALE. THIS TERM SHEET IS NOT AN OFFER TO SELL THESE SECURITIES AND IT IS NOT A SOLICITATION OF AN OFFER TO BUY THESE SECURITIES IN ANY JURISDICTION WHERE THE OFFER OR SALE IS NOT PERMITTED.
165
| Office – Suburban | Loan #14 | Cut-off Date Balance: | $17,324,688 | |
| 9726 East 42nd Street | Tech Ridge Office Park | Cut-off Date LTV: | 63.3% | |
| Tulsa, OK 74146 | U/W NCF DSCR: | 1.63x | ||
| U/W NOI Debt Yield: | 11.5% |
The following table presents certain information relating to comparable office leases related to Tech Ridge Office Park:
Comparable Office Leases(1)
| Property Name/Location | Year Built/ Renovated | Total GLA (SF) | Occupancy | Tenant | Tenant Size (SF) | Lease Start Date | Lease Term | Annual Base Rent PSF | Lease Type |
| Tech Ridge Office Park (subject) Tulsa, OK | 1975/NAP | 550,684(2) | 71.4%(2) | ||||||
| Office Campus 12222 State Farm Tulsa, OK | 1989/2010 | 289,909 | 100.0% | NAV | 35,000 | Jul-2021 | 7.3 Yrs. | $15.00 | FS |
| Corporate Woods 4500 South 129th Avenue Tulsa, OK | 1980/2018 | 522,438 | 95.8% | NAV NAV | 17,822 18,977 | Mar-2021 Jul-2021 | 1.0 Yrs. 3.0 Yrs. | $14.00 $16.00 | FS FS |
| Towne Centre Office Park 10810 East 45th street Tulsa, OK | 1980/NAP | 87,616 | 83.0% | BlackHawk Industrial NAV Flynt & Kallenberger Consulting | 18,481 12,397 1,800 | May-2021 Jul-2021 Jul-2016 | 5.0 Yrs. 3.0 Yrs. 5.3 Yrs. | $13.50 $13.50 $13.50 | FS FS FS |
| Eastgate Metroplex 14002 East 21st street Tulsa, OK | 1986/2008 | 86,000 | 78.0% | CxLoyalty | 30,000 | Jan-2018 | 7.0 Yrs. | $14.75 | NNN |
| Exchange Center 4606 South Garnett Road Tulsa, OK | 1979/NAP | 145,081 | 43.0% | FEMA | 10,218 | Jun-2019 | 12.0 Yrs. | $16.00 | FS |
| Commerce Tower 5801 41st Street Tulsa, OK | 1980/NAP | 108,076 | 75.0% | John F Bufogle R& Consulting Services Inc Force Personnel | 744 1,199 644 | Jun-2020 Apr-2020 Oct-2019 | 5.0 Yrs. 2.0 Yrs. 3.0 Yrs. | $13.00 $12.00 $15.30 | FS FS FS |
| Shadow Mountain Office Center 5840 South Memorial Drive Tulsa, OK | 1974/NAP | 66,500 | 65.7% | NAV NAV NAV | 452 1,496 903 | Nov-2021 May-2021 Mar-2021 | 3.0 Yrs. 3.0 Yrs. 3.0 Yrs. | $11.50 $10.50 $10.50 | FS FS FS |
| Fox Plaza 5416 South Yale Avenue Tulsa, OK | 1970/NAP | 88,334 | 67.2% | NAV | 1,223 | Jun-2021 | 3.0 Yrs. | $12.50 | FSG |
| (1) | Information obtained from the appraisal. |
| (2) | Information obtained from the underwritten rent roll. |
THE INFORMATION IN THIS STRUCTURAL AND COLLATERAL TERM SHEET IS NOT COMPLETE AND MAY BE AMENDED PRIOR TO THE TIME OF SALE. THIS TERM SHEET IS NOT AN OFFER TO SELL THESE SECURITIES AND IT IS NOT A SOLICITATION OF AN OFFER TO BUY THESE SECURITIES IN ANY JURISDICTION WHERE THE OFFER OR SALE IS NOT PERMITTED.
166
| Office – Suburban | Loan #14 | Cut-off Date Balance: | $17,324,688 | |
| 9726 East 42nd Street | Tech Ridge Office Park | Cut-off Date LTV: | 63.3% | |
| Tulsa, OK 74146 | U/W NCF DSCR: | 1.63x | ||
| U/W NOI Debt Yield: | 11.5% |
Operating History and Underwritten Net Cash Flow. The following table presents certain information relating to the historical operating performance and underwritten net cash flow at the Tech Ridge Office Park Property:
Cash Flow Analysis
2018
| 2019
| 2020
| TTM 8/31/2021 | U/W | %(1) | U/W $ per SF | |||||||||
| Base Rent | $4,810,464 | $4,945,901 | $4,557,677 | $4,594,347 | $6,571,191 | 98.0% | $11.93 | ||||||||
| Bad Debt | (12,201) | (7,201) | (12,820) | (12,820) | 0 | 0.0 | 0.00 | ||||||||
| Gross Potential Rent | $4,798,262 | $4,938,699 | $4,544,857 | $4,581,527 | $6,571,191(2) | 98.0% | $11.93 | ||||||||
| Other Income | 169,620 | 160,921 | 68,519 | 88,771 | 88,771 | 1.3 | 0.16 | ||||||||
| Total Recoveries | 63,445 | 142,091 | 4,976 | 19,076 | 48,364 | 0.7 | 0.09 | ||||||||
| Net Rental Income | $5,031,327 | $5,241,712 | $4,618,353 | $4,689,374 | $6,708,327 | 100.0% | $12.18 | ||||||||
| (Vacancy & Credit Loss) | 0 | 0 | 0 | 0 | (1,975,690) | (30.1)(3) | (3.59) | ||||||||
| Effective Gross Income | $5,031,327 | $5,241,712 | $4,618,353 | $4,689,374 | $4,732,637 | 70.5% | $8.59 | ||||||||
| Real Estate Taxes | 334,829
| 342,085
| 330,137
| 321,369
| 332,094
| 7.0 | 0.60 | ||||||||
| Insurance | 103,937 | 135,064 | 171,740 | 186,546 | 215,478 | 4.6 | 0.39 | ||||||||
| Management Fee | 150,940 | 157,251 | 138,551 | 140,681 | 141,979 | 3.0 | 0.26 | ||||||||
| Other Operating Expenses | 2,156,208 | 2,204,266 | 2,027,109 | 2,048,409 | 2,048,409 | 43.3 | 3.72 | ||||||||
| Total Operating Expenses | $2,745,913 | $2,838,667 | $2,667,536 | $2,697,005 | $2,737,960 | 57.9% | $4.97 | ||||||||
| Net Operating Income | $2,285,414 | $2,403,045 | $1,950,816 | $1,992,369 | $1,994,676 | 42.1% | $3.62 | ||||||||
| Replacement Reserves | 0 | 0 | 0 | 0 | 137,671 | 2.9 | 0.25 | ||||||||
| TI/LC | 13,867 | 0 | 0 | 0 | 247,808 | 5.2 | 0.45 | ||||||||
| Net Cash Flow | $2,271,547 | $2,403,045 | $1,950,816 | $1,992,369 | $1,609,197 | 34.0% | $2.92 | ||||||||
| NOI DSCR | 2.32x | 2.44x | 1.98x | 2.02x | 2.02x | ||||||||||
| NCF DSCR | 2.30x | 2.44x | 1.98x | 2.02x | 1.63x | ||||||||||
| NOI Debt Yield | 13.2% | 13.9% | 11.3% | 11.5% | 11.5% | ||||||||||
| NCF Debt Yield | 13.1% | 13.9% | 11.3% | 11.5% | 9.3% |
|
| (1) | Represents (i) percent of Net Rental Income for all revenue fields, (ii) percent of Base Rent for Vacancy & Credit Loss and (iii) percent of Effective Gross Income for all other fields. |
| (2) | Underwritten Gross Potential Rent includes rent steps of $147,340 through June 2022 and vacant space underwritten at market rent. |
| (3) | The underwritten economic vacancy is 29.8%. The Tech Ridge Office Park Property was 71.4% leased as of September 30, 2021. |
THE INFORMATION IN THIS STRUCTURAL AND COLLATERAL TERM SHEET IS NOT COMPLETE AND MAY BE AMENDED PRIOR TO THE TIME OF SALE. THIS TERM SHEET IS NOT AN OFFER TO SELL THESE SECURITIES AND IT IS NOT A SOLICITATION OF AN OFFER TO BUY THESE SECURITIES IN ANY JURISDICTION WHERE THE OFFER OR SALE IS NOT PERMITTED.
167
| No. 15 – StorQuest Thousand Oaks | |||||||
| Mortgage Loan Information | Mortgaged Property Information(3) | ||||||
| Mortgage Loan Seller: | Wells Fargo Bank, National Association | Single Asset/Portfolio: | Single Asset | ||||
Credit Assessment (Fitch/KBRA/Moody’s): | NR/NR/NR | Property Type – Subtype: | Self Storage – Self Storage | ||||
| Original Principal Balance: | $14,000,000 | Location: | Thousand Oaks, CA | ||||
| Cut-off Date Balance: | $14,000,000 | Size: | 56,504 SF | ||||
| % of Initial Pool Balance: | 1.8% | Cut-off Date Balance Per SF: | $247.77 | ||||
| Loan Purpose: | Refinance | Maturity Date Balance Per SF: | $247.77 | ||||
| Borrower Sponsor: | Clark W. Porter, Timothy B. Hobin, William W. Hobin | Year Built/Renovated: | 2010/NAP | ||||
| Guarantors: | Clark W. Porter, Timothy B. Hobin, William W. Hobin | Title Vesting: | Fee | ||||
| Mortgage Rate: | 3.253% | Property Manager: | William Warren Properties, Inc. | ||||
| Note Date: | November 1, 2021 | Current Occupancy (As of): | 93.4% (9/30/2021) | ||||
| Seasoning: | 1 month | YE 2020 Occupancy: | 93.4% | ||||
| Maturity Date: | November 11, 2031 | YE 2019 Occupancy: | 93.5% | ||||
| IO Period: | 120 months | YE 2018 Occupancy: | 90.9% | ||||
| Loan Term (Original): | 120 months | YE 2017 Occupancy: | NAP | ||||
| Amortization Term (Original): | 0 months | Appraised Value: | $22,570,000 | ||||
| Loan Amortization Type: | Interest Only | Appraised Value Per SF: | $399.44 | ||||
| Call Protection: | L(25), YM1(91), O(4) | Appraisal Valuation Date: | September 28, 2021 | ||||
| Lockbox Type: | Springing/Springing Cash Management | ||||||
| Additional Debt: | NAP | Underwriting and Financial Information(3) | |||||
| Additional Debt Type (Balance): | NAP | TTM NOI (9/30/2021): | $1,174,834 | ||||
| YE 2020 NOI: | $1,026,015 | ||||||
| YE 2019 NOI: | $996,590 | ||||||
| YE 2018 NOI: | NAP | ||||||
| U/W Revenues: | $1,685,324 | ||||||
| U/W Expenses: | $415,084 | ||||||
| Escrows and Reserves | U/W NOI: | $1,270,240 | |||||
| Initial | Monthly | Cap | U/W NCF: | $1,259,504 | |||
| Taxes(1) | $0 | Springing | NAP | U/W DSCR based on NOI/NCF: | 2.75x / 2.73x | ||
| Insurance(2) | $0 | Springing | NAP | U/W Debt Yield based on NOI/NCF: | 9.1% / 9.0% | ||
| Replacement Reserve | $0 | $895 | $32,207 | U/W Debt Yield at Maturity based on NOI/NCF: | 9.1% / 9.0% | ||
| Cut-off Date LTV Ratio: | 62.0% | ||||||
| LTV Ratio at Maturity: | 62.0% | ||||||
| Sources and Uses | ||||||||
| Sources | Uses | |||||||
| Loan Amount | $14,000,000 | 100.0% | Loan Payoff | $9,107,740 | 65.1% | |||
| Closing Costs | 227,380 | 1.6 | ||||||
| Return of Equity | 4,664,880 | 33.3 | ||||||
| Total Sources | $14,000,000 | 100.0% | Total Uses | $14,000,000 | 100.0% | |||
| (1) | Ongoing monthly tax reserve deposits in an amount equal to one-twelfth of the estimated taxes payable are not required as long as (a) no event of default is continuing and (b) the borrower pays all applicable taxes prior to interest or penalties being incurred. |
| (2) | Ongoing monthly insurance reserve deposits in an amount equal to one-twelfth of the insurance premiums that the lender estimates will be payable for the renewal of the required coverages will not be required as long as (a) no event of default is continuing (b) the maintained by the borrower is under one or more blanket policies reasonably acceptable to the lender, and (c) the lender has received evidence of the renewal of such policies no later than 10 business days prior to the expiration of the policies. |
| (3) | The novel coronavirus pandemic is an evolving situation and could impact the StorQuest Thousand Oaks Mortgage Loan more severely than assumed in the underwriting of the StorQuest Thousand Oaks Mortgage Loan and could adversely affect the NOI, NCF and occupancy information, as well as the appraised value and the DSCR, LTV and Debt Yield metrics presented above and herein. See "Risk Factors—Risks Related to Market Conditions and Other External Factors—The Coronavirus Pandemic Has Adversely Affected the Global Economy and Will Likely Adversely Affect the Performance of the Mortgage Loans" in the Preliminary Prospectus. |
THE INFORMATION IN THIS STRUCTURAL AND COLLATERAL TERM SHEET IS NOT COMPLETE AND MAY BE AMENDED PRIOR TO THE TIME OF SALE. THIS TERM SHEET IS NOT AN OFFER TO SELL THESE SECURITIES AND IT IS NOT A SOLICITATION OF AN OFFER TO BUY THESE SECURITIES IN ANY JURISDICTION WHERE THE OFFER OR SALE IS NOT PERMITTED.
168
| Self Storage – Self Storage | Loan #15 | Cut-off Date Balance: | $14,000,000 | |
| 100 North Skyline Drive | StorQuest Thousand Oaks | Cut-off Date LTV: | 62.0% | |
| Thousand Oaks, CA 91362 | U/W NCF DSCR: | 2.73x | ||
| U/W NOI Debt Yield: | 9.1% |
The Mortgage Loan. The 15th largest mortgage loan (the “StorQuest Thousand Oaks Mortgage Loan”) is secured by a first priority fee mortgage encumbering a self storage facility totaling 56,504 square feet located in Thousand Oaks, California (the “StorQuest Thousand Oaks Property”).
The Property. The StorQuest Thousand Oaks Property is a single-building, self-storage property consisting of 56,504 rentable square feet totaling 613 self storage units and two RV Sites. The StorQuest Thosand Oaks Property is four stories over a basement level and consists of interior and exterior units, with non-climate controlled units on floors 1-4 and climate controlled units on the basement level. Situated on 0.9 acres of land, The property includes 17 parking spaces in front of the leasing office and has two passenger elevators, keypad entry, and 24-hour video surveillance. The property was built in 2010 and was 93.4% leased as of 9/30/2021.
The following table presents historical occupancy percentages at the StorQuest Thousand Oaks Property:
Historical Occupancy
12/31/2018 | 12/31/2019 | 12/31/2020 | 9/30/2021(1) |
| 90.9% | 93.5% | 93.4% | 93.4% |
| (1) | Information obtained from the underwritten rent roll. |
COVID-19 Update. As of November 13, 2021 the StorQuest Thousand Oaks Property is open and operating. The first debt service payment is due in December 2021.
Market Overview and Competition. The StorQuest Property is located in the Westlake Village neighborhood of Thousand Oaks, CA, approximately 39.8 miles to the northwest of Los Angeles. The immediate area consists of primarily office, retail and industrial uses interspersed with multi-family complexes and single family residential. The StorQuest Thousand Oaks Property is located approximately 0.5 miles from U.S. Route 101 and 2.0 miles from State Route 23, the main highways serving the area. According to a third party market research provider, the estimated 2020 population within a one-, three- and five-mile radius of the StorQuest Thousand Oaks Property was approximately 6,738, 57,455, and 146,882, respectively; and the estimated 2020 average household income within the same radii was approximately $113,080, $141,276, and $153,980, respectively.
According to the appraisal, the primary market area for the StorQuest Thousand Oaks Property is within a three-mile radius. The appraiser identified eight competitive facilities within the market area totaling 3,998 units with vacancy ranging from 2.0% to 7.1%, with an average vacancy rate of 5.2%.
The following table presents certain information relating some comparable self storage properties for the StorQuest Thousand Oaks
Competitive Set(1)
StorQuest (Subject) | Extra Space Storage | SoCal Self Storage | Public Storage | SoCal Self Storage | StorQuest Westlake Village | Public Storage | |
| Location | Thousand Oaks, CA | Thousand Oaks, CA | Thousand Oaks, CA | Westlake Village, CA | Westlake Village, CA | Westlake Village, CA | Westlake Village, CA |
| Distance to Subject | -- | 0.2 miles | 0.5 miles | 0.7 miles | 0.9 miles | 2.4 miles | 3.0 miles |
| Property Type | Self Storage | Self Storage | Self Storage | Self Storage | Self Storage | Self Storage | Self Storage |
| Year Built/Renovated | 2010/NAP | 1997/NAP | 1988/NAP | 1978/NAP | 1996/NAP | 1987/NAP | 2005/NAP |
| Total Units | 615(2) | 487 | 518 | 931 | 622 | 640 | 800 |
| % of Climate Controlled Units | 21.2(2) | 0% | 0% | 100.0% | 0% | NAP(3) | 100.0% |
| Total SF | 56,504 SF(2) | 49,305 SF | 51,370 SF | 93,130 SF | 60,443 SF | 42,010 SF | 91,623 SF |
| Occupancy | 93.4%(2) | 94.0% | 93.0% | NAP | 93.0% | 96.0% | 98.0% |
| (1) | Information obtained from the appraisal. |
| (2) | Information obtained from the underwritten rent roll as of September 31, 2021. Total units includes 2 RV sites. |
| (3) | The appraisal notes that this property contains a mix of climate controlled and non-climate controlled units, but the percentage is unknown. |
THE INFORMATION IN THIS STRUCTURAL AND COLLATERAL TERM SHEET IS NOT COMPLETE AND MAY BE AMENDED PRIOR TO THE TIME OF SALE. THIS TERM SHEET IS NOT AN OFFER TO SELL THESE SECURITIES AND IT IS NOT A SOLICITATION OF AN OFFER TO BUY THESE SECURITIES IN ANY JURISDICTION WHERE THE OFFER OR SALE IS NOT PERMITTED.
169
| Self Storage – Self Storage | Loan #15 | Cut-off Date Balance: | $14,000,000 | |
| 100 North Skyline Drive | StorQuest Thousand Oaks | Cut-off Date LTV: | 62.0% | |
| Thousand Oaks, CA 91362 | U/W NCF DSCR: | 2.73x | ||
| U/W NOI Debt Yield: | 9.1% |
The table below presents certain information relating to comparable sales pertaining to the StorQuest Thousand Property identified by the appraiser:
Comparable Sales(1)
| Property Name | Location | Year Built/Renovated | Occupancy | Rentable Area (SF) | Sale Date | Sale Price | Sale Price (PSF) |
| StorQuest Thousand Oaks (Subject) | Thousand Oaks, CA | 2010/NAP | 93.4%(2) | 56,504 | NAP | NAP | NAP |
| Morena Storage 908 Sherman Street | San Diego, CA | 1980/NAP | 90.0% | 95,489 | Jul-2020 | $34,000,000 | $356 |
| ExtraSpace 2391 Fenton Street | Chula Vista, CA | 1992/NAP | 90.0% | 68,471 | March-2020 | $27,500,000 | $402 |
| Monterey Self Storage 302 Ramona Avenue | Monterey, CA | 1997/NAP | 97.0% | 25,222 | Feb-2020 | $8,000,000 | $317 |
| Lockaway Storage 220 West Ahwanee Avenue | Sunnyvale, CA | 1987/NAP | 85.0% | 44,782 | Feb-2021 | $18,000,000 | $402 |
| The Storage Place 6835 & 6836 Canby Avenue | Reseda, CA | 1974/NAP | 90.4% | 46,026 | Jun-2021 | $15,700,000 | $341 |
| (1) | Information obtained from the appraisal. |
| (2) | Information obtained from underwritten rent roll. |
Operating History and Underwritten Net Cash Flow. The following table presents certain information relating to the historical operating performance and underwritten net cash flow at the StorQuest Thousand Oaks Property:
Cash Flow Analysis
2019
| 2020
| TTM | U/W | %(1) | U/W $ PSF | ||||||||
| Base Rent | $1,321,495 | $1,380,591 | $1,539,580 | $1,766,161 | 97.7% | $31.26 | |||||||
| Grossed Up Vacant Space | 0 | 0 | 0 | 0 | 0.0% | 0.00 | |||||||
| Gross Potential Rent | $1,321,495 | $1,380,591 | $1,539,580 | $1,766,161 | 97.7% | $31.26 | |||||||
| Other Income | 48,982 | 43,624 | 40,592 | 40,992 | 2.3% | 0.73 | |||||||
| Net Rental Income | $1,370,477 | $1,424,215 | $1,580,172 | $1,807,153 | 100.0% | $31.98 | |||||||
| (Vacancy & Credit Loss) | 0 | 0 | 0 | (121,829)(2) | (6.9%)(2) | (2.16) | |||||||
| Effective Gross Income | $1,370,477 | $1,424,215 | $1,580,172 | $1,685,324 | 93.3% | $29.83 | |||||||
| Real Estate Taxes | 82,032 | 83,601 | 85,092 | 147,371 | 8.7% | $2.61 | |||||||
| Insurance | 6,385 | 7,992 | 8,647 | 8,658 | 0.5% | 0.15 | |||||||
| Management Fee | 82,248 | 85,493 | 94,826 | 50,560 | 3.0% | 0.89 | |||||||
| Other Operating Expenses | 203,222 | 221,114 | 216,773 | 208,495 | 12.4% | 3.69 | |||||||
| Total Operating Expenses | $373,887 | $398,200 | $405,338 | $415,084 | 24.6% | $7.35 | |||||||
| Net Operating Income | $996,590 | $1,026,015 | $1,174,834 | $1,270,240 | 75.4% | $22.48 | |||||||
| Replacement Reserves | 0 | 0 | 0 | 10,736 | 0.6% | 0.19 | |||||||
| TI/LC | 0 | 0 | 0 | 0 | 0.0% | 0.00 | |||||||
| Net Cash Flow | $996,590 | $1,026,015 | $1,174,834 | $1,259,504 | 74.7% | $22.29 | |||||||
| NOI DSCR | 2.16x | 2.22x | 2.54x | 2.75x | |||||||||
| NCF DSCR | 2.16x | 2.22x | 2.54x | 2.73x | |||||||||
| NOI Debt Yield | 7.1% | 7.3% | 8.4% | 9.1% | |||||||||
| NCF Debt Yield | 7.1% | 7.3% | 8.4% | 9.0% |
| (1) | Represents (i) percent of Net Rental Income for all revenue fields, (ii) percent of Base Rent for Vacancy & Credit Loss and (iii) percent of Effective Gross Income for all other fields. |
| (2) | The underwritten economic vacancy is 6.9%. The StorQuest Thousand Oaks Property was 93.4% leased as of September 30, 2021. |
THE INFORMATION IN THIS STRUCTURAL AND COLLATERAL TERM SHEET IS NOT COMPLETE AND MAY BE AMENDED PRIOR TO THE TIME OF SALE. THIS TERM SHEET IS NOT AN OFFER TO SELL THESE SECURITIES AND IT IS NOT A SOLICITATION OF AN OFFER TO BUY THESE SECURITIES IN ANY JURISDICTION WHERE THE OFFER OR SALE IS NOT PERMITTED.
170
| Wells Fargo Commercial Mortgage Trust 2021-C61 | Transaction Contact Information |
VII. Transaction Contact Information
Questions regarding this Structural and Collateral Term Sheet may be directed to any of the following individuals:
| Wells Fargo Securities, LLC | |
| Brigid Mattingly | Tel. (312) 269-3062 |
| A.J. Sfarra | Tel. (212) 214-5613 |
| Sean Duffy | Tel. (312) 837-1518 |
| Credit Suisse Securities (USA) LLC | |
| Brendan Jordan | Tel. (212) 325-1924 |
| Julia Powell | Tel. (212) 325-3294 |
| Nicholas Italia | Tel. (212) 325-5729 |
| UBS Securities LLC | |
| Nicholas Galeone | Tel. (212) 713-8832 |
| Siho Ham | Tel. (212) 713-1278 |
THE INFORMATION IN THIS STRUCTURAL AND COLLATERAL TERM SHEET IS NOT COMPLETE AND MAY BE AMENDED PRIOR TO THE TIME OF SALE. THIS TERM SHEET IS NOT AN OFFER TO SELL THESE SECURITIES AND IT IS NOT A SOLICITATION OF AN OFFER TO BUY THESE SECURITIES IN ANY JURISDICTION WHERE THE OFFER OR SALE IS NOT PERMITTED.
171