| | | FREE WRITING PROSPECTUS |
| | | FILED PURSUANT TO RULE 433 |
| | | REGISTRATION FILE NO.: 333-257991-10 |
Free Writing Prospectus
Structural and Collateral Term Sheet
$1,081,999,009
(Approximate Initial Pool Balance)
$981,373,000
(Approximate Aggregate Certificate Balance of Offered Certificates)
BANK 2024-BNK47
Wells Fargo Commercial Mortgage Securities, Inc.
as Depositor
Wells Fargo Bank, National Association
Bank of America, National Association
Goldman Sachs Mortgage Company
Morgan Stanley Mortgage Capital Holdings LLC
Citi Real Estate Funding Inc.
JPMorgan Chase Bank, National Association
National Cooperative Bank, N.A.
as Sponsors and Mortgage Loan Sellers
Commercial Mortgage Pass-Through Certificates
Series 2024-BNK47
June 5, 2024
WELLS FARGO
SECURITIES | BofA
SECURITIES | CITIGROUP | GOLDMAN
SACHS & CO.
LLC | J.P MORGAN | MORGAN
STANLEY |
Co-Lead
Manager and Joint
Bookrunner | Co-Lead
Manager and Joint
Bookrunner | Co-Lead
Manager and
Joint
Bookrunner | Co-Lead
Manager and
Joint
Bookrunner | Co-Lead
Manager and Joint
Bookrunner | Co-Lead
Manager and Joint
Bookrunner |
Academy Securities, Inc. Co-Manager | Drexel Hamilton Co-Manager | Siebert Williams Shank Co-Manager |
| THE INFORMATION IN THIS STRUCTURAL AND COLLATERAL TERM SHEET IS NOT COMPLETE AND MAY BE AMENDED PRIOR TO THE TIME OF SALE. THIS TERM SHEET IS NOT AN OFFER TO SELL THESE SECURITIES AND IT IS NOT A SOLICITATION OF AN OFFER TO BUY THESE SECURITIES IN ANY JURISDICTION WHERE THE OFFER OR SALE IS NOT PERMITTED. |
| | | |
STATEMENT REGARDING THIS FREE WRITING PROSPECTUS
The depositor has filed a registration statement (including a prospectus) with the Securities and Exchange Commission (“SEC”) (SEC File No. 333-257991) for the offering to which this communication relates. Before you invest, you should read the prospectus in the registration statement and other documents the depositor has filed with the SEC for more complete information about the depositor, the issuing entity and this offering. You may get these documents for free by visiting EDGAR on the SEC Web site at www.sec.gov. Alternatively, the depositor, any underwriter, or any dealer participating in the offering will arrange to send you the prospectus after filing if you request it by calling toll free 1-800-745-2063 (8 a.m. – 5 p.m. EST) or by emailing wfs.cmbs@wellsfargo.com.
Nothing in this document constitutes an offer of securities for sale in any jurisdiction where the offer or sale is not permitted. The information contained herein is preliminary as of the date hereof, supersedes any such information previously delivered to you and will be superseded by any such information subsequently delivered and ultimately by the final prospectus relating to the securities. These materials are subject to change, completion, supplement or amendment from time to time.
This free writing prospectus has been prepared by the underwriters for information purposes only and does not constitute, in whole or in part, a prospectus for the purposes of (i) Regulation (EU) 2017/1129 (as amended), (ii) such Regulation as it forms part of UK domestic law, or (iii) Part VI of the UK Financial Services and Markets Act 2000, as amended; and does not constitute an offering document for any other purpose.
STATEMENT REGARDING ASSUMPTIONS AS TO SECURITIES, PRICING ESTIMATES AND OTHER INFORMATION
The attached information contains certain tables and other statistical analyses (the “Computational Materials”) which have been prepared in reliance upon information furnished by the Mortgage Loan Sellers. Numerous assumptions were used in preparing the Computational Materials, which may or may not be reflected herein. As such, no assurance can be given as to the Computational Materials’ accuracy, appropriateness or completeness in any particular context; or as to whether the Computational Materials and/or the assumptions upon which they are based reflect present market conditions or future market performance. The Computational Materials should not be construed as either projections or predictions or as legal, tax, financial or accounting advice. You should consult your own counsel, accountant and other advisors as to the legal, tax, business, financial and related aspects of a purchase of these securities. Any weighted average lives, yields and principal payment periods shown in the Computational Materials are based on prepayment and/or loss assumptions, and changes in such prepayment and/or loss assumptions may dramatically affect such weighted average lives, yields and principal payment periods. In addition, it is possible that prepayments or losses on the underlying assets will occur at rates higher or lower than the rates shown in the attached Computational Materials. The specific characteristics of the securities may differ from those shown in the Computational Materials due to differences between the final underlying assets and the preliminary underlying assets used in preparing the Computational Materials. The principal amount and designation of any security described in the Computational Materials are subject to change prior to issuance. None of Wells Fargo Securities, LLC, BofA Securities, Inc., Citigroup Global Markets Inc., Goldman Sachs & Co. LLC, J.P. Morgan Securities LLC, Morgan Stanley & Co. LLC, Academy Securities, Inc., Drexel Hamilton, LLC, Siebert Williams Shank & Co., LLC or any of their respective affiliates, make any representation or warranty as to the actual rate or timing of payments or losses on any of the underlying assets or the payments or yield on the securities. The information in this presentation is based upon management forecasts and reflects prevailing conditions and management’s views as of this date, all of which are subject to change. In preparing this presentation, we have relied upon and assumed, without independent verification, the accuracy and completeness of all information available from public sources or which was provided to us by or on behalf of the Mortgage Loan Sellers or which was otherwise reviewed by us.
This free writing prospectus contains certain forward-looking statements. If and when included in this free writing prospectus, the words “expects”, “intends”, “anticipates”, “estimates” and analogous expressions and all statements that are not historical facts, including statements about our beliefs or expectations, are intended to identify forward-looking statements. Any forward-looking statements are made subject to risks and uncertainties which could cause actual results to differ materially from those stated. Those risks and uncertainties include, among other things, declines in general economic and business conditions, increased competition, changes in demographics, changes in political and social conditions, regulatory initiatives and changes in customer preferences, many of which are beyond our control and the control of any other person or entity related to this offering. The forward-looking statements made in this free writing prospectus are made as of the date stated on the cover. We have no obligation to update or revise any forward-looking statement.
Wells Fargo Securities is the trade name for the capital markets and investment banking services of Wells Fargo & Company and its subsidiaries, including but not limited to Wells Fargo Securities, LLC, a member of NYSE, FINRA, NFA and SIPC, Wells Fargo Prime Services, LLC, a member of FINRA, NFA and SIPC, and Wells Fargo Bank, N.A. Wells Fargo Securities, LLC and Wells Fargo Prime Services, LLC are distinct entities from affiliated banks and thrifts.
“BofA Securities” is the marketing name for the global banking and global markets businesses of Bank of America Corporation. Lending, derivatives, and other commercial banking activities are performed globally by banking affiliates of Bank of America Corporation, including Bank of America, N.A., member FDIC. Securities, strategic advisory, and other investment banking activities are performed globally by investment banking affiliates of Bank of America Corporation, including, in the United States, BofA Securities, Inc., which is a registered broker-dealer and member of FINRA and SIPC, and, in other jurisdictions, locally registered entities.
J.P. Morgan is the marketing name for the investment banking businesses of JPMorgan Chase & Co. and its subsidiaries worldwide. Securities, syndicated loan arranging, financial advisory and other investment banking activities are performed by JPMS and its securities affiliates, and lending, derivatives and other commercial banking activities are performed by JPMorgan Chase Bank, National Association and its banking affiliates. JPMS is a member of SIPC and the NYSE.
IMPORTANT NOTICE REGARDING THE OFFERED CERTIFICATES
The information herein is preliminary and may be supplemented or amended prior to the time of sale. In addition, the Offered Certificates referred to in these materials and the asset pool backing them are subject to modification or revision (including the possibility that one or more classes of certificates may be split, combined or eliminated at any time prior to issuance or availability of a final prospectus) and are offered on a “when, as and if issued” basis.
The underwriters described in these materials may from time to time perform investment banking services for, or solicit investment banking business from, any company named in these materials. The underwriters and/or their affiliates or respective employees may from time to time have a long or short position in any security or contract discussed in these materials.
The information contained herein supersedes any previous such information delivered to any prospective investor and will be superseded by information delivered to such prospective investor prior to the time of sale.
IMPORTANT NOTICE RELATING TO AUTOMATICALLY-GENERATED EMAIL DISCLAIMERS
Any legends, disclaimers or other notices that may appear at the bottom of any email communication to which this free writing prospectus is attached relating to (1) these materials not constituting an offer (or a solicitation of an offer), (2) any representation that these materials are accurate or complete and may not be updated or (3) these materials possibly being confidential, are not applicable to these materials and should be disregarded. Such legends, disclaimers or other notices have been automatically generated as a result of these materials having been sent via Bloomberg or another system.
| THE INFORMATION IN THIS STRUCTURAL AND COLLATERAL TERM SHEET IS NOT COMPLETE AND MAY BE AMENDED PRIOR TO THE TIME OF SALE. THIS TERM SHEET IS NOT AN OFFER TO SELL THESE SECURITIES AND IT IS NOT A SOLICITATION OF AN OFFER TO BUY THESE SECURITIES IN ANY JURISDICTION WHERE THE OFFER OR SALE IS NOT PERMITTED. |
| | 2 | |
| BANK 2024-BNK47 | Certificate Structure |
| Class | Expected Ratings
(Fitch/KBRA/Moody’s)(1) | Approximate Initial Certificate Balance or Notional Amount(2) | Approx. Initial Credit Support(3) | Pass-Through Rate Description | Weighted Average Life (Years)(4) | Expected Principal Window(4) | Certificate Principal UW NOI Debt Yield(5) | Certificate Principal to Value Ratio(6) |
| | Offered Certificates | | | | |
| A-1 | AAAsf/AAA(sf)/Aaa(sf) | $6,684,000 | | 30.000% | (7) | 2.75 | 07/24-05/29 | | 23.7% | 33.2% |
| A-2 | AAAsf/AAA(sf)/Aaa(sf) | $65,786,000 | | 30.000% | (7) | 4.94 | 05/29-06/29 | | 23.7% | 33.2% |
| A-3 | AAAsf/AAA(sf)/Aaa(sf) | $7,500,000 | | 30.000% | (7) | 6.89 | 05/31-05/31 | | 23.7% | 33.2% |
| A-SB | AAAsf/AAA(sf)/Aaa(sf) | $14,226,000 | | 30.000% | (7) | 7.34 | 06/29-10/33 | | 23.7% | 33.2% |
| A-4 | AAAsf/AAA(sf)/Aaa(sf) | (8) | | 30.000% | (7) | (8) | (8) | | 23.7% | 33.2% |
| A-5 | AAAsf/AAA(sf)/Aaa(sf) | (8) | | 30.000% | (7) | (8) | (8) | | 23.7% | 33.2% |
| X-A | AAAsf/AAA(sf)/Aaa(sf) | $757,399,000(9) | | N/A | Variable IO(10) | N/A | N/A | | N/A | N/A |
| X-B | Asf/AAA(sf)/Aa2(sf) | (11)(13) | | N/A | Variable IO(12) | N/A | N/A | | N/A | N/A |
| A-S | AAAsf/AAA(sf)/Aaa(sf) | $154,185,000 | | 15.750% | (7) | 9.97 | 05/34-06/34 | | 19.7% | 39.9% |
| B | AA-sf/AA-(sf)/Aa3(sf) | $48,690,000 | | 11.250% | (7) | 9.97 | 06/34-06/34 | | 18.7% | 42.1% |
| C | Asf/A(sf)/A2(sf) | (13) | | (13) | (7) | 9.97 | 06/34-06/34 | | 18.3% | 42.9% |
| | Risk Retention Certificates | | | | |
| D-RR | A-sf/A-(sf)/NR | (13) | | 8.250% | (7) | 9.97 | 06/34-06/34 | | 18.1% | 43.5% |
| E-RR | BBBsf/BBB+(sf)/NR | $12,172,000 | | 7.125% | (7) | 9.97 | 06/34-06/34 | | 17.9% | 44.0% |
| F-RR | BBB-sf/BBB-(sf)/NR | $14,878,000 | | 5.750% | (7) | 9.97 | 06/34-06/34 | | 17.6% | 44.7% |
| G-RR | BB-sf/BB-(sf)/NR | $18,935,000 | | 4.000% | (7) | 9.97 | 06/34-06/34 | | 17.3% | 45.5% |
| J-RR | B-sf/B-(sf)/NR | $10,820,000 | | 3.000% | (7) | 9.97 | 06/34-06/34 | | 17.1% | 46.0% |
| K-RR | NR/NR/NR | $32,460,008 | | 0.000% | (7) | 9.97 | 06/34-06/34 | | 16.6% | 47.4% |
| (1) | The expected ratings presented are those of Fitch Ratings, Inc. (“Fitch”), Kroll Bond Rating Agency, LLC (“KBRA”) and Moody’s Investors Service Inc. (“Moody’s”), which the depositor hired to rate the Offered Certificates. One or more other nationally recognized statistical rating organizations that were not hired by the depositor may use information they receive pursuant to Rule 17g-5 under the Securities Exchange Act of 1934, as amended (the “Exchange Act”) or otherwise, to rate or provide market reports and/or published commentary related to the Offered Certificates. We cannot assure you as to what ratings a non-hired nationally recognized statistical rating organization would assign or that its reports will not express differing, possibly negative, views of the mortgage loans and/or the Offered Certificates. The ratings of each Class of Offered Certificates address the likelihood of the timely distribution of interest and, except in the case of the Class X-A and X-B Certificates, the ultimate distribution of principal due on those Classes on or before the Rated Final Distribution Date. See “Risk Factors—Other Risks Relating to the Certificates—Nationally Recognized Statistical Rating Organizations May Assign Different Ratings to the Certificates; Ratings of the Certificates Reflect Only the Views of the Applicable Rating Agencies as of the Dates Such Ratings Were Issued; Ratings May Affect ERISA Eligibility; Ratings May Be Downgraded” and “Ratings” in the Preliminary Prospectus, expected to be dated June 5, 2024 (the “Preliminary Prospectus”). Fitch, KBRA and Moody’s have informed us that the “sf” designation in their ratings represents an identifier for structured finance product ratings. |
| (2) | The Certificate Balances and Notional Amounts set forth in the table are approximate. The actual initial Certificate Balances and Notional Amounts may be larger or smaller depending on the initial pool balance of the mortgage loans definitively included in the pool of mortgage loans, which aggregate cut-off date balance may be as much as 5% larger or smaller than the amount presented in the Preliminary Prospectus. In addition, the Notional Amounts of the Class X-A and X-B Certificates (collectively referred to herein as “Class X Certificates”) may vary depending upon the final pricing of the Classes of Principal Balance Certificates (as defined below) whose Certificate Balances comprise such Notional Amounts and, if as a result of such pricing the pass-through rate of any Class of the Class X Certificates would be equal to zero at all times, such Class of Certificates will not be issued on the closing date of this securitization. |
| (3) | The Approximate Initial Credit Support with respect to the Class A-1, A-2, A-3, A-SB, A-4 and A-5 Certificates represents the approximate credit enhancement for the Class A-1, A-2, A-3, A-SB, A-4 and A-5 Certificates in the aggregate. |
(4) (5) | Weighted Average Lives and Expected Principal Windows are calculated based on an assumed prepayment rate of 0% CPR and the “Structuring Assumptions” described under “Yield and Maturity Considerations—Weighted Average Life” in the Preliminary Prospectus. The Certificate Principal U/W NOI Debt Yield for each Class of Certificates (other than the Class A-1, A-2, A-3, A-SB, A-4 and A-5 Certificates) is calculated as the product of (a) the weighted average U/W NOI Debt Yield for the mortgage loans and (b) a fraction, the numerator of which is the total initial Certificate Balance of all of the Classes of Principal Balance Certificates and the denominator of which is the total initial Certificate Balance for such Class of Certificates and all Classes of Principal Balance Certificates senior to such Class of Certificates. The Certificate Principal U/W NOI Debt Yield for each of the Class A-1, A-2, A-3, A-SB, A-4 and A-5 Certificates is calculated in the aggregate for those Classes as if they were a single Class and is calculated as the product of (a) the weighted average U/W NOI Debt Yield for the mortgage loans and (b) a fraction, the numerator of which is the total initial Certificate Balance of all of the Classes of Principal Balance Certificates and the denominator of which is the total aggregate initial Certificate Balances for the Class A-1, A-2, A-3, A-SB, A-4 and A-5 Certificates. In any event, however, cash flow from each mortgaged property supports only the related mortgage loan and will not be available to support any other mortgage loan. |
| (6) | The Certificate Principal to Value Ratio for each Class of Certificates (other than the Class A-1, A-2, A-3, A-SB, A-4 and A-5 Certificates) is calculated as the product of (a) the weighted average Cut-off Date LTV Ratio for the mortgage loans and (b) a fraction, the numerator of which is the total initial Certificate Balance of such Class of Certificates and all Classes of Principal Balance Certificates senior to such Class of Certificates and the denominator of which is the total initial Certificate Balance of all of the Principal Balance Certificates. The Certificate Principal to Value Ratio for each of the Class A-1, A-2, A-3, A-SB, A-4 and A-5 Certificates is calculated in the aggregate for those Classes as if they were a single Class and is calculated as the product of (a) the weighted average Cut-off Date LTV Ratio for the mortgage loans and (b) a fraction, the numerator of which is the total initial aggregate Certificate Balances of such Classes of Certificates and the denominator of which is the total initial Certificate Balance of all of the Principal Balance Certificates. In any event, however, excess mortgaged property value associated with a mortgage loan will not be available to offset losses on any other mortgage loan. |
| (7) | The pass-through rates for the Class A-1, A-2, A-3, A-SB, A-4, A-5, A-S, B, C, D-RR, E-RR, F-RR, G-RR, J-RR and K-RR Certificates (collectively, the “Principal Balance Certificates”) for any distribution date will, in each case, be one of the following: (i) a fixed rate per annum, (ii) a variable rate per annum equal to the weighted average of the net mortgage interest rates on the mortgage loans for the related distribution date, (iii) a variable rate per annum equal to the lesser of (a) a fixed rate and (b) the weighted average of the net mortgage interest rates on the mortgage loans for the related distribution date or (iv) a variable rate per annum equal to the weighted average of the net mortgage interest rates on the mortgage loans for the related distribution date minus a specified percentage. For purposes of the calculation of the weighted average of the net mortgage interest rates on the mortgage loans for each distribution date, the mortgage interest rates will be adjusted as necessary to a 30/360 basis. |
| THE INFORMATION IN THIS STRUCTURAL AND COLLATERAL TERM SHEET IS NOT COMPLETE AND MAY BE AMENDED PRIOR TO THE TIME OF SALE. THIS TERM SHEET IS NOT AN OFFER TO SELL THESE SECURITIES AND IT IS NOT A SOLICITATION OF AN OFFER TO BUY THESE SECURITIES IN ANY JURISDICTION WHERE THE OFFER OR SALE IS NOT PERMITTED. |
| | 3 | |
| BANK 2024-BNK47 | Certificate Structure |
| (8) | The exact initial Certificate Balances of the Class A-4 and A-5 Certificates are unknown and will be determined based on the final pricing of those Classes of Certificates. However, the initial Certificate Balances, weighted average lives and principal windows of the Class A-4 and A-5 Certificates are expected to be within the applicable ranges reflected in the following chart. The aggregate initial Certificate Balance of the Class A-4 and A-5 Certificates is expected to be approximately $663,203,000, subject to a variance of plus or minus 5%. In the event that the Class A-5 Certificates is issued with the maximum certificate balance (i.e., with an initial certificate balance of $663,203,000), the Class A-4 Certificates will not be issued. |
Class of Certificates | Expected Range of Approximate Initial Certificate Balance | Expected Range of Weighted Average Life (Years) | Expected Range of Principal Window |
| Class A-4 | $0 - $300,000,000 | N/A – 9.49 | N/A / 10/33-02/34 |
| Class A-5 | $363,203,000 - $663,203,000 | 9.66 – 9.81 | 02/34-05/34 / 10/33-05/34 |
| (9) | The Class X-A Certificates are notional amount certificates. The Notional Amount of the Class X-A Certificates will be equal to the aggregate Certificate Balance of the Class A-1, A-2, A-3, A-SB, A-4 and A-5 Certificates outstanding from time to time. The Class X-A Certificates will not be entitled to distributions of principal. |
| (10) | The pass-through rate for the Class X-A Certificates for any distribution date will be a per annum rate equal to the excess, if any, of (a) the weighted average of the net mortgage interest rates on the mortgage loans for the related distribution date, over (b) the weighted average of the pass-through rates on the Class A-1, A-2, A-3, A-SB, A-4 and A-5 Certificates for the related distribution date, weighted on the basis of their respective Certificate Balances outstanding immediately prior to that distribution date. For purposes of the calculation of the weighted average of the net mortgage interest rates on the mortgage loans for each distribution date, the mortgage interest rates will be adjusted as necessary to a 30/360 basis. |
| (11) | The Class X-B Certificates are notional amount certificates. The Notional Amount of the Class X-B Certificates will be equal to the aggregate Certificate Balance of the Class A-S, B and C Certificates outstanding from time to time. The Class X-B Certificates will not be entitled to distributions of principal. |
| (12) | The pass-through rate for the Class X-B Certificates for any distribution date will be a per annum rate equal to the excess, if any, of (a) the weighted average of the net mortgage interest rates on the mortgage loans for the related distribution date, over (b) the weighted average of the pass-through rates on the Class A-S, B and C Certificates for the related distribution date, weighted on the basis of their respective Certificate Balances outstanding immediately prior to that distribution date. For purposes of the calculation of the weighted average of the net mortgage interest rates on the mortgage loans for each distribution date, the mortgage interest rates will be adjusted as necessary to a 30/360 basis. |
| (13) | The initial Certificate Balance of each of the Class C and Class D-RR Certificates are estimated based in part on the estimated ranges of Certificate Balances and estimated fair values described in “Credit Risk Retention” in the Preliminary Prospectus. The initial Certificate Balance of the Class C Certificates is expected to fall within a range of $14,607,000 and $21,099,000, and the initial Certificate Balance of the Class D-RR Certificates is expected to fall within a range of $11,361,000 and $17,853,000, with the ultimate initial Certificate Balance of each determined such that the aggregate fair value of the Class D-RR, Class E-RR, Class F-RR, Class G-RR, Class J-RR and Class K-RR certificates will equal at least 5% of the estimated fair value as of the Closing Date of all the Classes of Certificates (other than the Class R Certificates) issued by the issuing entity. Any variation in the initial Certificate Balance of the Class C Certificates would affect the initial notional amount of the Class X-B certificates. Additionally, the Credit Support for the Class C Certificates will range between approximately 9.300% and 9.900%. |
| THE INFORMATION IN THIS STRUCTURAL AND COLLATERAL TERM SHEET IS NOT COMPLETE AND MAY BE AMENDED PRIOR TO THE TIME OF SALE. THIS TERM SHEET IS NOT AN OFFER TO SELL THESE SECURITIES AND IT IS NOT A SOLICITATION OF AN OFFER TO BUY THESE SECURITIES IN ANY JURISDICTION WHERE THE OFFER OR SALE IS NOT PERMITTED. |
| | 4 | |
| BANK 2024-BNK47 | Transaction Highlights |
| II. Transaction | Highlights |
Mortgage Loan Sellers:
Mortgage Loan Seller | Number of
Mortgage Loans | Number of
Mortgaged
Properties | Aggregate Cut-off Date Balance | Approx. % of Initial Pool
Balance |
| Wells Fargo Bank, National Association | 14 | | 32 | | $289,617,948 | | 26.8 | % |
| Bank of America, National Association | 7 | | 16 | | 231,892,357 | | 21.4 | |
| Goldman Sachs Mortgage Company | 4 | | 5 | | 132,272,391 | | 12.2 | |
| Morgan Stanley Mortgage Capital Holdings LLC | 7 | | 8 | | 115,350,000 | | 10.7 | |
| JPMorgan Chase Bank, National Association / Goldman Sachs Mortgage Company | 1 | | 1 | | 100,000,000 | | 9.2 | |
| Citi Real Estate Funding Inc. | 3 | | 3 | | 91,650,000 | | 8.5 | |
| Goldman Sachs Mortgage Company / Morgan Stanley Mortgage Capital Holdings LLC | 1 | | 1 | | 69,500,000 | | 6.4 | |
| National Cooperative Bank, N.A. | 13 | | 13 | | 34,626,314 | | 3.2 | |
| JPMorgan Chase Bank, National Association | 2 | | 2 | | 17,090,000 | | 1.6 | |
Total | 52 | | 81 | | $1,081,999,009 | | 100.0 | % |
Loan Pool:
| Initial Pool Balance: | $1,081,999,009 |
| Number of Mortgage Loans: | 52 |
| Average Cut-off Date Balance per Mortgage Loan: | $20,807,673 |
| Number of Mortgaged Properties: | 81 |
| Average Cut-off Date Balance per Mortgaged Property(1): | $13,358,012 |
| Weighted Average Interest Rate: | 6.6258% |
| Ten Largest Mortgage Loans as % of Initial Pool Balance: | 62.4% |
| Weighted Average Original Term to Maturity (months): | 116 |
| Weighted Average Remaining Term to Maturity (months): | 114 |
| Weighted Average Original Amortization Term (months)(2): | 361 |
| Weighted Average Remaining Amortization Term (months)(2): | 361 |
| Weighted Average Seasoning (months): | 2 |
| (1) | Information regarding mortgage loans secured by multiple properties is based on an allocation according to relative appraised values or the allocated loan amounts or property-specific release prices set forth in the related loan documents or such other allocation as the related mortgage loan seller deemed appropriate. |
| (2) | Excludes any mortgage loan that does not amortize. |
Credit Statistics:
| Weighted Average U/W Net Cash Flow DSCR(1): | 2.31x |
| Weighted Average U/W Net Operating Income Debt Yield(1): | 16.6% |
| Weighted Average Cut-off Date Loan-to-Value Ratio(1): | 47.4% |
| Weighted Average Balloon or ARD Loan-to-Value Ratio(1): | 46.4% |
| % of Mortgage Loans with Additional Subordinate Debt(2): | 9.6% |
| % of Mortgage Loans with Single Tenants(3): | 14.6% |
| (1) | With respect to any mortgage loan that is part of a whole loan, loan-to-value ratio, debt service coverage ratio and debt yield calculations include the related pari passu companion loan(s) but exclude any related subordinate companion loan(s) (unless otherwise stated). For mortgaged properties securing residential cooperative mortgage loans, the debt service coverage ratio and debt yield for each such mortgaged property are calculated using U/W Net Operating Income or U/W Net Cash Flow, as applicable, for the related residential cooperative property which is the projected net operating income or net cash flow, as applicable, reflected in the most recent appraisal obtained by or otherwise in the possession of the related mortgage loan seller as of the cut-off date, and the loan-to-value ratio is calculated based upon the appraised value of the residential cooperative property determined as if such residential cooperative property is operated as a residential cooperative, inclusive of the amount of the underlying debt encumbering such residential cooperative property. The debt service coverage ratio, debt yield and loan-to-value ratio information do not take into account any subordinate debt (whether or not secured by the related mortgaged property), that currently exists or is allowed under the terms of any mortgage loan. See “Description of the Mortgage Pool—Mortgage Pool Characteristics” in the Preliminary Prospectus and Annex A-1 to the Preliminary Prospectus. |
| (2) | Ten (10) of the mortgage loans, each of which is secured by a residential cooperative property sold to the depositor by National Cooperative Bank, N.A., currently have in place either (i) subordinate secured lines of credit to the related mortgage borrowers that permit future advances (such loans, collectively, the “Subordinate Coop LOCs”) or (ii) subordinate wraparound mortgages to the related mortgage borrowers that are currently held by the cooperative sponsors (such loans, collectively, the “Subordinate Wrap Mortgages”). The percentage figure expressed as “% of Mortgage Loans with Additional Subordinate Debt” is determined as a percentage of the initial pool balance and does not take into account any future subordinate debt (whether or not secured by the mortgaged property), if any, that may be permitted under the terms of any mortgage loan or the pooling and servicing agreement. See “Description of the Mortgage Pool—Additional Indebtedness—Other Unsecured Indebtedness” and “Description of the Mortgage Pool—Additional Indebtedness—Other Unsecured Indebtedness—Additional Debt Financing for Mortgage Loans Secured by Residential Cooperatives Sold to the Depositor by National Cooperative Bank, N.A.” in the Preliminary Prospectus. |
| (3) | Excludes mortgage loans that are secured by multiple single tenant properties. |
| THE INFORMATION IN THIS STRUCTURAL AND COLLATERAL TERM SHEET IS NOT COMPLETE AND MAY BE AMENDED PRIOR TO THE TIME OF SALE. THIS TERM SHEET IS NOT AN OFFER TO SELL THESE SECURITIES AND IT IS NOT A SOLICITATION OF AN OFFER TO BUY THESE SECURITIES IN ANY JURISDICTION WHERE THE OFFER OR SALE IS NOT PERMITTED. |
| | 5 | |
| BANK 2024-BNK47 | Transaction Highlights |
Loan Structural Features:
Amortization: Based on the Initial Pool Balance, 31.9% of the mortgage pool (25 mortgage loans) has scheduled amortization, as follows:
22.2% (7 mortgage loans) provides for an interest-only period followed by an amortization period; and
9.7% (18 mortgage loans) requires amortization during the entire loan term.
Interest-Only: Based on the Initial Pool Balance, 68.1% of the mortgage pool (27 mortgage loans) provides for interest-only payments during the entire loan term through maturity or anticipated repayment date. The weighted average Cut-off Date Loan-to-Value Ratio and weighted average U/W Net Cash Flow DSCR for those mortgage loans are 45.3% and 2.36x, respectively.
Hard Lockboxes: Based on the Initial Pool Balance, 80.8% of the mortgage pool (26 mortgage loans) has hard lockboxes in place.
Reserves: The mortgage loans require amounts to be escrowed monthly as follows (excluding any mortgage loans with springing provisions):
| Real Estate Taxes: | 49.1% of the pool |
| Insurance: | 7.0% of the pool |
| Capital Replacements: | 29.9% of the pool |
| TI/LC: | 25.4% of the pool(1) |
| | (1) | The percentage of Initial Pool Balance for mortgage loans with TI/LC reserves is based on the aggregate principal balance allocable to loans that include office, mixed use, retail, industrial, leased fee and data center properties. |
Call Protection/Defeasance: Based on the Initial Pool Balance, the mortgage pool has the following call protection and defeasance features:
69.5% of the mortgage pool (30 mortgage loans) features a lockout period, then defeasance only until an open period;
14.8% of the mortgage pool (3 mortgage loans) features a lockout period, then defeasance or greater of a prepayment premium (1.0%) or yield maintenance until an open period;
11.4% of the mortgage pool (5 mortgage loans) features a lockout period, then greater of a prepayment premium (1.0%) or yield maintenance until an open period;
3.0% of the mortgage pool (12 mortgage loans) features the greater of a prepayment premium (1.0%) or yield maintenance, followed by a prepayment premium (1.0%) until an open period;
1.1% of the mortgage pool (1 mortgage loan) features the greater of a prepayment premium (1.0%) or yield maintenance, then defeasance or greater of a prepayment premium (1.0%) or yield maintenance until an open period; and
0.2% of the mortgage pool (1 mortgage loan) features the greater of a prepayment premium (1.0%) or yield maintenance until an open period.
| THE INFORMATION IN THIS STRUCTURAL AND COLLATERAL TERM SHEET IS NOT COMPLETE AND MAY BE AMENDED PRIOR TO THE TIME OF SALE. THIS TERM SHEET IS NOT AN OFFER TO SELL THESE SECURITIES AND IT IS NOT A SOLICITATION OF AN OFFER TO BUY THESE SECURITIES IN ANY JURISDICTION WHERE THE OFFER OR SALE IS NOT PERMITTED. |
| | 6 | |
| BANK 2024-BNK47 | Issue Characteristics |
| III. | Issue Characteristics |
| Securities Offered: | $981,373,000 approximate monthly pay, multi-class, commercial mortgage REMIC pass-through certificates consisting of eleven classes (Classes A-1, A-2, A-3, A-SB, A-4, A-5, A-S, B, C, X-A and X-B), which are offered pursuant to a registration statement filed with the SEC (such Classes of certificates, the “Offered Certificates”). |
| Mortgage Loan Sellers: | Wells Fargo Bank, National Association (“WFB”), Bank of America, National Association (“BANA”), Goldman Sachs Mortgage Company (“Goldman”), Morgan Stanley Mortgage Capital Holdings LLC (“MSMCH”), Citi Real Estate Funding Inc. (“CREFI”), JPMorgan Chase Bank, National Association (“JPMCB”) and National Cooperative Bank, N.A. (“NCB”) |
| Joint Bookrunners and Co-Lead Managers: | Wells Fargo Securities, LLC, BofA Securities, Inc., Goldman Sachs & Co. LLC, Morgan Stanley & Co. LLC, Citigroup Global Markets Inc. and J.P. Morgan Securities LLC |
| Co-Managers: | Academy Securities, Inc., Drexel Hamilton, LLC and Siebert Williams Shank & Co., LLC |
| Rating Agencies: | Fitch Ratings, Inc., Kroll Bond Rating Agency, LLC and Moody’s Investors Service, Inc. |
| Master Servicers: | Wells Fargo Bank, National Association and National Cooperative Bank, N.A. |
| Special Servicers: | Rialto Capital Advisors, LLC and National Cooperative Bank, N.A. |
| Certificate Administrator: | Computershare Trust Company, N.A. |
| Trustee: | Computershare Trust Company, N.A. |
| Operating Advisor: | Park Bridge Lender Services LLC |
| Asset Representations Reviewer: | Park Bridge Lender Services LLC |
| U.S. Credit Risk Retention: | For a discussion of the manner in which the U.S. credit risk retention requirements are being addressed by Wells Fargo Bank, National Association, as the retaining sponsor, see “Credit Risk Retention” in the Preliminary Prospectus. This transaction is being structured with a “third-party purchaser” that will acquire an “eligible horizontal residual interest”, which will be comprised of the Class D-RR, E-RR, F-RR, G-RR, J-RR and K-RR Certificates (the “horizontal risk retention certificates”). RREF V - D AIV RR H, LLC (in satisfaction of the retention obligations of Wells Fargo Bank, National Association, as the retaining sponsor) will be contractually obligated to retain (or to cause its “majority-owned affiliate” to retain) the horizontal risk retention certificates for a minimum of five years after the closing date, subject to certain permitted exceptions provided for under the risk retention rules. During this time, RREF V - D AIV RR H, LLC will agree to comply with hedging, transfer and financing restrictions that are applicable to third party purchasers under the credit risk retention rules. For additional information, see “Credit Risk Retention” in the Preliminary Prospectus. |
| EU Securitization Regulation and UK Securitization Regulation: | None of the sponsors, the depositor, the underwriters, or their respective affiliates, or any other person intends to retain a material net economic interest in the securitization constituted by the issue of the Certificates, or to take any other action in respect of such securitization, in a manner prescribed or contemplated by (i) Regulation (EU) 2017/2402, or (ii) such Regulation as it forms part of UK domestic law. In particular, no such person undertakes to take any action which may be required by any investor for the purposes of its compliance with any applicable requirement under either such Regulation. Furthermore, the arrangements described under “Credit Risk Retention” in the Preliminary Prospectus have not been structured with the objective of ensuring compliance by any person with any requirements of either such Regulation. See “Risk Factors—Other Risks Relating to the Certificates—EU Securitization Regulation and UK Securitization Regulation” in the Preliminary Prospectus. |
| Initial Controlling Class Certificateholder: | RREF V – D AIV RR H, LLC |
| Cut-off Date: | The Cut-off Date with respect to each mortgage loan is the due date for the monthly debt service payment that is due in June 2024 (or, in the case of any mortgage loan that has its first due date after June 2024, the date that would have been its due date in June 2024 under the terms of that mortgage loan if a monthly debt service payment were scheduled to be due in that month). |
| Expected Closing Date: | On or about June 26, 2024. |
| THE INFORMATION IN THIS STRUCTURAL AND COLLATERAL TERM SHEET IS NOT COMPLETE AND MAY BE AMENDED PRIOR TO THE TIME OF SALE. THIS TERM SHEET IS NOT AN OFFER TO SELL THESE SECURITIES AND IT IS NOT A SOLICITATION OF AN OFFER TO BUY THESE SECURITIES IN ANY JURISDICTION WHERE THE OFFER OR SALE IS NOT PERMITTED. |
| | 7 | |
| BANK 2024-BNK47 | Issue Characteristics |
| Determination Dates: | The 11th day of each month (or if that day is not a business day, the next succeeding business day), commencing in July 2024. |
| Distribution Dates: | The fourth business day following the Determination Date in each month, commencing in July 2024. |
| Rated Final Distribution Date: | The Distribution Date in June 2057. |
| Interest Accrual Period: | With respect to any Distribution Date, the calendar month immediately preceding the month in which such Distribution Date occurs. |
| Day Count: | The Offered Certificates will accrue interest on a 30/360 basis. |
| Minimum Denominations: | $10,000 for each Class of Offered Certificates (other than the Class X-A and X-B Certificates) and $1,000,000 for the Class X-A and X-B Certificates. Investments may also be made in any whole dollar denomination in excess of the applicable minimum denomination. |
| Clean-up Call: | 1.0% |
| Delivery: | DTC, Euroclear and Clearstream Banking |
| ERISA/SMMEA Status: | Each Class of Offered Certificates is expected to be eligible for exemptive relief under ERISA. No Class of Offered Certificates will be Secondary Mortgage Market Enhancement Act of 1984, as amended (“SMMEA”) eligible. |
| Risk Factors: | THE CERTIFICATES INVOLVE CERTAIN RISKS AND MAY NOT BE SUITABLE FOR ALL INVESTORS. SEE THE “SUMMARY OF RISK FACTORS” AND “RISK FACTORS” SECTIONS OF THE PRELIMINARY PROSPECTUS. |
| Bond Analytics Information: | The Certificate Administrator will be authorized to make distribution date statements, CREFC® reports and certain supplemental reports (other than confidential information) available to certain financial modeling and data provision services, including Bloomberg, L.P., CRED iQ, Trepp, LLC, Intex Solutions, Inc., Markit Group Limited, Interactive Data Corp., BlackRock Financial Management, Inc., CMBS.com, Inc., Moody’s Analytics, Inc., Morningstar Credit Information & Analytics, LLC, KBRA Analytics, LLC, MBS Data, LLC, RealInsight and Thomson Reuters Corporation. |
| Tax Treatment | For U.S. federal income tax purposes, the issuing entity will consist of one or more REMICs arranged in a tiered structure and a trust (the “grantor trust”). The Offered Certificates will represent REMIC regular interests. |
| THE INFORMATION IN THIS STRUCTURAL AND COLLATERAL TERM SHEET IS NOT COMPLETE AND MAY BE AMENDED PRIOR TO THE TIME OF SALE. THIS TERM SHEET IS NOT AN OFFER TO SELL THESE SECURITIES AND IT IS NOT A SOLICITATION OF AN OFFER TO BUY THESE SECURITIES IN ANY JURISDICTION WHERE THE OFFER OR SALE IS NOT PERMITTED. |
| | 8 | |
| BANK 2024-BNK47 | Characteristics of the Mortgage Pool |
| IV. | Characteristics of the Mortgage Pool(1) |
| A. | Ten Largest Mortgage Loans |
Mortgage Loan
Seller | Mortgage Loan Name | City | State | Number of Mortgage Loans / Mortgaged Properties | Mortgage Loan Cut-off Date Balance ($) | % of Initial Pool Balance(%) | Property
Type | Number
of
SF | Cut-off Date Balance
Per SF ($) | Cut-off Date LTV Ratio (%) | Balloon LTV Ratio (%) | U/W
NCF
DSCR
(x) | U/W NOI Debt
Yield (%) |
| JPMCB, GSMC | St. Johns Town Center | Jacksonville | FL | 1 / 1 | $100,000,000 | 9.2 | % | Retail | 1,022,042 | $352 | 47.8 | % | 47.8 | % | 2.09 | x | 13.3 | % |
| GSMC | Dallas Market Center | Dallas | TX | 1 / 1 | 90,000,000 | 8.3 | | Mixed Use | 2,746,550 | 86 | 37.2 | | 37.2 | | 2.46 | | 17.0 | |
| BANA | Woodfield Mall | Schaumburg | IL | 1 / 1 | 79,500,000 | 7.3 | | Retail | 1,064,590 | 248 | 38.0 | | 38.0 | | 2.42 | | 16.0 | |
| BANA | Westwood Gateway II | Los Angeles | CA | 1 / 1 | 75,000,000 | 6.9 | | Office | 548,904 | 273 | 45.5 | | 45.5 | | 3.01 | | 17.5 | |
| GSMC, MSMCH | Danbury Fair Mall | Danbury | CT | 1 / 1 | 69,500,000 | 6.4 | | Retail | 923,598 | 168 | 41.8 | | 40.9 | | 2.52 | | 19.4 | |
| MSMCH | 60 Hudson | New York | NY | 1 / 1 | 65,000,000 | 6.0 | | Other | 1,149,619 | 244 | 17.5 | | 17.5 | | 3.92 | | 24.2 | |
| WFB | DHC Medical Office Portfolio | Various | Various | 1 / 8 | 63,000,000 | 5.8 | | Office | 725,279 | 165 | 49.0 | | 49.0 | | 1.62 | | 12.4 | |
| WFB | SSW Advanced Technologies | Various | Various | 1 / 7 | 55,100,000 | 5.1 | | Industrial | 1,259,886 | 44 | 63.0 | | 59.9 | | 1.35 | | 11.7 | |
| CREFI | Citadel Crossing - Colorado Springs | Colorado Springs | CO | 1 / 1 | 41,000,000 | 3.8 | | Retail | 356,912 | 115 | 61.1 | | 61.1 | | 1.33 | | 11.1 | |
| BANA | Rhino Portfolio 3 | Various | Various | 1 / 7 | 37,150,000 | 3.4 | | Various | 1,100,563 | 125 | 62.3 | | 62.3 | | 1.46 | | 11.0 | |
| Top Three Total/Weighted Average | | | 3 / 3 | $269,500,000 | 24.9 | % | | | | 41.4 | % | 41.4 | % | 2.31 | x | 15.3 | % |
| Top Five Total/Weighted Average | | | 5 / 5 | $414,000,000 | 38.3 | % | | | | 42.2 | % | 42.0 | % | 2.47 | x | 16.4 | % |
| Top Ten Total/Weighted Average | | | 10 / 29 | $675,250,000 | 62.4 | % | | | | 44.4 | % | 44.1 | % | 2.32 | x | 15.8 | % |
| Non-Top Ten Total/Weighted Average | | | 42 / 52 | $406,749,009 | 37.6 | % | | | | 52.4 | % | 50.2 | % | 2.29 | x | 17.9 | % |
| (1) | With respect to any mortgage loan that is part of a whole loan, Cut-off Date Balance Per SF ($), loan-to-value ratio, debt service coverage ratio and debt yield calculations include the related pari passu companion loan(s) but exclude any related subordinate companion loan(s) (unless otherwise stated). With respect to each mortgage loan, debt service coverage ratio, debt yield and loan-to-value ratio information do not take into account subordinate debt (whether or not secured by the related mortgaged property), if any, that currently exists or is allowed under the terms of such mortgage loan. |
| THE INFORMATION IN THIS STRUCTURAL AND COLLATERAL TERM SHEET IS NOT COMPLETE AND MAY BE AMENDED PRIOR TO THE TIME OF SALE. THIS TERM SHEET IS NOT AN OFFER TO SELL THESE SECURITIES AND IT IS NOT A SOLICITATION OF AN OFFER TO BUY THESE SECURITIES IN ANY JURISDICTION WHERE THE OFFER OR SALE IS NOT PERMITTED. |
| | 9 | |
| BANK 2024-BNK47 | Characteristics of the Mortgage Pool |
| B. Summary | of the Whole Loans |
| No. | Property Name | Mortgage Loan Seller in BANK 2024-BNK47 | Mortgage Loan Cut-off Date Balance | Aggregate Pari-Passu Companion Loan Cut-off Date Balance(1) | Combined Cut-off Date Balance | Controlling Pooling / Trust and Servicing Agreement | Master Servicer | Special Servicer | Related Pari Passu Companion Loan(s) Securitizations | Combined UW NCF DSR(2) | Combined UW NOI Debt Yield(2) | Combined Cut-off Date LTV(2) |
| 1 | St. Johns Town Center | JPMCB, GSMC | $100,000,000 | $260,000,000 | $360,000,000 | Future Securitization(3) | Wells Fargo Bank, National Association(3) | Rialto Capital Advisors, LLC(3) | Future Securitization | 2.09x | 13.3% | 47.8% |
| 2 | Dallas Market Center | GSMC | $90,000,000 | $147,000,000 | $237,000,000 | BANK 2024-BNK47 | Wells Fargo Bank, National Association | Rialto Capital Advisors, LLC | Future Securitization | 2.46x | 17.0% | 37.2% |
| 3 | Woodfield Mall | BANA | $79,500,000 | $184,500,000 | $264,000,000 | BMO 2023-C7(4) | Wells Fargo Bank, National Association | KeyBank National Association | BMO 2023-C7, BBCMS 2024-C24
BMO 2024-C8, BBCMS 2024-C26 | 2.42x | 16.0% | 38.0% |
| 4 | Westwood Gateway II | BANA | $75,000,000 | $75,000,000 | $150,000,000 | BANK 2024-BNK47 | Wells Fargo Bank, National Association | Rialto Capital Advisors, LLC | BBCMS 2024-C26 | 3.01x | 17.5% | 45.5% |
| 5 | Danbury Fair Mall | GSMC, MSMCH | $69,500,000 | $85,500,000 | $155,000,000 | BMO 2024-C8 | Wells Fargo Bank, National Association | Rialto Capital Advisors, LLC | BMO 2024-C8, BBCMS 2024-C26 | 2.52x | 19.4% | 41.8% |
| 6 | 60 Hudson | MSMCH | $65,000,000 | $215,000,000 | $280,000,000 | MSWF 2023-2 | Wells Fargo Bank, National Association | Argentic Services Company LP | BBMS 2023-C22, BMO 2023-C7, MSWF 2023-2, BMO 2024-C8 | 3.92x | 24.2% | 17.5% |
| 7 | DHC Medical Office Portfolio | WFB | $63,000,000 | $57,000,000 | $120,000,000 | BANK 2024-BNK47 | Wells Fargo Bank, National Association | Rialto Capital Advisors, LLC | Future Securitization | 1.62x | 12.4% | 49.0% |
| 10 | Rhino Portfolio 3 | BANA | $37,150,000 | $100,000,000 | $137,150,000 | BBCMS 2024-C24 | Midland Loan Services | Argentic Services Company LP | BBCMS 2024-C24, BBCMS 2024-C26 | 1.46x | 11.0% | 62.3% |
| 16 | 1812 North Moore | CREFI | $25,000,000 | $148,000,000 | $173,000,000 | BMARK 2024-V7 | Midland Loan Services | K-Star Asset Management LLC | BMO 2024-5C4 and BMARK 2024-V7 | 1.55x | 13.9% | 54.9% |
| 21 | Arundel Mills and Marketplace | WFB | $15,000,000 | $345,000,000 | $360,000,000 | MSWF 2023-2 | Wells Fargo Bank, National Association | Argentic Services Company LP | BMO 2023-C7, MSWF 2023-2, Benchmark 2023-B40, BBCMS 2024-C24, BMO 2024-C8 | 1.98x | 16.1% | 41.4% |
| (1) | The Aggregate Pari Passu Companion Loan Cut-off Date Balance excludes the related Subordinate Companion Loans. |
| (2) | DSCR, Debt Yield and LTV calculations include any related pari passu companion loans and exclude any subordinate companion loans and/or mezzanine loans, as applicable. |
| (3) | The St. Johns Town Center controlling companion loan is currently held by Barclays Capital Real Estate Inc. The St. Johns Town Center whole loan will be serviced pursuant to the BANK 2024-BNK47 pooling and servicing agreement until the securitization of the related controlling pari passu companion loan. |
| (4) | Control rights are currently exercised by the holder of the related Subordinate Companion Loan until the occurrence and during the continuance of a control appraisal period for the related Whole Loan, as described under “Description of the Mortgage Pool—The Whole Loans—The Non-Serviced A/B Whole Loan—The Woodfield Mall Pari Passu AB Whole Loan ” in the Preliminary Prospectus. |
| THE INFORMATION IN THIS STRUCTURAL AND COLLATERAL TERM SHEET IS NOT COMPLETE AND MAY BE AMENDED PRIOR TO THE TIME OF SALE. THIS TERM SHEET IS NOT AN OFFER TO SELL THESE SECURITIES AND IT IS NOT A SOLICITATION OF AN OFFER TO BUY THESE SECURITIES IN ANY JURISDICTION WHERE THE OFFER OR SALE IS NOT PERMITTED. |
| | 10 | |
| BANK 2024-BNK47 | Characteristics of the Mortgage Pool |
| C. | Mortgage Loans with Additional Secured and Mezzanine Financing |
| Loan No. | Mortgage Loan Seller | Mortgage Loan Name | Mortgage
Loan
Cut-off Date Balance ($) | % of Initial Pool Balance (%) | Sub Debt Cut-off Date Balance ($) | Mezzanine Debt Cut-off Date Balance ($) | Total Debt Interest Rate (%)(1) | Mortgage Loan U/W NCF DSCR (x)(2) | Total Debt U/W NCF DSCR (x) | Mortgage Loan Cut-off Date U/W NOI Debt Yield (%)(2) | Total Debt Cut-off Date U/W NOI Debt Yield (%) | Mortgage Loan Cut-off Date LTV Ratio (%)(2) | Total Debt Cut-off Date LTV Ratio (%) |
| 3 | BANA | Woodfield Mall | $79,500,000 | 7.3% | $30,000,000 | NAP | 6.7110% | 2.42x | 2.05x | 16.0% | 14.3% | 38.0% | 42.4% |
| Total/Weighted Average | $79,500,000 | 7.3% | $30,000,000 | | 6.7110% | 2.42x | 2.05x | 16.0% | 14.3% | 38.0% | 42.4% |
| (1) | Total Debt Interest Rate for any specified mortgage loan reflects the weighted average of the interest rates on the respective components of the total debt. |
| (2) | With respect to any mortgage loan that is part of a whole loan, the loan-to-value ratio, debt service coverage ratio and debt yield calculations include the related pari passu companion loan(s) but excludes any related subordinate companion loan. |
| THE INFORMATION IN THIS STRUCTURAL AND COLLATERAL TERM SHEET IS NOT COMPLETE AND MAY BE AMENDED PRIOR TO THE TIME OF SALE. THIS TERM SHEET IS NOT AN OFFER TO SELL THESE SECURITIES AND IT IS NOT A SOLICITATION OF AN OFFER TO BUY THESE SECURITIES IN ANY JURISDICTION WHERE THE OFFER OR SALE IS NOT PERMITTED. |
| | 11 | |
| BANK 2024-BNK47 | Characteristics of the Mortgage Pool |
| D. | Previous Securitization History(1) |
Loan No. | Mortgage Loan Seller | Mortgage
Loan or Mortgaged
Property Name | City | State | Property Type | Mortgage Loan
or Mortgaged Property Cut-off Date Balance ($) | % of Cut-off Date Pool Balance (%) | Previous Securitization |
| 1.00 | JPMCB/ GSMC | St. Johns Town Center | Jacksonville | FL | Retail | $100,000,000 | 9.2 | % | WFRBS 2014-C24, WFRBS 2014-C25 |
| 6.00 | MSMCH | 60 Hudson | New York | NY | Other | 65,000,000 | 6.0 | | COMM 2013-CR13, COMM 2014-CR14 |
| 9.00 | CREFI | Citadel Crossing - Colorado Springs | Colorado Springs | CO | Retail | 41,000,000 | 3.8 | | CLNY 2015-FL3 |
| 11.00 | WFB | Anaheim Desert Palm Hotel & Suites | Anaheim | CA | Hospitality | 29,975,000 | 2.8 | | MSBAM 2014-C17 |
| 15.00 | WFB | Richland Town Center | Johnstown | PA | Retail | 25,460,163 | 2.4 | | COMM 2014-UBS4 |
| 17.00 | BANA | JLL Plaza Leased Fee | Austin | TX | Leased Fee | 23,700,000 | 2.2 | | COMM 2014-UBS3 |
| 21.00 | WFB | Arundel Mills and Marketplace | Hanover | MD | Retail | 15,000,000 | 1.4 | | MSBAM 2014-C15, MSBAM 2014-C16, JPMBB 2014-C19 |
| 24.00 | WFB | Del Sol Inn | Anaheim | CA | Hospitality | 10,000,000 | 0.9 | | MSBAM 2014-C16 |
| 25.00 | BANA | Ramada Inn - Rockville Centre, NY | Rockville Centre | NY | Hospitality | 8,650,000 | 0.8 | | COMM 2014-UBS2 |
| 26.00 | MSMCH | William Penn Plaza | Easton | PA | Retail | 8,000,000 | 0.7 | | COMM 2014-UBS4 |
| 27.00 | WFB | Powers Ferry Shopping Center | Sandy Springs | GA | Retail | 7,500,000 | 0.7 | | MSBAM 2014-C16 |
| 28.00 | NCB | Bon Aire Park Owners, Inc. | Suffern | NY | Multifamily | 7,000,000 | 0.6 | | WFRBS 2014-C21 |
| 32.00 | MSMCH | Vigouroux Marketplace Mobile AL | Mobile | AL | Retail | 5,500,000 | 0.5 | | CGCMT 2015-GC27 |
| 37.00 | NCB | 67th Road Housing Corporation | Forest Hills | NY | Multifamily | 3,793,444 | 0.4 | | WFRBS 2014-C21 |
| 39.00 | NCB | 321 Apartments Corp. | New York | NY | Multifamily | 3,194,592 | 0.3 | | WFRBS 2014-C20 |
| 42.00 | BANA | Bluejay Family Dollar Portfolio | Various | Various | Retail | 2,744,843 | 0.3 | | MSBAM 2014-C19 |
| 43.00 | NCB | 214 West 17 Apartment Corp. a/k/a 214 West 17th Apartment Corp. | New York | NY | Multifamily | 2,699,418 | 0.2 | | WFRBS 2014-C21 |
| 46.00 | NCB | 929 Park Avenue Apartments Corp. | New York | NY | Multifamily | 2,348,184 | 0.2 | | WFRBS 2014-C20 |
| 49.00 | NCB | 320 W. 89th St. Owners Corp. | New York | NY | Multifamily | 1,597,277 | 0.1 | | WFRBS 2014-C21 |
| 51.00 | NCB | 250 Equities Corp. | New York | NY | Multifamily | 1,300,000 | 0.1 | | WFRBS 2014-C22 |
| | Total | | | | | $364,462,922 | 33.7 | % | |
| (1) | The table above represents the most recent securitization with respect to the mortgaged property securing the related mortgage loan, based on information provided by the related borrower or obtained through searches of a third-party database. While loans secured by the above mortgaged properties may have been securitized multiple times in prior transactions, mortgage loans in this securitization are only listed in the above chart if the mortgage loan paid off a loan in another securitization. The information has not otherwise been confirmed by the mortgage loan sellers. |
| THE INFORMATION IN THIS STRUCTURAL AND COLLATERAL TERM SHEET IS NOT COMPLETE AND MAY BE AMENDED PRIOR TO THE TIME OF SALE. THIS TERM SHEET IS NOT AN OFFER TO SELL THESE SECURITIES AND IT IS NOT A SOLICITATION OF AN OFFER TO BUY THESE SECURITIES IN ANY JURISDICTION WHERE THE OFFER OR SALE IS NOT PERMITTED. |
| | 12 | |
| BANK 2024-BNK47 | Characteristics of the Mortgage Pool |
| E. | Mortgage Loans with Scheduled Balloon Payments and Related Classes |
| Class A-2(1) |
| Loan No. | Mortgage Loan Seller | Mortgage Loan Name | State | Property Type | Mortgage Loan Cut-off Date Balance ($) | % of Initial Pool
Balance (%) | Mortgage
Loan Balance at Maturity ($) | % of Class A-2 Certificate Principal
Balance (%)(2) | SF | Loan per
SF ($) | U/W NCF DSCR
(x) | U/W NOI Debt Yield (%) | Cut-off Date LTV Ratio (%) | Balloon
LTV Ratio (%) | Rem. IO Period (mos.) | Rem. Term to Maturity (mos.) |
| 9 | CREFI | Citadel Crossing – Colorado Springs | CO | Retail | $41,000,000 | 3.8 | % | $41,000,000 | 62.3 | % | 356,912 | $115 | 1.33 | x | 11.1 | % | 61.1 | % | 61.1 | % | 60 | 60 |
| 16 | CREFI | 1812 North Moore | VA | Office | 25,000,000 | 2.3 | | 24,373,642 | 37.0 | | 543,697 | 318 | 1.55 | | 13.9 | | 54.9 | | 53.5 | | 23 | 59 |
| Total/Weighted Average | | | $66,000,000 | 6.1 | % | $65,373,642 | 99.4 | % | 900,609 | | 1.41 | x | 12.2 | % | 58.8 | % | 58.2 | % | 46 | 60 |
| (1) | The table above presents the mortgage loan whose balloon payments would be applied to pay down the principal balance of the Class A-2 Certificates, assuming a 0% CPR and applying the “Structuring Assumptions” described in the Preliminary Prospectus, including the assumptions that (i) none of the mortgage loans in the pool experience prepayments prior to maturity, defaults or losses; (ii) there are no extensions of maturity dates of any mortgage loans in the pool; and (iii) each mortgage loan in the pool is paid in full on its stated maturity date. Each Class of Certificates evidences undivided ownership interests in the entire pool of mortgage loans. Debt service coverage ratio, debt yield and loan-to-value ratio information do not take into account subordinate debt (whether or not secured by the related mortgaged property), if any, that currently exists or is allowed under the terms of any mortgage loan. See Annex A-1 to the Preliminary Prospectus. |
| (2) | Reflects the percentage equal to the Balloon Balance divided by the initial Class A-2 Certificate Balance. |
| Class A-3(1) |
| Loan No. | Mortgage Loan Seller | Mortgage Loan Name | State | Property Type | Mortgage Loan Cut-off Date Balance ($) | % of Initial Pool
Balance (%) | Mortgage
Loan Balance at Maturity ($) | % of Class A-3 Certificate Principal
Balance (%)(2) | SF | Loan per
SF ($) | U/W NCF DSCR
(x) | U/W NOI Debt Yield (%) | Cut-off Date LTV Ratio (%) | Balloon
LTV Ratio (%) | Rem. IO Period (mos.) | Rem. Term to Maturity (mos.) |
| 27 | WFB | Powers Ferry Shopping Center | GA | Retail | $7,500,000 | 0.7% | $7,500,000 | 100.0% | 25,878 | $290 | 1.36x | 10.8% | 64.4% | 64.4% | 83 | 83 |
| Total/Weighted Average | | | $7,500,000 | 0.7% | $7,500,000 | 100.0% | 25,878 | | 1.36x | 10.8% | 64.4% | 64.4% | 83 | 83 |
| (1) | The table above presents the mortgage loan whose balloon payments would be applied to pay down the principal balance of the Class A-3 Certificates, assuming a 0% CPR and applying the “Structuring Assumptions” described in the Preliminary Prospectus, including the assumptions that (i) none of the mortgage loans in the pool experience prepayments prior to maturity, defaults or losses; (ii) there are no extensions of maturity dates of any mortgage loans in the pool; and (iii) each mortgage loan in the pool is paid in full on its stated maturity date. Each Class of Certificates evidences undivided ownership interests in the entire pool of mortgage loans. Debt service coverage ratio, debt yield and loan-to-value ratio information do not take into account subordinate debt (whether or not secured by the related mortgaged property), if any, that currently exists or is allowed under the terms of any mortgage loan. See Annex A-1 to the Preliminary Prospectus. |
| (2) | Reflects the percentage equal to the Balloon Balance divided by the initial Class A-3 Certificate Balance. |
| THE INFORMATION IN THIS STRUCTURAL AND COLLATERAL TERM SHEET IS NOT COMPLETE AND MAY BE AMENDED PRIOR TO THE TIME OF SALE. THIS TERM SHEET IS NOT AN OFFER TO SELL THESE SECURITIES AND IT IS NOT A SOLICITATION OF AN OFFER TO BUY THESE SECURITIES IN ANY JURISDICTION WHERE THE OFFER OR SALE IS NOT PERMITTED. |
| | 13 | |
| BANK 2024-BNK47 | Characteristics of the Mortgage Pool |
| F. | Property Type Distribution(1) |
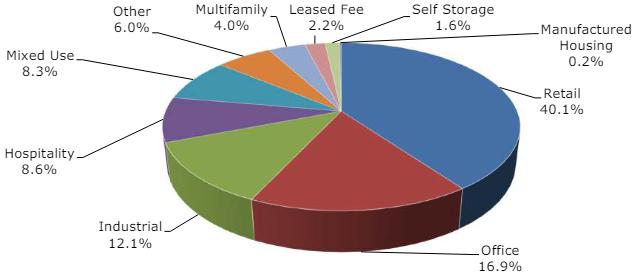
| Property Type | Number of Mortgaged Properties | Aggregate Cut-off Date Balance ($) | % of Cut-off Date Balance (%) | Weighted Average Cut-off Date LTV Ratio (%) | Weighted Average Balloon or ARD LTV Ratio (%) | Weighted Average U/W NCF DSCR (x) | Weighted Average U/W NOI Debt Yield (%) | Weighted Average U/W NCF Debt Yield (%) | Weighted Average Mortgage Rate (%) |
| Retail | 23 | $433,400,195 | 40.1% | 49.7% | 49.0% | 2.00x | 14.4% | 13.8% | 6.6414% |
| Super Regional Mall | 4 | 264,000,000 | 24.4 | 42.9 | 42.7 | 2.30 | 15.9 | 15.3 | 6.2796 |
| Anchored | 10 | 153,236,157 | 14.2 | 61.3 | 60.0 | 1.49 | 11.7 | 11.1 | 7.2298 |
| Single Tenant | 7 | 9,342,984 | 0.9 | 39.6 | 37.6 | 2.32 | 17.6 | 16.8 | 7.0779 |
| Shadow Anchored | 2 | 6,821,054 | 0.6 | 64.6 | 64.6 | 1.49 | 10.9 | 10.3 | 6.8289 |
| Office | 11 | 182,985,150 | 16.9 | 46.5 | 45.9 | 2.35 | 16.3 | 15.3 | 6.3706 |
| CBD | 3 | 119,985,150 | 11.1 | 45.3 | 44.2 | 2.74 | 18.4 | 17.4 | 6.1115 |
| Medical/Lab | 8 | 63,000,000 | 5.8 | 49.0 | 49.0 | 1.62 | 12.4 | 11.3 | 6.8640 |
| Industrial | 15 | 131,158,703 | 12.1 | 61.3 | 57.7 | 1.46 | 12.1 | 11.5 | 7.0263 |
| Manufacturing | 8 | 67,190,000 | 6.2 | 63.5 | 60.3 | 1.38 | 11.8 | 11.2 | 7.1210 |
| Warehouse/Manufacturing | 2 | 29,575,000 | 2.7 | 64.0 | 60.5 | 1.43 | 11.7 | 11.1 | 6.7710 |
| Flex/R&D | 1 | 21,500,000 | 2.0 | 57.2 | 52.7 | 1.40 | 11.7 | 11.1 | 6.9100 |
| Warehouse/Distribution | 1 | 5,147,513 | 0.5 | 73.0 | 65.1 | 1.24 | 11.5 | 10.7 | 7.7950 |
| Cold Storage/Warehouse | 1 | 4,750,000 | 0.4 | 26.0 | 26.0 | 3.10 | 21.6 | 20.9 | 6.6500 |
| Warehouse | 2 | 2,996,190 | 0.3 | 51.4 | 45.6 | 1.54 | 13.7 | 13.0 | 7.5330 |
| Hospitality | 6 | 93,398,835 | 8.6 | 54.8 | 52.6 | 2.41 | 19.6 | 17.9 | 7.3457 |
| Limited Service | 4 | 54,622,391 | 5.0 | 46.9 | 46.1 | 3.07 | 23.3 | 21.4 | 6.9279 |
| Select Service | 1 | 27,000,000 | 2.5 | 64.3 | 61.6 | 1.40 | 13.5 | 12.2 | 7.9000 |
| Extended Stay | 1 | 11,776,444 | 1.1 | 69.3 | 62.2 | 1.68 | 16.2 | 14.9 | 8.0130 |
| Mixed Use | 1 | 90,000,000 | 8.3 | 37.2 | 37.2 | 2.46 | 17.0 | 16.2 | 6.5020 |
| Merchandise Mart/Retail | 1 | 90,000,000 | 8.3 | 37.2 | 37.2 | 2.46 | 17.0 | 16.2 | 6.5020 |
| Other | 1 | 65,000,000 | 6.0 | 17.5 | 17.5 | 3.92 | 24.2 | 23.4 | 5.8850 |
| Data Center | 1 | 65,000,000 | 6.0 | 17.5 | 17.5 | 3.92 | 24.2 | 23.4 | 5.8850 |
| Multifamily | 15 | 43,431,126 | 4.0 | 18.2 | 16.9 | 5.53 | 41.0 | 40.2 | 6.4651 |
| Cooperative | 13 | 34,626,314 | 3.2 | 12.3 | 11.2 | 6.26 | 46.2 | 45.4 | 6.4825 |
| Low Rise | 1 | 4,604,812 | 0.4 | 62.3 | 62.3 | 1.46 | 11.0 | 10.2 | 6.9320 |
| Garden | 1 | 4,200,000 | 0.4 | 18.6 | 14.3 | 4.01 | 31.4 | 30.4 | 5.8100 |
| Leased Fee | 1 | 23,700,000 | 2.2 | 80.6 | 80.6 | 1.21 | 7.8 | 7.8 | 6.3460 |
| Leased Fee | 1 | 23,700,000 | 2.2 | 80.6 | 80.6 | 1.21 | 7.8 | 7.8 | 6.3460 |
| Self Storage | 7 | 16,775,000 | 1.6 | 47.3 | 47.3 | 2.02 | 13.0 | 12.8 | 6.2337 |
| Self Storage | 7 | 16,775,000 | 1.6 | 47.3 | 47.3 | 2.02 | 13.0 | 12.8 | 6.2337 |
| Manufactured Housing | 1 | 2,150,000 | 0.2 | 52.4 | 52.4 | 1.54 | 10.3 | 10.1 | 6.4700 |
| Manufactured Housing/RV Park | 1 | 2,150,000 | 0.2 | 52.4 | 52.4 | 1.54 | 10.3 | 10.1 | 6.4700 |
| Total/Weighted Average | 81 | $1,081,999,009 | 100.0% | 47.4% | 46.4% | 2.31x | 16.6% | 15.8% | 6.6258% |
| (1) | Because this table presents information relating to the mortgaged properties and not the mortgage loans, the information for mortgage loans secured by more than one mortgaged property is based on allocated loan amounts (allocating the principal balance of the mortgage loan to each of those properties according to the relative appraised values of the mortgaged properties or the allocated loan amounts or property-specific release prices set forth in the related mortgage loan documents or such other allocation as the related mortgage loan seller deemed appropriate). For mortgaged properties securing residential cooperative mortgage loans, the debt service coverage ratio and debt yield for each such mortgaged property is calculated using U/W Net Operating Income or U/W Net Cash Flow, as applicable, for the related residential cooperative property which is the projected net operating income or net cash flow, as applicable, reflected in the most recent appraisal obtained by or otherwise in the possession of the related mortgage loan seller as of the cut-off date and the loan-to-value ratio, is calculated based upon the appraised value of the residential cooperative property determined as if such residential cooperative property is operated as a residential cooperative, inclusive of the amount of the underlying debt encumbering such residential cooperative property. With respect to any mortgage loan that is part of a whole loan, the loan-to-value ratio, debt service coverage ratio and debt yield calculations include the related pari passu companion loan(s) but exclude any related subordinate companion loan(s) (unless otherwise stated). With respect to each mortgage loan, debt service coverage ratio, debt yield and loan-to-value ratio information do not take into account any subordinate debt (whether or not secured by the related mortgaged property) that currently exists or is allowed under the terms of such mortgage loan. See Annex A-1 to the Preliminary Prospectus. |
| THE INFORMATION IN THIS STRUCTURAL AND COLLATERAL TERM SHEET IS NOT COMPLETE AND MAY BE AMENDED PRIOR TO THE TIME OF SALE. THIS TERM SHEET IS NOT AN OFFER TO SELL THESE SECURITIES AND IT IS NOT A SOLICITATION OF AN OFFER TO BUY THESE SECURITIES IN ANY JURISDICTION WHERE THE OFFER OR SALE IS NOT PERMITTED. |
| | 14 | |
| BANK 2024-BNK47 | Characteristics of the Mortgage Pool |
| G. | Geographic Distribution(1) |
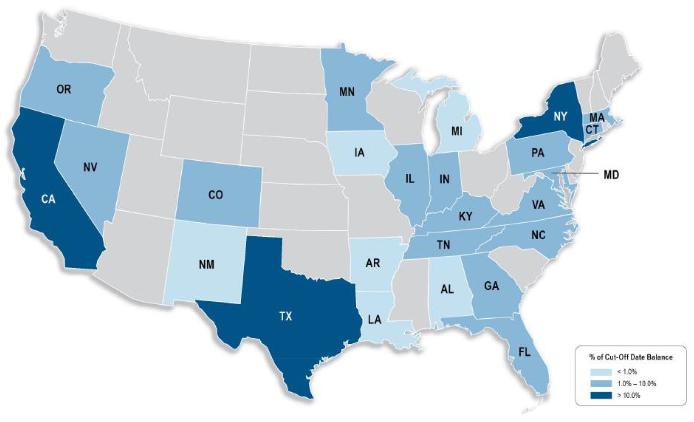
| Location | Number of Mortgaged Properties | Aggregate
Cut-off Date Balance ($) | % of
Cut-off Date Balance (%) | Weighted Average Cut-off Date LTV Ratio (%) | Weighted Average Balloon LTV Ratio (%) | Weighted Average U/W NCF DSCR (x) | Weighted Average U/W NOI Debt Yield (%) | Weighted Average U/W NCF Debt Yield (%) | Weighted Average Interest Rate (%) |
| California | 7 | | $189,567,857 | 17.5 | % | 49.1 | % | 48.2 | % | 2.51 | x | 17.3 | % | 16.3 | % | 6.4656 | % |
| Southern California | 6 | | 168,225,000 | 15.5 | | 49.1 | | 48.1 | | 2.63 | | 17.9 | | 16.9 | | 6.4150 | |
| Northern California | 1 | | 21,342,857 | 2.0 | | 49.0 | | 49.0 | | 1.62 | | 12.4 | | 11.3 | | 6.8640 | |
| New York | 18 | | 150,369,171 | 13.9 | | 26.9 | | 26.7 | | 3.86 | | 26.5 | | 25.6 | | 6.3674 | |
| Texas | 4 | | 126,228,819 | 11.7 | | 47.6 | | 47.2 | | 2.14 | | 14.9 | | 14.3 | | 6.5667 | |
| Florida | 2 | | 103,214,286 | 9.5 | | 47.8 | | 47.8 | | 2.08 | | 13.3 | | 12.6 | | 5.9765 | |
| Illinois | 3 | | 82,371,236 | 7.6 | | 38.8 | | 38.8 | | 2.39 | | 15.8 | | 15.4 | | 6.3562 | |
| Connecticut | 1 | | 69,500,000 | 6.4 | | 41.8 | | 40.9 | | 2.52 | | 19.4 | | 18.9 | | 6.3860 | |
| Pennsylvania | 7 | | 64,234,837 | 5.9 | | 48.7 | | 43.6 | | 2.18 | | 18.1 | | 16.4 | | 6.5945 | |
| Other(2) | 39 | | 296,512,803 | 27.4 | | 59.9 | | 58.2 | | 1.50 | | 12.2 | | 11.6 | | 7.2484 | |
| Total/Weighted Average | 81 | | $1,081,999,009 | 100.0 | % | 47.4 | % | 46.4 | % | 2.31 | x | 16.6 | % | 15.8 | % | 6.6258 | % |
| (1) | Because this table presents information relating to the mortgaged properties and not the mortgage loans, the information for mortgage loans secured by more than one mortgaged property is based on allocated loan amounts (allocating the principal balance of the mortgage loan to each of those properties according to the relative appraised values of the mortgaged properties or the allocated loan amounts or property-specific release prices set forth in the related mortgage loan documents or such other allocation as the related mortgage loan seller deemed appropriate). For mortgaged properties securing residential cooperative mortgage loans, the debt service coverage ratio and debt yield for each such mortgaged property is calculated using U/W Net Operating Income or U/W Net Cash Flow, as applicable, for the related residential cooperative property which is the projected net operating income or net cash flow, as applicable, reflected in the most recent appraisal obtained by or otherwise in the possession of the related mortgage loan seller as of the cut-off date and the loan-to-value ratio, is calculated based upon the appraised value of the residential cooperative property determined as if such residential cooperative property is operated as a residential cooperative, inclusive of the amount of the underlying debt encumbering such residential cooperative property. With respect to any mortgage loan that is part of a whole loan, the loan-to-value ratio, debt service coverage ratio and debt yield calculations include the related pari passu companion loan(s) but exclude any related subordinate companion loan(s) (unless otherwise stated). With respect to each mortgage loan, debt service coverage ratio, debt yield and loan-to-value ratio information do not take into account any subordinate debt (whether or not secured by the related mortgaged property) that currently exists or is allowed under the terms of such mortgage loan. See Annex A-1 to the Preliminary Prospectus. |
| (2) | Includes 18 other states. |
| THE INFORMATION IN THIS STRUCTURAL AND COLLATERAL TERM SHEET IS NOT COMPLETE AND MAY BE AMENDED PRIOR TO THE TIME OF SALE. THIS TERM SHEET IS NOT AN OFFER TO SELL THESE SECURITIES AND IT IS NOT A SOLICITATION OF AN OFFER TO BUY THESE SECURITIES IN ANY JURISDICTION WHERE THE OFFER OR SALE IS NOT PERMITTED. |
| | 15 | |
| BANK 2024-BNK47 | Characteristics of the Mortgage Pool |
| H. | Characteristics of the Mortgage Pool(1) |
CUT-OFF DATE BALANCE
Range of Cut-off Date
Balances ($) | Number of
Mortgage
Loans | Aggregate
Cut-off Date Balance ($) | Percent by
Aggregate
Cut-off Date
Pool Balance (%) |
| 1,000,000 - 5,000,000 | 19 | $52,967,347 | 4.9% |
| 5,000,001 - 15,000,000 | 13 | 109,936,348 | 10.2 |
| 15,000,001 - 20,000,000 | 2 | 35,985,150 | 3.3 |
| 20,000,001 - 30,000,000 | 8 | 207,860,163 | 19.2 |
| 30,000,001 - 50,000,000 | 2 | 78,150,000 | 7.2 |
| 50,000,001 - 70,000,000 | 4 | 252,600,000 | 23.3 |
| 70,000,001 - 100,000,000 | 4 | 344,500,000 | 31.8 |
| Total: | 52 | $1,081,999,009 | 100.0% |
| Average: | $20,807,673 | | |
UNDERWRITTEN NOI DEBT SERVICE COVERAGE RATIO
Range of U/W NOI
DSCRs (x) | Number of
Mortgage
Loans | Aggregate
Cut-off Date Balance ($) | Percent by
Aggregate
Cut-off Date
Pool Balance (%) |
| 1.21 - 1.50 | 8 | $162,192,357 | 15.0% |
| 1.51 - 2.00 | 15 | 298,420,188 | 27.6 |
| 2.01 - 4.00 | 15 | 514,353,594 | 47.5 |
| 4.01 - 9.00 | 12 | 103,185,786 | 9.5 |
| 9.01 - 11.69 | 2 | 3,847,084 | 0.4 |
| Total: | 52 | $1,081,999,009 | 100.0% |
| Weighted Average: | 2.42x | | |
UNDERWRITTEN NOI DEBT YIELD
Range of U/W NOI
Debt Yields (%) | Number of
Mortgage
Loans | Aggregate
Cut-off Date Balance ($) | Percent by
Aggregate
Cut-off Date
Pool Balance (%) |
| 7.8 - 12.0 | 14 | $261,642,357 | 24.2% |
| 12.1 - 16.0 | 12 | 376,893,744 | 34.8 |
| 16.1 - 20.0 | 6 | 264,276,444 | 24.4 |
| 20.1 - 40.0 | 12 | 156,750,871 | 14.5 |
| 40.1 - 60.0 | 4 | 13,894,010 | 1.3 |
| 60.1 - 80.0 | 3 | 7,042,683 | 0.7 |
| 80.1 - 88.3 | 1 | 1,498,900 | 0.1 |
| Total: | 52 | $1,081,999,009 | 100.0% |
| Weighted Average: | 16.6% | | |
LOAN PURPOSE
| Loan Purpose | Number of
Mortgage
Loans | Aggregate
Cut-off Date Balance ($) | Percent by
Aggregate
Cut-off Date
Pool Balance (%) |
| Refinance | 40 | $794,482,564 | 73.4% |
| Recapitalization | 5 | 148,750,000 | 13.7 |
| Acquisition | 7 | 138,766,444 | 12.8 |
| Total: | 52 | $1,081,999,009 | 100.0% |
| MORTGAGE RATE |
Range of Mortgage
Rates (%) | Number of
Mortgage
Loans | Aggregate
Cut-off Date Balance ($) | Percent by
Aggregate
Cut-off Date
Pool Balance (%) |
| 5.5600 - 6.0000 | 4 | $244,200,000 | 22.6% |
| 6.0001 - 6.5000 | 16 | 235,737,045 | 21.8 |
| 6.5001 - 7.0000 | 19 | 388,649,582 | 35.9 |
| 7.0001 - 7.5000 | 4 | 71,994,843 | 6.7 |
| 7.5001 - 8.0000 | 6 | 82,643,703 | 7.6 |
| 8.0001 - 8.1300 | 3 | 58,773,835 | 5.4 |
| Total: | 52 | $1,081,999,009 | 100.0% |
| Weighted Average: | 6.6258% | | |
| UNDERWRITTEN NCF DEBT SERVICE COVERAGE RATIO |
Range of U/W NCF
DSCRs (x) | Number of
Mortgage
Loans | Aggregate
Cut-off Date Balance ($) | Percent by
Aggregate
Cut-off Date
Pool Balance (%) |
| 1.21 - 1.50 | 14 | $305,377,520 | 28.2% |
| 1.51 - 2.00 | 10 | 170,235,025 | 15.7 |
| 2.01 - 4.00 | 15 | 564,353,594 | 52.2 |
| 4.01 - 9.00 | 11 | 38,185,786 | 3.5 |
| 9.01 - 11.43 | 2 | 3,847,084 | 0.4 |
| Total: | 52 | $1,081,999,009 | 100.0% |
| Weighted Average: | 2.31x | | |
| UNDERWRITTEN NCF DEBT YIELD |
Range of U/W NCF
Debt Yields (%) | Number of
Mortgage
Loans | Aggregate
Cut-off Date Balance ($) | Percent by
Aggregate
Cut-off Date
Pool Balance (%) |
| 7.8 - 12.0 | 17 | $362,192,520 | 33.5% |
| 12.1 - 16.0 | 11 | 303,120,025 | 28.0 |
| 16.1 - 20.0 | 4 | 237,500,000 | 22.0 |
| 20.1 - 40.0 | 12 | 156,750,871 | 14.5 |
| 40.1 - 60.0 | 5 | 16,394,010 | 1.5 |
| 60.1 - 80.0 | 2 | 4,542,683 | 0.4 |
| 80.1 - 86.3 | 1 | 1,498,900 | 0.1 |
| Total: | 52 | $1,081,999,009 | 100.0% |
| Weighted Average: | 15.8% | | |
| (1) | For mortgaged properties securing residential cooperative mortgage loans, the debt service coverage ratio and debt yield for each such mortgaged property is calculated using U/W Net Operating Income or U/W Net Cash Flow, as applicable, for the related residential cooperative property which is the projected net operating income or net cash flow, as applicable, reflected in the most recent appraisal obtained by or otherwise in the possession of the related mortgage loan seller as of the cut-off date and the loan-to-value ratio, is calculated based upon the appraised value of the residential cooperative property determined as if such residential cooperative property is operated as a residential cooperative, inclusive of the amount of the underlying debt encumbering such residential cooperative property. With respect to any mortgage loan that is part of a whole loan, the loan-to-value ratio, debt service coverage ratio and debt yield calculations include the related pari passu companion loan(s) but exclude any related subordinate companion loan(s) (unless otherwise stated). With respect to each mortgage loan, debt service coverage ratio, debt yield and loan-to-value ratio information do not take into account any subordinate debt (whether or not secured by the related mortgaged property), that currently exists or is allowed under the terms of such mortgage loan. See Annex A-1 to the Preliminary Prospectus. Prepayment provisions for each mortgage loan reflects the entire life of the loan (from origination to maturity). |
| THE INFORMATION IN THIS STRUCTURAL AND COLLATERAL TERM SHEET IS NOT COMPLETE AND MAY BE AMENDED PRIOR TO THE TIME OF SALE. THIS TERM SHEET IS NOT AN OFFER TO SELL THESE SECURITIES AND IT IS NOT A SOLICITATION OF AN OFFER TO BUY THESE SECURITIES IN ANY JURISDICTION WHERE THE OFFER OR SALE IS NOT PERMITTED. |
| | 16 | |
| BANK 2024-BNK47 | Characteristics of the Mortgage Pool |
| ORIGINAL TERM TO MATURITY |
Original Terms to
Maturity (months) | Number of
Mortgage
Loans | Aggregate Cut-
off Date Balance | Percent by
Aggregate
Cut-off Date
Pool Balance (%) |
| 60 | 2 | $66,000,000 | 6.1% |
| 84 | 1 | 7,500,000 | 0.7 |
| 120 | 49 | 1,008,499,009 | 93.2 |
| Total: | 52 | $1,081,999,009 | 100.0% |
| Weighted Average: | 116 months | | |
| REMAINING TERM TO MATURITY |
Range of Remaining
Terms to Maturity (months) | Number of
Mortgage
Loans | Aggregate Cut-
off Date Balance | Percent by
Aggregate
Cut-off Date
Pool Balance (%) |
| 59 - 60 | 2 | $66,000,000 | 6.1% |
| 61 - 83 | 1 | 7,500,000 | 0.7 |
| 112 - 120 | 49 | 1,008,499,009 | 93.2 |
| Total: | 52 | $1,081,999,009 | 100.0% |
| Weighted Average: | 114 months | | |
| ORIGINAL AMORTIZATION TERM(1) |
Original
Amortization Terms
(months) | Number of
Mortgage
Loans | Aggregate Cut-
off Date Balance | Percent by
Aggregate
Cut-off Date
Pool Balance (%) |
| Non-Amortizing | 27 | $737,300,000 | 68.1% |
| 300 | 1 | 4,200,000 | 0.4 |
| 360 | 22 | 335,451,406 | 31.0 |
| 480 | 2 | 5,047,602 | 0.5 |
| Total: | 52 | $1,081,999,009 | 100.0% |
| Weighted Average(3): | 361 months | | |
| REMAINING AMORTIZATION TERM(2) |
Range of Remaining Amortization Terms
(months) | Number of
Mortgage
Loans | Aggregate Cut-
off Date Balance | Percent by
Aggregate
Cut-off Date
Pool Balance (%) |
| Non-Amortizing | 27 | $737,300,000 | 68.1% |
| 300 | 1 | 4,200,000 | 0.4 |
| 357 - 360 | 22 | 335,451,406 | 31.0 |
| 478 - 479 | 2 | 5,047,602 | 0.5 |
| Total: | 52 | $1,081,999,009 | 100.0% |
| Weighted Average(3): | 361 months | | |
| LOCKBOXES |
| Type of Lockbox | Number of
Mortgage
Loans | Aggregate Cut-
off Date Balance | Percent by
Aggregate
Cut-off Date
Pool Balance (%) |
| Hard/ Springing Cash Management | 23 | $715,916,342 | 66.2% |
| Hard/ In Place Cash Management | 3 | 157,996,190 | 14.6 |
| Springing | 10 | 104,150,000 | 9.6 |
| Soft/ Springing Cash Management | 2 | 62,610,163 | 5.8 |
| None | 14 | 41,326,314 | 3.8 |
| Total: | 52 | $1,081,999,009 | 100.0% |
| PREPAYMENT PROVISION SUMMARY |
| Prepayment Provision | Number of
Mortgage
Loans | Aggregate Cut-
off Date Balance | Percent by
Aggregate
Cut-off Date
Pool Balance (%) |
| Lockout / Defeasance / Open | 30 | $752,257,695 | 69.5% |
| Lockout / GRTR 1% or YM or Defeasance / Open | 3 | 159,675,000 | 14.8 |
| Lockout / GRTR 1% or YM / Open | 5 | 123,350,000 | 11.4 |
| GRTR 1% or YM / 1% / Open | 12 | 32,126,314 | 3.0 |
| GRTR 1% or YM / GRTR 1% or YM or Defeasance / Open | 1 | 12,090,000 | 1.1 |
| GRTR 1% or YM / Open | 1 | 2,500,000 | 0.2 |
| Total: | 52 | $1,081,999,009 | 100.0% |
CUT-OFF DATE LOAN-TO-VALUE RATIO |
Range of Cut-off
Date LTV Ratios (%) | Number of
Mortgage
Loans | Aggregate Cut-
off Date Balance | Percent by
Aggregate
Cut-off Date
Pool Balance (%) |
| 3.0 - 15.0 | 9 | $18,332,870 | 1.7 | % |
| 15.1 - 20.0 | 5 | 82,493,444 | 7.6 | |
| 20.1 - 30.0 | 3 | 12,750,000 | 1.2 | |
| 30.1 - 40.0 | 4 | 196,185,150 | 18.1 | |
| 40.1 - 50.0 | 8 | 371,125,000 | 34.3 | |
| 50.1 - 60.0 | 8 | 90,116,033 | 8.3 | |
| 60.1 - 70.0 | 12 | 276,151,608 | 25.5 | |
| 70.1 - 80.0 | 2 | 11,144,904 | 1.0 | |
| 80.1 - 80.6 | 1 | 23,700,000 | 2.2 | |
| Total: | 52 | $1,081,999,009 | 100.0 | % |
| Weighted Average: | 47.4% | | |
| BALLOON or ARD LOAN-TO-VALUE RATIO |
| Range of Balloon LTV Ratios (%) | Number of
Mortgage
Loans | Aggregate Cut-
off Date Balance | Percent by
Aggregate
Cut-off Date
Pool Balance (%) |
| 2.8 - 15.0 | 11 | $26,326,314 | 2.4% |
| 15.1 - 20.0 | 3 | 74,500,000 | 6.9 |
| 20.1 - 30.0 | 4 | 32,735,150 | 3.0 |
| 30.1 - 40.0 | 3 | 176,200,000 | 16.3 |
| 40.1 - 50.0 | 9 | 374,121,190 | 34.6 |
| 50.1 - 60.0 | 9 | 167,680,007 | 15.5 |
| 60.1 - 70.0 | 12 | 206,736,348 | 19.1 |
| 70.1 - 80.6 | 1 | 23,700,000 | 2.2 |
| Total: | 52 | $1,081,999,009 | 100.0% |
| Weighted Average: | 46.4% | | |
| AMORTIZATION TYPE |
| Amortization Type | Number of
Mortgage
Loans | Aggregate Cut-
off Date Balance | Percent by
Aggregate
Cut-off Date
Pool Balance (%) |
| Interest Only | 26 | $713,600,000 | 66.0 | % |
| Interest Only, Amortizing Balloon | 7 | 239,765,000 | 22.2 | |
| Amortizing Balloon | 18 | 104,934,009 | 9.7 | |
| Interest Only - ARD | 1 | 23,700,000 | 2.2 | |
| Total: | 52 | $1,081,999,009 | 100.0 | % |
| ORIGINAL TERM OF INTEREST-ONLY PERIOD FOR PARTIAL IO LOANS |
IO Terms (months) | Number of
Mortgage
Loans | Aggregate Cut-
off Date Balance | Percent by
Aggregate
Cut-off Date
Pool Balance (%) |
| 24 | 1 | $25,000,000 | 2.3% |
| 36 | 1 | 21,500,000 | 2.0 |
| 60 | 4 | 123,765,000 | 11.4 |
| 96 | 1 | 69,500,000 | 6.4 |
| Total: | 7 | $239,765,000 | 22.2% |
| Weighted Average: | 65 months | | |
| SEASONING |
| Seasoning (months) | Number of
Mortgage
Loans | Aggregate Cut-
off Date Balance | Percent by
Aggregate
Cut-off Date
Pool Balance (%) |
| 0 | 15 | $367,240,000 | 33.9% |
| 1 | 13 | 159,703,371 | 14.8 |
| 2 | 9 | 146,464,850 | 13.5 |
| 3 | 6 | 100,965,787 | 9.3 |
| 4 | 3 | 84,725,000 | 7.8 |
| 5 | 3 | 63,400,000 | 5.9 |
| 6 | 1 | 79,500,000 | 7.3 |
| 7 | 1 | 15,000,000 | 1.4 |
| 8 | 1 | 65,000,000 | 6.0 |
| Total: | 52 | $1,081,999,009 | 100.0% |
| Weighted Average: | 2 months | | |
| (1) | The original amortization term shown for any mortgage loan that is interest only for part of its term does not include the number of months in its interest only period and reflects only the number of months as of the comm encement of amortization remaining from the end of such interest-only period. |
| (2) | The remaining amortization term shown for any mortgage loan that is interest only for part of its term does not include the number of months in its interest only period and reflects only the number of months as of the commencement of amortization remaining from the end of such interest-only period. |
| (3) | Excludes the non-amortizing mortgage loans. |
| THE INFORMATION IN THIS STRUCTURAL AND COLLATERAL TERM SHEET IS NOT COMPLETE AND MAY BE AMENDED PRIOR TO THE TIME OF SALE. THIS TERM SHEET IS NOT AN OFFER TO SELL THESE SECURITIES AND IT IS NOT A SOLICITATION OF AN OFFER TO BUY THESE SECURITIES IN ANY JURISDICTION WHERE THE OFFER OR SALE IS NOT PERMITTED. |
| | 17 | |
| BANK 2024-BNK47 | Certain Terms and Conditions |
| V. | Certain Terms and Conditions |
| Interest Entitlements: | The interest entitlement of each Class of Certificates (other than the Class V and R Certificates) on each Distribution Date generally will be the interest accrued during the related Interest Accrual Period on the related Certificate Balance or Notional Amount at the related pass-through rate, net of any prepayment interest shortfalls allocated to that Class for such Distribution Date as described below. If prepayment interest shortfalls arise from voluntary prepayments (without the applicable Master Servicer’s consent) on particular non-specially serviced loans during any collection period, the applicable Master Servicer is required to make a compensating interest payment to offset those shortfalls, generally up to an amount equal to the portion of its master servicing fees that accrue at 0.25 basis points per annum. The remaining amount of prepayment interest shortfalls will be allocated to reduce the interest entitlement on all Classes of Certificates that are entitled to interest, on a pro rata basis, based on their respective amounts of accrued interest for the related Distribution Date. If a Class receives less than the entirety of its interest entitlement on any Distribution Date, then the shortfall (excluding any shortfall due to prepayment interest shortfalls), together with interest thereon, will be added to its interest entitlement for the next succeeding Distribution Date. |
| Principal Distribution Amount: | The Principal Distribution Amount for each Distribution Date generally will be the aggregate amount of principal received or advanced in respect of the mortgage loans, net of any non-recoverable advances and interest thereon and workout-delayed reimbursement amounts that are reimbursed to a Master Servicer, a Special Servicer or the Trustee during the related collection period. Non-recoverable advances and interest thereon are reimbursable from principal collections and advances before reimbursement from other amounts. Workout-delayed reimbursement amounts are reimbursable from principal collections. |
| Subordination, Allocation of Losses and Certain Expenses: | The chart below describes the manner in which the payment rights of certain Classes of Certificates will be senior or subordinate, as the case may be, to the payment rights of other Classes of Certificates. The chart also shows the corresponding entitlement to receive principal and/or interest of certain Classes of Certificates (other than excess interest that accrues on each mortgage loan that has an anticipated repayment date) on any distribution date in descending order. It also shows the manner in which losses are allocated to certain Classes of Certificates in ascending order (beginning with the horizontal risk retention certificates, and other than the Class V and Class R Certificates) to reduce the balance of each such Class to zero; provided that no principal payments or mortgage loan losses will be allocated to the Class X-A, X-B, or R Certificates, although principal payments and losses may reduce the Notional Amounts of the Class X-A and X-B Certificates, and, therefore, the amount of interest they accrue. |
| |  |
| | (1) The Class X-A and X-B Certificates are interest-only certificates. |
| Distributions: | On each Distribution Date, funds available for distribution from the mortgage loans, net of specified trust fees, expenses and reimbursements will generally be distributed in the following amounts and order of priority (in each case to the extent of remaining available funds): |
| | 1. Class A-1, A-2, A-3, A-SB, A-4, A-5, X-A and X-B Certificates: To interest on the Class A-1, A-2, A-3, A-SB, A-4, A-5, X-A and X-B Certificates, pro rata, according to their respective interest entitlements. |
| THE INFORMATION IN THIS STRUCTURAL AND COLLATERAL TERM SHEET IS NOT COMPLETE AND MAY BE AMENDED PRIOR TO THE TIME OF SALE. THIS TERM SHEET IS NOT AN OFFER TO SELL THESE SECURITIES AND IT IS NOT A SOLICITATION OF AN OFFER TO BUY THESE SECURITIES IN ANY JURISDICTION WHERE THE OFFER OR SALE IS NOT PERMITTED. |
| | 18 | |
| BANK 2024-BNK47 | Certain Terms and Conditions |
| | 2. Class A-1, A-2, A-3, A-SB, A-4 and A-5 Certificates: To principal on the Class A-1, A-2, A-3, A-SB, A-4 and A-5 Certificates in the following amounts and order of priority: (i) first, to principal on the Class A-SB Certificates, in an amount up to the Principal Distribution Amount for such Distribution Date until their Certificate Balance is reduced to the Class A-SB Planned Principal Balance for such Distribution Date; (ii) second, to principal on the Class A-1 Certificates until their Certificate Balance is reduced to zero, up to the remainder of the Principal Distribution Amount for such Distribution Date; (iii) third, to principal on the Class A-2 Certificates until their Certificate Balance is reduced to zero, up to the remainder of the Principal Distribution Amount for such Distribution Date; (iv) fourth, to principal on the Class A-3 Certificates until their Certificate Balance is reduced to zero, up to the remainder of the Principal Distribution Amount for such Distribution Date; (v) fifth, to principal on the Class A-4 Certificates until their Certificate Balance is reduced to zero, up to the remainder of the Principal Distribution Amount for such Distribution Date; (vi) sixth, to principal on the Class A-5 Certificates until their Certificate Balance is reduced to zero, up to the remainder of the Principal Distribution Amount for such Distribution Date; and (vii) seventh, to principal on the Class A-SB Certificates until their Certificate Balance is reduced to zero, up to the remainder of the Principal Distribution Amount for such Distribution Date. However, if the Certificate Balance of each and every Class of Principal Balance Certificates, other than the Class A-1, A-2, A-3, A-SB, A-4 and A-5 Certificates, has been reduced to zero as a result of the allocation of Mortgage Loan losses and expenses and any of the Class A-1, A-2, A-3, A-SB, A-4 and A-5 Certificates remains outstanding, then the Principal Distribution Amount will be distributed to the Class A-1, A-2, A-3, A-SB, A-4 and A-5 Certificates, pro rata, based on their respective outstanding Certificate Balances, until their Certificate Balances have been reduced to zero. |
| | 3. Class A-1, A-2, A-3, A-SB, A-4 and A-5 Certificates: To reimburse the holders of the Class A-1, A-2, A-3, A-SB, A-4 and A-5 Certificates, pro rata, on the basis of previously allocated unreimbursed losses, for any previously unreimbursed losses (plus interest thereon) on the mortgage loans that were previously allocated in reduction of the Certificate Balances of such Classes. |
| | 4. Class A-S Certificates: To make distributions on the Class A-S Certificates as follows: (a) first, to interest on the Class A-S Certificates in the amount of the interest entitlement for that Class; (b) next, to the extent of the portion of the Principal Distribution Amount remaining after distributions in respect of principal to each Class with a higher distribution priority (in this case, the Class A-1, A-2, A-3, A-SB, A-4 and A-5 Certificates), to principal on the Class A-S Certificates until their Certificate Balance is reduced to zero; and (c) next, to reimburse the holders of the Class A-S Certificates for any previously unreimbursed losses (plus interest thereon) on the mortgage loans that were previously allocated to that Class in reduction of their Certificate Balance. 5. Class B Certificates: To make distributions on the Class B Certificates as follows: (a) first, to interest on the Class B Certificates in the amount of the interest entitlement for that Class; (b) next, to the extent of the portion of the Principal Distribution Amount remaining after distributions in respect of principal to each Class with a higher distribution priority (in this case, the Class A-1, A-2, A-3, A-SB, A-4, A-5 and A-S Certificates), to principal on the Class B Certificates until their Certificate Balance is reduced to zero; and (c) next, to reimburse the holders of the Class B Certificates for any previously unreimbursed losses (plus interest thereon) on the mortgage loans that were previously allocated to that Class in reduction of their Certificate Balance. 6. Class C Certificates: To make distributions on the Class C Certificates as follows: (a) first, to interest on the Class C Certificates in the amount of the interest entitlement for that Class; (b) next, to the extent of the portion of the Principal Distribution Amount remaining after distributions in respect of principal to each Class with a higher distribution priority (in this case, the Class A-1, A-2, A-3, A-SB, A-4, A-5, A-S and B Certificates), to principal on the Class C Certificates until their Certificate Balance is reduced to zero; and (c) next, to reimburse the holders of the Class C Certificates for any previously unreimbursed losses (plus interest thereon) on the mortgage loans that were previously allocated to that Class in reduction of their Certificate Balance. 7. After the Class A-1, A-2, A-3, A-SB, A-4, A-5, A-S, B and C Certificates are paid all amounts to which they are entitled, the remaining funds available for distribution will be used to pay interest, principal and loss reimbursement amounts on the Class D-RR, E-RR, F-RR, G-RR, J-RR and K-RR Certificates sequentially in that order in a manner analogous to the Class C Certificates. |
| THE INFORMATION IN THIS STRUCTURAL AND COLLATERAL TERM SHEET IS NOT COMPLETE AND MAY BE AMENDED PRIOR TO THE TIME OF SALE. THIS TERM SHEET IS NOT AN OFFER TO SELL THESE SECURITIES AND IT IS NOT A SOLICITATION OF AN OFFER TO BUY THESE SECURITIES IN ANY JURISDICTION WHERE THE OFFER OR SALE IS NOT PERMITTED. |
| | 19 | |
| BANK 2024-BNK47 | Certain Terms and Conditions |
| Allocation of Yield Maintenance Charges and Prepayment Premiums: | If any yield maintenance charge or prepayment premium is collected during any particular collection period with respect to any mortgage loan, then on the Distribution Date corresponding to that collection period, the Certificate Administrator will pay that yield maintenance charge or prepayment premium (net of liquidation fees payable therefrom) in the following manner: (1) to each of the Class A-1, A-2, A-3, A-SB, A-4, A-5, A-S, B and C Certificates, the product of (a) the yield maintenance charge or prepayment premium, (b) the related Base Interest Fraction (as defined in the Preliminary Prospectus) for such class and the applicable principal prepayment, and (c) a fraction, the numerator of which is equal to the amount of principal distributed to such class for that Distribution Date, and the denominator of which is the total amount of principal distributed to the Class A-1, A-2, A-3, A-SB, A-4, A-5, A-S, B, C, D-RR, E-RR, F-RR, G-RR, J-RR and K-RR Certificates, (2) to the Class X-A Certificates, the excess, if any, of (a) the product of (i) such yield maintenance charge or prepayment premium and (ii) a fraction, the numerator of which is equal to the total amount of principal distributed to the Class A-1, A-2, A-3, A-SB, A-4 and A-5 Certificates and the denominator of which is the total amount of principal distributed to the Class A-1, A-2, A-3, A-SB, A-4, A-5, A-S, B, C, D-RR, E-RR, F-RR, G-RR, J-RR and K-RR Certificates and over (b) the total amount of such yield maintenance charge or prepayment premium distributed to the Class A-1, A-2, A-3, A-SB, A-4 and A-5 Certificates as described above; and (3) to the Class X-B Certificates, any remaining portion of such yield maintenance charge or prepayment premium not distributed as described above; provided, however, that after the notional amounts of the Class X-A and X-B Certificates and the Certificate Balances of the Class A-1, A-2, A-3, A-SB, A-4, A-5, A-S, B and C Certificates have been reduced to zero, all prepayment premiums and yield maintenance charges with respect to the mortgage loans will be allocated among the holders of the Class D-RR, E-RR, F-RR, G-RR, J-RR and K-RR Certificates as provided in the BANK 2024-BNK47 pooling and servicing agreement. No prepayment premiums or yield maintenance charges will be distributed to the holders of the Class R Certificates. For a description of when prepayment premiums and yield maintenance charges are generally required on the mortgage loans, see Annex A-1 to the Preliminary Prospectus. See also “Risk Factors—Risks Relating to the Mortgage Loans—Risks Relating to Enforceability of Yield Maintenance Charges, Prepayment Premiums or Defeasance Provisions” and “Risk Factors—Other Risks Relating to the Certificates—Your Yield May Be Affected by Defaults, Prepayments and Other Factors” in the Preliminary Prospectus. Prepayment premiums and yield maintenance charges will be distributed on each Distribution Date only to the extent they are actually received on the mortgage loans as of the related Determination Date. |
| Realized Losses: | The Certificate Balances of the Class A-1, A-2, A-3, A-SB, A-4, A-5, A-S, B, C, D-RR, E-RR, F-RR, G-RR, J-RR and K-RR Certificates will be reduced without distribution on any Distribution Date as a write-off to the extent of any losses realized on the mortgage loans allocated to such Class on such Distribution Date. Such losses will be applied in the following order, in each case until the related Certificate Balance is reduced to zero: first, to the Class K-RR Certficates; second, to the Class J-RR Certificates; third, to the Class G-RR Certificates; fourth, to the Class F-RR Certificates; fifth, to the Class E-RR Certificates; sixth, to the Class D-RR Certificates; seventh, to the Class C Certificates; eighth, to the Class B Certificates; ninth, to the Class A-S Certificates; and, finally, pro rata, to the Class A-1, A-2, A-3, A-SB, A-4 and A-5 Certificates based on their outstanding Certificate Balances. The Notional Amount of the Class X-A Certificates will be reduced by the amount of all losses that are allocated to the Class A-1, A-2, A-3, A-SB, A-4 or A-5 Certificates as write-offs in reduction of their Certificate Balances. The Notional Amount of the Class X-B Certificates will be reduced by the amount of all losses that are allocated to the Class A-S, B or C Certificates as write-offs in reduction of their Certificate Balances. |
| P&I Advances: | Each Master Servicer or, any Master Servicer fails to do so, the Trustee, will be obligated to advance delinquent debt service payments with respect to the mortgage loans it services (other than balloon payments, excess interest and default interest) and assumed debt service payments on mortgage loans with delinquent balloon payments (excluding any related companion loan), except to the extent any such advance is deemed non-recoverable from collections on the related mortgage loan. In addition, if an Appraisal Reduction Amount exists for a given mortgage loan, the interest portion of any P&I advance for such mortgage loan will be reduced, which will have the effect of reducing the amount of interest available for distribution to the Certificates, which with respect to the Certificates (other than the Class V and R Certificates) will be applied in |
| THE INFORMATION IN THIS STRUCTURAL AND COLLATERAL TERM SHEET IS NOT COMPLETE AND MAY BE AMENDED PRIOR TO THE TIME OF SALE. THIS TERM SHEET IS NOT AN OFFER TO SELL THESE SECURITIES AND IT IS NOT A SOLICITATION OF AN OFFER TO BUY THESE SECURITIES IN ANY JURISDICTION WHERE THE OFFER OR SALE IS NOT PERMITTED. |
| | 20 | |
| BANK 2024-BNK47 | Certain Terms and Conditions |
| reverse alphabetical order of their Class designations (except that interest payments on the Class A-1, A-2, A-3, A-SB, A-4, A-5, X-A and X-B Certificates would be affected on a pari passu basis). No Special Servicer will be required to make any P&I Advance or any recoverability determination with respect to any P&I Advance. |
| Servicing Advances: | Each Master Servicer or, if any Master Servicer fails to do so, the Trustee, will be obligated to make servicing advances, including the payment of delinquent property taxes, insurance premiums and ground rent, except to the extent that those advances are deemed non-recoverable from collections on the related mortgage loan. The related Master Servicer or the Trustee, as applicable, will have the primary obligation to make any required servicing advances with respect to any serviced whole loan. With respect to any non-serviced whole loan, the master servicer or trustee, as applicable, under the related lead securitization servicing agreement will have the primary obligation to make any required servicing advances with respect to such non-serviced whole loan. |
Appraisal Reduction Amounts and Collateral Deficiency Amounts: | An “Appraisal Reduction Amount” generally will be created in the amount, if any, by which the principal balance of a required appraisal loan (which is a mortgage loan (other than a non-serviced mortgage loan) with respect to which certain defaults, modifications or insolvency events have occurred as further described in the Preliminary Prospectus) plus other amounts overdue or advanced in connection with such mortgage loan exceeds 90% of the appraised value of the related mortgaged property plus certain escrows and reserves (including letters of credit) held with respect to the mortgage loan. With respect to any serviced whole loan, any Appraisal Reduction Amount will be allocated first to the related subordinate companion loan(s), if any, and then, pro rata, to the related mortgage loan and the related pari passu companion loan(s). With respect to any non-serviced mortgage loan, appraisal reduction amounts are expected to be calculated in a similar manner under the related non-serviced pooling and servicing agreement. A mortgage loan will cease to be a required appraisal loan when the same has ceased to be a specially serviced loan (if applicable), has been brought current for at least three consecutive months and no other circumstances exist that would cause such mortgage loan to be a required appraisal loan. A “Collateral Deficiency Amount” will exist with respect to any mortgage loan that is modified into an AB loan structure and remains a corrected mortgage loan and will generally equal the excess of (i) the stated principal balance of such AB modified loan (taking into account the related junior note(s) and any pari passu notes included therein), over (ii) the sum of (in the case of a whole loan, solely to the extent allocable to the subject mortgage loan) (x) the most recent appraised value of the related mortgaged property plus (y) solely to the extent not reflected or taken into account in such appraised value (or in the calculation of any related Appraisal Reduction Amount) and to the extent on deposit with, or otherwise under the control of, the lender as of the date of such determination, any capital or additional collateral contributed by the related borrower at the time the mortgage loan (and as part of the modification thereto) became an AB modified loan plus (z) any other escrows or reserves (in addition to any amounts set forth in the immediately preceding clause (y) and solely to the extent not reflected or taken into account in the calculation of any related Appraisal Reduction Amount) held by the lender with respect to the mortgage loan as of the date of such determination. A “Cumulative Appraisal Reduction Amount” with respect to any mortgage loan will be the sum of any Appraisal Reduction Amount and any Collateral Deficiency Amount. Appraisal Reduction Amounts will affect the amount of debt service advances in respect of the related mortgage loan. Additionally, Cumulative Appraisal Reduction Amounts will be taken into account in the determination of the identity of the Class whose majority constitutes the “controlling class certificateholder” and is entitled to appoint the directing certificateholder. |
Clean-Up Call and Exchange Termination: | On each Distribution Date occurring after the aggregate unpaid principal balance of the pool of mortgage loans is less than 1.0% of the principal balance of the mortgage loans as of the cut-off date, certain specified persons will have the option to purchase all of the remaining mortgage loans (and the trust’s interest in all property acquired through exercise of remedies in respect of any mortgage loan) at the price specified in the Preliminary Prospectus. Exercise of the option will terminate the trust and retire the then-outstanding Certificates. If the aggregate Certificate Balances of each of the Class A-1, A-2, A-3, A-SB, A-4, A-5, A-S, B and C Certificates have been reduced to zero, the trust may also be terminated in connection with an exchange of all the then-outstanding Certificates (other than the Class V and R Certificates) for the mortgage loans and REO properties then remaining in the issuing entity, subject to payment of a price specified in the Preliminary Prospectus, but all of the holders of those outstanding Classes of Certificates (other than the Class V and Class R Certificates) would have to voluntarily participate in the exchange. |
| THE INFORMATION IN THIS STRUCTURAL AND COLLATERAL TERM SHEET IS NOT COMPLETE AND MAY BE AMENDED PRIOR TO THE TIME OF SALE. THIS TERM SHEET IS NOT AN OFFER TO SELL THESE SECURITIES AND IT IS NOT A SOLICITATION OF AN OFFER TO BUY THESE SECURITIES IN ANY JURISDICTION WHERE THE OFFER OR SALE IS NOT PERMITTED. |
| | 21 | |
| BANK 2024-BNK47 | Certain Terms and Conditions |
| Liquidation Loan Waterfall: | Following the liquidation of any mortgage loan or mortgaged property, the net liquidation proceeds generally will be applied (after reimbursement of advances and certain trust fund expenses), first, as a recovery of accrued interest, other than delinquent interest that was not advanced as a result of Appraisal Reduction Amounts, second, as a recovery of principal until all principal has been recovered, and then as a recovery of delinquent interest that was not advanced as a result of Appraisal Reduction Amounts. Please see “Description of the Certificates—Distributions—Application Priority of Mortgage Loan Collections or Whole Loan Collections” in the Preliminary Prospectus. |
| Control Eligible Certificates: | The Class J-RR and K-RR Certificates. |
| Directing Certificateholder/ Controlling Class: | A directing certificateholder may be appointed by the “controlling class certificateholder”, which will be the holder(s) of a majority of the Controlling Class. The “Controlling Class” will be, as of any time of determination, the most subordinate Class of Control Eligible Certificates then-outstanding that has an aggregate Certificate Balance (as notionally reduced by any Cumulative Appraisal Reduction Amounts allocable to such Class) at least equal to 25% of the initial Certificate Balance of that Class; provided, however, that if at any time the Certificate Balances of the Certificates other than the Control Eligible Certificates have been reduced to zero as a result of principal payments on the Mortgage Loans, then the Controlling Class will be the most subordinate Class of Control Eligible Certificates that has a Certificate Balance greater than zero without regard to any Cumulative Appraisal Reduction Amounts. The Controlling Class as of the Closing Date will be the Class K-RR Certificates. |
Control and Consultation/
Replacement of a Special Servicer by Directing Certificateholder: | The rights of various parties to replace the applicable Special Servicer and approve or consult with respect to major actions of such Special Servicer will vary according to defined periods. A “Control Termination Event” will occur when the Class J-RR Certificates have a Certificate Balance (taking into account the application of any Cumulative Appraisal Reduction Amounts to notionally reduce the Certificate Balance of such Class) of less than 25% of the initial Certificate Balance of that Class; provided, that a Control Termination Event will not be deemed continuing in the event that the Certificate Balances of the Certificates other than the Control Eligible Certificates have been reduced to zero as a result of principal payments on the Mortgage Loans. A “Consultation Termination Event” will occur when there is no Class of Control Eligible Certificates that has a then-outstanding Certificate Balance at least equal to 25% of the initial Certificate Balance of that Class, in each case, without regard to the application of any Cumulative Appraisal Reduction Amounts; provided, however, that a Consultation Termination Event will not be deemed continuing in the event that the Certificate Balances of the Certificates other than the Control Eligible Certificates have been reduced to zero as a result of principal payments on the Mortgage Loans. If no Control Termination Event has occurred and is continuing, except with respect to the Excluded Loans (as defined below) with respect to the directing certificateholder and the Servicing Shift Whole Loan (as defined below) (i) the directing certificateholder will be entitled to grant or withhold approval of asset status reports prepared, and material servicing actions proposed, by the applicable Special Servicer, and (ii) the directing certificateholder will be entitled to terminate and replace such Special Servicer with or without cause, and appoint itself or another person as the successor special servicer. It will be a condition to such appointment that Fitch, KBRA and Moody’s (and any rating agency rating any securities backed by any pari passu companion loan(s) serviced under this transaction) confirm that the appointment would not result in a qualification, downgrade or withdrawal of any of their then-current ratings of Certificates (and any certificates backed by any pari passu companion loan(s) serviced under this transaction). If a Control Termination Event has occurred and is continuing but no Consultation Termination Event has occurred and is continuing, the applicable Special Servicer will be required to consult with the directing certificateholder (other than with respect to Excluded Loans as to such party) and the Operating Advisor in connection with asset status reports and material special servicing actions. If a Consultation Termination Event has occurred and is continuing, the applicable Special Servicer must seek to consult with the Operating Advisor in connection with asset status reports and material special servicing actions, and, in general, no directing certificateholder will be recognized or have any right to terminate such Special Servicer or approve, direct or consult with respect to servicing matters. With respect to each serviced whole loan that is not a Servicing Shift Whole Loan, the rights of the directing certificateholder described above will be subject to the consultation rights of the holders of the related pari passu companion loans. Those consultation rights will generally extend to asset status reports and material special servicing actions involving the related whole loan, |
| THE INFORMATION IN THIS STRUCTURAL AND COLLATERAL TERM SHEET IS NOT COMPLETE AND MAY BE AMENDED PRIOR TO THE TIME OF SALE. THIS TERM SHEET IS NOT AN OFFER TO SELL THESE SECURITIES AND IT IS NOT A SOLICITATION OF AN OFFER TO BUY THESE SECURITIES IN ANY JURISDICTION WHERE THE OFFER OR SALE IS NOT PERMITTED. |
| | 22 | |
| BANK 2024-BNK47 | Certain Terms and Conditions |
| will be as set forth in the related intercreditor agreement, and will be in addition to the rights of the directing certificateholder in this transaction described above. With respect to the whole loan marked with footnote (3) under “IV. Characteristics of the Mortgage Pool—B. Summary of the Whole Loans” (the “Servicing Shift Whole Loan”), prior to the date of securitization of the related controlling pari passu companion loan (such date, a “Servicing Shift Securitization Date”), the holder of the related controlling pari passu companion loan will have certain control rights regarding the servicing of the related whole loan under the BANK 2024-BNK47 pooling and servicing agreement, including the right to approve or disapprove various material servicing actions involving the related whole loan. For purposes of the servicing of any such whole loan contemplated by this paragraph, the occurrence and continuance of a Control Termination Event or Consultation Termination Event under this securitization will not limit the control or other rights of the holder of the related controlling pari passu companion loan(s). With respect to (x) each non-serviced whole loan and (y) the Servicing Shift Whole Loan after its Servicing Shift Securitization Date, the applicable servicing agreement for the related controlling pari passu companion loan(s) generally grants (or will grant) the directing certificateholder under the related securitization (or, in some cases, a controlling companion loan holder) control rights that may include the right to approve or disapprove various material servicing actions involving the related whole loan. The directing certificateholder for this securitization (so long as no Consultation Termination Event has occurred and is occurring) generally will nonetheless have the right to be consulted on a non-binding basis with respect to such actions. For purposes of the servicing of any such whole loan contemplated by this paragraph, the occurrence and continuance of a Control Termination Event or Consultation Termination Event under this securitization will not limit the control or other rights of the directing certificateholder (or equivalent) under the securitization of the related controlling pari passu companion loan(s). The control rights and consent and consultation rights described in the preceding paragraphs are subject to various limitations, conditions and exceptions as described in the Preliminary Prospectus. Notwithstanding any contrary description set forth above, in the event that, with respect to any mortgage loan, the controlling class certificateholder or the directing certificateholder is a Borrower Party, the controlling class certificateholder and the directing certificateholder will have no right to receive asset status reports or such other information as may be specified in the BANK 2024-BNK47 pooling and servicing agreement, to grant or withhold approval of, or consult with respect to, asset status reports prepared, and material servicing actions proposed, by a Special Servicer, with respect to such mortgage loan, and such mortgage loan will be referred to as an “Excluded Loan” as to such party. In addition, notwithstanding any contrary description set forth above, in the event that, with respect to any mortgage loan, a controlling class certificateholder is a Borrower Party, such controlling class certificateholder will have no right to receive asset status reports or such other information as may be specified in the BANK 2024-BNK47 pooling and servicing agreement with respect to such mortgage loan. “Borrower Party” means a borrower, a mortgagor or a manager of a mortgaged property, an Accelerated Mezzanine Loan Lender, or any Borrower Party Affiliate. “Accelerated Mezzanine Loan Lender” means a mezzanine lender under a mezzanine loan that has been accelerated or as to which foreclosure or enforcement proceedings have been commenced against the equity collateral pledged to secure such mezzanine loan. “Borrower Party Affiliate” means, with respect to a borrower, a mortgagor, a manager of a Mortgaged Property or an Accelerated Mezzanine Loan Lender, (x) any other person controlling or controlled by or under common control with such borrower, mortgagor, manager or Accelerated Mezzanine Loan Lender, as applicable, or (y) any other person owning, directly or indirectly, 25% or more of the beneficial interests in such borrower, mortgagor, manager or Accelerated Mezzanine Loan Lender. With respect to a mortgage loan secured by a residential cooperative property, a person will not be considered a “Borrower Party” solely by reason of such person holding one or more cooperative unit loans that are secured by direct equity interests in the related borrower or owning one or more residential cooperative units comprising the related mortgaged property as a result of any foreclosure, transfer in lieu of foreclosure or other exercise of remedies with respect to any such unit loan(s). |
| Replacement of a Special Servicer: | If a Control Termination Event has occurred and is continuing, any Special Servicer (other than with respect to the Servicing Shift Whole Loan) may be removed and replaced without cause upon the affirmative direction of certificate owners holding not less than 66-2/3% of a certificateholder quorum, following a proposal from certificate owners holding not less than 25% of the appraisal-reduced voting rights of all Principal Balance Certificates. The certificateholders who initiate a vote on a termination and replacement of the applicable Special Servicer without cause must cause Fitch, KBRA and Moody’s to confirm the then-current ratings of the Certificates |
| THE INFORMATION IN THIS STRUCTURAL AND COLLATERAL TERM SHEET IS NOT COMPLETE AND MAY BE AMENDED PRIOR TO THE TIME OF SALE. THIS TERM SHEET IS NOT AN OFFER TO SELL THESE SECURITIES AND IT IS NOT A SOLICITATION OF AN OFFER TO BUY THESE SECURITIES IN ANY JURISDICTION WHERE THE OFFER OR SALE IS NOT PERMITTED. |
| | 23 | |
| BANK 2024-BNK47 | Certain Terms and Conditions |
| (or decline to review the matter) and cause the payment of the fees and expenses incurred in the replacement. If no Control Termination Event has occurred and is continuing, the applicable Special Servicer (other than with respect to the Servicing Shift Whole Loan) may be replaced by the directing certificateholder, subject to Fitch, KBRA and Moody’s (and any rating agency rating any securities backed by any pari passu companion loan(s) serviced under this transaction) confirming the then-current ratings of the Certificates (and any certificates backed by any pari passu companion loans serviced under this transaction) or declining to review the matter. In addition, if at any time the Operating Advisor determines, in its sole discretion exercised in good faith, that (i) the applicable Special Servicer is not performing its duties as required under the pooling and servicing agreement in accordance with the Servicing Standard and (ii) the replacement of the applicable Special Servicer would be in the best interest of the certificateholders as a collective whole, then the Operating Advisor will have the right to recommend the replacement of such Special Servicer and will submit its formal recommendation to the Trustee and the Certificate Administrator (along with its rationale, its proposed replacement special servicer and other relevant information justifying its recommendation). The Operating Advisor’s recommendation to replace the applicable Special Servicer must be confirmed by an affirmative vote of holders of Principal Balance Certificates evidencing at least a majority of a quorum of certificateholders (which, for this purpose, is the holders of Principal Balance Certificates that (i) evidence at least 20% of the Voting Rights |
| | (taking into account the application of any cumulative appraisal reduction amounts to notionally reduce the respective Certificate Balances) of all Principal Balance Certificates on an aggregate basis, and (ii) consist of at least three certificateholders or certificate owners that are not risk retention affiliated with each other). In the event the holders of Principal Balance Certificates evidencing at least a majority of a quorum of certificateholders elect to remove and replace a Special Servicer (which requisite affirmative votes must be received within 180 days of the posting of the notice of the Operating Advisor’s recommendation to replace such Special Servicer to the Certificate Administrator’s website), the Certificate Administrator will be required to receive a Rating Agency Confirmation from each of the Rating Agencies at that time, and confirmation from the applicable rating agencies that such replacement will not result in the downgrade, withdrawal or qualification of the then-current ratings of any class of any related serviced pari passu companion loan securities. |
| Excluded Special Servicer: | In the event that, with respect to any mortgage loan, the applicable Special Servicer is a Borrower Party, the applicable Special Servicer will be required to resign as special servicer of such mortgage loan (referred to as an “excluded special servicer loan”). If no Control Termination Event has occurred and is continuing, the directing certificateholder will be entitled to appoint (and may replace with or without cause) a separate special servicer that is not a Borrower Party (referred to as an “excluded special servicer”) with respect to such excluded special servicer loan unless such excluded special servicer loan is also an excluded loan. Otherwise, upon resignation of such Special Servicer with respect to an excluded special servicer loan, the resigning Special Servicer will be required to use reasonable efforts to appoint the excluded special servicer. |
| Appraisal Remedy: | If the Class of Certificates comprising the Controlling Class loses its status as Controlling Class because of the application of an Appraisal Reduction Amount or Collateral Deficiency Amount, the holders of a majority of the voting rights of such Class may require the applicable Special Servicer to order a second appraisal for any mortgage loan in respect of which an Appraisal Reduction Amount or Collateral Deficiency Amount has been applied. The applicable Special Servicer must thereafter determine whether, based on its assessment of such second appraisal, any recalculation of the Appraisal Reduction Amount or Collateral Deficiency Amount is warranted, and if so warranted, such Special Servicer will recalculate such Appraisal Reduction Amount or Collateral Deficiency Amount. Such Class will not be able to exercise any direction, control, consent and/or similar rights of the Controlling Class unless and until reinstated as the Controlling Class through such determination; and pending such determination, the rights of the Controlling Class will be exercised by the Control Eligible Certificates, if any, that would be the Controlling Class taking into account the subject appraisal reduction amount. |
| Sale of Defaulted Assets: | There will be no “fair value” purchase option. Instead, the BANK 2024-BNK47 pooling and servicing agreement will authorize the applicable Special Servicer to sell defaulted mortgage loans serviced by such Special Servicer to the highest bidder in a manner generally similar to sales of REO properties. The sale of a defaulted loan (other than a non-serviced whole loan) for less than par plus accrued interest and certain other fees and expenses owed on the loan will be subject to consent or consultation rights of the directing certificateholder and/or Operating Advisor, as described in the Preliminary Prospectus. Generally speaking, the holder of a pari passu companion loan will have consent and/or consultation rights, as described in the Preliminary Prospectus. If the subject |
| THE INFORMATION IN THIS STRUCTURAL AND COLLATERAL TERM SHEET IS NOT COMPLETE AND MAY BE AMENDED PRIOR TO THE TIME OF SALE. THIS TERM SHEET IS NOT AN OFFER TO SELL THESE SECURITIES AND IT IS NOT A SOLICITATION OF AN OFFER TO BUY THESE SECURITIES IN ANY JURISDICTION WHERE THE OFFER OR SALE IS NOT PERMITTED. |
| | 24 | |
| BANK 2024-BNK47 | Certain Terms and Conditions |
| whole loan includes one or more subordinate companion loans, those subordinate companion loans may be included in such sale as well. With respect to (x) each serviced whole loan and (y) the Servicing Shift Whole Loan prior to its Servicing Shift Securitization Date, if such whole loan becomes a defaulted loan under the BANK 2024-BNK47 pooling and servicing agreement, the applicable Special Servicer will generally be required to sell both the mortgage loan and the related pari passu companion loan(s) as a single whole loan. If the subject whole loan includes one or more subordinate companion loans, those subordinate companion loans may be included in such sale as well. With respect to (x) each non-serviced whole loan and (y) the Servicing Shift Whole Loan after its Servicing Shift Securitization Date, the applicable servicing agreement governing the servicing of such whole loan generally will provide that, if the related pari passu companion loan(s) serviced under such agreement become a defaulted loan under such servicing agreement, then the related special servicer may offer to sell to any person (or may offer to purchase) for cash such whole loan during such time as such applicable pari passu companion loan(s) constitutes a defaulted loan under such servicing agreement. Generally speaking, in connection with any such sale, the related special servicer is required to sell both the mortgage loan and the related pari passu companion loan(s) as a whole loan. The directing certificateholder for this securitization generally will have consent and/or consultation rights as the holder of an interest in the related mortgage loan, as described in the Preliminary Prospectus. If the subject whole loan includes one or more subordinate companion loans, those subordinate companion loans may be included in such sale as well. The procedures for the sale of any whole loan that becomes a defaulted whole loan, and any associated consultation rights, are subject to various limitations, conditions and exceptions as described in the Preliminary Prospectus. |
| “As-Is” Appraisals: | Appraisals must be conducted on an “as-is” basis, and must be no more than 12 months old, for purposes of determining Appraisal Reduction Amounts and market value in connection with REO sales. Required appraisals may consist of updates of prior appraisals. Internal valuations by the applicable Special Servicer are permitted if the principal balance of a mortgage loan is less than $2,000,000. |
| Operating Advisor: | The Operating Advisor will have certain review and consultation rights relating to the performance of each applicable Special Servicer and with respect to its actions taken in connection with the resolution and/or liquidation of specially serviced loans. With respect to each mortgage loan (other than a non-serviced mortgage loan) or serviced whole loan, the Operating Advisor will be responsible for: ● reviewing the actions of the applicable Special Servicer with respect to any specially serviced loan; ● reviewing (i) all reports by the applicable Special Servicer made available to Privileged Persons on the Certificate Administrator’s website that are relevant to the Operating Advisor’s obligations under the pooling and servicing agreement and (ii) each Asset Status Report (as defined in the Preliminary Prospectus) (after the occurrence and during the continuance of an Operating Advisor Consultation Event (as defined below)) and Final Asset Status Report (as defined in the Preliminary Prospectus); ● recalculating and reviewing for accuracy and consistency with the BANK 2024-BNK47 pooling and servicing agreement the mathematical calculations by the applicable special servicer and the corresponding application of the non-discretionary portion of the applicable formulas required to be utilized in connection with Appraisal Reduction Amounts, Collateral Deficiency Amounts and net present value calculations used in the applicable Special Servicer’s determination of what course of action to take in connection with the workout or liquidation of a specially serviced loan; and |
| THE INFORMATION IN THIS STRUCTURAL AND COLLATERAL TERM SHEET IS NOT COMPLETE AND MAY BE AMENDED PRIOR TO THE TIME OF SALE. THIS TERM SHEET IS NOT AN OFFER TO SELL THESE SECURITIES AND IT IS NOT A SOLICITATION OF AN OFFER TO BUY THESE SECURITIES IN ANY JURISDICTION WHERE THE OFFER OR SALE IS NOT PERMITTED. |
| | 25 | |
| | ● preparing an annual report (if any mortgage loan (other than any non-serviced mortgage loan) or serviced whole loan was a specially serviced loan at any time during the prior calendar year or an Operating Advisor Consultation Event (as defined below) occurred during the prior calendar year) that sets forth whether the Operating Advisor believes, in its sole discretion exercised in good faith, that the applicable Special Servicer is operating in compliance with the Servicing Standard with respect to its performance of its duties under the pooling and servicing agreement with respect to specially serviced loans (and, after the occurrence and continuance of an Operating Advisor Consultation Event (as defined below), with respect to major decisions on non-specially serviced loans) during the prior calendar year on a “asset-level basis”. The Operating Advisor will identify (1) which, if any, standards the Operating Advisor believes, in its sole discretion exercised in good faith, the applicable Special Servicer has failed to comply with and (2) any material deviations from the applicable Special Servicer’s obligations under the pooling and servicing agreement with respect to the resolution or liquidation of any specially serviced loan or REO property (other than with respect to any REO property related to any non-serviced mortgage loan). In preparing any Operating Advisor Annual Report (as defined in the Preliminary Prospectus), the Operating Advisor will not be required to report on instances of non-compliance with, or deviations from, the Servicing Standard or the applicable Special Servicer’s obligations under the pooling and servicing agreement that the Operating Advisor determines, in its sole discretion exercised in good faith, to be immaterial. With respect to each mortgage loan (other than any non-serviced mortgage loan) or serviced whole loan, after the Operating Advisor has received notice that an Operating Advisor Consultation Event (as defined below) has occurred and is continuing, in addition to the duties described above, the Operating Advisor will be required to perform the following additional duties: ● to consult (on a non-binding basis) with the applicable Special Servicer in respect of asset status reports and ● to consult (on a non-binding basis) with the applicable Special Servicer with respect to “major decisions” processed by such Special Servicer. An “Operating Advisor Consultation Event” will occur when the Certificate Balances of the Class D-RR, E-RR, F-RR, G-RR, J-RR and K-RR Certificates in the aggregate (taking into account the application of any Cumulative Appraisal Reduction Amounts to notionally reduce the Certificate Balances of such Classes) is 25% or less of the initial Certificate Balances of such Classes in the aggregate. |
| Asset Representations Reviewer: | The Asset Representations Reviewer will be required to review certain delinquent mortgage loans after a specified delinquency threshold has been exceeded (an “Asset Review Trigger”) and the required percentage of certificateholders vote to direct a review of such delinquent loans. An Asset Review Trigger will occur when either (1) mortgage loans with an aggregate outstanding principal balance of 25.0% or more of the aggregate outstanding principal balance of all of the mortgage loans (including any REO loans (or a portion of any REO loan in the case of a whole loan)) held by the issuing entity as of the end of the applicable collection period are delinquent loans or (2)(A) prior to and including the second anniversary of the Closing Date, at least 10 mortgage loans are delinquent loans as of the end of the applicable collection period and the outstanding principal balance of such delinquent loans in the aggregate constitutes at least 15.0% of the aggregate outstanding principal balance of all of the mortgage loans (including any REO loans (or a portion of any REO loan in the case of a whole loan)) held by the issuing entity as of the end of the applicable collection period, or (B) after the second anniversary of the Closing Date, at least 15 mortgage loans are delinquent loans as of the end of the applicable collection period and the outstanding principal balance of such delinquent loans in the aggregate constitutes at least 20.0% of the aggregate outstanding principal balance of all of the mortgage loans (including any REO loans (or a portion of any REO loan in the case of a whole loan)) held by the issuing entity as of the end of the applicable collection period. See “Pooling and Servicing Agreement—The Asset Representations Reviewer—Asset Review” in the Preliminary Prospectus. The Asset Representations Reviewer may be terminated and replaced without cause. Upon (i) the written direction of certificateholders evidencing not less than 25% of the voting rights (without regard to the application of any Cumulative Appraisal Reduction Amounts) requesting a vote to terminate and replace the Asset Representations Reviewer with a proposed successor Asset Representations Reviewer that is an eligible asset representations reviewer, and (ii) payment by such holders to the Certificate Administrator of the reasonable fees and expenses to be incurred by the Certificate Administrator in connection with administering such vote, the Certificate Administrator will promptly provide notice to all certificateholders and the Asset Representations Reviewer of such request by posting such notice on its internet website, and by mailing such notice to all certificateholders and the Asset Representations Reviewer. Upon the |
| THE INFORMATION IN THIS STRUCTURAL AND COLLATERAL TERM SHEET IS NOT COMPLETE AND MAY BE AMENDED PRIOR TO THE TIME OF SALE. THIS TERM SHEET IS NOT AN OFFER TO SELL THESE SECURITIES AND IT IS NOT A SOLICITATION OF AN OFFER TO BUY THESE SECURITIES IN ANY JURISDICTION WHERE THE OFFER OR SALE IS NOT PERMITTED. |
| | 26 | |
| BANK 2024-BNK47 | Certain Terms and Conditions |
| written direction of certificateholders evidencing at least 75% of a certificateholder quorum (without regard to the application of any Cumulative Appraisal Reduction Amounts), the Trustee will terminate all of the rights and obligations of the Asset Representations Reviewer under the BANK 2024-BNK47 pooling and servicing agreement by written notice to the Asset Representations Reviewer, and the proposed successor Asset Representations Reviewer will be appointed. See “Pooling and Servicing Agreement—The Asset Representations Reviewer” in the Preliminary Prospectus. |
| Dispute Resolution Provisions: | The mortgage loan sellers will be subject to the dispute resolution provisions set forth in the BANK 2024-BNK47 pooling and servicing agreement to the extent those provisions are triggered with respect to any mortgage loan sold to the depositor by a mortgage loan seller and such mortgage loan seller will be obligated under the related mortgage loan purchase agreement to comply with all applicable provisions and to take part in any mediation or arbitration proceedings that may result. Generally, in the event that a Repurchase Request (as defined in the Preliminary Prospectus) is not “Resolved” (as defined below) within 180 days after the related mortgage loan seller receives such Repurchase Request, then the enforcing servicer will be required to send a notice to the “Initial Requesting Certificateholder” (if any) and the Certificate Administrator indicating the enforcing servicer’s intended course of action with respect to the Repurchase Request. If (a) the enforcing servicer’s intended course of action with respect to the Repurchase Request does not involve pursuing further action to exercise rights against the related mortgage loan seller with respect to the Repurchase Request and the Initial Requesting Certificateholder, if any, or any other certificateholder or certificate owner wishes to exercise its right to refer the matter to mediation (including non-binding arbitration) or arbitration, or (b) the enforcing servicer’s intended course of action is to pursue further action to exercise rights against the related mortgage loan seller with respect to the Repurchase Request but the Initial Requesting Certificateholder, if any, or any other certificateholder or certificate owner does not agree with the dispute resolution method selected by the enforcing servicer, then the Initial Requesting Certificateholder, if any, or such other certificateholder or certificate owner may deliver a written notice to the applicable Special Servicer indicating its intent to exercise its right to refer the matter to either mediation or arbitration. “Resolved” means, with respect to a Repurchase Request, (i) that the related Material Defect has been cured, (ii) the related mortgage loan has been repurchased in accordance with the related mortgage loan purchase agreement, (iii) a mortgage loan has been substituted for the related mortgage loan in accordance with the related mortgage loan purchase agreement, (iv) the applicable mortgage loan seller has made a Loss of Value Payment (as defined in the Preliminary Prospectus), (v) a contractually binding agreement is entered into between the enforcing servicer, on behalf of the issuing entity, and the related mortgage loan seller that settles the related mortgage loan seller’s obligations under the related mortgage loan purchase agreement, or (vi) the related mortgage loan is no longer property of the issuing entity as a result of a sale or other disposition in accordance with the BANK 2024-BNK47 pooling and servicing agreement. See “Pooling and Servicing Agreement—Dispute Resolution Provisions” in the Preliminary Prospectus. |
| Investor Communications: | The Certificate Administrator is required to include on any Form 10–D any request received from a certificateholder to communicate with other certificateholders related to certificateholders exercising their rights under the terms of the BANK 2024-BNK47 pooling and servicing agreement. Any certificateholder wishing to communicate with other certificateholders regarding the exercise of its rights under the terms of the BANK 2024-BNK47 pooling and servicing agreement will be able to deliver a written request signed by an authorized representative of the requesting investor to the Certificate Administrator. |
| Certain Fee Offsets: | If a workout fee is earned by the applicable Special Servicer following a loan default with respect to any mortgage loan that it services, then certain limitations will apply based on modification fees paid by the borrower. The modification fee generally must not exceed 1% of the principal balance of the loan as modified in any 12-month period. In addition, if the loan re-defaults, any subsequent workout fee on that loan must be reduced by a portion of the modification fees paid by the borrower in the previous 12 months. Likewise, liquidation fees collected in connection with a liquidation or partial liquidation of a mortgage loan must be reduced by a portion of the modification fees paid by the borrower in the previous 12 months. |
| Deal Website: | The Certificate Administrator will be required to maintain a deal website, which will include, among other items: (a) summaries of asset status reports prepared by the applicable Special Servicer, (b) inspection reports, (c) appraisals, (d) various “special notices” described in the Preliminary Prospectus, (e) the “Investor Q&A Forum”, (f) a voluntary “Investor Registry” and (g) the “Risk Retention Special Notices” tab. Investors may access the deal website following execution of a certification and confidentiality agreement. |
| THE INFORMATION IN THIS STRUCTURAL AND COLLATERAL TERM SHEET IS NOT COMPLETE AND MAY BE AMENDED PRIOR TO THE TIME OF SALE. THIS TERM SHEET IS NOT AN OFFER TO SELL THESE SECURITIES AND IT IS NOT A SOLICITATION OF AN OFFER TO BUY THESE SECURITIES IN ANY JURISDICTION WHERE THE OFFER OR SALE IS NOT PERMITTED. |
| | 27 | |
| BANK 2024-BNK47 | Certain Terms and Conditions |
| Initial Controlling Class Certificateholder: | It is expected that RREF V – D AIV RR H, LLC or its affiliate will be the initial controlling class certificateholder. |
| Whole Loans: | Each of the mortgaged properties identified above under “IV. Characteristics of the Mortgage Pool—B. Summary of the Whole Loans” secures both a mortgage loan to be included in the trust fund and one or more other mortgage loans that will not be included in the trust fund, each of which will be pari passu or subordinate in right of payment with the mortgage loan included in the trust fund. We refer to each such group of mortgage loans as a “whole loan”. Such “—Summary of the Whole Loans” section includes further information regarding the various notes in each whole loan, the holders of such notes, the lead servicing agreement for each such whole loan, and the applicable master servicer and applicable special servicer under such lead servicing agreement. |
| THE INFORMATION IN THIS STRUCTURAL AND COLLATERAL TERM SHEET IS NOT COMPLETE AND MAY BE AMENDED PRIOR TO THE TIME OF SALE. THIS TERM SHEET IS NOT AN OFFER TO SELL THESE SECURITIES AND IT IS NOT A SOLICITATION OF AN OFFER TO BUY THESE SECURITIES IN ANY JURISDICTION WHERE THE OFFER OR SALE IS NOT PERMITTED. |
| | 28 | |
| Retail – Super Regional Mall | Loan #1 | Cut-off Date Balance: | | $100,000,000 |
| 4663 River City Drive | St. Johns Town Center | Cut-off Date LTV: | | 47.8% |
| Jacksonville, FL 32246 | | U/W NCF DSCR: | | 2.09x |
| | | U/W NOI Debt Yield: | | 13.3% |
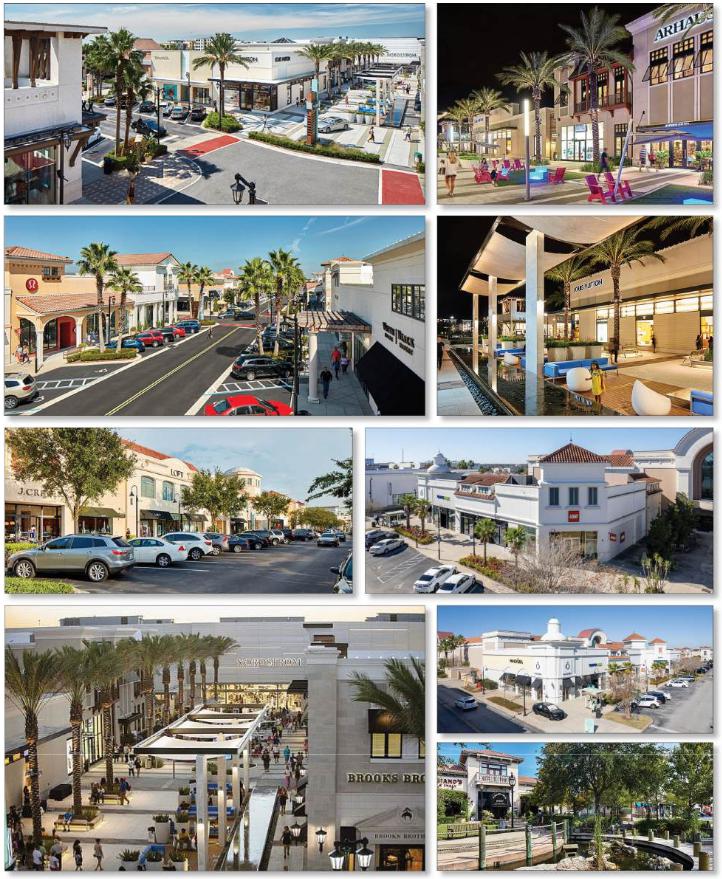
| THE INFORMATION IN THIS STRUCTURAL AND COLLATERAL TERM SHEET IS NOT COMPLETE AND MAY BE AMENDED PRIOR TO THE TIME OF SALE. THIS TERM SHEET IS NOT AN OFFER TO SELL THESE SECURITIES AND IT IS NOT A SOLICITATION OF AN OFFER TO BUY THESE SECURITIES IN ANY JURISDICTION WHERE THE OFFER OR SALE IS NOT PERMITTED. |
| | 29 | |
| Retail – Super Regional Mall | Loan #1 | Cut-off Date Balance: | | $100,000,000 |
| 4663 River City Drive | St. Johns Town Center | Cut-off Date LTV: | | 47.8% |
| Jacksonville, FL 32246 | | U/W NCF DSCR: | | 2.09x |
| | | U/W NOI Debt Yield: | | 13.3% |

| THE INFORMATION IN THIS STRUCTURAL AND COLLATERAL TERM SHEET IS NOT COMPLETE AND MAY BE AMENDED PRIOR TO THE TIME OF SALE. THIS TERM SHEET IS NOT AN OFFER TO SELL THESE SECURITIES AND IT IS NOT A SOLICITATION OF AN OFFER TO BUY THESE SECURITIES IN ANY JURISDICTION WHERE THE OFFER OR SALE IS NOT PERMITTED. |
| | 30 | |
| Retail – Super Regional Mall | Loan #1 | Cut-off Date Balance: | | $100,000,000 |
| 4663 River City Drive | St. Johns Town Center | Cut-off Date LTV: | | 47.8% |
| Jacksonville, FL 32246 | | U/W NCF DSCR: | | 2.09x |
| | | U/W NOI Debt Yield: | | 13.3% |

| THE INFORMATION IN THIS STRUCTURAL AND COLLATERAL TERM SHEET IS NOT COMPLETE AND MAY BE AMENDED PRIOR TO THE TIME OF SALE. THIS TERM SHEET IS NOT AN OFFER TO SELL THESE SECURITIES AND IT IS NOT A SOLICITATION OF AN OFFER TO BUY THESE SECURITIES IN ANY JURISDICTION WHERE THE OFFER OR SALE IS NOT PERMITTED. |
| | 31 | |
| No. 1 – St. Johns Town Center |
| |
| Mortgage Loan Information | | Mortgaged Property Information |
| Mortgage Loan Sellers: | JPMorgan Chase Bank, National Association, and Goldman Sachs Mortgage Company | | Single Asset/Portfolio: | Single Asset |
| Credit Assessment (Fitch/KBRA/Moody’s): | Asf/BBB+(sf)/Aa3(sf) | | Property Type – Subtype: | Retail – Super Regional Mall |
| Original Principal Balance(1): | $100,000,000 | | Location: | Jacksonville, FL |
| Cut-off Date Balance(1): | $100,000,000 | | Size(5): | 1,022,042 SF |
| % of Initial Pool Balance: | 9.2% | | Cut-off Date Balance Per SF(1)(5): | $352.24 |
| Loan Purpose: | Refinance | | Maturity Date Balance Per SF(1)(5): | $352.24 |
| Borrower Sponsor: | Simon Property Group, L.P. | | Year Built/Renovated: | 2005, 2008, 2014 / NAP |
| Guarantor: | Simon Property Group, L.P. | | Title Vesting: | Fee |
| Mortgage Rate: | 5.9480% | | Property Manager: | Simon Management Associates, LLC (borrower-related) |
| Note Date: | May 10, 2024 | | Current Occupancy (As of): | 93.9% (6/1/2024) |
| Seasoning: | 0 months | | YE 2023 Occupancy(6): | 97.0% |
| Maturity Date: | June 1, 2034 | | YE 2022 Occupancy(6): | 95.0% |
| IO Period: | 120 months | | YE 2021 Occupancy(6): | 95.0% |
| Loan Term (Original): | 120 months | | As-Is Appraised Value: | $753,700,000 |
| Amortization Term (Original): | NAP | | As-Is Appraised Value Per SF(5): | $737.45 |
| Loan Amortization Type: | Interest Only | | As-Is Appraisal Valuation Date: | March 21, 2024 |
| Call Protection(2): | L(24),D(90),O(6) | | |
| Lockbox Type: | Hard/Springing Cash
Management | | Underwriting and Financial Information |
| Additional Debt(1)(3): | Yes | | YE 2023 NOI(7): | $41,732,761 |
| Additional Debt Type (Balance)(1)(3): | Pari Passu ($260,000,000) | | YE 2022 NOI: | $39,266,904 |
| | | | YE 2021 NOI: | $35,954,705 |
| | | | YE 2020 NOI: | $31,506,200 |
| | | | U/W Revenues: | $63,759,318 |
| Escrows and Reserves(4) | | U/W Expenses: | $15,996,884 |
| | Initial | Monthly | Cap | | U/W NOI(7): | $47,762,434 |
| Taxes: | $0 | Springing | NAP | | U/W NCF: | $45,410,434 |
| Insurance: | $0 | Springing | NAP | | U/W DSCR based on NOI/NCF(1): | 2.20x / 2.09x |
| Replacement Reserves: | $0 | Springing | NAP | | U/W Debt Yield based on NOI/NCF(1): | 13.3% / 12.6% |
| TI/LC Reserve: | $0 | Springing | NAP | | U/W Debt Yield at Maturity based on NOI/NCF(1): | 13.3% / 12.6% |
| Gap Rent Reserve: | $1,394,586 | $0 | NAP | | Cut-off Date LTV Ratio(1): | 47.8% |
| Outstanding TI/LC: | $8,393,631 | $0 | NAP | | LTV Ratio at Maturity(1): | 47.8% |
| | | | | | | | |
| Sources and Uses |
| Sources | | | | | Uses | | | |
| Whole Loan Amount | $360,000,000 | | 98.5 | % | | Loan Payoff | $351,117,405 | | 96.0 | % |
| Sponsor Equity | $5,611,283 | | 01.5 | | | Reserves | $9,788,217 | | 2.7 | |
| | | | | | Closing Costs | $4,705,660 | | 1.3 | |
| Total Sources | $365,611,283 | | 100. | 0% | | Total Uses | $365,611,283 | | 100.0 | % |
| (1) | The St. Johns Town Center Mortgage Loan (as defined below) is part of the St. Johns Town Center Whole Loan (as defined below), which is comprised of 72 pari passu promissory notes with an aggregate original principal balance of $360,000,000. The Cut-off Date Balance Per SF, Maturity Date Balance Per SF, U/W DSCR based on NOI/NCF, U/W Debt Yield based on NOI/NCF, U/W Debt Yield at Maturity based on NOI/NCF, Cut-off Date LTV Ratio and LTV Ratio at Maturity presented above are based on the aggregate Cut-off Date principal balance of the St. Johns Town Center Whole Loan. |
| (2) | The St. Johns Town Center Whole Loan may be (a) defeased after the date that is the earlier of (i) two years from the closing date of the securitization that includes the last note to be securitized (the “REMIC Prohibition Period”) and (ii) June 1, 2027 (the “Permitted Release Date”), or (b) prepaid in whole (but not in part) with the payment of an amount equal to the yield maintenance premium if the Permitted Release Date has occurred but the REMIC Prohibition Period has not occurred, provided that any portion of the St. Johns Town Center Whole Loan that has been securitized, as of such projected prepayment date, for a period of more than two years from the closing date of the REMIC trust which holds such securitized portion of the St. Johns Town Center Whole Loan is contemporaneously defeased. The assumed lockout period is based on the expected BANK 2024-BNK47 closing date in June 2024. The actual lockout period may be longer. |
| (3) | See “The Mortgage Loan” section below for further discussion of additional mortgage debt. |
| (4) | See “Escrows” section below for further discussion of reserve requirements. |
| (5) | The St. Johns Town Center Property (as defined below) is part of a larger retail development consisting of 1,433,086 square feet (“SF”), including non-collateral tenants such as Dillard’s (242,309 SF), Target (123,735 SF) and Ashley Furniture (45,000 SF). |
| (6) | Includes temporary tenants. |
| (7) | The increase in NOI from YE 2023 to U/W is primarily driven by (i) approximately $2.8 million attributable to rent from recently executed new leases, (ii) approximately $1.4 million attributable to increased base rents associated with recently executed tenant renewals and (iii) approximately $0.9 million attributable to recently executed tenant expansions and relocations. |
| THE INFORMATION IN THIS STRUCTURAL AND COLLATERAL TERM SHEET IS NOT COMPLETE AND MAY BE AMENDED PRIOR TO THE TIME OF SALE. THIS TERM SHEET IS NOT AN OFFER TO SELL THESE SECURITIES AND IT IS NOT A SOLICITATION OF AN OFFER TO BUY THESE SECURITIES IN ANY JURISDICTION WHERE THE OFFER OR SALE IS NOT PERMITTED. |
| | 32 | |
| Retail – Super Regional Mall | Loan #1 | Cut-off Date Balance: | | $100,000,000 |
| 4663 River City Drive | St. Johns Town Center | Cut-off Date LTV: | | 47.8% |
| Jacksonville, FL 32246 | | U/W NCF DSCR: | | 2.09x |
| | | U/W NOI Debt Yield: | | 13.3% |
The Mortgage Loan. The largest mortgage loan (the “St. Johns Town Center Mortgage Loan”) is part of a whole loan (the “St. Johns Town Center Whole Loan”) evidenced by 72 pari passu promissory notes in the aggregate original principal amount of $360,000,000. The St. Johns Town Center Whole Loan is secured by first priority fee interest in a super-regional mall on a 119.82-acre plot of land in the St. Johns submarket of Jacksonville, Florida (the “St. Johns Town Center Property”). The St. Johns Town Center Whole Loan was co-originated on May 10, 2024 by Barclays Capital Real Estate Inc. (“Barclays”), Goldman Sachs Bank USA (“GSBI”), JPMorgan Chase Bank, National Association (“JPMCB”) and Societe Generale Financial Corporation (“SGFC”). The St. Johns Town Center Mortgage Loan is evidenced by the non-controlling notes A-6-A, A-6-B, A-6-C, A-6-D, A-7-A-2, A-7-B-2, A-7-C-2, A-7-D-2, A-10-A, A-10-B, A-10-C, A-10-D, A-11-A, A-11-B, A-11-C, A-11-D, A-12-A, A-12-B, A-12-C and A-12-D, with an aggregate outstanding principal balance as of the Cut-off Date of $100,000,000. The remaining promissory notes comprising the St. Johns Town Center Whole Loan are summarized in the below table. The St. Johns Town Center Whole Loan will be serviced pursuant to the pooling and servicing agreement for the BANK 2024-BNK47 trust until the controlling Note A-1-A is securitized, whereupon the St. Johns Town Center Whole Loan will be serviced pursuant to the pooling and servicing agreement for such future securitization. See “Description of the Mortgage Pool—The Whole Loans—The Non-Serviced Pari Passu Whole Loans” and “Pooling and Servicing Agreement—Servicing of the Non-Serviced Mortgage Loans Servicing of the St. Johns Town Center Mortgage Loan” in the Preliminary Prospectus.
Whole Loan Note Summary
| Notes | Original Balance | Cut-off Date Balance | Note Holder | Controlling Piece |
| A-1-A(1) | $19,859,697 | $19,859,697 | Barclays | Yes |
| A-1-B, A-1-C, A-1-D(1) | $25,140,303 | $25,140,303 | Barclays | No |
| A-2-A, A-2-B, A-2-C, A-2-D(1) | $30,000,000 | $30,000,000 | Barclays | No |
| A-3-A, A-3-B, A-3-C, A-3-D(1) | $25,000,000 | $25,000,000 | Barclays | No |
| A-4-A, A-4-B, A-4-C, A-4-D(1) | $12,500,000 | $12,500,000 | Barclays | No |
| A-5-A, A-5-B, A-5-C, A-5-D(1) | $7,500,000 | $7,500,000 | Barclays | No |
| A-6-A, A-6-B, A-6-C, A-6-D | $35,000,000 | $35,000,000 | BANK 2024-BNK47 | No |
| A-7-A-1, A-7-B-1, A-7-C-1, A-7-D-1(1) | $10,000,000 | $10,000,000 | JPMCB | No |
| A-7-A-2, A-7-B-2, A-7-C-2, A-7-D-2 | $10,000,000 | $10,000,000 | BANK 2024-BNK47 | No |
| A-8-A, A-8-B, A-8-C, A-8-D(1) | $20,000,000 | $20,000,000 | JPMCB | No |
| A-9-A, A-9-B, A-9-C, A-9-D(1) | $16,000,000 | $16,000,000 | JPMCB | No |
| A-10-A, A-10-B, A-10-C, A-10-D | $5,000,000 | $5,000,000 | BANK 2024-BNK47 | No |
| A-11-A, A-11-B, A-11-C, A-11-D | $25,000,000 | $25,000,000 | BANK 2024-BNK47 | No |
| A-12-A, A-12-B, A-12-C, A-12-D | $25,000,000 | $25,000,000 | BANK 2024-BNK47 | No |
| A-13-A, A-13-B, A-13-C, A-13-D(1) | $25,000,000 | $25,000,000 | GSBI | No |
| A-14-A, A-14-B, A-14-C, A-14-D(1) | $21,000,000 | $21,000,000 | GSBI | No |
| A-15-A, A-15-B, A-15-C, A-15-D(1) | $20,000,000 | $20,000,000 | SGFC | No |
| A-16-A, A-16-B, A-16-C, A-16-D(1) | $15,000,000 | $15,000,000 | SGFC | No |
| A-17-A, A-17-B, A-17-C, A-17-D(1) | $13,000,000 | $13,000,000 | SGFC | No |
| Total | $360,000,000 | $360,000,000 | | |
| (1) | The notes held by the lenders are expected to be contributed to one or more future securitization transactions or may otherwise be transferred at any time. |
The Borrowers and the Borrower Sponsor. The borrowing entities for the St. Johns Town Center Whole Loan are Shops at St. Johns, LLC and STJTC II, LLC, each a Delaware limited liability company and single purpose entity with two independent directors. The borrower sponsor and non-recourse carveout guarantor is Simon Property Group, L.P. (“Simon”). So long as the non-recourse carveout guarantor is either Simon, Simon Property Group, Inc. (“Simon Inc.”), RREEF America II Lower REIT LLC, a Delaware limited liability company, or an affiliate of Simon or Simon Inc., the liability under the guaranty is limited to 20% ($72,000,000) of the original principal amount of the St. Johns Town Center Whole Loan, plus all reasonable out-of-pocket costs and expenses incurred in the enforcement of the guaranty or preservation of the lender’s rights under the guaranty. There is no separate environmental indemnity for the St. Johns Town Center Whole Loan; however, the non-recourse carveout guaranty covers breaches of representations, warranties and indemnification provisions in the loan agreement concerning environmental laws and hazardous materials (subject to the aforementioned 20% cap).
Simon is the operating partnership of Simon Property Group Inc. (NYSE: SPG / S&P: A-), an S&P 100 company and owner of shopping, dining, entertainment and mixed-use destinations. As of March 31, 2024, Simon owned or held an interest in 195 income-producing properties in the United States, including 93 malls, 69 premium outlets, 14 Mills-branded shopping centers, six lifestyle centers and 13 other retail properties. Simon also owns an 84% non-controlling interest in The Taubman Realty Group, LLC, or TRG, which has an interest in 23 regional, super-regional and outlet malls in the U.S. and Asia. Additionally, Simon has a 22.4% ownership interest in Klépierre SA, a publicly traded, Paris-based real estate company, which owns shopping centers in 14 European countries. As of May 13, 2024, Simon had an equity market capitalization of approximately $47.9 billion. Simon is also a borrower sponsor on the Woodfield Mall Mortgage Loan and Arundel Mills and Marketplace Mortgage Loan, which are both included in this pool.
| THE INFORMATION IN THIS STRUCTURAL AND COLLATERAL TERM SHEET IS NOT COMPLETE AND MAY BE AMENDED PRIOR TO THE TIME OF SALE. THIS TERM SHEET IS NOT AN OFFER TO SELL THESE SECURITIES AND IT IS NOT A SOLICITATION OF AN OFFER TO BUY THESE SECURITIES IN ANY JURISDICTION WHERE THE OFFER OR SALE IS NOT PERMITTED. |
| | 33 | |
| Retail – Super Regional Mall | Loan #1 | Cut-off Date Balance: | | $100,000,000 |
| 4663 River City Drive | St. Johns Town Center | Cut-off Date LTV: | | 47.8% |
| Jacksonville, FL 32246 | | U/W NCF DSCR: | | 2.09x |
| | | U/W NOI Debt Yield: | | 13.3% |
The Property. The St. Johns Town Center Property is a Class A, open-air, super-regional mall on a 119.82-acre plot of land in the St. Johns submarket of Jacksonville, Florida. The St. Johns Town Center Property consists of a 1,022,042 square foot portion of a larger retail development consisting of 1,433,086 total square feet. The St. Johns Town Center Property benefits from four anchor tenants: Dick’s Clothing & Sporting Goods (“Dick’s”), Dillard’s (non-collateral), Nordstrom and Target (non-collateral). Dillard’s and Target are not part of the collateral and have no attributable underwritten base rent or reimbursements. The St. Johns Town Center Property was constructed in two phases: an initial phase that was built in 2005 (“Phase I”) and a subsequent phase that was constructed in 2008 and 2014 (“Phase II”). Together, Phase I and Phase II comprise a community center (the “Community Center”) and lifestyle center, as outlined in the layout shown on a previous page. The Community Center component is generally L-shaped and extends along the northern border and east side of the St. Johns Town Center Property. The Community Center component also includes three smaller strip centers located along the western border of the St. Johns Town Center Property. The lifestyle component of the St. Johns Town Center Property is comprised of a series of freestanding multi-tenant buildings which line either side of River City Drive and Midtown Parkway. Nordstrom and Dillard’s are located along the west side of the center with secondary roads extending to both. Dick’s and Restoration Hardware are situated along the east side of the St. Johns Town Center Property. A cluster of four freestanding restaurants anchor the south side of the St. Johns Town Center Property. The St. Johns Town Center Property provides parking via 6,149 surface parking spaces (approximately 4.25 spaces per 1,000 square feet).
The St. John Town Center Property benefits from having the highest mall grade among the appraiser’s identified competitive properties. The St. Johns Town Center Property has an A+ grade, with competitive properties largely of inferior quality, as determined by a third party market data provider.
As of June 1, 2024, the St. Johns Town Center Property was 93.9% leased to 170 unique tenants (excluding temp tenants), with no tenant accounting for greater than 12.0% of net rentable area and 2.9% of underwritten base rent. In 2023, the tenants at the St. Johns Town Center Property generated approximately $673.0 million in total sales, with comp inline sales (less than 10,000 square feet excluding Apple and Tesla) of $921 per square foot. Inline tenants benefit from high-performing anchor tenancy at the St. Johns Town Center Property, with the Dillard’s location netting the highest sales in the Southeast region and the Dick’s location netting higher sales than any other Dick’s store in the trade area. Inline tenants include both luxury and nationally-recognized brands, such as Apple, Louis Vuitton, Gucci, Chanel, Coach, Tiffany & Co., Mayors, Alo Yoga and Lululemon. The St. John’s Town Center Property has a wide variety of food and beverage options, including The Cheesecake Factory, RH Rooftop Restaurant, The Capital Grille and Cantina Laredo, with food and beverage outlets accounting for over $90.0 million of 2023 sales, in aggregate.
The St. Johns Town Center Property has benefitted from positive leasing momentum, with 53,439 square feet of recently executed leases commencing between 2023 and 2025. Notable brands with recently executed leases include Chanel, Gucci, Aritzia, Breitling, Omega and J. Crew. In addition, luxury tenants including Louis Vuitton, Lovesac, Mayors Jewelers and Lululemon recently expanded into larger spaces.
Simon has invested approximately $44.3 million in capital expenditures since 2019, including approximately $18.0 million allocated to the addition of an RH Gallery in 2021 and approximately $6.0 million to Gucci and Altar’d State tenant allowances. Capital expenditures were also allocated towards building improvements, exterior improvements, roofing, paving and signage.
The following table presents certain information relating to the tenant sales at the St. Johns Town Center Property:
Tenant Sales(1)(2)
| Sales History |
| | 2019 | 2021 | 2022 | 2023 |
| Gross Mall Sales(3) | $590,274,000 | $549,525,000 | $669,225,000 | $672,995,001 |
| Nordstrom | $17,943,000 | $13,321,000 | $20,091,000 | $19,768,260 |
| Dick's(4) | $17,500,000 | $20,100,000 | $20,100,000 | $20,100,000 |
| Comp Sales PSF (Inline < 10,000 SF)(5) | $1,064 | $935 | $1,097 | $1,109 |
Comp Sales PSF (Inline < 10,000 SF excluding Apple &
Tesla)(5) | $627 | $826 | $911 | $921 |
| Occupancy Cost (Inline < 10,000 SF)(5) | 11.0% | 10.6% | 10.4% | 11.0% |
| (1) | Includes the borrower sponsor’s provided estimates for non-reporting anchor tenants and/or non-collateral tenants. Dillard’s, Dick’s, Ross Dress for Less, Target, Ashley Furniture and Marshall’s do not report sales. Dillard’s, Target and Ashley Furniture are non-collateral. |
| (2) | 2020 excluded due to the adverse impact of the COVID-19 pandemic. |
| (3) | Gross Mall Sales includes the Community Center, which is included as collateral. |
| (4) | Based on estimates provided by the borrower sponsor. |
| (5) | Excludes the Community Center. |
| THE INFORMATION IN THIS STRUCTURAL AND COLLATERAL TERM SHEET IS NOT COMPLETE AND MAY BE AMENDED PRIOR TO THE TIME OF SALE. THIS TERM SHEET IS NOT AN OFFER TO SELL THESE SECURITIES AND IT IS NOT A SOLICITATION OF AN OFFER TO BUY THESE SECURITIES IN ANY JURISDICTION WHERE THE OFFER OR SALE IS NOT PERMITTED. |
| | 34 | |
| Retail – Super Regional Mall | Loan #1 | Cut-off Date Balance: | | $100,000,000 |
| 4663 River City Drive | St. Johns Town Center | Cut-off Date LTV: | | 47.8% |
| Jacksonville, FL 32246 | | U/W NCF DSCR: | | 2.09x |
| | | U/W NOI Debt Yield: | | 13.3% |
Major Tenants.
Nordstrom (123,000 square feet, 12.0% of NRA, 1.1% of underwritten base rent): Nordstrom (Fitch/Moody’s/S&P: BB/Ba2/BB+) was founded in 1901 as a retail shoe business in Seattle, Washington. Nordstrom is a leading fashion designer offering compelling clothing, shoes and accessories for men, women and kids. Nordstrom has more than 350 Nordstrom, Nordstrom Local and Nordstrom Rack locations. Nordstrom executed its ground lease at the St. Johns Town Center Property on April 23, 2013, and its initial lease expiration date is February 28, 2030. Nordstrom has eight, 10-year extension options. Nordstrom reported 2023 sales of approximately $19.8 million and occupancy cost of 2.8% at the St. Johns Town Center Property.
Dick's Clothing & Sporting Goods (66,000 square feet, 6.5% of NRA, 2.9% of underwritten base rent): Dick’s (Fitch/Moody's/S&P: NR/Baa3/BBB) was founded in 1948 as a bait-and-tackle shop in Binghamton, New York, and has since grown to become an omnichannel sporting goods retailer, with a primary focus on sports equipment, apparel, footwear and accessories. Headquartered in Coraopolis, Pennsylvania, Dick’s offers a wide range of products through its main and specialty concept stores, including Dick’s Sporting Goods, Public Lands, Moosejaw and Going Going Gone!. Dick’s is an original tenant at the St. Johns Town Center Property, having executed the lease for its space on October 17, 2003, and subsequently extending its lease term through January 2026. Dick’s has two remaining five-year extension options. The borrower sponsor estimates that Dick’s achieved 2023 sales of $20.1 million and occupancy cost of 7.0% at the St. Johns Town Center Property.
Restoration Hardware (48,697 square feet, 4.8% of NRA, 2.5% of underwritten base rent): Founded in 1980 and headquartered in Corte Madera, California, Restoration Hardware (Fitch/Moody's/S&P: NR/B1/NR) is a retailing company that offers home furnishing products, including fabric and leather seating, bedding accessories, tables, faucets, mirrors, lighting, rugs, etc. Restoration Hardware sells its products through its stores, websites and catalogs, and owns and operates a network of retail outlets across the US, Canada and the UK. Restoration Hardware executed its ground lease at the St. Johns Town Center Property in January 2020, and has an initial lease expiration date in January 2037. Restoration Hardware has three, five-year renewal options remaining. Restoration Hardware reported 2023 sales of approximately $25.7 million and occupancy cost of 6.8% at the St. Johns Town Center Property.
| THE INFORMATION IN THIS STRUCTURAL AND COLLATERAL TERM SHEET IS NOT COMPLETE AND MAY BE AMENDED PRIOR TO THE TIME OF SALE. THIS TERM SHEET IS NOT AN OFFER TO SELL THESE SECURITIES AND IT IS NOT A SOLICITATION OF AN OFFER TO BUY THESE SECURITIES IN ANY JURISDICTION WHERE THE OFFER OR SALE IS NOT PERMITTED. |
| | 35 | |
| Retail – Super Regional Mall | Loan #1 | Cut-off Date Balance: | | $100,000,000 |
| 4663 River City Drive | St. Johns Town Center | Cut-off Date LTV: | | 47.8% |
| Jacksonville, FL 32246 | | U/W NCF DSCR: | | 2.09x |
| | | U/W NOI Debt Yield: | | 13.3% |
The following table presents certain information relating to the major tenant sales at the St. Johns Town Center Property:
Major/Select In-Line Tenant Sales(1)(2)
| Tenant Name | SF | 2019 | 2021 | 2022 | 2023 | 2023 Sales
PSF | Occupancy
Cost |
| Major Tenants (Top 10 by SF) | | | | | | | |
| Restoration Hardware | 48,697 | N/A | N/A | $26,440,000 | $25,685,817 | $527 | 6.8% |
| Jo-Ann Fabrics | 35,000 | $4,680,000 | $4,374,000 | $4,223,000 | $3,966,282 | $113 | 15.4% |
| Ross Dress For Less | 30,187 | $7,000,000 | $9,700,000 | $9,800,000 | $9,800,000 | $325 | 5.3% |
| DSW Shoe Warehouse | 30,000 | $8,784,000 | $9,562,000 | $10,326,000 | $9,855,965 | $329 | 6.7% |
| Barnes & Noble | 25,153 | $5,877,000 | $4,871,000 | $7,896,000 | $7,556,930 | $300 | 10.6% |
| Marshalls | 23,636 | N/A | N/A | $6,300,000 | $6,300,000 | $267 | 8.6% |
| PetSmart | 19,107 | $6,410,000 | $7,854,000 | $8,231,000 | $8,510,546 | $445 | 4.8% |
| Old Navy | 16,953 | $7,989,000 | $8,069,000 | $7,458,000 | $7,336,126 | $433 | 11.3% |
| Arhaus Furniture | 16,000 | $6,110,000 | $7,717,000 | $11,451,000 | $12,253,281 | $766 | 9.3% |
| Altar'd State | 14,882 | $2,159,000 | $3,012,000 | $3,110,000 | $6,807,947 | $457 | 19.3% |
| Signature Tenants | | | | | | | |
| Anthropologie | 10,736 | $1,721,000 | $1,804,000 | $4,321,000 | $4,500,327 | $419 | 15.0% |
| Apple | 8,181 | $72,614,000 | $35,554,000 | $46,580,000 | $50,899,583 | $6,222 | 1.9% |
| Lululemon | 7,500 | $6,332,000 | $7,493,000 | $11,501,000 | $15,340,209 | $2,045 | 6.9% |
| Louis Vuitton | 6,053 | $21,103,000 | $42,595,000 | $45,692,000 | $37,478,447 | $6,192 | 5.7% |
| Sephora | 4,802 | $8,119,000 | $8,808,000 | $11,908,000 | $16,367,961 | $3,409 | 6.9% |
| Gucci(3) | 4,492 | N/A | N/A | N/A | $9,426,829 | $2,099 | 11.6% |
| Mayor's Jewelers | 4,147 | $3,282,000 | $8,639,000 | $10,562,000 | $4,386,394 | $1,058 | 19.5% |
| Alo Yoga(3) | 3,697 | N/A | N/A | N/A | $1,439,782 | $389 | 36.4% |
| Tiffany & Co. | 3,538 | $5,524,000 | $9,155,000 | $9,745,000 | $8,603,561 | $2,432 | 5.0% |
| (1) | All sales information presented herein with respect to the St. Johns Town Center Property is based upon information provided by Simon. In certain instances, sales figures represent estimates because the tenants are not required to report, or otherwise may not have reported sales information on a timely basis. Further, because sales are self-reported, such information is not independently verified by the borrower sponsor. |
| (2) | 2020 excluded due to the adverse impact of the COVID-19 pandemic on the St. John’s Town Center Property. |
| (3) | Gucci and Alo Yoga opened in March 2023 and July 2023, respectively. 2023 sales do not reflect a full year of operations. |
| THE INFORMATION IN THIS STRUCTURAL AND COLLATERAL TERM SHEET IS NOT COMPLETE AND MAY BE AMENDED PRIOR TO THE TIME OF SALE. THIS TERM SHEET IS NOT AN OFFER TO SELL THESE SECURITIES AND IT IS NOT A SOLICITATION OF AN OFFER TO BUY THESE SECURITIES IN ANY JURISDICTION WHERE THE OFFER OR SALE IS NOT PERMITTED. |
| | 36 | |
| Retail – Super Regional Mall | Loan #1 | Cut-off Date Balance: | | $100,000,000 |
| 4663 River City Drive | St. Johns Town Center | Cut-off Date LTV: | | 47.8% |
| Jacksonville, FL 32246 | | U/W NCF DSCR: | | 2.09x |
| | | U/W NOI Debt Yield: | | 13.3% |
The following table presents certain information relating to the major tenants at the St. Johns Town Center Property:
Tenant Summary(1)
| Tenant Name | Credit Rating (Fitch/Moody's /S&P)(2) | Tenant NRSF | % of NRSF | Annual U/W Rent | % of Total Annual U/W Rent | Annual U/W Rent PSF | | Ext. Options |
| Term. Option (Y/N) | Lease Expiration Date |
| Anchor Tenants | | | | | | | | | |
| Nordstrom(3) | BB/Ba2/BB+ | 123,000 | 12.0% | $420,677 | 1.1% | $3.42 | N | 2/28/2030 | 8 x 10Yr |
| Dick's | NR/Baa3/BBB | 66,000 | 6.5% | $1,056,000 | 2.9% | $16.00 | Y(4) | 1/31/2026 | 2 x 5 Yr |
| Total / Wtd. Avg. | | 189,000 | 18.5% | $1,476,677 | 4.0% | $7.81 | | | |
| | | | | | | | | | |
| Major Tenants (Top 10 by SF) | | | | | | | | |
| Restoration Hardware(3) | NR/B1/NR | 48,697 | 4.8% | $923,328 | 2.5% | $18.96 | N | 1/31/2037 | 3 x 5Yr |
| Jo-Ann Fabrics | NR/B3/NR | 35,000 | 3.4% | $385,000 | 1.0% | $11.00 | Y(5) | 1/31/2026 | 2 x 5 Yr |
| Ross Dress For Less | NR/A2/BBB+ | 30,187 | 3.0% | $362,244 | 1.0% | $12.00 | Y(6) | 1/31/2026 | 2 x 5 Yr |
| DSW Shoe Warehouse | NR/NR/NR | 30,000 | 2.9% | $570,000 | 1.5% | $19.00 | Y(7) | 1/31/2029 | 2 x 5 Yr |
| Barnes & Noble | NR/NR/NR | 25,153 | 2.5% | $646,323 | 1.8% | $25.70 | Y(8) | 5/31/2030 | None |
| Marshalls | NR/A2/A | 23,636 | 2.3% | $366,358 | 1.0% | $15.50 | N | 5/31/2032 | 4 x 5 Yr |
| PetSmart | NR/B1/B+ | 19,107 | 1.9% | $296,159 | 0.8% | $15.50 | Y(9) | 5/31/2025 | 3 x 5 Yr |
| Old Navy | NR/Ba3/BB | 16,953 | 1.7% | $599,069 | 1.6% | $35.34 | Y(10) | 1/31/2026 | None |
| Arhaus Furniture | NR/NR/NR | 16,000 | 1.6% | $540,000 | 1.5% | $33.75 | Y(11) | 1/31/2025 | 1 x 5 Yr |
| Altar'd State | NR/NR/NR | 14,882 | 1.5% | $1,056,176 | 2.9% | $70.97 | Y(12) | 1/31/2038 | None |
| Total/Wtd. Avg. | | 259,615 | 25.4% | $5,744,656 | 15.6% | $22.13 | | | |
| | | | | | | | | | |
| Remaining Occupied | | 511,060 | 50.0% | $29,684,658 | 80.4% | $58.08 | | | |
| | | | | | | | | | |
| Occupied Total | | 959,675 | 93.9% | $36,905,992 | 100.0% | $38.46 | | | |
| Vacant Space | | 62,367 | 6.1% | | | | | | |
| Total/Wtd. Avg. | | 1,022,042 | 100.0% | | | | | | |
| (1) | Based on the underwritten rent roll dated June 1, 2024, inclusive of rent steps through May 2025. |
| (2) | In certain instances, ratings provided are those of the parent company of the entity shown, whether or not the parent company guarantees the lease. |
| (3) | Nordstrom and Restoration Hardware are subject to ground leases. Additionally, Nordstrom is responsible for CAM charges and Restoration Hardware is responsible for real estate taxes and utilities. |
| (4) | Dick’s has the right to terminate its lease if less than 700,000 square feet of NRA is open for business to the public. Additionally, Dick’s may terminate its lease if Simon enters into a lease for greater than 10,000 square feet with a tenant that utilizes its space for (i) health, fitness and/or exercise equipment (ii) sporting goods, (iii) sporting equipment, and/or (iv) athletic footwear. |
| (5) | Jo-Ann Fabrics has the right to terminate its lease if (i) Target or Dillard’s and four major tenants are not open for business to the public or (ii) Target, Dillard’s and three major tenants are not open for business to the public. |
| (6) | Ross Dress for Less has the right to terminate its lease if less than 900,000 square feet of NRA is open for business to the public. |
| (7) | DSW Shoe Warehouse has the right to terminate its lease if (i) Dillard’s, Target or a replacement anchor tenant vacates or (ii) occupancy, inclusive of the Community Center, falls below 65% of gross leasable area. |
| (8) | Barnes & Noble has the right to terminate its lease if parking spaces falls below the greater of (i) 4.5 parking spaces per one thousand square feet of NRA and (ii) the number of parking spaces imposed by any local code requirements. Additionally, Barnes & Noble may terminate its lease if less than 50% of NRA is actively occupied and open for business. |
| (9) | PetSmart has the right to terminate its lease if either of the following tenant groupings are not open for business to the public: (i) Target and three national or regional retailers that occupy greater than 20,000 square feet or (ii) Dillard’s and four national or regional retailers that occupy greater than 20,000 square feet. |
| (10) | Old Navy has the right to terminate its lease if (i) fewer than three major tenants are open for business or (ii) less than 75% of NRA, excluding Old Navy’s space, outparcels and major tenants spaces, is open for business to the public. |
| (11) | Arhaus Furniture has the right to terminate its lease if (i) Nordstrom, or its replacement, permanently closes of business, or (ii) less than 70% of NRA is open for business to the public. |
| (12) | Altar’d State has the right to terminate its lease if (i) less than three major tenants are open and operating or (ii) less than 75% of NRA, excluding space designed to be occupied by major tenants, is open and operating. |
| THE INFORMATION IN THIS STRUCTURAL AND COLLATERAL TERM SHEET IS NOT COMPLETE AND MAY BE AMENDED PRIOR TO THE TIME OF SALE. THIS TERM SHEET IS NOT AN OFFER TO SELL THESE SECURITIES AND IT IS NOT A SOLICITATION OF AN OFFER TO BUY THESE SECURITIES IN ANY JURISDICTION WHERE THE OFFER OR SALE IS NOT PERMITTED. |
| | 37 | |
| Retail – Super Regional Mall | Loan #1 | Cut-off Date Balance: | | $100,000,000 |
| 4663 River City Drive | St. Johns Town Center | Cut-off Date LTV: | | 47.8% |
| Jacksonville, FL 32246 | | U/W NCF DSCR: | | 2.09x |
| | | U/W NOI Debt Yield: | | 13.3% |
The following table presents certain information relating to the lease rollover schedule at the St. Johns Town Center Property:
Lease Expiration Schedule(1)(2)
Year Ending
December 31 | No. of Leases Expiring | Expiring
NRSF | % of
Total
NRSF | Cumulative
Expiring
NRSF | Cumulative
% of Total
NRSF | Annual
U/W
Base Rent(3) | % of Total
Annual
U/W Base
Rent | Annual
U/W
Base Rent
PSF |
| 2024 & MTM | 13 | 32,253 | 3.2% | 32,253 | 3.2% | $1,169,960 | 3.2% | $36.27 |
| 2025 | 16 | 90,984 | 8.9% | 123,237 | 12.1% | $3,318,463 | 9.0% | $36.47 |
| 2026 | 26 | 224,609 | 22.0% | 347,846 | 34.0% | $6,765,993 | 18.3% | $30.12 |
| 2027 | 17 | 78,454 | 7.7% | 426,300 | 41.7% | $4,242,870 | 11.5% | $54.08 |
| 2028 | 17 | 73,588 | 7.2% | 499,888 | 48.9% | $4,736,057 | 12.8% | $64.36 |
| 2029 | 12 | 64,936 | 6.4% | 564,824 | 55.3% | $2,607,932 | 7.1% | $40.16 |
| 2030 | 12 | 181,205 | 17.7% | 746,029 | 73.0% | $3,276,318 | 8.9% | $18.08 |
| 2031 | 5 | 18,292 | 1.8% | 764,321 | 74.8% | $786,170 | 2.1% | $42.98 |
| 2032 | 10 | 63,943 | 6.3% | 828,264 | 81.0% | $2,163,571 | 5.9% | $33.84 |
| 2033 | 6 | 18,317 | 1.8% | 846,581 | 82.8% | $1,317,720 | 3.6% | $71.94 |
| 2034 | 14 | 47,014 | 4.6% | 893,595 | 87.4% | $4,180,792 | 11.3% | $88.93 |
| 2035 & Beyond | 24 | 66,080 | 6.5% | 959,675 | 93.9% | $2,340,147 | 6.3% | $35.41 |
| Vacant | 0 | 62,367 | 6.1% | 1,022,042 | 100.0% | $0 | 0.0% | $0.00 |
| Total/Wtd. Avg. | 172 | 1,022,042 | 100.0% | | | $36,905,992 | 100.0% | $38.46(3) |
| (1) | Based on the underwritten rent roll dated June 1, 2024 inclusive of rent steps through May 2025. |
| (2) | Certain tenants may have lease termination options that are exercisable prior to the stated expiration date of the subject lease or leases that are not considered in the Lease Expiration Schedule. |
| (3) | Total/Wtd. Avg. Annual U/W Base Rent PSF excludes vacant space. |
The following table presents historical occupancy percentages at the St. Johns Town Center Property:
Historical Occupancy
| | 12/31/2019(1) | 12/31/2020(1) | 12/31/2021(1) | 12/31/2022(1) | 12/31/2023(1) | 6/1/2024(2) |
| Incl. Temp Tenants | 98.0% | 93.0% | 95.0% | 95.0% | 97.0% | N/A |
| Excl. Temp Tenants | 94.0% | 85.0% | 86.0% | 92.0% | 94.0% | 93.9% |
| (1) | Historical occupancies are as of December 31 for each respective year. |
| (2) | Based on the June 1, 2024 rent roll. |
| THE INFORMATION IN THIS STRUCTURAL AND COLLATERAL TERM SHEET IS NOT COMPLETE AND MAY BE AMENDED PRIOR TO THE TIME OF SALE. THIS TERM SHEET IS NOT AN OFFER TO SELL THESE SECURITIES AND IT IS NOT A SOLICITATION OF AN OFFER TO BUY THESE SECURITIES IN ANY JURISDICTION WHERE THE OFFER OR SALE IS NOT PERMITTED. |
| | 38 | |
| Retail – Super Regional Mall | Loan #1 | Cut-off Date Balance: | | $100,000,000 |
| 4663 River City Drive | St. Johns Town Center | Cut-off Date LTV: | | 47.8% |
| Jacksonville, FL 32246 | | U/W NCF DSCR: | | 2.09x |
| | | U/W NOI Debt Yield: | | 13.3% |
Operating History and Underwritten Net Cash Flow. The following table presents certain information relating to the historical operating performance and underwritten net cash flow at the St. Johns Town Center Property:
Cash Flow Analysis
| | 2020 | 2021 | 2022 | 2023 | U/W | % | (1) | U/W $
per SF |
| In-Place Base Rent(2) | $29,043,233 | $27,975,913 | $29,632,722 | $32,197,323 | $36,245,458 | 52.8 | % | $35.46 | |
| Rent Steps(3) | 0 | 0 | 0 | 0 | 660,534 | 1.0 | | $0.65 | |
| Credit Tenant Rent Steps | 0 | 0 | 0 | 0 | 48,492 | 0.1 | | $0.05 | |
| Temporary Tenant Rent | 831,372 | 1,309,932 | 1,139,618 | 881,055 | 686,000 | 1.0 | | $0.67 | |
| PIL Rent(4) | 107,710 | 313,991 | 399,527 | 465,637 | 221,032 | 0.3 | | $0.22 | |
| Overage Rent(5) | 1,115,714 | 3,870,832 | 5,702,397 | 5,842,555 | 5,407,603 | 7.9 | | $5.29 | |
| Other Rental Income | 53,023 | 54,037 | 53,844 | 50,571 | 61,000 | 0.1 | | $0.06 | |
| Gross-Up Vacant Rent | 0 | 0 | 0 | 0 | 3,683,196 | 5.4 | | $3.60 | |
| Total Rental Income | $31,151,052 | $33,524,705 | $36,928,108 | $39,437,141 | $47,013,315 | 68.4 | % | $46.00 | |
| Total Recoveries | 16,757,264 | 15,585,660 | 16,157,119 | 17,723,862 | 21,684,361 | 31.6 | % | $21.22 | |
| Gross Potential Income | $47,908,316 | $49,110,365 | $53,085,227 | $57,161,003 | $68,697,676 | 100.0 | % | $67.22 | |
| Vacancy & Bad Debt | (3,832,965) | (124,095) | (76,314) | (100,950) | (5,458,658) | (7.9 | ) | ($5.34 | ) |
| Other Income | 346,031 | 496,311 | 928,544 | 481,443 | 520,300 | 0.8 | | $0.51 | |
| Effective Gross Income | $44,421,382 | $49,482,581 | $53,937,457 | $57,541,496 | $63,759,318 | 92.8 | % | $62.38 | |
| | | | | | | | |
| Real Estate Taxes | $6,443,428 | $6,200,481 | $6,194,896 | $6,764,959 | $6,853,350 | 10.7 | % | $6.71 | |
| Insurance | 1,061,740 | 1,161,715 | 1,304,133 | 1,582,047 | 2,001,357 | 3.1 | | $1.96 | |
| Management Fee | 1,227,408 | 1,455,325 | 1,644,610 | 1,535,262 | 1,000,000 | 1.6 | | $0.98 | |
| Other Operating Expenses | 4,182,606 | 4,710,355 | 5,526,914 | 5,926,467 | 6,142,177 | 9.6 | | $6.01 | |
| Total Operating Expenses | $12,915,182 | $13,527,876 | $14,670,553 | $15,808,735 | $15,996,884 | 25.1 | % | $15.65 | |
| | | | | | | | |
| Net Operating Income | $31,506,200 | $35,954,705 | $39,266,904 | $41,732,761 | $47,762,434 | 74.9 | % | $46.73 | |
| Replacement Reserves | 0 | 0 | 0 | 0 | 264,000 | 0.4 | | $0.26 | |
| TI/LC | 0 | 0 | 0 | 0 | 2,088,000 | 3.3 | | $2.04 | |
| Net Cash Flow | $31,506,200 | $35,954,705 | $39,266,904 | $41,732,761 | $45,410,434 | 71.2 | % | $44.43 | |
| | | | | | | | |
| NOI DSCR(6) | 1.45x | 1.66x | 1.81x | 1.92x | 2.20x | | |
| NCF DSCR(6) | 1.45x | 1.66x | 1.81x | 1.92x | 2.09x | | |
| NOI Debt Yield(6) | 8.8% | 10.0% | 10.9% | 11.6% | 13.3% | | |
| NCF Debt Yield(6) | 8.8% | 10.0% | 10.9% | 11.6% | 12.6% | | |
| (1) | Represents (i) percent of Gross Potential Income for all revenue fields and (ii) percent of Effective Gross Income for all other fields. |
| (2) | Based on the underwritten rent roll dated June 1, 2024, with adjustments made for executed leases, pending renewals and tenants that have given notice to vacate. |
| (3) | Contractual Rent Steps were taken through May 2025. |
| (4) | U/W PIL Rent is based on the terms of applicable leases using 2023 sales figures. |
| (5) | U/W Overage Rent is based on breakpoint amounts closest to, but not after, May 31, 2025, and 2023 sales. |
| (6) | Debt service coverage ratios and debt yields are based on the St. Johns Town Center Whole Loan. |
Appraisal. The appraiser concluded to an “As-is” value for the St. Johns Town Center Property of $753,700,000 as of March 21, 2024.
Environmental Matters. According to the Phase I environmental site assessment dated April 4, 2024, there was no evidence of any recognized environmental conditions at the St. Johns Town Center Property.
Market Overview and Competition. The St. Johns Town Center Property is located in the St. Johns submarket of the broader Jacksonville, Florida CBSA, approximately 11.8 miles northwest of the Downtown Jacksonville central business district. The St. Johns Town Center Property lies approximately one mile northeast of Deerwood South Office Park and one mile southwest of the University of North Florida. This area contains Jacksonville’s prime retail, suburban office, and multifamily residential submarkets, as reflected by the submarket’s dominant performance across these sectors.
According the appraiser, following its initial opening in 2005, the St. Johns Town Center Property quickly became the prominent retail destination in Northeast Florida and was the catalyst for a variety of ancillary commercial developments in the area, including the Markets at Town Center, The Strand, TopGolf and numerous full-service and fast food restaurants. The immediate area also includes a number of luxury apartment complexes, supplementing demand at the St. Johns Town Center Property.
| THE INFORMATION IN THIS STRUCTURAL AND COLLATERAL TERM SHEET IS NOT COMPLETE AND MAY BE AMENDED PRIOR TO THE TIME OF SALE. THIS TERM SHEET IS NOT AN OFFER TO SELL THESE SECURITIES AND IT IS NOT A SOLICITATION OF AN OFFER TO BUY THESE SECURITIES IN ANY JURISDICTION WHERE THE OFFER OR SALE IS NOT PERMITTED. |
| | 39 | |
| Retail – Super Regional Mall | Loan #1 | Cut-off Date Balance: | | $100,000,000 |
| 4663 River City Drive | St. Johns Town Center | Cut-off Date LTV: | | 47.8% |
| Jacksonville, FL 32246 | | U/W NCF DSCR: | | 2.09x |
| | | U/W NOI Debt Yield: | | 13.3% |
According to the appraiser, additional proposed mixed-use and retail developments within the southeast corridor of the Butler Boulevard and Interstate 295 interchange are projected to further solidify the viability of this corridor as the dominant retail, office and residential submarkets.
The following table presents certain information relating to the appraiser’s market rent conclusions for the St. Johns Town Center Property:
Market Rent Summary(1)
| | Market Rent (PSF) | Lease Term (Yrs.) | Rent Increase Projections | New Tenant Improvements |
| 0 – 1,500 SF | $115.00 | 7 | 1.5% | $50.00 |
| 1,501 – 2,500 SF | $72.00 | 7 | 1.5% | $50.00 |
| 2,501 – 2,500 SF | $70.00 | 7 | 1.5% | $50.00 |
| 5,000 – 10,000 SF | $65.00 | 7 | 1.5% | $50.00 |
| 10,000 SF + | $50.00 | 7 | 1.5% | $50.00 |
| Restaurants | $45.00 | 7 | 1.5% | $75.00 |
| Jewelers | $130.00 | 7 | 1.5% | $50.00 |
| Power Center 0 – 2,500 SF | $55.00 | 5 | 1.0% | $20.00 |
| Power Center 2,501 – 5,000 SF | $35.00 | 5 | 1.0% | $20.00 |
| Power Center 5,001 – 10,000 SF | $30.00 | 5 | 1.0% | $20.00 |
| Power Center 10,000 SF+ | $18.00 | 5 | 1.0% | $20.00 |
| Major – Lifestyle | $30.00 | 10 | 10% in YR 6 | $30.00 |
| Major – Power Center | $20.00 | 10 | 10% in YR 6 | $30.00 |
| Anchor | $16.00 | 10 | 10% in YR 6 | $30.00 |
| (1) | Information obtained from the appraisal. |
The table below presents certain information relating to comparable retail centers pertaining to the St. Johns Town Center Property identified by the appraiser:
Competitive Set(1)
Property Name | Distance to St. Johns Town Center Property | Grade(2) | Year Built / Renovated | Total NRA | Total Occupancy | Anchor / Major Tenants |
| St. Johns Town Center | | A+ | 2005, 2008,
2014 /NAP | 1,022,042(3)(4) | 93.9% | (3)(4) | Dick’s, Dillard’s, Nordstrom and Target |
| Regency Square Mall | 5.0 miles | D | 1967 / 2001 | 1,390,000 | 70% | | AMC, Dillard’s, Impact Church, Modern Furniture |
| The Avenues | 5.0 miles | C+ | 1990 / 2005 | 1,111,812 | 63% | | Belk, Dillard’s, Forever 21, Furniture Source, JC Penney |
| Orange Park Mall | 13.4 miles | B- | 1975 / 2006 | 959,405 | 86% | | Belk, Dick’s, Dillard’s, JC Penney |
| River City Marketplace | 16.5 miles | A- | 2006 / NAP | 905,499 | 99% | | Best Buy, BJ’s Wholesale Club, Lowe’s, Walmart Supercenter |
| Oakleaf Town Center | 18.5 miles | N/A | 2007 / NAP | 730,501 | 98% | | Hobby Lobby, HomeGoods, Kohl’s, PetSmart, The Home Depot |
| Weighted Average | | | | | 80.6% | (5) | |
| (1) | Information obtained from the appraisal, unless otherwise specified. |
| (2) | According to a third party market data provider. |
| (3) | Based on the underwritten rent roll as of June 1, 2024. |
| (4) | Total NRA and Total Occupancy excludes non-collateral tenants (Dillard’s, Target and Ashley Furniture). |
| (5) | Excludes the St. Johns Town Center Property. |
Escrows. At origination, the borrowers were required to deposit into escrow (i) $8,393,631 for outstanding tenant improvement allowances and leasing commissions associated with 18 tenants and (ii) $1,394,586 for outstanding gap rent associated with 11 tenants.
| THE INFORMATION IN THIS STRUCTURAL AND COLLATERAL TERM SHEET IS NOT COMPLETE AND MAY BE AMENDED PRIOR TO THE TIME OF SALE. THIS TERM SHEET IS NOT AN OFFER TO SELL THESE SECURITIES AND IT IS NOT A SOLICITATION OF AN OFFER TO BUY THESE SECURITIES IN ANY JURISDICTION WHERE THE OFFER OR SALE IS NOT PERMITTED. |
| | 40 | |
| Retail – Super Regional Mall | Loan #1 | Cut-off Date Balance: | | $100,000,000 |
| 4663 River City Drive | St. Johns Town Center | Cut-off Date LTV: | | 47.8% |
| Jacksonville, FL 32246 | | U/W NCF DSCR: | | 2.09x |
| | | U/W NOI Debt Yield: | | 13.3% |
Real Estate Taxes – On a monthly basis during the continuance of a Lockbox Event Period (as defined below) or at any time taxes are not paid by the borrowers prior to the assessment of any penalty, the borrowers are required to escrow 1/12th of the annual estimated tax payments payable during the next ensuing 12 months.
Insurance – During the continuance of a Lockbox Event Period, except if the St. Johns Town Center Property is insured under an acceptable blanket policy, the borrowers are required to escrow 1/12th of the annual estimated insurance payments on a monthly basis.
Replacement Reserve – During the continuance of a Lockbox Event Period, the borrowers are required to escrow approximately $22,000 on a monthly basis for replacements and repairs to be made at the St. Johns Town Center Property.
TI/LC Reserve – During the continuance of a Lockbox Event Period, the borrowers are required to escrow approximately $174,000 on a monthly basis for ongoing leasing reserves.
A “Lockbox Event Period” means the period commencing upon the occurrence of (i) an event of default, (ii) bankruptcy action of the borrowers or property manager (if the property manager is an affiliate of the borrowers) and the property manager is not replaced within 60 days with a qualified manager, or (iii) the debt yield based on the trailing four calendar quarters is less than 10.0% for two consecutive calendar quarters. A Lockbox Event Period will end (a) with respect to clause (i) above, if the cure of the event of default has been accepted by the lender, (b) with respect to clause (ii) above, if the property manager is replaced within 60 days or the bankruptcy action with respect to the property manager is dismissed within 90 days without adverse consequences to the St. Johns Town Center Property, or (c) with respect to clause (iii) above, (A) the debt yield based on the trailing four calendar quarters is greater than or equal to 10.0% for two consecutive calendar quarters (B) the borrowers prepay a portion of the St. Johns Town Center Whole Loan in accordance with the St. Johns Town Center Whole Loan documents in an amount sufficient such that the debt yield is no less than 10.00%, or (C) borrowers deliver to lender (1) cash, (2) U.S. obligations, (3) other securities having a rating reasonably acceptable to lender and for which a rating agency confirmation has been received, or (4) a letter of credit, in each case in an amount equal to an amount which, if applied to the repayment of the St. Johns Town Center Whole Loan would result in a debt yield equal to 10.00%; provided, however, that (A) no event of default or other Lockbox Event Period is continuing, (B) the borrowers have paid all of the lender’s reasonable expenses incurred in connection with the cure of such Lockbox Event Period, including reasonable attorney’s fees and expenses, (C) the borrowers may not cure a Lockbox Event Period more than a total of five times in the aggregate during the term of the St. Johns Town Center Whole Loan, and (D) in no event may the borrowers cure a Lockbox Event Period caused by a bankruptcy action of the borrowers.
Lockbox and Cash Management. The St. Johns Town Center Whole Loan is structured with a hard lockbox and springing cash management. The borrowers and property manager are required to direct the tenants to pay rent directly into the lockbox account, and to deposit any rents otherwise received in such account within two business days after receipt. During the continuance of a Lockbox Event Period, all funds in the lockbox account are required to be swept on a weekly basis and to a lender-controlled cash management account. Funds in the cash management account are required to be applied to debt service and the reserves and escrows described above, with any excess funds (i) to be deposited into an excess cash flow reserve account held by the lender as cash collateral for the St. Johns Town Center Whole Loan, or if (ii) no Lockbox Event Period is continuing, disbursed to the borrowers.
Property Management. The St. Johns Town Center Property is managed by Simon Management Associates, LLC, an affiliate of the borrowers.
Partial Release. Not permitted.
Real Estate Substitution. Not permitted.
Subordinate and Mezzanine Indebtedness. None.
Letter of Credit. None.
Right of First Offer / Right of First Refusal. None.
Ground Lease. Each of the Phase I and Phase II parcels at the St. Johns Town Center Property is subject to a long-term ground lease. Each ground lease is between an affiliate of the respective borrower, St. Johns Town Center, LLC, as fee owner, and such borrower, as tenant. In each case, the affiliated fee owner has mortgaged its fee interest in the St. Johns Town Center Property as collateral for the St. Johns Town Center Whole Loan. In the event of an exercise of remedies under the St. Johns Town Center Whole Loan documents, the lenders would be entitled to foreclose on both the fee and leasehold interests simultaneously and, if desired, eliminate the ground lease structure and take title to the St. Johns Town Center Property in fee (or if the lenders so elected, to retain the ground lease structure and own both fee and leasehold interests). The term of the ground lease for the Phase I parcel is scheduled to expire on March 21, 2064, and the term of the ground lease for the Phase II parcel is scheduled to expire on December 21, 2064.
Terrorism Insurance. The borrowers are required to obtain and maintain property insurance and business interruption insurance for 24 months plus a 365-day extended period of indemnity. Such insurance is required to cover perils of terrorism and acts of terrorism. If the Terrorism Risk Insurance Program Reauthorization Act of 2019 is not in effect, the borrower will only be required to pay for terrorism insurance a maximum of two times the annual insurance premiums payable for the St. Johns Town Center Property at the time with respect to the property and business income or rental income insurance interruption policies (excluding the terrorism and
| THE INFORMATION IN THIS STRUCTURAL AND COLLATERAL TERM SHEET IS NOT COMPLETE AND MAY BE AMENDED PRIOR TO THE TIME OF SALE. THIS TERM SHEET IS NOT AN OFFER TO SELL THESE SECURITIES AND IT IS NOT A SOLICITATION OF AN OFFER TO BUY THESE SECURITIES IN ANY JURISDICTION WHERE THE OFFER OR SALE IS NOT PERMITTED. |
| | 41 | |
| Retail – Super Regional Mall | Loan #1 | Cut-off Date Balance: | | $100,000,000 |
| 4663 River City Drive | St. Johns Town Center | Cut-off Date LTV: | | 47.8% |
| Jacksonville, FL 32246 | | U/W NCF DSCR: | | 2.09x |
| | | U/W NOI Debt Yield: | | 13.3% |
earthquake components of such premiums). See “Risk Factors—Risks Relating to the Mortgage Loans—Terrorism Insurance May Not Be Available for All Mortgaged Properties” in the Preliminary Prospectus.
Pace Loan. The St. Johns Town Center Whole Loan documents permit the borrowers to enter into a PACE loan for an amount not to exceed $5,000,000, subject to the consent of the lender and delivery of a rating agency confirmation.
| THE INFORMATION IN THIS STRUCTURAL AND COLLATERAL TERM SHEET IS NOT COMPLETE AND MAY BE AMENDED PRIOR TO THE TIME OF SALE. THIS TERM SHEET IS NOT AN OFFER TO SELL THESE SECURITIES AND IT IS NOT A SOLICITATION OF AN OFFER TO BUY THESE SECURITIES IN ANY JURISDICTION WHERE THE OFFER OR SALE IS NOT PERMITTED. |
| | 42 | |
| Mixed Use - Merchandise Mart/Retail | Loan #2 | Cut-off Date Balance: | | $90,000,000 |
| 2000 North Stemmons Freeway and | Dallas Market Center | Cut-off Date LTV: | | 37.2% |
| 2050-2100 North Stemmons Freeway | | U/W NCF DSCR: | | 2.46x |
| Dallas, TX 75207 | | U/W NOI Debt Yield: | | 17.0% |
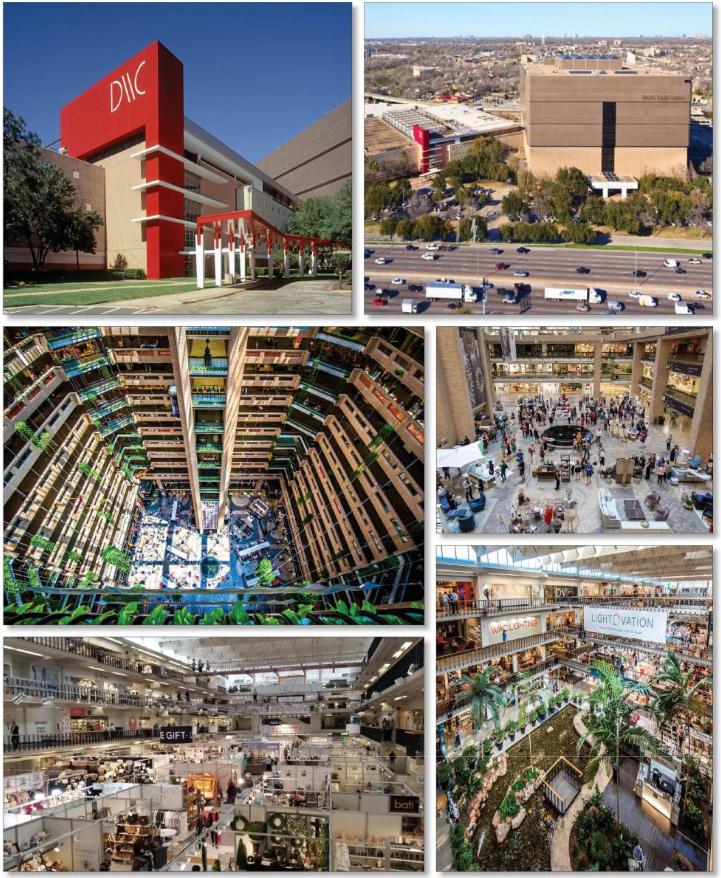
| THE INFORMATION IN THIS STRUCTURAL AND COLLATERAL TERM SHEET IS NOT COMPLETE AND MAY BE AMENDED PRIOR TO THE TIME OF SALE. THIS TERM SHEET IS NOT AN OFFER TO SELL THESE SECURITIES AND IT IS NOT A SOLICITATION OF AN OFFER TO BUY THESE SECURITIES IN ANY JURISDICTION WHERE THE OFFER OR SALE IS NOT PERMITTED. |
| | 43 | |
| Mixed Use - Merchandise Mart/Retail | Loan #2 | Cut-off Date Balance: | | $90,000,000 |
| 2000 North Stemmons Freeway and | Dallas Market Center | Cut-off Date LTV: | | 37.2% |
| 2050-2100 North Stemmons Freeway | | U/W NCF DSCR: | | 2.46x |
| Dallas, TX 75207 | | U/W NOI Debt Yield: | | 17.0% |
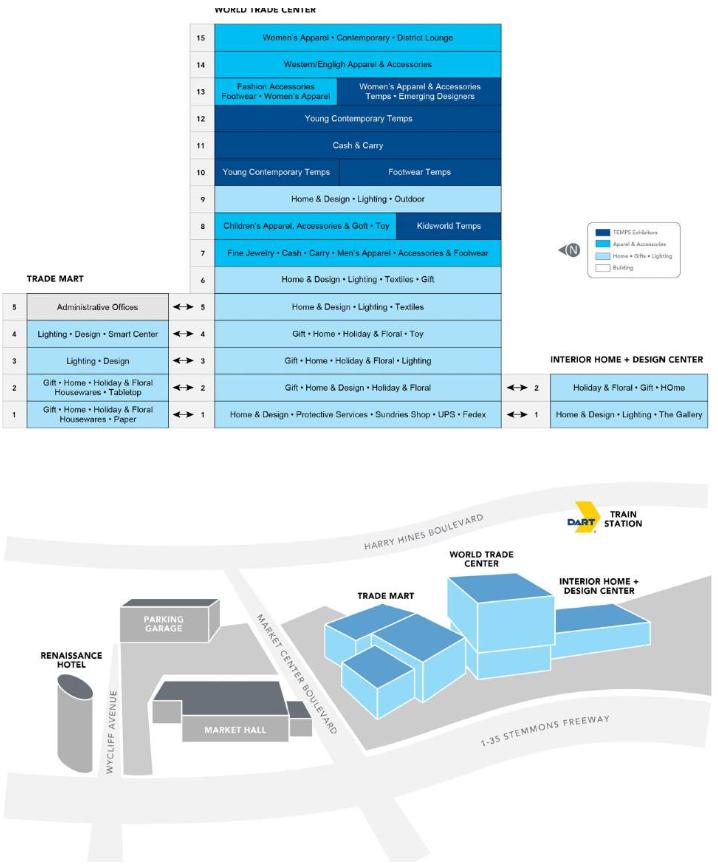
| THE INFORMATION IN THIS STRUCTURAL AND COLLATERAL TERM SHEET IS NOT COMPLETE AND MAY BE AMENDED PRIOR TO THE TIME OF SALE. THIS TERM SHEET IS NOT AN OFFER TO SELL THESE SECURITIES AND IT IS NOT A SOLICITATION OF AN OFFER TO BUY THESE SECURITIES IN ANY JURISDICTION WHERE THE OFFER OR SALE IS NOT PERMITTED. |
| | 44 | |
| Mixed Use - Merchandise Mart/Retail | Loan #2 | Cut-off Date Balance: | | $90,000,000 |
| 2000 North Stemmons Freeway and | Dallas Market Center | Cut-off Date LTV: | | 37.2% |
| 2050-2100 North Stemmons Freeway | | U/W NCF DSCR: | | 2.46x |
| Dallas, TX 75207 | | U/W NOI Debt Yield: | | 17.0% |
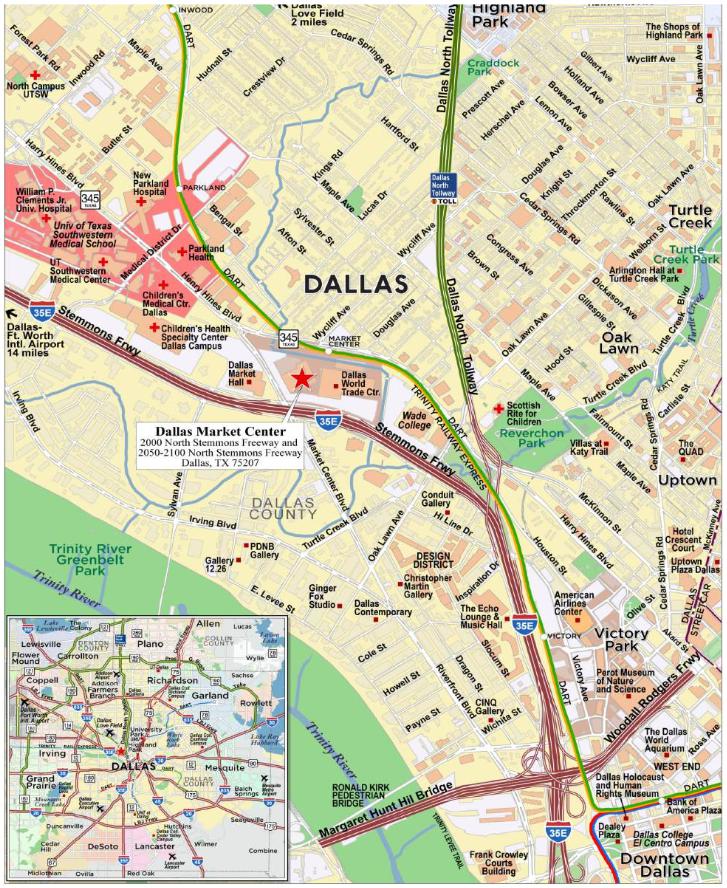
| THE INFORMATION IN THIS STRUCTURAL AND COLLATERAL TERM SHEET IS NOT COMPLETE AND MAY BE AMENDED PRIOR TO THE TIME OF SALE. THIS TERM SHEET IS NOT AN OFFER TO SELL THESE SECURITIES AND IT IS NOT A SOLICITATION OF AN OFFER TO BUY THESE SECURITIES IN ANY JURISDICTION WHERE THE OFFER OR SALE IS NOT PERMITTED. |
| | 45 | |
| No. 2 – Dallas Market Center |
| |
| Mortgage Loan Information | | Mortgaged Property Information |
| Mortgage Loan Seller: | Goldman Sachs Mortgage Company | | Single Asset/Portfolio: | Single Asset |
| Credit Assessment (Fitch/KBRA/Moody’s): | NR/NR/A3(sf) | | Property Type – Subtype: | Mixed Use – Merchandise Mart/Retail |
| Original Principal Balance(1): | $90,000,000 | | Location: | Dallas, TX |
| Cut-off Date Balance(1): | $90,000,000 | | Size(4): | 2,746,550 SF |
| % of Initial Pool Balance: | 8.3% | | Cut-off Date Balance Per SF(1): | $86.29 |
| Loan Purpose: | Refinance | | Maturity Date Balance Per SF(1): | $86.29 |
| Borrower Sponsor: | Dallas Market Center Financial, L.L.C. | | Year Built/Renovated: | 1957, 1958, 1974, 1979/1999,2019 |
| Guarantor: | Dallas Market Center Financial, L.L.C. | | Title Vesting: | Fee |
| Mortgage Rate: | 6.5020% | | Property Manager: | Market Center Management Company L.T.D. (borrower-related) |
| Note Date: | May 31, 2024 | | Current Occupancy (As of): | 91.1% (3/31/2024) |
| Seasoning: | 0 months | | FYE 2024 Occupancy: | 89.5% |
| Maturity Date: | June 6, 2034 | | FYE 2023 Occupancy: | 88.2% |
| IO Period: | 120 months | | FYE 2022 Occupancy: | 83.4% |
| Loan Term (Original): | 120 months | | FYE 2021 Occupancy: | 84.0% |
| Amortization Term (Original): | NAP | | As-Is Appraised Value: | $636,500,000 |
| Loan Amortization Type: | Interest Only | | As-Is Appraised Value Per SF: | $231.75 |
| Call Protection: | L(24),D(89),O(7) | | As-Is Appraisal Valuation Date: | April 27, 2024 |
| Lockbox Type: | Hard/In Place Cash Management | | Underwriting and Financial Information |
| Additional Debt(1)(2): | Yes | | FYE 2024 NOI(5): | $36,427,639 |
| Additional Debt Type (Balance) | Pari Passu ($147,000,000) | | FYE 2023 NOI(5): | $35,092,715 |
| | | | FYE 2022 NOI(5): | $34,255,349 |
| | | FYE 2021 NOI(5): | $22,055,849 |
| Escrows and Reserves(3) | | U/W Revenues: | $93,314,164 |
| | Initial | Monthly | Cap | | U/W Expenses: | $52,910,281 |
| Taxes: | $1,264,708 | $210,785 | NAP | | U/W NOI: | $40,403,884 |
| Insurance: | $0 | Springing | NAP | | U/W NCF: | $38,503,927 |
| Replacement Reserve: | $1,000,000 | Springing | $1,000,000 | | U/W DSCR based on NOI/NCF(1): | 2.59x / 2.46x |
| TI/LC Reserve: | $1,500,000 | Springing | $1,500,000 | | U/W Debt Yield based on NOI/NCF(1): | 17.0% /16.2% |
| Unfunded Obligations Reserve: | $431,802 | $0 | $0 | | U/W Debt Yield at Maturity based on NOI/NCF(1): | 17.0% /16.2% |
| | | | | | Cut-off Date LTV Ratio(1): | 37.2% |
| | | | | | LTV Ratio at Maturity(1): | 37.2% |
| | | | | | | | |
| Sources and Uses |
| Sources | | | | | Uses | | |
| Whole Loan Amount(1) | $237,000,000 | | 99.1% | | Loan Payoff | $231,913,303 | 96.9% |
| Borrower Sponsor Equity | 2,270,000 | | 0.9 | | Upfront reserves | 4,196,510 | 1.8 |
| | | | | | Closing costs | 3,160,187 | 1.3 |
| | | | | | | | |
| Total Sources | $239,270,000 | | 100.0% | | Total Uses | $239,270,000 | 100.0% |
| (1) | The Dallas Market Center Mortgage Loan (as defined below) is part of the Dallas Market Center Whole Loan (as defined below), which is comprised of two pari passu senior promissory notes with an aggregate original principal balance of $237,000,000. The Cut-off Date Balance Per SF, Maturity Date Balance Per SF, U/W DSCR based on NOI/NCF, U/W Debt Yield based on NOI/NCF, U/W Debt Yield at Maturity based on NOI/NCF, Cut-off Date LTV Ratio and LTV Ratio at Maturity presented above are based on the aggregate Cut-off Date principal balance of the Dallas Market Center Whole Loan. |
| (2) | See “The Mortgage Loan” section below for further discussion of additional mortgage debt. |
| (3) | See “Escrows” section below for further discussion of reserve requirements. |
| (4) | Represents permanent collateral SF. There is an additional 696,823 SF that consists of temporary SF included in the collateral, per borrower. |
| (5) | FYE represents a Fiscal Year End at the end of February each annual period. |
| THE INFORMATION IN THIS STRUCTURAL AND COLLATERAL TERM SHEET IS NOT COMPLETE AND MAY BE AMENDED PRIOR TO THE TIME OF SALE. THIS TERM SHEET IS NOT AN OFFER TO SELL THESE SECURITIES AND IT IS NOT A SOLICITATION OF AN OFFER TO BUY THESE SECURITIES IN ANY JURISDICTION WHERE THE OFFER OR SALE IS NOT PERMITTED. |
| | 46 | |
| Mixed Use - Merchandise Mart/Retail | Loan #2 | Cut-off Date Balance: | | $90,000,000 |
| 2000 North Stemmons Freeway and | Dallas Market Center | Cut-off Date LTV: | | 37.2% |
| 2050-2100 North Stemmons Freeway | | U/W NCF DSCR: | | 2.46x |
| Dallas, TX 75207 | | U/W NOI Debt Yield: | | 17.0% |
The Mortgage Loan. The mortgage loan (the "Dallas Market Center Mortgage Loan") is part of a whole loan (the "Dallas Market Center Whole Loan") evidenced by two pari passu notes issued by ITP & WTC FEE, L.P. and WTC-TRADE MART 2015, L.P. in the aggregate original principal amount of $237,000,000. The Dallas Market Center Mortgage Loan is evidenced by the controlling Note A-1, which has an outstanding principal balance as of the Cut-off Date of $90,000,000. The Dallas Market Center Mortgage Loan will be included in the BANK 2024-BNK47 securitization trust and represents approximately 8.3% of the initial pool balance. The Dallas Market Center Whole Loan was originated on May 31, 2024, by Goldman Sachs Bank USA (“GSBI”). The Dallas Market Center Whole Loan is secured by the borrowers’ fee interest in two buildings that comprise a portion of the Dallas Market Center campus located in Dallas, Texas (the "Dallas Market Center Property"). The Dallas Market Center Whole Loan has a 10-year term, is interest-only for the full term and accrues interest a rate of 6.5020% per annum on an Actual/360 basis.
The table below identifies the promissory notes that comprise the Dallas Market Center Whole Loan. The Dallas Market Center Whole Loan will be serviced pursuant to the pooling and servicing agreement for the BANK 2024-BNK47 securitization trust. The relationship between the holders of the Dallas Market Center Whole Loan is governed by a co-lender agreement as described under “Description of the Mortgage Pool—The Whole Loans—The Serviced Pari Passu Whole Loans” and “The Pooling and Servicing Agreement” in the Preliminary Prospectus.
Whole Loan Note Summary
| Note | Original Balance | Cut-off Date Balance | Note Holder | Controlling Piece |
| A-1 | $90,000,000 | $90,000,000 | BANK 2024-BNK47 | Yes |
| A-2(1) | $147,000,000 | $147,000,000 | GSBI | No |
| Total | $237,000,000 | $237,000,000 | | |
| (1) | The notes held by the lenders are expected to be contributed to one or more future securitization transactions or may otherwise be transferred at any time. |
The Borrowers and Borrower Sponsor. The borrowers are ITP & WTC FEE, L.P. and WTC-TRADE MART 2015, L.P., each a single-purpose entity with two independent directors. Legal counsel to the borrowers delivered a non-consolidation opinion in connection with the origination of the Dallas Market Center Whole Loan. The borrower sponsor and non-recourse carveout guarantor (the “Borrower Sponsor”) is Dallas Market Center Financial, L.L.C., a Delaware limited liability company. The borrowers are indirectly owned by Crow Holdings, L.P., which has a substantial stake in the ownership of various businesses, both real estate and non-real estate related, in the United States and Europe. Crow Holdings, L.P. owns and manages the capital of the extended Trammell Crow family, which has had ownership in the Dallas Market Center Property for more than 55 years and is the original developer of the Dallas Market Center Property.
The Property. The Dallas Market Center Property campus includes the Trade Mart, World Trade Center, International Trade Plaza, and Market Hall. Dallas Market Center (“DMC”) opened in 1957 as a single building, International Trade Plaza, with The Trade Mart, Market Hall, and World Trade Center, later delivered in 1958, 1960, and 1974, respectively. The Trade Mart, World Trade Center, and International Trade Plaza are physically connected and have been renovated and expanded several times since delivery. The development currently totals over 5.0 million gross square feet (“SF”) across 110 acres of land.
Dallas Market Center is one of the largest wholesale trade marts in the world, offering approximately 27,000 product lines with over 1,100 permanent showrooms and approximately 800,000 SF of temporary space across the four buildings. It is estimated that DMC attracts over 200,000 visitors each year that conduct approximately $8.5 billion in annual wholesale transactions. DMC hosts 35 trade shows, or markets, each year and owns and produces each trade show with the exception of one. Tenants at the Dallas Market Center Property include manufacturers and representatives for a variety of consumer product categories including gift, lighting, women’s and men’s apparel, fashion accessories, jewelry, western & English riding, children’s, home accents, home textiles, rugs, gourmet, floral, and garden. Typical visitors include retail buyers from major department stores, specialty shops, and online retailers as well as interior designers. Examples of major retailers that consistently visit DMC include Dillard’s, Neiman Marcus, JC Penny, Zappos, Michaels, Hobby Lobby, At Home, Nebraska Furniture Mart, and Wayfair. Access to the Trade Mart, World Trade Center, and International Trade Plaza is restricted to credentialed retail buyers and designers. The Market Hall is the only building in the DMC development that is open to the public and is not a part of the collateral for the Dallas Market Center Mortgage Loan.
The Dallas Market Center Property features numerous amenities to accommodate trade show traffic including on-site food and shipping amenities. The Dallas Market Center Property also offers hotel reservations at preferred rates, shuttle services to and from hotels, and a luggage check on site to accommodate traveling wholesalers and retail buyers. There is also a DART (Dallas Area Rapid Transit) rail station located directly adjacent to the World Trade Center. The Dallas Market Center management team works with surrounding hotels like the Hilton Anatole (owned by Crow Holdings) and Renaissance Hotel to reserve room blocks years in advance. It is estimated that DMC buyers and vendors purchase over 300,000 airline seats and 720,000 hotel room nights annually.
The permanent showroom space is currently 91.1% leased to over 800 tenants. No single tenant represents more than 1.3% of net rentable area SF or 1.8% of underwritten base rent. Permanent showroom tenants typically sign three to five year leases. These tenants have access to their showrooms 365 days per year; such showrooms are open daily in most cases. The permanent showroom tenants at the Dallas Market Center Property are classified in 16 groups, determined by product category and location within the DMC. The largest groups are gifts (26.9% of total permanent SF and 30.3% of total rent) and lighting (18.1% of total SF and 21.9% of total rent). Apparel tenants are spread across multiple groups. The permanent square footage also includes a small office / storage component and amenity space, which represent 1.3% and 1.4% of total permanent SF, respectively.
| THE INFORMATION IN THIS STRUCTURAL AND COLLATERAL TERM SHEET IS NOT COMPLETE AND MAY BE AMENDED PRIOR TO THE TIME OF SALE. THIS TERM SHEET IS NOT AN OFFER TO SELL THESE SECURITIES AND IT IS NOT A SOLICITATION OF AN OFFER TO BUY THESE SECURITIES IN ANY JURISDICTION WHERE THE OFFER OR SALE IS NOT PERMITTED. |
| | 47 | |
| Mixed Use - Merchandise Mart/Retail | Loan #2 | Cut-off Date Balance: | | $90,000,000 |
| 2000 North Stemmons Freeway and | Dallas Market Center | Cut-off Date LTV: | | 37.2% |
| 2050-2100 North Stemmons Freeway | | U/W NCF DSCR: | | 2.46x |
| Dallas, TX 75207 | | U/W NOI Debt Yield: | | 17.0% |
The temporary space is comprised of 632,800 SF of space designated for temporary trade show exhibition booths and 64,023 SF of Dallas Suites, per borrower. Most markets held at DMC involve temporary exhibition tenants in addition to permanent showroom tenants. The temporary exhibition component of each market typically lasts four to five days. During this time, temporary exhibition tenants lease a booth space, display and sell products from their booth, and leave after the trade show concludes. Dallas Suites are leased to major retailers on a temporary basis. These suites are typically used for “private buys” when major retailers request that wholesalers bring their product to a centralized private location (as opposed to retail buyers visiting various wholesale showrooms).
Whether a tenant leases permanent showroom space or temporary exhibition space depends on their distribution model and industry in some cases. Most notably, permanent showroom tenants benefit from year-round access to their showrooms, daily retail buyer traffic, and the ability to give their showroom its own look and feel while temporary exhibitors benefit from flexibility and cost savings.
The following table presents a summary regarding the Sales by Tenant Category/Industry at the Dallas Market Center Property:
| Sales by Tenant Category/Industry(1) |
| Tenant Category / Industry | Type | Total SF | % of Total
SF | Leased SF | % Leased | PSF | UW Annual Base Rent | % of
UW
Annual
Base
Rent |
| GIFTS | Hard Goods | 737,648 | 26.9% | 707,951 | 96.0% | $26.65 | $18,865,937 | 30.3% |
| LIGHTING | Hard Goods | 497,188 | 18.1% | 456,112 | 91.7% | $29.92 | $13,645,096 | 21.9% |
| 15TH FLOOR | Soft Goods | 138,837 | 5.1% | 136,173 | 98.1% | $28.71 | $3,909,427 | 6.3% |
| 14th FLOOR | Soft Goods | 140,047 | 5.1% | 140,047 | 100.0% | $25.94 | $3,633,121 | 5.8% |
| JEWELRY | Soft Goods | 124,165 | 4.5% | 113,457 | 91.4% | $29.27 | $3,321,169 | 5.3% |
| IHDC 1 | Hard Goods | 157,324 | 5.7% | 149,228 | 94.9% | $22.25 | $3,319,828 | 5.3% |
| RES. DESIGN | Hard Goods | 133,592 | 4.9% | 133,592 | 100.0% | $19.00 | $2,538,818 | 4.1% |
| 13th FLOOR | Soft Goods | 84,091 | 3.1% | 82,029 | 97.5% | $29.63 | $2,430,409 | 3.9% |
| ACCENT 5 | Hard Goods | 141,644 | 5.2% | 131,802 | 93.1% | $17.24 | $2,272,868 | 3.7% |
| ACCENT 6 | Hard Goods | 136,757 | 5.0% | 126,918 | 92.8% | $16.78 | $2,129,445 | 3.4% |
| CHILDRENS | Soft Goods | 78,041 | 2.8% | 71,860 | 92.1% | $24.32 | $1,747,391 | 2.8% |
| IHDC 2 | Hard Goods | 167,438 | 6.1% | 88,071 | 52.6% | $19.73 | $1,737,505 | 2.8% |
| WTC 1st FLOOR | Hard Goods | 46,325 | 1.7% | 46,325 | 100.0% | $26.93 | $1,247,642 | 2.0% |
| WESTERN ON 10 | Soft Goods | 66,606 | 2.4% | 25,703 | 38.6% | $33.60 | $863,604 | 1.4% |
| MENSWEAR | Soft Goods | 19,709 | 0.7% | 19,709 | 100.0% | $20.75 | $408,936 | 0.7% |
| OFFICE/STORAGE | Other | 35,481 | 1.3% | 31,898 | 89.9% | $4.52 | $144,151 | 0.2% |
| DEC. ACC. | Hard Goods | 3,108 | 0.1% | 2,253 | 72.5% | $11.00 | $24,783 | 0.0% |
| AMENITY | Other | 38,549 | 1.4% | 38,549 | 100.0% | $0.00 | $0 | 0.0% |
| Total | | 2,746,550 | 100.0% | 2,501,677 | 91.1% | $24.88 | $62,240,131 | 100.0% |
| (1) | Based on the underwritten rent roll dated March 31, 2024. |
The following table presents a summary regarding the Rental Revenue by Permanent/Temporary status at the Dallas Market Center Property:
| | FYE 2018(1) | FYE 2019(1) | FYE 2020(1) | FYE 2021(1) | FYE 2022(1) | FYE 2023(1) | FYE 2024(1) |
| Permanent Revenue ($) | $56,485,618 | 55,366,986 | 54,948,062 | 48,867,662 | 52,589,621 | 55,234,047 | 57,760,787 |
| Temporary Revenue ($) | $11,212,786 | 11,705,982 | 12,210,858 | 7,670,144 | 17,717,485 | 23,786,176 | 25,912,064 |
| Total Rental Revenue ($) | $67,698,404 | 67,072,968 | 67,158,920 | 56,537,806 | 70,307,106 | 79,020,223 | 83,672,851 |
| (1) | FYE represents a Fiscal Year End at the end of February each annual period. |
| THE INFORMATION IN THIS STRUCTURAL AND COLLATERAL TERM SHEET IS NOT COMPLETE AND MAY BE AMENDED PRIOR TO THE TIME OF SALE. THIS TERM SHEET IS NOT AN OFFER TO SELL THESE SECURITIES AND IT IS NOT A SOLICITATION OF AN OFFER TO BUY THESE SECURITIES IN ANY JURISDICTION WHERE THE OFFER OR SALE IS NOT PERMITTED. |
| | 48 | |
| Mixed Use - Merchandise Mart/Retail | Loan #2 | Cut-off Date Balance: | | $90,000,000 |
| 2000 North Stemmons Freeway and | Dallas Market Center | Cut-off Date LTV: | | 37.2% |
| 2050-2100 North Stemmons Freeway | | U/W NCF DSCR: | | 2.46x |
| Dallas, TX 75207 | | U/W NOI Debt Yield: | | 17.0% |
The following table presents a summary regarding the major tenants at the Dallas Market Center Property:
Major Tenants(1)(2)
| Tenant Name | Credit Rating (Fitch/Moody’s/ S&P)(3) | Tenant NRSF | % of NRSF | Annual U/W Rent | % of Total Annual U/W Rent | Annual U/W Rent PSF | Lease Expiration Date | Ext. Options | Term. Option (Y/N) |
| ONECOAST, LLC | NR/NR/NR | 31,764 | 1.2% | $1,143,510 | 1.8% | $36.00 | 3/31/2031 | None | N |
| GOETZ, INC. | NR/NR/NR | 36,653 | 1.3% | $929,797 | 1.5% | $25.37 | 9/30/2025 | None | N |
| DIVERSE MARKETING | NR/NR/NR | 34,747 | 1.3% | $857,100 | 1.4% | $24.67 | Various | None | N |
| KUZCO LIGHTING, LLC | NR/NR/NR | 23,667 | 0.9% | $775,804 | 1.2% | $32.78 | 8/31/2025 | None | N |
| VISUAL COMFORT & CO. | NR/NR/NR | 26,027 | 0.9% | $713,964 | 1.1% | $27.43 | 7/31/2028 | None | N |
| ANNE MCGILVRAY AND COMPANY | NR/NR/NR | 23,498 | 0.9% | $702,396 | 1.1% | $29.89 | Various | None | N |
| IVYSTONE GROUP, LLC | NR/NR/NR | 25892 | 0.9% | $617,742 | 1.0% | $23.86 | Various | None | N |
| PROGRESS LIGHTING, INC. | NR/NR/NR | 20,712 | 0.8% | $612,247 | 1.0% | $29.56 | 9/30/2027 | None | N |
DON BERNARD & ASSOCIATES,
LLC | NR/NR/NR | 23,174 | 0.8% | $602,107 | 1.0% | $25.98 | Various | None | N |
| K. GRAVES & A. GRAVES, INC. | NR/NR/NR | 34,517 | 1.3% | $571,040 | 0.9% | $16.54 | 11/30/2026 | None | N |
| Total/Wtd. Avg. | | 280,651 | 10.2% | $7,525,706 | 12.1% | $26.82 | | | |
| | | | | | | | | | |
| Non-Major Tenants | | 2,221,026 | 80.9% | 54,714,426 | 87.9% | $24.63 | | | |
| | | | | | | | | | |
| Occupied Collateral Total | | 2,501,677 | 91.1% | $62,240,131 | 100.0% | $24.88 | | | |
| Vacant Space | | 244,873 | 8.9% | | | | | | |
| Total/Wtd. Avg. | | 2,746,550 | 100.0% | | | | | | |
| (1) | Only includes tenants who occupy permanent space. |
| (2) | Based on the underwritten rent roll dated March 31, 2024, inclusive of rent steps through May 31, 2025. |
| (3) | Certain ratings are those of the parent company whether or not the parent guarantees the lease. |
The following table presents certain information relating to the lease rollover schedule at the Dallas Market Center Property:
Lease Expiration Schedule(1)(2)(3)
Year Ending
December 31, | No. of Leases Expiring | Expiring
NRSF | % of
Total
NRSF | Cumulative
Expiring
NRSF | Cumulative
% of Total
NRSF | Annual
U/W
Base Rent | % of Total
Annual
U/W Base
Rent | Annual
U/W
Base Rent
PSF |
| MTM | 38 | 67,710 | 2.5% | 67,710 | 2.5% | 294,975 | 0.5% | $4.36 |
| 2024 | 194 | 342,834 | 12.5% | 410,544 | 14.9% | 8,176,047 | 13.1% | $23.85 |
| 2025 | 295 | 686,955 | 25.0% | 1,097,500 | 40.0% | $17,018,345 | 27.3% | $24.77 |
| 2026 | 208 | 521,007 | 19.0% | 1,618,506 | 58.9% | $13,402,426 | 21.5% | $25.72 |
| 2027 | 87 | 421,410 | 15.3% | 2,039,916 | 74.3% | $11,015,915 | 17.7% | $26.14 |
| 2028 | 44 | 240,068 | 8.7% | 2,279,984 | 83.0% | $6,209,708 | 10.0% | $25.87 |
| 2029 | 28 | 152,892 | 5.6% | 2,432,876 | 88.6% | $3,998,014 | 6.4% | $26.15 |
| 2030 | 2 | 27,216 | 1.0% | 2,460,092 | 89.6% | $809,644 | 1.3% | $29.75 |
| 2031 | 1 | 31,764 | 1.2% | 2,491,856 | 90.7% | $1,143,510 | 1.8% | $36.00 |
| 2032 | 1 | 8,517 | 0.3% | 2,500,373 | 91.0% | $127,755 | 0.2% | $15.00 |
| 2033 | 0 | 0 | 0.0% | 2,500,373 | 91.0% | $0 | 0.0% | $0.00 |
| 2034 | 0 | 0 | 0.0% | 2,500,373 | 91.0% | $0 | 0.0% | $0.00 |
| 2035 & Beyond | 1 | 1,303 | 0.0% | 2,501,677 | 91.1% | $43,792 | 0.1% | $33.60 |
| Vacant | 0 | 244,873 | 8.9% | 2,746,550 | 100.0% | $0 | 0.0% | $0.00 |
| Total/Weighted Average | 899 | 2,746,550 | 100.0% | | | 62,240,131 | 100.0% | $24.88(4) |
| (1) | Based on the underwritten rent roll dated March 31, 2024, inclusive of rent steps through May 31, 2025. |
| (2) | Certain tenants may have lease termination options that are exercisable prior to the stated expiration date of the subject lease or leases which are not considered in the Lease Expiration Schedule. |
| (3) | Excludes amenity and borrower operated spaces. |
| (4) | Total/Weighted Average Annual U/W Base Rent PSF excludes vacant space. |
| THE INFORMATION IN THIS STRUCTURAL AND COLLATERAL TERM SHEET IS NOT COMPLETE AND MAY BE AMENDED PRIOR TO THE TIME OF SALE. THIS TERM SHEET IS NOT AN OFFER TO SELL THESE SECURITIES AND IT IS NOT A SOLICITATION OF AN OFFER TO BUY THESE SECURITIES IN ANY JURISDICTION WHERE THE OFFER OR SALE IS NOT PERMITTED. |
| | 49 | |
| Mixed Use - Merchandise Mart/Retail | Loan #2 | Cut-off Date Balance: | | $90,000,000 |
| 2000 North Stemmons Freeway and | Dallas Market Center | Cut-off Date LTV: | | 37.2% |
| 2050-2100 North Stemmons Freeway | | U/W NCF DSCR: | | 2.46x |
| Dallas, TX 75207 | | U/W NOI Debt Yield: | | 17.0% |
The following table presents historical occupancy percentages at the Dallas Market Center Property:
Historical Occupancy(1)(2)
FYE 2020 | FYE 2021 | FYE 2022 | FYE 2023 | FYE 2024 | 3/31/2024 |
| 86.0% | 84.0% | 83.4% | 88.2% | 89.5% | 91.1% |
| (1) | Information obtained from the Dallas Market Center borrower. |
| (2) | FYE represents a Fiscal Year End at the end of February each annual period. |
Operating History and Underwritten Net Cash Flow. The following table presents certain information relating to the historical operating performance and underwritten net cash flow at the Dallas Market Center Property:
Cash Flow Analysis
| | FYE February
2020 | FYE February
2021 | FYE February
2022 | FYE February
2023 | FYE February
2024 | U/W | %(1) | U/W $
per SF(2) |
| Base Rent (Permanent)(3) | $54,948,062 | $48,867,662 | $52,589,621 | $55,234,047 | $57,760,787 | $62,240,131 | 62.5% | $22.66 |
| Base Rent (Temporary) | 12,210,858 | 7,670,144 | 17,717,485 | 23,786,176 | 25,912,064 | 25,577,623 | 25.7% | $9.31 |
| Grossed Up Vacant Space(4) | 0 | 0 | 0 | 0 | 0 | 6,026,679 | 6.0% | $2.19 |
| Ground Rent Income(5) | 0 | 0 | 0 | 0 | 0 | 256,356 | 0.3% | $0.09 |
| Other Revenue | 4,134,506 | 2,166,624 | 4,279,949 | 5,513,897 | 5,583,678 | 5,522,654 | 5.5% | $2.01 |
| Net Rental Income | $71,293,426 | $58,704,430 | $74,587,055 | $84,534,120 | $89,256,529 | $99,623,443 | 100.0% | $36.27 |
| Less Vacancy | 0 | 0 | 0 | 0 | 0 | (6,026,679) | (6.0%) | ($2.19) |
| Less Credit Loss | (198,600) | (2,330,350) | 955,400 | 316,629 | (124,600) | (282,600) | (0.3%) | ($0.10) |
| Effective Gross Income | $71,094,826 | $56,374,080 | $75,542,455 | $84,850,749 | $89,131,929 | $93,314,164 | 93.7% | $33.98 |
| | | | | | | | | |
| Real Estate Taxes | $2,919,551 | $2,822,306 | $2,667,899 | $2,684,342 | $2,489,048 | $2,999,888 | 3.2% | $1.09 |
| Insurance | 721,385 | 894,142 | 1,034,696 | 1,283,145 | 3,305,875 | 3,759,707 | 4.0% | $1.37 |
| Ground Rent | 256,365 | 256,365 | 256,365 | 256,365 | 256,356 | 256,356 | 0.3% | $0.09 |
| Management Fee | 2,682,073 | 2,621,244 | 2,708,560 | 3,331,952 | 3,404,981 | 3,732,567 | 4.0% | $1.36 |
| Other Expenses | 36,268,938 | 27,724,174 | 34,619,586 | 42,202,230 | 43,248,030 | 42,161,763 | 45.2% | $15.35 |
| Total Expenses | $42,848,312 | $34,318,231 | $41,287,106 | $49,758,034 | $52,704,290 | $52,910,281 | 56.7% | $19.26 |
| | | | | | | | | |
| Net Operating Income | $28,246,514 | $22,055,849 | $34,255,349 | $35,092,715 | $36,427,639 | $40,403,884 | 43.3% | $14.71 |
| TI/LC(6) | 0 | 0 | 0 | 0 | 0 | 1,268,250 | 1.4% | 0.46 |
| Capital Expenditures | 0 | 0 | 0 | 0 | 0 | 631,706 | 0.7% | 0.23 |
| Net Cash Flow | $28,246,514 | $22,055,849 | $34,255,349 | $35,092,715 | $36,427,639 | $38,503,927 | 41.3% | $14.02 |
| | | | | | | | | |
| NOI DSCR(7) | 1.81x | 1.41x | 2.19x | 2.25x | 2.33x | 2.59x | | |
| NCF DSCR(7) | 1.81x | 1.41x | 2.19x | 2.25x | 2.33x | 2.46x | | |
| NOI Debt Yield(7) | 11.9% | 9.3% | 14.5% | 14.8% | 15.4% | 17.0% | | |
| NCF Debt Yield(7) | 11.9% | 9.3% | 14.5% | 14.8% | 15.4% | 16.2% | | |
| (1) | Represents (i) percent of Net Rental Income for all revenue fields and Vacancy and (ii) percent of Effective Gross Income for all other fields. |
| (2) | U/W $ per SF is based on the total permanent collateral SF of 2,746,550. |
| (3) | Base Rent (Permanent) is based on the underwritten rent roll dated March 31, 2024, inclusive of rent steps through May 31, 2025. |
| (4) | Grossed Up Vacant Space is based on grossed up rent for vacant permanent suites. |
| (5) | Ground Rent Income is net-zero with ground rent given the mortgage alone is secured by both the leasehold and leased fee interest. |
| (6) | Leasing Commissions are not provided, given all leasing is handled in-house by Dallas Market Center property management. |
| (7) | Debt service coverage ratios and debt yields are based on the Dallas Market Center Whole Loan. |
| THE INFORMATION IN THIS STRUCTURAL AND COLLATERAL TERM SHEET IS NOT COMPLETE AND MAY BE AMENDED PRIOR TO THE TIME OF SALE. THIS TERM SHEET IS NOT AN OFFER TO SELL THESE SECURITIES AND IT IS NOT A SOLICITATION OF AN OFFER TO BUY THESE SECURITIES IN ANY JURISDICTION WHERE THE OFFER OR SALE IS NOT PERMITTED. |
| | 50 | |
| Mixed Use - Merchandise Mart/Retail | Loan #2 | Cut-off Date Balance: | | $90,000,000 |
| 2000 North Stemmons Freeway and | Dallas Market Center | Cut-off Date LTV: | | 37.2% |
| 2050-2100 North Stemmons Freeway | | U/W NCF DSCR: | | 2.46x |
| Dallas, TX 75207 | | U/W NOI Debt Yield: | | 17.0% |
Appraisal. According to the appraisal, the Dallas Market Center Property had an “as-is” appraised value of $636,500,000 as of April 27, 2024.
Environmental Matters. The Phase I environmental assessment of the Dallas Market Center Property dated May 15, 2024, identified no recognized environmental conditions, controlled environmental conditions or significant data gaps. See “Description of the Mortgage Pool—Environmental Considerations” in the Preliminary Prospectus.
Market Overview and Competition. Wholesale trade marts, also known as market centers, are permanent venues that provide buyers of wholesale goods the opportunity to view and purchase a variety of merchandise in one location. Trade marts offer manufacturers and sales representatives centralized permanent showrooms for year-round exhibition of their products. By leasing permanent showroom space, a manufacturer or sales representative gains access to a year-round sales facility as well as the ability to participate in various trade shows that are held throughout the year. Some trade marts, including Dallas Market Center, offer temporary trade show exhibition space that allows manufactures or sales representatives to showcase their products during specific trade shows throughout the year. Temporary space can also potentially serve as an incubator for permanent tenants. Once tenants have leased temporary exhibition space, the hosting market is often well positioned to convert them into permanent tenants.
Trade shows, or markets, are short-term, seasonally recurring events that typically last between two to seven days and focus on a specific industry or related group of industries. A trade show is typically held at the same location each year and serves as both a transactional opportunity and a networking and educational experience for members of the retail community. There are thousands of different trade shows held annually across the globe at wholesale trade marts, arenas, and convention centers. Trade shows differ in size and geographic focus by catering to local, regional, national, or international buyers. Trade shows are most prominent in industries with many manufacturers and products that change frequently or require physical inspection before purchase. Successful trade shows have a broad offering of merchandise and are well attended by a variety of retail buyers.
The Dallas Market Center Property has a limited competitive set given its size and scope. The Dallas Market Center Property has three true competitors, which are all owned and operated by the same company, Andmore (previously International Market Centers).
— Andmore Atlanta Market: The Andmore Atlanta Market is primarily active in the gift industry, with a small collection of apparel and home products. Rental rates at the market are reportedly higher than DMC, causing many tenants to vacate the property after not reaching desired returns. The Atlanta Market also lacks strong daily traffic, compared to DMC which receives daily business from retail buyers across all industry groups. Lastly, the pandemic exacerbated safety concerns in the area surrounding the Atlanta Market, causing a decrease in attendance from retail buyers and a subsequent decrease in demand from wholesalers.
— Andmore High Point Market: The Andmore High Point Market is primarily competitive in the home industry. The market spans across multiple buildings and several blocks, making it more challenging to navigate compared to DMC, which is connected and organized by industry group. High Point is also comparatively expensive to travel to and does not have as well suited of an infrastructure to accommodate trade show demand. Lastly, retailers and designers tend to browse at High Point Market and do not often “paper” orders. Wholesalers at Dallas Market Center reportedly regularly receive orders from retail buyers that initially browsed at High Point Market.
— Andmore Las Vegas Market: The Andmore Las Vegas Market is primarily active in the home & design and gift industries. The market is reportedly struggling with rising vacancy rates, causing a domino effect of vacancies among other tenants as “industry mass” weakens. Without industry mass, retail buyers do not attend markets and sales decline. The Las Vegas Market also incurs higher expenses and spends more time organizing trade shows due to unions. Lastly, retail buyers’ dwell time at the property is reportedly brief, as many visiting retailers make time to visit tourist attractions in the city.
| THE INFORMATION IN THIS STRUCTURAL AND COLLATERAL TERM SHEET IS NOT COMPLETE AND MAY BE AMENDED PRIOR TO THE TIME OF SALE. THIS TERM SHEET IS NOT AN OFFER TO SELL THESE SECURITIES AND IT IS NOT A SOLICITATION OF AN OFFER TO BUY THESE SECURITIES IN ANY JURISDICTION WHERE THE OFFER OR SALE IS NOT PERMITTED. |
| | 51 | |
| Mixed Use - Merchandise Mart/Retail | Loan #2 | Cut-off Date Balance: | | $90,000,000 |
| 2000 North Stemmons Freeway and | Dallas Market Center | Cut-off Date LTV: | | 37.2% |
| 2050-2100 North Stemmons Freeway | | U/W NCF DSCR: | | 2.46x |
| Dallas, TX 75207 | | U/W NOI Debt Yield: | | 17.0% |
Escrows.
On the origination date of the Dallas Market Center Whole Loan, the borrowers funded escrow reserves in the amount of (i) $1,500,000 for tenant improvements and leasing commissions and (ii) $1,000,000 for capital expenditures.
In addition, on each due date, the borrowers will be required to fund (i) a tax reserve equal to one-twelfth of the amount that the lender reasonably estimates will be necessary to pay taxes over the then succeeding 12-month period, initially estimated to be $210,785, (ii) an insurance reserve equal to one-twelfth of the amount that the lender reasonably estimates will be necessary to carry the insurance premiums over the then succeeding 12-month period, (iii) a tenant improvements and leasing commissions reserve on a springing basis (capped at $1,500,000) and (iv) a capital expenditures reserve on a springing basis (capped at $1,000,000).
However, the borrowers will not be required to fund a reserve in respect of insurance premiums so long as (i) no event of default under the Dallas Market Center Whole Loan has occurred or is continuing, (ii) the borrowers maintain the required insurance under one or more blanket policies and (iii) the borrowers deliver evidence reasonably acceptable to the lender that the insurance premiums have been paid.
Lockbox and Cash Management. The Dallas Market Center Whole Loan is structured with a hard lockbox and in place cash management. The Dallas Market Center Whole Loan documents require the borrowers to direct tenants to pay rent directly to a lender-controlled lockbox account. All amounts in the lockbox account will be swept weekly to the lender-controlled cash management account. On a weekly basis, other than during a Dallas Market Center Trigger Period (as defined below) or an event of default under the Dallas Market Center Whole Loan, all amounts on deposit in the cash management account in excess of the amounts required to be paid to or reserved with the lender on the next due date will be swept into a borrower-controlled operating account. On each due date during a Dallas Market Center Trigger Period or, at the lender's discretion, during an event of default under the Dallas Market Center Whole Loan, the Dallas Market Center Whole Loan documents require that all amounts on deposit in the cash management account be used to pay debt service, required reserves and (other than during a Dallas Market Center Trigger Period or an event of default under the Dallas Market Center Whole Loan) operating expenses, and all remaining amounts be reserved in an excess cash flow reserve account. On each due date during which no Dallas Market Center Trigger Period or event of default is continuing, the Dallas Market Center Whole Loan documents require that all amounts on deposit in the cash management account, after the payment of debt service and required reserves, be swept into a borrower-controlled operating account. During the continuance of an event of default under the Dallas Market Center Whole Loan, the lender may apply all funds on deposit in any of the accounts constituting collateral for the Dallas Market Center Whole Loan to amounts payable under the Dallas Market Center Whole Loan documents and/or toward the payment of expenses of the Dallas Market Center Property, in such order of priority as the lender may determine.
A "Dallas Market Center Trigger Period" means (i) any period from (a) the conclusion of any 12-month period (ending on the last day of a fiscal quarter) during which the debt service coverage ratio is less than 1.40x to (b) the conclusion of the second of any two 12-month periods (ending on the last day of a fiscal quarter) ending in consecutive fiscal quarters thereafter during each of which the debt service coverage ratio is equal to or greater than 1.40x; and (ii) if the financial reports required under the Dallas Market Center Whole Loan documents are not delivered to the lender as and when required (subject in any event to the notice and cure period specific in the Dallas Market Center Whole Loan documents), a Dallas Market Center Trigger Period will be deemed to have commenced and be ongoing, unless and until such reports are delivered and they indicate that, in fact, no Dallas Market Center Trigger Period is ongoing.
Additional Secured Indebtedness (not including trade debts). The borrowers are permitted under the Dallas Market Center Whole Loan to accept unsecured loans made by the borrowers’ partners to the borrowers in accordance with the terms of the borrowers’ organizational documents and not exceeding $15,000,000 in the aggregate, provided that each such loan is required to be subject to the terms of a subordination and standstill agreement in a form acceptable to the lender under the Dallas Market Center Whole Loan and to be entered into by the applicable holder of such loan in favor of the lender under the Dallas Market Center Whole Loan.
Real Estate Substitution. Not permitted.
Property Management. The Dallas Market Center Property is managed by Market Center Management Company, Ltd. pursuant to a management agreement. Under the Dallas Market Center Whole Loan documents, the Dallas Market Center Property must remain managed by Market Center Management Company, Ltd. or any other management company approved by the lender and with respect to which a rating agency confirmation has been received. The lender has the right to terminate, or require the borrowers to terminate, the property manager and to replace them with a property manager selected by the lender (i) during the continuance of an event of default under the Dallas Market Center Whole Loan, (ii) following any foreclosure, conveyance in lieu of foreclosure or other similar transaction, (iii) during the continuance of a material default by the property manager under the management agreement (after the expiration of any applicable notice and/or cure periods), (iv) if the property manager files for, or is the subject of a petition in, bankruptcy or (v) if a trustee or receiver is appointed for the property manager's assets or the property manager makes an assignment for the benefit of its creditors or is adjudicated insolvent, provided that any replacement property manager will be selected by the borrowers and approved by the lender (provided further that in the event of default, any such replacement property manager will be selected by the lender).
Subordinate and Mezzanine Indebtedness. None.
| THE INFORMATION IN THIS STRUCTURAL AND COLLATERAL TERM SHEET IS NOT COMPLETE AND MAY BE AMENDED PRIOR TO THE TIME OF SALE. THIS TERM SHEET IS NOT AN OFFER TO SELL THESE SECURITIES AND IT IS NOT A SOLICITATION OF AN OFFER TO BUY THESE SECURITIES IN ANY JURISDICTION WHERE THE OFFER OR SALE IS NOT PERMITTED. |
| | 52 | |
| Mixed Use - Merchandise Mart/Retail | Loan #2 | Cut-off Date Balance: | | $90,000,000 |
| 2000 North Stemmons Freeway and | Dallas Market Center | Cut-off Date LTV: | | 37.2% |
| 2050-2100 North Stemmons Freeway | | U/W NCF DSCR: | | 2.46x |
| Dallas, TX 75207 | | U/W NOI Debt Yield: | | 17.0% |
Rights of First Offer / Rights of First Refusal. None.
Letter of Credit. None.
Terrorism Insurance. So long as TRIPRA or a similar or subsequent statute is in effect, the borrowers are required to maintain terrorism insurance for foreign and domestic acts (as those terms are defined in TRIPRA or a similar or subsequent statute) in an amount equal to the full replacement cost of the Dallas Market Center Property (plus 18 months of rental loss and/or business interruption coverage and containing an extended period of indemnity endorsement covering the 12-month period commencing on the date on which the Dallas Market Center Property has been restored). If TRIPRA or a similar or subsequent statute is not in effect, then provided that terrorism insurance is commercially available, the borrowers will be required to carry terrorism insurance throughout the term of the Dallas Market Center Whole Loan as described in the preceding sentence, but will not be required to spend more than two times the amount of the insurance premium that is payable at that time in respect of the property and business interruption/rental loss insurance required under the Dallas Market Center Whole Loan documents (without giving effect to the cost of terrorism and earthquake components of such property and business interruption/rental loss insurance), and if the cost of terrorism insurance exceeds such amount, then the borrowers will be required to purchase the maximum amount of terrorism insurance available with funds equal to such amount. In either such case, terrorism insurance may not have a deductible in excess of $50,000. The required terrorism insurance may be included in a blanket policy, provided that the borrowers provide evidence satisfactory to the lender that the insurance premiums for the Dallas Market Center Property are separately allocated to the Dallas Market Center Property and that the policy will provide the same protection as a separate policy. See “Risk Factors—Risks Relating to the Mortgage Loans—Terrorism Insurance May Not Be Available for All Mortgaged Properties” in the Preliminary Prospectus.
| THE INFORMATION IN THIS STRUCTURAL AND COLLATERAL TERM SHEET IS NOT COMPLETE AND MAY BE AMENDED PRIOR TO THE TIME OF SALE. THIS TERM SHEET IS NOT AN OFFER TO SELL THESE SECURITIES AND IT IS NOT A SOLICITATION OF AN OFFER TO BUY THESE SECURITIES IN ANY JURISDICTION WHERE THE OFFER OR SALE IS NOT PERMITTED. |
| | 53 | |
| Retail - Super Regional Mall | Loan #3 | Cut-off Date Balance: | | $79,500,000 |
| 5 Woodfield Mall | Woodfield Mall | Cut-off Date LTV: | | 38.0% |
| Schaumburg, IL 60173 | | U/W NCF DSCR: | | 2.42x |
| | | U/W NOI Debt Yield: | | 16.0% |
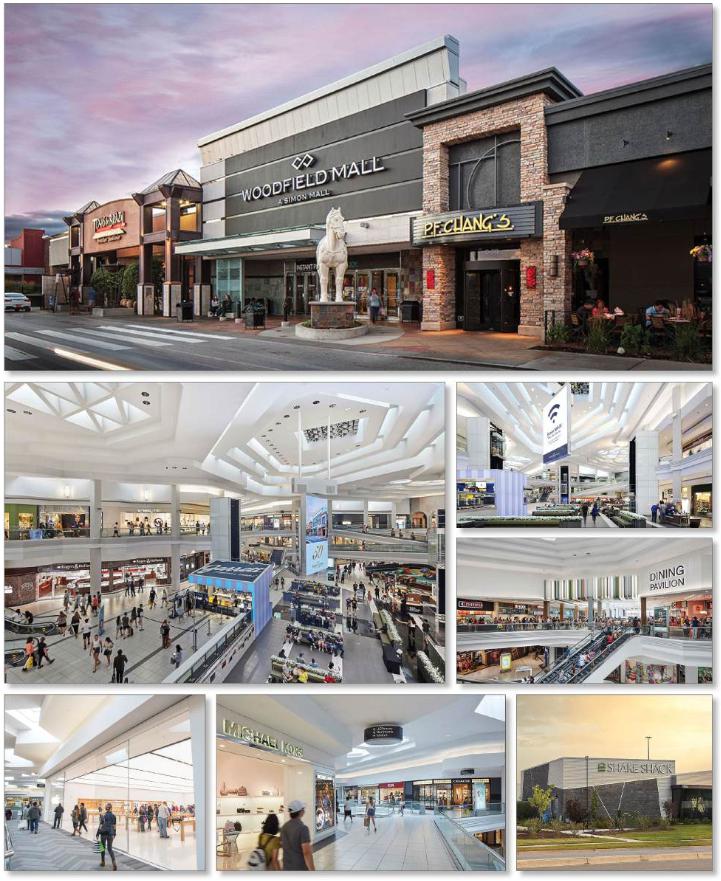
| THE INFORMATION IN THIS STRUCTURAL AND COLLATERAL TERM SHEET IS NOT COMPLETE AND MAY BE AMENDED PRIOR TO THE TIME OF SALE. THIS TERM SHEET IS NOT AN OFFER TO SELL THESE SECURITIES AND IT IS NOT A SOLICITATION OF AN OFFER TO BUY THESE SECURITIES IN ANY JURISDICTION WHERE THE OFFER OR SALE IS NOT PERMITTED. |
| | 54 | |
| Retail - Super Regional Mall | Loan #3 | Cut-off Date Balance: | | $79,500,000 |
| 5 Woodfield Mall | Woodfield Mall | Cut-off Date LTV: | | 38.0% |
| Schaumburg, IL 60173 | | U/W NCF DSCR: | | 2.42x |
| | | U/W NOI Debt Yield: | | 16.0% |
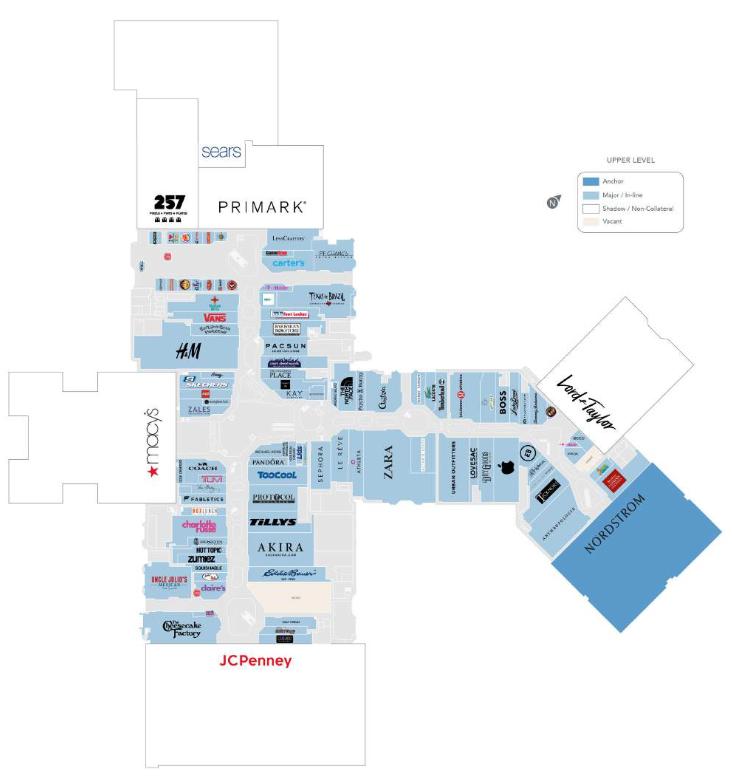
| THE INFORMATION IN THIS STRUCTURAL AND COLLATERAL TERM SHEET IS NOT COMPLETE AND MAY BE AMENDED PRIOR TO THE TIME OF SALE. THIS TERM SHEET IS NOT AN OFFER TO SELL THESE SECURITIES AND IT IS NOT A SOLICITATION OF AN OFFER TO BUY THESE SECURITIES IN ANY JURISDICTION WHERE THE OFFER OR SALE IS NOT PERMITTED. |
| | 55 | |
| Retail - Super Regional Mall | Loan #3 | Cut-off Date Balance: | | $79,500,000 |
| 5 Woodfield Mall | Woodfield Mall | Cut-off Date LTV: | | 38.0% |
| Schaumburg, IL 60173 | | U/W NCF DSCR: | | 2.42x |
| | | U/W NOI Debt Yield: | | 16.0% |
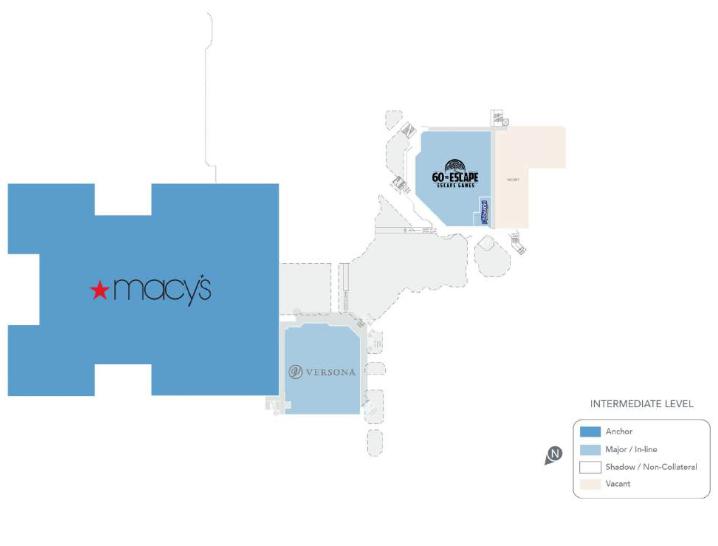
| THE INFORMATION IN THIS STRUCTURAL AND COLLATERAL TERM SHEET IS NOT COMPLETE AND MAY BE AMENDED PRIOR TO THE TIME OF SALE. THIS TERM SHEET IS NOT AN OFFER TO SELL THESE SECURITIES AND IT IS NOT A SOLICITATION OF AN OFFER TO BUY THESE SECURITIES IN ANY JURISDICTION WHERE THE OFFER OR SALE IS NOT PERMITTED. |
| | 56 | |
| Retail - Super Regional Mall | Loan #3 | Cut-off Date Balance: | | $79,500,000 |
| 5 Woodfield Mall | Woodfield Mall | Cut-off Date LTV: | | 38.0% |
| Schaumburg, IL 60173 | | U/W NCF DSCR: | | 2.42x |
| | | U/W NOI Debt Yield: | | 16.0% |
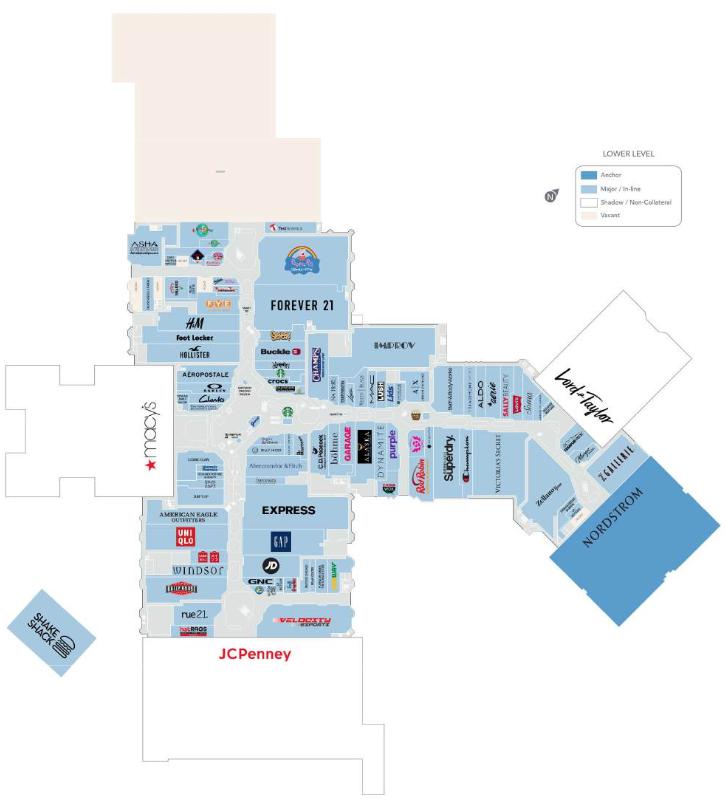
| THE INFORMATION IN THIS STRUCTURAL AND COLLATERAL TERM SHEET IS NOT COMPLETE AND MAY BE AMENDED PRIOR TO THE TIME OF SALE. THIS TERM SHEET IS NOT AN OFFER TO SELL THESE SECURITIES AND IT IS NOT A SOLICITATION OF AN OFFER TO BUY THESE SECURITIES IN ANY JURISDICTION WHERE THE OFFER OR SALE IS NOT PERMITTED. |
| | 57 | |
| Retail - Super Regional Mall | Loan #3 | Cut-off Date Balance: | | $79,500,000 |
| 5 Woodfield Mall | Woodfield Mall | Cut-off Date LTV: | | 38.0% |
| Schaumburg, IL 60173 | | U/W NCF DSCR: | | 2.42x |
| | | U/W NOI Debt Yield: | | 16.0% |
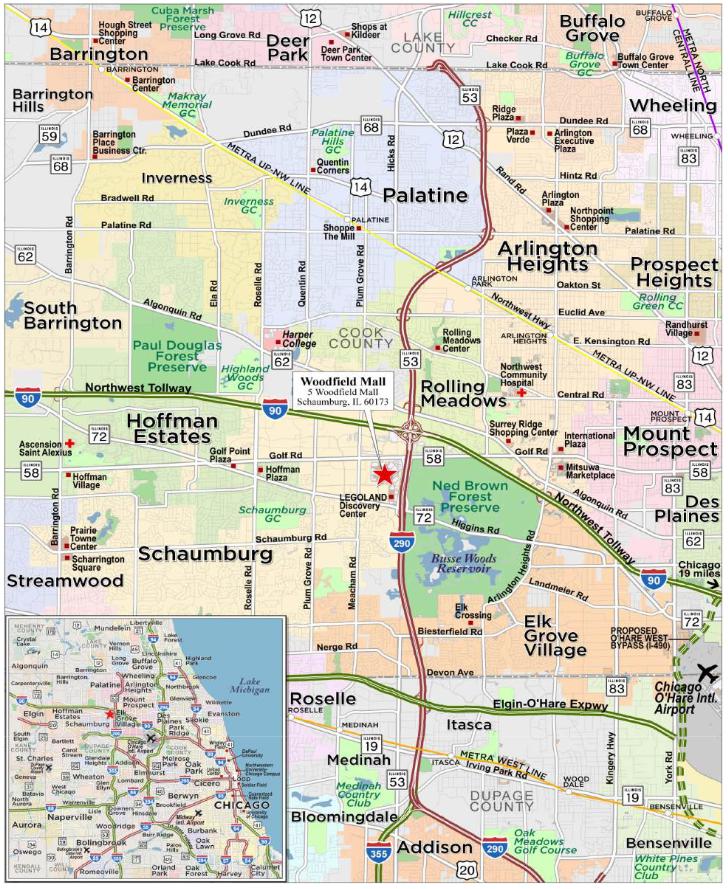
| THE INFORMATION IN THIS STRUCTURAL AND COLLATERAL TERM SHEET IS NOT COMPLETE AND MAY BE AMENDED PRIOR TO THE TIME OF SALE. THIS TERM SHEET IS NOT AN OFFER TO SELL THESE SECURITIES AND IT IS NOT A SOLICITATION OF AN OFFER TO BUY THESE SECURITIES IN ANY JURISDICTION WHERE THE OFFER OR SALE IS NOT PERMITTED. |
| | 58 | |
| No. 3 – Woodfield Mall |
| |
| Mortgage Loan Information | | Mortgaged Property Information |
| Mortgage Loan Seller: | Bank of America, National
Association | | Single Asset/Portfolio: | Single Asset |
Credit Assessment (Fitch/KBRA/Moody’s): | BBB+sf /A+(sf)/Aa2(sf) | | Property Type – Subtype: | Retail – Super Regional
Mall |
| Original Principal Balance(1): | $79,500,000 | | Location: | Schaumburg, IL |
| Cut-off Date Balance(1): | $79,500,000 | | Size: | 1,064,590 SF |
| % of Initial Pool Balance: | 7.3% | | Cut-off Date Balance Per SF(1): | $247.98 |
| Loan Purpose: | Refinance | | Maturity Date Balance Per SF(1): | $247.98 |
| Borrower Sponsors: | Simon Property Group, L.P. and Institutional Mall Investors LLC | | Year Built/Renovated: | 1971, 1995/2015, 2016,
2018 |
| Guarantor: | Simon Property Group, L.P. | | Title Vesting: | Fee |
| Mortgage Rate(2): | 6.335403409% | | Property Manager: | Simon Management Associates, LLC (borrower-related) |
| Note Date: | November 22, 2023 | | Current Occupancy (As of)(7): | 96.1% (11/14/2023) |
| Seasoning: | 6 months | | YE 2022 Occupancy(7): | 95.0% |
| Maturity Date: | December 1, 2033 | | YE 2021 Occupancy(7): | 93.0% |
| IO Period: | 120 months | | YE 2020 Occupancy(7): | 91.0% |
| Loan Term (Original): | 120 months | | As-Is Appraised Value: | $694,000,000 |
| Amortization Term (Original): | NAP | | As-Is Appraised Value Per SF: | $651.89 |
| Loan Amortization Type: | Interest Only | | As-Is Appraisal Valuation Date: | October 27, 2023 |
| Call Protection(3): | L(30),D(84),O(6) | | Underwriting and Financial Information |
| Lockbox Type(4): | Hard/Springing Cash Management | | TTM 10/31/2023 NOI: | $36,477,631 |
| Additional Debt(1): | Yes | | YE 2022 NOI: | $36,506,153 |
| Additional Debt Type (Balance)(1): | Pari Passu ($184,500,000); Subordinate ($30,000,000) | | YE 2021 NOI: | $37,229,630 |
| | | | YE 2020 NOI: | $27,546,528 |
| | | | U/W Revenues: | $74,931,706 |
| | | | U/W Expenses: | $32,816,238 |
| | | U/W NOI: | $42,115,468 |
| Escrows and Reserves(5) | | U/W NCF: | $41,055,801 |
| | Initial | Monthly | Cap | | U/W DSCR based on NOI/NCF(1): | 2.48x / 2.42x |
| Taxes | $0 | Springing | NAP | | U/W Debt Yield based on NOI/NCF(1): | 16.0% / 15.6% |
| Insurance | $0 | Springing | NAP | | U/W Debt Yield at Maturity based on NOI/NCF(1): | 16.0% / 15.6% |
| Replacement Reserve | $0 | Springing | NAP | | Cut-off Date LTV Ratio(1): | 38.0% |
| TI/LC Reserve | $0 | Springing | NAP | | LTV Ratio at Maturity(1): | 38.0% |
| Other Reserves(6) | $7,299,496 | $0 | NAP | | | |
| | | | | | | | | |
| Sources and Uses |
| Sources | | | | | Uses | | | |
| Senior Loan | $264,000,000 | | 68.9 | % | | Loan Payoff | $373,692,064 | | 97.6 | % |
| Sponsor Equity | 88,955,402 | | 23.2 | | | Upfront Reserves | 7,299,496 | | 1.9 | |
| Subordinate Companion Loan | 30,000,000 | | 7.8 | | | Closing Costs | 1,963,843 | | 0.5 | |
| Total Sources | $382,955,402 | | 100.0 | % | | Total Uses | $382,955,402 | | 100.0 | % |
| (1) | The Woodfield Mall Mortgage Loan (as defined below), with an original aggregate principal balance of $79,500,000, is part of a whole loan evidenced by 15 senior pari passu promissory notes, with an aggregate original balance of $264,000,000 and three junior pari passu promissory notes, with an aggregate original balance of $30,000,000 (collectively, the “Woodfield Mall Whole Loan”). The Cut-off Date Balance Per SF, Maturity Date Balance Per SF, U/W DSCR based on NOI/NCF, U/W Debt Yield based on NOI/NCF, U/W Debt Yield at Maturity based on NOI/NCF, Cut-off Date LTV Ratio and LTV Ratio at Maturity numbers presented above are based on the principal balance of the Woodfield Mall Senior Loan (as defined below). The Cut-off Date Balance Per SF, Maturity Date Balance Per SF, U/W DSCR based on NOI/NCF, U/W Debt Yield based on NOI/NCF, U/W Debt Yield at Maturity based on NOI/NCF, Cut-off Date LTV Ratio and LTV Ratio at Maturity based on the principal balance of the Woodfield Mall Whole Loan are $276.16, $276.16, 2.11x/2.05x, 14.3%/14.0%, 14.3%/14.0%, 42.4% and 42.4%, respectively. |
| (2) | Reflects the Woodfield Mall Senior Loan only. The Woodfield Mall Subordinate Companion Loan (as defined below) bears interest at the rate of 10.01625% per annum. |
| (3) | Defeasance of the Woodfield Mall Whole Loan is permitted at any time after the earlier to occur of (a) the end of the two-year period commencing on the closing date of the securitization of the last promissory note representing a portion of the Woodfield Mall Whole Loan to be securitized and (b) June 1, 2027. The assumed defeasance lockout period of 30 payments is based on the closing date of the BANK 2024-BNK47 transaction in June 2024. The actual defeasance lockout period may be longer. If any pari passu note has not been securitized for two years by June 1, 2027, the borrowers may prepay any such note that has not been securitized for two years upon payment of a prepayment fee equal to the greater of (i) 1% of the prepaid amount and (ii) a yield maintenance charge in conjunction with the defeasance of any securitized pari passu notes that have been securitized for greater than two years by the projected repayment date. |
| (4) | The borrower is required to cause rents to be deposited into a lockbox account established at origination under the Woodfield Mall Whole Loan documents, and the borrower will have access to the funds in the lockbox account and use the lockbox account as an operating account so long as no Lockbox Event (as defined below) continues. During the continuance of a Lockbox Event, the borrower will not have any further access to the funds in the lockbox account except as otherwise expressly provided in the Woodfield Mall Whole Loan documents. |
| (5) | See “Escrows” section for further discussion. |
| (6) | Other Reserves consist of $6,460,707 for an upfront outstanding TI/LC reserve and approximately $838,789 for an upfront gap rent reserve. |
| (7) | Occupancy for the Woodfield Mall Property (as defined below) includes temporary tenants. As of November 14, 2023, the Woodfield Mall Property was 87.5% occupied excluding temporary tenants. As of November 14, 2023, occupancy for the Woodfield Mall (as defined below) including temporary tenants was 98.1% and excluding temporary tenants was 93.8%. |
| THE INFORMATION IN THIS STRUCTURAL AND COLLATERAL TERM SHEET IS NOT COMPLETE AND MAY BE AMENDED PRIOR TO THE TIME OF SALE. THIS TERM SHEET IS NOT AN OFFER TO SELL THESE SECURITIES AND IT IS NOT A SOLICITATION OF AN OFFER TO BUY THESE SECURITIES IN ANY JURISDICTION WHERE THE OFFER OR SALE IS NOT PERMITTED. |
| | 59 | |
| Retail - Super Regional Mall | Loan #3 | Cut-off Date Balance: | | $79,500,000 |
| 5 Woodfield Mall | Woodfield Mall | Cut-off Date LTV: | | 38.0% |
| Schaumburg, IL 60173 | | U/W NCF DSCR: | | 2.42x |
| | | U/W NOI Debt Yield: | | 16.0% |
The Mortgage Loan. The third largest mortgage loan (the “Woodfield Mall Mortgage Loan”) is part of a whole loan evidenced by 15 pari passu senior promissory notes in the aggregate original principal amount of $264,000,000 (the “Woodfield Mall Senior Loan”) and three notes in the original principal amount of $30,000,000 that are subordinate to the Woodfield Mall Senior Loan (the “Woodfield Mall Subordinate Companion Loan”, and together with the Woodfield Mall Senior Loan, the “Woodfield Mall Whole Loan”). The Woodfield Mall Whole Loan is secured by a first priority fee mortgage encumbering a portion of a super-regional mall (the “Woodfield Mall”) located in Schaumburg, Illinois (such portion of the mall securing the Woodfield Mall Whole Loan, the “Woodfield Mall Property”). The Woodfield Mall Mortgage Loan is evidenced by non-controlling Note A-3-1, Note A-3-2, Note A-3-3 and Note A-3-4, with an aggregate original principal amount of $79,500,000. The Woodfield Mall Whole Loan will be serviced pursuant to the pooling and servicing agreement for the BMO 2023-C7 securitization trust. See “Description of the Mortgage Pool—The Whole Loans—The Woodfield Mall Pari Passu-A/B Whole Loan” and “Pooling and Servicing Agreement” in the Preliminary Prospectus.
The Woodfield Mall Whole Loan was co-originated by Bank of Montreal (“BMO”), Barclays Capital Real Estate Inc. (“Barclays”) and Bank of America, N.A. (“BANA”). The Woodfield Mall Whole Loan proceeds were used to refinance the existing debt on the Woodfield Mall Property, fund upfront reserves and pay origination costs. The Woodfield Mall Whole Loan accrues interest at a fixed rate of approximately 6.7110% per annum. The table below identifies the promissory notes that comprise the Woodfield Mall Whole Loan.
Whole Loan Note Summary
| Note | Original Balance | Cut-off Date Balance | Note Holder | Controlling Piece |
| A-1-1 | $20,000,000 | $20,000,000 | BBCMS 2024-C24 | No |
| A-1-2 | $55,000,000 | $55,000,000 | BMO 2023-C7 | No |
| A-1-3 | $10,000,000 | $10,000,000 | BBCMS 2024-C24 | No |
| A-1-4 | $10,000,000 | $10,000,000 | BMO 2024-C8 | No |
| A-1-5 | $5,000,000 | $5,000,000 | BMO 2024-C8 | No |
| A-1-6 | $5,000,000 | $5,000,000 | BMO 2024-C8 | No |
| A-2-1 | $13,000,000 | $13,000,000 | BMO 2023-C7 | No |
| A-2-2 | $25,000,000 | $25,000,000 | BBCMS 2024-C24 | No |
| A-2-3 | $20,000,000 | $20,000,000 | BBCMS 2024-C26 | No |
| A-2-4 | $12,500,000 | $12,500,000 | BBCMS 2024-C24 | No |
| A-2-5 | $9,000,000 | $9,000,000 | BBCMS 2024-C26 | No |
| A-3-1 | $40,000,000 | $40,000,000 | BANK 2024-BNK47 | No |
| A-3-2 | $15,000,000 | $15,000,000 | BANK 2024-BNK47 | No |
| A-3-3 | $15,000,000 | $15,000,000 | BANK 2024-BNK47 | No |
| A-3-4 | $9,500,000 | $9,500,000 | BANK 2024-BNK47 | No |
| Total Senior Loan | $264,000,000 | $264,000,000 | | |
| B-1 | $11,931,818 | $11,931,818 | BMO 2023-C7 (Loan-Specific Certificates) | Yes |
| B-2 | $9,034,091 | $9,034,091 | BMO 2023-C7 (Loan-Specific Certificates) | No |
| B-3 | $9,034,091 | $9,034,091 | BMO 2023-C7 (Loan-Specific Certificates) | No |
| Whole Loan | $294,000,000 | $294,000,000 | | |
The Borrower and Borrower Sponsors. The borrower for the Woodfield Mall Whole Loan is Woodfield Mall LLC, a single purpose entity with two independent directors. Legal counsel to the borrower delivered a non-consolidation opinion in connection with the origination of the Woodfield Mall Whole Loan. The borrower sponsors are Simon Property Group, L.P. (“Simon”) and Institutional Mall Investors LLC (“IMI”). Simon is also the non-recourse carveout guarantor of the Woodfield Mall Whole Loan. The Woodfield Mall Property ownership is a joint venture between IMI and Simon, with each owning 50%. Simon is also a borrower sponsor on the St. Johns Town Center Whole Loan and Arundel Mills and Marketplace Whole Loan, which are both included in this pool.
The Property. The Woodfield Mall is a two- and three-story partially enclosed Class “A” super-regional mall, totaling 2,152,069 square feet on an approximately 133.05-acre site in Schaumburg, Illinois. The Woodfield Mall was built in 1971 by Taubman Centers and expanded in 1995, with renovations occurring in 2015, 2016 and 2018. The Woodfield Mall provides parking via 8,949 surface parking and parking garage spaces, resulting in a parking ratio of approximately 4.2 spaces per 1,000 square feet of the Total Mall NRA (as defined below). The Woodfield Mall Property consists of 1,064,590 square feet of net rentable area (approximately 49.5% of the Total Mall NRA).
As of November 14, 2023, the Woodfield Mall Property was 96.1% occupied by over 200 tenants (including temporary tenants, which collectively occupy approximately 8.6% of the Woodfield Mall Property (the “Total Collateral NRA”)). No underwritten base rent is attributable to such temporary tenants. Approximately 47.8% of the Total Collateral NRA is occupied by 20 major tenants (each of which occupies 10,000 or more square feet of net rentable area) and one anchor tenant (Nordstrom).
The portion of the Woodfield Mall occupied by six anchor tenants, namely Macy’s, J.C. Penney, Sears, Primark, Level 257 and Lord & Taylor (the “Non-Collateral Anchors”), representing approximately 50.5% of the Total Mall NRA, is not part of the collateral securing the Woodfield Mall Whole Loan. The Woodfield Mall Property does not include any portion of the mall owned and occupied by the Non-Collateral Anchors. The information relating to the Woodfield Mall Property in this term sheet does not include any space occupied by the Non-Collateral Anchors, unless otherwise indicated.
| THE INFORMATION IN THIS STRUCTURAL AND COLLATERAL TERM SHEET IS NOT COMPLETE AND MAY BE AMENDED PRIOR TO THE TIME OF SALE. THIS TERM SHEET IS NOT AN OFFER TO SELL THESE SECURITIES AND IT IS NOT A SOLICITATION OF AN OFFER TO BUY THESE SECURITIES IN ANY JURISDICTION WHERE THE OFFER OR SALE IS NOT PERMITTED. |
| | 60 | |
| Retail - Super Regional Mall | Loan #3 | Cut-off Date Balance: | | $79,500,000 |
| 5 Woodfield Mall | Woodfield Mall | Cut-off Date LTV: | | 38.0% |
| Schaumburg, IL 60173 | | U/W NCF DSCR: | | 2.42x |
| | | U/W NOI Debt Yield: | | 16.0% |
The most recent expansion of the Woodfield Mall Property occurred in 1995, and such expansion included Nordstrom and the mall shops leading to Nordstrom. Renovations of the Woodfield Mall Property occurred in 2015, 2016 and 2018, with the most recent renovation involving a food court.
The borrower ground leased a portion of the Woodfield Mall Property (the “Nordstrom Parcel”) to Nordstrom pursuant to a ground lease (the “Nordstrom Ground Lease”) between Nordstrom, as ground lessee, and the borrower, as ground lessor. The Woodfield Mall Property collectively represents approximately 49.5% of the total 2,152,069 square feet of net rentable area at the Woodfield Mall (the “Total Mall NRA”).
Major Tenants. The three largest tenants at the Woodfield Mall Property based on underwritten base rent are H&M, Victoria’s Secret/Pink and Zara.
H&M (27,320 square feet; 2.6% of Total Collateral NRA; 6.1% of underwritten base rent): H&M Hennes & Mauritz (“H&M”) is a global retailer offering affordable apparel for men, women and children. H&M was incorporated in 1947 and remains under the control of the family of founder Erling Persson. H&M group’s brands are H&M, H&M Home, COS, Weekday, Monki, & Other Stories, ARKET, Afound and Sellpy. As of 2023, H&M operated approximately 4,338 stores across more than 70 markets with approximately 143,000 employees. H&M has been a tenant at the Woodfield Mall Property since 2014 under a lease with an expiration date of January 31, 2029, and no renewal or termination options.
Victoria’s Secret/Pink (18,269 square feet; 1.7% of Total Collateral NRA; 3.7% of underwritten base rent). Victoria’s Secret & Co. (“Victoria’s Secret/Pink”) is a Fortune 500 specialty retailer of modern, fashion-inspired collections including signature bras, panties, lingerie, casual sleepwear, athleisure and swimwear, as well as fragrances and body care. Victoria’s Secret/Pink comprises two brands, Victoria’s Secret and PINK, founded in 1977 by Roy and Gaye Raymond. Victoria’s Secret employs over 30,000 associates across approximately 1,350 retail stores in approximately 70 countries. Victoria’s Secret/Pink has been a tenant at the Woodfield Mall Property since 2013 under a lease with an expiration date of January 31, 2028, and no renewal or termination options.
Zara (21,759 square feet; 2.0% of Total Collateral NRA; 3.6% of underwritten base rent): Zara is a global clothing retailer having approximately 3,000 stores across 96 countries. Zara is the flagship brand of the Inditex Group. Inditex Group has a variety of brands including Zara, Pull&Bear, Massimo Dutti, Bershka, Stradivarius and Oysho Y Zara, located across 213 markets worldwide. The United States has 98 Inditex Group stores as of January 2019. Zara has been a tenant at the Woodfield Mall Property since 2015 under a lease with an expiration date of October 31, 2028, and no renewal or termination options.
The two largest tenants at the Woodfield Mall based on net rentable area are Macy’s and J.C. Penney, both Non-Collateral Anchors, and the largest tenant at the Woodfield Mall Property based on net rentable area is Nordstrom.
Nordstrom (200,000 square feet; 18.8% of Total Collateral NRA; 0.0% of underwritten base rent): Nordstrom (Moody’s/S&P/Fitch: Ba2/BB+/BB) was founded in 1901 as a retail shoe business in Seattle, Washington. Nordstrom offers an extensive selection of brand-name and private label merchandise for women, men, young adults and children focused on apparel, shoes, beauty, accessories and home goods. The Nordstrom Ground Lease at the Woodfield Mall Property has an original commencement date of March 3, 1995 and an expiration date of March 2, 2025. The Nordstrom Ground Lease has seven, 10-year renewal options remaining and no termination options. Nordstrom does not pay base rent.
Macy’s (Non-Collateral Anchor; 315,498 square feet; 0.0% of Total Collateral NRA; 0.0% of underwritten base rent): Founded in 1858 and headquartered in New York, New York, Macy’s (Moody’s/S&P/Fitch: Ba2/BB+/BBB-) is a department store chain that operates approximately 725 stores in the United States and Washington, D.C., as well as Guam and Puerto Rico. Macy’s has three banners that include Macy’s, bluemercury and Bloomingdale’s (and accompanying e-commerce sites), that sell men's, women's and children's apparel and accessories, cosmetics, and home furnishings, among other merchandise.
J.C. Penney (Non-Collateral Anchor; 288,550 square feet; 0.0% of Total Collateral NRA; 0.0% of underwritten base rent): Founded in 1902 and headquartered in Plano, Texas, J.C. Penney (Moody’s/S&P/Fitch: NR/NR/NR) is a department store chain with approximately 50,000 employees. J.C. Penney sells products including family apparel, footwear, accessories, fine and fashion jewelry, home furnishings, and beauty products through Sephora.
| THE INFORMATION IN THIS STRUCTURAL AND COLLATERAL TERM SHEET IS NOT COMPLETE AND MAY BE AMENDED PRIOR TO THE TIME OF SALE. THIS TERM SHEET IS NOT AN OFFER TO SELL THESE SECURITIES AND IT IS NOT A SOLICITATION OF AN OFFER TO BUY THESE SECURITIES IN ANY JURISDICTION WHERE THE OFFER OR SALE IS NOT PERMITTED. |
| | 61 | |
| Retail - Super Regional Mall | Loan #3 | Cut-off Date Balance: | | $79,500,000 |
| 5 Woodfield Mall | Woodfield Mall | Cut-off Date LTV: | | 38.0% |
| Schaumburg, IL 60173 | | U/W NCF DSCR: | | 2.42x |
| | | U/W NOI Debt Yield: | | 16.0% |
The following table presents certain information relating to the major tenants based on the Total Mall NRA:
Tenant Summary(1)
| Tenant | Ratings
Moody’s/ S&P/ Fitch(2) | Total Mall NRA (SF) | % of
Total Collateral NRA(3) | U/W Base Rent PSF | U/W Base Rent | % of Total
U/W Base Rent | TTM September 2023 Sales $(4) | Sales PSF(4) | Occ Cost(4) | Lease
Expiration Date |
| Non-Collateral Anchor Tenants | | | | | | | | | | |
| Macy's | Ba2/BB+/BBB- | 315,498 | NAP | $0.00 | $0 | 0.0 | % | $45,400,000 | $143.90 | NAV | NAV |
| J.C. Penney(5) | NR/NR/NR | 288,550 | NAP | $0.00 | 0 | 0.0 | | $16,500,000 | $57.18 | 3.6% | NAV |
| Sears(6) | NR/NR/NR | 272,678 | NAP | $0.00 | 0 | 0.0 | | NAV | NAV | NAV | NAV |
| Primark(6) | NR/NR/NR | 50,000 | NAP | $0.00 | 0 | 0.0 | | NAV | NAV | NAV | NAV |
| Level 257(6) | NR/NR/NR | 42,094 | NAP | $0.00 | 0 | 0.0 | | NAV | NAV | NAV | NAV |
| Lord & Taylor(5) | NR/NR/NR | 118,659 | NAP | $0.00 | 0 | 0.0 | | NAV | NAV | NAV | NAV |
| Non-Collateral Anchor Tenants Subtotal / Wtd. Avg. | | 1,087,479 | NAP | $0.00 | $0 | 0.0 | % | | | | |
| Collateral Anchor Tenant | | | | | | | | | | |
| Nordstrom | Ba2/BB+/BB | 200,000 | 18.8 | % | $0.00 | $0 | 0.0 | % | $42,000,000 | $210.00 | NAV | 3/02/2025 |
| Major Tenants | | | | | | | | | | |
| H&M | NR/NR/NR | 27,320 | 2.6 | % | $82.62 | 2,257,171 | 6 | .1 | $10,374,930 | $379.76 | 21.9% | 1/31/2029 |
| Victoria's Secret/Pink | NR/NR/NR | 18,269 | 1.7 | | $75.00 | 1,370,175 | 3 | .7 | $11,569,094 | $633.26 | 20.9% | 1/31/2028 |
| Zara | NR/NR/NR | 21,759 | 2.0 | | $61.59 | 1,340,243 | 3 | .6 | $16,127,709 | $741.20 | 9.3% | 10/31/2028 |
| Express/Express Men | NR/NR/NR | 20,176 | 1.9 | | $57.84 | 1,166,913 | 3 | .2 | $5,307,887 | $263.08 | 24.1% | 4/30/2029 |
| Cheesecake Factory | NR/NR/NR | 11,879 | 1.1 | | $68.39 | 812,428 | 2 | .2 | $13,685,994 | $1,152.12 | 7.9% | 1/31/2026 |
| Urban Outfitters | NR/NR/NR | 10,775 | 1.0 | | $66.63 | 717,884 | 1 | .9 | NAV | NAV | NAV | 10/31/2033 |
| The Gap/Gap Kids | NR/NR/NR | 11,202 | 1.1 | | $57.43 | 643,379 | 1 | .7 | $2,409,049 | $215.06 | 29.1% | 1/31/2027 |
| Hollister Co. | NR/NR/NR | 9,210 | 0.9 | | $65.83 | 606,304 | 1 | .6 | $6,343,726 | $688.79 | 20.0% | 1/31/2024 |
| Velocity Esports | NR/NR/NR | 15,360 | 1.4 | | $35.81 | 550,000 | 1 | .5 | NAV | NAV | NAV | 5/31/2036 |
| Uniqlo | NR/NR/NR | 11,384 | 1.1 | | $47.54 | 541,216 | 1 | .5 | $9,919,451 | $871.35 | 8.5% | 1/31/2029 |
| Major Tenants Subtotal / Wtd. Avg. | | 157,334 | 14.8 | % | $63.60 | $10,005,712 | 27.1 | % | | | | |
| Remaining Occupied | | 665,850 | 62.5 | % | $40.34 | $26,857,964 | 72.9 | % | | | | |
| Occupied Collateral Total | | 1,023,184 | 96.1 | % | $36.03 | $36,863,676 | 100.0 | % | | | | |
| Vacant | | 41,406 | 3.9 | | | | | | | | |
| Collateral Total / Wtd. Avg. | | 1,064,590 | 100.0 | % | | $36,863,676 | 100.0 | % | | | | |
| | | | | | | | | | | |
| | | | | | | | | | | |
| Collateral + Non Collateral Total | | 2,152,069 | 100.0 | % | | | | | | | |
| | | | | | | | | | | |
| (1) | Based on the underwritten rent roll dated November 14, 2023. Inclusive of rent steps through November 30, 2024. |
| (2) | In certain instances, ratings provided are those of the parent company of the entity shown, whether or not the parent company guarantees the lease. |
| (3) | % of Total Collateral NRA refers only to the Woodfield Mall Property and does not include the portion of the Woodfield Mall occupied by the Non-Collateral Anchors. |
| (4) | All information regarding sales and occupancy costs presented in this term sheet with respect to the Woodfield Mall is based upon information provided by the borrower sponsor. In certain instances, sales figures represent estimates because the tenants are not required to report, or otherwise may not have reported, sales information on a timely basis. Further, because sales are self-reported, such information is not independently verified by the borrower sponsor. Sales are presented as of the 12 months ended September 2023. |
| (5) | J.C. Penney and Lord & Taylor do not pay rent but pay certain reimbursements. |
| (6) | Sears leases a total of 364,772 square feet. Sears has subleased 50,000 square feet to Primark and 42,094 square feet to Level 257. Sears is dark in the remaining 272,678 square feet but continues to pay contractual reimbursements. |
| THE INFORMATION IN THIS STRUCTURAL AND COLLATERAL TERM SHEET IS NOT COMPLETE AND MAY BE AMENDED PRIOR TO THE TIME OF SALE. THIS TERM SHEET IS NOT AN OFFER TO SELL THESE SECURITIES AND IT IS NOT A SOLICITATION OF AN OFFER TO BUY THESE SECURITIES IN ANY JURISDICTION WHERE THE OFFER OR SALE IS NOT PERMITTED. |
| | 62 | |
| Retail - Super Regional Mall | Loan #3 | Cut-off Date Balance: | | $79,500,000 |
| 5 Woodfield Mall | Woodfield Mall | Cut-off Date LTV: | | 38.0% |
| Schaumburg, IL 60173 | | U/W NCF DSCR: | | 2.42x |
| | | U/W NOI Debt Yield: | | 16.0% |
The following table presents certain information relating to the tenant sales of the Woodfield Mall Property:
| Comparable In-line Sales(1) |
| Tenants < 10,000 SF | 2019 | 2020(2) | 2021 | 2022 | TTM September 2023 |
| Gross Mall Sales | $274,505,000 | NAP | $269,467,000 | $269,130,000 | $294,883,000 |
| Gross Mall Sales (Ex-Apple) | $220,566,000 | NAP | $240,722,000 | $233,070,000 | $256,280,000 |
| Sales PSF (Inline < 10,000 SF) | $726 | NAP | $755 | $807 | $820 |
| Sales PSF (Inline < 10,000 SF, Ex-Apple) | $597 | NAP | $691 | $717 | $730 |
| Occupancy Cost (Inline < 10,000 SF)(3) | 17.4% | NAP | 16.6% | 15.4% | 14.7% |
| Occupancy Cost (Inline < 10,000 SF, Ex-Apple)(3) | 21.2% | NAP | 18.2% | 17.3% | 16.5% |
| (1) | All information regarding sales and occupancy costs presented herein with respect to the Woodfield Mall Property is based upon information provided by the borrower sponsor. In certain instances, sales figures represent estimates because the tenants are not required to report, or otherwise may not have reported sales information on a timely basis. Further, because sales are self-reported, such information is not independently verified by the borrower sponsor. |
| (2) | The Woodfield Mall was closed due to the COVID-19 pandemic during a portion of 2020. |
| (3) | Occupancy Cost is calculated by the sum of base rents, percentage rents and all expense recoveries divided by annual sales. |
The following table presents certain information relating to the major tenant sales of the Woodfield Mall:
| Major Tenant Sales by Type(1) |
| Tenant Name | 2019 | 2020(2) | 2021 | 2022 | TTM September 2023 |
| Macy's(3) | $51,000,000 | $28,100,000 | $45,900,000 | $45,400,000 | $45,400,000 |
| Nordstrom | $53,600,000 | $37,500,000 | $40,100,000 | $42,000,000 | $42,000,000 |
| J.C. Penney(3) | $21,900,000 | $13,700,000 | $15,100,000 | $16,500,000 | $16,500,000 |
| Department Stores | $126,500,000 | $79,300,000 | $101,100,000 | $103,900,000 | $103,900,000 |
| In-Line Tenants | $337,753,000 | $210,500,000 | $353,998,000 | $362,968,000 | $380,594,000 |
| Apple | $53,939,000 | $21,311,000 | $28,745,000 | $36,060,000 | $38,603,000 |
| Total Woodfield Mall | $518,192,000 | $311,111,000 | $483,843,000 | $502,928,000 | $523,097,000 |
| (1) | All sales information presented herein with respect to the Woodfield Mall Property is based upon information provided by the borrower sponsor. In certain instances, sales figures represent estimates because the tenants are not required to report, or otherwise may not have reported sales information on a timely basis. Further, because sales are self-reported, such information is not independently verified by the borrower sponsor. |
| (2) | The Woodfield Mall Property was closed due to the COVID-19 pandemic during a portion of 2020. |
| (3) | Macy’s and J.C. Penney are Non-Collateral Anchors. |
| THE INFORMATION IN THIS STRUCTURAL AND COLLATERAL TERM SHEET IS NOT COMPLETE AND MAY BE AMENDED PRIOR TO THE TIME OF SALE. THIS TERM SHEET IS NOT AN OFFER TO SELL THESE SECURITIES AND IT IS NOT A SOLICITATION OF AN OFFER TO BUY THESE SECURITIES IN ANY JURISDICTION WHERE THE OFFER OR SALE IS NOT PERMITTED. |
| | 63 | |
| Retail - Super Regional Mall | Loan #3 | Cut-off Date Balance: | | $79,500,000 |
| 5 Woodfield Mall | Woodfield Mall | Cut-off Date LTV: | | 38.0% |
| Schaumburg, IL 60173 | | U/W NCF DSCR: | | 2.42x |
| | | U/W NOI Debt Yield: | | 16.0% |
The following table presents certain information relating to the lease rollover schedule at the Woodfield Mall Property:
Lease Expiration Schedule(1)(2)
| Year | Number
of Leases
Expiring | Net Rentable
Area Expiring | % of NRA
Expiring | U/W Base Rent
Expiring(3) | % of U/W
Base Rent
Expiring(3) | Cumulative
Net Rentable
Area Expiring | Cumulative
% of NRA
Expiring | Cumulative
U/W Base
Rent
Expiring(3) | Cumulative
% of U/W
Base Rent
Expiring(3) |
| Vacant | NAP | 41,406 | 3.9 | % | NAP | N | AP | 41,406 | 3.9% | NAP | NAP |
| 2024 & MTM | 32 | 100,650 | 9.5 | | $5,697,946 | 15.5 | % | 142,056 | 13.3% | $5,697,946 | 15.5% |
| 2025 | 23 | 265,320 | 24.9 | | 3,245,716 | 8.8 | | 407,376 | 38.3% | $8,943,662 | 24.3% |
| 2026 | 38 | 144,818 | 13.6 | | 6,175,654 | 16.8 | | 552,194 | 51.9% | $15,119,316 | 41.0% |
| 2027 | 18 | 57,775 | 5.4 | | 3,089,980 | 8.4 | | 609,969 | 57.3% | $18,209,296 | 49.4% |
| 2028 | 18 | 80,709 | 7.6 | | 5,357,144 | 14.5 | | 690,678 | 64.9% | $23,566,440 | 63.9% |
| 2029 | 20 | 105,967 | 10.0 | | 6,255,091 | 17.0 | | 796,645 | 74.8% | $29,821,530 | 80.9% |
| 2030 | 7 | 28,745 | 2.7 | | 1,479,397 | 4.0 | | 825,390 | 77.5% | $31,300,927 | 84.9% |
| 2031 | 4 | 7,102 | 0.7 | | 395,209 | 1.1 | | 832,492 | 78.2% | $31,696,137 | 86.0% |
| 2032 | 5 | 18,655 | 1.8 | | 614,059 | 1.7 | | 851,147 | 80.0% | $32,310,195 | 87.6% |
| 2033 | 14 | 43,869 | 4.1 | | 2,661,904 | 7.2 | | 895,016 | 84.1% | $34,972,099 | 94.9% |
| 2034 | 7 | 39,914 | 3.7 | | 1,041,577 | 2.8 | | 934,930 | 87.8% | $36,013,676 | 97.7% |
| 2035 & Beyond | 2 | 38,323 | 3.6 | | 850,000 | 2.3 | | 973,253 | 91.4% | $36,863,676 | 100.0% |
| Temporary Tenants | 24 | 91,337 | 8.6 | | 0 | 0.0 | | 1,064,590 | 100.0% | $36,863,676 | 100.0% |
| Total Collateral | 212 | 1,064,590 | 100.0 | % | $36,863,676 | 100.0 | % | 0 | | | |
| (1) | Based on the underwritten rent roll dated November 14, 2023. |
| (2) | Certain leases may have termination options that are exercisable prior to the originally stated expiration date of the lease and that are not considered in this Lease Expiration Schedule. |
| (3) | U/W Base Rent Expiring, % of U/W Base Rent Expiring, Cumulative U/W Base Rent Expiring and Cumulative % of U/W Base Rent Expiring include contractual rent steps through November 2024. |
The following table presents historical occupancy percentages at the Woodfield Mall Property:
Historical Occupancy(1)
2020 | 2021 | 2022 | Current(2) |
| 91.0% | 93.0% | 95.0% | 96.1% |
| | | | |
| (1) | Historical Occupancies are as of December 31 of each respective year and include temporary tenants. Occupancy does not include net rentable area for Non-Collateral Anchors and anchor tenants. |
| (2) | Based on the underwritten rent roll dated November 14, 2023. Current occupancy of the in-line tenants less than 10,000 square feet is 96.3%. |
| THE INFORMATION IN THIS STRUCTURAL AND COLLATERAL TERM SHEET IS NOT COMPLETE AND MAY BE AMENDED PRIOR TO THE TIME OF SALE. THIS TERM SHEET IS NOT AN OFFER TO SELL THESE SECURITIES AND IT IS NOT A SOLICITATION OF AN OFFER TO BUY THESE SECURITIES IN ANY JURISDICTION WHERE THE OFFER OR SALE IS NOT PERMITTED. |
| | 64 | |
| Retail - Super Regional Mall | Loan #3 | Cut-off Date Balance: | | $79,500,000 |
| 5 Woodfield Mall | Woodfield Mall | Cut-off Date LTV: | | 38.0% |
| Schaumburg, IL 60173 | | U/W NCF DSCR: | | 2.42x |
| | | U/W NOI Debt Yield: | | 16.0% |
Historical Performance and Underwritten Net Cash Flow. The following table presents certain information relating to the historical performance and underwritten net cash flow at the Woodfield Mall Property:
Cash Flow Analysis
| | 2019 | 2020 | 2021 | 2022 | 10/31/2023
TTM(1) | Underwritten | %(2) | U/W
PSF(3) |
| Rents in Place | $41,174,170 | $37,184,667 | $34,297,836 | $31,325,141 | $31,995,485 | $36,145,721 | 46.2% | $33.95 |
| Rent Steps | 0 | 0 | 0 | 0 | 0 | 717,955 | 0.9 | 0.67 |
| Percent in Lieu | 445,565 | 1,229,560 | 2,406,499 | 2,469,287 | 2,347,073 | 1,409,551 | 1.8 | 1.32 |
| Percent Rent | 811,987 | 341,531 | 3,278,507 | 4,355,569 | 4,441,146 | 3,925,259 | 5.0 | 3.69 |
| Vacant Income(4) | 0 | 0 | 0 | 0 | 0 | 3,245,048 | 4.2 | 3.05 |
| Gross Potential Rent | $42,431,722 | $38,755,758 | $39,982,842 | $38,149,997 | $38,783,704 | $45,443,534 | 58.1% | $42.69 |
| Total Reimbursements | 35,104,199 | 23,802,491 | 25,870,805 | 28,065,713 | 26,816,583 | 26,220,282 | 33.5 | 24.63 |
| Temporary Tenants | 4,396,324 | 2,837,003 | 4,433,113 | 4,598,726 | 4,329,039 | 4,329,039 | 5.5 | 4.07 |
| Other Rents | 236,767 | 176,161 | 230,481 | 219,885 | 275,155 | 275,155 | 0.4 | 0.26 |
| Media Income | 1,309,770 | 709,843 | 1,251,746 | 1,471,910 | 1,480,496 | 1,480,496 | 1.9 | 1.39 |
| Lease Settlement Income | 472,562 | 909,740 | 1,585,822 | 1,797,721 | 304,962 | 0 | 0.0 | 0.00 |
| Deferred Rent | 485,119 | 12,837 | 0 | 170,470 | 0 | 0 | 0.0 | 0.00 |
| Other Income | 617,296 | 533,957 | 348,322 | 391,178 | 428,248 | 428,248 | 0.5 | 0.40 |
| Net Rental Income | $85,053,759 | $67,737,790 | $73,703,131 | $74,865,600 | $72,418,187 | $78,176,753 | 100.0% | $73.43 |
| (Vacancy/Credit Loss)(5) | 0 | 0 | 0 | 0 | 0 | (3,245,048) | (4.2) | (3.05) |
| Effective Gross Income | $85,053,759 | $67,737,790 | $73,703,131 | $74,865,600 | $72,418,187 | $74,931,706 | 95.8% | $70.39 |
| Total Expenses(6) | 34,048,763 | 40,191,262 | 36,473,501 | 38,359,447 | 35,940,556 | 32,816,238 | 43.8 | 30.83 |
| Net Operating Income | $51,004,996 | $27,546,528 | $37,229,630 | $36,506,153 | $36,477,631 | $42,115,468 | 56.2% | $39.56 |
| Capital Expenditures | 0 | 0 | 0 | 0 | 0 | 195,077 | 0.3 | 0.18 |
| TI/LC | 0 | 0 | 0 | 0 | 0 | 864,590 | 1.2 | 0.81 |
| Net Cash Flow | $51,004,996 | $27,546,528 | $37,229,630 | $36,506,153 | $36,477,631 | $41,055,801 | 54.8% | $38.56 |
| | | | | | | | | |
| NOI DSCR(7) | 3.01x | 1.62x | 2.20x | 2.15x | 2.15x | 2.48x | | |
| NCF DSCR(7) | 3.01x | 1.62x | 2.20x | 2.15x | 2.15x | 2.42x | | |
| NOI Debt Yield(7) | 19.3% | 10.4% | 14.1% | 13.8% | 13.8% | 16.0% | | |
| NCF Debt Yield(7) | 19.3% | 10.4% | 14.1% | 13.8% | 13.8% | 15.6% | | |
| (1) | 10/31/2023 TTM reflects the trailing 12-month period ending October 31, 2023. Contractual rent steps are through November 2024. |
| (2) | % column represents percent of Net Rental Income for all revenue lines and represents percent of Effective Gross Income for the remainder of fields. |
| (3) | U/W PSF is calculated using the Total Collateral NRA. |
| (4) | Vacant Income reflects the gross up of vacancy at average in-place rents. |
| (5) | The underwritten economic occupancy is 95.5%. The Woodfield Mall Property was 96.1% leased based on the November 14, 2023 underwritten rent roll, including leases executed by the origination date. |
| (6) | The management fee is underwritten to reflect 4.00% of below market rate, temporary and overage rents, capped at $1,000,000. Real estate taxes were underwritten based on the actual tax bills for all of the property tax parcels at the Woodfield Mall Property (including the Nordstrom Parcel), inclusive of any tax reimbursements. |
| (7) | Debt service coverage ratios and debt yields are based on the Woodfield Mall Senior Loan. |
Appraisal. The appraiser concluded to an “as-is” appraised value for the Woodfield Mall Property of $694,000,000 as of October 27, 2023.
Environmental Matters. According to the Phase I environmental report dated November 7, 2023, there was no evidence of any recognized environmental conditions at the Woodfield Mall Property.
Market Overview and Competition. The Woodfield Mall Property is located in Schaumburg, Illinois, within the Chicago-Naperville-Elgin, IL-IN-WI core-based statistical area (the “Chicago CBSA”). Chicago is a major Great Lakes port and is considered the commercial, financial, industrial and cultural center of the midwestern United States. The region surrounding Chicago is a major warehouse and distribution hub, supported by its comprehensive network of highway, water, rail and air routes. The trade, transportation and utilities sector dominates Chicago CBSA as the largest employment sector with roughly 20.5% of the regional workforce.
The Woodfield Mall Property is easily accessible from both Chicago and its surrounding suburbs. The Woodfield Mall Property is situated in the northwest Chicago suburb, which is considered a desirable position within the Chicago metropolitan statistical area due to its proximity to the densely populated residential areas that surround the area and its easy access to both I-90 and I-290. Land uses in the immediate area generally include a mixture of commercial, residential, hotel, and office. The Woodfield Mall Property is located
| THE INFORMATION IN THIS STRUCTURAL AND COLLATERAL TERM SHEET IS NOT COMPLETE AND MAY BE AMENDED PRIOR TO THE TIME OF SALE. THIS TERM SHEET IS NOT AN OFFER TO SELL THESE SECURITIES AND IT IS NOT A SOLICITATION OF AN OFFER TO BUY THESE SECURITIES IN ANY JURISDICTION WHERE THE OFFER OR SALE IS NOT PERMITTED. |
| | 65 | |
| Retail - Super Regional Mall | Loan #3 | Cut-off Date Balance: | | $79,500,000 |
| 5 Woodfield Mall | Woodfield Mall | Cut-off Date LTV: | | 38.0% |
| Schaumburg, IL 60173 | | U/W NCF DSCR: | | 2.42x |
| | | U/W NOI Debt Yield: | | 16.0% |
approximately 27 miles from the central business district of Chicago. The O'Hare International Airport is located approximately 13 miles away from the Woodfield Mall Property. Public transit options are also readily available, with the Schaumburg Metra station providing a convenient train connection to Chicago. Additionally, Pace buses service the area, ensuring accessibility for those without personal vehicles.
Schaumburg is home to 10 industrial parks (including 13.2 million square feet of space in over 400 facilities), 67 shopping centers totaling more than 9.5 million square feet of space and 12.1 million square feet of office space spread throughout more than 90 buildings. Additional economic activity is generated by the Renaissance Schaumburg Hotel & Convention Center and an additional 25 hotels supporting the community. The area is also home to numerous office complexes, including Two Century Centre, an office complex north of the Woodfield Mall Property, past Golf Road (Illinois Route 58), and east of N. Roosevelt Boulevard. In addition, the neighborhood contains several car dealerships, fast food chains and gas stations.
According to the appraisal, the 2022 population within a 5-, 10- and 15-mile radius of the Woodfield Mall Property was 270,430, 949,592 and 2,109,255, respectively. Additionally, for the same time period, the average household income within the same radii was $119,090, $119,024 and $124,631, respectively.
According to the appraisal, the Woodfield Mall Property is located within the Chicago retail market and the Far Northwest retail submarket. As of the second quarter of 2023, the Chicago retail market contains 106,053,000 square feet of space and the overall vacancy rate was 12.7%, which is a decrease from 12.8% in 2018. As of the second quarter of 2023, the Far Northwest retail submarket contained approximately 6.9 million square feet of retail space inventory with a vacancy rate of 11.5% and an average asking rental rate of $18.20 per square foot.
| THE INFORMATION IN THIS STRUCTURAL AND COLLATERAL TERM SHEET IS NOT COMPLETE AND MAY BE AMENDED PRIOR TO THE TIME OF SALE. THIS TERM SHEET IS NOT AN OFFER TO SELL THESE SECURITIES AND IT IS NOT A SOLICITATION OF AN OFFER TO BUY THESE SECURITIES IN ANY JURISDICTION WHERE THE OFFER OR SALE IS NOT PERMITTED. |
| | 66 | |
| Retail - Super Regional Mall | Loan #3 | Cut-off Date Balance: | | $79,500,000 |
| 5 Woodfield Mall | Woodfield Mall | Cut-off Date LTV: | | 38.0% |
| Schaumburg, IL 60173 | | U/W NCF DSCR: | | 2.42x |
| | | U/W NOI Debt Yield: | | 16.0% |
The following table presents certain information relating to comparable retail centers for the Woodfield Mall Property:
| Competitive Retail Center Summary(1) |
| Property Name/Location | Year Built / Renovated or Expanded | Total NRA (SF) | Total Occupancy | Distance to Subject | Sales PSF | Major Tenants |
Woodfield Mall 5 Woodfield Mall Schaumburg, IL | 1971, 1995 / 2015, 2016, 2018 | 1,064,590(2)(3) | 96.1%(3) | NAP | $730(3)(4) | Macy’s J.C. Penney Nordstrom Sears Lord & Taylor Primark Level 257 |
Streets of Woodfield 601 N Martingale Road Schaumburg, IL | 1991, 1993, 1997, 2009 / 2000 | 692,549 | 96.0% | 0.6 miles | NAV | Dick’s Sporting Goods RH Outlet AMC Loews (20 Screens) Whole Foods Crate & Barrel |
The Arboretum of South Barrington 100 W Higgins Road South Barrington, IL | 2007-2008 / 2016, 2018, 2019, 2022 | 484,409 | 83.0% | 8.1 miles | NAV | L.L. Bean Star Cinema Grill Pinstripes DSW Arhaus |
Fashion Outlets of Chicago 5220 Fashion Outlets Way Rosemont, IL | 2013 / NAP | 538,735 | 99.0% | 12.9 miles | $1,036 | Forever 21 Nike Nordstrom rack Polo Ralph Lauren Bloomingdale’s Outlet Saks Fifth Avenue Off 5th |
Oakbrook Center 100 Oakbrook Center Oak Brook, IL | 1962 / 2014, 2016, 2017, 2021 | 1,886,885 | 92.0% | 15.3 miles | $1,326; $1,129 (Ex-Apple) | Macy’s Nordstrom Neiman Marcus AMC Theater (12 Screens) Crate & Barrel |
Westfield Old Orchard 4905 Old Orchard Center Skokie, IL | 1956 / 2022-2023 | 1,508,431 | 91.0% | 15.5 miles | $902; $830 (Ex-Apple) | Macy’s Nordstrom Bloomie’s Cinemex Crate & Barrel |
Northbrook Court 1515 Lake Cook Road Northbrook, IL | 1976 / 1996 | 1,014,506 | 92.0% | 19.2 miles | $833; $705 (Ex-Apple) | Neiman Marcus AMC (14 Screens) Crate & Barrel Forever 21 Gap |
Chicago Ridge Mall 444 Ridgeland Avenue Chicago Ridge, IL | 1981 / 2004 | 832,350 | 73.0% | 30.3 miles | $629 | Kohl’s Dick’s Sporting Goods AMC Theater (6 Screens) Michaels ALDI Old Navy Forever 21 |
| (1) | Source: Appraisal, unless stated otherwise. |
| (2) | Total NRA (SF) includes only the Total Collateral NRA. |
| (3) | Based on the underwritten rent roll dated November 14, 2023. |
| (4) | Represents sales per square foot as of the 12 months ended September 2023 for in-line tenants (excluding Apple). |
| THE INFORMATION IN THIS STRUCTURAL AND COLLATERAL TERM SHEET IS NOT COMPLETE AND MAY BE AMENDED PRIOR TO THE TIME OF SALE. THIS TERM SHEET IS NOT AN OFFER TO SELL THESE SECURITIES AND IT IS NOT A SOLICITATION OF AN OFFER TO BUY THESE SECURITIES IN ANY JURISDICTION WHERE THE OFFER OR SALE IS NOT PERMITTED. |
| | 67 | |
| Retail - Super Regional Mall | Loan #3 | Cut-off Date Balance: | | $79,500,000 |
| 5 Woodfield Mall | Woodfield Mall | Cut-off Date LTV: | | 38.0% |
| Schaumburg, IL 60173 | | U/W NCF DSCR: | | 2.42x |
| | | U/W NOI Debt Yield: | | 16.0% |
Escrows. At origination, the borrower was required to deposit into escrow (i) approximately $6,460,707 for outstanding tenant improvement allowances and leasing commissions identified in a schedule to the related loan agreement and (ii) approximately $838,789 for a gap rent reserve.
Tax Escrows – During the continuance of a Lockbox Event, the borrower is required to escrow 1/12th of the annual estimated tax payments on a monthly basis.
Insurance Escrows – During the continuance of a Lockbox Event, the borrower is required to escrow 1/12th of the annual estimated insurance payments on a monthly basis, except if the Woodfield Mall Property is insured under a blanket policy meeting the requirements set forth in the related Woodfield Mall Whole Loan documents (in which case, no insurance escrows will be required, notwithstanding the occurrence of a Lockbox Event).
Replacement Reserves – During the continuance of a Lockbox Event, the borrower is required to escrow $15,000 per month.
Rollover Reserve – During the continuance of a Lockbox Event, the borrower is required to escrow an amount equal to $73,000 per month for lease rollover reserves.
Lockbox and Cash Management. The Woodfield Mall Whole Loan is structured with a hard lockbox and springing cash management. The borrower and property manager are required to direct the tenants to pay rent directly into the lockbox account, and to deposit any rents otherwise received into such account within two business days after receipt. So long as no Lockbox Event has occurred and is continuing, the borrower will have access to the funds in the lockbox account and may use the lockbox account as an operating account. During the continuance of a Lockbox Event, all funds in the lockbox account are required to be swept on a weekly basis to a lender-controlled cash management account. Funds in the cash management account are required to be applied to debt service and the reserves and escrows described above, with any excess funds (i) deposited into an excess cash flow reserve account held by the lender as cash collateral for the Woodfield Mall Whole Loan, or if (ii) no Lockbox Event is continuing, disbursed to the borrower.
A “Lockbox Event” means the period commencing upon the occurrence of (i) an event of default, (ii) a bankruptcy action of the borrower or affiliated manager, or (iii) a Debt Yield Trigger Event (as defined below). A Lockbox Event will end (a) with respect to the matters described in clause (i) above, if the event of default has been waived by the lender, (b) with respect to the matters described in clause (ii) above, if the applicable property manager is replaced within 60 days or the bankruptcy action is dismissed within 90 days without any adverse consequences to the Woodfield Mall Property, or (c) with respect to matters described in clause (iii) above, a Debt Yield Trigger Event Cure (as defined below) occurs. A Lockbox Event may not be cured more than five times during the term of the Woodfield Mall Whole Loan.
A “Debt Yield Trigger Event” will occur if as of any date of determination, the debt yield based on the trailing four calendar quarters period is less than 10.0% for two consecutive calendar quarters and will be cured upon the occurrence of a Debt Yield Trigger Event Cure.
“Debt Yield Trigger Event Cure” means the occurrence of any of the following: (a) the achievement of a 10.0% or greater debt yield for two consecutive calendar quarters, (b) the borrower prepays a portion of the Woodfield Mall Whole Loan in an amount sufficient such that the debt yield is no less than 10.0%, or (c) the borrower delivers to the lender (i) cash, (ii) U.S. obligations, (iii) other securities having a rating reasonably acceptable to the lender and for which a rating agency confirmation has been received or (iv) a letter of credit, in each case in an amount equal to the Debt Yield Cure Collateral amount (as applicable, the “Debt Yield Cure Collateral”), which such Debt Yield Cure Collateral will be held by the lender in escrow as additional collateral for the Woodfield Mall Whole Loan and will be returned to the borrower upon the earlier of (x) the occurrence of a Debt Yield Trigger Event Cure pursuant to clause (a) or (b) above (provided that no other Lockbox Event is then in effect), and (y) the repayment or defeasance of the debt in full.
Property Management. The Woodfield Mall Property is managed by Simon Management Associates, LLC, an affiliate of Simon.
Partial Release. Not permitted.
Real Estate Substitution. Not permitted.
Subordinate and Mezzanine Indebtedness. The Woodfield Mall Property also secures the Woodfield Mall Subordinate Companion Loan, which has an aggregate Cut-off Date principal balance of $30,000,000. The Woodfield Mall Subordinate Companion Loan accrues interest at 10.01625% per annum, resulting in a blended rate for the Woodfield Mall Whole Loan of approximately 6.7110% per annum. The Woodfield Mall Senior Loan is senior in right of payment to the Woodfield Mall Subordinate Companion Loan. The Woodfield Mall Subordinate Companion Loan was contributed to the BMO 2023-C7 securitization trust. Payments allocated to the Woodfield Mall Subordinate Companion Loan will be paid only to the holders of the Woodfield Mall Subordinate Companion Loan as described in “Description of the Mortgage Pool—The Whole Loans—The Non-Serviced A/B Whole Loan—The Woodfield Mall Whole Loan” in the Preliminary Prospectus.
Ground Lease. None.
Right of First Offer / Right of First Refusal. None.
| THE INFORMATION IN THIS STRUCTURAL AND COLLATERAL TERM SHEET IS NOT COMPLETE AND MAY BE AMENDED PRIOR TO THE TIME OF SALE. THIS TERM SHEET IS NOT AN OFFER TO SELL THESE SECURITIES AND IT IS NOT A SOLICITATION OF AN OFFER TO BUY THESE SECURITIES IN ANY JURISDICTION WHERE THE OFFER OR SALE IS NOT PERMITTED. |
| | 68 | |
| Retail - Super Regional Mall | Loan #3 | Cut-off Date Balance: | | $79,500,000 |
| 5 Woodfield Mall | Woodfield Mall | Cut-off Date LTV: | | 38.0% |
| Schaumburg, IL 60173 | | U/W NCF DSCR: | | 2.42x |
| | | U/W NOI Debt Yield: | | 16.0% |
Terrorism Insurance. The borrower is required to obtain and maintain property insurance and business interruption insurance for 24 months plus a 12-month extended period of indemnity. Such insurance is required to cover perils of terrorism and acts of terrorism; provided that if the Terrorism Risk Insurance Program Reauthorization Act of 2019 is not in effect, the borrower will not be obligated to pay terrorism insurance premiums in excess of two times the annual premium for the property and business income or rental income insurance required hereunder on a standalone basis (without giving effect to the cost of terrorism and earthquake components of such casualty and business income or rental income insurance). In addition, any stand-alone terrorism insurance policy may have a deductible of up to $500,000. See “Risk Factors—Risks Relating to the Mortgage Loans—Terrorism Insurance May Not Be Available for All Mortgaged Properties” in the Preliminary Prospectus.
| THE INFORMATION IN THIS STRUCTURAL AND COLLATERAL TERM SHEET IS NOT COMPLETE AND MAY BE AMENDED PRIOR TO THE TIME OF SALE. THIS TERM SHEET IS NOT AN OFFER TO SELL THESE SECURITIES AND IT IS NOT A SOLICITATION OF AN OFFER TO BUY THESE SECURITIES IN ANY JURISDICTION WHERE THE OFFER OR SALE IS NOT PERMITTED. |
| | 69 | |
| Office - CBD | Loan #4 | Cut-off Date Balance: | | $75,000,000 |
11100 and 11150 Santa Monica
Boulevard | Westwood Gateway II | Cut-off Date LTV: | | 45.5% |
| Los Angeles, CA 90025 | | U/W NCF DSCR: | | 3.01x |
| | | U/W NOI Debt Yield: | | 17.5% |
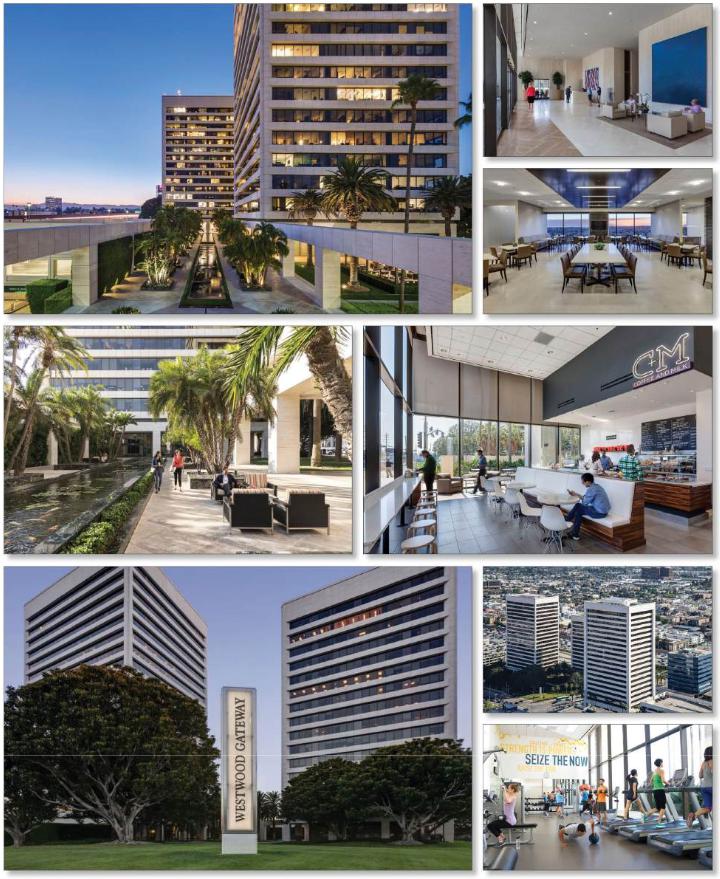
| THE INFORMATION IN THIS STRUCTURAL AND COLLATERAL TERM SHEET IS NOT COMPLETE AND MAY BE AMENDED PRIOR TO THE TIME OF SALE. THIS TERM SHEET IS NOT AN OFFER TO SELL THESE SECURITIES AND IT IS NOT A SOLICITATION OF AN OFFER TO BUY THESE SECURITIES IN ANY JURISDICTION WHERE THE OFFER OR SALE IS NOT PERMITTED. |
| | 70 | |
| Office - CBD | Loan #4 | Cut-off Date Balance: | | $75,000,000 |
11100 and 11150 Santa Monica
Boulevard | Westwood Gateway II | Cut-off Date LTV: | | 45.5% |
| Los Angeles, CA 90025 | | U/W NCF DSCR: | | 3.01x |
| | | U/W NOI Debt Yield: | | 17.5% |

| THE INFORMATION IN THIS STRUCTURAL AND COLLATERAL TERM SHEET IS NOT COMPLETE AND MAY BE AMENDED PRIOR TO THE TIME OF SALE. THIS TERM SHEET IS NOT AN OFFER TO SELL THESE SECURITIES AND IT IS NOT A SOLICITATION OF AN OFFER TO BUY THESE SECURITIES IN ANY JURISDICTION WHERE THE OFFER OR SALE IS NOT PERMITTED. |
| | 71 | |
| Office - CBD | Loan #4 | Cut-off Date Balance: | | $75,000,000 |
11100 and 11150 Santa Monica
Boulevard | Westwood Gateway II | Cut-off Date LTV: | | 45.5% |
| Los Angeles, CA 90025 | | U/W NCF DSCR: | | 3.01x |
| | | U/W NOI Debt Yield: | | 17.5% |
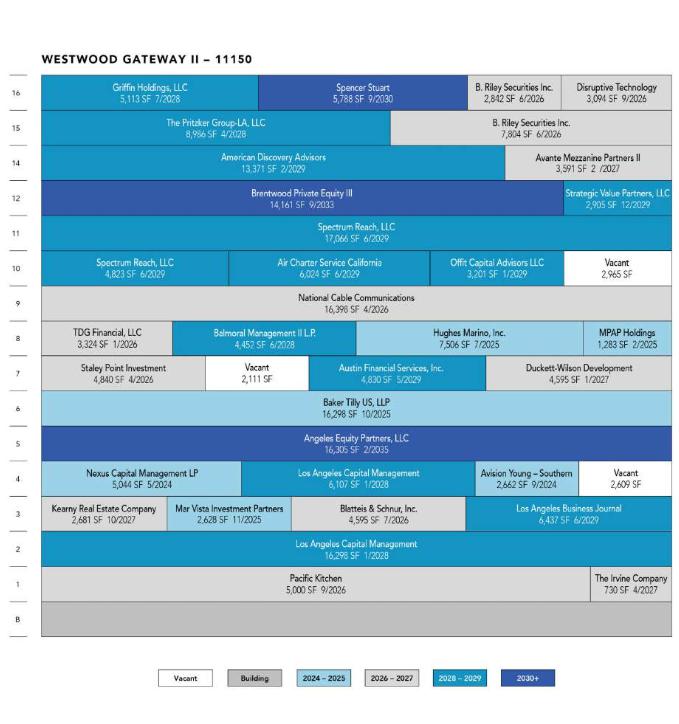
| THE INFORMATION IN THIS STRUCTURAL AND COLLATERAL TERM SHEET IS NOT COMPLETE AND MAY BE AMENDED PRIOR TO THE TIME OF SALE. THIS TERM SHEET IS NOT AN OFFER TO SELL THESE SECURITIES AND IT IS NOT A SOLICITATION OF AN OFFER TO BUY THESE SECURITIES IN ANY JURISDICTION WHERE THE OFFER OR SALE IS NOT PERMITTED. |
| | 72 | |
| Office - CBD | Loan #4 | Cut-off Date Balance: | | $75,000,000 |
11100 and 11150 Santa Monica
Boulevard | Westwood Gateway II | Cut-off Date LTV: | | 45.5% |
| Los Angeles, CA 90025 | | U/W NCF DSCR: | | 3.01x |
| | | U/W NOI Debt Yield: | | 17.5% |

| THE INFORMATION IN THIS STRUCTURAL AND COLLATERAL TERM SHEET IS NOT COMPLETE AND MAY BE AMENDED PRIOR TO THE TIME OF SALE. THIS TERM SHEET IS NOT AN OFFER TO SELL THESE SECURITIES AND IT IS NOT A SOLICITATION OF AN OFFER TO BUY THESE SECURITIES IN ANY JURISDICTION WHERE THE OFFER OR SALE IS NOT PERMITTED. |
| | 73 | |
| No. 4 – Westwood Gateway II |
| |
| Mortgage Loan Information | | Mortgaged Property Information |
| Mortgage Loan Seller: | Bank of America, National Association | | Single Asset/Portfolio: | Single Asset |
Credit Assessment (Fitch/KBRA/Moody’s): | BBBsf/BBB-(sf)/A2(sf) | | Property Type – Subtype: | Office - CBD |
| Original Principal Balance(1): | $75,000,000 | | Location: | Los Angeles, CA |
| Cut-off Date Balance(1): | $75,000,000 | | Size: | 548,904 SF |
| % of Initial Pool Balance: | 6.9% | | Cut-off Date Balance Per SF(1): | $273.27 |
| Loan Purpose: | Recapitalization | | Maturity Date Balance Per SF(1): | $273.27 |
| Borrower Sponsor: | The Irvine Company LLC | | Year Built/Renovated: | 1986, 1989/NAP |
| Guarantor: | Irvine Core Office LLC | | Title Vesting: | Fee |
| Mortgage Rate: | 5.5600% | | Property Manager: | Irvine Management Company (borrower-related) |
| Note Date: | March 28, 2024 | | Current Occupancy (As of): | 95.7% (2/29/2024) |
| Seasoning: | 2 months | | 12/31/2023 Occupancy: | 98.0% |
| Maturity Date: | April 1, 2034 | | 12/31/2022 Occupancy: | 96.0% |
| IO Period: | 120 months | | 12/31/2021 Occupancy: | 96.0% |
| Loan Term (Original): | 120 months | | As-Is Appraised Value: | $330,000,000 |
| Amortization Term (Original): | NAP | | As-Is Appraised Value Per SF: | $601.20 |
| Loan Amortization Type: | Interest Only | | As-Is Appraisal Valuation Date: | March 11, 2024 |
| Call Protection: | L(26),DorYM1(89),O(5) | | Underwriting and Financial Information |
| Lockbox Type: | Hard/Springing Cash Management | | TTM 2/29/2024 NOI: | $24,446,126 |
| Additional Debt(1): | Yes | | TTM 12/31/2023 NOI: | $24,802,129 |
| Additional Debt Type (Balance)(1): | Pari Passu ($75,000,000); | | TTM 12/31/2022 NOI: | $22,382,193 |
| | | | TTM 12/31/2021 NOI: | $19,732,734 |
| | | | U/W Revenues: | $38,185,908 |
| | | | U/W Expenses: | $11,938,115 |
| Escrows and Reserves(2) | | U/W NOI: | $26,247,793 |
| | Initial | Monthly | Cap | | U/W NCF: | $25,480,110 |
| Taxes | $0 | Springing | NAP | | U/W DSCR based on NOI/NCF(1): | 3.10x / 3.01x |
| Insurance | $0 | Springing | NAP | | U/W Debt Yield based on NOI/NCF(1): | 17.5% / 17.0% |
| Replacement Reserve | $0 | Springing | NAP | | U/W Debt Yield at Maturity based on NOI/NCF(1): | 17.5% / 17.0% |
| TI/LC Reserve | $0 | Springing | $2,000,000 | | Cut-off Date LTV Ratio(1): | 45.5% |
| Other Reserves(3) | $8,042,693 | $0 | NAP | | LTV Ratio at Maturity(1): | 45.5% |
| | | | | | | | | |
| Sources and Uses |
| Sources | | | | | Uses | | | |
| Whole Loan Amount(1) | $150,000,000 | | 100.0% | | Return of Equity | $141,427,423 | | 94.3 | % |
| | | | | | Upfront Reserves | 8,042,693 | | 5.4 | |
| | | | | | Closing Costs | 529,884 | | 0.4 | |
| Total Sources | $150,000,000 | | 100.0% | | Total Uses | $150,000,000 | | 100.0 | % |
| (1) | The Westwood Gateway II Mortgage Loan (as defined below) is part of the Westwood Gateway II Whole Loan (as defined below), which is evidenced by four pari passu promissory notes with an aggregate principal balance of $150,000,000. The Cut-off Date Balance Per SF, Maturity Date Balance Per SF, U/W DSCR based on NOI/NCF, U/W Debt Yield based on NOI/NCF, U/W Debt Yield at Maturity based on NOI/NCF, Cut-off Date LTV Ratio and LTV Ratio at Maturity numbers presented above are based on the aggregate principal balance of the promissory notes comprising the Westwood Gateway II Whole Loan. |
| (2) | See “Escrows” section for further discussion. |
| (3) | Other Reserves consist of an unfunded obligations reserve ($4,493,417) and a free rent reserve ($3,549,276). |
The Mortgage Loan. The fourth largest mortgage loan (the “Westwood Gateway II Mortgage Loan”) is part of a whole loan (the “Westwood Gateway II Whole Loan”) that is evidenced by four pari passu promissory notes in the aggregate original principal amount of $150,000,000 and secured by a first priority fee mortgage encumbering two Class “A” office buildings containing 548,904 square feet, located in Los Angeles, California (the “Westwood Gateway II Property”). The Westwood Gateway II Mortgage Loan is evidenced by the controlling Note A-1, with an original principal amount of $75,000,000. The remaining promissory notes comprising the Westwood Gateway II Whole Loan (the “Westwood Gateway II Pari Passu Companion Loans”) are summarized in the below table. The Westwood Gateway II Whole Loan will be serviced pursuant to the pooling and servicing agreement for the BANK 2024-BNK47 securitization. See “Description of the Mortgage Pool—The Whole Loans—The Serviced Pari Passu Whole Loans” and “Pooling and Servicing Agreement—Servicing of the Serviced Mortgage Loans” in the Preliminary Prospectus.
| THE INFORMATION IN THIS STRUCTURAL AND COLLATERAL TERM SHEET IS NOT COMPLETE AND MAY BE AMENDED PRIOR TO THE TIME OF SALE. THIS TERM SHEET IS NOT AN OFFER TO SELL THESE SECURITIES AND IT IS NOT A SOLICITATION OF AN OFFER TO BUY THESE SECURITIES IN ANY JURISDICTION WHERE THE OFFER OR SALE IS NOT PERMITTED. |
| | 74 | |
| Office - CBD | Loan #4 | Cut-off Date Balance: | | $75,000,000 |
11100 and 11150 Santa Monica
Boulevard | Westwood Gateway II | Cut-off Date LTV: | | 45.5% |
| Los Angeles, CA 90025 | | U/W NCF DSCR: | | 3.01x |
| | | U/W NOI Debt Yield: | | 17.5% |
Whole Loan Note Summary
Notes | Original Balance | Cut-off Date Balance | Note Holder | Controlling Piece |
| A-1 | $75,000,000 | $75,000,000 | BANK 2024-BNK47 | Yes |
| A-2 | $50,000,000 | $50,000,000 | BBCMS 2024-C26 | No |
| A-3 | $15,000,000 | $15,000,000 | BBCMS 2024-C26 | No |
| A-4 | $10,000,000 | $10,000,000 | BBCMS 2024-C26 | No |
| Total | $150,000,000 | $150,000,000 | | |
The Borrower and Borrower Sponsor. The borrower is Westwood Gateway II LLC, a Delaware limited liability company and single purpose entity with two independent directors. Legal counsel to the borrower delivered a non-consolidation opinion in connection with the origination of the Westwood Gateway II Whole Loan.
The borrower sponsor of the Westwood Gateway II Whole Loan is The Irvine Company LLC (“The Irvine Company”) and the non-recourse carveout guarantor is Irvine Core Office LLC. The Irvine Company is a private real estate investment company headquartered in Newport Beach, California and headed by Donald Bren, Chairman of the Board. The Irvine Company is committed to long-term ownership of a high-quality real estate portfolio encompassing apartment communities, new home villages, office buildings, retail, dining and entertainment and resorts. The Irvine Company’s holdings consist of 129 million square feet and includes more than 590 office buildings, 125 apartment communities with 65,000 units, 40 retail centers, one coastal resort, three golf courses and five marinas. The Irvine Company's collection of office properties are located in Orange County, California, Los Angeles, San Diego, Silicon Valley, Chicago and New York.
The Property. The Westwood Gateway II Property is comprised of one 15-story, Class “A” office tower and one 19-story, Class “A” office tower, together totaling 548,904 square feet and located in Los Angeles, California. The Westwood Gateway II Property is situated directly off of the Interstate-405 freeway exit, occupying a full city block bounded by Santa Monica Boulevard, Sepulveda Boulevard, Nebraska Avenue and Cotner Avenue. The Westwood Gateway II Property was developed by the borrower sponsor in 1986 and 1989 and the borrower sponsor has continued to invest in the property. Between 2019 and 2023, the borrower sponsor has invested a total of over $16.3 million in capital expenditures to the Westwood Gateway II Property. The buildings are finished in Italian travertine marble and bronze and are joined by a central pedestrian plaza through which there is a koi pond that stretches through the middle of the courtyard. The lobbies and public areas are also finished with Italian travertine marble and all office suites offer panoramic views through floor-to-ceiling laminated bronze glass. The Westwood Gateway II Property represents two buildings within a larger three building office campus. The third (non-collateral) building (Westwood Gateway I) is owned by an affiliate of the borrower sponsor.
Amenities at the Westwood Gateway II Property include 1,520-spaces between two parking garages, C+M (coffeehouse), Pacific Kitchen (restaurant), Kinetic Fitness Center, The Commons (open air gathering center with internet access), The Lounge (common area with big screen TV and pool table), multiple conference centers, customer resource center, EV charging stations, bike racks, car wash and shoeshine and repair. In addition to the onsite amenities, the Westwood Gateway II Property is located within walking distance of multiple area restaurants.
As of February 29, 2024, the Westwood Gateway II Property was 95.7% leased to 55 tenants representing various industries including finance, law, insurance, accounting and other industries. Fiscal year-end historical occupancy has ranged from 96.0% to 99.0% dating back to 2016. The three largest tenants are The Capital Group Co., Inc. (“Capital Group”), Crescent Capital Group LP (“Crescent Capital”) and B. Riley Securities, Inc. (“B. Riley”), which have original lease commencements in 1992, 1993 and 1999, respectively. Outside of the largest three tenants, no tenant represents more than 4.5% of net rentable area or 4.7% of base rent.
Major Tenants.
The Capital Group Co., Inc. (83,329 square feet; 15.2% of NRA; 17.2% of underwritten rent). Capital Group has been a tenant at the Westwood Gateway II Property since 1992. The tenant's lease extends through June 2031 with two, five-year extension options remaining. Current base rent is $66.84 PSF, increasing to $69.84 PSF, effective July 1, 2024. The tenant does not have any termination options. Capital Group, headquartered in Los Angeles, California, is one of the leading investment management firms globally. Founded in 1931, Capital Group offers a wide range of investment services, including equity, fixed income and multi-asset investment strategies, catering to individual investors, financial intermediaries and institutions.
Crescent Capital Group LP (41,899 square feet; 7.6% of NRA; 7.7% of underwritten rent). Crescent Capital has been a tenant at the Westwood Gateway II Property since 1993. The tenant's lease extends through February 2032 with one, five-year renewal option remaining. In connection with its most recent renewal, Crescent Capital is entitled to six months of free rent (from September 2024 through February 2025), which amount has been fully reserved by the lender. Current base rent is $66.00 PSF for Suites 1000 and 1125, decreasing to $60.00 PSF, effective September 1, 2024. Current base rent for Suite 1110 is $64.32 PSF, decreasing to $60.00 PSF, effective September 1, 2024. Current base rent for Suite 2000 is $66.00 PSF, decreasing to $64.80 PSF, effective September 1, 2024. The tenant does not have any termination options. Crescent Capital is a global alternative investment firm focused on below investment grade credit markets with primary strategies that include funds that invest in leveraged loans, high-yield bonds, mezzanine debt, special situations and distressed securities. The firm had approximately $40 billion of assets under management as of March 31, 2024 and has made investments in over 190 companies since its inception as well as expanded into the European market with operations based in London. Since its founding in 1991, the firm has raised approximately $25 billion across seven funds.
| THE INFORMATION IN THIS STRUCTURAL AND COLLATERAL TERM SHEET IS NOT COMPLETE AND MAY BE AMENDED PRIOR TO THE TIME OF SALE. THIS TERM SHEET IS NOT AN OFFER TO SELL THESE SECURITIES AND IT IS NOT A SOLICITATION OF AN OFFER TO BUY THESE SECURITIES IN ANY JURISDICTION WHERE THE OFFER OR SALE IS NOT PERMITTED. |
| | 75 | |
| Office - CBD | Loan #4 | Cut-off Date Balance: | | $75,000,000 |
11100 and 11150 Santa Monica
Boulevard | Westwood Gateway II | Cut-off Date LTV: | | 45.5% |
| Los Angeles, CA 90025 | | U/W NCF DSCR: | | 3.01x |
| | | U/W NOI Debt Yield: | | 17.5% |
B. Riley Securities, Inc. (26,500 square feet; 4.8% of NRA; 5.1% of underwritten rent). B. Riley has been a tenant at the Westwood Gateway II Property since 1999. The tenant leases 15,854 square feet through April 2029, with a one, five-year renewal option with a nine month notice. Current base rent for the 15,854 square foot space is $64.92 PSF, increasing to $67.80, effective May 1, 2024. The tenant had a termination option that it did not exercise in April 2023, which is no longer effective. B. Riley also leases 10,646 square feet through June 2026 with no renewal options. Current base rent for the 10,646 square foot space is $57.84 PSF, increasing to $59.88 PSF, effective July 1, 2024. The tenant currently sub-leases the entirety of this space: 7,804 square feet to NAI Capital Commercial Inc. and the remaining 2,842 square feet to Strategic Funding Source, Inc. B. Riley, headquartered in Arlington, Virginia, is a full-service investment bank and subsidiary of B. Riley Financial, Inc. The firm provides a comprehensive suite of investment banking services, including equity research, sales and trading, corporate finance and advisory services. B. Riley caters primarily to institutional investors, corporate clients and high-net-worth individuals, offering personalized financial solutions to meet their investment objectives and capital raising needs.
The following table presents certain information relating to the tenancy at the Westwood Gateway II Property:
Tenant Summary(1)
| Tenant Name | Credit Rating (Fitch/Moody’s/ S&P) | Tenant NRSF | % of
NRSF | Annual U/W Base Rent | % of Total Annual U/W Base Rent | Annual U/W Base Rent PSF | Lease Exp. Date | Renewal Options | Termination Options |
| The Capital Group Co., Inc. | NR/NR/NR | 83,329 | 15.2% | $5,819,697 | 17.2% | $69.84 | 6/30/2031 | 2 x 5 yr | N |
| Crescent Capital Group LP | NR/NR/NR | 41,899 | 7.6% | $2,595,463 | 7.7% | $61.95 | 2/29/2032 | 1 x 5 yr | N |
| B. Riley Securities, Inc.(2) | NR/NR/NR | 26,500 | 4.8% | $1,712,385 | 5.1% | $64.62 | Various | (2) | N |
| Aristotle Capital Management | NR/NR/NR | 24,951 | 4.5% | $1,580,304 | 4.7% | $63.34 | 9/30/2028 | 1 x 5 yr | N |
| Los Angeles Capital Management | NR/NR/NR | 22,405 | 4.1% | $1,438,401 | 4.2% | $64.20 | 1/31/2028 | 1 x 5 yr | N |
| Spectrum Reach, LLC | NR/NR/NR | 21,889 | 4.0% | $1,365,873 | 4.0% | $62.40 | 6/30/2029 | 1 x 5 yr | N |
| Jefferies LLC | NR/NR/NR | 17,205 | 3.1% | $1,251,147 | 3.7% | $72.72 | 12/31/2030 | (3) | N |
| National Cable Communications | NR/NR/NR | 16,398 | 3.0% | $1,042,913 | 3.1% | $63.60 | 4/30/2026 | 1 x 5 yr | N |
| Angeles Equity Partners, LLC(4) | NR/NR/NR | 16,305 | 3.0% | $968,517 | 2.9% | $59.40 | 2/28/2035 | 1 x 5 yr | Y |
| Aspiriant, LLC | NR/NR/NR | 16,301 | 3.0% | $1,144,332 | 3.4% | $70.20 | 8/31/2028 | 1 x 5 yr | Y |
| Subtotal/Wtd. Avg. | | 287,182 | 52.3% | $18,919,032 | 55.8% | $65.88 | | | |
| | | | | | | | | | |
| Other Tenants | | 238,299 | 43.4% | $14,976,189 | 44.2% | $62.85 | | | |
| Vacant Space | | 23,423 | 4.3% | $0 | 0.0% | $0.00 | | | |
| Total/Wtd. Avg.(5) | | 548,904 | 100.0% | $33,895,221 | 100.0% | $64.50 | | | |
| (1) | Information is based on the underwritten rent roll dated February 29, 2024 and is inclusive of rent steps through April 2025. |
| (2) | B. Riley Securities, Inc. leases 15,854 SF, expiring on April 30, 2029, with a one, five-year renewal option. B. Riley Securities, Inc. also leases 10,646 SF, expiring on June 30, 2026 (with no renewal options), which space is entirely subleased to two subtenants. |
| (3) | Jefferies LLC has one, 5-year or one, 7-year renewal option. |
| (4) | Angeles Equity Partners, LLC has a termination option effective as of September 1, 2031, with at least 12 months’ notice and payment of a termination fee. |
| (5) | Total/Wtd. Avg. Annual U/W Base Rent PSF excludes vacant space. |
| THE INFORMATION IN THIS STRUCTURAL AND COLLATERAL TERM SHEET IS NOT COMPLETE AND MAY BE AMENDED PRIOR TO THE TIME OF SALE. THIS TERM SHEET IS NOT AN OFFER TO SELL THESE SECURITIES AND IT IS NOT A SOLICITATION OF AN OFFER TO BUY THESE SECURITIES IN ANY JURISDICTION WHERE THE OFFER OR SALE IS NOT PERMITTED. |
| | 76 | |
| Office - CBD | Loan #4 | Cut-off Date Balance: | | $75,000,000 |
11100 and 11150 Santa Monica
Boulevard | Westwood Gateway II | Cut-off Date LTV: | | 45.5% |
| Los Angeles, CA 90025 | | U/W NCF DSCR: | | 3.01x |
| | | U/W NOI Debt Yield: | | 17.5% |
The following table presents certain information relating to the lease rollover schedule at the Westwood Gateway II Property:
Lease Expiration Schedule(1)(2)
Year Ending
December 31, | No. of Leases Expiring | Expiring NRSF | % of Total NRSF Expiring | Cumulative Expiring NRSF | Cumulative % of Total NRSF Expiring | Annual
U/W
Base Rent Expiring | % of Total Annual U/W Base Rent Expiring | Annual
U/W
Base Rent
PSF Expiring |
| 2024 & MTM | 5 | 14,389 | 2.6% | 14,389 | 2.6% | $917,569 | 2.7% | $63.77 |
| 2025 | 12 | 61,009 | 11.1% | 75,398 | 13.7% | 3,937,427 | 11.6% | $64.54 |
| 2026 | 14 | 63,492 | 11.6% | 138,890 | 25.3% | 3,805,920 | 11.2% | $59.94 |
| 2027 | 8 | 24,865 | 4.5% | 163,755 | 29.8% | 1,456,244 | 4.3% | $58.57 |
| 2028 | 9 | 87,501 | 15.9% | 251,256 | 45.7% | 5,650,787 | 16.7% | $64.58 |
| 2029 | 14 | 74,511 | 13.6% | 325,767 | 59.3% | 4,862,065 | 14.3% | $65.25 |
| 2030 | 4 | 28,623 | 5.2% | 354,390 | 64.5% | 2,021,283 | 6.0% | $70.62 |
| 2031 | 8 | 98,726 | 18.0% | 453,116 | 82.5% | 6,769,110 | 20.0% | $68.56 |
| 2032 | 4 | 41,899 | 7.6% | 495,015 | 90.1% | 2,595,463 | 7.7% | $61.95 |
| 2033 | 1 | 14,161 | 2.6% | 509,176 | 92.7% | 910,836 | 2.7% | $64.32 |
| 2034 | 0 | 0 | 0.0% | 509,176 | 92.7% | 0 | 0.0% | $0.00 |
| Thereafter | 1 | 16,305 | 3.0% | 525,481 | 95.7% | 968,517 | 2.9% | $59.40 |
| Vacant | 0 | 23,423 | 4.3% | 548,904 | 100.0% | 0 | 0.0% | $0.00 |
| Total/Wtd. Avg. | 80 | 548,904 | 100.0% | | | $33,895,221 | 100.0% | $64.50(3) |
| (1) | Information is based on the underwritten rent roll dated February 29, 2024 and is inclusive of rent steps through April 2025. |
| (2) | Certain tenants may have lease termination options that are exercisable prior to the originally stated expiration date of the subject lease and that are not considered in the Lease Expiration Schedule. |
| (3) | Total/Wtd. Avg. Annual U/W Base Rent PSF Expiring excludes vacant space. |
The following table presents historical occupancy percentages at the Westwood Gateway II Property:
Historical Occupancy(1)
2021 | 2022 | 2023 | 2/29/2024(2) |
| 96.0% | 96.0% | 98.0% | 95.7% |
| (1) | As provided by the borrower sponsors as of December 31 for each respective year. |
| (2) | Current occupancy is based on the underwritten rent roll as of February 29, 2024. |
| THE INFORMATION IN THIS STRUCTURAL AND COLLATERAL TERM SHEET IS NOT COMPLETE AND MAY BE AMENDED PRIOR TO THE TIME OF SALE. THIS TERM SHEET IS NOT AN OFFER TO SELL THESE SECURITIES AND IT IS NOT A SOLICITATION OF AN OFFER TO BUY THESE SECURITIES IN ANY JURISDICTION WHERE THE OFFER OR SALE IS NOT PERMITTED. |
| | 77 | |
| Office - CBD | Loan #4 | Cut-off Date Balance: | | $75,000,000 |
11100 and 11150 Santa Monica
Boulevard | Westwood Gateway II | Cut-off Date LTV: | | 45.5% |
| Los Angeles, CA 90025 | | U/W NCF DSCR: | | 3.01x |
| | | U/W NOI Debt Yield: | | 17.5% |
Historical Performance and Underwritten Net Cash Flow. The following table presents certain information relating to the historical performance and underwritten net cash flow at the Westwood Gateway II Property:
Cash Flow Analysis(1)
| | 2021 | 2022 | 2023 | TTM 2/29/2024 | U/W | %(2) | U/W $ per SF |
| Gross Potential Rent(3) | $28,088,675 | $30,163,369 | $31,811,313 | $31,039,129 | $35,005,279 | 96.9% | $63.77 |
| Expense Reimbursement | 523,290 | 525,517 | 1,101,594 | 1,129,307 | 1,082,688 | 3.0 | 1.97 |
| Underwriting Adjustment | 0 | 0 | 0 | 0 | 22,940 | 0.1 | 0.04 |
| Net Rental Income | $28,611,965 | $30,688,886 | $32,912,907 | $32,168,436 | $36,110,907 | 100.0% | $65.79 |
| Parking Income | 1,558,125 | 2,415,608 | 3,464,774 | 3,693,265 | 3,693,265 | 10.2 | 6.73 |
| Other Income | 207,264 | 231,633 | 258,695 | 243,667 | 259,185 | 0.7 | 0.47 |
| (Vacancy/Credit Loss) | 0 | 0 | 0 | 0 | (1,877,449) | (5.2) | (3.42) |
| Effective Gross Income | $30,377,354 | $33,336,127 | $36,636,376 | $36,105,368 | $38,185,908 | 105.7% | $69.57 |
| | | | | | | | |
| Total Expenses | $10,644,620 | $10,953,934 | $11,834,247 | $11,659,242 | $11,938,115 | 31.3% | $21.75 |
| | | | | | | | |
| Net Operating Income | $19,732,734 | $22,382,193 | $24,802,129 | $24,446,126 | $26,247,793 | 68.7% | $47.82 |
| | | | | | | | |
| Capital Expenditures | 0 | 0 | 0 | 0 | 218,779 | 0.6 | 0.40 |
| TI/LC | 0 | 0 | 0 | 0 | 548,904 | 1.4 | 1.00 |
| | | | | | | | |
| Net Cash Flow | $19,732,734 | $22,382,193 | $24,802,129 | $24,446,126 | $25,480,110 | 66.7% | $46.42 |
| | | | | | | | |
| NOI DSCR(4) | 2.33x | 2.65x | 2.93x | 2.89x | 3.10x | | |
| NCF DSCR(4) | 2.33x | 2.65x | 2.93x | 2.89x | 3.01x | | |
| NOI Debt Yield(4) | 13.2% | 14.9% | 16.5% | 16.3% | 17.5% | | |
| NCF Debt Yield(4) | 13.2% | 14.9% | 16.5% | 16.3% | 17.0% | | |
| (1) | Based on the underwritten rent roll dated February 29, 2024. |
| (2) | % column represents percent of Net Rental Income for all revenue lines and represents percent of Effective Gross Income for the remainder of fields. |
| (3) | U/W Gross Potential Rent includes contractual rent steps taken through April 2025. |
| (4) | Debt service coverage ratios and debt yields are based on the Westwood Gateway II Whole Loan. |
Appraisal. The appraiser concluded to an “as-is” appraised value for the Westwood Gateway II Property of $330,000,000 as of March 11, 2024.
Environmental Matters. According to the Phase I environmental report dated March 11, 2024, there was no evidence of any recognized environmental conditions at the Westwood Gateway II Property.
Market Overview and Competition. The Westwood Gateway II Property is located in Los Angeles, California, within the West LA Office submarket. Situated at the southeast corner of Santa Monica Boulevard and Sepulveda Boulevard, directly off of the Interstate-405 freeway exit, the Westwood Gateway II Property is located within 10 miles of some of Los Angeles’ most affluent neighborhoods including Bel-Air, Santa Monica and Pacific Palisades, approximately 13 miles west of the Los Angeles central business district, and approximately 10 miles north of the Los Angeles International Airport. The Westwood Gateway II Property’s location provides access and visibility along the Interstate-405 freeway and caters to a broad employment base of both executives and non-executive employees.
The Los Angeles economy comprises substantial portions of the national entertainment, tourism, international trade, fashion and aerospace industries. Los Angeles has several major talent generators, including top tier universities such as USC, UCLA and Cal Tech that support a growing tech ecosystem.
The transportation sector has experienced sustained growth as warehousing demands have increased by retailers and e-commerce operators. Much of the demand draws from the ports of Los Angeles and Long Beach, which rank first and second in the United States in terms of containers handled annually. The entertainment business is vital to the Los Angeles economy. Los Angeles has benefitted from the boom in content creation and social media over the past 10 years. Tourism is also important to the local economy, driven by more than 50 million visitors per year. Stores, restaurants and lodging in tourist hotspots like Downtown Los Angeles, Hollywood, Beverly Hills and Santa Monica are dependent on tourist spending.
Major employers include Los Angeles International Airport (45,000 employees), UCLA Health System (35,543 employees), UCLA Community Based Learning (30,000 employees), University of California Los Angeles (27,489 employees), National Institutes of Health (20,000 employees), Los Angeles County Sheriff (20,000 employees), Cedars-Sinai Medical Center (11,246 employees), Vision X (10,000 employees) and the Los Angeles Police Department (9,000 employees).
| THE INFORMATION IN THIS STRUCTURAL AND COLLATERAL TERM SHEET IS NOT COMPLETE AND MAY BE AMENDED PRIOR TO THE TIME OF SALE. THIS TERM SHEET IS NOT AN OFFER TO SELL THESE SECURITIES AND IT IS NOT A SOLICITATION OF AN OFFER TO BUY THESE SECURITIES IN ANY JURISDICTION WHERE THE OFFER OR SALE IS NOT PERMITTED. |
| | 78 | |
| Office - CBD | Loan #4 | Cut-off Date Balance: | | $75,000,000 |
11100 and 11150 Santa Monica
Boulevard | Westwood Gateway II | Cut-off Date LTV: | | 45.5% |
| Los Angeles, CA 90025 | | U/W NCF DSCR: | | 3.01x |
| | | U/W NOI Debt Yield: | | 17.5% |
The 2023 population within a one-, three- and five-mile radius of the Westwood Gateway II Property was 46,728, 285,984 and 612,234, respectively. The 2023 average household income within the same radii was $151,347, $168,061 and $170,552, respectively.
The following table presents certain information relating to the appraisal’s market rent conclusion for the Westwood Gateway II Property:
| Category | Market Rent (PSF) | Average Lease Term (Yrs) |
| MLA Office | $60.00 | 5.0 |
| MLA Retail | $48.00 | 5.0 |
The following table presents recent leasing data at comparable properties to the Westwood Gateway II Property:
Property Name Location | Year Built / Renovated | Occ. | Total NRA (SF) | Tenant | Lease Date/ Term (yrs.) | Lease Size (SF) | Base Rent PSF |
Westwood Gateway II Los Angeles, CA | 1986, 1989 / NAP | 95.7%(1) | 548,904(1) | Angeles Equity Partners, LLC Crescent Capital Group LP Staley Point Investment | Sep-24 / 10.5 Sep-24 / 7.5 May-24 / 2.0 | 16,305 7,932 3,562 | $59.40 $60.00 $60.72 |
Wilshire Landmark II 11766 Wilshire Boulevard Los Angeles, CA | 1989 / NAP | 65% | 412,946 | Renewal Renewal Renewal New Lease | Sep-23 / 5.0 Sep-23 / 7.3 Apr-23 / 3.0 Mar-23 / 2.0 | 5,075 830 1,496 7,273 | $46.20 $44.40 $45.60 $43.20 |
Wilshire Landmark I 11755 Wilshire Boulevard Los Angeles, CA | 1986 / 2023 | 66% | 337,440 | Oakview Group Philip Michels Semler Brossy Consulting Group Palm Tree | Feb-24 / 3.3 Jun-23 / 2.0 May-23 / 8.0 Feb-23 / 10.8 | 18,890 4,575 18,890 6,347 | $63.00 $58.20 $57.00 $64.20 |
12100 Wilshire Boulevard Los Angeles, CA | 1985 / NAP | 68% | 365,325 | Renewal Renewal Renewal New Lease | Sep-23 / 5.2 Aug-23 / 3.0 Jul-23 / 1.0 Jul-23 / 3.0 | 4,336 1,264 9,754 2,318 | $42.00 $45.00 $46.80 $42.00 |
Wilshire Brentwood Plaza 12400 Wilshire Boulevard Los Angeles, CA | 1985 / NAP | 68% | 235,811 | Renewal New Lease Renewal Renewal | Sep-23 / 3.0 Apr-23 / 4.2 Mar-23 / 5.0 Jan-23 / 3.2 | 17,473 1,881 8,373 2,485 | $51.84 $44.40 $42.60 $43.80 |
Gateway Los Angeles 12424 Wilshire Boulevard Los Angeles, CA | 1987 / NAP | 84% | 147,819 | New Lease New Lease Renewal Expansion | Sep-23 / 9.0 Feb-23 / 5.3 Jan-23 / 3.0 Jul-22 / 10.1 | 14,299 2,274 2,125 2,519 | $51.48 $42.60 $39.60 $45.60 |
10900 Wilshire Boulevard Los Angeles, CA | 1981 / 2015 | 97% | 251,862 | Quill & Arrow, LLP Expansion Quill & Arrow, LLP Hennelly & Grossfeld, LLP | Mar-23 / 1.0 Jan-23 / 7.0 Jul-22 / 1.7 Jan-22 / 5.0 | 2,952 7,584 2,376 5,094 | $58.20 $54.48 $52.20 $51.00 |
Oppenheimer Tower 10880 Wilshire Boulevard Los Angeles, CA | 1970 / 2020 | 74% | 583,083 | Renewal New Lease Renewal New Lease | Apr-24 / 5.3 Sep-23 / 2.0 Sep-23 / 3.2 Sep-23 / 6.0 | 14,444 2,341 3,634 11,346 | $46.20 $49.80 $49.80 $52.80 |
Westwood Center 1100 Glendon Avenue Los Angeles, CA | 1965 / 2000 | 94% | 334,111 | New Lease New Lease New Lease New Lease | Dec-23 / 5.3 Oct-23 / 6.1 Jun-23 / 7.0 Apr-23 / 10.0 | 3,420 4,501 876 7,964 | $55.80 $55.20 $53.40 $52.80 |
Source: Appraisal
| (1) | Information obtained from the underwritten rent roll dated February 29, 2024. |
Escrows. At origination, the borrower deposited (i) $4,493,417 for unfunded landlord obligations and (ii) $3,549,276 for outstanding free rent and gap rent obligations.
Tax Escrows – Upon the occurrence of a Cash Trap Event Period (as defined below), the borrower is required to escrow monthly payments equal to 1/12th of the annual estimated tax payments.
Insurance Escrows – Upon the occurrence of a Cash Trap Event Period, and if there is no blanket policy in place, the borrower is required to escrow monthly payments equal to 1/12th of the annual estimated insurance payments.
Replacement Reserve – Upon the occurrence of a Cash Trap Event Period, the borrower is required to deposit monthly replacement reserves equal to approximately $18,232.
TI/LC Reserves – Upon the occurrence of a DSCR Trigger Event Period (as defined below), until a Cash Trap Event Period has occurred and is continuing, the borrower is required to deposit monthly TI/LC reserves equal to $45,742, subject to a cap of $2,000,000.
| THE INFORMATION IN THIS STRUCTURAL AND COLLATERAL TERM SHEET IS NOT COMPLETE AND MAY BE AMENDED PRIOR TO THE TIME OF SALE. THIS TERM SHEET IS NOT AN OFFER TO SELL THESE SECURITIES AND IT IS NOT A SOLICITATION OF AN OFFER TO BUY THESE SECURITIES IN ANY JURISDICTION WHERE THE OFFER OR SALE IS NOT PERMITTED. |
| | 79 | |
| Office - CBD | Loan #4 | Cut-off Date Balance: | | $75,000,000 |
11100 and 11150 Santa Monica
Boulevard | Westwood Gateway II | Cut-off Date LTV: | | 45.5% |
| Los Angeles, CA 90025 | | U/W NCF DSCR: | | 3.01x |
| | | U/W NOI Debt Yield: | | 17.5% |
The borrower, at its option, may provide one or more letters of credit or guaranties in lieu of, and in the amount of, any of the cash deposits required for tax escrows, insurance escrows, replacement reserves and TI/LC reserves.
A “Cash Trap Event Period” means the period either commencing (i) upon an event of default until cured or (ii) when the 30-year amortizing debt service coverage ratio is less than 1.10x (tested quarterly) until the 30-year amortizing debt service coverage ratio is greater than or equal to 1.10x for two consecutive calendar quarters; notwithstanding the foregoing, the borrower is permitted to deposit with the lender additional collateral in an amount which, if applied as a principal prepayment, to achieve a 30-year amortizing debt service coverage ratio greater than or equal to 1.10x, in order to avoid a Cash Trap Event Period.
A “DSCR Trigger Event Period” means a period commencing upon the date that the amortizing debt service coverage ratio is less than 1.15x (tested quarterly) until the amortizing debt service coverage ratio is greater than or equal to 1.15x for two consecutive calendar quarters.
Lockbox and Cash Management. The Westwood Gateway II Whole Loan documents require a hard lockbox with springing cash management. All rents from the Westwood Gateway II Property are required to be deposited directly into the lockbox account by tenants and, so long as a Cash Trap Event Period is not continuing, funds in the lockbox account will be transferred to the borrower’s operating account. During a Cash Trap Event Period, the borrower will not have access to the funds in the lockbox account and such funds will be transferred to the lender-controlled cash management account and disbursed according to the Westwood Gateway II Whole Loan documents. During a Cash Trap Event Period, all excess cash is required to be held by the lender as additional security for the Westwood Gateway II Whole Loan; provided that if no event of default is continuing, excess cash will be disbursed at the direction of the borrower in the event of shortfalls in leasing reserve funds to pay for qualified leasing expenses.
Property Management. The Westwood Gateway II Property is managed by Irvine Management Company, an affiliate of the borrower.
Partial Release. Not permitted.
Real Estate Substitution. Not permitted.
Subordinate and Mezzanine Indebtedness. Provided no event of default has occurred and is continuing, with lender consent, the borrower may incur future mezzanine debt, secured by a direct equity interest in the borrower.
Ground Lease. None.
Right of First Offer / Right of First Refusal. None.
Terrorism Insurance. The borrower is required to obtain and maintain property insurance and business interruption insurance for 24 months plus a six-month extended period of indemnity. Such insurance is required to cover perils of terrorism and acts of terrorism; provided that if the Terrorism Risk Insurance Program Reauthorization Act of 2019 (“TRIPRA”) is not in effect, the borrower will not be obligated to pay terrorism insurance premiums in excess of two times the annual premium for the property and business interruption policies (excluding the cost of the terrorism, named storm and earthquake components of such all-risk and business interruption insurance policies). In addition, the borrower is allowed to satisfy terrorism coverage requirements through the use of a licensed captive insurance company that is an affiliate of the borrower sponsor (The Irvine Company LLC), subject to certain conditions, including (A) the policy limits are approved by the lender in its reasonable discretion, and the deductible is no greater than that calculated by TRIPRA, (B) other than the deductible, the portion of the insurance not reinsured by TRIPRA must be reinsured by an insurance carrier rated no less than S&P “A-” (or Moody’s/ Fitch equivalents, if applicable), (C) TRIPRA is in effect and requires that the federal government must reinsure that portion of any terrorism claim above the applicable deductible and other privately reinsured amounts as set forth above, and (D) the captive insurer is not the subject of a bankruptcy or similar proceeding. See “Risk Factors—Risks Relating to the Mortgage Loans—Terrorism Insurance May Not Be Available for All Mortgaged Properties” in the Preliminary Prospectus.
| THE INFORMATION IN THIS STRUCTURAL AND COLLATERAL TERM SHEET IS NOT COMPLETE AND MAY BE AMENDED PRIOR TO THE TIME OF SALE. THIS TERM SHEET IS NOT AN OFFER TO SELL THESE SECURITIES AND IT IS NOT A SOLICITATION OF AN OFFER TO BUY THESE SECURITIES IN ANY JURISDICTION WHERE THE OFFER OR SALE IS NOT PERMITTED. |
| | 80 | |
| Retail – Super Regional Mall | Loan #5 | Cut-off Date Balance: | | $69,500,000 |
| 7 Backus Avenue | Danbury Fair Mall | Cut-off Date LTV: | | 41.8% |
| Danbury, CT 06810 | | U/W NCF DSCR: | | 2.52x |
| | | U/W NOI Debt Yield: | | 19.4% |

| THE INFORMATION IN THIS STRUCTURAL AND COLLATERAL TERM SHEET IS NOT COMPLETE AND MAY BE AMENDED PRIOR TO THE TIME OF SALE. THIS TERM SHEET IS NOT AN OFFER TO SELL THESE SECURITIES AND IT IS NOT A SOLICITATION OF AN OFFER TO BUY THESE SECURITIES IN ANY JURISDICTION WHERE THE OFFER OR SALE IS NOT PERMITTED. |
| | 81 | |
| Retail – Super Regional Mall | Loan #5 | Cut-off Date Balance: | | $69,500,000 |
| 7 Backus Avenue | Danbury Fair Mall | Cut-off Date LTV: | | 41.8% |
| Danbury, CT 06810 | | U/W NCF DSCR: | | 2.52x |
| | | U/W NOI Debt Yield: | | 19.4% |
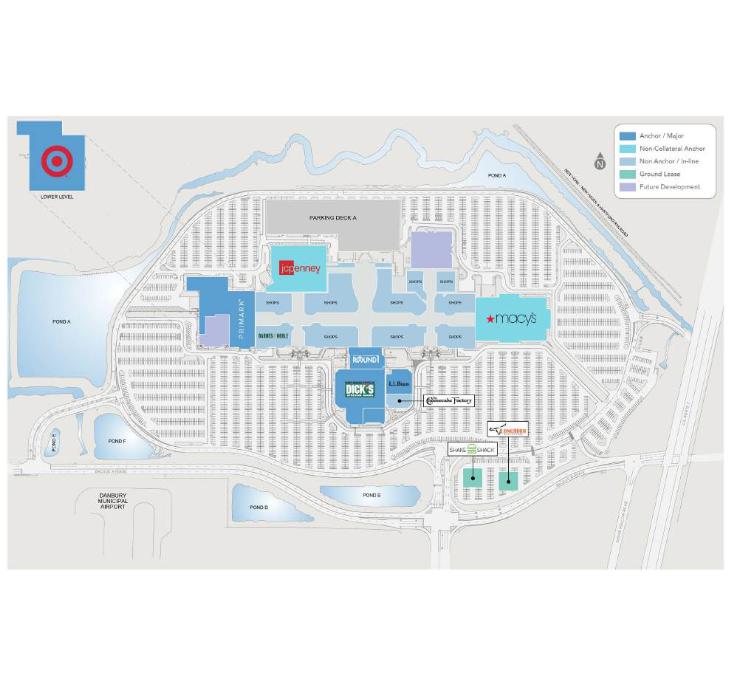
| THE INFORMATION IN THIS STRUCTURAL AND COLLATERAL TERM SHEET IS NOT COMPLETE AND MAY BE AMENDED PRIOR TO THE TIME OF SALE. THIS TERM SHEET IS NOT AN OFFER TO SELL THESE SECURITIES AND IT IS NOT A SOLICITATION OF AN OFFER TO BUY THESE SECURITIES IN ANY JURISDICTION WHERE THE OFFER OR SALE IS NOT PERMITTED. |
| | 82 | |
| Retail – Super Regional Mall | Loan #5 | Cut-off Date Balance: | | $69,500,000 |
| 7 Backus Avenue | Danbury Fair Mall | Cut-off Date LTV: | | 41.8% |
| Danbury, CT 06810 | | U/W NCF DSCR: | | 2.52x |
| | | U/W NOI Debt Yield: | | 19.4% |
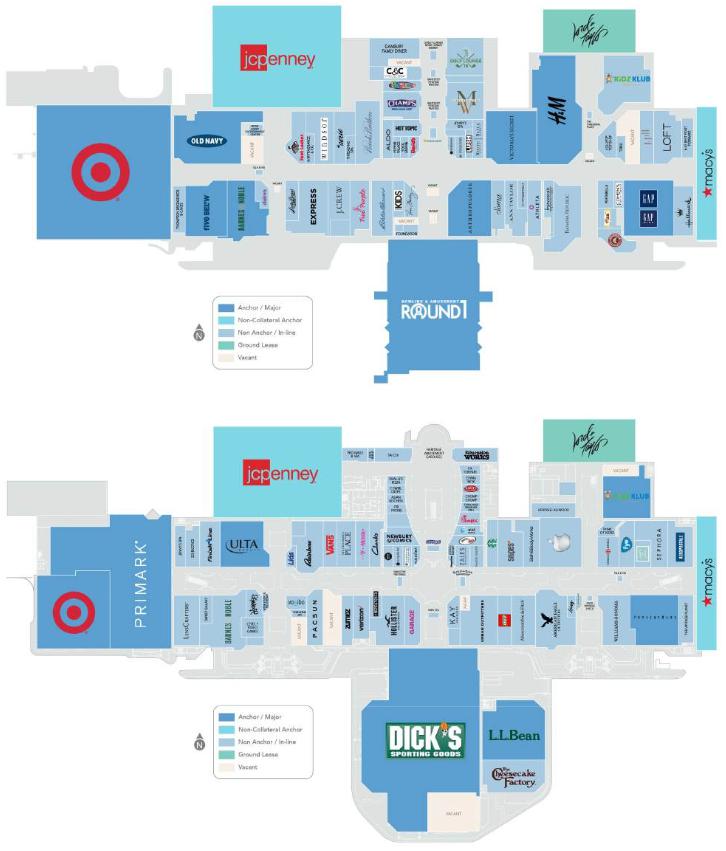
| THE INFORMATION IN THIS STRUCTURAL AND COLLATERAL TERM SHEET IS NOT COMPLETE AND MAY BE AMENDED PRIOR TO THE TIME OF SALE. THIS TERM SHEET IS NOT AN OFFER TO SELL THESE SECURITIES AND IT IS NOT A SOLICITATION OF AN OFFER TO BUY THESE SECURITIES IN ANY JURISDICTION WHERE THE OFFER OR SALE IS NOT PERMITTED. |
| | 83 | |
| Retail – Super Regional Mall | Loan #5 | Cut-off Date Balance: | | $69,500,000 |
| 7 Backus Avenue | Danbury Fair Mall | Cut-off Date LTV: | | 41.8% |
| Danbury, CT 06810 | | U/W NCF DSCR: | | 2.52x |
| | | U/W NOI Debt Yield: | | 19.4% |
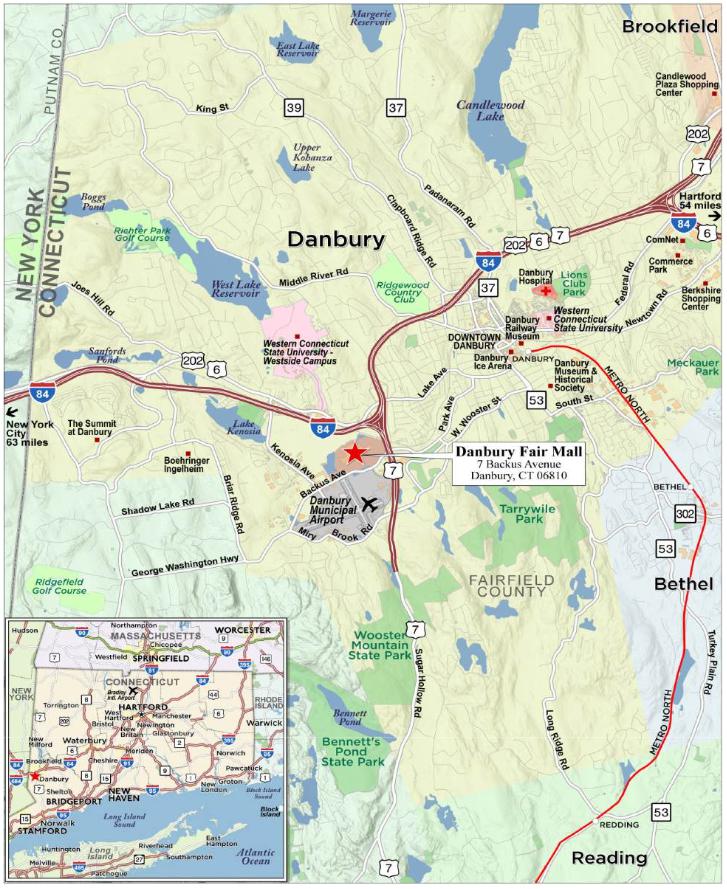
| THE INFORMATION IN THIS STRUCTURAL AND COLLATERAL TERM SHEET IS NOT COMPLETE AND MAY BE AMENDED PRIOR TO THE TIME OF SALE. THIS TERM SHEET IS NOT AN OFFER TO SELL THESE SECURITIES AND IT IS NOT A SOLICITATION OF AN OFFER TO BUY THESE SECURITIES IN ANY JURISDICTION WHERE THE OFFER OR SALE IS NOT PERMITTED. |
| | 84 | |
| No. 5 – Danbury Fair Mall |
| |
| Mortgage Loan Information | | Mortgaged Property Information |
| Mortgage Loan Sellers: | Goldman Sachs Mortgage Company and Morgan Stanley Mortgage Capital Holdings LLC | | Single Asset/Portfolio: | Single Asset |
Credit Assessment (Fitch/KBRA/Moody’s): | NR/NR/Aa2(sf) | | Property Type – Subtype: | Retail – Super Regional Mall |
| Original Principal Balance(1): | $69,500,000 | | Location: | Danbury, CT |
| Cut-off Date Balance(1): | $69,500,000 | | Size: | 923,598 SF |
| % of Initial Pool Balance: | 6.4% | | Cut-off Date Balance Per SF(1): | $168 |
| Loan Purpose: | Refinance | | Maturity Date Balance Per SF(1): | $164 |
| Borrower Sponsor: | The Macerich Partnership, L.P. | | Year Built/Renovated: | 1986 / 2007, 2017 |
| Guarantor: | The Macerich Partnership, L.P. | | Title Vesting: | Fee |
| Mortgage Rate: | 6.3860% | | Property Manager: | MACW Property Management, LLC (borrower-related) |
| Note Date: | January 25, 2024 | | Current Occupancy (As of)(6): | 97.1% (1/4/2024) |
| Seasoning: | 4 months | | 9/30/2023 Occupancy: | 99.3% |
| Maturity Date: | February 6, 2034 | | YE 2022 Occupancy: | 98.1% |
| IO Period: | 96 months | | YE 2021 Occupancy: | 90.1% |
| Loan Term (Original): | 120 months | | YE 2020 Occupancy: | 93.5% |
| Amortization Term (Original): | 360 | | As-Is Appraised Value: | $371,000,000 |
| Loan Amortization Type: | Interest Only, Amortizing Balloon | | As-Is Appraised Value Per SF: | $402 |
| Call Protection(2): | L(28),YM1(85),O(7) | | As-Is Appraisal Valuation Date: | December 18, 2023 |
| | | | | |
| Lockbox Type(3): | Hard/Springing Cash Management | | Underwriting and Financial Information |
| Additional Debt(1): | Yes | | TTM NOI (9/30/2023): | $30,411,426 |
| Additional Debt Type (Balance)(1): | Pari Passu ($85,500,000) | | YE 2022 NOI: | $26,390,480 |
| | | | YE 2021 NOI: | $22,240,718 |
| | | YE 2020 NOI: | $24,148,737 |
| Escrows and Reserves(4) | | U/W Revenues: | $43,953,322 |
| | Initial | Monthly | Cap | | U/W Expenses: | $13,946,497 |
| Taxes: | $0 | Springing | NAP | | U/W NOI: | $30,006,825 |
| Insurance: | $0 | Springing | NAP | | U/W NCF: | $29,271,323 |
| Replacement Reserve: | $0 | Springing | NAP | | U/W DSCR based on NOI/NCF(1): | 2.58x / 2.52x |
| TI/LC Reserve: | $0 | Springing | NAP | | U/W Debt Yield based on NOI/NCF(1): | 19.4% /18.9% |
| Other Reserve(5): | $4,103,258 | $0 | NAP | | U/W Debt Yield at Maturity based on NOI/NCF(1): | 19.8% /19.3% |
| | | | | | Cut-off Date LTV Ratio(1): | 41.8% |
| | | | | | LTV Ratio at Maturity(1): | 40.9% |
| | | | | | | | |
| Sources and Uses |
| Sources | | | | | Uses | | | |
| Whole Loan Amount(1) | $155,000,000 | | 100.0% | | Loan Payoff | $116,946,803 | | 75.4 | % |
| | | | | | Equity Distribution | 30,706,123 | | 19.8 | |
| | | | | | Reserves | 4,103,258 | | 2.6 | |
| | | | | | Closing Costs(7) | 3,243,816 | | 2.1 | |
| Total Sources | $155,000,000 | | 100.0% | | Total Uses | $155,000,000 | | 100.0 | % |
| (1) | The Danbury Fair Mall Mortgage Loan (as defined below) is part of the Danbury Fair Mall Whole Loan (as defined below), which is evidenced by six pari passu promissory notes with an aggregate principal balance of $155,000,000. The Mortgaged Property Information and Underwriting and Financial Information presented above is based on the aggregate principal balance of the promissory notes comprising the Danbury Fair Mall Whole Loan. |
| (2) | The Danbury Fair Mall Whole Loan may be voluntarily prepaid in whole (but not in part, other than in connection with the release of the L&T Parcel (as defined below) pursuant to the Danbury Fair Mall Whole Loan documents) at any time from and after the earlier to occur of (i) February 6, 2027 and (ii) the date that is two years from the closing date of the securitization that includes the last pari passu note of the Danbury Fair Mall Whole Loan to be securitized, with the payment of a yield maintenance premium if such prepayment is made prior to August 6, 2033. From and after August 6, 2033, the Danbury Fair Mall Whole Loan may be voluntarily prepaid in whole without the payment of a yield maintenance premium. The assumed lockout period of 28 payments is based on the expected BANK 2024-BNK47 securitization closing date in June 2024. The actual lockout period may be longer. |
| (3) | The borrowers are required to cause rents to be deposited into a lockbox account established at origination under the Danbury Fair Mall Whole Loan documents, and the borrowers will have access to the funds in the lockbox account and will be able to use the lockbox account as an operating account so long as no Trigger Period (as defined below) continues. During the continuance of a Trigger Period, the borrowers will not have any further access to the funds in the lockbox account except as otherwise expressly provided in the Danbury Fair Mall Whole Loan documents. |
| (4) | See “Escrows and Reserves” below for further discussion of reserve information. |
| (5) | Other Reserves include an outstanding TI/LC reserve of $3,460,293 and a gap and rent reserve of $642,965.09 which represents the sum of (i) the pro-rated rent for tenants with lease commencement dates after the note date, and (ii) the differential in current and contractual rent for tenants whose co-tenancy clauses will be cured by incoming leases with Target who opened and commenced paying rent on April 9, 2024 and Round 1 Entertainment who opened and commenced paying rent on March 8, 2024. |
| (6) | Occupancy includes all tenants in place, specialty leasing tenants of greater than six months, and tenants with signed leases as of the reporting period. Occupancy excludes gross leasable area for anchor tenants. |
| (7) | Closing Costs includes an interest rate buy-down fee of approximately $1,550,000. |
| THE INFORMATION IN THIS STRUCTURAL AND COLLATERAL TERM SHEET IS NOT COMPLETE AND MAY BE AMENDED PRIOR TO THE TIME OF SALE. THIS TERM SHEET IS NOT AN OFFER TO SELL THESE SECURITIES AND IT IS NOT A SOLICITATION OF AN OFFER TO BUY THESE SECURITIES IN ANY JURISDICTION WHERE THE OFFER OR SALE IS NOT PERMITTED. |
| | 85 | |
| Retail – Super Regional Mall | Loan #5 | Cut-off Date Balance: | | $69,500,000 |
| 7 Backus Avenue | Danbury Fair Mall | Cut-off Date LTV: | | 41.8% |
| Danbury, CT 06810 | | U/W NCF DSCR: | | 2.52x |
| | | U/W NOI Debt Yield: | | 19.4% |
The Mortgage Loan. The Danbury Fair Mall mortgage loan (the “Danbury Fair Mall Mortgage Loan”) is part of a whole loan (the “Danbury Fair Mall Whole Loan”) evidenced by six pari passu promissory notes issued by Danbury Mall, LLC and MS Danbury LLC in the aggregate original principal amount of $155,000,000. The Danbury Fair Mall Mortgage Loan is evidenced by the non-controlling notes A-3 and A-4, which have an aggregate outstanding principal balance as of the Cut-off Date of $69,500,000. The Danbury Fair Mall Mortgage Loan will be included in the BANK 2024-BNK47 securitization trust and represents approximately 6.4% of the initial pool balance. The Danbury Fair Mall Whole Loan was co-originated on January 25, 2024 by Goldman Sachs Bank USA (“GSBI”), Morgan Stanley Bank, N.A. (“MSBNA”) and Bank of Montreal (“BMO”). GSMC will be contributing the A-4 note and MSMCH will be contributing the A-3 note. The Danbury Fair Mall Whole Loan is secured by the borrowers’ fee simple interest in an approximately 1.27 million square foot enclosed super regional mall located in Danbury, Connecticut, of which 923,598 square feet serves as collateral (the “Danbury Fair Mall Property”) for the Danbury Fair Mall Whole Loan and does not include any portion of the regional mall that is occupied by Macy’s and JCPenney (which own their own parcels). The Danbury Fair Mall Whole Loan has a 10-year term, with an interest-only period accruing interest at a rate of 6.38600% per annum on an Actual/360 basis, followed by amortization on a 30-year basis.
The table below identifies the promissory notes that comprise the Danbury Fair Mall Whole Loan. The Danbury Fair Mall Whole Loan will be serviced pursuant to the pooling and servicing agreement for the BMO 2024-C8 trust securitization. The relationship between the holders of the Danbury Fair Mall Whole Loan is governed by a co-lender agreement as described under “Description of the Mortgage Pool—The Whole Loans—The Non-Serviced Pari Passu Whole Loans” and “The Pooling and Servicing Agreement—Servicing of the Non-Serviced Mortgage Loans” in the Preliminary Prospectus.
Whole Loan Note Summary
| Note | Original Balance | Cut-off Date Balance | Note Holder | Controlling Piece |
| A-1 | $46,750,000 | $46,750,000 | BMO 2024-C8 | Yes |
| A-2 | $21,250,000 | $21,250,000 | BMO 2024-C8 | No |
| A-3 | $31,000,000 | $31,000,000 | BANK 2024-BNK47 | No |
| A-4 | $38,500,000 | $38,500,000 | BANK 2024-BNK47 | No |
| A-5 | $9,250,000 | $9,250,000 | BBCMS 2024-C26 | No |
| A-6 | $8,250,000 | $8,250,000 | BBCMS 2024-C26 | No |
| Total | $155,000,000 | $155,000,000 | | |
The Borrowers and Borrower Sponsor. The borrowers are Danbury Mall, LLC and MS Danbury LLC, each a single purpose entity with two independent directors. Legal counsel to the borrowers delivered a non-consolidation opinion in connection with the origination of the Danbury Fair Mall Whole Loan. The borrower sponsor (the “Borrower Sponsor”) and non-recourse carveout guarantor is The Macerich Partnership, L.P., a Delaware limited partnership headquartered in Santa Monica, California and a provider of real estate investment services. The Macerich Partnership, L.P. acquires, leases, manages, develops, and redevelops malls and community centers.
The Property. The Danbury Fair Mall Property is part of a two-story, Class B+ super regional mall located in Danbury, Connecticut. The Danbury Fair Mall Property consists of 923,598 owned square feet within a super regional mall of 1,274,784 square feet, which is anchored by a 218,213 square foot Macy’s (non-collateral), a 132,973 square foot JCPenney (non-collateral), a 73,080 square foot DICK’S Sporting Goods and a 51,489 square foot Primark. The Borrower Sponsor recently executed leases with Round 1 Entertainment and Target to occupy anchor/major space at the Danbury Fair Mall Property beginning in March 2024 and April 2024, respectively. The Danbury Fair Mall Property is a shopping and dining destination located off the intersection of Interstate 84 and Route 7 in Danbury, Connecticut. The Danbury Fair Mall Property was originally constructed in 1986 and expanded in 1991 with the addition of the Lord & Taylor box (improvements owned by the tenant). The Danbury Fair Mall Property was acquired by the Borrower Sponsor in 2005. Following the Borrower Sponsor’s acquisition, the Danbury Fair Mall Property underwent a $24.8 million renovation in 2007. The Borrower Sponsor completed a second large scale renovation in 2011 following its acquisition of the former Filene’s parcel in 2010. The $38.0 million redevelopment included a reconfiguration of the 170,000 square feet Filene’s box into a DICK’S Sporting Goods on the main level, Forever 21 on the lower level, plus the addition of L.L. Bean, Cheesecake Factory and the former Brio Tuscan Grille. Today, the Danbury Fair Mall Property is leased to a mix of retailers and offers a multitude of dining options. The Danbury Fair Mall Property’s granular rent roll includes over 150 tenants with no non-anchor/major tenants accounting for more than 1.05% of collateral square feet and 2.78% of total underwritten rent. The Danbury Fair Mall Property is 97.1% leased as of January 4, 2024, which represents an improvement since the pandemic-driven occupancy trough of 90.1% in 2021. Comparable in-line tenant sales at the Danbury Fair Mall Property were $747 PSF in the third quarter of 2023, up 13.6% over pre-COVID 2019 sales of $658 PSF, equating to an occupancy cost of 11.7%. Comparable ex-Apple in-line sales over the same period were $564 PSF, up 11.0% over pre-COVID 2019 sales of $508 PSF, equating to an occupancy cost of 14.7%.
The Danbury Fair Mall Property contains a dark 79,872 square foot anchor box (the “L&T Parcel”) that is owned by Hudson Bay Company and subleased to Lord & Taylor. Lord & Taylor was operational before its parent company closed all locations. The tenant has kept current on its rent obligations. In August 2022, the Borrower Sponsor was able to secure a lease with National Resources who plans to invest over $25.0 million into the L&T Parcel to redevelop the existing two-level location into a multi family project featuring micro-housing and medical office uses. The borrowers have successfully rezoned the Danbury Fair Mall Property to allow for multifamily development and have obtained the necessary entitlements for this conversion from the City of Danbury. The borrowers expect the project to generate approximately $400,000 in incremental rent revenue annually over Lord & Taylor’s current lease, subject to recapturing the space from Lord & Taylor. The L&T Parcel can be released at any time with the prepayment of the Danbury Fair Mall Whole Loan in the amount equal to the greater of (x) $2,000,000 and (y) 45% of the proceeds of the sale of the L&T Parcel, subject to satisfaction of certain conditions set forth in the Danbury Fair Mall Whole Loan documents.
| THE INFORMATION IN THIS STRUCTURAL AND COLLATERAL TERM SHEET IS NOT COMPLETE AND MAY BE AMENDED PRIOR TO THE TIME OF SALE. THIS TERM SHEET IS NOT AN OFFER TO SELL THESE SECURITIES AND IT IS NOT A SOLICITATION OF AN OFFER TO BUY THESE SECURITIES IN ANY JURISDICTION WHERE THE OFFER OR SALE IS NOT PERMITTED. |
| | 86 | |
| Retail – Super Regional Mall | Loan #5 | Cut-off Date Balance: | | $69,500,000 |
| 7 Backus Avenue | Danbury Fair Mall | Cut-off Date LTV: | | 41.8% |
| Danbury, CT 06810 | | U/W NCF DSCR: | | 2.52x |
| | | U/W NOI Debt Yield: | | 19.4% |
Major Tenants.
Target (Fitch/Moody’s/S&P: A/A2/A; 126,615 square feet; 13.7% of net rentable area; 4.9% of underwritten base rent; 1/31/2034 lease expiration). Target is a general merchandise retailer located in all 50 states and the District of Columbia. There are currently 1,956 stores in the United States and Target generated 109 billion in total revenue in 2022. Target took occupancy at the property on April 9, 2024. The tenant has eight, five-year extension options remaining and no termination options.
DICK’S Sporting Goods (Fitch/Moody’s/S&P: NR/Baa3/BBB; 73,080 square feet; 7.9% of net rentable area; 6.6% of underwritten base rent; 1/31/2031 lease expiration). DICK’S Sporting Goods is a sports apparel and equipment retailer with 728 locations as of January 28, 2023 that was founded in 1948 in Binghamton, New York. DICK’S Sporting Goods has three, five-year renewal options and no termination options.
Round 1 Entertainment (Fitch/Moody’s/S&P: NR/NR/NR; 60,848 square feet; 6.6% of net rentable area; 4.5% of underwritten base rent; 2/28/2034 lease expiration). Round 1 Entertainment is a multi-entertainment facility that includes bowling, arcade games, karaoke, billiards, darts and ping pong, and operates under the Round 1 Entertainment Inc. parent entity, which was established in 2009 and currently has more than 50 locations that are open or plan to open across the United States as of February 2024. Round 1 Entertainment has two, five-year renewal options and no non-contingent termination options.
The following table presents a summary regarding the major tenants at the Danbury Fair Mall Property:
Major Tenants(1)
| Tenant Name | Credit Rating (Fitch/Moody’s/ S&P)(2) | Tenant NRSF | % of NRSF | Annual U/W Rent (3) | % of Total Annual U/W Rent | Annual U/W Rent PSF (3) | Lease Expiration Date | Ext Options | Term. Option (Y/N) |
| Major Tenants | | | | | | | | | |
| Target | A/A2/A | 126,615 | 13.7% | 1,350,417 | 4.9% | $10.67 | 1/31/2034 | 8 x 5 yrs | N |
| DICK'S Sporting Goods | NR/Baa3/BBB | 73,080 | 7.9% | 1,827,000 | 6.6% | $25.00 | 1/31/2031 | 3 x 5 yrs | N |
| Round 1 Entertainment | NR/NR/NR | 60,848 | 6.6% | 1,262,529 | 4.5% | $20.75 | 2/28/2034 | 2 x 5 yrs | N |
| Primark | NR/NR/NR | 51,489 | 5.6% | 1,120,676 | 4.0% | $21.77 | 8/31/2026 | 4 x 5 yrs | N |
| H&M | NR/BBB/NR | 21,563 | 2.3% | 565,757 | 2.0% | $26.24 | 1/31/2028 | 5 x 3 yrs | N |
| Kidz Klub | NR/NR/NR | 20,184 | 2.2% | 159,135 | 0.6% | $7.88 | 11/30/2025 | None | N |
| Barnes & Noble | NR/NR/NR | 19,092 | 2.1% | 534,576 | 1.9% | $28.00 | 1/31/2034 | 2 x 5 yrs | N |
| OLD NAVY | NR/B1/BB | 16,640 | 1.8% | 565,760 | 2.0% | $34.00 | 3/31/2027 | None | N |
| L.L. Bean | NR/NR/NR | 16,138 | 1.7% | 532,554 | 1.9% | $33.00 | 5/31/2027 | 1 x 5 yrs | N |
| GAP / GAP Kids | NR/B1/BB | 12,387 | 1.3% | 487,634 | 1.8% | $39.37 | 1/31/2028 | None | N |
| Total/Wtd. Avg. | | 418,036 | 45.2% | 8,406,038 | 30.2% | $20.11 | | | |
| | | | | | | | | | |
| Non-Major Tenants(4)(5) | | 479,076 | 51.9% | 19,348,916 | 69.7% | $40.39 | | | |
| | | | | | | | | | |
| Occupied Collateral Total | | 897,112 | 97.1% | 27,754,954 | 100.0% | $30.94 | | | |
| Vacant Space | | 26,486 | 2.9% | | | | | | |
| Total/Wtd. Avg. | | 923,598 | 100.0% | | | | | | |
| (1) | Based on the underwritten rent roll dated January 4, 2024. |
| (2) | Certain ratings are those of the parent company whether or not the parent guarantees the lease. |
| (3) | Annual U/W Rent and Annual U/W Rent PSF includes percentage in-lieu of rents totaling $653,695. |
| (4) | Non-Major Tenants includes various tenants with lease start dates after the Danbury Fair Mall Whole Loan origination date, that total 17,007 square feet and $721,949 of UW Base Rent. |
| (5) | Non-Major Tenants includes $359,999 of UW Base Rent from the L&T Parcel. |
| THE INFORMATION IN THIS STRUCTURAL AND COLLATERAL TERM SHEET IS NOT COMPLETE AND MAY BE AMENDED PRIOR TO THE TIME OF SALE. THIS TERM SHEET IS NOT AN OFFER TO SELL THESE SECURITIES AND IT IS NOT A SOLICITATION OF AN OFFER TO BUY THESE SECURITIES IN ANY JURISDICTION WHERE THE OFFER OR SALE IS NOT PERMITTED. |
| | 87 | |
| Retail – Super Regional Mall | Loan #5 | Cut-off Date Balance: | | $69,500,000 |
| 7 Backus Avenue | Danbury Fair Mall | Cut-off Date LTV: | | 41.8% |
| Danbury, CT 06810 | | U/W NCF DSCR: | | 2.52x |
| | | U/W NOI Debt Yield: | | 19.4% |
The following table presents certain information relating to the lease rollover schedule at the Danbury Fair Mall Property:
Lease Expiration Schedule(1)(2)
Year Ending
December 31 | No. of Leases Expiring | Expiring NRSF | % of Total NRSF | Cumulative Expiring NRSF | Cumulative % of Total NRSF | Annual
U/W Base Rent(3) | % of Total Annual U/W Base Rent(3) | Annual
U/W
Base Rent
PSF(3) |
| 2024 & MTM | 89 | 120,663 | | 13.1% | | 120,663 | | 13.1% | | $3,885,175 | 14.0% | $32.20 |
| 2025 | 26 | 92,003 | | 10.0% | | 212,666 | | 23.0% | | $4,068,700 | 14.7% | $44.22 |
| 2026 | 18 | 87,861 | | 9.5% | | 300,527 | | 32.5% | | $3,188,885 | 11.5% | $36.29 |
| 2027 | 25 | 85,272 | | 9.2% | | 385,799 | | 41.8% | | $4,517,226 | 16.3% | $52.97 |
| 2028 | 9 | 52,097 | | 5.6% | | 437,896 | | 47.4% | | $2,102,536 | 7.6% | $40.36 |
| 2029 | 8 | 22,480 | | 2.4% | | 460,376 | | 49.9% | | $1,310,678 | 4.7% | $58.30 |
| 2030 | 7 | 26,886 | | 2.9% | | 487,262 | | 52.8% | | $1,377,160 | 5.0% | $51.22 |
| 2031 | 4 | 82,944 | | 9.0% | | 570,206 | | 61.7% | | $2,251,483 | 8.1% | $27.14 |
| 2032 | 3 | 13,029 | | 1.4% | | 583,235 | | 63.2% | | $497,926 | 1.8% | $38.22 |
| 2033 | 5 | 23,268 | | 2.5% | | 606,503 | | 65.7% | | $708,784 | 2.6% | $30.46 |
| 2034 | 4 | 207,376 | | 22.5% | | 813,879 | | 88.1% | | $3,240,541 | 11.7% | $15.63 |
| 2035 & Beyond | 2 | 83,233 | | 9.0% | | 897,112 | | 97.1% | | $605,863 | 2.2% | $7.28 |
| Vacant | NAP | 26,486 | | 2.9% | | 923,598 | | 100.00% | | $0 | 0.0% | $0.00 |
| Total/Weighted Average | 200 | 923,598 | | 100.0% | | | | 27,754,954 | 100.0% | $30.94(4) |
| (1) | Information is based on the underwritten rent roll dated January 4, 2024. |
| (2) | Certain tenants may have lease termination options that are exercisable prior to the stated expiration date of the subject lease or leases which are not considered in the Lease Rollover Schedule. |
| (3) | Annual U/W Base Rent, % of Total Annual U/W Base Rent and Annual U/W Base Rent PSF includes percentage in-lieu of rents totaling $653,695. |
| (4) | Weighted Average Annual U/W Base Rent PSF excludes vacant space. |
The following table presents historical occupancy percentages at the Danbury Fair Mall Property:
Historical Occupancy(1)
12/31/2021 | 12/31/2022 | 9/30/2023 | Current(2)(3) |
| 90.1% | 98.1% | 99.3% | 97.1% |
| (1) | Historical Occupancies are as of December 31 of each respective year, unless otherwise specified. |
| (2) | Based on the underwritten rent roll dated January 4, 2024. |
| (3) | Occupancy includes all tenants in place, specialty leasing tenants of greater than six months, and tenants with signed leases as of the reporting period. Occupancy excludes gross leasable area for anchor tenants. |
| THE INFORMATION IN THIS STRUCTURAL AND COLLATERAL TERM SHEET IS NOT COMPLETE AND MAY BE AMENDED PRIOR TO THE TIME OF SALE. THIS TERM SHEET IS NOT AN OFFER TO SELL THESE SECURITIES AND IT IS NOT A SOLICITATION OF AN OFFER TO BUY THESE SECURITIES IN ANY JURISDICTION WHERE THE OFFER OR SALE IS NOT PERMITTED. |
| | 88 | |
| Retail – Super Regional Mall | Loan #5 | Cut-off Date Balance: | | $69,500,000 |
| 7 Backus Avenue | Danbury Fair Mall | Cut-off Date LTV: | | 41.8% |
| Danbury, CT 06810 | | U/W NCF DSCR: | | 2.52x |
| | | U/W NOI Debt Yield: | | 19.4% |
Operating History and Underwritten Net Cash Flow. The following table presents certain information relating to the historical operating performance and underwritten net cash flow at the Danbury Fair Mall Property:
Cash Flow Analysis
| | 2020 | 2021 | 2022 | TTM 9/30/2023 | U/W | % | U/W $ per SF(1) |
| Base Rent(2)(3) | $25,189,660 | $22,919,907 | $22,862,520 | $23,737,683 | $27,101,259 | 58.3% | $29.34 |
| Overage/Percentage Rent | 0 | 0 | 0 | 0 | 1,764,389 | 3.8 | 1.91 |
| Other Rental Revenue(4) | 2,505,763 | 4,662,477 | 5,242,739 | 5,354,726 | 5,111,552 | 11.0 | 5.53 |
| Reimbursement Revenue | 14,157,025 | 11,138,371 | 9,961,216 | 11,696,366 | 11,898,954 | 25.6 | 12.88 |
| Promotion Revenue | 0 | 0 | 0 | 0 | 79,821 | 0.2 | 0.09 |
| Other Revenue | 633,477 | 305,542 | 659,728 | 638,512 | 549,969 | 1.2 | 0.60 |
| Gross Potential Rent | $42,485,925 | $39,026,297 | $38,726,203 | $41,427,286 | $46,505,943 | 100.0% | $50.35 |
| Less Commercial Credit Loss | (3,590,947) | (865,112) | (54,641) | (61,365) | (2,552,621) | (5.5) | (2.76) |
| Effective Gross Income | $38,894,978 | $38,161,185 | $38,671,562 | $41,365,921 | $43,953,322 | 94.5% | $47.59 |
| | | | | | | | |
| Real Estate Taxes | 8,160,081 | 8,178,060 | 3,560,760 | 2,338,238 | 5,313,240 | 12.1 | 5.75 |
| Insurance | 290,848 | 342,559 | 377,870 | 397,892 | 500,460 | 1.1 | 0.54 |
| Other Expenses | 6,295,312 | 7,399,848 | 8,342,452 | 8,218,365 | 8,132,797 | 18.5 | 8.81 |
| Total Expenses | $14,746,241 | $15,920,467 | $12,281,082 | $10,954,495 | $13,946,497 | 31.7% | $15.10 |
| | | | | | | | |
| Net Operating Income | $24,148,737 | $22,240,718 | $26,390,480 | $30,411,426 | $30,006,825 | 68.3% | $32.49 |
| TI/LC | 0 | 0 | 0 | 0 | 568,561 | 1.3 | 0.62 |
| Capital Expenditures | 0 | 0 | 0 | 0 | 166,941 | 0.4 | 0.18 |
| Net Cash Flow | $24,148,737 | $22,240,718 | $26,390,480 | $30,411,426 | $29,271,323 | 66.6% | $31.69 |
| | | | | | | | |
| NOI DSCR(5) | 2.08x | 1.91x | 2.27x | 2.62x | 2.58x | | |
| NCF DSCR(5) | 2.08x | 1.91x | 2.27x | 2.62x | 2.52x | | |
| NOI Debt Yield(5) | 15.6% | 14.3% | 17.0% | 19.6% | 19.4% | | |
| NCF Debt Yield(5) | 15.6% | 14.3% | 17.0% | 19.6% | 18.9% | | |
| (1) | U/W $ Per SF is based on the total collateral square feet of 923,598. |
| (2) | Base Rent reflects annualized in-place base rent for in-place tenants and recently executed leases as of January 2024, with contractual rent steps through March 2025. Rental revenues have been adjusted to be exclusive of deferred straight-line minimum rent and termination income. |
| (3) | The difference between Underwritten Base Rent and previous historical Base Rent figures is primarily attributable to $2,612,946 of rent from both Target and Round 1 Entertainment, who took occupancy after the origination date. |
| (4) | Other Rental Revenue includes Overage / Percentage Rent, PIL Rent, Kiosks, Temporary, Specialty tenants and Business Development Income. |
| (5) | Debt service coverage ratios and debt yields are based on the Danbury Fair Mall Whole Loan. |
| THE INFORMATION IN THIS STRUCTURAL AND COLLATERAL TERM SHEET IS NOT COMPLETE AND MAY BE AMENDED PRIOR TO THE TIME OF SALE. THIS TERM SHEET IS NOT AN OFFER TO SELL THESE SECURITIES AND IT IS NOT A SOLICITATION OF AN OFFER TO BUY THESE SECURITIES IN ANY JURISDICTION WHERE THE OFFER OR SALE IS NOT PERMITTED. |
| | 89 | |
| Retail – Super Regional Mall | Loan #5 | Cut-off Date Balance: | | $69,500,000 |
| 7 Backus Avenue | Danbury Fair Mall | Cut-off Date LTV: | | 41.8% |
| Danbury, CT 06810 | | U/W NCF DSCR: | | 2.52x |
| | | U/W NOI Debt Yield: | | 19.4% |
Appraisal. According to the appraisal, the Danbury Fair Mall Property had an “as-is” appraised value of $371,000,000 as of December 18, 2023.
Environmental Matters. The Phase I environmental assessment of the Danbury Fair Mall Property dated December 21, 2023 identified no recognized environmental conditions, controlled environmental conditions or significant data gaps.
Market Overview and Competition. The Danbury Fair Mall Property is located within the Danbury area of the Bridgeport-Stamford-Norwalk MSA. The Danbury Fair Mall Property’s surrounding area is categorized as suburban consisting primarily of single-family homes and retail centers, and the Danbury Fair Mall Property is considered the largest demand generator within the City of Danbury. The Danbury Fair Mall Property benefits from proximity to Manhattan which is located approximately 60 miles away and access to the Westchester County Airport, situated approximately 35 miles from the mall. In 2022, the Bridgeport-Stamford-Norwalk MSA gross metropolitan product was $70.6 billion, a 3.3% increase from 2021. Within the immediate trade area comprised of the 1.0-mile region surrounding the Danbury Fair Mall Property, the 2023 average annual household income is approximately $132,337, relative to the 2023 statewide household income of approximately $129,040.
The following table presents retail market statistics for the surrounding area of the Danbury Fair Mall Property:
Retail Market Statistics (TTM Q4 2023)(1)
| Market/Submarket | Inventory (SF) | Completions (SF) | Vacancy | Net Absorption (SF) | NNN Rent Overall / SF |
| Stamford Retail | 53,184,660 | 171,383 | 4.00% | -245,986 | $32.75 |
| Danbury Retail | 6,955,057 | 45,000 | 4.00% | -106,171 | $22.32 |
| 1-Mile Radius Retail | 2,134,351 | 0 | 7.70% | -122,019 | $28.90 |
Escrows.
At origination, the borrowers were required to deposit into escrow (i) approximately $642,965 for a gap rent reserve (which represents the sum of (x) the pro-rated rent for tenants with lease commencement dates after the note date, and (y) the differential in current and contractual rent for tenants whose co-tenancy clauses will be cured by incoming leases with Target which opened and commenced paying rent on April 9, 2024 and Round 1 Entertainment which opened and commenced paying rent on March 8, 2024) and (ii) $3,460,293 for a TI/LC reserve (comprised of unpaid tenant allowances ($2,748,013), unpaid leasing commissions ($562,280) and landlord work ($150,000)).
Tax Escrows - During the continuance of a Trigger Period, the borrowers are required to deposit into escrow 1/12th of the annual estimated tax payments on a monthly basis.
Insurance Escrows – During the continuance of a Trigger Period, the borrowers are required to deposit into escrow 1/12th of the annual estimated insurance payments on a monthly basis, except if the Danbury Fair Mall Property is insured under a blanket policy meeting the requirements set forth in the Danbury Fair Mall Whole Loan documents (in which case, no insurance escrows will be required, notwithstanding the occurrence of a Trigger Period).
Capital Expenditure Reserve - During the continuance of a Trigger Period, the borrowers are required to deposit into escrow an amount equal to the gross leasable area (excluding the Non-Collateral Square Footage (as defined below) of any tenant that is required to pay for all repairs and maintenance costs for its entire leased premises, roof and structural components, and the following tenants: (i) Lord & Taylor, (ii) Shake Shack and (iii) Longhorn Steakhouse), multiplied by $0.25 and divided by 12 months. The monthly replacement reserve amount is estimated to be approximately $17,390. The borrowers are permitted to cease monthly deposits when the replacement reserve balance is equal to the sum of 24 monthly deposits, currently estimated to be $417,353. The tenants listed in clause (i) through (iii) above collectively represent 9.6% of the NRA and 2.6% of UW Base Rent.
Rollover Reserve – During the continuance of a Trigger Period, the borrowers are required to deposit into escrow an amount equal to the gross leasable area (excluding the Non-Collateral Square Footage and, to the extent not causing or contributing to the cause of the applicable Trigger Period, Lord & Taylor (and/or Live Uno), Target, Round 1 Entertainment, DICK’S Sporting Goods, Shake Shack and Longhorn Steakhouse) multiplied by $1.00 and divided by 12 months. The monthly rollover reserve amount is estimated to be approximately $47,847. The borrowers are not required to make any monthly deposits when the rollover reserve balance is equal to the sum of 24 monthly deposits, currently estimated to be $1,148,324. The borrowers’ upfront deposit of $642,965.09 with respect to gap rent is not included in the calculation of the rollover reserve balance for purposes of calculating the rollover reserve cap.
“Non-Collateral Square Footage” means the square footage occupied by Macy’s and JCPenney.
Lockbox and Cash Management.
The Danbury Fair Mall Whole Loan is structured with a hard lockbox and springing cash management. The borrowers and property manager are required to direct the tenants to pay rent directly into the lockbox account, and to deposit any rents otherwise received in such account within three business days after receipt. So long as no Trigger Period is continuing, borrowers will have access to the funds deposited into the lockbox account, and may utilize the lockbox account as its operating account. During the continuance of a
| THE INFORMATION IN THIS STRUCTURAL AND COLLATERAL TERM SHEET IS NOT COMPLETE AND MAY BE AMENDED PRIOR TO THE TIME OF SALE. THIS TERM SHEET IS NOT AN OFFER TO SELL THESE SECURITIES AND IT IS NOT A SOLICITATION OF AN OFFER TO BUY THESE SECURITIES IN ANY JURISDICTION WHERE THE OFFER OR SALE IS NOT PERMITTED. |
| | 90 | |
| Retail – Super Regional Mall | Loan #5 | Cut-off Date Balance: | | $69,500,000 |
| 7 Backus Avenue | Danbury Fair Mall | Cut-off Date LTV: | | 41.8% |
| Danbury, CT 06810 | | U/W NCF DSCR: | | 2.52x |
| | | U/W NOI Debt Yield: | | 19.4% |
Trigger Period, all funds in the lockbox account are required to be swept on a weekly basis and on the second business day before each payment date to a lender-controlled cash management account. Funds in the cash management account are required to be applied to debt service and the reserves and escrows described above, with any excess funds (i) to be deposited into the TI/LC Reserve, if the Trigger Period is caused by a tenant trigger event, or into an excess cash flow reserve account held by the lender as cash collateral for the Danbury Fair Mall Whole Loan, or (ii) if no Trigger Period is continuing, disbursed to the borrowers.
A “Trigger Period” means the period commencing upon the occurrence of (i) an event of default or (ii) a Low Debt Yield Period (as defined below). A Trigger Period will end (a) with respect to the matters described in clause (i) above, if the event of default has been waived by the lender and no other event of default is then continuing or (b) with respect to the matters described in clause (ii) above, if a cure of the Low Debt Yield Period occurs.
A “Low Debt Yield Period” will commence if, as of any calculation date, the Danbury Fair Mall Whole Loan debt yield is less than (x) 12.5% for the period commencing on the origination date to and excluding the eighth anniversary of the origination date, and end if the Danbury Fair Mall Whole Loan has achieved a debt yield of at least 12.5% for two consecutive calculation dates (45th day following the end of each calendar quarter during the term), and (y) 15.0% for the period commencing on the eighth anniversary of the origination date until the maturity date, and end if the Danbury Fair Mall Whole Loan has achieved a debt yield of at least 15.0% for two consecutive calculation dates.
Additional Secured Indebtedness (not including trade debts). The Danbury Fair Mall Property also secures the Danbury Fair Mall Non-Serviced Pari Passu Companion Loans, which have an aggregate Cut-off Date principal balance of $85,500,000. The Danbury Fair Mall Serviced Pari Passu Companion Loans accrue interest at the same rate as the Danbury Fair Mall Mortgage Loan. The Danbury Fair Mall Mortgage Loan is entitled to payments of principal and interest on a pro rata and pari passu basis with the Danbury Fair Mall Non-Serviced Pari Passu Companion Loans. The holders of the Danbury Fair Mall Mortgage Loan and the Danbury Fair Mall Non-Serviced Pari Passu Companion Loans have entered into a co-lender agreement which sets forth the allocation of collections on the Danbury Fair Mall Whole Loan. See “Description of the Mortgage Pool—The Whole Loans—The Non-Serviced Pari Passu Whole Loans” in the Preliminary Prospectus.
Partial Release. The borrowers may obtain the release of one or more non-income producing parcels without the payment of a release price (except with respect to the L&T Parcel), subject to satisfaction of certain conditions including, but not limited to, (i) no event of default has occurred and is continuing, (ii) regardless of whether such release is successfully consummated, the borrowers pay to the lender a processing fee in the amount of $15,000, (iii) the remaining property constitutes a separate tax lot (or the borrowers have filed an application for a separate tax lot and the Borrower Sponsor guarantees the payment of taxes on such release parcel pending the final issuance of such separate tax lot), (iv) the borrowers certify to the lender that the remaining property with all easements appurtenant and other permitted encumbrances thereto will not, strictly as a result of such transfer, be in violation of any reciprocal easement agreements or major leases, or any then applicable law, statute, rule or regulation and (v) satisfaction of any REMIC release conditions. The borrowers may obtain release of the L&T Parcel with the payment of a release price equal to the greater of $2,000,000 and 45% of the proceeds of the sale of the L&T Parcel (after deduction for reasonable and customary out-of-pocket costs of sale) and a yield maintenance premium if released prior to the open period.
Real Estate Substitution. Not permitted.
Property Management. The Danbury Fair Mall Property is managed by MACW Property Management, LLC, an affiliate of the Borrower Sponsor.
Subordinate and Mezzanine Indebtedness. None.
Ground Lease. None.
Rights of First Offer / Rights of First Refusal. None.
Letter of Credit. None.
Terrorism Insurance. The Danbury Fair Mall Whole Loan documents require that the “all risk” insurance policy required to be maintained by the borrower provides coverage for terrorism in an amount equal to the full replacement cost of the property, as well as business interruption insurance covering no less than the 24-month period following the occurrence of a casualty event, together with a 12-month extended period of indemnity (provided that if TRIPRA or a similar statute is not in effect, the borrower will not be obligated to pay terrorism insurance premiums in excess of two times the annual premium for the property and business interruption/rental loss insurance coverage). See “Risk Factors—Risks Relating to the Mortgage Loans—Terrorism Insurance May Not Be Available for All Mortgaged Properties” in the Preliminary Prospectus.
| THE INFORMATION IN THIS STRUCTURAL AND COLLATERAL TERM SHEET IS NOT COMPLETE AND MAY BE AMENDED PRIOR TO THE TIME OF SALE. THIS TERM SHEET IS NOT AN OFFER TO SELL THESE SECURITIES AND IT IS NOT A SOLICITATION OF AN OFFER TO BUY THESE SECURITIES IN ANY JURISDICTION WHERE THE OFFER OR SALE IS NOT PERMITTED. |
| | 91 | |
| Other – Data Center | Loan #6 | Cut-off Date Balance: | | $65,000,000 |
| 60 Hudson Street | 60 Hudson | Cut-off Date LTV: | | 17.5% |
| New York, NY 10013 | | U/W NCF DSCR: | | 3.92x |
| | | U/W NOI Debt Yield: | | 24.2% |
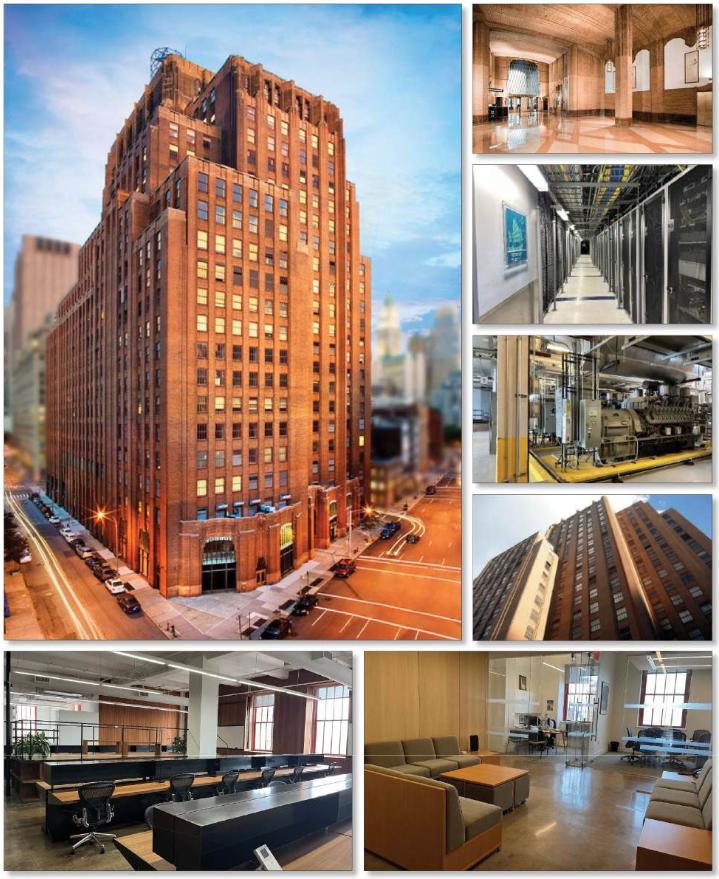
| THE INFORMATION IN THIS STRUCTURAL AND COLLATERAL TERM SHEET IS NOT COMPLETE AND MAY BE AMENDED PRIOR TO THE TIME OF SALE. THIS TERM SHEET IS NOT AN OFFER TO SELL THESE SECURITIES AND IT IS NOT A SOLICITATION OF AN OFFER TO BUY THESE SECURITIES IN ANY JURISDICTION WHERE THE OFFER OR SALE IS NOT PERMITTED. |
| | 92 | |
| Other – Data Center | Loan #6 | Cut-off Date Balance: | | $65,000,000 |
| 60 Hudson Street | 60 Hudson | Cut-off Date LTV: | | 17.5% |
| New York, NY 10013 | | U/W NCF DSCR: | | 3.92x |
| | | U/W NOI Debt Yield: | | 24.2% |
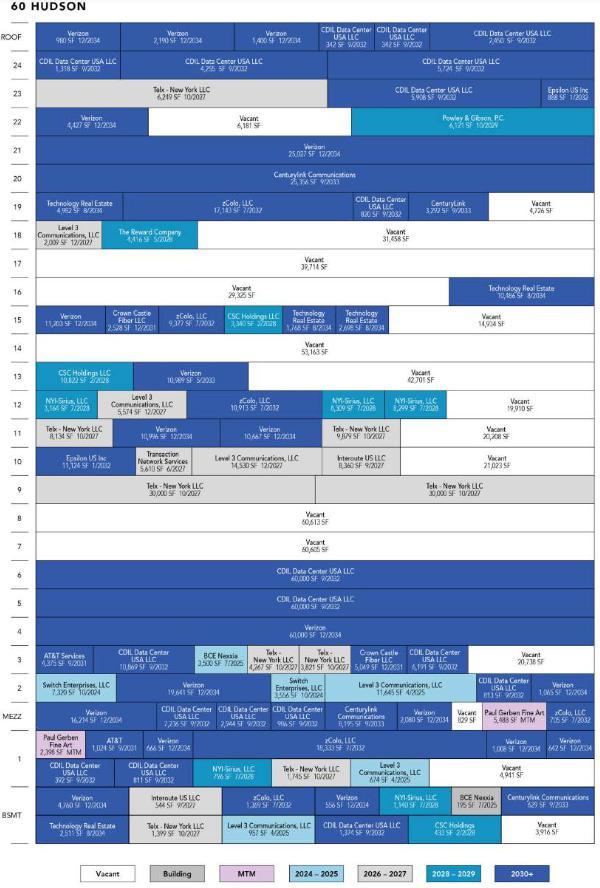
| THE INFORMATION IN THIS STRUCTURAL AND COLLATERAL TERM SHEET IS NOT COMPLETE AND MAY BE AMENDED PRIOR TO THE TIME OF SALE. THIS TERM SHEET IS NOT AN OFFER TO SELL THESE SECURITIES AND IT IS NOT A SOLICITATION OF AN OFFER TO BUY THESE SECURITIES IN ANY JURISDICTION WHERE THE OFFER OR SALE IS NOT PERMITTED. |
| | 93 | |
| Other – Data Center | Loan #6 | Cut-off Date Balance: | | $65,000,000 |
| 60 Hudson Street | 60 Hudson | Cut-off Date LTV: | | 17.5% |
| New York, NY 10013 | | U/W NCF DSCR: | | 3.92x |
| | | U/W NOI Debt Yield: | | 24.2% |

| THE INFORMATION IN THIS STRUCTURAL AND COLLATERAL TERM SHEET IS NOT COMPLETE AND MAY BE AMENDED PRIOR TO THE TIME OF SALE. THIS TERM SHEET IS NOT AN OFFER TO SELL THESE SECURITIES AND IT IS NOT A SOLICITATION OF AN OFFER TO BUY THESE SECURITIES IN ANY JURISDICTION WHERE THE OFFER OR SALE IS NOT PERMITTED. |
| | 94 | |
| |
| Mortgage Loan Information | | Mortgaged Property Information |
| Mortgage Loan Seller: | Morgan Stanley Mortgage Capital Holdings LLC | | Single Asset/Portfolio: | Single Asset |
Credit Assessment (Fitch/KBRA/Moody’s): | AAAsf/AAA(sf)/Aaa(sf) | | Property Type – Subtype: | Other – Data Center |
| Original Principal Balance(1): | $65,000,000 | | Location: | New York, NY |
| Cut-off Date Balance(1): | $65,000,000 | | Size: | 1,149,619 SF |
| % of Initial Pool Balance: | 6.0% | | Cut-off Date Balance Per SF(1): | $243.56 |
| Loan Purpose: | Refinance | | Maturity Date Balance Per SF(1): | $243.56 |
| Borrower Sponsor: | The Stahl Organization | | Year Built/Renovated: | 1930/2013 |
| Guarantors: | NAP(2) | | Title Vesting: | Fee |
| Mortgage Rate: | 5.8850% | | Property Manager: | Colliers Tri-State Management LLC (borrower-related) |
| Note Date: | September 6, 2023 | | Current Occupancy (As of)(5): | 62.2% (6/5/2023) |
| Seasoning: | 8 months | | YE 2022 Occupancy: | 63.2% |
| Maturity Date: | October 1, 2033 | | YE 2021 Occupancy: | 64.1% |
| IO Period: | 120 months | | YE 2020 Occupancy: | 72.6% |
| Loan Term (Original): | 120 months | | As-Is Appraised Value: | $1,596,000,000 |
| Amortization Term (Original): | NAP | | As-Is Appraised Value Per SF: | $1,388.29 |
| Loan Amortization Type: | Interest Only | | As-Is Appraisal Valuation Date: | May 8, 2023 |
| Call Protection: | L(32),D(83),O(5) | | | |
| Lockbox Type: | Hard/In Place Cash Management | | | |
| Additional Debt(1)(3): | Yes | | Underwriting and Financial Information |
| Additional Debt Type (Balance)(1)(3): | Pari Passu ($215,000,000) | | TTM 6/30/2023 NOI: | $73,525,984 |
| | | | YE 2022 NOI: | $65,561,820 |
| | | | YE 2021 NOI: | $77,460,400 |
| | | | YE 2020 NOI: | $67,543,911 |
| | | | U/W Revenues: | $120,518,204 |
| | | | U/W Expenses: | $52,684,531 |
| Escrows and Reserves(4) | | U/W NOI: | $67,833,673 |
| | Initial | Monthly | Cap | | U/W NCF: | $65,493,494 |
| Taxes: | $7,089,987 | $1,772,497 | NAP | | U/W DSCR based on NOI/NCF(1): | 4.06x / 3.92x |
| Insurance: | $0 | Springing | NAP | | U/W Debt Yield based on NOI/NCF(1): | 24.2% / 23.4% |
| Replacement Reserve: | $0 | Springing | NAP | | U/W Debt Yield at Maturity based on NOI/NCF(1): | 24.2% / 23.4% |
| TI/LC Reserve: | $0 | Springing | NAP | | Cut-off Date LTV Ratio(1): | 17.5% |
| | | | | | LTV Ratio at Maturity(1): | 17.5% |
| | | | | | | | |
| Sources and Uses |
| Sources | | | | | Uses | | | |
| Whole Loan Amount | $280,000,000 | | 98.7% | | Loan Payoff | $274,771,150 | | 96.9 | % |
| Borrower Equity | 3,678,608 | | 1.3 | | Reserves | 7,089,987 | | 2.5 | |
| | | | | | Closing Costs | 1,817,471 | | 0.6 | |
| Total Sources | $283,678,608 | | 100.0% | | Total Uses | $283,678,608 | | 100.0 | % |
| (1) | The 60 Hudson Mortgage Loan (as defined below) is part of the 60 Hudson Whole Loan (as defined below), which is comprised of 11 pari passu promissory notes with an aggregate original principal balance of $280,000,000. The Cut-off Date Balance Per SF, Maturity Date Balance Per SF, U/W DSCR based on NOI/NCF, U/W Debt Yield based on NOI/NCF, U/W Debt Yield at Maturity based on NOI/NCF, Cut-off Date LTV Ratio and LTV Ratio at Maturity presented above are based on the aggregate Cut-off Date principal balance of the 60 Hudson Whole Loan. |
| (2) | There is no non-recourse carveout guarantor or separate environmental indemnitor with respect to the 60 Hudson Whole Loan. |
| (3) | See “The Mortgage Loan” below for further information about additional mortgage debt. |
| (5) | Occupancy as of the May 28, 2024 rent roll was 62.3%. |
The Mortgage Loan. The sixth largest mortgage loan (the “60 Hudson Mortgage Loan”) is part of a whole loan (the “60 Hudson Whole Loan”) evidenced by 11 pari passu promissory notes with an aggregate original principal balance of $280,000,000. The 60 Hudson Whole Loan is secured by a first priority fee mortgage encumbering a 1,149,619 SF data center property in New York, New York (the “60 Hudson Property”). The 60 Hudson Mortgage Loan is evidenced by the non-controlling Note A-2 and the non-controlling Note A-7-1 with an aggregate original principal balance of $65,000,000. The 60 Hudson Whole Loan was originated by Morgan Stanley Bank, N.A. (“MSBNA”). The 60 Hudson Whole Loan will be serviced pursuant to the pooling and servicing agreement for the MSWF 2023-2 transaction. See “Description of the Mortgage Pool—The Whole Loans—The Serviced Pari Passu Whole Loans” and “Pooling and Servicing Agreement” in the Preliminary Prospectus.
| THE INFORMATION IN THIS STRUCTURAL AND COLLATERAL TERM SHEET IS NOT COMPLETE AND MAY BE AMENDED PRIOR TO THE TIME OF SALE. THIS TERM SHEET IS NOT AN OFFER TO SELL THESE SECURITIES AND IT IS NOT A SOLICITATION OF AN OFFER TO BUY THESE SECURITIES IN ANY JURISDICTION WHERE THE OFFER OR SALE IS NOT PERMITTED. |
| | 95 | |
| Other – Data Center | Loan #6 | Cut-off Date Balance: | | $65,000,000 |
| 60 Hudson Street | 60 Hudson | Cut-off Date LTV: | | 17.5% |
| New York, NY 10013 | | U/W NCF DSCR: | | 3.92x |
| | | U/W NOI Debt Yield: | | 24.2% |
Whole Loan Note Summary
| Notes | Original Balance | Cut-off Date Balance | Note Holder | Controlling Piece |
| A-1 | $60,000,000 | $60,000,000 | MSWF 2023-2 | Yes |
| A-2 | $50,000,000 | $50,000,000 | BANK 2024-BNK47 | No |
| A-3 | $40,000,000 | $40,000,000 | BMO 2024-C8 | No |
| A-4 | $30,000,000 | $30,000,000 | MSWF 2023-2 | No |
| A-5 | $30,000,000 | $30,000,000 | BBCMS 2023-C22 | No |
| A-6 | $20,000,000 | $20,000,000 | BMO 2024-C8 | No |
| A-7-1 | $15,000,000 | $15,000,000 | BANK 2024-BNK47 | No |
| A-7-2 | $5,000,000 | $5,000,000 | BMO 2024-C8 | No |
| A-8 | $10,000,000 | $10,000,000 | BBCMS 2023-C22 | No |
| A-9 | $10,000,000 | $10,000,000 | BMO 2023-C7 | No |
| A-10 | $10,000,000 | $10,000,000 | BMO 2023-C7 | No |
| Total (Whole Loan) | $280,000,000 | $280,000,000 | | |
The Borrower and the Borrower Sponsor. The borrower for the 60 Hudson Whole Loan is 60 Hudson Owner LLC, a single-purpose Delaware limited liability company with two independent directors in its organizational structure. The borrower sponsor is The Stahl Organization. The Stahl Organization is a privately held, New York based real estate company founded by Stanley Stahl in 1949. The Stahl Organization’s current real estate portfolio comprises over 5 million SF of office space, including 277 Park Avenue and 122 East 42nd Street, and ten retail/commercial properties in Manhattan. The Stahl Organization is also a significant residential landlord with over 3,500 apartments in various residential assets located throughout New York City. There is no non-recourse carveout guarantor or separate environmental indemnitor with respect to the 60 Hudson Whole Loan.
In addition to its real estate portfolio, The Stahl Organization owns 100% of Apple Bank for Savings, which has 84 branches. The Stahl Organization also owns Cauldwell Wingate Company, a construction company based in New York City and founded in 1910.
The Stahl Organization’s executives have been associated with the company for many years as employees and third-party professional consultants. Richard F. Czaja, the Co-President and General Counsel, has been with The Stahl Organization for over 35 years and has represented the company in legal matters during the prior eight years. Gregg S. Wolpert, Co-President, has been with the company for over 33 years and managed several of The Stahl Organization’s real estate investments during the prior eight years. Marianne Dziuba, Executive Vice President, has been with the organization for over 40 years. Robert Getreu, a key principal, is an Executive Vice President of Colliers Tri-State Management LLC (the “Property Manager”), and handled the redevelopment and expansion of the 60 Hudson Property in 2013. Robert Getreu has been with the Property Manager for over 31 years. Richard F. Czaja and Robert Getreu are the non-member managers of two entities which own an approximately 67.5% indirect equity interest in the borrower. Richard F. Czaja and Gregg S. Wolpert are trustees of a trust which is the general partner of a third entity which owns the remaining 32.5% indirect equity interest in the borrower.
The Property. The 60 Hudson Property is a 24-story, plus basement, 1,149,619 SF data center/carrier hotel building situated on an approximately 1.2-acre site located in New York, New York. The building spans an entire block between Hudson Street, West Broadway, Worth Street and Thomas Street. The 60 Hudson Property is one of the primary telecom and internet centers in New York City. Built in 1930 for the Western Union telegraph company, the building was initially known as the "Telegraph Capital of America”. After Western Union departed in 1973, the 60 Hudson Property was converted into a colocation center. Hundreds of telecommunication companies interconnect their respective internet networks, where telecommunications companies route internet traffic and exchange information in a “meet-me room” located at the 60 Hudson Property through fiber-optic lines. The 60 Hudson Property is widely considered a primary telecommunications hub of the Northeast region of the United States. The building provides an interconnection via under-sea cable to the United Kingdom, and to the cables from Manasquan, New Jersey, and Truckerton, New York, to the European Union.
The borrower sponsor most recently renovated the 60 Hudson Property in 2013. As of June 5, 2023, the 60 Hudson Property was 62.2% leased and anchored by major telecommunications and data center tenants, including Verizon, Hudson Interxchange, Telx New York LLC (Digital Realty Trust), and zColo. Approximately 9.5% of net rentable area consists of traditional office space. The 60 Hudson Property building was designated as a historical landmark in 1992 by the New York City Landmarks Preservation Commission.
| THE INFORMATION IN THIS STRUCTURAL AND COLLATERAL TERM SHEET IS NOT COMPLETE AND MAY BE AMENDED PRIOR TO THE TIME OF SALE. THIS TERM SHEET IS NOT AN OFFER TO SELL THESE SECURITIES AND IT IS NOT A SOLICITATION OF AN OFFER TO BUY THESE SECURITIES IN ANY JURISDICTION WHERE THE OFFER OR SALE IS NOT PERMITTED. |
| | 96 | |
| Other – Data Center | Loan #6 | Cut-off Date Balance: | | $65,000,000 |
| 60 Hudson Street | 60 Hudson | Cut-off Date LTV: | | 17.5% |
| New York, NY 10013 | | U/W NCF DSCR: | | 3.92x |
| | | U/W NOI Debt Yield: | | 24.2% |
Major Tenants.
Verizon (184,420 square feet, 16.0% of net rentable area, 28.3% of underwritten rent). Verizon (NYSE: VZ) is a leading provider of technology and communications services. Headquartered in New York City, and formed on June 30, 2000, the company offers voice, data and video services and solutions on its networks and platforms. Verizon has nearly 1,500 retail locations throughout over 150 countries and reported 2022 revenues of $136.8 billion. Verizon operates at the 60 Hudson Property under four separate affiliated entities; MCI Communication Services (157,952 SF), Metropolitan Fiber Systems of NY (14,904 SF), XO Communications Services (10,898 SF) and Verizon New York Inc. (666 SF). Verizon and its affiliated tenants have been tenants at the 60 Hudson Property since July 1984, December 1986, September 1990, and December 1997, respectively. With the exception of the XO Communications Services lease (10,898 SF), Verizon and its affiliated leases recently executed extension notices for their leases, which will extend for 10 years through December 2034, with one, 10-year renewal option remaining. The XO Communications Services lease has an expiration date of May 31, 2033, with no renewal options remaining.
CDIL Data Centre USA LLC (“Hudson Interxchange”) (172,775 square feet, 15.0% of net rentable area, 22.1% of underwritten rent). Hudson Interxchange (previously known as Datagryd) is a wholesale data center provider meeting the demands of high-power cloud computing and data storage clients by offering colocation space and power and cooling infrastructure for data network, telecommunications, cloud and large enterprises. Datagryd was acquired by Cordiant Digital Infrastructure in 2022 for $74.0 million and was rebranded to Hudson Interxchange. Hudson Interxchange has occupied the 60 Hudson Property since September, 2011, has a lease expiration date of September 30, 2032 and has three, 5-year renewal options remaining.
Telx – New York LLC (Digital Realty) (“Telx”) (95,494 square feet, 8.3% of net rentable area, 12.9% of underwritten rent). Telx is a provider of data center colocation, interconnection, and cloud enablement solutions. Telx was acquired by Digital Realty Trust, Inc. in 2015 for $1.9 billion. Digital Realty Trust, Inc. operates as a real estate investment trust and is a large global provider of cloud- and carrier-neutral data center, colocation, and interconnection solutions. As of December 31, 2022, Digital Realty Trust Inc.’s portfolio consisted of 316 specialty industrial properties located in North America, Europe, South America, Africa, Australia and Asia. Telx has been a tenant at the 60 Hudson Property since June 1997, has a lease expiration date of October 31, 2027 and has one, 5-year renewal option remaining.
zColo, LLC (DataBank) (57,840 square feet, 5.0% of net rentable area, 10.6% of underwritten rent). Databank acquired the data center assets of Zayo Group (zColo LLC) in December 2020 for approximately $1.4 billion, expanding Databank’s footprint to over 65 data centers in over 29 markets and creating one of the largest privately held data center operators in North America. ZColo’s data centers are located in markets across the United States, and included major carrier interconnects in markets such as New York, Los Angeles, Seattle, Denver, Chicago, Minneapolis, Boston, Philadelphia, and Miami. zColo, LLC (DataBank) has been a tenant at the 60 Hudson Property since April 1995, has a lease expiration date of July 31, 2032 and has one, 10-year renewal option remaining.
| THE INFORMATION IN THIS STRUCTURAL AND COLLATERAL TERM SHEET IS NOT COMPLETE AND MAY BE AMENDED PRIOR TO THE TIME OF SALE. THIS TERM SHEET IS NOT AN OFFER TO SELL THESE SECURITIES AND IT IS NOT A SOLICITATION OF AN OFFER TO BUY THESE SECURITIES IN ANY JURISDICTION WHERE THE OFFER OR SALE IS NOT PERMITTED. |
| | 97 | |
| Other – Data Center | Loan #6 | Cut-off Date Balance: | | $65,000,000 |
| 60 Hudson Street | 60 Hudson | Cut-off Date LTV: | | 17.5% |
| New York, NY 10013 | | U/W NCF DSCR: | | 3.92x |
| | | U/W NOI Debt Yield: | | 24.2% |
The following table presents certain information relating to the major tenants at the 60 Hudson Property:
Major Tenants(1)
| Tenant Name | Credit Rating (Fitch/ Moody’s/ S&P)(2) | Tenant NRSF | % of
NRSF | Annual U/W Base Rent PSF | Annual
U/W Base Rent | % of Total Annual U/W Base Rent | Lease
Expiration
Date | Extension Options | Term. Option (Y/N) |
| Major Tenants | | | | | | | | |
| Verizon(3) | A-/Baa1/BBB+ | 184,420 | 16.0% | $125.96 | $23,229,241 | 28.3% | Various(3) | Various(3) | N |
| Hudson Interxchange | NR/NR/NR | 172,775 | 15.0% | $104.95 | $18,132,737 | 22.1% | 9/30/2032 | 3x5 yr | N |
| Telx | BBB/Baa2/BBB | 95,494 | 8.3% | $111.26 | $10,624,472 | 12.9% | 10/31/2027 | 1x5 yr | N |
| zColo, LLC (DataBank) | NR/NR/NR | 57,840 | 5.0% | $150.18 | $8,686,211 | 10.6% | 7/31/2032 | 1x10 yr | N |
| Level 3 Communications, LLC | NR/NR/NR | 35,389 | 3.1% | $119.59 | $4,232,080 | 5.2% | Various(4) | 1x10 yr | Y(5) |
| Centurylink Communications | BB-/Caa2/CCC+ | 37,472 | 3.3% | $101.29 | $3,795,715 | 4.6% | 9/30/2033 | 1x10 yr | N |
| NYI-Sirius, LLC | NR/NR/NR | 21,708 | 1.9% | $115.42 | $2,505,625 | 3.0% | 7/31/2028 | 1x10 yr | Y(6) |
| Total Major Tenants | 605,098 | 52.6% | $117.68 | $71,206,081 | 86.7% | | | |
| | | | | | | | | |
| Non-Major Tenants | 109,536 | 9.5% | $99.99 | $10,952,927 | 13.3% | | | |
| | | | | | | | | |
| Occupied Collateral Total | 714,634 | 62.2% | $114.97 | $82,159,008 | 100.0% | | | |
| | | | | | | | | |
| Vacant Space(7) | 434,985 | 37.8% | | | | | | |
| | | | | | | | | |
| Collateral Total | 1,149,619 | 100.0% | | | | | | |
| | | | | | | | | | |
| | | | | | | | | | | |
| (1) | Information is based on the underwritten rent roll as of June 5, 2023. |
| (2) | Certain ratings are those of the parent company whether or not the parent company guarantees the lease. |
| (3) | Includes Verizon affiliated leases under MCI Communication Services (157,952 SF), Metropolitan Fiber Systems of NY (14,904 SF), XO Communications Services (10,898 SF) and Verizon New York Inc. (666 SF). With the exception of the XO Communications Services lease, Verizon and its affiliated leases recently executed extension notices for their leases, which extends the leases through December 31, 2034. The XO Communications Services lease has a lease expiration date of May 31, 2033. With the exception of the Verizon New York Inc. and XO Communications Services leases, Verizon’s affiliated leases have one, 10-year renewal option remaining. |
| (4) | Level 3 Communications, LLC has 22,113 SF with an expiration date of December 31, 2027 and 13,276 SF with an expiration date of April 30, 2025. |
| (5) | Level 3 Communications, LLC has the right to terminate its lease with respect to the 12th floor premises (5,574 SF) on December 31, 2024 upon delivery of written notice to the landlord no less than 12 months, and no more than fifteen months prior. |
| (6) | NYI-Sirius, LLC has the option to terminate its lease with respect to the Suite 1213 premises (8,309 SF) upon twelve months prior notice to the landlord, together with a payment of $100,000. |
| (7) | Vacant Space includes one in-place tenant, Stadium Goods (13,828 SF) which was underwritten as vacant due to its lease expiring in October 2023. |
The following table presents certain information relating to the lease rollover schedule at the 60 Hudson Property:
Lease Expiration Schedule(1)(2)
Year Ending
December 31 | No. of Leases Expiring | Expiring NRSF | % of Total NRSF | Cumulative Expiring NRSF | Cumulative % of Total NRSF | Annual
U/W
Base Rent | % of Total Annual U/W Base Rent | Annual
U/W
Base Rent
PSF |
| MTM | 2 | 7,886 | 0.7% | 7,886 | 0.7% | $0 | 0.0% | $0.00 |
| 2024 | 2 | 10,876 | 0.9% | 18,762 | 1.6% | $1,090,229 | 1.3% | $100.24 |
| 2025 | 2 | 16,971 | 1.5% | 35,733 | 3.1% | $1,938,982 | 2.4% | $114.25 |
| 2026 | 0 | 0 | 0.0% | 35,733 | 3.1% | $0 | 0.0% | $0.00 |
| 2027 | 12 | 132,121 | 11.5% | 167,854 | 14.6% | $14,937,189 | 18.2% | $113.06 |
| 2028 | 5 | 40,719 | 3.5% | 208,573 | 18.1% | $4,776,223 | 5.8% | $117.30 |
| 2029 | 1 | 6,121 | 0.5% | 214,694 | 18.7% | $529,996 | 0.6% | $86.59 |
| 2030 | 0 | 0 | 0.0% | 214,694 | 18.7% | $0 | 0.0% | $0.00 |
| 2031 | 3 | 12,976 | 1.1% | 227,670 | 19.8% | $1,581,019 | 1.9% | $121.84 |
| 2032 | 19 | 242,627 | 21.1% | 470,297 | 40.9% | $28,097,299 | 34.2% | $115.80 |
| 2033 | 2 | 48,370 | 4.2% | 518,667 | 45.1% | $5,014,225 | 6.1% | $103.66 |
| Thereafter | 7 | 195,967 | 17.0% | 714,634 | 62.2% | $24,193,846 | 29.4% | $123.46 |
| Vacant(3) | 0 | 434,985 | 37.8% | 1,149,619 | 100.0% | $0 | 0.0% | $0.00 |
| Total/Wtd. Avg. | 55 | 1,149,619 | 100.0% | | | $82,159,008 | 100.0% | $114.97(4) |
| (1) | Information is based on the underwritten rent roll as of June 5, 2023. |
| (2) | Certain tenants may have lease termination options that are exercisable prior to the stated expiration date of the subject lease or leases which are not considered in the lease rollover schedule. |
| (3) | Vacant includes one in place tenant, Stadium Goods (13,828 square feet) which was underwritten as vacant due to its lease expiring in October 2023. |
| (4) | Total/Wtd. Avg. Annual U/W Base Rent PSF excludes vacant space. |
| THE INFORMATION IN THIS STRUCTURAL AND COLLATERAL TERM SHEET IS NOT COMPLETE AND MAY BE AMENDED PRIOR TO THE TIME OF SALE. THIS TERM SHEET IS NOT AN OFFER TO SELL THESE SECURITIES AND IT IS NOT A SOLICITATION OF AN OFFER TO BUY THESE SECURITIES IN ANY JURISDICTION WHERE THE OFFER OR SALE IS NOT PERMITTED. |
| | 98 | |
| Other – Data Center | Loan #6 | Cut-off Date Balance: | | $65,000,000 |
| 60 Hudson Street | 60 Hudson | Cut-off Date LTV: | | 17.5% |
| New York, NY 10013 | | U/W NCF DSCR: | | 3.92x |
| | | U/W NOI Debt Yield: | | 24.2% |
The following table presents historical occupancy percentages at the 60 Hudson Property:
Historical Occupancy
2020(1) | 2021(1) | 2022(1) | 6/5/2023(2) |
| 72.6% | 64.1% | 63.2% | 62.2% |
| (1) | Information was provided by the borrower. |
| (2) | Information based on the underwritten rent roll. Occupancy as of the May 28, 2024 rent roll was 62.3%. |
Underwritten Net Cash Flow. The following table presents certain information relating to the historic operating results and underwritten net cash flow at the 60 Hudson Property:
Cash Flow Analysis
| | 2020 | 2021 | 2022 | 6/30/2023 TTM | U/W | %(1) | U/W $ per SF |
| Gross Potential Rent | $80,020,378 | $81,473,151 | $79,777,070 | $80,757,027 | $126,042,403(2) | 76.7% | $109.64 |
| Recoveries | 8,899,659 | 7,503,651 | 6,767,304 | 7,800,073 | 6,459,196 | 3.9 | 5.62 |
| Other Income(3) | 22,431,718 | 29,768,129 | 26,396,142 | 35,751,074 | 31,900,000 | 19.4 | 27.75 |
| Net Rental Income | $111,351,756 | $118,744,930 | $112,940,517 | $124,308,174 | $164,401,599 | 100.0% | $143.01 |
| Less Vacancy & Credit Loss | 0 | 0 | 0 | 0 | (43,883,395) | (34.8) | (38.17) |
| Effective Gross Income | $111,351,756 | $118,744,930 | $112,940,517 | $124,308,174 | $120,518,204 | 73.3% | $104.83 |
| | | | | | | | |
| Real Estate Taxes | $20,888,707 | $16,556,736 | $20,495,261 | $20,777,690 | $21,269,961 | 17.6% | $18.50 |
| Insurance | 707,269 | 703,478 | 681,814 | 758,606 | 745,821 | 0.6 | 0.65 |
| Other Operating Expenses | 22,211,869 | 24,024,316 | 26,201,622 | 29,245,894 | 30,668,749 | 25.4 | 26.68 |
| Total Operating Expenses | $43,807,845 | $41,284,530 | $47,378,697 | $50,782,190 | $52,684,531 | 43.7% | $45.83 |
| | | | | | | | |
| Net Operating Income | $67,543,911 | $77,460,400 | $65,561,820 | $73,525,984 | $67,833,673 | 56.3% | $59.01 |
| Replacement Reserves | 0 | 0 | 0 | 0 | 229,924 | 0.2 | 0.20 |
| TI/LC | 0 | 0 | 0 | 0 | 2,110,256 | 1.8 | 1.84 |
| Net Cash Flow | $67,543,911 | $77,460,400 | $65,561,820 | $73,525,984 | $65,493,494 | 54.3% | $56.97 |
| | | | | | | | |
| NOI DSCR(4) | 4.04x | 4.64x | 3.92x | 4.40x | 4.06x | | |
| NCF DSCR(4) | 4.04x | 4.64x | 3.92x | 4.40x | 3.92x | | |
| NOI Debt Yield(4) | 24.1% | 27.7% | 23.4% | 26.3% | 24.2% | | |
| NCF Debt Yield(4) | 24.1% | 27.7% | 23.4% | 26.3% | 23.4% | | |
| (1) | Represents (i) percent of Net Rental Income for all revenue fields, (ii) percent of Gross Potential Rent for Vacancy & Credit Loss and (iii) percent of Effective Gross Income for all other fields. |
| (2) | Based on the underwritten rent roll dated as of June 5, 2023 inclusive of contractual rent steps through September 2024 totaling $3,076,879. |
| (3) | Other Income includes metered electric charges, conduit income, point of entry income, condenser water income, emergency generator access charges, fuel riser income and other miscellaneous fees. |
| (4) | Debt service coverage ratios and debt yields are based on the aggregate Cut-off Date balance of the 60 Hudson Whole Loan. |
Appraisal. The appraiser concluded to an “as-is” value as of May 8, 2023 of $1,596,000,000.
Environmental Matters. According to the Phase I environmental report dated May 11, 2023, there was no evidence of any recognized environmental conditions at the 60 Hudson Property.
Market Overview and Competition. The 60 Hudson Property is located in the Financial District neighborhood of Lower Manhattan, which borders the neighborhoods of Downtown West, Downtown East, Battery Park, Tribeca/City Hall, Chinatown, and Lower East Side. The 60 Hudson Property is located 5 blocks north of the Wall Street subway station, which provides access to the 2 and 3 lines, while also being located a short walk from the PATH, 4, 5, A, C, E, J, M, Z, W, R, 1, 2, and 3 subway lines, with the new Fulton Street Transit Center providing access to New Jersey, Brooklyn, and the residential neighborhoods in Lower Manhattan.
The 60 Hudson Property is located within the New York metro data center market, which includes clusters of properties in Northern New Jersey, Southeastern New York, and Southwestern Connecticut. The New York metro represents the second-largest data center market in the United States, behind Northern Virginia, and accounts for the highest colocation revenues with proximity to Wall Street and subsea connectivity. Manhattan represents a major confluence of fiber networks and enterprise information technology footprints, with developed carrier hotels including the 60 Hudson Property, 32 Avenue of the Americas, and 111 8th Avenue expected to remain central hubs for networking and connectivity. As of 2023, according to a third party market research report, the New York metro is
| THE INFORMATION IN THIS STRUCTURAL AND COLLATERAL TERM SHEET IS NOT COMPLETE AND MAY BE AMENDED PRIOR TO THE TIME OF SALE. THIS TERM SHEET IS NOT AN OFFER TO SELL THESE SECURITIES AND IT IS NOT A SOLICITATION OF AN OFFER TO BUY THESE SECURITIES IN ANY JURISDICTION WHERE THE OFFER OR SALE IS NOT PERMITTED. |
| | 99 | |
| Other – Data Center | Loan #6 | Cut-off Date Balance: | | $65,000,000 |
| 60 Hudson Street | 60 Hudson | Cut-off Date LTV: | | 17.5% |
| New York, NY 10013 | | U/W NCF DSCR: | | 3.92x |
| | | U/W NOI Debt Yield: | | 24.2% |
estimated to operate with nearly 800 megawatts of multi-tenant information technology capacity. The New York market is estimated to have surpassed 6.0 million SF of multi-tenant operational space as of 2022. Data center customers within this region primarily include the financial sector, but also include healthcare, media, and others which have specific user requirements and compliance needs. New York’s financial industry is responsible for approximately 40% of its total economic output. Transferring data is vital for the financial services industry, and this communication must move quickly with its information stored securely. Increased volume of data in trading is raising demand for cybersecurity software with monitors for fraud or noncompliance. Proximity hosting allows traders to be physically close to information technology systems allowing the advantage of multiple data flows. According to the appraisal, data center operators in this region or other major markets are reporting occupancy rates from 75% to 94%.
According to the appraisal, the estimated 2022 population within a half-, one - and two-mile radius was approximately 19,702, 213,569, and 677,036, respectively, and the average household income within the same radii was $206,211, $207,361, and $217,611, respectively.
The following table presents certain information relating to the appraisal’s market rent conclusion for the 60 Hudson Property:
Market Rent Summary
| Category | Market Rent (PSF) | Lease Type (Reimbursements)(1) | Rent Increase Projection | Lease Term | Tenant Improvements (New/Renewal) | Leasing Commissions (New/Renewal) |
| Office (Floors 1-13) | $54.00 | MG+E (Taxes Only) | 2.5% per year | 10 years | $125.00 / $90.00 | 4.0% / 2.0% |
| Office (Floors 14-24) | $60.00 | MG+E (Taxes Only) | 2.5% per year | 10 years | $125.00 / $90.00 | 4.0% / 2.0% |
| Office (Floor 14; 1st Turn) | $60.00 | MG+E (Taxes Only) | 2.5% per year | 10 years | $150.00 / $90.00 | 4.0% / 2.0% |
| Data Center ($100 PSF) | $100.00 | MG+E (Taxes Only) | 2.5% per year | 10 years | $20.00 / $5.00 | 4.0% / 2.0% |
| Data Center ($125 PSF) | $125.00 | MG+E (Taxes Only) | 2.5% per year | 10 years | $20.00 / $5.00 | 4.0% / 2.0% |
| Data Center ($175 PSF) | $175.00 | MG+E (Taxes Only) | 2.5% per year | 10 years | $20.00 / $5.00 | 4.0% / 2.0% |
Source: Appraisal.
| (1) | MG+E (Taxes Only) represents modified gross basis with tenants paying their pro rata share of expense reimbursements (taxes only) over a base year. |
The following table presents information relating to the sales of comparable properties to the 60 Hudson Property identified by the appraisal:
Comparable Sales Summary
| Subject/Location | Year Built/ Renovated | Rentable Area (SF) | Occupancy | Sale Date | Sale Price | Sale Price PSF |
60 Hudson Property (subject)(1) New York, NY | 1930/2013 | 1,149,619 | 62.2% | NAV | $1,596,000,000(2) | $1,388.29(2) |
1500 Champa Street Denver, CO | 1985 / 2014 | 140,323 | 100.0% | Dec. 2021 | $92,000,000 | $655.63 |
Confidential Major Market | 1925 / 2010 | 66,000 | Value Add | Oct. 2021 | $31,895,000 | $483.26 |
325 Hudson New York, NY | 1967 / 2007 | 217,600 | Value Add | May 2021 | $134,140,000 | $616.45 |
Confidential Secondary Market | 1914 / 2001 | 300,000 | Value Add | Jan. 2021 | $360,000,000 | $1,200.00 |
Confidential Major Market | 1942 / 2000 | 175,000 | 75.0% | Dec. 2020 | $165,468,922 | $945.54 |
Confidential Major Market | 1923 / Various | 110,000 | 94.0% | Apr. 2020 | $100,000,00 | $909.09 |
Confidential Major Market | 1981 / 2013 | 400,000 | 90.0% | Jan. 2020 | $750,000,000 | $1,875.00 |
1950 North Stemmons Freeway Dallas, TX | 1985 / Various | 1,600,000 | 90.0% | Feb. 2018 | $800,000,000 | $500.00 |
Source: Appraisal.
| (1) | Information obtained from the underwritten rent roll other than year built/renovated. |
| (2) | Sale Price represents appraisal value. |
| THE INFORMATION IN THIS STRUCTURAL AND COLLATERAL TERM SHEET IS NOT COMPLETE AND MAY BE AMENDED PRIOR TO THE TIME OF SALE. THIS TERM SHEET IS NOT AN OFFER TO SELL THESE SECURITIES AND IT IS NOT A SOLICITATION OF AN OFFER TO BUY THESE SECURITIES IN ANY JURISDICTION WHERE THE OFFER OR SALE IS NOT PERMITTED. |
| | 100 | |
| Other – Data Center | Loan #6 | Cut-off Date Balance: | | $65,000,000 |
| 60 Hudson Street | 60 Hudson | Cut-off Date LTV: | | 17.5% |
| New York, NY 10013 | | U/W NCF DSCR: | | 3.92x |
| | | U/W NOI Debt Yield: | | 24.2% |
Escrows
Real Estate Taxes – At origination the borrower was required to deposit $7,089,987 into a reserve for real estate taxes. On each monthly payment date, the borrower is required to deposit into a reserve for real estate taxes an amount equal to 1/12 of the real estate taxes that the lender estimates will be payable during the next twelve months for the 60 Hudson Property (currently approximately $1,772,497).
Insurance – On each monthly payment date, the borrower is required to deposit into a reserve for insurance premiums an amount equal to 1/12 of the insurance premiums that the lender estimates will be payable for the renewal of coverage upon the expiration of the insurance policies. Notwithstanding the foregoing, the borrower is not required to reserve for insurance premiums, provided that (i) no event of default is continuing under the 60 Hudson Whole Loan documents, (ii) the liability and casualty insurance coverage for the 60 Hudson Property is included in blanket policies approved by the lender in its reasonable discretion, and (iii) the borrower provides the lender with evidence of renewal of the policies and paid receipts for the payment of the insurance premiums by no later than 10 days prior to the expiration date of the policies (which was the case at origination).
Replacement Reserve – On each monthly payment date during the continuance of a Reserves Trigger Period (as defined below), the borrower is required to deposit approximately $19,160 into a reserve for capital expenditures.
TI/LC Reserve – On each monthly payment date during the continuance of a Reserves Trigger Period, the borrower is required to deposit approximately $287,405 into a reserve for tenant improvements and leasing commissions.
“Reserves Trigger Period” means the continuance of any Cash Sweep Event Period (as defined below), provided that if such Cash Sweep Event Period is not caused by an event of default under the 60 Hudson Whole Loan documents, the Reserves Trigger Period will not be deemed to have occurred if (i) the borrower demonstrates to the reasonable satisfaction of the lender that the borrower has Sufficient Liquid Resources (as defined below) or (ii) the borrower delivers to the lender the Additional Collateral (as defined below) as and when permitted by the 60 Hudson Whole Loan documents.
“Sufficient Liquid Resources” means that the borrower has cash, cash equivalents and/or other liquid assets equal to not less than 50% or more of the capital expenditures and tenant improvements and leasing commissions payable as of an applicable determination date.
“Additional Collateral” means either cash or a letter of credit in the amount of $17,500,000.
“Cash Sweep Event Period” means a period (A) commencing upon the earliest of (i) the occurrence of an event of default under the 60 Hudson Whole Loan documents, or (ii) the interest only debt service coverage ratio of the 60 Hudson Whole Loan being less than 1.60x at the end of any calendar quarter; and (B) expiring upon (y) with regard to any Cash Sweep Event Period commenced in connection with clause (i) above, the cure (if applicable) of such event of default, and (z) with regard to any Cash Sweep Event Period commenced in connection with clause (ii) above, the date that either (A) the interest only debt service coverage ratio is equal to or greater than 1.60x for the immediately preceding calendar quarter (without assuming that the Additional Collateral has been applied as a partial repayment of the 60 Hudson Whole Loan) or (B) assuming that no event of default is continuing, the date that the borrower delivers Additional Collateral to the lender; provided, however, that if, 12 months following the commencement of the Cash Sweep Event Period that resulted in delivery of Additional Collateral, the interest only debt service coverage ratio is less than 1.60x at the end of any calendar quarter (without giving effect to application of the Additional Collateral to the outstanding principal balance of the 60 Hudson Whole Loan), a Cash Sweep Event Period will be deemed to have occurred and will continue until the date that the interest only debt service coverage ratio is equal to or greater than 1.60x for the immediately preceding calendar quarter. In no event will the borrower have the right to cure a Cash Sweep Event Period by delivering Additional Collateral on more than three occasions.
Lockbox and Cash Management. The 60 Hudson Whole Loan is structured with a hard lockbox maintained with Apple Bank for Savings, an affiliate of the borrower, and in place cash management. All rents are required to be deposited into the lender-controlled lockbox account. The 60 Hudson Whole Loan documents require that the borrower deliver tenant direction letters to the tenants directing them to pay all rents into the lockbox account, and if the borrower or property manager receives rents from the 60 Hudson Property despite such direction, to deposit such rents into the lockbox account within one business day of receipt. All funds in the lockbox account are required to be swept on each business day into a lender-controlled cash management account, to be applied, provided no event of default is continuing under the 60 Hudson Whole Loan, (i) to make the monthly deposits, if any, into the tax and insurance reserve funds, as described above under “Escrows” (ii) to pay debt service on the 60 Hudson Whole Loan, (iii) to make monthly deposits, if any, into the Replacement Reserve and the TI/LC Reserve, as described above under “Escrows” (iv) if a Cash Sweep Event Period is continuing, to pay monthly operating expenses in the amount set forth in the lender-approved annual budget and lender approved extraordinary expenses, and (v) to apply any funds remaining in the cash management account after the application described above (x) if a Cash Sweep Event Period exists, to be deposited into an excess cash flow reserve to be held as additional collateral for the 60 Hudson Whole Loan during the continuance of such Cash Sweep Event Period and (y) otherwise, to be disbursed to the borrower.
Subordinate and Mezzanine Indebtedness. None.
Partial Release. Not permitted.
Real Estate Substitution. Not permitted.
| THE INFORMATION IN THIS STRUCTURAL AND COLLATERAL TERM SHEET IS NOT COMPLETE AND MAY BE AMENDED PRIOR TO THE TIME OF SALE. THIS TERM SHEET IS NOT AN OFFER TO SELL THESE SECURITIES AND IT IS NOT A SOLICITATION OF AN OFFER TO BUY THESE SECURITIES IN ANY JURISDICTION WHERE THE OFFER OR SALE IS NOT PERMITTED. |
| | 101 | |
| Other – Data Center | Loan #6 | Cut-off Date Balance: | | $65,000,000 |
| 60 Hudson Street | 60 Hudson | Cut-off Date LTV: | | 17.5% |
| New York, NY 10013 | | U/W NCF DSCR: | | 3.92x |
| | | U/W NOI Debt Yield: | | 24.2% |
Property Management. The property manager is Colliers Tri-State Management LLC, an affiliate of the borrower.
Letter of Credit. None; provided that a letter of credit may be delivered to cure a Cash Sweep Event Period caused by a decline in debt service coverage ratio as described above under “Escrows.”
Right of First Offer/Right of First Refusal. None.
Ground Lease. None.
Terrorism Insurance. The borrower is required to obtain and maintain an “all risk” property insurance policy that covers perils of terrorism and acts of terrorism in an amount equal to the “full replacement cost” of the 60 Hudson Property together with 24 months of business income insurance, plus an extended period of indemnity of up to 12 months. Notwithstanding the foregoing, for so long as the Terrorism Risk Insurance Act of 2002, as extended and modified by the Terrorism Risk Insurance Program Reauthorization Act of 2015 (“TRIPRA”), is in effect (including any extensions thereof or if another federal governmental program is in effect relating to “acts of terrorism” which provides substantially similar protections as TRIPRA), the lender is required to accept terrorism insurance which insures against “covered acts” as defined by TRIPRA (or such other program) but only in the event that TRIPRA (or such other program) continues to cover both domestic and foreign acts of terrorism. Additionally, with respect to any such stand-alone policy covering perils of terrorism and acts of terrorism, the borrower will not be required to pay any insurance premiums solely with respect to such terrorism coverage in excess of two times the amount of the insurance premium that is payable in respect of the 60 Hudson Property and business income/loss of rents insurance (without giving effect to the cost of terrorism and earthquake components of such insurance) at the time that such terrorism coverage is excluded from the applicable insurance policy. See “Risk Factors—Risks Relating to the Mortgage Loans—Terrorism Insurance May Not Be Available for All Mortgaged Properties” in the Preliminary Prospectus.
| THE INFORMATION IN THIS STRUCTURAL AND COLLATERAL TERM SHEET IS NOT COMPLETE AND MAY BE AMENDED PRIOR TO THE TIME OF SALE. THIS TERM SHEET IS NOT AN OFFER TO SELL THESE SECURITIES AND IT IS NOT A SOLICITATION OF AN OFFER TO BUY THESE SECURITIES IN ANY JURISDICTION WHERE THE OFFER OR SALE IS NOT PERMITTED. |
| | 102 | |
| Office – Medical/Lab | Loan #7 | Cut-off Date Balance: | | $63,000,000 |
Property Addresses – Various Various, Various | DHC Medical Office Portfolio | Cut-off Date LTV: U/W NCF DSCR: U/W NOI Debt Yield: | | 49.0% 1.62x 12.4% |

| THE INFORMATION IN THIS STRUCTURAL AND COLLATERAL TERM SHEET IS NOT COMPLETE AND MAY BE AMENDED PRIOR TO THE TIME OF SALE. THIS TERM SHEET IS NOT AN OFFER TO SELL THESE SECURITIES AND IT IS NOT A SOLICITATION OF AN OFFER TO BUY THESE SECURITIES IN ANY JURISDICTION WHERE THE OFFER OR SALE IS NOT PERMITTED. |
| | 103 | |
| Office – Medical/Lab | Loan #7 | Cut-off Date Balance: | | $63,000,000 |
Property Addresses – Various Various, Various | DHC Medical Office Portfolio | Cut-off Date LTV: U/W NCF DSCR: U/W NOI Debt Yield: | | 49.0% 1.62x 12.4% |

| THE INFORMATION IN THIS STRUCTURAL AND COLLATERAL TERM SHEET IS NOT COMPLETE AND MAY BE AMENDED PRIOR TO THE TIME OF SALE. THIS TERM SHEET IS NOT AN OFFER TO SELL THESE SECURITIES AND IT IS NOT A SOLICITATION OF AN OFFER TO BUY THESE SECURITIES IN ANY JURISDICTION WHERE THE OFFER OR SALE IS NOT PERMITTED. |
| | 104 | |
| No. 7 – DHC Medical Office Portfolio |
| |
| Mortgage Loan Information | | Mortgaged Property Information |
| Mortgage Loan Seller: | Wells Fargo Bank, National Association | | Single Asset/Portfolio(3): | Portfolio |
Credit Assessment (Fitch/KBRA/Moody’s): | NR/NR/NR | | Property Type – Subtype(3): | Office – Medical/Lab |
| Original Principal Balance(1): | $63,000,000 | | Location(3): | Various |
| Cut-off Date Balance(1): | $63,000,000 | | Size(3): | 725,279 SF |
| % of Initial Pool Balance: | 5.8% | | Cut-off Date Balance Per SF(1): | $165.45 |
| Loan Purpose: | Recapitalization | | Maturity Date Balance Per SF(1): | $165.45 |
| Borrower Sponsor: | Diversified Healthcare Trust | | Year Built/Renovated: | Various/Various |
| Guarantor: | Diversified Healthcare Trust | | Title Vesting: | Various |
| Mortgage Rate: | 6.8640% | | Property Manager: | The RMR Group LLC (borrower-related) |
| Note Date: | May 30, 2024 | | Current Occupancy (As of): | 88.0% (April 1, 2024) |
| Seasoning: | 0 months | | YE 2023 Occupancy: | 95.3% |
| Maturity Date: | June 11, 2034 | | YE 2022 Occupancy: | 95.1% |
| IO Period: | 120 months | | YE 2021 Occupancy(4): | 91.2% |
| Loan Term (Original): | 120 months | | YE 2020 Occupancy(4): | 71.9% |
| Amortization Term (Original): | NAP | | As-Is Appraised Value(4): | $245,000,000 |
| Loan Amortization Type: | Interest Only | | As-Is Appraised Value Per SF: | $337.80 |
| Call Protection: | L(24),D(89),O(7) | | As-Is Appraisal Valuation Date: | Various |
| Lockbox Type: | Hard / Springing Cash Management | | Underwriting and Financial Information |
| Additional Debt(1): | Yes | | TTM NOI (3/31/2024): | $15,691,408 |
| Additional Debt Type (Balance) (1): | Pari Passu ($57,000,000) | | YE 2023 NOI: | $15,458,647 |
| | | | YE 2022 NOI(5): | NAV |
| | | | YE 2021 NOI(5): | NAV |
| | | | U/W Revenues: | $26,877,478 |
| | | | U/W Expenses: | $11,976,039 |
| Escrows and Reserves(2) | | U/W NOI: | $14,901,438 |
| | Initial | Monthly | Cap | | U/W NCF: | $13,538,112 |
| Tax Reserve | $0 | Springing | NAP | | U/W DSCR based on NOI/NCF(1): | 1.78x / 1.62x |
| Insurance Reserve | $0 | Springing | NAP | | U/W Debt Yield based on NOI/NCF(1): | 12.4% / 11.3% |
| Replacement Reserve | $0 | Springing | NAP | | U/W Debt Yield at Maturity based on NOI/NCF(1): | 12.4% / 11.3% |
| TI/LC Reserve | $1,500,000 | $108,333 | $8,000,000 | | Cut-off Date LTV Ratio(1): | 49.0% |
| Rent Concession Reserve | $29,229 | $0 | NAP | | LTV Ratio at Maturity(1): | 49.0% |
| Outstanding TI/LC Reserve | $1,770,305 | $0 | NAP | | | |
| Ground Rent Reserve | $34,333 | Springing | NAP | | | |
| Landlord Work Reserve | $66,700 | $0 | NAP | | | |
| | | | | | | | |
| Sources and Uses |
| Sources | | | | Uses | | |
| Whole Loan Amount(1) | $120,000,000 | 100.0% | | Return of Equity(6): | $114,750,817 | 95.6% |
| | | | | Upfront Reserves | 3,400,567 | 2.8 |
| | | | | Closing costs | 1,848,616 | 1.5 |
| Total Sources | $120,000,000 | 100.0% | | Total Uses | $120,000,000 | 100.0% |
| (1) | The DHC Medical Office Portfolio Mortgage Loan (as defined below) is part of the DHC Medical Office Portfolio Whole Loan (as defined below), which is evidenced by six pari passu promissory notes with an aggregate principal balance of $120,000,000. The Cut-off Date Balance Per SF, Maturity Date Balance Per SF, U/W Debt Yield based on NOI/NCF, UW at Maturity based on NOI/NCF, U/W DSCR based on NOI/NCF, Cut-off Date LTV Ratio and LTV Ratio at Maturity numbers presented above are based on the aggregate principal balance of the promissory notes comprising the DHC Medical Office Portfolio Whole Loan. |
| (2) | See “Escrows” below for further discussion of reserve information. |
| (3) | See the table entitled “DHC Medical Office Portfolio Summary” below for further information. |
| (4) | The YE 2020 and YE 2021 Occupancy numbers do not include the 47071 Bayside Parkway property, which was acquired in July 2022. |
| (5) | The 47071 Bayside Parkway property was acquired in July 2022, therefore the YE 2022 and YE 2021 NOI numbers are not representative of the total income for the DHC Medical Office Portfolio Properties (as defined below). |
| (6) | The DHC Medical Office Portfolio Properties were previously unencumbered. The proceeds from the DHC Medical Office Portfolio Whole Loan will be used by the borrower sponsor for corporate purposes. The borrower sponsors acquired the DHC Medical Office Portfolio Properties between June 2008 and July 2022 for $211,282,735. |
The Mortgage Loan. The seventh largest mortgage loan (the “DHC Medical Office Portfolio Mortgage Loan”) is part of a whole loan (the “DHC Medical Office Portfolio Whole Loan”) that is evidenced by six pari passu promissory notes in the aggregate original principal amount of $120,000,000 and secured by first priority fee or fee/leasehold mortgages encumbering a portfolio of eight medical office/laboratory properties totaling approximately 725,279 square feet, located in seven states (each a “Property” and collectively, the “DHC Medical Office Portfolio Properties”). The DHC Medical Office Portfolio Whole Loan was co-originated by UBS AG (“UBS”),
| THE INFORMATION IN THIS STRUCTURAL AND COLLATERAL TERM SHEET IS NOT COMPLETE AND MAY BE AMENDED PRIOR TO THE TIME OF SALE. THIS TERM SHEET IS NOT AN OFFER TO SELL THESE SECURITIES AND IT IS NOT A SOLICITATION OF AN OFFER TO BUY THESE SECURITIES IN ANY JURISDICTION WHERE THE OFFER OR SALE IS NOT PERMITTED. |
| | 105 | |
| Office – Medical/Lab | Loan #7 | Cut-off Date Balance: | | $63,000,000 |
Property Addresses – Various Various, Various | DHC Medical Office Portfolio | Cut-off Date LTV: U/W NCF DSCR: U/W NOI Debt Yield: | | 49.0% 1.62x 12.4% |
Bank of Montreal (“BMO”), and Wells Fargo Bank, National Association. The DHC Medical Office Portfolio Mortgage Loan is evidenced by the controlling note A-1 and non-controlling note A-2, and will be serviced under the pooling and servicing agreement for the BANK 2024-BNK47 securitization trust. See “Description of the Mortgage Pool—The Whole Loans—The Serviced Pari Passu Whole Loans” and “Pooling and Servicing Agreement—Servicing of the Serviced Mortgage Loans” in the Preliminary Prospectus.
| DHC Medical Office Portfolio Whole Loan Summary |
| Note | Original Balance | Cut-off Date Balance | Note Holder | Controlling Note |
| A-1 | $31,500,000 | $31,500,000 | | BANK 2024-BNK47 | Yes |
| A-2 | $31,500,000 | $31,500,000 | | BANK 2024-BNK47 | No |
| A-3(1) | $23,000,000 | $23,000,000 | | BMO | No |
| A-4(1) | $5,500,000 | $5,500,000 | | BMO | No |
| A-5(1) | $23,000,000 | $23,000,000 | | UBS | No |
| A-6(1) | $5,500,000 | $5,500,000 | | UBS | |
| Total | $120,000,000 | $120,000,000 | | | |
| (1) | The notes held by the lenders are expected to be contributed to one or more future securitization transactions or may otherwise be transferred at any time. |
The Borrowers and Borrower Sponsor. The borrowers, each of which owns a separate constituent mortgaged property, are Bayside Fremont CA LLC, Centre Ave Pittsburgh LLC, Congress Ave Boynton LLC, Country Road Mineola LLC, Maguire Road MA LLC, Mall Boulevard KOP PA LLC, Milstead Conyers GA LLC and Spurs Lane San Antonio LLC, each a Delaware limited liability company and each a special purpose entity with two independent directors.
The borrower sponsor and non-recourse carveout guarantor is Diversified Healthcare Trust (“DHC”) (Nasdaq: DHC). DHC is a real estate investment trust that currently owns approximately $7.2 billion of healthcare properties located in 36 states and Washington, DC. The company’s current portfolio includes over 100 properties totaling 8.5 million square feet, occupied by 500 tenants. Additionally, DHC has a senior living portfolio with more than 27,000 senior living units. The guarantor’s liability with respect to bankruptcy related full recourse carveouts will not exceed 50% of the loan amount.
DHC is managed by the RMR Group (“RMR”) (Nasdaq: RMR), an alternative asset management company which focuses on commercial real estate and related businesses. RMR employes over 1,000 people across 35 offices throughout the US and manages over $41 billion in assets. As of March 31, 2024, the combined RMR managed companies had over $5 billion in revenue and approximately 2,100 properties.
The Properties. The DHC Medical Office Portfolio consists of the six medical office properties (80.3% of net rentable area) and two life science properties (19.7% of net rentable area) totaling 725,279 square feet, located across seven states. DHC acquired the assets between June 2008 and July 2022 for a total of $211,282,735. The properties were built between 1963 and 2008, with the three largest properties renovated between 2020 and 2022.
As of April 1, 2024, the DHC Medical Office Portfolio Properties were 88.0% leased, across approximately 80 unique tenants. The DHC Medical Office Portfolio has averaged 88.5% occupancy since 2014. It reached its lowest occupancy during COVID at 68.5% in June 2021, but rebounded to 85.5% by September 2021 and 91.2% by YE 2021. The DHC Medical Office Portfolio Properties have a granular rent roll, with no tenant outside of the top three representing more than 4.1% of net rentable area or 2.7% of underwritten base rent. Recent leasing activity at the DHC Medical Office Portfolio Properties includes 21 new leases, representing 26.4% of net rentable area signed since 2022. Two investment grade tenants, NYU Langone Hospitals and UPMC Presbyterian Shadyside, comprise approximately 12.4% of the net rentable area and 13.2% of the underwritten rent.
| THE INFORMATION IN THIS STRUCTURAL AND COLLATERAL TERM SHEET IS NOT COMPLETE AND MAY BE AMENDED PRIOR TO THE TIME OF SALE. THIS TERM SHEET IS NOT AN OFFER TO SELL THESE SECURITIES AND IT IS NOT A SOLICITATION OF AN OFFER TO BUY THESE SECURITIES IN ANY JURISDICTION WHERE THE OFFER OR SALE IS NOT PERMITTED. |
| | 106 | |
| Office – Medical/Lab | Loan #7 | Cut-off Date Balance: | | $63,000,000 |
Property Addresses – Various Various, Various | DHC Medical Office Portfolio | Cut-off Date LTV: U/W NCF DSCR: U/W NOI Debt Yield: | | 49.0% 1.62x 12.4% |
The following table presents certain information relating to the DHC Medical Office Portfolio Properties:
| DHC Medical Office Portfolio Summary |
Property Name Address | Property Sub-Type | Allocated Whole Loan Cut-Off Date Balance | % of Portfolio Cut-Off Date Balance | Year Built/ Renovated | SF | UW NOI | % UW NOI | Appraised Value(1) | Allocated Cut-off Date LTV |
47071 Bayside Parkway 47071 Bayside Parkway
Fremont, CA 94538 | Life Science | $40,653,061 | 33.9% | 1990/2022 | 88,508 | $4,984,621 | 33.5% | $83,000,000 | 49.0% |
4 Maguire Road 4 Maguire Road Lexington, MA 02421 | Life Science | $24,391,837 | 20.3% | 1968/2022 | 54,633 | $2,664,667 | 17.9% | $49,800,000 | 49.0% |
200 Old Country Road(1)
200 Old Country Road
Mineola, NY 11501 | Medical | $21,795,918 | 18.2% | 1971/2020 | 256,559 | $2,235,141 | 15.0% | $44,500,000 | 49.0% |
21 Spurs Lane 21 Spurs Lane San Antonio, TX 78240 | Medical | $12,440,816 | 10.4% | 2005/NAP | 129,438 | $1,857,464 | 12.5% | $25,400,000 | 49.0% |
5750 Centre Avenue 5750 Centre Avenue
Pittsburgh, PA 15206 | Medical | $6,514,287 | 5.4% | 1990/NAP | 75,990 | $1,010,830 | 6.8% | $13,300,000 | 49.0% |
1325 South Congress
Avenue 1325 South Congress
Avenue Boynton Beach, FL 33426 | Medical | $6,122,449 | 5.1% | 1985/NAP | 52,867 | $803,991 | 5.4% | $12,500,000 | 49.0% |
1501 Milstead Road 1501 Milstead Road
Conyers, GA 30012 | Medical | $4,897,959 | 4.1% | 2008/NAP | 38,031 | $774,313 | 5.2% | $10,000,000 | 49.0% |
210 Mall Boulevard 210 Mall Boulevard King of Prussia, PA 19406 | Medical | $3,183,673 | 2.7% | 1963/2016 | 29,253 | $570,411 | 3.8% | $6,500,000 | 49.0% |
| Total | | $120,000,000 | 100.0% | | 725,279 | $14,901,438 | 100.0% | $245,000,000 | |
| (1) | A portion of the 200 Old Country Road property is secured by a ground lease. See “Ground Lease” below. |
Major Tenants.
Alamar Biosciences, Inc. (47071 Bayside Parkway property, 88,508 square feet, 12.2% of net rentable area, 22.0% of underwritten base rent). Alamar Biosciences, Inc. (“Alamar Biosciences”) is a privately held company headquartered at the 47071 Bayside Parkway property. The company is a life science company with a mission to power precision proteomics to enable early detection of disease. In February 2024, the company announced the first close of $100 million in Series C financing, bringing total funding to nearly $250MM to date. This funding round was led by Sands Capital, with other investors including Morningside Ventures, Illumina Ventures, Samsara Biocapital, and Sherpa Capital. Alamar Biosciences has been a tenant at the 47071 Bayside Parkway property since July 2022, with a lease that expires on January 31, 2034 with no termination options. The tenant is subleasing 8,287 SF, representing 9.4% of its space, to an affiliate through April 8, 2025 at $71.01 per square foot.
KSQ Therapeutics, Inc. (4 Maguire Road property, 54,633 square feet, 7.5% of net rentable area, 15.7% of underwritten base rent). KSQ Therapeutics, Inc, (“KSQ”) is a clinical-stage biotechnology company advancing a pipeline of novel drug candidates to treat cancer across multiple drug modalities including targeted therapies, adoptive cell therapies, and immunotherapies. KSQ Therapeutics leases the entirety of the 4 Maguire Road Property under a lease that expires on September 30, 2032 with a termination option effective September 29, 2030 for 24,962 SF of its space and August 13, 2030 for 29,671 SF of its space, each with 12 months’ written notice. The tenant has two, five-year renewal options remaining. KSQ is currently marketing 17,940, or 32.8% of its space, for sublease.
NYU Langone Hospitals (200 Old Country Road property, 68,258 square feet, 9.4% of net rentable area, 10.5% of underwritten base rent). NYU Langone Health is an academic medical center. NYU Langone Health is a healthcare system in the Northeast, with more than 46,000 employees. The health system consists of the NYU Grossman School of Medicine and NYU Grossman Long Island School of Medicine, both part of New York University (NYU), and more than 300 locations throughout the New York City Region and Florida, including six inpatient facilities (Tisch Hospital; Kimmel Pavilion; NYU Langone Orthopedic Hospital; Hassenfeld Children's Hospital; NYU Langone Hospital – Brooklyn, and NYU Langone Hospital – Long Island). NYU Langone Health leases space at the 200 Old Country Road property for a mix of office and lab uses under 15 separate leases with expiration dates between December 31, 2024 and December 31, 2027. One tenant space representing 4,083 square feet or 1.6% of the net rentable area of the 200 Old Country Road property, has a one-time termination option effective March 31, 2025, by giving notice no later than June 30, 2024.
| THE INFORMATION IN THIS STRUCTURAL AND COLLATERAL TERM SHEET IS NOT COMPLETE AND MAY BE AMENDED PRIOR TO THE TIME OF SALE. THIS TERM SHEET IS NOT AN OFFER TO SELL THESE SECURITIES AND IT IS NOT A SOLICITATION OF AN OFFER TO BUY THESE SECURITIES IN ANY JURISDICTION WHERE THE OFFER OR SALE IS NOT PERMITTED. |
| | 107 | |
| Office – Medical/Lab | Loan #7 | Cut-off Date Balance: | | $63,000,000 |
Property Addresses – Various Various, Various | DHC Medical Office Portfolio | Cut-off Date LTV: U/W NCF DSCR: U/W NOI Debt Yield: | | 49.0% 1.62x 12.4% |
The following table presents certain information relating to the tenancy at the DHC Medical Office Portfolio Properties:
Major Tenants(1)
| Tenant Name | Credit Rating
(Moody’s/ Fitch/
S&P) | Property | Tenant NRSF | % of
NRSF | Annual U/W Base Rent PSF | Annual
U/W Base Rent(2) | % of Total Annual U/W Base Rent(2) | Lease
Expiration
Date | Ext. Options | Term. Option (Y/N) |
| Major Tenants | | | | | | | | | |
| Alamar Biosciences, Inc. | NR / NR / NR | 47071 Bayside Parkway | 88,508(3) | 12.2%(3) | $56.31 | $4,983,888 | 22.0% | 1/31/2034 | 2, 5-year | N |
| KSQ Therapeutics, Inc. | NR / NR / NR | 4 Maguire Road | 54,633(4) | 7.5%(4) | $64.87 | $3,543,844 | 15.7% | 9/30/2032 | 2, 5-year | Y(5) |
| NYU Langone Hospitals | A1 / NR / A+ | 200 Old Country Road | 68,258 | 9.4% | $34.95 | $2,385,476 | 10.5% | Various(5) | 1, 5-year | Y(6) |
UPMC Presbyterian
Shadyside | A2 / NR / A | 5750 Centre Avenue | 21,649 | 3.0% | $28.11 | $608,637 | 2.7% | 4/30/2031 | N | N |
Albert Einstein
Healthcare Network | NR / NR / NR | 210 Mall Boulevard | 29,252(7) | 4.0%(7) | $19.50 | $570,414 | 2.5% | 6/30/2031 | 1, 5-year | Y(8) |
Retina Consultants of
Houston, PLLC | NR / NR / NR | 21 Spurs Lane | 20,087 | 2.8% | $28.11 | $564,723 | 2.5% | 11/30/2035 | 1, 10-year | Y(9) |
| | | 282,387 | 38.9% | $44.82 | $12,656,981 | 56.0% | | | |
| | | | | | | | | | |
| Non-Major Tenants | | 355,891 | 49.1% | $27.97 | $9,954,568 | 44.0% | | | |
| | | | | | | | | | |
| Occupied Collateral Total | | 638,278 | 88.0% | $35.43 | $22,611,549 | 100.0% | | | |
| | | | | | | | | | |
| Vacant Space | | 87,001 | 12.0% | | | | | | |
| | | | | | | | | | |
| Collateral Total | | 725,279 | 100.0% | | | | | | |
| | | | | | | | | | | |
| (1) | Information is based on the underwritten rent roll dated April 1, 2024 and includes contractual rent steps through April 1, 2025 of $551,474. |
| (2) | Annual U/W Base Rent and % of Total Annual U/W Base rent excludes vacant space. |
| (3) | Alamar Biosciences is subleasing 8,287 SF, representing 9.4% of its space, to an affiliate through April 8, 2025 at $71.01 per square foot. |
| (4) | KSQ is currently marketing 17,940, or 32.8% of its space, for sublease. |
| (5) | KSQ has a termination option effective September 29, 2030 for 24,962 SF of its space and August 13, 2030 for 29,671 SF of its space, each with 12 months’ written notice. |
| (6) | NYU Langone Hospitals includes 15 separate leases with expiration dates between December 31, 2024 and December 31, 2027. There is one space representing 4,083 square feet or 1.6% of the net rentable area of the 200 Old Country Road property, that has a one-time termination option effective March 31, 2025, by giving notice no later than June 30, 2024. |
| (7) | Albert Einstein Healthcare Network is subleasing approximately 4,019 SF, representing 13.7% of its space to two tenants with expirations of December 31, 2024 and April 22, 2026 at $18.00 per square foot and $19.00 per square foot, respectively. |
| (8) | Albert Einstein Healthcare Network has a termination option effective June 30, 2028 with 12 months’ notice. |
| (9) | Retina Consultants of Houston, PLLC has a one-time right to terminate the lease effective as of June 28, 2032 if the respective borrower is not able to accommodate the tenant’s request to expand in the 21 Spurs Lane property. The tenant must provide 12 months’ notice and pay termination fee of unamortized leasing costs at an 8% rate. |
The following table presents certain information relating to the lease rollover schedule at the DHC Medical Office Portfolio Properties:
Lease Expiration Schedule(1)(2)
Year Ending
December 31, | No. of Leases Expiring | Expiring NRSF | % of Total NRSF | Cumulative Expiring NRSF | Cumulative % of Total NRSF | Annual
U/W
Base Rent(3) | % of Total Annual U/W Base Rent(3) | Annual
U/W
Base Rent
PSF |
| MTM | 5 | 2,100 | 0.3% | 2,100 | 0.3% | $48,518 | 0.2% | $23.10 |
| 2024 | 8 | 7,382 | 1.0% | 9,482 | 1.3% | $244,594 | 1.1% | $33.13 |
| 2025 | 16 | 41,665 | 5.7% | 51,147 | 7.1% | $1,320,170 | 5.8% | $31.69 |
| 2026 | 19 | 78,533 | 10.8% | 129,680 | 17.9% | $2,300,468 | 10.2% | $29.29 |
| 2027 | 20 | 106,584 | 14.7% | 236,264 | 32.6% | $3,232,342 | 14.3% | $30.33 |
| 2028 | 7 | 12,070 | 1.7% | 248,334 | 34.2% | $382,120 | 1.7% | $31.66 |
| 2029 | 26 | 77,993 | 10.8% | 326,327 | 45.0% | $2,115,580 | 9.4% | $27.13 |
| 2030 | 5 | 26,658 | 3.7% | 352,985 | 48.7% | $729,423 | 3.2% | $27.36 |
| 2031 | 4 | 71,381 | 9.8% | 424,366 | 58.5% | $1,835,482 | 8.1% | $25.71 |
| 2032 | 5 | 70,142 | 9.7% | 494,508 | 68.2% | $3,870,476 | 17.1% | $55.18 |
| 2033 | 6 | 26,425 | 3.6% | 520,933 | 71.8% | $733,715 | 3.2% | $27.77 |
| 2034 | 4 | 97,257 | 13.4% | 618,190 | 85.2% | $5,233,938 | 23.1% | $53.82 |
| Thereafter | 2 | 20,088 | 2.8% | 638,278 | 88.0% | $564,723 | 2.5% | $28.11 |
| Vacant | 0 | 87,001 | 12.0% | 725,279 | 100.0% | $0 | 0.0% | $0.00 |
| Total/Weighted Average | 127 | 725,279 | 100.0% | | | $22,611,549 | 100.0% | $35.43(3) |
| (1) | Information is based on the underwritten rent roll dated April 1, 2024. |
| (2) | Certain tenants may have lease termination options that are exercisable prior to the originally stated expiration date of the related lease and are not considered in the rollover schedule. |
| (3) | Annual U/W Base Rent, and % of total Annual U/W Base Rent excludes vacant space and Total/Weighted Average Annual U/W Base Rent PSF. |
| THE INFORMATION IN THIS STRUCTURAL AND COLLATERAL TERM SHEET IS NOT COMPLETE AND MAY BE AMENDED PRIOR TO THE TIME OF SALE. THIS TERM SHEET IS NOT AN OFFER TO SELL THESE SECURITIES AND IT IS NOT A SOLICITATION OF AN OFFER TO BUY THESE SECURITIES IN ANY JURISDICTION WHERE THE OFFER OR SALE IS NOT PERMITTED. |
| | 108 | |
| Office – Medical/Lab | Loan #7 | Cut-off Date Balance: | | $63,000,000 |
Property Addresses – Various Various, Various | DHC Medical Office Portfolio | Cut-off Date LTV: U/W NCF DSCR: U/W NOI Debt Yield: | | 49.0% 1.62x 12.4% |
The following table presents historical occupancy percentages at the DHC Medical Office Portfolio Properties:
Historical Occupancy
12/31/2020(1)(2) | 12/31/2021(1)(2) | 12/31/2022(1) | 12/31/2023(1) | 4/1/2024(3) |
| 71.9% | 91.2% | 95.1% | 95.3% | 88.0% |
| (1) | Information obtained from the borrower. |
| (2) | Does not include the 47071 Bayside Parkway property which was acquired in July 2022. |
| (3) | Information obtained from the underwritten rent roll dates April 1, 2024. |
Operating History and Underwritten Net Cash Flow. The following table presents certain information relating to the historical operating performance and underwritten net cash flow at the DHC Medical Office Portfolio Properties:
Cash Flow Analysis
| | 2023 | TTM 03/31/2024 | U/W | %(1) | U/W $ per SF |
| Base Rent(2) | $22,307,202 | $22,355,770 | $22,611,549 | 75.0% | $31.18 |
| Grossed Up Vacant Space | 0 | 0 | 2,607,038 | 8.6 | 3.59 |
| Gross Potential Rent | $22,307,202 | $22,355,770 | $25,218,587 | 83.6% | $34.77 |
| (Free Rent) | (483,928) | (457,783) | 0 | 0.0 | 0.00 |
| Expense Reimbursements | 4,849,382 | 4,951,399 | 4,314,679 | 14.3 | 5.95 |
| Miscellaneous Income | 212,261 | 209,920 | 127,050 | 0.4 | 0.18 |
| Parking Income | 509,904 | 492,596 | 495,500 | 1.6 | 0.68 |
| Net Rental Income | $27,394,821 | $27,551,903 | $30,155,816 | 100.0% | $41.58 |
| (Vacancy & Credit Loss) | 0 | 0 | (3,278,339) | (13.0) | (4.52) |
| Effective Gross Income | $27,394,821 | $27,551,903 | $26,877,478 | 89.1% | $37.06 |
| | | | | | |
| Real Estate Taxes | $4,450,871 | $4,377,783 | $4,629,861 | 17.2 | 6.38 |
| Insurance | 476,139 | 472,778 | 472,989 | 1.8 | 0.65 |
| Ground Rent(3) | 206,000 | 206,000 | 206,000 | 0.8 | 0.28 |
| Other Operating Expenses | 6,803,164 | 6,803,934 | 6,667,189 | 24.8 | 9.19 |
| Total Operating Expenses | $11,936,174 | $11,860,495 | $11,976,039 | 44.6% | $16.51 |
| | | | | | |
| Net Operating Income | $15,458,647 | $15,691,408 | $14,901,438 | 55.4% | $20.55 |
| Replacement Reserves | 0 | 0 | 275,408 | 1.0 | 0.38 |
| TI/LC | 0 | 0 | 1,087,919 | 4.0 | 1.50 |
| Net Cash Flow | $15,458,647 | $15,691,408 | $13,538,112 | 50.4% | $18.67 |
| | | | | | |
| NOI DSCR(4) | 1.85x | 1.88x | 1.78x | | |
| NCF DSCR(4) | 1.85x | 1.88x | 1.62x | | |
| NOI Debt Yield(4) | 12.9% | 13.1% | 12.4% | | |
| NCF Debt Yield(4) | 12.9% | 13.1% | 11.3% | | |
| (1) | Represents (i) percent of Net Rental Income for all revenue fields, (ii) percent of Gross Potential Rent for Vacancy & Credit Loss and (iii) percent of Effective Gross Income for all other fields. |
| (2) | U/W Base Rent is based on the underwritten rent roll dated April 1, 2024 and includes contractual rent steps through April 1, 2025 of $551,474 |
| (3) | The ground rent reflects the current ground rent payment for the portion of the 200 Old Country Road property which is subject to a ground lease. |
| (4) | NOI DSCR, NCF DSCR, NOI Debt Yield, and NCF Debt Yield are based on the DHC Medical Office Portfolio Whole Loan. |
Appraisal. The appraisal concluded to an aggregate “as-is” appraised value for the DHC Medical Office Portfolio Properties of $245,000,000. The properties were valued individually between April 17, 2024 and April 22, 2024.
Environmental Matters. According to the Phase I environmental site assessments dated April 23, 2024 there was no evidence of any recognized environmental conditions at the DHC Medical Office Portfolio Properties, with the exception of the 4 Maguire Road property. The 4 Maguire Road property has a recognized environmental condition due to its historical use as a laboratory research and development site and its manufacturing uses. The consultant provided a worst-case estimate with a statistical 90% confidence interval that the total cost for potential remediation had an upper-end range of $1,277,000. The borrower obtained a $7,000,000 environmental insurance policy with a $7,000,000 limit per claim on a 13-year term, which includes a $25,000 deductible per claim. See “Description of the Mortgage Pool – Environmental Considerations” in the Preliminary Prospectus.
| THE INFORMATION IN THIS STRUCTURAL AND COLLATERAL TERM SHEET IS NOT COMPLETE AND MAY BE AMENDED PRIOR TO THE TIME OF SALE. THIS TERM SHEET IS NOT AN OFFER TO SELL THESE SECURITIES AND IT IS NOT A SOLICITATION OF AN OFFER TO BUY THESE SECURITIES IN ANY JURISDICTION WHERE THE OFFER OR SALE IS NOT PERMITTED. |
| | 109 | |
| Office – Medical/Lab | Loan #7 | Cut-off Date Balance: | | $63,000,000 |
Property Addresses – Various Various, Various | DHC Medical Office Portfolio | Cut-off Date LTV: U/W NCF DSCR: U/W NOI Debt Yield: | | 49.0% 1.62x 12.4% |
Market Overview and Competition. Market Overview and Competition. The DHC Medical Office Portfolio Properties are located across seven states: New York (one property, 35.4% of net rentable area), Texas (one property, 17.8% of net rentable area), Pennsylvania (two properties, 14.5% of net rentable area), California (one property, 12.2% of net rentable area), Massachusetts (one property, 7.5% of net rentable area), Florida (one property, 7.3% of net rentable area), and Georgia (one property, 5.2% of net rentable area). According to the appraisals, the properties are located in eight separate submarkets with vacancy ranging from 5.3% to 19.8% with an average of 10.3%.
The following table presents certain local demographic data related to the DHC Medical Office Portfolio Properties:
| Property Name – Location | 2023 Population
(within 1-mi. / 3-mi. / 5-mi. Radius) | 2023 Average Household Income
(within 1-mi. / 3-mi. / 5-mi. Radius) |
| 47071 Bayside Parkway - 47071 Bayside Parkway, Fremont, CA | 1,408 / 54,697 / 191,343 | $ 189,067 / $219,297/ $207,857 |
| 4 Maguire Road - 4 Maguire Road, Lexington, MA | 3,671 / 39,492 / 123,015 | $222,031 / $251,318 / $221,037 |
| 200 Old Country Road - 200 Old Country Road, Mineola, NY | 23,200 / 197,214 / 527,977 | $172,048/ $172,778 / $170,188 |
| 21 Spurs Lane - 21 Spurs Lane, San Antonio, TX | 17,838 / 138,589 / 342,523 | $70,084 / $78,518 / $84,663 |
| 5750 Centre Avenue - 5750 Centre Avenue, Pittsburgh, PA | 38,263 / 179,425 / 340,479 | $103,699 / $98,056 / $94,422 |
| 1325 South Congress Avenue- 1325 South Congress Avenue, Boynton Beach, FL | 13,190 / 112,100 / 255,746 | $92,065 / $98,738 / $102,442 |
| 1501 Milstead Road - 1501 Milstead Road, Conyers, GA | 8,266 / 32,828 / 68,940 | $76,639 / $84,334 / $96,455 |
| 210 Mall Boulevard - 210 Mall Boulevard, King of Prussia, PA | 8,457 / 61,788 / 184,359 | $159,484 / $168,136 / $158,605 |
The following table presents certain information relating to the appraiser’s market rent conclusion for the DHC Medical Office Portfolio Properties:
Market Rent Summary(1)
| Property Name | Market Rent (PSF) | Lease Term (Years) | Concessions (New / Renewal) | Lease Type (Reim- bursements) | Rent Increase Projection | Tenant Improvements (New Tenants) (PSF) | Tenant Improvements (Renewals) (PSF) |
| 47071 Bayside Parkway | $54.00 | 7/0 | 6 mos. / 6 mos. | Net | 3.0% | $50.00 | $25.00 |
| 4 Maguire Road | $72.00 | 7/3 | 3 mos. / 2 mos. | Net | 3.0% | $100.00 | $20.00 |
200 Old Country Road Storage MLA Office MLA Retail MLA | $12.00 $35.00 $20.00 | 7/0 7/0 10/0 | 0 mos. / 0 mos. 4 mos. / 4 mos. 2 mos. / 2 mos. | None Modified Gross Modified Gross | 0.0% 3.0% 3.0% | $0.00 $20.00 $15.00 | $0.00 $10.00 $50.00 |
21 Spurs Lane Surgical Center Medical Office | $38.00 $30.00 | 10/6 5/6 | 6 mos. / 2 mos. 0 mos. / 0 mos. | Net Base Year Stop | 3.0% 3.0% | $80.00 $25.00 | $30.00 $10.00 |
| 5750 Centre Avenue | $26.50 | 10/6 | 2 mos. / 0 mos. | Base Year Stop | 3.0% | $45.00 | $10.00 |
| 1325 South Congress Avenue | $21.00 | 5/0 | 2 mos. / 0 mos. | Net | 3.0% | $25.00 | $10.00 |
| 1501 Milstead Road | $20.00 | 5/0 | 0 mos. / 0 mos. | Net | 3.0% | $30.00 | $25.00 |
| 210 Mall Boulevard | $22.00 | 10/0 | 6 mos. / 0 mos. | NNN | 2.0% | $75.00 | $25.00 |
| (1) | Information obtained from the appraisals. |
| THE INFORMATION IN THIS STRUCTURAL AND COLLATERAL TERM SHEET IS NOT COMPLETE AND MAY BE AMENDED PRIOR TO THE TIME OF SALE. THIS TERM SHEET IS NOT AN OFFER TO SELL THESE SECURITIES AND IT IS NOT A SOLICITATION OF AN OFFER TO BUY THESE SECURITIES IN ANY JURISDICTION WHERE THE OFFER OR SALE IS NOT PERMITTED. |
| | 110 | |
| Office – Medical/Lab | Loan #7 | Cut-off Date Balance: | | $63,000,000 |
Property Addresses – Various Various, Various | DHC Medical Office Portfolio | Cut-off Date LTV: U/W NCF DSCR: U/W NOI Debt Yield: | | 49.0% 1.62x 12.4% |
Escrows.
Real Estate Taxes – The borrowers are required to deposit monthly to a real estate tax reserve 1/12 of the annual estimated real estate taxes during a Cash Sweep Event Period (as defined below) or if certain other conditions are not met, including upon the borrowers’ failure to provide the lender evidence of timely payment of taxes.
Insurance – The borrowers are required to deposit monthly 1/12 of the annual estimated insurance premiums to the insurance reserve during a Cash Sweep Event Period or upon the borrowers’ failure to provide the lender evidence of the timely payment of insurance premiums or evidence of the renewal of a blanket policy to the extent the borrowers maintain insurance pursuant to a blanket policy (which is currently the case).
Replacement Reserve – During a Cash Sweep Event Period, the borrowers are required to deposit monthly amounts of $22,967 to a reserve for replacements to the DHC Medical Office Portfolio Properties. In lieu of monthly deposits to the replacement reserve, the borrowers are permitted to provide a letter of credit for such amounts.
TI/LC Reserve – The loan documents require an upfront deposit of $1,500,000, and ongoing monthly deposits of $108,333, capped at $8,000,000.
Outstanding TI/LC Reserve – The loan documents require an upfront deposit of $1,770,305 for outstanding leasing costs relating to eight tenants.
Rent Concession Reserve – The loan documents require an upfront deposit of $29,229 for outstanding free rent obligations.
Ground Rent Reserve – The loan documents require an upfront deposit of $34,333 and during a Cash Sweep Event Period, the borrowers are required to deposit at least 10 business days in advance of each monthly payment date, monthly amounts for ground rent due and payable for the immediately following calendar month for the 200 Old Country Road property.
Landlord Work Reserve – The loan documents require an upfront deposit of $66,700 for landlord obligations to perform work at the 1325 South Congress Avenue property and the 200 Old Country Road property.
Lockbox and Cash Management. The DHC Medical Office Portfolio Whole Loan is structured with a hard lockbox and springing cash management. At loan origination, the borrowers were required to direct all tenants to remit all rents directly to the applicable lockbox account. Prior to a Cash Sweep Event Period, all amounts in the lockbox account are required to be remitted to a borrower-controlled operating account periodically. During a Cash Sweep Event Period, all funds in the lockbox account are required to be swept into the cash management account controlled by the lender and, on each payment date, are required to be applied in accordance with the waterfall as detailed in the cash management agreement. Any funds remaining after the cashflow waterfall will be held in the excess cash flow account as additional collateral for the loan.
A “Cash Sweep Event Period” will commence upon the earlier of the following:
| (i) | the occurrence of an event of default; |
| (ii) | the NCF DSCR falling below 1.25x, for two consecutive quarters; or |
| (iii) | the occurrence of a Material Tenant Trigger Period (as defined below). |
A Cash Sweep Event Period will end upon the occurrence of the following:
| ● | with regard to clause (i), the cure of such event of default; |
| ● | with regard to clause (ii), the NCF DSCR being at least 1.25x for two consecutive quarters; and |
| ● | with regard to clause (iii), a Material Tenant Trigger Period Cure (as defined below). |
A “Material Tenant Trigger Period” will commence upon the first to occur of the following:
| (i) | a Material Tenant (as defined below) is in monetary or material non-monetary default under its lease beyond any notice and cure periods; |
| (ii) | a Material Tenant fails to operate its business, or gives notice of its intention to cease operating, in 51% or more of its space (other than with regards to certain renovations); |
| (iii) | a Material Tenant giving written notice of its intent to terminate any portion of its space, any termination or cancelation (including rejection in any bankruptcy or similar insolvency proceeding), failing to be in full force and effect, giving written notice it intends not to renew or the date that is 180 days prior to the expiration of its lease, unless the lease has been extended or renewed; |
| (iv) | a Material Tenant is subject to a bankruptcy, insolvency or similar proceeding; or |
| (v) | a Material Tenant gives written notice of its intent to sublease 51% or more of its space. |
| THE INFORMATION IN THIS STRUCTURAL AND COLLATERAL TERM SHEET IS NOT COMPLETE AND MAY BE AMENDED PRIOR TO THE TIME OF SALE. THIS TERM SHEET IS NOT AN OFFER TO SELL THESE SECURITIES AND IT IS NOT A SOLICITATION OF AN OFFER TO BUY THESE SECURITIES IN ANY JURISDICTION WHERE THE OFFER OR SALE IS NOT PERMITTED. |
| | 111 | |
| Office – Medical/Lab | Loan #7 | Cut-off Date Balance: | | $63,000,000 |
Property Addresses – Various Various, Various | DHC Medical Office Portfolio | Cut-off Date LTV: U/W NCF DSCR: U/W NOI Debt Yield: | | 49.0% 1.62x 12.4% |
A “Material Tenant Trigger Period Cure” will be deemed to have occurred upon the occurrence of the following:
| ● | with regard to clause (i), the Material Tenant has cured all defaults under its lease; |
| ● | with regard to clause (ii), the Material Tenant is in actual physical possession, and open for business in at least 51% of its space; |
| ● | with regard to clause (iii), the Material Tenant has revoked or rescinded all termination or cancelation notices and has re-affirmed its lease in full force and effect, or has renewed or extended its lease in accordance with the terms of the loan agreement; |
| ● | with regard to clause (iv), the dismissal of such bankruptcy so the tenant is no longer being insolvent or subject to any bankruptcy or insolvency proceedings, and has affirmed the applicable lease pursuant to final, non-appealable order of a court; |
| ● | with regard to clause (v), the Material Tenant is subleasing the entirety of the applicable space for a term of at least five years in accordance with the applicable terms and conditions of the loan agreement, the tenant is in actual physical occupancy of its space and paying full unabated rent, and the sublease may not be revoked, rescinded, terminated or cancelled for at least the first five years of the lease; |
| ● | with regard to clauses (i)-(v), either (a) the applicable borrower has entered into one or more replacement leases for the entire Material Tenant space for a term of at least five years, there is no outstanding landlord work, tenant improvements or leasing commissions payable under the lease (unless any outstanding amounts have been reserved with the lender), the replacement tenant has taken occupancy and commenced paying full unabated rent (unless such abated rent has been reserved with the lender), or (b) there are funds on deposit in the excess cash flow account equal to the least amount of the Material Tenant Cap (as defined below), or the respective borrower has delivered a letter of credit in an amount equal to the Material Tenant Cap. |
A “Material Tenant” means the Alamar Biosciences lease, the KSQ Therapeutics lease, and any other lease which, individually or when aggregated with all other leases with the same tenant or its affiliates accounts for 15% or more of the gross potential rent of the portfolio.
A “Material Tenant Cap” means (a) for the Alamar Biosciences and the KSQ Therapeutics lease, an amount equal to $194 per square foot for the applicable space or (b) with respect to any other Material Tenant, an amount equal to two times the gross annual rental rate per square foot of the applicable space.
Property Management. The DHC Medical Office Portfolio Properties are managed by The RMR Group LLC.
Additional Secured Indebtedness (not including trade debts). In addition to the DHC Medical Office Portfolio Mortgage Loan, the DHC Medical Office Portfolio Properties also secure notes A-3, A-4, A-5 and A-6 (the “DHC Medical Office Portfolio Pari Passu Companion Loans”), which have an aggregate Cut-off Date principal balance of $57,000,000. DHC Medical Office Portfolio Pari Passu Companion Loans accrue interest at the same rate as the DHC Medical Office Portfolio Mortgage Loan. The DHC Medical Office Portfolio Mortgage Loan is entitled to payments of principal and interest on a pro rata and pari passu basis with the DHC Medical Office Portfolio Pari Passu Companion Loans. The holders of the DHC Medical Office Portfolio Mortgage Loan and the DHC Medical Office Portfolio Pari Passu Companion Loans have entered into a co-lender agreement which sets forth the allocation of collections on the DHC Medical Office Portfolio Whole Loan. See “Description of the Mortgage Pool—The Whole Loans” in the Preliminary Prospectus.
Mezzanine Loan and Preferred Equity. None.
Release of Property. None.
Letter of Credit. None.
Right of First Offer/Right of First Refusal. None.
Real Estate Substitution. Not permitted.
Subordinate and Mezzanine Indebtedness. None.
Ground Lease. The respective borrower of the 200 Old Country Road property has a leasehold interest in a portion of the 200 Old Country Road property with an expiration date of August 31, 2045, with one remaining 30-year extension option.
Terrorism Insurance. The borrowers are required to obtain and maintain property insurance and business interruption insurance for 18 months plus a 12 month extended period of indemnity (provided that if the Terrorism Risk Insurance Program Reauthorization Act of 2019 or a similar statute is not in effect, the borrowers will not be obligated to pay terrorism insurance premiums in excess of two times the annual premium for the property and business interruption/rental loss insurance coverage). See “Risk Factors—Risks Relating to the Mortgage Loans—Terrorism Insurance May Not Be Available for All Mortgaged Properties” in the Preliminary Prospectus.
| THE INFORMATION IN THIS STRUCTURAL AND COLLATERAL TERM SHEET IS NOT COMPLETE AND MAY BE AMENDED PRIOR TO THE TIME OF SALE. THIS TERM SHEET IS NOT AN OFFER TO SELL THESE SECURITIES AND IT IS NOT A SOLICITATION OF AN OFFER TO BUY THESE SECURITIES IN ANY JURISDICTION WHERE THE OFFER OR SALE IS NOT PERMITTED. |
| | 112 | |
| Industrial - Manufacturing | Loan #8 | Cut-off Date Balance: | | $55,100,000 |
Property Addresses - Various Various, Various | SSW Advanced Technologies | Cut-off Date LTV: U/W NCF DSCR: U/W NOI Debt Yield: | | 63.0% 1.35x 11.7% |
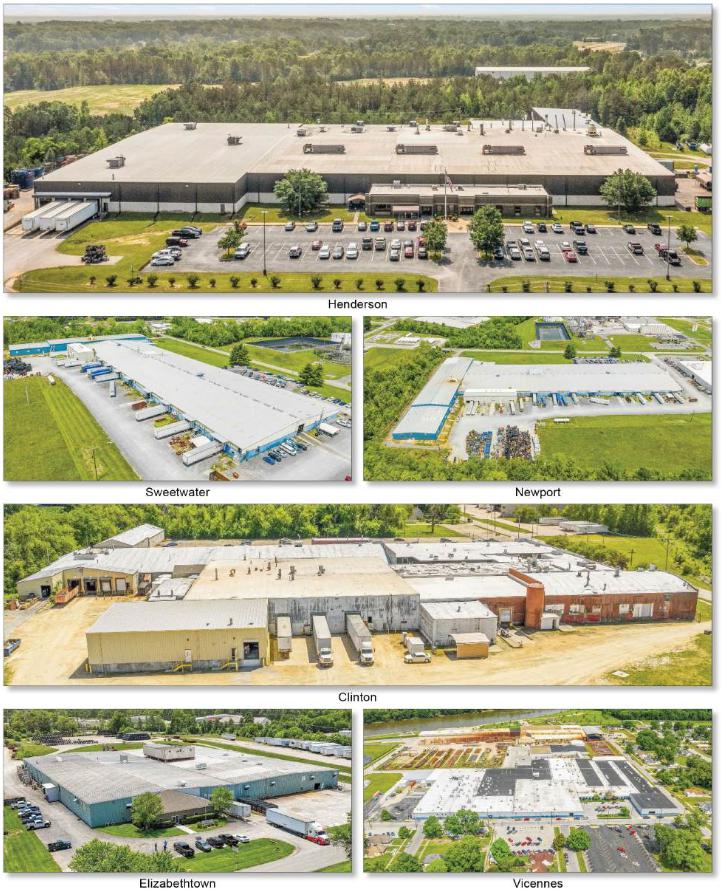
| THE INFORMATION IN THIS STRUCTURAL AND COLLATERAL TERM SHEET IS NOT COMPLETE AND MAY BE AMENDED PRIOR TO THE TIME OF SALE. THIS TERM SHEET IS NOT AN OFFER TO SELL THESE SECURITIES AND IT IS NOT A SOLICITATION OF AN OFFER TO BUY THESE SECURITIES IN ANY JURISDICTION WHERE THE OFFER OR SALE IS NOT PERMITTED. |
| | 113 | |
| Industrial - Manufacturing | Loan #8 | Cut-off Date Balance: | | $55,100,000 |
Property Addresses - Various Various, Various | SSW Advanced Technologies | Cut-off Date LTV: U/W NCF DSCR: U/W NOI Debt Yield: | | 63.0% 1.35x 11.7% |
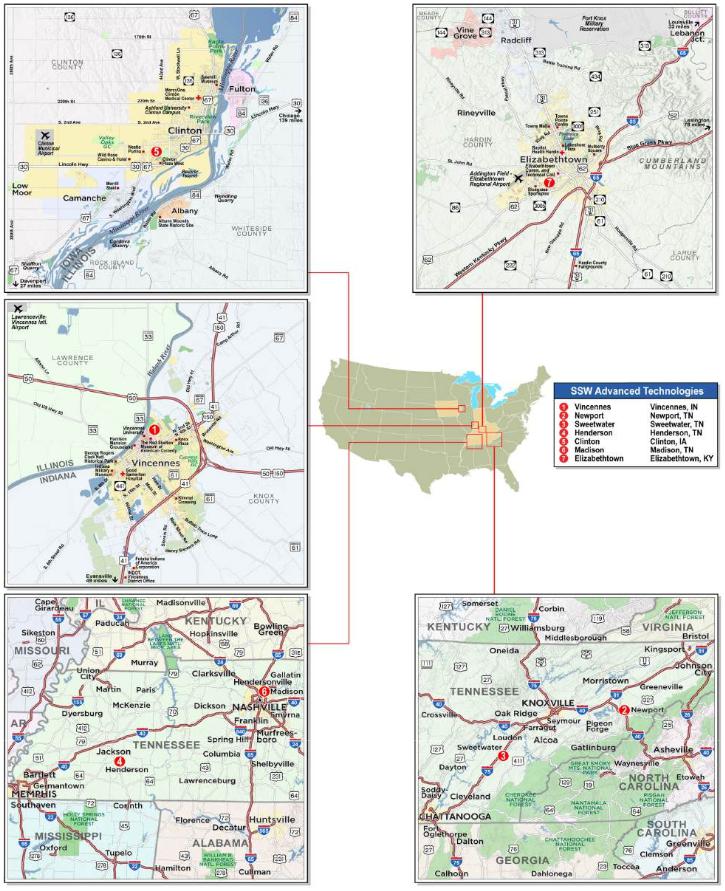
| THE INFORMATION IN THIS STRUCTURAL AND COLLATERAL TERM SHEET IS NOT COMPLETE AND MAY BE AMENDED PRIOR TO THE TIME OF SALE. THIS TERM SHEET IS NOT AN OFFER TO SELL THESE SECURITIES AND IT IS NOT A SOLICITATION OF AN OFFER TO BUY THESE SECURITIES IN ANY JURISDICTION WHERE THE OFFER OR SALE IS NOT PERMITTED. |
| | 114 | |
| No. 8 – SSW Advanced Technologies |
| |
| Mortgage Loan Information | | Mortgaged Property Information |
| Mortgage Loan Seller: | Wells Fargo Bank, National Association | | Single Asset/Portfolio: | Portfolio |
Credit Assessment (Fitch/KBRA/Moody’s): | NR/NR/NR | | Property Type – Subtype: | Industrial – Manufacturing |
| Original Principal Balance: | $55,100,000 | | Location: | Various – See Table |
| Cut-off Date Balance: | $55,100,000 | | Size: | 1,259,886 SF |
| % of Initial Pool Balance: | 5.1% | | Cut-off Date Balance Per SF: | $43.73 |
| Loan Purpose: | Acquisition | | Maturity Date Balance Per SF: | $41.58 |
| Borrower Sponsors: | Angelo, Gordon & Co., L.P. and TPG, Inc. | | Year Built/Renovated: | Various – See Table |
| Guarantors: | AG Net Lease IV Corp., AG Net Lease IV (Q) Corp. and AG Net Lease Realty Fund IV Investments (H-1), L.P. | | Title Vesting: | Fee |
| Mortgage Rate: | 7.1890% | | Property Manager: | Tenant-managed |
| Note Date: | February 23, 2024 | | Current Occupancy (As of): | 100.0% (6/1/2024) |
| Seasoning: | 3 months | | YE 2023 Occupancy(2): | NAV |
| Maturity Date: | March 11, 2034 | | YE 2022 Occupancy(2): | NAV |
| IO Period: | 60 months | | YE 2021 Occupancy(2): | NAV |
| Loan Term (Original): | 120 months | | YE 2020 Occupancy(2): | NAV |
| Amortization Term (Original): | 360 months | | As-Is Appraised Value: | $87,500,000 |
| Loan Amortization Type: | Interest Only, Amortizing Balloon | | As-Is Appraised Value Per SF: | $69.45 |
| Call Protection: | L(27),DorYM1(86),O(7) | | As-Is Appraisal Valuation Date(3): | Various |
| Lockbox Type: | Hard/Springing Cash Management | | | |
| Additional Debt: | None | | Underwriting and Financial Information |
| Additional Debt Type (Balance): | NAP | | TTM NOI(2): | NAV |
| | | | YE 2023 NOI(2): | NAV |
| | | | YE 2022 NOI(2): | NAV |
| | | | YE 2021 NOI(2): | NAV |
| | | | U/W Revenues: | $8,063,610 |
| | | | U/W Expenses: | $1,596,934 |
| | | U/W NOI: | $6,466,676 |
| | | | | | U/W NCF: | $6,055,208 |
| Escrows and Reserves(1) | | U/W DSCR based on NOI/NCF: | 1.44x / 1.35x |
| | Initial | Monthly | Cap | | U/W Debt Yield based on NOI/NCF: | 11.7% / 11.0% |
| Taxes | $0 | Springing | NAP | | U/W Debt Yield at Maturity based on NOI/NCF: | 12.3% / 11.6% |
| Insurance | $0 | Springing | NAP | | Cut-off Date LTV Ratio: | 63.0% |
| Replacement Reserve | $0 | Springing | NAP | | LTV Ratio at Maturity: | 59.9% |
| TI/LC | $0 | $0 | NAP | | | |
| | | | | | | | |
| Sources and Uses |
| Sources | | | | Uses | | |
| Loan Amount | $55,100,000 | 61.9% | | Purchase Price | $84,441,702 | 94.8% |
| Sponsor Equity | 33,974,213 | 38.1 | | Closing Costs | $4,632,511 | 5.2% |
| Total Sources | $89,074,213 | 100.0% | | Total Uses | $89,074,213 | 100.0% |
| (1) | See “Escrows and Reserves” section below. |
| (2) | Historical occupancy and historical operating history are not available, as the borrower sponsor recently acquired the SSW Advanced Technologies Properties (as defined below) in a sale-leaseback transaction, and leases were not previously in-place. |
| (3) | The appraisal valuation dates range from October 11, 2023 to December 29, 2023. |
The Mortgage Loan. The mortgage loan (the “SSW Advanced Technologies Mortgage Loan”) is secured by first priority fee interests in seven industrial properties totaling 1,259,886 square feet and located in Tennessee, Indiana, Iowa, and Kentucky (the “SSW Advanced Technologies Properties”).
The Borrower and Borrower Sponsors. The borrower is AGNL RACK, L.L.C. (the “SSW Advanced Technologies Borrower”), a Delaware limited liability company with one independent director. Legal counsel to the SSW Advanced Technologies Borrower delivered a non-consolidation opinion in connection with the origination of the SSW Advanced Technologies Mortgage Loan. The non-recourse carveout guarantors are AG Net Lease IV Corp., AG Net Lease IV (Q) Corp. and AG Net Lease Realty Fund IV Investments (H-1), L.P. Angelo, Gordon & Co., L.P. and TPG, Inc. are also borrower sponsors on the Baxters Industrial Portfolio Mortgage Loan and 147 North Main Street Mortgage Loan, which are both included in this pool.
The borrower sponsors are Angelo, Gordon & Co., LP (“Angelo Gordon”) and TPG, Inc. (“TPG”). In November 2023, Angelo Gordon was acquired by TPG, an alternative asset manager with approximately $222 billion in assets under management and 1,800 employees
| THE INFORMATION IN THIS STRUCTURAL AND COLLATERAL TERM SHEET IS NOT COMPLETE AND MAY BE AMENDED PRIOR TO THE TIME OF SALE. THIS TERM SHEET IS NOT AN OFFER TO SELL THESE SECURITIES AND IT IS NOT A SOLICITATION OF AN OFFER TO BUY THESE SECURITIES IN ANY JURISDICTION WHERE THE OFFER OR SALE IS NOT PERMITTED. |
| | 115 | |
| Industrial - Manufacturing | Loan #8 | Cut-off Date Balance: | | $55,100,000 |
Property Addresses - Various Various, Various | SSW Advanced Technologies | Cut-off Date LTV: U/W NCF DSCR: U/W NOI Debt Yield: | | 63.0% 1.35x 11.7% |
worldwide. Founded in 1988, Angelo Gordon is a diversified credit and real estate investing platform within TPG with approximately $78 billion in assets under management.
The Properties. The SSW Advanced Technologies Properties are comprised of seven one- and two-story, single-tenant, industrial buildings located in Tennessee (four properties, 47.1% of net rentable area), Indiana (one property, 31.4% of net rentable area), Iowa (one property, 13.4% of net rentable area), and Kentucky (one property, 8.1% of net rentable area). Built between 1900 and 1996, the properties range in size from 51,068 square feet to 395,871 square feet. Three properties were renovated between 2000 and 2015. Five of the seven properties contain surface parking ranging from 20 to 259 surface parking spaces with parking ratios ranging from 0.20 to 1.15 spaces per 1,000 square feet of rentable area. As of June 1, 2024, the SSW Advanced Technologies Properties were 100.0% leased to SSW Advanced Technologies under a master lease that runs through February 1, 2044, with two, 10-year and one, 7-year renewal options and no termination options.
The following table presents certain information relating to the SSW Advanced Technologies Properties:
Property Name Location | Year Built /
Renovated | Total NRA (SF) | Property Sub-
Type | Allocated Cut-Off Date Balance | Allocated Cut-Off Date Balance PSF | % of Total Balance | As-Is Appraised Value | Cut-off Date LTV Ratio | UW NCF | % Total UW NCF |
Vincennes 2000 Chestnut Street Vincennes, IN | 1930 / NAP | 395,871 | Manufacturing | $11,901,600 | $30.06 | 21.6% | $18,900,000 | 63.0% | $1,294,188 | 21.4% |
Newport 345 Chemwood Drive Newport, TN | 1968 / 2015 | 194,023 | Manufacturing | $10,453,257 | $53.88 | 19.0% | $16,600,000 | 63.0% | $1,180,017 | 19.5% |
Sweetwater 615 New Highway 68 Sweetwater, TN | 1973 / 2000 | 177,002 | Manufacturing | $9,634,629 | $54.43 | 17.5% | $15,300,000 | 63.0% | $1,080,506 | 17.8% |
Henderson 867 Premier Way Henderson, TN | 1996 / NAP | 170,843 | Manufacturing | $8,564,114 | $50.13 | 15.5% | $13,600,000 | 63.0% | $951,971 | 15.7% |
Clinton
2005 South 19th Street Clinton, IA | 1900 / 2015 | 169,018 | Manufacturing | $5,793,371 | $34.28 | 10.5% | $9,200,000 | 63.0% | $622,472 | 10.3% |
Madison
1129 Myatt Boulevard
Madison, TN | 1992 / NAP | 51,068 | Manufacturing | $5,289,600 | $103.58 | 9.6% | $8,400,000 | 63.0% | $537,772 | 8.9% |
Elizabethtown
1100 West Park Road
Elizabethtown, KY | 1978 / NAP | 102,061 | Manufacturing | $3,463,429 | $33.93 | 6.3% | $5,500,000 | 63.0% | $388,281 | 6.4% |
| Total/Weighted Average | | 1,259,886 | | $55,100,000 | $43.73 | 100.0% | $87,500,000 | 63.0% | $6,055,208 | 100.0% |
| THE INFORMATION IN THIS STRUCTURAL AND COLLATERAL TERM SHEET IS NOT COMPLETE AND MAY BE AMENDED PRIOR TO THE TIME OF SALE. THIS TERM SHEET IS NOT AN OFFER TO SELL THESE SECURITIES AND IT IS NOT A SOLICITATION OF AN OFFER TO BUY THESE SECURITIES IN ANY JURISDICTION WHERE THE OFFER OR SALE IS NOT PERMITTED. |
| | 116 | |
| Industrial - Manufacturing | Loan #8 | Cut-off Date Balance: | | $55,100,000 |
Property Addresses - Various Various, Various | SSW Advanced Technologies | Cut-off Date LTV: U/W NCF DSCR: U/W NOI Debt Yield: | | 63.0% 1.35x 11.7% |
Major Tenant.
Founded in 1946 and headquartered in Louisville, Kentucky, SSW Advanced Technologies (“SSW”) is a multinational supplier to the global appliance original equipment manufacturers. SSW designs and sells components and systems to the residential appliance industry (refrigeration, cooking, laundry), commercial refrigeration, HVAC, retail display and home/office organizational markets. SSW operates 15 manufacturing sites across the US, Mexico, and Canada, and has over 2,300 employees. As of June 1, 2024, the SSW Advanced Technologies Properties were 100.0% leased to SSW Advanced Technologies under a master lease that runs through February 1, 2044, with two, 10-year renewal options and one, seven year renewal option and no termination options. SSW is currently subleasing 166,721 SF (13.2% of portfolio net rentable area) at the Vincennes property (31.4% of net rentable area; 21.6% allocated loan amount) to SCHOTT North America, Inc. (“SCHOTT”) on a sublease expiring December 31, 2026. SCHOTT has been a sub-tenant at the property since 1991 and is currently paying a rental rate of $3.84 PSF.
Major Tenant(1)
| Tenant Name (Property) | Credit Rating (Fitch/ Moody’s/
S&P) | Tenant NRSF | % of
NRSF | Annual U/W Base Rent PSF(2) | Annual
U/W Base Rent(2) | % of Total Annual U/W Base Rent | Lease
Expiration
Date | Extension Options | Termination Option (Y/N) |
| Major Tenants | | | | | | | | | |
| SSW Advanced Technologies(3) | NR/NR/NR | 1,259,886 | 100.0% | $5.47 | $6,891,076 | 100.0% | 2/1/2044 | 2, 10-year; 1, 7-year | N |
| Occupied Collateral Total | | 1,259,886 | 100.0% | $5.47 | $6,891,076 | 100.0% | | | |
| | | | | | | | | | |
| Vacant Space | | 0 | 0.0% | | | | | | |
| | | | | | | | | | |
| Collateral Total | | 1,259,886 | 100.0% | | | | | | |
| | | | | | | | | | |
| (1) | Information is based on the underwritten rent roll. |
| (2) | The Annual U/W Base Rent and Annual U/W Base Rent PSF shown above include contractual rent steps through March 2025 totalling $168,075. |
| (3) | SSW is currently subleasing 166,721 SF (13.2% of portfolio net rentable area) at the Vincennes property (31.4% of net rentable area; 21.6% allocated loan amount) to SCHOTT on a sublease expiring December 31, 2026 at a rental rate of $3.84 PSF. |
| THE INFORMATION IN THIS STRUCTURAL AND COLLATERAL TERM SHEET IS NOT COMPLETE AND MAY BE AMENDED PRIOR TO THE TIME OF SALE. THIS TERM SHEET IS NOT AN OFFER TO SELL THESE SECURITIES AND IT IS NOT A SOLICITATION OF AN OFFER TO BUY THESE SECURITIES IN ANY JURISDICTION WHERE THE OFFER OR SALE IS NOT PERMITTED. |
| | 117 | |
| Industrial - Manufacturing | Loan #8 | Cut-off Date Balance: | | $55,100,000 |
Property Addresses - Various Various, Various | SSW Advanced Technologies | Cut-off Date LTV: U/W NCF DSCR: U/W NOI Debt Yield: | | 63.0% 1.35x 11.7% |
The following table presents certain information relating to the lease rollover schedule at the SSW Advanced Technologies Properties:
Lease Expiration Schedule(1)
Year Ending
December 31, | No. of Leases Expiring | Expiring NRSF | % of Total NRSF | Cumulative Expiring NRSF | Cumulative % of Total NRSF | Annual
U/W
Base Rent | % of Total Annual U/W Base Rent | Annual
U/W
Base Rent
PSF |
| MTM | 0 | 0 | 0.0% | 0 | 0.0% | $0 | 0.0% | $0.00 |
| 2024 | 0 | 0 | 0.0% | 0 | 0.0% | $0 | 0.0% | $0.00 |
| 2025 | 0 | 0 | 0.0% | 0 | 0.0% | $0 | 0.0% | $0.00 |
| 2026 | 0 | 0 | 0.0% | 0 | 0.0% | $0 | 0.0% | $0.00 |
| 2027 | 0 | 0 | 0.0% | 0 | 0.0% | $0 | 0.0% | $0.00 |
| 2028 | 0 | 0 | 0.0% | 0 | 0.0% | $0 | 0.0% | $0.00 |
| 2029 | 0 | 0 | 0.0% | 0 | 0.0% | $0 | 0.0% | $0.00 |
| 2030 | 0 | 0 | 0.0% | 0 | 0.0% | $0 | 0.0% | $0.00 |
| 2031 | 0 | 0 | 0.0% | 0 | 0.0% | $0 | 0.0% | $0.00 |
| 2032 | 0 | 0 | 0.0% | 0 | 0.0% | $0 | 0.0% | $0.00 |
| 2033 | 0 | 0 | 0.0% | 0 | 0.0% | $0 | 0.0% | $0.00 |
| 2034 | 0 | 0 | 0.0% | 0 | 0.0% | $0 | 0.0% | $0.00 |
| Thereafter | 7 | 1,259,886 | 100.0% | 1,259,886 | 100.0% | $6,891,076 | 100.0% | $5.47 |
| Vacant | 0 | 0 | 0.0% | 1,259,886 | 100.0% | $0 | 0.0% | $0.00 |
| Total/Weighted Average | 7 | 1,259,886 | 100.0% | | | $6,891,076 | 100.0% | $5.47 |
| (1) | Information obtained from underwritten rent roll as of June 1, 2024. |
The following table presents historical occupancy percentages at the SSW Advanced Technologies Properties:
Historical Occupancy
12/31/2020(1) | 12/31/2021(1) | 12/31/2022(1) | 12/31/2023(1) | 6/1/2024(2) |
| NAV | NAV | NAV | NAV | 100.0% |
| (1) | Historical occupancy and historical operating history are not available, as the borrower sponsor recently acquired the SSW Advanced Technologies Properties in a sale-leaseback transaction, and leases were not previously in-place. |
| (2) | Information obtained from the underwritten rent roll dated June 1, 2024. |
| THE INFORMATION IN THIS STRUCTURAL AND COLLATERAL TERM SHEET IS NOT COMPLETE AND MAY BE AMENDED PRIOR TO THE TIME OF SALE. THIS TERM SHEET IS NOT AN OFFER TO SELL THESE SECURITIES AND IT IS NOT A SOLICITATION OF AN OFFER TO BUY THESE SECURITIES IN ANY JURISDICTION WHERE THE OFFER OR SALE IS NOT PERMITTED. |
| | 118 | |
| Industrial - Manufacturing | Loan #8 | Cut-off Date Balance: | | $55,100,000 |
Property Addresses - Various Various, Various | SSW Advanced Technologies | Cut-off Date LTV: U/W NCF DSCR: U/W NOI Debt Yield: | | 63.0% 1.35x 11.7% |
Operating History and Underwritten Net Cash Flow. The following table presents certain information relating to the underwritten net cash flow of the SSW Advanced Technologies Properties:
Cash Flow Analysis(1)
| | U/W | %(2) | U/W $ per SF |
| Base Rent | $6,891,076(3) | 82.0% | $5.47 |
| Grossed Up Vacant Space | 0 | 0.0 | 0.00 |
| Gross Potential Rent | $6,891,076 | 82.0% | $5.47 |
| Total Recoveries | 1,517,088 | 18.0 | 1.20 |
| Net Rental Income | $8,408,164 | 100.0% | $6.67 |
| (Vacancy & Credit Loss) | (344,554) | (5.0)(4) | (0.27) |
| Effective Gross Income | $8,063,610 | 95.9% | $6.40 |
| Real Estates Taxes | 429,361 | 5.3 | 0.34 |
| Insurances | 189,031 | 2.3 | 0.15 |
| Management Fee | 241,908 | 3.0 | 0.19 |
| Other Operating Expenses | 736,634 | 9.1 | 0.58 |
| Total Operating Expenses | $1,596,934 | 19.8% | $1.27 |
| | | | |
| Net Operating Income | $ 6,466,676 | 80.2% | $5.13 |
| Replacement Reserves | 246,951 | 3.1 | 0.20 |
| TI/LC | 164,517 | 2.0 | 0.13 |
| Net Cash Flow | $6,055,208 | 75.1% | $4.81 |
| | | | |
| NOI DSCR | 1.44x | | |
| NCF DSCR | 1.35x | | |
| NOI Debt Yield | 11.7% | | |
| NCF Debt Yield | 11.0% | | |
| | | | |
| | | | |
| | | | |
| (1) | Historical operating history is not available, as the borrower sponsor recently acquired the properties in a sale-leaseback transaction, and leases were not previously in-place. |
| (2) | Represents (i) percent of Net Rental Income for all revenue fields, (ii) percent of Base Rent for Vacancy & Credit Loss and (iii) percent of Effective Gross Income for all other fields. |
| (3) | UW Base Rent includes contractual rent steps through March 2025 totalling $168,075. |
| (4) | The underwritten economic vacancy is 5.0%. The SSW Advanced Technologies Properties were 100.0% leased as of June 1, 2024. |
Appraisal. The aggregate of the appraiser’s “as-is” appraised values for the SSW Advanced Technologies Properties is $87,500,000. The valuation dates range from October 11, 2023, to December 29, 2023.
Environmental Matters. According to the Phase I environmental site assessments of each individual property, with dates ranging from October 3, 2023, to December 20, 2023, there are recognized environmental conditions at the Vincennes property, the Newport property, the Sweetwater property, the Henderson property, the Clinton property and the Elizabethtown property. The consultant provided a worst-case estimate with a statistical 90% confidence interval that the total cost for potential remediation had an upper-end range of $2,865,000. In lieu of Phase II environmental site assessments, the borrower obtained a $15,000,000 environmental insurance policy, that covers all the SSW Advanced Technologies Properties, with a $15,000,000 limit per claim on a 13-year term, which includes a $25,000 deductible per claim. See “Description of the Mortgage Pool – Environmental Considerations” in the Preliminary Prospectus.
Market Overview and Competition. The SSW Advanced Technologies Properties are located across four states: Tennessee (four properties, 47.1% of net rentable area), Indiana (one property, 31.4% of net rentable area), Iowa (one property, 13.4% of net rentable area), and Kentucky (one property, 8.1% of net rentable area). According to the appraisals, the SSW Advanced Technologies Properties are located in seven separate submarkets with an average vacancy of 1.94%.
| THE INFORMATION IN THIS STRUCTURAL AND COLLATERAL TERM SHEET IS NOT COMPLETE AND MAY BE AMENDED PRIOR TO THE TIME OF SALE. THIS TERM SHEET IS NOT AN OFFER TO SELL THESE SECURITIES AND IT IS NOT A SOLICITATION OF AN OFFER TO BUY THESE SECURITIES IN ANY JURISDICTION WHERE THE OFFER OR SALE IS NOT PERMITTED. |
| | 119 | |
| Industrial - Manufacturing | Loan #8 | Cut-off Date Balance: | | $55,100,000 |
Property Addresses - Various Various, Various | SSW Advanced Technologies | Cut-off Date LTV: U/W NCF DSCR: U/W NOI Debt Yield: | | 63.0% 1.35x 11.7% |
The following table presents certain local demographic data according to the appraisals related to the SSW Advanced Technologies Properties:
| Property Name – Location | 2023 Population
(within 1-mi. / 3-mi. / 5-mi. Radius) | 2023 Average Household Income
(within 1-mi. / 3-mi. / 5-mi. Radius) |
| Vincennes - 2000 Chestnut Street, Vincennes, IN | 4,228 / 19,473 / 22,749 | $42,338 / $76,521 / $80,286 |
| Newport - 345 Chemwood Drive, Newport, TN | 1,083 / 10,174 / 18,889 | $44,119 / $46,504 / $54,451 |
| Sweetwater - 615 New Highway 68, Sweetwater, TN | 1,494 / 8,127 / 13,696 | $63,323 / $64,330 / $67,465 |
| Henderson - 867 Premier Way, Henderson, TN | 1,097 / 7,488 / 10,782 | $69,967 / $61,848 / $67,501 |
| Clinton - 2005 South 19th Street, Clinton, IA | 3,368 / 20,173 / 33,213 | $77,097 / $69,823 / $74,248 |
| Madison - 1129 Myatt Boulevard, Madison, TN | 3,853 / 50,996 / 117,335 | $64,680 / $70,473 / $83,960 |
| Elizabethtown - 1100 West Park Road, Elizabethtown, KY | 2,696 / 23,179 / 43,895 | $76,207 / $82,718 / $86,543 |
The following table presents certain information relating to the appraiser’s market rent conclusion for the SSW Advanced Technologies Properties:
Market Rent Summary(1)
| Property Name | Market Rent (PSF) | Lease Term (Years) | Concessions (New / Renewal) | Lease Type (Reim- bursements) | Rent Increase Projection | Tenant Improvements (New Tenants) (PSF) | Tenant Improvements (Renewals) (PSF) |
| Vincennes | $3.25 | 5.0 | 3 mos. / 1 mos. | NNN | 2.5% | $1.50 | $0.25 |
| Newport | $5.50 | 10 | 0 mos. / 0 mos. | NNN | 2.5% | $1.00 | $0.00 |
| Sweetwater | $5.50 | 10 | 0 mos. / 0 mos. | NNN | 2.5% | $1.00 | $0.00 |
| Henderson | $5.00 | 10 | 1 mos. / 0 mos. | NNN | 3.0% | $1.00 | $0.00 |
| Clinton | $3.75 | 10 | 0 mos. / 0 mos. | Absolute Net | 2.5% | $1.00 | $0.00 |
| Madison | $9.50 | 10 | 1 mos. / 0 mos. | NNN | 3.0% | $5.00 | $1.00 |
| Elizabethtown | $3.75 | 10 | 0 mos. / 0 mos. | NNN | 2.5% | $3.00 | $0.00 |
| (1) | Information obtained from the appraisals. |
Escrows.
Real Estate Taxes – Ongoing monthly reserves for real estate taxes are not required as long as (A)(i) no event of default is continuing; (ii) the Major Tenant (as defined below) lease is in full force and effect; (iii) the Major Tenant is required under the Major Tenant lease to pay all taxes directly to the appropriate governmental taxing authority and (iv) the Major Tenant pays all taxes with respect to the SSW Advanced Technologies Properties directly to the applicable governmental taxing authority and the borrower delivers evidence to lender prior to the applicable delinquency date, or (B)(i) no event of default is continuing and (ii) the borrower pays all taxes to the appropriate governmental authority and provides evidence to the lender prior to the applicable delinquency date.
Insurance – Ongoing monthly reserves for insurance are not required as long as (A)(i) no event of default is continuing; (ii) the policies maintained by the borrower are part of a blanket or umbrella policy approved by the lender and (iii) the borrower provides the lender with paid receipts for the payment of the insurance premiums by no later than 10 business days prior to the expiration dates; or (B)(i) the Major Tenant lease is in full force and effect; (ii) no event of default is continuing; (iii) the Major Tenant maintains all policies in full force and effect; and (iv) the lender receives evidence reasonably satisfactory to the lender that the Major Tenant has timely paid any and all insurance premiums on all such insurance together with evidence of renewals of such insurance policies.
Replacement Reserves – The loan documents require ongoing monthly replacement reserve deposits of $20,579 ($0.20 PSF per year) and are not required as long as (A) (i) no Cash Trap Event Period (as defined below) exists and (ii) the Major Tenant is required pursuant to the terms of the Major Tenant lease, to pay and perform, at its sole cost and expense, the obligations and liabilities for which the replacement reserve subaccount was established; or (B) to the extent that a Cash Trap Event Period has occurred and is continuing, and the SSW Advanced Technologies Borrower or Major Tenant is maintaining the applicable SSW Advanced Technologies Property in accordance with the terms and provisions of the Major Tenant lease.
| THE INFORMATION IN THIS STRUCTURAL AND COLLATERAL TERM SHEET IS NOT COMPLETE AND MAY BE AMENDED PRIOR TO THE TIME OF SALE. THIS TERM SHEET IS NOT AN OFFER TO SELL THESE SECURITIES AND IT IS NOT A SOLICITATION OF AN OFFER TO BUY THESE SECURITIES IN ANY JURISDICTION WHERE THE OFFER OR SALE IS NOT PERMITTED. |
| | 120 | |
| Industrial - Manufacturing | Loan #8 | Cut-off Date Balance: | | $55,100,000 |
Property Addresses - Various Various, Various | SSW Advanced Technologies | Cut-off Date LTV: U/W NCF DSCR: U/W NOI Debt Yield: | | 63.0% 1.35x 11.7% |
Lockbox and Cash Management. The SSW Advanced Technologies Mortgage Loan is structured with a hard lockbox and springing cash management. The SSW Advanced Technologies Borrower is required to direct the tenant to pay rent directly into a deposit account, and to deposit any rents otherwise received in such account within two business day after receipt. If no Cash Trap Event Period exists, all excess cash flow will be disbursed to, or at the written direction, of the SSW Advanced Technologies Borrower. During the continuance of a Cash Trap Event Period, all funds in the cash management account will be applied according to the cash management agreement, and excess cash flow will be held by the lender as additional collateral.
A “Cash Trap Event Period” will commence upon the earliest of the following:
| (i) | the occurrence and continuance of an event of default; |
| (ii) | if SSW or any replacement tenant (a “Major Tenant”) is in default under its lease for failure to be in physical possession of or abandoning the SSW Advanced Technologies Property; |
| (iii) | a Major Tenant files for bankruptcy or similar insolvency proceedings; |
| (iv) | a Major Tenant lease is terminated as a result of default beyond any applicable notice and cure period; or |
| (v) | the net cash flow debt service coverage ratio (“NCF DSCR”) is less than 1.20x for two consecutive calendar quarters. |
A Cash Trap Event Period will end upon the occurrence of the following:
| ● | with regard to clause (i), above, upon the cure of such event of default; |
| ● | with regard to clauses (ii)-(iv), above, the borrower has entered into an acceptable replacement lease, |
| ● | with regard to clause (ii), above, upon (a) the event of default under the Major Tenant lease as described above is cured, (b) the date upon which the balance of the funds in the excess cash flow subaccount is equal to two years of underwritten base rent and recoveries with respect to the applicable property, or (c) the date upon which the borrower deposits a Major Tenant Cash Trap L/C (as defined below), which will be renewed annually for so long as a Cash Trap Event Period caused solely by clause (ii) above is continuing; |
| ● | with regard to clause (iii), above, upon (a) the date the Major Tenant emerges from bankruptcy or cures its insolvency, or (b) the Major Tenant lease is affirmed, assumed or assigned pursuant to an order from the bankruptcy court; |
| ● | with regard to clause (iv), above, upon the date the borrower has cured the underlying default(s) under the Major Tenant lease and SSW Advanced Technologies Borrower has revoked in writing the termination of the Major Tenant lease; |
| ● | with regard to clause (v), above, upon the NCF DSCR is being at least 1.20x for two consecutive calendar quarters. |
A “Major Tenant Cash Trap L/C” means a letter of credit in an amount equal to 12 months of forward looking rent and recoveries for the applicable individual property in lieu of a Cash Trap Event Period triggered by clause (ii) above.
Partial Release. Provided no event of default has occurred or is continuing, the SSW Advanced Technologies Borrower has the right, at any time after the lockout release date, to sell one or more of the SSW Advanced Technologies Properties to a bona fide third party purchaser, provided that certain conditions are satisfied, including, but not limited to, the following:
| (i) | payment of 110% of the allocated loan amount to such property and any associated prepayment fees or such greater amounts may be required to maintain compliance with REMIC requirements; |
| (ii) | the loan-to-value ratio of the remaining properties is no greater than the lesser of (a) the loan-to-value ratio as of February 23, 2024 (63.0%) and (b) the loan-to-value ratio immediately prior to the release; |
| (iii) | the NCF DSCR immediately following the release is at least equal to the greater of (a) the net cash flow debt service coverage ratio as of February 23, 2024 (1.35x) and (b) the net cash flow debt service coverage ratio immediately prior to the release; and |
| (iv) | the net cash flow debt yield immediately following the release is no less than the greater of (a) the net cash flow debt yield as of February 23, 2024 (11.0%) and (b) the net cash flow debt yield immediately prior to the release. |
Property Management. The SSW Advanced Technologies Properties are self-managed by the tenants.
Real Estate Substitution. Not permitted.
Subordinate and Mezzanine Indebtedness. Provided no event of default is continuing, the SSW Advanced Technologies Borrower may obtain future mezzanine debt upon satisfaction of certain conditions defined in the loan agreement, including, but not limited to: (i) the LTV ratio including the future mezzanine loan is not greater than 65.0%; (ii) the adjusted net cash flow DSCR, inclusive of the future mezzanine loan is no less than 1.30x, and the combined DSCR using 10% loan constant must not be less than 1.10x; (iii) the SSW Advanced Technologies Mortgage Loan and the mezzanine financing must be co-terminus, (iv) the mezzanine lender must execute an intercreditor agreement acceptable to the rating agencies and reasonably acceptable to the lender, (v) if requested by lender, mortgage borrower executes any documents, amendments or opinions reasonably requested by lender (including, any amendment required to implement hard cash management), reasonably satisfactory to lender, (vi) if expressly required in writing by the lender, a rating agency confirmation from each of the rating agencies, and (vii) the terms and documentation of the mezzanine financing must be reasonably acceptable to the lender.
Ground Lease. None.
| THE INFORMATION IN THIS STRUCTURAL AND COLLATERAL TERM SHEET IS NOT COMPLETE AND MAY BE AMENDED PRIOR TO THE TIME OF SALE. THIS TERM SHEET IS NOT AN OFFER TO SELL THESE SECURITIES AND IT IS NOT A SOLICITATION OF AN OFFER TO BUY THESE SECURITIES IN ANY JURISDICTION WHERE THE OFFER OR SALE IS NOT PERMITTED. |
| | 121 | |
| Industrial - Manufacturing | Loan #8 | Cut-off Date Balance: | | $55,100,000 |
Property Addresses - Various Various, Various | SSW Advanced Technologies | Cut-off Date LTV: U/W NCF DSCR: U/W NOI Debt Yield: | | 63.0% 1.35x 11.7% |
Terrorism Insurance. The SSW Advanced Technologies Mortgage Loan documents require that the “all risk” insurance policy required to be maintained by the SSW Advanced Technologies Borrower provides coverage for terrorism in an amount equal to the full replacement cost of the SSW Advanced Technologies Properties, as well as business interruption insurance covering no less than the 18-month period (if an individual property is insured on a blanket policy) following the occurrence of a casualty event (or a 12-month period if an individual property is insured on a dedicated policy), together with a 6-month extended period of indemnity (provided that if TRIPRA or a similar statute is not in effect, the borrowers will not be obligated to pay terrorism insurance premiums in excess of two times the annual premium for the casualty and business interruption coverage (without giving effect to the cost of terrorism, flood and earthquake and business interruption components of such coverage)). See “Risk Factors—Risks Relating to the Mortgage Loans—Terrorism Insurance May Not Be Available for All Mortgaged Properties” in the Preliminary Prospectus.
| THE INFORMATION IN THIS STRUCTURAL AND COLLATERAL TERM SHEET IS NOT COMPLETE AND MAY BE AMENDED PRIOR TO THE TIME OF SALE. THIS TERM SHEET IS NOT AN OFFER TO SELL THESE SECURITIES AND IT IS NOT A SOLICITATION OF AN OFFER TO BUY THESE SECURITIES IN ANY JURISDICTION WHERE THE OFFER OR SALE IS NOT PERMITTED. |
| | 122 | |
| Retail – Anchored | Loan #9 | Cut-off Date Balance: | | $41,000,000 |
| 507-749 and 801-975 North Academy Boulevard | Citadel Crossing - Colorado Springs | Cut-off Date LTV: | | 61.1% |
| Colorado Springs, CO 80909 | | UW NCF DSCR: | | 1.33x |
| | | UW NOI Debt Yield: | | 11.1% |

| THE INFORMATION IN THIS STRUCTURAL AND COLLATERAL TERM SHEET IS NOT COMPLETE AND MAY BE AMENDED PRIOR TO THE TIME OF SALE. THIS TERM SHEET IS NOT AN OFFER TO SELL THESE SECURITIES AND IT IS NOT A SOLICITATION OF AN OFFER TO BUY THESE SECURITIES IN ANY JURISDICTION WHERE THE OFFER OR SALE IS NOT PERMITTED. |
| | 123 | |
| Retail – Anchored | Loan #9 | Cut-off Date Balance: | | $41,000,000 |
| 507-749 and 801-975 North Academy Boulevard | Citadel Crossing - Colorado Springs | Cut-off Date LTV: | | 61.1% |
| Colorado Springs, CO 80909 | | UW NCF DSCR: | | 1.33x |
| | | UW NOI Debt Yield: | | 11.1% |
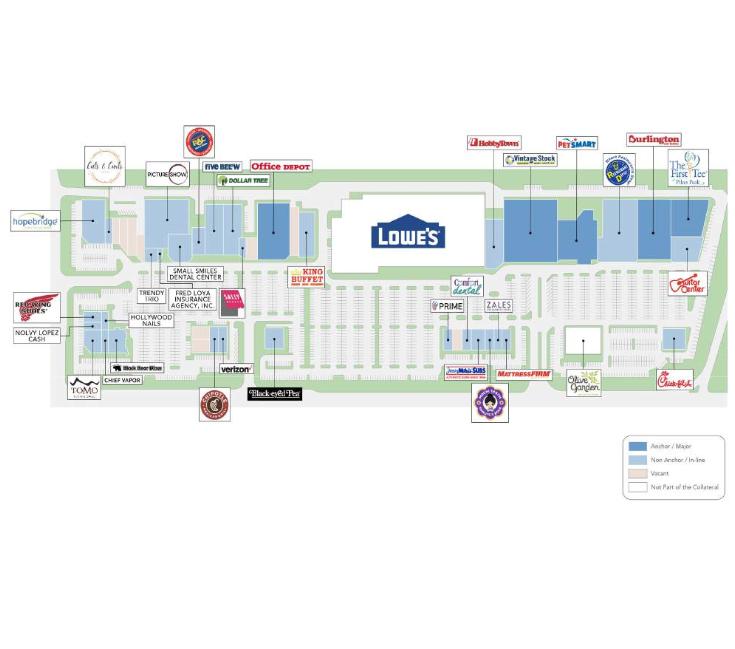
| THE INFORMATION IN THIS STRUCTURAL AND COLLATERAL TERM SHEET IS NOT COMPLETE AND MAY BE AMENDED PRIOR TO THE TIME OF SALE. THIS TERM SHEET IS NOT AN OFFER TO SELL THESE SECURITIES AND IT IS NOT A SOLICITATION OF AN OFFER TO BUY THESE SECURITIES IN ANY JURISDICTION WHERE THE OFFER OR SALE IS NOT PERMITTED. |
| | 124 | |
| Retail – Anchored | Loan #9 | Cut-off Date Balance: | | $41,000,000 |
| 507-749 and 801-975 North Academy Boulevard | Citadel Crossing - Colorado Springs | Cut-off Date LTV: | | 61.1% |
| Colorado Springs, CO 80909 | | UW NCF DSCR: | | 1.33x |
| | | UW NOI Debt Yield: | | 11.1% |
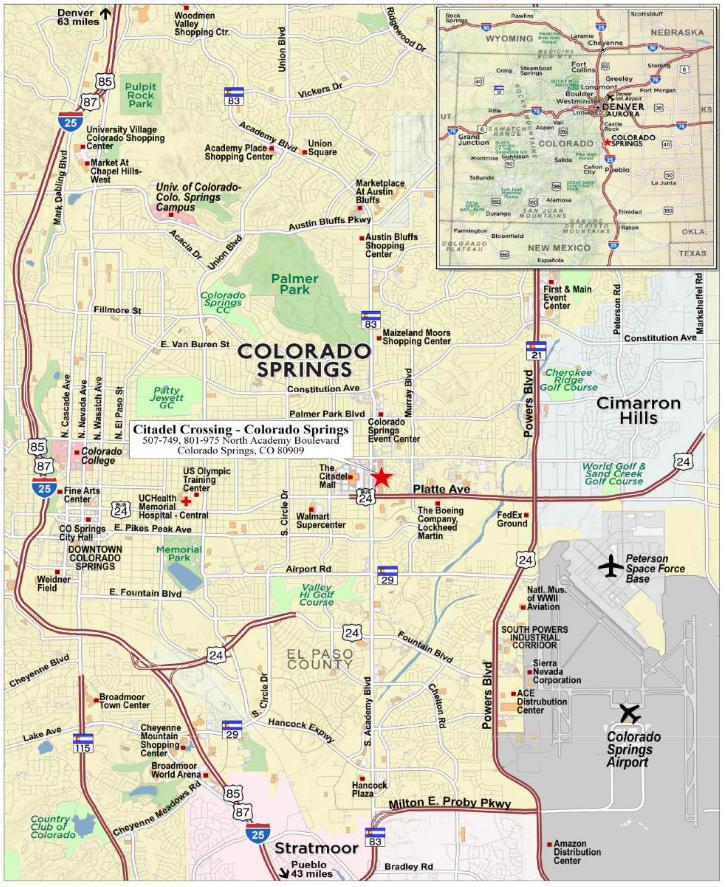
| THE INFORMATION IN THIS STRUCTURAL AND COLLATERAL TERM SHEET IS NOT COMPLETE AND MAY BE AMENDED PRIOR TO THE TIME OF SALE. THIS TERM SHEET IS NOT AN OFFER TO SELL THESE SECURITIES AND IT IS NOT A SOLICITATION OF AN OFFER TO BUY THESE SECURITIES IN ANY JURISDICTION WHERE THE OFFER OR SALE IS NOT PERMITTED. |
| | 125 | |
| No. 9 – Citadel Crossing - Colorado Springs |
| |
| Mortgage Loan Information | | Mortgaged Property Information |
| Mortgage Loan Sellers: | Citi Real Estate Funding Inc. | | Single Asset/Portfolio: | Single Asset |
Credit Assessment (Fitch/KBRA/Moody’s): | NR/NR/NR | | Property Type – Subtype: | Retail – Anchored |
| Original Principal Balance: | $41,000,000 | | Location: | Colorado Springs, CO |
| Cut-off Date Balance: | $41,000,000 | | Size: | 356,912 SF |
| % of Initial Pool Balance: | 3.8% | | Cut-off Date Balance Per SF: | $114.87 |
| Loan Purpose: | Refinance | | Maturity Date Balance Per SF: | $114.87 |
| Borrower Sponsors: | Patrick M. Nesbitt and Patrick Nesbitt, as Trustee of the Patrick M. Nesbitt Family Trust | | Year Built/Renovated: | 1988/NAP |
| Guarantors: | Patrick M. Nesbitt and Patrick Nesbitt, as Trustee of the Patrick M. Nesbitt Family Trust | | Title Vesting: | Fee |
| Mortgage Rate: | 8.1300% | | Property Manager: | NewMark Merrill Mountain States, LLC |
| Note Date: | May 24, 2024 | | Current Occupancy (As of): | 92.2% (5/1/2024) |
| Seasoning: | 0 months | | YE 2023 Occupancy: | 88.4% |
| Maturity Date: | June 6, 2029 | | YE 2022 Occupancy(2): | 90.4% |
| IO Period: | 60 months | | YE 2021 Occupancy(2): | 69.4% |
| Loan Term (Original): | 60 months | | As-Stabilized Appraised Value(3): | $67,100,000 |
| Amortization Term (Original): | NAP | | As-Stabilized Appraised Value Per SF(3): | $188.00 |
| Loan Amortization Type: | Interest Only | | As-Stabilized Appraisal Valuation Date(3): | May 2, 2025 |
| Call Protection: | L(24),D(32),O(4) | | | |
| Lockbox Type: | Hard/Springing Cash Management | | Underwriting and Financial Information |
| Additional Debt: | None | | TTM 3/31/2024 NOI: | $4,231,054 |
| Additional Debt Type (Balance): | NAP | | YE 2023 NOI: | $4,292,150 |
| | | YE 2022 NOI: | $3,685,249 |
| | | | YE 2021 NOI: | $3,044,356 |
| | | | U/W Revenues: | $5,971,897 |
| | | | U/W Expenses: | $1,402,436 |
| Escrows and Reserves(1) | | U/W NOI: | $4,569,461 |
| | Initial | Monthly | Cap | | U/W NCF: | $4,503,847 |
| Taxes | $25,901 | $25,901 | NAP | | U/W DSCR based on NOI/NCF: | 1.35x / 1.33x |
| Insurance | $0 | Springing | NAP | | U/W Debt Yield based on NOI/NCF: | 11.1% / 11.0% |
| Replacement Reserve | $0 | $5,468 | NAP | | U/W Debt Yield at Maturity based on NOI/NCF: | 11.1% / 11.0% |
| TI/LC Reserve | $1,500,000 | Springing | $1,500,000 | | Cut-off Date LTV Ratio(3): | 61.1% |
| Immediate Repairs | $1,191,118 | $0 | NAP | | LTV Ratio at Maturity(3): | 61.1% |
| Unfunded Obligations Reserve | $3,530,637 | $0 | NAP | | | |
| | | | | | | |
| | | | | | | | |
| Sources and Uses |
| Sources | | | | Uses | | |
| Loan amount | $41,000,000 | 100.0% | | Loan Payoff | $27,297,083 | 66.6 | % |
| | | | | Upfront Reserves | 6,247,656 | 15.2 | |
| | | | | Return of Equity | 4,942,339 | 12.1 | |
| | | | | Closing Costs | 2,512,922 | 6.1 | |
| Total Sources | $41,000,000 | 100.0% | | Total Uses | $41,000,000 | 100.0 | % |
| (2) | The increase in occupancy from YE 2021 Occupancy to YE 2022 Occupancy is primarily attributable to new leases executed with Restaurant Depot and Five Below in 2022. |
| (3) | The appraiser concluded to an “As-Stabilized” value of $67,100,000 as of May 2, 2025. The “As-Stabilized” value assumes that Burlington Coat Factory has taken occupancy at the Citadel Crossing – Colorado Springs Property (as defined below). Burlington Coat Factory has executed a lease for 24,124 square feet which commences in July 2024. The appraiser also concluded to an “As is” value of $62,300,000 as of May 2, 2024. The Cut-off Date LTV Ratio and the Maturity Date LTV Ratio based on the “As is” value are each 65.8%. At origination of the Citadel Crossing – Colorado Springs Mortgage Loan (as defined below), $3,530,637 was reserved in an unfunded obligations reserve, of which $2,934,051 was reserved for tenant improvements, landlord work and gap rent associated with the Burlington Coat Factory lease. |
The Mortgage Loan. The ninth largest mortgage loan (the “Citadel Crossing – Colorado Springs Mortgage Loan”) is evidenced by a promissory note with an original principal balance of $41,000,000. The Citadel Crossing – Colorado Springs Mortgage Loan is
| THE INFORMATION IN THIS STRUCTURAL AND COLLATERAL TERM SHEET IS NOT COMPLETE AND MAY BE AMENDED PRIOR TO THE TIME OF SALE. THIS TERM SHEET IS NOT AN OFFER TO SELL THESE SECURITIES AND IT IS NOT A SOLICITATION OF AN OFFER TO BUY THESE SECURITIES IN ANY JURISDICTION WHERE THE OFFER OR SALE IS NOT PERMITTED. |
| | 126 | |
| Retail – Anchored | Loan #9 | Cut-off Date Balance: | | $41,000,000 |
| 507-749 and 801-975 North Academy Boulevard | Citadel Crossing - Colorado Springs | Cut-off Date LTV: | | 61.1% |
| Colorado Springs, CO 80909 | | UW NCF DSCR: | | 1.33x |
| | | UW NOI Debt Yield: | | 11.1% |
secured by a first priority fee mortgage encumbering a 356,912 square foot anchored retail center located in Colorado Springs, Colorado (the “Citadel Crossing – Colorado Springs Property”).
The Borrower and the Borrower Sponsor. The borrower is Citadel Crossing Associates LLC, a Delaware limited liability company and single purpose entity with one independent director. The borrower sponsors and non-recourse carveout guarantors are Patrick M. Nesbitt and Patrick Nesbitt, as Trustee of the Patrick M. Nesbitt Family Trust. Patrick M. Nesbitt is the chairman, CEO and founder of Windsor Capital Group. Windsor Capital Group is a real estate investment firm based out of Santa Monica, California that owns and operates hospitality and retail properties across the United States.
The Property. The Citadel Crossing - Colorado Springs Property is an anchored retail center in Colorado Springs, Colorado totaling 356,912 square feet. The Citadel Crossing - Colorado Springs Property is comprised of a seven-building shopping center that was originally constructed in 1988 and is situated on an approximately 31.7-acre site. The center features anchor spaces, inline spaces, a movie theatre and a freestanding restaurant. The Citadel Crossing – Colorado Springs Property is physically divided by a Lowe’s that is tenant owned and serves as a shadow anchor to the Citadel Crossing – Colorado Springs Property. The Citadel Crossing - Colorado Springs Property shares 1,429 parking spaces with Lowe’s resulting in a parking ratio of approximately 4.00 spaces per 1,000 square feet.
The Citadel Crossing - Colorado Springs Property benefits from primary street frontage along Academy Boulevard which is one of the primary retail thoroughfares in Colorado Springs with significant traffic counts, including 42,000 to 45,000 cars per day. The Citadel Crossing – Colorado Springs Property has additional frontage along East Platte Avenue (41,000 cars per day) and Galley Road (20,000 cars per day).
As of May 1, 2024, the Citadel Crossing - Colorado Springs Property was 92.2% leased to a granular rent roll of 35 tenants, including both national and local retailers. As of the cut-off date, the tenants at the Citadel Crossing – Colorado Springs Property had been in occupancy for a weighted average term of 15.2 years with 49.0% of net rentable area having been leased for at least 15 years.
Major Tenants.
Vintage Stock (45,900 square feet, 12.9% of net rentable area, 8.2% of underwritten base rent). Founded in 1980, Vintage Stock is an entertainment retailer with 72 retail locations located across 12 states. Vintage Stock offers a large selection of music, video games, collectibles, cards and books in store and offers services including movie and video game rental and disc repair services. Vintage Stock was acquired by Live Ventures Incorporated (NASDAQ: LIVE) in 2016 and has been at the Citadel Crossing - Colorado Springs Property since May 2006 under a lease expiring in August 2027. The Vintage Stock lease has no termination options.
Restaurant Depot (30,449 square feet, 8.5% of net rentable area, 4.9% of underwritten base rent). Founded in 1990, Restaurant Depot is a wholesale cash and carry foodservice supplier that provides food products to independent food businesses. Restaurant Depot has 158 stores located across the United States with one additional store expected to open in 2024. Restaurant Depot has been at the Citadel Crossing - Colorado Springs Property since February 2022 and has a lease expiring in February 2032 with four, five-year renewal options. At any time after February 23, 2029, Restaurant Depot has the right to terminate its lease at any time upon 180 days’ written notice.
PetSmart (28,176 square feet, 7.9% of net rentable area, 6.5% of underwritten base rent). Founded in 1987, PetSmart is a specialty retailer of pet products and services with approximately 50,000 employees across 1,660 stores, seven distribution centers and two home offices. PetSmart provides services in pet grooming, PetsHotel, Doggie Day Camp, dog training, veterinary care and adoption. PetSmart has been at the Citadel Crossing - Colorado Springs Property since September 1989 and has a lease expiring in September 2029 with two, five-year renewal options. The PetSmart lease has no termination options.
Burlington Coat Factory (24,124 square feet, 6.8% of net rentable area, 7.3% of underwritten base rent). Founded in 1972, Burlington Coat Factory (NYSE: BURL) is an off-price retailer that offers a selection of fashion-focused merchandise at up to 60% off other retailers' prices, including women’s ready-to-wear apparel, menswear, youth apparel, baby, beauty, footwear, accessories, home, toys, gifts and coats. Burlington Coat Factory is a Fortune 500 company and operated 1,007 stores as of the end of the first quarter of 2023, in 46 states and Puerto Rico. Burlington Coat Factory executed a lease for 24,124 square feet but has not yet taken possession of its premises. The borrower must deliver the premises in accordance with the lease to Burlington Coat Factory by June 30, 2024. If the borrower fails to do so, a $5,000 per day late fee for each day the premises go undelivered is owed to Burlington Coat Factory. If the borrower fails to deliver the premises by December 31, 2024, then at any time within 30 days thereafter, Burlington Coat Factory may terminate the lease on 30 days’ written notice. Burlington Coat Factory is not obligated to begin paying rent until the earlier of (i) the date of the grand opening of the store or (ii) the next October 1 or April 1 that is at least 240 days after, among other conditions in the lease, the borrower delivers physical possession of the premises to Burlington Coat Factory. At origination of the Citadel Crossing – Colorado Springs Mortgage Loan, approximately $112,579 was reserved for gap rent for the months of July, August, September and October 2024. We cannot assure you that Burlington Coat Factory’s lease will commence or that they will take possession of the applicable premises and begin paying rent as expected or at all.
Office Depot (22,500 square feet, 6.3% of net rentable area, 4.7% of underwritten base rent). Founded in 1986, Office Depot is a subsidiary of The ODP Corporation (NASDAQ:ODP) and is an omnichannel retailer dedicated to helping small businesses, home office and education clients. Office Depot operates approximately 1,400 stores. Office Depot has been at the Citadel Crossing - Colorado Springs Property since May 2011 with a lease term through May 2026 with two, five-year renewal options. The Office Depot lease has no termination options.
| THE INFORMATION IN THIS STRUCTURAL AND COLLATERAL TERM SHEET IS NOT COMPLETE AND MAY BE AMENDED PRIOR TO THE TIME OF SALE. THIS TERM SHEET IS NOT AN OFFER TO SELL THESE SECURITIES AND IT IS NOT A SOLICITATION OF AN OFFER TO BUY THESE SECURITIES IN ANY JURISDICTION WHERE THE OFFER OR SALE IS NOT PERMITTED. |
| | 127 | |
| Retail – Anchored | Loan #9 | Cut-off Date Balance: | | $41,000,000 |
| 507-749 and 801-975 North Academy Boulevard | Citadel Crossing - Colorado Springs | Cut-off Date LTV: | | 61.1% |
| Colorado Springs, CO 80909 | | UW NCF DSCR: | | 1.33x |
| | | UW NOI Debt Yield: | | 11.1% |
The following table presents certain information relating to the tenancy at the Citadel Crossing - Colorado Springs Property:
Major Tenants(1)
| Tenant Name | Credit Rating (Fitch/Moody's/
S&P)(2) | Tenant NRSF | % of NRSF | Annual U/W Base Rent PSF(3) | Annual U/W
Base Rent(3) | % of Total Annual U/W Base Rent(3) | Sales
PSF/
Year(4) | U/W
Occ.
Costs | Lease Expiration Date | Extension Options | Term. Option (Y/N) |
| Major Tenants | | | | | | | | | | |
| Vintage Stock | NR / NR / NR | 45,900 | 12.9% | $8.25 | $378,850 | 8.2% | $64 | 12.9% | 8/31/2027 | None | N |
| Restaurant Depot(5) | NR / NR / NR | 30,449 | 8.5% | $7.50 | $228,368 | 4.9% | NAV | NAV | 2/29/2032 | 4 x 5 yr | Y(5) |
| PetSmart | NR / B1 / B+ | 28,176 | 7.9% | $10.75 | $302,892 | 6.5% | NAV | NAV | 9/30/2029 | 2 x 5 yr | N |
| Burlington Coat Factory(6) | NR / Ba2 / BB+ | 24,124 | 6.8% | $14.00 | $337,736 | 7.3% | NAV | NAV | 6/30/2034 | 4 x 5 yr | (6) |
| Office Depot | NR / NR / NR | 22,500 | 6.3% | $9.69 | $218,023 | 4.7% | NAV | NAV | 5/31/2026 | 2 x 5 yr | N |
| Picture Show Entertainment | NR / NR / NR | 21,820 | 6.1% | $12.01 | $262,000 | 5.6% | $198,985(7) | 16.5% | 9/30/2027 | 1 x 5 yr | N |
| The First Tee Of Pikes Peak | NR / NR / NR | 15,311 | 4.3% | $4.94 | $75,600 | 1.6% | NAV | NAV | MTM | None | N |
| Dollar Tree Stores | NR / Baa2 / BBB | 13,459 | 3.8% | $13.00 | $174,967 | 3.8% | NAV | NAV | 8/31/2031 | 2 x 5 yr | N |
| King Buffet | NR / NR / NR | 12,373 | 3.5% | $11.82 | $146,222 | 3.1% | $420 | 2.8% | 6/30/2030 | 2 x 5 yr | N |
| Hobby Town | NR / NR / NR | 12,000 | 3.4% | $10.04 | $120,510 | 2.6% | NAV | NAV | 2/28/2034 | 1 x 5 yr | N |
| Total Major Tenants | 226,112 | 63.4% | $9.93 | $2,245,167 | 48.4% | | | | | |
| | | | | | | | | | | | |
| Non-Major Tenants(8) | | 103,012 | 28.9% | $23.28 | $2,397,800 | 51.6% | | | | | |
| | | | | | | | | | | | |
| Occupied Collateral Total | 329,124 | 92.2% | $14.11 | $4,642,967 | 100.0% | | | | | |
| | | | | | | | | | | |
| Vacant Space | 27,788 | 7.8% | | | | | | | | |
| | | | | | | | | | | |
| Collateral Total | 356,912 | 100.0% | | | | | | | | |
| | | | | | | | | | | | |
| (1) | Based on the underwritten rent roll dated May 1, 2024. |
| (2) | Certain ratings are those of the parent company whether or not the parent guarantees the lease. |
| (3) | Annual U/W Base Rent, % of Total Annual U/W Base Rent and Annual U/W Base Rent PSF include contractual rent steps through May 1, 2025. |
| (4) | Sales PSF/Year are as of the trailing 12-month period ending December 31, 2023 as provided by the tenants to the borrower. |
| (5) | Restaurant Depot may terminate its space at any time after February 23, 2029 upon 180 days’ written notice. |
| (6) | Burlington Coat Factory executed a lease dated December 13, 2023. Burlington Coat Factory is expected to take occupancy in July 2024. If the borrower fails to deliver the premises by June 30, 2024, a $5,000 per day late fee for each day the premises go undelivered is owed to Burlington Coat Factory. If the borrower fails to deliver the premises by December 31, 2024, then at any time within 30 days thereafter, Burlington Coat Factory may terminate the lease on 30 days’ written notice. Burlington Coat Factory is not obligated to begin paying rent until the earlier of (i) the date of the grand opening of the store or (ii) the next October 1 or April 1 that is at least 240 days after, among other conditions in the lease, the borrower delivers physical possession of the premises to Burlington Coat Factory. At origination of the Citadel Crossing – Colorado Springs Mortgage Loan, approximately $112,579 was reserved for gap rent for the months of July, August, September and October 2024. We cannot assure you that Burlington Coat Factory’s lease will commence or that they will take possession of the applicable premises and begin paying rent as expected or at all. |
| (7) | Sales PSF / Year for Picture Show Entertainment are shown per screen. Picture Show Entertainment has eight screens at the Citadel Crossing – Colorado Springs Property. |
| (8) | Non-Major Tenants include two easement agreements to Lowe’s and Olive Garden each of which have one square foot and no underwritten base rent attributable. |
The following table presents certain information relating to the lease rollover schedule at the Citadel Crossing - Colorado Springs Property:
Lease Expiration Schedule(1)
| Year Ending December 31, | No. of Leases Expiring | Expiring NRSF | % of Total NRSF | Cumulative Expiring NRSF | Cumulative % of Total NRSF | Annual
U/W
Base Rent(2) | % of Total Annual U/W Base Rent(2) | Annual
U/W
Base Rent
PSF(2) |
| MTM & 2024 | 2 | 18,911 | 5.3% | 18,911 | 5.3% | $184,500 | 4.0% | $9.76 |
| 2025 | 1 | 4,000 | 1.1% | 22,911 | 6.4% | $74,284 | 1.6% | $18.57 |
| 2026 | 4 | 27,830 | 7.8% | 50,741 | 14.2% | $351,134 | 7.6% | $12.62 |
| 2027 | 7 | 79,159 | 22.2% | 129,900 | 36.4% | $994,957 | 21.4% | $12.57 |
| 2028(3) | 7 | 23,822 | 6.7% | 153,722 | 43.1% | $579,529 | 12.5% | $24.33 |
| 2029 | 4 | 37,865 | 10.6% | 191,587 | 53.7% | $506,703 | 10.9% | $13.38 |
| 2030 | 1 | 12,373 | 3.5% | 203,960 | 57.1% | $146,222 | 3.1% | $11.82 |
| 2031 | 2 | 19,194 | 5.4% | 223,154 | 62.5% | $334,725 | 7.2% | $17.44 |
| 2032 | 3 | 49,254 | 13.8% | 272,408 | 76.3% | $578,517 | 12.5% | $11.75 |
| 2033 | 2 | 15,432 | 4.3% | 287,840 | 80.6% | $294,149 | 6.3% | $19.06 |
| 2034 | 2 | 36,124 | 10.1% | 323,964 | 90.8% | $458,246 | 9.9% | $12.69 |
| Vacant | 0 | 27,788 | 7.8% | 351,752 | 98.6% | $0 | 0.0% | $0.00 |
| Thereafter(4) | 3 | 5,160 | 1.4% | 356,912 | 100.0% | $140,000 | 3.0% | $27.13 |
Total/Weighted
Average | 38 | 356,912 | 100.0% | | | $4,642,967 | 100.0% | $14.11(5) |
| (1) | Based on the underwritten rent roll dated May 1, 2024. |
| (2) | Annual U/W Base Rent, % of Total Annual U/W Base Rent and Annual U/W Base Rent PSF include contractual rent steps through May 1, 2025. |
| (3) | 2028 includes a lease to USAA Federal Savings Bank for an ATM as to which one square foot and $32,010 in underwritten base rent are attributable. |
| (4) | Thereafter includes two easement agreements to Lowe’s and Olive Garden each of which have one square foot and no underwritten base rent attributable. |
| (5) | Total/Weighted Average Annual U/W Base Rent PSF excludes vacant space. |
| THE INFORMATION IN THIS STRUCTURAL AND COLLATERAL TERM SHEET IS NOT COMPLETE AND MAY BE AMENDED PRIOR TO THE TIME OF SALE. THIS TERM SHEET IS NOT AN OFFER TO SELL THESE SECURITIES AND IT IS NOT A SOLICITATION OF AN OFFER TO BUY THESE SECURITIES IN ANY JURISDICTION WHERE THE OFFER OR SALE IS NOT PERMITTED. |
| | 128 | |
| Retail – Anchored | Loan #9 | Cut-off Date Balance: | | $41,000,000 |
| 507-749 and 801-975 North Academy Boulevard | Citadel Crossing - Colorado Springs | Cut-off Date LTV: | | 61.1% |
| Colorado Springs, CO 80909 | | UW NCF DSCR: | | 1.33x |
| | | UW NOI Debt Yield: | | 11.1% |
The following table presents historical occupancy percentages at the Citadel Crossing - Colorado Springs Property:
Historical Occupancy(1)
12/31/2021(2) | 12/31/2022(2) | 12/31/2023 | 5/1/2024(3) |
| 69.4% | 90.4% | 88.4% | 92.2% |
| (1) | Information obtained from the historical operating statements. |
| (2) | The increase in occupancy from 12/31/2021 to 12/31/2022 is primarily attributable to new leases executed with Restaurant Depot and Five Below in 2022. |
| (3) | Information obtained from the underwritten rent roll as of May 1, 2024. |
Operating History and Underwritten Net Cash Flow. The following table presents certain information relating to the underwritten net cash flow at the Citadel Crossing - Colorado Springs Property:
Cash Flow Analysis(1)
| | 2021 | 2022 | 2023 | TTM 3/31/2024 | U/W | %(2) | U/W $
per SF |
| Base Rent | $3,498,159 | $3,888,149 | $4,310,479 | $4,242,896 | $4,550,855 | 69.9% | $12.75 | |
| Rent Steps | 0 | 0 | 0 | 0 | 92,112 | 1.4 | 0.26 | |
| Potential Income from Vacant Space | 0 | 0 | 0 | 0 | 683,943 | 10.5 | 1.92 | |
| Total Reimbursements | 743,221 | 940,343 | 1,219,249 | 1,177,277 | 1,182,810 | 18.2 | 3.31 | |
| Gross Potential Rent | $4,241,380 | $4,828,492 | $5,529,728 | $5,420,173 | $6,509,720 | 100.0% | $18.24 | |
| Other Income(3) | 71,801 | 182,422 | 107,051 | 146,120 | 146,120 | 2.2 | 0.41 | |
| (Vacancy & Credit Loss) | 0 | 0 | 0 | 0 | (683,943) | (10.5) | (1.92 | ) |
| Effective Gross Income | $4,313,181 | $5,010,914 | $5,636,779 | $5,566,293 | $5,971,897 | 91.7% | $16.73 | |
| | | | | | | | |
| Real Estate Taxes | $304,074 | $264,387 | $250,721 | $259,277 | $296,013 | 5.0% | $0.83 | |
| Management Fee | 134,525 | 165,207 | 181,756 | 177,452 | 179,157 | 3.0 | 0.50 | |
| Insurance | 26,214 | 71,285 | 71,285 | 74,304 | 83,377 | 1.4 | 0.23 | |
| Other Operating Expenses(4) | 804,011 | 824,786 | 840,868 | 824,206 | 843,889 | 14.1 | 2.36 | |
| Total Expenses | $1,268,825 | $1,325,665 | $1,344,629 | $1,335,239 | $1,402,436 | 23.5% | $3.93 | |
| | | | | | | | |
| Net Operating Income | $3,044,356 | $3,685,249 | $4,292,150 | $4,231,054 | $4,569,461 | 76.5% | $12.80 | |
| Replacement Reserves | 0 | 0 | 0 | 0 | 65,614 | 1.1 | 0.18 | |
| TI/LC | 0 | 0 | 0 | 0 | 0 | 0.0 | 0.00 | |
| Net Cash Flow | $3,044,356 | $3,685,249 | $4,292,150 | $4,231,054 | $4,503,847 | 75.4% | $12.62 | |
| | | | | | | | |
| NOI DSCR | 0.90x | 1.09x | 1.27x | 1.25x | 1.35x | | |
| NCF DSCR | 0.90x | 1.09x | 1.27x | 1.25x | 1.33x | | |
| NOI Debt Yield | 7.4% | 9.0% | 10.5% | 10.3% | 11.1% | | |
| NCF Debt Yield | 7.4% | 9.0% | 10.5% | 10.3% | 11.0% | | |
| (1) | Based on the underwritten rent roll dated May 1, 2024. |
| (2) | Represents (i) percent of Gross Potential Rent for all revenue fields and (ii) percent of Effective Gross Income for all other fields. |
| (3) | Other Income includes sign pole rent, administrative fees, late fees, and other miscellaneous income and percentage rent. |
| (4) | Other Operating Expenses include payroll and benefits, repairs and maintenance, utilities, general and administrative and non-reimbursable expenses. |
| THE INFORMATION IN THIS STRUCTURAL AND COLLATERAL TERM SHEET IS NOT COMPLETE AND MAY BE AMENDED PRIOR TO THE TIME OF SALE. THIS TERM SHEET IS NOT AN OFFER TO SELL THESE SECURITIES AND IT IS NOT A SOLICITATION OF AN OFFER TO BUY THESE SECURITIES IN ANY JURISDICTION WHERE THE OFFER OR SALE IS NOT PERMITTED. |
| | 129 | |
| Retail – Anchored | Loan #9 | Cut-off Date Balance: | | $41,000,000 |
| 507-749 and 801-975 North Academy Boulevard | Citadel Crossing - Colorado Springs | Cut-off Date LTV: | | 61.1% |
| Colorado Springs, CO 80909 | | UW NCF DSCR: | | 1.33x |
| | | UW NOI Debt Yield: | | 11.1% |
Appraisal. According to the appraisal dated May 21, 2024, the Citadel Crossing - Colorado Springs Property had an “As-Stabilized” value of $67,100,000 as of May 2, 2025. The “As-Stabilized” value assumes that Burlington Coat Factory has taken occupancy at the Citadel Crossing – Colorado Springs Property. Burlington Coat Factory has an executed lease for 24,124 square feet which commences in July 2024. The appraiser also concluded to an “As is” value of $62,300,000 as of May 2, 2024. The Cut-off Date LTV Ratio and the Maturity Date LTV Ratio based on the “As is” value are each 65.8%. At origination, $3,530,637 was reserved in an unfunded obligations reserve, of which $2,934,051 was reserved for tenant improvements, landlord work and gap rent associated with the Burlington Coat Factory lease.
Environmental Matters. According to the Phase I environmental report dated May 1, 2024, there was no evidence of any recognized environmental conditions at the Citadel Crossing - Colorado Springs Property.
Market Overview and Competition. The Citadel Crossing - Colorado Springs Property is located at 507-749 and 801-975 North Academy Boulevard in Colorado Springs, Colorado, approximately 4.0 miles east of the Colorado Springs central business district. The Citadel Crossing – Colorado Spring Property is a part of the Colorado Springs metropolitan area (“Colorado Springs MSA”). Major employers in the Colorado Springs MSA include Walmart Inc., Air Force Academy, Schriever Air Force Base, the United States Olympic Committee and the University of Colorado. Primary access to the Citadel Crossing - Colorado Springs Property is provided by Interstate 25 which is a major north south arterial highway running through Colorado. Public transportation is available to the Citadel Crossing – Colorado Springs Property via the Mountain Metropolitan Transit system.
According to a third-party market research report, the Citadel Crossing - Colorado Springs Property is located in East Colorado Springs and is a part of the East retail submarket. As of April 30, 2024, the East retail submarket had retail inventory of 10,905,525 square feet with a vacancy rate of 5.20% and an average asking rental rate of $13.52 per square foot. As of April 30, 2024, the submarket had 783,405 square feet of strip retail centers with a vacancy rate of 3.5% and average asking rent of $13.95 per square foot.
According to the appraisal, the estimated 2023 population within a one-, three-, and five-mile radius of the Citadel Crossing - Colorado Springs Property was 15,673, 118,522, and 274,817, respectively, and the estimated 2023 average household income with the same radii was approximately $64,369, $73,211, and $83,671, respectively.
The following table presents certain information relating to comparable retail leases to the Citadel Crossing - Colorado Springs Property:
Market Analysis(1)
| Property Name / Address | Distance from Subject | Tenant | Suite Size (SF) | Lease Commencement | Lease Term (Mos) | Rent (PSF) |
Citadel Crossing – Colorado Springs 507-749 and 801-975 North Academy
Boulevard, Colorado Springs, CO | — | Vintage Stock | 45,900 | Sep - 2022 | 60 | $8.01(2) |
Fillmore Marketplace 3010-3050 North Nevada Avenue, Colorado
Springs, CO | 5.6 miles | Roadhouse Cinema | 44,235 | Apr-2019 | 120 | $13.00 |
1785 South 8th Street
1785 South 8th Street, Colorado Springs, CO | 6.7 miles | Triple Q Hardware LLC | 22,135 | May-2023 | 119 | $7.50 |
Cheyenne Plaza Shopping Center 1779 South 8th Street, Colorado Springs, CO | 7.4 miles | Ace Hardware | 22,135 | Oct-2022 | 119 | $7.50 |
Regal Cinemas 8141 East Arapahoe Road, Englewood, CO | 56.5 miles | Regal Cinemas | 49,032 | Nov-2017 | 180 | $16.32 |
Bowles Crossing 8055 West Bowles Avenue, Littleton, CO | 68.6 miles | Burlington | 26,786 | Sep-2023 | 120 | $15.00 |
| (1) | Information obtained from the appraisal. |
| (2) | Rent (PSF) is reflects base rent and is not inclusive of rent steps. |
| THE INFORMATION IN THIS STRUCTURAL AND COLLATERAL TERM SHEET IS NOT COMPLETE AND MAY BE AMENDED PRIOR TO THE TIME OF SALE. THIS TERM SHEET IS NOT AN OFFER TO SELL THESE SECURITIES AND IT IS NOT A SOLICITATION OF AN OFFER TO BUY THESE SECURITIES IN ANY JURISDICTION WHERE THE OFFER OR SALE IS NOT PERMITTED. |
| | 130 | |
| Retail – Anchored | Loan #9 | Cut-off Date Balance: | | $41,000,000 |
| 507-749 and 801-975 North Academy Boulevard | Citadel Crossing - Colorado Springs | Cut-off Date LTV: | | 61.1% |
| Colorado Springs, CO 80909 | | UW NCF DSCR: | | 1.33x |
| | | UW NOI Debt Yield: | | 11.1% |
Escrows. At origination of the Citadel Crossing - Colorado Springs Mortgage Loan, the borrower deposited (i) approximately $25,901 into a real estate tax reserve account, (ii) $1,191,118 into an immediate repairs reserve, (iii) $1,500,000 into a leasing reserve for future tenant improvements and leasing commissions, and (iv) approximately $3,530,637 into an unfunded obligations reserve for existing tenant improvements, leasing commissions, free rent, gap rent and other unfunded obligations for seven tenants, including Burlington Coat Factory and Office Depot.
Real Estate Taxes – On each monthly payment date, the borrower is required to deposit an amount equal to 1/12 of the real estate taxes that the lender estimates will be payable during the next 12 months into a real estate tax reserve account (initially estimated to be approximately $25,901).
Insurance – If the liability or casualty policy maintained by the borrower is not an approved blanket or umbrella policy, on each monthly payment date, the borrower is required to deposit into an insurance reserve an amount equal to 1/12 of the insurance premiums that the lender estimates will be payable for the renewal of coverage. At origination of the Citadel Crossing - Colorado Springs Mortgage Loan, the borrower maintained a blanket policy and was not obligated to deposit into the insurance reserve.
Replacement Reserve – On each monthly payment date, the borrower is required to deposit approximately $5,468 into a replacement reserve account.
TI/LC Reserve – On each monthly payment date on which the amount in the TI/LC reserve is less than $1,000,000, the borrower is required to deposit approximately $29,720; provided, however, the borrower will not be obligated to make such deposits if the funds on deposit in such TI/LC reserve account would equal or exceed $1,500,000.
Lockbox and Cash Management. The Citadel Crossing - Colorado Springs Mortgage Loan is structured with a hard lockbox and springing cash management. Within 15 days of origination of the Citadel Crossing – Colorado Springs Mortgage Loan, the borrower is required to establish a hard lockbox account in accordance with the Citadel Crossing – Colorado Springs Mortgage Loan documents. Within five business days of origination of the Citadel Crossing - Colorado Springs Mortgage Loan, the borrower was required to deliver a notice to each tenant directing them to remit all payments under the applicable lease directly to the lender-controlled lockbox account. The borrower and property manager are required to cause all revenue derived from the Citadel Crossing - Colorado Springs Property to be deposited directly into a lender approved lockbox account immediately following receipt. All funds deposited into the lockbox are required to be released to the borrower on each business day unless a Trigger Period (as defined below) exists. Upon the occurrence and during the continuance of a Trigger Period, all funds in the lockbox account are required to be swept each business day to a lender-controlled cash management account, to be applied and disbursed in accordance with the Citadel Crossing - Colorado Springs Mortgage Loan documents, and all excess cash flow funds remaining in the cash management account after the application of such funds in accordance with the Citadel Crossing - Colorado Springs Mortgage Loan documents are required to be held by the lender in an excess cash flow reserve account as additional collateral for the Citadel Crossing - Colorado Springs Mortgage Loan. Upon the cure of the applicable Trigger Period, so long as no other Trigger Period exists, the lender is required to return any amounts remaining on deposit in the excess cash flow reserve account to the borrower. Upon an event of default under the Citadel Crossing - Colorado Springs Mortgage Loan documents, the lender may apply funds to the debt in such priority as it may determine.
A “Trigger Period” means a period (A) commencing upon the earliest of (i) the occurrence and continuance of an event of default, (ii) the debt service coverage ratio being less than 1.20x and (iii) the occurrence of a Specified Tenant Trigger Period (as defined below), and (B) expiring upon (x) with regard to any Trigger Period commenced in connection with the foregoing clause (i), the cure (if applicable) of such event of default, (y) with regard to any Trigger Period commenced in connection with the foregoing clause (ii), the date the debt service coverage ratio is equal to or greater than 1.20x for two consecutive calendar quarters and (z) with regard to any Trigger Period commenced in connection with the foregoing clause (iii), a Specified Tenant Trigger Period ceasing to exist.
A “Specified Tenant Trigger Period” means a period (A) commencing upon the first to occur of (i) Specified Tenant (as defined below) being in default under the applicable Specified Tenant lease beyond applicable notice and cure periods, (ii) Specified Tenant failing to be in actual, physical possession of the Specified Tenant space (or applicable portion thereof), (iii) Specified Tenant failing to be open for business during customary hours and/or “going dark” in the Specified Tenant space (or applicable portion thereof), (iv) Specified Tenant giving notice that it is terminating its lease for all or any portion of the Specified Tenant space (or applicable portion thereof), (v) any termination or cancellation of any Specified Tenant lease (including, without limitation, rejection in any bankruptcy or similar insolvency proceeding) and/or any Specified Tenant lease failing to otherwise be in full force and effect, (vi) any bankruptcy or similar insolvency of Specified Tenant, and (vii) Specified Tenant failing to extend or renew the applicable Specified Tenant lease as required under the terms of the Citadel Crossing - Colorado Springs Mortgage Loan documents and (B) expiring upon the first to occur of the lender’s receipt of evidence reasonably acceptable to the lender of (1) the satisfaction of the applicable Specified Tenant Cure Conditions (as defined below) or (2) the borrower leasing the entire Specified Tenant space (or applicable portion thereof) pursuant to one or more leases for a term of at least five years and in accordance with the applicable terms and conditions of the Citadel Crossing - Colorado Springs Mortgage Loan documents, the applicable tenant(s) under such lease(s) being in actual, physical occupancy of the space demised, all contingencies to effectiveness of each such lease have expired or been satisfied, each such lease has commenced and a rent commencement date has been established (without possibility of delay) and, in the lender’s judgment, the applicable Specified Tenant Excess Cash Flow Condition (as defined below) is satisfied in connection therewith; provided, however, that with respect to the space demised to Vintage Stock Inc. (“Vintage”), the foregoing requirement to lease the entire Specified Tenant space will be deemed satisfied if one or more replacement leases demise at least 75% of such Specified Tenant space and require payment, in the aggregate, of at least 75% of the rental paid by Vintage pursuant to its lease.
| THE INFORMATION IN THIS STRUCTURAL AND COLLATERAL TERM SHEET IS NOT COMPLETE AND MAY BE AMENDED PRIOR TO THE TIME OF SALE. THIS TERM SHEET IS NOT AN OFFER TO SELL THESE SECURITIES AND IT IS NOT A SOLICITATION OF AN OFFER TO BUY THESE SECURITIES IN ANY JURISDICTION WHERE THE OFFER OR SALE IS NOT PERMITTED. |
| | 131 | |
| Retail – Anchored | Loan #9 | Cut-off Date Balance: | | $41,000,000 |
| 507-749 and 801-975 North Academy Boulevard | Citadel Crossing - Colorado Springs | Cut-off Date LTV: | | 61.1% |
| Colorado Springs, CO 80909 | | UW NCF DSCR: | | 1.33x |
| | | UW NOI Debt Yield: | | 11.1% |
“Specified Tenant” means, as applicable, (i) Vintage, together with its successors and/or assigns, (ii) Burlington Coat Factory Warehouse Corporation, (iii) any other tenant of the Specified Tenant space (or any portion thereof) and (iv) any guarantors of the applicable related Specified Tenant leases.
“Specified Tenant Cure Conditions” means each of the following, as applicable, (i) the Specified Tenant has cured all defaults under the applicable Specified Tenant lease and no other default by the applicable Specified Tenant under such Specified Tenant lease occurs during the remainder of the then-current calendar quarter following such cure, (ii) the applicable Specified Tenant is in actual, physical possession of the Specified Tenant space (or applicable portion thereof) and open for business during customary hours and not “dark” in substantially all of the Specified Tenant space (or applicable portion thereof), (iii) the applicable Specified Tenant has revoked or rescinded all termination or cancellation notices with respect to the applicable Specified Tenant lease and has re-affirmed the applicable Specified Tenant lease as being in full force and effect, (iv) in the event the Specified Tenant Trigger Period is due to the applicable Specified Tenant’s failure to extend or renew the applicable Specified Tenant lease in accordance with clause (vii) of the definition of “Specified Tenant Trigger Period”, the applicable Specified Tenant has renewed or extended the applicable Specified Tenant lease in accordance with the terms of the Citadel Crossing - Colorado Springs Mortgage Loan documents and the lease for a term of at least five years and, in the lender’s judgment, the applicable Specified Tenant Excess Cash Flow Condition is satisfied in connection therewith, (v) the Specified Tenant is no longer insolvent or subject to any bankruptcy or insolvency proceedings and has affirmed the applicable Specified Tenant lease pursuant to final, non-appealable order of a court of competent jurisdiction, and (vi) the applicable Specified Tenant is paying full, unabated rent under the applicable Specified Tenant lease.
“Specified Tenant Excess Cash Flow Condition” means, (i) with respect to curing any Specified Tenant Trigger Period by re-tenanting the applicable Specified Tenant space (as contemplated by clause (B)(2) of the definition of “Specified Tenant Trigger Period” above), sufficient funds have been accumulated in the excess cash flow account to cover all anticipated leasing commissions, tenant improvement costs, tenant allowances, free rent periods, and/or rent abatement periods to be incurred in connection with any such re-tenanting and (ii) with respect to curing any Specified Tenant Trigger Period by renewal/extension of any Specified Tenant lease (as contemplated by clause (iv) of the definition of “Specified Tenant Cure Conditions” above), sufficient funds have been accumulated in the excess cash flow account (during the continuance of the subject Specified Tenant Trigger Period) to cover all anticipated leasing commissions, tenant improvement costs, tenant allowances, free rent periods, and/or rent abatement periods to be incurred in connection with any such renewal/extension.
Additional Secured Indebtedness (not including trade debts). None.
Mezzanine Loan and Preferred Equity. None.
Release of Property. Not permitted.
Letter of Credit. None.
Right of First Offer/Right of First Refusal. None.
Ground Lease. None.
Terrorism Insurance. The borrower is required to maintain or cause to be maintained an “all-risk” insurance policy that provides coverage for terrorism in an amount equal to the full replacement cost of the Citadel Crossing - Colorado Springs Property. The “all-risk” policy containing terrorism insurance is required to contain a deductible no greater than $50,000 except with respect to windstorm/named storms and earthquake. See “Risk Factors—Risks Relating to the Mortgage Loans—Terrorism Insurance May Not Be Available for All Mortgaged Properties” in the Preliminary Prospectus.
| THE INFORMATION IN THIS STRUCTURAL AND COLLATERAL TERM SHEET IS NOT COMPLETE AND MAY BE AMENDED PRIOR TO THE TIME OF SALE. THIS TERM SHEET IS NOT AN OFFER TO SELL THESE SECURITIES AND IT IS NOT A SOLICITATION OF AN OFFER TO BUY THESE SECURITIES IN ANY JURISDICTION WHERE THE OFFER OR SALE IS NOT PERMITTED. |
| | 132 | |
| Property Type – Various | Loan #10 | Cut-off Date Balance: | | $37,150,000 |
| Property Addresses – Various | Rhino Portfolio 3 | Cut-off Date LTV: | | 62.3% |
| Various, Various | | U/W NCF DSCR: | | 1.46x |
| | | U/W NOI Debt Yield: | | 11.0% |
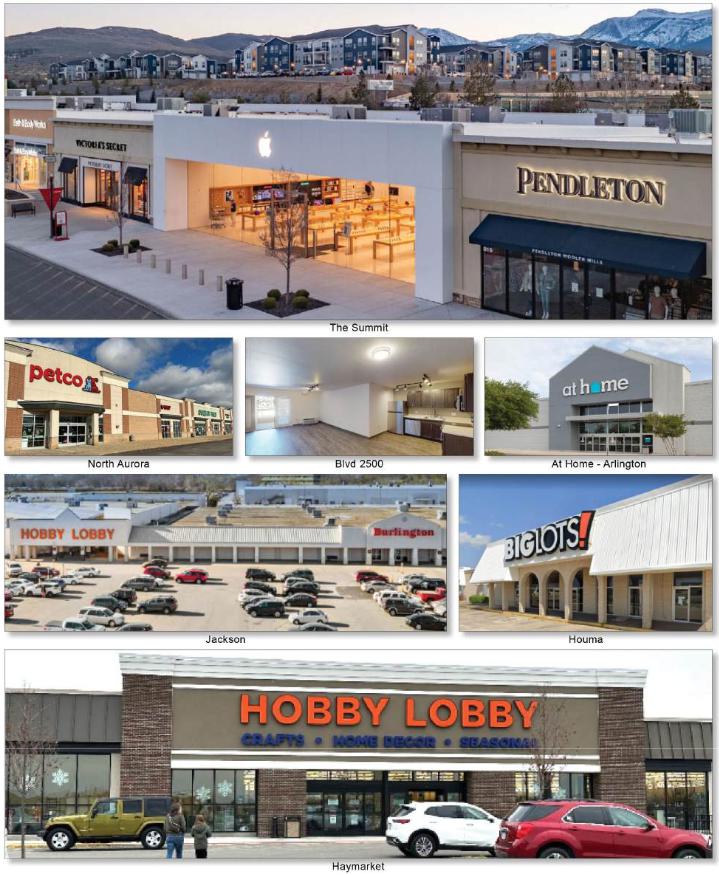
| THE INFORMATION IN THIS STRUCTURAL AND COLLATERAL TERM SHEET IS NOT COMPLETE AND MAY BE AMENDED PRIOR TO THE TIME OF SALE. THIS TERM SHEET IS NOT AN OFFER TO SELL THESE SECURITIES AND IT IS NOT A SOLICITATION OF AN OFFER TO BUY THESE SECURITIES IN ANY JURISDICTION WHERE THE OFFER OR SALE IS NOT PERMITTED. |
| | 133 | |
| Property Type – Various | Loan #10 | Cut-off Date Balance: | | $37,150,000 |
| Property Addresses – Various | Rhino Portfolio 3 | Cut-off Date LTV: | | 62.3% |
| Various, Various | | U/W NCF DSCR: | | 1.46x |
| | | U/W NOI Debt Yield: | | 11.0% |
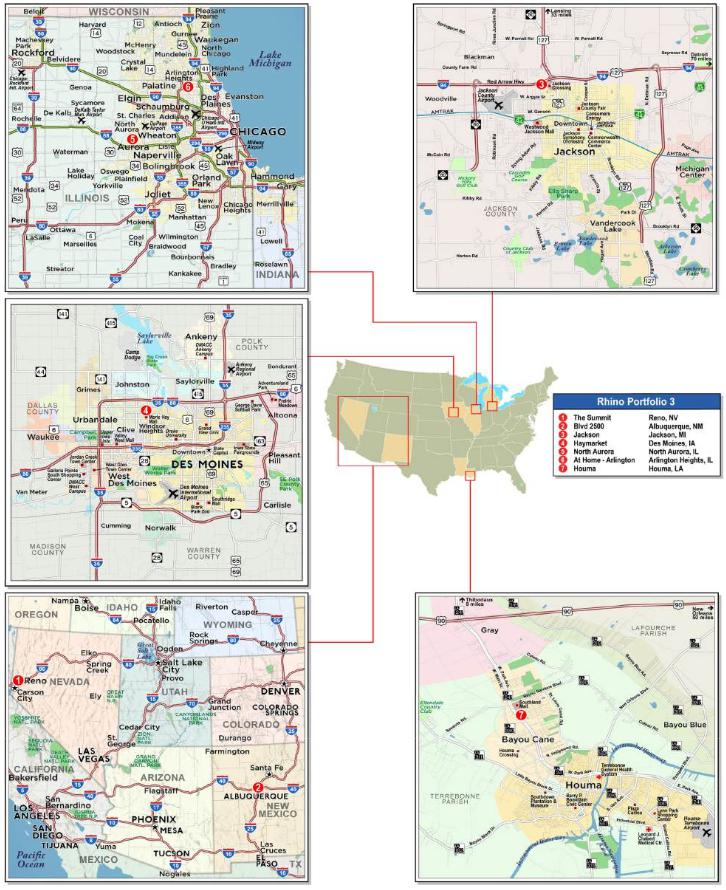
| THE INFORMATION IN THIS STRUCTURAL AND COLLATERAL TERM SHEET IS NOT COMPLETE AND MAY BE AMENDED PRIOR TO THE TIME OF SALE. THIS TERM SHEET IS NOT AN OFFER TO SELL THESE SECURITIES AND IT IS NOT A SOLICITATION OF AN OFFER TO BUY THESE SECURITIES IN ANY JURISDICTION WHERE THE OFFER OR SALE IS NOT PERMITTED. |
| | 134 | |
| No. 10 – Rhino Portfolio 3 |
| |
| Mortgage Loan Information | | Mortgaged Property Information |
| Mortgage Loan Seller: | Bank of America, National Association | | Single Asset/Portfolio: | Portfolio |
Credit Assessment (Fitch/KBRA/Moody’s): | NR/NR/NR | | Property Type – Subtype(4): | Various - Various |
| Original Principal Balance(1): | $37,150,000 | | Location: | Various |
| Cut-off Date Balance(1): | $37,150,000 | | Size(5): | 1,100,563 SF |
| % of Initial Pool Balance: | 3.4% | | Cut-off Date Balance Per SF(1): | $124.62 |
| Loan Purpose: | Refinance | | Maturity Date Balance Per SF(1): | $124.62 |
| Borrower Sponsor: | Sanjiv Chopra | | Year Built/Renovated: | Various/Various |
| Guarantor: | Sanjiv Chopra | | Title Vesting: | Fee |
| Mortgage Rate: | 6.9320% | | Property Manager: | Various |
| Note Date: | December 19, 2023 | | Current Occupancy (As of)(5): | 94.8% (Various) |
| Seasoning: | 5 months | | 12/31/2022 Occupancy: | 78.3% |
| Maturity Date: | January 6, 2034 | | 12/31/2021 Occupancy: | 71.0% |
| IO Period: | 120 months | | 12/31/2020 Occupancy: | 70.2% |
| Loan Term (Original): | 120 months | | As-Is Appraised Value(6): | $220,113,997 |
| Amortization Term (Original): | NAP | | As-Is Appraised Value Per SF(6): | $200.00 |
| Loan Amortization Type: | Interest only | | As-Is Appraisal Valuation Date(6): | Various |
| Call Protection: | L(24),YM1(89),O(7) | | Underwriting and Financial Information |
| Lockbox Type: | Soft/Springing Cash Management | | TTM Various NOI(7)(8): | $10,761,492 |
| Additional Debt(1): | Yes | | TTM 12/31/2022 NOI(7)(10)(11)(13): | $8,768,474 |
| Additional Debt Type (Balance)(1): | Pari Passu ($100,000,000) | | TTM 12/31/2021 NOI(9)(10)(11)(13): | $7,093,480 |
| | | | TTM 12/31/2020 NOI(9)(11)(12)(13): | $5,766,630 |
| Escrows and Reserves(2) | | U/W Revenues(14): | $22,679,232 |
| | Initial | Monthly | Cap | | U/W Expenses(14): | $7,590,897 |
| Taxes | $404,449 | $201,224 | NAP | | U/W NOI(14): | $15,088,334 |
| Insurance | $0 | Springing | NAP | | U/W NCF(14): | $14,026,111 |
| Replacement Reserve | $0 | $18,407 | NAP | | U/W DSCR based on NOI/NCF(1): | 1.57x / 1.46x |
| TI/LC Reserve | $0 | $61,203 | $2,203,325 | | U/W Debt Yield based on NOI/NCF(1): | 11.0% / 10.2% |
| Deferred Maintenance | $107,625 | $0 | NAP | | U/W Debt Yield at Maturity based on NOI/NCF(1): | 11.0% / 10.2% |
| Trader Joe’s Earnout Reserve | $1,300,000 | $0 | NAP | | Cut-off Date LTV Ratio(1): | 62.3% |
| Other Reserves(3) | $14,281,504 | $0 | NAP | | LTV Ratio at Maturity(1): | 62.3% |
| | | | | | | | | |
| Sources and Uses |
| Sources | | | | Uses | | |
| Whole Loan Amount(1) | $137,150,000 | 98.9 | % | | Loan Payoff | $118,577,299 | 85.5 | % |
| Borrower Sponsor Equity | 1,477,130 | 1.1 | | | Upfront Reserves | 16,093,577 | 11.6 | |
| | | | | Closing Costs | 3,956,255 | 2.9 | |
| Total Sources | $138,627,130 | 100.0 | % | | Total Uses | $138,627,130 | 100.0 | % |
| (1) | The Rhino Portfolio 3 Mortgage Loan (as defined below) is part of a whole loan evidenced by seven pari passu notes with an aggregate outstanding principal balance as of the Cut-off Date of $137.15 million (the “Rhino Portfolio 3 Whole Loan”). The Rhino Portfolio 3 Whole Loan includes $1,300,000 attributed to the Trader Joe’s earnout reserve that is contingent upon Trader Joe’s taking occupancy at The Summit mortgaged property, among other conditions described in the “Escrows” section. The Financial Information in the chart reflects the metrics of the Rhino Portfolio 3 Whole Loan and the underwritten rent attributed to Trader Joe’s. |
| (2) | See “Escrows” section for further discussion. |
| (3) | Other Reserves consist of an upfront TI/LC reserve ($11,354,359.61), free rent reserve ($2,414,573.70) and static insurance reserve ($512,570.25). |
| (4) | The Rhino Portfolio 3 Whole Loan is secured by six retail properties and one multifamily property. |
| (5) | Net rentable area and occupancy take into account the net rentable area of the Blvd 2500 mortgaged property multifamily space. The Blvd 2500 mortgaged property contains 296 multifamily units, which are being treated as 121,308 square feet to calculate total square feet and occupancy throughout the whole portfolio. Based on the Blvd 2500 mortgaged property’s multifamily units, it has an occupancy rate of 89.5% as of November 24, 2023. Included in occupancy are 15 tenants totaling 123,844 square feet, as of March 2024, accounting for approximately $2.6 million in base rent that have executed leases but are not yet occupying their space which includes Trader Joe’s, whom is expected to take occupancy in November 2024, and at origination of the Rhino Portfolio 3 Whole Loan there was a $1.3 million earnout reserved upfront contingent on Trader Joe’s taking occupancy. The conditions of the earnout are described in the Escrows and Reserves section. Occupancy dates for the Rhino Portfolio 3 Properties (as defined below) are as of November 24, 2023 through December 19, 2023. |
| (6) | The appraised value represents the “As-Is with Escrow Reserve” value, which includes the extraordinary assumption that certain escrows have been reserved for tenant improvements and leasing commissions, gap rent and free rent associated with the lease up of various tenant spaces in an estimated aggregate amount of $14,863,997. At origination of the Rhino Portfolio 3 Whole Loan, the borrowers deposited with the lender approximately (i) $11,354,360 for outstanding tenant improvement work and leasing commission obligations, (ii) $2,278,509 for gap rent, (iii) $136,064 for free rent and (iv) $1,300,000 for an earnout reserve related to the Trader Joe’s lease. Appraisals are dated from October 5, 2023 through October 27, 2023. |
| (7) | The increase from 2nd Most Recent NOI to Most Recent NOI is primarily attributed to recent leasing at The Summit mortgaged property. The leases primarily driving this growth include Columbia ($318,270 of underwritten base rent; lease commencement date of November 2022; 11,232 square feet), Lululemon Athletica ($208,029 of underwritten base rent; lease commencement date of December 2022; 6,249 square feet) and Five Below ($153,918 of underwritten base rent; lease commencement date of July 2022, 9,054 square feet). |
| (8) | The increase from Most Recent NOI to Underwritten NOI is primarily attributed to recent leasing throughout the Rhino Portfolio 3 Properties. Recent leasing includes Dave and Busters ($473,666 of underwritten base rent; expected occupancy date of February 2025; 20,156 square feet; The Summit mortgaged property), Burlington ($249,550 of underwritten base rent; expected occupancy date of July 2024; 21,700 square feet; the Jackson mortgaged property), Petco ($262,977 of underwritten base rent; expected occupancy date of July 2024; 13,486 square feet; The Summit mortgaged property), Kids Empire ($190,076 of underwritten base rent; expected occupancy date of June 2024; 10,004 square feet; the North Aurora mortgaged property), Golf X ($172,632 of underwritten base rent; occupancy date of February 2024; 7,193 square feet; The Summit mortgaged property) and Starbucks ($155,234 of underwritten base rent; expected occupancy date of June 2024; 2,465 square feet; The Summit mortgaged property). |
| THE INFORMATION IN THIS STRUCTURAL AND COLLATERAL TERM SHEET IS NOT COMPLETE AND MAY BE AMENDED PRIOR TO THE TIME OF SALE. THIS TERM SHEET IS NOT AN OFFER TO SELL THESE SECURITIES AND IT IS NOT A SOLICITATION OF AN OFFER TO BUY THESE SECURITIES IN ANY JURISDICTION WHERE THE OFFER OR SALE IS NOT PERMITTED. |
| | 135 | |
| Property Type – Various | Loan #10 | Cut-off Date Balance: | | $37,150,000 |
| Property Addresses – Various | Rhino Portfolio 3 | Cut-off Date LTV: | | 62.3% |
| Various, Various | | U/W NCF DSCR: | | 1.46x |
| | | U/W NOI Debt Yield: | | 11.0% |
| (9) | The increase from 4th Most Recent NOI to 3rd Most Recent NOI is driven primarily by the inclusion of the Blvd 2500 mortgaged property. |
| (10) | The increase from 3rd Most Recent NOI to 2nd Most Recent NOI is driven primarily by increased rental income at the Blvd 2500 mortgaged property as the property reached stabilization. |
| (11) | Historical cash flows include a 35,000 square foot box formerly leased to UFC Gym, who was paying approximately $37,203 in monthly base rent, at the North Aurora mortgaged property that is no longer included in the collateral. The 35,000 square foot box has been vacant since 2021 and represents 3.2% of the total portfolio net rentable area. |
| (12) | 4th Most Recent NOI excludes the Blvd 2500 mortgaged property as the property was converted to multifamily usage in phases beginning in 2020 and the development was still ongoing. |
| (13) | The At Home – Arlington and Houma mortgaged properties were purchased in 2023. The At Home – Arlington mortgaged property cash flows are excluded from 4th Most Recent, 3rd Most Recent and 2nd Most Recent NOI. The Houma mortgaged property historical cash flows are excluded from all historical cash flows. |
| (14) | Underwritten cash flows include underwritten rent attributed to Trader Joe’s, which has been underwritten in occupancy. Trader Joe’s is expected to take occupancy in November 2024. |
The Mortgage Loan. The Rhino Portfolio 3 mortgage loan (the “Rhino Portfolio 3 Mortgage Loan”) is part of a fixed rate whole loan secured by the borrowers’ fee interests in an 1,100,563 square foot, seven-property portfolio located in Nevada, New Mexico, Michigan, Iowa, Illinois and Louisiana (each, a “Rhino Portfolio 3 Property”, and collectively, the “Rhino Portfolio 3 Properties”). The Rhino Portfolio 3 Whole Loan consists of seven pari passu notes and accrues interest at a rate of 6.93200% per annum. The Rhino Portfolio 3 Whole Loan has a 10-year term, is interest-only for the entire term of the loan and accrues interest on an Actual/360 basis. The Rhino Portfolio 3 Whole Loan was co-originated on December 19, 2023 by Barclays Capital Real Estate Inc. (“Barclays”) and Bank of America, N.A. (“BANA”). The Rhino Portfolio 3 Mortgage Loan is evidenced by the non-controlling Note A-6 and Note A-7, with an aggregate principal balance as of the Cut-off Date of $37,150,000. The controlling Note A-1 and non-controlling Note A-3, Note A-4 and Note A-5 were contributed to the BBCMS 2024-C24 securitization trust. The non-controlling Note A-2 was contributed to the BBCMS 2024-C26 securitization trust. The Rhino Portfolio 3 Whole Loan is serviced pursuant to the pooling and servicing agreement for the BBCMS 2024-C24 securitization trust. See “Description of the Mortgage Pool—The Whole Loans—The Non-Serviced Pari Passu Whole Loans” and “Pooling and Servicing Agreement” in the Preliminary Prospectus.
Whole Loan Note Summary
Notes | Original Balance | Cut-off Date Balance | Note Holder | Controlling Piece |
| A-1 | $40,000,000 | | $40,000,000 | | BBCMS 2024-C24 | Yes |
| A-2 | $35,000,000 | | $35,000,000 | | BBCMS 2024-C26 | No |
| A-3 | $10,000,000 | | $10,000,000 | | BBCMS 2024-C24 | No |
| A-4 | $10,000,000 | | $10,000,000 | | BBCMS 2024-C24 | No |
| A-5 | $5,000,000 | | $5,000,000 | | BBCMS 2024-C24 | No |
| A-6 | $20,000,000 | | $20,000,000 | | BANK 2024-BNK47 | No |
| A-7 | $17,150,000 | | $17,150,000 | | BANK 2024-BNK47 | No |
| Total | $137,150,000 | | $137,150,000 | | | |
The Borrowers and Borrower Sponsor. The borrowers are Rhino Holdings Arlington, LLC, Rhino Holdings Boulevard, LLC, Rhino Holdings Shayden Summit, LLC, Rhino Holdings Houma, LLC, Rhino Holdings Jackson Crossing, LLC, Rhino Holdings Haymarket, LLC and Rhino Holdings North Aurora, LLC, all Delaware limited liability companies and special purpose entities with two independent directors. Legal counsel to the borrowers provided a non-consolidation opinion in connection with the origination of the Rhino Portfolio 3 Whole Loan.
The non-recourse carve-out guarantor and borrower sponsor of the Rhino Portfolio 3 Whole Loan is Sanjiv Chopra. Sanjiv Chopra is founder and chief executive officer of Rhino Investment Group, a real estate acquisition and development firm with a portfolio of over five million square feet located on over 60 sites throughout the United States. The borrower sponsor previously owned and controlled an entity that filed for Chapter 11 bankruptcy in 2019 (later converted to Chapter 7 proceedings) related to certain fitness centers operated by such entity, and the borrower sponsor filed for a personal bankruptcy in 2011 that was resolved in 2015. See “Description of the Mortgage Pool—Litigation and Other Considerations” and “—Loan Purpose; Default History, Bankruptcy Issues and Other Proceedings” in the Preliminary Prospectus.
The Properties. The Rhino Portfolio 3 Properties consist of three anchored retail centers (79.1% of the Rhino Portfolio 3 Whole Loan amount (“ALA”)), one shadow anchored retail center (4.2% of ALA), two single tenant retail properties (4.3% of ALA) and one low rise multifamily property (12.4% of ALA). Retail space throughout the Rhino Portfolio 3 Properties was 95.3% occupied as of November 24, 2023 through December 19, 2023. The Blvd 2500 mortgaged property is the only multifamily property and was 89.5% occupied by units as of November 24, 2023. In total, including the net rentable area of the multifamily space at the Blvd 2500 mortgaged property, the Rhino Portfolio 3 Properties were 94.8% occupied as of November 24, 2023 through December 19, 2023.
The Summit mortgaged property (64.6% of ALA) is an anchored retail center located in Reno, Nevada. The Summit mortgaged property is anchored by Century Theatres, Old Navy, Petco and Apple. The Summit mortgaged property is also shadow anchored by Dillard’s. Additionally, Trader Joe’s is expected to take occupancy in November 2024 and will be an anchor at The Summit mortgaged property.
The Blvd 2500 mortgaged property (12.4% of ALA) is a low rise multifamily property located in Albuquerque, New Mexico. The Blvd 2500 mortgaged property has maintained occupancy above 92.0% since 2021.
| THE INFORMATION IN THIS STRUCTURAL AND COLLATERAL TERM SHEET IS NOT COMPLETE AND MAY BE AMENDED PRIOR TO THE TIME OF SALE. THIS TERM SHEET IS NOT AN OFFER TO SELL THESE SECURITIES AND IT IS NOT A SOLICITATION OF AN OFFER TO BUY THESE SECURITIES IN ANY JURISDICTION WHERE THE OFFER OR SALE IS NOT PERMITTED. |
| | 136 | |
| Property Type – Various | Loan #10 | Cut-off Date Balance: | | $37,150,000 |
| Property Addresses – Various | Rhino Portfolio 3 | Cut-off Date LTV: | | 62.3% |
| Various, Various | | U/W NCF DSCR: | | 1.46x |
| | | U/W NOI Debt Yield: | | 11.0% |
The Jackson mortgaged property (7.4% of ALA) is an anchored retail center located in Jackson, Michigan. The Jackson mortgaged property is anchored by Hobby Lobby and Planet Fitness, which have both recently executed 10-year leases in 2022. Additionally, Burlington is expected to take occupancy in July 2024.
The Haymarket mortgaged property (7.1% of ALA) is an anchored retail center located in Des Moines, Iowa. The Haymarket mortgaged property is anchored by Burlington and Hobby Lobby, who have been at the Haymarket mortgaged property since 1994 and 1999, respectively.
The North Aurora mortgaged property (4.2% of ALA) is a shadow anchored retail center located in North Aurora, Illinois. The North Aurora mortgaged property is shadow anchored by Target.
The At Home – Arlington mortgaged property (3.5% of ALA) is a single tenant retail property located in Arlington Heights, Illinois. The sole tenant, At Home, executed a lease in 2022 that will expire in June 2033.
The Houma mortgaged property (0.8% of ALA) is a single tenant retail property located in Houma, Louisiana. The sole tenant, Big Lots, has been at the Houma mortgaged property since 1997 and recently extended its lease which commenced in February 2023 and has a lease expiration date in January 2028.
The following table presents certain information relating to the Rhino Portfolio 3 Properties:
| Property Name | Location | Year Built / Renovated | SF | Occ. %(1)(2) | Allocated
Cut-off Date Whole Loan Amount (“ALA”) | % of ALA | Appraised Value | % of Appraised Value |
| The Summit | Reno, NV | 2005, 2006, 2007 / NAP | 391,416 | 96.5% | $88,550,000 | 64.6% | $138,713,944 | 63.0% |
| Blvd 2500 (Multifamily) | Albuquerque, NM | 1970 / 2020 | 128,922(3) | 92.0%(3) | 17,000,000 | 12.4% | $34,218,251 | 15.5% |
| Jackson | Jackson, MI | 1966 / 2023 | 138,513 | 96.7% | 10,200,000 | 7.4% | $14,287,158 | 6.5% |
| Haymarket | Des Moines, IA | 1973 / 1994 | 229,413 | 92.6% | 9,700,000 | 7.1% | $13,683,212 | 6.2% |
| North Aurora | North Aurora, IL | 2006 / NAP | 85,758 | 86.8% | 5,800,000 | 4.2% | $9,511,432 | 4.3% |
| At Home – Arlington | Arlington Heights, IL | 1989 / 2022 | 100,501 | 100.0% | 4,800,000 | 3.5% | $7,800,000 | 3.5% |
| Houma | Houma, LA | 1973 / 1997 | 26,040 | 100.0% | 1,100,000 | 0.8% | $1,900,000 | 0.9% |
| Total / Wtd. Avg. | | | 1,100,563 | 94.8% | $137,150,000 | 100.0% | $220,113,997 | 100.0% |
| (1) | Occ. % is as of November 24, 2023 through December 19, 2023. The Summit occupancy is as of December 12, 2023, Blvd 2500 occupancy is as of November 24, 2023, Jackson occupancy is as of December 11, 2023, Haymarket occupancy is as of December 11, 2023, North Aurora occupancy is as of December 11, 2023, At Home – Arlington occupancy is as of December 19, 2023 and Houma occupancy is as of December 19, 2023. |
| (2) | Included in occupancy are 15 tenants totaling 123,844 square feet accounting for approximately $2.6 million in base rent that have executed leases but are not yet occupying their space which includes Trader Joe’s, whom is expected to take occupancy in November 2024, and at origination of the Rhino Portfolio 3 Whole Loan there was a $1.3 million earnout reserved upfront contingent on Trader Joe’s taking occupancy. The conditions of the earnout are described in the “Escrows” section. |
| (3) | Based on the aggregate net rentable area attributed to both the multifamily and retail space at the Blvd 2500 mortgaged property. Based on the multifamily component of the Blvd 2500 mortgaged property, there are 296 units which were 89.5% occupied as of November 24, 2023. |
Major Tenants.
Hobby Lobby Stores, Inc. (123,934 square feet; 12.7% of portfolio NRA; 5.5% of portfolio underwritten base rent). Hobby Lobby Stores, Inc. (“Hobby Lobby”) was founded in 1970 and has over 900 stores today as the largest privately-owned arts-and-crafts retailer in the world. Hobby Lobby has over 43,000 employees and operates in 48 different states. Hobby Lobby had revenue of approximately $7.9 billion in 2023, which was an approximately 2.6% year-over-year increase from 2022. Hobby Lobby occupies 67,594 square feet at the Haymarket mortgaged property with a current lease expiration date of December 2027 and two, five-year renewal options remaining. Hobby Lobby also occupies 56,340 square feet at the Jackson mortgaged property with a current lease expiration date in May 2032 and has three, five-year lease renewal options remaining. Hobby Lobby has no termination options.
Burlington Coat Factory (112,961 square feet; 11.5% of portfolio NRA; 5.4% of portfolio underwritten base rent). Burlington Coat Factory (“Burlington”) is a Fortune 500 company founded in 1972 and headquartered in Burlington, New Jersey. Burlington is a nationally recognized off-price retailer including women’s ready-to-wear apparel, menswear, youth apparel, baby, beauty, footwear, accessories, home, toys, gifts and coats. Burlington, as of the end of the third quarter of 2023, operated 977 stores spanning across 46 states and Puerto Rico. Burlington had fiscal year 2022 sales of approximately $8.7 billion. Burlington also reported third quarter of 2023 total sales of approximately $2.3 billion, which was a 12% increase compared to the third quarter of 2022. Burlington operates 91,261 square feet at the Haymarket mortgaged property with a lease expiration date of June 2030. Burlington has been at the Haymarket mortgaged property since 1994. Additionally, Burlington is expected to take occupancy of 21,700 square feet at the Jackson mortgaged property in July 2024. The lease is expected to expire in February 2035 and has four, five-year renewal options remaining. Burlington has no termination options.
| THE INFORMATION IN THIS STRUCTURAL AND COLLATERAL TERM SHEET IS NOT COMPLETE AND MAY BE AMENDED PRIOR TO THE TIME OF SALE. THIS TERM SHEET IS NOT AN OFFER TO SELL THESE SECURITIES AND IT IS NOT A SOLICITATION OF AN OFFER TO BUY THESE SECURITIES IN ANY JURISDICTION WHERE THE OFFER OR SALE IS NOT PERMITTED. |
| | 137 | |
| Property Type – Various | Loan #10 | Cut-off Date Balance: | | $37,150,000 |
| Property Addresses – Various | Rhino Portfolio 3 | Cut-off Date LTV: | | 62.3% |
| Various, Various | | U/W NCF DSCR: | | 1.46x |
| | | U/W NOI Debt Yield: | | 11.0% |
At Home (100,501 square feet; 10.3% of portfolio NRA; 4.9% of portfolio underwritten base rent). At Home (Moody’s/S&P: C/CCC), formerly, Garden Ridge, opened its first mega-store in Houston, Texas in 1992. Currently, At Home is headquartered in Dallas, Texas and operates 262 stores through 40 states. At Home offers up to 45,000 home products including furniture, mirrors, housewares and patio and seasonal décor. Garden Ridge was officially rebranded to At Home in 2014 and in 2016 At Home was named a Top 100 retailer. 70 million people visit At Home stores each year. At Home is the sole tenant at the At Home – Arlington mortgaged property and has a current lease expiration of June 2033. At Home took occupancy in December 2022 on a 10-year lease with three, five-year renewal options remaining. At Home has no termination options.
The following table presents certain information relating to the tenancy at the Rhino Portfolio 3 retail properties:
Tenant Summary(1)(2)
| Tenant | Property | Ratings
Moody’s/S&P/ Fitch(3) | Net Rentable Area (SF) | % of
Total NRA | UW Base Rent PSF(4) | UW Base Rent(4) | % of Total
UW Base Rent(4) | Lease
Exp. Date | Renewal Options |
| Hobby Lobby(5) | Various | NR / NR / NR | 123,934 | 12.7 | % | $6.30 | | $780,210 | 5.5 | % | Various | Various |
| Burlington(6) | Various | NR / NR / NR | 112,961 | 11.5 | | $6.79 | | $766,954 | 5.4 | | Various | Various |
| At Home | At Home - Arlington | C / CCC / NR | 100,501 | 10.3 | | $7.00 | | $703,507 | 4.9 | | 6/30/2033 | 3, 5-year |
| Century Theatres | The Summit | NR / NR / NR | 49,605 | 5.1 | | $16.39 | | $812,830 | 5.7 | | 5/31/2027 | 5, 5-year |
| Planet Fitness | Jackson | NR / NR / NR | 30,000 | 3.1 | | $8.25 | | $247,500 | 1.7 | | 7/31/2032 | 3, 5-year |
| Petco(7) | Various | NR / NR / NR | 29,041 | 3.0 | | $12.80 | | $371,862 | 2.6 | | Various | Various |
| Big Lots | Houma | NR / NR / NR | 26,040 | 2.7 | | $6.15 | | $160,116 | 1.1 | | 1/31/2028 | 1, 5-year |
| Harbor Freight Tools | Haymarket | B1 / BB- / NR | 23,921 | 2.4 | | $9.17 | | $219,272 | 1.5 | | 12/31/2032 | 4, 5-year |
| Michael's | North Aurora | Caa2 / B- / NR | 21,730 | 2.2 | | $2.70 | | $58,671 | 0.4 | | 2/28/2027 | None |
| Dave and Busters | The Summit | NR / NR / NR | 20,156 | 2.1 | | $23.50 | | $473,666 | 3.3 | | 1/31/2040 | 3, 5-year |
| Top Ten Tenants | | | 537,889 | 54.9 | % | $8.54 | | $4,594,588 | 32.2 | % | | |
| | | | | | | | | | |
| Remaining Tenants | | 394,879 | 40.3 | % | $24.45 | | $9,654,195 | 67.8 | % | | |
| Occupied Collateral Total / Wtd. Avg. | 932,768 | 95.3 | % | $15.28 | | $14,248,783 | 100.0 | % | | |
| Vacant Space | | | 46,487 | 4.7 | % | | | | | |
| | | | | | | | | | |
| Collateral Total | | | 979,255 | 100.0 | % | | | | | |
| | | | | | | | | |
| (1) | Based on the underwritten rent rolls dated between November 24, 2023 and December 19, 2023. The information in this table does not include multifamily space at the Blvd 2500 mortgaged property. The information in this table includes 14 tenants totaling 121,644 square feet accounting for approximately $2.5 million in base rent that have executed leases but are not yet occupying their space. |
| (2) | The Rhino Portfolio 3 Properties’ major tenants in the Top Ten Tenant Summary table are not required to report sales, with the exception of Century Theatres and Big Lots. Century Theatres reported TTM gross sales as of June 2023 of $6,320,332, sales per screen of $395,021 and an occupancy cost of 18.9%. Big Lots reported TTM gross sales as of October 2023 of $2,723,430, sales per square foot of $105 and an occupancy cost of 6.3%. |
| (3) | In certain instances, ratings provided are for the parent company of the entity listed in the “Tenant” field whether or not the parent company guarantees the lease. |
| (4) | Includes $386,520 of percentage rent. $12,469 of percentage rent is attributed to Big Lots, while the rest is attributed to remaining tenants. |
| (5) | Hobby Lobby occupies 56,340 square feet at the Jackson mortgaged property with a lease expiration date of May 31, 2032 and 67,594 square feet at the Haymarket mortgaged property with a lease expiration date of December 31, 2027. Hobby Lobby has three, five-year renewal options at the Jackson mortgaged property and two, five-year renewals at the Haymarket mortgaged property. |
| (6) | Burlington occupies 91,261 square feet at the Haymarket mortgaged property with a lease expiration date of June 30, 2030 and 21,700 square feet at the Jackson mortgaged property with a lease expiration date of February 28, 2035. Burlington has no renewal options at the Haymarket mortgaged property and four, five-year renewal options at the Jackson mortgaged property. |
| (7) | Petco occupies 15,555 square feet at the North Aurora mortgaged property with a lease expiration date of April 30, 2027 and 13,486 square feet at The Summit mortgaged property with a lease expiration date of June 30, 2034. Petco has two, five-year renewal options at the North Aurora mortgaged property and five, five-year renewal options at The Summit mortgaged property. |
| THE INFORMATION IN THIS STRUCTURAL AND COLLATERAL TERM SHEET IS NOT COMPLETE AND MAY BE AMENDED PRIOR TO THE TIME OF SALE. THIS TERM SHEET IS NOT AN OFFER TO SELL THESE SECURITIES AND IT IS NOT A SOLICITATION OF AN OFFER TO BUY THESE SECURITIES IN ANY JURISDICTION WHERE THE OFFER OR SALE IS NOT PERMITTED. |
| | 138 | |
| Property Type – Various | Loan #10 | Cut-off Date Balance: | | $37,150,000 |
| Property Addresses – Various | Rhino Portfolio 3 | Cut-off Date LTV: | | 62.3% |
| Various, Various | | U/W NCF DSCR: | | 1.46x |
| | | U/W NOI Debt Yield: | | 11.0% |
The Blvd 2500 Property – Unit Mix(1)
| Unit Type | # of Units | % of Total | Occupied Units | Occupancy | Average Unit Size
(SF) | Average Monthly Rental Rate(2) | Average Monthly Rental Rate PSF(2) |
| Studio | 249 | 84.1% | 218 | 87.6% | 342 | $773 | $2.26 |
| One Bedroom | 43 | 14.5% | 43 | 100.0% | 741 | $1,113 | $1.50 |
| Two Bedroom | 3 | 1.0% | 3 | 100.0% | 958 | $1,343 | $1.40 |
| Three Bedroom | 1 | 0.3% | 1 | 100.0% | 1,385 | $2,025 | $1.46 |
| Total/Wtd. Avg. | 296 | 100.0% | 265 | 89.5% | 410 | $840 | $2.05 |
| (1) | Based on the underwritten rent roll dated November 24, 2023. |
| (2) | Average Monthly Rental Rate and Average Monthly Rental Rate PSF are calculated using the in-place contract rent of the Occupied Units. |
The following table presents certain information relating to the lease rollover schedule at the Rhino Portfolio 3 Properties:
Lease Expiration Schedule(1)(2)
| Year | Number of Leases Expiring | Net Rentable Area Expiring | % of NRA Expiring | UW Base Rent Expiring(3) | % of UW Base Rent Expiring(3) | Cumulative Net Rentable Area Expiring | Cumulative % of NRA Expiring | Cumulative UW Base Rent Expiring(3) | Cumulative % of UW Base Rent Expiring(3) |
| Vacant | NAP | 46,487 | 4.7% | NAP | N A | P | 46,487 | 4.7% | NAP | NAP | |
| 2024 & MTM | 4 | 6,273 | 0.6% | $112,088 | 0.8 | % | 52,760 | 5.4% | $112,088 | 0.8 | % |
| 2025 | 14 | 48,492 | 5.0% | 1,147,479 | 8.1 | | 101,252 | 10.3% | $1,259,566 | 8.8 | % |
| 2026 | 10 | 47,100 | 4.8% | 736,066 | 5.2 | | 148,352 | 15.1% | $1,995,632 | 14.0 | % |
| 2027 | 9 | 170,957 | 17.5% | 1,838,265 | 12.9 | | 319,309 | 32.6% | $3,833,898 | 26.9 | % |
| 2028 | 14 | 81,355 | 8.3% | 1,521,874 | 10.7 | | 400,664 | 40.9% | $5,355,772 | 37.6 | % |
| 2029 | 14 | 73,546 | 7.5% | 1,811,630 | 12.7 | | 474,210 | 48.4% | $7,167,402 | 50.3 | % |
| 2030 | 5 | 102,040 | 10.4% | 852,110 | 6.0 | | 576,250 | 58.8% | $8,019,512 | 56.3 | % |
| 2031 | 2 | 5,625 | 0.6% | 144,150 | 1.0 | | 581,875 | 59.4% | $8,163,662 | 57.3 | % |
| 2032 | 8 | 138,499 | 14.1% | 1,598,985 | 11.2 | | 720,374 | 73.6% | $9,762,647 | 68.5 | % |
| 2033 | 9 | 119,581 | 12.2% | 1,644,540 | 11.5 | | 839,955 | 85.8% | $11,407,188 | 80.1 | % |
| 2034 | 14 | 94,244 | 9.6% | 2,066,900 | 14.5 | | 934,199 | 95.4% | $13,474,088 | 94.6 | % |
| 2035 & Beyond | 4 | 45,056 | 4.6% | 774,696 | 5.4 | | 979,255 | 100.0% | $14,248,784 | 100.0 | % |
| Total | 107 | 979,255 | 100.0% | $14,248,784 | 100.0 | % | | | | |
| (1) | Based on the underwritten rent rolls dated between November 24, 2023 and December 19, 2023. The information in this table does not include multifamily space at the Blvd 2500 mortgaged property. Includes 14 tenants totaling 121,644 square feet accounting for approximately $2.5 million in base rent that have executed leases but are not yet occupying their space which includes Trader Joe’s, whom is expected to take occupancy in November 2024, and at origination of the Rhino Portfolio 3 Whole Loan there was a $1.3 million earnout reserved upfront contingent on Trader Joe’s taking occupancy. |
| (2) | Certain tenants may have lease termination options that are exercisable prior to the originally stated expiration date of the subject lease and that are not considered in the Lease Rollover Schedule. |
| (3) | UW Base Rent Expiring, % of UW Base Rent Expiring, Cumulative UW Base Rent Expiring and Cumulative % of UW Base Rent Expiring include $386,520 of percentage rent. |
The following table presents historical occupancy percentages at the Rhino Portfolio 3 Properties:
Historical Occupancy(1)
2019(2) | 2020 | 2021 | 2022(3) | Current(3)(4) |
| 72.2% | 70.2% | 71.0% | 78.3% | 94.8% |
| | | | | |
| (1) | Historical occupancy is as of December 31 of each respective year. Historical occupancy is from a third party source. |
| (2) | 2019 occupancy excludes the Blvd 2500 mortgaged property as extensive renovations commenced in 2020 to convert the mortgaged property to multifamily usage. |
| (3) | The increase from 2022 occupancy to current occupancy is attributed to recent leasing throughout the Rhino Portfolio 3 Properties. Recent leasing includes Dave and Busters ($473,666 of underwritten base rent; expected occupancy date of February 2025; 20,156 square feet), Trader Joe’s ($356,400 of underwritten base rent; expected occupancy date of November 2024; 14,850 square feet), Petco ($262,977 of underwritten base rent; expected occupancy date of July 2024; 13,486 square feet), Burlington ($249,550 of underwritten base rent; expected occupancy date of July 2024; 21,700 square feet), Kids Empire ($190,076 of underwritten base rent; expected occupancy date of June 2024; 10,004 square feet) and Starbucks ($155,234 of underwritten base rent; expected occupancy date of June 2024; 2,465 square feet). |
| (4) | Current Occupancy is as of November 24, 2023 through December 19, 2023 and includes 15 tenants totaling 123,844 square feet accounting for approximately $2.6 million in base rent that have executed leases but are not yet occupying their space which includes Trader Joe’s, whom is expected to take occupancy in November 2024, and at origination of the Rhino Portfolio 3 Whole Loan there was a $1.3 million earnout reserved upfront contingent on Trader Joe’s taking occupancy. |
| THE INFORMATION IN THIS STRUCTURAL AND COLLATERAL TERM SHEET IS NOT COMPLETE AND MAY BE AMENDED PRIOR TO THE TIME OF SALE. THIS TERM SHEET IS NOT AN OFFER TO SELL THESE SECURITIES AND IT IS NOT A SOLICITATION OF AN OFFER TO BUY THESE SECURITIES IN ANY JURISDICTION WHERE THE OFFER OR SALE IS NOT PERMITTED. |
| | 139 | |
| Property Type – Various | Loan #10 | Cut-off Date Balance: | | $37,150,000 |
| Property Addresses – Various | Rhino Portfolio 3 | Cut-off Date LTV: | | 62.3% |
| Various, Various | | U/W NCF DSCR: | | 1.46x |
| | | U/W NOI Debt Yield: | | 11.0% |
Historical Performance and Underwritten Net Cash Flow. The following table presents certain information relating to the historical performance and underwritten net cash flow at the Rhino Portfolio 3 Properties:
Cash Flow Analysis(1)
| | 2019 (2)(3)(4)(5) | 2020 (2)(4)(5)(6) | 2021 (2)(5)(6) | 2022 (2)(5)(6)(7) | TTM (2)(5)(7)(8)(9) | U/W (9)(10) | U/W $ per SF | %(11) |
| Base Rent(12) | $7,201,962 | | $6,686,184 | | $8,829,116 | | $10,736,878 | | $12,497,389 | | $16,532,473 | | $15.02 | 69.0 | % |
| Vacancy Gross Up | 0 | | 0 | | 0 | | (129,222 | ) | (121,122 | ) | 1,124,185 | | 1.02 | 4.7 | |
| Percentage Rent | 932,589 | | 816,552 | | 1,090,781 | | 1,097,276 | | 911,033 | | 386,520 | | 0.35 | 1.6 | |
| Gross Potential Income | $8,134,551 | | $7,502,736 | | $9,919,897 | | $11,704,93 | 2 | $13,287,29 | 9 | $18,043,17 | 8 | $16.39 | 75.3 | % |
| Reimbursements | 2,625,722 | | 2,745,862 | | 2,630,876 | | 2,613,090 | | 3,477,130 | | 5,085,127 | | 4.62 | 21.2 | |
| Other Income | 450,847 | | 410,563 | | 663,751 | | 885,147 | | 826,299 | | 844,539 | | 0.77 | 3.5 | |
| Net Rental Income | $11,211,12 | 0 | $10,659,16 | 1 | $13,214,52 | 3 | $15,203,16 | 9 | $17,590,72 | 8 | $23,972,84 | 5 | $21.78 | 100.0 | % |
| (Vacancy/Credit Loss) | 0 | | 0 | | (15,461 | ) | (17,821 | ) | (31,172 | ) | (1,293,613 | ) | (1.18) | (5.4 | ) |
| Effective Gross Income | $11,211,12 | 0 | $10,659,16 | 1 | $13,199,06 | 2 | $15,185,34 | 8 | $17,559,556 | | $22,679,23 | 2 | $20.61 | 94.6 | % |
| Taxes | 1,631,953 | | 1,878,898 | | 1,759,616 | | 1,873,437 | | 1,827,842 | | 2,418,126 | | 2.20 | 10.7 | |
| Insurance | 128,124 | | 195,115 | | 269,696 | | 360,089 | | 474,087 | | 683,427 | | 0.62 | 3.0 | |
| Repairs and Maintenance | 1,691,427 | | 1,435,037 | | 1,893,006 | | 2,146,971 | | 2,259,882 | | 2,648,712 | | 2.41 | 11.7 | |
| Management Fee | 336,334 | | 319,775 | | 395,972 | | 455,560 | | 526,787 | | 667,385 | | 0.61 | 2.9 | |
| Other Expenses | 1,088,265 | | 1,063,706 | | 1,787,293 | | 1,580,817 | | 1,709,467 | | 1,173,248 | | 1.07 | 5.2 | |
| Total Expenses | $4,876,104 | | $4,892,530 | | $6,105,582 | | $6,416,874 | | $6,798,064 | | $7,590,897 | | $6.90 | 33.5 | % |
| Net Operating Income | $6,335,017 | | $5,766,630 | | $7,093,480 | | $8,768,474 | | $10,761,49 | 2 | $15,088,33 | 4 | $13.71 | 66.5 | % |
| TI/LC | 0 | | 0 | | 0 | | 0 | | 0 | | 841,335 | | 0.76 | 3.7 | |
| Cap Ex | 0 | | 0 | | 0 | | 0 | | 0 | | 220,888 | | 0.20 | 1.0 | |
| Net Cash Flow | $6,335,017 | | $5,766,630 | | $7,093,480 | | $8,768,474 | | $10,761,49 | 2 | $14,026,111 | | $12.74 | 61.8 | % |
| | | | | | | | | |
| NOI DSCR(13) | 0.66x | 0.60x | 0.74x | 0.91x | 1.12x | 1.57x | | |
| NCF DSCR(13) | 0.66x | 0.60x | 0.74x | 0.91x | 1.12x | 1.46x | | |
| NOI Debt Yield(13) | 4.6% | 4.2% | 5.2% | 6.4% | 7.8% | 11.0% | | |
| NCF Debt Yield(13) | 4.6% | 4.2% | 5.2% | 6.4% | 7.8% | 10.2% | | |
| (1) | Based on the underwritten rent rolls dated between November 24, 2023 and December 19, 2023. |
| (2) | Historical cash flows include a 35,000 square foot box that was formerly leased to UFC Gym, who was paying approximately $37,203 in monthly base rent, at the North Aurora mortgaged property and is no longer part of the collateral. The 35,000 square foot box has been vacant since 2021 and represents 3.2% of the total portfolio net rentable area. |
| (3) | 2019 cash flows exclude the Jackson mortgaged property. The sponsor acquired the property in 2019 and such information was not available. |
| (4) | 2019 and 2020 cash flows exclude the Blvd 2500 mortgaged property as the property was converted to multifamily usage in phases beginning in 2020. |
| (5) | The At Home - Arlington and Houma mortgaged properties were purchased in 2023. At Home – Arlington mortgaged property historical cash flows are unavailable prior to the TTM period. Houma mortgaged property historical cash flows are unavailable. |
| (6) | The increase from 2020 Net Operating Income to 2021 Net Operating Income is primarily driven by the inclusion of the Blvd 2500 mortgaged property cash flows. The increase from 2021 to 2022 cash flows is driven by increases in rental income at the Blvd 2500 mortgaged property as the property was reaching stabilization. |
| (7) | The increase from 2022 Net Operating Income to TTM Net Operating Income is primarily attributed to recent leasing at The Summit mortgaged property. The primary leases driving this growth include Columbia ($318,270 of underwritten base rent; lease commencement date of November 2022; 11,232 square feet), Lululemon Athletica ($208,029 of underwritten base rent; lease commencement date of December 2022; 6,249 square feet) and Five Below ($153,918 of underwritten base rent; lease commencement date of July 2022, 9,054 square feet). |
| (8) | TTM reflects the trailing 12 months ending in various dates from August 30, 2023 through September 30, 2023. |
| (9) | The increase from TTM Net Operating Income to Underwritten Net Operating Income is primarily attributed to recent leasing throughout the Rhino Portfolio 3 Properties. Recent leasing includes Dave and Busters ($473,666 of underwritten base rent; expected occupancy date of February 2025; 20,156 square feet), Burlington ($249,550 of underwritten base rent; expected occupancy date of July 2024; 21,700 square feet), Petco ($262,977 of underwritten base rent; expected occupancy date of July 2024; 13,486 square feet), Kids Empire ($190,076 of underwritten base rent; expected occupancy date of June 2024; 10,004 square feet), Golf X ($172,632 of underwritten base rent; occupancy date of February 2024; 7,193 square feet) and Starbucks ($155,234 of underwritten base rent; expected occupancy date of June 2024; 2,465 square feet). |
| (10) | The underwritten cash flow includes 14 tenants in occupancy totaling 121,644 square feet accounting for approximately $2.5 million in base rent that have executed leases but are not yet occupying their space. |
| (11) | % column represents percentage of Net Rental Income for all revenue lines and represents percentage of Effective Gross Income for the remaining fields. |
| (12) | Includes rent steps through January 2025 and average straight line rent for investment-grade tenants. |
| (13) | Debt service coverage ratios and debt yields are based on the Rhino Portfolio 3 Whole Loan. |
Appraisal. The appraiser concluded to an “As-Is with Escrow Reserve” appraised value for the Rhino Portfolio 3 Properties of $220,113,997 per the individual appraisals dated between October 5, 2023 and October 27, 2023. The appraised value represents the “As-Is with Escrow Reserve” value, which includes the extraordinary assumption that certain escrows have been reserved for tenant improvements and leasing commissions, gap rent and free rent associated with the lease up of various tenant spaces in an estimated aggregate amount of $14,863,997. At origination of the Rhino Portfolio 3 Whole Loan, the borrowers deposited with the lender
| THE INFORMATION IN THIS STRUCTURAL AND COLLATERAL TERM SHEET IS NOT COMPLETE AND MAY BE AMENDED PRIOR TO THE TIME OF SALE. THIS TERM SHEET IS NOT AN OFFER TO SELL THESE SECURITIES AND IT IS NOT A SOLICITATION OF AN OFFER TO BUY THESE SECURITIES IN ANY JURISDICTION WHERE THE OFFER OR SALE IS NOT PERMITTED. |
| | 140 | |
| Property Type – Various | Loan #10 | Cut-off Date Balance: | | $37,150,000 |
| Property Addresses – Various | Rhino Portfolio 3 | Cut-off Date LTV: | | 62.3% |
| Various, Various | | U/W NCF DSCR: | | 1.46x |
| | | U/W NOI Debt Yield: | | 11.0% |
approximately (i) $11,354,360 for outstanding tenant improvement work and leasing commission obligations, (ii) $2,278,509 for gap rent, (iii) $136,064 for free rent and (iv) $1,300,000 for an earnout reserve related to the Trader Joe’s lease.
Environmental Matters. According to the Phase I environmental reports dated between October 12, 2023 and November 8, 2023, there were no recognized environmental conditions at the Rhino Portfolio 3 Properties.
Market Overview and Competition. The Rhino Portfolio 3 Properties consist of seven properties located across six different states and seven different submarkets. The Rhino Portfolio 3 Properties are located in submarkets with vacancy rates ranging from 2.00% to 7.70% and average market retail market rents per square foot ranging from $6.00 to $35.05.
The following table presents certain market information relating to the Rhino Portfolio 3 Properties:
| Market Summary(1) |
| Property Name | Location | Market | Submarket | UW Rental Rate PSF(2) | Market Rent Rate PSF | Average Submarket Vacancy |
| The Summit | Reno, NV | Reno/Sparks | South Reno | $25.03 | $35.05 | 2.80% |
| Blvd 2500 | Albuquerque, NM | Albuquerque | East Albuquerque | $840(3) | $814(3) | 7.70% |
| Jackson | Jackson, MI | West Michigan | Jackson County | $9.86 | $10.65 | 3.80% |
| Haymarket | Des Moines, IA | Des Moines | Western Suburbs | $6.76 | $7.02 | 3.70% |
| North Aurora | North Aurora, IL | Chicago | Western East/West Corridor | $9.60 | $11.52 | 6.50% |
| At Home – Arlington | Arlington Heights, IL | Chicago | Schaumburg Area | $7.00 | $7.00 | 5.70% |
| Houma | Houma, LA | Houma-Thibodaux MSA | City of Houma | $5.67 | $6.00 | 2.00% |
| (1) | Source: Appraisals dated from October 5, 2023 through October 27, 2023. |
| (2) | Based on the underwritten rent rolls dated between November 24, 2023 and December 19, 2023. |
| (3) | Calculated based on multifamily units. |
The Summit
The Property. The Summit mortgaged property is a 391,416 square foot anchored retail shopping center in Reno, Nevada. The Summit mortgaged property represents 64.6% of the ALA of the Rhino Portfolio 3 Whole Loan and 58.1% of the underwritten base rent of the Rhino Portfolio 3 Properties. The Summit mortgaged property was 96.5% leased to 76 unique tenants as of December 12, 2023 and has a weighted average lease term remaining of approximately 6.3 years based on square feet. The Summit mortgaged property spans across 14 existing buildings with an additional two buildings that are expected to be completed in 2024. Dave and Busters (20,156 square feet) and Starbucks (2,465 square feet) both have executed leases and are expected to take occupancy in May 2024 and June 2024, respectively.
The Summit mortgaged property is anchored by Century Theatres, Old Navy, Petco and Apple. Additionally, Trader Joe’s executed a lease at The Summit mortgaged property consisting of 14,850 square feet and is expected to take occupancy in November 2024. The lease has a 10-year term along with four, five-year renewal options. Rent will be fixed at $24.00 per square foot for the first five years of the lease, followed by escalations based on the Consumer Price Index during the initial five-year period subject to a cap of 10%. At origination, $1,300,000 was reserved upfront as a holdback contingent on Trader Joe’s taking occupancy at The Summit mortgaged property, among other conditions described in the “Escrows and Reserves” section.
| THE INFORMATION IN THIS STRUCTURAL AND COLLATERAL TERM SHEET IS NOT COMPLETE AND MAY BE AMENDED PRIOR TO THE TIME OF SALE. THIS TERM SHEET IS NOT AN OFFER TO SELL THESE SECURITIES AND IT IS NOT A SOLICITATION OF AN OFFER TO BUY THESE SECURITIES IN ANY JURISDICTION WHERE THE OFFER OR SALE IS NOT PERMITTED. |
| | 141 | |
| Property Type – Various | Loan #10 | Cut-off Date Balance: | | $37,150,000 |
| Property Addresses – Various | Rhino Portfolio 3 | Cut-off Date LTV: | | 62.3% |
| Various, Various | | U/W NCF DSCR: | | 1.46x |
| | | U/W NOI Debt Yield: | | 11.0% |
The following tables present sales information relating to The Summit mortgaged property:
| The Summit Sales(1) |
| | 2020 | 2021 | 2022 | TTM(2) |
| Gross Sales | $68,639,265 | $107,347,668 | $120,781,983 | $120,356,495 |
| Gross Sales (Ex-Apple) | $47,769,767 | $68,235,754 | $77,401,472 | $76,126,593 |
| Sales PSF (Inline < 10,000 SF) | $491 | $774 | $813 | $877 |
| Sales PSF (Inline < 10,000 SF, Ex-Apple) | $344 | $487 | $515 | $549 |
| Occupancy Cost (Inline < 10,000 SF) | 7.2% | 4.6% | 4.4% | 4.2% |
| Occupancy Cost (Inline < 10,000 SF, Ex-Apple) | 10.1% | 7.1% | 6.8% | 6.5% |
| (1) | Excludes certain tenants at The Summit mortgaged property that are either vacant or not reporting sales for a given period. |
| (2) | TTM reporting periods range from the period ending June through December 2023. |
| The Summit Major Tenant Sales(1) |
| Tenant Name | Net Rentable Area (SF) | 2020 | 2021 | 2022 | TTM 2023(2) | TTM 2023 Sales PSF(2) | Occ. Cost% |
| Century Theatres | 49,605 | $1,984,765 | $4,084,290 | $6,049,681 | $6,320,332 | $395,021(3) | 18.9% |
| Old Navy | 17,046 | $3,288,765 | $3,882,430 | $2,776,275 | $2,911,392 | $171 | 10.4% |
| Pottery Barn | 11,597 | $3,368,575 | $4,777,101 | $5,351,891 | $5,110,816 | $441 | 5.8% |
| Apple | 8,325 | $20,869,498 | $39,111,914 | $43,380,511 | $44,229,902 | $5,313 | 0.9% |
| Lululemon Athletica | 6,249 | $4,976,192 | $6,315,146 | $8,662,650 | $9,519,904 | $1,523 | 2.6% |
| Victoria’s Secret | 6,034 | $1,670,778 | $2,424,557 | $2,190,352 | $2,124,442 | $352 | 8.4% |
| Reno Running Company | 5,648 | $1,347,456 | $1,785,016 | $2,156,896 | $1,848,922 | $327 | 8.8% |
| Williams-Sonoma | 5,537 | $2,044,068 | $3,194,455 | $3,375,589 | $3,419,926 | $618 | 5.2% |
| Land Ocean | 5,154 | $3,056,017 | $4,612,620 | $5,281,065 | $5,432,479 | $1,054 | 3.3% |
| Sephora | 4,803 | $2,479,560 | $3,375,681 | $4,963,863 | $5,645,430 | $1,175 | 3.7% |
| (1) | All sales information is based upon information provided by the borrower sponsor. This table represents the largest tenants by square feet among tenants who report sales at The Summit mortgaged property. |
| (2) | TTM 2023 sales are as of various dates from June through December 2023. |
| (3) | TTM 2023 Sales PSF for Century Theatres is calculated based on the number of screens. There are 16 screens total. |
| THE INFORMATION IN THIS STRUCTURAL AND COLLATERAL TERM SHEET IS NOT COMPLETE AND MAY BE AMENDED PRIOR TO THE TIME OF SALE. THIS TERM SHEET IS NOT AN OFFER TO SELL THESE SECURITIES AND IT IS NOT A SOLICITATION OF AN OFFER TO BUY THESE SECURITIES IN ANY JURISDICTION WHERE THE OFFER OR SALE IS NOT PERMITTED. |
| | 142 | |
| Property Type – Various | Loan #10 | Cut-off Date Balance: | | $37,150,000 |
| Property Addresses – Various | Rhino Portfolio 3 | Cut-off Date LTV: | | 62.3% |
| Various, Various | | U/W NCF DSCR: | | 1.46x |
| | | U/W NOI Debt Yield: | | 11.0% |
The following table presents information relating to the largest tenants at The Summit mortgaged property:
The Summit Major Tenant Summary(1) |
| Tenant | Ratings
Moody’s/S&P/Fitch(2) | Net Rentable Area (SF) | % of
Total NRA | UW Base Rent PSF(3) | UW Base Rent(3) | % of Total
UW Base Rent(3) | Lease
Exp. Date |
| Century Theatres | NR / NR / NR | 49,605 | 12.7 | % | $16.39 | $812,830 | 8.3 | % | 5/31/2027 |
| Dave and Busters | NR / NR / NR | 20,156 | 5.1 | | $23.50 | $473,666 | 4.8 | | 1/31/2040 |
| Old Navy | NR / NR / NR | 17,046 | 4.4 | | $10.00 | $170,460 | 1.7 | | 4/30/2029 |
| Trader Joe's | NR / NR / NR | 14,850 | 3.8 | | $24.00 | $356,400 | 3.6 | | 11/14/2034 |
| Petco | B3 / B / NR | 13,486 | 3.4 | | $19.50 | $262,977 | 2.7 | | 6/30/2034 |
| Pottery Barn | NR / NR / NR | 11,597 | 3.0 | | $18.30 | $212,257 | 2.2 | | 1/31/2025 |
| Columbia | NR / NR / NR | 11,232 | 2.9 | | $28.34 | $318,270 | 3.2 | | 11/30/2032 |
| Ulta | NR / NR / NR | 11,183 | 2.9 | | $22.00 | $246,026 | 2.5 | | 7/31/2029 |
| Mount Rose Medical Group | NR / NR / NR | 9,712 | 2.5 | | $22.59 | $219,394 | 2.2 | | 1/31/2029 |
| Five Below | NR / NR / NR | 9,054 | 2.3 | | $17.00 | $153,918 | 1.6 | | 7/31/2032 |
| Major Tenants | 167,921 | 42.9 | % | $19.21 | $3,226,198 | 32.8% | |
| Other Tenants | | 209,766 | 53.6 | % | $31.46 | $6,600,015 | 67.2% | |
| Occupied Collateral Total | | 377,687 | 96.5 | % | $26.02 | $9,826,212 | 100.0% | |
| Vacant Space | | 13,729 | 3.5 | % | | | | |
| Collateral Total | | 391,416 | 100.0 | % | | | | |
| | | | | | | | |
| (1) | Based on the underwritten rent roll dated December 12, 2023. Information in this table includes underwritten rent attributed to 9 tenants totaling 69,763 square feet representing approximately $1.9 million of underwritten base rent which have executed leases but have not yet taken occupancy of their space. Included among those tenants are Dave and Busters, Trader Joe’s and Petco. |
| (2) | In certain instances, ratings provided are for the parent company of the entity listed in the “Tenant” field whether or not the parent company guarantees the lease. |
| (3) | Includes $374,051 of percentage rent which is attributed to DeVon’s Jewelers ($180,000), Land Ocean ($91,624), Sephora ($50,940), Lululemon ($40,000), Aveda/Tangerine Salon Spa ($9,508) and Burger Me ($1,980). |
The Market. The Summit mortgaged property, representing 64.6% of the ALA of the Rhino Portfolio 3 Whole Loan, is located in Reno, Nevada. Additionally, The Summit mortgaged property is located in the South Reno submarket which is within the greater Reno/Sparks market. In the past decade, the local population in the market grew at more than double the US average rate. Reno has experienced increased demand in the tech sector in recent years. In 2020, Google announced its plans to invest $600 million in a data center in Reno. In 2023, Tesla revealed its plans of investing more than $3.6 billion into its Reno, Nevada gigafactory. In addition, Reno’s geographical position allows for travel to 11 different states within one day via ground transportation. This has fueled warehouse and distribution job growth which has coincided with a shift towards e-commerce. The Summit mortgaged property is an approximately 15-to-20-minute drive from both the Reno central business district and the Reno-Tahoe International Airport.
The vacancy rate in the Reno/Sparks retail market is 4.9% while rents have grown by 5.0% which is well above the national average of 3.4%. Asking rent per square foot in the Reno/Sparks market has increased from $17.08 to $18.73 from the first quarter of 2021 to the third quarter of 2023. According to the appraisal, the 2023 population within a one-, three- and five-mile radius of The Summit mortgaged property was 7,623, 49,715 and 72,376, respectively. The 2023 average household income within the same radii was $130,006, $148,721 and $151,830, respectively.
The following table presents information relating to the appraisal’s market rent conclusion for The Summit mortgaged property:
| Market Rent Summary(1) |
| Category | Net Rentable Area (SF) | Market Rent (PSF) | Lease Type (Reimbursements) | Rent Increase Projection | Lease Term | Tenant Improvements (New/Renewal) | Leasing Commissions (New/Renewal) |
| Shops Space | 205,816 | $38.00 | Modified Gross | 3.0% per year | 5 years | $20.00 / $5.00 | 6.0% / 3.0% |
| Premium Shops Space | 42,603 | $49.00 | Modified Gross | 3.0% per year | 5 years | $40.00 / $5.00 | 6.0% / 3.0% |
| Small Major Space | 52,778 | $26.00 | Modified Gross | 10.0% every 5 years | 10 years | $15.00 / $5.00 | 6.0% / 3.0% |
| Major Space | 37,202 | $24.00 | Modified Gross | 10.0% every 5 years | 10 years | $10.00 / $5.00 | 6.0% / 3.0% |
| Theater Space | 49,605 | $28.00 | Modified Gross | 10.0% every 5 years | 10 years | $20.00 / $5.00 | 6.0% / 3.0% |
| Pad Restaurant Space | 2,465 | $50.00 | Modified Gross | 3.0% per year | 10 years | $40.00 / $5.00 | 6.0% / 3.0% |
| (1) | Source: Appraisal unless otherwise noted. |
| THE INFORMATION IN THIS STRUCTURAL AND COLLATERAL TERM SHEET IS NOT COMPLETE AND MAY BE AMENDED PRIOR TO THE TIME OF SALE. THIS TERM SHEET IS NOT AN OFFER TO SELL THESE SECURITIES AND IT IS NOT A SOLICITATION OF AN OFFER TO BUY THESE SECURITIES IN ANY JURISDICTION WHERE THE OFFER OR SALE IS NOT PERMITTED. |
| | 143 | |
| Property Type – Various | Loan #10 | Cut-off Date Balance: | | $37,150,000 |
| Property Addresses – Various | Rhino Portfolio 3 | Cut-off Date LTV: | | 62.3% |
| Various, Various | | U/W NCF DSCR: | | 1.46x |
| | | U/W NOI Debt Yield: | | 11.0% |
Escrows. At origination, the borrowers deposited into escrow (i) approximately $11,354,360 for upfront TI/LCs, (ii) approximately $2,278,509 for gap rent, (iii) $136,064 for free rent, (iv) $1,300,000 for a Trader Joe’s earnout reserve, (v) $512,570 for static insurance, (vi) $404,449 for taxes and (vii) $107,625 for deferred maintenance.
Tax Escrows – On a monthly basis, the borrowers are required to escrow 1/12th of the annual estimated tax payments, which currently equates to approximately $201,224.
Insurance Escrows – If there is no approved blanket policy in place, the borrowers are required to escrow 1/12th of the annual estimated insurance payments on a monthly basis.
Replacement Reserves – On a monthly basis, the borrowers are required to escrow approximately $18,407 ($0.15 per square foot) for replacement reserves.
TI/LC Reserves – The borrowers are required to make monthly deposits into the TI/LC reserve in an amount equal to $61,203 ($0.75 per square foot) subject to a cap of approximately $2,203,325 (three years of collections).
Trader Joe’s Earnout Reserve – The borrowers deposited $1,300,000 at origination of the Rhino Portfolio 3 Whole Loan into an earnout reserve. The lender will disburse the upfront reserve deposit upon satisfaction of the following conditions: (i) no event of default, (ii) a Trader Joe’s Holdback Satisfaction Event (as defined below) has occurred and (iii) the borrowers deliver to the lender evidence of the Trader Joe’s Holdback Satisfaction Event.
A “Trader Joe’s Holdback Satisfaction Event” means each of the following has occurred: (i) the primary term of the Trader Joe’s lease has commenced and the lease is in full force and effect, (ii) Trader Joe’s is open for business, (iii) the borrowers have performed and paid for all tenant improvement obligations with respect to the Trader Joe’s lease, (iv) Trader Joe’s is paying full, unabated rent under the Trader Joe’s lease, (v) the borrowers deliver to the lender an estoppel from Trader Joe’s and (vi) the net cash flow debt yield is equal to or greater than 10.0%.
Lockbox and Cash Management. The Rhino Portfolio 3 Whole Loan documents require a soft, springing hard lockbox, with springing cash management. Prior to a Trigger Period (as defined below), all rents received by the borrower or property manager will be deposited into the lockbox account within one business day of receipt. Commencing at the first Trigger Period, the borrowers are required to instruct all tenants to deposit rent directly to the lockbox account. So long as a Trigger Period is not continuing, funds in the lockbox account will be transferred to the borrowers’ operating account on each business day. Upon the occurrence and during the continuance of a Trigger Period, all funds in the lockbox account are required to be swept on each business day to a lender-controlled cash management account to be applied and disbursed in accordance with the Rhino Portfolio 3 Whole Loan documents, and all excess cash flow funds remaining in the cash management account after the application of such funds will be applied in accordance with the Rhino Portfolio 3 Whole Loan documents.
A “Trigger Period” will commence upon the earliest of (i) an event of default or (ii) the net cash flow debt service coverage ratio (“DSCR”) being less than 1.10x, based on a 30 year amortization schedule, and will expire upon (x) with regard to clause (i), the cure of such event of default, and (y) with regard to clause (ii), the date that the DSCR is equal to or greater than 1.15x for two consecutive calendar quarters, based on a 30 year amortization schedule.
Property Management. The Rhino Portfolio 3 Properties are managed by various third-party management companies that are not affiliated with the borrower sponsor.
Partial Release. Provided that no event of default exists, after January 6, 2026, the borrowers may obtain the release of the Houma mortgaged property, the At Home - Arlington mortgaged property and/or the North Aurora mortgaged property, upon the satisfaction of certain conditions, including, among other conditions: (i) payment of a release price in an amount equal to the greater of (a) 115% of the ALA of the property being released and (b) net proceeds received in connection with the sale of the individual mortgaged property; (ii) if such partial release occurs prior to the open date, which is the payment date occurring in July 2033, payment of the yield maintenance premium; (iii) the debt service coverage ratio, based on a 30 year amortization schedule is equal to or greater than (a) 1.26x, which nets out the $1.3 million Trader Joe’s earnout reserve upfront deposit from such calculation as of the origination date, and (b) the DSCR for the remaining mortgaged properties for the 12 months immediately preceding the release; (iv) the loan-to-value ratio for the remaining mortgaged properties is no greater than the lesser of (a) 61.7%, which nets out the $1.3 million Trader Joe’s earnout reserve upfront deposit from such calculation as of the origination date, and (b) the loan-to-value ratio for the remaining mortgaged properties immediately preceding the release; (v) the net cash flow debt yield is equal to the greater of (a) 10.0%, which nets out the $1.3 million Trader Joe’s earnout reserve upfront deposit from such calculation as of the origination date, and (b) the net cash flow debt yield for the remaining mortgaged properties for the 12 months immediately preceding the release; and (vi) satisfaction of all REMIC requirements.
Additionally, provided that no event of default exists, the borrowers may obtain a release of two designated outparcels consisting of (A) of unimproved land (“BLVD 2500 Tract 1”) and (B) a 47-space surface parking lot (“BLVD 2500 Tract 3”) located at the Blvd 2500 mortgaged property upon the satisfaction of certain conditions, including, among other conditions: (i) in connection with a release of BLVD Tract 3, payment of a release price in connection with BLVD 2500 Tract 3 equal to the greater of (a) 100% of the appraised value of BLVD 2500 Tract 3 and (b) 100% of the net sales proceeds of BLVD 2500 Tract 3, together with the payment of the applicable yield maintenance premium (provided that no payment is required in connection with a release of BLVD Tract 1); and (ii) after giving
| THE INFORMATION IN THIS STRUCTURAL AND COLLATERAL TERM SHEET IS NOT COMPLETE AND MAY BE AMENDED PRIOR TO THE TIME OF SALE. THIS TERM SHEET IS NOT AN OFFER TO SELL THESE SECURITIES AND IT IS NOT A SOLICITATION OF AN OFFER TO BUY THESE SECURITIES IN ANY JURISDICTION WHERE THE OFFER OR SALE IS NOT PERMITTED. |
| | 144 | |
| Property Type – Various | Loan #10 | Cut-off Date Balance: | | $37,150,000 |
| Property Addresses – Various | Rhino Portfolio 3 | Cut-off Date LTV: | | 62.3% |
| Various, Various | | U/W NCF DSCR: | | 1.46x |
| | | U/W NOI Debt Yield: | | 11.0% |
effect to such release, (x) the net cash flow debt yield is greater than or equal to (1) 10.0%, which excludes the $1.3 million Trader Joe’s earnout reserve upfront deposit from such calculation as of the origination date, and (2) the net cash flow debt yield immediately preceding such release, (y) the DSCR based on a 30 year amortization schedule is greater than or equal to (1) 1.26x, which excludes the $1.3 million Trader Joe’s earnout reserve upfront deposit from such calculation as of the origination date, and (2) the DSCR immediately preceding such release, and (z) the loan-to-value ratio is less than or equal to (1) 61.7%, which excludes the $1.3 million Trader Joe’s earnout reserve upfront deposit from such calculation as of the origination date, and (2) the loan-to-value ratio immediately preceding such release.
Real Estate Substitution. Not permitted.
Subordinate and Mezzanine Indebtedness. From and after the date that is two years following the date on which a securitization has occurred, a mezzanine loan is permitted provided that each of the following conditions, among others as described in the Rhino Portfolio 3 Whole Loan documents, are satisfied: (i) no event of default has occurred or is continuing; (ii) the combined loan to value ratio is less than or equal to 61.7%, which excludes the $1.3 million Trader Joe’s earnout reserve upfront deposit from such calculation as of the origination date; (iii) the net cash flow debt yield as of the date of closing of the proposed permitted mezzanine loan (without giving effect to the permitted mezzanine loan) is equal to or greater than 10.0%, which nets out the $1.3 million Trader Joe’s earnout reserve upfront deposit from such calculation as of the origination date, and (iv) the combined debt service coverage ratio is equal to or greater than 1.26x, which nets out the $1.3 million Trader Joe’s earnout reserve upfront deposit from such calculation as of the origination date.
Ground Lease. None.
Right of First Offer / Right of First Refusal. None.
Terrorism Insurance. The borrower is required to obtain and maintain property insurance and business interruption insurance for 18 months plus a six-month extended period of indemnity. Such insurance is required to cover perils of terrorism and acts of terrorism. See “Risk Factors—Risks Relating to the Mortgage Loans—Terrorism Insurance May Not Be Available for All Mortgaged Properties” in the Preliminary Prospectus.
| THE INFORMATION IN THIS STRUCTURAL AND COLLATERAL TERM SHEET IS NOT COMPLETE AND MAY BE AMENDED PRIOR TO THE TIME OF SALE. THIS TERM SHEET IS NOT AN OFFER TO SELL THESE SECURITIES AND IT IS NOT A SOLICITATION OF AN OFFER TO BUY THESE SECURITIES IN ANY JURISDICTION WHERE THE OFFER OR SALE IS NOT PERMITTED. |
| | 145 | |
| No. #11 – Anaheim Desert Palm Hotel & Suites |
| |
| Mortgage Loan Information | | Mortgaged Property Information |
| Mortgage Loan Seller: | Wells Fargo Bank, National Association | | Single Asset/Portfolio: | Single Asset |
Credit Assessment (Fitch/KBRA/Moody’s): | NR/BBB+(sf/)A1(sf) | | Property Type – Subtype: | Hospitality – Limited Service |
| Original Principal Balance: | $29,975,000 | | Location: | Anaheim, CA |
| Cut-off Date Balance: | $29,975,000 | | Size: | 196 Rooms |
| % of Initial Pool Balance: | 2.8% | | Cut-off Date Balance Per Room: | $152,934 |
| Loan Purpose: | Refinance | | Maturity Date Balance Per Room: | $152,934 |
| Borrower Sponsors: | Arun H. Patel and Shirish H. Patel | | Year Built/Renovated: | 1988/2004 |
| Guarantors: | Arun H. Patel and Shirish H. Patel | | Title Vesting: | Fee |
| Mortgage Rate: | 6.7270% | | Property Manager: | Hansji Corporation |
| Note Date: | May 1, 2024 | | Current Occupancy (As of): | 82.1% (3/31/2024) |
| Seasoning: | 1 month | | YE 2023 Occupancy: | 81.9% |
| Maturity Date: | May 11, 2034 | | YE 2022 Occupancy(3): | 84.0% |
| IO Period: | 120 months | | YE 2021 Occupancy(3): | 47.2% |
| Loan Term (Original): | 120 months | | YE 2020 Occupancy(3): | 15.6% |
| Amortization Term (Original): | NAP | | As-Is Appraised Value: | $68,800,000 |
| Loan Amortization Type: | Interest Only | | As-Is Appraised Value Per Room: | $351,020 |
| Call Protection: | L(25),D(91),O(4) | | As-Is Appraisal Valuation Date: | March 19, 2024 |
| Lockbox Type: | Springing | | Underwriting and Financial Information |
| Additional Debt: | None | | TTM NOI (3/31/2024): | $6,876,254 |
| Additional Debt Type (Balance): | NAP | | YE 2023 NOI: | $6,666,124 |
| | | | YE 2022 NOI(3): | $6,298,390 |
| | | | YE 2021 NOI(3): | $2,513,365 |
| | | | U/W Revenues: | $13,827,075 |
| | | | U/W Expenses: | $6,946,109 |
| | | U/W NOI: | $6,880,965 |
| Escrows and Reserves | | U/W NCF: | $6,327,882 |
| | Initial | Monthly | Cap | | U/W DSCR based on NOI/NCF: | 3.37x / 3.10x |
| Taxes: | $55,884 | $27,942 | NAP | | U/W Debt Yield based on NOI/NCF: | 23.0% / 21.1% |
| Insurance(1): | $0 | Springing | NAP | | U/W Debt Yield at Maturity based on NOI/NCF: | 23.0% / 21.1% |
| FF&E Reserve(2): | $0 | $34,568 | NAP | | Cut-off Date LTV Ratio: | 43.6% |
| | | | | | LTV Ratio at Maturity: | 43.6% |
| | | | | | | | |
| Sources and Uses |
| Sources | | | | | Uses | | | |
| Mortgage Loan | $29,975,000 | | 100.0% | | Loan Payoff | $24,676,756 | | 82.3% |
| | | | | | Return of Equity | 4,846,884 | | 16.2 |
| | | | | | Closing Costs | 395,477 | | 1.3 |
| | | | | | Reserves | 55,884 | | 0.2 |
| Total Sources | $29,975,000 | | 100.0% | | Total Uses | $29,975,000 | | 100.0% |
| (1) | The loan documents do not require ongoing monthly insurance reserves; provided (i) no event of default is continuing, (ii) the borrower maintains insurance coverage for the Anaheim Desert Palm Hotel & Suites Property (as defined below) as part of blanket or umbrella coverage reasonably approved by the lender and (iii) the borrower provides the lender with evidence of the renewals of the insurance policies and paid receipts for the payment of the insurance premiums no later than 10 business days prior to the expiration dates of the policies. |
| (2) | The loan documents require ongoing monthly reserve deposits equal to the greater of (i) the then-existing FF&E reserve monthly deposit; or (ii) 1/12th of 3% of the trailing 12-month underwritten revenue for the prior fiscal quarter. The monthly reserve amount is initially estimated at $34,568. |
| (3) | The increase in occupancy from YE 2020 to YE 2021 and YE 2021 to YE 2022 and the increase from YE 2021 NOI and YE 2022 NOI is primarily attributable to increases in room revenue following the impact of the COVID-19 pandemic in 2020 and 2021. |
The Mortgage Loan. The eleventh largest mortgage loan (the “Anaheim Desert Palm Hotel & Suites Mortgage Loan”) is evidenced by a promissory note in the original principal amount of $29,975,000 and is secured by the borrower’s fee interest in the Anaheim Desert Palm Hotel & Suites, a 196 room limited service hotel located in Anaheim, California (the “Anaheim Desert Palm Hotel & Suites Property”).
The Borrower and Borrower Sponsors. The borrower is Desert Palm Suites LP (the “Anaheim Desert Palm Hotel & Suites Borrower”), a California limited partnership with one independent director. Legal counsel to the borrower delivered a non-consolidation opinion in connection with the origination of the Anaheim Desert Palm Hotel & Suites Mortgage Loan. The borrower sponsors and non-recourse carveout guarantors are Arun H. Patel and Shirish H. Patel.
Shirish Hansji Patel founded the Hansji Corporation in 1974, which is headquartered in Anaheim, California and currently owns 25 different commercial real estate properties. Hansji Corporation has both operated and developed hospitality chains such as Hilton and
| THE INFORMATION IN THIS STRUCTURAL AND COLLATERAL TERM SHEET IS NOT COMPLETE AND MAY BE AMENDED PRIOR TO THE TIME OF SALE. THIS TERM SHEET IS NOT AN OFFER TO SELL THESE SECURITIES AND IT IS NOT A SOLICITATION OF AN OFFER TO BUY THESE SECURITIES IN ANY JURISDICTION WHERE THE OFFER OR SALE IS NOT PERMITTED. |
| | 146 | |
| Hospitality – Limited Service | Loan #11 | Cut-off Date Balance: | | $29,975,000 |
| 631 West Katella Avenue | Anaheim Desert Palm Hotel & Suites | Cut-off Date LTV: | | 43.6% |
| Anaheim, CA 92802 | | U/W NCF DSCR: | | 3.10x |
| | | U/W NOI Debt Yield: | | 23.0% |
Marriott. The Hansji Corporation is currently led by Shirish Patel’s son, Rajan Hansji, President & CEO, who is responsible for oversight of Hansji’s investment, development, and management operations.
The Property. The Anaheim Desert Palm Hotel & Suites Property is a 196-room limited service hotel built in 1988 and expanded in 2004. The Anaheim Desert Palm Hotel & Suites Property features various amenities including an on-site restaurant, meeting space, market/pantry, breakfast dining area with complimentary breakfast, outdoor pool and whirlpool, fitness center, a guest laundry area, and vending areas. The Anaheim Desert Palm Hotel & Suites Property guestroom configuration consists of 65 deluxe double queen rooms, 13 family suites with 2 bedrooms and 2 bathrooms, 3 king suites, 41 mini suite/sunken level rooms, 20 kitchenette suite rooms, 39 kids suite king/bunk rooms, 7 kids suite double queen/sofa/bunk rooms and 8 deluxe king rooms. The property has an onsite parking garage with 157 spaces.
As of March 31, 2024, the Anaheim Desert Palm Hotel & Suites Property had a trailing 12-month occupancy of 82.1%, ADR of $218.69 and RevPAR of $179.45.
The following table presents certain information relating to the performance of the Anaheim Desert Palm Hotel & Suites Property:
| Historical Occupancy, ADR, RevPAR(1)(2) |
| | | Competitive Set | | Anaheim Desert Palm Hotel & Suites Property | | Penetration Factor |
| Year | | Occupancy | ADR | RevPAR | | Occupancy | ADR | RevPAR | | Occupancy | ADR | RevPAR |
| 12/31/2021 | | 56.5% | $140.41 | $79.38 | | 67.8% | $171.91 | $116.54 | | 119.9% | 122.4% | 146.8% |
| 12/31/2022 | | 76.5% | $180.27 | $137.95 | | 84.0% | $201.07 | $168.85 | | 109.7% | 111.5% | 122.4% |
| 12/31/2023 | | 78.5% | $188.36 | $147.86 | | 81.9% | $216.68 | $177.48 | | 104.3% | 115.0% | 120.0% |
| 3/31/2024 TTM | | 79.1% | $191.57 | $151.44 | | 81.7% | $220.38 | $180.07 | | 103.4% | 115.0% | 118.9% |
| (1) | Data obtained from third-party hospitality research reports. Variances between underwriting and the industry report data are attributable to variances in reporting methodology and/or timing differences. |
| (2) | The competitive set consists of the following hotels: Hotel Lulu, BW Premier Collection, Clementine Hotel & Suites, Hilton Garden Inn Anaheim Garden Grove, Portofino Inn & Suites Anaheim, Courtyard Anaheim Resort Convention Center, Homewood Suites by Hilton Anaheim Resort Convention Center. |
The following table presents historical occupancy percentages at Anaheim Desert Palm Hotel & Suites Property:
Historical Occupancy(1)
12/31/2020(2) | 12/31/2021(2) | 12/31/2022(2) | 12/31/2023 | TTM 3/31/2024 |
| 15.6% | 47.2% | 84.0% | 81.9% | 82.1% |
| (1) | Information obtained from the borrower. |
| (2) | The increase in occupancy from 12/31/2020 to 12/31/2021 and from 12/31/2021 to 12/31/2022 is primarily attributable to increases in room revenue following the impact of the COVID-19 pandemic in 2020 and 2021. |
| THE INFORMATION IN THIS STRUCTURAL AND COLLATERAL TERM SHEET IS NOT COMPLETE AND MAY BE AMENDED PRIOR TO THE TIME OF SALE. THIS TERM SHEET IS NOT AN OFFER TO SELL THESE SECURITIES AND IT IS NOT A SOLICITATION OF AN OFFER TO BUY THESE SECURITIES IN ANY JURISDICTION WHERE THE OFFER OR SALE IS NOT PERMITTED. |
| | 147 | |
| Hospitality – Limited Service | Loan #11 | Cut-off Date Balance: | | $29,975,000 |
| 631 West Katella Avenue | Anaheim Desert Palm Hotel & Suites | Cut-off Date LTV: | | 43.6% |
| Anaheim, CA 92802 | | U/W NCF DSCR: | | 3.10x |
| | | U/W NOI Debt Yield: | | 23.0% |
Operating History and Underwritten Net Cash Flow. The following table presents certain information relating to the historical operating performance and underwritten net cash flow at the Anaheim Desert Palm Hotel & Suites Property:
Cash Flow Analysis
| | 2021 | 2022 | 2023 | TTM 3/31/2024 | U/W | % of U/W Total Revenue(1) | U/W $ per Room |
| Occupancy | 47.2% | 84.0% | 81.9% | 82.1% | 82.1% | | |
| ADR | $171.85 | $200.51 | $215.96 | $218.69 | $218.69 | | |
| RevPAR | $81.07 | $168.39 | $176.85 | $179.45 | $179.45 | | |
| | | | | | | | |
| Room Revenue | $5,799,723 | $12,046,330 | $12,652,135 | $12,872,726 | $12,837,555 | 92.8% | $65,498 |
| Other Income | 596,754 | 977,465 | 995,555 | 1,021,229 | 989,520 | 7.2 | 5,049 |
| Total Revenue | $6,396,477 | $13,023,795 | $13,647,690 | $13,893,955 | $13,827,075 | 100.0% | $70,546 |
| | | | | | | | |
| Room Expense | 1,855,220 | 3,483,961 | 3,500,630 | 3,447,924 | 3,438,503 | 26.8 | 17,543 |
| Other Expense | 3,917 | 5,722 | 3,321 | 2,111 | 2,045 | 0.2 | 10 |
| Total Department Expenses | $1,859,137 | $3,489,683 | $3,503,951 | $3,450,035 | $3,440,549 | 24.9% | $17,554 |
| Departmental Profit | $4,537,340 | $9,534,112 | $10,143,739 | $10,443,920 | $10,386,526 | 75.1% | $52,992 |
| | | | | | | | |
| Total Undistributed Expenses | 1,426,837 | 2,392,428 | 2,608,069 | 2,668,404 | 2,556,859 | 18.5 | 13,045 |
| Gross Operating Profit | $3,110,503 | $7,141,684 | $7,535,670 | $7,775,516 | $7,829,667 | 56.6% | $39,947 |
| | | | | | | | |
| Management Fee | 190,537 | 390,707 | 408,478 | 415,954 | 414,812 | 3.0 | 2,116 |
| Real Estate Taxes | 311,492 | 312,867 | 313,011 | 319,341 | 390,654 | 2.8 | 1,993 |
| Property Insurance | 95,109 | 139,720 | 148,057 | 163,967 | 143,235 | 1.0 | 731 |
| Total Operating Expenses | $597,138 | $843,294 | $869,546 | $899,262 | $948,701 | 6.9% | $4,840 |
| | | | | | | | |
| Net Operating Income | $2,513,365(2) | $6,298,390(2) | $6,666,124 | $6,876,254 | $6,880,965 | 49.8% | $35,107 |
| FF&E | 0 | 0 | 0 | 0 | 553,083 | 4.0 | 2,822 |
| Net Cash Flow | $2,513,365 | $6,298,390 | $6,666,124 | $6,876,254 | $6,327,882 | 45.8% | $32,285 |
| | | | | | | | |
| NOI DSCR | 1.23x | 3.08x | 3.26x | 3.36x | 3.37x | | |
| NCF DSCR | 1.23x | 3.08x | 3.26x | 3.36x | 3.10x | | |
| NOI DY | 8.4% | 21.0% | 22.2% | 22.9% | 23.0% | | |
| NCF DY | 8.4% | 21.0% | 22.2% | 22.9% | 21.1% | | |
| (1) | % of U/W Total Revenue for Room Expense and Other Expense are based on their corresponding revenue line items. All other line items represent percent of Total Revenue. |
| (2) | The increase from 2021 Net Operating Income and 2022 Net Operating Income is primarily attributable to increases in room revenue following the impact of the COVID-19 pandemic in 2020 and 2021. |
| THE INFORMATION IN THIS STRUCTURAL AND COLLATERAL TERM SHEET IS NOT COMPLETE AND MAY BE AMENDED PRIOR TO THE TIME OF SALE. THIS TERM SHEET IS NOT AN OFFER TO SELL THESE SECURITIES AND IT IS NOT A SOLICITATION OF AN OFFER TO BUY THESE SECURITIES IN ANY JURISDICTION WHERE THE OFFER OR SALE IS NOT PERMITTED. |
| | 148 | |
| Hospitality – Limited Service | Loan #11 | Cut-off Date Balance: | | $29,975,000 |
| 631 West Katella Avenue | Anaheim Desert Palm Hotel & Suites | Cut-off Date LTV: | | 43.6% |
| Anaheim, CA 92802 | | U/W NCF DSCR: | | 3.10x |
| | | U/W NOI Debt Yield: | | 23.0% |
Appraisal. The appraisal concluded to an “as is” appraised value for the Anaheim Desert Palm Hotel & Suites Property of $68,800,000 as of March 19, 2024.
Environmental Matters. According to the Phase I environmental site assessment dated March 29, 2024 (the “ESA”), there was no evidence of any recognized environmental conditions at the Anaheim Desert Palm Hotel & Suites Property.
Market Overview and Competition. The Anaheim Desert Palm Hotel & Suites Property is located in the southern portion the Anaheim Resort District of Anaheim, California within Orange County, approximately 1.3 miles from Downtown Disney District. The property is 1.6 miles from Interstate 5, which provides access to the property from the greater Los Angeles metro area. The primary demand generators in the area include Disneyland Resort, which includes Disneyland, Disney California Adventure Park, and the Downtown Disney District. Anaheim Garden Walk, a 20-acre outdoor entertainment and dining destination featuring the House of Blues Anaheim and a movie theatre, is located 0.3 miles east of the property.
According to the appraisal, the 2023 population within a one-, three- and five-mile radius of the Anaheim Palm Hotel & Suites Property was 20,943, 270,558 and 765,906 respectively. The median household income for the same one-, three- and five-mile radius was $67,584, $81,870 and $80,383, respectively.
The appraisal did not identify any new hotels under construction or planned for near term development that are expected to directly compete with the Anaheim Palm Hotel & Suites Property.
| THE INFORMATION IN THIS STRUCTURAL AND COLLATERAL TERM SHEET IS NOT COMPLETE AND MAY BE AMENDED PRIOR TO THE TIME OF SALE. THIS TERM SHEET IS NOT AN OFFER TO SELL THESE SECURITIES AND IT IS NOT A SOLICITATION OF AN OFFER TO BUY THESE SECURITIES IN ANY JURISDICTION WHERE THE OFFER OR SALE IS NOT PERMITTED. |
| | 149 | |
| No. 12 – Baxters Industrial Portfolio |
| |
| Mortgage Loan Information | | Mortgaged Property Information |
| Mortgage Loan Seller: | Goldman Sachs Mortgage Company | | Single Asset/Portfolio: | Portfolio |
Credit Assessment (Fitch/KBRA/Moody’s): | NR/NR/NR | | Property Type – Subtype: | Industrial – Warehouse/Manufacturing |
| Original Principal Balance: | $29,575,000 | | Location: | Various, Various |
| Cut-off Date Balance: | $29,575,000 | | Size: | 421,940 SF |
| % of Initial Pool Balance: | 2.7% | | Cut-off Date Balance Per SF: | $70.09 |
| Loan Purpose: | Acquisition | | Maturity Date Balance Per SF: | $66.28 |
| Borrower Sponsors(2): | Angelo, Gordon & Co., L.P. and TPG, Inc. | | Year Built/Renovated: | Various/Various |
| Guarantors: | AG Net Lease IV (Q) Corp., AG Net Lease IV Corp., and AG Net Lease Realty Fund IV Investments (H-1), L.P. | | Title Vesting: | Fee |
| Mortgage Rate: | 6.7710% | | Property Manager: | Self-Managed |
| Note Date: | April 5, 2024 | | Current Occupancy (As of): | 100.0% (6/1/2024) |
| Seasoning: | 2 months | | YE 2023 Occupancy(7): | NAP |
| Maturity Date: | April 6, 2034 | | YE 2022 Occupancy(7): | NAP |
| IO Period: | 60 months | | YE 2021 Occupancy(7): | NAP |
| Loan Term (Original): | 120 months | | YE 2020 Occupancy(7): | NAP |
| Amortization Term (Original): | 360 months | | As-Is Appraised Value: | $46,200,000 |
| Loan Amortization Type: | Interest Only, Amortizing Balloon | | As-Is Appraised Value Per SF: | $109.49 |
| Call Protection: | L(26),DorYM1(87),O(7) | | As-Is Appraisal Valuation Date: | Various |
| Lockbox Type: | Hard/Springing Cash Management | | Underwriting and Financial Information |
| Additional Debt(1): | Yes | | TTM NOI(7): | NAV |
| Additional Debt Type (Balance)(1): | Future Mezzanine | | YE 2023 NOI(7): | NAV |
| | | | YE 2022 NOI(7): | NAV |
| | | YE 2021 NOI(7): | NAV |
| Escrows and Reserves | | U/W Revenues: | $3,580,691 |
| | Initial | Monthly | Cap | | U/W Expenses: | $107,421 |
| Taxes: | $0 | Springing(3) | NAP | | U/W NOI: | $3,473,270 |
| Insurance: | $0 | Springing(4) | NAP | | U/W NCF: | $3,295,492 |
| Replacement Reserve: | $0 | Springing(5) | $84,388 | | U/W DSCR based on NOI/NCF: | 1.51x / 1.43x |
| TI/LC Reserve: | $0 | Springing(6) | $421,940 | | U/W Debt Yield based on NOI/NCF: | 11.7% /11.1% |
| | | | | | U/W Debt Yield at Maturity based on NOI/NCF: | 12.4% /11.8% |
| | | | | | Cut-off Date LTV Ratio: | 64.0% |
| | | | | | LTV Ratio at Maturity: | 60.5% |
| | | | | | | | |
| Sources and Uses |
| Sources | | | | | Uses | | | |
| Borrower Sponsor Equity | $61,467,265 | | 67.5% | | Closing Costs | $45,792,265 | | 50.3 | % |
| Mortgage Loan Amount | 29,575,000 | | 32.5 | | Purchase Price | 45,250,000 | | 49.7 | |
| | | | | | | | | |
| | | | | | | | | |
| Total Sources | $91,042,265 | | 100.0% | | Total Uses | $91,042,265 | | 100.0 | % |
| (1) | Future Mezzanine financing is permitted, if certain criteria is met, including a maximum combined LTV of 64%; minimum combined debt yield of 12.02%; minimum combined DSCR of 1.75x, an intercreditor agreement and rating agency confirmation. |
| (2) | The borrower sponsors are also borrower sponsors on the SSW Advanced Technologies Mortgage Loan and 147 North Main Street Mortgage Loan, which are both included in this pool. |
| (3) | For so long as no trigger period is continuing and the borrower continues to deliver evidence reasonably satisfactory to the lender that all taxes have been timely paid, borrower’s obligation to make deposits into the tax account will be suspended. The borrower will not be required to reserve funds in the basic carrying costs escrow account in respect of property taxes and insurance premiums so long as: (i) the critical tenant lease is in full force and effect, (ii) critical tenant is current in its payment of taxes and assessments with respect to the properties and in its provision of insurance with respect to the Baxters Industrial Portfolio Properties all consistent with the requirements hereunder and of the critical tenant lease. |
| (4) | For so long as no trigger period is continuing and the borrower continues to deliver evidence reasonably satisfactory to the lender that all insurance premiums have been timely paid, the borrower’s obligation to make deposits into the insurance account will be suspended. |
| (5) | Monthly deposits of $7,032.33 upon an event of default, trigger period (unless the critical tenant lease in full force and effect and current in its payment) or funds on deposit fall below $42,194, capped at $84,388. |
| (6) | Monthly deposits of $35,161.67 during an event of default, trigger period, or funds on deposit fall below $210,970, capped at $421,940. |
| (7) | Historical Occupancy and Financial Information is not available due to the borrower sponsor’s acquisition of the Baxters Industrial Portfolio Properties (as defined below) through a sale-leaseback transaction with Baxters North America, who executed an absolute NNN master lease across the Baxters Industrial Portfolio Properties. |
| THE INFORMATION IN THIS STRUCTURAL AND COLLATERAL TERM SHEET IS NOT COMPLETE AND MAY BE AMENDED PRIOR TO THE TIME OF SALE. THIS TERM SHEET IS NOT AN OFFER TO SELL THESE SECURITIES AND IT IS NOT A SOLICITATION OF AN OFFER TO BUY THESE SECURITIES IN ANY JURISDICTION WHERE THE OFFER OR SALE IS NOT PERMITTED. |
| | 150 | |
| Industrial – Warehouse/Manufacturing | Loan #12 | Cut-off Date Balance: | | $29,575,000 |
| Various | Baxters Industrial Portfolio | Cut-off Date LTV: | | 64.0% |
| Various, Various | | U/W NCF DSCR: | | 1.43x |
| | | U/W NOI Debt Yield: | | 11.7% |
The Mortgage Loan. The Baxters Industrial Portfolio mortgage loan (the “Baxters Industrial Portfolio Mortgage Loan”) is secured by the borrowers’ fee interest in two industrial properties located in East Bernstadt, Kentucky (the “East Bernstadt Property”), and Salem, Oregon (the “Salem Property”, and together with the East Bernstadt Property, the “Baxters Industrial Portfolio Properties”). The Baxters Industrial Portfolio Mortgage Loan was originated on April 5, 2024, by Goldman Sachs Bank USA and has a 10-year term, with an interest-only period accruing interest at a rate of 6.7710% per annum on an Actual/360 basis, followed by amortization on a 30-year basis.
The Properties. The Baxters Industrial Portfolio Properties consist of two mission-critical industrial warehouse/manufacturing assets totaling 421,940 SF. Both Baxters Industrial Portfolio Properties are occupied by a single tenant, Baxters North America (“Baxters”), a subsidiary of Baxters Food Group, which is headquartered in Cincinnati, Ohio. Baxters utilizes both facilities to produce a wide variety of food products for Baxters’ co-manufacturing and growing private label businesses. The facilities maintain an array of production lines and equipment with various capabilities to produce and package food based on customers’ specifications.
The East Bernstadt Property was built in 1960, renovated in 2008 and houses 200 employees across three shifts, five days per week, and is used for industrial food processing, distribution, and cold storage. The East Bernstadt Property, initially built in phases for food distribution, was converted into a food processing plant in 2008. This conversion included a full renovation of the East Bernstadt Property and the build out of a significant amount of food grade temperature-controlled production and packaging space. Total investment is estimated at over $10.3 million ($2.34 million spent between 2021 and 2023). The East Bernstadt Property’s use breakdown consists of warehouse (39.1%), manufacturing (26.7%), cold storage (16.4%), and office/miscellaneous space (17.8%). The East Bernstadt Property features 22-26 foot clear heights, 13 dock doors, and 194 parking stalls. Products produced at the East Bernstadt Property are mostly higher volume SKUs for multi-national CPGs. Example products include single serve Kraft Heinz’s Velveeta Cheesy Skillets and Quaker Oat’s Rice-A-Roni.
The Salem Property was built in 1972 and houses 180 employees across three shifts, five days per week, and is used for industrial food processing, distribution, and cold storage. The Salem Property features temperature-controlled production space, general warehouse space, significant cold storage space (54,000 SF of freezer space and 18,000 SF of cooler space), a research & development (“R&D”) lab, a dedicated packaging zone and a two-story administrative office buildout. The Salem Property features a full R&D lab with its own retort oven and full kitchen to test new formulations and products based on customer specifications for mass production. Equipment at the Salem Property includes five production / tray and pouch filling lines, 15 rotational retort ovens and various packaging lines. Total investment is estimated at over $7.8 million ($5.71 million spent between 2021 and 2023). The space usage includes cold storage (44.8%), manufacturing (19.9%), warehouse (16.6%), and office/miscellaneous space (18.7%). The Salem Property features 25-30 foot clear heights, 13 dock doors, and 159 parking stalls. While the Salem Property currently focuses on co-manufacturing, Baxters is targeting revenue growth through private label and special certification food manufacturing (e.g., Kosher).
The following table presents certain information relating to the Baxters Industrial Portfolio Properties:
| Portfolio Summary(1) |
| Address | City, State | SF | Allocable Loan Amount | Year Built / Renovated | Clear Heights | Annual Rent | Rent PSF | Lease End Date |
| 2742 US Highway 25 | East Bernstadt, KY | $262,517 | $15,875,321 | 1960 / 2008 | 22-26 ft | $1,908,300 | $7.27 | 4/5/2044 |
| 556 Murlark Avenue Northwest | Salem, OR | $159,423 | $13,699,679 | 1972 / NAP | 25-30 ft | $1,646,776 | $10.33 | 4/5/2044 |
| (1) | The borrower sponsors executed an absolute NNN master lease across the Baxters Industrial Portfolio Properties with Baxters North America with a 20-year initial term, two 10-year renewal options, 3.0% annual rent escalations, and no termination options. |
| THE INFORMATION IN THIS STRUCTURAL AND COLLATERAL TERM SHEET IS NOT COMPLETE AND MAY BE AMENDED PRIOR TO THE TIME OF SALE. THIS TERM SHEET IS NOT AN OFFER TO SELL THESE SECURITIES AND IT IS NOT A SOLICITATION OF AN OFFER TO BUY THESE SECURITIES IN ANY JURISDICTION WHERE THE OFFER OR SALE IS NOT PERMITTED. |
| | 151 | |
| Industrial – Warehouse/Manufacturing | Loan #12 | Cut-off Date Balance: | | $29,575,000 |
| Various | Baxters Industrial Portfolio | Cut-off Date LTV: | | 64.0% |
| Various, Various | | U/W NCF DSCR: | | 1.43x |
| | | U/W NOI Debt Yield: | | 11.7% |
Operating History and Underwritten Net Cash Flow. The following table presents certain information relating to the historical operating performance and underwritten net cash flow at the Baxters Industrial Portfolio Properties:
Cash Flow Analysis(1)
| | U/W | %(2) | U/W $ per SF(3) |
| Base Rent(4) | $3,555,075 | 94.3% | $8.43 |
| Rent Steps(5) | 106,652 | 2.8 | 0.25 |
| Gross Potential Rent | $3,661,727 | 97.2% | $8.68 |
| Recoveries | 107,421 | 2.9 | 0.25 |
| Net Rental Income | $3,769,148 | 100.0% | $8.93 |
| Less Vacancy | 188,457 | 5.0 | 0.45 |
| Effective Gross Income | $3,580,691 | 95.0% | $8.49 |
| | | | |
| Management Fee | 107,421 | 3.0 | 0.25 |
| Total Expenses | $107,421 | 3.0% | $0.25 |
| | | | |
| Net Operating Income | $3,473,270 | 97.0% | $8.23 |
| TI/LC | 105,485 | 2.9 | 0.25 |
| Capital Expenditures | 72,293 | 2.0 | 0.17 |
| Net Cash Flow | $3,295,492 | 92.0% | $7.81 |
| | | | |
| NOI DSCR | 1.51x | | |
| NCF DSCR | 1.43x | | |
| NOI Debt Yield | 11.7% | | |
| NCF Debt Yield | 11.1% | | |
| (1) | Historical cash flows are not available due to the borrower sponsors’ acquisition of the Baxters Industrial Portfolio Properties through a sale-leaseback transaction with Baxters North America, who executed an absolute NNN master lease across the Baxters Industrial Portfolio Properties. |
| (2) | Represents (i) percent of Net Rental Income for all revenue fields and Vacancy and (ii) percent of Effective Gross Income for all other fields. |
| (3) | U/W per SF is based on the total collateral SF of 421,940. |
| (4) | Based on the underwritten rent roll dated June 1, 2024. |
| (5) | Rent Steps are based on 3.0% contractual annual escalations. |
The Market. The East Bernstadt Property is located in the London Industrial submarket. As of the first quarter of 2024, submarket vacancy was 3.6% and the average market NNN rental rate was $6.17 per SF, per a third-party market research report.
The Salem Property is located in the Polk County Industrial submarket. As of the first quarter of 2024, submarket vacancy was 6.1% and the average market NNN rental rate was $7.64 per SF, per a third-party market research report.
Release of Collateral. In connection with (A) a Permitted Release Casualty Event (as defined below) or (B) from and after July 6, 2026, a release of the East Bernstadt Property, the borrower may obtain the release of the applicable Baxters Industrial Portfolio Property from the lien of the mortgage upon the satisfaction of certain conditions including, but not limited to: (i) no event of default exists (unless it is evident that the completion of such partial release will result in the cure of such event of default as determined by the lender in its reasonable discretion), (ii) delivery of defeasance collateral or prepayment (together with payment of a yield maintenance premium), as applicable, of a release price in an amount equal to (x) 120% of the allocated loan amount attributable to the East Bernstadt Property and (y) 115% of the allocated loan amount attributable to the Salem Property, (iii) after giving effect to the release, (a) the debt service coverage ratio for the remaining Baxters Industrial Portfolio Properties is no less than (x) 1.75x and (y) the debt service coverage ratio immediately prior to release and (b) the debt yield for the remaining Baxters Industrial Portfolio Properties is no less than (x) 12.02% and (y) the debt yield immediately prior to release and (iv) reimbursement of the lender’s reasonable and actual out-of-pocket costs and expenses (including rating agency, legal and accounting cost) in connection with such release. Notwithstanding the foregoing, if, after giving effect to the release, the fair market value of the remaining Baxters Industrial Portfolio Properties, as determined by the lender based on a current appraisal, would fail to comply with REMIC guidelines, the principal balance of the Baxters Industrial Portfolio Mortgage Loan may be paid down (in the case of a release pursuant to clause (B) above), (together with payment of a yield maintenance premium) (a) in an amount necessary to satisfy the REMIC guidelines or (b) a lesser amount provided the lender receives a REMIC opinion.
A “Permitted Release Casualty Event” means the occurrence of a casualty or condemnation which results in a critical tenant terminating its lease, solely to the extent such termination is permitted by such tenant’s lease.
| THE INFORMATION IN THIS STRUCTURAL AND COLLATERAL TERM SHEET IS NOT COMPLETE AND MAY BE AMENDED PRIOR TO THE TIME OF SALE. THIS TERM SHEET IS NOT AN OFFER TO SELL THESE SECURITIES AND IT IS NOT A SOLICITATION OF AN OFFER TO BUY THESE SECURITIES IN ANY JURISDICTION WHERE THE OFFER OR SALE IS NOT PERMITTED. |
| | 152 | |
| No. 13 – Hilton Garden Inn Lompoc |
| |
| Mortgage Loan Information | | Mortgaged Property Information |
| Mortgage Loan Seller: | Morgan Stanley Mortgage Capital Holdings LLC | | Single Asset/Portfolio: | Single Asset |
| Credit Assessment | NR/NR/NR | | Property Type – Subtype: | Hospitality – Select Service |
| (Fitch/KBRA/Moody’s): | | | Location: | Lompoc, CA |
| Original Principal Balance: | $27,000,000 | | Size: | 156 Rooms |
| Cut-off Date Balance: | $27,000,000 | | Cut-off Date Balance Per Room: | $173,077 |
| % of Initial Pool Balance: | 2.5% | | Maturity Date Balance Per Room: | $165,833 |
| Loan Purpose: | Refinance | | Year Built/Renovated: | 2017 / NAP |
| Borrower Sponsor: | Atul P. Patel | | Title Vesting: | Fee |
| Guarantor: | Sardaben P. Patel | | Property Manager: | Legend Hospitality Inc. |
| Mortgage Rate: | 7.9000% | | | |
| Note Date: | February 14, 2024 | | Current Occupancy (As of)(4): | 65.1% (12/31/2023) |
| Seasoning: | 3 months | | YE 2022 Occupancy(4) | 69.1% |
| Maturity Date: | March 1, 2034 | | YE 2021 Occupancy(4): | 66.4% |
| IO Period: | 60 months | | YE 2020 Occupancy(4): | 47.7% |
| Loan Term (Original): | 120 months | | YE 2019 Occupancy(4): | 57.0% |
| Amortization Term (Original): | 360 | | As-Is Appraised Value: | $42,000,000 |
| Loan Amortization Type: | Interest Only, Amortizing Balloon | | As-Is Appraised Value Per Room: | $269,231 |
| Call Protection: | L(27),D(89),O(4) | | As-Is Appraisal Valuation Date: | August 23, 2023 |
| Lockbox Type: | Hard/Springing Cash Management | | | |
| Additional Debt: | (1) | | Underwriting and Financial Information |
| Additional Debt Type | (1) | | YE 2023 NOI(4): | $3,740,389 |
| (Balance): | | | YE 2022 NOI(4): | $3,931,786 |
| | | | YE 2021 NOI(4): | $3,615,792 |
| Escrows and Reserves | | YE 2020 NOI(4): | $1,748,820 |
| | Initial | Monthly | Cap | | YE 2019 NOI(4): | $2,431,554 |
| Taxes: | $42,772 | $21,386 | NAP | | U/W Revenues: | $8,633,654 |
| Insurance: | $0 | Springing(2) | NAP | | U/W Expenses: | $4,982,272 |
| Deferred Maintenance: | $0 | $0 | NAP | | U/W NOI: | $3,651,382 |
| FF&E Reserve: | $0 | $28,779(3) | NAP | | U/W NCF: | $3,306,036 |
| | | | | | U/W DSCR based on NOI/NCF: | 1.55x / 1.40x |
| | | | | | U/W Debt Yield based on NOI/NCF: | 13.5% / 12.2% |
| | | | | | U/W Debt Yield at Maturity based on | |
| | | | | | NOI/NCF: | 14.1% / 12.8% |
| | | | | | Cut-off Date LTV Ratio: | 64.3% |
| | | | | | LTV Ratio at Maturity: | 61.6% |
| | | | | | | | |
| Sources and Uses |
| Sources | | | | | Uses | | | |
| Mortgage Loan Amount | $27,000,000 | | 100.0% | | Loan Payoff | $21,062,408 | | 78.0 | % |
| | | | | | Return of Equity | 5,354,783 | | 19.8 | |
| | | | | | Closing Costs | 540,037 | | 2.0 | |
| | | | | | Reserves | 42,772 | | 0.2 | |
| Total Sources | $27,000,000 | | 100.0% | | Total Uses | $27,000,000 | | 100.0 | % |
| (1) | The borrower is also a borrower under an Economic Injury Disaster Loan (the “SBA Loan”) with a $2,000,000 principal balance, which was obtained from the United States Small Business Administration (the “SBA”) in May 2020. The SBA Loan is secured by a mortgage on the Mortgaged Property. The SBA has entered into a subordination agreement subordinating the lien of its mortgage to the lien of the Hilton Garden Inn Lompoc Mortgage Loan (as defined below) documents. |
| (2) | Deposits into the insurance reserve are waived so long as no event of default is continuing, the liability and casualty policies maintained by the borrower are part of a blanket or umbrella policy approved by the lender in its reasonable discretion, and the borrower provides the lender evidence of renewal of the policies and paid receipts for the insurance premiums no later than 10 days prior to the expiration dates of the policies. |
| (3) | The required deposit is equal to the greater of (i) 1/12 of 4% of the operating income for the Hilton Garden Inn Lompoc Property (as defined below) for the preceding calendar year ($28,779 for the remainder of 2024), and (ii) the deposit required by the franchisor under the franchise agreement on account of furniture, fixtures and equipment. |
| (4) | The decrease in Occupancy and NOI from 2019 to 2020, and the increase in Occupancy and NOI from 2020 to 2021, 2021 to 2022 and from 2022 to 2023 was primarily due to the effect of the novel coronavirus on the hospitality industry in 2020, and the continued recovery in 2021 and 2022. |
The Mortgage Loan. The thirteenth largest mortgage loan (the “Hilton Garden Inn Lompoc Mortgage Loan”) is evidenced by a promissory note in the original principal amount of $27,000,000 and secured by a fee mortgage encumbering a select-service hospitality property located in Lompoc, California (the “Hilton Garden Inn Lompoc Property”).
The Borrower and Borrower Sponsor. The borrower for the Hilton Garden Inn Lompoc Mortgage Loan is Lompoc Land Holdings, LLC, a California limited liability company with one independent director in its organizational structure. Legal counsel to the borrower delivered a non-consolidation opinion in connection with the origination of the Hilton Garden Inn Lompoc Mortgage Loan. The borrower is 71.2% owned by Logistics Land Developers LLC, 19.2% owned by the borrower sponsor, Atul P. Patel, and 4.5% owned by his son
| THE INFORMATION IN THIS STRUCTURAL AND COLLATERAL TERM SHEET IS NOT COMPLETE AND MAY BE AMENDED PRIOR TO THE TIME OF SALE. THIS TERM SHEET IS NOT AN OFFER TO SELL THESE SECURITIES AND IT IS NOT A SOLICITATION OF AN OFFER TO BUY THESE SECURITIES IN ANY JURISDICTION WHERE THE OFFER OR SALE IS NOT PERMITTED. |
| | 153 | |
| Hospitality – Select Service | Loan #13 | Cut-off Date Balance: | | $27,000,000 |
| 1201 North H Street | Hilton Garden Inn Lompoc | Cut-off Date LTV: | | 64.3% |
| Lompoc, CA 93436 | | U/W NCF DSCR: | | 1.40x |
| | | U/W NOI Debt Yield: | | 13.5% |
Preyesh A. Patel and 4.5% owned by Suraj A. Patel. Logistics Land Developers LLC is wholly owned by the non-recourse carveout guarantor, Sardaben P. Patel, who is the mother of the borrower sponsor and also is the managing member of the borrower, and is the guarantor on the non-recourse carve-outs. Since 1981, the Patel family has owned and operated a series of 11 hotels comprising eight in the Lompoc or nearby Santa Maria, California area, two in Georgia, and one in Alabama, representing Hilton, Choice, IHG, and Radisson brands, as well as six unflagged properties.
The Property. The Hilton Garden Inn Lompoc Property is a 156-room, select-service hospitality property built on a 2.78-acre site in Lompoc, California. The Hilton Garden Inn Lompoc Property was constructed in 2017 by the borrower sponsor. The Hilton Garden Inn Lompoc Property features the Valley Eatery & Bar, an outdoor pool, business center, fitness center, guest self-laundry, sundry shop, and complimentary high-speed internet access. The Hilton Garden Inn Lompoc Property also has approximately 3,484 square feet of dedicated meeting and event space, and 156 parking spaces.
The guestroom mix at the Hilton Garden Inn Lompoc Property is comprised of 156 bedrooms with 69 king bedrooms, 60 rooms with two queen beds, and 27 suites. Guestrooms are accessible via two passenger elevators, and room amenities feature a work area, nightstand, dresser, sofa chair, flat screen television, internet, iron and ironing board, coffee maker, microwave, and mini refrigerator. The 84 seat Valley Eatery & Bar provides breakfast in the morning by a la carte or buffet for an additional cost, and serves American cuisine for dinner at night. The restaurant also includes a bar that sells alcoholic and non-alcoholic beverages. Additionally, the sundry shop offers snacks and beverages for purchase.
The Hilton Garden Inn Lompoc Property is currently subject to a franchise agreement with Hilton Franchise Holding LLC, which expires on June 30, 2037.
According to the appraisal, the property segmentation at the Hilton Garden Inn Lompoc Property is estimated at 55% commercial, 20% leisure and 25% meeting and group.
The following table presents certain information relating to the Occupancy, ADR and RevPAR of the Hilton Garden Inn Lompoc Property and its competitive set:
Historical Occupancy, ADR, RevPAR(1)(2)
| | Competitive Set | Hilton Garden Inn Lompoc Property | Penetration Factor |
| Year | Occupancy | ADR | RevPAR | Occupancy | ADR | RevPAR | Occupancy | ADR | RevPAR |
| 12/31/2021 | 62.4% | $134.38 | $83.87 | 66.4% | $160.56 | $106.60 | 106.4% | 119.5% | 127.1% |
| 12/31/2022 | 69.3% | $152.87 | $105.94 | 69.1% | $179.42 | $123.97 | 99.7% | 117.4% | 117.0% |
| 12/31/2023 | 58.7% | $178.92 | $105.06 | 65.9% | $192.58 | $126.93 | 112.3% | 107.6% | 120.8% |
| 3/31/2024 TTM | 61.7% | $177.99 | $109.74 | 66.9% | $192.81 | $128.90 | 108.4% | 108.3% | 117.5% |
Source: Industry Report.
| (1) | The competitive set includes Holiday Inn Express Lompoc, Marriott Santa Ynez Valley, Embassy Suites by Hilton Lompoc Central Coast and SureStay Plus Lompoc. |
| (2) | The variances between the underwriting, the appraisal and the industry report data with respect to Occupancy, ADR and RevPAR at the Hilton Garden Inn Lompoc Property are attributable to variances in reporting methodologies and/or timing differences. |
| THE INFORMATION IN THIS STRUCTURAL AND COLLATERAL TERM SHEET IS NOT COMPLETE AND MAY BE AMENDED PRIOR TO THE TIME OF SALE. THIS TERM SHEET IS NOT AN OFFER TO SELL THESE SECURITIES AND IT IS NOT A SOLICITATION OF AN OFFER TO BUY THESE SECURITIES IN ANY JURISDICTION WHERE THE OFFER OR SALE IS NOT PERMITTED. |
| | 154 | |
| Hospitality – Select Service | Loan #13 | Cut-off Date Balance: | | $27,000,000 |
| 1201 North H Street | Hilton Garden Inn Lompoc | Cut-off Date LTV: | | 64.3% |
| Lompoc, CA 93436 | | U/W NCF DSCR: | | 1.40x |
| | | U/W NOI Debt Yield: | | 13.5% |
Operating History and Underwritten Net Cash Flow. The following table presents certain information relating to the historical operating performance and underwritten net cash flow at the Hilton Garden Inn Lompoc Property:
Cash Flow Analysis
| | 2019(1) | 2020(1) | 2021(1) | 2022(1) | 2023(1) | U/W(1) | %(2) | U/W $ per Room |
| Occupancy(3) | 57.0% | 47.7% | 66.4% | 69.1% | 65.1% | 65.1% | | |
| ADR(3) | $148.90 | $137.97 | $159.90 | $178.38 | $193.35 | $193.35 | | |
| RevPAR(3) | $84.89 | $65.77 | $106.17 | $123.26 | $125.79 | $125.79 | | |
| | | | | | | | | |
| Room Revenue | $4,833,622 | $3,755,118 | $6,045,537 | $7,018,641 | $7,162,603 | $7,162,603 | 83.0% | $45,914 |
| Food & Beverage Revenue | 1,632,707 | 1,012,847 | 1,365,473 | 1,319,367 | 1,256,578 | 1,256,578 | 14.6 | 8,055 |
| Other Departmental Income(4) | 146,708 | 164,582 | 195,141 | 172,242 | 214,473 | 214,473 | 2.5 | 1,375 |
| Total Revenue | $6,613,037 | $4,932,547 | $7,606,151 | $8,510,250 | $8,633,654 | $8,633,654 | 100.0% | $55,344 |
| | | | | | | | | |
| Room Expense | 1,219,024 | 932,069 | 1,155,961 | 1,415,498 | 1,378,541 | 1,378,541 | 19.2 | 8,837 |
| Food & Beverage Expense | 1,211,024 | 683,460 | 876,450 | 1,009,824 | 1,037,590 | 1,037,590 | 82.6 | 6,651 |
| Other Departmental Expenses | 0 | 0 | 0 | 0 | 0 | 0 | 0.0 | 0 |
| Gross Operating Profit | $4,182,989 | $3,317,018 | $5,573,740 | $6,084,928 | $6,217,523 | $6,217,523 | 72.0% | $39,856 |
| | | | | | | | | |
| Total Fixed Charges | 1,751,435 | 1,568,198 | 1,957,948 | 2,153,142 | 2,477,134 | 2,566,141 | 29.7 | 16,450 |
| Total Operating Expenses | $4,181,483 | $3,183,727 | $3,990,359 | $4,578,464 | $4,893,265 | $4,982,272 | 57.7% | $31,938 |
| | | | | | | | | |
| Net Operating Income | $2,431,554 | $1,748,820 | $3,615,792 | $3,931,786 | $3,740,389 | $3,651,382 | 42.3% | $23,406 |
| FF&E | 198,391 | 147,976 | 228,185 | 255,307 | 259,010 | 345,346 | 4.0 | 2,214 |
| Net Cash Flow | $2,233,163 | $1,600,844 | $3,387,607 | $3,676,479 | $3,481,379 | $3,306,036 | 38.3% | $21,193 |
| | | | | | | | | |
| NOI DSCR | 1.03x | 0.74x | 1.54x | 1.67x | 1.59x | 1.55x | | |
| NCF DSCR | 0.95x | 0.68x | 1.44x | 1.56x | 1.48x | 1.40x | | |
| NOI Debt Yield | 9.0% | 6.5% | 13.4% | 14.6% | 13.9% | 13.5% | | |
| NCF Debt Yield | 8.3% | 5.9% | 12.5% | 13.6% | 12.9% | 12.2% | | |
| (1) | The decrease in Occupancy and NOI from 2019 to 2020, and the increase in Occupancy and NOI from 2020 to 2021, 2021 to 2022, and 2022 to 2023 was primarily due to the effect of the novel coronavirus on the hospitality industry in 2020, and the continued recovery in 2021 and 2022. |
| (2) | % for Room Expense, Food & Beverage Expense and Other Departmental Expenses are based on their corresponding revenue line items. All other line items represent percent of Total Revenue. |
| (3) | The variances between the underwriting, the appraisal, and the industry report data with respect to Occupancy, ADR and RevPAR at the Hilton Garden Inn Lompoc Property are attributable to variances in reporting methodologies and/or timing differences. |
| (4) | Other Departmental Income is comprised of net income for guest parking and miscellaneous income. |
Appraisal. According to the appraisal, the Hilton Garden Inn Lompoc Property had an “As-Is” appraised value of $42,000,000 as of August 23, 2023.
Environmental Matters. According to the Phase I environmental site assessment dated November 22, 2023, there was no evidence of any recognized environmental conditions at the Hilton Garden Inn Lompoc Property.
Market Overview and Competition. The Hilton Garden Inn Lompoc Property is located in Lompoc, California. The town of Lompoc is located in Santa Barbara County, in the Santa Rita Hills of California’s Central Coast, approximately 55 miles north of Santa Barbara, approximately 60 miles south of San Luis Obispo, and approximately 155 miles north of Los Angeles. The town is situated along the scenic Pacific Coast Highway (Highway 1). The town is known for tourism, its wine industry, space technology, agriculture, recreation, and the arts. Notable commercial demand generators include the US Department of Justice, Allan Hancock College, DenMat Holdings, Imery’s Filtration Minerals, and the Vandenburg Space Force Base, which accounts for over 25% of total employment in the city of Lompoc. The Hilton Garden Inn Lompoc Property is located minutes from more than a dozen vineyard tasting rooms in the Lompoc Wine Ghetto, is approximately 3.5 miles away from La Purisima Mission State Historic Park, and approximately 9 miles from the Vandenberg Air Force Base. The Vandenberg Air Force Base transitioned to a Space Force base in 2020 and employs approximately 16,000 people, generating $4.5 billion annually for Santa Barbara and San Luis Obispo Counties. The base occupies approximately 99,600 acres, serving a critical role in national defense, research, and space exploration missions and hosts an array of functions such as the launch and testing of intercontinental ballistic missiles, satellite deployments, and surveillance operations.
| THE INFORMATION IN THIS STRUCTURAL AND COLLATERAL TERM SHEET IS NOT COMPLETE AND MAY BE AMENDED PRIOR TO THE TIME OF SALE. THIS TERM SHEET IS NOT AN OFFER TO SELL THESE SECURITIES AND IT IS NOT A SOLICITATION OF AN OFFER TO BUY THESE SECURITIES IN ANY JURISDICTION WHERE THE OFFER OR SALE IS NOT PERMITTED. |
| | 155 | |
| Hospitality – Select Service | Loan #13 | Cut-off Date Balance: | | $27,000,000 |
| 1201 North H Street | Hilton Garden Inn Lompoc | Cut-off Date LTV: | | 64.3% |
| Lompoc, CA 93436 | | U/W NCF DSCR: | | 1.40x |
| | | U/W NOI Debt Yield: | | 13.5% |
According to the appraisal, the estimated 2023 population within a one-, three-, and five-mile radius of the Hilton Garden Inn Lompoc Property was 18,759, 49,730 and 55,476, respectively. According to the appraisal, the 2023 average household income within the same radii was $72,174, $80,056 and $83,919, respectively.
The following table presents the primary competitive properties to the Hilton Garden Inn Lompoc Property.
Competitive Property Summary (1)
| Property Name | Year Built | Rooms | Commercial | Group | Leisure | 2022 Occupancy(2) | 2022 ADR(2) | 2022 RevPAR(2) |
| Hilton Garden Inn Lompoc Property (subject) | 2017 | 156 | 55% | 25% | 20% | 69.1% | $179.42 | $123.97 |
| Holiday Inn Express Lompoc | 1998 | 90 | 60% | 20% | 20% | 75%-80% | $130-$140 | $100-$110 |
| Marriott Santa Ynez Valley | 1986 | 163 | 45% | 30% | 25% | 70%-75% | $185-$195 | $130-$140 |
| Embassy Suites by Hilton Lompoc Central Coast | 1986 | 155 | 55% | 25% | 20% | 70%-75% | $175-$185 | $120-$130 |
| SureStay Plus Lompoc | 1985 | 217 | 55% | 15% | 30% | 60%-65% | $105-$115 | $65-$75 |
| Subtotal/Average | | 781 | 53% | 23% | 24% | 69% | $158.16 | $109.55 |
| (1) | Information obtained from the appraisal. |
| (2) | The variances between the underwriting, the appraisal and industry report data with respect to Occupancy, ADR and RevPAR at the Hilton Garden Inn Lompoc Property are attributable to variances in reporting methodologies and/or timing differences. |
| THE INFORMATION IN THIS STRUCTURAL AND COLLATERAL TERM SHEET IS NOT COMPLETE AND MAY BE AMENDED PRIOR TO THE TIME OF SALE. THIS TERM SHEET IS NOT AN OFFER TO SELL THESE SECURITIES AND IT IS NOT A SOLICITATION OF AN OFFER TO BUY THESE SECURITIES IN ANY JURISDICTION WHERE THE OFFER OR SALE IS NOT PERMITTED. |
| | 156 | |
| No. 14 – 201 West 72nd Street |
| |
| Mortgage Loan Information | | Mortgaged Property Information |
| Mortgage Loan Sellers: | Citi Real Estate Funding Inc. | | Single Asset/Portfolio: | Single Asset |
Credit Assessment (Fitch/KBRA/Moody’s): | NR/NR/NR | | Property Type – Subtype: | Retail – Anchored |
| Original Principal Balance: | $25,650,000 | | Location: | New York, NY |
| Cut-off Date Balance: | $25,650,000 | | Size: | 29,385 SF |
| % of Initial Pool Balance: | 2.4% | | Cut-off Date Balance Per SF: | $872.89 |
| Loan Purpose: | Refinance | | Maturity Date Balance Per SF: | $872.89 |
| Borrower Sponsor: | Broadway/72nd Associates II, L.L.C. | | Year Built/Renovated: | 1938/1990 |
| Guarantor: | Broadway/72nd Associates II, L.L.C. | | Title Vesting: | Fee |
| Mortgage Rate: | 6.8600% | | Property Manager: | Self-Managed |
| Note Date: | May 29, 2024 | | Current Occupancy (As of): | 100.0% (4/1/2024) |
| Seasoning: | 0 months | | YE 2023 Occupancy: | 100.0% |
| Maturity Date: | June 6, 2034 | | YE 2022 Occupancy: | 100.0% |
| IO Period: | 120 months | | YE 2021 Occupancy: | 100.0% |
| Loan Term (Original): | 120 months | | As-Is Appraised Value: | $45,800,000 |
| Amortization Term (Original): | NAP | | As-Is Appraised Value Per SF: | $1,558.62 |
| Loan Amortization Type: | Interest Only | | As-Is Appraisal Valuation Date: | March 21, 2024 |
| Call Protection: | L(24),D(92),O(4) | | | |
| Lockbox Type: | Hard/Springing Cash Management | | Underwriting and Financial Information |
| Additional Debt: | None | | TTM 2/29/2024 NOI(4): | $3,092,314 |
| Additional Debt Type (Balance): | NAP | | YE 2023 NOI: | $3,266,865 |
| | | YE 2022 NOI: | $3,056,994 |
| | | | YE 2021 NOI: | $3,099,417 |
| | | | U/W Revenues: | $5,611,155 |
| | | | U/W Expenses: | $2,051,295 |
| Escrows and Reserves | | U/W NOI(4): | $3,559,860 |
| | Initial | Monthly | Cap | | U/W NCF: | $3,408,497 |
| Taxes: | $135,545 | $135,545 | NAP | | U/W DSCR based on NOI/NCF: | 2.00x / 1.91x |
| Insurance: | $0 | Springing(1) | NAP | | U/W Debt Yield based on NOI/NCF: | 13.9% / 13.3% |
| Replacement Reserve: | $0 | $367 | NAP | | U/W Debt Yield at Maturity based on NOI/NCF: | 13.9% / 13.3% |
| TI/LC Reserve: | $0 | Springing(2) | NAP | | Cut-off Date LTV Ratio: | 56.0% |
| Condominium Reserve: | $14,312 | Springing(3) | NAP | | LTV Ratio at Maturity: | 56.0% |
| | | | | | | |
| | | | | | | |
| | | | | | | | |
| Sources and Uses |
| Sources | | | | | Uses | | |
| Mortgage Loan amount | $25,650,000 | | 91.3 | % | | Loan Payoff | $26,409,805 | | 94.0 | % |
| Sponsor Equity | 2,448,279 | | 8.7 | | | Closing Costs | 1,538,617 | | 5.5 | |
| | | | | | Upfront Reserves | 149,857 | | 0.5 | |
| Total Sources | $28,098,279 | | 100.0 | % | | Total Uses | $28,098,279 | | 100.0 | % |
| | | | | | | | | |
| (1) | If the liability or casualty policy maintained by the borrower is not an approved blanket or umbrella policy, on each monthly payment date, the borrower will be required to deposit into an insurance reserve account an amount equal to 1/12 of the insurance premiums that the lender estimates will be payable for the renewal of coverage. |
| (2) | The borrower is only required to make deposits into the TI/LC Reserve if Bloomingdale’s (as defined below) gross sales are not in excess of $20,000,000 during one or more of the following sales test periods: (i) January 1, 2026 – December 31, 2026, (ii) January 1, 2027 – December 31, 2027 and (iii) April 1, 2028 – March 31, 2029. Even if Bloomingdale’s gross sales fail during the first two such sales test periods, the borrower may cure by either depositing $500,000 into the TI/LC Reserve or providing the lender with a letter of credit in an amount equal to $500,000. If the TI/LC Reserve already has $500,000 or more on deposit if and when Bloomingdale’s gross sales fail a sales test period, then the borrower will not be obligated to make a deposit to the TI/LC Reserve. Even if Bloomingdale’s gross sales fail during the third such sales test period, the borrower may cure by delivering reasonably satisfactory evidence to the lender that the early termination right (as described further under Major Tenants below) under the lease has lapsed without exercise or is otherwise of no further force and effect. |
| (3) | If on a monthly payment date during the continuance of a cash management trigger period, the lender is holding less than 1/12 of the annual amount of all common charges or other fees, dues, charges or assessments for the condominium (the “Condominium Assessments”), the borrower is required to deposit an amount such that the lender is holding 1/12 of an amount sufficient to pay the Condominium Assessments during the next ensuing twelve months. |
| (4) | The increase from TTM 2/29/2024 NOI to U/W NOI is primarily attributable to straight line rent steps of $740,339 for Bloomingdale’s. |
The Mortgage Loan. The 14th largest mortgage loan (the “201 West 72nd Street Mortgage Loan”) is evidenced by a promissory note with an original principal balance of $25,650,000. The 201 West 72nd Street Mortgage Loan is secured by a first priority fee mortgage encumbering a 29,385 square foot anchored retail center located in New York, New York (the “201 West 72nd Street Property”).
| THE INFORMATION IN THIS STRUCTURAL AND COLLATERAL TERM SHEET IS NOT COMPLETE AND MAY BE AMENDED PRIOR TO THE TIME OF SALE. THIS TERM SHEET IS NOT AN OFFER TO SELL THESE SECURITIES AND IT IS NOT A SOLICITATION OF AN OFFER TO BUY THESE SECURITIES IN ANY JURISDICTION WHERE THE OFFER OR SALE IS NOT PERMITTED. |
| | 157 | |
| Retail – Anchored | Loan #14 | | Cut-off Date Balance: | | $25,650,000 |
| 201 West 72nd Street | 201 West 72nd Street | | Cut-off Date LTV: | | 56.0% |
| New York, NY 10023 | | | UW NCF DSCR: | | 1.91x |
| | | | UW NOI Debt Yield: | | 13.9% |
The Borrower and the Borrower Sponsor. The borrower is Alexandria Commercial Owner LLC, a Delaware limited liability company and single purpose entity with one independent director. The borrower sponsor and non-recourse carveout guarantor is Broadway/72nd Associates II, L.L.C., the sole member of the borrower, which is jointly controlled by Peter L. Malkin and Trust Under Article Fifth of the Will of Stanley Stahl. Peter L. Malkin is the chairman of Empire State Realty Trust which is a New York City focused REIT that owns and manages a portfolio of office, retail and multifamily assets in Manhattan and the greater New York metropolitan area. The Trust Under Article Fifth of the Will of Stanley Stahl is affiliated with the Stahl Organization, which is a New York City based real estate company with experience purchasing, renovating and operating landmark buildings. See “Description of the Mortgage Pool – Non-Recourse Carveout Limitations” in the Preliminary Prospectus.
The Property. The 201 West 72nd Street Property is an anchored retail condominium in New York, New York totaling 29,385 square feet. The 201 West 72nd Street Property is comprised of a commercial condominium with two retail suites located at the base of The Alexandria, a 21-story residential condominium building that was originally constructed in 1938 and renovated in 1990. The 201 West 72nd Street Property is located on the corner of 72nd Street and Broadway in the Upper West Side neighborhood of Manhattan. The 201 West 72nd Street Property is accessible via the Broadway/72nd Street subway station located directly across the street which services the 1, 2, and 3 subway lines. As of April 1, 2024, the 201 West 72nd Street Property was 100.0% leased to Bloomingdale’s, LLC (“Bloomingdale’s”) and FedEx Office and Print (“FedEx”). Both Bloomingdale’s and FedEx have been in occupancy at the 201 West 72nd Street Property since 2015 and have a weighted average lease term remaining of 7.3 years as of the cut-off date.
Condominium Regime. The 201 West 72nd Street Property is part of a mixed-use condominium comprised of residential, storage and commercial units. The single commercial condominium unit is comprised of two sub-units that are owned by the borrower and leased to the two commercial tenants at the 201 West 72nd Street Property further described below. The commercial unit represents 10.0970% of the condominium association. The condominium board is comprised of seven members, five elected by the residential and storage unit owners and two elected exclusively by the commercial unit owner. Accordingly, the borrower does not control the condominium.
Major Tenants.
Bloomingdale’s (24,985 square feet, 85.0% of net rentable area, 89.3% of underwritten base rent). Founded in 1872, Bloomingdale’s is a New York City based department store that sells designer brands, contemporary labels and private label brands. Bloomingdale’s is a fully owned subsidiary of Macy’s (NYSE: M), which is the guarantor on Bloomingdale’s lease. Bloomingdale’s operates its Bloomindale’s The Outlet Store brand out of the 201 West 72nd Street Property. Bloomingdale’s has been at the 201 West 72nd Street Property since August 2015 under a lease expiring in March 2032 with one, five-year renewal option. Bloomingdale’s has a single termination right which may be exercised if Bloomingdale’s gross sales from April 1, 2028 through and including March 31, 2029 (the “Testing Period”) do not exceed $20,000,000. Provided Bloomingdale’s is not and continues to not be in monetary or material non-monetary default, if Bloomingdale’s gross sales did not exceed $20,000,000 during the Testing Period, Bloomingdale’s has the right to terminate its lease, effective March 31, 2030, provided that Bloomingdale’s (i) gives written notice to the landlord on or before May 31, 2029 and (ii) pays a termination fee equal to one year of the fixed annual rent then in effect as of the date of the termination notice. In addition, if Bloomingdale’s gross sales did not exceed $20,000,000 during the Testing Period, the landlord may elect to terminate the lease, effective March 31, 2030, by giving written notice to Bloomingdale’s on or before May 31, 2029; provided that no termination fee will be payable upon a landlord termination.
FedEx (4,400 square feet, 15.0% of net rentable area, 10.7% of underwritten base rent). Founded in 1971, FedEx (NYSE: FDX) is a United States based global logistics company with 210,000 vehicles, 697 airplanes and 600,000 team members. FedEx has been at the 201 West 72nd Street Property since July 2015 and has a lease expiring in July 2028 with no renewal or termination options.
| THE INFORMATION IN THIS STRUCTURAL AND COLLATERAL TERM SHEET IS NOT COMPLETE AND MAY BE AMENDED PRIOR TO THE TIME OF SALE. THIS TERM SHEET IS NOT AN OFFER TO SELL THESE SECURITIES AND IT IS NOT A SOLICITATION OF AN OFFER TO BUY THESE SECURITIES IN ANY JURISDICTION WHERE THE OFFER OR SALE IS NOT PERMITTED. |
| | 158 | |
| Retail – Anchored | Loan #14 | | Cut-off Date Balance: | | $25,650,000 |
| 201 West 72nd Street | 201 West 72nd Street | | Cut-off Date LTV: | | 56.0% |
| New York, NY 10023 | | | UW NCF DSCR: | | 1.91x |
| | | | UW NOI Debt Yield: | | 13.9% |
The following table presents certain information relating to the tenancy at the 201 West 72nd Street Property:
Major Tenants(1)
| Tenant Name | Credit Rating (Fitch/Moody's/S&P)(2) | Tenant NRSF | % of NRSF | Annual U/W Base Rent PSF(3) | Annual U/W Base Rent(3) | % of Total Annual U/W Base Rent(3) | Sales
PSF/
Year(4) | U/W
Occ.
Costs | Lease Expiration Date | Extension Options | Term. Option (Y/N) |
| Major Tenants | | | | | | | | | | |
| Bloomingdale’s | BBB-/Ba1/BB+ | 24,985 | 85.0% | $204.69 | $5,114,194 | 89.3% | $638 | 32.1% | 3/31/2032 | 1 x 5 yr | Y(5) |
| FedEx | NR/Baa2/BBB | 4,400 | 15.0% | $139.77 | $615,000 | 10.7% | NAV | NAV | 7/31/2028 | None | N |
| Total Major Tenants | 29,385 | 100.0% | $194.97 | $5,729,194 | 100.0% | | | | | |
| | | | | | | | | | | | |
| Vacant Space | 0 | 0.0% | | | | | | | | |
| | | | | | | | | | | |
| Collateral Total | 29,385 | 100.0% | | | | | | | | |
| | | | | | | | | | | | |
| (1) | Based on the underwritten rent roll dated April 1, 2024. |
| (2) | Certain ratings are those of the parent company whether or not the parent guarantees the lease. |
| (3) | Annual U/W Base Rent, % of Total Annual U/W Base Rent and Annual U/W Base Rent PSF include $740,339 of straight line rent steps for Bloomingdale’s. |
| (4) | Sales PSF/Year are as of the trailing 12-month period ending December 31, 2023 as provided by the tenants to the borrower. |
| (5) | Bloomingdale’s has a single termination right which may be exercised if Bloomingdale’s gross sales from April 1, 2028 through and including March 31, 2029 (the “Testing Period”) do not exceed $20,000,000. Provided Bloomingdale’s is not and continues to not be in monetary or material non-monetary default, if Bloomingdale’s gross sales did not exceed $20,000,000 during the Testing Period, Bloomingdale’s has the right to terminate its lease, effective March 31, 2030, provided that Bloomingdale’s (i) gives written notice to the landlord on or before May 31, 2029 and (ii) pays a termination fee equal to one year of the fixed annual rent then in effect as of the date of the termination notice. In addition, if Bloomingdale’s gross sales did not exceed $20,000,000 during the Testing Period, the landlord may elect to terminate the lease, effective March 31, 2030, by giving written notice to Bloomingdale’s on or before May 31, 2029; provided that no termination fee will be payable upon a landlord termination. |
The following table presents certain information relating to the lease rollover schedule at the 201 West 72nd Street Property:
Lease Expiration Schedule(1)
| Year Ending December 31, | No. of Leases Expiring | Expiring NRSF | % of Total NRSF | Cumulative Expiring NRSF | Cumulative % of Total NRSF | Annual
U/W
Base Rent(2) | % of Total Annual U/W Base Rent(2) | Annual
U/W
Base Rent
PSF(2) |
| MTM & 2024 | 0 | 0 | 0.0% | 0 | 0.0% | $0 | 0.0% | $0.00 |
| 2025 | 0 | 0 | 0.0% | 0 | 0.0% | $0 | 0.0% | $0.00 |
| 2026 | 0 | 0 | 0.0% | 0 | 0.0% | $0 | 0.0% | $0.00 |
| 2027 | 0 | 0 | 0.0% | 0 | 0.0% | $0 | 0.0% | $0.00 |
| 2028 | 1 | 4,400 | 15.0% | 4,400 | 15.0% | $615,000 | 10.7% | $139.77 |
| 2029 | 0 | 0 | 0.0% | 4,400 | 15.0% | $0 | 0.0% | $0.00 |
| 2030 | 0 | 0 | 0.0% | 4,400 | 15.0% | $0 | 0.0% | $0.00 |
| 2031 | 0 | 0 | 0.0% | 4,400 | 15.0% | $0 | 0.0% | $0.00 |
| 2032 | 1 | 24,985 | 85.0% | 29,385 | 100.0% | $5,114,194 | 89.3% | $204.69 |
| 2033 | 0 | 0 | 0.0% | 29,385 | 100.0% | $0 | 0.0% | $0.00 |
| 2034 | 0 | 0 | 0.0% | 29,385 | 100.0% | $0 | 0.0% | $0.00 |
| Vacant | 0 | 0 | 0.0% | 29,385 | 100.0% | $0 | 0.0% | $0.00 |
| Thereafter | 0 | 0 | 0.0% | 29,385 | 100.0% | $0 | 0.0% | $0.00 |
| Total/Weighted Average | 2 | 29,385 | 100.0% | | | $5,729,194 | 100.0% | $194.97 |
| (1) | Based on the underwritten rent roll dated April 1, 2024. |
| (2) | Annual U/W Base Rent, % of Total Annual U/W Base Rent and Annual U/W Base Rent PSF include $740,339 of straight line rent steps for Bloomingdale’s. |
Historical Occupancy. The following table presents historical occupancy percentages at the 201 West 72nd Street Property:
Historical Occupancy(1)
12/31/2021 | 12/31/2022 | 12/31/2023 | 4/1/2024(2) |
| 100.0% | 100.0% | 100.0% | 100.0% |
| (1) | Information obtained from the historical operating statements unless otherwise noted. |
| (2) | Information obtained from the underwritten rent roll as of April 1, 2024. |
| THE INFORMATION IN THIS STRUCTURAL AND COLLATERAL TERM SHEET IS NOT COMPLETE AND MAY BE AMENDED PRIOR TO THE TIME OF SALE. THIS TERM SHEET IS NOT AN OFFER TO SELL THESE SECURITIES AND IT IS NOT A SOLICITATION OF AN OFFER TO BUY THESE SECURITIES IN ANY JURISDICTION WHERE THE OFFER OR SALE IS NOT PERMITTED. |
| | 159 | |
| Retail – Anchored | Loan #14 | | Cut-off Date Balance: | | $25,650,000 |
| 201 West 72nd Street | 201 West 72nd Street | | Cut-off Date LTV: | | 56.0% |
| New York, NY 10023 | | | UW NCF DSCR: | | 1.91x |
| | | | UW NOI Debt Yield: | | 13.9% |
Operating History and Underwritten Net Cash Flow. The following table presents certain information relating to the operating history and underwritten net cash flow at the 201 West 72nd Street Property:
Cash Flow Analysis(1)
| | 2021 | 2022 | 2023 | TTM 2/29/2024 | U/W | %(2) | U/W $ per SF |
| Base Rent | $5,051,317 | $4,882,308 | $5,030,774 | $5,042,087 | $4,988,855 | 84.5 | % | $169.78 |
| Straight Line Rent Steps(3) | 0 | 0 | 0 | 0 | 740,339 | 12.5 | | 25.19 |
| Potential Income from Vacant Space | 0 | 0 | 0 | 0 | 0 | 0.0 | | 0.00 |
| Total Reimbursements | 148,870 | 176,760 | 231,950 | 200,463 | 177,285 | 3.0 | | 6.03 |
| Gross Potential Rent | $5,200,187 | $5,059,068 | $5,262,724 | $5,242,551 | $5,906,479 | 100.0 | % | $201.00 |
| Other Income | 0 | 0 | 0 | 0 | 0 | 0.0 | | 0.00 |
| (Vacancy & Credit Loss) | 0 | 0 | 0 | 0 | (295,324) | (5.0 | ) | (10.05) |
| Effective Gross Income | $5,200,187 | $5,059,068 | $5,262,724 | $5,242,551 | $5,611,155 | 95.0 | % | $190.95 |
| | | | | | | | |
| Management Fee | 156,006 | 151,772 | 157,882 | 157,277 | 168,335 | 3.0 | % | 5.73 |
| Real Estate Taxes | 1,687,258 | 1,616,859 | 1,542,702 | 1,697,434 | 1,607,471 | 28.6 | | 54.70 |
| Insurance | 29,677 | 39,197 | 35,297 | 36,025 | 44,368 | 0.8 | | 1.51 |
| Other Operating Expenses(4) | 227,829 | 194,246 | 259,978 | 259,501 | 231,122 | 4.1 | | 7.87 |
| Total Expenses | $2,100,770 | $2,002,074 | $1,995,859 | $2,150,236 | $2,051,295 | 36.6 | % | $69.81 |
| | | | | | | | |
| Net Operating Income | $3,099,417 | $3,056,994 | $3,266,865 | $3,092,314(5) | $3,559,860(5) | 63.4 | % | $121.15 |
| Replacement Reserves | 0 | 0 | 0 | 0 | 4,408 | 0.1 | | 0.15 |
| TI/LC | 0 | 0 | 0 | 0 | 146,955 | 2.6 | | 5.00 |
| Net Cash Flow | $3,099,417 | $3,056,994 | $3,266,865 | $3,092,314 | $3,408,497 | 60.7 | % | $115.99 |
| | | | | | | | |
| NOI DSCR | 1.74x | 1.71x | 1.83x | 1.73x | 2.00x | | |
| NCF DSCR | 1.74x | 1.71x | 1.83x | 1.73x | 1.91x | | |
| NOI Debt Yield | 12.1% | 11.9% | 12.7% | 12.1% | 13.9% | | |
| NCF Debt Yield | 12.1% | 11.9% | 12.7% | 12.1% | 13.3% | | |
| (1) | Based on the underwritten rent roll dated April 1, 2024. |
| (2) | Represents (i) percent of Gross Potential Rent for all revenue fields and (ii) percent of Effective Gross Income for all other fields. |
| (3) | Represents straight line rent steps for Bloomingdale’s over the term of its lease. |
| (4) | Other Operating Expenses include CAM, repairs and maintenance, and general and administrative expenses. |
| (5) | The increase from TTM 2/29/2024 NOI to U/W NOI is primarily attributable to straight line rent steps of $740,339 for Bloomingdale’s. |
| THE INFORMATION IN THIS STRUCTURAL AND COLLATERAL TERM SHEET IS NOT COMPLETE AND MAY BE AMENDED PRIOR TO THE TIME OF SALE. THIS TERM SHEET IS NOT AN OFFER TO SELL THESE SECURITIES AND IT IS NOT A SOLICITATION OF AN OFFER TO BUY THESE SECURITIES IN ANY JURISDICTION WHERE THE OFFER OR SALE IS NOT PERMITTED. |
| | 160 | |
| Retail – Anchored | Loan #14 | | Cut-off Date Balance: | | $25,650,000 |
| 201 West 72nd Street | 201 West 72nd Street | | Cut-off Date LTV: | | 56.0% |
| New York, NY 10023 | | | UW NCF DSCR: | | 1.91x |
| | | | UW NOI Debt Yield: | | 13.9% |
Market Overview and Competition. The 201 West 72nd Street Property is located at the base of The Alexandria on the corner of 72nd Street and Broadway in the Upper West Side neighborhood of Manhattan. The 201 West 72nd Street Property is accessible via the Broadway/72nd Street subway station located directly across the street which services the 1, 2, and 3 subway lines. Per the New York City Metropolitan Transportation Authority’s 2023 subway ridership statistics, the 72nd Street subway station exhibited annual subway ridership of 9,086,110, ranking 22nd out of 423 stations.
According to the appraisal, the 201 West 72nd Street Property is located in the Upper West Side retail submarket of the Manhattan retail market. As of December 31, 2023, the Upper West Side retail submarket had retail inventory of 3,486,511 square feet with a vacancy rate of 2.10% and an average asking rental rate of $107.26 per square foot.
The following table presents certain information relating to comparable retail leases to the 201 West 72nd Street Property:
Market Analysis(1)
| Property Name / Location | Tenant | Suite Size (SF) | Lease Commencement | Lease Term (Mos) | Rent (PSF) |
| 201 West 72nd Street | Bloomingdale’s | 24,985 | Apr – 2020(2) | 144(2) | $175.06(3) |
| 201 West 72nd Street | FedEx | 4,400 | Nov – 2020(2) | 93(2) | $139.77(3) |
360 Amsterdam Avenue Northwest Corner of 77th Street | Salt & Straw | 2,397 | Mar - 2024 | 120 | $205.00 |
2220 Broadway Northeast Corner of 79th Street | P.C. Richard & Son | 31,500 | Jun - 2023 | 60 | $226.19 |
2990 Broadway Between 82nd and 83rd Streets | Westville | 4,358 | May - 2023 | 120 | $169.64 |
101 West 73rd Street Between 73rd and 74th Streets | Nuts Factory | 2,716 | Mar - 2023 | 120 | $175.00 |
104 West 70th Street Between 69th and 70th Streets | New Balance Athletic Shoe, Inc. | 4,100 | Mar - 2023 | 125 | $320.00 |
164 West 75th Street Between Amsterdam and Columbus Avenues | Sempre 75 LLC | 5,375 | Jan - 2023 | 120 | $120.00 |
| (1) | Information obtained from the appraisal. |
| (2) | The Lease Commencement and Lease Term for Bloomingdale’s and FedEx represent the most recent rent commencement date and term as per their latest lease amendments. |
| (3) | Rent (PSF) reflects base rent and is not inclusive of rent steps. |
| THE INFORMATION IN THIS STRUCTURAL AND COLLATERAL TERM SHEET IS NOT COMPLETE AND MAY BE AMENDED PRIOR TO THE TIME OF SALE. THIS TERM SHEET IS NOT AN OFFER TO SELL THESE SECURITIES AND IT IS NOT A SOLICITATION OF AN OFFER TO BUY THESE SECURITIES IN ANY JURISDICTION WHERE THE OFFER OR SALE IS NOT PERMITTED. |
| | 161 | |
| No. 15 – Richland Town Center |
| |
| Mortgage Loan Information | | Mortgaged Property Information |
| Mortgage Loan Seller: | Wells Fargo Bank, National Association | | Single Asset/Portfolio: | Single Asset |
Credit Assessment (Fitch/KBRA/Moody’s): | NR/NR/NR | | Property Type – Subtype: | Retail – Anchored |
| Original Principal Balance: | $25,500,000 | | Location: | Johnstown, PA |
| Cut-off Date Balance: | $25,460,163 | | Size: | 289,570 SF |
| % of Initial Pool Balance: | 2.4% | | Cut-off Date Balance Per SF: | $87.92 |
| Loan Purpose: | Refinance | | Maturity Date Balance Per SF: | $76.28 |
| Borrower Sponsors: | John R. McGill and Matthew J. McGill | | Year Built/Renovated: | 2004/NAP |
| Guarantors: | John R. McGill and Matthew J. McGill | | Title Vesting: | Fee |
| Mortgage Rate: | 6.6880% | | Property Manager: | Self-managed |
| Note Date: | April 08, 2024 | | Current Occupancy (As of): | 95.7% (01/23/2024) |
| Seasoning: | 2 months | | YE 2023 Occupancy: | 100.0% |
| Maturity Date: | April 11, 2034 | | YE 2022 Occupancy: | 100.0% |
| IO Period: | NAP | | YE 2021 Occupancy: | 96.0% |
| Loan Term (Original): | 120 months | | As-Is Appraised Value: | $41,300,000 |
| Amortization Term (Original): | 360 months | | As-Is Appraised Value Per SF: | $142.63 |
| Loan Amortization Type: | Amortizing Balloon | | As-Is Appraisal Valuation Date: | January 24, 2024 |
| Call Protection: | L(26),D(89),O(5) | | | |
| Lockbox Type: | Soft / Springing Cash Management | | Underwriting and Financial Information |
| Additional Debt: | None | | TTM NOI: | NAV |
| Additional Debt Type (Balance): | NAP | | YE 2023 NOI: | $3,173,814 |
| | | YE 2022 NOI: | $3,067,896 |
| Escrows and Reserves | | YE 2021 NOI: | $2,898,671 |
| | Initial | Monthly | Cap | | U/W Revenues: | $4,477,362 |
| Taxes | $51,581 | $51,581 | NAP | | U/W Expenses: | $1,374,534 |
| Insurance(1) | $0 | Springing | NAP | | U/W NOI: | $3,102,829 |
| Replacement Reserve | $0 | $6,787 | NAP | | U/W NCF: | $2,876,382 |
| TI/ LC Reserve | $250,000 | $12,083 | $750,000 | | U/W DSCR based on NOI/NCF: | 1.57x / 1.46x |
| | | | | | U/W Debt Yield based on NOI/NCF: | 12.2% / 11.3% |
| | | | | | U/W Debt Yield at Maturity based on NOI/NCF: | 14.0% / 13.0% |
| | | | | | Cut-off Date LTV Ratio: | 61.6% |
| | | | | | LTV Ratio at Maturity: | 53.5% |
| | | | | | | |
| | | | | | | | |
| Sources and Uses |
| Sources | | | | | Uses | | | |
| Loan amount | $25,500,000 | | 99.1% | | Existing Mortgage | $24,895,766 | | 96.7% |
| Borrower Equity | $233,889 | | 0.9% | | Upfront Reserves | $301,581 | | 1.2% |
| | | | | | Closing Costs | $536,541 | | 2.1% |
| | | | | | | | | |
| Total Sources | $25,733,889 | | 100.0% | | Total Uses | $25,733,889 | | 100.0% |
| (1) | Ongoing monthly reserves for insurance are not required as long as no event of default is continuing, the policies maintained by the borrower are part of a blanket or umbrella policy approved by the lender, and the borrower provides the lender with paid receipts for the insurance premiums no later than 10 business days prior to the expiration dates of the policies. |
The Mortgage Loan. The mortgage loan (the “Richland Town Center Mortgage Loan”) is evidenced by a promissory note in the original principal amount of $25,500,000 and secured by a first priority fee interest in a 289,570 square foot anchored retail property located in Johnstown, Pennsylvania (the “Richland Town Center Property”).
The Borrower and Borrower Sponsors. The borrower is Johnstown Shopping Center, LLC, an Ohio limited liability company and single purpose entity with one independent director. Legal counsel to the borrower delivered a non-consolidation opinion in connection with the origination of the Richland Town Center Mortgage Loan. The borrower sponsors are John R. McGill and Matthew J. McGill. The non-recourse carveout guarantors are John R. McGill and Matthew J. McGill.
John R. McGill is the founder and president of MGP Property Group. The company was founded in 2004 and currently manages over 1 million square feet of commercial retail real estate in Florida, Ohio, and Pennsylvania. Matthew J. McGill is a property manager for MGP Property Group, with over 13 years of experience in the development, leasing, and management of commercial retail real estate.
The Property. The Richland Town Center Property is an anchored retail center located in Johnstown, Pennsylvania consisting of six buildings totaling 289,570 square feet. Built in 2004, the Richland Town Center Property is situated on a 38.51-acre site and is
| THE INFORMATION IN THIS STRUCTURAL AND COLLATERAL TERM SHEET IS NOT COMPLETE AND MAY BE AMENDED PRIOR TO THE TIME OF SALE. THIS TERM SHEET IS NOT AN OFFER TO SELL THESE SECURITIES AND IT IS NOT A SOLICITATION OF AN OFFER TO BUY THESE SECURITIES IN ANY JURISDICTION WHERE THE OFFER OR SALE IS NOT PERMITTED. |
| | 162 | |
| Retail - Anchored | Loan #15 | Cut-off Date Balance: | | $25,460,163 |
| 370 Town Centre Drive | Richland Town Center | Cut-off Date LTV: | | 61.6% |
| Johnstown, PA 15904 | | UW NCF DSCR: | | 1.46x |
| | | UW NOI Debt Yield: | | 12.2% |
anchored by Best Buy, Michaels, TJ Maxx and Ross Dress for Less, and shadow anchored by a Wal-Mart. Other notable tenants at the Richland Town Center Property include Petco, Five Below, Dollar Tree and Richland Mall Cinemas. Outside of the largest tenant, TJ Maxx, no other tenants makes up more than 8.5% of the underwritten rent. The Richland Town Center Property contains 2,150 surface parking spaces, resulting in a parking ratio of 7.42 spaces per 1,000 SF of rentable area. As of January 23, 2024, the Richland Town Center Property was 95.7% leased to 32 tenants and has averaged 98.0% occupancy since 2018.
Major Tenants.
TJ Maxx (F/M/S: NR/A2/A ; 50,490 SF; 17.4% of NRA; 13.9% of underwritten base rent). TJ Maxx is a part of the TJX Companies, Inc., an off-price retailer of apparel and home fashions. It has more than 4,800 stores across nine countries and approximately 329,000 employees. TJ Maxx has been a tenant since 2004 and has a lease expiring in January 2025 with two, five-year renewal options remaining and no termination options.
Richland Mall Cinemas (F/M/S: NR/NR/NR; 27,220 SF; 9.4% of NRA; 8.5% of underwritten base rent). Founded in 1949, as County Amusement Company, Richland Cinemas is a family run business that has been operated by four generations of a single family. This is its only location. Richland Mall Cinemas has been a tenant since 2003 and has a lease expiring in November 2033 with four, five-year renewal options remaining and no termination options.
Best Buy (F/M/S: NR/A3/BBB+; 33,862 SF; 11.7% of NRA; 7.0% of underwritten base rent). Founded in 1966, the company’s product offerings include consumer electronics, computers and mobile phones, appliances, entertainment products and home office products. Best Buy has more than 1,000 stores and over 90,000 employees. The company has been a tenant since 2011 and has a lease expiring in March 2027 with four, five-year renewal options remaining and no termination options.
The following table presents certain information relating to the tenancy at the Richland Town Center Property:
Major Tenants(1)
| Tenant Name | Credit Rating (Fitch/ Moody’s/
S&P)(2) | Tenant NRSF | % of
NRSF | Annual U/W Base Rent PSF | Annual
U/W Base Rent(3) | % of Total Annual U/W Base Rent(3) | Lease
Expiration
Date | Ext. Options | Term. Option (Y/N) |
| Major Tenants | | | | | | | | |
| TJ Maxx | NR/A2/A | 50,490 | 17.4% | $9.25 | $467,033 | 13.9% | 1/31/2025 | 2, 5-year | N |
| Richland Mall Cinemas | NR/NR/NR | 27,220 | 9.4% | $10.50 | $285,810 | 8.5% | 11/30/2033 | 4, 5-year | N |
| Best Buy | NR/A3/BBB+ | 33,862 | 11.7% | $7.00 | $237,034 | 7.0% | 3/31/2027 | 4, 5-year | N |
| Petco | NR/NR/NR | 15,000 | 5.2% | $15.25 | $228,750 | 6.8% | 1/31/2033 | 2, 5-year | N |
| Dollar Tree | NR/NR/NR | 18,850 | 6.5% | $11.25 | $212,063 | 6.3% | 1/31/2030 | 2, 5-year | N |
| Ross Dress for Less | NR/NR/NR | 23,678 | 8.2% | $8.50 | $201,263 | 6.0% | 1/31/2030 | 2, 5-year | N |
| Michaels | NR/NR/NR | 21,300 | 7.4% | $7.25 | $154,425 | 4.6% | 2/28/2029 | 1, 5-year | N |
| | 190,400 | 65.8% | $9.38 | $1,786,377 | 53.1% | | | |
| | | | | | | | | |
| Non-Major Tenants | 86,667 | 29.9% | $18.24 | $1,580,837 | 46.9% | | | |
| | | | | | | | | |
| Occupied Collateral Total(4) | 277,067 | 95.7% | $12.15 | $3,367,214 | 100.0% | | | |
| | | | | | | | | |
| Vacant Space | 12,503 | 4.3% | | | | | | |
| | | | | | | | | |
| Collateral Total(4) | 289,570 | 100.0% | | | | | | |
| | | | | | | | | | |
| (1) | Information obtained from the underwritten rent roll dated January 23, 2024. |
| (2) | Certain ratings are those of the parent company, whether or not the parent company guarantees the lease. |
| (3) | Annual U/W Base Rent and % of Total Annual U/W Base Rent excludes vacant space. |
| (4) | Includes Chili’s square footage (5,691) which is on a ground lease. |
| THE INFORMATION IN THIS STRUCTURAL AND COLLATERAL TERM SHEET IS NOT COMPLETE AND MAY BE AMENDED PRIOR TO THE TIME OF SALE. THIS TERM SHEET IS NOT AN OFFER TO SELL THESE SECURITIES AND IT IS NOT A SOLICITATION OF AN OFFER TO BUY THESE SECURITIES IN ANY JURISDICTION WHERE THE OFFER OR SALE IS NOT PERMITTED. |
| | 163 | |
| Retail - Anchored | Loan #15 | Cut-off Date Balance: | | $25,460,163 |
| 370 Town Centre Drive | Richland Town Center | Cut-off Date LTV: | | 61.6% |
| Johnstown, PA 15904 | | UW NCF DSCR: | | 1.46x |
| | | UW NOI Debt Yield: | | 12.2% |
The following table presents a summary of sales and occupancy costs for certain tenants at the Richland Town Center Property:
Tenant Sales(1)(2)
| | 2021 Sales (PSF) | 2022 Sales (PSF) | 2023 Sales (PSF) | Occupancy Cost(3) |
| TJ Maxx | $301 | $310 | $330 | 2.8% |
| Richland Mall Cinemas(4) | $98,890 | $146,008 | $175,705 | 16.3% |
| Best Buy | NAV | NAV | NAV | NAV |
| Petco | NAV | NAV | NAV | NAV |
| Dollar Tree | NAV | NAV | NAV | NAV |
| Ross Dress for Less | NAV | NAV | NAV | NAV |
| Michaels | $152 | $136 | $130 | 5.6% |
| (1) | Information obtained from the borrower. |
| (2) | Tenants shown on the Major Tenants table above and not included on the Tenant Sales table are not required to report sales. |
| (3) | Occupancy cost based on underwritten base rent and any applicable reimbursements, divided by most recent reported sales. |
| (4) | Richland Mall Cinemas represents per screen sales. |
The following table presents certain information relating to the lease rollover schedule at the Richland Town Center Property:
Lease Expiration Schedule(1)(2)
Year Ending
December 31, | No. of Leases Expiring | Expiring NRSF | % of Total NRSF | Cumulative Expiring NRSF | Cumulative % of Total NRSF | Annual
U/W
Base Rent | % of Total Annual U/W Base Rent | Annual
U/W
Base Rent
PSF |
| MTM | 0 | 0 | 0.0% | 0 | 0.0% | $0 | 0.0% | $0.00 |
| 2024 | 2 | 3,710 | 1.3% | 3,710 | 1.3% | $71,925 | 2.1% | $19.39 |
| 2025 | 7 | 67,448 | 23.3% | 71,158 | 24.6% | $799,364 | 23.7% | $11.85 |
| 2026 | 1 | 7,200 | 2.5% | 78,358 | 27.1% | $146,520 | 4.4% | $20.35 |
| 2027 | 4 | 39,438 | 13.6% | 117,796 | 40.7% | $341,267 | 10.1% | $8.65 |
| 2028 | 2 | 7,280 | 2.5% | 125,076 | 43.2% | $140,880 | 4.2% | $19.35 |
| 2029 | 5 | 36,080 | 12.5% | 161,156 | 55.7% | $351,107 | 10.4% | $9.73 |
| 2030 | 3 | 45,407 | 15.7% | 206,563 | 71.3% | $469,466 | 13.9% | $10.34 |
| 2031 | 3 | 18,984 | 6.6% | 225,547 | 77.9% | $337,205 | 10.0% | $17.76 |
| 2032 | 2 | 7,500 | 2.6% | 233,047 | 80.5% | $151,000 | 4.5% | $20.13 |
| 2033 | 2 | 42,220 | 14.6% | 275,267 | 95.1% | $514,560 | 15.3% | $12.19 |
| 2034 | 0 | 0 | 0.0% | 275,267 | 95.1% | $0 | 0.0% | $0.00 |
| Thereafter | 1 | 1,800 | 0.6% | 277,067 | 95.7% | $43,920 | 1.3% | $24.40 |
| Vacant | 0 | 12,503 | 4.3% | 289,570 | 100.0% | $0 | 0.0% | $0.00 |
| Total/Weighted Average | 32 | 289,570 | 100.0% | | | $3,367,214 | 100.0% | $12.15(3) |
| (1) | Information obtained from the underwritten rent roll dated January 23, 2024. |
| (2) | Certain tenants may have lease termination options that are exercisable prior to the originally stated expiration date of the related lease and are not considered in the rollover schedule. |
| (3) | Total/Weighted Average Annual U/W Base Rent PSF excludes vacant space. |
The following table presents historical occupancy percentages at the Richland Town Center Property:
Historical Occupancy
12/31/2021(1) | 12/31/2022(1) | 12/31/2023(1) | 1/23/2024(2) |
| 96.0% | 100.0% | 100.0% | 95.7% |
| (1) | Information obtained from the borrower. |
| (2) | Information obtained from the underwritten rent roll dated January 23, 2024. |
Market Overview and Competition. The Richland Town Center Property is located in Johnstown, Pennsylvania. The Johnstown area is the primary commercial market in Cambria County. It is located approximately 6.3 miles from Johnstown and 73.0 miles east of Pittsburgh. The Richland Town Center Property is located approximately 0.5 miles to US 219 and 1.1 miles to Route 56, providing access throughout the region. The Richland Township area is home to several defense and aerospace facilities and the largest concentration of retail development in the county. Major employers in the area include Conemaugh Valley Memorial Hospital, Saint Francis University, Cambria Care Center, University of Pittsburgh and Giant Eagle Inc. The Richland Town Center Property is also located approximately 0.9 miles from the University of Pittsburgh at Johnstown.
According to the appraisal, the estimated 2023 population within a one-, three- and five-mile radius was approximately 2,717, 20,056, and 45,193, respectively, and the average household income within the same radii was $104,885, $91,726, and $78,551, respectively.
| THE INFORMATION IN THIS STRUCTURAL AND COLLATERAL TERM SHEET IS NOT COMPLETE AND MAY BE AMENDED PRIOR TO THE TIME OF SALE. THIS TERM SHEET IS NOT AN OFFER TO SELL THESE SECURITIES AND IT IS NOT A SOLICITATION OF AN OFFER TO BUY THESE SECURITIES IN ANY JURISDICTION WHERE THE OFFER OR SALE IS NOT PERMITTED. |
| | 164 | |
| Retail - Anchored | Loan #15 | Cut-off Date Balance: | | $25,460,163 |
| 370 Town Centre Drive | Richland Town Center | Cut-off Date LTV: | | 61.6% |
| Johnstown, PA 15904 | | UW NCF DSCR: | | 1.46x |
| | | UW NOI Debt Yield: | | 12.2% |
According to a third party research report, the Richland Town Center Property is located within the Johnstown retail submarket. As of May 22, 2024, the submarket reported total inventory of approximately 7.92 million square feet with a 4.3% vacancy rate and average asking rent of $12.44 per square foot. The appraisal concluded to market rents for the Richland Town Center Property, ranging from $9.75 per square foot for anchor to $21.50 per square foot for inline space and Strip Center space.
The following table presents certain information relating to the appraiser’s market rent conclusions for the Richland Town Center Property:
Market Rent Summary(1)
| | Anchor | In Line | Strip Center | Free Standing Restaurant | Junior Anchor |
| Market Rent (PSF) | $9.75 | $21.50 | $21.50 | $15.00 | $11.00 |
| Lease Term (Years) | 15 | 10 | 10 | 10 | 15 |
Lease Type (Reimbursements) | Net | Net | Net | Net | Net |
| Rent Increase Projection | 10.0%/5 years | 10.0%/midterm | 10.0%/midterm | 10.0%/midterm | 10.0%/5 years |
| Tenant Improvements (New / Renewal) | $5.00 / $0.00 | $10.00 / $5.00 | $10.00 / $5.00 | $10.00 / $5.00 | $5.00 / $0.00 |
| Leasing Commissions (New / Renewal) | 6.0% / 3.0% | 6.0% / 3.0% | 6.0% / 3.0% | 6.0% / 3.0% | 6.0% / 3.0% |
| Free Rent Months (New / Renewal) | 0 / 0 | 0 / 0 | 0 / 0 | 0 / 0 | 0 / 0 |
| | (1) | Information obtained from the appraisal. |
The table below presents certain information relating to comparable sales pertaining to the Richland Town Center Property, as identified by the appraiser:
Comparable Sales(1)
Property Name | Location | Year Built/Renovated | Rentable Area (SF) | Occupancy | Sale Date | Sale Price | Sale Price (PSF) |
| Richland Town Center | 370 Town Centre Drive, Johnstown, PA | 2004/NAP | 289,570 | 95.7%(2) | - | - | - |
| Springhurst Towne Center | 4400 Towne Center Drive, Louisville, KY | 1997/2020 | 444,503 | 99.0% | 12/2023 | $66,100,000 | $149 |
| Countrywood Crossing | 2281 North Germantown Parkway, Cordova, TN | 2007/NAP | 233,981 | 64.0% | 6/2023 | $26,820,000 | $115 |
| The Promenade at Carolina Reserve | 7790-7900 Charlotte Highway, Fort Mill, SC | 2018/NAP | 228,097 | 100.0% | 6/2023 | $34,050,000 | $149 |
| Maple Hill Pavillion | 5022 West Main Street, Kalamazoo, MI | 1971/2013 | 276,397 | 98.0% | 5/2023 | $33,312,000 | $121 |
| Promenade at Manassas | 7486 Stream Walk Lane, Manassas, VA | 1992/NAP | 280,760 | 99.0% | 10/2022 | $46,100,000 | $164 |
| (1) | Information obtained from the appraisal. |
| (2) | Information obtained from the underwritten rent roll dated January 23, 2024. |
| THE INFORMATION IN THIS STRUCTURAL AND COLLATERAL TERM SHEET IS NOT COMPLETE AND MAY BE AMENDED PRIOR TO THE TIME OF SALE. THIS TERM SHEET IS NOT AN OFFER TO SELL THESE SECURITIES AND IT IS NOT A SOLICITATION OF AN OFFER TO BUY THESE SECURITIES IN ANY JURISDICTION WHERE THE OFFER OR SALE IS NOT PERMITTED. |
| | 165 | |
| Retail - Anchored | Loan #15 | Cut-off Date Balance: | | $25,460,163 |
| 370 Town Centre Drive | Richland Town Center | Cut-off Date LTV: | | 61.6% |
| Johnstown, PA 15904 | | UW NCF DSCR: | | 1.46x |
| | | UW NOI Debt Yield: | | 12.2% |
Operating History and Underwritten Net Cash Flow. The following table presents certain information relating to the historical operating performance and underwritten net cash flow at the Richland Town Center Property:
Cash Flow Analysis
| | 2020 | 2021 | 2022 | 2023 | U/W | %(1) | U/W $ per SF |
| Base Rent | $2,678,676 | $3,081,700 | $3,221,508 | $3,370,397 | $3,367,214 | 70.9% | $11.63 |
| Grossed Up Vacant Space | 0 | 0 | 0 | 0 | 268,815 | 5.7 | 0.93 |
| Gross Potential Rent | $2,678,676 | $3,081,700 | $3,221,508 | $3,370,397 | $3,636,029 | 76.6% | $12.56 |
| Other Income | 1,000 | 2,712 | 2,407 | 456 | 456 | 0.0 | 0.00 |
| Total Recoveries | 922,006 | 928,715 | 1,000,649 | 1,041,928 | 1,109,692 | 23.4 | 3.83 |
| Net Rental Income | $3,601,682 | $4,013,126 | $4,224,564 | $4,412,782 | $4,746,177 | 100.0% | $16.39 |
| (Free Rent) | 0 | 0 | 0 | 0 | 0 | 0.0 | 0.00 |
| (Vacancy & Credit Loss) | 0 | 0 | 0 | 0 | (268,815)(2) | (7.4) | (0.93) |
| Effective Gross Income | $3,601,682 | $4,013,126 | $4,224,564 | $4,412,782 | $4,477,362 | 94.3% | $15.46 |
| | | | | | | | |
| Real Estate Taxes | 568,215 | 568,276 | 565,207 | 577,712 | 589,487 | 13.2 | 2.04 |
| Insurance | 65,694 | 64,890 | 76,550 | 101,730 | 101,730 | 2.3 | 0.35 |
| Management Fee | 9,603 | 10,901 | 11,695 | 10,530 | 134,321 | 3.0 | 0.46 |
| Other Operating Expenses | 488,386 | 470,388 | 503,217 | 548,996 | 548,996 | 12.3 | 1.90 |
| Total Operating Expenses | $1,131,898 | $1,114,455 | $1,156,669 | $1,238,968 | $1,374,534 | 30.7% | $4.75 |
| | | | | | | | |
| Net Operating Income | $2,469,784 | $2,898,671 | $3,067,896 | $3,173,814 | $3,102,829 | 69.3% | $10.72 |
| Replacement Reserves | 0 | 0 | 0 | 0 | 81,447 | 1.8 | 0.28 |
| TI/LC | 0 | 0 | 0 | 0 | 145,000 | 3.2 | 0.50 |
| Net Cash Flow | $2,469,784 | $2,898,671 | $3,067,896 | $3,173,814 | $2,876,382 | 64.2% | $9.93 |
| | | | | | | | |
| NOI DSCR | 1.25x | 1.47x | 1.56x | 1.61x | 1.57x | | |
| NCF DSCR | 1.25x | 1.47x | 1.56x | 1.61x | 1.46x | | |
| NOI Debt Yield | 9.7% | 11.4% | 12.0% | 12.5% | 12.2% | | |
| NCF Debt Yield | 9.7% | 11.4% | 12.0% | 12.5% | 11.3% | | |
| (1) | Represents (i) percent of Net Rental Income for all revenue fields, (ii) percent of Gross Potential Rent for Vacancy & Credit Loss and (iii) percent of Effective Gross Income for all other fields. |
| (2) | The underwritten economic vacancy is 7.4%. The Richland Town Center Property was 95.7% leased as of January 23, 2024. |
| THE INFORMATION IN THIS STRUCTURAL AND COLLATERAL TERM SHEET IS NOT COMPLETE AND MAY BE AMENDED PRIOR TO THE TIME OF SALE. THIS TERM SHEET IS NOT AN OFFER TO SELL THESE SECURITIES AND IT IS NOT A SOLICITATION OF AN OFFER TO BUY THESE SECURITIES IN ANY JURISDICTION WHERE THE OFFER OR SALE IS NOT PERMITTED. |
| | 166 | |
| BANK 2024-BNK47 | Transaction Contact Information |
VI. Transaction Contact Information
Questions regarding this Structural and Collateral Term Sheet may be directed to any of the following individuals:
| Wells Fargo Securities, LLC | |
| | |
| Brigid Mattingly | Tel. (312) 269-3062 |
| | |
| A.J. Sfarra | Tel. (212) 214-5613 |
| | |
| Sean Duffy | Tel. (312) 827-1518 |
| BofA Securities, Inc. | |
| | |
| Leland F. Bunch, III | Tel. (646) 855-3953 |
| | |
| Danielle Caldwell | Tel. (646) 855-3421 |
| Citigroup Global Markets Inc. | |
| | |
| Raul Orozco | Tel. (212) 723-1295 |
| | |
| Goldman Sachs & Co. LLC | |
| | |
| Scott Epperson | Tel. (212) 934-2882 |
| | |
| Justin Peterson | Tel. (212) 902-4283 |
| | |
| J.P. Morgan Securities LLC | |
| | |
| Kunal Singh | Tel. (212) 834-5467 |
| | |
| Harris Rendelstein | Tel. (212) 834-6737 |
| | |
| Derrick Fetzer | Tel. (212) 834-3111 |
| | |
| Avinash Sharma | Tel. (212) 834-3111 |
| | |
| Morgan Stanley & Co. LLC | |
| | |
| Nishant Kapur | Tel. (212) 761-1483 |
| | |
| Jane Lam | Tel. (212) 761-3507 |
| | |
| | |
| THE INFORMATION IN THIS STRUCTURAL AND COLLATERAL TERM SHEET IS NOT COMPLETE AND MAY BE AMENDED PRIOR TO THE TIME OF SALE. THIS TERM SHEET IS NOT AN OFFER TO SELL THESE SECURITIES AND IT IS NOT A SOLICITATION OF AN OFFER TO BUY THESE SECURITIES IN ANY JURISDICTION WHERE THE OFFER OR SALE IS NOT PERMITTED. |
| | 167 | |