| | | FREE WRITING PROSPECTUS |
| | | FILED PURSUANT TO RULE 433 |
| | | REGISTRATION FILE NO.: 333-257991-14 |
Free Writing Prospectus
Structural and Collateral Term Sheet
$720,005,340
(Approximate Initial Pool Balance)
$645,304,000
(Approximate Aggregate Certificate Balance of Offered Certificates)
Wells Fargo Commercial Mortgage Trust 2024-5C2
as Issuing Entity
Wells Fargo Commercial Mortgage Securities, Inc.
as Depositor
Wells Fargo Bank, National Association
Goldman Sachs Mortgage Company
JPMorgan Chase Bank, National Association
UBS AG
Citi Real Estate Funding Inc.
LMF Commercial, LLC
as Sponsors and Mortgage Loan Sellers
Commercial Mortgage Pass-Through Certificates
Series 2024-5C2
November 12, 2024
WELLS FARGO
SECURITIES | CITIGROUP | GOLDMAN
SACHS & CO.
LLC | J.P. MORGAN | UBS SECURITIES |
Co-Lead Manager
and Joint Bookrunner | Co-Lead Manager
and
Joint Bookrunner | Co-Lead Manager
and
Joint Bookrunner | Co-Lead Manager
and Joint Bookrunner | Co-Lead Manager
and
Joint Bookrunner |
Academy Securities, Inc. Co-Manager | Drexel Hamilton Co-Manager | Siebert Williams Shank Co-Manager |
STATEMENT REGARDING THIS FREE WRITING PROSPECTUS
The depositor has filed a registration statement (including a prospectus) with the Securities and Exchange Commission (“SEC”) (SEC File No. 333-257991) for the offering to which this communication relates. Before you invest, you should read the prospectus in the registration statement and other documents the depositor has filed with the SEC for more complete information about the depositor, the issuing entity and this offering. You may get these documents for free by visiting EDGAR on the SEC Web site at www.sec.gov. Alternatively, the depositor, any underwriter, or any dealer participating in the offering will arrange to send you the prospectus after filing if you request it by calling toll free 1-800-745-2063 (8 a.m. – 5 p.m. EST) or by emailing wfs.cmbs@wellsfargo.com.
Nothing in this document constitutes an offer of securities for sale in any jurisdiction where the offer or sale is not permitted. The information contained herein is preliminary as of the date hereof, supersedes any such information previously delivered to you and will be superseded by any such information subsequently delivered and ultimately by the final prospectus relating to the securities. These materials are subject to change, completion, supplement or amendment from time to time.
This free writing prospectus has been prepared by the underwriters for information purposes only and does not constitute, in whole or in part, a prospectus for the purposes of (i) Regulation (EU) 2017/1129 (as amended), (ii) such Regulation as it forms part of UK domestic law, or (iii) Part VI of the UK Financial Services and Markets Act 2000, as amended; and does not constitute an offering document for any other purpose.
STATEMENT REGARDING ASSUMPTIONS AS TO SECURITIES, PRICING ESTIMATES AND OTHER INFORMATION
The attached information contains certain tables and other statistical analyses (the “Computational Materials”) which have been prepared in reliance upon information furnished by the Mortgage Loan Sellers. Numerous assumptions were used in preparing the Computational Materials, which may or may not be reflected herein. As such, no assurance can be given as to the Computational Materials’ accuracy, appropriateness or completeness in any particular context; or as to whether the Computational Materials and/or the assumptions upon which they are based reflect present market conditions or future market performance. The Computational Materials should not be construed as either projections or predictions or as legal, tax, financial or accounting advice. You should consult your own counsel, accountant and other advisors as to the legal, tax, business, financial and related aspects of a purchase of these securities. Any weighted average lives, yields and principal payment periods shown in the Computational Materials are based on prepayment and/or loss assumptions, and changes in such prepayment and/or loss assumptions may dramatically affect such weighted average lives, yields and principal payment periods. In addition, it is possible that prepayments or losses on the underlying assets will occur at rates higher or lower than the rates shown in the attached Computational Materials. The specific characteristics of the securities may differ from those shown in the Computational Materials due to differences between the final underlying assets and the preliminary underlying assets used in preparing the Computational Materials. The principal amount and designation of any security described in the Computational Materials are subject to change prior to issuance. None of Wells Fargo Securities, LLC, Citigroup Global Markets Inc., Goldman Sachs & Co. LLC, UBS Securities LLC, J.P. Morgan Securities LLC, Academy Securities, Inc., Drexel Hamilton, LLC, Siebert Williams Shank & Co., LLC or any of their respective affiliates, make any representation or warranty as to the actual rate or timing of payments or losses on any of the underlying assets or the payments or yield on the securities. The information in this presentation is based upon management forecasts and reflects prevailing conditions and management’s views as of this date, all of which are subject to change. In preparing this presentation, we have relied upon and assumed, without independent verification, the accuracy and completeness of all information available from public sources or which was provided to us by or on behalf of the Mortgage Loan Sellers or which was otherwise reviewed by us.
This free writing prospectus contains certain forward-looking statements. If and when included in this free writing prospectus, the words “expects”, “intends”, “anticipates”, “estimates” and analogous expressions and all statements that are not historical facts, including statements about our beliefs or expectations, are intended to identify forward-looking statements. Any forward-looking statements are made subject to risks and uncertainties which could cause actual results to differ materially from those stated. Those risks and uncertainties include, among other things, declines in general economic and business conditions, increased competition, changes in demographics, changes in political and social conditions, regulatory initiatives and changes in customer preferences, many of which are beyond our control and the control of any other person or entity related to this offering. The forward-looking statements made in this free writing prospectus are made as of the date stated on the cover. We have no obligation to update or revise any forward-looking statement.
Wells Fargo Securities is the trade name for the capital markets and investment banking services of Wells Fargo & Company and its subsidiaries, including but not limited to Wells Fargo Securities, LLC, a member of NYSE, FINRA, NFA and SIPC, Wells Fargo Prime Services, LLC, a member of FINRA, NFA and SIPC, and Wells Fargo Bank, N.A. Wells Fargo Securities, LLC and Wells Fargo Prime Services, LLC are distinct entities from affiliated banks and thrifts.
J.P. Morgan is the marketing name for the investment banking businesses of JPMorgan Chase & Co. and its subsidiaries worldwide. Securities, syndicated loan arranging, financial advisory and other investment banking activities are performed by JPMS and its securities affiliates, and lending, derivatives and other commercial banking activities are performed by JPMorgan Chase Bank, National Association and its banking affiliates. JPMS is a member of SIPC and the NYSE.
IMPORTANT NOTICE REGARDING THE OFFERED CERTIFICATES
The information herein is preliminary and may be supplemented or amended prior to the time of sale. In addition, the Offered Certificates referred to in these materials and the asset pool backing them are subject to modification or revision (including the possibility that one or more classes of certificates may be split, combined or eliminated at any time prior to issuance or availability of a final prospectus) and are offered on a “when, as and if issued” basis.
The underwriters described in these materials may from time to time perform investment banking services for, or solicit investment banking business from, any company named in these materials. The underwriters and/or their affiliates or respective employees may from time to time have a long or short position in any security or contract discussed in these materials.
The information contained herein supersedes any previous such information delivered to any prospective investor and will be superseded by information delivered to such prospective investor prior to the time of sale.
IMPORTANT NOTICE RELATING TO AUTOMATICALLY-GENERATED EMAIL DISCLAIMERS
Any legends, disclaimers or other notices that may appear at the bottom of any email communication to which this free writing prospectus is attached relating to (1) these materials not constituting an offer (or a solicitation of an offer), (2) any representation that these materials are accurate or complete and may not be updated or (3) these materials possibly being confidential, are not applicable to these materials and should be disregarded. Such legends, disclaimers or other notices have been automatically generated as a result of these materials having been sent via Bloomberg or another system.
THE INFORMATION IN THIS STRUCTURAL AND COLLATERAL TERM SHEET IS NOT COMPLETE AND MAY BE AMENDED PRIOR TO THE TIME OF SALE. THIS TERM SHEET IS NOT AN OFFER TO SELL THESE SECURITIES AND IT IS NOT A SOLICITATION OF AN OFFER TO BUY THESE SECURITIES IN ANY JURISDICTION WHERE THE OFFER OR SALE IS NOT PERMITTED. |
| | 2 | |
| Wells Fargo Commercial Mortgage Trust 2024-5C2 | Certificate Structure |
| Class | Expected Ratings
(Fitch/KBRA/Moody’s)(1) | Approximate Initial Certificate Balance or Notional Amount(2) | Approx. Initial Credit Support(3) | Pass-Through Rate Description | Weighted Average Life (Years)(4) | Expected Principal Window(4) | Certificate Principal U/W NOI Debt Yield(5) | Certificate Principal to Value Ratio(6) |
| | Offered Certificates | | | | | | | | | |
| A-1 | AAAsf/AAA(sf)/Aaa(sf) | $3,921,000 | | 30.000% | | (7) | 2.57 | 12/24 – 02/29 | | 18.5% | 39.7% |
| A-2 | AAAsf/AAA(sf)/Aaa(sf) | (8) | | 30.000% | | (7) | (8) | (8) | | 18.5% | 39.7% |
| A-3 | AAAsf/AAA(sf)/Aaa(sf) | (8) | | 30.000% | | (7) | (8) | (8) | | 18.5% | 39.7% |
| X-A | AAAsf/AAA(sf)/Aaa(sf) | $504,003,000 | (9) | N/A | | Variable IO(10) | N/A | N/A | | N/A | N/A |
| X-B | Asf/AAA(sf)/NR | $141,301,000 | (11) | N/A | | Variable IO(12) | N/A | N/A | | N/A | N/A |
| A-S | AAAsf/AAA(sf)/NR | $95,401,000 | | 16.750% | | (7) | 4.97 | 11/29 – 11/29 | | 15.5% | 47.3% |
| B | AAsf/AA-(sf)/NR | $23,400,000 | | 13.500% | | (7) | 4.97 | 11/29 – 11/29 | | 14.9% | 49.1% |
| C | Asf/A-(sf)/NR | $22,500,000 | | 10.375% | | (7) | 4.97 | 11/29 – 11/29 | | 14.4% | 50.9% |
| Non-Offered Certificates | | | | | | | | | |
| X-D | A-sf/BBB+(sf)/NR | (13)(15) | | N/A | | Variable IO(14) | N/A | N/A | | N/A | N/A |
| D | A-sf/BBB+(sf)/NR | (15) | | (15) | | (7) | 4.97 | 11/29 – 11/29 | | 14.2% | 51.6% |
| E-RR | BBBsf/BBB(sf)/NR | (15) | | 7.625% | | (7) | 4.97 | 11/29 – 11/29 | | 14.0% | 52.4% |
| F-RR | BBB-sf/BBB-(sf)/NR | $8,100,000 | | 6.500% | | (7) | 4.97 | 11/29 – 11/29 | | 13.8% | 53.1% |
| G-RR | BB-sf/BB-(sf)/NR | $16,201,000 | | 4.250% | | (7) | 4.97 | 11/29 – 11/29 | | 13.5% | 54.3% |
| J-RR | B-sf/B(sf)/NR | $7,200,000 | | 3.250% | | (7) | 4.97 | 11/29 – 11/29 | | 13.4% | 54.9% |
| K-RR | NR/NR/NR | $23,400,339 | | 0.000% | | (7) | 4.97 | 11/29 – 11/29 | | 12.9% | 56.8% |
| (1) | The expected ratings presented are those of Fitch Ratings, Inc. (“Fitch”), Kroll Bond Rating Agency, LLC (“KBRA”) and Moody’s Investors Service Inc. (“Moody’s”), which the depositor hired to rate the Offered Certificates. One or more other nationally recognized statistical rating organizations that were not hired by the depositor may use information they receive pursuant to Rule 17g-5 under the Securities Exchange Act of 1934, as amended (the “Exchange Act”) or otherwise, to rate or provide market reports and/or published commentary related to the Offered Certificates. We cannot assure you as to what ratings a non-hired nationally recognized statistical rating organization would assign or that its reports will not express differing, possibly negative, views of the mortgage loans and/or the Offered Certificates. The ratings of each Class of Offered Certificates address the likelihood of the timely distribution of interest and, except in the case of the Class X-A, X-B and X-D Certificates, the ultimate distribution of principal due on those Classes on or before the Rated Final Distribution Date. See “Risk Factors—Other Risks Relating to the Certificates—Nationally Recognized Statistical Rating Organizations May Assign Different Ratings to the Certificates; Ratings of the Certificates Reflect Only the Views of the Applicable Rating Agencies as of the Dates Such Ratings Were Issued; Ratings May Affect ERISA Eligibility; Ratings May Be Downgraded” and “Ratings” in the Preliminary Prospectus, expected to be dated November 12, 2024 (the “Preliminary Prospectus”). Fitch, KBRA and Moody’s have informed us that the “sf” designation in their ratings represents an identifier for structured finance product ratings. |
| (2) | The Certificate Balances and Notional Amounts set forth in the table are approximate. The actual initial Certificate Balances and Notional Amounts may be larger or smaller depending on the initial pool balance of the mortgage loans definitively included in the pool of mortgage loans, which aggregate cut-off date balance may be as much as 5% larger or smaller than the amount presented in the Preliminary Prospectus. In addition, the Notional Amounts of the Class X-A, X-B and X-D Certificates (collectively referred to herein as “Class X Certificates”) may vary depending upon the final pricing of the Classes of Principal Balance Certificates (as defined below) whose Certificate Balances comprise such Notional Amounts and, if as a result of such pricing the pass-through rate of any Class of the Class X Certificates would be equal to zero at all times, such Class of Certificates will not be issued on the closing date of this securitization. |
| (3) | The Approximate Initial Credit Support with respect to the Class A-1, A-2 and A-3 Certificates represents the approximate credit enhancement for the Class A-1, A-2 and A-3 Certificates in the aggregate. |
(4) | Weighted Average Lives and Expected Principal Windows are calculated based on an assumed prepayment rate of 0% CPR and the “Structuring Assumptions” described under “Yield and Maturity Considerations—Weighted Average Life” in the Preliminary Prospectus. |
(5) | The Certificate Principal U/W NOI Debt Yield for each Class of Certificates (other than the Class A-1, A-2 and A-3 Certificates) is calculated as the product of (a) the weighted average U/W NOI Debt Yield for the mortgage loans and (b) a fraction, the numerator of which is the total initial Certificate Balance of all of the Classes of Principal Balance Certificates and the denominator of which is the total initial Certificate Balance for such Class of Certificates and all Classes of Principal Balance Certificates senior to such Class of Certificates. The Certificate Principal U/W NOI Debt Yield for each of the Class A-1, A-2 and A-3 Certificates is calculated in the aggregate for those Classes as if they were a single Class and is calculated as the product of (a) the weighted average U/W NOI Debt Yield for the mortgage loans and (b) a fraction, the numerator of which is the total initial Certificate Balance of all of the Classes of Principal Balance Certificates and the denominator of which is the total aggregate initial Certificate Balances for the Class A-1, A-2 and A-3 Certificates. In any event, however, cash flow from each mortgaged property supports only the related mortgage loan and will not be available to support any other mortgage loan. |
| (6) | The Certificate Principal to Value Ratio for each Class of Certificates (other than the Class A-1, A-2 and A-3 Certificates) is calculated as the product of (a) the weighted average Cut-off Date LTV Ratio for the mortgage loans and (b) a fraction, the numerator of which is the total initial Certificate Balance of such Class of Certificates and all Classes of Principal Balance Certificates senior to such Class of Certificates and the denominator of which is the total initial Certificate Balance of all of the Principal Balance Certificates. The Certificate Principal to Value Ratio for each of the Class A-1, A-2 and A-3 Certificates is calculated in the aggregate for those Classes as if they were a single Class and is calculated as the product of (a) the weighted average Cut-off Date LTV Ratio for the mortgage loans and (b) a fraction, the numerator of which is the total initial aggregate Certificate Balances of such Classes of Certificates and the denominator of which is the total initial Certificate Balance of all of the Principal Balance Certificates. In any event, however, excess mortgaged property value associated with a mortgage loan will not be available to offset losses on any other mortgage loan. |
| (7) | The pass-through rates for the Class A-1, A-2, A-3, A-S, B, C, D, E-RR, F-RR, G-RR, J-RR and K-RR Certificates (collectively, the “Principal Balance Certificates”) for any distribution date will, in each case, be one of the following: (i) a fixed rate per annum, (ii) a variable rate per annum equal to the weighted average of the net mortgage interest rates on the mortgage loans for the related distribution date, (iii) a variable rate per annum equal to the lesser of (a) a fixed rate and (b) the weighted average of the net mortgage interest rates on the mortgage loans for the related distribution date or (iv) a variable rate per annum equal to the weighted average of the net mortgage interest rates on the mortgage loans for the related distribution date minus a specified percentage. For purposes of the calculation of the weighted average of the net mortgage interest rates on the mortgage loans for each distribution date, the mortgage interest rates will be adjusted as necessary to a 30/360 basis. |
THE INFORMATION IN THIS STRUCTURAL AND COLLATERAL TERM SHEET IS NOT COMPLETE AND MAY BE AMENDED PRIOR TO THE TIME OF SALE. THIS TERM SHEET IS NOT AN OFFER TO SELL THESE SECURITIES AND IT IS NOT A SOLICITATION OF AN OFFER TO BUY THESE SECURITIES IN ANY JURISDICTION WHERE THE OFFER OR SALE IS NOT PERMITTED. |
| | 3 | |
| Wells Fargo Commercial Mortgage Trust 2024-5C2 | Certificate Structure |
| (8) | The exact initial Certificate Balances of the Class A-2 and A-3 Certificates are unknown and will be determined based on the final pricing of those Classes of Certificates. However, the initial Certificate Balances, weighted average lives and principal windows of the Class A-2 and A-3 Certificates are expected to be within the applicable ranges reflected in the following chart. The aggregate initial Certificate Balance of the Class A-2 and A-3 Certificates is expected to be approximately $500,082,000, subject to a variance of plus or minus 5%. In the event that the Class A-3 Certificates is issued with the maximum certificate balance (i.e., with an initial certificate balance of $500,082,000), the Class A-2 Certificates will not be issued. |
Class of
Certificates | | Expected Range of Approximate Initial Certificate Balance | | Expected Range of Weighted Average Life (Years) | | Expected Range of
Principal Window |
| Class A-2 | | $0 - $225,000,000 | | N/A - 4.81 | | N/A / 02/29 – 10/29 |
| Class A-3 | | $275,082,000 - $500,082,000 | | 4.87 - 4.91 | | 02/29 – 11/29 / 10/29 – 11/29 |
| (9) | The Class X-A Certificates are notional amount certificates. The Notional Amount of the Class X-A Certificates will be equal to the aggregate Certificate Balance of the Class A-1, A-2 and A-3 Certificates outstanding from time to time. The Class X-A Certificates will not be entitled to distributions of principal. |
| (10) | The pass-through rate for the Class X-A Certificates for any distribution date will be a per annum rate equal to the excess, if any, of (a) the weighted average of the net mortgage interest rates on the mortgage loans for the related distribution date, over (b) the weighted average of the pass-through rates on the Class A-1, A-2 and A-3 Certificates for the related distribution date, weighted on the basis of their respective Certificate Balances outstanding immediately prior to that distribution date. For purposes of the calculation of the weighted average of the net mortgage interest rates on the mortgage loans for each distribution date, the mortgage interest rates will be adjusted as necessary to a 30/360 basis. |
| (11) | The Class X-B Certificates are notional amount certificates. The Notional Amount of the Class X-B Certificates will be equal to the aggregate Certificate Balance of the Class A-S, B and C Certificates outstanding from time to time. The Class X-B Certificates will not be entitled to distributions of principal. |
| (12) | The pass-through rate for the Class X-B Certificates for any distribution date will be a per annum rate equal to the excess, if any, of (a) the weighted average of the net mortgage interest rates on the mortgage loans for the related distribution date, over (b) the weighted average of the pass-through rates on the Class A-S, B and C Certificates for the related distribution date, weighted on the basis of their respective Certificate Balances outstanding immediately prior to that distribution date. For purposes of the calculation of the weighted average of the net mortgage interest rates on the mortgage loans for each distribution date, the mortgage interest rates will be adjusted as necessary to a 30/360 basis. |
| (13) | The Class X-D Certificates are notional amount certificates. The Notional Amount of the Class X-D Certificates will be equal to the Certificate Balance of the Class D Certificates outstanding from time to time. The Class X-D Certificates will not be entitled to distributions of principal. |
| (14) | The pass-through rate for the Class X-D Certificates for any distribution date will be a per annum rate equal to the excess, if any, of (a) the weighted average of the net mortgage interest rates on the mortgage loans for the related distribution date, over (b) the pass-through rate on the Class D Certificates for the related distribution date. For purposes of the calculation of the weighted average of the net mortgage interest rates on the mortgage loans for each distribution date, the mortgage interest rates will be adjusted as necessary to a 30/360 basis. |
| (15) | The initial Certificate Balance of each of the Class D and Class E-RR Certificates is estimated based in part on the estimated ranges of Certificate Balances and estimated fair values described in “Credit Risk Retention” in the Preliminary Prospectus. The initial Certificate Balance of the Class D Certificates is expected to fall within a range of $7,200,000 to $9,900,000, and the initial Certificate Balance of the Class E-RR Certificates is expected to fall within a range of $9,900,000 to $12,600,000, with the ultimate initial Certificate Balance of each determined such that the aggregate fair value of the Class E-RR, F-RR, G-RR, J-RR and K-RR Certificates will equal at least 5% of the estimated fair value as of the Closing Date of all of the Classes of Certificates (other than the Class R Certificates) issued by the issuing entity. Any variation in the initial Certificate Balance of the Class D Certificates would affect the initial notional amount of the Class X-D certificates. Additionally, the Approximate Initial Credit Support for the Class D Certificates will range between approximately 9.000% and 9.375%. |
THE INFORMATION IN THIS STRUCTURAL AND COLLATERAL TERM SHEET IS NOT COMPLETE AND MAY BE AMENDED PRIOR TO THE TIME OF SALE. THIS TERM SHEET IS NOT AN OFFER TO SELL THESE SECURITIES AND IT IS NOT A SOLICITATION OF AN OFFER TO BUY THESE SECURITIES IN ANY JURISDICTION WHERE THE OFFER OR SALE IS NOT PERMITTED. |
| | 4 | |
| Wells Fargo Commercial Mortgage Trust 2024-5C2 | Transaction Highlights |
| II. | Transaction Highlights |
Mortgage Loan Sellers:
Mortgage Loan Seller | Number of
Mortgage Loans | Number of
Mortgaged
Properties | Aggregate Cut-off Date Balance | Approx. % of Initial Pool
Balance |
| Wells Fargo Bank, National Association | 8 | | 25 | | $235,788,017 | | 32.7 | % |
| JPMorgan Chase Bank, National Association | 3 | | 3 | | 100,995,000 | | 14.0 | |
| Goldman Sachs Mortgage Company | 4 | | 39 | | 97,975,000 | | 13.6 | |
| UBS AG | 2 | | 10 | | 72,400,000 | | 10.1 | |
| Wells Fargo Bank, National Association / JPMorgan Chase Bank, National Association / Citi Real Estate Funding Inc. | 1 | | 52 | | 69,000,000 | | 9.6 | |
| Goldman Sachs Mortgage Company / UBS AG | 1 | | 1 | | 42,000,000 | | 5.8 | |
| Citi Real Estate Funding Inc. | 3 | | 3 | | 39,550,000 | | 5.5 | |
| LMF Commercial, LLC | 4 | | 4 | | 32,297,323 | | 4.5 | |
| JPMorgan Chase Bank, National Association / Goldman Sachs Mortgage Company | 1 | | 1 | | 30,000,000 | | 4.2 | |
Total | 27 | | 138 | | $720,005,340 | | 100.0 | % |
Loan Pool:
| Initial Pool Balance: | $720,005,340 |
| Number of Mortgage Loans: | 27 |
| Average Cut-off Date Balance per Mortgage Loan: | $26,666,864 |
| Number of Mortgaged Properties: | 138 |
| Average Cut-off Date Balance per Mortgaged Property(1): | $5,217,430 |
| Weighted Average Interest Rate: | 6.3538% |
| Ten Largest Mortgage Loans as % of Initial Pool Balance: | 67.3% |
| Weighted Average Original Term to Maturity (months): | 60 |
| Weighted Average Remaining Term to Maturity (months): | 59 |
| Weighted Average Original Amortization Term (months)(2): | 360 |
| Weighted Average Remaining Amortization Term (months)(2): | 360 |
| Weighted Average Seasoning (months): | 1 |
| (1) | Information regarding mortgage loans secured by multiple properties is based on an allocation according to relative appraised values or the allocated loan amounts or property-specific release prices set forth in the related loan documents or such other allocation as the related mortgage loan seller deemed appropriate. |
| (2) | Excludes any mortgage loan that does not amortize. |
Credit Statistics:
| Weighted Average U/W Net Cash Flow DSCR(1): | 1.87x |
| Weighted Average U/W Net Operating Income Debt Yield(1): | 12.9% |
| Weighted Average Cut-off Date Loan-to-Value Ratio(1): | 56.8% |
| Weighted Average Balloon or ARD Loan-to-Value Ratio(1): | 56.4% |
| % of Mortgage Loans with Additional Subordinate Debt(2): | 16.3% |
| % of Mortgage Loans with Single Tenants(3): | 11.7% |
| (1) | With respect to any mortgage loan that is part of a whole loan, loan-to-value ratio, debt service coverage ratio and debt yield calculations include the related pari passu companion loan(s) but exclude any related subordinate companion loan(s) (unless otherwise stated). The debt service coverage ratio, debt yield and loan-to-value ratio information do not take into account any subordinate debt (whether or not secured by the related mortgaged property), that currently exists or is allowed under the terms of any mortgage loan. See “Description of the Mortgage Pool—Mortgage Pool Characteristics” in the Preliminary Prospectus and Annex A-1 to the Preliminary Prospectus. |
| (2) | The percentage figure expressed as “% of Mortgage Loans with Additional Subordinate Debt” is determined as a percentage of the initial pool balance and does not take into account any future subordinate debt (whether or not secured by the mortgaged property), if any, that may be permitted under the terms of any mortgage loan or the pooling and servicing agreement. See “Description of the Mortgage Pool—Additional Indebtedness—Other Unsecured Indebtedness” in the Preliminary Prospectus. |
| (3) | Excludes mortgage loans that are secured by multiple single tenant properties. |
THE INFORMATION IN THIS STRUCTURAL AND COLLATERAL TERM SHEET IS NOT COMPLETE AND MAY BE AMENDED PRIOR TO THE TIME OF SALE. THIS TERM SHEET IS NOT AN OFFER TO SELL THESE SECURITIES AND IT IS NOT A SOLICITATION OF AN OFFER TO BUY THESE SECURITIES IN ANY JURISDICTION WHERE THE OFFER OR SALE IS NOT PERMITTED. |
| | 5 | |
| Wells Fargo Commercial Mortgage Trust 2024-5C2 | Transaction Highlights |
Loan Structural Features:
Amortization: Based on the Initial Pool Balance, 22.0% of the mortgage pool (5 mortgage loans) has scheduled amortization, as follows:
12.1% (2 mortgage loans) provides for an interest-only period followed by an amortization period; and
9.9% (3 mortgage loans) requires amortization during the entire loan term.
Interest-Only: Based on the Initial Pool Balance, 78.0% of the mortgage pool (22 mortgage loans) provides for interest-only payments during the entire loan term through maturity. The weighted average Cut-off Date Loan-to-Value Ratio and weighted average U/W Net Cash Flow DSCR for those mortgage loans are 56.0% and 1.96x, respectively.
Hard Lockboxes: Based on the Initial Pool Balance, 76.7% of the mortgage pool (17 mortgage loans) has hard lockboxes in place.
Reserves: The mortgage loans require amounts to be escrowed monthly as follows (excluding any mortgage loans with springing provisions):
| Real Estate Taxes: | 66.4% of the pool |
| Insurance: | 30.1% of the pool |
| Capital Replacements: | 78.7% of the pool |
| TI/LC: | 56.7% of the pool(1) |
| | (1) | The percentage of Initial Pool Balance for mortgage loans with TI/LC reserves is based on the aggregate principal balance allocable to loans that include office, mixed use, retail, industrial and other properties. |
Call Protection/Defeasance: Based on the Initial Pool Balance, the mortgage pool has the following call protection and defeasance features:
53.0% of the mortgage pool (16 mortgage loans) features a lockout period, then defeasance only until an open period;
23.3% of the mortgage pool (5 mortgage loans) features a lockout period, then greater of a prepayment premium (1.0%) or yield maintenance until an open period;
8.7% of the mortgage pool (2 mortgage loans) features a lockout period, then greater of a prepayment premium (1.0%) or yield maintenance, then defeasance or greater of a prepayment premium (1.0%) or yield maintenance until an open period;
8.5% of the mortgage pool (2 mortgage loans) features the greater of a prepayment premium (1.0%) or yield maintenance, then defeasance or greater of a prepayment premium (1.0%) or yield maintenance until an open period;
4.2% of the mortgage pool (1 mortgage loan) features a lockout period, then defeasance or greater of a prepayment premium (1.0%) or yield maintenance until an open period; and
2.3% of the mortgage pool (1 mortgage loan) features the greater of a prepayment premium (0.5%) or yield maintenance, then defeasance or greater of a prepayment premium (0.5%) or yield maintenance until an open period.
THE INFORMATION IN THIS STRUCTURAL AND COLLATERAL TERM SHEET IS NOT COMPLETE AND MAY BE AMENDED PRIOR TO THE TIME OF SALE. THIS TERM SHEET IS NOT AN OFFER TO SELL THESE SECURITIES AND IT IS NOT A SOLICITATION OF AN OFFER TO BUY THESE SECURITIES IN ANY JURISDICTION WHERE THE OFFER OR SALE IS NOT PERMITTED. |
| | 6 | |
| Wells Fargo Commercial Mortgage Trust 2024-5C2 | Issue Characteristics |
| III. | Issue Characteristics |
| Securities Offered: | $645,304,000 approximate monthly pay, multi-class, commercial mortgage REMIC pass-through certificates consisting of eight classes (Classes A-1, A-2, A-3, A-S, B, C, X-A and X-B), which are offered pursuant to a registration statement filed with the SEC (such Classes of certificates, the “Offered Certificates”). |
| Mortgage Loan Sellers: | Wells Fargo Bank, National Association (“WFB”), Goldman Sachs Mortgage Company (“GSMC”), JPMorgan Chase Bank, National Association (“JPMCB”), UBS AG (“UBS”), Citi Real Estate Funding Inc. (“CREFI”) and LMF Commercial, LLC (“LMF”) |
Joint Bookrunners and Co-Lead
Managers: | Wells Fargo Securities, LLC, Goldman Sachs & Co. LLC, J.P. Morgan Securities LLC, UBS Securities LLC and Citigroup Global Markets Inc. |
| Co-Managers: | Academy Securities, Inc., Drexel Hamilton, LLC and Siebert Williams Shank & Co., LLC |
| Rating Agencies: | Fitch Ratings, Inc., Kroll Bond Rating Agency, LLC and Moody’s Investors Service, Inc. |
| Master Servicer: | Wells Fargo Bank, National Association |
| Special Servicer: | Rialto Capital Advisors, LLC |
| Certificate Administrator: | Computershare Trust Company, N.A. |
| Trustee: | Computershare Trust Company, N.A. |
| Operating Advisor: | Pentalpha Surveillance LLC |
| Asset Representations Reviewer: | Pentalpha Surveillance LLC |
| U.S. Credit Risk Retention: | For a discussion of the manner in which the U.S. credit risk retention requirements are being addressed by Wells Fargo Bank, National Association, as the retaining sponsor, see “Credit Risk Retention” in the Preliminary Prospectus. This transaction is being structured with a “third-party purchaser” that will acquire an “eligible horizontal residual interest”, which will be comprised of the Class E-RR, F-RR, G-RR, J-RR and K-RR Certificates (the “horizontal risk retention certificates”). RREF V - D AIV RR H, LLC (in satisfaction of the retention obligations of Wells Fargo Bank, National Association, as the retaining sponsor) will be contractually obligated to retain (or to cause its “majority-owned affiliate” to retain) the horizontal risk retention certificates for a minimum of five years after the closing date, subject to certain permitted exceptions provided for under the risk retention rules. During this time, RREF V - D AIV RR H, LLC will agree to comply with hedging, transfer and financing restrictions that are applicable to third party purchasers under the credit risk retention rules. For additional information, see “Credit Risk Retention” in the Preliminary Prospectus. |
EU Securitization Regulation
and UK Securitization
Regulation: | None of the sponsors, the depositor, the underwriters, or their respective affiliates, or any other person intends to retain a material net economic interest in the securitization constituted by the issue of the Certificates, or to take any other action in respect of such securitization, in a manner prescribed or contemplated by (i) Regulation (EU) 2017/2402, or (ii) such Regulation as it forms part of UK domestic law. In particular, no such person undertakes to take any action which may be required by any investor for the purposes of its compliance with any applicable requirement under either such Regulation. Furthermore, the arrangements described under “Credit Risk Retention” in the Preliminary Prospectus have not been structured with the objective of ensuring compliance by any person with any requirements of either such Regulation. See “Risk Factors—Other Risks Relating to the Certificates—EU SR Rules and UK Securitization Framework” in the Preliminary Prospectus. |
Initial Controlling Class
Certificateholder: | RREF V – D AIV RR H, LLC |
| Cut-off Date: | The Cut-off Date with respect to each mortgage loan is the due date for the monthly debt service payment that is due in November 2024 (or, in the case of any mortgage loan that has its first due date after November 2024, the date that would have been its due date in November 2024 under the terms of that mortgage loan if a monthly debt service payment were scheduled to be due in that month). |
| Expected Closing Date: | On or about November 27, 2024. |
| Determination Dates: | The 11th day of each month (or if that day is not a business day, the next succeeding business day), commencing in December 2024. |
THE INFORMATION IN THIS STRUCTURAL AND COLLATERAL TERM SHEET IS NOT COMPLETE AND MAY BE AMENDED PRIOR TO THE TIME OF SALE. THIS TERM SHEET IS NOT AN OFFER TO SELL THESE SECURITIES AND IT IS NOT A SOLICITATION OF AN OFFER TO BUY THESE SECURITIES IN ANY JURISDICTION WHERE THE OFFER OR SALE IS NOT PERMITTED. |
| | 7 | |
| Wells Fargo Commercial Mortgage Trust 2024-5C2 | Issue Characteristics |
| Distribution Dates: | The fourth business day following the Determination Date in each month, commencing in December 2024. |
| Rated Final Distribution Date: | The Distribution Date in November 2057. |
| Interest Accrual Period: | With respect to any Distribution Date, the calendar month immediately preceding the month in which such Distribution Date occurs. |
| Day Count: | The Offered Certificates will accrue interest on a 30/360 basis. |
| Minimum Denominations: | $10,000 for each Class of Offered Certificates (other than the Class X-A and X-B Certificates) and $1,000,000 for the Class X-A and X-B Certificates. Investments may also be made in any whole dollar denomination in excess of the applicable minimum denomination. |
| Clean-up Call: | 1.0% |
| Delivery: | DTC, Euroclear and Clearstream Banking |
| ERISA/SMMEA Status: | Each Class of Offered Certificates is expected to be eligible for exemptive relief under ERISA. No Class of Offered Certificates will be Secondary Mortgage Market Enhancement Act of 1984, as amended (“SMMEA”) eligible. |
| Risk Factors: | THE CERTIFICATES INVOLVE CERTAIN RISKS AND MAY NOT BE SUITABLE FOR ALL INVESTORS. SEE THE “SUMMARY OF RISK FACTORS” AND “RISK FACTORS” SECTIONS OF THE PRELIMINARY PROSPECTUS. |
| Bond Analytics Information: | The Certificate Administrator will be authorized to make distribution date statements, CREFC® reports and certain supplemental reports (other than confidential information) available to certain financial modeling and data provision services, including Bloomberg, L.P., CRED iQ, Trepp, LLC, Intex Solutions, Inc., Markit Group Limited, Interactive Data Corp., BlackRock Financial Management, Inc., CMBS.com, Inc., Moody’s Analytics, Inc., Morningstar Credit Information & Analytics, LLC, KBRA Analytics, LLC, MBS Data, LLC, RealInsight and Thomson Reuters Corporation. |
| Tax Treatment | For U.S. federal income tax purposes, the issuing entity will consist of one or more REMICs arranged in a tiered structure. The Offered Certificates will represent REMIC regular interests. |
THE INFORMATION IN THIS STRUCTURAL AND COLLATERAL TERM SHEET IS NOT COMPLETE AND MAY BE AMENDED PRIOR TO THE TIME OF SALE. THIS TERM SHEET IS NOT AN OFFER TO SELL THESE SECURITIES AND IT IS NOT A SOLICITATION OF AN OFFER TO BUY THESE SECURITIES IN ANY JURISDICTION WHERE THE OFFER OR SALE IS NOT PERMITTED. |
| | 8 | |
| Wells Fargo Commercial Mortgage Trust 2024-5C2 | Characteristics of the Mortgage Pool |
| IV. | Characteristics of the Mortgage Pool(1) |
| A. | Ten Largest Mortgage Loans |
Mortgage Loan
Seller | Mortgage Loan Name | City | State | Number of Mortgage Loans / Mortgaged Properties | Mortgage Loan Cut-off Date Balance ($) | % of Initial Pool Balance(%) | Property
Type | Number
of
SF/Rooms/Units | Cut-off Date Balance
Per SF/Room/ Unit ($) | Cut-off Date LTV Ratio (%) | Balloon LTV Ratio (%) | U/W
NCF
DSCR
(x) | U/W NOI Debt
Yield (%) |
| JPMCB | Bay Plaza Community Center | Bronx | NY | 1 / 1 | $69,000,000 | 9.6 | % | Mixed Use | 568,813 | $492 | 59.6% | 59.6 | % | 1.54 | x | 10.0 | % |
| WFB, CREFI, JPMCB | Mini Mall Self Storage | Various | Various | 1 / 52 | 69,000,000 | 9.6 | | Self Storage | 2,460,347 | 73 | 73.8 | 73.8 | | 1.71 | | 10.5 | |
| WFB | Sacramento Gateway | Sacramento | CA | 1 / 1 | 61,500,000 | 8.5 | | Retail | 347,560 | 177 | 66.8 | 65.5 | | 1.31 | | 10.3 | |
| UBS AG | Interstate Industrial Portfolio | Various | Various | 1 / 7 | 58,000,000 | 8.1 | | Industrial | 2,573,860 | 44 | 63.9 | 63.9 | | 1.37 | | 9.9 | |
| WFB | Northeastern Hotel Portfolio | Various | Various | 1 / 4 | 54,371,913 | 7.6 | | Hospitality | 607 | 89,575 | 50.7 | 48.4 | | 1.56 | | 15.4 | |
| GSMC, UBS AG | Moffett Towers Building D | Sunnyvale | CA | 1 / 1 | 42,000,000 | 5.8 | | Office | 357,481 | 406 | 48.3 | 48.3 | | 1.83 | | 13.2 | |
| WFB | Rockefeller Center | New York | NY | 1 / 15 | 40,000,000 | 5.6 | | Various | 7,207,470 | 273 | 32.3 | 32.3 | | 3.17 | | 18.2 | |
| GSMC | Atrium Hotel Portfolio 24 Pack | Various | Various | 1 / 24 | 35,000,000 | 4.9 | | Hospitality | 6,106 | 76,122 | 32.1 | 32.1 | | 4.17 | | 26.7 | |
| JPMCB, GSMC | Queens Center | Elmhurst | NY | 1 / 1 | 30,000,000 | 4.2 | | Retail | 412,033 | 1,274 | 49.5 | 49.5 | | 1.84 | | 10.2 | |
| GSMC | ICONIQ Multifamily Portfolio | Various | Various | 1 / 6 | 26,000,000 | 3.6 | | Multifamily | 1,790 | 167,598 | 36.1 | 36.1 | | 2.43 | | 14.6 | |
| Top Three Total/Weighted Average | | | 3 / 54 | $199,500,000 | 27.7 | % | | | | 66.7% | 66.3 | % | 1.53 | x | 10.3 | % |
| Top Five Total/Weighted Average | | | 5 / 65 | $311,871,913 | 43.3 | % | | | | 63.4% | 62.8 | % | 1.50 | x | 11.1 | % |
| Top Ten Total/Weighted Average | | | 10 / 112 | $484,871,913 | 67.3 | % | | | | 54.9% | 54.5 | % | 1.93 | x | 13.1 | % |
| Non-Top Ten Total/Weighted Average | | | 17 / 26 | $235,133,427 | 32.7 | % | | | | 60.5% | 60.1 | % | 1.73 | x | 12.5 | % |
| (1) | With respect to any mortgage loan that is part of a whole loan, Cut-off Date Balance Per SF/Room/Unit ($), loan-to-value ratio, debt service coverage ratio and debt yield calculations include the related pari passu companion loan(s) but exclude any related subordinate companion loan(s) (unless otherwise stated). With respect to each mortgage loan, debt service coverage ratio, debt yield and loan-to-value ratio information do not take into account subordinate debt (whether or not secured by the related mortgaged property), if any, that currently exists or is allowed under the terms of such mortgage loan. |
THE INFORMATION IN THIS STRUCTURAL AND COLLATERAL TERM SHEET IS NOT COMPLETE AND MAY BE AMENDED PRIOR TO THE TIME OF SALE. THIS TERM SHEET IS NOT AN OFFER TO SELL THESE SECURITIES AND IT IS NOT A SOLICITATION OF AN OFFER TO BUY THESE SECURITIES IN ANY JURISDICTION WHERE THE OFFER OR SALE IS NOT PERMITTED. |
| | 9 | |
| Wells Fargo Commercial Mortgage Trust 2024-5C2 | Characteristics of the Mortgage Pool |
| B. | Summary of the Whole Loans |
| No. | Property Name | Mortgage Loan Seller in WFCM 2024-5C2 | Mortgage Loan Cut-off Date Balance | Aggregate Pari-Passu Companion Loan Cut-off Date Balance(1) | Combined Cut-off Date Balance | Controlling Pooling / Trust and Servicing Agreement | Master Servicer | Special Servicer | Related Pari Passu Companion Loan(s) Securitizations | Combined U/W NCF DSR(2) | Combined U/W NOI Debt Yield(2) | Combined Cut-off Date LTV(2) |
| 1 | Bay Plaza Community Center | JPMCB | $69,000,000 | $211,000,000 | $280,000,000 | BANK5 2024-5YR10 | Wells Fargo | Rialto | BANK5 2024-5YR10; BANK5 2024-5YR11 | 1.54x | 10.0% | 59.6% |
| 2 | Mini Mall Self Storage | WFB, CREFI, JPMCB | $69,000,000 | $111,000,000 | $180,000,000 | WFCM 2024-5C2 | Wells Fargo | Rialto | Future Securitization | 1.71x | 10.5% | 73.8% |
| 4 | Interstate Industrial Portfolio | UBS AG | $58,000,000 | $54,000,000 | $112,000,000 | WFCM 2024-5C2 | Wells Fargo | Rialto | BMO 2024-5C7 | 1.37x | 9.9% | 63.9% |
| 6 | Moffett Towers Building D | GSMC, UBS AG | $42,000,000 | $103,000,000 | $145,000,000 | BMARK 2024-V10 | Midland | Rialto | BMARK 2024-V10; BMO 2024-5C6 | 1.83x | 13.2% | 48.3% |
| 7 | Rockefeller Center | WFB | $40,000,000 | $1,928,500,000 | $1,968,500,000 | ROCK 2024-CNTR | Wells Fargo | KeyBank | ROCK 2024-CNTR | 3.17x | 18.2% | 32.3% |
| 8 | Atrium Hotel Portfolio 24 Pack | GSMC | $35,000,000 | $429,800,000 | $464,800,000 | AHPT 2024-ATRM | Wells Fargo | CWCapital | AHPT 2024-ATRM; BMARK 2024-V11; BANK5 2024-5YR11 | 4.17x | 26.7% | 32.1% |
| 9 | Queens Center | JPMCB, GSMC | $30,000,000 | $495,000,000 | $525,000,000 | Future Securitization | Wells Fargo | Midland | BANK5 2024-5YR11 | 1.84x | 10.2% | 49.5% |
| 10 | ICONIQ Multifamily Portfolio | GSMC | $26,000,000 | $274,000,000 | $300,000,000 | ICNQ 2024-MF | Wells Fargo | KeyBank | ICNQ 2024-MF | 2.43x | 14.6% | 36.1% |
| 13 | International Plaza II | JPMCB | $21,995,000 | $56,330,000 | $78,325,000 | BANK5 2024-5YR10 | Wells Fargo | Rialto | BANK5 2024-5YR10 | 1.77x | 14.0% | 63.1% |
| 17 | BioMed 2024 Portfolio 2 | GSMC | $16,500,000 | $533,394,737 | $549,894,737 | BX 2024-BIO2 | KeyBank | KeyBank | BMARK 2024-V10; BBCMS 2024-5C29; BANK5 2024-5YR9 | 2.34x | 13.1% | 50.1% |
| 20 | Hilton Washington DC Rockville Hotel | WFB | $11,916,104 | $14,564,127 | $26,480,231 | BANK5 2024-5YR10 | Wells Fargo | Rialto | BANK5 2024-5YR10 | 1.91x | 16.6% | 52.9% |
| 21 | Euclid Apartments | LMF | $10,000,000 | $43,000,000 | $53,000,000 | WFCM 2024-5C1 | Wells Fargo | Argentic | BMO 2024-5C4; BBCMS 2024-C26; WFCM 2024-5C1 | 1.69x | 12.4% | 68.8% |
| 22 | 175 Remsen Street | JPMCB | $10,000,000 | $20,000,000 | $30,000,000 | BANK5 2024-5YR10 | Wells Fargo | Rialto | BANK5 2024-5YR10 | 1.58x | 12.4% | 55.6% |
| (1) | The Aggregate Pari Passu Companion Loan Cut-off Date Balance excludes the related Subordinate Companion Loans. |
| (2) | DSCR, Debt Yield and LTV calculations include any related pari passu companion loans and exclude any subordinate companion loans and/or mezzanine loans, as applicable. |
THE INFORMATION IN THIS STRUCTURAL AND COLLATERAL TERM SHEET IS NOT COMPLETE AND MAY BE AMENDED PRIOR TO THE TIME OF SALE. THIS TERM SHEET IS NOT AN OFFER TO SELL THESE SECURITIES AND IT IS NOT A SOLICITATION OF AN OFFER TO BUY THESE SECURITIES IN ANY JURISDICTION WHERE THE OFFER OR SALE IS NOT PERMITTED. |
| | 10 | |
| Wells Fargo Commercial Mortgage Trust 2024-5C2 | Characteristics of the Mortgage Pool |
| C. | Mortgage Loans with Additional Secured and Mezzanine Financing |
| Loan No. | Mortgage Loan Seller | Mortgage Loan Name | Mortgage
Loan
Cut-off Date Balance ($) | % of Initial Pool Balance (%) | Sub Debt Cut-off Date Balance ($) | Mezzanine Debt Cut-off Date Balance ($) | Total Debt Interest Rate (%)(1) | Mortgage Loan U/W NCF DSCR (x)(2) | Total Debt U/W NCF DSCR (x) | Mortgage Loan Cut-off Date U/W NOI Debt Yield (%)(2) | Total Debt Cut-off Date U/W NOI Debt Yield (%) | Mortgage Loan Cut-off Date LTV Ratio (%)(2) | Total Debt Cut-off Date LTV Ratio (%) |
| 7 | WFB | Rockefeller Center | $40,000,000 | 5.6% | $1,531,500,000 | NAP | 6.2266% | 3.17x | 1.54x | 18.2% | 10.3% | 32.3% | 57.4% |
| 8 | GSMC | Atrium Hotel Portfolio 24 Pack | 35,000,000 | 4.9 | 520,200,000 | NAP | 7.3521% | 4.17 | 1.48 | 26.7 | 12.6 | 32.1 | 68.0 |
| 10 | GSMC | ICONIQ Multifamily Portfolio | 26,000,000 | 3.6 | 225,000,000 | NAP | 6.0715% | 2.43 | 1.34 | 14.6 | 8.3 | 36.1 | 63.1 |
| 17 | GSMC | BioMed 2024 Portfolio 2 | 16,500,000 | 2.3 | 166,842,106 | NAP | 5.8954% | 2.34 | 1.67 | 13.1 | 10.1 | 50.1 | 65.3 |
| Total/Weighted Average | $117,500,000 | 16.3% | $2,443,542,106 | | 6.4810% | 3.19x | 1.50x | 19.2% | 10.5% | 35.6% | 62.9% |
(1) Total Debt Interest Rate for any specified mortgage loan reflects the weighted average of the interest rates on the respective components of the total debt.
(2) With respect to any mortgage loan that is part of a whole loan, the loan-to-value ratio, debt service coverage ratio and debt yield calculations include the related pari passu companion loan(s) but excludes any related subordinate companion loan.
THE INFORMATION IN THIS STRUCTURAL AND COLLATERAL TERM SHEET IS NOT COMPLETE AND MAY BE AMENDED PRIOR TO THE TIME OF SALE. THIS TERM SHEET IS NOT AN OFFER TO SELL THESE SECURITIES AND IT IS NOT A SOLICITATION OF AN OFFER TO BUY THESE SECURITIES IN ANY JURISDICTION WHERE THE OFFER OR SALE IS NOT PERMITTED. |
| | 11 | |
| Wells Fargo Commercial Mortgage Trust 2024-5C2 | Characteristics of the Mortgage Pool |
| D. | Previous Securitization History(1) |
Loan No. | Mortgage Loan Seller | Mortgage
Loan or Mortgaged
Property Name | City | State | Property Type | Mortgage Loan
or Mortgaged Property Cut-off Date Balance ($) | % of Cut-off Date Pool Balance (%) | Previous Securitization |
| 3.00 | WFB | Sacramento Gateway | Sacramento | CA | Retail | 61,500,000 | 8.5% | CGCMT 2019-GC34 |
| 5.00 | WFB | Northeastern Hotel Portfolio | Various | Various | Hospitality | 54,371,913 | 7.6% | CGCMT 2015-GC27 |
| 7.00 | WFB | Rockefeller Center | New York | NY | Various | 40,000,000 | 5.6% | GSMS 2005-ROCK |
| 6.00 | GSMC, UBS AG | Moffett Towers Building D | Sunnyvale | CA | Office | 42,000,000 | 5.8% | COMM 2014-CR14, COMM 2014-CR15, COMM 2014-CR16, COMM 2014-UBS2 |
| 9.00 | JPMCB, GSMC | Queens Center | Elmhurst | NY | Retail | 30,000,000 | 4.2% | QCMT 2013-QCA |
| 17.00 | GSMC | BioMed 2024 Portfolio 2 | Various | Various | Various | 16,500,000 | 2.3% | LIFE 2021-BMR and DBGS 2018-BIOD |
| 21.00 | LMF | Euclid Apartments | Euclid | OH | Multifamily | 10,000,000 | 1.4% | ARBOR 2022-Q021 |
| 23.00 | LMF | Prime Storage - West Phoenix | Phoenix | AZ | Self Storage | 9,500,000 | 1.3% | WFCM 2020-C55 |
| 27.00 | LMF | Walgreens Beaverton | Beaverton | OR | Retail | 4,697,323 | 0.7% | CSAIL 2015-C1 |
| | Total | | | | | $268,569,236 | 37.3% | |
| (1) | The table above represents the most recent securitization with respect to the mortgaged property securing the related mortgage loan, based on information provided by the related borrower or obtained through searches of a third-party database. While loans secured by the above mortgaged properties may have been securitized multiple times in prior transactions, mortgage loans in this securitization are only listed in the above chart if the mortgage loan paid off a loan in another securitization. The information has not otherwise been confirmed by the mortgage loan sellers. |
THE INFORMATION IN THIS STRUCTURAL AND COLLATERAL TERM SHEET IS NOT COMPLETE AND MAY BE AMENDED PRIOR TO THE TIME OF SALE. THIS TERM SHEET IS NOT AN OFFER TO SELL THESE SECURITIES AND IT IS NOT A SOLICITATION OF AN OFFER TO BUY THESE SECURITIES IN ANY JURISDICTION WHERE THE OFFER OR SALE IS NOT PERMITTED. |
| | 12 | |
| Wells Fargo Commercial Mortgage Trust 2024-5C2 | Characteristics of the Mortgage Pool |
| E. | Property Type Distribution(1) |
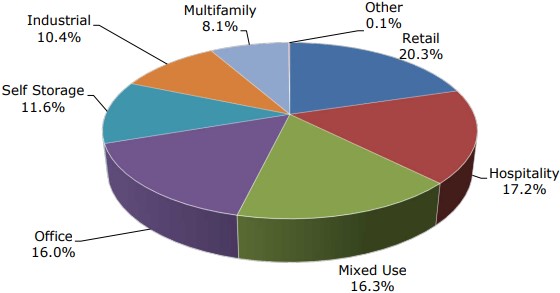
| Property Type | Number of Mortgaged Properties | Aggregate Cut-off Date Balance ($) | % of Cut-off Date Balance (%) | Weighted Average Cut-off Date LTV Ratio (%) | Weighted Average Balloon or ARD LTV Ratio (%) | Weighted Average U/W NCF DSCR (x) | Weighted Average U/W NOI Debt Yield (%) | Weighted Average U/W NCF Debt Yield (%) | Weighted Average Mortgage Rate (%) |
| Retail | 7 | $146,308,180 | 20.3% | 60.5% | 59.6% | 1.58x | 11.4% | 10.8% | 6.2182% |
| Anchored | 4 | 111,474,857 | 15.5 | 63.2 | 62.2 | 1.53 | 11.7 | 11.1 | 6.4019 |
| Super Regional Mall | 1 | 30,000,000 | 4.2 | 49.5 | 49.5 | 1.84 | 10.2 | 10.0 | 5.3700 |
| Single Tenant | 2 | 4,833,323 | 0.7 | 64.3 | 61.3 | 1.26 | 10.1 | 10.1 | 7.2463 |
| Hospitality | 32 | 123,544,017 | 17.2 | 47.1 | 45.8 | 2.40 | 18.8 | 16.3 | 6.8039 |
| Full Service | 22 | 69,386,206 | 9.6 | 44.4 | 43.5 | 2.88 | 20.9 | 18.2 | 6.3787 |
| Select Service | 6 | 44,038,364 | 6.1 | 49.9 | 47.7 | 1.67 | 15.9 | 13.6 | 7.5127 |
| Limited Service | 1 | 8,100,000 | 1.1 | 58.7 | 58.7 | 1.85 | 15.1 | 13.0 | 6.9100 |
| Limited Service; Extended Stay | 3 | 2,019,447 | 0.3 | 32.1 | 32.1 | 4.17 | 26.7 | 23.4 | 5.5325 |
| Mixed Use | 15 | 117,296,650 | 16.3 | 50.8 | 50.8 | 2.10 | 12.7 | 12.1 | 5.8392 |
| Retail/Office | 1 | 69,000,000 | 9.6 | 59.6 | 59.6 | 1.54 | 10.0 | 9.6 | 6.1300 |
| Office/Retail | 7 | 32,252,571 | 4.5 | 32.3 | 32.3 | 3.17 | 18.2 | 17.1 | 5.3921 |
| Lab/Office | 7 | 16,044,079 | 2.2 | 50.1 | 50.1 | 2.34 | 13.1 | 13.0 | 5.4876 |
| Office | 11 | 115,113,429 | 16.0 | 55.4 | 55.4 | 1.85 | 12.9 | 12.5 | 6.7911 |
| Suburban | 1 | 42,000,000 | 5.8 | 48.3 | 48.3 | 1.83 | 13.2 | 12.9 | 6.9600 |
| CBD | 6 | 38,238,429 | 5.3 | 56.1 | 56.1 | 1.95 | 14.3 | 13.5 | 7.0502 |
| R&D | 1 | 20,475,000 | 2.8 | 65.0 | 65.0 | 2.08 | 11.1 | 11.0 | 5.2040 |
| Medical | 3 | 14,400,000 | 2.0 | 60.3 | 60.3 | 1.34 | 10.8 | 10.7 | 7.8670 |
| Self Storage | 54 | 83,200,000 | 11.6 | 72.2 | 72.2 | 1.66 | 10.2 | 10.0 | 5.9802 |
| Self Storage | 54 | 83,200,000 | 11.6 | 72.2 | 72.2 | 1.66 | 10.2 | 10.0 | 5.9802 |
| Industrial | 8 | 75,000,000 | 10.4 | 62.7 | 62.7 | 1.39 | 10.3 | 9.5 | 6.7041 |
| Warehouse | 7 | 58,000,000 | 8.1 | 63.9 | 63.9 | 1.37 | 9.9 | 9.0 | 6.5030 |
| Manufacturing | 1 | 17,000,000 | 2.4 | 58.8 | 58.8 | 1.48 | 11.6 | 11.1 | 7.3900 |
| Multifamily | 9 | 58,550,000 | 8.1 | 53.3 | 53.3 | 1.89 | 12.1 | 11.9 | 6.0112 |
| Mid Rise | 4 | 22,296,667 | 3.1 | 59.7 | 59.7 | 1.63 | 10.5 | 10.3 | 6.1115 |
| High Rise | 3 | 20,453,333 | 2.8 | 36.1 | 36.1 | 2.43 | 14.6 | 14.4 | 5.1797 |
| Garden | 2 | 15,800,000 | 2.2 | 66.5 | 66.5 | 1.56 | 11.2 | 11.0 | 6.9462 |
| Other | 2 | 993,064 | 0.1 | 40.5 | 40.5 | 2.79 | 15.9 | 15.2 | 5.4359 |
| Theater | 1 | 537,143 | 0.1 | 32.3 | 32.3 | 3.17 | 18.2 | 17.1 | 5.3921 |
| Parking Garage | 1 | 455,921 | 0.1 | 50.1 | 50.1 | 2.34 | 13.1 | 13.0 | 5.4876 |
| Total/Weighted Average | 138 | $720,005,340 | 100.0% | 56.8% | 56.4% | 1.87x | 12.9% | 12.1% | 6.3538% |
| (1) | Because this table presents information relating to the mortgaged properties and not the mortgage loans, the information for mortgage loans secured by more than one mortgaged property is based on allocated loan amounts (allocating the principal balance of the mortgage loan to each of those properties according to the relative appraised values of the mortgaged properties or the allocated loan amounts or property-specific release prices set forth in the related mortgage loan documents or such other allocation as the related mortgage loan seller deemed appropriate). With respect to any mortgage loan that is part of a whole loan, the loan-to-value ratio, debt service coverage ratio and debt yield calculations include the related pari passu companion loan(s) but exclude any related subordinate companion loan(s) (unless otherwise stated). With respect to each mortgage loan, debt service coverage ratio, debt yield and loan-to-value ratio information do not take into account any subordinate debt (whether or not secured by the related mortgaged property) that currently exists or is allowed under the terms of such mortgage loan. See Annex A-1 to the Preliminary Prospectus. |
THE INFORMATION IN THIS STRUCTURAL AND COLLATERAL TERM SHEET IS NOT COMPLETE AND MAY BE AMENDED PRIOR TO THE TIME OF SALE. THIS TERM SHEET IS NOT AN OFFER TO SELL THESE SECURITIES AND IT IS NOT A SOLICITATION OF AN OFFER TO BUY THESE SECURITIES IN ANY JURISDICTION WHERE THE OFFER OR SALE IS NOT PERMITTED. |
| | 13 | |
| Wells Fargo Commercial Mortgage Trust 2024-5C2 | Characteristics of the Mortgage Pool |
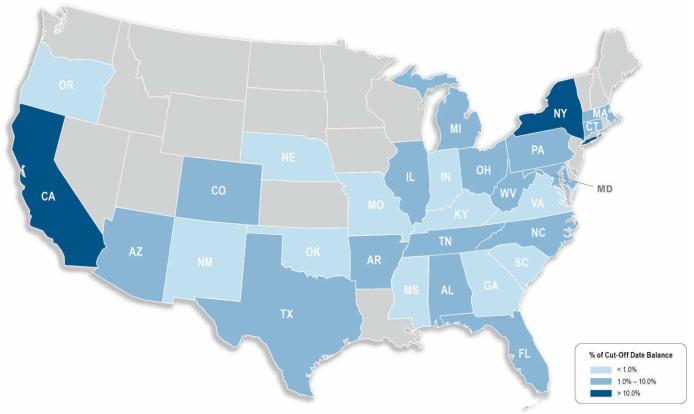
| F. | Geographic Distribution(1)(2) |
| Location | Number of Mortgaged Properties | Aggregate
Cut-off Date Balance ($) | % of
Cut-off Date Balance (%) | Weighted Average Cut-off Date LTV Ratio (%) | Weighted Average Balloon LTV Ratio (%) | Weighted Average U/W NCF DSCR (x) | Weighted Average U/W NOI Debt Yield (%) | Weighted Average U/W NCF Debt Yield (%) | Weighted Average Interest Rate (%) |
| New York | 25 | | $224,858,758 | 31.2 | % | 53.3 | % | 53.% | | 1.84 | x | 12.2 | % | 11.4 | % | 6.2097 | % |
| California | 7 | | 113,103,655 | 15.7 | | 58.1 | | 57.4 | | 1.63 | | 11.9 | | 11.5 | | 6.5619 | |
| Northern California | 3 | | 106,973,684 | 14.9 | | 59.0 | | 58.2 | | 1.55 | | 11.5 | | 11.2 | | 6.6224 | |
| Southern California | 4 | | 6,129,971 | 0.9 | | 42.8 | | 42.8 | | 3.08 | | 18.6 | | 17.2 | | 5.5057 | |
| Ohio | 13 | | 55,960,798 | 7.8 | | 66.0 | | 66.0 | | 1.73 | | 12.9 | | 11.8 | | 6.6919 | |
| Michigan | 2 | | 46,275,000 | 6.4 | | 63.7 | | 63.0 | | 1.92 | | 12.7 | | 12.3 | | 5.7649 | |
| Other(3) | 91 | | 279,807,130 | 38.9 | | 56.0 | | 55.6 | | 2.00 | | 14.0 | | 13.0 | | 6.4151 | |
| Total/Weighted Average | 138 | | $720,005,340 | 100.0 | % | 56.8 | % | 56.4 | % | 1.87 | x | 12.9 | % | 12.1 | % | 6.3538 | % |
(1) The mortgaged properties are located in 29 states.
(2) Because this table presents information relating to the mortgaged properties and not the mortgage loans, the information for mortgage loans secured by more than one mortgaged property is based on allocated loan amounts (allocating the principal balance of the mortgage loan to each of those properties according to the relative appraised values of the mortgaged properties or the allocated loan amounts or property-specific release prices set forth in the related mortgage loan documents or such other allocation as the related mortgage loan seller deemed appropriate). With respect to any mortgage loan that is part of a whole loan, the loan-to-value ratio, debt service coverage ratio and debt yield calculations include the related pari passu companion loan(s) but exclude any related subordinate companion loan(s) (unless otherwise stated). With respect to each mortgage loan, debt service coverage ratio, debt yield and loan-to-value ratio information do not take into account any subordinate debt (whether or not secured by the related mortgaged property) that currently exists or is allowed under the terms of such mortgage loan. See Annex A-1 to the Preliminary Prospectus.
| (3) | Includes 25 other states. |
THE INFORMATION IN THIS STRUCTURAL AND COLLATERAL TERM SHEET IS NOT COMPLETE AND MAY BE AMENDED PRIOR TO THE TIME OF SALE. THIS TERM SHEET IS NOT AN OFFER TO SELL THESE SECURITIES AND IT IS NOT A SOLICITATION OF AN OFFER TO BUY THESE SECURITIES IN ANY JURISDICTION WHERE THE OFFER OR SALE IS NOT PERMITTED. |
| | 14 | |
| Wells Fargo Commercial Mortgage Trust 2024-5C2 | Characteristics of the Mortgage Pool |
| G. | Characteristics of the Mortgage Pool(1) |
CUT-OFF DATE BALANCE
Range of Cut-off Date
Balances ($) | Number of
Mortgage
Loans | Aggregate
Cut-off Date Balance ($) | Percent by
Aggregate
Cut-off Date
Pool Balance (%) |
| 4,697,323 - 5,000,000 | 2 | $9,397,323 | 1.3% |
| 5,000,001 - 15,000,000 | 8 | 83,216,104 | 11.6 |
| 15,000,001 - 20,000,000 | 3 | 50,250,000 | 7.0 |
| 20,000,001 - 30,000,000 | 6 | 148,270,000 | 20.6 |
| 30,000,001 - 50,000,000 | 3 | 117,000,000 | 16.2 |
| 50,000,001 - 69,000,000 | 5 | 311,871,913 | 43.3 |
| Total: | 27 | $720,005,340 | 100.0% |
| Average: | $26,666,864 | | |
| UNDERWRITTEN NOI DEBT SERVICE COVERAGE RATIO |
Range of U/W NOI
DSCRs (x) | Number of
Mortgage
Loans | Aggregate
Cut-off Date Balance ($) | Percent by
Aggregate
Cut-off Date
Pool Balance (%) |
| 1.20 - 1.50 | 7 | 117,347,323 | 16.3% |
| 1.51 - 2.00 | 12 | 431,166,913 | 59.9 |
| 2.01 - 4.00 | 7 | 136,491,104 | 19.0 |
| 4.01 - 4.76 | 1 | 35,000,000 | 4.9 |
| Total: | 27 | $720,005,340 | 100.0% |
| Weighted Average: | 1.99x | | |
| UNDERWRITTEN NOI DEBT YIELD |
Range of U/W NOI
Debt Yields (%) | Number of
Mortgage
Loans | Aggregate
Cut-off Date Balance ($) | Percent by
Aggregate
Cut-off Date
Pool Balance (%) |
| 8.6 - 12.0 | 13 | $380,822,323 | 52.9% |
| 12.1 - 16.0 | 10 | 238,766,913 | 33.2 |
| 16.1 - 20.0 | 3 | 65,416,104 | 9.1 |
| 20.1 - 26.7 | 1 | 35,000,000 | 4.9 |
| Total: | 27 | $720,005,340 | 100.0% |
| Weighted Average: | 12.9% | | |
LOAN PURPOSE
| Loan Purpose | Number of
Mortgage
Loans | Aggregate
Cut-off Date Balance ($) | Percent by
Aggregate
Cut-off Date
Pool Balance (%) |
| Refinance | 21 | $593,119,236 | 82.4% |
| Acquisition | 4 | 64,411,104 | 8.9 |
| Recapitalization | 2 | 62,475,000 | 8.7 |
| Total: | 27 | $720,005,340 | 100.0% |
| MORTGAGE RATE |
Range of Mortgage
Rates (%) | Number of
Mortgage
Loans | Aggregate
Cut-off Date Balance ($) | Percent by
Aggregate
Cut-off Date
Pool Balance (%) |
| 5.1797 - 5.5000 | 5 | $132,975,000 | 18.5% |
| 5.5001 - 6.0000 | 3 | 113,500,000 | 15.8 |
| 6.0001 - 6.5000 | 7 | 213,666,104 | 29.7 |
| 6.5001 - 7.0000 | 4 | 113,900,000 | 15.8 |
| 7.0001 - 7.5000 | 6 | 77,192,323 | 10.7 |
| 7.5001 - 7.8670 | 2 | 68,771,913 | 9.6 |
| Total: | 27 | $720,005,340 | 100.0% |
| Weighted Average: | 6.3538% | | |
| UNDERWRITTEN NCF DEBT SERVICE COVERAGE RATIO |
Range of U/W NCF
DSCRs (x) | Number of
Mortgage
Loans | Aggregate
Cut-off Date Balance ($) | Percent by
Aggregate
Cut-off Date
Pool Balance (%) |
| 1.20 - 1.50 | 9 | 192,347,323 | 26.7% |
| 1.51 - 2.00 | 13 | 389,683,017 | 54.1 |
| 2.01 - 4.00 | 4 | 102,975,000 | 14.3 |
| 4.01 - 4.17 | 1 | 35,000,000 | 4.9 |
| Total: | 27 | $720,005,340 | 100.0% |
| Weighted Average: | 1.87x | | |
| UNDERWRITTEN NCF DEBT YIELD |
Range of U/W NCF
Debt Yields (%) | Number of
Mortgage
Loans | Aggregate
Cut-off Date Balance ($) | Percent by
Aggregate
Cut-off Date
Pool Balance (%) |
| 8.5 - 12.0 | 15 | $414,822,323 | 57.6% |
| 12.1 - 16.0 | 10 | 230,183,017 | 32.0 |
| 16.1 - 20.0 | 1 | 40,000,000 | 5.6 |
| 20.1 - 23.4 | 1 | 35,000,000 | 4.9 |
| Total: | 27 | $720,005,340 | 100.0% |
| Weighted Average: | 12.1% | | |
| (1) | With respect to any mortgage loan that is part of a whole loan, the loan-to-value ratio, debt service coverage ratio and debt yield calculations include the related pari passu companion loan(s) but exclude any related subordinate companion loan(s) (unless otherwise stated). With respect to each mortgage loan, debt service coverage ratio, debt yield and loan-to-value ratio information do not take into account any subordinate debt (whether or not secured by the related mortgaged property), that currently exists or is allowed under the terms of such mortgage loan. See Annex A-1 to the Preliminary Prospectus. Prepayment provisions for each mortgage loan reflects the entire life of the loan (from origination to maturity). |
THE INFORMATION IN THIS STRUCTURAL AND COLLATERAL TERM SHEET IS NOT COMPLETE AND MAY BE AMENDED PRIOR TO THE TIME OF SALE. THIS TERM SHEET IS NOT AN OFFER TO SELL THESE SECURITIES AND IT IS NOT A SOLICITATION OF AN OFFER TO BUY THESE SECURITIES IN ANY JURISDICTION WHERE THE OFFER OR SALE IS NOT PERMITTED. |
| | 15 | |
| Wells Fargo Commercial Mortgage Trust 2024-5C2 | Characteristics of the Mortgage Pool |
ORIGINAL TERM TO MATURITY
Original Terms to
Maturity (months) | Number of
Mortgage
Loans | Aggregate Cut-
off Date Balance | Percent by
Aggregate
Cut-off Date
Pool Balance (%) |
| 60 | 27 | $720,005,340 | 100.0% |
| Total: | 27 | $720,005,340 | 100.0% |
| Weighted Average: | 60 months | | |
| REMAINING TERM TO MATURITY |
Range of Remaining
Terms to Maturity (months) | Number of
Mortgage
Loans | Aggregate Cut-
off Date Balance | Percent by
Aggregate
Cut-off Date
Pool Balance (%) |
| 51 - 60 | 27 | $720,005,340 | 100.0% |
| Total: | 27 | $720,005,340 | 100.0% |
| Weighted Average: | 59 months | | |
| ORIGINAL AMORTIZATION TERM(1) |
Original
Amortization Terms
(months) | Number of
Mortgage
Loans | Aggregate Cut-
off Date Balance | Percent by
Aggregate
Cut-off Date
Pool Balance (%) |
| Non-Amortizing | 22 | $561,720,000 | 78.0% |
| 360 | 5 | 158,285,340 | 22.0 |
| Total: | 27 | $720,005,340 | 100.0% |
| Weighted Average(3): | 360 months | | |
| REMAINING AMORTIZATION TERM(2) |
Range of Remaining Amortization Terms
(months) | Number of
Mortgage
Loans | Aggregate Cut-
off Date Balance | Percent by
Aggregate
Cut-off Date
Pool Balance (%) |
| Non-Amortizing | 22 | $561,720,000 | 78.0% |
| 359 - 360 | 5 | 158,285,340 | 22.0 |
| Total: | 27 | $720,005,340 | 100.0% |
| Weighted Average(3): | 360 months | | |
| LOCKBOXES |
| Type of Lockbox | Number of
Mortgage
Loans | Aggregate Cut-
off Date Balance | Percent by
Aggregate
Cut-off Date
Pool Balance (%) |
| Hard / Springing Cash Management | 16 | $509,958,017 | 70.8% |
| Springing | 9 | 142,047,323 | 19.7 |
| Hard / In Place Cash Management | 1 | 42,000,000 | 5.8 |
| Soft / Springing Cash Management | 1 | 26,000,000 | 3.6 |
| Total: | 27 | $720,005,340 | 100.0% |
| PREPAYMENT PROVISION SUMMARY |
| Prepayment Provision | Number of
Mortgage
Loans | Aggregate Cut-
off Date Balance | Percent by
Aggregate
Cut-off Date
Pool Balance (%) |
| Lockout / Defeasance / Open | 16 | $381,938,017 | 53.0% |
| Lockout / GRTR 1% or YM / Open | 5 | 168,092,323 | 23.3 |
| Lockout / GRTR 1% or YM / GRTR 1% or YM or Defeasance / Open | 2 | 62,475,000 | 8.7 |
| GRTR 1% or YM / GRTR 1% or YM or Defeasance / Open | 2 | 61,000,000 | 8.5 |
| Lockout / GRTR 1% or YM or Defeasance / Open | 1 | 30,000,000 | 4.2 |
| GRTR 0.5% or YM / GRTR 0.5% or YM or Defeasance / Open | 1 | 16,500,000 | 2.3 |
| Total: | 27 | $720,005,340 | 100.0% |
CUT-OFF DATE LOAN-TO-VALUE RATIO
Range of Cut-off
Date LTV Ratios (%) | Number of
Mortgage
Loans | Aggregate Cut-
off Date Balance | Percent by
Aggregate
Cut-off Date
Pool Balance (%) |
| 32.1 - 40.0 | 3 | $101,000,000 | 14.0% |
| 40.1 - 50.0 | 2 | 72,000,000 | 10.0 |
| 50.1 - 60.0 | 9 | 215,588,017 | 29.9 |
| 60.1 - 70.0 | 12 | 262,417,323 | 36.4 |
| 70.1 - 73.8 | 1 | 69,000,000 | 9.6 |
| Total: | 27 | $720,005,340 | 100.0% |
| Weighted Average: | 56.8% | | |
| BALLOON or ARD LOAN-TO-VALUE RATIO |
| Range of Balloon LTV Ratios (%) | Number of
Mortgage
Loans | Aggregate Cut-
off Date Balance | Percent by
Aggregate
Cut-off Date
Pool Balance (%) |
| 32.1 - 40.0 | 3 | $101,000,000 | 14.0% |
| 40.1 - 50.0 | 4 | 138,288,017 | 19.2 |
| 50.1 - 60.0 | 7 | 149,300,000 | 20.7 |
| 60.1 - 70.0 | 12 | 262,417,323 | 36.4 |
| 70.1 - 73.8 | 1 | 69,000,000 | 9.6 |
| Total: | 27 | $720,005,340 | 100.0% |
| Weighted Average: | 56.4% | | |
| AMORTIZATION TYPE |
| Amortization Type | Number of
Mortgage
Loans | Aggregate Cut-
off Date Balance | Percent by
Aggregate
Cut-off Date
Pool Balance (%) |
| Interest Only | 22 | $561,720,000 | 78.0% |
| Interest Only, Amortizing Balloon | 2 | 87,300,000 | 12.1 |
| Amortizing Balloon | 3 | 70,985,340 | 9.9 |
| Total: | 27 | $720,005,340 | 100.0% |
| ORIGINAL TERM OF INTEREST-ONLY PERIOD FOR PARTIAL IO LOANS |
IO Terms (months) | Number of
Mortgage
Loans | Aggregate Cut-
off Date Balance | Percent by
Aggregate
Cut-off Date
Pool Balance (%) |
| 36 | 2 | | $87,300,000 | 12.1% |
| Total: | 2 | | $87,300,000 | 12.1% |
| Weighted Average: | 36 months | | | |
| SEASONING |
| Seasoning (months) | Number of
Mortgage
Loans | Aggregate Cut-
off Date Balance | Percent by
Aggregate
Cut-off Date
Pool Balance (%) |
| 0 | 12 | $320,975,000 | 44.6% |
| 1 | 12 | 330,530,340 | 45.9 |
| 3 | 2 | 58,500,000 | 8.1 |
| 9 | 1 | 10,000,000 | 1.4 |
| Total: | 27 | $720,005,340 | 100.0% |
| Weighted Average: | 1 month | | |
| (1) | The original amortization term shown for any mortgage loan that is interest only for part of its term does not include the number of months in its interest only period and reflects only the number of months as of the commencement of amortization remaining from the end of such interest-only period. |
| (2) | The remaining amortization term shown for any mortgage loan that is interest only for part of its term does not include the number of months in its interest only period and reflects only the number of months as of the commencement of amortization remaining from the end of such interest-only period. |
| (3) | Excludes the non-amortizing mortgage loans. |
THE INFORMATION IN THIS STRUCTURAL AND COLLATERAL TERM SHEET IS NOT COMPLETE AND MAY BE AMENDED PRIOR TO THE TIME OF SALE. THIS TERM SHEET IS NOT AN OFFER TO SELL THESE SECURITIES AND IT IS NOT A SOLICITATION OF AN OFFER TO BUY THESE SECURITIES IN ANY JURISDICTION WHERE THE OFFER OR SALE IS NOT PERMITTED. |
| | 16 | |
| Wells Fargo Commercial Mortgage Trust 2024-5C2 | Certain Terms and Conditions |
| V. | Certain Terms and Conditions |
| Interest Entitlements: | The interest entitlement of each Class of Certificates (other than the Class R Certificates) on each Distribution Date generally will be the interest accrued during the related Interest Accrual Period on the related Certificate Balance or Notional Amount at the related pass-through rate, net of any prepayment interest shortfalls allocated to that Class for such Distribution Date as described below. If prepayment interest shortfalls arise from voluntary prepayments (without the Master Servicer’s consent) on particular non-specially serviced loans during any collection period, the Master Servicer is required to make a compensating interest payment to offset those shortfalls, generally up to an amount equal to the portion of its master servicing fees that accrue at 0.25 basis points per annum. The remaining amount of prepayment interest shortfalls will be allocated to reduce the interest entitlement on all Classes of Certificates that are entitled to interest, on a pro rata basis, based on their respective amounts of accrued interest for the related Distribution Date. If a Class receives less than the entirety of its interest entitlement on any Distribution Date, then the shortfall (excluding any shortfall due to prepayment interest shortfalls), together with interest thereon, will be added to its interest entitlement for the next succeeding Distribution Date. |
| Principal Distribution Amount: | The Principal Distribution Amount for each Distribution Date generally will be the aggregate amount of principal received or advanced in respect of the mortgage loans, net of any non-recoverable advances and interest thereon and workout-delayed reimbursement amounts that are reimbursed to the Master Servicer, the Special Servicer or the Trustee during the related collection period. Non-recoverable advances and interest thereon are reimbursable from principal collections and advances before reimbursement from other amounts. Workout-delayed reimbursement amounts are reimbursable from principal collections. |
| Subordination, Allocation of Losses and Certain Expenses: | The chart below describes the manner in which the payment rights of certain Classes of Certificates will be senior or subordinate, as the case may be, to the payment rights of other Classes of Certificates. The chart also shows the corresponding entitlement to receive principal and/or interest of certain Classes of Certificates on any distribution date in descending order. It also shows the manner in which losses are allocated to certain Classes of Certificates in ascending order (beginning with the Non-Offered Certificates, other than the Class X-D and R Certificates) to reduce the balance of each such Class to zero; provided that no principal payments or mortgage loan losses will be allocated to the Class X-A, X-B, X-D or R Certificates, although principal payments and losses may reduce the Notional Amounts of the Class X-A, X-B and X-D Certificates, and, therefore, the amount of interest they accrue. |
| | 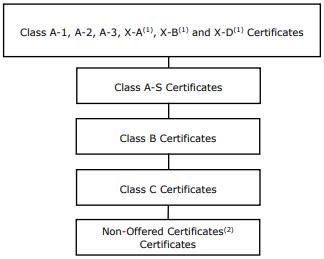 |
| | | (1) | The Class X-A, X-B and X-D Certificates are interest-only certificates. |
| | | (2) | Other than the Class X-D and R Certificates. |
| Distributions: | On each Distribution Date, funds available for distribution from the mortgage loans, net of specified trust fees, expenses and reimbursements will generally be distributed in the following amounts and order of priority (in each case to the extent of remaining available funds): |
| | 1. Class A-1, A-2, A-3, X-A, X-B and X-D Certificates: To interest on the Class A-1, A-2, A-3, X-A, X-B and X-D Certificates, pro rata, according to their respective interest entitlements. |
| | 2. Class A-1, A-2 and A-3 Certificates: To principal on the Class A-1, A-2 and A-3 Certificates in the following amounts and order of priority: (i) first, to principal on the Class A-1 Certificates until their Certificate Balance is reduced to zero, up to the Principal |
THE INFORMATION IN THIS STRUCTURAL AND COLLATERAL TERM SHEET IS NOT COMPLETE AND MAY BE AMENDED PRIOR TO THE TIME OF SALE. THIS TERM SHEET IS NOT AN OFFER TO SELL THESE SECURITIES AND IT IS NOT A SOLICITATION OF AN OFFER TO BUY THESE SECURITIES IN ANY JURISDICTION WHERE THE OFFER OR SALE IS NOT PERMITTED. |
| | 17 | |
| Wells Fargo Commercial Mortgage Trust 2024-5C2 | Certain Terms and Conditions |
| | Distribution Amount for such Distribution Date; (ii) second, to principal on the Class A-2 Certificates until their Certificate Balance is reduced to zero, up to the remainder of the Principal Distribution Amount for such Distribution Date; and (iii) third, to principal on the Class A-3 Certificates until their Certificate Balance is reduced to zero, up to the remainder of the Principal Distribution Amount for such Distribution Date. However, if the Certificate Balance of each and every Class of Principal Balance Certificates, other than the Class A-1, A-2 and A-3 Certificates, has been reduced to zero as a result of the allocation of Mortgage Loan losses and expenses and any of the Class A-1, A-2 and A-3 Certificates remains outstanding, then the Principal Distribution Amount will be distributed to the Class A-1, A-2 and A-3 Certificates, pro rata, based on their respective outstanding Certificate Balances, until their Certificate Balances have been reduced to zero. |
| | 3. Class A-1, A-2 and A-3 Certificates: To reimburse the holders of the Class A-1, A-2 and A-3 Certificates, pro rata, on the basis of previously allocated unreimbursed losses, for any previously unreimbursed losses (plus interest thereon) on the mortgage loans that were previously allocated in reduction of the Certificate Balances of such Classes. |
| | 4. Class A-S Certificates: To make distributions on the Class A-S Certificates as follows: (a) first, to interest on the Class A-S Certificates in the amount of the interest entitlement for that Class; (b) next, to the extent of the portion of the Principal Distribution Amount remaining after distributions in respect of principal to each Class with a higher distribution priority (in this case, the Class A-1, A-2 and A-3 Certificates), to principal on the Class A-S Certificates until their Certificate Balance is reduced to zero; and (c) next, to reimburse the holders of the Class A-S Certificates for any previously unreimbursed losses (plus interest thereon) on the mortgage loans that were previously allocated to that Class in reduction of their Certificate Balance. 5. Class B Certificates: To make distributions on the Class B Certificates as follows: (a) first, to interest on the Class B Certificates in the amount of the interest entitlement for that Class; (b) next, to the extent of the portion of the Principal Distribution Amount remaining after distributions in respect of principal to each Class with a higher distribution priority (in this case, the Class A-1, A-2, A-3 and A-S Certificates), to principal on the Class B Certificates until their Certificate Balance is reduced to zero; and (c) next, to reimburse the holders of the Class B Certificates for any previously unreimbursed losses (plus interest thereon) on the mortgage loans that were previously allocated to that Class in reduction of their Certificate Balance. 6. Class C Certificates: To make distributions on the Class C Certificates as follows: (a) first, to interest on the Class C Certificates in the amount of the interest entitlement for that Class; (b) next, to the extent of the portion of the Principal Distribution Amount remaining after distributions in respect of principal to each Class with a higher distribution priority (in this case, the Class A-1, A-2, A-3, A-S and B Certificates), to principal on the Class C Certificates until their Certificate Balance is reduced to zero; and (c) next, to reimburse the holders of the Class C Certificates for any previously unreimbursed losses (plus interest thereon) on the mortgage loans that were previously allocated to that Class in reduction of their Certificate Balance. 7. After the Class A-1, A-2, A-3, A-S, B and C Certificates are paid all amounts to which they are entitled, the remaining funds available for distribution will be used to pay interest, principal and loss reimbursement amounts on the Class D, E-RR, F-RR, G-RR, J-RR and K-RR Certificates sequentially in that order in a manner analogous to the Class C Certificates. |
| Allocation of Yield Maintenance Charges and Prepayment Premiums: | If any yield maintenance charge or prepayment premium is collected during any particular collection period with respect to any mortgage loan, then on the Distribution Date corresponding to that collection period, the Certificate Administrator will pay that yield maintenance charge or prepayment premium (net of liquidation fees payable therefrom) in the following manner: (1) to each of the Class A-1, A-2, A-3, A-S, B, C and D Certificates, the product of (a) the yield maintenance charge or prepayment premium, (b) the related Base Interest Fraction (as defined in the Preliminary Prospectus) for such class and the applicable principal prepayment, and (c) a fraction, the numerator of which is equal to the amount of principal distributed to such class for that Distribution Date, and the denominator of which is the total amount of principal distributed to the Class A-1, A-2, A-3, A-S, B, C, D, E-RR, F-RR, G-RR, J-RR and K-RR Certificates, (2) to the Class X-A Certificates, the excess, if any, of (a) the product of (i) such yield maintenance charge or prepayment premium and (ii) a fraction, the numerator of which is equal to the total amount of principal distributed to the Class A-1, A-2 and |
THE INFORMATION IN THIS STRUCTURAL AND COLLATERAL TERM SHEET IS NOT COMPLETE AND MAY BE AMENDED PRIOR TO THE TIME OF SALE. THIS TERM SHEET IS NOT AN OFFER TO SELL THESE SECURITIES AND IT IS NOT A SOLICITATION OF AN OFFER TO BUY THESE SECURITIES IN ANY JURISDICTION WHERE THE OFFER OR SALE IS NOT PERMITTED. |
| | 18 | |
| Wells Fargo Commercial Mortgage Trust 2024-5C2 | Certain Terms and Conditions |
| A-3 Certificates and the denominator of which is the total amount of principal distributed to the Class A-1, A-2, A-3, A-S, B, C, D, E-RR, F-RR, G-RR, J-RR and K-RR Certificates over (b) the total amount of such yield maintenance charge or prepayment premium distributed to the Class A-1, A-2 and A-3 Certificates as described above; (3) to the Class X-B Certificates, the excess, if any, of (a) the product of (i) such yield maintenance charge or prepayment premium and (ii) a fraction, the numerator of which is equal to the total amount of principal distributed to the Class A-S, B and C Certificates and the denominator of which is the total amount of principal distributed to the Class A-1, A-2, A-3, A-S, B, C, D, E-RR, F-RR, G-RR, J-RR and K-RR Certificates over (b) the total amount of such yield maintenance charge or prepayment premium distributed to the Class A-S, B and C Certificates as described above; and (4) to the Class X-D Certificates, any remaining portion of such yield maintenance charge or prepayment premium not distributed as described above; provided, however, that after the notional amounts of the Class X-A, X-B and X-D Certificates and the Certificate Balances of the Class A-1, A-2, A-3, A-S, B, C and D Certificates have been reduced to zero, all prepayment premiums and yield maintenance charges with respect to the mortgage loans will be allocated among the holders of the Class E-RR, F-RR, G-RR, J-RR and K-RR Certificates as provided in the WFCM 2024-5C2 pooling and servicing agreement. No prepayment premiums or yield maintenance charges will be distributed to the holders of the Class R Certificates. For a description of when prepayment premiums and yield maintenance charges are generally required on the mortgage loans, see Annex A-1 to the Preliminary Prospectus. See also “Risk Factors—Risks Relating to the Mortgage Loans—Risks Relating to Enforceability of Yield Maintenance Charges, Prepayment Premiums or Defeasance Provisions” and “Risk Factors—Other Risks Relating to the Certificates—Your Yield May Be Affected by Defaults, Prepayments and Other Factors” in the Preliminary Prospectus. Prepayment premiums and yield maintenance charges will be distributed on each Distribution Date only to the extent they are actually received on the mortgage loans as of the related Determination Date. |
| Realized Losses: | The Certificate Balances of the Class A-1, A-2, A-3, A-S, B, C, D, E-RR, F-RR, G-RR, J-RR and K-RR Certificates will be reduced without distribution on any Distribution Date as a write-off to the extent of any losses realized on the mortgage loans allocated to such Class on such Distribution Date. Such losses will be applied in the following order, in each case until the related Certificate Balance is reduced to zero: first, to the Class K-RR Certificates; second, to the Class J-RR Certificates; third, to the Class G-RR Certificates; fourth, to the Class F-RR Certificates; fifth, to the Class E-RR Certificates; sixth, to the Class D Certificates; seventh, to the Class C Certificates; eighth, to the Class B Certificates; ninth, to the Class A-S Certificates; and, finally, pro rata, to the Class A-1, A-2 and A-3 Certificates based on their outstanding Certificate Balances. The Notional Amount of the Class X-A Certificates will be reduced by the amount of all losses that are allocated to the Class A-1, A-2 or A-3 Certificates as write-offs in reduction of their Certificate Balances. The Notional Amount of the Class X-B Certificates will be reduced by the amount of all losses that are allocated to the Class A-S, B or C Certificates as write-offs in reduction of their Certificate Balances. The Notional Amount of the Class X-D Certificates will be reduced by the amount of all losses that are allocated to the Class D Certificates as write-offs in reduction of its Certificate Balance. |
| P&I Advances: | The Master Servicer or, if the Master Servicer fails to do so, the Trustee, will be obligated to advance delinquent debt service payments with respect to the mortgage loans it services (other than balloon payments, excess interest and default interest) and assumed debt service payments on mortgage loans with delinquent balloon payments (excluding any related companion loan), except to the extent any such advance is deemed non-recoverable from collections on the related mortgage loan. In addition, if an Appraisal Reduction Amount exists for a given mortgage loan, the interest portion of any P&I advance for such mortgage loan will be reduced, which will have the effect of reducing the amount of interest available for distribution to the Certificates, which with respect to the Certificates (other than the Class R Certificates) will be applied in reverse alphabetical order of their Class designations (except that interest payments on the Class A-1, A-2, A-3, X-A, X-B and X-D Certificates would be affected on a pari passu basis). The Special Servicer will not be required to make any P&I Advance or any recoverability determination with respect to any P&I Advance. |
| Servicing Advances: | The Master Servicer or, if the Master Servicer fails to do so, the Trustee, will be obligated to make servicing advances, including the payment of delinquent property taxes, insurance premiums and |
THE INFORMATION IN THIS STRUCTURAL AND COLLATERAL TERM SHEET IS NOT COMPLETE AND MAY BE AMENDED PRIOR TO THE TIME OF SALE. THIS TERM SHEET IS NOT AN OFFER TO SELL THESE SECURITIES AND IT IS NOT A SOLICITATION OF AN OFFER TO BUY THESE SECURITIES IN ANY JURISDICTION WHERE THE OFFER OR SALE IS NOT PERMITTED. |
| | 19 | |
| Wells Fargo Commercial Mortgage Trust 2024-5C2 | Certain Terms and Conditions |
| ground rent, except to the extent that those advances are deemed non-recoverable from collections on the related mortgage loan. The Master Servicer or the Trustee, as applicable, will have the primary obligation to make any required servicing advances with respect to any serviced whole loan. With respect to any non-serviced whole loan, the master servicer or trustee, as applicable, under the related lead securitization servicing agreement will have the primary obligation to make any required servicing advances with respect to such non-serviced whole loan. |
Appraisal Reduction Amounts and Collateral Deficiency Amounts: | An “Appraisal Reduction Amount” generally will be created in the amount, if any, by which the principal balance of a required appraisal loan (which is a mortgage loan (other than a non-serviced mortgage loan) with respect to which certain defaults, modifications or insolvency events have occurred as further described in the Preliminary Prospectus) plus other amounts overdue or advanced in connection with such mortgage loan exceeds 90% of the appraised value of the related mortgaged property plus certain escrows and reserves (including letters of credit) held with respect to the mortgage loan. With respect to any serviced whole loan, any Appraisal Reduction Amount will be allocated first to the related subordinate companion loan(s), if any, and then, pro rata, to the related mortgage loan and the related pari passu companion loan(s). With respect to any non-serviced mortgage loan, appraisal reduction amounts are expected to be calculated in a similar manner under the related non-serviced pooling and servicing agreement. A mortgage loan will cease to be a required appraisal loan when the same has ceased to be a specially serviced loan (if applicable), has been brought current for at least three consecutive months and no other circumstances exist that would cause such mortgage loan to be a required appraisal loan. A “Collateral Deficiency Amount” will exist with respect to any mortgage loan that is modified into an AB loan structure and remains a corrected mortgage loan and will generally equal the excess of (i) the stated principal balance of such AB modified loan (taking into account the related junior note(s) and any pari passu notes included therein), over (ii) the sum of (in the case of a whole loan, solely to the extent allocable to the subject mortgage loan) (x) the most recent appraised value of the related mortgaged property plus (y) solely to the extent not reflected or taken into account in such appraised value (or in the calculation of any related Appraisal Reduction Amount) and to the extent on deposit with, or otherwise under the control of, the lender as of the date of such determination, any capital or additional collateral contributed by the related borrower at the time the mortgage loan (and as part of the modification thereto) became an AB modified loan plus (z) any other escrows or reserves (in addition to any amounts set forth in the immediately preceding clause (y) and solely to the extent not reflected or taken into account in the calculation of any related Appraisal Reduction Amount) held by the lender with respect to the mortgage loan as of the date of such determination. A “Cumulative Appraisal Reduction Amount” with respect to any mortgage loan will be the sum of any Appraisal Reduction Amount and any Collateral Deficiency Amount. Appraisal Reduction Amounts will affect the amount of debt service advances in respect of the related mortgage loan. Additionally, Cumulative Appraisal Reduction Amounts will be taken into account in the determination of the identity of the Class whose majority constitutes the “controlling class certificateholder” and is entitled to appoint the directing certificateholder. |
Clean-Up Call and Exchange Termination: | On each Distribution Date occurring after the aggregate unpaid principal balance of the pool of mortgage loans is less than 1.0% of the principal balance of the mortgage loans as of the cut-off date, certain specified persons will have the option to purchase all of the remaining mortgage loans (and the trust’s interest in all property acquired through exercise of remedies in respect of any mortgage loan) at the price specified in the Preliminary Prospectus. Exercise of the option will terminate the trust and retire the then-outstanding Certificates. If the aggregate Certificate Balances of each of the Class A-1, A-2, A-3, A-S, B, C and D Certificates have been reduced to zero, the trust may also be terminated in connection with an exchange of all the then-outstanding Certificates (other than the Class R Certificates) for the mortgage loans and REO properties then remaining in the issuing entity, subject to payment of a price specified in the Preliminary Prospectus, but all of the holders of those outstanding Classes of Certificates (other than the Class R Certificates) would have to voluntarily participate in the exchange. |
| Liquidation Loan Waterfall: | Following the liquidation of any mortgage loan or mortgaged property, the net liquidation proceeds generally will be applied (after reimbursement of advances and certain trust fund expenses), first, as a recovery of accrued interest, other than delinquent interest that was not advanced as a result of Appraisal Reduction Amounts, second, as a recovery of principal until all principal has been recovered, and then as a recovery of delinquent interest that was not advanced as a result of Appraisal Reduction Amounts. Please see “Description of the Certificates—Distributions—Application Priority of Mortgage Loan Collections or Whole Loan Collections” in the Preliminary Prospectus. |
THE INFORMATION IN THIS STRUCTURAL AND COLLATERAL TERM SHEET IS NOT COMPLETE AND MAY BE AMENDED PRIOR TO THE TIME OF SALE. THIS TERM SHEET IS NOT AN OFFER TO SELL THESE SECURITIES AND IT IS NOT A SOLICITATION OF AN OFFER TO BUY THESE SECURITIES IN ANY JURISDICTION WHERE THE OFFER OR SALE IS NOT PERMITTED. |
| | 20 | |
| Wells Fargo Commercial Mortgage Trust 2024-5C2 | Certain Terms and Conditions |
| Control Eligible Certificates: | The Class J-RR and K-RR Certificates. |
| Directing Certificateholder/ Controlling Class: | A directing certificateholder may be appointed by the “controlling class certificateholder”, which will be the holder(s) of a majority of the Controlling Class. The “Controlling Class” will be, as of any time of determination, the most subordinate Class of Control Eligible Certificates then-outstanding that has an aggregate Certificate Balance (as notionally reduced by any Cumulative Appraisal Reduction Amounts allocable to such Class) at least equal to 25% of the initial Certificate Balance of that Class; provided, however, that if at any time the Certificate Balances of the Certificates other than the Control Eligible Certificates have been reduced to zero as a result of principal payments on the Mortgage Loans, then the Controlling Class will be the most subordinate Class of Control Eligible Certificates that has a Certificate Balance greater than zero without regard to any Cumulative Appraisal Reduction Amounts. The Controlling Class as of the Closing Date will be the Class K-RR Certificates. |
Control and Consultation/
Replacement of Special Servicer by Directing Certificateholder: | The rights of various parties to replace the Special Servicer and approve or consult with respect to major actions of the Special Servicer will vary according to defined periods. A “Control Termination Event” will occur when the Class J-RR Certificates have a Certificate Balance (taking into account the application of any Cumulative Appraisal Reduction Amounts to notionally reduce the Certificate Balance of such Class) of less than 25% of the initial Certificate Balance of that Class; provided, that a Control Termination Event will not be deemed continuing in the event that the Certificate Balances of the Certificates other than the Control Eligible Certificates have been reduced to zero as a result of principal payments on the Mortgage Loans. A “Consultation Termination Event” will occur when there is no Class of Control Eligible Certificates that has a then-outstanding Certificate Balance at least equal to 25% of the initial Certificate Balance of that Class, in each case, without regard to the application of any Cumulative Appraisal Reduction Amounts; provided, however, that a Consultation Termination Event will not be deemed continuing in the event that the Certificate Balances of the Certificates other than the Control Eligible Certificates have been reduced to zero as a result of principal payments on the Mortgage Loans. If no Control Termination Event has occurred and is continuing, except with respect to the Excluded Loans (as defined below) with respect to the directing certificateholder (i) the directing certificateholder will be entitled to grant or withhold approval of asset status reports prepared, and material servicing actions proposed, by the Special Servicer, and (ii) the directing certificateholder will be entitled to terminate and replace the Special Servicer with or without cause, and appoint itself or another person as the successor special servicer. It will be a condition to such appointment that Fitch, KBRA and Moody’s (and any rating agency rating any securities backed by any pari passu companion loan(s) serviced under this transaction) confirm that the appointment would not result in a qualification, downgrade or withdrawal of any of their then-current ratings of Certificates (and any certificates backed by any pari passu companion loan(s) serviced under this transaction). If a Control Termination Event has occurred and is continuing but no Consultation Termination Event has occurred and is continuing, the Special Servicer will be required to consult with the directing certificateholder (other than with respect to Excluded Loans as to such party) and the Operating Advisor in connection with asset status reports and material special servicing actions. If a Consultation Termination Event has occurred and is continuing, the Special Servicer must seek to consult with the Operating Advisor in connection with asset status reports and material special servicing actions, and, in general, no directing certificateholder will be recognized or have any right to terminate the Special Servicer or approve, direct or consult with respect to servicing matters. With respect to each serviced whole loan, the rights of the directing certificateholder described above will be subject to the consultation rights of the holders of the related pari passu companion loans. Those consultation rights will generally extend to asset status reports and material special servicing actions involving the related whole loan, will be as set forth in the related intercreditor agreement, and will be in addition to the rights of the directing certificateholder in this transaction described above. With respect to each non-serviced whole loan, the applicable servicing agreement for the related controlling pari passu companion loan(s) generally grants (or will grant) the directing certificateholder under the related securitization (or, in some cases, a controlling companion loan holder) control rights that may include the right to approve or disapprove various material servicing actions involving the related whole loan. The directing certificateholder for this securitization (so long as no Consultation Termination Event has occurred and is occurring) generally will nonetheless have the right to be consulted on a non-binding basis with respect to such actions. For purposes of the servicing of any such whole loan contemplated by this paragraph, the occurrence and continuance of a Control Termination Event or Consultation |
THE INFORMATION IN THIS STRUCTURAL AND COLLATERAL TERM SHEET IS NOT COMPLETE AND MAY BE AMENDED PRIOR TO THE TIME OF SALE. THIS TERM SHEET IS NOT AN OFFER TO SELL THESE SECURITIES AND IT IS NOT A SOLICITATION OF AN OFFER TO BUY THESE SECURITIES IN ANY JURISDICTION WHERE THE OFFER OR SALE IS NOT PERMITTED. |
| | 21 | |
| Wells Fargo Commercial Mortgage Trust 2024-5C2 | Certain Terms and Conditions |
| Termination Event under this securitization will not limit the control or other rights of the directing certificateholder (or equivalent) under the securitization of the related controlling pari passu companion loan(s). The control rights and consent and consultation rights described in the preceding paragraphs are subject to various limitations, conditions and exceptions as described in the Preliminary Prospectus. Notwithstanding any contrary description set forth above, in the event that, with respect to any mortgage loan, the controlling class certificateholder or the directing certificateholder is a Borrower Party, the controlling class certificateholder and the directing certificateholder will have no right to receive asset status reports or such other information as may be specified in the WFCM 2024-5C2 pooling and servicing agreement, to grant or withhold approval of, or consult with respect to, asset status reports prepared, and material servicing actions proposed, by the Special Servicer, with respect to such mortgage loan, and such mortgage loan will be referred to as an “Excluded Loan” as to such party. In addition, notwithstanding any contrary description set forth above, in the event that, with respect to any mortgage loan, a controlling class certificateholder is a Borrower Party, such controlling class certificateholder will have no right to receive asset status reports or such other information as may be specified in the WFCM 2024-5C2 pooling and servicing agreement with respect to such mortgage loan. “Borrower Party” means a borrower, a mortgagor or a manager of a mortgaged property, an Accelerated Mezzanine Loan Lender, or any Borrower Party Affiliate. “Accelerated Mezzanine Loan Lender” means a mezzanine lender under a mezzanine loan that has been accelerated or as to which foreclosure or enforcement proceedings have been commenced against the equity collateral pledged to secure such mezzanine loan. “Borrower Party Affiliate” means, with respect to a borrower, a mortgagor, a manager of a Mortgaged Property or an Accelerated Mezzanine Loan Lender, (x) any other person controlling or controlled by or under common control with such borrower, mortgagor, manager or Accelerated Mezzanine Loan Lender, as applicable, or (y) any other person owning, directly or indirectly, 25% or more of the beneficial interests in such borrower, mortgagor, manager or Accelerated Mezzanine Loan Lender. With respect to a mortgage loan secured by a residential cooperative property, a person will not be considered a “Borrower Party” solely by reason of such person holding one or more cooperative unit loans that are secured by direct equity interests in the related borrower or owning one or more residential cooperative units comprising the related mortgaged property as a result of any foreclosure, transfer in lieu of foreclosure or other exercise of remedies with respect to any such unit loan(s). |
| Replacement of Special Servicer: | If a Control Termination Event has occurred and is continuing, the Special Servicer may be removed and replaced without cause upon the affirmative direction of certificate owners holding not less than 66-2/3% of a certificateholder quorum, following a proposal from certificate owners holding not less than 25% of the appraisal-reduced voting rights of all Principal Balance Certificates. The certificateholders who initiate a vote on a termination and replacement of the Special Servicer without cause must cause Fitch, KBRA and Moody’s to confirm the then-current ratings of the Certificates (or decline to review the matter) and cause the payment of the fees and expenses incurred in the replacement. If no Control Termination Event has occurred and is continuing, the Special Servicer may be replaced by the directing certificateholder, subject to Fitch, KBRA and Moody’s (and any rating agency rating any securities backed by any pari passu companion loan(s) serviced under this transaction) confirming the then-current ratings of the Certificates (and any certificates backed by any pari passu companion loans serviced under this transaction) or declining to review the matter. In addition, if at any time the Operating Advisor determines, in its sole discretion exercised in good faith, that (i) the Special Servicer is not performing its duties as required under the pooling and servicing agreement in accordance with the Servicing Standard and (ii) the replacement of the Special Servicer would be in the best interest of the certificateholders as a collective whole, then the Operating Advisor will have the right to recommend the replacement of the Special Servicer and will submit its formal recommendation to the Trustee and the Certificate Administrator (along with its rationale, its proposed replacement special servicer and other relevant information justifying its recommendation). The Operating Advisor’s recommendation to replace the Special Servicer must be confirmed by an affirmative vote of holders of Principal Balance Certificates whose holders voted on the matter, provided that the holders of Principal Balance Certificates that so voted on the matter (i) hold Principal Balance Certificates representing at least 20% of the outstanding Certificate Principal Balance of all Principal Balance Certificates on an aggregate basis and (ii) consist of at least three certificateholders or certificate owners that are not “risk retention affiliated” with each other. |
THE INFORMATION IN THIS STRUCTURAL AND COLLATERAL TERM SHEET IS NOT COMPLETE AND MAY BE AMENDED PRIOR TO THE TIME OF SALE. THIS TERM SHEET IS NOT AN OFFER TO SELL THESE SECURITIES AND IT IS NOT A SOLICITATION OF AN OFFER TO BUY THESE SECURITIES IN ANY JURISDICTION WHERE THE OFFER OR SALE IS NOT PERMITTED. |
| | 22 | |
| Wells Fargo Commercial Mortgage Trust 2024-5C2 | Certain Terms and Conditions |
| | In the event the holders of Principal Balance Certificates evidencing at least a majority of a quorum of certificateholders elect to remove and replace the Special Servicer (which requisite affirmative votes must be received within 180 days of the posting of the notice of the Operating Advisor’s recommendation to replace the Special Servicer to the Certificate Administrator’s website), the Certificate Administrator will be required to receive a Rating Agency Confirmation from each of the Rating Agencies at that time, and confirmation from the applicable rating agencies that such replacement will not result in the downgrade, withdrawal or qualification of the then-current ratings of any class of any related serviced pari passu companion loan securities. |
| Excluded Special Servicer: | In the event that, with respect to any mortgage loan, the Special Servicer is a Borrower Party, the Special Servicer will be required to resign as special servicer of such mortgage loan (referred to as an “excluded special servicer loan”). If no Control Termination Event has occurred and is continuing, the directing certificateholder will be entitled to appoint (and may replace with or without cause) a separate special servicer that is not a Borrower Party (referred to as an “excluded special servicer”) with respect to such excluded special servicer loan unless such excluded special servicer loan is also an excluded loan. Otherwise, upon resignation of the Special Servicer with respect to an excluded special servicer loan, the resigning Special Servicer will be required to use reasonable efforts to appoint the excluded special servicer. |
| Appraisal Remedy: | If the Class of Certificates comprising the Controlling Class loses its status as Controlling Class because of the application of an Appraisal Reduction Amount or Collateral Deficiency Amount, the holders of a majority of the voting rights of such Class may require the Special Servicer to order a second appraisal for any mortgage loan in respect of which an Appraisal Reduction Amount or Collateral Deficiency Amount has been applied. The Special Servicer must thereafter determine whether, based on its assessment of such second appraisal, any recalculation of the Appraisal Reduction Amount or Collateral Deficiency Amount is warranted, and if so warranted, the Special Servicer will recalculate such Appraisal Reduction Amount or Collateral Deficiency Amount. Such Class will not be able to exercise any direction, control, consent and/or similar rights of the Controlling Class unless and until reinstated as the Controlling Class through such determination; and pending such determination, the rights of the Controlling Class will be exercised by the Control Eligible Certificates, if any, that would be the Controlling Class taking into account the subject appraisal reduction amount. |
| Sale of Defaulted Assets: | There will be no “fair value” purchase option. Instead, the WFCM 2024-5C2 pooling and servicing agreement will authorize the Special Servicer to sell defaulted mortgage loans serviced by the Special Servicer to the highest bidder in a manner generally similar to sales of REO properties. The sale of a defaulted loan (other than a non-serviced whole loan) for less than par plus accrued interest and certain other fees and expenses owed on the loan will be subject to consent or consultation rights of the directing certificateholder and/or Operating Advisor, as described in the Preliminary Prospectus. Generally speaking, the holder of a pari passu companion loan will have consent and/or consultation rights, as described in the Preliminary Prospectus. If the subject whole loan includes one or more subordinate companion loans, those subordinate companion loans may be included in such sale as well. With respect to each serviced whole loan, if such whole loan becomes a defaulted loan under the WFCM 2024-5C2 pooling and servicing agreement, the Special Servicer will generally be required to sell both the mortgage loan and the related pari passu companion loan(s) as a single whole loan. If the subject whole loan includes one or more subordinate companion loans, those subordinate companion loans may be included in such sale as well. With respect to each non-serviced whole loan, the applicable servicing agreement governing the servicing of such whole loan generally will provide that, if the related pari passu companion loan(s) serviced under such agreement become a defaulted loan under such servicing agreement, then the related special servicer may offer to sell to any person (or may offer to purchase) for cash such whole loan during such time as such applicable pari passu companion loan(s) constitutes a defaulted loan under such servicing agreement. Generally speaking, in connection with any such sale, the related special servicer is required to sell both the mortgage loan and the related pari passu companion loan(s) as a whole loan. The directing certificateholder for this securitization generally will have consent and/or consultation rights as the holder of an interest in the related mortgage loan, as described in the Preliminary Prospectus. If the subject whole loan includes one or more subordinate companion loans, those subordinate companion loans may be included in such sale as well. The procedures for the sale of any whole loan that becomes a defaulted whole loan, and any associated consultation rights, are subject to various limitations, conditions and exceptions as described in the Preliminary Prospectus. |
THE INFORMATION IN THIS STRUCTURAL AND COLLATERAL TERM SHEET IS NOT COMPLETE AND MAY BE AMENDED PRIOR TO THE TIME OF SALE. THIS TERM SHEET IS NOT AN OFFER TO SELL THESE SECURITIES AND IT IS NOT A SOLICITATION OF AN OFFER TO BUY THESE SECURITIES IN ANY JURISDICTION WHERE THE OFFER OR SALE IS NOT PERMITTED. |
| | 23 | |
| Wells Fargo Commercial Mortgage Trust 2024-5C2 | Certain Terms and Conditions |
| “As-Is” Appraisals: | Appraisals must be conducted on an “as-is” basis, and must be no more than 12 months old, for purposes of determining Appraisal Reduction Amounts and market value in connection with REO sales. Required appraisals may consist of updates of prior appraisals. Internal valuations by the Special Servicer are permitted if the principal balance of a mortgage loan is less than $2,000,000. |
| Operating Advisor: | The Operating Advisor will have certain review and consultation rights relating to the performance of the Special Servicer and with respect to its actions taken in connection with the resolution and/or liquidation of specially serviced loans. With respect to each mortgage loan (other than a non-serviced mortgage loan) or serviced whole loan, the Operating Advisor will be responsible for: ● reviewing the actions of the Special Servicer with respect to any specially serviced loan; ● reviewing (i) all reports by the Special Servicer made available to Privileged Persons on the Certificate Administrator’s website that are relevant to the Operating Advisor’s obligations under the pooling and servicing agreement and (ii) each Asset Status Report (as defined in the Preliminary Prospectus) (after the occurrence and during the continuance of an Operating Advisor Consultation Event (as defined below)) and Final Asset Status Report (as defined in the Preliminary Prospectus); ● recalculating and reviewing for accuracy and consistency with the WFCM 2024-5C2 pooling and servicing agreement the mathematical calculations by the Special Servicer and the corresponding application of the non-discretionary portion of the applicable formulas required to be utilized in connection with Appraisal Reduction Amounts, Collateral Deficiency Amounts and net present value calculations used in the Special Servicer’s determination of what course of action to take in connection with the workout or liquidation of a specially serviced loan; and |
| | ● preparing an annual report (if any mortgage loan (other than any non-serviced mortgage loan) or serviced whole loan was a specially serviced loan at any time during the prior calendar year or an Operating Advisor Consultation Event (as defined below) occurred during the prior calendar year) that sets forth whether the Operating Advisor believes, in its sole discretion exercised in good faith, that the Special Servicer is operating in compliance with the Servicing Standard with respect to its performance of its duties under the pooling and servicing agreement with respect to specially serviced loans (and, after the occurrence and continuance of an Operating Advisor Consultation Event (as defined below), with respect to major decisions on non-specially serviced loans) during the prior calendar year on a “asset-level basis”. The Operating Advisor will identify (1) which, if any, standards the Operating Advisor believes, in its sole discretion exercised in good faith, the Special Servicer has failed to comply with and (2) any material deviations from the Special Servicer’s obligations under the pooling and servicing agreement with respect to the resolution or liquidation of any specially serviced loan or REO property (other than with respect to any REO property related to any non-serviced mortgage loan). In preparing any Operating Advisor Annual Report (as defined in the Preliminary Prospectus), the Operating Advisor will not be required to report on instances of non-compliance with, or deviations from, the Servicing Standard or the Special Servicer’s obligations under the pooling and servicing agreement that the Operating Advisor determines, in its sole discretion exercised in good faith, to be immaterial. With respect to each mortgage loan (other than any non-serviced mortgage loan) or serviced whole loan, after the Operating Advisor has received notice that an Operating Advisor Consultation Event (as defined below) has occurred and is continuing, in addition to the duties described above, the Operating Advisor will be required to perform the following additional duties: ● to consult (on a non-binding basis) with the Special Servicer in respect of asset status reports and ● to consult (on a non-binding basis) with the Special Servicer with respect to “major decisions” processed by the Special Servicer. An “Operating Advisor Consultation Event” will occur when the Certificate Balances of the Class E-RR, F-RR, G-RR, J-RR and K-RR Certificates in the aggregate (taking into account the application of any Cumulative Appraisal Reduction Amounts to notionally reduce the Certificate Balances of such Classes) is 25% or less of the initial Certificate Balances of such Classes in the aggregate. |
| Asset Representations Reviewer: | The Asset Representations Reviewer will be required to review certain delinquent mortgage loans after a specified delinquency threshold has been exceeded (an “Asset Review Trigger”) and the required percentage of certificateholders vote to direct a review of such delinquent loans. An Asset Review Trigger will occur when either (1) mortgage loans with an aggregate outstanding |
THE INFORMATION IN THIS STRUCTURAL AND COLLATERAL TERM SHEET IS NOT COMPLETE AND MAY BE AMENDED PRIOR TO THE TIME OF SALE. THIS TERM SHEET IS NOT AN OFFER TO SELL THESE SECURITIES AND IT IS NOT A SOLICITATION OF AN OFFER TO BUY THESE SECURITIES IN ANY JURISDICTION WHERE THE OFFER OR SALE IS NOT PERMITTED. |
| | 24 | |
| Wells Fargo Commercial Mortgage Trust 2024-5C2 | Certain Terms and Conditions |
| principal balance of 25.0% or more of the aggregate outstanding principal balance of all of the mortgage loans (including any REO loans (or a portion of any REO loan in the case of a whole loan)) held by the issuing entity as of the end of the applicable collection period are delinquent loans or (2)(A) prior to and including the second anniversary of the Closing Date, at least 10 mortgage loans are delinquent loans as of the end of the applicable collection period and the outstanding principal balance of such delinquent loans in the aggregate constitutes at least 15.0% of the aggregate outstanding principal balance of all of the mortgage loans (including any REO loans (or a portion of any REO loan in the case of a whole loan)) held by the issuing entity as of the end of the applicable collection period, or (B) after the second anniversary of the Closing Date, at least 15 mortgage loans are delinquent loans as of the end of the applicable collection period and the outstanding principal balance of such delinquent loans in the aggregate constitutes at least 20.0% of the aggregate outstanding principal balance of all of the mortgage loans (including any REO loans (or a portion of any REO loan in the case of a whole loan)) held by the issuing entity as of the end of the applicable collection period. See “Pooling and Servicing Agreement—The Asset Representations Reviewer—Asset Review” in the Preliminary Prospectus. The Asset Representations Reviewer may be terminated and replaced without cause. Upon (i) the written direction of certificateholders evidencing not less than 25% of the voting rights (without regard to the application of any Cumulative Appraisal Reduction Amounts) requesting a vote to terminate and replace the Asset Representations Reviewer with a proposed successor Asset Representations Reviewer that is an eligible asset representations reviewer, and (ii) payment by such holders to the Certificate Administrator of the reasonable fees and expenses to be incurred by the Certificate Administrator in connection with administering such vote, the Certificate Administrator will promptly provide notice to all certificateholders and the Asset Representations Reviewer of such request by posting such notice on its internet website, and by mailing such notice to all certificateholders and the Asset Representations Reviewer. Upon the written direction of certificateholders evidencing at least 75% of a certificateholder quorum (without regard to the application of any Cumulative Appraisal Reduction Amounts), the Trustee will terminate all of the rights and obligations of the Asset Representations Reviewer under the WFCM 2024-5C2 pooling and servicing agreement by written notice to the Asset Representations Reviewer, and the proposed successor Asset Representations Reviewer will be appointed. See “Pooling and Servicing Agreement—The Asset Representations Reviewer” in the Preliminary Prospectus. |
| Dispute Resolution Provisions: | The mortgage loan sellers will be subject to the dispute resolution provisions set forth in the WFCM 2024-5C2 pooling and servicing agreement to the extent those provisions are triggered with respect to any mortgage loan sold to the depositor by a mortgage loan seller and such mortgage loan seller will be obligated under the related mortgage loan purchase agreement to comply with all applicable provisions and to take part in any mediation or arbitration proceedings that may result. Generally, in the event that a Repurchase Request (as defined in the Preliminary Prospectus) is not “Resolved” (as defined below) within 180 days after the related mortgage loan seller receives such Repurchase Request, then the enforcing servicer will be required to send a notice to the “Initial Requesting Certificateholder” (if any) and the Certificate Administrator indicating the enforcing servicer’s intended course of action with respect to the Repurchase Request. If (a) the enforcing servicer’s intended course of action with respect to the Repurchase Request does not involve pursuing further action to exercise rights against the related mortgage loan seller with respect to the Repurchase Request and the Initial Requesting Certificateholder, if any, or any other certificateholder or certificate owner wishes to exercise its right to refer the matter to mediation (including non-binding arbitration) or arbitration, or (b) the enforcing servicer’s intended course of action is to pursue further action to exercise rights against the related mortgage loan seller with respect to the Repurchase Request but the Initial Requesting Certificateholder, if any, or any other certificateholder or certificate owner does not agree with the dispute resolution method selected by the enforcing servicer, then the Initial Requesting Certificateholder, if any, or such other certificateholder or certificate owner may deliver a written notice to the Special Servicer indicating its intent to exercise its right to refer the matter to either mediation or arbitration. “Resolved” means, with respect to a Repurchase Request, (i) that the related Material Defect has been cured, (ii) the related mortgage loan has been repurchased in accordance with the related mortgage loan purchase agreement, (iii) a mortgage loan has been substituted for the related mortgage loan in accordance with the related mortgage loan purchase agreement, (iv) the applicable mortgage loan seller has made a Loss of Value Payment (as defined in the Preliminary Prospectus), (v) a contractually binding agreement is entered into between the enforcing servicer, on behalf of the issuing entity, and the related mortgage loan seller that settles the related mortgage loan seller’s obligations under the related mortgage loan purchase agreement, or (vi) the related mortgage loan is no longer property of the issuing entity as a result of a sale or other disposition in accordance with the WFCM 2024-5C2 pooling and servicing agreement. |
THE INFORMATION IN THIS STRUCTURAL AND COLLATERAL TERM SHEET IS NOT COMPLETE AND MAY BE AMENDED PRIOR TO THE TIME OF SALE. THIS TERM SHEET IS NOT AN OFFER TO SELL THESE SECURITIES AND IT IS NOT A SOLICITATION OF AN OFFER TO BUY THESE SECURITIES IN ANY JURISDICTION WHERE THE OFFER OR SALE IS NOT PERMITTED. |
| | 25 | |
| Wells Fargo Commercial Mortgage Trust 2024-5C2 | Certain Terms and Conditions |
| See “Pooling and Servicing Agreement—Dispute Resolution Provisions” in the Preliminary Prospectus. |
| Investor Communications: | The Certificate Administrator is required to include on any Form 10–D any request received from a certificateholder to communicate with other certificateholders related to certificateholders exercising their rights under the terms of the WFCM 2024-5C2 pooling and servicing agreement. Any certificateholder wishing to communicate with other certificateholders regarding the exercise of its rights under the terms of the WFCM 2024-5C2 pooling and servicing agreement will be able to deliver a written request signed by an authorized representative of the requesting investor to the Certificate Administrator. |
| Certain Fee Offsets: | If a workout fee is earned by the Special Servicer following a loan default with respect to any mortgage loan that it services, then certain limitations will apply based on modification fees paid by the borrower. The modification fee generally must not exceed 1% of the principal balance of the loan as modified in any 12-month period. In addition, if the loan re-defaults, any subsequent workout fee on that loan must be reduced by a portion of the modification fees paid by the borrower in the previous 12 months. Likewise, liquidation fees collected in connection with a liquidation or partial liquidation of a mortgage loan must be reduced by a portion of the modification fees paid by the borrower in the previous 12 months. |
| Deal Website: | The Certificate Administrator will be required to maintain a deal website, which will include, among other items: (a) summaries of asset status reports prepared by the Special Servicer, (b) inspection reports, (c) appraisals, (d) various “special notices” described in the Preliminary Prospectus, (e) the “Investor Q&A Forum”, (f) a voluntary “Investor Registry” and (g) the “Risk Retention Special Notices” tab. Investors may access the deal website following execution of a certification and confidentiality agreement. |
| Initial Controlling Class Certificateholder: | It is expected that RREF V – D AIV RR H, LLC or its affiliate will be the initial controlling class certificateholder. |
| Whole Loans: | Each of the mortgaged properties identified above under “IV. Characteristics of the Mortgage Pool—B. Summary of the Whole Loans” secures both a mortgage loan to be included in the trust fund and one or more other mortgage loans that will not be included in the trust fund, each of which will be pari passu or subordinate in right of payment with the mortgage loan included in the trust fund. We refer to each such group of mortgage loans as a “whole loan”. Such “—Summary of the Whole Loans” section includes further information regarding the various notes in each whole loan, the holders of such notes, the lead servicing agreement for each such whole loan, and the applicable master servicer and applicable special servicer under such lead servicing agreement. |
THE INFORMATION IN THIS STRUCTURAL AND COLLATERAL TERM SHEET IS NOT COMPLETE AND MAY BE AMENDED PRIOR TO THE TIME OF SALE. THIS TERM SHEET IS NOT AN OFFER TO SELL THESE SECURITIES AND IT IS NOT A SOLICITATION OF AN OFFER TO BUY THESE SECURITIES IN ANY JURISDICTION WHERE THE OFFER OR SALE IS NOT PERMITTED. |
| | 26 | |
| Mixed Use – Retail/Office | Loan #1 | Cut-off Date Balance: | | $69,000,000 |
2100 Bartow Avenue Bronx, NY 10475 | Bay Plaza Community Center | Cut-off Date LTV: U/W NCF DSCR: U/W NOI Debt Yield: | | 59.6% 1.54x 10.0% |

THE INFORMATION IN THIS STRUCTURAL AND COLLATERAL TERM SHEET IS NOT COMPLETE AND MAY BE AMENDED PRIOR TO THE TIME OF SALE. THIS TERM SHEET IS NOT AN OFFER TO SELL THESE SECURITIES AND IT IS NOT A SOLICITATION OF AN OFFER TO BUY THESE SECURITIES IN ANY JURISDICTION WHERE THE OFFER OR SALE IS NOT PERMITTED. |
| | 27 | |
| Mixed Use – Retail/Office | Loan #1 | Cut-off Date Balance: | | $69,000,000 |
2100 Bartow Avenue Bronx, NY 10475 | Bay Plaza Community Center | Cut-off Date LTV: U/W NCF DSCR: U/W NOI Debt Yield: | | 59.6% 1.54x 10.0% |
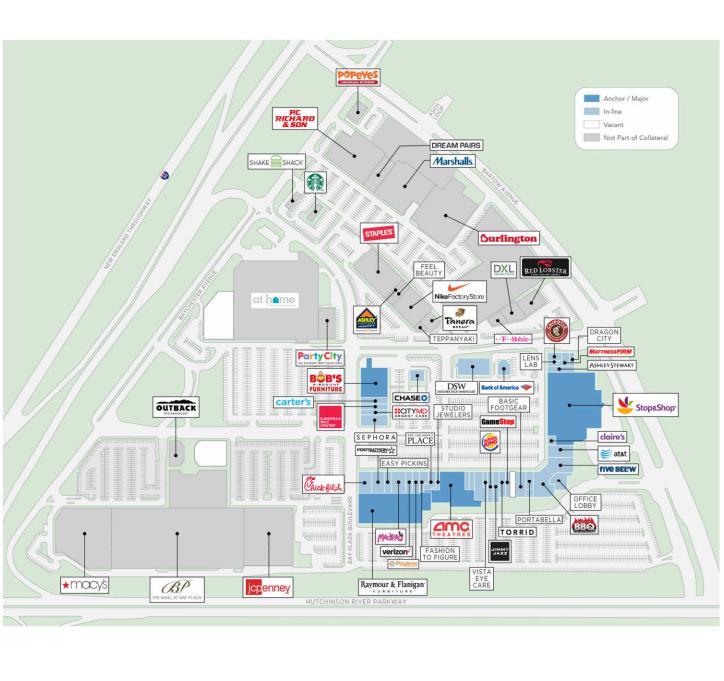
THE INFORMATION IN THIS STRUCTURAL AND COLLATERAL TERM SHEET IS NOT COMPLETE AND MAY BE AMENDED PRIOR TO THE TIME OF SALE. THIS TERM SHEET IS NOT AN OFFER TO SELL THESE SECURITIES AND IT IS NOT A SOLICITATION OF AN OFFER TO BUY THESE SECURITIES IN ANY JURISDICTION WHERE THE OFFER OR SALE IS NOT PERMITTED. |
| | 28 | |
| Mixed Use – Retail/Office | Loan #1 | Cut-off Date Balance: | | $69,000,000 |
2100 Bartow Avenue Bronx, NY 10475 | Bay Plaza Community Center | Cut-off Date LTV: U/W NCF DSCR: U/W NOI Debt Yield: | | 59.6% 1.54x 10.0% |
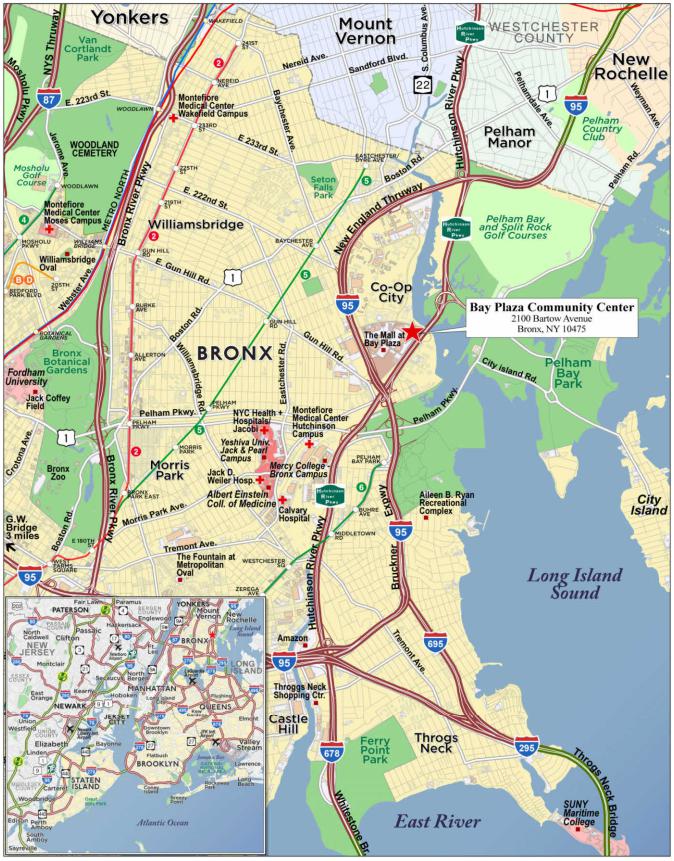
THE INFORMATION IN THIS STRUCTURAL AND COLLATERAL TERM SHEET IS NOT COMPLETE AND MAY BE AMENDED PRIOR TO THE TIME OF SALE. THIS TERM SHEET IS NOT AN OFFER TO SELL THESE SECURITIES AND IT IS NOT A SOLICITATION OF AN OFFER TO BUY THESE SECURITIES IN ANY JURISDICTION WHERE THE OFFER OR SALE IS NOT PERMITTED. |
| | 29 | |
| No. 1 – Bay Plaza Community Center |
| |
| Mortgage Loan Information | | Mortgaged Property Information |
| Mortgage Loan Seller: | JPMorgan Chase Bank, National Association | | Single Asset/Portfolio: | Single Asset |
Credit Assessment (Fitch/KBRA/Moody’s): | NR/NR/NR | | Property Type – Subtype(5): | Mixed Use – Retail/Office |
| Original Principal Balance(1): | $69,000,000 | | Location: | Bronx, NY |
| Cut-off Date Balance(1): | $69,000,000 | | Size(5): | 568,813 SF |
| % of Initial Pool Balance: | 9.6% | | Cut-off Date Balance Per SF(1): | $492.25 |
| Loan Purpose: | Refinance | | Maturity Date Balance Per SF(1): | $492.25 |
| Borrower Sponsor: | Prestige Properties & Development | | Year Built/Renovated: | 1988, 2013/2023 |
| Guarantors: | Sami Shalem and Irving Pergament | | Title Vesting: | Fee |
| Mortgage Rate: | 6.1300% | | Property Manager: | Prestige Properties & Development Co., Inc. (borrower related) |
| Note Date: | September 17, 2024 | | Current Occupancy (As of): | 89.7% (6/1/2024) |
| Seasoning: | 1 month | | YE 2023 Occupancy: | 92.0% |
| Maturity Date: | October 1, 2029 | | YE 2022 Occupancy: | 90.0% |
| IO Period: | 60 months | | YE 2021 Occupancy: | 90.0% |
| Loan Term (Original): | 60 months | | YE 2020 Occupancy: | 90.0% |
| Amortization Term (Original): | NAP | | As-Is Appraised Value: | $470,000,000 |
| Loan Amortization Type: | Interest Only | | As-Is Appraised Value Per SF: | $826.28 |
| Call Protection: | L(24),YM1(29),O(7) | | As-Is Appraisal Valuation Date: | July 25, 2024 |
| Lockbox Type: | Hard/Springing Cash Management | | | |
| | | | | |
| Additional Debt(1)(2): | Yes | | Underwriting and Financial Information(1) |
| Additional Debt Type (Balance)(1)(2): | Pari Passu ($211,000,000) | | TTM NOI (6/30/2024)(6): | $23,454,156 |
| Future Debt Permitted (Type)(3): | Yes (Mezzanine) | | YE 2023 NOI: | $23,030,484 |
| | | | YE 2022 NOI: | $22,148,647 |
| | | YE 2021 NOI: | NAV |
| Escrows and Reserves(4) | | U/W Revenues: | $39,831,349 |
| | Initial | Monthly | Cap | | U/W Expenses: | $11,772,713 |
| Taxes: | $0 | Springing | NAP | | U/W NOI(6): | $28,058,636 |
| Insurance: | $0 | Springing | NAP | | U/W NCF: | $26,795,419 |
| Replacement Reserve: | $7,110 | $7,110 | $170,644 | | U/W DSCR based on NOI/NCF(1): | 1.61x / 1.54x |
| TI/LC Reserve: | $1,000,000 | Springing | $1,000,000 | | U/W Debt Yield based on NOI/NCF(1): | 10.0% / 9.6% |
| Outstanding TI/LC: | $1,941,930 | $0 | NAP | | U/W Debt Yield at Maturity based on NOI/NCF(1): | 10.0% / 9.6% |
| | | | | | Cut-off Date LTV Ratio(1): | 59.6% |
| | | | | | LTV Ratio at Maturity(1): | 59.6% |
| | | | | | | | |
| Sources and Uses |
| Sources | | | | | Uses | | | |
| Whole Loan Amount(1) | $280,000,000 | 100.0% | | | Loan Payoff | | $265,439,060 | 94.8 | % |
| | | | | | Return of Equity | | $10,155,147 | 3.6 | |
| | | | | | Reserves | | $2,949,040 | 1.1 | |
| | | | | | Closing Costs | | $1,456,753 | 0.5 | |
| Total Sources | $280,000,000 | 100.0% | | | Total Uses | | $280,000,000 | 100.0 | % |
| (1) | The Bay Plaza Community Center Mortgage Loan (as defined below) is part of a whole loan evidenced by six pari passu promissory notes with an aggregate original principal balance of $280,000,000. The financial information presented in the chart above is based on the Bay Plaza Community Center Whole Loan (as defined below). |
| (2) | See “The Mortgage Loan” below for further discussion of additional mortgage debt. |
| (3) | See “Permitted Mezzanine Loan” below for further discussion of future debt permitted. |
| (4) | See “Escrows” below for further discussion of reserve requirements. |
| (5) | The Bay Plaza Community Center Property (as defined below) is a 568,813 square foot mixed-use property with 384,769 square feet of retail space and 184,044 square feet of office space. |
| (6) | The increase in NOI from TTM (6/30/2024) to U/W is primarily attributable to recent office leases executed by NYC – ACS (as defined below) and UFT (as defined below), and burn-off of associated free rent. |
The Mortgage Loan. The largest mortgage loan (the “Bay Plaza Community Center Mortgage Loan”) is part of a fixed rate whole loan evidenced by six pari passu promissory notes with an aggregate outstanding principal balance as of the Cut-off Date of $280,000,000 (the “Bay Plaza Community Center Whole Loan”). The Bay Plaza Community Center Whole Loan is secured by the borrower’s fee interest in a 568,813 square foot mixed-use, retail/office property located in the Bronx, New York (the “Bay Plaza Community Center Property”). The Bay Plaza Community Center Mortgage Loan is evidenced by the non-controlling note A-2-1, with an outstanding principal balance as of the Cut-off Date of $69,000,000. The Bay Plaza Community Center Whole Loan was originated by JPMorgan Chase Bank, National Association (“JPMCB”) on September 17, 2024. The Bay Plaza Community Center Whole Loan is serviced pursuant
THE INFORMATION IN THIS STRUCTURAL AND COLLATERAL TERM SHEET IS NOT COMPLETE AND MAY BE AMENDED PRIOR TO THE TIME OF SALE. THIS TERM SHEET IS NOT AN OFFER TO SELL THESE SECURITIES AND IT IS NOT A SOLICITATION OF AN OFFER TO BUY THESE SECURITIES IN ANY JURISDICTION WHERE THE OFFER OR SALE IS NOT PERMITTED. |
| | 30 | |
| Mixed Use – Retail/Office | Loan #1 | Cut-off Date Balance: | | $69,000,000 |
2100 Bartow Avenue Bronx, NY 10475 | Bay Plaza Community Center | Cut-off Date LTV: U/W NCF DSCR: U/W NOI Debt Yield: | | 59.6% 1.54x 10.0% |
to the pooling and servicing agreement for the BANK5 2024-5YR10 securitization trust. The relationship between the holders of the Bay Plaza Community Center Whole Loan is governed by a co-lender agreement as described under “Description of the Mortgage Pool—The Whole Loans—The Non-Serviced Pari Passu Whole Loans” in the prospectus.
Whole Loan Note Summary
| Note | Original Balance | Cut-off Date Balance | Note Holder | Controlling Piece |
| A-1 | $83,000,000 | $83,000,000 | BANK5 2024-5YR10 | Yes |
| A-2-1 | $69,000,000 | $69,000,000 | WFCM 2024-5C2 | No |
| A-2-2(1) | $11,000,000 | $11,000,000 | JPMCB | No |
| A-3 | $67,000,000 | $67,000,000 | BANK5 2024-5YR11 | No |
| A-4(1) | $40,000,000 | $40,000,000 | JPMCB | No |
| A-5 | $10,000,000 | $10,000,000 | BANK5 2024-5YR11 | No |
| Total | $280,000,000 | $280,000,000 | | |
| (1) | Expected to be contributed to one or more future securitization transactions or may otherwise be transferred at any time. |
The Borrowers and Borrower Sponsor. The borrower entities for the Bay Plaza Community Center Whole Loan are SP Center, LLC and BPCC Lease, LLC, each a New York limited liability company and single purpose entity with two independent directors. The non-recourse carveout guarantors are Sami Shalem and Irving Pergament, each an individual, who are the Chief Executive Officer and President, respectively, of the borrower sponsor, Prestige Properties & Development. Founded in 1984, Prestige Properties & Development is a real estate company specializing in the ownership, development and management of Class A retail and office properties. Legal counsel to the borrowers delivered a non-consolidation opinion in connection with the origination of the Bay Plaza Community Center Whole Loan.
The Property. Built in 1988 and renovated in 2023, the Bay Plaza Community Center Property is a 568,813 square foot mixed-use property with 384,769 square feet of retail space and 184,044 square feet of office space located in the Baychester neighborhood of the Bronx. The Bay Plaza Community Center Property comprises a four-story retail and office building, a two-story multi-tenant retail building, a two-story single tenant building and two one-story outparcel retail buildings situated on a 29.42-acre parcel with 1,950 parking spaces. According to the appraisal, the Bay Plaza Community Center Property is part of the greater Bay Plaza retail complex, which comprises 2.0 million square feet and is the prime retail destination in the Bronx. The Bay Plaza Community Center Property is bordered directly to the north by Co-op City, the largest single residential development in the United States, with 15,372 residential units across 35 high-rise buildings.
As of June 1, 2024, the Bay Plaza Community Center Property was approximately 89.7% occupied by a granular tenant base comprising 54 tenants, with no single tenant accounting for greater than 10.6% of underwritten base rent or 11.8% of net rentable area. As of June 1, 2024, the retail component was 97.6% occupied by 44 unique tenants, while the office component was 73.3% occupied by 11 unique tenants. The Bay Plaza Community Center Property has demonstrated consistent performance, maintaining an occupancy rate at or above 90.0% between 2019 and 2023. The Bay Plaza Community Center Property is anchored by Stop & Shop (10.2% of underwritten base rent), which has been a tenant since August 1996, and AMC (10.6% of underwritten base rent), which is the sole movie theater in the Bronx. The remaining tenancy is largely comprised of institutional quality national retail brands.
The office space at the Bay Plaza Community Center Property underwent significant renovations in 2023 in connection with the recent leasing and buildout of the New York City Administration for Children’s Services (“NYC – ACS”) and United Federation of Teachers (“UFT”) spaces. Both NYC – ACS and UFT executed long term leases expiring in 2044. The borrower sponsor invested approximately $13.7 million in the buildout of the spaces, including mechanical upgrades and base building improvements. The borrower sponsor invested a total of approximately $21.5 million in capital expenditures on the office space between 2022 and 2023.
Major Tenants.
Stop & Shop (Fitch/Moody’s/S&P: NR/Baa1/BBB+; 67,333 square feet; 11.8% of net rentable area; 10.2% of underwritten base rent): Founded in 1914, Stop & Shop is a subsidiary for Koninklijke Ahold Delhaize N.V., which operates retail food stores and e-commerce primarily in the United States and Europe. Stop & Shop has over 50,000 associates across over 350 stores throughout Massachusetts, Connecticut, Rhode Island and New York. Stop & Shop has steadily increased sales at the Bay Plaza Community Center Property since 2018, increasing from $35,314,144 ($524.47 PSF) in 2018 to $51,839,003 ($769.89 PSF) in 2023. Stop & Shop is a long-standing retail tenant that has been at the Bay Plaza Community Center Property since 1996. Stop & Shop’s lease expires in October 2033, has two, five-year extension options remaining and no unilateral termination options.
AMC (55,700 square feet; 9.8% of net rentable area; 10.6% of underwritten base rent): Founded in 1920 and headquartered in Leawood, Kansas, AMC is a theatrical exhibition company that has pioneered many of the industry’s innovations. As of December 31, 2023, the company owned, leased or operated 898 theatres and 10,059 screens in 11 countries, including 562 theaters with a total of 7,369 screens in the United States and 336 theaters with a total of 2,690 screens in European markets. AMC’s sales have largely recovered from post-COVID-19 pandemic lows, increasing from $6,837,927 ($525,994 per screen) in 2021 to $14,207,861 ($1,092,912 per screen) in 2023, nearly reaching pre-pandemic performance. The AMC location at the Bay Plaza Community Center Property is the sole movie theater in the borough of the Bronx, which the appraisal suggests will support future demand and subsequent sales growth. AMC is a long-standing retail tenant that has been at the Bay Plaza Community Center Property since 1989. AMC’s lease expires in June 2029, has three, five-year extension options remaining and no termination options.
THE INFORMATION IN THIS STRUCTURAL AND COLLATERAL TERM SHEET IS NOT COMPLETE AND MAY BE AMENDED PRIOR TO THE TIME OF SALE. THIS TERM SHEET IS NOT AN OFFER TO SELL THESE SECURITIES AND IT IS NOT A SOLICITATION OF AN OFFER TO BUY THESE SECURITIES IN ANY JURISDICTION WHERE THE OFFER OR SALE IS NOT PERMITTED. |
| | 31 | |
| Mixed Use – Retail/Office | Loan #1 | Cut-off Date Balance: | | $69,000,000 |
2100 Bartow Avenue Bronx, NY 10475 | Bay Plaza Community Center | Cut-off Date LTV: U/W NCF DSCR: U/W NOI Debt Yield: | | 59.6% 1.54x 10.0% |
United Federation of Teachers (“UFT”) (45,008 square feet; 7.9% of net rentable area; 6.5% of underwritten base rent): The UFT is a labor union that is the sole bargaining agent for most of New York City’s public schools. In total, the UFT represents nearly 200,000 members, including approximately 75,000 teachers, 25,000 classroom paraprofessionals and many other school-based employees, including secretaries, counselors and physical therapists. UFT has been an office tenant at the Bay Plaza Community Center Property since September 2023 and is under a long-term lease through July 2044. The Borrower Sponsor invested approximately $14.2 million in the buildout of the UFT and NYC – ACS spaces in 2023. UFT has two, 10-year extension options remaining and no termination options.
The following table presents a summary regarding the major tenants at the Bay Plaza Community Center Property:
Major Tenants(1)
| Tenant Name | Tenant Type | Credit Rating (Fitch/Moody's/
S&P)(2) | Tenant NRSF | % of NRSF | Annual U/W Rent | % of Total Annual U/W Rent | Annual U/W Rent PSF | Term. Option (Y/N) | Lease Expiration Date | Ext. Options |
| Anchor Tenant | | | | | | | | | | |
| Stop & Shop | Retail | NR/Baa1/BBB+ | 67,333 | 11.8% | $2,943,523 | 10.2% | $43.72 | N | 10/31/2033 | 2 x 5 Yr |
| AMC | Retail | NR/NR/NR | 55,700 | 9.8% | $3,060,158 | 10.6% | $54.94 | N | 6/30/2029 | 3 x 5 Yr |
| | | | | | | | | | | |
| Major Tenants | | | | | | | | | | |
| UFT | Office | NR/NR/NR | 45,008 | 7.9% | $1,867,382 | 6.5% | $41.49 | N | 7/31/2044 | 2 x 10 Yr |
| Raymour & Flanigan | Retail | NR/NR/NR | 43,000 | 7.6% | $1,441,790 | 5.0% | $33.53 | N | 12/31/2029 | 1 x 5 Yr |
| NYC - ACS | Office | AA/Aa2/AA | 37,500 | 6.6% | $1,352,291 | 4.7% | $36.06 | Y(3) | 9/25/2044 | 1 x 5 Yr |
| Bob's Furniture | Retail | NR/NR/NR | 29,428 | 5.2% | $1,369,096 | 4.8% | $46.52 | N | 2/29/2028 | 1 x 5 Yr |
| Montefiore Medical | Office | NR/NR/NR | 27,600 | 4.9% | $1,163,074 | 4.0% | $42.14 | N | 12/31/2029 | 1 x 5 Yr |
| DSW Shoes | Retail | NR/NR/NR | 21,000 | 3.7% | $1,251,180 | 4.4% | $59.58 | Y(4) | 1/31/2034 | 1 x 5 Yr |
| Dallas BBQ(5) | Retail | NR/NR/NR | 13,106 | 2.3% | $862,410 | 3.0% | $65.80 | N | 7/31/2033 | None |
| Adidas | Retail | NR/A3/A- | 10,595 | 1.9% | $766,385 | 2.7% | $72.33 | Y(6) | 1/31/2033 | 1 x 5 Yr |
| Total/Wtd. Avg. | | | 350,270 | 61.6% | $16,077,289 | 55.9% | $45.90 | | | |
| | | | | | | | | | | |
| Remaining Occupied Retail | | 135,517 | 23.8% | $11,707,374 | 40.7% | $86.39 | | | |
| Remaining Occupied Office | | 22,467 | 3.9% | $969,849 | 3.4% | $43.17 | | | |
| | | | | | | | | | | |
| Occupied Total | | | 508,254 | 89.4% | $28,754,513 | 100.0% | $56.58 | | | |
| Vacant Space | | | 60,559 | 10.6% | | | | | | |
| Total/Wtd. Avg. | | | 568,813 | 100.0% | | | | | | |
| (1) | Based on the underwritten rent roll dated as of June 1, 2024 inclusive of contractual rent steps through October 2025. |
| (2) | Certain ratings are those of the parent company whether or not the parent guarantees the lease. |
| (3) | Effective between March 26, 2034 and March 26, 2035 upon 360 days’ notice, NYC – ACS has a one-time right to terminate its lease upon payment of a termination fee in an amount equal to the unamortized portion of the sum of (i) the brokerage commission that the borrower paid the NYC – ACS’s broker, (ii) the borrower’s contribution towards the buildout of NYC – ACS’s space, and (iii) $1,012,500. |
| (4) | DSW has the right to terminate its lease if at least one of Bob’s Furniture or Stop & Shop plus retailers having an aggregate of 65% of NRA of the Bay Plaza Community Center Property are not open for a continuous period of 18 months. |
| (5) | Dallas BBQ also pays percentage rent equal to the product of gross sales in excess of $8,000,0000 multiplied by 6% which is excluded from Annual U/W Rent PSF above. |
| (6) | Adidas has the right to terminate its lease if its gross sales between February 2027 and January 2028 do not exceed $4,000,000, provided it gives notice within 90 days of February 1, 2028. |
The following table presents a summary of sales for certain tenants at the Bay Plaza Community Center Property:
Select Tenant Sales
| | SF | 2018 Sales
PSF | 2019 Sales
PSF | 2021 Sales
PSF | 2022 Sales
PSF | 2023 Sales
PSF | 2023
Occupancy
Cost(1) |
| Stop & Shop | 67,333 | $524.47 | $516.12 | $611.54 | $687.19 | $769.89 | 9.5% |
| AMC(2) | 55,700 | $1,342,379 | $1,319,639 | $525,994 | $836,167 | $1,092,912 | 28.5% |
| Raymour & Flanigan | 43,000 | $565.07 | $549.31 | $680.27 | $560.29 | $488.27 | 12.3% |
| Bob's Furniture | 29,428 | $760.79 | $922.32 | $731.40 | $697.58 | $632.41 | 10.6% |
| DSW Shoes | 21,000 | $266.41 | $262.91 | $321.47 | $317.23 | $257.45 | 30.0% |
| Dallas BBQ | 13,106 | $767.96 | $762.19 | $718.33 | $763.52 | $769.18 | 11.3% |
| Five Below | 10,586 | $473.69 | $516.77 | $462.03 | $434.15 | $454.77 | 17.0% |
| (1) | Occupancy Cost is calculated by dividing gross sales of each tenant by the sum of (i) its contractual rent based on the underwritten rent roll dated June 1, 2024 and (ii) its reimbursements based on the underwritten rent roll dated June 1, 2024. |
| (2) | Calculated based on a sales per screen (with 13 screens). |
THE INFORMATION IN THIS STRUCTURAL AND COLLATERAL TERM SHEET IS NOT COMPLETE AND MAY BE AMENDED PRIOR TO THE TIME OF SALE. THIS TERM SHEET IS NOT AN OFFER TO SELL THESE SECURITIES AND IT IS NOT A SOLICITATION OF AN OFFER TO BUY THESE SECURITIES IN ANY JURISDICTION WHERE THE OFFER OR SALE IS NOT PERMITTED. |
| | 32 | |
| Mixed Use – Retail/Office | Loan #1 | Cut-off Date Balance: | | $69,000,000 |
2100 Bartow Avenue Bronx, NY 10475 | Bay Plaza Community Center | Cut-off Date LTV: U/W NCF DSCR: U/W NOI Debt Yield: | | 59.6% 1.54x 10.0% |
The following table presents certain information relating to the lease rollover schedule at the Bay Plaza Community Center Property:
Lease Expiration Schedule(1)(2)
| Year Ending December 31 | No. of Leases Expiring | Expiring NRSF | % of Total NRSF | Cumulative Expiring NRSF | Cumulative % of Total NRSF | Annual U/W Base Rent | % of Total Annual U/W Base Rent | Annual U/W Base Rent PSF |
| MTM/2024 | 1 | 3,488 | 0.6% | 3,488 | 0.6% | $285,863 | 1.0% | $81.96 |
| 2025 | 3 | 7,597 | 1.3% | 11,085 | 1.9% | $625,670 | 2.2% | $82.36 |
| 2026 | 10 | 35,654 | 6.3% | 46,739 | 8.2% | $2,622,557 | 9.1% | $73.56 |
| 2027 | 3 | 11,708 | 2.1% | 58,447 | 10.3% | $1,127,292 | 3.9% | $96.28 |
| 2028 | 2 | 31,419 | 5.5% | 89,866 | 15.8% | $1,533,354 | 5.3% | $48.80 |
| 2029 | 8 | 144,190 | 25.3% | 234,056 | 41.1% | $7,388,890 | 25.7% | $51.24 |
| 2030 | 4 | 20,637 | 3.6% | 254,693 | 44.8% | $1,687,016 | 5.9% | $81.75 |
| 2031 | 4 | 11,476 | 2.0% | 266,169 | 46.8% | $858,933 | 3.0% | $74.85 |
| 2032 | 2 | 3,565 | 0.6% | 269,734 | 47.4% | $270,251 | 0.9% | $75.81 |
| 2033 | 8 | 111,455 | 19.6% | 381,189 | 67.0% | $6,059,411 | 21.1% | $54.37 |
| 2034 | 4 | 30,192 | 5.3% | 411,381 | 72.3% | $1,830,006 | 6.4% | $60.61 |
| 2035 & Thereafter | 5 | 96,873 | 17.0% | 508,254 | 89.4% | $4,465,270 | 15.5% | $46.09 |
| Vacant | 0 | 60,559 | 10.6% | 568,813 | 100.0% | $0 | 0.0% | $0.00 |
| Total / Wtd. Avg. | 54 | 568,813 | 100.0% | | | $28,754,513 | 100.0% | $56.58 |
| (1) | Based on the underwritten rent roll dated June 1, 2024 inclusive of contractual rent steps through October 2025. |
| (2) | Certain tenants may have termination options that are exercisable prior to the originally stated expiration date of the subject lease and that are not considered in the Lease Expiration Schedule. |
The following table presents historical occupancy percentages at the Bay Plaza Community Center Property:
Historical Occupancy(1)
| | 12/31/2019 | 12/31/2020 | 12/31/2021 | 12/31/2022 | 12/31/2023 | 6/1/2024(2) |
| Retail | 98.0% | 96.0% | 91.0% | 93.0% | 99.0% | 97.6% |
| Office | 73.3% | 77.5% | 87.9% | 83.7% | 77.4% | 73.3% |
| Overall | 90.0% | 90.0% | 90.0% | 90.0% | 92.0% | 89.7% |
| (1) | Includes tenants that have leases that have not yet commenced, but have executed leases. |
| (2) | Current occupancy is based on the underwritten rent roll dated as of June 1, 2024. |
THE INFORMATION IN THIS STRUCTURAL AND COLLATERAL TERM SHEET IS NOT COMPLETE AND MAY BE AMENDED PRIOR TO THE TIME OF SALE. THIS TERM SHEET IS NOT AN OFFER TO SELL THESE SECURITIES AND IT IS NOT A SOLICITATION OF AN OFFER TO BUY THESE SECURITIES IN ANY JURISDICTION WHERE THE OFFER OR SALE IS NOT PERMITTED. |
| | 33 | |
| Mixed Use – Retail/Office | Loan #1 | Cut-off Date Balance: | | $69,000,000 |
2100 Bartow Avenue Bronx, NY 10475 | Bay Plaza Community Center | Cut-off Date LTV: U/W NCF DSCR: U/W NOI Debt Yield: | | 59.6% 1.54x 10.0% |
Operating History and Underwritten Net Cash Flow. The following table presents certain information relating to the historical operating performance and underwritten net cash flow at the Bay Plaza Community Center Property:
Cash Flow Analysis
| | 2022 | 2023 | TTM 6/30/2024 | U/W | %(1) | U/W $
per SF |
| Rents In Place(2) | $24,211,177 | $24,010,544 | $24,260,443 | $28,754,513 | 66.1% | $50.55 |
| Vacant Income | 0 | 0 | 0 | 2,628,762 | 6.0% | $4.62 |
| Gross Potential Rent | $24,211,177 | $24,010,544 | $24,260,443 | $31,383,275 | 72.2% | $55.17 |
| Reimbursements | 6,657,426 | 7,326,455 | 7,582,157 | 11,541,016 | 26.5% | $20.29 |
| Percentage Rent | 214,844 | 425,964 | 254,540 | 298,449 | 0.7% | $0.52 |
| Other Rental Storage | 268,434 | 425,117 | 56,524 | 250,025 | 0.6% | $0.44 |
| Net Rental Income | $31,351,881 | $32,188,080 | $32,153,664 | $43,472,765 | 100.0% | $76.43 |
| Less Vacancy | 0 | 0 | 0 | (3,641,416) | (8.4%) | ($6.40) |
| Effective Gross Income | $31,351,881 | $32,188,080 | $32,153,664 | $39,831,349 | 91.6% | $70.03 |
| | | | | | | |
| Real Estate Taxes(3) | $2,423,583 | $2,578,213 | $2,709,774 | $4,447,961 | 11.2% | $7.82 |
| Insurance | 634,343 | 730,780 | 753,822 | 565,042 | 1.4% | $0.99 |
| Management Fee | 471,380 | 529,838 | 523,245 | 1,000,000 | 2.5% | $1.76 |
| Other Expenses | 5,673,928 | 5,318,765 | 4,712,667 | 5,759,710 | 14.5% | $10.13 |
| Total Expenses | $9,203,234 | $9,157,596 | $8,699,508 | $11,772,713 | 29.6% | $20.70 |
| | | | | | | |
| Net Operating Income | $22,148,647 | $23,030,484 | $23,454,156 | $28,058,636 | 70.4% | $49.33 |
| Capital Expenditure Reserve(4) | 0 | 0 | 0 | (100,000) | (0.3%) | ($0.18) |
| TI/LC | 0 | 0 | 0 | 1,277,896 | 3.2% | $2.25 |
| Replacement Reserves | 0 | 0 | 0 | 85,322 | 0.2% | $0.15 |
| Net Cash Flow(5) | $22,148,647 | $23,030,484 | $23,454,156 | $26,795,419 | 67.3% | $47.11 |
| | | | | | | |
| NOI DSCR(6) | 1.27x | 1.32x | 1.35x | 1.61x | | |
| NCF DSCR(6) | 1.27x | 1.32x | 1.35x | 1.54x | | |
| NOI Debt Yield(6) | 7.9% | 8.2% | 8.4% | 10.0% | | |
| NCF Debt Yield(6) | 7.9% | 8.2% | 8.4% | 9.6% | | |
| (1) | Represents (i) percent of Net Rental Income for all revenue figures and Vacancy and (ii) percent of Effective Gross Income for all other figures. |
| (2) | U/W Rents in Place are based on the underwritten rent roll dated June 1, 2024 inclusive of contractual rent steps through October 2025. |
| (3) | The increase in Real Estate Taxes from TTM 6/30/2024 to U/W is primarily attributable to the burn-off abatements associated with ICAP and ICIP programs. Nearly all tenants are subject to NNN leases under which they are required to reimburse for their share of real estate taxes. |
| (4) | U/W Capital Expenditure Reserve represents a credit against anticipated TI/LCs during the term of the term of the loan for the $1,000,000 reserved at loan origination. |
| (5) | The increase in Net Cash Flow from TTM 6/30/2024 to U/W is primarily attributable to recent office leases executed by NYC – ACS and UFT, and the burn-off of their associated free rent. |
| (6) | DSCRs and Debt Yields are based on the Bay Plaza Community Center Whole Loan. |
Appraisal. The appraiser concluded to an “As-is” value for the Bay Plaza Community Center Property of $470,000,000 as of July 25, 2024.
Environmental Matters. According to the Phase I environmental site assessment dated July 31, 2024, there was no evidence of any recognized environmental conditions at the Bay Plaza Community Center Property.
Market Overview and Competition. The Bay Plaza Community Center Property is located at the intersection of Hutchinson River Parkway and Bartow Avenue within the Baychester neighborhood of the Bronx. The Baychester neighborhood is bordered by the Eastchester neighborhood to the north, Williamsbridge neighborhood in the west, Pelham Gardens to the south and Hutchinson River to the east. The New England Thruway bifurcates the Baychester neighborhood and provides access into Queens through the Throggs Neck Bridge and arterial access into Manhattan and New Jersey.
Baychester is a residential, self-contained community. The streets are improved with mainly middle-income residential housing types, including multi-tenant rentals, cooperative apartments and condominium buildings. Located in the northern section of Baychester is Co-op City, the largest single residential development in the United States. Co-op City has 15,372 residential units across 35 high-rise buildings. Co-op City also features a school system, parking garages and shopping centers.
The Bay Plaza Community Center Property is located within the Bay Plaza retail complex, adjacent to the Mall at Bay Plaza. The retail complex contains a total of approximately two million square feet of retail space and is the prime retail center in the Bronx. The Mall at Bay Plaza contains tenants including JCPenney, Macy’s, Victoria’s Secret, Hollister Co., Vans, Express, Charlotte Russe and H&M. According to a third party market data provider, the Bay Plaza retail complex receives more than 15 million visitors each year, with visitors spending an average of 84 minutes in the center with each visit. Additionally, according to a third party market data provider, the center contains several tenants which rank among the most visited chains in the State of New York, such as Chase Bank, Starbucks, Bank of America and Sephora.
Within a 0.5-, one- and three-mile radius of the Bay Plaza Community Center Property, the 2022 average household income was approximately $68,328, $76,059 and $77,983, respectively; and within the same radii, the 2022 population was 27,314, 59,931 and 499,018, respectively.
THE INFORMATION IN THIS STRUCTURAL AND COLLATERAL TERM SHEET IS NOT COMPLETE AND MAY BE AMENDED PRIOR TO THE TIME OF SALE. THIS TERM SHEET IS NOT AN OFFER TO SELL THESE SECURITIES AND IT IS NOT A SOLICITATION OF AN OFFER TO BUY THESE SECURITIES IN ANY JURISDICTION WHERE THE OFFER OR SALE IS NOT PERMITTED. |
| | 34 | |
| Mixed Use – Retail/Office | Loan #1 | Cut-off Date Balance: | | $69,000,000 |
2100 Bartow Avenue Bronx, NY 10475 | Bay Plaza Community Center | Cut-off Date LTV: U/W NCF DSCR: U/W NOI Debt Yield: | | 59.6% 1.54x 10.0% |
According to the appraisal, the Bay Plaza Community Center Property is situated within the Bronx shopping center market. As of the second quarter of 2024, the Bronx shopping center market reported total inventory of approximately 5.3 million square feet with a 6.0% vacancy rate and average asking rents of $51.95 per square foot. Additionally, the Bay Plaza Community Center Property is located within The Bronx office market. As of the second quarter of 2024, the Bronx office market reported total inventory of approximately 15.7 million square feet with a 8.3% vacancy rate and average rents of $35.60 per square foot.
The following table presents certain information relating to the appraisal’s market rent conclusions for the Bay Plaza Community Center Property:
Market Rent Summary(1)
| | Market Rent (PSF) | Lease Term (Yrs.) | Rent Increase Projections | New Tenant Improvements PSF |
| Anchor – Stop & Shop | $45.00 | 15 | 10% every 60 months | $40.00 |
| Anchor – AMC | $50.00 | 15 | 10% every 60 months | $40.00 |
| Junior Anchor (>25,000 SF) | $55.00 | 10 | 10% every 60 months | $40.00 |
| Junior Anchor (11,000 - 25,000 SF) | $60.00 | 10 | 10% every 60 months | $40.00 |
| In-Line – Large (6,000 - 11,000 SF) | $65.00 | 10 | 10% every 60 months | $30.00 |
| In-Line – Mid (3,000 - 6,000 SF) | $75.00 | 10 | 3% per annum | $30.00 |
| In-Line – Small (<3,000 SF) | $85.00 | 10 | 3% per annum | $30.00 |
| Outparcel – Bank | $125.00 | 10 | 3% per annum | $30.00 |
| Office – Large (>30,000 SF) | $35.00 | 10 | 10% every 60 months | $120.00 |
| Office – Mid (5,000 - 30,000 SF) | $40.00 | 10 | 3% per annum | $100.00 |
| Office – Small (<5,000 SF) | $45.00 | 10 | 3% per annum | $100.00 |
| (1) | Information obtained from the appraisal. |
The table below presents certain information relating to comparable retail centers pertaining to the Bay Plaza Community Center Property identified by the appraisal:
Competitive Set(1)
| Property Name | Year Built/Renovated | Total NRA | Total Occupancy | Anchor / Major Tenants | Distance to Bay Plaza Community Center Property |
| Bay Plaza Community Center | 1988, 2013/2023 | 384,769(2) | 97.6%(3) | AMC Theaters, Stop & Shop | NAP |
| The Mall at Bay Plaza | 2014 / NAP | 490,314 | 98.0% | JCPenney, Macy’s, Forever 21 | 0.3 Miles South |
| Bay Plaza Shopping Center | 1988 / NAP | 864,327 | 98.0% | Marshalls, PC Richards & Son, Staples, Ashley’s HomeStore | 0.2 Miles South |
| Peartree Square | 2003 / NAP | 141,156 | 98.0% | Stop & Shop | 1.1 Miles North |
| Gun Hill Commons | 1986 / NAP | 81,177 | 100.0% | ALDI, Planet Fitness | 1.2 Miles Southwest |
| Post Road Plaza | 1990 / 2009 | 257,143 | 85.0% | Fairway Market, Dave & Buster’s, 24 Hour Fitness, HomeGoods | 2.2 Miles North |
| Throggs Neck Shopping Center | 2013 / NAP | 473,312 | 98.0% | Target, TJ Maxx | 4.4 Miles South |
| Mount Vernon Shopping Center | 2005 / NAP | 290,852 | 83.0% | Target, TJ Maxx | 4.5 Miles North |
| Bruckner Commons | 1964 / 1989 | 369,301 | 89.0% | Target, Burlington, Leonardo Furniture | 5.0 Miles Southwest |
| Bronx Terminal Market | 2009 / NAP | 918,537 | 97.0% | Target, BJ’s Wholesale Club, Home Depot | 10.1 Miles Southwest |
| Weighted Average | | | 95.0%(4) | | |
| (1) | Information obtained from the appraisal, unless otherwise specified. |
| (2) | Based on the underwritten rent roll dated as of June 1, 2024. |
| (3) | Based on the retail occupancy at the Bay Plaza Community Center Property. Total occupancy inclusive of office square feet is 89.7%. |
| (4) | Weighted Average excludes the Bay Plaza Community Center Property. |
Escrows. At loan origination, the borrowers were required to deposit into escrow (i) approximately $7,110 for replacement reserves, (ii) $1,000,000 for rollover reserves and (iii) $1,941,930 for outstanding tenant improvements and free rent.
Real Estate Taxes – On a monthly basis during the continuance of a Cash Sweep Event Period (as defined below) or at any time taxes are not paid by the borrowers prior to the assessment of any penalty, the borrowers are required to escrow 1/12th of the annual estimated tax payments payable during the next ensuing 12 months.
THE INFORMATION IN THIS STRUCTURAL AND COLLATERAL TERM SHEET IS NOT COMPLETE AND MAY BE AMENDED PRIOR TO THE TIME OF SALE. THIS TERM SHEET IS NOT AN OFFER TO SELL THESE SECURITIES AND IT IS NOT A SOLICITATION OF AN OFFER TO BUY THESE SECURITIES IN ANY JURISDICTION WHERE THE OFFER OR SALE IS NOT PERMITTED. |
| | 35 | |
| Mixed Use – Retail/Office | Loan #1 | Cut-off Date Balance: | | $69,000,000 |
2100 Bartow Avenue Bronx, NY 10475 | Bay Plaza Community Center | Cut-off Date LTV: U/W NCF DSCR: U/W NOI Debt Yield: | | 59.6% 1.54x 10.0% |
Insurance – During the continuance of an event of default or if the Bay Plaza Community Center Property is not insured under an acceptable blanket policy, the borrowers are required to escrow 1/12th of the annual estimated insurance payments on a monthly basis.
Replacement Reserve – The borrowers are required to escrow approximately $7,110 on a monthly basis for replacements and repairs to be made at the Bay Plaza Community Center Property, subject to a cap of approximately $170,644.
Rollover Reserve – The borrowers are required to escrow approximately $47,401 on a monthly basis for ongoing rollover reserves, subject to a cap of $1,000,000.
Lease Sweep Reserve – During a Lease Sweep Period (as defined below), all excess cash flow is deposited into the cash management account.
Lockbox and Cash Management.
The Bay Plaza Community Center Whole Loan is structured with a hard lockbox and springing cash management. The borrowers and property manager are required to direct the tenants to pay rent directly into the lockbox account, and to deposit any rents otherwise received in such account within one business day after receipt. During the continuance of a Cash Sweep Event Period, all funds in the lockbox account are required to be swept each business day to a lender-controlled cash management account. Funds in the cash management account are required to be applied to debt service and the reserves and escrows described above, with any excess funds (i) to be deposited into an excess cash flow reserve account held by the lender as cash collateral for the Bay Plaza Community Center Whole Loan, or if (ii) no Cash Sweep Event Period is continuing, disbursed to the borrowers.
A “Cash Sweep Event Period” means the period commencing upon the occurrence of (i) an event of default, (ii) a bankruptcy action of the borrowers or property manager, (iii) the debt service coverage ratio based on the trailing one calendar quarter is less than 1.15x or (iv) the commencement of a Lease Sweep Period. A Cash Sweep Event Period will end (a) with respect to clause (i) above, if the cure of the event of default has been accepted by the lender, (b) with respect to clause (ii) above, if the property manager is replaced within 60 days, (c) with respect to clause (iii) above, the debt service coverage ratio based on the trailing two calendar quarters is greater than or equal to 1.15x for two consecutive calendar quarters and (d) with respect to clause (iv) above, the Lease Sweep Period has ended; provided, however, that (A) no event of default or other Cash Sweep Event Period is continuing, (B) the borrowers have paid all of the lender’s reasonable expenses incurred in connection with the cure of the Cash Sweep Event Period, including reasonable attorney’s fees and expenses, (C) with respect to clause (ii) above, the borrowers may not cure a Cash Sweep Event Period more than a total of two times in the aggregate during the term of the Bay Plaza Community Center Whole Loan, and (D) in no event may the borrowers cure a Cash Sweep Event Period caused by a bankruptcy action of the borrowers.
A “Lease Sweep Period” (a) commences on the first payment date following the occurrence of (i) with respect to the AMC lease, the Raymour & Flanigan lease and any replacement lease (as described in the Bay Plaza Community Center Whole Loan documents) (each, a “Lease Sweep Lease”), the earlier to occur of (A) six months prior to stated expiration of the AMC lease or (B) six months prior to the stated expiration of the Raymour & Flanigan lease; (ii) the date any tenant under a Lease Sweep Lease discontinues business or gives notice that it intends to discontinue business; or (iii) the occurrence of an insolvency event or proceedings or a similar event with respect to a tenant or its direct or indirect parent company (the “Lease Sweep Tenant Party”) under the Lease Sweep Lease (each, a “Lease Sweep Tenant Party Insolvency Proceeding”); and (b) ends (i) in the case of clause (a)(i) above, upon the earlier of (x) the date that an amount equal to the total rentable square feet of the applicable Lease Sweep Lease multiplied by $25.00 (the “Lease Sweep Deposit Amount”) applicable to the applicable Lease Sweep Lease has been accumulated in the related reserve account (the “Lease Sweep Account”) or the borrowers make a deposit into the Lease Sweep Account in the amount of the Lease Sweep Deposit Amount or deliver a letter of credit in the amount of the Lease Sweep Deposit Amount and (y) the date on which (i) the entirety of the space under the applicable Lease Sweep Lease (the “Lease Sweep Space”) is leased pursuant to one or more qualified leases with a tenant acceptable to the lender, (ii) the entire Lease Sweep Space is tenanted and such tenants have taken occupancy, as more fully described in the Bay Plaza Community Center Whole Loan documents (the “Occupancy Conditions”) and (iii) the applicable tenant thereunder has delivered an estoppel reasonably acceptable to the lender; (ii) in the case of clause (a)(iii) above, either (A) the applicable Lease Sweep Tenant Party Insolvency Proceeding has terminated, and the applicable Lease Sweep Lease has been affirmed, assumed or assigned in a manner reasonably satisfactory to the lender or (B) the applicable Lease Sweep Lease has been assumed and assigned to a third party in a manner reasonably satisfactory to the lender; (iii) in the case of clauses (a)(i), (a)(ii), and (a)(iii) above, the date on which the funds in the Lease Sweep Account collected with respect to the Lease Sweep Lease in question are equal to the Lease Sweep Deposit Amount applicable to such Lease Sweep Space, subject to certain conditions set forth in the Bay Plaza Community Center Whole Loan documents.
Real Estate Substitution. Not permitted.
Property Management. The Bay Plaza Community Center Property is managed by Prestige Properties & Development Co., Inc., an affiliate of the borrowers.
Subordinate and Mezzanine Indebtedness. None.
Partial Release. Not permitted.
Ground Lease. None.
Rights of First Offer / Rights of First Refusal. None.
THE INFORMATION IN THIS STRUCTURAL AND COLLATERAL TERM SHEET IS NOT COMPLETE AND MAY BE AMENDED PRIOR TO THE TIME OF SALE. THIS TERM SHEET IS NOT AN OFFER TO SELL THESE SECURITIES AND IT IS NOT A SOLICITATION OF AN OFFER TO BUY THESE SECURITIES IN ANY JURISDICTION WHERE THE OFFER OR SALE IS NOT PERMITTED. |
| | 36 | |
| Mixed Use – Retail/Office | Loan #1 | Cut-off Date Balance: | | $69,000,000 |
2100 Bartow Avenue Bronx, NY 10475 | Bay Plaza Community Center | Cut-off Date LTV: U/W NCF DSCR: U/W NOI Debt Yield: | | 59.6% 1.54x 10.0% |
Letter of Credit. None.
Permitted Mezzanine Loan. The borrowers have a one-time right to cause a new mezzanine borrower (the “New Mezzanine Borrower”) to incur additional indebtedness in the form of a mezzanine loan (the “New Mezzanine Loan”), subject to the satisfaction of certain conditions set forth in the related Bay Plaza Community Center Whole Loan documents, including, without limitation, the following: (a) the aggregate principal amount of the New Mezzanine Loan may in no event exceed the amount which, after giving effect thereto, yields (x) an aggregate loan-to-value ratio not greater than the loan-to-value ratio on the loan origination date and (y) an aggregate debt service coverage ratio not less than the debt service coverage ratio on the loan origination date; (b) the collateral for the New Mezzanine Loan may include only pledges of the direct or indirect equity interests in each special purpose entity that is the member of a borrower; (c) the lender of the New Mezzanine Loan (the “New Mezzanine Lender”) must be a person approved by the lender under the Bay Plaza Community Center Whole Loan; and (d) the lender of the New Mezzanine Loan must enter into an intercreditor agreement on terms acceptable to such New Mezzanine Lender and the lender under the Bay Plaza Community Center Whole Loan in its sole discretion and obtain a rating agency confirmation with respect to such intercreditor agreement. See “Description of the Mortgage Pool—Additional Indebtedness” in the prospectus for additional information.
Terrorism Insurance. The borrowers are required to obtain and maintain property insurance and business interruption insurance for 18 months plus a 12-month extended period of indemnity. Such insurance is required to cover perils of terrorism and acts of terrorism. See “Risk Factors—Risks Relating to the Mortgage Loans—Terrorism Insurance May Not Be Available for All Mortgaged Properties” in the prospectus.
THE INFORMATION IN THIS STRUCTURAL AND COLLATERAL TERM SHEET IS NOT COMPLETE AND MAY BE AMENDED PRIOR TO THE TIME OF SALE. THIS TERM SHEET IS NOT AN OFFER TO SELL THESE SECURITIES AND IT IS NOT A SOLICITATION OF AN OFFER TO BUY THESE SECURITIES IN ANY JURISDICTION WHERE THE OFFER OR SALE IS NOT PERMITTED. |
| | 37 | |
| Self Storage – Self Storage | Loan #2 | Cut-off Date Balance: | | $69,000,000 |
| Various | Mini Mall Self Storage | Cut-off Date LTV: | | 73.8% |
| Various | | U/W NCF DSCR: | | 1.71x |
| | | U/W NOI Debt Yield: | | 10.5% |
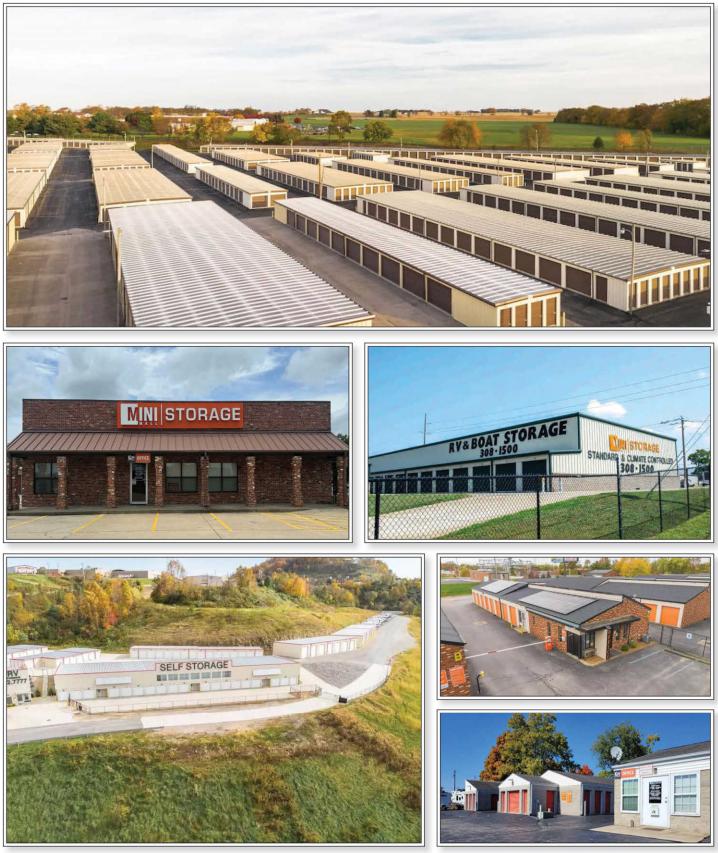
THE INFORMATION IN THIS STRUCTURAL AND COLLATERAL TERM SHEET IS NOT COMPLETE AND MAY BE AMENDED PRIOR TO THE TIME OF SALE. THIS TERM SHEET IS NOT AN OFFER TO SELL THESE SECURITIES AND IT IS NOT A SOLICITATION OF AN OFFER TO BUY THESE SECURITIES IN ANY JURISDICTION WHERE THE OFFER OR SALE IS NOT PERMITTED. |
| | 38 | |
| Self Storage – Self Storage | Loan #2 | Cut-off Date Balance: | | $69,000,000 |
| Various | Mini Mall Self Storage | Cut-off Date LTV: | | 73.8% |
| Various | | U/W NCF DSCR: | | 1.71x |
| | | U/W NOI Debt Yield: | | 10.5% |
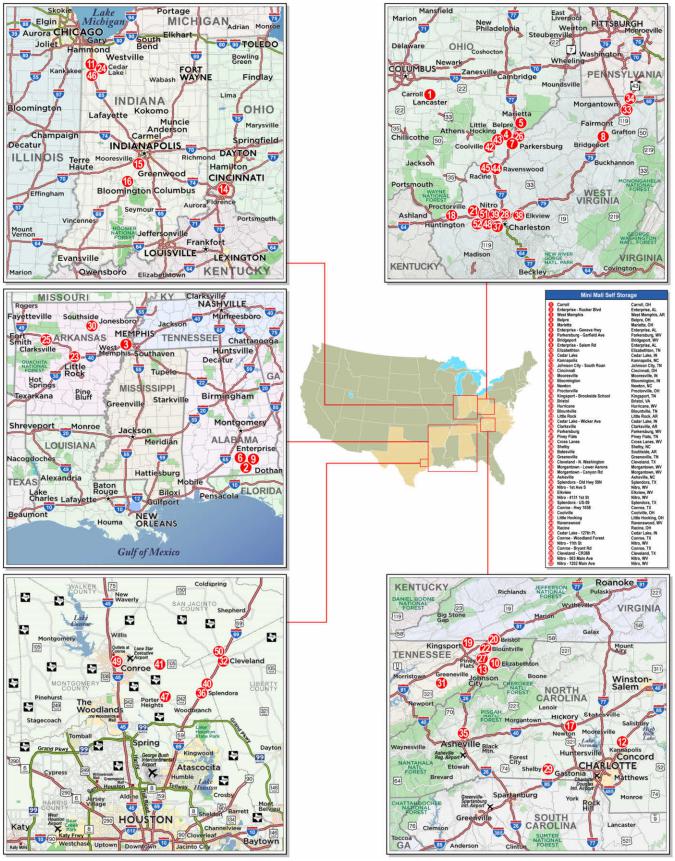
THE INFORMATION IN THIS STRUCTURAL AND COLLATERAL TERM SHEET IS NOT COMPLETE AND MAY BE AMENDED PRIOR TO THE TIME OF SALE. THIS TERM SHEET IS NOT AN OFFER TO SELL THESE SECURITIES AND IT IS NOT A SOLICITATION OF AN OFFER TO BUY THESE SECURITIES IN ANY JURISDICTION WHERE THE OFFER OR SALE IS NOT PERMITTED. |
| | 39 | |
| No. 2 – Mini Mall Self Storage |
| |
| Mortgage Loan Information | | Mortgaged Property Information |
| Mortgage Loan Sellers: | Wells Fargo Bank, National | | Single Asset/Portfolio: | Portfolio |
| | Association, JPMorgan Chase Bank, | | Property Type – Subtype: | Self Storage – Self |
| | Association, Citi Real Estate Funding, | | | Storage |
| | Inc. | | Location: | Various, Various |
Credit Assessment (Fitch/KBRA/Moody’s): | NR/NR/NR | | Size: | 2,460,347 SF |
| Original Principal Balance(1): | $69,000,000 | | Cut-off Date Balance Per SF(1): | $73.16 |
| Cut-off Date Balance(1): | $69,000,000 | | Maturity Date Balance Per SF(1): | $73.16 |
| % of Initial Pool Balance: | 9.6% | | Year Built/Renovated: | Various / Various |
| Loan Purpose: | Refinance | | Title Vesting: | Fee |
| Borrower Sponsor: | Mini Mall U.S. Storage Properties Master LP | | Property Manager: | Mini Mall U.S. Storage Properties Master LP (borrower-related) |
| Guarantor: | Mini Mall U.S. Storage Properties Master LP | | Current Occupancy (As of): | 75.8% (10/7/2024) |
| Mortgage Rate: | 5.9700% | | YE 2023 Occupancy(4): | NAV |
| Note Date: | October 31, 2024 | | YE 2022 Occupancy(4): | NAV |
| Seasoning: | 0 months | | YE 2021 Occupancy(4): | NAV |
| Maturity Date: | November 6, 2029 | | YE 2020 Occupancy(4): | NAV |
| IO Period: | 60 months | | As Portfolio Appraised Value(5): | $244,000,000 |
| Loan Term (Original): | 60 months | | As Portfolio Appraised Value Per SF(5): | $99.17 |
| Amortization Term (Original): | NAP | | As Portfolio Appraisal Valuation Date: | August 10, 2024 |
| Loan Amortization Type: | Interest Only | | | |
| Call Protection(2): | L(24),D(29),O(7) | | | |
| Lockbox Type: | Springing/Springing Cash Management | | | |
| Additional Debt(1): | Yes | | Underwriting and Financial Information |
| Additional Debt Type (Balance)(1): | Pari Passu ($111,000,000) | | TTM NOI (8/31/2024): | $18,244,484 |
| | | | YE 2023 NOI(4): | NAV |
| | | | YE 2022 NOI(4): | NAV |
| | | | U/W Revenues: | $25,498,875 |
| | | | U/W Expenses: | $6,590,351 |
| | | U/W NOI: | $18,908,524 |
| | | | | | U/W NCF: | $18,576,612 |
| Escrows and Reserves(3) | | U/W DSCR based on NOI/NCF(1): | 1.74x / 1.71x |
| | Initial | Monthly | Cap | | U/W Debt Yield based on NOI/NCF(1): | 10.5% / 10.3% |
| Taxes: | $261,988 | $119,946 | NAP | | U/W Debt Yield at Maturity based on NOI/NCF(1): | 10.5% / 10.3% |
| Insurance: | $0 | Springing | NAP | | Cut-off Date LTV Ratio(1)(5): | 73.8% |
| Replacement Reserve: | $0 | $27,659 | NAP | | LTV Ratio at Maturity(1)(5): | 73.8% |
| Deferred Maintenance: | $240,160 | $0 | NAP | | | |
| | | | | | | | |
| Sources and Uses |
| Sources | | | | | Uses | | | |
| Whole Loan Amount | $180,000,000 | | 100.0% | | Loan Payoff | $150,772,564 | | 83.8% |
| | | | | | Return of Equity | 19,688,366 | | 10.9 |
| | | | | | Closing Costs | 9,036,922 | | 5.0 |
| | | | | | Upfront Reserves | 502,148 | | 0.3 |
| Total Sources | $180,000,000 | | 100.0% | | Total Uses | $180,000,000 | | 100.0% |
| | | | | | | | | | |
| (1) | The Mini Mall Self Storage Mortgage Loan (as defined below) is part of the Mini Mall Self Storage Whole Loan (as defined below), which is comprised of eight pari passu promissory notes with an aggregate original principal balance of $180,000,000. The Underwriting and Financial Information presented above are based on the aggregate Cut-off Date principal balance of the Mini Mall Self Storage Whole Loan. |
| (2) | Defeasance of the Mini Mall Self Storage Whole Loan is permitted at any time after the earlier to occur of (a) the end of the two-year period commencing on the closing date of the securitization of the last promissory note representing a portion of the Mini Mall Self Storage Whole Loan to be securitized and (b) December 6, 2027. The assumed defeasance lockout period of 24 payments is based on the closing date of this transaction in November 2024. |
| (3) | See “Escrows” section. |
| (4) | Historical information is not available due to the borrower sponsor purchasing the Mini Mall Self Storage Portfolio in separate transactions between June 2022 and September 2023. |
| (5) | The Appraised Value is based on the “As Portfolio” value, inclusive of a 4.1% portfolio premium. The sum of the individual appraised values is $234,300,000, which equates to a Cut-off Date LTV Ratio and LTV Ratio at Maturity of 76.8%. |
THE INFORMATION IN THIS STRUCTURAL AND COLLATERAL TERM SHEET IS NOT COMPLETE AND MAY BE AMENDED PRIOR TO THE TIME OF SALE. THIS TERM SHEET IS NOT AN OFFER TO SELL THESE SECURITIES AND IT IS NOT A SOLICITATION OF AN OFFER TO BUY THESE SECURITIES IN ANY JURISDICTION WHERE THE OFFER OR SALE IS NOT PERMITTED. |
| | 40 | |
| Self Storage – Self Storage | Loan #2 | Cut-off Date Balance: | | $69,000,000 |
| Various | Mini Mall Self Storage | Cut-off Date LTV: | | 73.8% |
| Various | | U/W NCF DSCR: | | 1.71x |
| | | U/W NOI Debt Yield: | | 10.5% |
The Mortgage Loan. The second largest mortgage loan (the “Mini Mall Self Storage Mortgage Loan”) is part of a whole loan (the “Mini Mall Self Storage Whole Loan”) evidenced by eight pari passu notes with an aggregate outstanding principal balance as of the Cut-off Date of $180,000,000. The Mini Mall Self Storage Whole Loan is secured by a first lien mortgage on the borrowers’ fee interest in a 2,460,347 square foot, self-storage portfolio consisting of 52 properties containing 60 individual assets (each, a “Mini Mall Self Storage Property” and collectively, the “Mini Mall Self Storage Properties” or the “Mini Mall Self Storage Portfolio”) located across nine states. The Mini Mall Self Storage Mortgage Loan is evidenced by the controlling Note A-1-A and the non-controlling Notes A-2-A and A-3-B with an outstanding principal balance as of the Cut-off Date of $69,000,000. The Mini Mall Self Storage Whole Loan was co-originated by Wells Fargo Bank, National Association (“WFB”), JPMorgan Chase Bank, National Association (“JPM”), and Citi Real Estate Funding Inc. (“CREFI”) on October 31, 2024. The relationship between the holders of the Mini Mall Self Storage Whole Loan is governed by a co-lender agreement. The Mini Mall Self Storage Whole Loan is being serviced pursuant to the pooling and servicing agreement for the WFCM 2024-5C2 securitization trust. See “Description of the Mortgage Pool—The Whole Loans—The Serviced Pari Passu Whole Loans,” and “Pooling and Servicing Agreement” in the prospectus.
Whole Loan Note Summary
| Note | Original Balance | Cut-off Date Balance | Note Holder | Controlling Piece |
| A-1-A | $34,500,000 | $34,500,000 | WFCM 2024-5C2 | Yes |
| A-1-B | $52,500,000 | $52,500,000 | WFB | No |
| A-1-C | $3,000,000 | $3,000,000 | WFB | No |
| A-2-A | $17,250,000 | $17,250,000 | WFCM 2024-5C2 | No |
| A-2-B | $27,750,000 | $27,750,000 | CREFI | No |
| A-3-A | $18,750,000 | $18,750,000 | JPM | No |
| A-3-B | $17,250,000 | $17,250,000 | WFCM 2024-5C2 | No |
| A-3-C | $9,000,000 | $9,000,000 | JPM | No |
| Total (Whole Loan) | $180,000,000 | $180,000,000 | | |
The Borrowers and Borrower Sponsor. The borrowers are MMUS OH SPE 1, LLC, MMUS OH SPE 2, LLC, MMUS OH SPE 3, LLC, MMUS OH SPE 4, LLC, MMUS OH SPE 5, LLC, MMUS OH SPE 6, LLC, MMUS OH SPE 7, LLC, MMUS OH SPE 8, LLC, MMUS OH SPE 9, LLC, MMUS OH SPE 10, LLC, MMUS WV SPE 1, LLC, MMUS WV SPE 2, LLC, MMUS WV SPE 3, LLC, MMUS WV SPE 4, LLC, MMUS WV SPE 5, LLC, MMUS WV SPE 6, LLC, MMUS WV SPE 7, LLC, MMUS WV SPE 8, LLC, MMUS WV SPE 9, LLC, OHU3003CI LLC, ALU4407EE LP, ARU3319LK LP, ARU3318WS LP, ARU3320CE LP, INU2905BN LP, INU2906ME LP, INU2907CE LP, NCU4001KS LP, VAU3508BL LP, TXU4801SA LP and WVU3601CS LP, each a Delaware limited liability company or Delaware limited partnership. Each borrower is a single purpose entity having at least two independent directors in its organizational structure. Legal counsel to the borrowers delivered a non-consolidation opinion in connection with the origination of the Mini Mall Storage Portfolio Mortgage Loan.
The borrower sponsor and non-recourse carveout guarantor is Mini Mall U.S. Storage Properties Master LP. Mini Mall U.S. Storage Properties Master LP is a subsidiary of Mini Mall Storage Properties Trust which owns and operates over 210 self storage facilities totaling over eight million square feet across the United States and Canada. Mini Mall Storage Properties Trust focuses on acquiring legacy-run assets and applies institutional-grade technology and strategies to increase profitability. These include 24/7 access, improved security, and dynamic pricing models.
The Properties. The Mini Mall Self Storage Portfolio is comprised of 52 properties containing 60 individual self storage assets totaling 18,338 units and 2,460,347 SF, located across nine states. The Mini Mall Self Storage Portfolio includes 12,707 (69.3% of total units) non-climate-controlled units, 4,406 (24.0%) climate controlled units, 1,016 (5.5%) parking units and 209 (1.1%) other units. The Mini Mall Self Storage Portfolio has a weighted average year built of 1993 and no individual Mini Mall Self Storage Property accounts for more than 8.8% of underwritten net cash flow or 8.0% of units across the Mini Mall Self Storage Portfolio. As of October 2024, the portfolio was 75.8% occupied. The borrower sponsor purchased the Mini Mall Self Storage Portfolio in separate transactions between June 2022 and September 2023 and has invested approximately $11.0 million in capital expenditures.
THE INFORMATION IN THIS STRUCTURAL AND COLLATERAL TERM SHEET IS NOT COMPLETE AND MAY BE AMENDED PRIOR TO THE TIME OF SALE. THIS TERM SHEET IS NOT AN OFFER TO SELL THESE SECURITIES AND IT IS NOT A SOLICITATION OF AN OFFER TO BUY THESE SECURITIES IN ANY JURISDICTION WHERE THE OFFER OR SALE IS NOT PERMITTED. |
| | 41 | |
| Self Storage – Self Storage | Loan #2 | Cut-off Date Balance: | | $69,000,000 |
| Various | Mini Mall Self Storage | Cut-off Date LTV: | | 73.8% |
| Various | | U/W NCF DSCR: | | 1.71x |
| | | U/W NOI Debt Yield: | | 10.5% |
The following table presents certain information relating to the Mini Mall Self Storage Properties:
| Portfolio Summary |
| Property(1) | Address | City, State | Year Built / Renovated | Units | Net Rentable Area (SF)(2) | Occupancy %(2) | Allocated Whole Loan Amount | % of Allocated Whole Loan Amount | Appraised Value | U/W NCF(2) | % of U/W NCF |
| Carroll | 3900 Columbus-
Lancaster Road | Carroll, OH | 1994-2005 / NAP | 1,472 | 219,400 | 77.3% | $16,250,000 | 9.0% | $21,200,000 | $1,640,836 | 8.8% |
Enterprise -
Rucker Blvd | 2801 Rucker
Boulevard | Enterprise, AL | 2005 / 2019 | 1,315 | 186,240 | 81.1% | $14,525,000 | 8.1% | $18,900,000 | $1,454,009 | 7.8% |
| West Memphis | 701 AR-77 | West Memphis, AR | 2004 / 2022 | 892 | 131,220 | 76.9% | $12,980,000 | 7.2% | $16,900,000 | $1,205,117 | 6.5% |
| Belpre | 138 Lee Street, 485
Lee Street and 1924
Washington Boulevard | Belpre, OH | 1989-2015 / NAP | 799 | 136,250 | 75.1% | $7,750,000 | 4.3% | $9,300,000 | $784,584 | 4.2% |
| Marietta | 1306 Pike Street and
104 Ellsworth
Avenue | Marietta, OH | 1980-2019 / NAP | 717 | 107,700 | 74.1% | $7,650,000 | 4.3% | $9,950,000 | $733,296 | 3.9% |
Enterprise -
Geneva Hwy | 1232 Geneva
Highway | Enterprise, AL | 1997 / 2019 | 743 | 142,125 | 75.4% | $6,585,000 | 3.7% | $8,350,000 | $690,506 | 3.7% |
Parkersburg -
Garfield Ave | 2351 Garfield
Avenue | Parkersburg, WV | 1982 / 1987, 1988, 1991, 1996, 2003, 2007 | 743 | 98,750 | 89.9% | $6,500,000 | 3.6% | $7,775,000 | $931,996 | 5.0% |
| Bridgeport | 61 Ocean Mines
Road | Bridgeport, WV | 2019 / 2020, 2023 | 502 | 75,080 | 87.2% | $5,750,000 | 3.2% | $6,875,000 | $754,350 | 4.1% |
Enterprise -
Salem Rd | 4021 Salem Road | Enterprise, AL | 1964, 2016 / NAP | 495 | 74,585 | 85.4% | $5,575,000 | 3.1% | $6,800,000 | $599,627 | 3.2% |
| Elizabethton | 480 TN-91 | Elizabethton, TN | 2019 / 2023 | 614 | 48,550 | 66.0% | $4,500,000 | 2.5% | $7,600,000 | $396,961 | 2.1% |
| Cedar Lake | 10630 and 10706
West 133rd Street | Cedar Lake, IN | 1930-1999 / NAP | 405 | 73,317 | 56.1% | $4,110,000 | 2.3% | $6,850,000 | $292,282 | 1.6% |
| Kannapolis | 2745 North Cannon
Boulevard | Kannapolis, NC | 1987 / 2018 | 357 | 41,375 | 85.0% | $4,030,000 | 2.2% | $5,250,000 | $396,811 | 2.1% |
Johnson City -
South Roan | 2501 South Roan
Street | Johnson City, TN | 2004 / 2009 | 312 | 34,500 | 91.9% | $4,025,000 | 2.2% | $5,000,000 | $427,871 | 2.3% |
| Cincinnati | 1109 Alfred Street | Cincinnati, OH | 1901 / 2001 | 450 | 46,165 | 73.4% | $3,840,000 | 2.1% | $5,000,000 | $308,732 | 1.7% |
| Mooresville | 1242 South Old
State Route 67 | Mooresville, IN | 1985 / 2003 | 348 | 48,260 | 75.4% | $3,690,000 | 2.1% | $4,800,000 | $346,530 | 1.9% |
| Bloomington | 4910 and 4990
North Lakeview
Drive | Bloomington, IN | 2000-2001 / NAP | 317 | 34,325 | 72.9% | $3,535,000 | 2.0% | $4,350,000 | $311,904 | 1.7% |
| Newton | 3005 Nathan Street | Newton, NC | 1983 / NAP | 345 | 42,050 | 69.8% | $3,530,000 | 2.0% | $4,600,000 | $267,139 | 1.4% |
| Proctorville | 700 County Road
411 | Proctorville, OH | 2019-2022 / 2022 | 324 | 47,050 | 84.5% | $3,450,000 | 1.9% | $4,100,000 | $381,771 | 2.1% |
Kingsport -
Brookside School | 149 Brookside
School Lane | Kingsport, TN | 1956 / 2019 | 303 | 29,375 | 75.3% | $3,350,000 | 1.9% | $4,550,000 | $246,385 | 1.3% |
| Bristol | 818 Commonwealth
Avenue | Bristol, VA | 1999 / NAP | 301 | 35,250 | 82.4% | $3,175,000 | 1.8% | $3,775,000 | $367,117 | 2.0% |
| Hurricane | 316 Putnam Village
Drive | Hurricane, WV | 2017 / 2021 | 275 | 31,175 | 92.5% | $3,150,000 | 1.8% | $3,750,000 | $414,845 | 2.2% |
| Blountville | 2851 TN-394 | Blountville, TN | 2013 / NAP | 331 | 30,950 | 73.6% | $3,125,000 | 1.7% | $4,000,000 | $312,166 | 1.7% |
| Little Rock | 19501 Arch Street
Northwest | Little Rock, AR | 1994 / 2022 | 419 | 45,150 | 54.5% | $3,110,000 | 1.7% | $4,050,000 | $243,616 | 1.3% |
Cedar Lake -
Wicker Ave | 13077 West Wicker
Avenue | Cedar Lake, IN | 2018-2022 / NAP | 433 | 65,600 | 50.3% | $3,100,000 | 1.7% | $7,000,000 | $170,329 | 0.9% |
| Clarksville | 677 South Crawford
Street and 1802
Freeway Lane | Clarksville, AR | 2001 / 2011 | 494 | 56,350 | 70.6% | $2,975,000 | 1.7% | $3,750,000 | $310,822 | 1.7% |
| Parkersburg | 112 College Parkway
and 5239 Emerson
Avenue | Parkersburg, WV | 2002 / 2018, 2019 | 343 | 54,525 | 76.5% | $2,925,000 | 1.6% | $3,475,000 | $455,625 | 2.5% |
| Piney Flats | 6460 Bristol
Highway | Piney Flats, TN | 2012 / 2014 | 319 | 28,275 | 77.2% | $2,550,000 | 1.4% | $3,150,000 | $293,967 | 1.6% |
| Cross Lanes | 5290 Big Tyler Road | Cross Lanes, WV | 2014 / NAP | 227 | 26,150 | 89.1% | $2,550,000 | 1.4% | $3,050,000 | $293,322 | 1.6% |
| Shelby | 612 Smith Street
and 516 East Dixon
Boulevard | Shelby, NC | 1978, 1994 / NAP | 380 | 43,250 | 70.6% | $2,500,000 | 1.4% | $3,750,000 | $185,101 | 1.0% |
| Batesville | 1009 Batesville
Boulevard | Southside, AR | 2000 / 2013 | 316 | 35,950 | 75.8% | $2,500,000 | 1.4% | $3,000,000 | $269,848 | 1.5% |
| Greeneville | 1375 West Andrew
Johnson Highway | Greeneville, TN | 2006 / NAP | 185 | 19,350 | 82.2% | $2,300,000 | 1.3% | $2,900,000 | $243,219 | 1.3% |
Cleveland - N.
Washington | 201 North
Washington | Cleveland, TX | 2000 / NAP | 170 | 23,090 | 81.0% | $2,150,000 | 1.2% | $2,700,000 | $211,085 | 1.1% |
Morgantown -
Lower Aarons | 482 Lower Aarons
Creek Road | Morgantown, WV | 1998 / NAP | 229 | 32,200 | 82.8% | $2,150,000 | 1.2% | $2,550,000 | $316,161 | 1.7% |
Morgantown -
Canyon Rd | 855 Canyon Road | Morgantown, WV | 2008 / 2014 | 273 | 34,050 | 80.0% | $2,100,000 | 1.2% | $2,500,000 | $302,862 | 1.6% |
| Asheville | 241 Old Weaverville
Road | Asheville, NC | 2015 / NAP | 95 | 12,080 | 84.4% | $2,000,000 | 1.1% | $2,550,000 | $194,004 | 1.0% |
THE INFORMATION IN THIS STRUCTURAL AND COLLATERAL TERM SHEET IS NOT COMPLETE AND MAY BE AMENDED PRIOR TO THE TIME OF SALE. THIS TERM SHEET IS NOT AN OFFER TO SELL THESE SECURITIES AND IT IS NOT A SOLICITATION OF AN OFFER TO BUY THESE SECURITIES IN ANY JURISDICTION WHERE THE OFFER OR SALE IS NOT PERMITTED. |
| | 42 | |
| Self Storage – Self Storage | Loan #2 | Cut-off Date Balance: | | $69,000,000 |
| Various | Mini Mall Self Storage | Cut-off Date LTV: | | 73.8% |
| Various | | U/W NCF DSCR: | | 1.71x |
| | | U/W NOI Debt Yield: | | 10.5% |
| Portfolio Summary (Continued) |
| Property(1) | Address | City, State | Year Built / Renovated | Units | Net Rentable Area (SF)(2) | Occupancy %(2) | Allocated Whole Loan Amount | % of Allocated Whole Loan Amount | Appraised Value | U/W NCF(2) | % of U/W NCF |
Splendora -
Old Hwy 59N | 14098 Old Highway
59 North | Splendora, TX | 1992 / NAP | 239 | 23,300 | 61.8% | $1,690,000 | 0.9% | $2,200,000 | $171,835 | 0.9% |
Nitro - 1st Ave
S | 901 1st Avenue
South | Nitro, WV | 2008 / 2010 | 154 | 19,250 | 75.6% | $1,575,000 | 0.9% | $1,875,000 | $196,062 | 1.1% |
| Elkview | 5116 and 5149 Elk
River Road | Elkview, WV | 1994, 1999 /
2009 | 247 | 29,150 | 77.9% | $1,500,000 | 0.8% | $1,800,000 | $216,511 | 1.2% |
Nitro - 4131
1st St | 4131 1st Avenue | Nitro, WV | 1982 / 1991,
1999, 2004,
2008 | 192 | 25,775 | 86.5% | $1,450,000 | 0.8% | $1,725,000 | $202,635 | 1.1% |
Splendora -
US-59 | 13952 US-59
Business | Splendora, TX | 2006 / NAP | 154 | 21,400 | 49.3% | $1,200,000 | 0.7% | $1,500,000 | $123,820 | 0.7% |
Conroe - Hwy
105E | 16842 TX-105 | Conroe, TX | 2001 / 2013 | 118 | 16,200 | 56.8% | $1,150,000 | 0.6% | $1,500,000 | $86,447 | 0.5% |
| Coolville | 792 State Route 7 | Coolville, OH | 2014 / NAP | 135 | 19,800 | 79.0% | $1,075,000 | 0.6% | $1,300,000 | $135,738 | 0.7% |
| Little Hocking | 21 Clifton Road | Little Hocking, OH | 2009 / NAP | 119 | 19,910 | 78.9% | $1,000,000 | 0.6% | $1,200,000 | $124,125 | 0.7% |
| Ravenswood | 514 Washington
Street | Ravenswood, WV | 2021 / NAP | 99 | 11,925 | 85.5% | $970,000 | 0.5% | $1,150,000 | $131,557 | 0.7% |
| Racine | 52691 OH-124 | Racine, OH | 1999 / NAP | 108 | 19,650 | 58.9% | $920,000 | 0.5% | $1,200,000 | $88,051 | 0.5% |
Cedar Lake -
127th Pl. | 11220 and 11221
127th Place | Cedar Lake, IN | 2004 / NAP | 90 | 12,600 | 60.7% | $810,000 | 0.5% | $1,350,000 | $52,466 | 0.3% |
Conroe -
Woodland
Forest | 18401 Woodland
Forest Drive | Conroe, TX | 2001 / NAP | 101 | 10,200 | 62.3% | $650,000 | 0.4% | $850,000 | $64,926 | 0.3% |
| Nitro - 11th St | 1101 11th Street | Nitro, WV | 1994 / NAP | 105 | 9,950 | 70.9% | $590,000 | 0.3% | $700,000 | $85,838 | 0.5% |
Conroe -
Bryant Rd | 419 Bryant Road | Conroe, TX | 1995 / NAP | 78 | 9,200 | 58.7% | $430,000 | 0.2% | $600,000 | $40,475 | 0.2% |
Cleveland -
CR388 | 288 County Road
388 | Cleveland, TX | 1970 / 1983 | 65 | 10,800 | 65.7% | $375,000 | 0.2% | $500,000 | $32,166 | 0.2% |
Nitro - 503
Main Ave | 503 Main Avenue | Nitro, WV | 1996 / NAP | 51 | 6,175 | 82.6% | $335,000 | 0.2% | $400,000 | $36,409 | 0.2% |
Nitro - 1202
Main Ave | 1202 Main Avenue | Nitro, WV | 1956 / 2001 | 40 | 5,350 | 72.0% | $295,000 | 0.2% | $350,000 | $32,754 | 0.2% |
| Total | | | | 18,338 | 2,460,347 | 75.8% | $180,000,000 | 100.0% | $244,000,000(3) | $18,576,612 | 100.0% |
| (1) | Certain properties listed above may be comprised of multiple addresses or locations, but are treated as a single property for appraisal and loan underwriting purposes. |
| (2) | Based on the underwritten rent roll as of October 7, 2024. |
| (3) | Represents the “As Portfolio” value, inclusive of a 4.1% portfolio premium. The sum of the individual appraised values is $234,300,000, which equates to a Cut-off Date LTV Ratio and LTV Ratio at Maturity of 76.8%.
|
THE INFORMATION IN THIS STRUCTURAL AND COLLATERAL TERM SHEET IS NOT COMPLETE AND MAY BE AMENDED PRIOR TO THE TIME OF SALE. THIS TERM SHEET IS NOT AN OFFER TO SELL THESE SECURITIES AND IT IS NOT A SOLICITATION OF AN OFFER TO BUY THESE SECURITIES IN ANY JURISDICTION WHERE THE OFFER OR SALE IS NOT PERMITTED. |
| | 43 | |
| Self Storage – Self Storage | Loan #2 | Cut-off Date Balance: | | $69,000,000 |
| Various | Mini Mall Self Storage | Cut-off Date LTV: | | 73.8% |
| Various | | U/W NCF DSCR: | | 1.71x |
| | | U/W NOI Debt Yield: | | 10.5% |
The following table presents information with respect to the unit mix of the Mini Mall Self Storage Properties:
| Unit Mix(1) |
| Unit | Net Rentable Area | % of Net Rental Area | # of Units | Current Occupancy(2) | U/W Rent Per Unit |
| Non-Climate Controlled | 1,800,755 | 73.2% | 12,707 | 76.0% | $1,357 |
| Climate Controlled | 501,240 | 20.4% | 4,406 | 75.6% | $1,686 |
| Parking | 98,215 | 4.0% | 1,016 | 83.9% | $1,050 |
| Other | 60,137 | 2.4% | 209 | 60.6% | $2,835 |
| Total/Weighted Average | 2,460,347 | 100% | 18,338 | 75.8% | $1,439 |
| (1) | Based on the underwritten rent roll as of October 7, 2024. |
| (2) | Includes containers, apartment, billboard, office, retail, and car wash. |
The following table presents historical occupancy percentages at the Mini Mall Self Storage Properties:
Historical Occupancy
2022(1) | 2023(1) | 10/7/2024(2) |
| NAV | NAV | 75.8% |
| (1) | Historical occupancy is not available because the borrower sponsor purchased the Mini Mall Self Storage Portfolio in separate transactions between June 2022 and September 2023. |
| (2) | Based on the underwritten rent roll as of October 7, 2024. |
Operating History and Underwritten Net Cash Flow. The following table presents certain information relating to the historical operating performance and underwritten net cash flow at the Mini Mall Self Storage Properties:
Cash Flow Analysis
| | TTM
8/31/2024(1) | U/W | %(2) | U/W $
per SF |
| Base Rent | $19,063,831 | $19,092,667 | 60.0% | $7.76 |
| Grossed Up Vacant Space | 0 | 6,341,118 | 19.9 | 2.58 |
| Gross Potential Rent | $19,063,831 | $25,433,785 | 79.9% | $10.34 |
| Other Income(3) | 5,474,113 | 6,406,208 | 20.1 | 2.60 |
| Net Rental Income | $24,537,945 | $31,839,993 | 100.0% | $12.94 |
| (Vacancy) | 0 | (6,341,118) | (24.9)(4) | (2.58) |
| Effective Gross Income | $24,537,945 | $25,498,875 | 80.1% | $10.36 |
| | | | | |
| Real Estate Taxes | $1,328,884 | $1,383,945 | 5.4% | $0.56 |
| Insurance | 1,226,111 | 1,257,953 | 4.9 | 0.51 |
| Management Fee | 981,518 | 1,019,955 | 4.0 | 0.41 |
| Other Expenses | 2,756,949 | 2,928,498 | 11.5 | 1.19 |
| Total Operating Expenses | $6,293,461 | $6,590,351 | 25.8% | $2.68 |
| | | | | |
| Net Operating Income | $18,244,484 | $18,908,524 | 74.2% | $7.69 |
| Replacement Reserves | 0 | 331,912 | 1.3 | 0.13 |
| Net Cash Flow | $18,244,484 | $18,576,612 | 72.9% | $7.55 |
| | | | | |
| NOI DSCR(5) | 1.67x | 1.74x | | |
| NCF DSCR(5) | 1.67x | 1.71x | | |
| NOI Debt Yield(5) | 10.1% | 10.5% | | |
| NCF Debt Yield(5) | 10.1% | 10.3% | | |
| (1) | Represents the Trailing 11 Months for 18 of the properties where a TTM was not available due to the borrowers acquiring the assets in August and September 2023. |
| (2) | Represents (i) percent of Net Rental Income for all revenue fields, (ii) percent of Gross Potential Rent for Vacancy and (iii) percent of Effective Gross Income for all other fields. |
| (3) | Other Income includes late fees, NSF fees, tenant insurance, miscellaneous income storage and administrative fees. |
| (4) | The underwritten vacancy is 24.9%. The Mini Mall Self Storage Portfolio was 75.8% occupied as of October 7, 2024. |
| (5) | Debt service coverage ratios and debt yields are based on the Mini Mall Self Storage Whole Loan. |
THE INFORMATION IN THIS STRUCTURAL AND COLLATERAL TERM SHEET IS NOT COMPLETE AND MAY BE AMENDED PRIOR TO THE TIME OF SALE. THIS TERM SHEET IS NOT AN OFFER TO SELL THESE SECURITIES AND IT IS NOT A SOLICITATION OF AN OFFER TO BUY THESE SECURITIES IN ANY JURISDICTION WHERE THE OFFER OR SALE IS NOT PERMITTED. |
| | 44 | |
| Self Storage – Self Storage | Loan #2 | Cut-off Date Balance: | | $69,000,000 |
| Various | Mini Mall Self Storage | Cut-off Date LTV: | | 73.8% |
| Various | | U/W NCF DSCR: | | 1.71x |
| | | U/W NOI Debt Yield: | | 10.5% |
Appraisal. According to the appraisal, the Mini Mall Storage Portfolio had an “As Portfolio” appraised value of $244,000,000 as of August 10, 2024, which is inclusive of an approximately 4.1% portfolio premium. Additionally, the appraisal appraised the Mini Mall Storage Portfolio Properties as of various dates in August 2024, which produced an aggregate “as is” appraised value of $234,300,000.
Environmental Matters. According to the Phase I environmental site assessment with various dates in August 2024, there was no evidence of any recognized environmental conditions at any of the Mini Mall Self Storage Properties.
The Market. The Mini Mall Storage Portfolio Properties are located across nine states: West Virginia (14 properties, 23.5% of U/W NCF), Ohio (8 properties, 22.6% of U/W NCF), Alabama (3 properties, 14.8% of U/W NCF), Arkansas (4 properties, 10.9% of U/W NCF), Tennessee (6 properties, 10.3% of U/W NCF), Indiana (5 properties, 6.3% of U/W NCF), North Carolina (4 properties, 5.6% of U/W NCF), Texas (7 properties, 3.9% of U/W NCF), and Virginia (1 property, 2.0% of U/W NCF).
The following table presents a geographic summary related to the Mini Mall Self Storage Properties:
| State | Property count | # of Units | SF | Allocated Whole
Loan Amount | % of ALA | | U/W NCF |
| West Virginia | 14 | | 3,480 | | 459,505 | $31,840,000 | 17.7% | | $4,370,927 |
| Ohio | 8 | | 4,124 | | 615,925 | $41,935,000 | 23.3% | | $4,197,133 |
| Alabama | 3 | | 2,553 | | 402,950 | $26,685,000 | 14.8% | | $2,744,143 |
| Arkansas | 4 | | 2,121 | | 268,670 | $21,565,000 | 12.0% | | $2,029,403 |
| Tennessee | 6 | | 2,064 | | 191,000 | $19,850,000 | 11.0% | | $1,920,569 |
| Indiana | 5 | | 1,593 | | 234,102 | $15,245,000 | 8.5% | | $1,173,511 |
| North Carolina | 4 | | 1177 | | 138,755 | $12,060,000 | 6.7% | | $1,043,054 |
| Texas | 7 | | 925 | | 114,190 | $7,645,000 | 4.2% | | $730,754 |
| Virginia | 1 | | 301 | | 35,250 | $3,175,000 | 1.8% | | $367,117 |
| Total | 52 | | 18,338 | | 2,460,347 | $180,000,000 | 100.0% | | $18,576,612 |
Escrows.
Taxes – The Mini Mall Self Storage Whole Loan documents require an upfront reserve of $261,988 for real estate taxes plus ongoing monthly reserves in an amount equal to 1/12 of the taxes that the lender estimates will be payable during the next twelve months, initially $119,946.
Insurance – The Mini Mall Self Storage Whole Loan documents require ongoing monthly reserves in an amount equal to 1/12 of the insurance premiums that the lender estimates will be payable during the next twelve months. Ongoing monthly reserves for insurance are not required as long as (i) no event of default under the Mini Mall Self Storage Mortgage Loan documents has occurred and is continuing; (ii) the Mini Mall Self Storage Properties are part of a blanket or umbrella policy approved by the lender; (iii) the borrowers provide the lender with evidence of renewal of insurance policies; and (iv) the borrowers provide the lender with paid receipts for insurance premiums by no later than 10 business days prior to the policy expiration dates.
Replacement Reserve – The Mini Mall Self Storage Whole Loan documents require ongoing monthly reserves in an amount equal to $27,659 for replacements.
Deferred Maintenance Reserve – The Mini Mall Self Storage Whole Loan documents require an upfront reserve of $240,160 for immediate repairs.
Lockbox and Cash Management. Upon the occurrence of a Cash Trap Event Period (as defined below) the Mini Mall Self Storage borrowers are required to establish a lender-controlled lockbox account and deposit all rents and direct all credit card companies to pay all amounts due directly into such lockbox account. During the continuance of a Cash Trap Event Period, all funds in the lockbox account are required to be swept into the cash management account controlled by the lender and disbursed on each payment date in accordance with the Mini Mall Self Storage Whole Loan documents and all excess funds are required to be swept to an excess cash flow subaccount controlled by the lender.
A “Cash Trap Event Period” will commence upon the earlier of the following:
| (i) | the occurrence and continuance of an event of default under the Mini Mall Self Storage Whole Loan documents; |
| (ii) | the net cash flow debt yield (“NCF DY”) falling below 8.0%; and |
| (iii) | for any individual property having legal non-conforming zoning status where a casualty occurs and full rebuild-related approvals are not issued within an application period (90 days following the casualty, subject to a 60-day lender-approved extension for delays beyond the borrowers’ control), the Mini Mall Storage borrowers’ failure to prepay the Mini Mall Self Storage Whole Loan in an amount equal to the allocated loan amount for such property, less any net proceeds received by the lender (the “LNC Casualty Prepayment Amount”). |
THE INFORMATION IN THIS STRUCTURAL AND COLLATERAL TERM SHEET IS NOT COMPLETE AND MAY BE AMENDED PRIOR TO THE TIME OF SALE. THIS TERM SHEET IS NOT AN OFFER TO SELL THESE SECURITIES AND IT IS NOT A SOLICITATION OF AN OFFER TO BUY THESE SECURITIES IN ANY JURISDICTION WHERE THE OFFER OR SALE IS NOT PERMITTED. |
| | 45 | |
| Self Storage – Self Storage | Loan #2 | Cut-off Date Balance: | | $69,000,000 |
| Various | Mini Mall Self Storage | Cut-off Date LTV: | | 73.8% |
| Various | | U/W NCF DSCR: | | 1.71x |
| | | U/W NOI Debt Yield: | | 10.5% |
A Cash Trap Event Period will end upon the occurrence of the following:
| ● | with regard to clause (i) above, the cure of such event of default; |
| ● | with regard to clause (ii) above, the NCF DY is equal to or greater than 8.5% for 2 consecutive calendar quarters; or |
| ● | with regard to clause (iii) above, the earlier of (A) Mini Mall Self Storage Borrowers pay the LNC Casualty Prepayment Amount and (B) the amount of funds in the excess cash flow subaccount equalling the LNC Casualty Prepayment Amount. |
Property Management. The Mini Mall Self Storage Properties are managed by Mini Mall U.S. Storage Properties Master LP, an affiliate of the borrowers.
Release of Collateral (Release Parcels/Rights). Provided no event of default is ongoing, the Mini Mall Self Storage borrowers have the right, at any time after the lockout period and prior to the open period start date (May 6, 2029), to obtain the release of any of the Mini Mall Self Storage Properties from the lien of the Mini Mall Self Storage Whole Loan, provided that certain conditions are satisfied, including, but not limited to, the following:
| (i) | partial defeasance in an amount equal to the greater of (a) 130.0% of the allocated loan amount for the property being released or (b) 100.0% of net sale proceeds; |
| (ii) | the net cash flow debt service coverage ratio (“NCF DSCR”) immediately following the release being equal to or greater than the greater of (a) 1.71x and (b) the NCF DSCR ratio immediately prior to the release; |
| (iii) | the NCF DY immediately following the release being equal to or greater than the greater of (a) 10.32% and (b) the NCF DY immediately prior to the release; |
| (iv) | compliance with all applicable REMIC requirements; and |
| (v) | rating agency confirmation that such release will not result in a downgrade, withdrawal or qualification of the respective ratings assigned to the WFCM 2024-5C2 certificates. |
Real Estate Substitution. Not permitted.
Subordinate and Mezzanine Indebtedness. None.
Future Mezzanine or Subordinate Indebtedness Permitted. Not permitted.
Ground Lease. None.
Letter of Credit. None.
Terrorism Insurance. The Mini Mall Self Storage Whole Loan documents require that the “all risk” insurance policy required to be maintained by the borrowers, in an amount equal to the full replacement cost of the Mini Mall Self Storage Properties, contain no exclusion for damage or destruction caused by acts of terrorism, as well as business interruption insurance covering a period of restoration of 18 months and a 6-month extended period of indemnity.
THE INFORMATION IN THIS STRUCTURAL AND COLLATERAL TERM SHEET IS NOT COMPLETE AND MAY BE AMENDED PRIOR TO THE TIME OF SALE. THIS TERM SHEET IS NOT AN OFFER TO SELL THESE SECURITIES AND IT IS NOT A SOLICITATION OF AN OFFER TO BUY THESE SECURITIES IN ANY JURISDICTION WHERE THE OFFER OR SALE IS NOT PERMITTED. |
| | 46 | |
| Retail – Anchored | Loan #3 | Cut-off Date Balance: | | $61,500,000 |
3648 North Freeway Boulevard Sacramento, CA 95834 | Sacramento Gateway | Cut-off Date LTV: U/W NCF DSCR: U/W NOI Debt Yield: | | 66.8% 1.31x 10.3% |

THE INFORMATION IN THIS STRUCTURAL AND COLLATERAL TERM SHEET IS NOT COMPLETE AND MAY BE AMENDED PRIOR TO THE TIME OF SALE. THIS TERM SHEET IS NOT AN OFFER TO SELL THESE SECURITIES AND IT IS NOT A SOLICITATION OF AN OFFER TO BUY THESE SECURITIES IN ANY JURISDICTION WHERE THE OFFER OR SALE IS NOT PERMITTED. |
| | 47 | |
| Retail – Anchored | Loan #3 | Cut-off Date Balance: | | $61,500,000 |
3648 North Freeway Boulevard Sacramento, CA 95834 | Sacramento Gateway | Cut-off Date LTV: U/W NCF DSCR: U/W NOI Debt Yield: | | 66.8% 1.31x 10.3% |
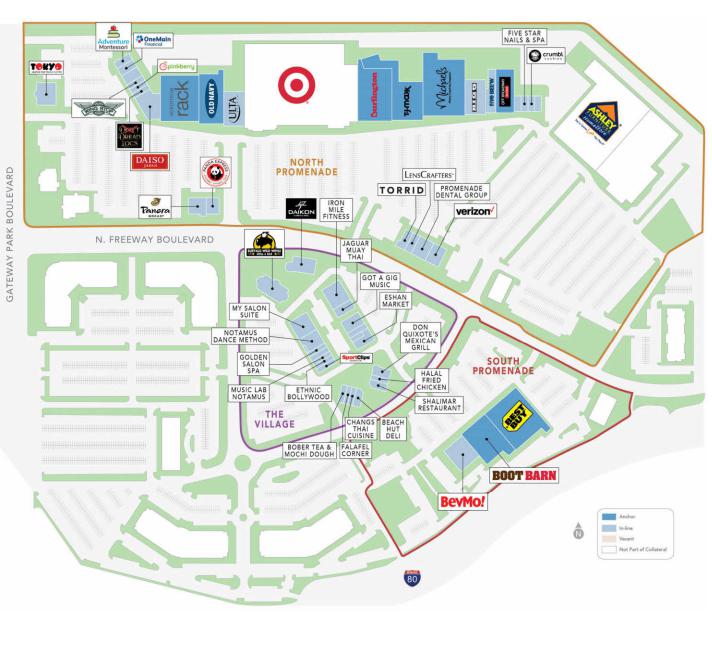
THE INFORMATION IN THIS STRUCTURAL AND COLLATERAL TERM SHEET IS NOT COMPLETE AND MAY BE AMENDED PRIOR TO THE TIME OF SALE. THIS TERM SHEET IS NOT AN OFFER TO SELL THESE SECURITIES AND IT IS NOT A SOLICITATION OF AN OFFER TO BUY THESE SECURITIES IN ANY JURISDICTION WHERE THE OFFER OR SALE IS NOT PERMITTED. |
| | 48 | |
| Retail – Anchored | Loan #3 | Cut-off Date Balance: | | $61,500,000 |
3648 North Freeway Boulevard Sacramento, CA 95834 | Sacramento Gateway | Cut-off Date LTV: U/W NCF DSCR: U/W NOI Debt Yield: | | 66.8% 1.31x 10.3% |

THE INFORMATION IN THIS STRUCTURAL AND COLLATERAL TERM SHEET IS NOT COMPLETE AND MAY BE AMENDED PRIOR TO THE TIME OF SALE. THIS TERM SHEET IS NOT AN OFFER TO SELL THESE SECURITIES AND IT IS NOT A SOLICITATION OF AN OFFER TO BUY THESE SECURITIES IN ANY JURISDICTION WHERE THE OFFER OR SALE IS NOT PERMITTED. |
| | 49 | |
| No. 3 – Sacramento Gateway |
| |
| Mortgage Loan Information | | Mortgaged Property Information |
| Mortgage Loan Seller: | Wells Fargo Bank, National Association | | Single Asset/Portfolio: | Single Asset |
Credit Assessment (Fitch/KBRA/Moody’s): | NR/NR/NR | | Property Type – Subtype: | Retail – Anchored |
| Original Principal Balance: | $61,500,000 | | Location: | Sacramento, CA |
| Cut-off Date Balance: | $61,500,000 | | Size: | 347,560 SF |
| % of Initial Pool Balance: | 8.5% | | Cut-off Date Balance Per SF: | $176.95 |
| Loan Purpose: | Refinance | | Maturity Date Balance Per SF: | $173.38 |
| Borrower Sponsors: | Fairbourne, Harbert Fund and Harbert U.S. Real Estate Funds VI Feeder L.P. | | Year Built/Renovated: | 2006/NAP |
| Guarantor: | Fairbourne Properties, LLC | | Title Vesting: | Fee |
| Mortgage Rate: | 6.4560% | | Property Manager: | Fairbourne Properties, LLC (borrower-related) |
| Note Date: | October 10, 2024 | | Current Occupancy (As of): | 95.7% (7/31/2024) |
| Seasoning: | 1 month | | YE 2023 Occupancy: | 79.7% |
| Maturity Date: | October 11, 2029 | | YE 2022 Occupancy: | 89.8% |
| IO Period: | 36 months | | YE 2021 Occupancy: | 88.6% |
| Loan Term (Original): | 60 months | | YE 2020 Occupancy: | 86.6% |
| Amortization Term (Original): | 360 months | | As-Is Appraised Value: | $92,000,000 |
| Loan Amortization Type: | Interest Only, Amortizing Balloon | | As-Is Appraised Value Per SF: | $264.70 |
| Call Protection: | L(25),D(28),O(7) | | As-Is Appraisal Valuation Date: | September 6, 2024 |
| | | | | |
| Lockbox Type: | Hard / Springing Cash Management | | Underwriting and Financial Information |
| Additional Debt: | None | | TTM NOI (7/31/2024)(2): | $5,283,522 |
| Additional Debt Type (Balance): | NAP | | YE 2023 NOI(2): | $4,422,984 |
| | | | YE 2022 NOI(2): | $4,547,374 |
| | | | YE 2021 NOI(2): | $4,230,610 |
| | | | U/W Revenues: | $9,875,456 |
| | | | U/W Expenses: | $3,525,062 |
| Escrows and Reserves(1) | | U/W NOI(2): | $6,350,394 |
| | Initial | Monthly | Cap | | U/W NCF: | $6,082,773 |
| Taxes: | $249,697 | $83,233 | NAP | | U/W DSCR based on NOI/NCF: | 1.37x / 1.31x |
| Insurance: | $0 | Springing | NAP | | U/W Debt Yield based on NOI/NCF: | 10.3% / 9.9% |
| Replacement Reserves: | $0 | $7,820 | $187,682 | | U/W Debt Yield at Maturity based on NOI/NCF: | 10.5% / 10.1% |
| TI/LC Reserve: | $0 | $36,204 | $868,900 | | Cut-off Date LTV Ratio: | 66.8% |
| Existing TI/LC Reserve: | $61,930 | $0 | NAP | | LTV Ratio at Maturity: | 65.5% |
| Immediate Repairs: | $16,800 | $0 | NAP | | | |
| | | | | | | |
| | | | | | | | |
| Sources and Uses |
| Sources | | | | | Uses | | | |
| Original Mortgage Loan Amount | $61,500,000 | | 100.0% | | Primary Loan Payoff | $37,642,823 | | 61.2% |
| | | | | | Closing Costs | 789,303 | | 1.3% |
| | | | | | Upfront Reserves | 328,427 | | 0.5% |
| | | | | | Return of Equity | 22,739,447 | | 37.0% |
| Total Sources | $61,500,000 | | 100.0% | | Total Uses | $61,500,000 | | 100.0% |
| (1) | See “Escrows” below for further discussion of reserve requirements. |
| (2) | The increase in NOI from YE 2021 to U/W is due to Barnes & Noble and Bed Bath & Beyond vacating the property and those spaces being backfilled by Nordstrom Rack and Burlington at higher rents (see “Operating History and Underwritten Net Cash Flow”). |
The Mortgage Loan. The third largest mortgage loan (the “Sacramento Gateway Mortgage Loan”) is evidenced by the first priority fee interest encumbering a 347,560 square foot anchored retail center located in Sacramento, CA (the “Sacramento Gateway Property”).
The Borrowers and Borrower Sponsors. The borrowers are FHS Promenade, LLC and FHS Village, LLC a Delaware limited liability company and single purpose entity with one independent director. Legal counsel to the borrower delivered a non-consolidation opinion in connection with the origination of the Sacramento Gateway Mortgage Loan. The borrower sponsors are Fairbourne, Harbert Fund and Harbert U.S. Real Estate Funds VI Feeder L.P. and the nonrecourse carveout guarantor is Fairbourne Properties, LLC.
The Property. The Sacramento Gateway Property consists of an anchored retail center totaling 347,560 square feet located in Sacramento, California. Built in 2006, the property is situated on a 42.0-acre site. The Sacramento Gateway Property includes twelve buildings and a total of 1,538 parking spaces, which results in a parking ratio of 4.43 spaces per 1,000 square feet. The Sacramento
THE INFORMATION IN THIS STRUCTURAL AND COLLATERAL TERM SHEET IS NOT COMPLETE AND MAY BE AMENDED PRIOR TO THE TIME OF SALE. THIS TERM SHEET IS NOT AN OFFER TO SELL THESE SECURITIES AND IT IS NOT A SOLICITATION OF AN OFFER TO BUY THESE SECURITIES IN ANY JURISDICTION WHERE THE OFFER OR SALE IS NOT PERMITTED. |
| | 50 | |
| Retail – Anchored | Loan #3 | Cut-off Date Balance: | | $61,500,000 |
3648 North Freeway Boulevard Sacramento, CA 95834 | Sacramento Gateway | Cut-off Date LTV: U/W NCF DSCR: U/W NOI Debt Yield: | | 66.8% 1.31x 10.3% |
Gateway Property is anchored by a Best Buy, Burlington, Nordstrom Rack, TJ Maxx and Michaels and is shadow anchored by a Target. As of July 31, 2024, the Sacramento Gateway Property was 95.7% leased to 53 tenants.
Major Tenants.
Largest Tenant by U/W Base Rent: Michaels (23,454 square feet; 6.7% of net rentable area; 7.1% of underwritten base rent; 5/31/2029 lease expiration) – Michaels is an arts and crafts retailer in North America, operating approximately 1,300 stores in the U.S. and Canada. Along with its retail outlets, the company owns various brands that collectively offer arts, crafts, framing, floral, home decor, and seasonal merchandise to hobbyists and do-it-yourself home decorators. Michaels has been a tenant since 2019 and has a lease expiration of May 31, 2029. Michaels has four, five-year renewal options remaining and no termination options.
2nd Largest Tenant by U/W Base Rent: Burlington (28,007 square feet; 8.1% of net rentable area; 7.1% of underwritten base rent; 2/28/2035 lease expiration) – Burlington is an American national off-price department store retailer, and a division of Burlington Coat Factory Warehouse Corporation. Burlington operates approximately 1,000 stores in 45 states, Washington, D.C. and Puerto Rico. Burlington has been a tenant since 2024 and has a lease expiration of February 28, 2035. Burlington has four, five-year renewal options remaining and no termination options.
3rd Largest Tenant by U/W Base Rent: Nordstrom Rack (26,000 square feet; 7.5% of net rentable area; 7.1% of underwritten base rent; 10/31/2033 lease expiration) – Nordstrom Rack is an American off-price department store chain. Nordstrom operates 348 stores in 41 U.S. states. Nordstrom Rack has been a tenant since 2023 and has a lease expiration of October 31, 2033. Nordstrom Rack has four, five-year renewal options remaining and no termination options.
The following table presents certain information relating to the tenancy at the Sacramento Gateway Property:
Major Tenants
| Tenant Name | Credit Rating (Fitch/ Moody’s/
S&P) | Tenant NRSF | % of
NRSF | Annual U/W Base Rent PSF(1) | Annual
U/W Base Rent(1) | % of Total Annual U/W Base Rent | Lease
Expiration
Date | Ext. Options | Term. Option (Y/N) |
| Major Tenants | | | | | | | | |
| Michaels | NR/Caa2/B- | 23,454 | 6.7% | $20.35 | $477,289 | 7.1% | 05/31/2029 | 4, 5-year | N |
| Burlington | NR/NR/BB+ | 28,007 | 8.1% | $17.00 | $476,119 | 7.1% | 02/28/2035 | 4, 5-year | N |
| Nordstrom Rack | BB/Ba2/BB+ | 26,000 | 7.5% | $18.30 | $475,800 | 7.1% | 10/31/2033 | 4, 5-year | N |
| Old Navy | NR/B1/BB | 18,800 | 5.4% | $22.62 | $425,256 | 6.4% | 03/31/2026 | N | N |
| Best Buy | NR/A3/BBB+ | 30,211 | 8.7% | $13.00 | $392,743 | 5.9% | 03/31/2027 | 2, 5-year | N |
| TJ Maxx | NR/A2/A | 21,000 | 6.0% | $15.50 | $325,500 | 4.9% | 11/30/2028 | 3, 5-year | N |
| | 147,472 | 42.4% | $17.45 | $2,572,707 | 38.5% | | | |
| | | | | | | | | |
| Non-Major Tenants | 185,196 | 53.3% | $22.19 | $4,109,739 | 61.5% | | | |
| | | | | | | | | |
| Occupied Collateral Total | 332,668 | 95.7% | $20.09 | $6,682,446 | 100.0% | | | |
| | | | | | | | | |
| Vacant Space | 14,892 | 4.3% | | | | | | |
| | | | | | | | | |
| Collateral Total | 347,560 | 100.0% | | | | | | |
| | | | | | | | | | |
| (1) | Annual U/W Base Rent PSF and Annual U/W Base Rent include contractual rent steps through November 2025. |
THE INFORMATION IN THIS STRUCTURAL AND COLLATERAL TERM SHEET IS NOT COMPLETE AND MAY BE AMENDED PRIOR TO THE TIME OF SALE. THIS TERM SHEET IS NOT AN OFFER TO SELL THESE SECURITIES AND IT IS NOT A SOLICITATION OF AN OFFER TO BUY THESE SECURITIES IN ANY JURISDICTION WHERE THE OFFER OR SALE IS NOT PERMITTED. |
| | 51 | |
| Retail – Anchored | Loan #3 | Cut-off Date Balance: | | $61,500,000 |
3648 North Freeway Boulevard Sacramento, CA 95834 | Sacramento Gateway | Cut-off Date LTV: U/W NCF DSCR: U/W NOI Debt Yield: | | 66.8% 1.31x 10.3% |
The following table presents a summary of sales and occupancy costs for certain tenants at the Sacramento Gateway Property:
Sales and Occupancy Cost Summary
| | 2021 Sales (PSF) | 2022 Sales (PSF) | 2023 Sales (PSF) | TTM July 2024 Sales (PSF) | TTM July 2024 Occupancy Cost(1) |
| Michaels | NAV | NAV | NAV | NAV | NAV |
| Burlington | NAV | NAV | NAV | NAV | NAV |
| Nordstrom Rack | NAV | NAV | NAV | NAV | NAV |
| Old Navy | $275 | $213 | $212 | $213 | 13.6% |
| Best Buy | NAV | NAV | NAV | NAV | NAV |
| TJ Maxx | NAV | NAV | NAV | NAV | NAV |
| Non-Major Tenants(2) | $345 | $382 | $375 | $437 | 7.4% |
| (1) | Occupancy cost was calculated using the tenant’s Annual U/W Base Rent plus reimbursements divided by the TTM July 2024 sales. |
| (2) | 30 non-major tenants totalling 111,574 square feet (32.1% of NRSF) reported sales during the TTM July 2024 period. |
The following table presents certain information relating to the lease rollover schedule at the Sacramento Gateway Property:
Lease Expiration Schedule(1)
Year Ending
December 31, | No. of Leases Expiring | Expiring NRSF | % of Total NRSF | Cumulative Expiring NRSF | Cumulative % of Total NRSF | Annual
U/W
Base Rent | % of Total Annual U/W Base Rent | Annual
U/W
Base Rent
PSF(2) |
| 2024 | 0 | 0 | 0.0% | 0 | 0.0% | $0 | 0.0% | $0.00 |
| 2025 | 6 | 15,847 | 4.6% | 15,847 | 4.6% | $398,033 | 6.0% | $25.12 |
| 2026 | 9 | 58,379 | 16.8% | 74,226 | 21.4% | $1,221,706 | 18.3% | $20.93 |
| 2027 | 6 | 47,116 | 13.6% | 121,342 | 34.9% | $890,892 | 13.3% | $18.91 |
| 2028 | 4 | 27,791 | 8.0% | 149,133 | 42.9% | $586,265 | 8.8% | $21.10 |
| 2029 | 3 | 33,983 | 9.8% | 183,116 | 52.7% | $656,338 | 9.8% | $19.31 |
| 2030 | 5 | 43,425 | 12.5% | 226,541 | 65.2% | $865,839 | 13.0% | $19.94 |
| 2031 | 3 | 11,585 | 3.3% | 238,126 | 68.5% | $298,521 | 4.5% | $25.77 |
| 2032 | 3 | 11,769 | 3.4% | 249,895 | 71.9% | $308,368 | 4.6% | $26.20 |
| 2033 | 3 | 50,191 | 14.4% | 300,086 | 86.3% | $836,141 | 12.5% | $16.66 |
| 2034 | 2 | 4,161 | 1.2% | 304,247 | 87.5% | $144,224 | 2.2% | $34.66 |
| Thereafter | 2 | 28,421 | 8.2% | 332,668 | 95.7% | $476,119 | 7.1% | $16.75 |
| Vacant | 0 | 14,892 | 4.3% | 347,560 | 100.0% | $0 | 0.0% | $0.00 |
| Total/Weighted Average | 46 | 347,560 | 100.0% | | | $6,682,446(2) | 100.0% | $20.09(2) |
| (1) | Information obtained from the underwritten rent roll. |
| (2) | Total/Weighted Average Annual U/W Base Rent and Annual U/W Base Rent PSF exclude vacant space. |
The following table presents historical occupancy percentages at the Sacramento Gateway Property:
Historical Occupancy(1)(2)
12/31/2020 | 12/31/2021 | 12/31/2022 | 12/31/2023 | TTM 7/31/2024(3) |
| 86.6% | 88.6% | 89.8% | 79.7% | 95.7% |
| (1) | Historical occupancies obtained from borrower rent rolls. |
| (2) | The increase in historical occupancy is due to Barnes & Noble and Bed Bath & Beyond vacating the property and those spaces being backfilled by Nordstrom Rack and Burlington. |
| (3) | Information obtained from the underwritten rent roll. |
THE INFORMATION IN THIS STRUCTURAL AND COLLATERAL TERM SHEET IS NOT COMPLETE AND MAY BE AMENDED PRIOR TO THE TIME OF SALE. THIS TERM SHEET IS NOT AN OFFER TO SELL THESE SECURITIES AND IT IS NOT A SOLICITATION OF AN OFFER TO BUY THESE SECURITIES IN ANY JURISDICTION WHERE THE OFFER OR SALE IS NOT PERMITTED. |
| | 52 | |
| Retail – Anchored | Loan #3 | Cut-off Date Balance: | | $61,500,000 |
3648 North Freeway Boulevard Sacramento, CA 95834 | Sacramento Gateway | Cut-off Date LTV: U/W NCF DSCR: U/W NOI Debt Yield: | | 66.8% 1.31x 10.3% |
Underwritten Net Cash Flow. The following table presents certain information relating to the historical operating results and the underwritten net cash flow at the Sacramento Gateway Property:
Cash Flow Analysis
| | 2021 | 2022 | 2023 | TTM July 2024 | U/W | %(1) | U/W $ per SF |
| Base Rent | $5,372,494 | $5,486,714 | $5,404,178 | $6,012,680 | $6,682,446(2) | 64.7% | $19.23(2) |
| Grossed Up Vacant Space | 0 | 0 | 0 | 0 | 459,558 | 6.4 | 1.32 |
| Gross Potential Rent | $5,372,494 | $5,486,714 | $5,404,178 | $6,012,680 | $7,142,004 | 69.1% | $20.55 |
| Percentage Rent | 49,334 | 87,508 | 37,119 | 0 | 38,106 | 0.4 | 0.11 |
| Other Income | 35,650 | 30,272 | 25,088 | 25,451 | 25,451 | 0.2 | 0.07 |
| Total Recoveries | 2,061,876 | 2,266,278 | 2,540,843 | 2,865,197 | 3,129,453 | 30.3 | 9.00 |
| Net Rental Income | $7,519,354 | $7,870,772 | $8,007,228 | $8,903,328 | $10,335,014 | 100.0% | $29.74 |
| (Vacancy & Credit Loss) | 0 | 0 | 0 | 0 | (459,558) | (6.4) | (1.32) |
| Collection Loss | (175,220) | (42,048) | (116,816) | (117,206) | 0 | 0.0 | (0.00) |
| Effective Gross Income | $7,344,134 | $7,828,724 | $7,890,412 | $8,786,122 | $9,875,456 | 95.6% | $28.41 |
| | | | | | | | |
| Real Estate Taxes | $878,313 | $901,622 | $918,588 | $953,418 | $926,911 | 9.4% | $2.67 |
| Insurance | 149,733 | 178,643 | 206,102 | 216,551 | 232,343 | 2.4 | 0.67 |
| Management Fee | 229,026 | 243,188 | 234,133 | 263,086 | 296,264 | 3.0 | 0.85 |
| Other Operating Expenses | 1,856,452 | 1,957,897 | 2,108,605 | 2,069,545 | 2,069,545 | 21.0 | 5.95 |
| Total Operating Expenses | $3,113,524 | $3,281,350 | $3,467,428 | $3,502,600 | $3,525,062 | 35.7% | $10.14 |
| | | | | | | | |
| Net Operating Income | $4,230,610(3) | $4,547,374 | $4,422,984 | $5,283,522 | $6,350,394(3) | 64.3% | $18.27 |
| Replacement Reserves | 0 | 0 | 0 | 0 | 93,841 | 1.0 | 0.27 |
| TI/LC | 0 | 0 | 0 | 0 | 173,780 | 1.8 | 0.50 |
| Net Cash Flow | $4,230,610 | $4,547,374 | $4,422,984 | $5,283,522 | $6,082,773 | 61.6% | $17.50 |
| | | | | | | | |
| NOI DSCR | 0.91x | 0.98x | 0.95x | 1.14x | 1.37x | | |
| NCF DSCR | 0.91x | 0.98x | 0.95x | 1.14x | 1.31x | | |
| NOI Debt Yield | 6.9% | 7.4% | 7.2% | 8.6% | 10.3% | | |
| NCF Debt Yield | 6.9% | 7.4% | 7.2% | 8.6% | 9.9% | | |
| (1) | Represents (i) percent of Net Rental Income for all revenue fields, (ii) percent of gross potential rent for grossed up vacant space, vacancy and credit loss and (iii) percent of Effective Gross Income for all other fields. |
| (2) | The U/W Base Rent and U/W $ per SF include contractual rent steps through November 2025. |
| (3) | The increase in NOI from YE 2021 to U/W is due to Barnes & Noble and Bed Bath & Beyond vacating the property and those spaces being backfilled by Nordstrom Rack and Burlington at higher rents. |
Appraisal. The appraiser concluded to an “As-is” value for the Sacramento Gateway Property of $92,000,000. The appraised value is as of September 6, 2024.
Environmental Matters. According to the Phase I environmental site assessment for the Sacramento Gateway Property, dated August 30, 2024, there was no evidence of any recognized environmental conditions.
Market Overview and Competition. The Sacramento Gateway Property is located in the city of Sacramento. Sacramento is the capital of California and is located in California's Central Valley. The Sacramento Gateway Property is located at the northeast quadrant of Truxel Road and Interstate 80 and is approximately 9.1 miles from the Sacramento International Airport. According to a third party report, within a 1-, 3- and 5- mile radius of the Sacramento Gateway Property, the estimated 2024 population is 16,694, 142,740, and 282,500, respectively, and the 2024 average household income is $103,666, $115,971, and $108,340, respectively.
According to a third party report, the property is situated within the Natomas retail submarket of the greater Sacramento retail market. As of second quarter of 2024, the submarket reports a total inventory of approximately 4.0 million square feet with an approximately 2.6% vacancy rate and average market rent of $26.88 per square foot. The appraiser concluded to market rents in the market rent summary below.
THE INFORMATION IN THIS STRUCTURAL AND COLLATERAL TERM SHEET IS NOT COMPLETE AND MAY BE AMENDED PRIOR TO THE TIME OF SALE. THIS TERM SHEET IS NOT AN OFFER TO SELL THESE SECURITIES AND IT IS NOT A SOLICITATION OF AN OFFER TO BUY THESE SECURITIES IN ANY JURISDICTION WHERE THE OFFER OR SALE IS NOT PERMITTED. |
| | 53 | |
| Retail – Anchored | Loan #3 | Cut-off Date Balance: | | $61,500,000 |
3648 North Freeway Boulevard Sacramento, CA 95834 | Sacramento Gateway | Cut-off Date LTV: U/W NCF DSCR: U/W NOI Debt Yield: | | 66.8% 1.31x 10.3% |
The following table presents certain information relating to the appraiser’s market rent conclusions for the Sacramento Gateway Property:
Market Rent Summary(1)
| | Jr. Anchor | Shop > 10,000 SF | Shop 5,000 – 10,000 SF | Shop 2,500 – 4,999 SF | Shop < 2,500 SF | Restaurant | Village Shop > 5,000 SF | Village Shop 2,500-4,999 SF | Village Shop < 2,500 SF | Village Restaurant |
Market Rent
(PSF) | $17.40 | $21.60 | $25.20 | $39.00 | $30.00 | $36.00 | $15.60 | $15.00 | $24.00 | $21.00 |
Lease Term
(Years) | 10 | 10 | 5 | 5 | 5 | 10 | 5 | 5 | 5 | 10 |
| Lease Type | NNN | NNN | NNN | NNN | NNN | NNN | NNN | NNN | NNN | NNN |
Rent
Increase
Projection | 10.0% / Midterm | 10.0% / Midterm | 3.0% / Year | 3.0% / Year | 3.0% / Year | 10.0% / Midterm | 3.0% / Year | 3.0% / Year | 3.0% / Year | 10.0% / Midterm |
| (1) | Information obtained from the appraisal. |
The table below presents certain information relating to comparable sales pertaining to the Sacramento Gateway Property identified by the appraiser:
Comparable Sales(1)
| Property Name | Location | Year Built/Renovated | Rentable Area (SF) | Occupancy | Sale Date | Sale Price | Sale Price (PSF) |
Sacramento Gateway 3648 North Freeway Boulevard | Sacramento, CA | 2006 / NAP | 347,560(2) | 95.7%(2) | | | |
The Plant 1 Curtner Avenue | San Jose, CA | 2008 / NAP | 367,000 | 65.0% | Aug-2024 | $95,000,000 | $259 |
Riverpoint Marketplace 744-768 Ikea Court | West Sacramento, CA | 2010 / NAP | 134,065 | 83.8% | Nov-2023 | $36,000,000 | $269 |
Creekside Town Center 1192-1256 Galleria Boulevard | Roseville, CA | 1999 / NAP | 345,451 | 94.8% | Sep-2023 | $125,500,000 | $363 |
Homestead Square 20580-20680 Homestead Road | Cupertino, CA | 1976 / NAP | 202,714 | 99.2% | Jun-2023 | $92,500,000 | $456 |
Arden Watt Marketplace 3308-3350 Arden Way | Sacramento, CA | 1999 / NAP | 148,469 | 100.0% | Feb-2023 | $26,500,000 | $178 |
| (1) | Information obtained from the appraisal. |
| (2) | Information obtained from the underwritten rent roll. |
THE INFORMATION IN THIS STRUCTURAL AND COLLATERAL TERM SHEET IS NOT COMPLETE AND MAY BE AMENDED PRIOR TO THE TIME OF SALE. THIS TERM SHEET IS NOT AN OFFER TO SELL THESE SECURITIES AND IT IS NOT A SOLICITATION OF AN OFFER TO BUY THESE SECURITIES IN ANY JURISDICTION WHERE THE OFFER OR SALE IS NOT PERMITTED. |
| | 54 | |
| Retail – Anchored | Loan #3 | Cut-off Date Balance: | | $61,500,000 |
3648 North Freeway Boulevard Sacramento, CA 95834 | Sacramento Gateway | Cut-off Date LTV: U/W NCF DSCR: U/W NOI Debt Yield: | | 66.8% 1.31x 10.3% |
Escrows.
Real Estate Taxes – The loan documents require an upfront reserve of $249,697 for real estate taxes and ongoing monthly reserves equal to 1/12th of the annual estimated tax payments payable during the next ensuing 12 months, initially $83,233.
Insurance – The loan documents require an ongoing monthly deposit into an insurance reserve equal to 1/12th of the insurance premiums that the lender reasonably estimates will be payable; during the next ensuring 12 months’ provided that no deposits are required if (i) no event of default is continuing, (ii) the borrower maintains insurance coverage for the Sacramento Gateway Property as part of blanket or umbrella coverage reasonably approved by the lender, and (iii) the borrower provides the lender with evidence of the renewals of the insurance policies and paid receipts for the payment of the insurance premiums no later than seven business days prior to the expiration dates of the policies.
Replacement Reserve – The loan documents require ongoing monthly deposits of $7,820 for replacement reserves, which are capped at $187,682.
TI/LC Reserve – The loan documents require ongoing monthly deposits of $36,204 capped at $868,900 for tenant improvement and leasing commission costs.
Existing TI/LC Reserve – The loan documents require an upfront reserve of $61,930 for outstanding tenant improvement and leasing commission costs.
Immediate Repairs – The loan documents require an upfront reserve of $16,800 for immediate repairs.
Lockbox and Cash Management. The Sacramento Mortgage Loan is structured with a hard lockbox and springing cash management. Tenants make rental payments are directed to deposit all rent directly into a lockbox account within one business day of receipt. Prior to a Cash Trap Event Period (as defined below), amounts on deposit in the lockbox account will be transferred to the borrower. During the continuance of a Cash Trap Event Period, funds in the lockbox accounts will be transferred to a lender-controlled cash management account to be applied in accordance with the cash management agreement. Excess funds will be retained by lender until the Cash Trap Event Period is cured.
A “Cash Trap Event Period” will commence upon the earlier of the following:
| (i) | the occurrence and continuance of an event of default under the Sacramento Gateway Mortgage Loan documents. |
| (ii) | the DSCR Net Cash Flow falling below 1.10x (based on 30-year amortization), tested quarterly. |
A Cash Trap Event Period will expire, provided no other Cash Trap Event Period is then continuing, upon the occurrence of the following:
| ● | with regard to clause (i), the cure of such event of default. |
| ● | with regard to clause (ii), the DSCR being at least 1.15x (based on 30-year amortization) for one calendar quarter. |
Mezzanine Loan and Preferred Equity. None.
Release of Property. Not permitted.
Letter of Credit. None.
Right of First Offer/Right of First Refusal. None.
Ground Lease. None.
Terrorism Insurance. The loan documents require that the “all risk” insurance policy required to be maintained by the borrower provides coverage for terrorism in an amount equal to the full replacement cost of the Sacramento Gateway Property, as well as business interruption insurance covering no less than the 12-month period following the occurrence of a casualty event, together with a 6-month extended period of indemnity.
THE INFORMATION IN THIS STRUCTURAL AND COLLATERAL TERM SHEET IS NOT COMPLETE AND MAY BE AMENDED PRIOR TO THE TIME OF SALE. THIS TERM SHEET IS NOT AN OFFER TO SELL THESE SECURITIES AND IT IS NOT A SOLICITATION OF AN OFFER TO BUY THESE SECURITIES IN ANY JURISDICTION WHERE THE OFFER OR SALE IS NOT PERMITTED. |
| | 55 | |
| Industrial – Warehouse | Loan #4 | Cut-off Date Balance: | | $58,000,000 |
Various Various | Interstate Industrial Portfolio | Cut-off Date LTV: U/W NCF DSCR: U/W NOI Debt Yield: | | 63.9% 1.37x 9.9% |
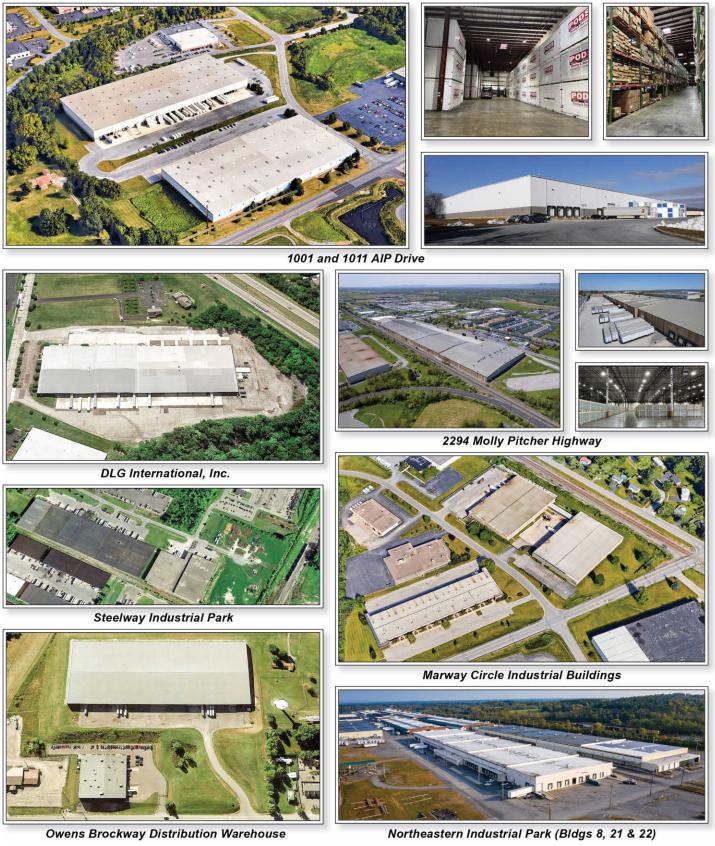
THE INFORMATION IN THIS STRUCTURAL AND COLLATERAL TERM SHEET IS NOT COMPLETE AND MAY BE AMENDED PRIOR TO THE TIME OF SALE. THIS TERM SHEET IS NOT AN OFFER TO SELL THESE SECURITIES AND IT IS NOT A SOLICITATION OF AN OFFER TO BUY THESE SECURITIES IN ANY JURISDICTION WHERE THE OFFER OR SALE IS NOT PERMITTED. |
| | 56 | |
| Industrial – Warehouse | Loan #4 | Cut-off Date Balance: | | $58,000,000 |
Various Various | Interstate Industrial Portfolio | Cut-off Date LTV: U/W NCF DSCR: U/W NOI Debt Yield: | | 63.9% 1.37x 9.9% |
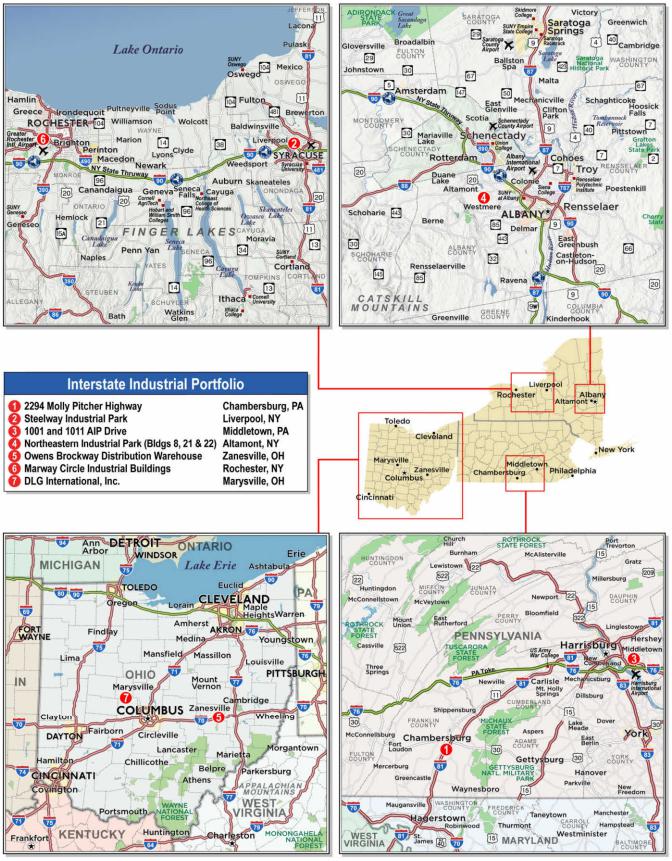
THE INFORMATION IN THIS STRUCTURAL AND COLLATERAL TERM SHEET IS NOT COMPLETE AND MAY BE AMENDED PRIOR TO THE TIME OF SALE. THIS TERM SHEET IS NOT AN OFFER TO SELL THESE SECURITIES AND IT IS NOT A SOLICITATION OF AN OFFER TO BUY THESE SECURITIES IN ANY JURISDICTION WHERE THE OFFER OR SALE IS NOT PERMITTED. |
| | 57 | |
| No. 4 – Interstate Industrial Portfolio |
| |
| Mortgage Loan Information | | Mortgaged Property Information |
| Mortgage Loan Seller: | UBS AG | | Single Asset/Portfolio: | Portfolio |
Credit Assessment (Fitch/KBRA/Moody’s): | NR/NR/NR | | Property Type – Subtype: | Industrial – Warehouse |
| Original Principal Balance(1): | $58,000,000 | | Location: | Various |
| Cut-off Date Balance(1): | $58,000,000 | | Size: | 2,573,860 SF |
| % of Initial Pool Balance: | 8.1% | | Cut-off Date Balance Per SF(1): | $43.51 |
| Loan Purpose: | Refinance | | Maturity Date Balance Per SF(1): | $43.51 |
| Borrower Sponsor: | Gavriel Alexander | | Year Built/Renovated: | Various/Various |
| Guarantor: | Gavriel Alexander | | Title Vesting: | Fee |
| Mortgage Rate: | 6.5030% | | Property Manager: | Heritage Capital Management, LLC |
| Note Date: | October 2, 2024 | | Current Occupancy (As of): | 98.6% (9/12/2024) |
| Seasoning: | 1 month | | YE 2023 Occupancy: | 100.0% |
| Maturity Date: | October 6, 2029 | | YE 2022 Occupancy: | 99.1% |
| IO Period: | 60 months | | YE 2021 Occupancy: | 81.9% |
| Loan Term (Original): | 60 months | | YE 2020 Occupancy: | NAV |
| Amortization Term (Original): | NAP | | As-Is Appraised Value: | $175,350,000 |
| Loan Amortization Type: | Interest Only | | As-Is Appraised Value Per SF: | $68.13 |
| Call Protection: | L(12),YM1(44),O(4) | | As-Is Appraisal Valuation Date: | Various |
| | | | | |
| Lockbox Type: | Hard/Springing Cash Management | | Underwriting and Financial Information |
| Additional Debt(1): | Yes | | TTM (7/31/2024) NOI: | $10,789,175 |
| Additional Debt Type (Balance)(1): | Pari Passu ($54,000,000) | | YE 2023 NOI: | $10,562,333 |
| | | | YE 2022 NOI(4): | $9,231,316 |
| | | | YE 2021 NOI(4): | $6,177,232 |
| Escrows and Reserves(2) | | U/W Revenues: | $15,342,775 |
| | Initial | Monthly | Cap | | U/W Expenses: | $4,209,461 |
| Taxes: | $188,503 | $188,503 | NAP | | U/W NOI: | $11,133,314 |
| Insurance: | $265,597 | $40,242 | NAP | | U/W NCF: | $10,103,770 |
| Replacement Reserve: | $0 | $32,173 | $772,158 | | U/W DSCR based on NOI/NCF(1): | 1.51x / 1.37x |
| TI/LC Reserve: | $1,400,000 | (3) | (3) | | U/W Debt Yield based on NOI/NCF(1): | 9.9% / 9.0% |
| Immediate Repairs: | $197,044 | $0 | NAP | | U/W Debt Yield at Maturity based on NOI/NCF(1): | 9.9% / 9.0% |
| Rent Concession Funds: | $210,881 | $0 | NAP | | Cut-off Date LTV Ratio(1): | 63.9% |
| TA TI/LC Reserve: | $575,287 | $0 | NAP | | LTV Ratio at Maturity(1): | 63.9% |
| | | | | | | |
| | | | | | | | |
| Sources and Uses |
| Sources | | | | | Uses | | | |
| Whole Loan amount | $112,000,000 | | 100.0% | | Loan Payoff | $104,953,570 | | 93.7 | % |
| | | | | | Upfront Reserves | 2,837,313 | | 2.5 | |
| | | | | | Return of Equity | 2,554,415 | | 2.3 | |
| | | | | | Closing Costs | 1,654,702 | | 1.5 | |
| Total Sources | $112,000,000 | | 100.0% | | Total Uses | $112,000,000 | | 100.0 | % |
| (1) | The Interstate Industrial Portfolio Mortgage Loan (as defined below) is part of the Interstate Industrial Portfolio Whole Loan (as defined below), which is evidenced by four pari passu promissory notes with an aggregate principal balance of $112,000,000. The Cut-off Date Balance Per SF, Maturity Date Balance Per SF, U/W Debt Yield based on NOI/NCF, U/W Debt Yield at Maturity based on NOI/NCF, U/W DSCR based on NOI/NCF, Cut-off Date LTV Ratio and LTV Ratio at Maturity numbers presented above are based on the aggregate principal balance of the promissory notes comprising the Interstate Industrial Portfolio Whole Loan. |
| (2) | See “Escrows” section. |
| (3) | On a monthly basis, the borrowers are required to deposit an aggregate amount equal to $0.25 per square foot for TI/LC reserves from November 6, 2024 through October 6, 2027. From November 6, 2027 through October 6, 2028, the borrowers are required to deposit an aggregate amount equal to $0.50 per square foot for TI/LC reserves, subject to a cap of $1,500,000 for the full TI/LC reserve. From November 6, 2028 through October 6, 2029, the borrowers are required to deposit an aggregate amount equal to $0.25 per square foot for TI/LC reserves, subject to a cap of $1,500,000 for the full TI/LC reserve. |
| (4) | The increase from YE 2021 NOI to YE 2022 NOI is primarily attributed to the lease up at the 2294 Molly Pitcher Highway property from 25.0% in 2021 to 96.1% in 2022. The 2294 Molly Pitcher Highway property accounts for 24.1% of NRA at the Interstate Industrial Portfolio Properties (as defined below). |
THE INFORMATION IN THIS STRUCTURAL AND COLLATERAL TERM SHEET IS NOT COMPLETE AND MAY BE AMENDED PRIOR TO THE TIME OF SALE. THIS TERM SHEET IS NOT AN OFFER TO SELL THESE SECURITIES AND IT IS NOT A SOLICITATION OF AN OFFER TO BUY THESE SECURITIES IN ANY JURISDICTION WHERE THE OFFER OR SALE IS NOT PERMITTED. |
| | 58 | |
| Industrial – Warehouse | Loan #4 | Cut-off Date Balance: | | $58,000,000 |
Various Various | Interstate Industrial Portfolio | Cut-off Date LTV: U/W NCF DSCR: U/W NOI Debt Yield: | | 63.9% 1.37x 9.9% |
The Mortgage Loan. The fourth largest mortgage loan (the “Interstate Industrial Portfolio Mortgage Loan”) is part of a whole loan (the “Interstate Industrial Portfolio Whole Loan”) secured by the borrowers’ fee interest in a 2,573,860 square foot portfolio of seven industrial properties located in New York, Pennsylvania and Ohio (each, an “Interstate Industrial Portfolio Property”, and collectively, the “Interstate Industrial Portfolio Properties”). The Interstate Industrial Portfolio Whole Loan is evidenced by four pari passu notes and accrues interest at a rate of 6.5030% per annum. The Interstate Industrial Portfolio Whole Loan has a five-year term, is interest only for the entire term and accrues interest on an Actual/360 basis. The Interstate Industrial Portfolio Mortgage Loan is evidenced by the controlling Note A-1, with a principal balance as of the Cut-off Date of $58,000,000. The Interstate Industrial Portfolio Whole Loan will be serviced pursuant to the pooling and servicing agreement for the WFCM 2024 5C2 securitization trust. The relationship between the holders of the Interstate Industrial Portfolio Whole Loan is governed by a co-lender agreement. See “Description of the Mortgage Pool—The Whole Loans—The Serviced Pari Passu Whole Loans” and “Pooling and Servicing Agreement” in the Preliminary Prospectus.
Whole Loan Summary
| Note | Original Balance | Cut-off Date Balance | Note Holder | Controlling Note |
| A-1 | $58,000,000 | $58,000,000 | WFCM 2024-5C2 | Yes |
| A-2 | $32,000,000 | $32,000,000 | BMO 2024-5C7 | No |
| A-3 | $12,000,000 | $12,000,000 | BMO 2024-5C7 | No |
| A-4 | $10,000,000 | $10,000,000 | BMO 2024-5C7 | No |
| Total | $112,000,000 | $112,000,000 | | |
The Borrowers and Borrower Sponsor. The borrowers are Albany NY Warehouse LLC, Syracuse NY Warehouse LLC, Rochester NY Warehouse LLC, Harrisburg PA Warehouse LLC and Columbus OH Warehouse LLC, each a Delaware limited liability company and a single purpose entity with one independent director. Legal counsel to the borrowers delivered a non-consolidation opinion in connection with the origination of the Interstate Industrial Portfolio Whole Loan. The borrower sponsor and nonrecourse carveout guarantor is Gavriel Alexander, founder and chief executive officer of Alexander Property Holdings, LLC (“APH”).
APH is a privately held real estate company that is engaged in the acquisition, development, ownership, and management of real estate throughout the country. APH is based in New City, New York, where it controls or manages a portfolio of multifamily communities, office buildings, commercial buildings, and development sites. Resources include accounting services, underwriters, marketing capabilities, and a support staff that provides APH with infrastructure to continue to grow.
The Properties. The Interstate Industrial Portfolio Whole Loan is secured by seven industrial warehouse properties totaling 2,573,860 square feet located in New York (three properties, 48.0% of NRA), Pennsylvania (two properties, 35.2% of NRA) and Ohio (two properties, 16.7% of NRA). The borrower sponsor acquired the Interstate Industrial Portfolio Properties in 2021 for an aggregate purchase price (inclusive of origination costs) of approximately $145.6 million. Since acquisition, the borrower sponsor has invested approximately $680,000 in capital improvements resulting in a total cost basis of approximately $146.3 million at the Interstate Industrial Portfolio Properties. Twenty tenants, representing 48.4% of NRA and 56.1% of the underwritten base rent, are new leases or have either extended their lease terms or expanded their space at the Interstate Industrial Portfolio Properties. Tenants at the Interstate Industrial Portfolio Properties have a weighted average tenure of approximately 12.2 years. The Interstate Industrial Portfolio Properties were 98.6% occupied by 30 unique tenants as of September 12, 2024, with the five largest tenants accounting for 43.5% of NRA and 39.8% of the underwritten base rent. The remaining tenants represent no more than 6.8% of NRA or 5.0% of the underwritten base rent.
Portfolio Summary
| Property | State | Net Rentable Area (SF)(1) | Year Built/ Renovated (2) | % U/W NOI (1) | Allocated Whole Loan Amount “ALA” | % of ALA | “As-Is” Appraised Value(2) | % Office(2) | Clear Heights (2) | Dock Doors(2) | Drive-In Doors (2) |
2294 Molly Pitcher
Highway | PA | 621,400 | 1960/1991 | 22.4 | % | $27,700,000 | 24.7 | % | $44,675,000 | 3.0% | 17' - 32' | 40 | 2 |
| Steelway Industrial Park | NY | 661,623 | 1970, 1977/NAP | 21.5 | | 24,400,000 | 21.8 | | 33,300,000 | 1.0% | 27' - 28' | 73 | 5 |
| 1001 and 1011 AIP Drive | PA | 285,831 | 1992/2012 | 14.5 | | 19,400,000 | 17.3 | | 31,850,000 | 3.6% | 20' - 30' | 55 | 1 |
Northeastern Industrial
Park (Bldgs 8, 21 & 22) | NY | 397,923 | 1947, 1988, 1989/NAP | 19.5 | | 16,100,000 | 14.4 | | 29,300,000 | 1.8% | 24' - 36' | 64 | 3 |
Owens Brockway
Distribution Warehouse | OH | 300,000 | 1991/NAP | 9.5 | | 10,900,000 | 9.7 | | 14,750,000 | 2.0% | 30' | 13 | 1 |
Marway Circle Industrial
Buildings | NY | 176,348 | 1975-1980/NAP | 6.8 | | 8,400,000 | 7.5 | | 13,900,000 | 23.1% | 18' - 30' | 27 | 3 |
| DLG International, Inc. | OH | 130,735 | 1988/NAP | 5.8 | | 5,100,000 | 4.6 | | 7,575,000 | 6.8% | 20' - 26' | 19 | 1 |
| Total | | 2,573,860 | | 100.0 | % | $112,000,000 | 100.0 | % | $175,350,000 | | | 291 | 16 |
| (1) | Information obtained from the underwritten rent roll. |
| (2) | Information obtained from the appraisals. |
THE INFORMATION IN THIS STRUCTURAL AND COLLATERAL TERM SHEET IS NOT COMPLETE AND MAY BE AMENDED PRIOR TO THE TIME OF SALE. THIS TERM SHEET IS NOT AN OFFER TO SELL THESE SECURITIES AND IT IS NOT A SOLICITATION OF AN OFFER TO BUY THESE SECURITIES IN ANY JURISDICTION WHERE THE OFFER OR SALE IS NOT PERMITTED. |
| | 59 | |
| Industrial – Warehouse | Loan #4 | Cut-off Date Balance: | | $58,000,000 |
Various Various | Interstate Industrial Portfolio | Cut-off Date LTV: U/W NCF DSCR: U/W NOI Debt Yield: | | 63.9% 1.37x 9.9% |
The following table presents certain information relating to the tenancy at the Interstate Industrial Portfolio Properties:
Major Tenants(1)
| Tenant Name | Credit Rating (Fitch/Moody’s/S&P)(2) | Tenant NRSF | % of
NRSF | Annual U/W Base Rent PSF(3) | Annual
U/W Base Rent(3) | % of Total Annual U/W Base Rent | Lease
Expiration
Date | Ext. Options | Term. Option (Y/N) |
| Major Tenants | | | | | | | | |
Owens-Brockway Glass
Container, Inc. | NR/Ba3/BB- | 300,000 | 11.7% | $3.56 | $1,067,271 | 9.1% | 4/30/2029 | 1, 5-year | N |
Thyssenkrupp Supply
Chain Services NA,
Inc.(4) | NR/Ba3/BB | 255,000 | 9.9% | $4.65 | $1,185,750 | 10.1% | 9/30/2025 | N | Y(4) |
| Victory Packaging LP | NR/Baa2/BBB | 195,949 | 7.6% | $4.79 | $938,498 | 8.0% | 9/30/2029 | 1, 5-year | N |
| D.M. Bowman(5) | NR/NR/NR | 192,000 | 7.5% | $4.65 | $892,800 | 7.6% | 2/21/2026 | N | N |
| Rotondo Warehouse | NR/NR/NR | 177,222 | 6.9% | $3.38 | $599,125 | 5.1% | Various(6) | N | N |
| | 1,120,171 | 43.5% | $4.18 | $4,683,445 | 39.8% | | | |
| | | | | | | | | |
| Non-Major Tenants | 1,418,924 | 55.1% | $5.00 | $7,088,162 | 60.2% | | | |
| | | | | | | | | |
| Occupied Collateral Total | 2,539,095 | 98.6% | $4.64 | $11,771,606 | 100.0% | | | |
| | | | | | | | | |
| Vacant Space | 34,765 | 1.4% | | | | | | |
| | | | | | | | | |
| Collateral Total | 2,573,860 | 100.0% | | | | | | |
| | | | | | | | | | |
| (1) | Information obtained from the underwritten rent roll. |
| (2) | Ratings are those of the parent company, whether or not the parent guarantees the lease. |
| (3) | The Annual U/W Base Rent and Annual U/W Base Rent PSF shown above include contractual rent steps through November 1, 2025 totaling $687,882. |
| (4) | Thyssenkrupp Supply Chain Services NA, Inc. subleases 255,000 square feet of space from D.M. Bowman at the 2294 Molly Pitcher Highway property expiring on September 30, 2025 at a base rental rate of $4.65 per square feet. The 255,000 square foot sublease provides for mutual termination rights at 90 days’ notice. However, D.M. Bowman must continue to pay rent and recoveries in accordance with its lease and has signed an estoppel attesting to its intent to honor its lease through its lease expiration date of February 21, 2026. The sublease allows for Thyssenkrupp Supply Chain Services NA, Inc. to extend through D.M. Bowman’s lease expiration date of February 21, 2026. |
| (5) | D.M. Bowman is the direct lease tenant with a lease term through February 21, 2026 at a current base rent of $5.10 per square foot NNN, which steps to $5.25 per square foot NNN in February 2025. The tenant vacated its space but continues to pay base rent and reimbursements per the terms of the lease. UBS AG has underwritten to the sublease rent for Thyssenkrupp Supply Chain Services NA, Inc. due to the expectation that Thyssenkrupp Supply Chain Services NA, Inc. will expand into the remaining space. |
| (6) | Rotondo Warehouse leases 112,000 square feet at the Steelway Industrial Park property expiring on June 30, 2026, and 65,222 square feet at the Steelway Industrial Park property expiring on September 30, 2027. |
The following table presents certain information relating to the lease rollover schedule at the Interstate Industrial Portfolio Properties:
Lease Expiration Schedule(1)(2)
Year Ending
December 31, | No. of Leases Expiring | Expiring NRSF | % of Total NRSF | Cumulative Expiring NRSF | Cumulative % of Total NRSF | Annual
U/W
Base Rent(3)(4) | % of Total Annual U/W Base Rent(4) | Annual
U/W
Base Rent
PSF(3)(4) |
| MTM | 0 | 0 | 0.0% | 0 | 0.0% | $0 | 0.0% | $0.00 |
| 2024 | 0 | 0 | 0.0% | 0 | 0.0% | $0 | 0.0% | $0.00 |
| 2025 | 6 | 447,730 | 17.4% | 447,730 | 17.4% | $2,093,740 | 17.8% | $4.68 |
| 2026 | 8 | 674,236 | 26.2% | 1,121,966 | 43.6% | $3,241,019 | 27.5% | $4.81 |
| 2027 | 4 | 209,394 | 8.1% | 1,331,360 | 51.7% | $991,949 | 8.4% | $4.74 |
| 2028 | 7 | 313,164 | 12.2% | 1,644,524 | 63.9% | $1,421,564 | 12.1% | $4.54 |
| 2029 | 4 | 670,349 | 26.0% | 2,314,873 | 89.9% | $2,598,729 | 22.1% | $3.88 |
| 2030 | 4 | 132,560 | 5.2% | 2,447,433 | 95.1% | $857,715 | 7.3% | $6.47 |
| 2031 | 3 | 29,846 | 1.2% | 2,477,279 | 96.2% | $226,902 | 1.9% | $7.60 |
| 2032 | 1 | 61,816 | 2.4% | 2,539,095 | 98.6% | $339,988 | 2.9% | $5.50 |
| 2033 | 0 | 0 | 0.0% | 2,539,095 | 98.6% | $0 | 0.0% | $0.00 |
| 2034 | 0 | 0 | 0.0% | 2,539,095 | 98.6% | $0 | 0.0% | $0.00 |
| Thereafter | 0 | 0 | 0.0% | 2,539,095 | 98.6% | $0 | 0.0% | $0.00 |
| Vacant | 0 | 34,765 | 1.4% | 2,573,860 | 100.0% | $0 | 0.0% | $0.00 |
| Total/Weighted Average | 37 | 2,573,860 | 100.0% | | | $11,771,606 | 100.0% | $4.64 |
| (1) | Information obtained from the underwritten rent roll. |
| (2) | Certain leases may have termination options that are exercisable prior to the originally stated expiration date of the lease and are not considered in this Lease Rollover Schedule |
| (3) | Annual U/W Base Rent and Annual U/W Base Rent PSF does not include vacant space. |
| (4) | Annual U/W Base Rent, % of Total Annual U/W Base Rent and Annual U/W Base Rent PSF shown above include contractual rent steps through November 1, 2025 totaling $687,882. |
THE INFORMATION IN THIS STRUCTURAL AND COLLATERAL TERM SHEET IS NOT COMPLETE AND MAY BE AMENDED PRIOR TO THE TIME OF SALE. THIS TERM SHEET IS NOT AN OFFER TO SELL THESE SECURITIES AND IT IS NOT A SOLICITATION OF AN OFFER TO BUY THESE SECURITIES IN ANY JURISDICTION WHERE THE OFFER OR SALE IS NOT PERMITTED. |
| | 60 | |
| Industrial – Warehouse | Loan #4 | Cut-off Date Balance: | | $58,000,000 |
Various Various | Interstate Industrial Portfolio | Cut-off Date LTV: U/W NCF DSCR: U/W NOI Debt Yield: | | 63.9% 1.37x 9.9% |
The following table presents historical occupancy percentages at the Interstate Industrial Portfolio Properties:
Historical Occupancy
12/31/2021(1)(2) | 12/31/2022(1)(2) | 12/31/2023(1) | 09/12/2024(3) |
| 81.9% | 99.1% | 100.0% | 98.6% |
| (1) | Information obtained from the borrowers. |
| (2) | The increase in occupancy from 12/31/2021 to 12/31/2022 is primarily attributed to lease up at the 2294 Molly Pitcher Highway property from 25.0% in 2021 to 96.1% in 2022. The 2294 Molly Pitcher Highway property accounts for 24.1% of NRA at the Interstate Industrial Portfolio Properties. |
| (3) | Information obtained from the underwritten rent roll. See “Major Tenants” above for more information. |
Operating History and Underwritten Net Cash Flow. The following table presents certain information relating to the historical operating performance and underwritten net cash flow at the Interstate Industrial Portfolio Properties:
Cash Flow Analysis
| | 2021 | 2022 | 2023 | TTM 7/31/2024 | U/W | %(1) | U/W $ per SF |
| Base Rent | $7,601,485 | $10,407,421 | $10,910,113 | $10,996,680 | $11,083,724 | 68.6% | $4.31 |
| Rent Steps(2) | 0 | 0 | 0 | 0 | 687,882 | 4.3% | 0.27 |
| Vacant Income | 0 | 0 | 0 | 0 | 260,019 | 1.6% | 0.10 |
| Gross Potential Rent | $7,601,485 | $10,407,421 | $10,910,113 | $10,996,680 | $12,031,625 | 74.5% | $4.67 |
| Total Reimbursements | 2,120,588 | 2,886,141 | 3,970,502 | 4,011,774 | 4,074,333 | 25.2% | 1.58 |
| Total Other Income | 0 | 0 | 23,073 | 42,507 | 42,507 | 0.3% | 0.02 |
| Net Rental Income | $9,722,073 | $13,293,562 | $14,903,689 | $15,050,961 | $16,148,465 | 100.0% | $6.27 |
| (Vacancy & Credit Loss) | 0 | 0 | 0 | 0 | (805,690)(3) | (5.0)(3) | (0.31) |
| Effective Gross Income | $9,722,073 | $13,293,562 | $14,903,689 | $15,050,961 | $15,342,775 | 95.0% | $5.96 |
| | | | | | | | |
| Total Expenses | 3,544,841 | 4,062,246 | 4,341,356 | 4,261,786 | 4,209,461 | 27.4% | 1.64 |
| | | | | | | | |
| Net Operating Income(4) | $6,177,232 | $9,231,316 | $10,562,333 | $10,789,175 | $11,133,314 | 72.6% | $4.33 |
| Total TI/LC, Capex/RR | 0 | 0 | 0 | 0 | 1,029,544 | 6.7% | 0.40 |
| Net Cash Flow | $6,177,232 | $9,231,316 | $10,562,333 | $10,789,175 | $10,103,770 | 65.9% | $3.93 |
| | | | | | | | |
| NOI DSCR(5) | 0.84x | 1.25x | 1.43x | 1.46x | 1.51x | | |
| NCF DSCR(5) | 0.84x | 1.25x | 1.43x | 1.46x | 1.37x | | |
| NOI Debt Yield(5) | 5.5% | 8.2% | 9.4% | 9.6% | 9.9% | | |
| NCF Debt Yield(5) | 5.5% | 8.2% | 9.4% | 9.6% | 9.0% | | |
| (1) | Represents (i) percent of Net Rental Income for all revenue fields and (ii) percent of Effective Gross Income for all other fields. |
| (2) | Rent Steps totaling $687,882 are taken through November 1, 2025. |
| (3) | The underwritten economic vacancy is 5.0%. The Interstate Industrial Portfolio Properties were 98.6% occupied as of September 12, 2024. |
| (4) | The increase from 2021 Net Operating Income to 2022 Net Operating Income is primarily attributed to the lease up at the 2294 Molly Pitcher Highway property from 25.0% in 2021 to 96.1% in 2022. The 2294 Molly Pitcher Highway property accounts for 24.1% of NRA at the Interstate Industrial Portfolio Properties. |
| (5) | Figures are based on the Interstate Industrial Portfolio Whole Loan debt service and original principal balance. |
Appraisal. The appraiser concluded to an aggregate “as-is” Appraised Value for the Interstate Industrial Portfolio Properties of $175,350,000 as of August 5, 2024 to September 12, 2024.
Environmental Matters. According to the Phase I environmental site assessments dated between August 8, 2024 and August 15, 2024, there was no evidence of any recognized environmental conditions at the Interstate Industrial Portfolio Properties.
Market Overview and Competition. The Interstate Industrial Portfolio Properties are located in New York (43.7% of ALA), Pennsylvania (42.1% of ALA) and Ohio (14.3% of ALA).
THE INFORMATION IN THIS STRUCTURAL AND COLLATERAL TERM SHEET IS NOT COMPLETE AND MAY BE AMENDED PRIOR TO THE TIME OF SALE. THIS TERM SHEET IS NOT AN OFFER TO SELL THESE SECURITIES AND IT IS NOT A SOLICITATION OF AN OFFER TO BUY THESE SECURITIES IN ANY JURISDICTION WHERE THE OFFER OR SALE IS NOT PERMITTED. |
| | 61 | |
| Industrial – Warehouse | Loan #4 | Cut-off Date Balance: | | $58,000,000 |
Various Various | Interstate Industrial Portfolio | Cut-off Date LTV: U/W NCF DSCR: U/W NOI Debt Yield: | | 63.9% 1.37x 9.9% |
The following table presents certain market information with respect to the Interstate Industrial Portfolio Properties:
Market Overview(1)
| Property | Net Rentable Area (SF)(2) | Submarket | Property Vacancy (2) | Submarket Vacancy | Appraisal Concluded Vacancy | Submarket Inventory (SF) | U/W Base Rent PSF(2)(3) | Submarket Rent PSF |
| 2294 Molly Pitcher Highway | 621,400 | Chambersburg/ Waynesboro | 0.0% | 12.1% | 5.0% | 35,691,682 | $4.30(4) | $6.63 |
| Steelway Industrial Park | 661,623 | NE Outer Onondaga County | 0.0% | 3.6% | 3.0% | 15,102,908 | $4.17 | $7.37 |
| 1001 and 1011 AIP Drive | 285,831 | Harrisburg Area East | 0.0% | 8.1% | 7.0% | 39,766,526 | $5.97 | $8.16 |
Northeastern Industrial Park
(Bldgs 8, 21 & 22) | 397,923 | W Outer Albany County | 0.1% | 2.4% | 3.0% | 9,412,373 | $5.62 | $8.76 |
Owens Brockway Distribution
Warehouse(5) | 300,000 | Zanesville | 0.0% | 1.7% | 0.0% | 9,235,173 | $3.56 | $5.77 |
Marway Circle Industrial
Buildings | 176,348 | Southwest | 19.4% | 10.8% | 3.0% | 14,371,034 | $5.87 | $9.11 |
| DLG International, Inc. | 130,735 | Union County | 0.0% | 2.5% | 0.0% | 14,285,311 | $3.83 | $9.35 |
| Total/Weighted Average | 2,573,860 | | 1.4% | 6.2% | 3.4% | 137,865,007 | $4.64 | $7.53 |
| (1) | Information obtained from third-party market research reports. |
| (2) | Information obtained from the underwritten rent roll. |
| (3) | U/W Base Rent PSF excludes underwritten vacant space and is inclusive of approximately $687,882 of contractual rent steps through November 1, 2025. |
| (4) | U/W Base Rent PSF for the 2294 Molly Pitcher Highway property is based on the Thyssenkrupp Supply Chain Services NA, Inc. sublease base rental rate of $4.65 per square foot. D.M. Bowman currently pays a base rental rate of $5.10 per square foot for its space. The tenant vacated its space but continues to pay base rent and reimbursements per the terms of the lease. |
| (5) | No submarket data for the Owens Brockway Distribution Warehouse property was available. Market information is presented in the table above. |
The following table presents certain demographic information with respect to the Interstate Industrial Portfolio Properties:
Demographics Overview
| Property | Net Rentable Area (SF)(1) | ALA | % of ALA | U/W NOI | % of U/W NOI | Estimated 2024 Population (5-mile Radius)(2) | Estimated 2024 Average Household Income (5-mile Radius)(2) |
| 2294 Molly Pitcher Highway | 621,400 | $27,700,000 | 24.7% | $2,496,650 | 22.4% | 50,828 | $93,790 |
| Steelway Industrial Park | 661,623 | $24,400,000 | 21.8% | $2,389,348 | 21.5% | 118,935 | $92,075 |
| 1001 and 1011 AIP Drive | 285,831 | $19,400,000 | 17.3% | $1,609,407 | 14.5% | 54,373 | $103,186 |
| Northeastern Industrial Park (Bldgs 8, 21 & 22) | 397,923 | $16,100,000 | 14.4% | $2,173,697 | 19.5% | 39,068 | $133,739 |
| Owens Brockway Distribution Warehouse(5) | 300,000 | $10,900,000 | 9.7% | $1,055,368 | 9.5% | 32,343 | $67,037 |
| Marway Circle Industrial Buildings | 176,348 | $8,400,000 | 7.5% | $762,041 | 6.8% | 169,535 | $74,723 |
| DLG International, Inc. | 130,735 | $5,100,000 | 4.6% | $646,804 | 5.8% | 33,165 | $121,465 |
| Total/Weighted Average | 2,573,860 | $112,000,000 | 100.0% | $11,133,314 | 100.0% | 71,992 | $97,550 |
| (1) | Information obtained from the underwritten rent roll. |
| (2) | Information obtained from third-party market research reports. |
Escrows.
Real Estate Taxes – The Interstate Industrial Portfolio Whole Loan documents require an upfront deposit of $188,503 and ongoing monthly real estate tax reserves in an amount equal to 1/12 of the real estate taxes that the lender estimates will be payable during the next 12 months, initially estimated at approximately $188,503 per month.
Insurance – The Interstate Industrial Portfolio Whole Loan documents require an upfront deposit of $265,597 and ongoing monthly insurance reserves in an amount equal to 1/12 of the insurance premiums that the lender reasonably estimates will be payable during the next ensuing 12 months, initially estimated at approximately $40,242 per month.
Replacement Reserve – The Interstate Industrial Portfolio Whole Loan documents require an ongoing monthly replacement reserve deposit of $32,173, capped at $772,158.
TI/LC – The Interstate Industrial Portfolio Whole Loan documents require an upfront deposit of $1,400,000 for tenant improvements and leasing commissions. The Interstate Industrial Portfolio Whole Loan documents require the borrowers to deposit an aggregate amount equal to $0.25 per square foot for TI/LC reserves from November 6, 2024 through October 6, 2027. From November 6, 2027 through October 6, 2028, the borrowers are required to deposit an aggregate amount equal to $0.50 per square foot for TI/LC reserves,
THE INFORMATION IN THIS STRUCTURAL AND COLLATERAL TERM SHEET IS NOT COMPLETE AND MAY BE AMENDED PRIOR TO THE TIME OF SALE. THIS TERM SHEET IS NOT AN OFFER TO SELL THESE SECURITIES AND IT IS NOT A SOLICITATION OF AN OFFER TO BUY THESE SECURITIES IN ANY JURISDICTION WHERE THE OFFER OR SALE IS NOT PERMITTED. |
| | 62 | |
| Industrial – Warehouse | Loan #4 | Cut-off Date Balance: | | $58,000,000 |
Various Various | Interstate Industrial Portfolio | Cut-off Date LTV: U/W NCF DSCR: U/W NOI Debt Yield: | | 63.9% 1.37x 9.9% |
subject to a cap of $1,500,000 for the full TI/LC reserve. From November 6, 2028 through October 6, 2029, the borrowers are required to deposit an aggregate amount equal to $0.25 per square foot for TI/LC reserves, subject to a cap of $1,500,000 for the full TI/LC reserve. If the TI/LC reserve exceeds $2,000,000 at any point from November 6, 2024 through October 6, 2027, up to $200,000 of the TI/LC reserve may be utilized for capital expenditure related items, so long as those capital expenditure funds are depleted.
Rent Concession Funds – The Interstate Industrial Portfolio Whole Loan documents require an upfront deposit of approximately $210,881 for rent concession funds with respect to the Giovanni Food, Inc. lease ($101,703) for underwritten reimbursements for the period of November 2024 through May 2025 and the Triple Eggs LLC lease ($109,178.48) for rent concessions in months one, two and 25 of the lease term.
TA TI/LC – The Interstate Industrial Portfolio Whole Loan documents require an upfront deposit of approximately $575,287 for TA TI/LC funds associated with Victory Packaging LP (approximately $540,287) and Packaging Corporation of America ($35,000).
Lockbox and Cash Management. The Interstate Industrial Portfolio Whole Loan is structured with a hard lockbox and springing cash management upon the occurrence and continuance of a Cash Management Trigger Event (as defined below). Rents from the Interstate Industrial Portfolio Properties are required to be deposited directly into the lockbox account or, if received by the borrowers or the property manager, deposited within three business days of receipt. During the continuance of a Cash Management Trigger Event, all funds in the lockbox account are required to be swept each business day to a lender-controlled cash management account and disbursed in accordance with the Interstate Industrial Portfolio Whole Loan documents, and all excess funds on deposit in the cash management account (after payment of required monthly reserve deposits, debt service payment on the Interstate Industrial Portfolio Whole Loan, operating expenses and cash management bank fees) will be applied as follows: (a) if a Material Tenant Trigger Event (as defined below) has occurred and is continuing, to a Material Tenant (as defined below) rollover reserve, (b) if a Cash Sweep Trigger Event (as defined below) has occurred and is continuing (but not a Material Tenant Trigger Event), to the lender-controlled excess cash flow account or (c) if no Material Tenant Trigger Event or Cash Sweep Trigger Event has occurred and is continuing, to an account designated by the borrowers.
A “Cash Management Trigger Event” means a period commencing upon the occurrence of (i) an event of default under the Interstate Industrial Portfolio Whole Loan documents, (ii) any bankruptcy action involving any of the borrowers, the guarantor or the property manager, (iii) the trailing 12-month period debt service coverage ratio falling below 1.20x, (iv) the indictment for fraud or misappropriation of funds by any of the borrowers, the guarantor or an affiliated or third-party property manager (provided that, in the case of the third-party property manager, such fraud or misappropriation is related to any of the Interstate Industrial Portfolio Properties), or any director or officer of the aforementioned parties or (v) a Material Tenant Trigger Event, and expiring upon (a) with respect to clause (i) above, the cure of such event of default, (b) with respect to clause (ii) above, the filing being discharged, stayed or dismissed within 60 days, and the lender’s determination that such filing does not materially affect the borrowers’, the guarantor’s or the property manager’s monetary obligations, (c) with respect to clause (iii) above, the trailing 12-month debt service coverage ratio being at least 1.20x for two consecutive calendar quarters, (d) with respect to clause (iv) above, the dismissal of the applicable indictment with prejudice or acquittal of the applicable person, or the replacement of the property manager with a third-party property manager that constitutes a qualified property manager under the Interstate Industrial Portfolio Whole Loan documents or (e) with respect to clause (v) above, the cure of such Material Tenant Trigger Event.
A “Cash Sweep Trigger Event” means a period commencing upon the occurrence of (i) an event of default under the Interstate Industrial Portfolio Whole Loan documents, (ii) any bankruptcy action involving any of the borrowers, the guarantor or the property manager or (iii) the trailing 12-month period debt service coverage ratio falling below 1.15x, and expiring upon (a) with respect to clause (i) above, the cure of such event of default, (b) with respect to clause (ii) above, as to an involuntary filing, the filing being discharged, stayed or dismissed within 60 days, and the lender’s determination that such filing does not materially affect the borrowers’, the guarantor’s or the property manager’s monetary obligations or (c) with respect to clause (iii) above, the trailing 12-month debt service coverage ratio is at least 1.15x for two consecutive calendar quarters.
A “Material Tenant” means (i) Owens-Brockway Glass Container, Inc., (ii) Victory Packaging LP, (iii) D.M. Bowman or (iv) any tenant at the Interstate Industrial Portfolio Properties that, together with its affiliates, either (a) leases no less than 20% of the total rentable square footage of the Interstate Industrial Portfolio Properties or (b) accounts for (or would account for) no less than 20% of the total in-place base rent at the Interstate Industrial Portfolio Properties.
A “Material Tenant Trigger Event” means a period commencing upon the occurrence of (i) a Material Tenant giving notice of its intention to terminate, cancel, or not to extend or renew its lease, (ii) on or prior to the date that is 12 months prior to the then applicable expiration date under its Material Tenant lease, the Material Tenant does not extend its lease on terms and conditions reasonably acceptable to the lender, (iii) on or prior to the date a Material Tenant is required under its Material Tenant lease to notify the borrowers of its election to extend or renew its lease, if such Material Tenant does not give notice, (iv) an event of default under a Material Tenant lease occurring and continuing beyond any applicable notice and/or cure period, (v) a bankruptcy action of a Material Tenant or a lease guarantor of any Material Tenant lease occurring, (vi) a Material Tenant lease being terminated (in whole or in part) or is no longer in full force and effect, (vii) a Material Tenant (other than D.M. Bowman, but only for so long as the Thyssenkrupp Supply Chain Services NA, Inc. sublease remains in full force and effect) “going dark”, vacating, ceasing to occupy or ceasing to conduct business in the ordinary course at the applicable property or a portion thereof constituting more than 25% of the total net rentable square footage at the applicable property, (viii) a Material Tenant announcing or disclosing its intention to relocate from or vacate all or substantially all of its Material Tenant space or (ix) all or substantially all of a Material Tenant space is marketed for sublease by or on behalf of a Material Tenant (other than D.M. Bowman, but only for so long as the Thyssenkrupp Supply Chain Services NA, Inc. sublease remains in full force and effect), and expiring upon (a) with respect to clause (i), (ii), (iii), (vi), (vii), (viii) or (ix) above, (1) the applicable Material Tenant lease is extended or (2) all or substantially all of the applicable Material Tenant space is leased pursuant to one or
THE INFORMATION IN THIS STRUCTURAL AND COLLATERAL TERM SHEET IS NOT COMPLETE AND MAY BE AMENDED PRIOR TO THE TIME OF SALE. THIS TERM SHEET IS NOT AN OFFER TO SELL THESE SECURITIES AND IT IS NOT A SOLICITATION OF AN OFFER TO BUY THESE SECURITIES IN ANY JURISDICTION WHERE THE OFFER OR SALE IS NOT PERMITTED. |
| | 63 | |
| Industrial – Warehouse | Loan #4 | Cut-off Date Balance: | | $58,000,000 |
Various Various | Interstate Industrial Portfolio | Cut-off Date LTV: U/W NCF DSCR: U/W NOI Debt Yield: | | 63.9% 1.37x 9.9% |
more qualified leases, (b) with respect to clause (i) above, the date that the applicable Material Tenant revokes or rescinds all termination or cancellation notices, (c) with respect to clause (iv) above, a cure of the applicable event of default, (d) with respect to clause (v) above, the affirmation of the Material Tenant lease in the applicable bankruptcy proceeding and confirmation that the Material Tenant is actually paying all rents and other amounts under its lease (or, if applicable, the discharge or dismissal of the applicable Material Tenant lease guarantor from the applicable bankruptcy proceeding; provided that such bankruptcy (after dismissal or discharge) does not have an adverse effect on such Material Tenant lease guarantor’s ability to perform its obligations under its lease guaranty), (e) with respect to clause (vii) above, the applicable Material Tenant recommences its operations, such that it is no longer dark, and has not vacated or ceased to conduct business at the applicable property, (f) with respect to clause (viii) above, the Material Tenant retracts all announcements or disclosures of its intention to relocate from or vacate any portion of its Material Tenant space and (g) with respect to clause (ix) above, the unconditional cessation of all marketing efforts by or on behalf of the applicable Material Tenant with respect to its Material Tenant space. As of the origination date of the Interstate Industrial Portfolio Whole Loan, there is no Material Tenant Trigger Event in effect.
Property Management. The Interstate Industrial Portfolio Properties are managed by Heritage Capital Management, LLC.
Partial Release. Not permitted.
Real Estate Substitution. Not permitted.
Subordinate and Mezzanine Indebtedness. None.
Ground Lease. None.
Terrorism Insurance. The Interstate Industrial Portfolio Whole Loan documents require that the “all risk” insurance policy required to be maintained by the borrowers provides coverage for terrorism in an amount equal to the full replacement cost of the Interstate Industrial Portfolio Property, as well as business interruption insurance covering no less than the 18-month period following the occurrence of a casualty event, together with a 12-month extended period of indemnity.
THE INFORMATION IN THIS STRUCTURAL AND COLLATERAL TERM SHEET IS NOT COMPLETE AND MAY BE AMENDED PRIOR TO THE TIME OF SALE. THIS TERM SHEET IS NOT AN OFFER TO SELL THESE SECURITIES AND IT IS NOT A SOLICITATION OF AN OFFER TO BUY THESE SECURITIES IN ANY JURISDICTION WHERE THE OFFER OR SALE IS NOT PERMITTED. |
| | 64 | |
| Hospitality – Various | Loan #5 | Cut-off Date Balance: | | $54,371,913 |
| Various | Northeastern Hotel Portfolio | Cut-off Date LTV: | | 50.7% |
| Various | | U/W NCF DSCR: | | 1.56x |
| | | U/W NOI Debt Yield: | | 15.4% |

THE INFORMATION IN THIS STRUCTURAL AND COLLATERAL TERM SHEET IS NOT COMPLETE AND MAY BE AMENDED PRIOR TO THE TIME OF SALE. THIS TERM SHEET IS NOT AN OFFER TO SELL THESE SECURITIES AND IT IS NOT A SOLICITATION OF AN OFFER TO BUY THESE SECURITIES IN ANY JURISDICTION WHERE THE OFFER OR SALE IS NOT PERMITTED. |
| | 65 | |
| Hospitality – Various | Loan #5 | Cut-off Date Balance: | | $54,371,913 |
| Various | Northeastern Hotel Portfolio | Cut-off Date LTV: | | 50.7% |
| Various | | U/W NCF DSCR: | | 1.56x |
| | | U/W NOI Debt Yield: | | 15.4% |
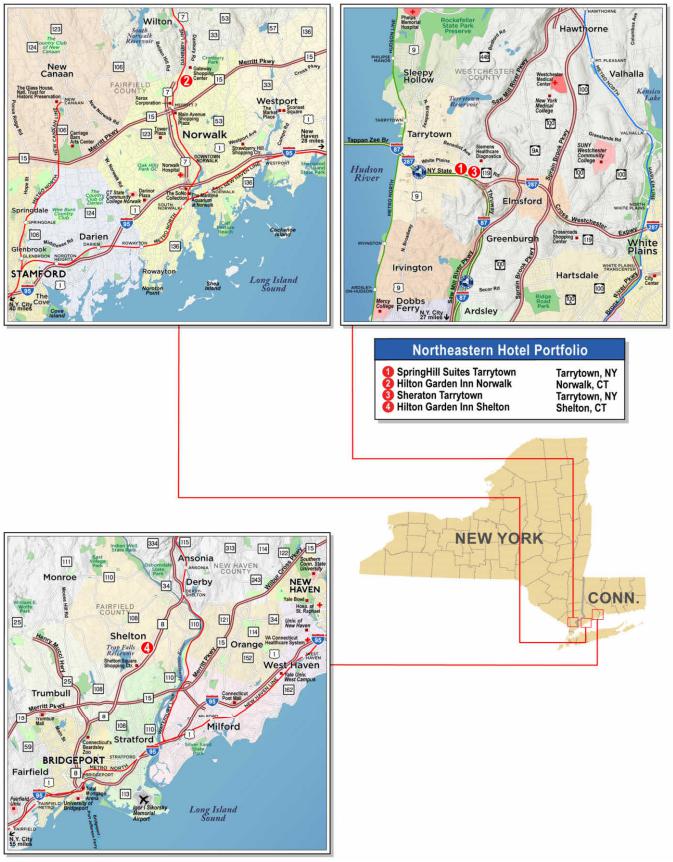
THE INFORMATION IN THIS STRUCTURAL AND COLLATERAL TERM SHEET IS NOT COMPLETE AND MAY BE AMENDED PRIOR TO THE TIME OF SALE. THIS TERM SHEET IS NOT AN OFFER TO SELL THESE SECURITIES AND IT IS NOT A SOLICITATION OF AN OFFER TO BUY THESE SECURITIES IN ANY JURISDICTION WHERE THE OFFER OR SALE IS NOT PERMITTED. |
| | 66 | |
| No. 5 – Northeastern Hotel Portfolio |
| |
| Mortgage Loan Information | | Mortgaged Property Information |
| Mortgage Loan Seller: | Wells Fargo Bank, National Association | | Single Asset/Portfolio: | Portfolio |
Credit Assessment (Fitch/KBRA/Moody’s): | NR/NR/NR | | Property Type – Subtype(2): | Hospitality – Various |
| Original Principal Balance: | $54,400,000 | | Location(2): | Various |
| Cut-off Date Balance: | $54,371,913 | | Size(2): | 607 Rooms |
| % of Initial Pool Balance: | 7.6% | | Cut-off Date Balance Per Room: | $89,575 |
| Loan Purpose: | Refinance | | Maturity Date Balance Per Room: | $85,554 |
| Borrower Sponsor: | Lixi Group | | Year Built/Renovated(2): | Various/2019 |
| Guarantor: | Shen Xiao | | Title Vesting(3): | Various |
| | | | Property Manager(4): | Various |
| Mortgage Rate: | 7.6000% | | | |
| Note Date: | October 4, 2024 | | Current Occupancy (As of): | 75.0% (8/31/2024) |
| Seasoning: | 1 month | | YE 2023 Occupancy: | 76.4% |
| Maturity Date: | October 6, 2029 | | YE 2022 Occupancy: | 73.7% |
| IO Period: | 0 months | | YE 2021 Occupancy: | 70.0% |
| Loan Term (Original): | 60 months | | As-Is Appraised Value(5): | $107,300,000 |
| Amortization Term (Original): | 360 months | | As-Is Appraised Value Per Room: | $176,771 |
| Loan Amortization Type: | Amortizing Balloon | | As-Is Appraisal Valuation Date: | September 1, 2024 |
| Call Protection: | L(25),D(28),O(7) | | | |
| Lockbox Type: | Hard/Springing Cash Management | | | |
| Additional Debt: | No | | |
| Additional Debt Type (Balance): | NAP | | Underwriting and Financial Information |
| | | | TTM NOI (8/31/2024): | $8,378,923 |
| | | | YE 2023 NOI: | $8,116,218 |
| | | | YE 2022 NOI: | $7,027,177 |
| | | | YE 2021 NOI: | $5,303,546 |
| | | | U/W Revenues: | $29,048,224 |
| | | U/W Expenses(6): | $20,683,264 |
| Escrows and Reserves(1) | | U/W NOI: | $8,364,960 |
| | Initial | Monthly | Cap | | U/W NCF: | $7,203,031 |
| Taxes: | $582,504 | $145,626 | NAP | | U/W DSCR based on NOI/NCF: | 1.81x/1.56x |
| Insurance: | $758,916 | $63,243 | NAP | | U/W Debt Yield based on NOI/NCF: | 15.4%/13.2% |
| FF&E Reserve: | $0 | $96,827 | NAP | | U/W Debt Yield at Maturity based on NOI/NCF: | 16.1%/13.9% |
| Capital Expenditure Reserve: | $0 | $24,207 | NAP | | Cut-off Date LTV Ratio: | 50.7% |
| Immediate Repairs: | $46,115 | $0 | NAP | | LTV Ratio at Maturity: | 48.4% |
| PIP Reserve: | $5,077,834 | Springing | NAP | | | |
| HGI Norwalk Ground Rent Reserve: | $42,389 | $42,389 | NAP | | | |
| Sheraton Tarrytown Condo Assessment Reserve: | $2,762 | $2,762 | NAP | | | |
| | | | | | | | |
| Sources and Uses |
| Sources | | | | | Uses | | | |
| Mortgage Loan Amount | $54,400,000 | | 86.7 | % | | Senior Loan Payoff(7) | $43,320,499 | | 69.0 | % |
| Borrower Equity Contribution | $8,367,010 | | 13.3 | | | Mezzanine Loan Payoff | $11,830,315 | | 18.8 | |
| | | | | | Upfront Reserves | $6,510,520 | | 10.4 | |
| | | | | | Closing Costs | $1,105,676 | | 1.8 | |
| Total Sources | $62,767,010 | | 100.0 | % | | Total Uses | $62,767,010 | | 100.0 | % |
| (1) | See “Escrows” section below. |
| (2) | See “The Properties” section below. |
| (3) | The Hilton Garden Inn Shelton Property (as defined below), Sheraton Tarrytown Property (as defined below) and SpringHill Suites Tarrytown Property (as defined below) are secured by fee interest. The Hilton Garden Inn Norwalk Property is secured by a leasehold interest. See “Ground Lease” section below for further discussion. |
| (4) | See “Property Management” section below. |
| (5) | The As-Is appraised value of $107,300,000 reflects the aggregate as-is appraisal value of $102,900,000 plus stated “capital deductions” totalling $4,400,000 relating to capital improvements at the Hilton Garden Inn Norwalk Property ($2,100,000), Hilton Garden Inn Shelton Property ($2,000,000), and SpringHill Suites Tarrytown Property ($300,000) for which $5,077,834 was reserved in connection with the Northeastern Hotel Portfolio Mortgage Loan for known required PIPs. |
| (6) | For the Hilton Garden Inn Norwalk Property (as defined below), loan underwriting was based on current ground rent expenses. See “Ground Lease” section, below. |
| (7) | Senior Loan Payoff of $43,320,499 consists of the outstanding principal balance ($47,270,654) net of reserves ($3,950,155), or the amount due at payoff for the existing loan. |
THE INFORMATION IN THIS STRUCTURAL AND COLLATERAL TERM SHEET IS NOT COMPLETE AND MAY BE AMENDED PRIOR TO THE TIME OF SALE. THIS TERM SHEET IS NOT AN OFFER TO SELL THESE SECURITIES AND IT IS NOT A SOLICITATION OF AN OFFER TO BUY THESE SECURITIES IN ANY JURISDICTION WHERE THE OFFER OR SALE IS NOT PERMITTED. |
| | 67 | |
| Hospitality – Various | Loan #5 | Cut-off Date Balance: | | $54,371,913 |
| Various | Northeastern Hotel Portfolio | Cut-off Date LTV: | | 50.7% |
| Various | | U/W NCF DSCR: | | 1.56x |
| | | U/W NOI Debt Yield: | | 15.4% |
The Mortgage Loan. The fifth largest mortgage loan (the “Northeastern Hotel Portfolio Mortgage Loan”) is evidenced by a single promissory note in the original principal amount of $54,400,000 and secured by the fee interests in three hospitality properties and leasehold interest in one hospitality property located in New York and Connecticut (collectively, the “Northeastern Hotel Portfolio Properties”).
The Borrowers and the Borrower Sponsor. The borrowers for the Northeastern Hotel Portfolio Mortgage Loan are Lixi Hospitality Tarrytown LLC, Lixi Hospitality Norwalk LLC, Lixi Hospitality White Plains LLC and Lixi Hospitality Shelton LLC (the “Northeastern Hotel Portfolio Borrowers”), each a single-purpose Delaware limited liability company with two independent directors. The non-recourse carveout guarantor is Shen Xiao, the main principal of Lixi Group, and the borrower sponsor is Lixi Group.
Lixi Group (the “Sponsor”) is a private, 100% family-controlled real estate company that has acquired, developed, and managed hotels in Canada and the U.S. for 15 years. Lixi Group owns 13 hotels in the U.S. and 8 hotels in Canada along with 2 land parcels. The Sponsor is also currently constructing two Marriott-branded hotels in Canada. Lixi Group’s current portfolio is comprised of 2,052 keys (excluding the Northeastern Hotel Portfolio), of which 1,226 are in the U.S. The Lixi Group’s management arm works with several national brands including Marriott, Hilton and Wyndham. Shen Xiao (the “Guarantor”), is the main principal of Lixi Group.
The Properties. The Northeastern Hotel Portfolio Properties are comprised of one select service hotel located in Tarrytown, New York, one select service hotel located in Norwalk, Connecticut, one full service hotel located in Tarrytown, New York, and one select service hotel in Shelton, Connecticut, totalling 607 rooms: SpringHill Suites Tarrytown (“SpringHill Suites Tarrytown Property”), Hilton Garden Inn Norwalk (“Hilton Garden Inn Norwalk Property”), Sheraton Tarrytown (“Sheraton Tarrytown Property”) and Hilton Garden Inn Shelton (“Hilton Garden Inn Shelton Property”). The Northeastern Hotel Portfolio Mortgage Loan is full recourse to the guarantors if any franchise agreement is terminated, surrendered, expires or is otherwise cancelled, in each case without the lender’s prior written consent, until such time as the Northeastern Hotel Portfolio Borrowers have entered into a replacement franchise agreement.
The following table presents certain information relating to the Northeastern Hotel Portfolio Properties:
Northeastern Hotel Portfolio Properties Summary
| Property Name | Year Built / Renovated | # of Rooms | Allocated Cut-off Date Loan Amount (“ALA”) | % of ALA | Appraised Value (1) | U/W NOI | % of U/W NOI |
| SpringHill Suites Tarrytown | 2004 / 2019 | 145 | $15,800,000 | 29.0% | $26,300,000 | $2,283,625 | 27.3% |
| 480 White Plains Road, Tarrytown, NY 10591 |
| Hilton Garden Inn Norwalk | 2001 / 2019 | 170 | $15,500,000 | 28.5% | $30,800,000 | $2,497,508 | 29.9% |
| 560 Main Avenue, Norwalk, CT 06851 |
| Sheraton Tarrytown | 2007 / 2019 | 150 | $12,200,000 | 22.4% | $26,000,000 | $2,016,222 | 24.1% |
| 600 White Plains Road, Tarrytown, NY 10591 |
| Hilton Garden Inn Shelton | 1999 / 2019 | 142 | $10,900,000 | 20.0% | $24,200,000 | $1,567,605 | 18.7% |
| 25 Old Stratford Road, Shelton, CT 06484 |
| Total | | 607 | $54,400,000 | 100.0% | $107,300,000 | $8,364,960 | 100.0% |
| (1) | The As-Is Appraised Value of $107,300,000 reflects the aggregate as-is appraisal value of $102,900,000 plus stated “capital deductions” totalling $4,400,000 relating to capital improvements at the SpringHill Suites Tarrytown Property ($300,000), Hilton Garden Inn Norwalk Property ($2,100,000) and Hilton Garden Inn Shelton Property ($2,000,000) for which $5,077,834 was reserved in connection with the Northeastern Hotel Portfolio Mortgage Loan for known required PIPs. |
SpringHill Suites Tarrytown Property
The SpringHill Suites Tarrytown Property is a six-story, select service hotel located in Tarrytown, New York. Built in 2004 and renovated in 2019, the SpringHill Tarrytown Property is situated on an approximately 7.21-acre parcel with 142 parking spaces (0.98 spaces per room). In 2019, the borrower sponsor completed a $2.04 million ($14,065 per room) renovation of the property.
The SpringHill Suites Tarrytown Property consists of 145 rooms and offers 336 square feet of meeting space, an indoor swimming pool, an indoor whirlpool, a fitness room, a lobby workstation, a lobby bar, a market pantry and a guest laundry area. Onsite food and beverage (“F&B”) facilities include a breakfast dining area. The guestrooms include 88 queen/queen rooms, 55 king rooms and 2 whirlpool suite rooms.
The 2023 demand segmentation was estimated as 40% commercial, 35% leisure and 25% group.
The SpringHill Suites Tarrytown Property is subject to a franchise agreement with Marriott International, Inc. expiring in February 2029, subject to a conditional 15-year extension if the borrower completes a $499,529 PIP with an outside completion date of March 2026. The Northeastern Hotel Portfolio Mortgage Loan includes a property improvement plan (“PIP”) reserve that incorporates 100% of the PIP budget. If the related franchise agreement has not been extended to February 2044, the Northeastern Hotel Portfolio Mortgage Loan documents provide for a cash flow sweep. See “Lockbox and Cash Management” section below.
THE INFORMATION IN THIS STRUCTURAL AND COLLATERAL TERM SHEET IS NOT COMPLETE AND MAY BE AMENDED PRIOR TO THE TIME OF SALE. THIS TERM SHEET IS NOT AN OFFER TO SELL THESE SECURITIES AND IT IS NOT A SOLICITATION OF AN OFFER TO BUY THESE SECURITIES IN ANY JURISDICTION WHERE THE OFFER OR SALE IS NOT PERMITTED. |
| | 68 | |
| Hospitality – Various | Loan #5 | Cut-off Date Balance: | | $54,371,913 |
| Various | Northeastern Hotel Portfolio | Cut-off Date LTV: | | 50.7% |
| Various | | U/W NCF DSCR: | | 1.56x |
| | | U/W NOI Debt Yield: | | 15.4% |
The following table presents certain information relating to the performance of the SpringHill Suites Tarrytown Property:
Historical Occupancy, ADR, RevPAR(1)
| | SpringHill Suites Tarrytown Property | Competitive Set(2) | Penetration Factor |
| Year | Occupancy | ADR | RevPAR | Occupancy | ADR | RevPAR | Occupancy | ADR | RevPAR |
| TTM 12/31/2022 | 72.3% | $145.15 | $104.99 | 70.0% | $156.55 | $109.57 | 103.3% | 92.7% | 95.8% |
| TTM 12/31/2023 | 76.2% | $166.90 | $127.15 | 66.5% | $169.51 | $112.78 | 114.5% | 98.5% | 112.7% |
| TTM 8/31/2024 | 75.3% | $167.04 | $125.79 | 69.6% | $171.37 | $119.28 | 108.2% | 97.5% | 105.5% |
Source: Third party research report
| (1) | Variances between the underwriting, the appraisal and the industry report data with respect to Occupancy, ADR and RevPAR at the SpringHill Suites Tarrytown Property are attributable to variances in reporting methodologies and/or timing differences. |
| (2) | According to a third party research report, the competitive set includes the following hotels: Hampton Inn White Plains/Tarrytown, Courtyard Tarrytown Westchester County, Sheraton Hotel Tarrytown, Hotel Nyack and Hilton Garden Inn Westchester Dobbs Ferry. |
Hilton Garden Inn Norwalk Property
The Hilton Garden Inn Norwalk Property is a three-story, select service hotel located in Norwalk, Connecticut. Built in 2001 and renovated in 2019, the Hilton Garden Inn Norwalk Property is situated on an approximately 3.54-acre parcel with 173 parking spaces (1.02 spaces per room). In 2019, the borrower sponsor completed a $3.0 million ($17,716 per room) renovation of the property. The borrower sponsor intends to spend $2.4 million in capital improvements by August 2026.
The Hilton Garden Inn Norwalk Property is positioned across four different parcels and operates with three different ground leases (see “Ground Lease” section below).
The Hilton Garden Inn Norwalk Property consists of 170 rooms and offers 1,400 square feet of meeting space, an indoor swimming pool, an indoor whirlpool, a fitness room, a business center, a market pantry and a guest laundry area. Onsite F&B facilities include the Pavilion Pantry and The Garden Grille & Bar. The guestrooms include 100 king rooms and 70 queen/queen rooms.
The 2023 demand segmentation was estimated as 60% commercial, 25% leisure and 15% group.
The Hilton Garden Inn Norwalk Property is subject to a franchise agreement with Hilton Garden Inn Franchise LLC expiring in November 2029. A $2.4 million PIP at the Hilton Garden Inn Norwalk Property is required to be completed by August 2026. The Northeastern Hotel Portfolio Mortgage Loan includes a PIP reserve that incorporates 100% of such PIP budget. In addition, The Northeastern Hotel Portfolio Mortgage Loan is structured with a cash flow sweep 12 months prior to the expiration of the franchise agreement to cover any brand mandated PIP at the time of renewal.
The following table presents certain information relating to the performance of the Hilton Garden Inn Norwalk Property:
Historical Occupancy, ADR, RevPAR(1)
| | Hilton Garden Inn Norwalk Property | Competitive Set(2) | Penetration Factor |
| Year | Occupancy | ADR | RevPAR | Occupancy | ADR | RevPAR | Occupancy | ADR | RevPAR |
| TTM 12/31/2022 | 77.3% | $142.65 | $110.20 | 67.7% | $140.68 | $95.23 | 114.1% | 101.4% | 115.7% |
| TTM 12/31/2023 | 79.0% | $153.20 | $121.06 | 73.4% | $164.76 | $120.98 | 107.6% | 93.0% | 100.1% |
| TTM 8/31/2024 | 78.8% | $161.67 | $127.33 | 73.3% | $167.61 | $122.82 | 107.5% | 96.5% | 103.7% |
Source: Third party research report
| (1) | Variances between the underwriting, the appraisal and the industry report data with respect to Occupancy, ADR and RevPAR at the Hilton Garden Inn Norwalk Property are attributable to variances in reporting methodologies and/or timing differences. |
| (2) | According to a third party research report, the competitive set includes the following hotels: EVEN Hotels Norwalk, Courtyard Norwalk and The Watershed. |
Sheraton Tarrytown Property
The Sheraton Tarrytown Property is a six-story, full-service hotel located in Tarrytown, New York. Built in 2007 and renovated in 2019, the Sheraton Tarrytown Property is situated on an approximately 0.64-acre parcel with 214 parking spaces (1.43 spaces per room). In 2019, the borrower sponsor completed a $4.1 million ($27,481 per room) renovation of the property.
The Sheraton Tarrytown Property is comprised of one unit in a three-unit land condominium (an alternative to land subdivision). The borrower has a 50% voting rights interest in the related owner’s association. The owners’ association’s responsibilities are limited: it has the obligation, generally, to maintain common elements. The loan documents contain compliance covenants with respect to the existing condominium regime.
The Sheraton Tarrytown Property consists of 150 rooms and offers 1,323 square feet of meeting space, an indoor swimming pool, an indoor whirlpool, a fitness room, a lobby workstation, a market pantry and a guest laundry area. Onsite F&B facilities include the
THE INFORMATION IN THIS STRUCTURAL AND COLLATERAL TERM SHEET IS NOT COMPLETE AND MAY BE AMENDED PRIOR TO THE TIME OF SALE. THIS TERM SHEET IS NOT AN OFFER TO SELL THESE SECURITIES AND IT IS NOT A SOLICITATION OF AN OFFER TO BUY THESE SECURITIES IN ANY JURISDICTION WHERE THE OFFER OR SALE IS NOT PERMITTED. |
| | 69 | |
| Hospitality – Various | Loan #5 | Cut-off Date Balance: | | $54,371,913 |
| Various | Northeastern Hotel Portfolio | Cut-off Date LTV: | | 50.7% |
| Various | | U/W NCF DSCR: | | 1.56x |
| | | U/W NOI Debt Yield: | | 15.4% |
Toasted Barrel restaurant and bar and a Starbucks-licensed outlet. The guestrooms include 87 king rooms, 54 queen/queen rooms, 5 queen rooms and 4 one-bedroom suite rooms.
The 2023 demand segmentation was estimated as 25% commercial, 35% leisure and 40% meeting & group.
The Sheraton Tarrytown Property is subject to a franchise agreement with The Sheraton LLC expiring in November 2034. The franchisor has the right to require a PIP by 2027 that, if imposed, would be required to be completed by 2029. The Northeastern Hotel Portfolio Mortgage Loan is structured with a cash flow sweep which will commence 15 days after receipt of the PIP notice from Marriott to cover any brand mandated PIP at the Sheraton Tarrytown Property unless the aggregate amount of the undisbursed funds in the FF&E Reserve Account, the Capital Expenditure Reserve Account and the PIP reserve account (less any amounts in any such accounts which are not allocable to the Sheraton Tarrytown Property) plus any additional amount paid by the borrower towards the Sheraton Tarrytown PIP to the lender will be at least equal to approximately $4.3 million, which represent 115% of the appraiser’s estimated PIP of $3.8 million to bring the Sheraton Tarrytown Property up to the current brand standards, should there be a current change of ownership of the Sheraton Tarrytown Property. Once lender has reviewed and approved the borrower’s budget for the Sheraton Tarrytown PIP, if the budget is less than the reserve balance allocated to the Sheraton Tarrytown PIP then the lender will be required to release reserve proceeds in the amount of such overage to the borrower, and if the budget is greater than the reserve balance allocated to the Sheraton Tarrytown PIP then the borrower will be required to deposit additional proceeds in that amount of such shortfall with the lender for the purpose of financing the Sheraton Tarrytown PIP.
The following table presents certain information relating to the performance of the Sheraton Tarrytown Property:
Historical Occupancy, ADR, RevPAR(1)
| | Sheraton Tarrytown Property | Competitive Set(2) | Penetration Factor |
| Year | Occupancy | ADR | RevPAR | Occupancy | ADR | RevPAR | Occupancy | ADR | RevPAR |
| TTM 12/31/2022 | 71.9% | $153.39 | $110.24 | 61.1% | $168.23 | $102.78 | 117.6% | 91.2% | 107.3% |
| TTM 12/31/2023 | 75.4% | $167.57 | $126.42 | 59.4% | $184.94 | $109.92 | 126.9% | 90.6% | 115.0% |
| TTM 8/31/2024 | 73.9% | $169.89 | $125.56 | 61.3% | $187.71 | $115.08 | 120.6% | 90.5% | 109.1% |
Source: Third party research report
| (1) | Variances between the underwriting, the appraisal and the industry report data with respect to Occupancy, ADR and RevPAR at the Sheraton Tarrytown Property are attributable to variances in reporting methodologies and/or timing differences. |
| (2) | According to a third party research report, the competitive set includes the following hotels: Hampton Inn White Plains/Tarrytown, Sleepy Hollow Hotel, Courtyard Tarrytown Westchester County, Tarrytown House Estate, Hyatt House White Plains and SpringHill Suites Tarrytown Westchester County. |
Hilton Garden Inn Shelton Property
The Hilton Garden Inn Shelton Property is a six-story, select service hotel located in Shelton, Connecticut. Built in 1999 and renovated in 2019, the Hilton Garden Inn Shelton Property is situated on an approximately 1.43-acre parcel with 147 parking spaces (1.04 spaces per room). In 2019, the borrower sponsor completed a $2.4 million ($16,710 per room) renovation of the property.
The Hilton Garden Inn Shelton Property consists of 142 rooms and offers 2,362 square feet of meeting space, an indoor swimming pool, an indoor whirlpool, a fitness room, a business center, a market pantry, a guest laundry area and a parlor/bridal room. Onsite F&B facilities include The Garden Grille & Bar. The guestrooms include 87 king rooms, 52 queen/queen rooms and 3 king suite rooms.
The 2023 demand segmentation was estimated as 55% commercial, 25% leisure and 20% group.
The Hilton Garden Inn Shelton Property is subject to a franchise agreement with Hilton Garden Inns Franchise LLC expiring in November 2029. A $2.2 million PIP at the Hilton Garden Inn Shelton Property is required to be completed by August 2026. The Northeastern Hotel Portfolio Mortgage Loan includes a PIP reserve that incorporates 100% of such PIP budget. In addition, The Northeastern Hotel Portfolio Mortgage Loan is structured with a cash flow sweep 12 months prior to the expiration of the franchise agreement to cover any brand mandated PIP at the time of renewal.
THE INFORMATION IN THIS STRUCTURAL AND COLLATERAL TERM SHEET IS NOT COMPLETE AND MAY BE AMENDED PRIOR TO THE TIME OF SALE. THIS TERM SHEET IS NOT AN OFFER TO SELL THESE SECURITIES AND IT IS NOT A SOLICITATION OF AN OFFER TO BUY THESE SECURITIES IN ANY JURISDICTION WHERE THE OFFER OR SALE IS NOT PERMITTED. |
| | 70 | |
| Hospitality – Various | Loan #5 | Cut-off Date Balance: | | $54,371,913 |
| Various | Northeastern Hotel Portfolio | Cut-off Date LTV: | | 50.7% |
| Various | | U/W NCF DSCR: | | 1.56x |
| | | U/W NOI Debt Yield: | | 15.4% |
The following table presents certain information relating to the performance of the Hilton Garden Inn Shelton Property:
Historical Occupancy, ADR, RevPAR(1)
| | Hilton Garden Inn Shelton Property | Competitive Set(2) | Penetration Factor |
| Year | Occupancy | ADR | RevPAR | Occupancy | ADR | RevPAR | Occupancy | ADR | RevPAR |
| TTM 12/31/2022 | 72.7% | $130.81 | $95.06 | 69.3% | $133.48 | $92.56 | 104.8% | 98.0% | 102.7% |
| TTM 12/31/2023 | 74.3% | $125.78 | $93.44 | 76.9% | $135.60 | $104.25 | 96.6% | 92.8% | 89.6% |
| TTM 8/31/2024 | 72.0% | $129.27 | $93.05 | 77.3% | $138.02 | $106.72 | 93.1% | 93.7% | 87.2% |
Source: Third party research report
| (1) | Variances between the underwriting, the appraisal and the industry report data with respect to Occupancy, ADR and RevPAR at the Hilton Garden Inn Shelton Property are attributable to variances in reporting methodologies and/or timing differences. |
| (2) | According to a third party research report, the competitive set includes the following hotels: Residence Inn Shelton Fairfield County, Courtyard Shelton, Hampton Inn Shelton and Hyatt House Shelton. |
Operating History and Underwritten Net Cash Flow. The following table presents certain information relating to the historical operating performance and the underwritten net cash flow at the Northeastern Hotel Portfolio Properties:
Cash Flow Analysis
| | 2021 | 2022 | 2023 | TTM 8/31/2024 | U/W | % of U/W Total Revenue(2) | U/W $ per Room |
| Occupancy | 70.0% | 73.7% | 76.4% | 75.0% | 75.2% | | |
| ADR | $113.92 | $143.15 | $153.79 | $158.86 | $158.86 | | |
| RevPAR | $79.69 | $105.51 | $117.42 | $119.09 | $119.41 | | |
| | | | | | | | |
| Room Revenue | 17,656,412 | 23,377,186 | 26,015,326 | 26,456,500 | 26,456,500 | 91.1 | | 43,586 |
| Other Revenue(1) | 1,881,384 | 1,977,650 | 2,563,506 | 2,591,724 | 2,591,724 | 8.9 | | 4,270 |
| Total Revenue | $19,537,796 | $25,354,836 | $28,578,832 | $29,048,224 | $29,048,224 | 100.0 | % | $47,855 |
| | | | | | | | |
| Room Expense | 3,656,169 | 5,364,659 | 6,095,680 | 6,245,455 | 6,245,455 | 23.6 | | 10,289 |
| Other Department Expense | 917,200 | 1,498,409 | 1,946,507 | 1,970,010 | 1,970,010 | 76.0 | | 3,245 |
| Total Department Expenses | $4,573,369 | $6,863,068 | $8,042,187 | $8,215,466 | $8,215,466 | 28.3 | % | $13,535 |
| Gross Operating Income | $14,964,427 | $18,491,768 | $20,536,645 | $20,832,758 | $20,832,758 | 71.7 | % | $34,321 |
| | | | | | | | |
| Total Undistributed Expenses | 6,863,006 | 8,403,769 | 9,238,823 | 9,540,373 | 9,530,089 | 32.8 | | 15,700 |
| Gross Operating Profit | $8,101,421 | $10,087,999 | $11,297,823 | $11,292,386 | $11,302,670 | 38.9 | % | $18,621 |
| | | | | | | | |
| Total Fixed Charges | 2,797,875 | 3,060,822 | 3,131,604 | 2,913,462 | 2,937,710 | 10.1 | | 4,840 |
| Total Operating Expenses | $14,234,250 | $18,327,659 | $20,412,614 | $20,669,301 | $20,683,264 | 71.2 | % | $34,075 |
| | | | | | | | |
| Net Operating Income | $5,303,546 | $7,027,177 | $8,166,218 | $8,378,923 | $8,364,960 | 28.8 | % | $13,781 |
| FF&E | 781,512 | 1,014,193 | 1,143,153 | 1,161,929 | 1,161,929 | 4.0 | | 1,914 |
| Net Cash Flow | $4,522,035 | $6,012,983 | $7,023,065 | $7,216,994 | $7,203,031 | 24.8 | % | $11,867 |
| | | | | | | | |
| NOI DSCR | 1.15x | 1.52x | 1.77x | 1.82x | 1.81x | | |
| NCF DSCR | 0.98x | 1.30x | 1.52x | 1.57x | 1.56x | | |
| NOI DY | 9.7% | 12.9% | 15.0% | 15.4% | 15.4% | | |
| NCF DY | 8.3% | 11.1% | 12.9% | 13.3% | 13.2% | | |
| (1) | Other Revenue includes food and beverage revenue and minor department revenue. |
| (2) | % of U/W Total Revenue for Room Expense and Other Department Expense are based on their corresponding revenue line items. All other line items represent percent of Total Revenue. |
Appraisal. According to the individual appraisals with valuation as of date September 1, 2024, the Northeastern Hotel Portfolio Properties had an As-Is Appraised Value of $107,300,000. The As-Is Appraised Value reflects the aggregate as-is appraisal value of $102,900,000 plus stated “capital deductions” totalling $4,400,000 relating to capital improvements at the SpringHill Suites Tarrytown Property ($300,000), Hilton Garden Inn Norwalk Property ($2,100,000), and Hilton Garden Inn Shelton Property ($2,000,000) for which $5,077,834 was reserved in connection with the Northeastern Hotel Portfolio Mortgage Loan for known required PIPs.
Environmental Matters. According to the Phase I environmental site assessments dated August 8, 2024, there was no evidence of any recognized environmental conditions at the Northeastern Hotel Portfolio Properties.
Market Overview and Competition. The Northeastern Hotel Portfolio Properties consist of two properties located in Tarrytown, New York, one property located in Norwalk, Connecticut, and one property located in Shelton, Connecticut.
Tarrytown, New York
The SpringHill Suites Tarrytown Property and Sheraton Tarrytown Property are located in Tarrytown, New York within the Rockland/Westchester, NY submarket. The SpringHill Suites Tarrytown Property is located southeast of Downtown Tarrytown, south of
THE INFORMATION IN THIS STRUCTURAL AND COLLATERAL TERM SHEET IS NOT COMPLETE AND MAY BE AMENDED PRIOR TO THE TIME OF SALE. THIS TERM SHEET IS NOT AN OFFER TO SELL THESE SECURITIES AND IT IS NOT A SOLICITATION OF AN OFFER TO BUY THESE SECURITIES IN ANY JURISDICTION WHERE THE OFFER OR SALE IS NOT PERMITTED. |
| | 71 | |
| Hospitality – Various | Loan #5 | Cut-off Date Balance: | | $54,371,913 |
| Various | Northeastern Hotel Portfolio | Cut-off Date LTV: | | 50.7% |
| Various | | U/W NCF DSCR: | | 1.56x |
| | | U/W NOI Debt Yield: | | 15.4% |
the intersection formed by White Plains Road and Old White Plains Road. The Sheraton Tarrytown Property is located in eastern Tarrytown, south of the intersection formed by White Plains Road and Benedict Avenue. Interstate 287 lies to south of the Sheraton Tarrytown Property site. Interstate 287 is the closest major thoroughfare. The Westchester County Airport is located approximately five miles to the northeast of both the properties. The LaGuardia Airport and John F. Kennedy International Airport are located approximately 20 miles and 25 miles south of both the property sites respectively.
Leisure demand generators include the Hudson River Museum, Tarrytown Music Hall, Caramoor Center for Music and the Arts, LEGOLAND Discovery Center Westchester, and the Greenburgh Nature Center & Manor House. Furthermore, New York City is one of the most popular and frequently visited tourism destinations in the United States, having accommodated 62.2 million visitors in 2023. Nearby demand generators include Siemens Healthineers, Coca-Cola, NY Medical College, and Montefiore Medical Center.
Major employers in the SpringHill Suites Tarrytown and Sheraton Tarrytown Property’s market include Regeneron Pharmaceuticals, MasterCard, IBM Corporation, PepsiCo, Inc., Pepsi Bottling Group, Consolidated Edison and Morgan Stanley. Education, healthcare, and pharmaceutical are key components of the local economy, well represented by Iona College, Manhattanville College, Monroe College, New York-Presbyterian, Northwell Health, St. John's Riverside Hospital, Sarah Lawrence College, United States Merchant Marine Academy, Westchester Medical Center Health Network, and White Plains Hospital. The market is also home to major regional or headquarters operations of MasterCard Worldwide, Morgan Stanley, Pepsi Co., Regeneron Pharmaceuticals, and XPO Logistics, among others.
As of August 2024 (YTD), the top corporate accounts at the SpringHill Suites Tarrytown Property include Siemens (646 room nights), Regeneron Pharma (701 room nights), Local Corporate (261 room nights), IBM (151 room nights), American Pile & Foundation (121 room nights), General Dynamics (68 room nights), Motorola Solutions (63 room nights), Magnetic Analysis Corp. (41 room nights), Westchester Medical Center (57 room nights) and Accenture (41 room nights). As of August 2024 (YTD), the top corporate accounts at the Sheraton Tarrytown Property include Regeneron Pharma, Inc. (640 room nights), Siemens (582 room nights), IBM (206 room nights), Accenture (197 room nights), PepsiCo (199 room nights), General Dynamics Corp (204 room nights), Berkshire Hathaway (200 room nights), Fleetcore Technologies Inc. (150 room nights), Deloitte (122 room nights) and Kohler Co. (103 room nights).
According to a third party market report, the 2024 estimated population within a 1-, 3- and 5-mile radius of the SpringHill Suites Tarrytown Property was 7,891, 54,671 and 174,057, respectively. The 2024 estimated average household income within the same radii was $191,057, $195,523 and $187,394 respectively. The 2024 estimated population within a 1-, 3- and 5-mile radius of the Sheraton Tarrytown Property was 7,000, 58,283 and 180,371, respectively. The 2024 estimated average household income within the same radii was $186,367, $194,634 and $189,296 respectively.
| Competitive Set – SpringHill Suites Tarrytown |
Property Name | Location | Year Opened/Reno. | Rooms | Occupancy | ADR | RevPAR |
| SpringHill Suites Tarrytown | 480 White Plains Road, Tarrytown, NY | 2004/2019 | 145 | 76.2% | $166.89 | $127.13 |
| Courtyard by Marriott Tarrytown Westchester County | 475 White Plains Road, Tarrytown, NY | 1988/2024 | 139 | 65% - 70% | $180 - $190 | $120 - $125 |
| Hampton by Hilton White Plains Tarrytown | 200 West Main Street, Elmsford, NY | 1957/2016 | 156 | 65% - 70% | $150 - $160 | $105 - $110 |
| Hilton Garden Inn Westchester Dobbs Ferry | 201 Ogden Avenue, Dobbs Ferry, NY | 2018/NA | 143 | 70% - 75% | $170 - $180 | $125 - $130 |
| Hotel Nyack | 400 High Avenue, Nyack, NY | 2016/2022 | 133 | 45% - 50% | $160 - $170 | $80 - $85 |
| Sheraton Tarrytown | 600 White Plains Road, Tarrytown, NY | 2007/2019 | 150 | 70% - 75% | $160 - $170 | $125 - $130 |
Source: Appraisal. Occupancy, ADR and RevPAR are based on estimated 2023 values.
THE INFORMATION IN THIS STRUCTURAL AND COLLATERAL TERM SHEET IS NOT COMPLETE AND MAY BE AMENDED PRIOR TO THE TIME OF SALE. THIS TERM SHEET IS NOT AN OFFER TO SELL THESE SECURITIES AND IT IS NOT A SOLICITATION OF AN OFFER TO BUY THESE SECURITIES IN ANY JURISDICTION WHERE THE OFFER OR SALE IS NOT PERMITTED. |
| | 72 | |
| Hospitality – Various | Loan #5 | Cut-off Date Balance: | | $54,371,913 |
| Various | Northeastern Hotel Portfolio | Cut-off Date LTV: | | 50.7% |
| Various | | U/W NCF DSCR: | | 1.56x |
| | | U/W NOI Debt Yield: | | 15.4% |
| Competitive Set – Sheraton Tarrytown |
Property Name | Location | Year Opened/Reno. | Rooms | Occupancy | ADR | RevPAR |
| Sheraton Tarrytown | 600 White Plains Road, Tarrytown, NY | 2007/2019 | 150 | 75.4% | $167.15 | $126.10 |
| Courtyard by Marriott Tarrytown Westchester County | 475 White Plains Road, Tarrytown, NY | 1988/2024 | 139 | 65% - 70% | $180 - $190 | $120 - $125 |
| Hampton by Hilton White Plains Tarrytown | 200 West Main Street, Elmsford, NY | 1957/2016 | 156 | 65% - 70% | $150 - $160 | $105 - $110 |
| Hyatt House White Plains | 101 Corporate Park Drive, White Plains, NY | 2000/2018-19 | 187 | 70% - 75% | $230 - $240 | $170 - $180 |
| Sleepy Hollow Hotel | 455 South Broadway, Tarrytown, NY | 1961/2007 | 246 | 40% - 45% | $150 - $160 | $65 - $70 |
| SpringHill Suites by Marriott Tarrytown Greenburgh | 480 White Plains Road, Tarrytown, NY | 2004/2019 | 145 | 75% - 80% | $160 - $170 | $125 - $130 |
| Tarrytown House Estate on the Hudson | 49 East Sunnyside Lane, Tarrytown, NY | 1965/2017 | 212 | 40% - 45% | $200 - $210 | $85 - $90 |
Source: Appraisal. Occupancy, ADR and RevPAR are based on estimated 2023 values.
Norwalk, Connecticut
The Hilton Garden Inn Norwalk Property is located in Norwalk, Connecticut within the Stamford/Danbury submarket. The Hilton Garden Inn Norwalk Property is located southwest of the intersection formed by U.S. Highway 7 and West Rocks Road. The LaGuardia Airport is located approximately 30 miles to the southwest of the Hilton Garden Inn Norwalk Property.
Major employers in the Hilton Garden Inn Norwalk Property’s market include ASML US Inc., Boehringer Ingelheim, Bridgewater Associates, Ceci Brothers Inc., Charles Rutenberg, Danbury Hospital, Deloitte, Dooner & Bourke Inc., Dorel Sports and Gartner Inc. Fairfield County is home to numerous headquarters and large regional operations for companies such as Xerox, Praxair, Charter Communications, XPO Logistics, EMCOR Group, Gartner Inc., United Rentals, Sikorsky Aircraft, and Pitney Bowes. As of September 2024 (YTD), the top corporate accounts at the Hilton Garden Inn Norwalk Property include ASML (1,122 room nights), Corporate Lodging (1,043 room nights), Moran Towing (239 room nights), General Mills (205 room nights), Lodging Source Pjtn (186 room nights), Campbell Soup (181 room nights), Van Dyk Recycling (171 room nights), Dooney & Burke (161 room nights), General Electric (145 room nights) and Xerox (110 room nights).
According to a third party market report, the 2024 est. population within a 1-, 3- and 5-mile radius of the Hilton Garden Inn Norwalk Property was 5,274, 56,563 and 142,814, respectively. The 2024 est. average household income within the same radii was $201,015, $186,093 and $195,093, respectively.
| Competitive Set – Hilton Garden Inn Norwalk |
Property Name | Location | Year Opened/Reno. | Rooms | Occupancy | ADR | RevPAR |
| Hilton Garden Inn Norwalk | 560 Main Avenue, Norwalk, CT | 2001/2019 | 170 | 79.0% | $153.70 | $121.45 |
| Courtyard by Marriott Norwalk | 474 Main Avenue, Norwalk, CT | 1988/2021 | 145 | 75% - 80% | $170 - $180 | $140 - $150 |
| EVEN Hotel Norwalk | 426 Main Avenue, Norwalk, CT | 1988/2014 | 129 | 70% - 75% | $140 - $150 | $105 - $110 |
| Residence Inn by Marriott Norwalk | 45 South Main Street, Norwalk, CT | 2019/NA | 102 | 75% - 80% | $180 - $190 | $130 - $140 |
| Watershed | 353 Main Avenue, Norwalk, CT | 2013/2024 | 96 | 65% - 70% | $190 - $200 | $130 - $140 |
Source: Appraisal. Occupancy, ADR and RevPAR are based on estimated 2023 values.
Shelton, Connecticut
The Hilton Garden Inn Shelton Property is located in Shelton, Connecticut within the Stamford/Danbury submarket. The Hilton Garden Inn Shelton Property is located in eastern Fairfield County, in the eastern quadrant of the intersection formed by Old Stratford Road and Bridgeport Avenue. It is located near and is relatively simple to locate from State Route 8, which is the closest major thoroughfare. The Bradley International Airport is located approximately 45 miles to the northeast of the Hilton Garden Inn Shelton Property.
Major employers in the Hilton Garden Inn Shelton Property’s market include Waterbury Board of Education, Yale-New Haven Health System, Amity Regional High School, Bozzuto's Inc., Connecticut Department of Transportation, Griffin Hospital Inc., LATICRETE International Inc., Masonicare Health Center, Medtronic Inc. and Roller Bearing Company of America Inc. Fairfield County is home to numerous headquarters and large regional operations for companies such as Xerox, Praxair, Charter Communications, XPO Logistics, EMCOR Group, Gartner Inc., United Rentals, Sikorsky Aircraft, and Pitney Bowes. As of August 2024 (YTD), the top corporate accounts
THE INFORMATION IN THIS STRUCTURAL AND COLLATERAL TERM SHEET IS NOT COMPLETE AND MAY BE AMENDED PRIOR TO THE TIME OF SALE. THIS TERM SHEET IS NOT AN OFFER TO SELL THESE SECURITIES AND IT IS NOT A SOLICITATION OF AN OFFER TO BUY THESE SECURITIES IN ANY JURISDICTION WHERE THE OFFER OR SALE IS NOT PERMITTED. |
| | 73 | |
| Hospitality – Various | Loan #5 | Cut-off Date Balance: | | $54,371,913 |
| Various | Northeastern Hotel Portfolio | Cut-off Date LTV: | | 50.7% |
| Various | | U/W NCF DSCR: | | 1.56x |
| | | U/W NOI Debt Yield: | | 15.4% |
at the Hilton Garden Inn Shelton Property include Corporate Lodging (987 room nights), Lockheed Martin (294 room nights), Pitney Bowes (201 room nights), US Army Field Band (178 room nights), 109 NLRA NCOMM (102 room nights), General Electric (101 room nights), Hubbell Inc. (101 room nights), Sectra Apps (73 room nights), South Shore Kings (62 room nights) and 8U Cal Ripken (57 room nights).
According to a third party market report, the 2024 estimated population within a 1-, 3- and 5-mile radius of the Hilton Garden Inn Shelton Property was 4,336, 36,702 and 125,352, respectively. The 2024 estimated average household income within the same radii was $135,119, $147,637 and $141,498 respectively.
| Competitive Set – Hilton Garden Inn Shelton |
Property Name | Location | Year Opened/Reno. | Rooms | Occupancy | ADR | RevPAR |
| Hilton Garden Inn Shelton | 25 Old Stratford Road, Shelton, CT | 1999/2019 | 142 | 74.3% | $125.43 | $93.19 |
| Courtyard by Marriott Shelton | 780 Bridgeport Avenue, Shelton, CT | 1990/2023 | 161 | 70% - 75% | $130 - $140 | $95 - $100 |
| Hampton by Hilton Shelton | 695 Bridgeport Avenue, Shelton, CT | 1998/2024 | 125 | 75% - 80% | $130 - $140 | $100 - $105 |
| Hyatt House Shelton | 830 Bridgeport Avenue, Shelton, CT | 2010/2018 | 127 | 75% - 80% | $140 - $150 | $110 - $115 |
| Residence Inn by Marriott Shelton Fairfield County | 1001 Bridgeport Avenue, Shelton, CT | 1988/2015 | 96 | 80% - 85% | $130 - $140 | $110 - $115 |
Source: Appraisal. Occupancy, ADR and RevPAR are based on estimated 2023 values.
Escrows and Reserves.
Real Estate Taxes – The loan documents require an upfront deposit of $582,504 and ongoing monthly deposits in an amount equal to 1/12th of the estimated annual real estate taxes, which currently equates to $145,626.
Insurance – The loan documents require an upfront deposit of $758,916 and ongoing monthly deposits in an amount equal to 1/12th of the estimated insurance premiums, which currently equates to $63,243.
Immediate Repairs - The loan documents require an upfront deposit of $46,115 for immediate repairs at the Northeastern Hotel Portfolio Properties.
HGI Norwalk Ground Rent Reserve – The loan documents require an upfront deposit of $42,389 and ongoing monthly deposits in an amount equal to 1/12th of the annual ground rent for the Hilton Garden Inn Norwalk Property, which currently equates to $42,389.
Sheraton Tarrytown Condo Assessment Reserve: The loan documents require an upfront deposit of $2,762 and ongoing monthly deposits in an amount equal to 1/12th of all common charges pursuant to the condominium budget for the succeeding 12 month period, which currently equates to $2,762 (or if no condominium budget has been provided for such period, an amount equal to 1/12th of all common charges pursuant to the condominium budget for the immediately preceding period plus the common charges that the lender estimates will be payable during such period in order to accumulate sufficient funds to pay such assessments at least 30 days prior to the date such amounts are due) for the Sheraton Tarrytown Property.
PIP Reserve – The loan documents require an upfront deposit of $5,077,834 to be used for completing the PIP work. During the continuance of a Cash Management Trigger Event Period solely as the result of a PIP Account Funding Franchise Agreement Trigger Event (as defined below), the borrower is required to deposit with the lender on each payment date all excess cash flow until the borrower has deposited with the lender an amount estimated by the lender to fund any new, amended, modified or otherwise revised PIP (“New PIP”) or any anticipated New PIP (such amount, the “New PIP Deposit Threshold”).
FF&E Reserve – The Northeastern Hotel Portfolio Borrowers are required on each monthly payment date to deposit the greater of (i) the amount required under the franchise/management agreements and (ii) 4% of the previous month’s total gross revenues, initially estimated at $96,827.
Capital Expenditure Reserve - The Northeastern Hotel Portfolio Borrowers are required on each monthly payment date to deposit an amount equal to 1.0% of gross income from operations for the preceding month, initially estimated at $24,207.
Lockbox and Cash Management. The Northeastern Hotel Portfolio Mortgage Loan is structured with a hard lockbox and springing cash management. At origination of the Northeastern Hotel Portfolio Mortgage Loan, the borrower was required to established a lender-controlled lockbox or clearing account (the “DACA Account”) and cause each present and future tenant of the property to pay all rents directly to the lockbox established in connection with the clearing account (if payment is made by check, money order or similar instrument) or directly to the clearing account (if payment is made by wire transfer). The borrower is required to deliver direction letters to each of the credit card companies with which borrower has entered into a merchant’s or other credit card agreement directing them to pay to the lender-controlled lockbox account all payments which would otherwise be paid to the borrower under the applicable credit card processing agreement. On each business day during any Cash Management Trigger Event Period, funds from the DACA Account will be transferred to the cash management account. During a Cash Management Trigger Event Period, funds in the cash
THE INFORMATION IN THIS STRUCTURAL AND COLLATERAL TERM SHEET IS NOT COMPLETE AND MAY BE AMENDED PRIOR TO THE TIME OF SALE. THIS TERM SHEET IS NOT AN OFFER TO SELL THESE SECURITIES AND IT IS NOT A SOLICITATION OF AN OFFER TO BUY THESE SECURITIES IN ANY JURISDICTION WHERE THE OFFER OR SALE IS NOT PERMITTED. |
| | 74 | |
| Hospitality – Various | Loan #5 | Cut-off Date Balance: | | $54,371,913 |
| Various | Northeastern Hotel Portfolio | Cut-off Date LTV: | | 50.7% |
| Various | | U/W NCF DSCR: | | 1.56x |
| | | U/W NOI Debt Yield: | | 15.4% |
management account are required to be disbursed in the manner provided in the Northeastern Hotel Portfolio Mortgage Loan documents.
A “Cash Management Trigger Event Period” will commence upon the earlier of the following:
| (i) | the occurrence of an event of default; |
| (ii) | without waiving any event of default or the assessment of late charges arising therefrom, borrower’s second failure in any consecutive 12 month period to pay a monthly debt service payment on a payment date; |
| (iii) | any bankruptcy action of borrower or guarantor; |
| (iv) | any bankruptcy action of manager, unless within 30 days of such bankruptcy action of manager either (x) such manager is replaced with a qualified manager or (y) borrower replaces such manager with the applicable borrower and self-manages the property; |
| (v) | the DSCR being less than 1.25x following the end of any calendar quarter; and |
| (vi) | the occurrence of a Franchise Agreement Trigger Event (as defined below). |
A “Cash Management Trigger Event Period” will be cured upon the occurrence of the following:
| (i) | with regard to clause (i) the cure of such event of default; |
| (ii) | with regard to clause (ii) the timely payment of the monthly debt service payment on 12 consecutive payment dates |
| (iii) | with regard to clause (iii) if such Cash Management Trigger Event Period is as a result of the filing of an involuntary petition against borrower/guarantor with respect to which neither borrower, guarantor nor any affiliate of borrower or guarantor solicited or caused to be solicited petitioning creditors or consented to or otherwise acquiesced in or joined in such involuntary petition, upon the same being discharged, stayed or dismissed within 60 days of such filing; provided that in lender’s reasonable opinion, such filing (after dismissal or discharge) does not materially increase borrower’s monetary obligations or guarantor’s ability to perform its obligations under the loan documents to which it is a party. |
| (iv) | with regards to clause (iv) (A) if borrower replaces manager with a new a qualified manager acceptable to lender in accordance with the assignment of management agreement and the loan agreement, or (B) if such Cash Management Trigger Event Period is as a result of the filing of an involuntary petition against manager with respect to which neither manager nor any affiliate of manager solicited or caused to be solicited petitioning creditors or consented to or otherwise acquiesced in or joined in such involuntary petition, upon the same being discharged, stayed or dismissed within 90 days of such filing; provided that, in lender’s reasonable opinion, such filing (after dismissal or discharge) does not materially and adversely affect manager’s ability to perform its obligations under the management agreement; |
| (v) | with regards to clause (v) the earlier to occur of (x) date that the DSCR is greater than 1.35x for 2 consecutive calendar quarters and (y) the date the borrower has effectuated a cash management DSCR trigger event cure; |
| (vi) | with regards to clause (vi) the date on which the applicable franchise agreement trigger event cure has occurred. |
A “Franchise Agreement Trigger Event” will commence upon:
| (i) | the date that is 12 months prior to the expiration of the franchise agreement; |
| (ii) | if franchisor or borrower gives notice of its intent to terminate or not renew/extend the franchise agreement |
| (iii) | the expiration or termination of the franchise agreement; |
| (iv) | any breach or default under the franchise agreement by borrower that, with the passage of time or delivery of notice, could result in the termination by franchisor of the franchise agreement in accordance with the terms thereof; |
| (v) | franchisor becomes the subject of a bankruptcy action; |
| (vi) | the failure of any quality assurance test requirements if not remedied within the time period, if any, required under the franchise agreement; |
| (vii) | the date that is 12 months prior to the date of any early termination clause is exercisable pursuant to the terms of the franchise agreement; |
| (viii) | a 480 Tarrytown Franchise Agreement Trigger Event – payment date in August 2026, unless prior to such date (i) borrower has renewed/extended the franchise agreement for a term that expires no earlier than February 9, 2039 or executed a replacement franchise agreement and (ii) borrower has paid to lender for deposit into the PIP Account all amounts required to fund any PIP in connection with such renewal/extension. |
| (ix) | a 600 Tarrytown Franchise Agreement Trigger Event – 15 business days after receipt by borrower of a 600 Tarrytown new PIP notice letter, unless the aggregate amount of undisbursed funds in the FF&E Account, the Capital Expenditure Account and the PIP Account plus the amount of any 600 Tarrytown franchise agreement trigger event avoidance collateral, is at least equal to $4,312,500. |
A “PIP Account Funding Franchise Agreement Trigger Event” means a Franchise Agreement Trigger Event which occurs as a result of one or more of clause (i), (ii), (iii), (viii) or (ix) of the definition thereof.
Property Management. The Sheraton Tarrytown Property is managed by Remington Tarrytown Employers, LLC, a non-borrower related entity. The SpringHill Suites Tarrytown Property, Hilton Garden Inn Norwalk Property and the Hilton Garden Inn Shelton Property are self-managed by the borrower sponsor.
Partial Release. Individual property releases are allowed in connection with a third-party arms-length sale subject to (i) defeasance of the loan in an amount equal to 115% of the ALA of the Property being released, (ii) the post-release DSCR being no less than the greater of (a) 1.50x and (b) the DSCR in effect immediately prior to the release, (iii) the post-release LTV being no greater than lesser
THE INFORMATION IN THIS STRUCTURAL AND COLLATERAL TERM SHEET IS NOT COMPLETE AND MAY BE AMENDED PRIOR TO THE TIME OF SALE. THIS TERM SHEET IS NOT AN OFFER TO SELL THESE SECURITIES AND IT IS NOT A SOLICITATION OF AN OFFER TO BUY THESE SECURITIES IN ANY JURISDICTION WHERE THE OFFER OR SALE IS NOT PERMITTED. |
| | 75 | |
| Hospitality – Various | Loan #5 | Cut-off Date Balance: | | $54,371,913 |
| Various | Northeastern Hotel Portfolio | Cut-off Date LTV: | | 50.7% |
| Various | | U/W NCF DSCR: | | 1.56x |
| | | U/W NOI Debt Yield: | | 15.4% |
of (a) 65% and (b) the LTV in effect immediately prior to the release, and (iv) sufficient reserves to pay for any known or anticipated PIP or capex work at the remaining properties.
Real Estate Substitution. Not permitted.
Subordinate and Mezzanine Indebtedness. Not permitted.
Ground Lease. The Hilton Garden Inn Norwalk Property is comprised of the borrower’s leasehold interest under three ground leases: (i) the Norwalk Electric Company ground lease, having an expiration of November 1, 2097, inclusive of extension options, (ii) the Pirri ground lease, having an expiration of October 31, 2097, inclusive of extension options, and (iii) the William A. Collins ground lease, having an expiration of November 9, 2097, inclusive of extension options. The lease with Norwalk Electric Company provides for an annual ground rent increase of 2.0% and the leases with John Pirri, Jr. and William A. Collins provide for an annual ground rent increase of 2.5%. The loan underwriting was based on current ground rent amounts at the time of loan origination.
Terrorism Insurance. The Northeastern Hotel Portfolio Mortgage Loan documents require the Northeastern Hotel Portfolio Borrowers to obtain and maintain property insurance and business interruption insurance for 18 months plus a 12-month extended period of indemnity. Such insurance is required to cover perils of terrorism and acts of terrorism. See “Risk Factors—Risks Relating to the Mortgage Loans—Terrorism Insurance May Not Be Available for All Mortgaged Properties” in the Preliminary Prospectus.
THE INFORMATION IN THIS STRUCTURAL AND COLLATERAL TERM SHEET IS NOT COMPLETE AND MAY BE AMENDED PRIOR TO THE TIME OF SALE. THIS TERM SHEET IS NOT AN OFFER TO SELL THESE SECURITIES AND IT IS NOT A SOLICITATION OF AN OFFER TO BUY THESE SECURITIES IN ANY JURISDICTION WHERE THE OFFER OR SALE IS NOT PERMITTED. |
| | 76 | |
| Office - Suburban | Loan #6 | Cut-off Date Balance: | | $42,000,000 |
| 1100 Enterprise Way | Moffett Towers Building D | Cut-off Date LTV: | | 48.3% |
| Sunnyvale, CA 94089 | | U/W NCF DSCR: | | 1.83x |
| | | U/W NOI Debt Yield: | | 13.2% |
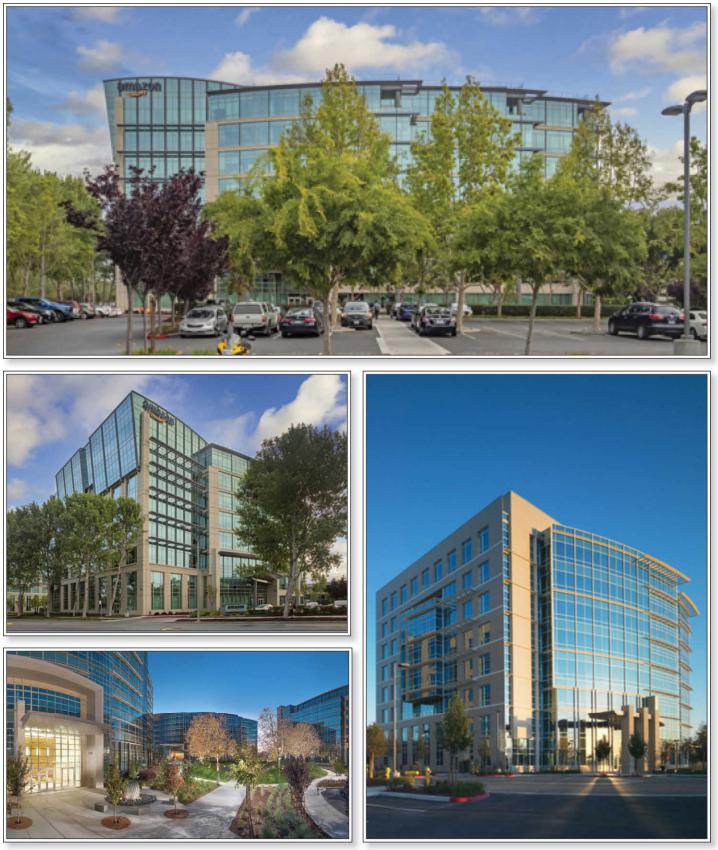
THE INFORMATION IN THIS STRUCTURAL AND COLLATERAL TERM SHEET IS NOT COMPLETE AND MAY BE AMENDED PRIOR TO THE TIME OF SALE. THIS TERM SHEET IS NOT AN OFFER TO SELL THESE SECURITIES AND IT IS NOT A SOLICITATION OF AN OFFER TO BUY THESE SECURITIES IN ANY JURISDICTION WHERE THE OFFER OR SALE IS NOT PERMITTED. |
| | 77 | |
| Office - Suburban | Loan #6 | Cut-off Date Balance: | | $42,000,000 |
| 1100 Enterprise Way | Moffett Towers Building D | Cut-off Date LTV: | | 48.3% |
| Sunnyvale, CA 94089 | | U/W NCF DSCR: | | 1.83x |
| | | U/W NOI Debt Yield: | | 13.2% |
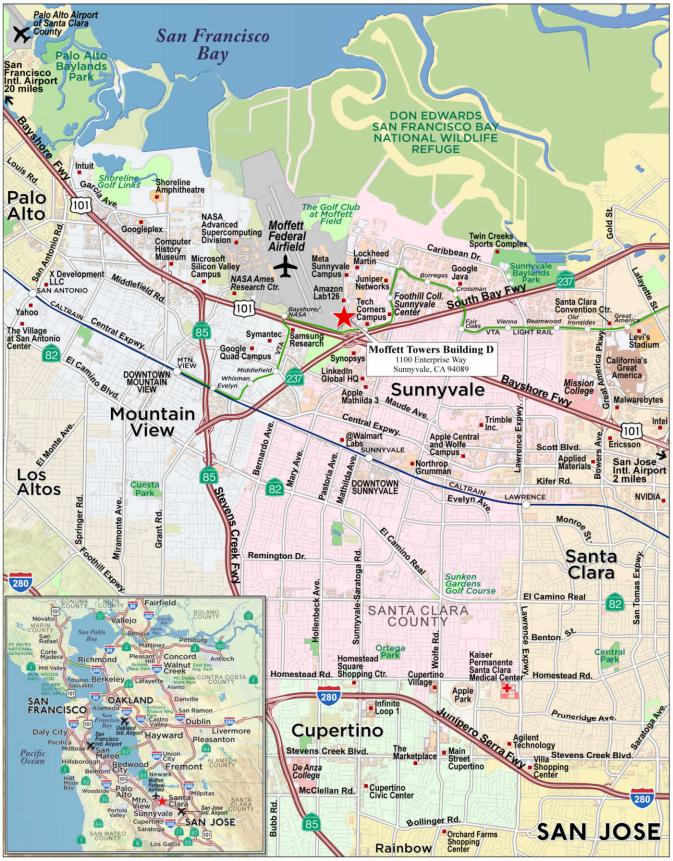
THE INFORMATION IN THIS STRUCTURAL AND COLLATERAL TERM SHEET IS NOT COMPLETE AND MAY BE AMENDED PRIOR TO THE TIME OF SALE. THIS TERM SHEET IS NOT AN OFFER TO SELL THESE SECURITIES AND IT IS NOT A SOLICITATION OF AN OFFER TO BUY THESE SECURITIES IN ANY JURISDICTION WHERE THE OFFER OR SALE IS NOT PERMITTED. |
| | 78 | |
| No. 6 – Moffett Towers Building D |
| Mortgage Loan Information | | Mortgaged Property Information |
| Mortgage Loan Sellers: | Goldman Sachs Mortgage Company, UBS AG | | Single Asset/Portfolio: | Single Asset |
| Credit Assessment (Fitch/KBRA/Moody’s): | NR/NR/Baa3 | | Property Type – Subtype: | Office – Suburban |
| Original Principal Balance(1): | $42,000,000 | | Location: | Sunnyvale, CA |
| Cut-off Date Balance(1): | $42,000,000 | | Size(5): | 357,481 SF |
| % of Initial Pool Balance: | 5.8% | | Cut-off Date Balance Per SF(1): | $405.62 |
| Loan Purpose: | Recapitalization | | Maturity Date Balance Per SF(1): | $405.62 |
| Borrower Sponsor: | Joseph K. Paul (a/k/a Jay Paul) | | Year Built/Renovated: | 2014 / NAP |
| Guarantor: | Paul Guarantor LLC | | Title Vesting: | Fee |
| Mortgage Rate: | 6.96000% | | Property Manager: | Paul Holdings, Inc., dba Jay Paul Company |
| Note Date: | July 19, 2024 | | Current Occupancy (As of): | 100.0% (11/1/2024) |
| Seasoning: | 3 months | | YE 2023 Occupancy: | 100.0% |
| Maturity Date: | August 6, 2029 | | YE 2022 Occupancy: | 100.0% |
| IO Period: | 60 months | | YE 2021 Occupancy: | 100.0% |
| Loan Term (Original): | 60 months | | As-Is Appraised Value: | $300,000,000 |
| Amortization Term (Original): | NAP | | As-Is Appraised Value Per SF: | $839.21 |
| Loan Amortization Type: | Interest Only | | As-Is Appraisal Valuation Date: | June 12, 2024 |
| Call Protection(2): | L(24),YM1(3),DorYM1(26),O(7) | | |
| Lockbox Type: | Hard/In Place Cash Management | | Underwriting and Financial Information(5) |
| Additional Debt(1): | Yes | | TTM May 31, 2024 NOI: | $16,936,938 |
| Additional Debt Type (Balance)(1): | Pari Passu ($103,000,000) | | YE 2023 NOI: | $17,646,474 |
| | | | YE 2022 NOI: | $17,394,645 |
| | | | YE 2021 NOI: | $16,837,894 |
| | | | U/W Revenues: | $26,115,828 |
| Escrows and Reserves(3) | | U/W Expenses: | $6,932,478 |
| | Initial | Monthly | Cap | | U/W NOI: | $19,183,350 |
| Taxes: | $1,035,239 | $207,048 | NAP | | U/W NCF: | $18,749,733 |
| Insurance: | $0 | Springing | NAP | | U/W DSCR based on NOI/NCF: | 1.87x / 1.83x |
| Replacement Reserves: | $0 | Springing | NAP | | U/W Debt Yield based on NOI/NCF: | 13.2% / 12.9% |
| Other Reserves: | $0 | Springing(4) | NAP | | U/W Debt Yield at Maturity based on NOI/NCF: | 13.2% / 12.9% |
| | | | | | Cut-off Date LTV Ratio: | 48.3% |
| | | | | | LTV Ratio at Maturity: | 48.3% |
| | | | | | | | |
| Sources and Uses |
| Sources | | | | | Uses | | | |
| Whole Loan Amount | $145,000,000 | | 100.0% | | Recapitalization(5) | $142,847,446 | | 98.5 | % |
| | | | | | Closing Costs | 1,117,315 | | 0.8 | |
| | | | | | Reserves | 1,035,239 | | 0.7 | |
| Total Sources | $145,000,000 | | 100.0% | | Total Uses | $145,000,000 | | 100.0 | % |
| (1) | The Moffett Towers Building D Mortgage Loan (as defined below) is part of the Moffett Towers Building D Whole Loan (as defined below), which is evidenced by 14 pari passu promissory notes with an aggregate original principal balance of $145,000,000. The Underwriting and Financial Information presented above is based on the aggregate principal balance of the promissory notes comprising the Moffett Towers Building D Whole Loan. |
| (2) | Voluntary prepayment with yield maintenance of the Moffett Towers Building D Whole Loan is permitted in whole (but not in part) on any business day on or after September 6, 2026. Defeasance of the Moffett Towers Building D Whole Loan is permitted in full at any time on or after the date that is the earlier to occur of (i) two years after the closing date of the securitization that includes the last Moffett Towers Building D Whole Loan note to be securitized and (ii) July 19, 2027. The assumed defeasance lockout period of 27 payments is based on the anticipated closing date of the WFCM 2024-5C2 securitization trust in November 2024. The actual defeasance lockout period may be longer. |
| (3) | See “Escrows” below for further discussion of reserve information. |
| (4) | On a monthly basis during a Lease Sweep Period (as defined below), the borrower is required to escrow (i) $643,031 and (ii) available cash, into a lease sweep account. The borrower will have the option, at any time and from time to time, to deliver a letter of credit to the lender in accordance with the terms and conditions set forth in the Moffett Towers Building D Whole Loan documents, in order to prevent a Lease Sweep Period from occurring. |
| (5) | The borrower sponsor’s recapitalization was done to refinance proceeds from the previous loan that was repaid in January 2024. |
The Mortgage Loan. The sixth largest mortgage loan (the “Moffett Towers Building D Mortgage Loan”) is part of a whole loan (the “Moffett Towers Building D Whole Loan”) evidenced by 14 pari passu notes that is secured by the borrower’s fee interest in a 357,481 square foot office building located in Sunnyvale, California (the “Moffett Towers Building D Property”).
THE INFORMATION IN THIS STRUCTURAL AND COLLATERAL TERM SHEET IS NOT COMPLETE AND MAY BE AMENDED PRIOR TO THE TIME OF SALE. THIS TERM SHEET IS NOT AN OFFER TO SELL THESE SECURITIES AND IT IS NOT A SOLICITATION OF AN OFFER TO BUY THESE SECURITIES IN ANY JURISDICTION WHERE THE OFFER OR SALE IS NOT PERMITTED. |
| | 79 | |
| Office - Suburban | Loan #6 | Cut-off Date Balance: | | $42,000,000 |
| 1100 Enterprise Way | Moffett Towers Building D | Cut-off Date LTV: | | 48.3% |
| Sunnyvale, CA 94089 | | U/W NCF DSCR: | | 1.83x |
| | | U/W NOI Debt Yield: | | 13.2% |
The Moffett Towers Building D Mortgage Loan, which is evidenced by the non-controlling notes A-2-2, A-3-1, A-9 and A-10 has an outstanding principal balance as of the Cut-off Date of $42,000,000. The Moffett Towers Building D Whole Loan was originated on July 19, 2024 by Goldman Sachs Bank USA (“GSBI”), DBR Investments Co. Limited (“DBRI”) and UBS AG, New York Branch (“UBS AG”) and has an aggregate outstanding principal balance as of the Cut-off Date of $145,000,000. Notes A-2-2 and A-3-1, with an aggregate outstanding principal balance as of the Cut-off Date of $35,500,000 are being sold by Goldman Sachs Mortgage Company and Notes A-9 and A-10 with an aggregate outstanding principal balance of $6,500,000 as of the Cut-off Date, are being sold by UBS AG. The Moffett Towers Building D Whole Loan has a five-year term, is interest-only for the full term and accrues interest on an Actual/360 basis. The scheduled maturity date of the Moffett Towers Building D Whole Loan is August 6, 2029.
The Moffett Towers Building D Whole Loan will be serviced pursuant to the pooling and servicing agreement for the BMARK 2024-V10 securitization trust. The relationship between the holders of the Moffett Towers Building D Whole Loan is governed by a co-lender agreement. See “Description of the Mortgage Pool—The Whole Loans—The Non-Serviced Pari Passu Whole Loans” in the prospectus.
The table below identifies the promissory notes that comprise the Moffett Towers Building D Whole Loan:
Whole Loan Note Summary
| Notes | Original Balance | Cut-off Date Balance | Note Holder | Controlling Piece |
| A-1 | $25,000,000 | $25,000,000 | BMARK 2024-V10 | Yes |
| A-2-1 | 7,000,000 | 7,000,000 | BMARK 2024-V10 | No |
| A-2-2 | 18,000,000 | 18,000,000 | WFCM 2024-5C2 | No |
| A-3-1 | 17,500,000 | 17,500,000 | WFCM 2024-5C2 | No |
| A-3-2 | 5,000,000 | 5,000,000 | BMO 2024-5C6 | No |
| A-4(1) | 20,000,000 | 20,000,000 | GACC | No |
| A-5-1 | 14,500,000 | 14,500,000 | BMARK 2024-V10 | No |
| A-5-2(1) | 5,500,000 | 5,500,000 | GACC | No |
| A-6-1(1) | 6,000,000 | 6,000,000 | GACC | No |
| A-6-2 | 5,000,000 | 5,000,000 | BMO 2024-5C6 | No |
| A-7 | 10,000,000 | 10,000,000 | BMO 2024-5C6 | No |
| A-8 | 5,000,000 | 5,000,000 | BMO 2024-5C6 | No |
| A-9 | 4,000,000 | 4,000,000 | WFCM 2024-5C2 | No |
| A-10 | 2,500,000 | 2,500,000 | WFCM 2024-5C2 | No |
| Total | $145,000,000 | $145,000,000 | | |
| (1) | Expected to be contributed to one or more future securitization trusts. |
The Borrower and the Borrower Sponsor. The borrower for the Moffett Towers Building D Whole Loan is MT3 1100 LLC, a Delaware limited liability company and single purpose entity with two independent managers. Legal counsel to the borrowers delivered a non-consolidation opinion in connection with the origination of the Moffett Towers Building D Whole Loan. The borrower sponsor is Joseph K. Paul (a/k/a Jay Paul). The borrower sponsor’s affiliate, Paul Guarantor LLC, a Delaware limited liability company, is the guarantor of certain non-recourse carveout liabilities under the Moffett Towers Building D Whole Loan.
The Property. The Moffett Towers Building D Property is a 357,481 SF, eight-story office building located in Sunnyvale, California that was built in 2014. The Moffett Towers Building D Property sits on approximately nine acres. The Moffett Towers Building D Property has been 100% leased to Amazon since February 2014. Amazon recently executed a seven-year renewal through February 2031 at a rental rate of $47.76 PSF with 3.0% contractual rent steps and no tenant improvement dollars. The Moffett Towers Building D Property is a portion of a larger office development known as the Moffett Towers, Phase 2 development, and represents approximately 34.6% of the square footage of the larger development. The Moffett Towers Building D Property shares common area amenities with the larger development such as a parking structure, fitness club, swimming pool, and outdoor patio.
The Moffett Towers Building D Property is part of the larger Moffett Towers Campus development, which is comprised of seven buildings built by the borrower sponsor. The campus totals 1.8 million SF of LEED certified Gold, Class A office space that is currently 100% leased. Since taking occupancy in 2014, Amazon has invested an estimated $45.0 million ($125 PSF) into the Moffett Towers Building D Property. This includes six floors of office space and a specialized lab buildout of the first two floors.
Sole Tenant.
The sole tenant at the Moffett Towers Building D Property is Amazon, pursuant to a NNN lease with a 10-year initial term that commenced in February 2014 and was recently extended through February 28, 2031. Founded in 1994 and headquartered in Seattle, Washington and Arlington, Virginia, Amazon is an online retailer and web service provider offering a wide range of products and services. The Amazon lease at the Moffett Towers Building D Property is guaranteed by Amazon.com, Inc. (rated A1/AA/AA- by Moody’s/S&P/Fitch). The Amazon lease does not contain any termination options.
THE INFORMATION IN THIS STRUCTURAL AND COLLATERAL TERM SHEET IS NOT COMPLETE AND MAY BE AMENDED PRIOR TO THE TIME OF SALE. THIS TERM SHEET IS NOT AN OFFER TO SELL THESE SECURITIES AND IT IS NOT A SOLICITATION OF AN OFFER TO BUY THESE SECURITIES IN ANY JURISDICTION WHERE THE OFFER OR SALE IS NOT PERMITTED. |
| | 80 | |
| Office - Suburban | Loan #6 | Cut-off Date Balance: | | $42,000,000 |
| 1100 Enterprise Way | Moffett Towers Building D | Cut-off Date LTV: | | 48.3% |
| Sunnyvale, CA 94089 | | U/W NCF DSCR: | | 1.83x |
| | | U/W NOI Debt Yield: | | 13.2% |
The following table presents certain information relating to sole tenant at the Moffett Towers Building D Property:
Tenant Summary(1)
| Tenant Name | Tenant Type | Credit Rating (Fitch/ Moody's/ S&P)(2) | Tenant NRSF | % of NRSF | Annual U/W Rent(3) | % of Total Annual U/W Rent(3) | Annual U/W Rent PSF | Term. Option (Y/N) | Lease Expiration Date | Ext. Options |
| Amazon | Office | AA-/A1/AA | 357,481 | 100.0% | $17,585,491 | 100.0% | $49.19 | N | 2/28/2031 | 2 x 7 Yr |
| Total/Wtd. Avg. | | | 357,481 | 100.0% | $17,585,491 | 100.0% | $49.19 | | | |
| | | | | | | | | | | |
| Occupied Total | | | 357,481 | 100.0% | $17,585,491 | 100.0% | $49.19 | | | |
| Vacant Space | | | 0 | 0.0 | | | | | | |
| Total/Wtd. Avg. | | | 357,481 | 100.0% | | | | | | |
| (1) | Based on the underwritten rent roll dated November 1, 2024. |
| (2) | Certain ratings are those of the parent company whether or not the parent guarantees the lease. |
The following table presents certain information relating to the lease rollover schedule at the Moffett Towers Building D Property:
Lease Expiration Schedule(1)
Year Ending
December 31 | No. of Leases Expiring | Expiring NRSF | % of Total NRSF | Cumulative Expiring NRSF | Cumulative % of Total NRSF | Annual
U/W
Base Rent(1) | % of Total Annual U/W Base Rent(1) | Annual
U/W
Base Rent
PSF(1) |
| 2024 & MTM | 0 | 0 | 0.0% | 0 | 0.0% | $0 | 0.0% | $0.00 |
| 2025 | 0 | 0 | 0.0% | 0 | 0.0% | $0 | 0.0% | $0.00 |
| 2026 | 0 | 0 | 0.0% | 0 | 0.0% | $0 | 0.0% | $0.00 |
| 2027 | 0 | 0 | 0.0% | 0 | 0.0% | $0 | 0.0% | $0.00 |
| 2028 | 0 | 0 | 0.0% | 0 | 0.0% | $0 | 0.0% | $0.00 |
| 2029 | 0 | 0 | 0.0% | 0 | 0.0% | $0 | 0.0% | $0.00 |
| 2030 | 0 | 0 | 0.0% | 0 | 0.0% | $0 | 0.0% | $0.00 |
| 2031 | 1 | 357,481 | 100.0% | 357,481 | 100.0% | $17,585,491 | 100.0% | $49.19 |
| 2032 | 0 | 0 | 0.0% | 357,481 | 100.0% | $0 | 0.0% | $0.00 |
| 2033 | 0 | 0 | 0.0% | 357,481 | 100.0% | $0 | 0.0% | $0.00 |
| 2034 | 0 | 0 | 0.0% | 357,481 | 100.0% | $0 | 0.0% | $0.00 |
| 2035 & Beyond | 0 | 0 | 0.0% | 357,481 | 100.0% | $0 | 0.0% | $0.00 |
| Vacant | 0 | NAP | 0.0% | 357,481 | 100.0% | $0 | 0.0% | $0.00 |
| Total/Wtd. Avg. | 1 | 357,481 | 100.0% | | | $17,585,491 | 100.0% | $49.19 |
| (1) | Based on the underwritten rent roll dated November 1, 2024. |
The following table presents historical occupancy percentages at the Moffett Towers Building D Property:
Historical Occupancy
| Historical and Current Occupancy(1) |
| 2020 | 2021 | 2022 | 2023 | Current(2) |
| 100.0% | 100.0% | 100.0% | 100.0% | 100.0% |
| (1) | Historical occupancies are as of December 31 of each respective year. |
| (2) | Based on the underwritten rent roll dated November 1, 2024. |
THE INFORMATION IN THIS STRUCTURAL AND COLLATERAL TERM SHEET IS NOT COMPLETE AND MAY BE AMENDED PRIOR TO THE TIME OF SALE. THIS TERM SHEET IS NOT AN OFFER TO SELL THESE SECURITIES AND IT IS NOT A SOLICITATION OF AN OFFER TO BUY THESE SECURITIES IN ANY JURISDICTION WHERE THE OFFER OR SALE IS NOT PERMITTED. |
| | 81 | |
| Office - Suburban | Loan #6 | Cut-off Date Balance: | | $42,000,000 |
| 1100 Enterprise Way | Moffett Towers Building D | Cut-off Date LTV: | | 48.3% |
| Sunnyvale, CA 94089 | | U/W NCF DSCR: | | 1.83x |
| | | U/W NOI Debt Yield: | | 13.2% |
Operating History and Underwritten Net Cash Flow. The following table presents certain information relating to the historical operating performance and underwritten net cash flow at the Moffett Towers Building D Property:
Cash Flow Analysis
| | 2020 | 2021 | 2022 | 2023 | TTM 5/31/2024 | U/W | %(1) | U/W $ per SF |
| Base Rent(2) | $15,946,343 | $16,424,733 | $16,917,475 | $17,295,285 | $17,239,787 | $17,585,491 | 65.0 | % | $49.19 |
| Credit Tenant Rent Steps(3) | 0 | 0 | 0 | 0 | 0 | 2,138,038 | 7.9 | | 5.98 |
| Amenity Use Fee | 387,155 | 398,769 | 410,732 | 419,905 | 418,558 | 414,509 | 1.5 | | 1.16 |
| Commercial Reimbursement Revenue | 4,962,579 | 5,509,335 | 5,785,025 | 6,212,580 | 6,163,846 | 6,932,235 | 25.6 | | 19.39 |
| Gross Potential Rent | $21,296,076 | $22,332,837 | $23,113,232 | $23,927,769 | $23,822,190 | $27,070,273 | 100.0 | % | $75.73 |
| Vacancy Loss | 0 | 0 | 0 | 0 | 0 | (954,446) | -3.5 | | (2.67) |
| Effective Gross Income | $21,296,076 | $22,332,837 | $23,113,232 | $23,927,769 | $23,822,190 | $26,115,828 | 96.5 | % | $73.06 |
| Real Estate Taxes | 2,299,865 | 2,348,647 | 2,376,645 | 2,409,276 | 2,411,718 | 2,412,207 | 9.2 | | 6.75 |
| Insurance | 488,785 | 657,794 | 775,578 | 881,569 | 922,957 | 959,323 | 3.7 | | 2.68 |
| Repairs & Maintenance | 1,762,488 | 1,959,668 | 2,034,583 | 2,443,900 | 3,004,668 | 3,004,668 | 11.5 | | 8.41 |
| Management Fee | 478,390 | 492,742 | 507,524 | 518,859 | 517,194 | 527,565 | 2.0 | | 1.48 |
| General and Administrative - Direct | 28,224 | 31,849 | 27,439 | 27,388 | 28,473 | 28,473 | 0.1 | | 0.08 |
| Other Expenses | 605 | 4,243 | (3,183) | 302 | 242 | 242 | 0.0 | | 0.00 |
| Total Expenses | $5,058,357 | $5,494,943 | $5,718,587 | $6,281,296 | $6,885,252 | $6,932,478 | 26.5 | % | $19.39 |
| Net Operating Income | $16,237,719 | $16,837,894 | $17,394,645 | $17,646,474 | $16,936,938 | $19,183,350 | 73.5 | % | $53.66 |
| Capital Expenditures | 0 | 0 | 0 | 0 | 0 | 71,496 | 0.3 | | $0.20 |
| TI/LC | 0 | 0 | 0 | 0 | 0 | 362,121 | 1.4 | | $1.01 |
| Net Cash Flow | $16,237,719 | $16,837,894 | $17,394,645 | $17,646,474 | $16,936,938 | $18,749,733 | 71.8 | % | $52.45 |
| | | | | | | | | |
| NOI DSCR(4) | 1.59x | 1.65x | 1.70x | 1.72x | 1.66x | 1.87x | | |
| NCF DSCR(4) | 1.59x | 1.65x | 1.70x | 1.72x | 1.66x | 1.83x | | |
| NOI DY(4) | 11.2% | 11.6% | 12.0% | 12.2% | 11.7% | 13.2% | | |
| NCF DY(4) | 11.2% | 11.6% | 12.0% | 12.2% | 11.7% | 12.9% | | |
| (1) | % column represents percent of Gross Potential Rent for revenue lines and percent of Effective Gross Income for all remaining fields. |
| (2) | Based on the underwritten rent roll dated November 1, 2024. |
| (3) | Credit Tenant Rent Steps reflects the present value of contractual rent step increments for Amazon's investment-grade credit rating. |
| (4) | Debt service coverage ratios and debt yields are based on the Moffett Towers Whole Loan. |
Appraisal. According to the appraisal dated July 1, 2024, the Moffett Towers Building D Property had an “as-is” appraised value of $300,000,000.
Environmental. According to the Phase I environmental report dated August 31, 2023, there are no recognized environmental conditions or recommendations for further action at the Moffett Towers Building D Property.
Market Overview and Competition. The Moffett Towers Building D Property sits in the Moffett Park submarket, which is located within the greater San Jose-Sunnyvale-Santa Clara metropolitan statistical area, alternatively referred to as the Silicon Valley office market. As of the first quarter of 2024, Moffett Park office submarket vacancy is 15.0%, according to a third-party market research report. Sunnyvale is considered a hub for the video game industry and is the former location of Atari’s headquarters. The top employers in Sunnyvale are Google, Apple, LinkedIn, Lockheed Martin Space Systems, and Amazon.
Escrows. At origination of the Moffett Towers Building D Whole Loan, the borrower deposited approximately $1,035,239 into an upfront tax reserve.
Tax Escrows – On a monthly basis, the borrower is required to escrow 1/12th of the annual estimated tax payments payable during the next ensuing 12 months (initially, approximately $207,048).
Insurance Escrows – On a monthly basis, the borrower is required to escrow 1/12th of the annual estimated insurance payments (initially, approximately $79,944). Such reserve has been conditionally waived so long as the borrower maintains a blanket policy meeting the requirements of the Moffett Towers Building D Whole Loan documents and the borrower provides evidence of the renewal of any insurance policy prior to the expiration thereof and receipts for the payment of the applicable premiums. At origination of the Moffett Towers Building D Whole Loan, an acceptable blanket policy was in place.
Replacement Reserve – On a monthly basis during a Trigger Period (as defined below), the borrower is required to escrow approximately $71,496 for the payment or reimbursement of approved capital expenses.
THE INFORMATION IN THIS STRUCTURAL AND COLLATERAL TERM SHEET IS NOT COMPLETE AND MAY BE AMENDED PRIOR TO THE TIME OF SALE. THIS TERM SHEET IS NOT AN OFFER TO SELL THESE SECURITIES AND IT IS NOT A SOLICITATION OF AN OFFER TO BUY THESE SECURITIES IN ANY JURISDICTION WHERE THE OFFER OR SALE IS NOT PERMITTED. |
| | 82 | |
| Office - Suburban | Loan #6 | Cut-off Date Balance: | | $42,000,000 |
| 1100 Enterprise Way | Moffett Towers Building D | Cut-off Date LTV: | | 48.3% |
| Sunnyvale, CA 94089 | | U/W NCF DSCR: | | 1.83x |
| | | U/W NOI Debt Yield: | | 13.2% |
Lease Sweep Reserve – On a monthly basis during a Lease Sweep Period (as defined below), the borrower is required to escrow $643,031 and available cash (as described under “Lockbox / Cash Management” below) into a lease sweep account. The borrower will have the option, at any time and from time to time, to deliver a letter of credit to the lender (as described under “Lockbox / Cash Management” below) in accordance with the terms and conditions set forth in the Moffett Towers Building D Whole Loan documents, in order to prevent the commencement of a Lease Sweep Period (or, if already triggered, to terminate such Lease Sweep Period).
Lockbox / Cash Management. The Moffett Towers Building D Whole Loan is structured with a hard lockbox and in place cash management. The borrower and the property manager, as applicable, are required to cause all rents to be deposited directly into a lender-controlled lockbox account. All revenues received by the borrower or property manager, as applicable, are required to be deposited in the lockbox account within one business day of receipt. Funds in the lockbox account are required to be swept daily into a cash management account and applied according to the cash flow waterfall in the Moffett Towers Building D Whole Loan documents. During a Trigger Period, excess cash flow is required to be swept to an excess cash flow subaccount to be held as additional collateral for the Moffett Towers Building D Whole Loan, unless a Lease Sweep Period exists, in which case all excess cash will be swept to a lease sweep reserve for leasing expenses in connection with a replacement Lease Sweep Lease (as defined below).
A “Trigger Period” means a period commencing upon (i) the occurrence of an event of default, (ii) the commencement of a Low DSCR Period (as defined below) or (iii) the commencement of a Lease Sweep Period; and ending if (A) with respect to a Trigger Period commenced pursuant to clause (i), the event of default commencing the Trigger Period has been cured and such cure has been accepted by the lender (and no other event of default is then continuing), (B) with respect to a Trigger Period commenced due to clause (ii), the Low DSCR Period has ended pursuant to the terms of the Moffett Towers Building D Whole Loan documents (and no other Trigger Period is then continuing), and (C) with respect to a Trigger Period commenced due to clause (iii), the Lease Sweep Period has ended pursuant to the terms of the Moffett Towers Building D Whole Loan documents, as described below (and no other Trigger Period is continuing).
A “Lease Sweep Period”:
(i) will commence on the first monthly payment date following the earliest to occur of any of the following (each, a “Lease Sweep Trigger”):
(a) the date on which, with respect to any “Lease Sweep Lease” (defined as (x) the Amazon lease or (y) any lease which is entered into by borrower in replacement of the Amazon lease, and that, either individually, or when taken together with any other lease with the same tenant or its affiliates, and assuming the exercise of all expansion rights and all preferential rights to lease additional space contained in such replacement lease, demises lease sweep space equal to or greater than 75% or more of the rentable square feet demised under the applicable Lease Sweep Lease as of the loan origination date), (i) the related tenant cancels or terminates its Lease Sweep Lease with respect to all or a material portion of the space subject to such Lease Sweep Lease prior to the then current expiration date under such Lease Sweep Lease, or (ii) the related tenant delivers to the borrower or property manager a notice to the effect that it is canceling or terminating its Lease Sweep Lease with respect to all or a material portion of the space subject to such Lease Sweep Lease; provided, however, no Lease Sweep Period will commence pursuant this clause (i)(a) if, in connection with such termination or cancellation (or delivery of notice of termination or cancellation), the borrower simultaneously enters into a replacement lease(s) with one or more investment-grade entities covering the terminated space, provided that such replacement lease is a Qualified Lease (as defined below) and provided that the Occupancy Conditions (as defined below) are satisfied with respect to such replacement lease within ten business days of the date of such termination or cancellation (or delivery of notice of termination or cancellation);
(b) the date on which, with respect to any Lease Sweep Lease, the related tenant ceases operating its business (i.e., “goes dark”) at 20% or more of its space on a rentable square foot basis; provided, however, that if the tenant (x) is Amazon, (y) is one or more investment-grade entities or (z) has subleased the dark space portion of its premises to one or more investment-grade entities which has accepted delivery thereof (i.e., the lease has commenced) and is paying unabated rent at a contract rate no less than the contract rate required under the Lease Sweep Lease, in any such case, such tenant will be deemed not to have ‘gone dark’ for purposes of this clause (b) and no Lease Sweep Period will commence pursuant to this clause (b);
(c) upon a default under a Lease Sweep Lease by the tenant thereunder that continues beyond any applicable notice and cure period;
(d) upon the occurrence of an insolvency proceeding of the tenant under a Lease Sweep Lease;
(e) the date on which, with respect to the Amazon lease, neither Amazon nor its parent company is rated as an investment-grade entity; or
(f) solely with respect to the occurrence of a casualty during any period when the Amazon lease is in effect, upon the delivery of a Repair Notice (as such term is defined in the Amazon lease) to Amazon that indicates that the anticipated period for repairing the damage resulting from such casualty exceeds 270 days from the date of such casualty (a Repair Notice in such case, a “Termination Option Repair Notice”), pursuant to which Amazon has the option to terminate subject to the terms and conditions set forth in the Amazon lease; and
(ii) will end on the earliest of the applicable of the following to occur:
THE INFORMATION IN THIS STRUCTURAL AND COLLATERAL TERM SHEET IS NOT COMPLETE AND MAY BE AMENDED PRIOR TO THE TIME OF SALE. THIS TERM SHEET IS NOT AN OFFER TO SELL THESE SECURITIES AND IT IS NOT A SOLICITATION OF AN OFFER TO BUY THESE SECURITIES IN ANY JURISDICTION WHERE THE OFFER OR SALE IS NOT PERMITTED. |
| | 83 | |
| Office - Suburban | Loan #6 | Cut-off Date Balance: | | $42,000,000 |
| 1100 Enterprise Way | Moffett Towers Building D | Cut-off Date LTV: | | 48.3% |
| Sunnyvale, CA 94089 | | U/W NCF DSCR: | | 1.83x |
| | | U/W NOI Debt Yield: | | 13.2% |
(1) in the case of clause (i)(a), the date on which, with respect to each Lease Sweep Lease space, one or more replacement tenants acceptable to the lender (in its sole but good faith discretion) execute and deliver replacement lease(s) covering the requisite space, provided that such replacement lease(s) are qualified leases and provided that the Occupancy Conditions are satisfied;
(2) in the case of clause (i)(b) or (i)(e), the date on which either (A) with respect to clause (i)(b) one or more replacement tenants acceptable to the lender (in its sole but good faith discretion) execute and deliver replacement lease(s) covering the requisite space, provided that such replacement tenant(s) and lease(s) are Qualified Leases and provided that the Occupancy Conditions are satisfied or (B) for a dark period event with respect to clause (i)(b) or an Amazon downgrade event (with respect to clause (1)(e)), Amazon (or its parent) is restored as an investment-grade entity or the entirety of the lease sweep space has been sublet to an investment-grade entity which has accepted delivery thereof (i.e., the lease has commenced) and is paying unabated rent (or, alternatively, sufficient funds have been deposited into the lease sweep account to account for all remaining scheduled free rent periods or rent abatements periods under such lease) at a contract rate no less than the contract rate required under the Lease Sweep Lease;
(3) in the case of clause (i)(c) above, the date on which the subject default has been cured and no other default under such Lease Sweep Lease occurs for a period of three consecutive months following such cure;
(4) in the case of clause (i)(d) above, the applicable tenant insolvency proceeding has terminated and the applicable Lease Sweep Lease has been affirmed, assumed or assigned in a manner satisfactory to the lender;
(5) in the case of clause (i)(f) above, if Amazon does not exercise (or does not send notice to the borrower of its intention to exercise) its right to terminate the Amazon lease within 45 days after the delivery to Amazon of a Termination Option Repair Notice;
(6) in the case of clause (i)(f) above, if Amazon does exercise (or sends notice to the borrower of its intention to exercise) its right to terminate the Amazon lease after receipt of such Termination Option Repair Notice, the date on which all of the following are satisfied: (A) the entirety of the applicable lease sweep space is leased pursuant to one or more Qualified Leases and (B) the Occupancy Conditions are satisfied with respect to all such Qualified Leases;
(7) in the case of all Lease Sweep Triggers, the date on which the borrower has delivered a letter of credit to the lender with a face amount equal to $7,716,370, unless, the applicable Lease Sweep Lease space has been leased pursuant to one or more leases which, in the aggregate, (x) require the borrower to incur expenses, including the payment of brokerage commissions, completion of tenant improvements or payment of tenant allowances, and/or (y) provide for free rent periods and/or rent abatement periods with respect to rent amounts, which, in the lender’s determination, exceed $7,716,370 (in which case the Lease Sweep Period in question will continue until the borrower satisfies clause (1) above); and
(8) in the case of all Lease Sweep Triggers other than a tenant insolvency proceeding, the date on which the aggregate amount of funds transferred into the lease sweep account (including any related termination payments with respect to the Lease Sweep Lease(s) in question deposited into the lease sweep account) equals the applicable lease sweep reserve cap set forth in the Moffett Towers Building D Whole Loan documents (for the avoidance of doubt: (x) a Lease Sweep Period terminating pursuant to this clause (ii)(8) will terminate once funds in an amount equal to the applicable lease sweep reserve cap (representing an aggregate amount equal to $55.00 per square foot of the applicable tenant space (except such cap will not apply in the event of a lease sweep tenant insolvency proceeding)) have been transferred into the lease sweep account over the course of the Lease Sweep Period; but all of such funds will not have to be, at any one time, on deposit all at once in such lease sweep account) and (y) if a Lease Sweep Trigger is continuing due to the occurrence of more than one Lease Sweep Trigger, the aggregate amount of funds required to be transferred over the course of the Lease Sweep Period will be equal to the amount of the largest lease sweep reserve cap applicable to all then continuing Lease Sweep Triggers, such that each Lease Sweep Trigger will be treated as concurrent and not duplicative or independent of another.
A “Low DSCR Period” will (i) commence if, as of any calculation date, (A) the Moffett Towers Building D Property is not fully leased to either (a) Amazon or (b) an investment-grade entity with a credit rating that is at least equal to the credit rating of Amazon as of the origination date, in either case pursuant to a lease that is substantially on the same or better terms as the Amazon lease, and (B) the debt service coverage ratio is less than 1.10x and (ii) will end on the date a debt service coverage ratio of at least 1.10x is achieved for at least one calculation date, as determined by the lender.
“Occupancy Conditions” means, with respect to the Lease Sweep Lease space in question, (I) with respect to Lease Sweep Lease space at least equal to the requisite space, the delivery by the borrower to the lender of evidence reasonably satisfactory to the lender (including an estoppel certificate executed by the relevant tenant) that (A) the entirety of such requisite space is leased (or, in the case of a lease renewal or extension, continues to be leased) under one or more Qualified Leases, (B) all contingencies under the lease or leases of the Lease Sweep Lease space in question (or the lease renewal or extension) to the effectiveness of such lease(s) have been satisfied and the rent commencement date under all such lease(s) has been set, (C) all leasing commissions payable in connection with the lease or leases of the Lease Sweep Lease space in question (or the lease renewal or extension) have been paid and all tenant improvement obligations or other landlord obligations of an inducement nature have either been completed or paid in full or, alternatively, sufficient funds have been retained in the lease sweep account for such purposes (the “Unpaid TILC Obligation Amount”), (D) the tenant under the lease or leases of the Lease Sweep Lease space in question (or the lease renewal or extension) has actually commenced paying full contractual rent and any initial free rent period or period of partial rent abatements has expired or, alternatively,
THE INFORMATION IN THIS STRUCTURAL AND COLLATERAL TERM SHEET IS NOT COMPLETE AND MAY BE AMENDED PRIOR TO THE TIME OF SALE. THIS TERM SHEET IS NOT AN OFFER TO SELL THESE SECURITIES AND IT IS NOT A SOLICITATION OF AN OFFER TO BUY THESE SECURITIES IN ANY JURISDICTION WHERE THE OFFER OR SALE IS NOT PERMITTED. |
| | 84 | |
| Office - Suburban | Loan #6 | Cut-off Date Balance: | | $42,000,000 |
| 1100 Enterprise Way | Moffett Towers Building D | Cut-off Date LTV: | | 48.3% |
| Sunnyvale, CA 94089 | | U/W NCF DSCR: | | 1.83x |
| | | U/W NOI Debt Yield: | | 13.2% |
sufficient funds will be retained in the lease sweep account to account for all remaining scheduled free rent periods or rent abatements (the “Remaining Rent Abatement Amount” and, collectively with the Unpaid TILC Obligation Amount, the “Unpaid Landlord Obligations Amount”), and (E) the tenant(s) under the lease or leases of the Lease Sweep Lease space in question (or the lease renewal or extension) have accepted delivery of the demised premises (i.e., the lease has commenced), (II) in the event that the conditions under the foregoing clause (I) are satisfied by Qualified Leases that demise requisite space that is less than 100% of the rentable square feet demised under the Amazon lease as of the origination date (the difference between such space leased under the Amazon lease and the space leased under such Qualified Lease demised to satisfy the foregoing clause (I) being the “Remaining Lease Sweep Space”), the then aggregate amount of funds on deposit in the lease sweep account on account of the Remaining Lease Sweep Space and not previously disbursed or applied (and not allocable to the Unpaid Landlord Obligations Amount), is equal to or greater than the product of (x) the applicable per rentable square foot lease sweep reserve cap and (y) the rentable square feet of the Remaining Lease Sweep Space (including, without limitation, all approved leasing expenses, free rent periods and/or rent abatement periods) and (III) the debt service coverage ratio after giving effect to the lease or leases of the Lease Sweep Lease space in question (or the lease renewal or extension) (taking into account the Remaining Rent Abatement Amount as rents) is no less than a debt service coverage ratio of at least 1.20x.
A “Qualified Lease” means a replacement Lease Sweep Lease or a renewal or extension of an existing Lease Sweep Lease (i) entered into in accordance with the Moffett Towers Building D Whole Loan documents, (ii) (A) in the case of any lease renewal or extension, having an initial term of no less than seven years from the date that the term of the lease being renewed or extended expired (or will expire, if applicable) or (B) in the case of any replacement lease, having an initial term of no less than seven years from the date that the term of the lease being replaced expired and (iii) on economic terms (e.g., base rent, additional rent and recoveries, tenant improvement allowances, etc.) at least as favorable to the landlord as those contained in the Lease Sweep Lease being replaced, renewed or extended; provided, that, in the event the economic terms in the Lease Sweep Lease being replaced are not commercially reasonable for the market at such time in question, such economic terms may be reduced to reflect such market terms, subject to the lender’s reasonable approval.
Subordinate and Mezzanine Debt. None.
Permitted Future Mezzanine or Subordinate Debt. Not permitted.
Partial Release. Not permitted.
Ground Lease. None.
THE INFORMATION IN THIS STRUCTURAL AND COLLATERAL TERM SHEET IS NOT COMPLETE AND MAY BE AMENDED PRIOR TO THE TIME OF SALE. THIS TERM SHEET IS NOT AN OFFER TO SELL THESE SECURITIES AND IT IS NOT A SOLICITATION OF AN OFFER TO BUY THESE SECURITIES IN ANY JURISDICTION WHERE THE OFFER OR SALE IS NOT PERMITTED. |
| | 85 | |
| Various - Various | Loan #7 | Cut-off Date Balance: | | $40,000,000 |
| Various | Rockefeller Center | Cut-off Date LTV: | | 32.3% |
| New York, NY Various | | U/W NCF DSCR: | | 3.17x |
| | | U/W NOI Debt Yield: | | 18.2% |
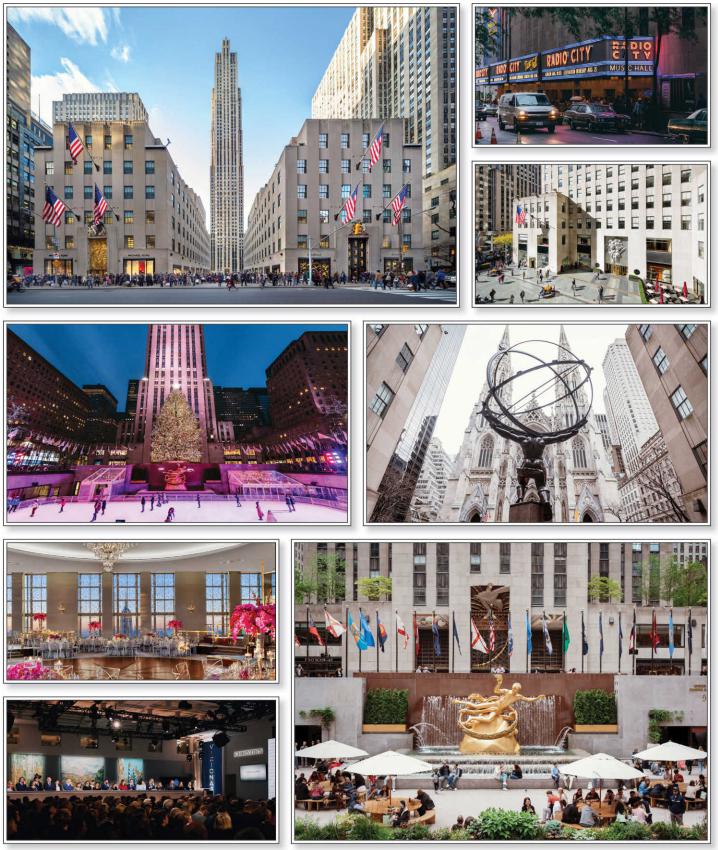
THE INFORMATION IN THIS STRUCTURAL AND COLLATERAL TERM SHEET IS NOT COMPLETE AND MAY BE AMENDED PRIOR TO THE TIME OF SALE. THIS TERM SHEET IS NOT AN OFFER TO SELL THESE SECURITIES AND IT IS NOT A SOLICITATION OF AN OFFER TO BUY THESE SECURITIES IN ANY JURISDICTION WHERE THE OFFER OR SALE IS NOT PERMITTED. |
| | 86 | |
| Various - Various | Loan #7 | Cut-off Date Balance: | | $40,000,000 |
| Various | Rockefeller Center | Cut-off Date LTV: | | 32.3% |
| New York, NY Various | | U/W NCF DSCR: | | 3.17x |
| | | U/W NOI Debt Yield: | | 18.2% |

THE INFORMATION IN THIS STRUCTURAL AND COLLATERAL TERM SHEET IS NOT COMPLETE AND MAY BE AMENDED PRIOR TO THE TIME OF SALE. THIS TERM SHEET IS NOT AN OFFER TO SELL THESE SECURITIES AND IT IS NOT A SOLICITATION OF AN OFFER TO BUY THESE SECURITIES IN ANY JURISDICTION WHERE THE OFFER OR SALE IS NOT PERMITTED. |
| | 87 | |
| Various - Various | Loan #7 | Cut-off Date Balance: | | $40,000,000 |
| Various | Rockefeller Center | Cut-off Date LTV: | | 32.3% |
| New York, NY Various | | U/W NCF DSCR: | | 3.17x |
| | | U/W NOI Debt Yield: | | 18.2% |
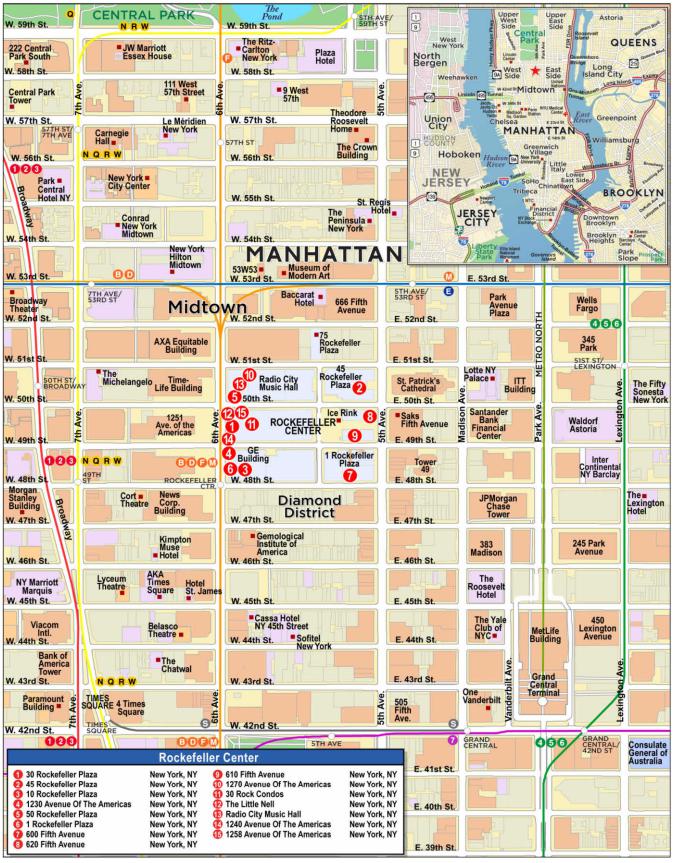
THE INFORMATION IN THIS STRUCTURAL AND COLLATERAL TERM SHEET IS NOT COMPLETE AND MAY BE AMENDED PRIOR TO THE TIME OF SALE. THIS TERM SHEET IS NOT AN OFFER TO SELL THESE SECURITIES AND IT IS NOT A SOLICITATION OF AN OFFER TO BUY THESE SECURITIES IN ANY JURISDICTION WHERE THE OFFER OR SALE IS NOT PERMITTED. |
| | 88 | |
| No. 7 – Rockefeller Center |
| Mortgage Loan Information | | Mortgaged Property Information |
| Mortgage Loan Seller: | Wells Fargo Bank, National Association | | Single Asset/Portfolio: | Portfolio |
Credit Assessment (Fitch/KBRA/Moody’s): | A+/AAA/Aaa | | Property Type – Subtype(6): | Various - Various |
| Original Principal Balance(1): | $40,000,000 | | Location: | New York, NY |
| Cut-off Date Balance(1): | $40,000,000 | | Size: | 7,207,470 SF |
| % of Initial Pool Balance: | 5.6% | | Cut-off Date Balance Per SF(1): | $273.12 |
| Loan Purpose: | Refinance | | Maturity Date Balance Per SF(1): | $273.12 |
| Borrower Sponsors: | Tishman Speyer Properties, L.P. and Henry Crown and Company S LLC | | Year Built/Renovated: | Various/Various |
| Guarantor: | Tishman Speyer Crown Equities LLC | | Title Vesting: | Fee |
| Mortgage Rate(2): | 5.39209% | | Property Manager: | Tishman Speyer Properties, L.L.C. (borrower-related) |
| Note Date: | October 18, 2024 | | Current Occupancy (As of): | 92.6% (7/1/2024) |
| Seasoning: | 0 months | | YE 2023 Occupancy: | 90.7% |
| Maturity Date: | November 9, 2029 | | YE 2022 Occupancy: | 90.7% |
| IO Period: | 60 months | | YE 2021 Occupancy: | 89.4% |
| Loan Term (Original): | 60 months | | As-Is Appraised Value(7): | $6,100,000,000 |
| Amortization Term (Original): | NAP | | As-Is Appraised Value Per SF(7): | $846.34 |
| Loan Amortization Type: | Interest Only | | As-Is Appraisal Valuation Date: | July 31, 2024 |
| Call Protection(3): | L(24),D(29),O(7) | | | |
| Lockbox Type: | Hard/Springing Cash Management | | Underwriting and Financial Information(8) |
| Additional Debt(1): | Yes | | TTM NOI (7/31/2024): | $305,588,525 |
| Additional Debt Type (Balance)(1)(4): | Pari Passu ($1,928,500,000); B-Note ($1,531,500,000); Future Mezzanine | | YE 2023 NOI: | $272,403,335 |
| | | | YE 2022 NOI: | $256,670,015 |
| | | YE 2021 NOI: | $210,968,405 |
| | | | U/W Revenues: | $746,062,620 |
| Escrows and Reserves(5) | | U/W Expenses: | $386,983,682 |
| | Initial | Monthly | Cap | | U/W NOI: | $359,078,938 |
| Taxes | $0 | Springing | NAP | | U/W NCF: | $336,015,034 |
| Insurance | $0 | Springing | NAP | | U/W DSCR based on NOI/NCF(1): | 3.38x / 3.17x |
| Replacement Reserve | $0 | Springing | $2,162,241 | | U/W Debt Yield based on NOI/NCF(1): | 18.2% / 17.1% |
| TI/LC Reserve | $0 | $1,801,868 | NAP | | U/W Debt Yield at Maturity based on NOI/NCF(1): | 18.2% / 17.1% |
| Specified Tenant Reserves: | $246,794,668 | $0 | NAP | | Cut-off Date LTV Ratio(1)(7): | 32.3% |
| | | | | | LTV Ratio at Maturity(1)(7): | 32.3% |
| | | | | | | | | |
| Sources and Uses |
| Sources | | | | | Uses | | | |
| Whole Loan Amount | $3,500,000,000 | | 100.0% | | Senior CMBS Loan Payoff | $1,693,761,952 | | 48.4% |
| | | | | | Mezzanine Loan Payoff | 1,232,641,045 | | 35.2 |
| | | | | | Upfront Reserves | 246,794,668 | | 7.1 |
| | | | | | Return of Equity | 160,315,156 | | 4.6 |
| | | | | | Closing Costs | 89,694,962 | | 2.6 |
| | | | | | 30 Rock Condo Acquisition Loan(8) | $76,792,216 | | 2.2 |
| Total Sources | $3,500,000,000 | | 100.0% | | Total Uses | $3,500,000,000 | | 100.0% |
| (1) | The Rockefeller Center Mortgage Loan (as defined below) is part of the Rockefeller Center Whole Loan (as defined below) with an original aggregate principal balance of $3,500,000,000. The Underwriting and Financial Information presented above are based on the Rockefeller Center Senior Loan (as defined below). The Cut-off Date Balance per SF, Maturity Date Balance per SF, U/W Debt Yield based on NOI, U/W Debt Yield at Maturity based on NOI, U/W DSCR based on NCF, Cut-off Date LTV Ratio and LTV Ratio at Maturity based upon the Rockefeller Center Whole Loan are $486.61, $486.61, 10.3%, 10.3%, 1.54x, 57.4% and 57.4%, respectively. |
| (2) | Reflects the Rockefeller Center Senior Loan only. The Rockefeller Center Subordinate Companion Loan (as defined below) bears interest at the rate of 7.29912823832844% per annum. |
| (3) | Defeasance of the Rockefeller Center Whole Loan is permitted at any time after the earlier to occur of (a) the end of the two-year period commencing on the closing date of the securitization of the last promissory note representing a portion of the Rockefeller Center Whole Loan to be securitized and (b) December 9, 2027. The assumed defeasance lockout period of 24 payments is based on the closing date of the WFCM 2024-5C2 transaction in November 2024. |
| (4) | See “The Mortgage Loan” and “Subordinate and Mezzanine Indebtedness” below for further discussion of additional debt. |
| (5) | See “Escrows” below for further discussion of reserve requirements. |
| (6) | See “The Properties” section below for further discussion. |
| (7) | The individual Rockefeller Center Properties (as defined below) have a combined appraised value of $6,090,000,000, which was rounded to $6,100,000,000 by the appraiser for the portfolio value. The Cut-off Date LTV Ratio and LTV Ratio at Maturity are based on the rounded appraised value. |
| (8) | The 30 Rock Condo Acquisition Loan encumbers approximately 215,031 SF (approximately 15% of 30 Rockefeller Plaza property’s SF) across six floors at the 30 Rockefeller Plaza property. The condos were purchased from NBC in 2007 and separately financed. |
THE INFORMATION IN THIS STRUCTURAL AND COLLATERAL TERM SHEET IS NOT COMPLETE AND MAY BE AMENDED PRIOR TO THE TIME OF SALE. THIS TERM SHEET IS NOT AN OFFER TO SELL THESE SECURITIES AND IT IS NOT A SOLICITATION OF AN OFFER TO BUY THESE SECURITIES IN ANY JURISDICTION WHERE THE OFFER OR SALE IS NOT PERMITTED. |
| | 89 | |
| Various - Various | Loan #7 | Cut-off Date Balance: | | $40,000,000 |
| Various | Rockefeller Center | Cut-off Date LTV: | | 32.3% |
| New York, NY Various | | U/W NCF DSCR: | | 3.17x |
| | | U/W NOI Debt Yield: | | 18.2% |
The Mortgage Loan. The seventh largest mortgage loan (the “Rockefeller Center Mortgage Loan”) is part of a whole loan evidenced by six senior promissory notes in the aggregate original principal amount of $1,968,500,000 (the “Rockefeller Center Senior Loan”) and two subordinate B-Notes in the aggregate original principal amount of $1,531,500,000 that are subordinate to the Rockefeller Center Senior Loan (the “Rockefeller Center Subordinate Companion Loan”, and together with the Rockefeller Center Senior Loan, the “Rockefeller Center Whole Loan”). The Rockefeller Center Whole Loan was co-originated by Bank of America, N.A. (“BANA”) and Wells Fargo Bank, National Association (“WFB”). The Rockefeller Center Whole Loan is secured by the borrowers’ fee simple interest in a 7,207,470 SF, 13-building primarily mixed use office and retail (including attractions) hospitality and theater complex located in New York, New York (the “Rockefeller Center Properties” or “Rockefeller Center”). The Rockefeller Center Mortgage Loan is evidenced by the non-controlling Note A-4 and Note A-6 with an aggregate outstanding principal balance as of the Cut-off Date of $40,000,000. The Rockefeller Center Whole Loan will be serviced pursuant to the pooling and servicing agreement for the ROCK Trust 2024-CNTR securitization trust. See “Description of the Mortgage Pool—The Whole Loans—The Non-Serviced AB Whole Loans—The Rockefeller Center AB Whole Loan” and “Pooling and Servicing Agreement—Servicing of the Non-Serviced Whole Loans” in the prospectus.
Whole Loan Note Summary
| Notes | Original Balance | Cut-off Date Balance | Note Holder | Controlling Piece |
| Senior Notes |
| A-1 | $1,121,100,000 | $1,121,100,000 | ROCK 2024-CNTR | Yes |
| A-2 | $747,400,000 | $747,400,000 | ROCK 2024-CNTR | No |
| A-3(1) | $30,000,000 | $30,000,000 | BANA | No |
| A-4 | $20,000,000 | $20,000,000 | WFCM 2024-5C2 | No |
| A-5(1) | $30,000,000 | $30,000,000 | BANA | No |
| A-6 | $20,000,000 | $20,000,000 | WFCM 2024-5C2 | No |
| Total Senior Notes | $1,968,500,000 | $1,968,500,000 | | |
| |
| Subordinate Notes |
| B-1, B-2 | $1,531,500,000 | $1,531,500,000 | ROCK 2024-CNTR | No |
| Total (Whole Loan) | $3,500,000,000 | $3,500,000,000 | | |
| (1) | Expected to be securitized in future transactions. |
The Borrowers and Borrower Sponsors. The borrowers are RCPI Landmark Properties, L.L.C., RCPI 30 Rock 22234849, L.L.C. and RCPI 600 Fifth Holdings, L.L.C., each a Delaware limited liability company and single purpose entity with two independent directors. The borrowers are owned by a joint venture between the borrower sponsors, Tishman Speyer Properties, L.P. (“Tishman”) and Henry Crown and Company S LLC (“HCC”). The non-recourse carveout guarantor for the Rockefeller Center Whole Loan is Tishman Speyer Crown Equities LLC. The obligations of the non-recourse carveout guarantors are limited as set forth under “Description of the Mortgage Pool—Non-Recourse Carveout Limitations” in the prospectus. Legal counsel to the borrowers delivered a non-consolidation opinion in connection with the origination of the Rockefeller Center Whole Loan.
Tishman is a leading owner, developer, operator, and fund manager of real estate around the world. Founded in 1978, Tishman is active across the United States, Europe, Brazil, and Asia, building and managing premier office, residential, life science, and retail space in over 35 key global markets for industry-leading tenants. Their assets include New York City's Rockefeller Center, The Springs in Shanghai, Paris Bourse in Paris, and Frankfurt’s OpernTurm and TaunusTurm. Tishman operates and owns a portfolio of over 84 million SF worth nearly $65 billion.
HCC has origins dating back to 1919 and is a Chicago-based, privately held organization that oversees the interests of the Crown Family. Their portfolio includes investments in publicly traded securities, real estate, private investments, and privately held operating companies.
The Properties. The Rockefeller Center Properties are comprised of 7,207,470 SF across 13 mixed-use office and retail, hospitality and theater, Class A buildings located on a 12-acre site in Midtown Manhattan, New York. The Rockefeller Center Properties encompass the six square blocks between Fifth Avenue and Avenue of the Americas to the east and the west, respectively, and West 48th and West 51st Streets to the south and the north, respectively. The Rockefeller Center Properties were constructed in phases from 1890-1952, centered around a private street, known as Rockefeller Plaza (the “Plaza”). In 1985, the original sections of Rockefeller Center (building exteriors and interior portions of 30 Rockefeller Plaza, 45 Rockefeller Plaza, One Rockefeller Plaza and Radio City Music Hall) were declared as landmarked by the New York City Landmarks Preservation Commission. From 2019 through July 2024, the borrower sponsors invested approximately $419.1 million across Rockefeller Center to add to the existing entertainment options at the Rockefeller Center Properties, modified the elevators at 45 Rockefeller Plaza, and made other base building improvements.
In total, the Rockefeller Center Properties consist of approximately 5.5 million SF of office space, approximately 1.4 million SF of retail space, approximately 280,000 SF of storage space and a 652-space garage. As of July 1, 2024, the Rockefeller Center Properties were 92.6% leased to a diverse tenant roster of more than 400 unique tenants with a weighted average lease term remaining of approximately 13 years. Historical occupancy since 2015 has averaged 92.9%. Rockefeller Center is the corporate headquarter location for tenants including Deloitte LLP, Lazard Group LLC, Christie’s, NBC Universal Media, and Simon & Schuster, Inc. Major retail tenants include FAO Schwarz, Lego, Nintendo World, Alo Yoga and Tiffany & Co. amongst others. The approximately 100 retail tenants generated approximately $369 million in total sales as of TTM July 2024. The approximately 40 restaurant tenants at the Rink Level generated approximately $55.2 million in total sales as of TTM July 2024.
THE INFORMATION IN THIS STRUCTURAL AND COLLATERAL TERM SHEET IS NOT COMPLETE AND MAY BE AMENDED PRIOR TO THE TIME OF SALE. THIS TERM SHEET IS NOT AN OFFER TO SELL THESE SECURITIES AND IT IS NOT A SOLICITATION OF AN OFFER TO BUY THESE SECURITIES IN ANY JURISDICTION WHERE THE OFFER OR SALE IS NOT PERMITTED. |
| | 90 | |
| Various - Various | Loan #7 | Cut-off Date Balance: | | $40,000,000 |
| Various | Rockefeller Center | Cut-off Date LTV: | | 32.3% |
| New York, NY Various | | U/W NCF DSCR: | | 3.17x |
| | | U/W NOI Debt Yield: | | 18.2% |
Rockefeller Center is an internationally known destination that contains a wide range of attractions, including: the Top of the Rock Observation Deck, with recently added features including The Beam and Skylift, The Rink at Rockefeller Center, with the adjacent Rink Level retail dining center, Radio City Music Hall (a 6,000-seat theater operated by Madison Square Garden), Rainbow Room, 620 Loft & Gardens and Radio Park, a 24,000 SF private outdoor park atop Radio City Music Hall exclusively for Rockefeller Center tenants during business hours, but open to the public for private events. As of TTM July 2024, the Rockefeller Center Properties have seen more than 35 million visitors.
The borrower sponsors own a condominium interest in three interconnected buildings (30 Rockefeller Plaza, 1250 Avenue of the Americas, and the Studio building between and contiguous to 30 Rockefeller Plaza and 1250 Avenue of the Americas) totaling 54 condominium units, and an approximately 53.1% undivided interest in the common elements. The borrower’s collateral includes the following floors: subbasement, concourse, exterior patio, street level, mezzanine level, mechanical space on floor 2, 19, 20, 22-45, 48-50, 54-69 and the roof, and excludes the following floors: 2 (with the exception of select mechanical space) 3-18, 21, 46- 47 and 51-53. The balance of the condominium units are owned by an NBC-affiliated entity (NBCUniversal Atlas LLC, a Delaware limited liability company), and leased (or sub-leased, as the case may be) to NBC. Expenses of the condominium are shared among the owners in accordance with their respective interests therein. The condominium is governed by a five-member board of managers, three of whom are selected by the borrower and two of whom are selected by NBC. Substantially all management decisions are vested in an “executive committee consisting of the three managers selected by the borrower, provided that certain capital improvements and/or alterations that may adversely affect NBC or the condominium are subject to prior review and comment by NBC.
The following table presents certain information for the Rockefeller Center Properties:
| Rockefeller Center Properties Summary |
| Property | Year Built | Property Type/Sub Type | Allocated Cut-Off Mortgage Loan Amount | Size(1) | Occ.(1) | Top Tenant(1) | % SF | U/W NOI | % U/W NOI | Appraised Value(2) |
| 30 Rockefeller Plaza(3)(4) | 1932 | Mixed Use/ Office/Retail | $17,132,571 | 1,627,738 | 89.9% | Deloitte LLP | 31.1% | $162,927,882 | 45.4% | $2,602,679,711 |
| 45 Rockefeller Plaza | 1934 | Mixed Use/ Office/Retail | $5,638,857 | 1,299,726 | 91.4% | Baker & Hostetler LLP | 11.8% | $54,313,260 | 15.1% | $860,000,000 |
| 10 Rockefeller Plaza(5) | 1939 | Mixed Use/ Office/Retail | $3,056,000 | 481,299 | 100.0% | Christie's | 54.0% | $22,308,605 | 6.2% | $466,000,000 |
| 1230 Avenue Of The Americas | 1939 | Office/CBD | $2,984,000 | 739,920 | 99.5% | Simon & Schuster, Inc. | 40.6% | $30,639,067 | 8.5% | $455,000,000 |
| 50 Rockefeller Plaza | 1938 | Mixed Use/ Office/Retail | $2,163,429 | 508,677 | 95.1% | Katten Muchin Rosenman LLP | 28.3% | $21,715,563 | 6.0% | $330,000,000 |
| 1 Rockefeller Plaza | 1936 | Office/ CBD | $1,606,857 | 613,308 | 91.5% | Atalaya Capital Management LP | 4.2% | $13,970,917 | 3.9% | $245,000,000 |
| 600 Fifth Avenue | 1952 | Mixed Use/ Office/Retail | $1,573,714 | 436,788 | 90.0% | Lazard Group LLC | 19.3% | $14,557,163 | 4.1% | $240,000,000 |
| 620 Fifth Avenue(6) | 1936 | Mixed Use/ Office/Retail | $1,475,429 | 124,152 | 99.2% | NBC | 40.7% | $8,856,480 | 2.5% | $225,000,000 |
| 610 Fifth Avenue | 1932 | Mixed Use/ Office/Retail | $1,212,571 | 134,265 | 89.8% | Catterton Latin America Management L.L.C. | 13.6% | $10,060,108 | 2.8% | $185,000,000 |
| 1270 Avenue Of The Americas | 1931 | Office/CBD | $996,571 | 521,518 | 77.4% | 1270 Office Suites LLC | 7.1% | $8,823,398 | 2.5% | $152,000,000 |
| 30 Rock Condos(7) | 1932 | Office/CBD | $656,000 | NAP | NAP | NAP | NAP | NAV | NAV | $100,000,000 |
| The Little Nell(5) | 1939 | Hospitality/ Full Service | $656,000 | 160,019 | 100.0% | Little Nell Big Apple | 100.0% | NAV | NAV | $100,000,000 |
| Radio City Music Hall(8) | 1932 | Other/ Theater | $537,143 | 548,250 | 100.0% | Radio City Productions LLC | 100.0% | $8,107,253 | 2.3% | $82,000,000 |
| 1240 Avenue Of The Americas | 1890 | Retail/ Anchored | $174,857 | 5,761 | 100.0% | Rock Center Townhouse F & B, LLC | 63.4% | $1,571,077 | 0.4% | $26,606,122 |
| 1258 Avenue Of The Americas | 1933 | Retail/ Single Tenant | $136,000 | 6,049 | 100.0% | Warby Parker Retail Inc | 100.0% | $1,228,165 | 0.3% | $20,714,166 |
| Total / Wtd. Avg. | | | $40,000,000 | 7,207,470 | 92.6% | | 100.0% | $359,078,938 | 100.0% | $6,100,000,000 |
| (1) | Based on the underwritten rent roll dated July 1, 2024. |
| (2) | The individual properties for the Rockefeller Center Properties have a combined appraised value of $6,090,000,000, which was rounded to $6,100,000,000 by the appraiser for the portfolio value. |
| (3) | The borrower sponsor owns approximately 56% of the 30 Rockefeller Plaza building. NBC is a tenant in both the portion of 30 Rockefeller Plaza property that will serve as collateral for the Rockefeller Center Whole Loan and owns the remaining portion of 30 Rockefeller Plaza building which will not serve as collateral for the Rockefeller Center Whole Loan. All figures referencing 30 Rockefeller Plaza property in this term sheet are collateral for the Rockefeller Center Whole Loan. |
| (4) | 30 Rockefeller Plaza property includes tourist attractions including Observation Deck including The Bean and Skylift (17.0% of U/W NOI), The Rink at Rockefeller Center (2.1% of U/W NOI) and an event space, Rainbow Room (0.6% of U/W NOI). Top of the Rock is a three-level indoor and outdoor observation deck at 30 Rockefeller Plaza, occupying floors 67, 69 and 70. The Rink at Rockefeller Center is a skating rink located at the base of 30 Rock in the middle of the Rockefeller Center campus. The skating rink is seasonal, typically open from October to March. Rainbow Room is a premier private event space for corporate receptions, galas, weddings, celebrations and other special events. |
THE INFORMATION IN THIS STRUCTURAL AND COLLATERAL TERM SHEET IS NOT COMPLETE AND MAY BE AMENDED PRIOR TO THE TIME OF SALE. THIS TERM SHEET IS NOT AN OFFER TO SELL THESE SECURITIES AND IT IS NOT A SOLICITATION OF AN OFFER TO BUY THESE SECURITIES IN ANY JURISDICTION WHERE THE OFFER OR SALE IS NOT PERMITTED. |
| | 91 | |
| Various - Various | Loan #7 | Cut-off Date Balance: | | $40,000,000 |
| Various | Rockefeller Center | Cut-off Date LTV: | | 32.3% |
| New York, NY Various | | U/W NCF DSCR: | | 3.17x |
| | | U/W NOI Debt Yield: | | 18.2% |
| (5) | 620 Fifth Avenue includes RC Venues (0.5% of U/W NOI), which comprises of indoor loft and outdoor garden, a reflection pool, that offers views of historic Saint Patrick’s Cathedral and all of Rockefeller Center. |
| (6) | With respect The Little Nell property, the borrower sponsor has entered in a 99-year lease with respect to the 7th through 17th floors (160,019 SF) of the 10 Rockefeller Plaza property (which were previously utilized as office space) with Little Nell Big Apple to convert such floors to hotel use. Little Nell Big Apple is currently under a free rent period and the rent on the hotel lease will commence on the earlier of (i) the hotel opening date or (ii) March 1, 2026. All tenant and financial information related to the Little Nell property is included in the 10 Rockefeller Plaza property. |
| (7) | Radio City Music Hall is the largest indoor theatre in the world, well-known for the annual Radio City Christmas Spectacular featuring the Rockettes. The Great Stage measures 60 feet high and 100 feet wide. Radio City Music Hall is a designated landmark by the New York City Landmarks Preservation Commission. In 2021, Radio City renewed its lease for 15 years starting in 2023 and the hall is operated by Madison Square Garden. |
Major Tenants.
Deloitte LLP (506,091 square feet, 7.0% net rentable area, 8.7% underwritten base rent, September 30, 2028, expiration). Deloitte LLP (“Deloitte”) is a provider of audit and assurance, tax and legal, consulting, financial advisory, and risk advisory services across more than 150 countries and territories. Deloitte has been a tenant at 30 Rockefeller Plaza since 2011, and currently leases 506,091 SF across 14 floors in three contiguous blocks. Deloitte’s lease has a current expiration of September 30, 2028, with two five-year or one ten-year renewal options remaining and no termination options. Based on the underwritten rent roll dated July 1, 2024, Deloitte pays a base rent of $83.65 PSF, which is inclusive of rent steps through September 2025.
Lazard Group LLC (444,100 square feet, 6.2% of net rentable area; 8.0% of underwritten base rent, October 31, 2033, expiration). Founded in 1848, Lazard Group LLC (“Lazard”) is a financial advisory and asset management firms, with operations in North America, South America, Europe, the Middle East, Asia, and Australia. Lazard provides advice on mergers and acquisitions, capital markets and capital solutions, restructuring and liability management, geopolitics, and other strategic matters, as well as asset management and investment solutions to institutions, corporations, governments, partnerships, family offices, and high net worth individuals. Lazard leases space at four properties: 30 Rockefeller Plaza (324,180 SF), 600 Fifth Avenue (84,335 SF) and 50 Rockefeller Plaza (482 SF). Lazard’s lease has a current expiration of October 31, 2033, with two five-year or one ten-year renewal options remaining and no termination options. Based on the underwritten rent roll dated July 1, 2024, Lazard pays an annual base rent of $86.85 PSF, which represents straight lined rent through the end of the end of the loan term.
Christie's (373,212 square feet; 5.2% of net rentable area; 5.6% of underwritten base rent, March 31, 2050, expiration). Founded in 1766, Christie’s is an art and luxury business with a physical presence in 46 countries throughout the Americas, Europe, Middle East, and Asia Pacific, and flagship international sales hubs in New York, London, Hong Kong, Paris and Geneva. Christie’s network of specialists offers its clients a full portfolio of global services, including art appraisal, art financing, international real estate and education. Christie’s auctions span more than 80 art and luxury categories, at price points ranging from $500 to over $100 million. Christie’s leases both office (144,475 SF) and retail (228,737 SF) space at two properties: 10 Rockefeller Plaza (259,712 SF) and 1230 Avenue Of The Americas (113,500 SF). Christie’s lease has a current expiration of March 31, 2050, with two ten-year renewal options remaining and no termination options. Based on the underwritten rent roll dated July 1, 2024, Christie’s pays an annual base rent of $72.34 PSF, which is inclusive of rent steps through September 2025.
THE INFORMATION IN THIS STRUCTURAL AND COLLATERAL TERM SHEET IS NOT COMPLETE AND MAY BE AMENDED PRIOR TO THE TIME OF SALE. THIS TERM SHEET IS NOT AN OFFER TO SELL THESE SECURITIES AND IT IS NOT A SOLICITATION OF AN OFFER TO BUY THESE SECURITIES IN ANY JURISDICTION WHERE THE OFFER OR SALE IS NOT PERMITTED. |
| | 92 | |
| Various - Various | Loan #7 | Cut-off Date Balance: | | $40,000,000 |
| Various | Rockefeller Center | Cut-off Date LTV: | | 32.3% |
| New York, NY Various | | U/W NCF DSCR: | | 3.17x |
| | | U/W NOI Debt Yield: | | 18.2% |
The following table presents certain information relating to the tenancy at the Rockefeller Center Property:
Major Tenants(1)
| Tenant Name | Credit Rating (Fitch/ Moody’s/
S&P)(2) | Property | Tenant NRSF | % of
NRSF | Annual U/W Rent PSF | Annual
U/W Rent | % of Total Annual U/W Rent | Lease
Expiration
Date | Extension Options | Termination Option (Y/N) |
| Major Tenants | | | | | | | | | |
| Deloitte LLP | NR/NR/NR | (3) | 506,091 | 7.0% | $83.65 | $42,333,317 | 8.7% | 9/30/2028 | 2 x 5yr or 1 x 10yr | N |
| Lazard Group LLC | BBB+/Baa3/BBB+ | (4) | 444,100 | 6.2% | $86.85 | $38,571,135 | 8.0% | 10/31/2033 | 2 x 5yr or 1 x 10yr | N |
| Christie’s | NR/NR/NR | (5) | 373,212 | 5.2% | $72.34 | $26,996,815 | 5.6% | 3/31/2050 | 2 x 10yr | N |
| JPMorgan Chase Bank, National Association | AA-/A1/A- | (6) | 280,253 | 3.9% | $80.96 | $22,689,474 | 4.7% | 8/31/2037 | 1 x 5yr | N |
| NBC | A-/A3/A- | (7) | 194,277 | 2.7% | $108.99 | $21,173,609 | 4.4% | Various(6) | 2 x 5yr | N |
| Simon & Schuster, Inc. | NR/NR/NR | 1230 Avenue Of The Americas | 300,120 | 4.2% | $63.95 | $19,193,544 | 4.0% | 11/30/2034 | 1 x 5yr | N |
| Radio City Productions LLC | NR/NR/NR | (8) | 578,313 | 8.0% | $22.48 | $13,000,000 | 2.7% | 8/31/2038 | 1 x 10yr | N |
| Baker & Hostetler LLP | NR/NR/NR | 45 Rockefeller Plaza | 153,592 | 2.1% | $74.50 | $11,442,604 | 2.4% | 2/28/2027 | 2 x 5yr | N |
| Katten Muchin Rosenman LLP | NR/NR/NR | 50 Rockefeller Plaza | 143,899 | 2.0% | $82.35 | $11,850,620 | 2.4% | 7/31/2032 | 2 x 5yr or 1 x 10yr | N |
| Tishman Speyer Properties, L.P. | NR/NR/NR | (9) | 128,917 | 1.8% | $86.42 | $11,140,513 | 2.3% | Various(8) | 1 x 5yr and 1x1 yr | N |
| Total Major Tenants | | | 3,102,774 | 43.0% | $70.39 | $218,391,631 | 45.1% | | | |
Non-Major Tenants | | | 3,571,597 | 49.6% | $74.45 | $265,905,034 | 54.9% | | | |
Occupied Collateral Total | | 6,674,371 | 92.6% | $72.56 | $484,296,665 | 100.0% | | | |
| | | | | | | | | | |
| Vacant Space | | 533,099 | 7.4% | | | | | | |
| | | | | | | | | | |
| Collateral Total | | 7,207,470 | 100.0% | | | | | | |
| | | | | | | | | | | |
| (1) | Based on the underwritten rent roll dated July 1, 2024, inclusive of rent steps through September 2025. |
| (2) | Certain ratings are those of the parent company whether or not the parent guarantees the lease. |
| (3) | Deloitte LLP leases spaces across two properties: 30 Rockefeller Plaza and 30 Rock Condos. |
| (4) | Lazard Group LLC leases spaces across four properties: 30 Rockefeller Plaza, 30 Rock condos, 50 Rockefeller Plaza and 600 Fifth Avenue. |
| (5) | Christie’s leases spaces across two properties (1230 Avenue Of The Americas and 10 Rockefeller Plaza). Christie’s recently signed an extension through 2050. |
| (6) | JPMorgan Chase Bank, National Association leases spaces across two properties (1230 Avenue Of The Americas and 10 Rockefeller Plaza). |
| (7) | NBC occupies space across seven properties (620 Fifth Avenue – 50,570 SF, 4/30/2031; 600 Fifth Avenue – 9,063 SF, 1/26/2031; 50 Rockefeller Plaza – 3,100 SF, 9/30/2030, 3,362 SF, 1/26/2031, 4,582 SF, 2/29/2032; 45 Rockefeller Plaza – 629 SF, 1/26/2031; 30 Rockefeller Plaza – 93,043 SF, 2024-2034; 10 Rockefeller Plaza – 25,808 SF, 12/31/2038; and 1 Rockefeller Plaza – 556 SF, 1/26/2031, 3,564 SF, 12/31/2040). |
| (8) | Radio City Productions LLC leases spaces across three properties (Radio City Music Hall, 50 Rockefeller Plaza and 1270 Avenue Of The Americas). |
| (9) | Tishman Speyer Properties, L.P. is one of the borrower sponsor and occupies space across three properties (50 Rockefeller Plaza – 1,367 SF, 3/31/2039; 45 Rockefeller Plaza – 118,967 SF, 3/31/2039; 1270 Avenue Of The Americas – 552 SF, 11/30/2024, 8,031 SF, 4/30/2025). |
THE INFORMATION IN THIS STRUCTURAL AND COLLATERAL TERM SHEET IS NOT COMPLETE AND MAY BE AMENDED PRIOR TO THE TIME OF SALE. THIS TERM SHEET IS NOT AN OFFER TO SELL THESE SECURITIES AND IT IS NOT A SOLICITATION OF AN OFFER TO BUY THESE SECURITIES IN ANY JURISDICTION WHERE THE OFFER OR SALE IS NOT PERMITTED. |
| | 93 | |
| Various - Various | Loan #7 | Cut-off Date Balance: | | $40,000,000 |
| Various | Rockefeller Center | Cut-off Date LTV: | | 32.3% |
| New York, NY Various | | U/W NCF DSCR: | | 3.17x |
| | | U/W NOI Debt Yield: | | 18.2% |
The following table presents sales information related to certain tenants at the Rockefeller Center Property:
| Tenant Sales(1) |
| Tenant Name | Building | 2019(2) | 2020(2) |
2021(2) | 2022(2) | 2023(2) | TTM July 2024 | TTM July 2024 Sales PSF |
| Banana Republic | 45 Rockefeller Plaza | $19,038,269 | $4,123,230 | $7,617,356 | $11,959,817 | $11,617,332 | $13,196,192 | $277 |
| FAO ROC Holdings LLC | 30 Rockefeller Plaza | $23,219,653 | $4,770,887 | $13,706,152 | $24,081,707 | $31,160,656 | $34,775,747 | $1,713 |
| Urbn US Retail LLC (Anthropologie) | 50 Rockefeller Plaza | $12,720,885 | $2,439,595 | $4,771,098 | $8,278,731 | $13,285,501 | $13,537,050 | $620 |
| Grace Holmes, Inc. (J.Crew) | 30 Rockefeller Plaza | $12,924,379 | $4,655,393 | $5,623,264 | $9,499,137 | $11,739,208 | $11,994,154 | $871 |
| NES Merchandising, Inc. (Nintendo World) | 10 Rockefeller Plaza | $19,636,952 | $5,515,369 | $14,530,156 | $19,267,693 | $21,423,658 | $19,624,649 | $1,523 |
| Lego Brand Retail, Inc. | 45 Rockefeller Plaza | $12,679,477 | $3,872,609 | $7,864,670 | $17,953,695 | $20,579,995 | $22,066,095 | $1,832 |
| Alo, LLC | 600 Fifth Avenue | $0 | $0 | $0 | $4,565,333 | $14,174,628 | $16,293,409 | $1,717 |
| Del Frisco’s Grille of New York LLC | 50 Rockefeller Plaza | $12,138,089 | $5,045,499 | $8,578,896 | $10,470,379 | $10,712,434 | $10,453,475 | $2,226 |
| Bill’s Bar & Burger R.C., LLC | 45 Rockefeller Plaza | $10,155,397 | $2,046,318 | $3,350,709 | $8,821,509 | $10,915,380 | $11,197,691 | $1,145 |
| Limani 51, LLC | 45 Rockefeller Plaza | $8,460,852 | $2,602,482 | $5,196,117 | $8,429,001 | $8,810,762 | $8,009,770 | $1,010 |
| (1) | All sales and sales PSF information is based upon information provided by the borrower sponsor. In certain instances, sales figures represent estimates because the tenants are not required to report, or otherwise may not have reported, sales information on a timely basis. Further, because sales are self-reported by tenants, such information is not independently verified by the borrower sponsor. |
| (2) | Shown as of December 31 of each respective year. |
The following table presents certain information relating to the lease rollover schedule at the Rockefeller Center Property:
Lease Expiration Schedule(1)(2)
Year Ending
December 31, | No. of Leases Expiring | Expiring NRSF | % of Total NRSF | Cumulative Expiring NRSF | Cumulative % of Total NRSF | Annual
U/W
Rent | % of Total Annual U/W Rent | Annual
U/W
Rent
PSF |
| MTM/2024 | 53 | 154,190 | 2.1% | 154,190 | 2.1% | $5,189,399 | 1.1% | $33.66 |
| 2025 | 73 | 271,100 | 3.8% | 425,290 | 5.9% | $20,746,563 | 4.3% | $76.53 |
| 2026 | 66 | 218,472 | 3.0% | 643,762 | 8.9% | $18,576,718 | 3.8% | $85.03 |
| 2027 | 82 | 483,449 | 6.7% | 1,127,211 | 15.6% | $47,431,002 | 9.8% | $98.11 |
| 2028 | 94 | 747,567 | 10.4% | 1,874,778 | 26.0% | $64,772,555 | 13.4% | $86.64 |
| 2029(3) | 55 | 166,944 | 2.3% | 2,041,722 | 28.3% | $14,397,233 | 3.0% | $86.24 |
| 2030 | 109 | 234,410 | 3.3% | 2,276,132 | 31.6% | $18,307,244 | 3.8% | $78.10 |
| 2031 | 40 | 209,922 | 2.9% | 2,486,054 | 34.5% | $17,959,154 | 3.7% | $85.55 |
| 2032 | 39 | 243,395 | 3.4% | 2,729,449 | 37.9% | $18,635,896 | 3.8% | $76.57 |
| 2033 | 59 | 734,522 | 10.2% | 3,463,971 | 48.1% | $64,078,905 | 13.2% | $87.24 |
| 2034 | 48 | 730,908 | 10.1% | 4,194,879 | 58.2% | $56,204,188 | 11.6% | $76.90 |
| Thereafter | 237 | 2,479,492 | 34.4% | 6,674,371 | 92.6% | $137,997,807 | 28.5% | $55.66 |
| Vacant | 0 | 533,099 | 7.4% | 7,207,470 | 100.0% | $0 | 0.0% | $0.00 |
| Total/Weighted Average | 955 | 7,207,470 | 100.0% | | | $484,296,665 | 100.0% | $72.56(4) |
| (1) | Based on the underwritten rent roll dated July 1, 2024, inclusive of rent steps through September 2025. |
| (2) | Certain tenants may have lease termination options that are exercisable prior to the originally stated expiration date of the subject lease and that are not considered in the Lease Expiration Schedule. |
| (3) | The Rockefeller Center Whole Loan has a maturity date of November 9, 2029. |
| (4) | Total/Wtd. Avg. Annual Gross U/W Rent PSF excludes vacant space. |
The following table presents historical occupancy percentages at the Rockefeller Center Property:
Historical Occupancy
12/31/2019(1) | 12/31/2020(1) | 12/31/2021(1) | 12/31/2022(1) | 12/31/2023(1) | 7/1/2024(2) |
| 94.0% | 92.4% | 89.4% | 90.7% | 90.7% | 92.6% |
| (1) | Information obtained from the borrower and reflects office and retail space at the property. |
| (2) | Information obtained from the underwritten rent roll as of July 1, 2024. |
THE INFORMATION IN THIS STRUCTURAL AND COLLATERAL TERM SHEET IS NOT COMPLETE AND MAY BE AMENDED PRIOR TO THE TIME OF SALE. THIS TERM SHEET IS NOT AN OFFER TO SELL THESE SECURITIES AND IT IS NOT A SOLICITATION OF AN OFFER TO BUY THESE SECURITIES IN ANY JURISDICTION WHERE THE OFFER OR SALE IS NOT PERMITTED. |
| | 94 | |
| Various - Various | Loan #7 | Cut-off Date Balance: | | $40,000,000 |
| Various | Rockefeller Center | Cut-off Date LTV: | | 32.3% |
| New York, NY Various | | U/W NCF DSCR: | | 3.17x |
| | | U/W NOI Debt Yield: | | 18.2% |
Underwritten Net Cash Flow. The following table presents certain information relating to the underwritten net cash flow at the Rockefeller Center Property:
| | 2019 | 2020 | 2021 | 2022 | 2023 | 7/31/2024 TTM | U/W | %(1) | U/W $ per SF |
| In-Place Rent | $469,246,185 | $456,301,805 | $408,505,537 | $409,801,259 | $436,059,731 | $449,007,744 | $472,577,190(2) | 90.4% | $65.57 |
| Rent Steps | $0 | $0 | $0 | $0 | $0 | $0 | $9,092,872(3) | 1.7% | $1.26 |
| SL Rent | $0 | $0 | $0 | $0 | $0 | $0 | $2,626,603(4) | 0.5% | $0.36 |
| Gross-Up Vacant Rent | $0 | $0 | $0 | $0 | $0 | $0 | $38,290,058 | 7.3% | $5.31 |
| Net Rentable Income | $469,246,185 | $456,301,805 | $408,505,537 | $409,801,259 | $436,059,731 | $449,007,744 | $522,586,724 | 100.0% | $72.51 |
| Recoveries | $81,267,448 | $67,159,607 | $53,993,015 | $52,381,284 | $49,755,985 | $42,823,716 | $47,063,817 | 9.0% | $6.53 |
| (Vacancy / Credit Loss) | $0 | $0 | $0 | $0 | $0 | $0 | ($41,578,749) | (8.0%)(5) | ($5.77) |
| Observation Deck Income | $87,810,972 | $13,905,668 | $20,758,855 | $56,815,949 | $63,377,324 | $74,374,418 | $102,230,616(6) | 19.6% | $14.18 |
| Other Income | $91,715,321 | $53,249,746 | $76,009,185 | $108,507,095 | $130,503,958 | $128,226,540 | $115,760,212(7) | 22.2% | $16.06 |
| Effective Gross Income | $730,039,926 | $590,616,826 | $559,266,592 | $627,505,587 | $679,696,998 | $694,432,418 | $746,062,620 | 142.8% | $103.51 |
| | | | | | | | | | |
| Real Estate Taxes | $141,090,777 | $145,843,480 | $143,384,782 | $135,797,910 | $132,727,079 | $132,809,056 | $133,986,693 | 18.0% | $18.59 |
| Insurance | $7,287,699 | $9,440,987 | $10,964,123 | $12,265,953 | $12,529,642 | $13,435,619 | $15,091,435 | 2.0% | $2.09 |
| Other Expenses | $237,506,619 | $200,063,967 | $193,949,282 | $222,771,709 | $262,036,942 | $242,599,218 | $237,905,554 | 31.9% | $33.01 |
| Total Expenses | $385,885,095 | $355,348,434 | $348,298,187 | $370,835,572 | $407,293,663 | $388,843,893 | $386,983,682 | 51.9% | $53.69 |
| | | | | | | | | | |
| Net Operating Income | $344,154,831(8) | $235,268,392(8) | $210,968,405(8) | $256,670,015(8) | $272,403,335 | $305,588,525(9) | $359,078,938(9) | 48.1% | $49.82 |
| Replacement Reserves | $0 | $0 | $0 | $0 | $0 | $0 | $1,441,494 | 0.2% | $0.20 |
| TI/LC | $0 | $0 | $0 | $0 | $0 | $0 | $21,622,410 | 2.9% | $3.00 |
| Net Cash Flow | $344,154,831 | $235,268,392 | $210,968,405 | $256,670,015 | $272,403,335 | $305,588,525 | $336,015,034 | 45.0% | $46.62 |
| | | | | | | | | | |
| NOI DSCR(10) | 3.24x | 2.22x | 1.99x | 2.42x | 2.57x | 2.88x | 3.38x | | |
| NCF DSCR(10) | 3.24x | 2.22x | 1.99x | 2.42x | 2.57x | 2.88x | 3.17x | | |
| NOI Debt Yield(10) | 17.5% | 12.0% | 10.7% | 13.0% | 13.8% | 15.5% | 18.2% | | |
| NCF Debt Yield(10) | 17.5% | 12.0% | 10.7% | 13.0% | 13.8% | 15.5% | 17.1% | | |
| (1) | Represents (i) percent of Net Rental Income for all revenue fields and Vacancy & Credit Loss and (ii) percent of Effective Gross Income for all other fields. |
| (2) | U/W In-Place Rent is based on the underwritten rent roll as of July 1, 2024. |
| (3) | U/W Rent Steps were taken through September 2025. |
| (4) | U/W SL Rent represents average rents for investment grade rated tenants through the lesser of the Rockefeller Center Whole Loan term or the lease term. |
| (5) | The underwritten economic vacancy is 7.3%. The Rockefeller Center Property was 92.6% leased as of July 1, 2024. |
| (6) | U/W Observation Deck Income is calculated based on an estimated per capita spend of approximately $42 and 2.4 million annual visitors. The per capita spend is based on assumptions for average general admission ticket prices, average ticket prices and penetration rates for The Beam and Skylift attractions, and average spend on ancillary revenue sources including retail, photos, and tours. |
| (7) | U/W Other Income includes studio coworking and gather income (15.6%), parking income (4.2%), percentage rent income (8.5%), ice rink income (11.8%), Rainbow Room income (20.0%), cleaning company income (14.1%), RC Venues income (3.1%), plaza income (3.7%) and other miscellaneous income. |
| (8) | The decrease in NOI year-over-year between 2019 and 2021 and subsequent increase between 2021 and 2022 was primarily driven by a decrease in Observation Deck Income and Other Income in 2020 and 2021 during the COVID-19 pandemic. |
| (9) | The increase in NOI between 7/31/2024 TTM and U/W is primarily due (i) to the borrower sponsor signing new leases commencing between January 2024 and February 2025 comprising 6.7% of the NRA, (ii) rent steps through September 2025 totalling approximately $9.1 million, (iii) straight line rent averaging for investment grade tenants totalling approximately $2.6 million, and (iv) an increase in observation deck income driven by the Beam opening in December 2023 and the Skylift opening in October 2024. |
| (10) | Based on the Rockefeller Center Senior Loan. |
Appraisal. The appraiser concluded to an “as-is” value for the Rockefeller Center Properties of $6,100,000,000 as of July 31, 2024. The individual properties Rockefeller Center Properties have a combined appraised value of $6,090,000,000, which was rounded to $6,100,000,000 by the appraiser for the portfolio value.
Environmental Matters. According to the Phase I environmental site assessment dated September 6, 2024, there was recognized environmental conditions identified at the 10 Rockefeller Center related to underground storage tanks (“USTs”), all of which were removed in 1990. See “Description of the Mortgage Pool – Environmental Considerations” in the Preliminary Prospectus.
According to the Phase I environmental site assessments dated September 6, 2024, there were no recognized environmental conditions identified at any of the other properties.
Market Overview and Competition. The Rockefeller Center Properties are located across six full blocks bounded by Fifth Avenue, Avenue of the Americas, West 48th and West 51st Streets, in proximity to several notable landmarks including Grand Central Station, the Chrysler Building, the United Nations, St. Patrick’s Cathedral, the Empire State Building, the New York Public Library, Carnegie Hall, Bryant Park and Central Park. Other attractions in the area include the Museum of Modern Art and a variety of high-end retail stores. The Rockefeller Center Properties are situated within one block of multiple subway lines, 0.5 miles from Grand Central Terminal, and 0.2 miles from one of New York’s largest tourist destinations, Times Square. Due to the proximity to Grand Central Station, tenants, shoppers, and visitors have access to the Metro-North Railroad, NJ Transit and the Long Island Railroad. The Rockefeller Center Properties provide direct access to the 47th-50th Street Subway Station (B, D, F, and M trains) via the street and rink level and is
THE INFORMATION IN THIS STRUCTURAL AND COLLATERAL TERM SHEET IS NOT COMPLETE AND MAY BE AMENDED PRIOR TO THE TIME OF SALE. THIS TERM SHEET IS NOT AN OFFER TO SELL THESE SECURITIES AND IT IS NOT A SOLICITATION OF AN OFFER TO BUY THESE SECURITIES IN ANY JURISDICTION WHERE THE OFFER OR SALE IS NOT PERMITTED. |
| | 95 | |
| Various - Various | Loan #7 | Cut-off Date Balance: | | $40,000,000 |
| Various | Rockefeller Center | Cut-off Date LTV: | | 32.3% |
| New York, NY Various | | U/W NCF DSCR: | | 3.17x |
| | | U/W NOI Debt Yield: | | 18.2% |
within a 10-minute walk of Times Square Station (1, 2, 3, 7, A, C, E, N, Q, R, S, and W trains) and Grand Central Terminal (4, 5, 6, 7, and S trains).
The Rockefeller Center Properties are located in New York City’s Plaza District office submarket. The Plaza District is generally bounded by 47th Street to the south and 65th Street to the north, from Avenue of the Americas to Park Avenue. The Plaza District office submarket is one of Manhattan’s largest submarket by SF, with a robust mix of financial, legal, and professional service tenants. Historically, the Plaza District office submarket has evidenced the highest rents in Midtown Manhattan, with a direct asking rental rate for Class A space of $96.30 PSF, as of July 2024. The total submarket saw a 1.5% rental increase from 2022 to 2023, as compared to a 0.9% increase seen in the total New York City CBD.
The Rockefeller Center Properties are located in New York City’s Midtown Manhattan retail submarket, which includes a variety of department stores, boutiques, jewelers, furriers, art galleries, antique shops, rare collector shops, wine cellars, and gourmet food shops. Occupants include Saks Fifth Avenue, Cartier, Tiffany & Co., Louis Vuitton, Gucci, Prada, Chanel, Christian Dior, Gianni Versace, Canada Goose, Oscar De La Renta and Burberry. Within the Midtown Manhattan retail submarket, retail tenants from 49th-60th Street along Fifth Avenue command the highest rents within the city. As of the second quarter of 2024, asking rents grew approximately 8% year-over-year from $590 PSF to $637 PSF, as availability decreased by nearly 43%.
Escrows.
Real Estate Taxes – On a monthly basis during a Cash Trap Event Period (as defined below), the borrowers are required to escrow 1/12th of the annual estimated tax payments.
Insurance – On a monthly basis during a Cash Trap Event Period and if there is no approved blanket policy in place, the borrowers are required to escrow 1/12th of the annual estimated insurance payments.
Replacement Reserve – On a monthly basis during a Cash Trap Event Period, the borrowers are required to escrow $120,125 for replacement reserves, capped at $2,162,241.
TI/LC Reserve – On a monthly basis, the borrowers are required to make deposits of $1,801,868 into a TI/LC reserve account. If on any monthly payment date, provided no event of default exists, the amount of funds on deposit in the TI/LC reserve account equals or exceeds $85.00 per rentable square foot of the applicable lease sweep premises (the “Lease Sweep Cap”), the borrower will no longer be obligated to deposit a monthly TI/LC reserve; provided that, in the event that the amount of funds on deposit in the TI/LC reserve account is less than the Lease Sweep Cap, the borrower will again be required to make monthly TI/LC deposits until the Lease Sweep Cap has been achieved.
Specified Tenant Reserve – At origination, the borrowers deposited $246,794,668 into a Specified Tenant Reserve for outstanding landlord obligations of free rent, gap rent, and leasing reserves for certain tenants.
Condominium Common Charges Reserve – On a monthly basis during a Cash Trap Event Period, the borrowers are required to escrow an amount equal to the monthly amount set forth in the annual budget and/or in any written notice received by borrowers from the condominium board for condominium common charges related to 30 Rockefeller Plaza and 10 Rockefeller Plaza.
Lockbox and Cash Management. The Rockefeller Center Whole Loan is structured with a hard lockbox and springing cash management. The borrowers were required to establish at origination a deposit account (which, absent the continuation of a Cash Trap Event Period, may be a borrower operating account) for the benefit of the lender (in which the lender was granted a security interest and will have control pursuant to a deposit account control agreement acceptable to lender) at a financial institution acceptable to lender into which all tenants at the Rockefeller Center Properties are required to be instructed to directly deposit all rents and revenues. The borrowers may access and expend the funds in the deposit account in their sole discretion absent the continuation of a Cash Trap Event Period. On each business day during a Cash Trap Event Period, funds on deposit in the deposit account are required to be transferred to a cash management account established by the lender. Provided no event of default exists, funds on deposit in the cash management account are required to be used on each monthly payment date to fund debt service payments, escrow and reserve deposits and other payments due under the loan documents (including amounts required on account of a Lease Sweep Trigger (as defined below)), to pay operating expenses related to the Rockefeller Center Properties in accordance with an annual budget approved by the lender (subject to variances not to exceed 10% of the applicable budget line item or 5% of the budget in the aggregate), and any excess funds (“Excess Cash”) are required to be held in escrow as additional collateral for the Rockefeller Center Whole Loan. Notwithstanding the foregoing, until (x) an event of default has occurred and (y) the lender has commenced foreclosure proceedings or obtained a receiver, the lender is required to make cash flow from the Rockefeller Center Properties and Excess Cash available for the payment of real estate taxes and similar charges, insurance premiums, utilities, wages and benefits of employees and other budgeted non-discretionary operating expenses. Excess Cash held by the lender is required to be returned to the following the discontinuance of a Cash Trap Event Period (provided no other Cash Trap Event Period is then continuing).
A “Cash Trap Event Period” will commence upon the first to occur of (i) an event of default under the Rockefeller Center Whole Loan or an approved mezzanine loan, (ii) the debt yield falling below 7.75% on a trailing 12 month basis (tested quarterly), (iii) the debt service coverage ratio falling below 1.25x on a trailing 12 month basis (tested quarterly), or (iv) a Lease Sweep Trigger (as defined below), occurs and continues until such time as (a) with respect to clause (i) above the cure or waiver of such event of default, (b) with respect to clause (ii), the debt yield is at least 7.75% on a trailing 12 month basis (tested quarterly for one calendar quarter) or the borrowers deposit Cash Trap Event Cure Collateral, (c) with respect to clause (iii), the debt service coverage ratio is at least 1.25x
THE INFORMATION IN THIS STRUCTURAL AND COLLATERAL TERM SHEET IS NOT COMPLETE AND MAY BE AMENDED PRIOR TO THE TIME OF SALE. THIS TERM SHEET IS NOT AN OFFER TO SELL THESE SECURITIES AND IT IS NOT A SOLICITATION OF AN OFFER TO BUY THESE SECURITIES IN ANY JURISDICTION WHERE THE OFFER OR SALE IS NOT PERMITTED. |
| | 96 | |
| Various - Various | Loan #7 | Cut-off Date Balance: | | $40,000,000 |
| Various | Rockefeller Center | Cut-off Date LTV: | | 32.3% |
| New York, NY Various | | U/W NCF DSCR: | | 3.17x |
| | | U/W NOI Debt Yield: | | 18.2% |
on a trailing 12 month basis (tested quarterly for one calendar quarter) or the borrowers deposit Cash Trap Event Cure Collateral, and (d) with respect to clause (iv), a Lease Sweep Trigger Cure Event (as defined below) has occurred.
During a Cash Trap Event Period, the borrowers may post cash or an acceptable letter of credit or utilize Excess Cash in an amount necessary to achieve the applicable debt yield or debt service coverage ratio if drawn and hypothetically applied to reduce principal (“Cash Trap Event Cure Collateral”). Such cash or letter of credit is required to be released to the borrowers following the discontinuance of a Cash Trap Event Period.
A “Lease Sweep Trigger” will occur upon the first monthly payment date following the first to occur of (i) the date that is the earlier of (a) 12 months prior to the expiration of the applicable major lease, (b) the expiration date of the notice period to exercise any extension option contained within any such major lease, and (c) the date the subject Major Tenant (as defined below) gives notice, in accordance with the applicable major lease, of its intention not to extend the applicable major lease as to more than 50% of the total rentable square footage of the subject major lease, in each case (a), (b), and (c), unless the subject Major Tenant has given notice of renewal or extension of the applicable major lease in accordance with the terms thereof as to at least 50% of the applicable premises; provided, however, that no Lease Sweep Trigger will occur if the borrowers simultaneously or theretofore enters into one or more replacement leases in accordance with the loan documents covering at least 90% of the terminated space (or an equivalent amount of space elsewhere in the Rockefeller Center Properties); (ii) the date on which a Major Tenant terminates or gives a valid notice to terminate as to more than 50% of the total rentable square footage of the subject major lease and such termination is to occur within 12 months thereafter; provided, however, that no Lease Sweep Trigger will occur if the borrowers simultaneously or theretofore enters into one or more replacement leases in accordance with the loan documents covering at least 90% of the terminated space (or an equivalent amount of space elsewhere in the Rockefeller Center Properties); (iii) the date on which a Major Tenant goes dark (unless such Major Tenant or any replacement tenant is investment grade rated) as to more than 50% of its total rentable square footage; (iv) a monetary default or material non-monetary default by a Major Tenant under its lease taking into account any notice, grace or cure provisions with respect thereto, provided that a Major Tenant’s non-payment of rents up to $2,500,000 in the aggregate will not constitute a Lease Sweep Trigger if such payment is the result of a good faith dispute and the borrowers are pursuing an expeditious resolution of such dispute in a commercially reasonable manner and such dispute is resolved within 180 days; or (v) a Major Tenant or guarantor becomes subject to insolvency proceedings.
A “Major Tenant” means each tenant that (i) is an affiliate of a borrower (other than leases covering the offices of the manager (except to the extent that the same would constitute major leases pursuant to clause (ii) of this definition) and the operating leases), (ii) occupies more than 250,000 net rentable SF of space at the Rockefeller Center Properties, when aggregated with all the other leases with the same tenant and its affiliates, and assuming the exercise of all rights to lease additional space contained in such lease(s), or (iii) whose lease contains an option, offer, right of first refusal or other similar entitlement to purchase all or any portion of the Rockefeller Center Properties.
A “Lease Sweep Trigger Cure Event” will occur upon the earliest of, (a) with respect to clauses (i),(ii), (iii), (iv) and (v) of the definition of Lease Sweep Trigger, entry into one or more replacement leases in accordance with the loan documents covering at least 90% of the applicable square footage that was the subject of the Lease Sweep Trigger (or an equivalent amount of space elsewhere in the Rockefeller Center Properties); (b) with respect to clause (iii) of the definition of Lease Sweep Trigger, the date on which the Major Tenant re-opens within at least 50% of its total rentable square footage for a period of not less than three months, (c) with respect to clause (iv) of the definition of Lease Sweep Trigger, the date on which the event of default has been cured; or (d) with respect to clause (v) of the definition of Lease Sweep Trigger, the Major Tenant or guarantor insolvency proceedings have terminated and the major lease or the applicable guaranty has been affirmed, assumed, or assigned in a manner reasonably satisfactory to lender. The amount of excess cash flow collected during a Cash Trap Event Period for a Lease Sweep Trigger and moved to the TI/LC reserve account will be capped at $85 per square foot of affected space (and upon first achieving the same, the applicable Cash Trap Event Period will cease assuming no other Cash Trap Event Period is continuing).
During a Cash Trap Event Period, the borrowers may post cash, utilize Excess Cash or an acceptable letter of credit in an amount necessary to achieve the applicable debt yield or debt service coverage ratio if drawn and hypothetically applied to reduce principal. Such cash or letter of credit is required to be released to the borrowers following the discontinuance of a Cash Sweep Period.
Property Management. The Rockefeller Center Property is self-managed by Tishman Speyer Properties, L.L.C., an affiliate of the borrowers.
Partial Release. Provided no event of default is ongoing, the Rockefeller Center Borrower has the right, at any time after the lockout period and to the maturity date, to obtain the release of any of the Rockefeller Center Properties from the lien of the Rockefeller Center Whole Loan, provided that certain conditions are satisfied, including, but not limited to, the following:
| (i) | partial defeasance (prior to open period start date) or partial prepayment (on or after open period start date) in an amount equal to 120% of the allocated loan amount for 30 Rockefeller Plaza and 45 Rockefeller Plaza and 110% of the allocated loan amount for all other properties; |
| (ii) | the NCF DSCR immediately following the release being equal to or greater than the NCF DSCR ratio immediate prior to the release; |
| (iii) | the NOI DY immediately following the release being equal to or greater than the NOI DY immediately prior to the release; and |
| (iv) | compliance with all applicable REMIC requirements. |
THE INFORMATION IN THIS STRUCTURAL AND COLLATERAL TERM SHEET IS NOT COMPLETE AND MAY BE AMENDED PRIOR TO THE TIME OF SALE. THIS TERM SHEET IS NOT AN OFFER TO SELL THESE SECURITIES AND IT IS NOT A SOLICITATION OF AN OFFER TO BUY THESE SECURITIES IN ANY JURISDICTION WHERE THE OFFER OR SALE IS NOT PERMITTED. |
| | 97 | |
| Various - Various | Loan #7 | Cut-off Date Balance: | | $40,000,000 |
| Various | Rockefeller Center | Cut-off Date LTV: | | 32.3% |
| New York, NY Various | | U/W NCF DSCR: | | 3.17x |
| | | U/W NOI Debt Yield: | | 18.2% |
Real Estate Substitution. Not permitted.
Subordinate and Mezzanine Indebtedness. The Rockefeller Center Properties also secure the Rockefeller Center Subordinate Companion Loan, which has a Cut-off Date principal balance of $1,531,500,000. The Rockefeller Center Subordinate Companion Loan is coterminous with the Rockefeller Center Senior Loan and accrues interest at a rate of 7.29912823832844% per annum. The Rockefeller Center Senior Loan is senior in right of payment to the Rockefeller Center Subordinate Companion Loan. The holders of the Rockefeller Center Mortgage Loan, the Rockefeller Center Senior Loan and the Rockefeller Center Subordinate Companion Loan have entered into a co-lender agreement which sets forth the allocation of collections on the Rockefeller Center Whole Loan. See “Description of the Mortgage Pool—The Whole Loans—The Non-Serviced AB Whole Loans—The Rockefeller Center AB Whole Loan” in the prospectus.
The following table presents certain information relating to the Rockefeller Center Subordinate Loan:
| | B-Note Original Principal Balance | B-Note Interest Rate | Original Term (mos.) | Original Amort. Term (mos.) | Original IO Term (mos.) | Whole Loan U/W NCF DSCR | Whole Loan U/W NOI DY | Whole Loan Cutoff Date LTV |
| Rockefeller Center Subordinate Loan | $1,531,500,000 | 7.29912823832844% | 60 | 0 | 60 | 1.54x | 10.3% | 57.4% |
Letter of Credit. None.
Terrorism Insurance. The borrowers are required to obtain and maintain property insurance and business interruption insurance for 24 months plus a 12-month extended period of indemnity. Such insurance is required to cover perils of terrorism and acts of terrorism (provided that if TRIPRA or a similar statute is not in effect, the borrowers will not be obligated to pay terrorism insurance premiums in excess of two times the premium then payable in respect of the property and business interruption coverages). See “Risk Factors—Risks Relating to the Mortgage Loans—Terrorism Insurance May Not Be Available for All Mortgaged Properties” in the prospectus.
THE INFORMATION IN THIS STRUCTURAL AND COLLATERAL TERM SHEET IS NOT COMPLETE AND MAY BE AMENDED PRIOR TO THE TIME OF SALE. THIS TERM SHEET IS NOT AN OFFER TO SELL THESE SECURITIES AND IT IS NOT A SOLICITATION OF AN OFFER TO BUY THESE SECURITIES IN ANY JURISDICTION WHERE THE OFFER OR SALE IS NOT PERMITTED. |
| | 98 | |
| Hospitality – Various | Loan #8 | Cut-off Date Balance: | | $35,000,000 |
| Various | Atrium Hotel Portfolio 24 Pack | Cut-off Date LTV: | | 32.1% |
| Various | | U/W NCF DSCR: | | 4.17x |
| | | U/W NOI Debt Yield: | | 26.7% |
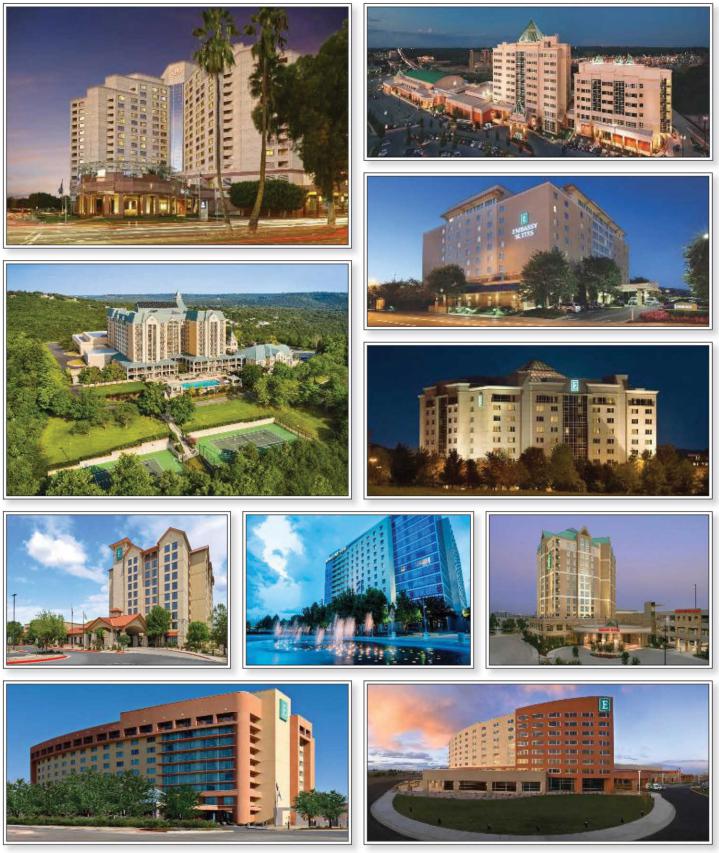
THE INFORMATION IN THIS STRUCTURAL AND COLLATERAL TERM SHEET IS NOT COMPLETE AND MAY BE AMENDED PRIOR TO THE TIME OF SALE. THIS TERM SHEET IS NOT AN OFFER TO SELL THESE SECURITIES AND IT IS NOT A SOLICITATION OF AN OFFER TO BUY THESE SECURITIES IN ANY JURISDICTION WHERE THE OFFER OR SALE IS NOT PERMITTED. |
| | 99 | |
| Hospitality – Various | Loan #8 | Cut-off Date Balance: | | $35,000,000 |
| Various | Atrium Hotel Portfolio 24 Pack | Cut-off Date LTV: | | 32.1% |
| Various | | U/W NCF DSCR: | | 4.17x |
| | | U/W NOI Debt Yield: | | 26.7% |
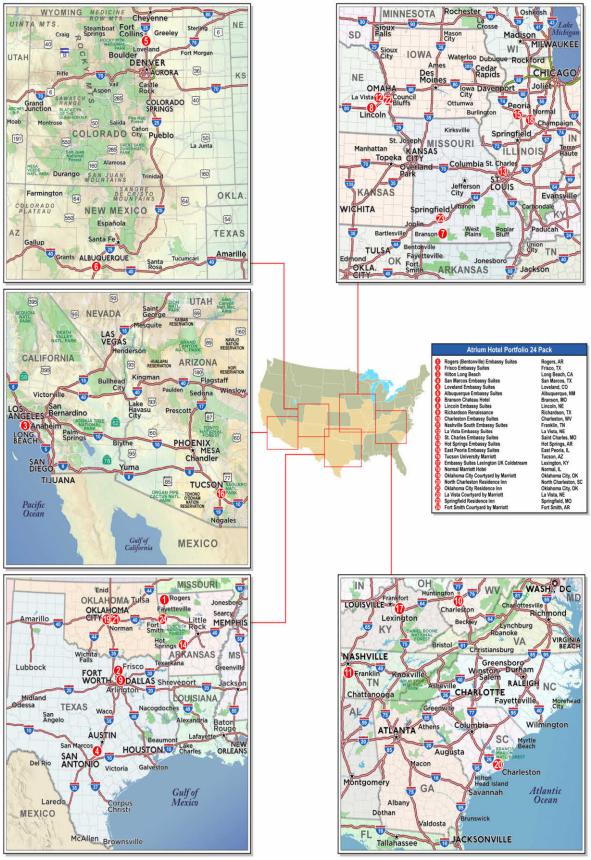
THE INFORMATION IN THIS STRUCTURAL AND COLLATERAL TERM SHEET IS NOT COMPLETE AND MAY BE AMENDED PRIOR TO THE TIME OF SALE. THIS TERM SHEET IS NOT AN OFFER TO SELL THESE SECURITIES AND IT IS NOT A SOLICITATION OF AN OFFER TO BUY THESE SECURITIES IN ANY JURISDICTION WHERE THE OFFER OR SALE IS NOT PERMITTED. |
| | 100 | |
| No. 8 – Atrium Hotel Portfolio 24 Pack |
| Mortgage Loan Information | | Mortgaged Property Information |
| Mortgage Loan Seller: | Goldman Sachs Mortgage Company | | Single Asset/Portfolio: | Portfolio |
| Credit Assessment (Fitch/KBRA/Moody’s): | BBB+/A+/Baa1 | | Property Type – Subtype: | Hospitality – Various |
| Original Principal Balance(1): | $35,000,000 | | Location: | Various |
| Cut-off Date Balance(1): | $35,000,000 | | Size: | 6,106 rooms |
| % of Initial Pool Balance: | 4.9% | | Cut-off Date Balance Per Room(1): | $76,122 |
| Loan Purpose: | Refinance | | Maturity Date Balance Per Room(1): | $76,122 |
| Borrower Sponsor: | Atrium Holding Company | | Year Built/Renovated: | Various/Various |
| Guarantor: | Skylight Property Holdings I LLC | | Title Vesting: | Fee/Leasehold |
| Mortgage Rate(2): | 5.53252353234854% | | Property Manager: | Atrium Hospitality LP |
| Note Date: | October 7, 2024 | | Current Occupancy (As of): | 71.4% (8/31/2024) |
| Seasoning: | 0 months | | YE 2023 Occupancy: | 70.3% |
| Maturity Date: | November 6, 2029 | | YE 2022 Occupancy: | 66.1% |
| IO Period: | 60 months | | YE 2021 Occupancy: | 52.3% |
| Loan Term (Original): | 60 months | | As-Is Appraised Value: | $1,448,000,000 |
| Amortization Term (Original): | NAP | | As-Is Appraised Value Per Room: | $237,144 |
| Loan Amortization Type: | Interest Only | | As-Is Appraisal Valuation Date: | May 13, 2024 |
| Call Protection(3): | YM1(24),DorYM1(29),O(7) | | |
| Lockbox Type: | Hard/Springing Cash Management | | Underwriting and Financial Information(5) |
| Additional Debt(1): | Yes | | TTM August 31, 2024 NOI: | $120,507,166 |
| Additional Debt Type (Balance)(1): | Pari Passu/B Note | | YE 2023 NOI: | $113,469,681 |
| | $429,800,000/$520,200,000 | | YE 2022 NOI: | $100,992,678 |
| | | | YE 2021 NOI: | $59,244,953 |
| | | | U/W Revenues: | $381,876,673 |
| Escrows and Reserves(4) | | U/W Expenses: | $257,838,705 |
| | Initial | Monthly | Cap | | U/W NOI: | $124,037,968 |
| Taxes: | $0 | Springing | NAP | | U/W NCF: | $108,822,046 |
| Insurance: | $0 | Springing | NAP | | U/W DSCR based on NOI/NCF: | 4.76x/4.17x |
| Replacement Reserves: | $40,000,000 | Various(5) | NAP | | U/W Debt Yield based on NOI/NCF: | 26.7%/23.4% |
| Ground Lease Reserve: | $335,875 | Springing | $335,875 | | U/W Debt Yield at Maturity based on NOI/NCF: | 26.7%/23.4% |
| | | | | | Cut-off Date LTV Ratio: | 32.1% |
| | | | | | LTV Ratio at Maturity: | 32.1% |
| | | | | | | | |
| Sources and Uses |
| Sources | | | | | Uses | | | |
| Subordinate Loan(1) | $520,200,000 | | 52.8 | % | | Loan Payoff | $755,023,067 | | 76.7 | % |
| Senior Loan(1) | 464,800,000 | | 47.2 | | | Principal Equity Distribution | 129,147,949 | | 13.1 | |
| | | | | | Closing Costs | 60,493,109 | | 6.1 | |
| | | | | | Reserves | 40,335,875 | | 4.1 | |
| Total Sources | $985,000,000 | | 100.0 | % | | Total Uses | $985,000,000 | | 100.0 | % |
| (1) | The Atrium Hotel Portfolio 24 Pack Mortgage Loan (as defined below) is part of the Atrium Hotel Portfolio 24 Pack Whole Loan (as defined below), which is evidenced by seven senior pari passu promissory notes and two junior pari passu promissory notes with an aggregate original principal balance of $985,000,000. The Underwriting and Financial Information presented above is based on the aggregate principal balance of the Senior Notes (as defined below). |
| (2) | 5.53252353234854% represents the senior loan coupon. The coupon for the Atrium Hotel Portfolio 24 Pack Whole Loan is 7.35207348308183%. |
| (3) | The Atrium Hotel Portfolio 24 Pack Whole Loan may be prepaid in whole or in part at any time, subject to a yield maintenance premium on the principal amount of such prepayment, if made prior to the payment date in May 2029. The Atrium Hotel Portfolio 24 Pack Whole Loan is also prepayable in part (a) in connection with a release of an individual Atrium Hotel Portfolio 24 Pack Property (as defined below) and (b) to achieve the debt yield necessary to permit a Debt Yield Cure (as defined below). At any time on or after the date that is the earlier to occur of (i) the payment date occurring in November 2027 and (ii) the second anniversary of the date on which the entire Atrium Hotel Portfolio 24 Pack Whole Loan has been securitized pursuant to one or a series of securitizations, the Atrium Hotel Portfolio 24 Pack Whole Loan may be defeased in whole (or in part as described below under “Release of Collateral”). The assumed defeasance lockout period of 24 payments is based on the closing date of the WFCM 2024-5C2 transaction in November 2024. The actual defeasance lockout period may be longer. |
| (4) | See “Escrows” below for further discussion of reserve information. |
| (5) | Based on the “As Portfolio” appraised value of $1,448,000,000 which includes an approximately 4.8% portfolio premium. The aggregate as-is appraised value without the portfolio premium is $1,381,200,000, which results in a Cut-off Date LTV and Maturity Date LTV of 33.7% for the senior notes and 71.3% Cut-off Date LTV and Maturity Date LTV for the Atrium Hotel Portfolio 24 Pack Whole Loan. |
THE INFORMATION IN THIS STRUCTURAL AND COLLATERAL TERM SHEET IS NOT COMPLETE AND MAY BE AMENDED PRIOR TO THE TIME OF SALE. THIS TERM SHEET IS NOT AN OFFER TO SELL THESE SECURITIES AND IT IS NOT A SOLICITATION OF AN OFFER TO BUY THESE SECURITIES IN ANY JURISDICTION WHERE THE OFFER OR SALE IS NOT PERMITTED. |
| | 101 | |
| Hospitality – Various | Loan #8 | Cut-off Date Balance: | | $35,000,000 |
| Various | Atrium Hotel Portfolio 24 Pack | Cut-off Date LTV: | | 32.1% |
| Various | | U/W NCF DSCR: | | 4.17x |
| | | U/W NOI Debt Yield: | | 26.7% |
The Mortgage Loan. The eighth largest mortgage loan (the “Atrium Hotel Portfolio 24 Pack Mortgage Loan”) is secured by the borrowers’ cross-collateralized fee simple and/or leasehold interests in 24 full service, limited service, select service and extended stay hospitality properties located across 14 states (each an “Atrium Hotel Portfolio 24 Pack Property”, and collectively the “Atrium Hotel Portfolio 24 Pack Properties” or the “Atrium Hotel Portfolio 24 Pack Portfolio”). The borrowers are indirectly owned by Atrium Holding Company (“Atrium”). The Atrium Hotel Portfolio 24 Pack Mortgage Loan is part of a whole loan (the “Atrium Hotel Portfolio 24 Pack Whole Loan”). Proceeds of the Atrium Hotel Portfolio 24 Pack Whole Loan were used to refinance the existing debt on the Atrium Hotel Portfolio 24 Pack Properties. The Atrium Hotel Portfolio 24 Pack Whole Loan accrues interest at a weighted average fixed rate of 7.35207348308183% per annum. The Atrium Hotel Portfolio 24 Pack Whole Loan has an initial term of 60 months and has a remaining term of 60 months as of the Cut-off Date.
The Atrium Hotel Portfolio 24 Pack Whole Loan is comprised of seven pari passu componentized senior notes with an aggregate principal balance of $464,800,000 (the “Senior Notes”) and two pari passu componentized junior notes with an aggregate principal balance of $520,200,000 (the “Junior Notes”). Two Senior Notes with an aggregate principal balance of $314,800,000 and the Junior Notes were contributed to the AHPT 2024-ATRM securitization. The Atrium Hotel Portfolio 24 Pack Mortgage Loan is evidenced by Note A-1-C2, with an outstanding principal balance as of the Cut-off Date of $35,000,000. The Atrium Hotel Portfolio 24 Pack Whole Loan was co-originated by Goldman Sachs Bank USA and Wells Fargo Bank, National Association on October 7, 2024.
The table below identifies the promissory notes that comprise the Atrium Hotel Portfolio 24 Pack Whole Loan. The relationship between the holders of the Atrium Hotel Portfolio 24 Pack Whole Loan is governed by a co-lender agreement as described under “Description of the Mortgage Pool—The Whole Loans—The Non-Serviced AB Whole Loans—The Atrium Hotel Portfolio 24 Pack AB Whole Loan” in the Preliminary Prospectus. The Atrium Hotel Portfolio 24 Pack Whole Loan will be serviced pursuant to the trust and servicing agreement for the AHPT 2024-ATRM securitization. See “Pooling and Servicing Agreement—Servicing of the Non-Serviced Whole Loans” in the Preliminary Prospectus.
Whole Loan Note Summary
| Notes | Original Balance | Cut-off Date Balance | Note Holder | Controlling Piece |
| Senior Notes | | | | |
| A-1-S1 | $178,880,000 | $178,880,000 | AHPT 2024-ATRM | Yes |
| A-2-S1 | $135,920,000 | $135,920,000 | AHPT 2024-ATRM | No |
| A-1-C1 | $50,000,000 | $50,000,000 | Benchmark 2024-V11 | No |
| A-1-C2 | $35,000,000 | $35,000,000 | WFCM 2024-5C2 | No |
| A-1-C3 | $15,000,000 | $15,000,000 | Goldman Sachs Bank USA | No |
| A-2-C1 | $25,000,000 | $25,000,000 | BANK5 2024-5YR11 | No |
| A-2-C2 | $25,000,000 | $25,000,000 | BANK5 2024-5YR11 | No |
| Junior Notes | | | | |
| B-1 | $312,120,000 | $312,120,000 | AHPT 2024-ATRM | No |
| B-2 | $208,080,000 | $208,080,000 | AHPT 2024-ATRM | No |
| Total | $985,000,000 | $985,000,000 | | |
The Borrowers and the Borrower Sponsor. The borrowers under the Atrium Hotel Portfolio 24 Pack Whole Loan are JDHQ Hotels LLC, Tucson Charleston LLC, LB Funding LLC, Chateau Lake, LLC, Atrium TRS Tucson, LLC and Lexington Kentucky Suite Hotel LLC, each a Delaware limited liability company. Each borrower is a recycled special purpose entity whose primary business is the performance of the obligations under the Atrium Hotel Portfolio 24 Pack Whole Loan documents and the ownership and/or operation of the applicable Atrium Hotel Portfolio 24 Pack Properties. The borrowers are indirectly owned by Atrium and its affiliates. The non-recourse carveout guarantor is Skylight Property Holdings I LLC, a Delaware limited liability company and an affiliate of the borrower sponsor.
The Property. The Atrium Hotel Portfolio 24 Pack Portfolio consists of 24 hotels (6,106 rooms) across 14 states, including 14 Atrium Hotel Portfolio 24 Pack Properties operating under the Hilton brand family, nine Atrium Hotel Portfolio 24 Pack Properties operating under the Marriott brand family, and one independent resort hotel. The Atrium Hotel Portfolio 24 Pack Properties were constructed between 1992 and 2009 and have an average age of approximately 21 years with renovations at some of the Atrium Hotel Portfolio 24 Pack Properties taking place between 2014 and 2024. As of the trailing twelve months ended August 2024, the Atrium Hotel Portfolio 24 Pack Portfolio was 71.4% occupied and reported an ADR and RevPAR of $161.81 and $115.55, respectively. According to third party market reports, as of the trailing twelve months ended July 2024, the Atrium Hotel Portfolio 24 Pack Portfolio’s average RevPAR Penetration was 127.3%, weighted by portfolio rooms.
THE INFORMATION IN THIS STRUCTURAL AND COLLATERAL TERM SHEET IS NOT COMPLETE AND MAY BE AMENDED PRIOR TO THE TIME OF SALE. THIS TERM SHEET IS NOT AN OFFER TO SELL THESE SECURITIES AND IT IS NOT A SOLICITATION OF AN OFFER TO BUY THESE SECURITIES IN ANY JURISDICTION WHERE THE OFFER OR SALE IS NOT PERMITTED. |
| | 102 | |
| Hospitality – Various | Loan #8 | Cut-off Date Balance: | | $35,000,000 |
| Various | Atrium Hotel Portfolio 24 Pack | Cut-off Date LTV: | | 32.1% |
| Various | | U/W NCF DSCR: | | 4.17x |
| | | U/W NOI Debt Yield: | | 26.7% |
The following table sets forth certain information regarding the Atrium Hotel Portfolio 24 Pack Properties:
Portfolio Summary(1)
| Property Name | City, State | Allocable Mortgage Loan Amount ($) | Appraised Value ($) | GS U/W NCF ($) | Rooms | Hotel Type | Brand | Year Built | Year Renovated | Franchise Agmt Expiration Date |
| Rogers (Bentonville) Embassy Suites | Rogers, AR | 3,437,817 | 129,000,000 | 12,405,676 | 400 | Full Service | Embassy Suites | 2003 | 2015-2018 | 2038 |
| Frisco Embassy Suites | Frisco, TX | 2,632,569 | 109,100,000 | 8,172,267 | 330 | Full Service | Embassy Suites | 2005 | 2015, 2017 | 2038 |
| Hilton Long Beach | Long Beach, CA | 2,475,655 | 118,100,000 | 7,078,695 | 399 | Full Service | Hilton | 1992 | 2015-2017 | 2035 |
| San Marcos Embassy Suites | San Marcos, TX | 2,159,553 | 74,800,000 | 6,799,470 | 283 | Full Service | Embassy Suites | 2008 | 2023-2024 | 2038 |
| Loveland Embassy Suites | Loveland, CO | 2,153,584 | 80,700,000 | 6,537,895 | 263 | Full Service | Embassy Suites | 2009 | NAP | 2038 |
| Albuquerque Embassy Suites | Albuquerque, NM | 1,948,061 | 79,900,000 | 5,912,792 | 261 | Full Service | Embassy Suites | 2005 | 2022-2023 | 2038 |
| Branson Chateau Hotel | Branson, MO | 1,770,289 | 70,200,000 | 5,900,504 | 301 | Full Service | Independent | 1997 | NAP | NAP |
| Richardson Renaissance | Richardson, TX | 1,632,386 | 70,200,000 | 5,098,799 | 335 | Full Service | Renaissance | 2001 | 2018 | 2038 |
| Charleston Embassy Suites | Charleston, WV | 1,604,492 | 68,100,000 | 5,052,634 | 253 | Full Service | Embassy Suites | 1997 | 2019 | 2032 |
| Nashville South Embassy Suites | Franklin, TN | 1,561,675 | 58,600,000 | 4,736,606 | 250 | Full Service | Embassy Suites | 2001 | 2015-2016 | 2038 |
| La Vista Embassy Suites | La Vista, NE | 1,535,949 | 66,100,000 | 4,514,484 | 257 | Full Service | Embassy Suites | 2008 | NAP | 2038 |
| Lincoln Embassy Suites | Lincoln, NE | 1,696,416 | 71,200,000 | 4,421,392 | 252 | Full Service | Embassy Suites | 2000 | 2023-2024 | 2038 |
| St. Charles Embassy Suites | Saint Charles, MO | 1,284,162 | 48,900,000 | 3,692,028 | 296 | Full Service | Embassy Suites | 2005 | 2017-2018 | 2038 |
| East Peoria Embassy Suites | East Peoria, IL | 1,071,320 | 40,200,000 | 3,680,957 | 226 | Full Service | Embassy Suites | 2008 | NAP | 2038 |
| Hot Springs Embassy Suites | Hot Springs, AR | 1,160,543 | 37,900,000 | 3,408,623 | 246 | Full Service | Embassy Suites | 2003 | NAP | 2038 |
| Tucson University Marriott | Tucson, AZ | 1,035,325 | 42,900,000 | 3,115,241 | 250 | Full Service | Marriott | 1996 | 2017 | 2038 |
| Oklahoma City Courtyard by Marriott | Oklahoma City, OK | 816,904 | 31,700,000 | 2,937,883 | 225 | Select Service | Courtyard | 2004 | 2014, 2019 | 2033 |
| Embassy Suites Lexington UK Coldstream | Lexington, KY | 998,939 | 43,400,000 | 2,790,779 | 230 | Full Service | Embassy Suites | 1999 | NAP | 2038 |
| Oklahoma City Residence Inn | Oklahoma City, OK | 714,888 | 24,900,000 | 2,558,922 | 151 | Limited Service/Extended Stay | Residence Inn | 2007 | NAP | 2033 |
| Normal Marriott Hotel | Normal, IL | 961,665 | 27,700,000 | 2,530,234 | 228 | Full Service | Marriott | 2009 | NAP | 2038 |
| North Charleston Residence Inn | North Charleston, SC | 769,076 | 27,700,000 | 2,358,736 | 150 | Limited Service/Extended Stay | Residence Inn | 2004 | 2019-2020 | 2033 |
| La Vista Courtyard by Marriott | La Vista, NE | 643,503 | 24,400,000 | 2,198,788 | 246 | Select Service | Courtyard | 2009 | 2019 | 2033 |
| Springfield Residence Inn | Springfield, MO | 535,482 | 20,500,000 | 1,712,344 | 136 | Limited Service/Extended Stay | Residence Inn | 2004 | 2019 | 2033 |
| Fort Smith Courtyard by Marriott | Fort Smith, AR | 399,746 | 15,000,000 | 1,206,296 | 138 | Select Service | Courtyard | 2007 | NAP | 2033 |
| (1) | Source: Appraisal and underwritten cash flow. |
THE INFORMATION IN THIS STRUCTURAL AND COLLATERAL TERM SHEET IS NOT COMPLETE AND MAY BE AMENDED PRIOR TO THE TIME OF SALE. THIS TERM SHEET IS NOT AN OFFER TO SELL THESE SECURITIES AND IT IS NOT A SOLICITATION OF AN OFFER TO BUY THESE SECURITIES IN ANY JURISDICTION WHERE THE OFFER OR SALE IS NOT PERMITTED. |
| | 103 | |
| Hospitality – Various | Loan #8 | Cut-off Date Balance: | | $35,000,000 |
| Various | Atrium Hotel Portfolio 24 Pack | Cut-off Date LTV: | | 32.1% |
| Various | | U/W NCF DSCR: | | 4.17x |
| | | U/W NOI Debt Yield: | | 26.7% |
The following table sets forth certain information regarding the Atrium Hotel Portfolio 24 Pack Properties by hotel type:
Historical, August 2024 TTM and U/W Metrics (1)
| Hotel Type | Properties | Rooms | Occupancy | ADR | RevPar | 2022 NCF | 2023 NCF | August 2024 TTM NCF | August 2024 TTM NCF % | U/W NCF | U/W NCF % |
| Full-Service | 18 | 5,060 | 71.0% | $168.12 | $119.33 | $76,716,161 | $87,319,532 | $92,580,786 | 87.9% | $95,849,077 | 88.1% |
| Limited-Service; Extended-Stay | 3 | 437 | 81.3 | 139.62 | 113.52 | 6,092,586 | 6,117,773 | 6,546,240 | 6.2% | 6,630,001 | 6.1% |
| Select-Service | 3 | 609 | 67.9 | 126.08 | 85.66 | 5,153,113 | 5,458,942 | 6,235,402 | 5.9% | 6,342,967 | 5.8% |
| Total | 24 | 6,106 | 71.4% | $161.81 | $115.55 | $87,961,861 | $98,896,248 | $105,362,428 | 100.0% | $108,822,046 | 100.0% |
| (1) | Source: Underwritten cash flow. |
From 2019 to July 2024, Atrium invested approximately $121.1 million (approximately $19.8k per room) in property improvement plan (“PIP”) renovations and other capital expenditures (“CapEx”) across the Atrium Hotel Portfolio 24 Pack Portfolio. The renovations have included lobby refurbishments, guestroom renovations, meeting space upgrades, restaurant and amenity enhancements, and restoration of public spaces and exterior facades. From the fourth quarter of 2024 through 2029, Atrium plans to spend an additional approximately $126.1 million in PIP and CapEx across the Atrium Hotel Portfolio 24 Pack Portfolio. We cannot assure you that these or any investments will be made into the Atrium Hotel Portfolio 24 Pack Portfolio. The Atrium Hotel Portfolio 24 Pack Whole Loan documents required the borrowers to reserve $40.0 million at the origination of the Atrium Hotel Portfolio 24 Pack Whole Loan and require ongoing deposits during the term of the Atrium Hotel Portfolio 24 Pack Whole Loan to capitalize these capital expenditure projects. See below for additional information related to past capital expenditures at the Atrium Hotel Portfolio 24 Pack Portfolio:
THE INFORMATION IN THIS STRUCTURAL AND COLLATERAL TERM SHEET IS NOT COMPLETE AND MAY BE AMENDED PRIOR TO THE TIME OF SALE. THIS TERM SHEET IS NOT AN OFFER TO SELL THESE SECURITIES AND IT IS NOT A SOLICITATION OF AN OFFER TO BUY THESE SECURITIES IN ANY JURISDICTION WHERE THE OFFER OR SALE IS NOT PERMITTED. |
| | 104 | |
| Hospitality – Various | Loan #8 | Cut-off Date Balance: | | $35,000,000 |
| Various | Atrium Hotel Portfolio 24 Pack | Cut-off Date LTV: | | 32.1% |
| Various | | U/W NCF DSCR: | | 4.17x |
| | | U/W NOI Debt Yield: | | 26.7% |
Recent Renovations (CapEx)(1)
| Property Name | # Rooms | 2019 | 2020 | 2021 | 2022 | 2023 | 2024 YTD | 2019-2024 July YTD |
| Rogers (Bentonville) Embassy Suites | 400 | $619,262 | $212,952 | $89,720 | $659,661 | $371,420 | $806,421 | $2,759,435 |
| Frisco Embassy Suites | 330 | $707,715 | $203,648 | $66,027 | $339,659 | $664,598 | $309,882 | $2,291,529 |
| Hilton Long Beach | 399 | $972,944 | $375,687 | $412,291 | $643,181 | $908,847 | $435,107 | $3,748,056 |
| San Marcos Embassy Suites | 283 | $995,881 | $174,073 | $42,680 | $466,668 | $1,709,836 | $4,854,742 | $8,243,880 |
| Loveland Embassy Suites | 263 | $556,772 | $28,794 | $83,465 | $327,481 | $571,334 | $799,009 | $2,366,854 |
| Albuquerque Embassy Suites | 261 | $209,855 | $82,076 | $77,058 | $6,613,326 | $6,038,727 | $303,322 | $13,324,363 |
| Branson Chateau Hotel | 301 | $699,966 | $386,719 | $962,715 | $833,033 | $1,054,546 | $255,604 | $4,192,583 |
| Richardson Renaissance | 335 | $589,997 | $132,221 | $30,125 | $61,961 | $161,494 | $653,835 | $1,629,634 |
| Charleston Embassy Suites | 253 | $6,994,397 | $208,868 | $115,088 | $166,347 | $412,999 | $141,151 | $8,038,850 |
| Nashville South Embassy Suites | 250 | $193,306 | $253,520 | $63,757 | $480,031 | $1,095,283 | $437,156 | $2,523,053 |
| La Vista Embassy Suites | 257 | $155,518 | $76,890 | $109,802 | $701,509 | $476,234 | $389,407 | $1,909,361 |
| Lincoln Embassy Suites | 252 | $360,140 | $54,320 | $95,184 | $281,478 | $7,251,617 | $5,086,193 | $13,128,932 |
| St. Charles Embassy Suites | 296 | $287,557 | $106,980 | $77,841 | $303,277 | $499,913 | $293,871 | $1,569,438 |
| East Peoria Embassy Suites | 226 | $189,160 | $9,972 | $27,520 | $131,624 | $520,112 | $187,235 | $1,065,624 |
| Hot Springs Embassy Suites | 246 | $461,426 | $187,990 | $30,431 | $177,567 | $243,681 | $5,070,718 | $6,171,812 |
| Tucson University Marriott | 250 | $11,279,769 | $2,224,323 | $205,217 | $263,156 | $150,883 | $28,275 | $14,151,624 |
| Oklahoma City Courtyard by Marriott | 225 | $4,222,437 | $1,335,528 | $210,250 | $115,987 | $256,434 | $147,444 | $6,288,079 |
| Embassy Suites Lexington UK Coldstream | 230 | $194,081 | $33,101 | $175,802 | $558,037 | $1,400,839 | $398,463 | $2,760,323 |
| Oklahoma City Residence Inn | 151 | $237,392 | $215,386 | $9,920 | $80,625 | $347,548 | $383,005 | $1,273,877 |
| Normal Marriott Hotel | 228 | $914,191 | $149,987 | $53,075 | $281,853 | $395,987 | $3,121,229 | $4,916,320 |
| North Charleston Residence Inn | 150 | $4,838,010 | $2,315,402 | $480,772 | $92,348 | $325,675 | $146,303 | $8,198,510 |
| La Vista Courtyard by Marriott | 246 | $4,118,982 | $22,287 | $25,937 | $47,783 | $258,642 | $176,963 | $4,650,594 |
| Springfield Residence Inn | 136 | $4,532,052 | $154,963 | $48,631 | $99,105 | $147,170 | $36,312 | $5,018,232 |
| Fort Smith Courtyard by Marriott | 138 | $593,834 | $68,831 | $15,499 | $84,760 | $23,553 | $74,449 | $860,926 |
| Total | 6,106 | $44,924,643 | $9,014,516 | $3,508,807 | $13,810,458 | $25,287,372 | $24,536,094 | $121,081,891 |
| (1) | Source: Third-party reports. |
THE INFORMATION IN THIS STRUCTURAL AND COLLATERAL TERM SHEET IS NOT COMPLETE AND MAY BE AMENDED PRIOR TO THE TIME OF SALE. THIS TERM SHEET IS NOT AN OFFER TO SELL THESE SECURITIES AND IT IS NOT A SOLICITATION OF AN OFFER TO BUY THESE SECURITIES IN ANY JURISDICTION WHERE THE OFFER OR SALE IS NOT PERMITTED. |
| | 105 | |
| Hospitality – Various | Loan #8 | Cut-off Date Balance: | | $35,000,000 |
| Various | Atrium Hotel Portfolio 24 Pack | Cut-off Date LTV: | | 32.1% |
| Various | | U/W NCF DSCR: | | 4.17x |
| | | U/W NOI Debt Yield: | | 26.7% |
The following table presents historical occupancy percentages at the Atrium Hotel Portfolio 24 Pack Property:
Historical Occupancy
| Historical and Current Occupancy(1) |
| 2019 | 2020 | 2021 | 2022 | 2023 | Current(2) |
| 68.8% | 31.7% | 52.3% | 66.1% | 70.3% | 71.4% |
| (1) | Historical occupancies are as of December 31 of each respective year. |
| (2) | Current Occupancy is as of August 31, 2024. |
Operating History and Underwritten Net Cash Flow. The following table presents certain information relating to the historical operating performance and underwritten net cash flow at the Atrium Hotel Portfolio 24 Pack Property:
Cash Flow Analysis(1)
| | 2019 | 2020 | 2021 | 2022 | 2023 | TTM 5/31/2024 | U/W(2) | %(3) | U/W $ per SF |
| Rooms Revenue | $223,155,533 | $91,237,524 | $159,953,345 | $226,950,298 | $249,450,769 | $258,241,252 | $259,839,658 | 68.0% | $42,555 |
| Food and Beverage Revenue | 100,295,177 | 26,783,390 | 38,372,226 | 83,273,465 | 97,948,145 | 102,905,823 | 103,012,857 | 27.0 | $16,871 |
| Other Departmental Revenue | 9,406,120 | 4,364,554 | 7,173,438 | 9,180,080 | 11,072,214 | 11,957,467 | 12,000,415 | 3.1 | $1,965 |
| Miscellaneous Income | 4,006,092 | 3,863,390 | 4,420,944 | 6,366,600 | 5,864,693 | 5,513,891 | 5,545,119 | 1.5 | $908 |
| Non-Operating Income | 253,583 | 426,731 | 1,298,004 | 609,374 | 1,556,043 | 1,478,624 | 1,478,624 | 0.4 | $242 |
| Total Operating Revenue | $337,116,505 | $126,675,589 | $211,217,958 | $326,379,817 | $365,891,863 | $380,097,056 | $381,876,673 | 100.0% | $62,541 |
| Rooms Expense | 53,356,009 | 21,796,432 | 37,071,424 | 55,772,310 | 61,741,194 | 63,447,017 | 63,475,531 | 51.2 | $10,396 |
| Food and Beverage Expense | 52,664,279 | 15,474,841 | 19,806,693 | 43,238,527 | 50,485,100 | 51,328,987 | 51,339,418 | 41.4 | $8,408 |
| Other Departmental Expenses | 4,307,036 | 1,973,390 | 2,387,852 | 3,329,972 | 4,287,936 | 4,200,179 | 4,195,487 | 3.4 | $687 |
| Total Departmental Profit | $226,789,181 | $87,430,927 | $151,951,989 | $224,039,008 | $249,377,633 | $261,120,873 | $262,866,237 | 211.9% | $43,050 |
| Administrative and General | 24,202,261 | 11,772,182 | 16,019,245 | 22,526,460 | 25,443,697 | 25,963,214 | 25,991,693 | 21.0 | $4,257 |
| Information and Telecommunications Systems | 4,469,235 | 3,675,077 | 4,429,850 | 5,020,624 | 5,430,854 | 5,590,980 | 5,574,304 | 4.5 | $913 |
| Sales and Marketing | 21,338,269 | 7,808,863 | 10,280,509 | 17,792,211 | 20,756,152 | 21,945,853 | 21,955,628 | 17.7 | $3,596 |
| Franchise Fees | 17,406,760 | 7,111,750 | 12,448,281 | 18,101,890 | 20,066,629 | 21,114,245 | 20,995,316 | 16.9 | $3,438 |
| Property Operation and Maintenance | 14,226,017 | 8,366,731 | 10,956,908 | 15,102,575 | 16,288,464 | 16,915,361 | 16,909,156 | 13.6 | $2,769 |
| Utilities | 13,540,873 | 9,660,646 | 12,038,702 | 14,738,957 | 14,851,562 | 15,175,854 | 15,221,174 | 12.3 | $2,493 |
| Base Management Fee | 10,105,888 | 3,787,466 | 6,297,599 | 9,773,113 | 10,930,075 | 11,358,553 | 11,411,941 | 9.2 | $1,869 |
| Other Expenses(4) | 19,288,606 | 20,375,736 | 20,235,941 | 19,990,500 | 22,140,520 | 22,549,647 | 20,769,056 | 16.7 | $3,401 |
| Total Expenses | $124,577,907 | $72,558,451 | $92,707,036 | $123,046,330 | $135,907,953 | $140,613,707 | $138,828,269 | 111.9% | $22,736 |
| Net Operating Income | $102,211,273 | $14,872,476 | $59,244,953 | $100,992,678 | $113,469,681 | $120,507,166 | $124,037,968 | 100.0% | $20,314 |
| FF&E | 13,474,517 | 5,049,954 | 8,396,798 | 13,030,818 | 14,573,433 | 15,144,737 | 15,215,922 | 12.3 | $2,492 |
| Net Cash Flow | $88,736,756 | $9,822,522 | $50,848,155 | $87,961,861 | $98,896,248 | $105,362,428 | $108,822,046 | 87.7% | $17,822 |
| | | | | | | | | | |
| NOI DSCR(5) | 3.92x | 0.57x | 2.27x | 3.87x | 4.35x | 4.62x | 4.76x | | |
| NCF DSCR(5) | 3.40x | 0.38x | 1.95x | 3.37x | 3.79x | 4.04x | 4.17x | | |
| NOI DY(5) | 22.0% | 3.2% | 12.7% | 21.7% | 24.4% | 25.9% | 26.7% | | |
| NCF DY(5) | 19.1% | 2.1% | 10.9% | 18.9% | 21.3% | 22.7% | 23.4% | | |
| (1) | Historical and underwritten net cash flows are adjusted to reflect total management fees paid to Atrium Hospitality, inclusive of revenue management, accounting, and certain other centralized services and software licenses, equal to 3.0% of gross revenues. Historical financials exclude non-property corporate level expenses. Historical financials also exclude extraordinary or non-recurring items, including certain bad debt, severance/relocation pay, capitalizable major repairs, costs related to insurable events, professional fees related to real estate tax appeals and paycheck protection program loan forgiveness. Excluded extraordinary and one-time items total approximately $82,000 in 2019, approximately $312,000 in 2020, approximately $508,000 in 2021, approximately $507,000 in 2022, approximately $1.08 million in 2023, and approximately $759,000 in the August 31, 2024 TTM. |
| (2) | Based on the in-place rent roll dated August 31, 2024. The Lincoln Embassy Suites property was underwritten based on 2023 financials due to temporary disruption resulting from current ongoing renovations. |
| (3) | % column represents percent of Total Operating Revenue for revenue lines and percent of Net Operating Income for all remaining fields. |
| (4) | Other expenses represent the total non-operating expenses associated with rent, taxes and insurance. |
| (5) | Debt service coverage ratios and debt yields are based on the Senior Notes. |
THE INFORMATION IN THIS STRUCTURAL AND COLLATERAL TERM SHEET IS NOT COMPLETE AND MAY BE AMENDED PRIOR TO THE TIME OF SALE. THIS TERM SHEET IS NOT AN OFFER TO SELL THESE SECURITIES AND IT IS NOT A SOLICITATION OF AN OFFER TO BUY THESE SECURITIES IN ANY JURISDICTION WHERE THE OFFER OR SALE IS NOT PERMITTED. |
| | 106 | |
| Hospitality – Various | Loan #8 | Cut-off Date Balance: | | $35,000,000 |
| Various | Atrium Hotel Portfolio 24 Pack | Cut-off Date LTV: | | 32.1% |
| Various | | U/W NCF DSCR: | | 4.17x |
| | | U/W NOI Debt Yield: | | 26.7% |
Appraisal. According to the portfolio appraisal dated May 13, 2024, the Atrium Hotel Portfolio 24 Pack Properties had an “As Portfolio” appraised value of $1,448,000,000, which includes a 4.8% portfolio premium. The aggregate as-is appraised value without the premium is $1,381,200,000.
Environmental. According to the Phase I environmental assessments dated between May 9, 2024 and May 24, 2024, there was no evidence of any recognized environmental conditions at the Atrium Hotel Portfolio 24 Pack Properties; however, the Phase I environmental assessments did identify certain controlled recognized environmental conditions at the Atrium Hotel Portfolio 24 Pack Properties as described under “Description of the Mortgage Pool—Environmental Considerations” in the Preliminary Prospectus.
Market Overview and Competition. The Atrium Hotel Portfolio 24 Pack Portfolio’s top eight markets based on underwritten net cash flow are responsible for approximately 59.0% of the underwritten net cash flow and a total of 3,150 rooms (approximately 51.6% of total room count).
Historical and August 2024 TTM Metrics(1)
| Top Markets | Properties | # Rooms | Occupancy | ADR | RevPar | 2022 NCF | 2023 NCF | August 2024
TTM NCF | August 2024 TTM NCF % | U/W NCF | U/W NCF % |
| Dallas-Plano-Irving, TX | 2 | 665 | 66.1% | $159.18 | $105.20 | $7,208,029 | $11,050,887 | $13,155,172 | 12.5% | $13,271,066 | 12.2% |
| Fayetteville-Springdale-Rogers, AR-MO | 1 | 400 | 73.8% | $179.23 | $132.35 | $10,644,445 | $11,017,894 | $12,172,646 | 11.6% | $12,405,676 | 11.4% |
| Los Angeles-Long Beach-Glendale, CA | 1 | 399 | 83.0% | $206.80 | $171.61 | $4,733,003 | $7,137,055 | $7,010,622 | 6.7% | $7,078,695 | 6.5% |
| Austin-Round Rock, TX | 1 | 283 | 73.3% | $160.72 | $117.73 | $5,551,125 | $6,368,571 | $6,687,120 | 6.3% | $6,799,470 | 6.2% |
| Omaha-Council Bluffs, NE-IA | 2 | 503 | 61.3% | $145.34 | $89.10 | $6,489,363 | $6,035,733 | $6,327,723 | 6.0% | $6,713,272 | 6.2% |
| Fort Collins-Loveland, CO | 1 | 263 | 74.4% | $167.38 | $124.48 | $4,334,461 | $5,330,688 | $6,499,967 | 6.2% | $6,537,895 | 6.0% |
| Albuquerque, NM | 1 | 261 | 83.2% | $166.50 | $138.60 | $4,312,459 | $4,080,847 | $5,710,832 | 5.4% | $5,912,792 | 5.4% |
| Oklahoma City, OK | 2 | 376 | 77.0% | $133.47 | $102.84 | $4,100,003 | $4,682,627 | $5,413,225 | 5.1% | $5,496,805 | 5.1% |
| Other (13 markets) | 13 | 2,956 | 70.2% | $158.21 | $111.13 | $40,588,973 | $43,191,946 | $42,385,121 | 40.2% | $44,606,375 | 41.0% |
| Total | 24 | 6,106 | 71.4% | $161.81 | $115.55 | $87,961,861 | $98,896,248 | $105,362,428 | 100.0% | $108,822,046 | 100.0% |
| (1) | Source: Third party reports. |
THE INFORMATION IN THIS STRUCTURAL AND COLLATERAL TERM SHEET IS NOT COMPLETE AND MAY BE AMENDED PRIOR TO THE TIME OF SALE. THIS TERM SHEET IS NOT AN OFFER TO SELL THESE SECURITIES AND IT IS NOT A SOLICITATION OF AN OFFER TO BUY THESE SECURITIES IN ANY JURISDICTION WHERE THE OFFER OR SALE IS NOT PERMITTED. |
| | 107 | |
| Hospitality – Various | Loan #8 | Cut-off Date Balance: | | $35,000,000 |
| Various | Atrium Hotel Portfolio 24 Pack | Cut-off Date LTV: | | 32.1% |
| Various | | U/W NCF DSCR: | | 4.17x |
| | | U/W NOI Debt Yield: | | 26.7% |
The following table sets forth certain information regarding the Atrium Hotel Portfolio 24 Pack Properties Comp Set RevPAR Penetration compared to its Comp Set:
Comp Set RevPAR Penetration(1)
| Property Name | Rooms | 2015 | 2016 | 2017 | 2018 | 2019 | 2020 | 2021 | 2022 | 2023 | July 2024 TTM |
| Rogers (Bentonville) Embassy Suites | 400 | 104% | 103% | 107% | 103% | 103% | 84% | 124% | 119% | 116% | 116% |
| Frisco Embassy Suites | 330 | 107% | 110% | 102% | 96% | 86% | 68% | 85% | 86% | 89% | 89% |
| Hilton Long Beach | 399 | 87% | 96% | 97% | 92% | 92% | 64% | 65% | 91% | 97% | 104% |
| San Marcos Embassy Suites | 283 | 205% | 216% | 231% | 233% | 211% | 168% | 126% | 141% | 156% | 163% |
| Loveland Embassy Suites | 263 | 116% | 128% | 125% | 128% | 135% | 118% | 118% | 131% | 136% | 137% |
| Albuquerque Embassy Suites | 261 | 161% | 161% | 163% | 150% | 139% | 146% | 161% | 182% | 142% | 159% |
| Branson Chateau Hotel | 301 | 127% | 112% | 106% | 109% | 86% | 63% | 128% | 131% | 116% | 120% |
| Richardson Renaissance | 335 | 134% | 116% | 111% | 120% | 137% | 108% | 95% | 121% | 133% | 135% |
| Charleston Embassy Suites | 253 | 140% | 139% | 146% | 144% | 111% | 114% | 147% | 162% | 160% | 157% |
| Nashville South Embassy Suites | 250 | 115% | 110% | 117% | 113% | 107% | 99% | 96% | 116% | 109% | 106% |
| La Vista Embassy Suites | 257 | 133% | 130% | 145% | 145% | 157% | 155% | 145% | 135% | 131% | 130% |
| Lincoln Embassy Suites | 252 | 132% | 125% | 130% | 137% | 130% | 108% | 113% | 125% | 129% | 110% |
| St. Charles Embassy Suites | 296 | 138% | 129% | 137% | 128% | 142% | 148% | 177% | 165% | 164% | 164% |
| East Peoria Embassy Suites | 226 | 139% | 132% | 149% | 159% | 138% | 116% | 152% | 170% | 171% | 171% |
| Hot Springs Embassy Suites | 246 | 217% | 202% | 196% | 144% | 145% | 106% | 114% | 134% | 137% | 140% |
| Tucson University Marriott | 250 | 171% | 176% | 122% | 121% | 111% | 118% | 121% | 138% | 143% | 146% |
| Oklahoma City Courtyard by Marriott | 225 | 138% | 151% | 147% | 84% | 81% | 75% | 82% | 106% | 108% | 112% |
| Embassy Suites Lexington UK Coldstream | 230 | NAP | 115% | 115% | 116% | 123% | 127% | 127% | 116% | 113% | 109% |
| Oklahoma City Residence Inn | 151 | 132% | 126% | 122% | 112% | 107% | 139% | 124% | 127% | 124% | 125% |
| Normal Marriott Hotel | 228 | 115% | 121% | 113% | 115% | 113% | 94% | 99% | 102% | 102% | 101% |
| North Charleston Residence Inn | 150 | 127% | 124% | 127% | 124% | 107% | 94% | 136% | 130% | 122% | 126% |
| La Vista Courtyard by Marriott | 246 | 102% | 89% | 94% | 90% | 79% | 74% | 78% | 89% | 90% | 94% |
| Springfield Residence Inn | 136 | 136% | 109% | 108% | 101% | 87% | 105% | 91% | 96% | 109% | 110% |
| Fort Smith Courtyard by Marriott | 138 | 126% | 96% | 113% | 99% | 109% | 94% | 125% | 146% | 149% | 148% |
| Total / Wtd Average | 6,106 | 133% | 129% | 129% | 124% | 119% | 106% | 117% | 127% | 126% | 127% |
| (1) | Source: Third party reports. |
Escrows. On the origination date, the borrowers were required to fund (i) a property improvement plan work and replacements reserve in the amount of $40,000,000 for the payment of certain FF&E expenditures and property improvement plans required by the related franchise agreements and (ii) a ground lease reserve in the amount of $335,875.20.
PIP and Replacement Reserve: On each monthly due date, the borrowers are required to deposit an amount equal to the sum of (i) 4.0% of gross revenues from the Atrium Hotel Portfolio 24 Pack Properties that remain subject to the liens of the Atrium Hotel Portfolio 24 Pack Whole Loan documents for the calendar month that is two calendar months prior to the calendar month of the monthly due date plus (ii) commencing on the monthly due date in November 2026 and on each subsequent monthly due date, $1,000,000; provided that if an Atrium Hotel Portfolio 24 Pack Property subject to a PIP has been released from the Atrium Hotel Portfolio 24 Pack Whole Loan, then such amount will be reduced.
Additionally, in connection with any public health or safety emergency (e.g., a pandemic) or industry-wide emergency (which may include, without limitation, any national decline in RevPAR of hotels in the upper upscale category for any trailing 15 day period of not less than 15% from pre-emergency levels), the borrowers’ monthly deposits into the PIP and Replacement Reserve will be suspended during such emergency, such period not to exceed six months. In addition, during such emergency, the lender will have the right to permit the borrowers to use funds on deposit in the PIP and Replacement Reserve toward satisfaction of debt service for a period of up to three months, to the extent of insufficient funds to pay operating expenses and debt service.
Ground Lease Reserve: On each monthly due date, the borrowers are required to deposit an amount equal to 1/12th of base rent and additional rent, and other similar charges payable with respect to the ground leased Atrium Hotel Portfolio 24 Pack Properties and each parking agreement that the lender reasonably estimates will be payable during the next ensuing 12 months; provided, however, such ground lease reserve will be conditionally waived so long as (i) no event of default under the Atrium Hotel Portfolio 24 Pack Whole Loan or Atrium Hotel Portfolio 24 Pack Cash Sweep Period (as defined below) has occurred and is continuing, (ii) the borrowers deliver evidence that ground rents are paid when due and (iii) no less than $335,874.50 remains on deposit in the ground rent reserve.
THE INFORMATION IN THIS STRUCTURAL AND COLLATERAL TERM SHEET IS NOT COMPLETE AND MAY BE AMENDED PRIOR TO THE TIME OF SALE. THIS TERM SHEET IS NOT AN OFFER TO SELL THESE SECURITIES AND IT IS NOT A SOLICITATION OF AN OFFER TO BUY THESE SECURITIES IN ANY JURISDICTION WHERE THE OFFER OR SALE IS NOT PERMITTED. |
| | 108 | |
| Hospitality – Various | Loan #8 | Cut-off Date Balance: | | $35,000,000 |
| Various | Atrium Hotel Portfolio 24 Pack | Cut-off Date LTV: | | 32.1% |
| Various | | U/W NCF DSCR: | | 4.17x |
| | | U/W NOI Debt Yield: | | 26.7% |
Tax and Insurance Reserve: On each monthly due date, the borrowers are required to deposit an amount equal to 1/12th of the taxes, insurance premiums and other charges estimated by the lender to be payable during the next ensuing 12 months; provided that, so long as no event of default under the Atrium Hotel Portfolio 24 Pack Whole Loan documents or Atrium Hotel Portfolio 24 Pack Cash Sweep Event (as defined below) has occurred and is continuing, (i) if the Atrium Hotel Portfolio 24 Pack Properties are covered by a blanket insurance policy reasonably acceptable to the lender insuring all or substantially all of the real property owned directly or indirectly by the guarantor and the borrowers, the borrowers will not be required to make deposits for insurance premiums, and (ii) to the extent taxes are timely paid by the borrowers and the borrowers deliver evidence reasonably acceptable to the lender that taxes have been paid as and when due, the borrowers will not be required to make deposits for insurance or taxes and other charges, as applicable.
Lockbox / Cash Management. The Atrium Hotel Portfolio 24 Pack Whole Loan is structured with a hard lockbox with respect to each individual Atrium Hotel Portfolio 24 Pack Property (collectively, the “Lockbox Account”) and springing cash management. At origination, the borrowers instructed each applicable credit card company or credit card clearing bank to deliver all receipts payable with respect to the Atrium Hotel Portfolio 24 Pack Properties directly to the Lockbox Account and have entered into the cash management agreement for the establishment of a cash management account (the “Cash Management Account”). All amounts in the Lockbox Account are required to be disbursed from the Lockbox Account to the Cash Management Account on each business day. If no Atrium Hotel Portfolio 24 Pack Cash Sweep Period is continuing, on each business day, all funds in the Cash Management Account, less the minimum balance as set forth in the Atrium Hotel Portfolio 24 Pack Whole Loan documents, will be remitted to the borrowers. If an Atrium Hotel Portfolio 24 Pack Cash Sweep Period is continuing, (a) if no event of default under the Atrium Hotel Portfolio 24 Pack Whole Loan documents or bankruptcy action of the borrowers has occurred and is continuing, all funds after payment of taxes and custodial funds then due and payable, required deposits to the tax and insurance reserve fund and the ground lease reserve, agent fees, monthly operating expenses, monthly debt service on the Atrium Hotel Portfolio 24 Pack Whole Loan, approved extraordinary expenses (or extraordinary expenses which do not require the approval of the lender under the Atrium Hotel Portfolio 24 Pack Whole Loan documents) and distributions for tax payments, gratuities and similar matters as set forth in the Atrium Hotel Portfolio 24 Pack Whole Loan documents are required to be held as additional collateral for the Atrium Hotel Portfolio 24 Pack Whole Loan and (b) if an event of default under the Atrium Hotel Portfolio 24 Pack Whole Loan documents or bankruptcy action of the borrowers has occurred and is continuing, but no Priority Payment Cessation Event (as defined below) has occurred, all funds after payment of taxes, custodial funds, insurance premiums, ground rents and (only if no receiver has been appointed, no bankruptcy action of the borrowers or property manager has occurred and no event of default under the Atrium Hotel Portfolio 24 Pack Whole Loan documents relating to fraud or negligence of the property manager has occurred) operating expenses are required to be held as additional collateral for the Atrium Hotel Portfolio 24 Pack Whole Loan, and (c) if a Priority Payment Cessation Event has occurred, the lender can apply amounts on deposit in the Cash Management Account in such manner or order as the lender determines in its sole discretion.
“Atrium Hotel Portfolio 24 Pack Cash Sweep Event” means the occurrence of: (a) an event of default under the Atrium Hotel Portfolio 24 Pack Whole Loan documents; (b) any bankruptcy action of the borrowers, any principal of the borrowers or property manager; (c) a Debt Yield Trigger Event (as defined below) or (d) the guarantor failing to comply with certain financial covenants set forth in the related guaranty (without limiting, any event of default under the Atrium Hotel Portfolio 24 Pack Whole Loan documents resulting therefrom).
“Atrium Hotel Portfolio 24 Pack Cash Sweep Period” means each period commencing on the occurrence of an Atrium Hotel Portfolio 24 Pack Cash Sweep Event and continuing until the earlier of (a) the date of the cure of the related Atrium Hotel Portfolio 24 Pack Cash Sweep Event, or (b) payment in full of the Atrium Hotel Portfolio 24 Pack Whole Loan.
“Debt Yield Cure” means the achievement of a debt yield of at least the Debt Yield Trigger Level (as defined below) as of the end of the calendar quarter immediately preceding the applicable payment date, which may at the borrowers’ election be accomplished by making a voluntary prepayment of the Atrium Hotel Portfolio 24 Pack Whole Loan pursuant to the terms of the Atrium Hotel Portfolio 24 Pack Whole Loan documents that, after giving effect thereto, results in a debt yield of at least the Debt Yield Trigger Level.
“Debt Yield Trigger Event” means any time the debt yield for the Atrium Hotel Portfolio 24 Pack Whole Loan as of the conclusion of the trailing 12 month period immediately preceding the end of the calendar quarter falls below the Debt Yield Trigger Level until the debt yield as of the conclusion of a subsequent calendar quarter is equal to or greater than the Debt Yield Trigger Level; provided, however, that if the amount in the excess cash flow reserve equals or exceeds the amount that, if applied to prepay a portion of the Atrium Hotel Portfolio 24 Pack Whole Loan, would result in the Debt Yield exceeding the Debt Yield Trigger Level (the “DY Trigger Cure Amount”), then no Debt Yield Trigger Event will be deemed to exist for so long as the amount on deposit in the excess cash flow reserve continues to equal or exceed the DY Trigger Cure Amount.
“Debt Yield Trigger Level” means (i) through the payment date occurring in October 2026, 8.50%, (ii) after the payment date occurring in October 2026 through the payment date occurring in October 2028, 8.75% and (iii) thereafter, 9.00%.
“Priority Payment Cessation Event” means (a) the conclusion of judicial or non-judicial foreclosure proceedings relating to all or a material portion of the Atrium Hotel Portfolio 24 Pack Properties, so long as no bankruptcy action of the borrowers or principal of the borrowers has occurred and (b) the satisfaction or other termination of the Atrium Hotel Portfolio 24 Pack Whole Loan.
Subordinate and Mezzanine Debt. The Atrium Hotel Portfolio 24 Pack Whole Loan also includes the Atrium Hotel Portfolio 24 Pack Junior Notes. The Atrium Hotel Portfolio 24 Pack Junior Notes bear interest at 8.97784591118801% per annum. Payments on the Atrium Hotel Portfolio 24 Pack Junior Notes are generally subordinate to payments on the Atrium Hotel Portfolio 24 Pack Senior Notes, provided that the Atrium Hotel Portfolio 24 Pack Junior Notes receive payments of interest prior to principal payments being made on
THE INFORMATION IN THIS STRUCTURAL AND COLLATERAL TERM SHEET IS NOT COMPLETE AND MAY BE AMENDED PRIOR TO THE TIME OF SALE. THIS TERM SHEET IS NOT AN OFFER TO SELL THESE SECURITIES AND IT IS NOT A SOLICITATION OF AN OFFER TO BUY THESE SECURITIES IN ANY JURISDICTION WHERE THE OFFER OR SALE IS NOT PERMITTED. |
| | 109 | |
| Hospitality – Various | Loan #8 | Cut-off Date Balance: | | $35,000,000 |
| Various | Atrium Hotel Portfolio 24 Pack | Cut-off Date LTV: | | 32.1% |
| Various | | U/W NCF DSCR: | | 4.17x |
| | | U/W NOI Debt Yield: | | 26.7% |
the Atrium Hotel Portfolio 24 Pack Senior Notes. See “Description of the Mortgage Pool—The Whole Loans—The Non-Serviced AB Whole Loans—The Atrium Hotel Portfolio 24 Pack AB Whole Loan” in the Preliminary Prospectus.
Permitted Future Mezzanine or Subordinate Debt. Not permitted.
Release of Collateral. The borrowers may obtain the release of one or more Atrium Hotel Portfolio 24 Pack Properties from the lien of the Atrium Hotel Portfolio 24 Pack Whole Loan by prepaying or defeasing the applicable release price (as described below), subject to the satisfaction of certain conditions, including but not limited to the debt yield on the Atrium Hotel Portfolio 24 Pack Whole Loan as calculated under the Atrium Hotel Portfolio 24 Pack Whole Loan documents after giving effect to the release is at least equal to the greater of (i) 11.0% and (ii) the debt yield immediately prior to giving effect to such release; provided that in no event will the debt yield be required to be more than 12.5%.
The release price for any Atrium Hotel Portfolio 24 Pack Property will be the related allocated loan amount plus a premium that increases as additional amounts are prepaid in connection with sales to third parties, expressed as a percentage of the related allocated loan amount as set forth in the chart below.
| Principal Balance Previously Prepaid | Release Price (Inclusive of Premium) as a Percentage of Allocated Loan Amount |
| $0 – $295,500,000 | 110% |
| Greater than $295,500,000 | 115% |
Notwithstanding the foregoing, in the event that the debt yield does not equal or exceed the required threshold as set forth above with respect to the Atrium Hotel Portfolio 24 Pack Properties remaining immediately following an individual Atrium Hotel Portfolio 24 Pack Property release and such release is in connection with an arms’ length sale to a third party, the release price will equal the greater of (i) the release price for such individual Atrium Hotel Portfolio 24 Pack Property and (ii) the lesser of (x) 100% of the gross cash proceeds actually received by the borrowers for such individual Atrium Hotel Portfolio 24 Pack Property (net of any reasonable and customary origination costs) and (y) an amount necessary to, after giving effect to such release of the individual Atrium Hotel Portfolio 24 Pack Property, achieve the applicable debt yield test.
In addition, the borrowers will have the right to either make a voluntary prepayment of the Atrium Hotel Portfolio 24 Pack Whole Loan in accordance with the provisions described above, defease the Atrium Hotel Portfolio 24 Pack Whole Loan, or deposit with the lender as additional collateral for the Atrium Hotel Portfolio 24 Pack Whole Loan cash or a letter of credit, in each case in the amount necessary to achieve a debt yield that equals or exceeds the required threshold.
In connection with any release of an Atrium Hotel Portfolio 24 Pack Property, any paydown in excess of the allocated loan amount for such Atrium Hotel Portfolio 24 Pack Property will reduce the allocated loan amounts for all remaining Atrium Hotel Portfolio 24 Pack Properties on a pro rata basis. In addition, the borrowers will be permitted to obtain the release of certain parcels of land that were not necessary for the generation of income as of the origination date of the Atrium Hotel Portfolio 24 Pack Whole Loan, without payment of any release price, subject to satisfaction of certain conditions.
Notwithstanding the foregoing, no defeasance in connection with an Atrium Hotel Portfolio 24 Pack Property release is permitted prior to the earlier to occur of (i) the payment date occurring in November 2027 and (ii) the second anniversary of the closing date of the securitization of the last note of the Atrium Hotel Portfolio 24 Pack Whole Loan to be securitized.
Any prepayment or defeasance of the Atrium Hotel Portfolio 24 Pack Whole Loan in connection with an Atrium Hotel Portfolio 24 Pack Property release will be applied first to the Senior Notes on a pro rata basis (and sequentially to the Senior Note components), and then to the Junior Notes on a pro rata basis (and sequentially to the Junior Note components). Any voluntary prepayments are subject to satisfaction of all the conditions in the Atrium Hotel Portfolio 24 Pack Whole Loan documents including, without limitation, (i) no event of default exists and is continuing under the Atrium Hotel Portfolio 24 Pack Whole Loan documents (except if such release would cure such event of default, as more particularly set forth in the Atrium Hotel Portfolio 24 Pack Whole Loan documents); and (ii) the borrowers pay, in addition to the outstanding principal amount of the Atrium Hotel Portfolio 24 Pack Whole Loan to be prepaid, (A) all interest that would have accrued on the amount of the Atrium Hotel Portfolio 24 Pack Whole Loan to be paid through and including the last day of the Atrium Hotel Portfolio 24 Pack Whole Loan interest accrual period in which such prepayment occurs; (B) all other sums then due and payable under the Atrium Hotel Portfolio 24 Pack Whole Loan documents; and (C) if such prepayment is made prior to the May 2029 payment date, the applicable yield maintenance premium. Any partial prepayment of the Atrium Hotel Portfolio 24 Pack Whole Loan will be applied first to the Senior Notes on a pro rata basis (and sequentially to the Senior Note components), and then to the Junior Notes (as defined below), on a pro rata basis (and sequentially to the Junior Note components).
THE INFORMATION IN THIS STRUCTURAL AND COLLATERAL TERM SHEET IS NOT COMPLETE AND MAY BE AMENDED PRIOR TO THE TIME OF SALE. THIS TERM SHEET IS NOT AN OFFER TO SELL THESE SECURITIES AND IT IS NOT A SOLICITATION OF AN OFFER TO BUY THESE SECURITIES IN ANY JURISDICTION WHERE THE OFFER OR SALE IS NOT PERMITTED. |
| | 110 | |
| Hospitality – Various | Loan #8 | Cut-off Date Balance: | | $35,000,000 |
| Various | Atrium Hotel Portfolio 24 Pack | Cut-off Date LTV: | | 32.1% |
| Various | | U/W NCF DSCR: | | 4.17x |
| | | U/W NOI Debt Yield: | | 26.7% |
Ground Lease. Six Atrium Hotel Portfolio 24 Pack Properties are subject to ground leases. Below is a summary of the ground leased properties:
| Property | Lessor | Expiration Date | August 2024 TTM Ground Rent | Ground Rent Calculation |
| St. Charles Embassy Suites | City of St. Charles, Missouri | April 30, 2098(1) | $100,081 | $100 + 0.75% of adjusted rooms revenue |
| Embassy Suites Lexington UK Coldstream | The University of Kentucky | December 1, 2092 | $200,712 | The ground lease increases by a rate of 25% of the percentage increase of the Consumer Price Index every 60 months. Next reset occurs in 2029. |
| Loveland Embassy Suites | Board of County Commissioners of Larimer County, Colorado | April 9, 2064 | $144,622 | 1.50% of adjusted rooms revenue |
| East Peoria Embassy Suites | City of East Peoria | September 1, 2027(2) | $180,000(2) | Fixed |
| Tucson University Marriott | Marshall Foundation | June 30, 2094 | $153,782 | Annual rent is adjusted every three years by the 80% of the CPI increase over the intervening term. Next reset occurs in 2025. |
| North Charleston Residence Inn(3) | City of North Charleston | May 31, 2058 | $80,000 | Fixed |
| (1) | Represents the fully extended expiration date. The initial expiration date is April 30, 2058 and is subject to four, 10-year extension options. |
| (2) | The related borrower has a $100 purchase option to purchase the leased fee upon termination of the ground lease, so the rent payment is recorded in the borrower’s financials as a capitalized lease obligation. The related borrower must provide the ground lessor with notice of its intent to exercise the purchase option at least 120 days prior to the expiration date, and the purchase would occur upon termination (i.e., the same day). |
| (3) | The related borrower has a $2.3 million land purchase option exercisable at any time during the lease term. |
Right of First Offer/Right of First Refusal. Marriott International, Inc., as franchisor (including the Marriott, Embassy Suites, Renaissance, Courtyard and Residence Inn brands), has a conditional Right of First Refusal (“ROFR”) to acquire each Atrium Hotel Portfolio 24 Pack Property operated under a Marriott flag (Marriott, Residence Inn, Renaissance and Courtyard by Marriott) if there is a transfer of one of the hotels or controlling direct or indirect interest in a Borrower to a competitor (generally, any person that exclusively develops, operates or franchises through or with a competitor of franchisor comprising at least 10 luxury hotels, 20 full-service hotels or 50 limited-service hotels). The ROFR is not extinguished by foreclosure or deed-in-lieu thereof, and if there is a transfer to a competitor by foreclosure, or if franchisee or its affiliates become a competitor, franchisor has right to purchase hotel upon notice to franchisee. The franchisor comfort letters provide that, if lender exercises remedies against a franchisee, lender may appoint a lender affiliate to acquire the property and enter into a management or franchise agreement if it is not competitor or competitor affiliate; provided, however, that a lender affiliate will not be deemed a competitor simply due to its ownership of multiple or competing hotels or having engaged managers to manage such other hotels.
Terrorism Insurance. The Atrium Hotel Portfolio 24 Pack Mortgage Loan documents require an “all risk” insurance policy on a replacement cost basis, together with (i) business interruption insurance covering no less than the 18-month period following the occurrence of a casualty event, together with a 12-month extended period of indemnity, (ii) windstorm and /or named storm coverage with a deductible up to 5% of the total insurable value, and (iii) terrorism coverage as defined by TRIPRA. See “Risk Factors—Risks Relating to the Mortgage Loans—Terrorism Insurance May Not Be Available for All Mortgaged Properties” in the prospectus.
THE INFORMATION IN THIS STRUCTURAL AND COLLATERAL TERM SHEET IS NOT COMPLETE AND MAY BE AMENDED PRIOR TO THE TIME OF SALE. THIS TERM SHEET IS NOT AN OFFER TO SELL THESE SECURITIES AND IT IS NOT A SOLICITATION OF AN OFFER TO BUY THESE SECURITIES IN ANY JURISDICTION WHERE THE OFFER OR SALE IS NOT PERMITTED. |
| | 111 | |
| Retail – Super Regional Mall | Loan #9 | Cut-off Date Balance: | | $30,000,000 |
90-15 Queens Boulevard Elmhurst, NY 11373 | Queens Center | Cut-off Date LTV: U/W NCF DSCR: U/W NOI Debt Yield: | | 49.5% 1.84x 10.2% |
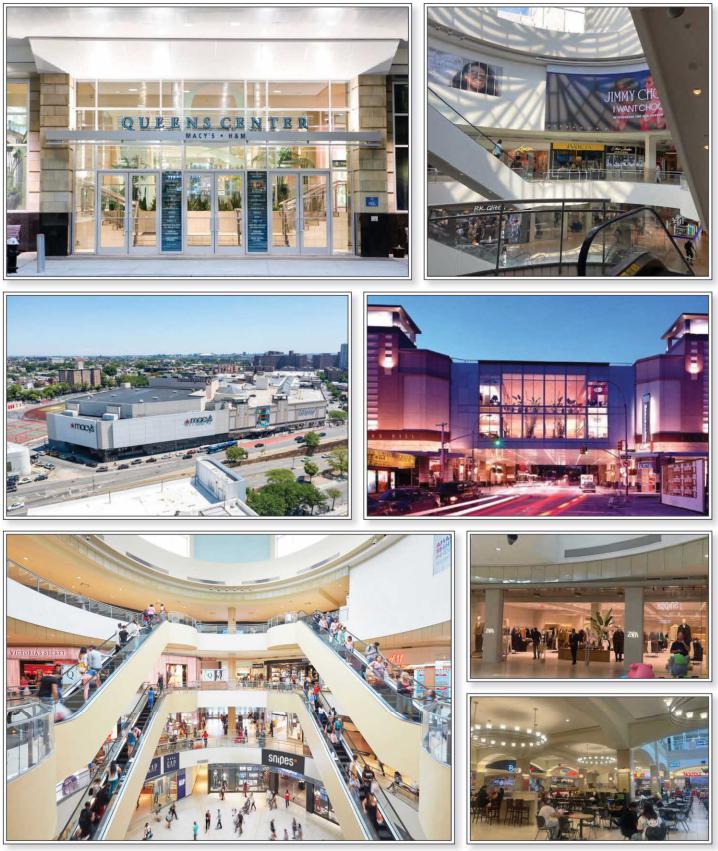
THE INFORMATION IN THIS STRUCTURAL AND COLLATERAL TERM SHEET IS NOT COMPLETE AND MAY BE AMENDED PRIOR TO THE TIME OF SALE. THIS TERM SHEET IS NOT AN OFFER TO SELL THESE SECURITIES AND IT IS NOT A SOLICITATION OF AN OFFER TO BUY THESE SECURITIES IN ANY JURISDICTION WHERE THE OFFER OR SALE IS NOT PERMITTED. |
| | 112 | |
| Retail – Super Regional Mall | Loan #9 | Cut-off Date Balance: | | $30,000,000 |
90-15 Queens Boulevard Elmhurst, NY 11373 | Queens Center | Cut-off Date LTV: U/W NCF DSCR: U/W NOI Debt Yield: | | 49.5% 1.84x 10.2% |

THE INFORMATION IN THIS STRUCTURAL AND COLLATERAL TERM SHEET IS NOT COMPLETE AND MAY BE AMENDED PRIOR TO THE TIME OF SALE. THIS TERM SHEET IS NOT AN OFFER TO SELL THESE SECURITIES AND IT IS NOT A SOLICITATION OF AN OFFER TO BUY THESE SECURITIES IN ANY JURISDICTION WHERE THE OFFER OR SALE IS NOT PERMITTED. |
| | 113 | |
| Retail – Super Regional Mall | Loan #9 | Cut-off Date Balance: | | $30,000,000 |
90-15 Queens Boulevard Elmhurst, NY 11373 | Queens Center | Cut-off Date LTV: U/W NCF DSCR: U/W NOI Debt Yield: | | 49.5% 1.84x 10.2% |
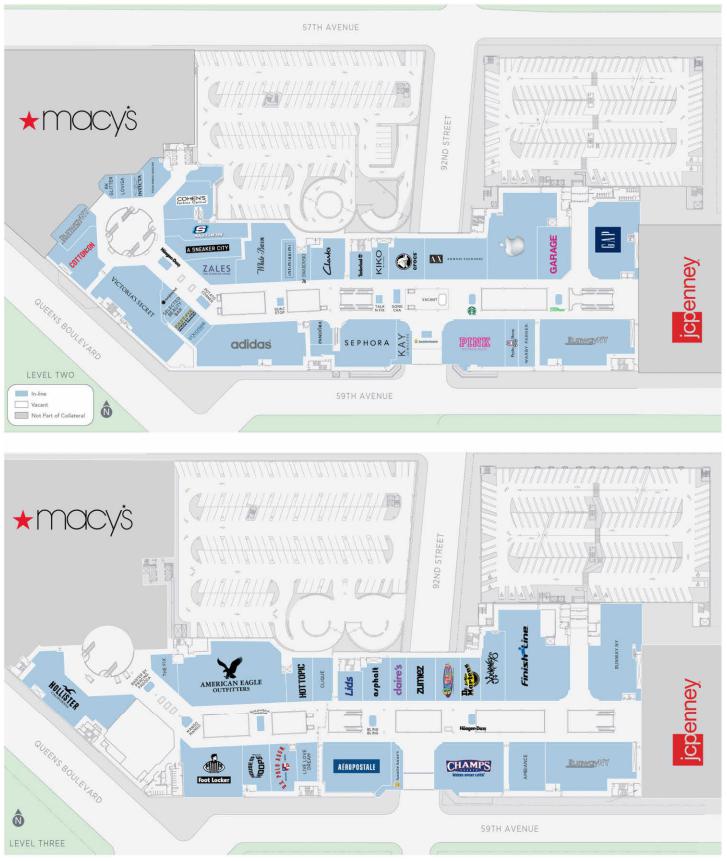
THE INFORMATION IN THIS STRUCTURAL AND COLLATERAL TERM SHEET IS NOT COMPLETE AND MAY BE AMENDED PRIOR TO THE TIME OF SALE. THIS TERM SHEET IS NOT AN OFFER TO SELL THESE SECURITIES AND IT IS NOT A SOLICITATION OF AN OFFER TO BUY THESE SECURITIES IN ANY JURISDICTION WHERE THE OFFER OR SALE IS NOT PERMITTED. |
| | 114 | |
| Retail – Super Regional Mall | Loan #9 | Cut-off Date Balance: | | $30,000,000 |
90-15 Queens Boulevard Elmhurst, NY 11373 | Queens Center | Cut-off Date LTV: U/W NCF DSCR: U/W NOI Debt Yield: | | 49.5% 1.84x 10.2% |

THE INFORMATION IN THIS STRUCTURAL AND COLLATERAL TERM SHEET IS NOT COMPLETE AND MAY BE AMENDED PRIOR TO THE TIME OF SALE. THIS TERM SHEET IS NOT AN OFFER TO SELL THESE SECURITIES AND IT IS NOT A SOLICITATION OF AN OFFER TO BUY THESE SECURITIES IN ANY JURISDICTION WHERE THE OFFER OR SALE IS NOT PERMITTED. |
| | 115 | |
| Retail – Super Regional Mall | Loan #9 | Cut-off Date Balance: | | $30,000,000 |
90-15 Queens Boulevard Elmhurst, NY 11373 | Queens Center | Cut-off Date LTV: U/W NCF DSCR: U/W NOI Debt Yield: | | 49.5% 1.84x 10.2% |

THE INFORMATION IN THIS STRUCTURAL AND COLLATERAL TERM SHEET IS NOT COMPLETE AND MAY BE AMENDED PRIOR TO THE TIME OF SALE. THIS TERM SHEET IS NOT AN OFFER TO SELL THESE SECURITIES AND IT IS NOT A SOLICITATION OF AN OFFER TO BUY THESE SECURITIES IN ANY JURISDICTION WHERE THE OFFER OR SALE IS NOT PERMITTED. |
| | 116 | |
| Mortgage Loan Information | | Mortgaged Property Information |
| Mortgage Loan Sellers: | JPMorgan Chase Bank, National | | Single Asset/Portfolio: | Single Asset |
| | Association and Goldman Sachs | | Property Type – Subtype: | Retail – Super Regional Mall |
| | Mortgage Company | | Location: | Elmhurst, NY |
| Credit Assessment (Fitch/KBRA/Moody’s): | BBB/BBB/NR | | Size(4): | 412,033 SF |
| Original Principal Balance(1): | $30,000,000 | | Cut-off Date Balance Per SF(1): | $1,274.17 |
| Cut-off Date Balance(1): | $30,000,000 | | Maturity Date Balance Per SF(1): | $1,274.17 |
| % of Initial Pool Balance: | 4.2% | | Year Built/Renovated: | 1973/2004 |
| Loan Purpose: | Refinance | | Title Vesting(5): | Fee/Leasehold |
| Borrower Sponsor: | The Macerich Partnership, L.P. | | Property Manager: | Macerich Property Management Company, LLC (borrower related) |
| Guarantor: | The Macerich Partnership, L.P. | | Current Occupancy (As of): | 95.4% (10/07/2024) |
| Mortgage Rate: | 5.3700% | | YE 2023 Occupancy: | 98.9% |
| Note Date: | October 28, 2024 | | YE 2022 Occupancy: | 98.7% |
| Seasoning: | 0 months | | YE 2021 Occupancy: | 97.6% |
| Maturity Date: | November 6, 2029 | | YE 2020 Occupancy: | 97.9% |
| IO Period: | 60 months | | As-Is Appraised Value: | $1,060,000,000 |
| Loan Term (Original): | 60 months | | As-Is Appraised Value Per SF: | $2,573 |
| Amortization Term (Original): | NAP | | As-Is Appraisal Valuation Date: | September 19, 2024 |
| Loan Amortization Type: | Interest Only | | | |
| Call Protection: | L(24),DorYM1(29),O(7) | | Underwriting and Financial Information(1) |
| Lockbox Type: | Hard/Springing Cash Management | | TTM NOI (9/30/2024): | $49,730,304 |
| Additional Debt(1)(2): | Yes | | YE 2023 NOI: | $52,482,275 |
| Additional Debt Type (Balance)(1)(2): | Pari Passu ($495,000,000) | | YE 2022 NOI: | $55,476,544 |
| | | YE 2021 NOI: | $51,866,594 |
| Escrows and Reserves(3) | | U/W Revenues: | $100,774,128 |
| | Initial | Monthly | Cap | | U/W Expenses: | $47,153,562 |
| Taxes: | $0 | Springing | NAP | | U/W NOI: | $53,620,566 |
| Insurance: | $0 | Springing | NAP | | U/W NCF: | $52,532,319 |
| Replacement Reserve: | $0 | Springing | $206,017 | | U/W DSCR based on NOI/NCF(1): | 1.88x / 1.84x |
| TI/LC Reserve: | $0 | Springing | $641,476 | | U/W Debt Yield based on NOI/NCF(1): | 10.2% / 10.0% |
| Outstanding TI/LC and Gap Rent: | $12,211,534 | $0 | NAP | | U/W Debt Yield at Maturity based on NOI/NCF(1): | 10.2% / 10.0% |
| | | | | | Cut-off Date LTV Ratio(1): | 49.5% |
| | | | | | LTV Ratio at Maturity(1): | 49.5% |
| | | | | | | | |
| Sources and Uses |
| Sources | | | | Uses | | |
| Whole Loan Amount(1) | $525,000,000 | 85.2 | % | | Loan Payoff | $601,802,949 | 97.7 | % |
| Sponsor Equity: | $91,238,851 | 14.8 | | | Reserves | $12,211,534 | 2.0 | |
| | | | | Closing Costs | $2,224,368 | 0.4 | |
| Total Sources | $616,238,851 | 100.0 | % | | Total Uses | $616,238,851 | 100.0 | % |
| (1) | The Queens Center Mortgage Loan (as defined below) is part of a whole loan evidenced by 27 pari passu promissory notes with an aggregate original principal balance of $525,000,000. The financial information presented in the chart above is based on the Queens Center Whole Loan (as defined below). |
| (2) | See “The Mortgage Loan” below for further discussion of additional mortgage debt. |
| (3) | See “Escrows and Reserves” below for further discussion of reserve requirements. |
| (4) | Size is exclusive of 556,724 SF associated with Macy’s and JCPenney, both of which are non-collateral anchor tenants. |
| (5) | See “Ground Lease” below for further discussion of reserve requirements. |
The Mortgage Loan. The ninth largest mortgage loan (the “Queens Center Mortgage Loan”) is part of a whole loan evidenced by 27 pari passu promissory notes with an aggregate outstanding principal balance as of the Cut-off Date of $525,000,000 (the “Queens Center Whole Loan”). The Queens Center Whole Loan is secured by the borrowers’ non-overlapping fee and leasehold interest in a 412,033 SF retail property located in Elmhurst, New York (the “Queens Center Property”) as well as the Pledgor Borrower’s (as defined below) membership interest in the Property Borrower (as defined below). The Queens Center Mortgage Loan is evidenced by the non-controlling Notes A-2-1 and A-3-3, with an outstanding principal balance as of the Cut-off Date of $30,000,000. The Queens Center Whole Loan was originated by German American Capital Corporation (“GACC”), Goldman Sachs Bank USA (“GS”), JPMorgan Chase Bank, National Association (“JPMCB”), Bank of Montreal (“BMO”) and Morgan Stanley Bank, N.A. (“MSBNA”) on October 28, 2024. Goldman Sachs Mortgage Company, an affiliate of GS, is selling Note A-2-1 with an outstanding principal balance as of the Cut-off Date of $15,000,000 and JPMCB is selling Note A-3-3 with an outstanding principal balance as of the Cut-off Date of $15,000,000. The Queens Center Whole Loan is serviced pursuant to the pooling and servicing agreement for the BANK5 2024-5YR11 securitization trust
THE INFORMATION IN THIS STRUCTURAL AND COLLATERAL TERM SHEET IS NOT COMPLETE AND MAY BE AMENDED PRIOR TO THE TIME OF SALE. THIS TERM SHEET IS NOT AN OFFER TO SELL THESE SECURITIES AND IT IS NOT A SOLICITATION OF AN OFFER TO BUY THESE SECURITIES IN ANY JURISDICTION WHERE THE OFFER OR SALE IS NOT PERMITTED. |
| | 117 | |
| Retail – Super Regional Mall | Loan #9 | Cut-off Date Balance: | | $30,000,000 |
90-15 Queens Boulevard Elmhurst, NY 11373 | Queens Center | Cut-off Date LTV: U/W NCF DSCR: U/W NOI Debt Yield: | | 49.5% 1.84x 10.2% |
until the controlling Note A-1-1 is securitized, at which time servicing will shift to the pooling and servicing agreement for such future securitization. See “Description of the Mortgage Pool—The Non-Serviced Pari Passu Whole Loans” and “Pooling and Servicing Agreement—Servicing of the Non-Serviced Mortgage Loans” in the prospectus.
Whole Loan Note Summary
| Note | Original Balance | Cut-off Date Balance | Note Holder | Controlling Piece |
| A-1-1(1) | $50,000,000 | $50,000,000 | GACC | Yes |
| A-1-2(1) | $25,000,000 | $25,000,000 | GACC | No |
| A-1-3(1) | $25,000,000 | $25,000,000 | GACC | No |
| A-1-4(1) | $20,000,000 | $20,000,000 | GACC | No |
| A-1-5(1) | $15,000,000 | $15,000,000 | GACC | No |
| A-1-6(1) | $15,000,000 | $15,000,000 | GACC | No |
| A-2-1 | $15,000,000 | $15,000,000 | WFCM 2024-5C2 | No |
| A-2-2(1) | $15,000,000 | $15,000,000 | GS | No |
| A-2-3(1) | $15,000,000 | $15,000,000 | GS | No |
| A-2-4(1) | $15,000,000 | $15,000,000 | GS | No |
| A-2-5(1) | $15,000,000 | $15,000,000 | GS | No |
| A-2-6(1) | $25,000,000 | $25,000,000 | GS | No |
| A-3-1 | $43,000,000 | $43,000,000 | BANK5 2024-5YR11 | No |
| A-3-2(1) | $20,000,000 | $20,000,000 | JPMCB | No |
| A-3-3 | $15,000,000 | $15,000,000 | WFCM 2024-5C2 | No |
| A-3-4(1) | $15,000,000 | $15,000,000 | JPMCB | No |
| A-3-5(1) | $7,000,000 | $7,000,000 | JPMCB | No |
| A-4-1(1) | $15,000,000 | $15,000,000 | BMO | No |
| A-4-2(1) | $15,000,000 | $15,000,000 | BMO | No |
| A-4-3(1) | $15,000,000 | $15,000,000 | BMO | No |
| A-4-4(1) | $15,000,000 | $15,000,000 | BMO | No |
| A-4-5(1) | $15,000,000 | $15,000,000 | BMO | No |
| A-4-6(1) | $25,000,000 | $25,000,000 | BMO | No |
| A-5-1 | $32,000,000 | $32,000,000 | BANK5 2024-5YR11 | No |
| A-5-2(1) | $20,000,000 | $20,000,000 | MSBNA | No |
| A-5-3(1) | $15,000,000 | $15,000,000 | MSBNA | No |
| A-5-4(1) | $8,000,000 | $8,000,000 | MSBNA | No |
| Total | $525,000,000 | $525,000,000 | | |
| (1) | Expected to be contributed to one or more future securitization transactions or may otherwise be transferred at any time. |
The Borrowers and Borrower Sponsor. The borrowers for the Queens Center Whole Loan are Queens Center SPE LLC (the “Property Borrower”) and Queens Center Pledgor LLC (the “Pledgor Borrower”; together with the Property Borrower, the “Borrowers”), each a Delaware limited liability company and single purpose entity with two independent directors. The borrower sponsor is The Macerich Partnership, L.P., which is a subsidiary of The Macerich Company (“Macerich”). Macerich is a fully integrated, self-managed and self-administered real estate investment trust. The Macerich Partnership, L.P. is the non-recourse carveout guarantor. Developing and managing properties that serve as community cornerstones, Macerich currently owns 44 million SF of real estate consisting primarily of interests in 41 retail centers. Legal counsel to the Borrowers delivered a non-consolidation opinion in connection with the origination of the Queens Center Whole Loan.
The Property. Built in 1973 and renovated in 2004, Queens Center (the “Queens Center Mall”) is a 968,757 SF (412,033 collateral SF) super regional shopping center located in Elmhurst, NY situated on an 8.41-acre parcel with 1,903 parking spaces. Of the 968,757 total SF, 412,033 SF constitutes the collateral for the Queens Center Whole Loan, with the remaining non-collateral areas of the Queens Center Mall occupied by Macy’s and JCPenney and owned by third parties.
Representing the sole enclosed super-regional shopping center in Queens, the Queens Center Mall attracts 9.4 million visitors annually and has a trade area of 2.4 million people. The Queens Center Mall has historically benefited from high tenant demand with occupancy
THE INFORMATION IN THIS STRUCTURAL AND COLLATERAL TERM SHEET IS NOT COMPLETE AND MAY BE AMENDED PRIOR TO THE TIME OF SALE. THIS TERM SHEET IS NOT AN OFFER TO SELL THESE SECURITIES AND IT IS NOT A SOLICITATION OF AN OFFER TO BUY THESE SECURITIES IN ANY JURISDICTION WHERE THE OFFER OR SALE IS NOT PERMITTED. |
| | 118 | |
| Retail – Super Regional Mall | Loan #9 | Cut-off Date Balance: | | $30,000,000 |
90-15 Queens Boulevard Elmhurst, NY 11373 | Queens Center | Cut-off Date LTV: U/W NCF DSCR: U/W NOI Debt Yield: | | 49.5% 1.84x 10.2% |
averaging 98.4% over the last 10 years. Further, the Queens Center Property is currently 95.4% leased and features a strong mix of 120 national and regional tenants. Since 2022, Macerich has been able to successfully re-tenant or renew over 60% of the collateral SF. Recently, the borrower sponsor has leased to several new high-performing tenants including Primark (54,832 SF), ZARA (36,463 SF) and H&M (19,694 SF).
The Queens Center Mall was originally acquired by Macerich in 1995. In 2004, Macerich invested $275.0 million to fully redevelop and expand the Queens Center Property. The expansion featured the addition of 250,000 in-line SF and JCPenney’s development of a 204,340 SF box, which JCPenney subsequently sold to Ashkenazy Acquisition Corporation in January 2022. Since 2019, the Borrowers have invested $65.2 million in leasing capital, common area renovations, and operational upgrades with plans to invest an additional $13.0 million by the end of 2024 (such additional investment is not required or reserved for under the Queens Center Whole Loan documents). Of the $78.2 million spent or budgeted from 2019 through year end 2024, $15.2 million has been allocated toward buildout of ZARA’s new 36,463 SF store, which combined 10 in-line units across two floors. Furthermore, Macerich has invested $19.7 million and $6.3 million in tenant allowances and buildout costs for Primark (54,832 SF) and H&M (19,694 SF), respectively.
According to the appraisal, the Queens Center Mall is a top-producing center in New York City, attracting significant foot traffic and generating over $500 million in annual sales. The Queens Center Mall’s sales PSF are significantly higher than the national average, with comparable mall shop sales reported at $1,731 PSF ($1,165 PSF excluding Apple). According to the borrower sponsor, as of TTM July 2024 the non-collateral Macy’s and JCPenney reported annual sales of $132,000,000 and $26,000,000, respectively.
Major Tenants.
Primark (54,832 SF; 13.3% of NRA; 5.6% of underwritten base rent): Founded in 1969, Primark is an international fashion retailer that offers affordable fashion, home goods and accessories. Primark operates over 450 stores across 17 countries across Europe and the United States. The Queens Center Property hosts Primark’s newest location in the Tri-State area. Primark is not yet in occupancy and is expected to take possession of its space in December 2024. Primark’s lease expires in January 2035, has two, five-year extension options remaining and contains a termination option in the event that gross sales between December 2027 and November 2028 do not exceed $23,000,000, provided it gives notice within 90 days following November 30, 2028.
ZARA (36,463 SF; 8.8% of NRA; 3.2% of underwritten base rent): Founded in 1974, ZARA is an international fashion retailer and part of the Inditex Group. ZARA operates approximately 3,000 stores in 96 countries, offering a wide range of fashion-forward apparel. ZARA’s forecasted reported annual sales for the TTM July 2024 period are $23,559,201 ($646 PSF). ZARA’s lease expires in November 2033, has one, five-year extension option remaining and contains a termination option in the event that it gives notice 270 days prior to (i) December 31, 2028 or (ii) May 31, 2031.
H&M (19,694 SF; 4.8% of NRA; 2.8% of underwritten base rent): Founded in 1947, H&M, part of the H&M Group, is a global fashion retailer offering a broad range of clothing and accessories for men, women, and children. H&M has over 3,800 stores across 77 markets worldwide. H&M is known for its commitment to affordable fashion. H&M’s lease expires in January 2035, has two, 4-year extension options remaining and no termination options, other than an option to terminate based on gross sales in the 2028 and 2031 calendar years.
American Eagle Outfitters (10,268 SF; 2.5% of NRA; 3.4% of underwritten base rent): Founded in 1977, American Eagle Outfitters is a global specialty retailer that offers various types of apparel, intimates, activewear, accessories, and personal care products. With over 1,000 stores worldwide, American Eagle focuses on providing a unique shopping experience for the 15 to 25 year-old consumer demographic. American Eagle Outfitters reported annual sales for the TTM July 2024 period of $10,541,311 ($1,027 PSF). American Eagle Outfitters’ lease expires in September 2032 and has no extension or termination options.
THE INFORMATION IN THIS STRUCTURAL AND COLLATERAL TERM SHEET IS NOT COMPLETE AND MAY BE AMENDED PRIOR TO THE TIME OF SALE. THIS TERM SHEET IS NOT AN OFFER TO SELL THESE SECURITIES AND IT IS NOT A SOLICITATION OF AN OFFER TO BUY THESE SECURITIES IN ANY JURISDICTION WHERE THE OFFER OR SALE IS NOT PERMITTED. |
| | 119 | |
| Retail – Super Regional Mall | Loan #9 | Cut-off Date Balance: | | $30,000,000 |
90-15 Queens Boulevard Elmhurst, NY 11373 | Queens Center | Cut-off Date LTV: U/W NCF DSCR: U/W NOI Debt Yield: | | 49.5% 1.84x 10.2% |
The following table presents a summary regarding the major tenants at the Queens Center Property:
Major Tenants(1)
| Tenant Name | Credit Rating (Fitch / Moody’s /
S&P)(2) | Tenant NRSF | % of NRSF | Annual U/W Rent | % of Total Annual U/W Rent | Annual U/W Rent PSF | Term. Option (Y/N) | Lease Expiration Date | Ext. Options |
| Major Tenants | | | | | | | | | |
| Primark | NR/NR/NR | 54,832 | 13.3% | $2,967,306 | 5.6% | $54.12 | Y(3) | 1/31/2035 | 2 x 5 Yr |
| ZARA | NR/NR/NR | 36,463 | 8.8% | $1,700,000 | 3.2% | $46.62 | Y(4) | 11/30/2033 | 1 x 5 Yr |
| H&M | NR/NR/NR | 19,694 | 4.8% | $1,477,050 | 2.8% | $75.00 | Y(5) | 1/31/2035 | 2 x 4 Yr |
| American Eagle Outfitters | NR/NR/NR | 10,268 | 2.5% | $1,773,181 | 3.4% | $172.69 | N | 9/30/2032 | None |
| | | | | | | | | | |
| Select In-Line < 10,000 SF | | | | | | | | | |
| Apple | NR/Aaa/AA+ | 8,706 | 2.1% | $1,558,044 | 3.0% | $178.96 | N | 7/31/2025 | 1 x 5 Yr |
| Finish Line | NR/NR/NR | 8,625 | 2.1% | $1,669,923 | 3.2% | $193.61 | N | 8/31/2025 | None |
| Adidas | NR/NR/NR | 8,183 | 2.0% | $1,104,705(6) | 2.1% | $135.00 | Y(7) | 1/31/2029 | None |
| The Cheesecake Factory | NR/NR/NR | 8,077 | 2.0% | $848,085 | 1.6% | $105.00 | N | 1/31/2037 | 2 x 5 Yr |
| Hollister Co. | NR/NR/NR | 8,028 | 1.9% | $879,028 | 1.7% | $109.50 | N | 1/31/2027 | None |
| Victoria’s Secret | NR/NR/NR | 7,767 | 1.9% | $1,285,796 | 2.4% | $165.55 | N | 1/31/2033 | None |
| Subtotal/Wtd. Avg. | | 49,386 | 12.0% | $7,345,580 | 13.9% | $148.74 | | | |
| | | | | | | | | | |
| Remaining Occupied | | 222,284 | 54.0% | $37,530,596 | 71.1% | $168.84 | | | |
| | | | | | | | | | |
| Occupied Total | | 392,927 | 95.4% | $52,793,713 | 100.0% | $134.36 | | | |
| Vacant(8) | | 19,106 | 4.6% | | | | | | |
| Total/Wtd. Avg. | | 412,033 | 100.0% | | | | | | |
| (1) | Based on the underwritten rent roll dated as of October 7, 2024 and exclusive of 556,724 SF associated with Macy’s and JCPenney, both of which are non-collateral anchors. |
| (2) | Certain ratings are those of the parent company whether or not the parent guarantees the lease. |
| (3) | Primark has the right to terminate its lease if its gross sales between December 2027 and November 2028 do not exceed $23,000,000, provided it gives notice within 90 days following November 30, 2028, with the payment of a termination fee in an amount equal to the unamortized portion, as of the end of the fifth lease year, of the sum of certain allowance for construction and other interior work amortized on a straight-line basis over the period from the rent commencement date through the effective date of termination. |
| (4) | ZARA has the right to terminate its lease, provided it gives notice 270 days prior to (i) December 31, 2028 or (ii) May 31, 2031, with the payment of a termination fee in an amount equal to the unamortized portion, as of the end of the fifth lease year, of the sum of certain allowance for construction work amortized on a straight-line basis over the period from the rent commencement date through the effective date of termination. |
| (5) | H&M has the right to terminate its lease if its gross sales (i) between January 2028 and December 2028 do not exceed $16,000,000 or (ii) between January 2031 and December 2031 do not exceed $18,000,000, in each case, provided that it gives notice within 120 days following such period, with the payment of a termination fee in an amount equal to 50% (if terminated based on sales in 2028) or 25% (if terminated based on sales in 2031) of the unamortized portion of the sum of certain allowance for construction and other interior work amortized on a straight-line basis over the period from the rent commencement date through the effective date of termination. |
| (6) | During the period commencing January 2024 and continuing through December 2024 (“Rent Reduction Period”), in lieu of fixed minimum rent and percentage rent set forth in the lease, Adidas benefits from reduced monthly rent in the amount of (a) $92,058.75 plus (b) the product obtained by multiplying 6% by annual gross sales in excess of $14,452,452.47. |
| (7) | If Adidas’ gross sales for calendar year 2024 (the “Test Period”) do not exceed $7,000,000, anytime during the 60-day period immediately following the Test Period, Adidas will have the one-time right to terminate its lease upon 90 days’ prior written notice and the payment of termination fee in an amount equal to five times the monthly fixed minimum rent and monthly amount of the tenant’s share of variable costs as set forth in the lease and in effect on the date of tenant’s notice to terminate its lease. Adidas’ sales for the TTM July 2024 period were $5,438,309. |
| (8) | Vacant includes 8,351 SF currently occupied that is underwritten as vacant though currently occupied by tenants known to be vacating. The Queens Center Property was 97.4% physically occupied inclusive of such tenants as of October 7, 2024. |
The following table presents certain comparable sales history at the Queens Center Mall:
Comparable Sales(1)
| | 2019 | 2021 | 2022 | 2023 | TTM
7/31/2024 |
| Inline (<10,000 SF) Sales PSF | $1,581 | $1,615 | $1,717 | $1,751 | $1,731 |
| Inline (<10,000 SF excluding Apple) Sales PSF | $1,145 | $1,122 | $1,189 | $1,147 | $1,165 |
| Inline (<10,000 SF excluding Apple) Occupancy Cost(2) | 22.5% | 21.7% | 21.1% | 22.8% | 22.1% |
| Non-collateral Anchor Sales(3) | $173,300,000 | $159,700,000 | $164,000,000 | $164,000,000 | $158,000,000 |
| Total Queens Center Mall Sales | $616,120,375 | $536,343,372 | $561,506,309 | $562,896,033 | $533,839,416 |
| (1) | All sales information presented above is based upon information provided by the borrower sponsor. In certain instances, sales figures represent estimates because the tenants are not required to report, or otherwise may not have reported sales information on a timely basis. Further, because sales are self-reported, such information is not independently verified by the borrower sponsor. |
| (2) | Occupancy Cost is calculated based on gross sales divided by the sum of (i) contractual rent and (ii) reimbursements, each based on the underwritten rent roll dated October 7, 2024. |
| (3) | Includes sales of Macy’s and JCPenney, both of which are non-collateral anchors, as provided by the borrower sponsor. |
THE INFORMATION IN THIS STRUCTURAL AND COLLATERAL TERM SHEET IS NOT COMPLETE AND MAY BE AMENDED PRIOR TO THE TIME OF SALE. THIS TERM SHEET IS NOT AN OFFER TO SELL THESE SECURITIES AND IT IS NOT A SOLICITATION OF AN OFFER TO BUY THESE SECURITIES IN ANY JURISDICTION WHERE THE OFFER OR SALE IS NOT PERMITTED. |
| | 120 | |
| Retail – Super Regional Mall | Loan #9 | Cut-off Date Balance: | | $30,000,000 |
90-15 Queens Boulevard Elmhurst, NY 11373 | Queens Center | Cut-off Date LTV: U/W NCF DSCR: U/W NOI Debt Yield: | | 49.5% 1.84x 10.2% |
The following table presents certain information relating to the lease expiration schedule at the Queens Center Property:
Lease Expiration Schedule(1)(2)
| Year Ending December 31 | No. of Leases Expiring | Expiring NRSF | % of Total NRSF | Cumulative Expiring NRSF | Cumulative % of Total NRSF | Annual U/W Base Rent | % of Total Annual U/W Base Rent | Annual U/W Base Rent PSF |
| MTM/2024 | 10 | 21,754 | 5.3% | 21,754 | 5.3% | $4,334,114 | 8.2% | $199.23 |
| 2025 | 28 | 77,642 | 18.8% | 99,396 | 24.1% | $9,690,548 | 18.4% | $124.81 |
| 2026 | 17 | 37,142 | 9.0% | 136,538 | 33.1% | $7,896,124 | 15.0% | $212.59 |
| 2027 | 13 | 25,249 | 6.1% | 161,787 | 39.3% | $3,456,921 | 6.5% | $136.91 |
| 2028 | 11 | 19,816 | 4.8% | 181,603 | 44.1% | $3,090,862 | 5.9% | $155.98 |
| 2029 | 16 | 32,294 | 7.8% | 213,897 | 51.9% | $6,424,947 | 12.2% | $198.95 |
| 2030 | 5 | 8,572 | 2.1% | 222,469 | 54.0% | $1,167,451 | 2.2% | $136.19 |
| 2031 | 1 | 389 | 0.1% | 222,858 | 54.1% | $175,873 | 0.3% | $452.12 |
| 2032 | 2 | 11,788 | 2.9% | 234,646 | 56.9% | $1,966,221 | 3.7% | $166.80 |
| 2033 | 8 | 52,114 | 12.6% | 286,760 | 69.6% | $3,599,219 | 6.8% | $69.06 |
| 2034 | 10 | 12,981 | 3.2% | 299,741 | 72.7% | $3,290,888 | 6.2% | $253.52 |
| 2035 & Thereafter | 8 | 93,186 | 22.6% | 392,927 | 95.4% | $7,700,543 | 14.6% | $82.64 |
| Vacant | 0 | 19,106 | 4.6% | 412,033 | 100.0% | $0 | 0.0% | $0.00 |
| Total / Wtd. Avg. | 129 | 412,033 | 100.0% | | | $52,793,713 | 100.0% | $134.36 |
| (1) | Based on the underwritten rent roll dated October 7, 2024 inclusive of contractual rent steps through October 2025. |
| (2) | Certain tenants may have termination options that are exercisable prior to the originally stated expiration date of the subject lease and that are not considered in the Lease Expiration Schedule. |
The following table presents historical occupancy percentages at the Queens Center Property:
Historical Occupancy
| | 12/31/2019 | 12/31/2020 | 12/31/2021 | 12/31/2022 | 12/31/2023 | 10/7/2024(1) |
| Occupancy | 98.9% | 97.9% | 97.6% | 98.7% | 98.9% | 95.4% |
| (1) | Based on the underwritten rent roll dated as of October 7, 2024 and includes tenants that have leases that have not yet commenced, but have executed leases and excludes non-collateral anchor tenants. |
THE INFORMATION IN THIS STRUCTURAL AND COLLATERAL TERM SHEET IS NOT COMPLETE AND MAY BE AMENDED PRIOR TO THE TIME OF SALE. THIS TERM SHEET IS NOT AN OFFER TO SELL THESE SECURITIES AND IT IS NOT A SOLICITATION OF AN OFFER TO BUY THESE SECURITIES IN ANY JURISDICTION WHERE THE OFFER OR SALE IS NOT PERMITTED. |
| | 121 | |
| Retail – Super Regional Mall | Loan #9 | Cut-off Date Balance: | | $30,000,000 |
90-15 Queens Boulevard Elmhurst, NY 11373 | Queens Center | Cut-off Date LTV: U/W NCF DSCR: U/W NOI Debt Yield: | | 49.5% 1.84x 10.2% |
Operating History and Underwritten Net Cash Flow. The following table presents certain information relating to the historical operating performance and underwritten net cash flow at the Queens Center Property:
Cash Flow Analysis
| | 2019 | 2020 | 2021 | 2022 | 2023 | TTM 6/30/2024 | U/W | %(1) | U/W $ per SF |
| Base Rent | $67,057,833 | $59,301,650 | $52,916,768 | $51,918,944 | $52,818,458 | $51,520,695 | $52,793,713 | 50.2% | $128.13 |
| Rent Steps | $0 | $0 | $0 | $0 | $0 | $0 | $1,247,807 | 1.2% | $3.03 |
| Vacant Income | $0 | $0 | $0 | $0 | $0 | $0 | $4,370,011 | 4.2% | $10.61 |
| Gross Potential Rent | $67,057,833 | $59,301,650 | $52,916,768 | $51,918,944 | $52,818,458 | $51,520,695 | $58,411,531 | 55.6% | $141.76 |
| Reimbursements | $30,790,847 | $29,765,742 | $27,453,264 | $29,305,910 | $29,580,066 | $30,900,451 | $31,470,373 | 29.9% | $76.38 |
| Percentage Rent | $87,927 | $284,409 | $1,504,768 | $1,176,649 | $211,061 | $4,663 | $0 | 0.0% | $0.00 |
| Other Income(2) | $18,077,641 | $9,515,462 | $14,790,599 | $20,746,611 | $16,405,772 | $15,580,030 | $15,262,235 | 14.5% | $37.04 |
| Net Rental Income | $116,014,248 | $98,867,263 | $96,665,399 | $103,148,114 | $99,015,357 | $98,005,839 | $105,144,139 | 100.0% | $255.18 |
| Less Vacancy/Bad Debt(3) | ($482,316) | ($7,429,704) | $3,086,693 | ($396,362) | $285,757 | ($1,035,603) | ($4,370,011) | (4.2%) | ($10.61) |
| Effective Gross Income | $115,531,932 | $91,437,559 | $99,752,092 | $102,751,752 | $99,301,114 | $96,970,236 | $100,774,128 | 95.8% | $244.58 |
| | | | | | | | | | |
| Real Estate Taxes | $28,285,488 | $29,999,255 | $29,577,588 | $27,309,540 | $26,831,221 | $26,587,630 | $26,925,545 | 26.7% | $65.35 |
| Insurance | $254,934 | $356,236 | $424,981 | $453,227 | $419,257 | $486,435 | $531,957 | 0.5% | $1.29 |
| Management Fee | $1,106,734 | $952,496 | $923,502 | $1,003,129 | $876,335 | $860,247 | $1,000,000 | 1.0% | $2.43 |
| Ground Rent | $441,719 | $441,719 | $461,478 | $471,358 | $471,358 | $502,544 | $608,041 | 0.6% | 1.48 |
| Other Expenses | $17,087,387 | $11,923,051 | $16,497,949 | $18,037,954 | $18,220,668 | $18,803,076 | $18,088,019 | 17.9% | $43.90 |
| Total Expenses | $47,176,262 | $43,672,757 | $47,885,498 | $47,275,208 | $46,818,839 | $47,239,932 | $47,153,562 | 46.8% | $114.44 |
| | | | | | | | | | |
| Net Operating Income | $68,355,670 | $47,764,802 | $51,866,594 | $55,476,544 | $52,482,275 | $49,730,304 | $53,620,566 | 53.2% | $130.14 |
| TI/LC | $0 | $0 | $0 | $0 | $0 | $0 | $968,757 | 1.0% | $2.35 |
| Replacement Reserves | $0 | $0 | $0 | $0 | $0 | $0 | $119,490 | 0.1% | $0.29 |
| Net Cash Flow(4) | $68,355,670 | $47,764,802 | $51,866,594 | $55,476,544 | $52,482,275 | $49,730,304 | $52,532,319 | 52.1% | $127.50 |
| | | | | | | | | | |
| NOI DSCR(5) | 2.39x | 1.67x | 1.81x | 1.94x | 1.84x | 1.74x | 1.88x | | |
| NCF DSCR(5) | 2.39x | 1.67x | 1.81x | 1.94x | 1.84x | 1.74x | 1.84x | | |
| NOI Debt Yield(5) | 13.0% | 9.1% | 9.9% | 10.6% | 10.0% | 9.5% | 10.2% | | |
| NCF Debt Yield(5) | 13.0% | 9.1% | 9.9% | 10.6% | 10.0% | 9.5% | 10.0% | | |
| (1) | Represents (i) percent of Net Rental Income for all revenue figures and Vacancy and (ii) percent of Effective Gross Income for all other figures. |
| (2) | Other Income is based on the borrower sponsor’s budget and includes income from parking, business development/advertising, specialty leasing, overage rent and other miscellaneous income. |
| (3) | Vacancy/Bad Debt reflects bad debt for historical periods and vacancy for U/W. Positive periods reflect recovery of bad debt. |
| (4) | The decrease in Net Cash Flow from 2019 to 2020 and subsequent increase from 2020 to 2021 is primarily attributable to impacts from the COVID-19 pandemic. |
| (5) | DSCRs and Debt Yields are based on the Queens Center Whole Loan. |
Appraisal. The appraiser concluded to an “as-is” value for the Queens Center Property of $1,060,000,000 as of September 19, 2024.
Environmental Matters. According to the Phase I environmental site assessment dated October 18, 2024, there was no evidence of any recognized environmental conditions at the Queens Center Property.
Market Overview and Competition. The Queens Center Property is located in the Elmhurst neighborhood of Queens, New York. Elmhurst is a densely populated area with a mix of residential and commercial developments. The neighborhood is well-connected via public transportation, including the Long Island Rail Road and New York City subway system, providing access to Manhattan and other parts of the city. The area is characterized by a diverse population and a variety of housing types, including multi-tenant rentals and cooperative apartments. The average household income within a one-mile radius is $86,791, increasing to $92,204 within three miles, and $98,765 within five miles. The population in these areas is 191,469, 907,210, and 2,357,847, respectively.
The Queens Center Mall benefits from its location and strong tenant mix, making it a key retail center in the region. Notably, Apple is a significant draw, with sales of approximately $130 million. According to the appraisal, the Queens Retail market, as of the second quarter of 2024, has a total inventory is approximately 5.7 million SF with an 11.3% vacancy rate.
Positioned as the only enclosed super regional shopping center in Queens County, the Queens Center Property serves a trade area of 2.4 million people and approximately 861,000 households. Queens County spans 108.1 square miles and is home to 2.4 million residents, making Queens the 4th densest county in the United States. The Queens Center Mall’s trade area is characterized by a dynamic and culturally rich population with an average household income approximately of $104,000. The Queens Center Mall has two retail centers in its trade area; however, the Queens Center Mall offers superior access via car, bus, subway or foot, as it is located adjacent to a highly trafficked subway station and the intersection of Queens Boulevard, Woodhaven Boulevard, and the Long Island Expressway.
THE INFORMATION IN THIS STRUCTURAL AND COLLATERAL TERM SHEET IS NOT COMPLETE AND MAY BE AMENDED PRIOR TO THE TIME OF SALE. THIS TERM SHEET IS NOT AN OFFER TO SELL THESE SECURITIES AND IT IS NOT A SOLICITATION OF AN OFFER TO BUY THESE SECURITIES IN ANY JURISDICTION WHERE THE OFFER OR SALE IS NOT PERMITTED. |
| | 122 | |
| Retail – Super Regional Mall | Loan #9 | Cut-off Date Balance: | | $30,000,000 |
90-15 Queens Boulevard Elmhurst, NY 11373 | Queens Center | Cut-off Date LTV: U/W NCF DSCR: U/W NOI Debt Yield: | | 49.5% 1.84x 10.2% |
The following table presents certain information relating to the appraisal’s market rent conclusions for the Queens Center Property:
Market Rent Summary(1)
| | Market Rent (PSF) | Lease Term (Yrs.) | Rent Increase Projections | New Tenant Improvements PSF | Renewal Tenant Improvements PSF |
| 0 – 1,000 SF | $225.00 | 5 | 3% per annum | $100.00 | $25.00 |
| 1,001 – 2,000 SF | $200.00 | 5 | 3% per annum | $100.00 | $25.00 |
| 2,001 – 3,000 SF | $200.00 | 5 | 3% per annum | $100.00 | $25.00 |
| 3,001 – 5,000 SF | $175.00 | 5 | 3% per annum | $100.00 | $25.00 |
| 5,001 – 7,500 SF | $150.00 | 10 | 3% per annum | $100.00 | $25.00 |
| 7,501+ SF | $150.00 | 10 | 3% per annum | $100.00 | $25.00 |
| Jewelry | $400.00 | 10 | 3% per annum | $100.00 | $25.00 |
| Food Court | $410.00 | 10 | 3% per annum | $250.00 | $75.00 |
| Kiosk 0-100 SF | $2,000.00 | 5 | 3% per annum | $0.00 | $0.00 |
| Kiosk 100+ SF | $650.00 | 5 | 3% per annum | $0.00 | $0.00 |
| Major | $75.00 | 10 | 10% in Year 6 | $100.00 | $25.00 |
| Junior Anchor | $50.00 | 10 | 10% in Year 6 | $100.00 | $25.00 |
| (1) | Information obtained from the appraisal. |
The table below presents certain information relating to retail centers comparable to the Queens Center Property identified by the appraisal:
Competitive Set(1)
| Property Name | Year Built/Renovated | Total NRA | Total Occupancy | Anchor / Major Tenants | Distance to Queens Center Property |
| Queens Center | 1973 / 2004 | 412,033(2) | 95.4%(2) | Primark, ZARA(2) | NAP |
| Queens Place Retail Center | 1965 / 2001 | 445,953 | 96.0% | Target, Macy’s Furniture Store, DSW Shoes, Best Buy, Lidl | One Block North |
| Rego Park Center I | 1996 / 2005 | 342,869 | 75.0% | Burlington, Marshalls | Two Blocks South |
| Rego Park Center II | 2010 / NAP | 616,820 | 100.0% | Costco, At Home, Aldi, Petco, TJ Maxx | Two Blocks South |
| The Shops at Atlas Park | 2006 / NAP | 372,000 | 95.0% | Ashley Furniture, Forever 21, HomeGoods, NYSC, Regal Cinemas, Ulta, TJ Maxx | 1.8 Miles South |
| Kings Plaza(3) | 1969 / 2018 | 1,146,035 | 88.0% | Burlington, Lowe’s, Macy’s, Target, Primark | 10.0 Miles South |
| Green Acres Mall | 1956 / 2016 | 2,075,000 | 93.0% | Macy’s, Kohl’s, Primark | 11.0 Miles Southeast |
| Staten Island Mall(3) | 1972 / 2018 | 1,700,000 | 94.0% | Primark, JC Penney, Macy’s, Lidl, AMC Theatres | 22.0 Miles Southwest |
| Roosevelt Field | 1956 / 2014 | 2,330,000 | 98.0% | Bloomingdales, JC Penney, Primark, Macy’s, Nordstrom, Dick’s Sporting Goods, Neiman Marcus | 15.0 Miles East |
| Weighted Average | | | 93.9%(4) | | |
| (1) | Information obtained from the appraisal, unless otherwise specified. |
| (2) | Based on the underwritten rent roll dated as of October 7, 2024 and does not include 556,724 SF of space associated with Macy’s and JCPenney which are non-collateral anchor tenants. |
| (3) | Owned by the borrower sponsor. |
| (4) | Weighted Average excludes the Queens Center Property. |
Escrows.
Real Estate Taxes – During the continuance of an Trigger Period (as defined below), the Borrowers are required to deposit into a real estate tax reserve, on a monthly basis, an amount equal to 1/12 of the real estate taxes that the lender estimates will be payable during the next ensuing twelve months (initially estimated to be approximately $2,243,795 monthly).
Insurance – During the continuance of a Trigger Period, unless the Queens Center Property is insured under an acceptable blanket policy and no event of default for which the lender has commenced an enforcement action is continuing, the Borrowers are required to escrow 1/12 of the annual estimated insurance payments on a monthly basis.
Replacement Reserve – During the continuance of a Trigger Period, the Borrowers are required to escrow approximately $8,584 on a monthly basis for replacement reserves, subject to a cap of $206,017.
THE INFORMATION IN THIS STRUCTURAL AND COLLATERAL TERM SHEET IS NOT COMPLETE AND MAY BE AMENDED PRIOR TO THE TIME OF SALE. THIS TERM SHEET IS NOT AN OFFER TO SELL THESE SECURITIES AND IT IS NOT A SOLICITATION OF AN OFFER TO BUY THESE SECURITIES IN ANY JURISDICTION WHERE THE OFFER OR SALE IS NOT PERMITTED. |
| | 123 | |
| Retail – Super Regional Mall | Loan #9 | Cut-off Date Balance: | | $30,000,000 |
90-15 Queens Boulevard Elmhurst, NY 11373 | Queens Center | Cut-off Date LTV: U/W NCF DSCR: U/W NOI Debt Yield: | | 49.5% 1.84x 10.2% |
TI/LC Reserve – During the continuance of a Trigger Period, the Borrowers are required to escrow approximately $26,728 on a monthly basis for ongoing rollover reserves, subject to a cap of $641,476.
Outstanding TI/LC and Gap Rent Reserve – On the loan origination date, the Borrowers were required to make an upfront deposit of $12,211,534 into a reserve for unfunded obligations for the tenant improvements, leasing commissions and free or abated rent.
Lockbox and Cash Management.
The Queens Center Whole Loan is structured with a hard lockbox and springing cash management. The Borrowers and property manager are required to direct the tenants to pay rent directly into the lockbox account, and to deposit any rents otherwise received in such account within three business days after receipt. So long as no Trigger Period is continuing, the Borrowers will have access to the funds deposited into the lockbox account, and may utilize the lockbox account as its operating account. During the continuance of a Trigger Period, the Borrowers will no longer have any further access to the funds in the lockbox account, and such funds in the lockbox account are required to be swept to a lender-controlled cash management account, and applied and disbursed in accordance with the Queens Center Whole Loan documents, with any excess funds (i) to be deposited into an excess cash flow reserve account held by the lender as cash collateral for the Queens Center Whole Loan during the continuance of such Trigger Period, or (ii) if no Trigger Period is continuing, disbursed to the Borrowers.
A “Trigger Period” means the period commencing upon the occurrence of (i) an event of default or (ii) the debt service coverage ratio based on the trailing two calendar quarters is less than 1.40x. A Trigger Period will end (a) with respect to clause (i) above, if the cure of the event of default has been accepted by the lender or (b) with respect to clause (ii) above, (x) the debt service coverage ratio based on the trailing two calendar quarters is greater than or equal to 1.40x, or (y) Borrowers will have (1) after the prepayment lockout release date, prepaid the Queens Center Whole Loan in an amount that would result in a debt service coverage ratio of 1.40x in accordance with the Queens Center Whole Loan documents or (2) delivered to the lender cash or other securities acceptable to the lender in accordance with the Queens Center Whole Loan documents as additional collateral for the Queens Center Whole Loan in an amount that when added to underwritten net operating income would result in a debt service coverage ratio at least equal to 1.40x.
Real Estate Substitution. Not permitted.
Property Management. The Queens Center Property is managed by Macerich Property Management Company, LLC, an affiliate of the borrowers.
Subordinate and Mezzanine Indebtedness. None.
Partial Release. The Borrowers are permitted to obtain the free release (without prepayment or defeasance) of Out Parcels (as defined below) provided certain conditions are satisfied, including among others, (i) certification by the Borrowers that the release will not materially and adversely affect the use, operations, economic value of, or the revenue produced by (exclusive of the economic value or revenue lost attributable to the Out Parcel being released) the remaining improvements located on the Queens Center Property as a retail shopping center; (ii) separate tax lots (or the owner of the released Out Parcel is contractually obligated to pay its share of taxes), (iii) compliance with all applicable laws, reciprocal easement and agreement and material leases, and (iv) compliance with REMIC related conditions.
“Out Parcels” means (A) certain real property that is as of the date of any potential release non-income producing and unimproved for tenant occupancy and the release of which does not have a material adverse effect on (i) the business, profits, operations or condition (financial) of the borrowers, (ii) the ability of the borrowers to repay the debt in accordance with the terms of the loan documents, or (iii) the ongoing operations of the remaining Queens Center Property; and (B) certain real property that is as of the date of any potential release non-income producing and improved by structures that (A) were vacant as of the origination date and (B) have been vacant and non-income producing continuously since the origination date and for at least three years prior to the date of any potential release.
Ground Lease. A 17,450 SF portion of the Queens Center Property located on the northeast corner of 92nd street and 59th Street (the “Ground Leased Parcel”) is subject to a ground lease (the “Ground Lease”) between Tiliakos Enterprises, LLC, as the ground landlord (the “Ground Landlord”), and the Property Borrower, as the ground tenant (in such capacity, the “Ground Tenant”). The Ground Lease has a maturity date of May 31, 2048, with no renewal options, but with a purchase option for the Property Borrower, exercisable as follows: Between May 1, 2039 and April 30, 2046, the Ground Landlord must serve notice to the Ground Tenant for the Ground Tenant to purchase the ground-leased parcel (the “Put Right”), with the notice date being deemed to be March 2, 2046, if the Ground Landlord fails to provide such notice by April 30, 2046, and the Ground Tenant will subsequently have three years to send notice of its acceptance of the Put Right beginning 60 days after Ground Landlord’s notice is sent (the “Call Right”). The Ground Landlord and the Ground Tenant are each required to appoint an appraiser, and to agree to a third, disinterested appraiser, to obtain a fair market value of the Ground Leased Parcel, and the average of the two closest valuations will be treated as the purchase price to be paid by the Ground Tenant for the Ground Leased Parcel. The current annual base rent is $595,510, which is required to increase every three years to the greater of (a) $325,000 (which was the initial annual base rent) or (b) the adjusted annual base rent based on the Consumer Price Index.
Shared Tax Lot. A portion of the Queens Center Property to the west of 92nd Street and the Macy’s parcel together constitute a single tax lot (the “Shared Tax Lot”). The real estate taxes on the shared tax lot are allocated between Macy’s and the Property Borrower under a reciprocal easement agreement (the “REA”). Under the REA, Macy’s pays approximately 40% of the total property taxes
THE INFORMATION IN THIS STRUCTURAL AND COLLATERAL TERM SHEET IS NOT COMPLETE AND MAY BE AMENDED PRIOR TO THE TIME OF SALE. THIS TERM SHEET IS NOT AN OFFER TO SELL THESE SECURITIES AND IT IS NOT A SOLICITATION OF AN OFFER TO BUY THESE SECURITIES IN ANY JURISDICTION WHERE THE OFFER OR SALE IS NOT PERMITTED. |
| | 124 | |
| Retail – Super Regional Mall | Loan #9 | Cut-off Date Balance: | | $30,000,000 |
90-15 Queens Boulevard Elmhurst, NY 11373 | Queens Center | Cut-off Date LTV: U/W NCF DSCR: U/W NOI Debt Yield: | | 49.5% 1.84x 10.2% |
assessed against the shared tax lot to the Property Borrower, who then makes the required tax payments. There are no other operating covenants in place governing the operation of the Shared Tax Lot.
In the event of default under the Queens Center Whole Loan documents, the lender has the right to require, among other related rights, the Borrowers to exercise the rights of the Property Borrower under the REA to pursue the creation of a separate tax lot for the portion of the Queens Center Property that is part of the Shared Tax Lot, such that no portion of the Queens Center Property shares a tax lot with any real property that is not subject to the lien of the Queens Center Whole Loan.
In September 2005, the City of New York advised that it would no longer accept deeds for recordation which affect only a portion of a tax lot, although the recordation of mortgages or instruments other than deeds is not affected by this advisement. The borrowers have provided a non-recourse carveout for any losses arising from the lender’s inability to foreclose on the portion of the Queens Center Property that is part of the Shared Tax Lot caused by (i) the City of New York’s refusal to accept for recordation a deed in foreclosure with respect to such portion of the Queens Center Property and (ii) the Borrowers’ failure to promptly pursue the creation of a separate tax lot for the portion of the property comprising the Shared Tax Lot.
Rights of First Offer / Rights of First Refusal. None.
Letter of Credit. None.
Permitted Mezzanine Loan. None.
Terrorism Insurance. The Borrowers are required to obtain and maintain property insurance and business interruption insurance for 24 months plus a 12-month extended period of indemnity. Such insurance is required to cover perils of terrorism and acts of terrorism. If TRIPRA is no longer in effect, the Borrowers will not be required to pay any annual insurance premiums solely with respect to such terrorism coverage in excess of 2x the amount of the then annual premiums paid by the Borrowers for all-risk coverage under a stand-alone all-risk policy (the “Terrorism Premium Cap”) and, if the cost for such coverage exceeds the Terrorism Premium Cap, the Borrowers will be required to purchase the maximum amount of terrorism coverage available with funds equal to the Terrorism Premium Cap. See “Risk Factors—Risks Relating to the Mortgage Loans—Terrorism Insurance May Not Be Available for All Mortgaged Properties” in the prospectus.
THE INFORMATION IN THIS STRUCTURAL AND COLLATERAL TERM SHEET IS NOT COMPLETE AND MAY BE AMENDED PRIOR TO THE TIME OF SALE. THIS TERM SHEET IS NOT AN OFFER TO SELL THESE SECURITIES AND IT IS NOT A SOLICITATION OF AN OFFER TO BUY THESE SECURITIES IN ANY JURISDICTION WHERE THE OFFER OR SALE IS NOT PERMITTED. |
| | 125 | |
| Multifamily – Various | Loan #10 | Cut-off Date Balance: | | $26,000,000 |
| Various | ICONIQ Multifamily Portfolio | Cut-off Date LTV: | | 36.1% |
| Various | | U/W NCF DSCR: | | 2.43x |
| | | U/W NOI Debt Yield: | | 14.6% |
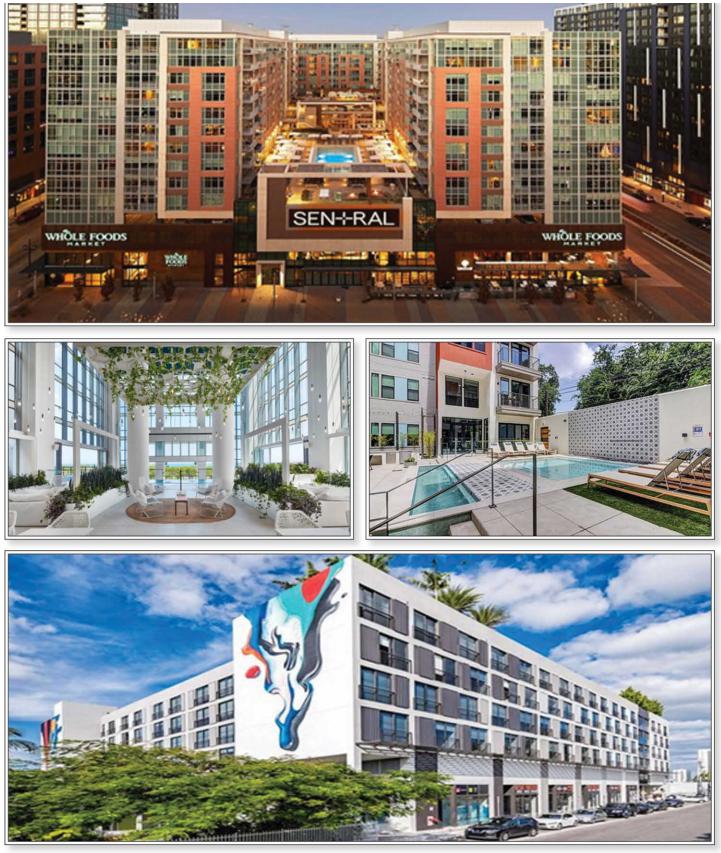
THE INFORMATION IN THIS STRUCTURAL AND COLLATERAL TERM SHEET IS NOT COMPLETE AND MAY BE AMENDED PRIOR TO THE TIME OF SALE. THIS TERM SHEET IS NOT AN OFFER TO SELL THESE SECURITIES AND IT IS NOT A SOLICITATION OF AN OFFER TO BUY THESE SECURITIES IN ANY JURISDICTION WHERE THE OFFER OR SALE IS NOT PERMITTED. |
| | 126 | |
| Multifamily – Various | Loan #10 | Cut-off Date Balance: | | $26,000,000 |
| Various | ICONIQ Multifamily Portfolio | Cut-off Date LTV: | | 36.1% |
| Various | | U/W NCF DSCR: | | 2.43x |
| | | U/W NOI Debt Yield: | | 14.6% |
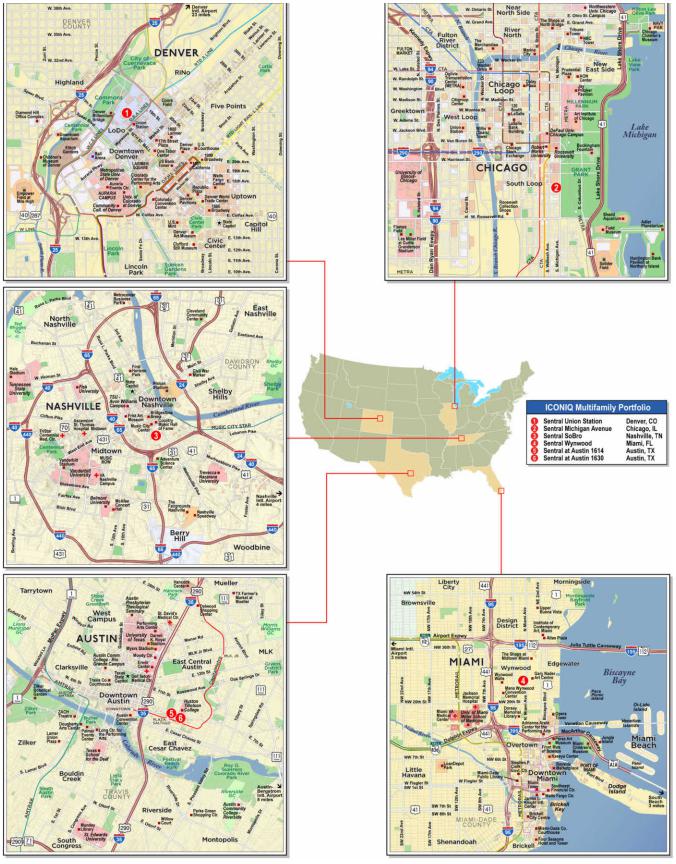
THE INFORMATION IN THIS STRUCTURAL AND COLLATERAL TERM SHEET IS NOT COMPLETE AND MAY BE AMENDED PRIOR TO THE TIME OF SALE. THIS TERM SHEET IS NOT AN OFFER TO SELL THESE SECURITIES AND IT IS NOT A SOLICITATION OF AN OFFER TO BUY THESE SECURITIES IN ANY JURISDICTION WHERE THE OFFER OR SALE IS NOT PERMITTED. |
| | 127 | |
| No. 10 – ICONIQ Multifamily Portfolio |
| |
| Mortgage Loan Information | | Mortgaged Property Information |
| Mortgage Loan Seller: | Goldman Sachs Mortgage Company | | Single Asset/Portfolio: | Portfolio |
| Credit Assessment (Fitch/KBRA/Moody’s): | AA-/BBB-/A2 | | Property Type – Subtype: | Multifamily – Various |
| Original Principal Balance(1): | $26,000,000 | | Location: | Various |
| Cut-off Date Balance(1): | $26,000,000 | | Size: | 1,790 Units |
| % of Initial Pool Balance: | 3.6% | | Cut-off Date Balance Per Unit(1): | $167,598 |
| Loan Purpose: | Refinance | | Maturity Date Balance Per Unit(1): | $167,598 |
| Borrower Sponsor: | ICONIQ Residential Partners GP, LP | | Year Built/Renovated: | Various/NAP |
| Guarantors: | ICONIQ Residential Partners Fund A, LP, ICONIQ Residential Partners Fund B, LP, and ICONIQ Residential Partners Fund C, LP | | Title Vesting: | Various |
| Mortgage Rate(2): | 5.179710% | | Property Manager: | BHI Residential Corporation |
| Note Date: | November 5, 2024 | | Current Occupancy (As of)(5): | 92.2% (9/10/2024) |
| Seasoning: | 0 months | | YE 2023 Occupancy: | 86.0% |
| Maturity Date: | November 6, 2029 | | YE 2022 Occupancy: | 81.5% |
| IO Period: | 60 months | | YE 2021 Occupancy: | NAV |
| Loan Term (Original): | 60 months | | As-Is Appraised Value: | $831,600,000 |
| Amortization Term (Original): | NAP | | As-Is Appraised Value Per Unit: | $464,581 |
| Loan Amortization Type: | Interest Only | | As-Is Appraisal Valuation Date: | Various |
| Call Protection(3): | YM1(24),DorYM1(29),O(7) | | |
| Lockbox Type: | Soft/Springing Cash Management | | Underwriting and Financial Information(1) |
| Additional Debt(1): | Yes | | TTM 8/31/2024 NOI: | $40,620,572 |
| Additional Debt Type (Balance)(1): | Pari Passu/B Note | | YE 2023 NOI: | $39,701,158 |
| | $274,000,000/$225,000,000 | | YE 2022 NOI: | $32,440,891 |
| | | | YE 2021 NOI | NAV |
| | | | U/W Revenues: | $81,279,144 |
| Escrows and Reserves(4) | | U/W Expenses: | $37,619,484 |
| | Initial | Monthly | Cap | | U/W NOI: | $43,659,660 |
| Taxes: | $0 | Springing | NAP | | U/W NCF: | $43,287,811 |
| Insurance: | $0 | Springing | NAP | | U/W DSCR based on NOI/NCF: | 2.45x/2.43x |
| Replacement Reserves: | $0 | $22,375 | NAP | | U/W Debt Yield based on NOI/NCF: | 14.6%/14.4% |
| Ground Rent Reserve: | $0 | Springing | NAP | | U/W Debt Yield at Maturity based on NOI/NCF: | 14.6%/14.4% |
| Hotel Tax Reserve | $0 | Springing | NAP | | Cut-off Date LTV Ratio: | 36.1% |
| | | | | | LTV Ratio at Maturity: | 36.1% |
| | | | | | | |
| Sources and Uses |
| Sources | | | | | Uses | | | |
| Senior Loan(1) | $300,000,000 | | 57.1 | % | | Loan Payoff | $488,485,100 | | 93.0 | % |
| Subordinate Loan | 225,000,000 | | 42.9 | | | Closing Costs | 31,399,780 | | 6.0 | |
| | | | | | Principal Equity Distribution | 5,115,120 | | 1.0 | |
| Total Sources | $525,000,000 | | 100.0 | % | | Total Uses | $525,000,000 | | 100.0 | % |
| (1) | The ICONIQ Multifamily Portfolio Mortgage Loan (as defined below) is part of a whole loan evidenced by six senior pari passu promissory notes and two junior promissory notes with an aggregate original principal balance of $525,000,000 (the “ICONIQ Multifamily Portfolio Whole Loan”). The Underwriting and Financial Information presented above is based on the aggregate principal balance of the senior promissory notes. |
| (2) | 5.17971% represents the ICONIQ Multifamily Portfolio Mortgage Loan coupon. The coupon for the ICONIQ Multifamily Portfolio Whole Loan is 6.0715%. |
| (3) | Defeasance of the ICONIQ Multifamily Portfolio Whole Loan, in whole, but not in part, is permitted after the date that is earlier to occur of (i) two years from the closing date of the securitization that includes the last note to be securitized and (ii) November 5, 2027. The assumed defeasance lockout period of 24 payments is based on the closing date of the WFCM 2024-5C2 transaction in November 2024. The actual defeasance lockout period may be longer. |
| (4) | See “Escrows” below for further discussion of reserve information. |
| (5) | Current Occupancy is based on live units. |
THE INFORMATION IN THIS STRUCTURAL AND COLLATERAL TERM SHEET IS NOT COMPLETE AND MAY BE AMENDED PRIOR TO THE TIME OF SALE. THIS TERM SHEET IS NOT AN OFFER TO SELL THESE SECURITIES AND IT IS NOT A SOLICITATION OF AN OFFER TO BUY THESE SECURITIES IN ANY JURISDICTION WHERE THE OFFER OR SALE IS NOT PERMITTED. |
| | 128 | |
| Multifamily – Various | Loan #10 | Cut-off Date Balance: | | $26,000,000 |
| Various | ICONIQ Multifamily Portfolio | Cut-off Date LTV: | | 36.1% |
| Various | | U/W NCF DSCR: | | 2.43x |
| | | U/W NOI Debt Yield: | | 14.6% |
The Mortgage Loan. The tenth largest mortgage loan (the “ICONIQ Multifamily Portfolio Mortgage Loan”) is secured by the borrowers’ cross-collateralized fee simple or leasehold interests in six multifamily properties located across five states (each a “ICONIQ Multifamily Portfolio Property”, and collectively the “ICONIQ Multifamily Portfolio Properties” or the “ICONIQ Multifamily Portfolio”).
The ICONIQ Multifamily Portfolio Whole Loan is comprised of six pari passu componentized senior notes with an aggregate principal balance of $300,000,000 (the “Senior Notes”) and two junior notes with an aggregate principal balance of $225,000,000 (the “Junior Notes”). Two Senior Notes with a principal balance of $170,000,000 and the two Junior Notes were contributed to the ICNQ 2024-MF securitization. The ICONIQ Multifamily Portfolio Mortgage Loan is evidenced by the Note A-5, with an aggregate outstanding principal balance as of the Cut-off Date of $26,000,000. The ICONIQ Multifamily Portfolio Whole Loan was co-originated by German American Capital Corporation and Goldman Sachs Bank USA on November 5, 2024. The ICONIQ Multifamily Portfolio Whole Loan accrues interest at a weighted average fixed rate of 6.0715% per annum. The ICONIQ Multifamily Portfolio Whole Loan has an initial term of 60 months and has a remaining term of 60 months as of the Cut-off Date.
The table below identifies the promissory notes that comprise the ICONIQ Multifamily Portfolio Whole Loan. The relationship between the holders of the ICONIQ Multifamily Portfolio Whole Loan is governed by a co-lender agreement as described under “Description of the Mortgage Pool—The Whole Loans—The Non-Serviced AB Whole Loans—The ICONIQ Multifamily Portfolio AB Whole Loan” in the Preliminary Prospectus. The ICONIQ Multifamily Portfolio Whole Loan will be serviced pursuant to the trust and servicing agreement for the ICNQ 2024-MF securitization. See “Pooling and Servicing Agreement—Servicing of the Non-Serviced Whole Loans” in the Preliminary Prospectus.
Whole Loan Note Summary
| Notes | Original Balance | Cut-off Date Balance | Note Holder | Controlling
Piece |
| Senior Notes | | | | |
| A-1 | $119,000,000 | $119,000,000 | ICNQ 2024-MF | Yes |
| A-2(1) | $45,500,000 | $45,500,000 | DBRI | No |
| A-3(1) | $45,500,000 | $45,500,000 | DBRI | No |
| A-4 | $51,000,000 | $51,000,000 | ICNQ 2024-MF | No |
| A-5 | $26,000,000 | $26,000,000 | WFCM 2024-5C2 | No |
| A-6(1) | $13,000,000 | $13,000,000 | GSBI | No |
| Junior Notes | | | | |
| B-1 | $157,500,000 | $157,500,000 | ICNQ 2024-MF | No |
| B-2 | $67,500,000 | $67,500,000 | ICNQ 2024-MF | No |
| Total | $525,000,000 | $525,000,000 | | |
| (1) | Expected to be contributed to one or more future securitizations. |
The Borrowers and the Borrower Sponsor. The borrowers are Sixth South Partners, LP, IRP Bradley Apartments, LLC, IRP Essex Apartments, LLC, IRP Indie Apartments, LLC, IRP Candela Apartments, LLC and IRP Union Denver Apartments, LLC, each a Delaware limited liability company or limited partnership structured as a single purpose, bankruptcy-remote entity with two independent directors. Legal counsel to the borrowers delivered a non-consolidation opinion in connection with the origination of the ICONIQ Multifamily Portfolio Whole Loan. The borrower sponsor is ICONIQ Residential Partners GP, LP. The non-recourse carveout guarantors are ICONIQ Residential Partners Fund A, LP, ICONIQ Residential Partners Fund B, LP and ICONIQ Residential Partners Fund C, LP., each a Delaware limited partnership and an affiliate of the borrower sponsor.
The Properties. The ICONIQ Multifamily Portfolio consists of six Class A multifamily properties located in five different states, totaling 1,198 “Live Unfurnished” units, which are traditional multifamily units, 131 “Live Furnished” units and 461 “Stay” units, which are leased for shorter term stays. The ICONIQ Multifamily Portfolio Properties were constructed between 2018 and 2021. As of the September 2024 rent rolls, the Live units (furnished and unfurnished) were 92.2% occupied, with weighted average in-place rent of $2,647/month ($3.40 PSF). The ICONIQ Multifamily Portfolio offers a diverse unit mix with the Live units consisting of 318 Studio units (23.9% of Live units / 490 Avg. SF), 660 One-Bedroom units (49.7% of Live units / 717 Avg. SF), 341 Two-Bedroom units (25.7% of Live units / 1,134 Avg. SF), 6 Three-Bedroom units (0.5% of Live units / 1,408 Avg. SF), and 4 Four-Bedroom units (0.3% of Live units / 2,294 Avg. SF).
The collateral includes 97,273 SF of commercial tenancy that is 94.9% occupied as of September 10, 2024. See “Commercial Tenancy” below for additional detail.
THE INFORMATION IN THIS STRUCTURAL AND COLLATERAL TERM SHEET IS NOT COMPLETE AND MAY BE AMENDED PRIOR TO THE TIME OF SALE. THIS TERM SHEET IS NOT AN OFFER TO SELL THESE SECURITIES AND IT IS NOT A SOLICITATION OF AN OFFER TO BUY THESE SECURITIES IN ANY JURISDICTION WHERE THE OFFER OR SALE IS NOT PERMITTED. |
| | 129 | |
| Multifamily – Various | Loan #10 | Cut-off Date Balance: | | $26,000,000 |
| Various | ICONIQ Multifamily Portfolio | Cut-off Date LTV: | | 36.1% |
| Various | | U/W NCF DSCR: | | 2.43x |
| | | U/W NOI Debt Yield: | | 14.6% |
The following table sets forth certain information regarding the ICONIQ Multifamily Portfolio Properties:
Portfolio Summary(1)
| Property | Market | Live Unfurnished Units | Live Furnished Units | Stay Units | Total Units | Live Occ. | Live In-Place Unit Occupancy | Live In-Place Monthly Rent/Unit | U/W NCF | % of U/W NCF |
| Sentral Union Station | Denver | 489 | 40 | 50 | 579 | 495 | 93.60% | $2,584 | $14,206,940 | 32.8% |
| Sentral Michigan Avenue | Chicago | 362 | 25 | 92 | 479 | 354 | 91.50% | $2,975 | $10,332,467 | 23.9% |
| Sentral SoBro | Nashville | 154 | 0 | 145 | 299 | 146 | 94.80% | $2,825 | $10,325,808 | 23.9% |
| Sentral Wynwood | Miami | 4 | 62 | 109 | 175 | 47 | 71.20% | $3,196 | $4,763,194 | 11.0% |
| Sentral at Austin 1614 | Austin | 87 | 4 | 28 | 119 | 89 | 97.80% | $2,264 | $2,002,210 | 4.6% |
| Sentral at Austin 1630 | Austin | 102 | 0 | 37 | 139 | 94 | 92.20% | $1,546 | $1,657,194 | 3.8% |
| Total / Wtd. Avg.: | | 1,198 | 131 | 461 | 1,790 | 1,225 | 92.20% | $2,647 | $43,287,811 | 100.0% |
| (1) | Source: Appraisal, underwritten cash flow and underwritten rent roll. |
The following table presents the unit mix at the ICONIQ Multifamily Portfolio Properties:
Unit Mix(1)
| | | | | | Live Units |
| Unit Type(1) | Total Units | Unfurnished Live Units | Furnished Live Units | Stay Units | # of Units | Unit Mix % | Occupied Units | Occ. % | Avg SF/Unit | $/Unit |
| Studio | 430 | 298 | 20 | 112 | 318 | 23.9% | 301 | 94.7% | $490 | 1,873 |
| One-Bedroom | 934 | 570 | 90 | 274 | 660 | 49.7% | 607 | 92.0% | $717 | 2,529 |
| Two-Bedroom | 416 | 320 | 21 | 75 | 341 | 25.7% | 307 | 90.0% | $1,134 | 3,514 |
| Three-Bedroom | 6 | 6 | 0 | 0 | 6 | 0.5% | 6 | 100.0% | $1,408 | 5,082 |
| Four-Bedroom | 4 | 4 | 0 | 0 | 4 | 0.3% | 4 | 100.0% | $2,294 | 8,498 |
| Total / Wtd. Avg.: | 1790 | 1,198 | 131 | 461 | 1,329 | 100.0% | 1,225 | 92.2% | $778 | 2,647 |
| (1) | Source: Appraisal and underwritten rent roll. |
The following table presents historical occupancy percentages at the ICONIQ Multifamily Portfolio Property:
Historical Occupancy
| Historical and Current Occupancy(1) |
| 2022 | 2023 | Current(2)(3) |
| 81.5% | 86.0% | 92.2% |
| (1) | Historical occupancies are as of December 31 of each respective year. |
| (2) | Current Occupancy is as of September 10, 2024. |
| (3) | Current Occupancy is based on live units. |
THE INFORMATION IN THIS STRUCTURAL AND COLLATERAL TERM SHEET IS NOT COMPLETE AND MAY BE AMENDED PRIOR TO THE TIME OF SALE. THIS TERM SHEET IS NOT AN OFFER TO SELL THESE SECURITIES AND IT IS NOT A SOLICITATION OF AN OFFER TO BUY THESE SECURITIES IN ANY JURISDICTION WHERE THE OFFER OR SALE IS NOT PERMITTED. |
| | 130 | |
| Multifamily – Various | Loan #10 | Cut-off Date Balance: | | $26,000,000 |
| Various | ICONIQ Multifamily Portfolio | Cut-off Date LTV: | | 36.1% |
| Various | | U/W NCF DSCR: | | 2.43x |
| | | U/W NOI Debt Yield: | | 14.6% |
The following table presents Commercial Tenancy at the ICONIQ Multifamily Portfolio Properties:
Commercial Tenancy(1)
| Tenant Name | Property Type | Credit Rating (Fitch/ | Tenant NRSF | % of NRSF | Annual U/W Rent(3) | % of Total Annual U/W Rent(3) | Annual U/W Rent PSF | | Ext. Options |
| Credit Rating (Fitch/Moody's/ S&P)(2) | Term. Option (Y/N) | Lease Expiration Date |
| Whole Foods Market | Sentral Union Station | AA-/A1/AA | 50,203 | 51.6% | $1,933,820 | 47.1% | $38.52 | N | 11/14/2037 | None |
| CVS | Sentral Union Station | NR/Baa2/BBB | 8,751 | 9.0% | $500,907 | 12.2% | $57.24 | N | 8/31/2043 | None |
| Ossobuco | Sentral Wynwood | NR/NR/NR | 4,207 | 4.3% | $284,268 | 6.9% | $67.57 | N | 12/31/2032 | 1 x 5yr |
| The Wall Art Gallery | Sentral Wynwood | NR/NR/NR | 4,230 | 4.3% | $251,976 | 6.1% | $59.57 | N | 12/16/2027 | None |
| Zuri | Sentral Wynwood | NR/NR/NR | 2,855 | 2.9% | $231,744 | 5.6% | $81.17 | N | 3/31/2031 | None |
| Gyu-Kaku | Sentral Union Station | NR/NR/NR | 3,142 | 3.2% | $138,374 | 3.4% | $44.04 | N | 11/30/2028 | None |
| TABU NASH(3) | Sentral SoBro | NR/NR/NR | 3,222 | 3.3% | $135,324 | 3.3% | $42.00 | N | 1/31/2036 | None |
| House of Mane | Sentral Wynwood | NR/NR/NR | 2,115 | 2.2% | $126,900 | 3.1% | $60.00 | N | 7/31/2034 | None |
| The NOW Massage | Sentral Wynwood | NR/NR/NR | 2,115 | 2.2% | $115,968 | 2.8% | $54.83 | N | 12/21/2033 | None |
| Maman | Sentral Wynwood | NR/NR/NR | 4,202 | 4.3% | $94,548 | 2.3% | $22.50 | N | 10/13/2036 | None |
| Recreation Sports and Social | Sentral at Austin 1630 | NR/NR/NR | 2,500 | 2.6% | $91,428 | 2.2% | $36.57 | N | 2/29/2028 | None |
| Form 50 Miami, Inc | Sentral Wynwood | NR/NR/NR | 2,115 | 2.2% | $89,760 | 2.2% | $42.44 | N | 8/31/2027 | None |
| Sixt Car Rental(3) | Sentral SoBro | NR/NR/NR | 951 | 1.0% | $45,648 | 1.1% | $48.00 | N | 1/31/2030 | None |
| Wynwood Buggies | Sentral Wynwood | NR/NR/NR | 638 | 0.7% | $30,816 | 0.8% | $48.30 | N | 10/31/2026 | None |
| Tipsy Scoop(3) | Sentral SoBro | NR/NR/NR | 1,079 | 1.1% | $30,212 | 0.7% | $28.00 | N | 5/31/2035 | 1 x 5yr |
| Total/Wtd. Avg. | | | 92,325 | 94.9% | $4,101,693 | 100.0% | $44.43 | | | |
| Vacant Space | | | 4,948 | 5.1% | | | | | | |
| Total/Wtd. Avg. | | | 97,273 | 100.0% | | | | | | |
| (1) | Based on the underwritten rent roll dated September 10, 2024. |
| (2) | Credit ratings may reflect those of the parent company of the entity shown, whether or not the parent company guarantees the lease. |
| (3) | Signed but not yet in occupancy.
|
THE INFORMATION IN THIS STRUCTURAL AND COLLATERAL TERM SHEET IS NOT COMPLETE AND MAY BE AMENDED PRIOR TO THE TIME OF SALE. THIS TERM SHEET IS NOT AN OFFER TO SELL THESE SECURITIES AND IT IS NOT A SOLICITATION OF AN OFFER TO BUY THESE SECURITIES IN ANY JURISDICTION WHERE THE OFFER OR SALE IS NOT PERMITTED. |
| | 131 | |
| Multifamily – Various | Loan #10 | Cut-off Date Balance: | | $26,000,000 |
| Various | ICONIQ Multifamily Portfolio | Cut-off Date LTV: | | 36.1% |
| Various | | U/W NCF DSCR: | | 2.43x |
| | | U/W NOI Debt Yield: | | 14.6% |
Operating History and Underwritten Net Cash Flow. The following table presents certain information relating to the historical operating performance and underwritten net cash flow at the ICONIQ Multifamily Portfolio Property:
Cash Flow Analysis(1)
| | 2022(2) | 2023 | TTM 8/31/2024 | U/W(2) | %(3) | U/W $ per Unit |
| Gross Potential Rent | $51,859,233 | $45,005,640 | $43,318,398 | $42,517,436 | 100.0% | $23,753 |
| Vacancy | (7,664,052) | (4,336,296) | (3,698,064) | (3,611,845) | (8.5) | ($2,018) |
| Non-Revenue Units | (54,951) | (232,353) | (212,680) | (201,763) | (0.5) | ($113) |
| Concessions | (1,591,739) | (1,082,373) | (1,309,279) | (1,116,031) | (2.6) | ($623) |
| Bad Debt | (306,033) | (670,517) | (929,106) | (425,174) | (1.0) | ($238) |
| Net Rental Income | $42,242,458 | $38,684,102 | $37,169,269 | $37,162,622 | 87.4% | $20,761 |
| Other Income(4) | 10,249,650 | 13,832,292 | 16,094,916 | 17,612,303 | 41.4 | $9,839 |
| Stay Income | 10,913,278 | 21,099,892 | 23,399,121 | 26,504,218 | 62.3 | $14,807 |
| Effective Gross Income | $63,405,386 | $73,616,286 | $76,663,306 | $81,279,144 | 191.2% | $45,407 |
| Management Fee | 1,933,617 | 2,243,536 | 2,299,059 | 2,438,374 | 3.0 | $1,362 |
| General & Administrative | 3,262,212 | 3,724,451 | 2,938,681 | 2,938,681 | 3.6 | $1,642 |
| Payroll | 5,386,470 | 6,789,131 | 5,743,879 | 5,743,879 | 7.1 | $3,209 |
| Turnover | 333,583 | 346,495 | 343,916 | 343,916 | 0.4 | $192 |
| Repairs & Maintenance | 823,326 | 751,771 | 850,247 | 850,247 | 1.0 | $475 |
| Landscaping | 319,358 | 413,939 | 410,231 | 410,231 | 0.5 | $229 |
| Contract Services | 1,616,330 | 2,358,140 | 3,045,597 | 3,045,597 | 3.7 | $1,701 |
| Guest and Resident Service | 505,286 | 209,560 | 238,779 | 238,779 | 0.3 | $133 |
| Stay Expense | 4,187,984 | 4,195,879 | 6,262,558 | 6,639,622 | 8.2 | $3,709 |
| Utilities | 2,728,708 | 2,389,055 | 3,017,899 | 3,017,899 | 3.7 | $1,686 |
| Real Estate Taxes | 8,612,125 | 8,933,049 | 9,069,650 | 9,844,214 | 12.1 | $5,500 |
| Ground Lease | 366,762 | 398,175 | 408,393 | 460,094 | 0.6 | $257 |
| Insurance | 888,732 | 1,161,948 | 1,413,845 | 1,647,951 | 2.0 | $921 |
| Total Expenses | $30,964,495 | $33,915,128 | $36,042,734 | $37,619,484 | 46.3% | $21,016 |
| Net Operating Income | $32,440,891 | $39,701,158 | $40,620,572 | $43,659,660 | 53.7% | $24,391 |
| CapEx | 268,500 | 268,500 | 268,500 | 358,000 | 0.4 | $200 |
| Ti/LC | 0 | 0 | 0 | 13,849 | 0.0 | $8 |
| Net Cash Flow | $32,172,391 | $39,432,658 | $40,352,072 | $43,287,811 | 53.3% | $24,183 |
| | | | | | | |
| NOI DSCR(5) | 1.82x | 2.23x | 2.28x | 2.45x | | |
| NCF DSCR(5) | 1.81x | 2.22x | 2.27x | 2.43x | | |
| NOI Debt Yield(5) | 10.8% | 13.2% | 13.5% | 14.6% | | |
| NCF Debt Yield(5) | 10.7% | 13.1% | 13.5% | 14.4% | | |
| (1) | Based on the underwritten cash flow dated September 10, 2024. |
| (2) | 2022 represents February through December 2022 for Sentral SoBro (which was acquired in 2022) and full year end 2022 financials for the remaining ICONIQ Multifamily Portfolio Properties. |
| (3) | % column represents percent of Gross Potential Rent for revenue lines and percent of Effective Gross Income for all remaining fields. |
| (4) | Other Income consists primarily of commercial income, parking income, utility reimbursements resort fee income and homeshare amenity. |
| (5) | DSCRs and Debt Yields are based on the ICONIQ Multifamily Portfolio Whole Loan. |
Appraisal. According to the ICONIQ Multifamily Portfolio Properties appraisals dated as of various dates in October 2024, the ICONIQ Multifamily Portfolio Properties had an as-is appraised value of $831,600,000
Environmental. According to the Phase I environmental assessments dated October 14, 2024, there was no evidence of any recognized environmental conditions at the ICONIQ Multifamily Portfolio Properties.
THE INFORMATION IN THIS STRUCTURAL AND COLLATERAL TERM SHEET IS NOT COMPLETE AND MAY BE AMENDED PRIOR TO THE TIME OF SALE. THIS TERM SHEET IS NOT AN OFFER TO SELL THESE SECURITIES AND IT IS NOT A SOLICITATION OF AN OFFER TO BUY THESE SECURITIES IN ANY JURISDICTION WHERE THE OFFER OR SALE IS NOT PERMITTED. |
| | 132 | |
| Multifamily – Various | Loan #10 | Cut-off Date Balance: | | $26,000,000 |
| Various | ICONIQ Multifamily Portfolio | Cut-off Date LTV: | | 36.1% |
| Various | | U/W NCF DSCR: | | 2.43x |
| | | U/W NOI Debt Yield: | | 14.6% |
Market Overview and Competition. The ICONIQ Multifamily Portfolio Properties are located in Denver, CO, Chicago, IL, Nashville, TN, Miami, FL and Austin, TX. The following table presents certain information relating to the TTM June 2024 RevPAR Comparison at the ICONIQ Multifamily Portfolio Properties:
RevPAR Comparison(1)
| Month | 23-Jan | 23-Feb | 23-Mar | 23-Apr | 23-May | 23-Jun | 23-Jul | 23-Aug | 23-Sep | 23-Oct | 23-Nov | 23-Dec | 24-Jan | 24-Feb | 24-Mar | 24-Apr | 24-May | 24-Jun |
Live
Unfurnished
Units | 1,238 | 1,247 | 1,248 | 1,248 | 1,214 | 1,214 | 1,214 | 1,214 | 1,214 | 1,214 | 1,204 | 1,204 | 1,200 | 1,198 | 1,198 | 1,201 | 1,199 | 1,199 |
| ADR | $82 | $82 | $83 | $83 | $83 | $83 | $83 | $84 | $84 | $85 | $85 | $85 | $83 | $83 | $83 | $84 | $86 | $86 |
| Occupancy | 93.6% | 94.0% | 93.1% | 94.9% | 95.9% | 95.3% | 94.2% | 93.6% | 93.4% | 92.0% | 92.2% | 93.3% | 94.8% | 94.8% | 95.7% | 95.9% | 96.4% | 94.9% |
| RevPAR | $77 | $77 | $77 | $79 | $79 | $79 | $78 | $78 | $79 | $78 | $79 | $79 | $79 | $79 | $80 | $80 | $82 | $82 |
Live
Furnished
Units | 213 | 204 | 203 | 203 | 172 | 172 | 172 | 172 | 172 | 172 | 172 | 160 | 123 | 118 | 152 | 141 | 134 | 133 |
| ADR | $116 | $118 | $124 | $120 | $124 | $128 | $127 | $124 | $124 | $120 | $116 | $116 | $107 | $114 | $118 | $125 | $137 | $139 |
| Occupancy | 88.4% | 92.3% | 94.5% | 91.1% | 87.3% | 90.1% | 84.6% | 76.9% | 75.9% | 78.7% | 70.4% | 74.8% | 82.2% | 79.3% | 78.1% | 82.4% | 76.5% | 75.1% |
Rooms
Booked | 5,834 | 5,274 | 5,946 | 5,545 | 4,654 | 4,651 | 4,512 | 4,099 | 3,915 | 4,196 | 3,635 | 3,710 | 3,133 | 2,619 | 3,681 | 3,487 | 3,177 | 2,995 |
| RevPAR | $103 | $109 | $117 | $110 | $108 | $116 | $108 | $95 | $94 | $94 | $82 | $87 | $88 | $90 | $92 | $103 | $105 | $105 |
| Stay Units | 339 | 339 | 339 | 339 | 404 | 404 | 404 | 404 | 404 | 405 | 414 | 427 | 436 | 443 | 419 | 448 | 457 | 458 |
| ADR | $157 | $172 | $217 | $212 | $206 | $200 | $189 | $186 | $211 | $239 | $185 | $171 | $174 | $179 | $203 | $202 | $210 | $205 |
| Occupancy | 64.3% | 80.0% | 81.6% | 74.7% | 74.2% | 73.0% | 73.3% | 67.7% | 74.0% | 76.2% | 66.5% | 52.2% | 60.8% | 73.7% | 80.1% | 79.0% | 80.8% | 78.0% |
Rooms
Booked | 6,761 | 7,595 | 8,575 | 7,601 | 9,290 | 8,848 | 9,186 | 8,485 | 8,966 | 9,564 | 8,254 | 6,908 | 8,222 | 9,140 | 10,407 | 10,624 | 11,440 | 10,716 |
| RevPAR | $101 | $138 | $177 | $159 | $153 | $146 | $139 | $126 | $156 | $182 | $123 | $89 | $106 | $132 | $163 | $160 | $170 | $160 |
| RevPAR Premiums | | | | | | | | | | | | | | | | | |
Live
Furnished
Premiums | 34.3% | 41.6% | 52.2% | 38.6% | 36.4% | 45.3% | 37.5% | 22.0% | 19.7% | 20.0% | 4.1% | 9.8% | 12.1% | 14.4% | 15.7% | 28.7% | 26.9% | 28.2% |
| Stay Premiums | 32.0% | 78.7% | 130.4% | 100.6% | 93.4% | 83.6% | 76.7% | 61.3% | 98.5% | 131.8% | 56.8% | 12.6% | 34.6% | 66.8% | 103.7% | 99.3% | 105.7% | 95.6% |
| (1) | Source: Third party reports. |
Escrows.
Tax Reserve: During the continuance of a Trigger Period (as defined below), the borrowers are required to deposit into escrow 1/12th of the estimated annual real estate taxes on a monthly basis.
Insurance Reserve: During the continuance of a Trigger Period, the borrowers are required to deposit a monthly amount equal to monthly 1/12th of the annual estimated insurance premiums, unless an acceptable blanket policy is in effect. As of the origination date, an acceptable blanket policy was in place.
Capital Expenditures Reserve: On each monthly payment date, the borrowers are required to deposit approximately $22,375 into a capital expenditures account, for the payment and reimbursement of approved capital expenses.
Ground Rent Reserve: During the continuance of a Trigger Period, the borrowers are required to deposit monthly amounts of rent due and payable for the calendar month under the ground lease at the Sentral Michigan Avenue property.
Hotel Tax Reserve: During the continuance of a Trigger Period, the borrowers are required to deposit an amount reasonably budgeted by the borrowers for the payment of sales and occupancy taxes that are anticipated to be payable during such month.
Lockbox / Cash Management. The ICONIQ Multifamily Portfolio Whole Loan is structured with a soft lockbox with respect to residential rents and springing cash management. The ICONIQ Multifamily Portfolio Whole Loan documents require the borrowers to deliver a notice to all commercial tenants directing them to remit all payments into a lender-controlled clearing account. All gross revenue, including residential rents and any insurance proceeds, received by the borrowers or property manager are required to be deposited into the clearing account within one business day of receipt. Funds in the clearing account will be swept on a daily basis into the borrower’s operating account unless a Trigger Period is continuing, in which event such funds will be swept on a daily basis into a lender-controlled cash management account and disbursed in accordance with the ICONIQ Multifamily Portfolio Whole Loan documents.
A “Trigger Period” will commence upon the following the occurrence of: (i) an event of default under the ICONIQ Multifamily Portfolio Whole Loan documents until cured or waived in writing by the lender or (ii) the debt yield falling below 6.0% for two consecutive calendar quarters (a “Low Debt Yield Period”) until the debt yield is equal to or greater than 6.0% for two consecutive calendar quarters.
The borrowers may prepay the ICONIQ Multifamily Portfolio Whole Loan in an amount such that, if the outstanding principal balance of the ICONIQ Multifamily Portfolio Whole Loan used in the applicable debt yield calculation had been equal to the outstanding principal balance amount of the ICONIQ Multifamily Portfolio Whole Loan after giving effect to such prepayment, the debt yield as of such date
THE INFORMATION IN THIS STRUCTURAL AND COLLATERAL TERM SHEET IS NOT COMPLETE AND MAY BE AMENDED PRIOR TO THE TIME OF SALE. THIS TERM SHEET IS NOT AN OFFER TO SELL THESE SECURITIES AND IT IS NOT A SOLICITATION OF AN OFFER TO BUY THESE SECURITIES IN ANY JURISDICTION WHERE THE OFFER OR SALE IS NOT PERMITTED. |
| | 133 | |
| Multifamily – Various | Loan #10 | Cut-off Date Balance: | | $26,000,000 |
| Various | ICONIQ Multifamily Portfolio | Cut-off Date LTV: | | 36.1% |
| Various | | U/W NCF DSCR: | | 2.43x |
| | | U/W NOI Debt Yield: | | 14.6% |
would have equaled or exceeded 6.0% (provided that any such prepayment is subject to the payment of any applicable interest shortfall and, if made prior to the open prepayment Date is subject to the applicable prepayment fee).
The borrowers may also satisfy the conditions to cure a Trigger Period resulting from a Low Debt Yield Period by delivering cash or a letter of credit as additional collateral for the ICONIQ Multifamily Portfolio Whole Loan in an amount that would be sufficient, if the same were to be deducted from the principal balance of the ICONIQ Multifamily Portfolio Whole Loan, to cause the debt yield to be equal to or greater than 6.0%, at its sole option, to prevent the commencement of a Trigger Period due to the commencement of a Low Debt Yield Period. If the debt yield (without any imputed deduction to the outstanding principal balance of the ICONIQ Multifamily Portfolio Whole Loan) is equal to or greater than 6.0% for two consecutive calendar quarters, the lender will return to the borrowers an amount of the collateral that is not required to satisfy the conditions to cure a Trigger Period resulting from a Low Debt Yield Period.
Partial Release. The borrowers may at any time, provided no ICONIQ Multifamily Portfolio Whole Loan event of default is continuing (other than as noted below), release one or more ICONIQ Multifamily Portfolio Properties by prepaying the applicable Release Amount (as defined below) of the allocated loan amount of the subject ICONIQ Multifamily Portfolio Properties together with any yield maintenance premium then required (if any), and subject to the following terms and conditions, among others: (i) the debt yield after giving effect to such release (the “Partial Release Required Debt Yield”) is at least equal to the greater of (a) 8.3% or (b) the debt yield immediately prior to the occurrence of such release; (ii) continued compliance with the single purpose entity requirements contained in the ICONIQ Multifamily Portfolio Whole Loan documents; (iii) payment of the lender’s reasonable out-of-pocket costs and expenses; and (iv) satisfaction of any REMIC conditions.
“Release Amount” with respect to any ICONIQ Multifamily Portfolio Property released, means (x) if the Release Amount paid with respect to the applicable ICONIQ Multifamily Portfolio Property that is subject to a partial release (when aggregated with any prior Release Amounts) is equal to or less than $157,500,000, 105% of the allocated loan amount for such ICONIQ Multifamily Portfolio Property and (y) in all other instances, 110% of the allocated loan amount for such ICONIQ Multifamily Portfolio Property.
In the event that the debt yield following the release does not satisfy the Partial Release Required Debt Yield, the borrower will be permitted to release the subject ICONIQ Multifamily Portfolio Property taking into account any cash or letters of credit previously held or delivered as collateral to cure a Low Debt Yield Period.
Transfers of direct and indirect equity interests in the borrowers will be permitted under certain circumstances so long as the conditions described in “Description of the Mortgage Pool—The Whole Loans—The Non-Serviced AB Whole Loan—The ICONIQ Multifamily Portfolio Whole Loan—Transfer Restrictions” in the Preliminary Prospectus are satisfied.
The borrowers have the right to (x) convey the entire ICONIQ Multifamily Portfolio Whole Loan to a transferee that assumes all of the borrowers’ obligations under the ICONIQ Multifamily Portfolio Whole Loan documents (a “Portfolio Sale”) or (y) to transfer direct or indirect equity interests in the borrowers to a transferee which would not otherwise constitute a permitted transfer under the ICONIQ Multifamily Portfolio Whole Loan documents (an “Equity Sale”), provided, among other things, (i) no event of default under the ICONIQ Multifamily Portfolio Whole Loan documents has occurred and is continuing, (ii) in connection with a Portfolio Sale, the transferee is a special purpose bankruptcy remote entity satisfying the requirements in the ICONIQ Multifamily Portfolio Whole Loan documents and in connection with an Equity Sale, the borrowers continue to be a special purpose bankruptcy remote entities satisfying the requirements in the ICONIQ Multifamily Portfolio Whole Loan documents, (iii) the transferee or the borrowers, as the case may be, is required to be controlled by a person who (a) is a qualified transferee under the ICONIQ Multifamily Portfolio Whole Loan documents, and (b) either satisfies the requirements of an eligible qualified owner under the ICONIQ Multifamily Portfolio Whole Loan documents (or with respect to the experience requirement, engages an unaffiliated qualified property manager that satisfied the experience requirements), (iv) the ICONIQ Multifamily Portfolio Property will be managed by an approved affiliate manager under the ICONIQ Multifamily Portfolio Whole Loan documents, an affiliate of the borrower (in the case of an Equity Sale) or the transferee (in the case of a Portfolio Sale), or another property manager acceptable to the lender, (v) a rating agency confirmation is obtained, (vi) an approved replacement guarantor delivers a replacement, non-recourse carveout guaranty and environmental indemnity, and (vii) the lender receives a transfer fee equal to $500,000.
Subordinate and Mezzanine Debt. The ICONIQ Multifamily Portfolio Whole Loan also includes the ICONIQ Multifamily Portfolio Junior Notes. The ICONIQ Multifamily Portfolio Junior Notes bear interest at 6.3650% per annum. Payments on the ICONIQ Multifamily Portfolio Junior Notes are generally subordinate to payments on the ICONIQ Multifamily Portfolio Senior Notes, provided that the ICONIQ Multifamily Portfolio Junior Notes receive payments of interest prior to principal payments being made on the ICONIQ Multifamily Portfolio Senior Notes. See “Description of the Mortgage Pool—The Whole Loans—The Non-Serviced AB Whole Loans—The ICONIQ Multifamily Portfolio Whole Loan” in the Preliminary Prospectus.
Permitted Future Mezzanine or Subordinate Debt. Not permitted.
Ground Lease. The Sentral Michigan Avenue property is subject to a ground lease through December 31, 2114, with no extension options. The current ground rent for the year ending on December 31, 2024, is $410,184.93, payable in equal monthly installments of approximately $34,182. On the first day of January throughout the ground lease term, the base ground rent will be increased by an amount equal to the percentage CPI increase for the immediately preceding year, plus 1%.
Terrorism Insurance. The ICONIQ Multifamily Portfolio Whole Loan documents require an “all risk” insurance policy on a replacement cost basis, together with (i) business interruption insurance covering no less than the 18-month period following the occurrence of a casualty event, together with a 12-month extended period of indemnity, (ii) windstorm and/or named storm coverage with a deductible
THE INFORMATION IN THIS STRUCTURAL AND COLLATERAL TERM SHEET IS NOT COMPLETE AND MAY BE AMENDED PRIOR TO THE TIME OF SALE. THIS TERM SHEET IS NOT AN OFFER TO SELL THESE SECURITIES AND IT IS NOT A SOLICITATION OF AN OFFER TO BUY THESE SECURITIES IN ANY JURISDICTION WHERE THE OFFER OR SALE IS NOT PERMITTED. |
| | 134 | |
| Multifamily – Various | Loan #10 | Cut-off Date Balance: | | $26,000,000 |
| Various | ICONIQ Multifamily Portfolio | Cut-off Date LTV: | | 36.1% |
| Various | | U/W NCF DSCR: | | 2.43x |
| | | U/W NOI Debt Yield: | | 14.6% |
up to $100,000, except for water damage, which may have a deductible not to exceed $250,000, with the exception of windstorm or earthquake, which may have deductibles not to exceed five percent (5%) of the total insurable value of such property per occurrence and (iii) terrorism coverage as defined by TRIPRA. See “Risk Factors—Risks Relating to the Mortgage Loans—Terrorism Insurance May Not Be Available for All Mortgaged Properties” in the Preliminary Prospectus.
THE INFORMATION IN THIS STRUCTURAL AND COLLATERAL TERM SHEET IS NOT COMPLETE AND MAY BE AMENDED PRIOR TO THE TIME OF SALE. THIS TERM SHEET IS NOT AN OFFER TO SELL THESE SECURITIES AND IT IS NOT A SOLICITATION OF AN OFFER TO BUY THESE SECURITIES IN ANY JURISDICTION WHERE THE OFFER OR SALE IS NOT PERMITTED. |
| | 135 | |
| No. 11 – Waterside Marketplace |
| |
| Mortgage Loan Information | | Mortgaged Property Information |
| Mortgage Loan Seller: | Wells Fargo Bank, National Association | | Single Asset/Portfolio: | Single Asset |
Credit Assessment (Fitch/KBRA/S&P): | NR/NR/Baa3 | | Property Type – Subtype: | Retail – Anchored |
| Original Principal Balance: | $25,800,000 | | Location: | Chesterfield, MI |
| Cut-off Date Balance: | $25,800,000 | | Size: | 276,244 SF |
| % of Initial Pool Balance: | 3.6% | | Cut-off Date Balance Per SF: | $93.40 |
| Loan Purpose: | Acquisition | | Maturity Date Balance Per SF: | $91.39 |
| Borrower Sponsors: | Sridhar Marupudi and Ziaur Rahman | | Year Built/Renovated: | 2007, 2008, 2014, 2021/NAP |
| Guarantors: | Sridhar Marupudi and Ziaur Rahman | | Title Vesting: | Fee |
| Mortgage Rate: | 6.2100% | | Property Manager: | Pinnacle Leasing & Management, LLC. |
| Note Date: | October 16, 2024 | | Current Occupancy (As of): | 93.8% (9/5/2024) |
| Seasoning: | 0 months | | YE 2023 Occupancy(1): | 96.9% |
| Maturity Date: | November 11, 2029 | | YE 2022 Occupancy: | 94.3% |
| IO Period: | 36 months | | YE 2021 Occupancy: | 88.4% |
| Loan Term (Original): | 60 months | | YE 2020 Occupancy: | 88.4% |
| Amortization Term (Original): | 360 months | | As-Is Appraised Value: | $41,125,000 |
| Loan Amortization Type: | Interest Only, Amortizing Balloon | | As-Is Appraised Value Per SF: | $148.87 |
| Call Protection: | L(24),D(29),O(7) | | As-Is Appraisal Valuation Date: | August 5, 2024 |
| | | | | |
| Lockbox Type: | Hard / Springing Cash Management | | Underwriting and Financial Information |
| Additional Debt: | No | | TTM NOI (7/31/2024) (2): | $2,990,209 |
| Additional Debt Type (Balance): | NAP | | YE 2023 NOI: | $2,668,891 |
| | | | YE 2022 NOI: | $3,494,942 |
| | | | YE 2021 NOI: | $3,943,526 |
| | | | U/W Revenues: | $5,300,317 |
| | | | U/W Expenses: | $1,693,234 |
| Escrows and Reserves | | U/W NOI(2): | $3,607,084 |
| | Initial | Monthly | Cap | | U/W NCF: | $3,419,652 |
| Taxes | $222,081 | $74,027 | NAP | | U/W DSCR based on NOI/NCF: | 1.90x / 1.80x |
| Insurance | $54,194 | $7,742 | NAP | | U/W Debt Yield based on NOI/NCF: | 14.0% / 13.3% |
| Replacement Reserves | $200,000 | $4,604 | $200,000 | | U/W Debt Yield at Maturity based on NOI/NCF: | 14.3% / 13.5% |
| TI/LC Reserve | $750,000 | $34,531 | $750,000 | | Cut-off Date LTV Ratio: | 62.7% |
| Existing TI/LC Reserve | $1,413,000 | $0 | NAP | | LTV Ratio at Maturity: | 61.4% |
| | | | | | | |
| | | | | | | |
| | | | | | | | |
| Sources and Uses |
| Sources | | | | | Uses | | | |
| Original Mortgage Loan Amount | $25,800,000 | | 60.6 | % | | Purchase Price | $39,600,000 | | 93.0 | % |
| Sponsor Equity | $16,795,017 | | 39.4 | % | | Upfront Reserves | 2,639,275 | | 6.2 | % |
| | | | | | Closing Costs | 355,742 | | 0.8 | % |
| Total Sources | $42,595,017 | | 100.0 | % | | Total Uses | $42,595,017 | | 100.0 | % |
| (1) | Information obtained from the August 31, 2023 rent roll. |
| (2) | The increase in U/W NOI from the TTM NOI (7/31/2024) was due to the Bed Bath & Beyond space being backfilled by Sierra Trading Post, contractual rent increases through November 2025 and free rent burning off for other new leases. |
The Mortgage Loan. The eleventh largest mortgage loan (the “Waterside Marketplace Mortgage Loan”) is evidenced by the first priority fee interest encumbering an anchored retail property totaling 276,244 square feet located in Chesterfield, Michigan (the “Waterside Marketplace Property”).
The Borrower and Borrower Sponsors. The borrower is ORF X Waterside, LLC a Delaware limited liability company and single purpose entity with one independent director. Legal counsel to the borrower delivered a non-consolidation opinion in connection with the origination of the Waterside Marketplace Mortgage Loan. The borrower sponsors are Sridhar Marupudi & Ziaur Rahman and the nonrecourse carveout guarantors are Sridhar Marupudi & Ziaur Rahman. In addition to the non-recourse carveout guaranty, Sridhar Marupudi & Ziaur Rahman provided a guaranty of up to $2,580,000, representing 10% of the original principal balance of the Waterside Marketplace Mortgage Loan.
The Property. The Waterside Marketplace Property consists of an anchored shopping center totaling 276,244 square feet located in Chesterfield, Michigan. The improvements consist of five retail buildings that were constructed from 2007 through 2021. The Waterside
THE INFORMATION IN THIS STRUCTURAL AND COLLATERAL TERM SHEET IS NOT COMPLETE AND MAY BE AMENDED PRIOR TO THE TIME OF SALE. THIS TERM SHEET IS NOT AN OFFER TO SELL THESE SECURITIES AND IT IS NOT A SOLICITATION OF AN OFFER TO BUY THESE SECURITIES IN ANY JURISDICTION WHERE THE OFFER OR SALE IS NOT PERMITTED. |
| | 136 | |
| Retail – Anchored | Loan #11 | Cut-off Date Balance: | | $25,800,000 |
50383, 50400, 50579, 50640 and 50769 Waterside Drive Chesterfield, MI 48051 | Waterside Marketplace | Cut-off Date LTV: U/W NCF DSCR: U/W NOI Debt Yield: | | 62.7% 1.80x 14.0% |
Marketplace Property is located approximately 32 miles northeast of the Detroit central business district (“CBD”) and is situated on a 33.9-acre site. The Waterside Marketplace Property includes 1,589 parking spaces, which results in a parking ratio of 5.75 spaces per 1,000 square feet. The Waterside Marketplace Property is anchored by Burlington, TJ Maxx, Sierra, Best Buy, DSW and Jo-Ann’s. The Waterside Marketplace Property is shadow anchored by a JC Penney, Dick’s Sporting Goods and Aldi. As of September 5, 2024, the Waterside Marketplace Property was 93.8% leased to 19 tenants.
Major Tenants.
Largest Tenant by U/W Base Rent: Best Buy (45,000 square feet; 16.3% of net rentable area; 13.7% of underwritten base rent; 3/31/2026 lease expiration) – Best Buy is the world's largest specialty consumer electronics retailer. In the fiscal year 2024, Best Buy generated $43.5 billion of revenue and operated approximately 1,125 retail stores in North America. Best Buy has been a tenant at the -Waterside Marketplace Property since 2007, has three, five-year renewal options and no termination options remaining.
2nd Largest Tenant by U/W Base Rent: Burlington Coat Factory (35,000 square feet; 12.1% of net rentable area; 11.1% of underwritten base rent; 2/29/2032 lease expiration) – Burlington Coat Factory is an American national off-price department store retailer with approximately 1,000 stores in 46 states and Puerto Rico. Burlington Coat Factory has been a tenant since 2021 and has four, five-year renewal option remaining and no termination options.
3rd Largest Tenant by U/W Base Rent: TJ Maxx (30,450 square feet; 11.0% of net rentable area; 10.1% of underwritten base rent; 10/31/2027 lease expiration) – TJ Maxx is an American department store chain founded in 1976. TJ Maxx has more than 4,900 stores worldwide. TJ Maxx has been a tenant since 2007, has three, five-year renewal options and no termination options remaining.
The following table presents certain information relating to the tenancy at the Waterside Marketplace Property:
Major Tenants
| Tenant Name | Credit Rating (Fitch/ Moody’s/
S&P) (1) | Tenant NRSF | % of
NRSF | Annual U/W Base Rent PSF(2) | Annual
U/W Base Rent(2) | % of Total Annual U/W Base Rent | Lease
Expiration
Date | Ext. Options | Term. Option (Y/N) |
| Major Tenants | | | | | | | | |
| Best Buy | NR/A3/BBB+ | 45,000 | 16.3% | $11.00 | $495,000 | 13.7% | 3/31/2026 | 3, 5-year | N |
| Burlington Coat Factory | NR/NR/BB+ | 35,000 | 12.7% | $12.50 | $437,500 | 12.1% | 2/29/2032 | 4, 5-year | N |
| TJ Maxx | NR/A2/A | 30,450 | 11.0% | $12.00 | $365,400 | 10.1% | 10/31/2027 | 3, 5-year | N |
| Jo-Ann's Fabrics | NR/NR/NR | 25,000 | 9.0% | $11.75 | $293,750 | 8.1% | 1/31/2029 | 3, 5-year | N |
| Sierra Trading Post(2) | NR/A2/A | 19,312 | 7.0% | $14.85 | $286,783 | 7.9% | 4/30/2035 | 4, 5-year | N |
| Old Navy | NR/Ba3/BB | 18,800 | 6.8% | $12.00 | $225,600 | 6.2% | 3/31/2025 | None | N |
| | 173,562 | 62.8% | $12.12 | $2,104,033 | 58.0% | | | |
| | | | | | | | | |
| Non-Major Tenants(3) | 85,475 | 30.9% | $17.81 | $1,522,167 | 42.0% | | | |
| | | | | | | | | |
| Occupied Collateral Total | 259,037 | 93.8% | $14.00 | $3,626,201 | 100.0% | | | |
| | | | | | | | | |
| Vacant Space | 17,207 | 6.2% | | | | | | |
| | | | | | | | | |
| Collateral Total | 276,244 | 100.0% | | | | | | |
| | | | | | | | | | |
| (1) | Certain ratings are those of the parent company whether or not the parent company guarantees the lease. |
| (2) | Information is based on the underwritten rent roll as of September 5, 2024, includes rent increases through November 2025 and signed but not occupied rent for Sierra Trading Post. Sierra Trading Post’s space has been delivered to the tenant in satisfactory condition, they are expected to open for business on April 15, 2025 and outstanding TI funds and gap rent have been reserved for upfront. |
| (3) | Non-Major Tenants space includes one tenant Storage space totalling 2,997 square feet (1.1% of NRSF) that is in occupancy and paying rent and three shadow non-collateral tenants that pay CAM charges. |
THE INFORMATION IN THIS STRUCTURAL AND COLLATERAL TERM SHEET IS NOT COMPLETE AND MAY BE AMENDED PRIOR TO THE TIME OF SALE. THIS TERM SHEET IS NOT AN OFFER TO SELL THESE SECURITIES AND IT IS NOT A SOLICITATION OF AN OFFER TO BUY THESE SECURITIES IN ANY JURISDICTION WHERE THE OFFER OR SALE IS NOT PERMITTED. |
| | 137 | |
| Retail – Anchored | Loan #11 | Cut-off Date Balance: | | $25,800,000 |
50383, 50400, 50579, 50640 and 50769 Waterside Drive Chesterfield, MI 48051 | Waterside Marketplace | Cut-off Date LTV: U/W NCF DSCR: U/W NOI Debt Yield: | | 62.7% 1.80x 14.0% |
The following table presents a summary of sales and occupancy costs for certain tenants at the Waterside Marketplace Property:
Sales and Occupancy Cost Summary(1)
| | 2021 Sales (PSF) | 2022 Sales (PSF) | 2023 Sales (PSF) | 2023 Occupancy
Cost(2) |
| Best Buy | NAV | NAV | NAV | NAV |
| Burlington Coat Factory | NAV | NAV | NAV | NAV |
| TJ Maxx | $493 | $481 | $499 | 3.3% |
| Jo-Ann's Fabrics | $103 | $86 | $86 | 19.2% |
| Sierra Trading Post | NAV | NAV | NAV | NAV |
| Old Navy | $212 | $175 | $173 | 9.3% |
| (1) | Represents available sales information for tenants included in the Major Tenants table above. |
| (2) | Occupancy cost was calculated using the tenant’s Annual U/W Base Rent plus reimbursements divided by the 2023 sales. |
The following table presents certain information relating to the lease rollover schedule at the Waterside Marketplace Property:
Lease Expiration Schedule(1)
Year Ending
December 31, | No. of Leases Expiring | Expiring NRSF | % of Total NRSF | Cumulative Expiring NRSF | Cumulative % of Total NRSF | Annual
U/W
Base Rent | % of Total Annual U/W Base Rent | Annual
U/W
Base Rent
PSF |
| 2024 | 0 | 0 | 0.0% | 0 | 0.0% | $0 | 0.0% | $0.00 |
| 2025 | 3 | 28,997 | 10.5% | 28,997 | 10.5% | $352,384 | 9.7% | $12.15 |
| 2026 | 1 | 45,000 | 16.3% | 73,997 | 26.8% | $495,000 | 13.7% | $11.00 |
| 2027 | 4 | 50,549 | 18.3% | 124,546 | 45.1% | $717,526 | 19.8% | $14.19 |
| 2028 | 3 | 22,800 | 8.3% | 147,346 | 53.3% | $409,576 | 11.3% | $17.96 |
| 2029 | 2 | 28,200 | 10.2% | 175,546 | 63.5% | $399,350 | 11.0% | $14.16 |
| 2030 | 1 | 1,818 | 0.7% | 177,364 | 64.2% | $19,998 | 0.6% | $11.00 |
| 2031 | 1 | 4,605 | 1.7% | 181,969 | 65.9% | $90,120 | 2.5% | $19.57 |
| 2032 | 1 | 35,000 | 12.7% | 216,969 | 78.5% | $437,500 | 12.1% | $12.50 |
| 2033 | 1 | 4,200 | 1.5% | 221,169 | 80.1% | $88,200 | 2.4% | $21.00 |
| 2034 | 2 | 11,356 | 4.1% | 232,525 | 84.2% | $221,764 | 6.1% | $19.53 |
| Thereafter | 3 | 26,512 | 9.6% | 259,037 | 93.8% | $394,783 | 10.9% | $14.89 |
| Vacant | 0 | 17,207 | 6.2% | 276,244 | 100.0% | $0 | 0.0% | $0.00 |
| Total/Weighted Average | 22 | 276,244 | 100.0% | | | $3,626,201 | 100.0% | $14.00 |
| (1) | Information is based on the underwritten rent roll as of September 5, 2024, includes rent increases through November 2025 and signed not occupied rent for Sierra Trading Post. Sierra Trading Post’s space has been delivered to the tenant in satisfactory condition, they are expected to open for business on April 15, 2025 and outstanding TI funds and gap rent have been reserved for upfront. Rent roll includes one tenant Storage space totaling 2,997 square feet (1.1% of NRSF) that is in occupancy and paying rent and three shadow non-collateral tenants that pay CAM charges. |
The following table presents historical occupancy percentages at the Waterside Marketplace Property:
Historical Occupancy(1)
12/31/2020 | 12/31/2021 | 12/31/2022 | 8/31/2023 | TTM 9/5/2024(2) |
| 88.4% | 88.4% | 94.3% | 96.9% | 93.8% |
| (1) | Historical occupancies obtained from borrower rent rolls. |
| (2) | Information obtained from the underwritten rent roll as of September 5, 2024. |
THE INFORMATION IN THIS STRUCTURAL AND COLLATERAL TERM SHEET IS NOT COMPLETE AND MAY BE AMENDED PRIOR TO THE TIME OF SALE. THIS TERM SHEET IS NOT AN OFFER TO SELL THESE SECURITIES AND IT IS NOT A SOLICITATION OF AN OFFER TO BUY THESE SECURITIES IN ANY JURISDICTION WHERE THE OFFER OR SALE IS NOT PERMITTED. |
| | 138 | |
| Retail – Anchored | Loan #11 | Cut-off Date Balance: | | $25,800,000 |
50383, 50400, 50579, 50640 and 50769 Waterside Drive Chesterfield, MI 48051 | Waterside Marketplace | Cut-off Date LTV: U/W NCF DSCR: U/W NOI Debt Yield: | | 62.7% 1.80x 14.0% |
Underwritten Net Cash Flow. The following table presents certain information relating to the historical operating results and the underwritten net cash flow at the Waterside Marketplace Property:
Cash Flow Analysis
| | 2020 | 2021 | 2022 | 2023 | TTM July 2024 | U/W | % | U/W $
per SF |
| Base Rent | $3,553,599 | $3,986,146 | $3,783,645 | $3,046,972 | $3,265,674 | $3,626,201(1) | 64.8% | $13.13(1) |
| Grossed Up Vacant Space | 0 | 0 | 0 | 0 | 0 | 298,780 | 5.3 | 1.08 |
| Gross Potential Rent | $3,553,599 | $3,986,146 | $3,783,645 | $3,046,972 | $3,265,674 | $3,924,981 | 70.1% | $14.21 |
| Other Income | 85,076 | 171,668 | 139,940 | 114,473 | 158,843 | 137,752 | 2.5 | 0.50 |
| Percentage Rent | 0 | 59,976 | 0 | 16,624 | 41,456 | 0 | 0.0 | 0.00 |
| Total Recoveries | 1,188,387 | 1,507,165 | 1,501,703 | 1,430,025 | 1,469,579 | 1,536,365 | 27.4 | 5.56 |
| Net Rental Income | $4,827,062 | $5,724,955 | $5,425,288 | $4,608,094 | $4,935,552 | $5,599,097 | 100.0% | $20.27 |
| (Vacancy & Credit Loss) | 0 | 0 | 0 | 0 | 0 | (298,780) | (7.6) | (1.08) |
| Collection Loss | (140,642) | 0 | (73,044) | (74,434) | 0 | 0 | 0.0 | 0.00 |
| Free Rent Adjustment | (286,018) | 0 | 0 | (75,032) | (225,728) | 0 | 0.0 | 0.00 |
| Effective Gross Income | $4,400,402 | $5,724,955 | $5,352,244 | $4,458,628 | $4,709,824 | $5,300,317 | 94.7% | $19.19 |
| | | | | | | | | |
| Real Estate Taxes | $830,711 | $867,062 | $870,447 | $814,329 | $837,709 | $851,705 | 16.1% | $3.08 |
| Insurance | 134,588 | 130,745 | 130,319 | 197,569 | 138,468 | 88,481 | 1.7 | 0.32 |
| Management Fee | 180,487 | 254,846 | 235,218 | 197,673 | 202,402 | 212,013 | 4.0 | 0.77 |
| Other Operating Expenses | 424,810 | 528,777 | 621,317 | 580,166 | 541,035 | 541,035 | 10.2 | 1.96 |
| Total Operating Expenses | $1,570,596 | $1,781,429 | $1,857,302 | $1,789,737 | $1,719,614 | $1,693,234 | 31.9% | $6.13 |
| | | | | | | | | |
| Net Operating Income | $2,829,806 | $3,943,526 | $3,494,942 | $2,668,891 | $2,990,209 | $3,607,084 | 68.1% | $13.06 |
| Replacement Reserves | 0 | 0 | 0 | 0 | 0 | 55,249 | 1.0 | 0.20 |
| TI/LC | 0 | 0 | 0 | 0 | 0 | 207,183 | 3.9 | 0.75 |
| Non-Recurring Items | 0 | 0 | 0 | 0 | 0 | (75,000) | (1.4) | (0.27) |
| Net Cash Flow | $2,829,806 | $3,943,526 | $3,494,942 | $2,668,891 | $2,990,209 | $3,419,652 | 64.5% | $12.38 |
| | | | | | | | | |
| NOI DSCR | 1.49x | 2.08x | 1.84x | 1.41x | 1.58x | 1.90x | | |
| NCF DSCR | 1.49x | 2.08x | 1.84x | 1.41x | 1.58x | 1.80x | | |
| NOI Debt Yield | 11.0% | 15.3% | 13.5% | 10.3% | 11.6% | 14.0% | | |
| NCF Debt Yield | 11.0% | 15.3% | 13.5% | 10.3% | 11.6% | 13.3% | | |
| (1) | The U/W Base Rent per SF and U/W Base Rent include contractual rent steps November 2025. |
| (2) | All percent revenue fields are divided over net rental income, all percent vacancy fields are divided over gross potential rent and all percent expenses are divided over effective gross income. |
| (3) | The increase in U/W NOI from the TTM NOI (7/31/2024) was due to the Bed Bath & Beyond space being backfilled by Sierra Trading Post, contractual rent increases through November 2025 and free rent burning off for other new leases. |
Appraisal. The appraiser concluded to an “As-is” value for the Waterside Marketplace Property of $41,125,000. The appraised value is as of August 5, 2024.
Environmental Matters. According to the Phase I environmental site assessment for the Waterside Marketplace Property, dated August 30, 2024, there was no evidence of any recognized environmental conditions.
Market Overview and Competition. The Waterside Marketplace Property is located in Chesterfield, Michigan, approximately 32 miles northeast of the Detroit CBD. The primary highway access is provided by Interstate 94 to the East (1.2 miles). According to the appraisal, within a 1-, 3- and 5- mile radius of the Waterside Marketplace Property, the estimated 2024 population is 6,990, 46,347 and 105,874 respectively, and the 2024 average household income is $84,624, $115,702, and $117,681 respectively.
According to the appraisal, the property is situated within the Macomb East retail submarket of the Detroit retail market. The Macomb East retail submarket reports a total inventory of approximately 26.1 million square feet with a 5.9% vacancy rate and average market rents of $12.98 per square foot. The appraiser identified six lease comparable for anchor tenants, seven lease comparables for junior anchor tenants, seven lease comparables for major tenants, six lease comparable for Majors (4k - 6.5k) leases, and seven lease comparable for Inline (<4k) leases. The appraiser concluded to market rents for the Waterside Marketplace Property, ranging from $11.00 per square foot for Anchor, to $30.00 per square foot for the Inline space.
THE INFORMATION IN THIS STRUCTURAL AND COLLATERAL TERM SHEET IS NOT COMPLETE AND MAY BE AMENDED PRIOR TO THE TIME OF SALE. THIS TERM SHEET IS NOT AN OFFER TO SELL THESE SECURITIES AND IT IS NOT A SOLICITATION OF AN OFFER TO BUY THESE SECURITIES IN ANY JURISDICTION WHERE THE OFFER OR SALE IS NOT PERMITTED. |
| | 139 | |
| Retail – Anchored | Loan #11 | Cut-off Date Balance: | | $25,800,000 |
50383, 50400, 50579, 50640 and 50769 Waterside Drive Chesterfield, MI 48051 | Waterside Marketplace | Cut-off Date LTV: U/W NCF DSCR: U/W NOI Debt Yield: | | 62.7% 1.80x 14.0% |
The following table presents certain information relating to the appraiser’s market rent conclusions for the Waterside Marketplace Property:
Market Rent Summary(1)
| | Anchor
(Outlot) | Junior Anchor | Majors (6.5k - 20k) | Majors (4k - 6.5k) | Inline (<4k) | Inline Corner (<4k) | Outlot - Inline |
| Market Rent (PSF) | $11.00 | $12.50 | $17.50 | $20.00 | $30.00 | $10.00 | $20.00 |
| Lease Term (Years) | 10 | 10 | 10 | 5 | 5 | 5 | 5 |
| Lease Type | NNN | NNN | NNN | NNN | NNN | NNN | NNN |
| Rent Increase Projection | 10% / 5 Yrs. | 10% / 5 Yrs. | 10% / 5 Yrs. | 2.50% / YR | 2.50% / YR | 2.50% / YR | 2.50% / YR |
| (1) | Information obtained from the appraisal. |
The table below presents certain information relating to comparable sales pertaining to the Waterside Marketplace Property identified by the appraiser:
Comparable Sales(1)
| Property Name | Location | Year Built/Renovated | Rentable Area (SF) | Occupancy | Sale Date | Sale Price | Sale Price (PSF) |
Waterside Marketplace Property 50383, 50400, 50579, 50640 and
50769 Waterside Drive | Chesterfield, MI | 2007, 2008, 2014, 2021/NAP | 276,244(2) | 93.8%(2) | | | |
Springhurst Towne Center
4400 Towne Center Drive | Louisville, KY | 1997 / 2020 | 444,503 | 99.0% | Dec-2023 | $66,100,000 | $149 |
Waterstone Center
9691 Waterstone Boulevard | Cincinnati, OH | 1996 / NAP | 157,181 | 100.0% | Sep-2023 | $29,569,397 | $188 |
Maple Hill Pavillion
5022 W Main St | Kalamazoo, MI | 1971 / 2013 | 276,397 | 98.0% | May-2023 | $33,312,000 | $121 |
Tel-Twelve Mall
28550-28700 Telegraph Road | Southfield, MI | 1968 / 2005 | 193,850 | 96.0% | Jun-2022 | $45,000,000 | $232 |
Hunter's Square
30825-31383 Orchard Lake Road | Farmington Hills, MI | 1981 / 2024 | 358,098 | 54.0% | Mar-2024 | $34,000,000 | $229 |
Creekside Commons
9557-9581 Mentor Ave. | Mentor, OH | 1995 / 2023 | 204,997 | 100.0% | Oct-2023 | $24,125,000 | $118 |
| (1) | Information obtained from the appraisal. |
| (2) | Information obtained from the underwritten rent roll as of September 5, 2024. |
THE INFORMATION IN THIS STRUCTURAL AND COLLATERAL TERM SHEET IS NOT COMPLETE AND MAY BE AMENDED PRIOR TO THE TIME OF SALE. THIS TERM SHEET IS NOT AN OFFER TO SELL THESE SECURITIES AND IT IS NOT A SOLICITATION OF AN OFFER TO BUY THESE SECURITIES IN ANY JURISDICTION WHERE THE OFFER OR SALE IS NOT PERMITTED. |
| | 140 | |
| No. 12 – Lakeland Park Center |
| |
| Mortgage Loan Information | | Mortgaged Property Information |
| Mortgage Loan Seller: | Wells Fargo Bank, National Association | | Single Asset/Portfolio: | Single Asset |
Credit Assessment (Fitch/KBRA/Moody’s): | NR/NR/NR | | Property Type – Subtype: | Retail – Anchored |
| Original Principal Balance: | $24,000,000 | | Location: | Lakeland, FL |
| Cut-off Date Balance: | $24,000,000 | | Size: | 219,340 SF |
| % of Initial Pool Balance: | 3.3% | | Cut-off Date Balance Per SF: | $109.42 |
| Loan Purpose: | Refinance | | Maturity Date Balance Per SF: | $109.42 |
| Borrower Sponsors: | Daniel Katz and Daniel Kaufthal | | Year Built/Renovated: | 2014/NAP |
| Guarantors: | Daniel Katz and Daniel Kaufthal | | Title Vesting: | Fee |
| Mortgage Rate: | 6.4770% | | Property Manager: | Katz Properties Management LLC (borrower-related) |
| Note Date: | October 18, 2024 | | Current Occupancy (As of): | 100.0% (8/31/2024) |
| Seasoning: | 0 months | | YE 2023 Occupancy: | 100.0% |
| Maturity Date: | November 11, 2029 | | YE 2022 Occupancy: | 96.7% |
| IO Period: | 60 months | | YE 2021 Occupancy: | 98.3% |
| Loan Term (Original): | 60 months | | YE 2020 Occupancy: | 97.6% |
| Amortization Term (Original): | NAP | | As-Is Appraised Value: | $43,700,000 |
| Loan Amortization Type: | Interest Only | | As-Is Appraised Value Per SF: | $199.23 |
| Call Protection: | L(24),D(29),O(7) | | As-Is Appraisal Valuation Date: | August 17, 2024 |
| Lockbox Type: | Hard/Springing Cash Management | | Underwriting and Financial Information |
| Additional Debt: | None | | TTM NOI (8/31/2024 T6 Annualized): | $3,118,990 |
| Additional Debt Type (Balance): | NAP | | YE 2023 NOI: | $2,759,970 |
| | | | YE 2022 NOI: | $2,813,585 |
| | | | YE 2021 NOI: | $2,944,155 |
| | | | U/W Revenues: | $4,503,147 |
| | | | U/W Expenses: | $1,408,429 |
| Escrows and Reserves | | U/W NOI: | $3,094,718 |
| | Initial | Monthly | Cap | | U/W NCF: | $2,787,642 |
| Taxes | $414,447 | $37,677 | NAP | | U/W DSCR based on NOI/NCF: | 1.96x / 1.77x |
| Insurance(1) | $0 | Springing | NAP | | U/W Debt Yield based on NOI/NCF: | 12.9% / 11.6% |
| Replacement Reserves | $0 | $2,742 | NAP | | U/W Debt Yield at Maturity based on NOI/NCF: | 12.9% / 11.6% |
| TI/LC Reserve | $0 | $22,848 | NAP | | Cut-off Date LTV Ratio: | 54.9% |
| Tenant Reimbursement Reserve | $6,142 | $0 | NAP | | LTV Ratio at Maturity: | 54.9% |
| | | | | | | |
| | | | | | | | |
| Sources and Uses |
| Sources | | | | | Uses | | | |
| Original Mortgage Loan Amount | $24,000,000 | | 100.0% | | Existing Debt Payoff(3): | $22,880,155 | | 95. | 3% |
| | | | | | Closing Costs | 694,113 | | 2.9 | |
| | | | | | Upfront Reserves | 420,589 | | 1.8 | |
| | | | | | Cash to Borrower | 5,143 | | 0.0 | |
| Total Sources | $24,000,000 | | 100.0% | | Total Uses | $24,000,000 | | 10 | 0.0% |
| (1) | The loan documents do not require ongoing monthly insurance reserves; so long as no event of default is continuing, the borrower maintains insurance coverage for the Lakeland Park Center Property as part of blanket or umbrella coverage reasonably approved by the lender, and provides the lender with evidence of the renewals of the insurance policies and paid receipts for the payment of the insurance premiums no later than 10 days prior to the expiration dates of the policies. If such conditions are not satisfied, the loan documents require ongoing monthly insurance reserves in an amount equal to 1/12 of the insurance premiums. |
| (2) | Includes preferred equity paydown totaling $4.5 million. |
The Mortgage Loan. The twelfth largest mortgage loan (the “Lakeland Park Center Mortgage Loan”) is evidenced by the first priority fee interest encumbering an anchored retail property totaling 219,340 square feet located in Lakeland, Florida (the “Lakeland Park Center Property”).
The Borrower and Borrower Sponsors. The borrower is Lakeland Park MZL LLC, a Delaware limited liability company and single purpose entity with one independent director. Legal counsel to the borrower delivered a non-consolidation opinion in connection with the origination of the Lakeland Park Center Mortgage Loan. The borrower sponsors and nonrecourse carveout guarantors are Daniel Katz and Daniel Kaufthal.
THE INFORMATION IN THIS STRUCTURAL AND COLLATERAL TERM SHEET IS NOT COMPLETE AND MAY BE AMENDED PRIOR TO THE TIME OF SALE. THIS TERM SHEET IS NOT AN OFFER TO SELL THESE SECURITIES AND IT IS NOT A SOLICITATION OF AN OFFER TO BUY THESE SECURITIES IN ANY JURISDICTION WHERE THE OFFER OR SALE IS NOT PERMITTED. |
| | 141 | |
| Retail – Anchored | Loan #12 | Cut-off Date Balance: | | $24,000,000 |
919 Lakeland Park Center Drive Lakeland, FL 33809 | Lakeland Park Center | Cut-off Date LTV: U/W NCF DSCR: U/W NOI Debt Yield: | | 54.9% 1.77x 12.9% |
Daniel Katz and Daniel Kaufthal are managing partners of KPR Centers (“KPR”), a vertically integrated real estate investor with in-house retail leasing, management, and development operations. Founded in 2009 and headquartered in New York, KPR’s strategy is focused on acquiring retail and industrial properties. KPR has a current portfolio of 49 properties across 17 states.
The Property. The Lakeland Park Center Property comprises a two-building, anchored retail center totaling 219,340 square feet, located in Lakeland, Florida. Situated on a 33.6-acre site, the property was constructed in 2014 and includes a total of 1,358 parking spaces, which results in a parking ratio of 6.19 spaces per 1,000 square feet. The Lakeland Park Center Property is anchored by a Floor & Decor and Dick’s Sporting Goods with other major tenants including Ross Dress For Less, Ulta Salon, Five Below and Lane Bryant. As of August 31, 2024, the Lakeland Park Center Property was 100.0% leased to 15 tenants.
Major Tenants. Largest Tenant by U/W Base Rent: Floor & Decor (60,462 square feet; 27.6% of net rentable area; 20.2% of underwritten base rent; 12/31/2029 lease expiration) – Floor & Decor operates as a multi-channel specialty retailer of hard surface flooring and related accessories and seller of commercial surfaces. The company operates warehouse-format stores and small design studios across 36 states. Floor & Decor was founded in 2000 and is headquartered in Atlanta, Georgia. Floor & Decor has been a tenant since 2014 and has one, five-year renewal option remaining with no termination options.
2nd Largest Tenant by U/W Base Rent: Dick’s Sporting Goods (50,019 square feet; 22.8% of net rentable area; 17.4% of underwritten base rent; 1/31/2030 lease expiration) – Dick’s Sporting Goods (“Dick’s”) is a sporting goods retailer offering an assortment of sports equipment, apparel, footwear, and accessories. In addition to Dick’s Sporting Goods stores, the company owns and operates Golf Galaxy, Public Lands, Moosejaw and Going Going Gone!, and also offers its products online and through the company's mobile apps. Dick’s has been a tenant since 2014 and has two, five-year renewal options remaining with no termination options.
3rd Largest Tenant by U/W Base Rent: Ross Dress For Less (27,248 square feet; 12.4% of net rentable area; 9.1% of underwritten base rent; 1/31/2030 lease expiration) – Ross Dress For Less (“Ross”) is the largest off-price apparel and home fashion chain in the United States, with locations in 40 states, the District of Columbia, and Guam. Ross Dress For Less has been a tenant since 2014 and has one, five-year renewal option remaining with no termination options.
The following table presents certain information relating to the tenancy at the Lakeland Park Center Property:
Major Tenants
| Tenant Name | Credit Rating (Fitch/ Moody’s/
S&P)(1) | Tenant NRSF | % of
NRSF | Annual U/W Base Rent PSF(2) | Annual
U/W Base Rent(2) | % of Total Annual U/W Base Rent | Lease
Expiration
Date | Ext. Options | Term. Option (Y/N) |
| Major Tenants | | | | | | | | |
| Floor & Decor | NR/NR/BB | 60,462 | 27.6% | $12.50 | $755,775 | 20.2% | 12/31/2029 | 1, 5-year | N |
| Dick’s | NR/Baa2/BBB | 50,019 | 22.8% | $13.00 | $650,247 | 17.4% | 1/31/2030 | 2, 5-year | N |
| Ross | NR/A2/BBB+ | 27,248 | 12.4% | $12.50 | $340,600 | 9.1% | 1/31/2030 | 1, 5-year | N |
| Pet Smart | NR/B1/B+ | 14,007 | 6.4% | $16.00 | $224,112 | 6.0% | 9/30/2029 | 2, 5-year | N |
| Old Navy | NR/Ba3/BB | 12,577 | 5.7% | $16.40 | $206,263 | 5.5% | 9/30/2026 | N | N |
| Shoe Carnival | NR/NR/NR | 10,087 | 4.6% | $17.90 | $180,540 | 4.8% | 1/31/2030 | N | N |
| | 174,400 | 79.5% | $13.52 | $2,357,537 | 63.0% | | | |
| | | | | | | | | |
| Non-Major Tenants | 44,940 | 20.5% | $30.85 | $1,386,555 | 37.0% | | | |
| | | | | | | | | |
| Occupied Collateral Total | 219,340 | 100.0% | $17.07 | $3,744,092 | 100.0% | | | |
| | | | | | | | | |
| Vacant Space | 0 | 0% | | | | | | |
| | | | | | | | | |
| Collateral Total | 219,340 | 100.0% | | | | | | |
| | | | | | | | | | |
| (1) | Based on the underwritten rent roll dated August 31, 2024. |
| (2) | Certain Ratings are those of the parent company, whether or not the parent guarantees the lease. |
| (3) | Annual U/W Base Rent PSF and Annual U/W Base Rent includes contractual rent steps through November 2025 totalling $221,693. |
THE INFORMATION IN THIS STRUCTURAL AND COLLATERAL TERM SHEET IS NOT COMPLETE AND MAY BE AMENDED PRIOR TO THE TIME OF SALE. THIS TERM SHEET IS NOT AN OFFER TO SELL THESE SECURITIES AND IT IS NOT A SOLICITATION OF AN OFFER TO BUY THESE SECURITIES IN ANY JURISDICTION WHERE THE OFFER OR SALE IS NOT PERMITTED. |
| | 142 | |
| Retail – Anchored | Loan #12 | Cut-off Date Balance: | | $24,000,000 |
919 Lakeland Park Center Drive Lakeland, FL 33809 | Lakeland Park Center | Cut-off Date LTV: U/W NCF DSCR: U/W NOI Debt Yield: | | 54.9% 1.77x 12.9% |
The following table presents a summary of sales and occupancy costs for certain tenants at the Lakeland Park Center Property:
Sales and Occupancy Cost Summary(1)
| | 2021 Sales (PSF) | 2022 Sales (PSF) | 2023 Sales (PSF) | 2023 Occupancy Cost(2) |
| Floor & Decor | NAV | NAV | NAV | NAV |
| Dick’s | NAV | NAV | NAV | NAV |
| Ross | NAV | NAV | NAV | NAV |
| Pet Smart | NAV | $504(3) | $571 | 3.8% |
| Old Navy | NAV | NAV | NAV | NAV |
| (1) | Represents available sales information for tenants included in the Major Tenants table above. |
| (2) | Occupancy cost was calculated using the tenant’s Annual U/W Base Rent plus reimbursements divided by the 2023 sales. |
| (3) | Represents 11 months of sales from February 2022 through December 2022. January 2022 sales information was not available. |
The following table presents certain information relating to the lease rollover schedule at the Lakeland Park Center Property:
Lease Expiration Schedule(1)
Year Ending
December 31, | No. of Leases Expiring | Expiring NRSF | % of
Total
NRSF | Cumulative Expiring NRSF | Cumulative % of Total NRSF | Annual
U/W
Base Rent(2) | % of Total Annual U/W Base Rent | Annual
U/W
Base Rent
PSF(2) |
| MTM/2024 | 0 | 0 | 0.0% | 0 | 0.0% | $0 | 0.0% | $0.00 |
| 2025 | 0 | 0 | 0.0% | 0 | 0.0% | $0 | 0.0% | $0.00 |
| 2026 | 1 | 12,577 | 5.7% | 12,577 | 5.7% | $206,263 | 5.5% | $16.40 |
| 2027 | 3 | 10,508 | 4.8% | 23,085 | 10.5% | $354,554 | 9.5% | $33.74 |
| 2028 | 0 | 0 | 0.0% | 23,085 | 10.5% | $0 | 0.0% | $0.00 |
| 2029 | 2 | 74,469 | 34.0% | 97,554 | 44.5% | $979,887 | 26.2% | $13.16 |
| 2030 | 6 | 102,481 | 46.7% | 200,035 | 91.2% | $1,573,313 | 42.0% | $15.35 |
| 2031 | 1 | 9,990 | 4.6% | 210,025 | 95.8% | $259,640 | 6.9% | $25.99 |
| 2032 | 0 | 0 | 0.0% | 210,025 | 95.8% | $0 | 0.0% | $0.00 |
| 2033 | 1 | 2,015 | 0.9% | 212,040 | 96.7% | $66,269 | 1.8% | $32.89 |
| 2034 | 0 | 0 | 0.0% | 212,040 | 96.7% | $0 | 0.0% | $0.00 |
| Thereafter | 1 | 7,300 | 3.3% | 219,340 | 100.0% | $304,166 | 8.1% | $41.67 |
| Vacant | 0 | 0 | 0.0% | 219,340 | 100.0% | $0 | 0.0% | $0.00 |
| Total/Weighted Average | 15 | 219,340 | 100.0% | | | $3,744,092 | 100.0% | $17.07 |
| (1) | Information obtained from the underwritten rent roll dated August 31, 2024. |
| (2) | The Annual U/W Base Rent and Annual U/W Base Rent PSF include contractual rent steps through November 2025 totaling $221,693. |
The following table presents historical occupancy percentages at the Lakeland Park Center Property:
Historical Occupancy
12/31/2020(1) | 12/31/2021(1) | 12/31/2022(1) | 12/31/2023(2) | 8/31/2024(3) |
| 97.6% | 98.3% | 96.7% | 100.0% | 100.0% |
| (1) | Information obtained from the borrower. |
| (2) | Information obtained from a third party market research provider. |
| (3) | Information obtained from the underwritten rent roll dated August 31, 2024. |
THE INFORMATION IN THIS STRUCTURAL AND COLLATERAL TERM SHEET IS NOT COMPLETE AND MAY BE AMENDED PRIOR TO THE TIME OF SALE. THIS TERM SHEET IS NOT AN OFFER TO SELL THESE SECURITIES AND IT IS NOT A SOLICITATION OF AN OFFER TO BUY THESE SECURITIES IN ANY JURISDICTION WHERE THE OFFER OR SALE IS NOT PERMITTED. |
| | 143 | |
| Retail – Anchored | Loan #12 | Cut-off Date Balance: | | $24,000,000 |
919 Lakeland Park Center Drive Lakeland, FL 33809 | Lakeland Park Center | Cut-off Date LTV: U/W NCF DSCR: U/W NOI Debt Yield: | | 54.9% 1.77x 12.9% |
Underwritten Net Cash Flow. The following table presents certain information relating to the historical operating results and the underwritten net cash flow at the Lakeland Park Center Property:
Cash Flow Analysis
| | 2021 | 2022 | 2023 | Trailing 6-Months Annualized August 2024 | U/W | %(1) | U/W $ per SF |
| Base Rent | $3,225,866 | $3,262,917 | $3,253,204 | $3,570,309 | $3,744,092(2) | 79.8% | $17.07 |
| Grossed Up Vacant Space | 0 | 0 | 0 | 0 | 0 | 0.0 | 0.00 |
| Gross Potential Rent | $3,225,866 | $3,262,917 | $3,253,204 | $3,570,309 | $3,744,092 | 79.8% | $17.07 |
| Other Income | 3,796 | 4,812 | 11,431 | 5,163 | 5,000 | 0.1 | 0.02 |
| Total Recoveries | 747,065 | 776,957 | 813,075 | 690,765 | 941,260 | 20.1 | 4.29 |
| Net Rental Income | $3,976,727 | $4,044,686 | $4,077,710 | $4,266,237 | $4,690,352 | 100.0% | $21.38 |
| (Vacancy & Credit Loss) | 0 | 0 | ($10,462) | 0 | (187,205) | (5.0) | (0.85) |
| Effective Gross Income | $3,976,727 | $4,044,686 | $4,067,248 | $4,266,237 | $4,503,147 | 96.0% | $20.53 |
| | | | | | | | |
| Real Estate Taxes | $276,227 | $269,916 | $303,927 | $309,069 | $430,592 | 9.6% | $1.96 |
| Insurance | 186,652 | 192,481 | 259,863 | 304,595 | 316,328 | 7.0 | 1.44 |
| Management Fee | 244,800 | 243,191 | 231,470 | 187,256 | 135,094 | 3.0 | 0.62 |
| Other Operating Expenses | 324,895 | 525,513 | 512,017 | 346,326 | 526,416 | 11.7 | 2.40 |
| Total Expenses | $1,032,573 | $1,231,101 | $1,307,277 | $1,147,247 | $1,408,429 | 31.3% | $6.42 |
| | | | | | | | |
| Net Operating Income | $2,944,155 | $2,813,585 | $2,759,970(3) | $3,118,990(3) | $3,094,718 | 68.7% | $14.11 |
| Replacement Reserves | 0 | 0 | 0 | 0 | 32,901 | 0.7 | 0.15 |
| TI/LC | 0 | 0 | 0 | 0 | 274,175 | 6.1 | 1.25 |
| Net Cash Flow | $2,944,155 | $2,813,585 | $2,759,970 | $3,118,990 | $2,787,642 | 61.9% | $12.71 |
| | | | | | | | |
| NOI DSCR | 1.87x | 1.79x | 1.75x | 1.98x | 1.96x | | |
| NCF DSCR | 1.87x | 1.79x | 1.75x | 1.98x | 1.77x | | |
| NOI Debt Yield | 12.3% | 11.7% | 11.5% | 13.0% | 12.9% | | |
| NCF Debt Yield | 12.3% | 11.7% | 11.5% | 13.0% | 11.6% | | |
| (1) | All percent revenue fields are divided over net rental income, all percent vacancy fields are divided over gross potential rent and all percent expenses are divided over effective gross income. |
| (2) | The U/W Base Rent PSF and U/W Base Rent include contractual rent steps through November 2025 totaling $221,693. |
| (3) | The increase in Net Operating Income between 2023 and Trailing 6-Months Annualized August 2024 is due to the three new leases totaling 5.1% of NRA and 11.7% of Underwritten Base Rent being executed between March 2023 and September 2023. |
Appraisal. The appraiser concluded to an “As-is” value for the Lakeland Park Center property of $43,700,000. The appraised value is as of August 17, 2024.
Environmental Matters. According to the Phase I environmental site assessment for the Lakeland Park Center Property, dated August 23, 2024, there was no evidence of any recognized environmental conditions.
Market Overview and Competition. The Lakeland Park Center is located in Lakeland, Florida, between Interstate 4, which has a daily traffic count of approximately 56,000 vehicles per day, and US Highway 98, which has a daily traffic count of approximately 62,000 vehicles per day. According to the appraisal, the largest employment sectors in Lakeland are trade, transportation and utilities (27.5% of the regional workforce), professional and business services (14.5%) and education and health services (14.4%). The largest employers include Publix, Lakeland Regional Health, GEICO, Amazon Air Hub & Distribution, and Watson Clinic. The population growth in the Lakeland CBSA outpaced national population growth, averaging 2.3% annually from 2013 through 2023. According to the appraisal, the estimated 2023 population within a 1-, 3- and 5- mile radius of the property was 10,540, 59,321, and 142,869, respectively, and the 2023 average household income within the same radii was $60,116, $64,120, and $67,345, respectively.
According to a third party market research report, the property is located within the Polk County retail submarket of the Lakeland-FL retail market. The submarket reports a total inventory of approximately 33.9 million square feet with a 3.9% vacancy rate and average market rents of $19.36 per square foot. The appraiser concluded to market rents for the Lakeland Park Center Property, ranging from $12.00 per square foot for Anchor space to $40.00 per square foot for the Millers Ale House OP space.
THE INFORMATION IN THIS STRUCTURAL AND COLLATERAL TERM SHEET IS NOT COMPLETE AND MAY BE AMENDED PRIOR TO THE TIME OF SALE. THIS TERM SHEET IS NOT AN OFFER TO SELL THESE SECURITIES AND IT IS NOT A SOLICITATION OF AN OFFER TO BUY THESE SECURITIES IN ANY JURISDICTION WHERE THE OFFER OR SALE IS NOT PERMITTED. |
| | 144 | |
| Retail – Anchored | Loan #12 | Cut-off Date Balance: | | $24,000,000 |
919 Lakeland Park Center Drive Lakeland, FL 33809 | Lakeland Park Center | Cut-off Date LTV: U/W NCF DSCR: U/W NOI Debt Yield: | | 54.9% 1.77x 12.9% |
The following table presents certain information relating to the appraiser’s market rent conclusions for the Lakeland Park Center Property:
Market Rent Summary(1)
| | Anchor | Jr. Anchor-Ross | Premium/Smaller Jr. Anchor | Inline Shops | Majors | Millers Ale House OP |
| Market Rent (PSF) | $12.00 | $12.00 | $16.00 | $32.50 | $24.00 | $40.00 |
| Lease Term (Years) | 10 | 10 | 10 | 7 | 5 | 10 |
| Lease Type | Net | Net | Net | Net | Net | Net |
| Rent Increase Projection | 2.0%/Year | 2.0%/Year | 2.0%/Year | 3.0%/Year | 2.5%/Year | 2.0%/Year |
| (1) | Information obtained from the appraisal. |
The table below presents certain information relating to comparable sales pertaining to the Lakeland Park Center Property identified by the appraiser:
Comparable Sales(1)
| Property Name | Location | Year Built/Renovated | Rentable Area (SF) | Occupancy | Sale Date | Sale Price | Sale Price (PSF) |
Lakeland Park Center Property 919 Lakeland Park Center Drive | Lakeland, FL | 2014 / NAP | 219,340(2) | 100.0%(2) | | | |
Marketplace at Seminole Towne Center 1301-2251 WP Ball Boulevard | Sanford, FL | 2005 / NAP | 318,649 | 96.0% | Mar-2024 | $68,700,000 | $215.60 |
Berkshire Oaks 4465 Southwest 40th Avenue | Ocala, FL | 2008 / NAP | 244,550 | 98.0% | Feb-2024 | $31,750,000 | $129.83 |
Shops at Tyrone Square 6665 22nd Avenue North | St. Petersburg, FL | 2018 / NAP | 125,731 | 100.0% | Sep-2023 | $37,800,000 | $300.64 |
Cypress Creek Town Center 25557 Sierra Center Boulevard | Lutz, FL | 2019 / NAP | 240,211 | 100.0% | Jul-2023 | $49,600,000 | $206.49 |
Lakeside Village 1479 Town Center Drive | Lakeland, FL | 2005 / NAP | 454,872 | 91.0% | Jun-2023 | $78,000,100 | $171.48 |
Orlando Square 1700 West Sand Lake Road | Orlando, FL | 2004 / NAP | 183,877 | 85.0% | Jun-2023 | $25,100,000 | $136.50 |
| (1) | Information obtained from the appraisal. |
| (2) | Information obtained from the underwritten rent roll dated August 31, 2024. |
THE INFORMATION IN THIS STRUCTURAL AND COLLATERAL TERM SHEET IS NOT COMPLETE AND MAY BE AMENDED PRIOR TO THE TIME OF SALE. THIS TERM SHEET IS NOT AN OFFER TO SELL THESE SECURITIES AND IT IS NOT A SOLICITATION OF AN OFFER TO BUY THESE SECURITIES IN ANY JURISDICTION WHERE THE OFFER OR SALE IS NOT PERMITTED. |
| | 145 | |
| No. 13 – International Plaza II |
| |
| Mortgage Loan Information | | Mortgaged Property Information |
| Mortgage Loan Seller: | JPMorgan Chase Bank, National Association | | Single Asset/Portfolio: | Single Asset |
Credit Assessment (Fitch/KBRA/Moody’s): | NR/NR/NR | | Property Type – Subtype: | Office – CBD |
| Original Principal Balance(1): | $21,995,000 | | Location: | Dallas, TX |
| Cut-off Date Balance(1): | $21,995,000 | | Size: | 388,430 SF |
| % of Initial Pool Balance: | 3.1% | | Cut-off Date Balance Per SF(1): | $201.65 |
| Loan Purpose: | Acquisition | | Maturity Date Balance Per SF(1): | $201.65 |
| Borrower Sponsor: | Shorenstein Investment Advisors | | Year Built/Renovated: | 2000 / 2020 |
| Guarantors: | Shorenstein Realty Investors Fourteen-A, L.P., Shorenstein Realty Investors Fourteen-B, L.P. and Shorenstein Realty Investors Fourteen-C, L.P. | | Title Vesting: | Fee |
| Mortgage Rate: | 7.4300% | | Property Manager: | Shorenstein Realty Services L.P. |
| Note Date: | September 13, 2024 | | Current Occupancy (As of)(2): | 93.5% (8/2/2024) |
| Seasoning: | 1 month | | YE 2023 Occupancy(2): | 84.7% |
| Maturity Date: | October 1, 2029 | | YE 2022 Occupancy(2): | 67.8% |
| IO Period: | 60 months | | YE 2021 Occupancy(2): | 40.0% |
| Loan Term (Original): | 60 months | | As-Is Appraised Value: | $124,200,000 |
| Amortization Term (Original): | NAP | | As-Is Appraised Value Per SF: | $319.75 |
| Loan Amortization Type: | Interest Only | | As-Is Appraisal Valuation Date: | August 19, 2024 |
| Call Protection: | L(24),YM1(30),O(6) | | | |
| Lockbox Type: | Hard/Springing Cash Management | | |
| Additional Debt(1): | Yes | | Underwriting and Financial Information |
| Additional Debt Type (Balance)(1): | Pari Passu ($56,330,000) | | TTM NOI (6/30/2024)(2): | $8,904,501 |
| | | | YE 2023 NOI(2): | $6,373,807 |
| | | | YE 2022 NOI(2): | $5,777,003 |
| | | | YE 2021 NOI(2): | ($571,647) |
| | | | U/W Revenues: | $18,664,795 |
| Escrows and Reserves | | U/W Expenses: | $7,725,641 |
| | Initial | Monthly | Cap | | U/W NOI(2): | $10,939,154 |
| Taxes: | $1,750,081 | $171,577 | NAP | | U/W NCF: | $10,473,038 |
| Insurance: | $0 | Springing | NAP | | U/W DSCR based on NOI/NCF(1): | 1.85x / 1.77x |
| Replacement Reserve: | $8,092 | $8,092 | $291,322 | | U/W Debt Yield based on NOI/NCF(1): | 14.0% / 13.4% |
| TI/LC Reserve: | $16,185 | $16,185 | $582,645 | | U/W Debt Yield at Maturity based on NOI/NCF(1): | 14.0% / 13.4% |
| Free Rent Reserve: | $1,714,536 | $0 | NAP | | Cut-off Date LTV Ratio(1): | 63.1% |
| Outstanding TI Reserve | $480,748 | $0 | NAP | | LTV Ratio at Maturity(1): | 63.1% |
| | | | | | | | |
| Sources and Uses |
| Sources | | | | | Uses | | | |
| Whole Loan Amount | $78,325,000 | | 62.1 | % | | Purchase Price(3) | $120,500,000 | | 95.5 | % |
| Cash Equity Contribution(3) | 47,901,898 | | 37.9 | | | Reserves | 3,969,642 | | 3.1 | |
| | | | | | Closing Costs | 1,757,256 | | 1.4 | |
| Total Sources | $126,226,898 | | 100.0 | % | | Total Uses | $126,226,898 | | 100.0 | % |
| (1) | The International Plaza II Mortgage Loan (as defined below) is part of the International Plaza II Whole Loan (as defined below), which is evidenced by three pari passu promissory notes with an aggregate principal balance as of the Cut-off Date of $78,325,000. The Cut-off Date Balance Per SF, Maturity Date Balance Per SF, U/W DSCR based on NOI/NCF, U/W Debt Yield based on NOI/NCF, U/W Debt Yield at Maturity based on NOI/NCF, Cut-off Date LTV Ratio and LTV Ratio at Maturity presented above are based on the International Plaza II Whole Loan. |
| (2) | The increase from YE 2021 NOI and YE 2021 Occupancy through U/W NOI and Current Occupancy is primarily attributable to disruption related to a renovation and subsequent lease up thereafter. |
| (3) | Purchase Price and Cash Equity Contribution are inclusive of certain prorations and seller credits for outstanding obligations, accrued expenses and prepaid rents. |
The Mortgage Loan. The thirteenth largest mortgage loan (the “International Plaza II Mortgage Loan”) is part of a whole loan evidenced by three pari passu promissory notes in the aggregate original principal amount of $78,325,000 (the “International Plaza II Whole Loan”). The International Plaza II Whole Loan was co-originated by JPMorgan Chase Bank, National Association and Goldman Sachs Bank USA, which has since transferred its note to an affiliate, Goldman Sachs Mortgage Company (“GSMC”) on September 13,
THE INFORMATION IN THIS STRUCTURAL AND COLLATERAL TERM SHEET IS NOT COMPLETE AND MAY BE AMENDED PRIOR TO THE TIME OF SALE. THIS TERM SHEET IS NOT AN OFFER TO SELL THESE SECURITIES AND IT IS NOT A SOLICITATION OF AN OFFER TO BUY THESE SECURITIES IN ANY JURISDICTION WHERE THE OFFER OR SALE IS NOT PERMITTED. |
| | 146 | |
| Office – CBD | Loan #13 | Cut-off Date Balance: | | $21,995,000 |
| 14221 North Dallas Parkway | International Plaza II | Cut-off Date LTV: | | 63.1% |
| Dallas, TX 75254 | U/W NCF DSCR: | | 1.77x |
| | | U/W NOI Debt Yield: | | 14.0% |
2024. The International Plaza II Whole Loan is secured by a first priority fee mortgage encumbering a 388,430 SF Class A office property located in Dallas, Texas (the “International Plaza II Property”).
The International Plaza II Mortgage Loan is evidenced by the non-controlling Note A-2 with an original principal amount of $21,995,000. The remaining promissory notes comprising the International Plaza II Whole Loan are summarized in the below table. The International Plaza II Whole Loan is serviced pursuant to the pooling and servicing agreement for the BANK5 2024-5YR10 securitization trust. See “Description of the Mortgage Pool—The Whole Loans—The Non-Serviced Pari Passu Whole Loans” in the prospectus.
Whole Loan Note Summary
| Notes | Original Balance | Cut-off Date Balance | Note Holder | Controlling Piece |
| A-1 | $25,000,000 | $25,000,000 | BANK5 2024-5YR10 | Yes |
| A-2 | $21,995,000 | $21,995,000 | WFCM 2024-5C2 | No |
| A-3(1) | $31,330,000 | $31,330,000 | GSMC | No |
| Total | $78,325,000 | $78,325,000 | | |
| (1) | Expected to be contributed to one or more future securitization trusts. |
The Borrowers and the Borrower Sponsor. The borrowers are IP2 Owner, L.P. and IP2 TRS, L.P., each a Delaware limited partnership and single purpose entity with one independent director. The borrower sponsor is Shorenstein Investment Advisors and the non-recourse carveout guarantors are Shorenstein Realty Investors Fourteen-A, L.P., Shorenstein Realty Investors Fourteen-B, L.P. and Shorenstein Realty Investors Fourteen-C, L.P.
Shorenstein Investment Advisors is a fully integrated real estate investment company founded in 1992 and headquartered in San Francisco, California. As of year-end 2023, Shorenstein Investment Advisors had acquired approximately $19.0 billion worth of real estate assets and managed approximately 14.5 million square feet of space. Shorenstein Investment Advisors portfolio spans across the United States with properties located in California, New York, Pennsylvania, Oregon and Texas, among other states. Shorenstein Investment Advisors portfolio includes 40 properties (approximately 16.0 million square feet) which are LEED certified and 66 properties (approximately 21.3 million square feet) which are energy star benchmarked.
The Property. The International Plaza II Property is a 388,430 square foot, 15 story, Class A office building located in Dallas, Texas. Built in 2000, the International Plaza II Property represents one of three towers that comprise International Plaza, an approximately 1.1 million square foot office park. The International Plaza is considered Cawley Partners’ signature development and among the best Class A buildings available in the lower Tollway. Amenities at the International Plaza II Property include a lobby area, café and executive conference center on the first floor, a fitness center on the second floor and a food hall as well as a collaboration lounge and game area on the third floor. The International Plaza II Property sits in an amenity rich environment, with over 32 hotels, over 200 restaurants and over 300 retail stores within one mile of the International Plaza II Property. Moreover, the International Plaza II Property sits approximately 13 miles away from Frisco, approximately 13 miles away from the Dallas central business district, approximately 3 miles away from the Addison Airport, approximately 9 miles away from the Dallas Love Field Airport and approximately 16 miles away from the Dallas Fort Worth International Airport.
Prior to vacating in 2018, J.P. Morgan occupied both the International Plaza II Property and the adjacent building, International Plaza I. Taconic Investments, the prior owner, purchased both properties in April of 2018, invested in renovations and subsequently leased up the International Plaza II Property to 93.5% occupied by six different tenants as of August 2, 2024. Since the prior owner acquired the International Plaza II Property in 2018, both the International Plaza II Property and International Plaza I have undergone an approximately $23.3 million renovation. The renovation included functional improvements such as upgrades to the security system as well as the implementation of new amenities such as a new fitness center, conference center, café and coffee bar. Concurrently with this renovation, the Lake House Pavilion, a 68,760 SF outdoor collaboration environment for the office tower users, was developed. The Lake House Pavilion features a coffee bar, indoor and outdoor seating and meeting/huddle space, all connected to a large water feature that acts as a buffer and sets the campus apart from Dallas Parkway. The International Plaza II Property also has a parking ratio of 4.5 spaces per 1,000 SF.
As of August 2, 2024, the International Plaza II Property was 93.5% leased to six tenants with a weighted average lease term of approximately 13.39 years. Additionally, there are no tenants that roll during the term of the International Plaza II Mortgage Loan and only one tenant, Forvis, LLP, with a termination option, available in 2032. The largest tenant by SF at the International Plaza II Property, Trinity Industries, Inc. (“Trinity Industries”), signed a 16 year lease at the International Plaza II Property in February of 2021 and utilizes the space as its company headquarters. Additionally, all tenant leases were executed post COVID-19 pandemic, beginning in February of 2021. Several tenants have also invested additional capital expenditures towards the build out of their space, with Interstate Batteries, Inc. contributing approximately $5 million, IMA Financial Group, Inc. contributing approximately $1.2 million, Freeman Holdings, LLC contributing approximately $4.0 million and Forvis, LLP contributing approximately $1.8 million.
Major Tenants.
Trinity Industries, Inc. (155,200 square feet, 40.0% of net rentable area, 41.7% of underwritten rent). Trinity Industries has been providing railcar products and services across North America for over 85 years. Trinity Industries has a unique platform that is able to provide a single source for rail transportation solutions that help in the optimization of usage of railcar equipment and enhances the value-proposition of the rail modal supply chain for its customers. Trinity Industries operates their rail-related products and services under the name TrinityRail. Trinity Industries is a top five railcar leasing company and has approximately 109,365 railcars under
THE INFORMATION IN THIS STRUCTURAL AND COLLATERAL TERM SHEET IS NOT COMPLETE AND MAY BE AMENDED PRIOR TO THE TIME OF SALE. THIS TERM SHEET IS NOT AN OFFER TO SELL THESE SECURITIES AND IT IS NOT A SOLICITATION OF AN OFFER TO BUY THESE SECURITIES IN ANY JURISDICTION WHERE THE OFFER OR SALE IS NOT PERMITTED. |
| | 147 | |
| Office – CBD | Loan #13 | Cut-off Date Balance: | | $21,995,000 |
| 14221 North Dallas Parkway | International Plaza II | Cut-off Date LTV: | | 63.1% |
| Dallas, TX 75254 | U/W NCF DSCR: | | 1.77x |
| | | U/W NOI Debt Yield: | | 14.0% |
ownership with an additional 34,305 railcars owned by investors. Moreover, Trinity Industries is a leading railcar manufacturer, with 37% of industry deliveries in 2023. As of the second quarter of 2024, Trinity Industries generated approximately $841 million in revenue, representing a 16.0% increase year over year. Similarly, as of June 30, 2024, Trinity Industries had liquidity of approximately $985 million. At the International Plaza II Property, Trinity Industries has a lease expiration in January 2037, with two, five year extension options and no termination options.
Interstate Batteries, Inc. (77,435 square feet, 19.9% of net rentable area, 20.8% of underwritten rent). Founded in 1952, Interstate Batteries, Inc. (“Interstate Batteries”) is a privately owned corporation that focuses on providing reliable and innovative battery solutions to a wide array of battery needs, including cars, trucks, golf carts and industrial machinery. Interstate Batteries has been the technician’s choice nine years and is powered by a distribution network of 300 wholesale warehouses, which is supported by over 150,000 dealers around the world as well as 200 franchise stores. Since inception, Interstate Batteries has sold over 500 million batteries, including 19 million in 2021. Interstate Batteries has a lease expiration in June 30, 2033, with two, five year extension options and no termination options.
Freeman Holding, LLC (65,684 square feet, 16.9% of net rentable area, 18.5% of underwritten rent). Freeman Holding, LLC (“Freeman Holding”) is a global event solutions company that has offices in 90 locations throughout the U.S. and Canada, and is headquartered in Dallas, Texas. Freeman Holding focuses on creating and delivering innovative brand experiences and event services backed by a 100-year track record of success and reliability. Specifically, Freeman Holding focuses on event production, audiovisual solutions, exhibit designs, event technology and logistics management. Annually, Freeman Holding produces nearly 4,000 expositions and over 10,000 other events. Freeman Holding has a lease expiration in October 31, 2035, with two, five year extension options and no termination options.
The following table presents certain information relating to the tenancy at the International Plaza II Property:
Major Tenants(1)
| Tenant Name | Credit Rating (Moody’s/ Fitch/
S&P) | Tenant NRSF | % of
NRSF | Annual U/W Gross Rent PSF | Annual
U/W Gross Rent | % of Total Annual U/W Gross Rent | Lease
Expiration
Date | Extension Options | Termination Option (Y/N) |
| Major Tenants | | | | | | | | | |
| Trinity Industries, Inc. | Ba2/BB/BB+ | 155,200 | 40.0% | $30.47 | $4,728,944 | 41.7% | 1/31/2037 | 2 x 5yr | N |
| Interstate Batteries, Inc. | NR/NR/NR | 77,435 | 19.9% | $30.50 | $2,361,768 | 20.8% | 6/30/2033 | 2 x 5yr | N |
| Freeman Holding, LLC | NR/NR/NR | 65,684 | 16.9% | $32.00 | $2,101,888 | 18.5% | 10/31/2035 | 2 x 5yr | N |
| Forvis, LLP(2) | NR/NR/NR | 30,650 | 7.9% | $35.00 | $1,072,750 | 9.5% | 1/31/2035 | 2 x 5yr | Y |
| IMA Financial Group, Inc. | NR/NR/NR | 30,650 | 7.9% | $31.00 | $950,150 | 8.4% | 6/30/2033 | 1 x 5yr | N |
| VisionPoint Advisory Group(3) | NR/NR/NR | 3,397 | 0.9% | $40.00 | $135,880 | 1.2% | 1/31/2032 | 1 x 5yr | N |
| Total Major Tenants | | 363,016 | 93.5% | $31.27 | $11,351,380 | 100.0% | | | |
| | | | | | | | | | |
| Vacant Space | | 25,414 | 6.5% | | | | | | |
| | | | | | | | | | |
| Collateral Total | | 388,430 | 100.0% | | | | | | |
| | | | | | | | | | |
| (1) | Based on the underwritten rent roll dated August 2, 2024 and is inclusive of contractual rent steps through August 1, 2025. |
| (2) | Forvis, LLP has (a) a one-time right to terminate its lease in January 2032 with written notice by no later than January 2031 and the payment of a termination fee equal to the sum of three full calendar months of gross rent at the rate payable immediately following the termination effective date, and (b) benefits from four months of free rent upon its lease commencement in October 2024. |
| (3) | VisionPoint Advisory Group benefits from six months of free rent through January 2025. |
THE INFORMATION IN THIS STRUCTURAL AND COLLATERAL TERM SHEET IS NOT COMPLETE AND MAY BE AMENDED PRIOR TO THE TIME OF SALE. THIS TERM SHEET IS NOT AN OFFER TO SELL THESE SECURITIES AND IT IS NOT A SOLICITATION OF AN OFFER TO BUY THESE SECURITIES IN ANY JURISDICTION WHERE THE OFFER OR SALE IS NOT PERMITTED. |
| | 148 | |
| Office – CBD | Loan #13 | Cut-off Date Balance: | | $21,995,000 |
| 14221 North Dallas Parkway | International Plaza II | Cut-off Date LTV: | | 63.1% |
| Dallas, TX 75254 | U/W NCF DSCR: | | 1.77x |
| | | U/W NOI Debt Yield: | | 14.0% |
The following table presents certain information relating to the lease rollover schedule at the International Plaza II Property:
Lease Expiration Schedule(1)(2)
Year Ending
December 31, | No. of Leases Expiring | Expiring NRSF | % of Total NRSF | Cumulative Expiring NRSF | Cumulative % of Total NRSF | Annual
U/W
Base Rent | % of Total Annual U/W Base Rent | Annual
U/W
Base Rent
PSF |
| MTM | 0 | 0 | 0.0% | 0 | 0.0% | $0 | 0.0% | $0.00 |
| 2024 | 0 | 0 | 0.0% | 0 | 0.0% | $0 | 0.0% | $0.00 |
| 2025 | 0 | 0 | 0.0% | 0 | 0.0% | $0 | 0.0% | $0.00 |
| 2026 | 0 | 0 | 0.0% | 0 | 0.0% | $0 | 0.0% | $0.00 |
| 2027 | 0 | 0 | 0.0% | 0 | 0.0% | $0 | 0.0% | $0.00 |
| 2028 | 0 | 0 | 0.0% | 0 | 0.0% | $0 | 0.0% | $0.00 |
| 2029 | 0 | 0 | 0.0% | 0 | 0.0% | $0 | 0.0% | $0.00 |
| 2030 | 0 | 0 | 0.0% | 0 | 0.0% | $0 | 0.0% | $0.00 |
| 2031 | 0 | 0 | 0.0% | 0 | 0.0% | $0 | 0.0% | $0.00 |
| 2032 | 1 | 3,397 | 0.9% | 3,397 | 0.9% | $135,880 | 1.2% | $40.00 |
| 2033 | 2 | 108,085 | 27.8% | 111,482 | 28.7% | $3,311,918 | 29.2% | $30.64 |
| 2034 | 0 | 0 | 0.0% | 111,482 | 28.7% | $0 | 0.0% | $0.00 |
| 2035 & Beyond | 3 | 251,534 | 64.8% | 363,016 | 93.5% | $7,903,582 | 69.6% | $31.42 |
| Vacant | 0 | 25,414 | 6.5% | 388,430 | 100.0% | $0 | 0.0% | $0.00 |
| Total/Weighted Average(3) | 6 | 388,430 | 100.0% | | | $11,351,380 | 100.0% | $31.27 |
| (1) | Based on the underwritten rent roll dated August 2, 2024 and is inclusive of contractual rent steps through August 1, 2025. |
| (2) | Certain tenants may have lease termination options that are exercisable prior to the originally stated expiration date of the subject lease and that are not considered in the Lease Expiration Schedule. |
| (3) | Total/Weighted Average Annual U/W Base Rent PSF excludes vacant space. |
The following table presents historical occupancy percentages at the International Plaza II Property:
Historical Occupancy
12/31/2021(1) | 12/31/2022(1) | 12/31/2023(1) | 8/2/2024(1)(2) |
| 40.0% | 67.8% | 84.7% | 93.5% |
| (1) | The increase in historical occupancy is primarily attributable to disruption related to a renovation and subsequent lease up thereafter. |
| (2) | Based on the underwritten rent roll dated August 2, 2024. |
THE INFORMATION IN THIS STRUCTURAL AND COLLATERAL TERM SHEET IS NOT COMPLETE AND MAY BE AMENDED PRIOR TO THE TIME OF SALE. THIS TERM SHEET IS NOT AN OFFER TO SELL THESE SECURITIES AND IT IS NOT A SOLICITATION OF AN OFFER TO BUY THESE SECURITIES IN ANY JURISDICTION WHERE THE OFFER OR SALE IS NOT PERMITTED. |
| | 149 | |
| Office – CBD | Loan #13 | Cut-off Date Balance: | | $21,995,000 |
| 14221 North Dallas Parkway | International Plaza II | Cut-off Date LTV: | | 63.1% |
| Dallas, TX 75254 | U/W NCF DSCR: | | 1.77x |
| | | U/W NOI Debt Yield: | | 14.0% |
Underwritten Net Cash Flow. The following table presents certain information relating to the underwritten net cash flow at the International Plaza II Property:
Cash Flow Analysis
| | 2021(1) | 2022(1) | 2023(1) | TTM
6/30/2024(1) | U/W(1)(2) | %(3) | U/W $
per SF |
| Rents in Place | $3,468,930 | $7,162,999 | $8,690,902 | $9,860,383 | $11,351,380 | 57.7% | $29.22 |
| Gross-Up Vacant Rent | 0 | 0 | 0 | 0 | 1,030,520 | 5.2 | 2.65 |
| Gross Potential Rent | $3,468,930 | $7,162,999 | $8,690,902 | $9,860,383 | $12,381,900 | 62.9% | 31.88 |
| Total Reimbursements | 2,044,490 | 3,586,476 | 5,267,521 | 6,591,033 | 7,305,777 | 37.1 | 18.81 |
| Gross Potential Income | $5,513,420 | $10,749,475 | $13,958,423 | $16,451,416 | $19,687,677 | 100.0% | 50.69 |
| Parking/Other Rental | 22,494 | 14,997 | 19,220 | 19,740 | 7,638 | 0.0 | 0.02 |
| Less Vacancy & Credit Loss | 0 | 0 | 0 | 0 | (1,030,520) | (5.2) | (2.65) |
| Effective Gross Income | $5,535,914 | $10,764,472 | $13,977,644 | $16,471,156 | $18,664,795 | 94.8% | 48.05 |
| | | | | | | | |
| Real Estate Taxes | 1,751,260 | 1,254,312 | 2,251,747 | 1,949,866 | 2,058,918 | 11.0 | 5.30 |
| Insurance | 162,004 | 153,621 | 139,182 | 223,359 | 175,000 | 0.9 | 0.45 |
| Management Fee | 30,000 | 80,522 | 497,519 | 461,652 | 559,944 | 3.0 | 1.44 |
| Other Operating Expenses | 4,164,297 | 3,499,014 | 4,715,389 | 4,931,778 | 4,931,778 | 26.4 | 12.70 |
| Total Expenses | $6,107,561 | $4,987,469 | $7,603,837 | $7,566,655 | $7,725,641 | 41.4% | 19.89 |
| | | | | | | | |
| Net Operating Income | ($571,647) | $5,777,003 | $6,373,807 | $8,904,501 | $10,939,154 | 58.6% | 28.16 |
| Replacement Reserves | 0 | 0 | 0 | 0 | 77,686 | 0.4 | 0.20 |
| TI/LC | 0 | 0 | 0 | 0 | 388,430 | 2.1 | 1.00 |
| Net Cash Flow | ($571,647) | $5,777,003 | $6,373,807 | $8,904,501 | $10,473,038 | 56.1% | $26.96 |
| | | | | | | | |
| NOI DSCR(4) | (0.10x) | 0.98x | 1.08x | 1.51x | 1.85x | | |
| NCF DSCR(4) | (0.10x) | 0.98x | 1.08x | 1.51x | 1.77x | | |
| NOI Debt Yield(4) | (0.7%) | 7.4% | 8.1% | 11.4% | 14.0% | | |
| NCF Debt Yield(4) | (0.7%) | 7.4% | 8.1% | 11.4% | 13.4% | | |
| (1) | The increase in Net Operating Income occupancy is primarily attributable to disruption related to a renovation and subsequent lease up thereafter. |
| (2) | Based on the underwritten rent roll dated August 2, 2024 and is inclusive of contractual rent steps through August 1, 2025. |
| (3) | Represents (i) percent of Gross Potential Income for all revenue fields, (ii) percent of Gross Potential Income for Vacancy & Credit Loss and (iii) percent of Effective Gross Income for all other fields. |
| (4) | DSCR and Debt Yields are based on the International Plaza II Whole Loan. |
Appraisal. The appraisal concluded to an “as-is” value for the International Plaza II Property of $124,200,000 as of August 19, 2024.
Environmental Matters. According to the Phase I environmental site assessment dated July 10, 2024, there was no evidence of any recognized environmental conditions at the International Plaza II Property.
Market Overview and Competition. The International Plaza II Property is located in Dallas, Texas and within the Dallas-Plano-Irving Statistical Area (“Dallas MSA”). According to the appraisal, the Dallas MSA is projected to outperform the national region metros in six of eight performance categories over the next five years, including in gross metro product, total unemployment, unemployment rate, personal income growth, population and multifamily permits. The three largest represented industries within the broader Dallas-Fort Worth-Arlington Statistical Area (“Dallas TX MSA”) are the services industry, finance/insurance/real estate industry and the retail trade industry, which combined, account for an approximately 74.9% of the labor force. Furthermore, the largest employers within the Dallas MSA include Walmart Inc., UT Southwestern Medical Center, Baylor Scott & White Health, Lockheed Martin and AT&T. Driven by a lower cost of doing business as well as a well-developed transportation network, numerous large employers have either relocated to or expanded in Dallas, including Toyota, AT&T, Texas Instruments, defense manufacturers, airlines, major banks and others. Consequently, the appraisal also notes that there has also been a significant influx of young professionals, and the presence of a highly educated workforce has further attracted more business relocations. Over the longer term, above-average population growth and the concentration of corporate headquarters, technology businesses and financial services will contribute to an above-average performance. The appraisal notes that the International Plaza II Property is in proximity of Interstate Highway 35E, which provides for easy access to most parts of the Dallas MSA.
THE INFORMATION IN THIS STRUCTURAL AND COLLATERAL TERM SHEET IS NOT COMPLETE AND MAY BE AMENDED PRIOR TO THE TIME OF SALE. THIS TERM SHEET IS NOT AN OFFER TO SELL THESE SECURITIES AND IT IS NOT A SOLICITATION OF AN OFFER TO BUY THESE SECURITIES IN ANY JURISDICTION WHERE THE OFFER OR SALE IS NOT PERMITTED. |
| | 150 | |
| Office – CBD | Loan #13 | Cut-off Date Balance: | | $21,995,000 |
| 14221 North Dallas Parkway | International Plaza II | Cut-off Date LTV: | | 63.1% |
| Dallas, TX 75254 | U/W NCF DSCR: | | 1.77x |
| | | U/W NOI Debt Yield: | | 14.0% |
In addition, the International Plaza II Property is about a twenty minute drive away from the Dallas Fort Worth International Airport and is also proximate to a large concentration of commercial activity. The International Plaza II Property is further located within the Quorum/Bent Tree submarket. According to the appraisal, as of the second quarter of 2024, the Quorum/Bent Tree office submarket had 25,722,114 SF of inventory, an occupancy rate of 78.6% and asking rent of $28.19 PSF. As of the second quarter of 2024, the broader Dallas TX MSA office market had 426,391,121 SF of inventory, an occupancy rate of 81.9% and asking rent of $30.38 PSF. Moreover, absorption for the last 12 months was flat for both the overall market area and at the submarket level and the overall market area and submarket have been stable with respect to occupancy over the past year.
According to the appraisal, the 2024 population and average household income within a one-, three- and five-mile radius of the International Plaza II Property was 24,075, 125,307, 380,647 and $88,399, $131,800, and $128,322, respectively. Between 2010 and 2024, the population within a one-, three- and five-mile radius increased by approximately 31.8%, 14.3% and 8.6%, respectively.
The following table presents certain information relating to the appraiser’s market rent conclusions for the International Plaza II Property:
Market Rent Summary
| | Office |
| Market Rent (PSF) | $32.00 |
| Lease Term (Months) | 125 |
| Lease Type | NNN |
| Escalations | 2.0%/Year |
| Tenant Improvements (New/Renewal) | $40/$10 |
| Leasing Commissions (New/Renewal) | 4.5%/2.5% |
| Free Rent (Months) | 5 |
The following table summarizes the comparable office leases in the surrounding market:
Comparable Office Leases
| Property | Year Built/Renovated | Tenant Name | Lease Start Date | Term (Months) | Lease Type | Tenant Size (SF) | Base Rent PSF |
International Plaza II(1) Dallas, TX | 2000/2020 | Trinity Industries | Feb-21 | 192 | Net | 155,200 | $30.47 |
Tower 909 Irving, TX | 1988 / 2013 | Schachter Harris LLP | Jan-23 | 33 | NNN | 2,987 | $23.00 |
International Plaza III Dallas, TX | 2001 / 2020 | Ryan Companies | Dec-24 | 65 | NNN | 12,501 | $33.00 |
Legacy Place 1 Plano, TX | 1998 / NAP | RXO Capacity Solutions | Jun-23 | 63 | NNN | 13,496 | $30.88 |
Colonnade Three Addison, TX | 1998 / 2020 | Hilton Worldwide | Jan-25 | 60 | NNN | 51,126 | $29.00 |
Millenium Tower Addison, TX | 1999 / NAP | Undisclosed | Apr-24 | 60 | NNN | 2,387 | $28.00 |
| (1) | Information is based on the underwritten rent roll dated August 2, 2024. |
THE INFORMATION IN THIS STRUCTURAL AND COLLATERAL TERM SHEET IS NOT COMPLETE AND MAY BE AMENDED PRIOR TO THE TIME OF SALE. THIS TERM SHEET IS NOT AN OFFER TO SELL THESE SECURITIES AND IT IS NOT A SOLICITATION OF AN OFFER TO BUY THESE SECURITIES IN ANY JURISDICTION WHERE THE OFFER OR SALE IS NOT PERMITTED. |
| | 151 | |
| No. 14 – Eaton Innovation Center |
| |
| Mortgage Loan Information | | Mortgaged Property Information |
| Mortgage Loan Seller: | Goldman Sachs Mortgage Company | | Single Asset/Portfolio: | Single Asset |
Credit Assessment (Fitch/KBRA/Moody’s): | NR/NR/NR | | Property Type – Subtype: | Office – R&D |
| Original Principal Balance: | $20,475,000 | | Location: | Southfield, MI |
| Cut-off Date Balance: | $20,475,000 | | Size: | 217,618 SF |
| % of Initial Pool Balance: | 2.8% | | Cut-off Date Balance Per SF: | $94.09 |
| Loan Purpose: | Recapitalization | | Maturity Date Balance Per SF: | $94.09 |
| Borrower Sponsor: | New Mountain Net Lease Partners II Corporation | | Year Built/Renovated: | 1960/NAP |
| Guarantor: | New Mountain Net Lease Partners II Corporation | | Title Vesting: | Fee |
| Mortgage Rate: | 5.2040% | | Property Manager: | Self-Managed |
| Note Date: | October 17, 2024 | | Current Occupancy (As of): | 100.0% (11/1/2024) |
| Seasoning: | 0 months | | YE 2023 Occupancy(1): | NAV |
| Maturity Date: | November 6, 2029 | | YE 2022 Occupancy(1): | NAV |
| IO Period: | 60 months | | YE 2021 Occupancy(1): | NAV |
| Loan Term (Original): | 60 months | | YE 2020 Occupancy(1): | NAV |
| Amortization Term (Original): | NAP | | As-Is Appraised Value: | $31,500,000 |
| Loan Amortization Type: | Interest Only | | As-Is Appraised Value Per SF: | $144.75 |
| Call Protection: | L(23),YM1(1),DorYM1(31),O(5) | | As-Is Appraisal Valuation Date: | June 20, 2024 |
| Lockbox Type: | Hard/Springing Cash Management | | Underwriting and Financial Information |
| Additional Debt: | No | | YE 2023 NOI(1): | NAV |
| Additional Debt Type (Balance): | NAP | | YE 2022 NOI(1): | NAV |
| | | | YE 2021 NOI(1): | NAV |
| | | | U/W Revenues: | $2,847,871 |
| | | | U/W Expenses: | $569,574 |
| | | | U/W NOI: | $2,278,297 |
| Escrows and Reserves | | U/W NCF: | $2,245,654 |
| | Initial | Monthly | Cap | | U/W DSCR based on NOI/NCF: | 2.11x / 2.08x |
| Taxes: | $0 | Springing | NAP | | U/W Debt Yield based on NOI/NCF: | 11.1% / 11.0% |
| Insurance: | $0 | Springing | NAP | | U/W Debt Yield at Maturity based on NOI/NCF: | 11.1% / 11.0% |
| TI/LC Reserve | $0 | Springing | $326,427 | | Cut-off Date LTV Ratio: | 65.0% |
| Downgrade Reserve | $0 | Springing | NAP | | LTV Ratio at Maturity: | 65.0% |
| Replacement Reserves: | $0 | Springing | $48,964 | | | |
| Sources and Uses |
| Sources | | | | | Uses | | | |
| Mortgage Loan Amount | $20,475,000 | | 100.0% | | Principal Equity Distribution | $19,098,876 | | 93.3 | % |
| | | | | | Closing Costs | 1,376,124 | | 6.7 | |
| Total Sources | $20,475,000 | | 100.0% | | Total Uses | $20,475,000 | | 100.0 | % |
| (1) | Historical occupancy and NOI are not available given the Eaton Innovation Center Mortgage Loan (as defined below) was part of a sales leaseback transaction. |
The Mortgage Loan. The fourteenth largest mortgage loan (the “Eaton Innovation Center Mortgage Loan”) is evidenced by a promissory note in the original principal amount of $20,475,000 secured by the borrower’s fee simple interest in the Eaton Innovation Center, a 217,618 square foot office property located in Southfield, Michigan (“the Eaton Innovation Center Property”).
The Borrower and Borrower Sponsor. The borrower is NM ETN, L.L.C., a Delaware limited liability company and single purpose entity with one independent director. Legal counsel to the borrower delivered a non-consolidation opinion in connection with the origination of the Eaton Innovation Center Mortgage Loan.
The borrower sponsor is New Mountain Net Lease Partners II Corporation. New Mountain Net Lease Partners II Corporation is one of three investment strategies of New Mountain Capital, an asset management company with holdings across private equity, credit and net lease capital. As of March 31, 2024, New Mountain Capital had approximately $55 billion assets under management.
The Property. The Eaton Innovation Center Property is a research and development complex located in Southfield, Michigan. Built in 1960, the Eaton Innovation Center Property consists of two buildings situated on a 14.29 acre parcel. The Eaton Innovation Center Property is 100% leased to Eaton, a power management company. Eaton’s lease expires in May 2039.
Eaton uses the Eaton Innovation Center Property in a research and development capacity. On-site labs include a polymer 3D printing lab, a fuel testing lab, a 48v motors systems lab and a vehicle solutions lab.
THE INFORMATION IN THIS STRUCTURAL AND COLLATERAL TERM SHEET IS NOT COMPLETE AND MAY BE AMENDED PRIOR TO THE TIME OF SALE. THIS TERM SHEET IS NOT AN OFFER TO SELL THESE SECURITIES AND IT IS NOT A SOLICITATION OF AN OFFER TO BUY THESE SECURITIES IN ANY JURISDICTION WHERE THE OFFER OR SALE IS NOT PERMITTED. |
| | 152 | |
| Office – R&D | Loan #14 | Cut-off Date Balance: | | $20,475,000 |
26201 and 26101 Northwestern Highway Southfield, MI 48076 | Eaton Innovation Center | Cut-off Date LTV: U/W NCF DSCR: U/W NOI Debt Yield: | | 65.0% 2.08x 11.1% |
Major Tenant.
Eaton (217,618 square feet; 100.0% of net rentable area; 100.0% of underwritten base rent). Founded in 1911, Eaton is a power management company focused on electrical, aerospace, hydraulic and vehicular products and services. Eaton has approximately 94,000 employees globally. The company reported revenues of $23.2 billion for the full year of 2023. Eaton executed a 15-year absolute NNN lease at loan closing. The lease expires in May 2039 with no renewal options.
The following table presents certain information relating to the tenancy at the Eaton Innovation Center Property:
Major Tenants
| Tenant Name | Credit Rating (Fitch/ Moody’s/
S&P)(1) | Tenant NRSF | % of
NRSF | Annual U/W Base Rent PSF(2) | Annual
U/W Base Rent(2) | % of Total Annual U/W Base Rent | Lease
Expiration
Date | Ext. Options | Term. Option (Y/N) |
| Major Tenants | | | | | | | | |
| Eaton | NR/NR/A- | 217,618 | 100.0% | $10.50 | $2,284,989 | 100.0% | 5/21/2039 | None | N |
| | 217,618 | 100.0% | $10.50 | $2,284,989 | 100.0% | | | |
| | | | | | | | | |
| Other Tenants | 0 | 0.0% | $0.00 | $0 | 0.0% | | | |
| Occupied Collateral Total | 217,618 | 100.0% | $10.50 | $2,284,989 | 100.0% | | | |
| Vacant Space | 0 | 0.0% | | | | | | |
| | | | | | | | | |
| Collateral Total | 217,618 | 100.0% | | | | | | |
| | | | | | | | | | |
| (1) | Certain ratings are those of the parent company whether or not the parent guarantees the lease. |
| (2) | The Annual U/W Base Rent and Annual U/W Base Rent PSF shown above include contractual rent steps through May 31, 2025. |
The following table presents certain information relating to the lease rollover schedule at the Eaton Innovation Center Property:
Lease Expiration Schedule(1)
Year Ending
December 31, | No. of Leases Expiring | Expiring NRSF | % of Total NRSF | Cumulative Expiring NRSF | Cumulative % of Total NRSF | Annual
U/W
Base Rent | % of Total Annual U/W Base Rent | Annual
U/W
Base Rent
PSF |
| MTM | 0 | 0 | 0.0% | 0 | 0.0% | $0 | 0.0% | $0.00 |
| 2024 | 0 | 0 | 0.0% | 0 | 0.0% | $0 | 0.0% | $0.00 |
| 2025 | 0 | 0 | 0.0% | 0 | 0.0% | $0 | 0.0% | $0.00 |
| 2026 | 0 | 0 | 0.0% | 0 | 0.0% | $0 | 0.0% | $0.00 |
| 2027 | 0 | 0 | 0.0% | 0 | 0.0% | $0 | 0.0% | $0.00 |
| 2028 | 0 | 0 | 0.0% | 0 | 0.0% | $0 | 0.0% | $0.00 |
| 2029 | 0 | 0 | 0.0% | 0 | 0.0% | $0 | 0.0% | $0.00 |
| 2030 | 0 | 0 | 0.0% | 0 | 0.0% | $0 | 0.0% | $0.00 |
| 2031 | 0 | 0 | 0.0% | 0 | 0.0% | $0 | 0.0% | $0.00 |
| 2032 | 0 | 0 | 0.0% | 0 | 0.0% | $0 | 0.0% | $0.00 |
| 2033 | 0 | 0 | 0.0% | 0 | 0.0% | $0 | 0.0% | $0.00 |
| 2034 | 0 | 0 | 0.0% | 0 | 0.0% | $0 | 0.0% | $0.00 |
| 2035 & Thereafter | 1 | 217,618 | 100.0% | 217,618 | 100.0% | $2,284,989 | 100.0% | $10.50 |
| Vacant | 0 | 0 | 0.0% | 217,618 | 100.0% | $0 | 0.0% | $0.00 |
| Total/Weighted Average | 1 | 217,618 | 100.0% | | | $2,284,989 | 100.0% | $10.50 |
| (1) | Information obtained from the underwritten rent roll. |
Market Overview and Competition. The Eaton Innovation Center Property is located in the Southfield submarket within the broader Warren-Troy-Farmington Hills metropolitan statistical area. The Eaton Innovation Center Property’s neighborhood is located at the intersection of the area’s three major freeways (Interstate 696, Lodge Freeway and Telegraph Road interchange). According to the appraisal, the Eaton Innovation Center Property is approximately a 20-minute drive from the Detroit central business district and approximately a 28-minute drive from Detroit Wayne County Metropolitan Airport.
According to the appraisal, the population and average household income within a one-, three- and five-mile radius of the Eaton Innovation Center Property is 8,767, $101,545, 85,293, $92,241, 286,167 and $103,330, respectively.
THE INFORMATION IN THIS STRUCTURAL AND COLLATERAL TERM SHEET IS NOT COMPLETE AND MAY BE AMENDED PRIOR TO THE TIME OF SALE. THIS TERM SHEET IS NOT AN OFFER TO SELL THESE SECURITIES AND IT IS NOT A SOLICITATION OF AN OFFER TO BUY THESE SECURITIES IN ANY JURISDICTION WHERE THE OFFER OR SALE IS NOT PERMITTED. |
| | 153 | |
| Office – R&D | Loan #14 | Cut-off Date Balance: | | $20,475,000 |
26201 and 26101 Northwestern Highway Southfield, MI 48076 | Eaton Innovation Center | Cut-off Date LTV: U/W NCF DSCR: U/W NOI Debt Yield: | | 65.0% 2.08x 11.1% |
Operating History and Underwritten Net Cash Flow. The following table presents certain information relating to the historical operating performance and underwritten net cash flow at the Eaton Innovation Center Property:
Cash Flow Analysis
| | U/W | %(1) | U/W $ per SF |
| Base Rent | $2,284,989(2) | 77.8 | % | $10.50 |
| Contractual Rent Steps | 81,386 | 2.8 | | 0.37 |
| Gross Potential Rent | $2,366,375 | 80.6 | % | $10.87 |
| Total Recoveries | 569,574 | 19.4 | | 2.62 |
| Net Rental Income | $2,935,950 | 100.0 | % | $13.49 |
| (Vacancy & Credit Loss) | (88,078) | (3.7 | ) | (0.40) |
| Effective Gross Income | $2,847,871 | 97.0 | % | $13.09 |
| | | | |
| Management Fee | 85,436 | 3.0 | | 0.39 |
| Other Expenses | 484,138 | 17.0 | | 2.22 |
| Total Operating Expenses | $569,574 | 20.0 | % | $2.62 |
| | | | |
| Net Operating Income | $2,278,297 | 80.0 | % | $10.47 |
| Replacement Reserves | 32,643 | 1.1 | | 0.15 |
| TI/LC | 0 | 0.0 | | 0.00 |
| Net Cash Flow | $2,245,654 | 78.9 | % | $10.32 |
| | | | |
| NOI DSCR | 2.11x | | |
| NCF DSCR | 2.08x | | |
| NOI Debt Yield | 11.1% | | |
| NCF Debt Yield | 11.0% | | |
| (1) | Represents (i) percent of Net Rental Income for all revenue fields, (ii) percent of Gross Potential Rent for Vacancy & Credit Loss and (iii) percent of Effective Gross Income for all other fields. |
| (2) | U/W Base Rent shown above includes contractual rent steps through May 31, 2025. |
THE INFORMATION IN THIS STRUCTURAL AND COLLATERAL TERM SHEET IS NOT COMPLETE AND MAY BE AMENDED PRIOR TO THE TIME OF SALE. THIS TERM SHEET IS NOT AN OFFER TO SELL THESE SECURITIES AND IT IS NOT A SOLICITATION OF AN OFFER TO BUY THESE SECURITIES IN ANY JURISDICTION WHERE THE OFFER OR SALE IS NOT PERMITTED. |
| | 154 | |
| No. 15 – Mocksville Industrial |
| |
| Mortgage Loan Information | | Mortgaged Property Information |
| Mortgage Loan Seller: | Citi Real Estate Funding Inc. | | Single Asset/Portfolio: | Single Asset |
Credit Assessment
(Fitch/KBRA/Moody’s): | NR/NR/NR | | Property Type – Subtype: | Industrial – Manufacturing |
| Original Principal Balance: | $17,000,000 | | Location: | Mocksville, NC |
| Cut-off Date Balance: | $17,000,000 | | Size: | 253,052 SF |
| % of Initial Pool Balance: | 2.4% | | Cut-off Date Balance Per SF: | $67.18 |
| Loan Purpose: | Refinance | | Maturity Date Balance Per SF: | $67.18 |
| Borrower Sponsors: | Damian Kassab, John Garcia, Ajoy Sharma and Bruce Culver | | Year Built/Renovated: | 2018/NAP |
| Guarantors: | Damian Kassab, John Garcia, Ajoy Sharma and Bruce Culver | | Title Vesting: | Fee |
| Mortgage Rate: | 7.3900% | | Property Manager: | Self-Managed |
| Note Date: | October 25, 2024 | | Current Occupancy (As of): | 100.0% (11/1/2024) |
| Seasoning: | 0 months | | YE 2023 Occupancy(1): | NAV |
| Maturity Date: | November 6, 2029 | | YE 2022 Occupancy(1): | NAV |
| IO Period: | 60 months | | YE 2021 Occupancy(1): | NAV |
| Loan Term (Original): | 60 months | | YE 2020 Occupancy(1): | NAV |
| Amortization Term (Original): | NAP | | As-Is Appraised Value(3): | $28,900,000 |
| Loan Amortization Type: | Interest Only | | As-Is Appraised Value Per SF: | $114.21 |
| Call Protection: | L(24),D(29),O(7) | | As-Is Appraisal Valuation Date: | August 21, 2024 |
| Lockbox Type: | Hard/Springing Cash Management | | | |
| Additional Debt: | No | | Underwriting and Financial Information |
| Additional Debt Type (Balance): | NAP | | YE 2023 NOI(1): | NAV |
| | | | YE 2022 NOI(1): | NAV |
| | | | YE 2021 NOI(1): | NAV |
| | | | YE 2020 NOI(1): | NAV |
| | | | U/W Revenues: | $2,034,122 |
| | | | U/W Expenses: | $61,024 |
| | | | | | U/W NOI: | $1,973,099 |
| Escrows and Reserves | | U/W NCF: | $1,884,221 |
| | Initial | Monthly | Cap | | U/W DSCR based on NOI/NCF: | 1.55x/1.48x |
| Taxes: | $88,039 | $8,004 | NAP | | U/W Debt Yield based on NOI/NCF: | 11.6%/11.1% |
| Insurance | $10,396 | $10,396 | NAP | | Cut-off Date LTV Ratio(3): | 58.8% |
| Replacement Reserve: | $0 | $2,109 | NAP | | LTV Ratio at Maturity: | 58.8% |
| TI / LC: | $0 | $5,298 | NAP | | | |
| Debt Service Reserve(2): | $1,273,748 | $0 | NAP | | | |
| | | | | | | | |
| Sources and Uses |
| Sources | | | | | Uses | | | |
| Original Loan Amount | $17,000,000 | | 69.5% | | Payoff | $22,420,125 | | 91.7 | % |
| Borrower Equity Contribution | 7,457,973 | | 30.5 | | Upfront Reserves | 1,372,182 | | 5.6 | |
| | | | | | Closing Costs | 665,665 | | 2.7 | |
| Total Sources | $24,457,973 | | 100.0% | | Total Uses: | $24,457,973 | | 100.0 | % |
| (1) | Historical occupancy and NOI are unavailable because the borrower recently acquired the Mocksville Industrial Property (as defined below) in March 2024, and entered into a triple net lease for 100% of the Mocksville Industrial Property with Palltronics, Inc. (“Palltronics”), an affiliated tenant, upon such acquisition. |
| (2) | The Debt Service Reserve is required to be released to the borrower in equal monthly installments of $106,145 (or the remaining balance if less than such amount) if (i) no event of default exists and (ii) the Palltronics EBITDAR Condition is satisfied. The “Palltronics EBITDAR Condition” means Palltronics achieving an EBITDAR Ratio of at least 1.5x for the preceding 12 consecutive months. The “EBITDAR Ratio” means, as defined in more detail in the loan documents, the ratio of (i) Palltronics’ net income (calculated using annualized trailing one month revenues) plus (a) the following (to the extent deducted in calculating net income): interest charges, taxes, depreciation and amortization, rent paid under Palltronics’ lease, and other non-recurring expenses minus (b) the following (if included in calculating net income): tax credits, all non-cash items increasing net income for the applicable period (with (a) and (b) calculated using annualized trailing twelve-month expenses), to (ii) rent paid by Palltronics under its lease. |
| (3) | In addition to the As-Is Appraised Value, the appraiser concluded to a hypothetical go-dark value of $24,300,000, representing a loan to dark value ratio of 70.0%. |
THE INFORMATION IN THIS STRUCTURAL AND COLLATERAL TERM SHEET IS NOT COMPLETE AND MAY BE AMENDED PRIOR TO THE TIME OF SALE. THIS TERM SHEET IS NOT AN OFFER TO SELL THESE SECURITIES AND IT IS NOT A SOLICITATION OF AN OFFER TO BUY THESE SECURITIES IN ANY JURISDICTION WHERE THE OFFER OR SALE IS NOT PERMITTED. |
| | 155 | |
| Office – CBD | Loan #15 | Cut-off Date Balance: | | $15,000,000 |
120 Wall Street New York, NY 10005 | Mocksville Industrial | Cut-off Date LTV: U/W NCF DSCR: U/W NOI Debt Yield: | | 57.9% 2.74x 9.3% |
The Mortgage Loan. The fifteenth largest mortgage loan (the “Mocksville Industrial Mortgage Loan”) is evidenced by a single promissory note in the original principal amount of $17,000,000 secured by the borrower’s fee interest in a 253,052 SF industrial manufacturing facility located in Mocksville, North Carolina (the “Mocksville Industrial Property”). The prior mortgage loan secured by the Mocksville Industrial Property constituted seller financing in the amount of $21,900,000 which matured on September 30, 2024 and was in maturity default at the time of origination of the Mocksville Industrial Mortgage Loan.
The Borrower and the Borrower Sponsors. The borrower is Mocksville RE Holdings LLC, a Michigan limited liability company and single purpose entity. The borrower sponsors and non-recourse carveout guarantors are Damian Kassab, John Garcia, Ajoy Sharma and Bruce Culver of Solyco Core Partners, LLC (DE) (“Solyco Capital”). Founded in 2017 by John Garcia and Damian Kassab, Solyco Capital is a private equity group focused on providing capital solutions for late-stage startup and growth companies. Ajoy Sharma serves as a senior partner for Solyco Capital focusing on financial strategy, analytics and turnarounds. Bruce Culver is an entrepreneur, investor, executive and scientist who has founded multiple companies and is an active private investor, including an investor in Solyco Capital.
The Property. The Mocksville Industrial Property is a 253,052 SF industrial manufacturing and distribution facility located in Mocksville, North Carolina. The Mocksville Industrial Property was originally constructed in 2018 and is situated on a 30.83-acre site. As of November 1, 2024, the Mocksville Industrial Property was 100.0% leased to Palltronics, an affiliate of the borrower. The Mocksville Industrial Property is comprised of 97.2% manufacturing and distribution space and 2.8% office space. The Mocksville Industrial Property features 30’ clear heights, 14 dock high doors, and one drive-in door with 116 parking spaces resulting in a parking ratio of 0.46 spaces per 1,000 SF.
Sole Tenant.
Palltronics (253,052 square feet; 100.0% of net rentable area; 100.0% of underwritten base rent). Founded in 2021, Palltronics is an affiliate of the borrower and a subsidiary of Solyco Capital. Palltronics utilizes its space at the Mocksville Industrial Property as its site for manufacturing and distribution of Palltronics’ smart pallets. Palltronics is a private company specializing in high tech pallets that are anti-microbial and fully trackable. Palltronics’ pallets are equipped with RFID chips that track themselves and measure temperature, weight, humidity, and vibration. Upon the acquisition of the Mocksville Industrial Property by the borrower in March 2024, the borrower executed a new ten year triple net lease with Palltronics with a lease term through March 2034, no termination options, and three, five-year renewal options. The Palltronics lease is fully guaranteed by the borrower sponsors. Prior to the acquisition of the Mocksville Industrial Property by the borrower, Palltronics leased the Mocksville Industrial Property from the prior owner.
The following table presents certain information relating to the sole tenant at the Mocksville Industrial Property:
| Tenant Name | Credit Rating (Fitch/
Moody’s/
S&P) | Tenant NRSF | % of
NRSF | Annual U/W Base Rent PSF(1) | Annual
U/W Base Rent(1) | % of Total Annual U/W Base Rent | Lease
Expiration
Date | Ext. Options | Term. Option (Y/N) |
| Major Tenants | | | | | | | | |
| Palltronics, Inc. | NR/NR/NR | 253,052 | 100.0% | $8.22 | $2,080,158 | 100.0% | 3/31/2034 | 3 x 5 yr | N |
| Occupied Collateral Total | 253,052 | 100.0% | $8.22 | $2,080,158 | 100.0% | | | |
| | | | | | | | | |
| Vacant Space | 0 | 0.0% | 0 | 0 | 0.0% | | | |
| | | | | | | | | |
| Collateral Total | 253,052 | 100.0% | $8.22 | $2,080,158 | 100.0% | | | |
| | | | | | | | | | |
| (1) | The Annual U/W Base Rent and Annual U/W Base Rent PSF includes rent steps through April 1, 2025. |
THE INFORMATION IN THIS STRUCTURAL AND COLLATERAL TERM SHEET IS NOT COMPLETE AND MAY BE AMENDED PRIOR TO THE TIME OF SALE. THIS TERM SHEET IS NOT AN OFFER TO SELL THESE SECURITIES AND IT IS NOT A SOLICITATION OF AN OFFER TO BUY THESE SECURITIES IN ANY JURISDICTION WHERE THE OFFER OR SALE IS NOT PERMITTED. |
| | 156 | |
| Office – CBD | Loan #15 | Cut-off Date Balance: | | $15,000,000 |
120 Wall Street New York, NY 10005 | Mocksville Industrial | Cut-off Date LTV: U/W NCF DSCR: U/W NOI Debt Yield: | | 57.9% 2.74x 9.3% |
The following table presents certain information relating to the lease rollover schedule at the Mocksville Industrial Property:
Lease Expiration Schedule(1)
Year Ending
December 31, | No. of Leases Expiring | Expiring NRSF | % of Total NRSF | Cumulative Expiring NRSF | Cumulative % of Total NRSF | Annual
U/W
Base Rent(2) | % of Total Annual U/W Base Rent | Annual
U/W
Base Rent
PSF(2) |
| 2024 & MTM | 0 | 0 | 0.0% | 0 | 0.0% | $0 | 0.0% | $0.00 |
| 2025 | 0 | 0 | 0.0% | 0 | 0.0% | $0 | 0.0% | $0.00 |
| 2026 | 0 | 0 | 0.0% | 0 | 0.0% | $0 | 0.0% | $0.00 |
| 2027 | 0 | 0 | 0.0% | 0 | 0.0% | $0 | 0.0% | $0.00 |
| 2028 | 0 | 0 | 0.0% | 0 | 0.0% | $0 | 0.0% | $0.00 |
| 2029 | 0 | 0 | 0.0% | 0 | 0.0% | $0 | 0.0% | $0.00 |
| 2030 | 0 | 0 | 0.0% | 0 | 0.0% | $0 | 0.0% | $0.00 |
| 2031 | 0 | 0 | 0.0% | 0 | 0.0% | $0 | 0.0% | $0.00 |
| 2032 | 0 | 0 | 0.0% | 0 | 0.0% | $0 | 0.0% | $0.00 |
| 2033 | 0 | 0 | 0.0% | 0 | 0.0% | $0 | 0.0% | $0.00 |
| 2034 | 1 | 253,052 | 100.0% | 253,052 | 100.0% | $2,080,158 | 100.0% | $8.22 |
| 2035 & Beyond | 0 | 0 | 0.0% | 253,052 | 100.0% | $0 | 0.0% | $0.00 |
| Vacant | 0 | 0 | 0.0% | 253,052 | 100.0% | NAP | NAP | NAP |
| Total/Weighted Average | 1 | 253,052 | 100.0% | | | $2,080,158 | 100.0% | $8.22 |
| (1) | Based on the underwritten rent roll dated November 1, 2024. |
| (2) | Annual U/W Base Rent and Annual U/W Base Rent PSF is inclusive of rent steps through April 1, 2025. |
Market Overview and Competition. The Mocksville Industrial Property is located at 288 Quality Drive in Mocksville, North Carolina which is part of the Greensboro-High Point-Winston Salem Combined Statistical Area (“Greensboro CSA”). The Greensboro CSA is commonly referred to as the Piedmont Triad and consists of 12 counties surrounding the cities of Greensboro, Winston-Salem and High Point. The Greensboro CSA has an estimated population of nearly 1.8 million people and is known as a primary manufacturing and transportation center of the southeastern United States.
According to the appraisal, the Mocksville Industrial Property is located within the Greensboro/Winston-Salem industrial market which as of the first quarter of 2024 had inventory of 300,489,655 SF, a vacancy rate of 4.6%, and average asking rent of $5.21 per square foot. The appraisal also concluded to a market rent of $8.00 PSF for the Mocksville Industrial Property
According to the appraisal, the estimated 2022 population within a three-, five-, and seven-mile radius of the Mocksville Industrial Property was 4,229, 12,922, and 21,329. The 2022 estimated average household income within the same radii was $70,086, $73,481, and $75,003, respectively.
The following table presents certain information relating to comparable industrial leases to the Mocksville Industrial Property:
Market Analysis(1)
| Property Name | Tenant | Suite Size (SF) | Lease Commencement | Lease Term (Yrs) | Rent (PSF) |
| Mocksville Industrial | Palltronics, Inc. | 253,052 | Mar-24 | 10 | $8.22(2) |
| Union Cross IV | Confidential | 144,000 | Dec-24 | 12 | $7.65 |
| Amerisource Bergen | Amerisource Bergen | 164,000 | Oct-24 | 7 | $9.50 |
| Piedmont Commerce Center IV | Confidential | 104,128 | Jul-24 | 10.3 | $7.20 |
| 1533 Galleria Boulevard | UPS | 175,740 | Jun-24 | 10.3 | $7.70 |
| Blackstock Commerce Center - Building A | Somnus Mattress International | 233,280 | Oct-23 | 5.17 | $6.60 |
| Interchange Logistics Center | SEG | 224,797 | Sep-23 | 10.3 | $7.55 |
| Carolina Logistics Park - Building 3 | Snyder's Lance | 173,748 | Aug-23 | 8 | $8.05 |
| (1) | Information obtained from the appraisal. |
| (2) | Rent (PSF) is inclusive of rent steps through April 2025. |
THE INFORMATION IN THIS STRUCTURAL AND COLLATERAL TERM SHEET IS NOT COMPLETE AND MAY BE AMENDED PRIOR TO THE TIME OF SALE. THIS TERM SHEET IS NOT AN OFFER TO SELL THESE SECURITIES AND IT IS NOT A SOLICITATION OF AN OFFER TO BUY THESE SECURITIES IN ANY JURISDICTION WHERE THE OFFER OR SALE IS NOT PERMITTED. |
| | 157 | |
| Office – CBD | Loan #15 | Cut-off Date Balance: | | $15,000,000 |
120 Wall Street New York, NY 10005 | Mocksville Industrial | Cut-off Date LTV: U/W NCF DSCR: U/W NOI Debt Yield: | | 57.9% 2.74x 9.3% |
The following table presents historical occupancy percentages at the Mocksville Industrial Property:
Historical Occupancy(1)
12/31/2021 | 12/31/2022 | 12/31/2023 | 11/1/2024(2) |
| NAV | NAV | NAV | 100.0% |
| (1) | Historical occupancy information is not available because the borrower sponsor recently acquired the Mocksville Industrial Property in March 2024, and entered into a triple net lease for 100% of the Mocksville Industrial Property with the affiliated tenant upon such acquisition. |
| (2) | Based on the underwritten rent roll dated November 1, 2024. |
Underwritten Net Cash Flow. The following table presents certain information relating to the underwritten net cash flow at the Mocksville Industrial Property:
Cash Flow Analysis(1)(2)
| | U/W | U/W $ per SF | %(3) |
| Base Rent | $2,019,571 | $7.98 | 94.3% |
| Contractual Rent Steps | 60,587 | $0.24 | 2.8% |
| Gross Potential Rent | $2,080,158 | $8.22 | 97.2% |
| Total Reimbursements | 61,024 | $0.24 | 2.9% |
| Total Gross Income | $2,141,181 | $8.46 | 100.0% |
| (Vacancy & Credit Loss) | (107,059) | ($0.42) | (5.3%) |
| Effective Gross Income | $2,034,122 | $8.04 | 100.0% |
| | | | |
| Management Fee | 61,024 | $0.24 | 3.0% |
| Insurance | 0 | $0.00 | 0.0% |
| Real Estate Taxes | 0 | $0.00 | 0.0% |
| Other Operating Expenses | 0 | $0.00 | 0.0% |
| Total Operating Expenses(4) | $61,024 | $0.24 | 3.0% |
| | | | |
| Net Operating Income | $1,973,099 | $7.80 | 97.0% |
| Replacement Reserves | 25,305 | $0.10 | 1.2% |
| TI/LC | 63,573 | $0.25 | 3.1% |
| Net Cash Flow | $1,884,221 | $7.45 | 92.6% |
| | | | |
| NOI DSCR | 1.55x | | |
| NCF DSCR | 1.48x | | |
| NOI Debt Yield | 11.6% | | |
| NCF Debt Yield | 11.1% | | |
| (1) | Based on the underwritten rent roll as of November 1, 2024. |
| (2) | Historical financial information is not available because the borrower sponsor recently acquired the Mocksville Industrial Property in March 2024, and entered into a triple net lease for 100% of the Mocksville Industrial Property with the affiliated tenant upon such acquisition. |
| (3) | Represents (i) percent of Total Gross Income for all revenue fields and (ii) percent of Effective Gross Income for all other fields. |
| (4) | Expenses other than Management Fee are shown as $0 as the sole tenant is responsible for all such expenses. |
THE INFORMATION IN THIS STRUCTURAL AND COLLATERAL TERM SHEET IS NOT COMPLETE AND MAY BE AMENDED PRIOR TO THE TIME OF SALE. THIS TERM SHEET IS NOT AN OFFER TO SELL THESE SECURITIES AND IT IS NOT A SOLICITATION OF AN OFFER TO BUY THESE SECURITIES IN ANY JURISDICTION WHERE THE OFFER OR SALE IS NOT PERMITTED. |
| | 158 | |
| Wells Fargo Commercial Mortgage Trust 2024-5C2 | Transaction Contact Information |
| VI. | Transaction Contact Information |
Questions regarding this Structural and Collateral Term Sheet may be directed to any of the following individuals:
| Wells Fargo Securities, LLC | |
| | |
| Brigid Mattingly | Tel. (312) 269-3062 |
| | |
| A.J. Sfarra | Tel. (212) 214-5613 |
| | |
| Sean Duffy | Tel. (312) 827-1518 |
| Citigroup Global Markets Inc. | |
| | |
| Raul Orozco | Tel. (212) 723-1295 |
| | |
| Rick Simpson | Tel. (212) 816-5343 |
| Jay Mercandetti | Tel. (212) 816-6384 |
| | |
| Goldman Sachs & Co. LLC | |
| | |
| Scott Epperson | Tel. (212) 934-2882 |
| | |
| Justin Peterson | Tel. (212) 902-4283 |
| | |
| UBS Securities LLC | |
| | |
| Nicholas Galeone | Tel. (212) 713-8832 |
| | |
| Siho Ham | Tel. (212) 713-1278 |
| | |
| Michael Barbieri | Tel. (212) 713-1181 |
| | |
| J.P. Morgan Securities LLC | |
| | |
| Kunal Singh | Tel. (212) 834-5467 |
| | |
| Harris Rendelstein | Tel. (212) 834-6737 |
| | |
| Derrick Fetzer | Tel. (212) 834-3111 |
| | |
| Avinash Sharma | Tel. (212) 834-3111 |
THE INFORMATION IN THIS STRUCTURAL AND COLLATERAL TERM SHEET IS NOT COMPLETE AND MAY BE AMENDED PRIOR TO THE TIME OF SALE. THIS TERM SHEET IS NOT AN OFFER TO SELL THESE SECURITIES AND IT IS NOT A SOLICITATION OF AN OFFER TO BUY THESE SECURITIES IN ANY JURISDICTION WHERE THE OFFER OR SALE IS NOT PERMITTED. |
| | 159 | |