UNITED STATES
SECURITIES AND EXCHANGE COMMISSION
Washington, D.C. 20549
FORM N-CSR
CERTIFIED SHAREHOLDER REPORT OF REGISTERED
MANAGEMENT INVESTMENT COMPANIES
Investment Company Act File Number 811-05823
DOMINI SOCIAL INVESTMENT TRUST
(Exact Name of Registrant as Specified in Charter)
532 Broadway, 9th Floor, New York, New York 10012
(Address of Principal Executive Offices)
Amy Domini Thornton
Domini Social Investments LLC
532 Broadway, 9th Floor
New York, New York 10012
(Name and Address of Agent for Service)
Registrant’s Telephone Number, including Area Code: 212-217-1100
Date of Fiscal Year End: July 31
Date of Reporting Period: July 31, 2014
| Item 1. | Reports to Stockholders. |
A copy of the report transmitted to stockholders pursuant to Rule 30e-1 under the Investment Company Act of 1940 follows.
| ANNUAL REPORT 2014 | | JULY 31, 2014 | |

DOMINI SOCIAL EQUITY FUND®
INVESTOR SHARES, CLASS A SHARES, INSTITUTIONAL SHARES & CLASS R SHARES
DOMINI INTERNATIONAL SOCIAL EQUITY FUNDSM
INVESTOR SHARES, CLASS A SHARES & INSTITUTIONAL SHARES
DOMINI SOCIAL BOND FUND®
INVESTOR SHARES & INSTITUTIONAL SHARES
| KEEP IN TOUCH WITH DOMINI |
A report like this comes twice a year, but your dollars work for change all year long. Stay connected with us on Facebook and Twitter:
|
| SIGN UP FOR E-DELIVERY |
If you invest directly with Domini, you can also avoid an annual fee of $15 by signing up for paperless E-Delivery of your statements, reports and tax forms — just log into your account, go to “Account Options,” and select “E-Delivery Option.”
If you invest through a financial advisor, brokerage firm, or employer-sponsored retirement plan, why not ask your advisor or plan sponsor how to receive your documents electronically? It can reduce your carbon footprint, save trees, and unclutter your life, all with just a few strokes of your keyboard! |
THE WAY YOU INVEST MATTERS®
Dear Fellow Shareholders:
The year ended July 31, 2014 was a particularly good one for the Domini Social Equity Fund, which outperformed the S&P 500 by 3 percent. Our international fund also posted strong returns, although not as strong as its benchmark index, the MSCI EAFE.
Responsible investing means committing oneself to continuously reviewing the standards used to make our investment decisions, and staying current as industries change. One area that has seen tremendous change is food production. There are many factors driving these changes, and our responses to them: the obesity epidemic, indications that food additives or storage containers may affect human health, changes in the chemistry of soil, rivers and lakes as pesticides flow downstream and the alarming dangers to farm workers exposed to chemicals. These are but a few of the reasons that we now must ask harder questions of the companies we invest in, and expect better answers.
The transformation of our food production systems began decades ago. Over fifty years ago, I can recall the first artificial product, served in a plastic container, that my mother put on the table. I’ll never forget my father’s reaction. He grabbed the container, asking, “What’s this?” My mother laughed and told him to settle down, but he persisted, staring at the ingredients before declaring, “This is soap! You are feeding our children soap!” Now my father was not a radical man, but he was an Italian immigrant and brought with him a love of all things fresh. He won the argument that day. At the time, none of us considered that there might be far larger implications to consider and that massive transformations were under way. In fact, the very definition of food was being expanded to include untested ingredients, including those that might be harmful to humans.
Today, responsible investors see many opportunities in the current counter-revolution in food production. The growth of demand for organics alone has spurred a range of positive impacts. The local family farm can convert a small operation into one that specializes in a product that can command a price that makes farming an economically viable option. The niche restaurant can pull in a wider clientele that is seeking local, organic products. The large purchasers begin to feel the demand but cannot source only locally, so they contract for thousands of acres of organic produce, often making it necessary for a large supplier to become organic. This in turn improves the health and safety of the workforce on the farm and the water system in the area.
2
THE WAY YOU INVEST MATTERS®
We see in the field of sustainable agriculture many of the hard choices that exist in other fields. People want healthier, higher quality products, which, in many cases, drives up prices. Still, as we witnessed in the evolution of cellular telephones, sometimes the wealthy create sufficient demand to spur the kind of healthy competition that drives prices down while quality continues to improve. Certainly, there are trade-offs as small-scale organic farming is brought to the mainstream, but the entry of so many conventional mega-stores such as Walmart and Target into the organic food sales area surely demonstrates that dramatic changes are once again underway.
The issues are complicated. As more of the human population moves off of subsistence living to a market-based economy, the demand for proteins, frequently in the form of meat, rises. Meat production creates a whole host of issues ranging from animal welfare to climate change considerations. Even when the demand is for a simple grain, it can cause discouraging results. We saw this in the growth of popularity of quinoa. As world demand grew, this staple for the Bolivian poor became too expensive for many. There was no cheaper grain to turn to and the poor suffered great hardship, even starvation.
At Domini Social Investments, the research we conduct to understand these changes to our food systems is core to the investment process. Whether it is expressed in the avoidance of many manufacturers of agricultural chemicals, in the search for systems that provide safer food for all, or in the proxy votes we cast or the hard questions we ask of corporate managers, we view our social and environmental standards as key to the process of helping both the public and corporations understand what is at stake.
Agriculture is a complicated business, but the results are simple. I began with a story of my father, and I’ll end with one. He was growing eggplants. One day he turned to me and asked if I had tried vinegar as an insect deterrent. I said I had tried it mixed with soap and water and that it seemed to work pretty well. I asked, “What got you so interested in organic farming?” He looked at me with disappointment. “This is food,” he said. “People eat it.”
Very truly yours,

Amy Domini
amy@domini.com
3
THE WAY YOU INVEST MATTERS®
Expanding Our Influence
Every year, we see numerous opportunities to engage the broader community of institutional investors on questions of corporate and investor responsibility. This past year, we participated in events convened by Ernst & Young to discuss recent trends in corporate governance and the SEC’s review of financial reporting requirements. At each, we shared the table with corporate executives and some of the world’s largest institutional investors. We were also pleased to join a panel at this year’s Millstein Governance Forum at Columbia Law School to speak about corporate social responsibility.
We are particularly interested in influencing initiatives to improve corporate reporting. We participated in roundtable discussions about Integrated Reporting, an emerging approach to corporate reporting that integrates financial and sustainability considerations, and met with Mary Jo White, the Chair of the Securities and Exchange Commission, to advocate for mandatory corporate political contributions reporting. Our General Counsel continues to serve as a member of the SEC’s Investor Advisory Committee, and is a member of the Human Rights and Reporting Assurance Framework’s Eminent Persons Group, helping to guide the development of a reporting format to communicate corporate compliance with the UN Guiding Principles on Business and Human Rights. In September, we met with UN Ambassadors representing Hungary, New Zealand, Denmark and Canada to encourage the inclusion of corporate sustainability reporting in the UN’s Sustainable Development Goals.
Steve Lydenberg’s Dilemmas in Responsible Investment Published in China
“Ultimately, responsible investment implies a redefinition of what is called ‘success’ in investment, from a one-dimensional, purely financial approach to a multi-dimensional approach…. In other words, responsible investment implies a paradigm change.”
- Steven Lydenberg and Céline Louche, Dilemmas in Responsible Investment (2011)
Steve Lydenberg, a founder of the Domini Social Equity Fund currently in charge of Domini’s strategic vision, spent a week in China lecturing and celebrating the translation of his book, Dilemmas in Responsible Investment (coauthored with Céline Louche), into Chinese. Steve is a founder of the Initiative for Responsible Investment at the Harvard Kennedy School, where he is an adjunct lecturer in public policy. A student of Steve’s corporate social responsibility course facilitated his invitation to Nankai University in Tiajing, where he participated in several roundtable discussions with faculty, students and the China Social Investment Forum. He then delivered a formal presentation on the book and socially responsible investing at the School of Economics.
4
THE WAY YOU INVEST MATTERS®
Sustainability is a journey, and no company is perfect. We are therefore willing to work with those companies that face significant challenges but demonstrate a commitment to improve. Here are a few highlights of our corporate engagement work over the past twelve months.
Following a Domini-authored letter on behalf of institutional investors managing more than $490 billion, and further conversations with us, Amazon.com agreed to remove several categories of semi-automatic weapons accessories from its website and to amend its prohibited weapons policy.
For more than ten years, we have asked companies to disclose their political contributions and lobbying positions. We withdrew our shareholder proposal to JetBlue Airways when the company agreed to begin publishing its political contributions, including contributions to trade associations. In 2008, we helped convince the company to begin sustainability reporting.
When corporations don’t pay their fair share of taxes, somebody else must pick up the tab. Countries around the world are losing billions in tax revenues, all in the name of shareholder value. Google is one of several companies at the center of a global debate about aggressive corporate strategies to avoid paying taxes, generally through the use of offshore tax havens. Our first of its kind shareholder proposal, asking Google to adopt a set of ethical principles to guide its tax strategies, helped to raise awareness of this critical issue and opened dialogue with the company. We also raised these issues with Microsoft, Merck, Coca-Cola and Apple.
Other highlights included meetings with the CEO and senior management of PNC Financial Services* regarding its investments in the Pennsylvania coal industry and its impact on climate change, and a meeting with The Walt Disney Company’s Chief Financial Officer regarding a range of sustainability issues. Domini has been in dialogue with Disney for more than 15 years, and played a role in the development of the company’s international labor standards program.
Visit www.domini.com for more stories, a list of all shareholder proposals we’ve filed on your behalf, and to read our quarterly Social Impact Updates.
*We are serving a supporting role in this engagement.
5
THE WAY YOU INVEST MATTERS®
INVESTING IN BETTER FOOD PRODUCTION
The complexity of our food production systems is astounding, as are its staggering impacts on climate change and human rights. Any given meal or afternoon snack can touch on issues as far-ranging as the survival of the orangutan or a land rights dispute in Africa. Climate change, water scarcity, nutritional content, marketing to children, animal welfare and labor rights are all on the table.
Behind each familiar brand lies a complex set of relationships stretching across the globe. We view these relationships as opportunities for positive impact. As investors, we can create the incentives for companies to simultaneously be more transparent and to dig deeper to ensure their businesses are operating responsibly. Through your investment in the Domini Funds, your money is working to help catalyze this process of transformation.
For this report, we focus on a handful of issues that lie beneath the surface, hidden from the consumer’s view. We discuss a few actions we have taken and provide some brief examples of companies that are making efforts to reduce their footprint and have a more positive impact.
Pesticides and Pollinators
It is imperative that we pay attention to the overall resiliency of our food systems. It is said that a chain is only as strong as its weakest link, and the lowly honeybee is in peril.
Honeybees are the most economically important pollinators globally and contribute more than $24 billion to the U.S. economy each year. According to the US Department of Agriculture, “[a]bout one mouthful in three in our diet directly or indirectly benefits from honeybee pollination.” Crops dependent upon honeybees include almonds, blueberries, apples, lemons and zucchini. Since 2006, however, commercial honeybee colony loss rates have averaged 30 percent each winter, compared to historical losses of 10 to 15 percent. “Colony Collapse Disorder” is a global syndrome that produces the sudden catastrophic loss of a hive. The USDA warns that if losses continue at current levels, “it could threaten the economic viability of the bee pollination industry.”
Scientists believe a series of contributing factors are to blame, including loss of natural forage areas due to land-use changes, inadequate diets, mite infestations, diseases, loss of genetic diversity and certain commercial beekeeping practices. Although a single cause may never be found, an independent four-year scientific analysis of 800 peer-reviewed studies recently concluded that neonicotinoid pesticides (“neonics”) are a “key factor in the decline of bees” and their widespread use poses a threat to the infrastructure that enables food production. Neonics are a “systemic”
6
THE WAY YOU INVEST MATTERS®
pesticide used on more than 140 different crops in 120 countries, and are the most widely used group of insecticides globally. They are used to pre-coat seeds, where they are then taken up by the entire plant, and are also sprayed. The European Union has taken steps to ban certain neonics, and the EPA has required that warning labels be put on certain products containing neonics.
While scientists and policymakers continue to study pollinator declines, there are a few things that we can do as investors and consumers. First, we can make our own determination about the social and economic value of the pesticide industry. The Domini Funds do not invest in companies that derive significant revenues from the manufacture of pesticides, such as Bayer, Monsanto, The Dow Chemical Co., DuPont and Syngenta.
As investors, we can engage with the companies that sell pesticides, or utilize them in their supply chains. For example, we spoke with Campbell Soup Company about its approach to pesticide use in its supply chain. Pesticide control is an area of focus within the company’s sustainable agriculture programs. The company seeks to use pesticides only optimally, and as a last resort.
Working with other concerned investors, we sent letters to food producers and retailers and home improvement companies that sell pesticides and pesticide-treated plants to alert them to the severe risks to bees and the potential economic implications. The Home Depot has taken a lead on this issue by announcing that it will require its suppliers to label all plants pretreated with neonics, and that it will work with suppliers to eliminate neonics in plant production. The company is also providing its customers with a list of neonic-free alternatives for home application. We are in active dialogue with Lowe’s about the science, encouraging that company to follow Home Depot’s lead and to ultimately take these products off the shelf. Your backyard garden may be an important refuge for bees. Let your garden supplier know that you need to ensure that it is a safe one.
Genetically Modified Organisms (GMOs)
We have received a number of questions from Domini Funds shareholders about genetically modified organisms (GMOs). Our concerns about the widespread use of genetic engineering in food production relate to human health as well as broader ecological impacts, including increased use of pesticides on crops that have been engineered to resist their application. It is important to recognize, however, that GMOs have been part of the U.S. food system for 20 years, and are pervasive.
We do recognize companies that have made special commitments to either avoid GMOs or label their products so that their consumers can make more informed decisions. As of 2014, 94 percent of American-grown soybeans are genetically engineered. WhiteWave Foods, however, the
7
THE WAY YOU INVEST MATTERS®
owner of the Silk, Land O Lakes and Horizon Organic brands, uses non-genetically modified soybeans in the production of most of its soy products.
Lindt & Sprüngli, the Swiss chocolate company, reports that it will not use any raw materials that have been genetically modified or that are derived from genetically modified organisms, as long as non-modified raw materials are available. The company tests its products for more than 200 types of pesticides and has participated in Sustainable Tree Crops, a program in West/Central Africa to promote the minimization of agricultural chemical use by farmers. Lindt also monitors its supply chain for human rights violations, which have been a persistent systemic problem in worldwide cocoa production.
Nissin Foods Holdings (Japan), known for its Cup Noodles brand, has a policy and monitoring system to ensure it uses only non-GMO corn and soy in addition to extensive screening systems to test for more than 700 chemicals and substances in its food products including heavy metals, animal feed additives and agricultural chemicals. The company does not use artificial food additives, including coloring. Nissin has a history of donating its instant food products for disaster relief efforts and recently announced it will start selling low-priced, nutrition enhanced cup noodles in Bangladesh.
Chipotle Mexican Grill has been making waves in its industry for high-profile commercials challenging traditional farming techniques and promoting a more natural approach. The company provides explicit and detailed GMO labeling on its website and strives to purchase its produce from local sources. We commend the company for these efforts, but would like to see more comprehensive data to enable us to evaluate progress. We therefore joined another investor in submitting a shareholder proposal this year requesting a sustainability report. More than 31 percent of shares were voted in favor of our proposal, and we look forward to continuing our dialogue with the company.
In October, we joined other investors in asking companies to refrain from using corporate funds to oppose GMO labeling legislation, citing risks to corporate reputation if consumers learned that their favorite brands opposed their right to know what is in their foods. In 2012, Proposition 37, a California measure to introduce GMO labeling, was defeated after intense lobbying, including opposition from Unilever, Campbell Soup Company, Monsanto, Kraft Foods Group, The Hershey Company and PepsiCo. These persistent contradictions between corporate political activity, corporate sustainability policies and the public interest are a regular aspect of our corporate dialogues.
8
THE WAY YOU INVEST MATTERS®
Choosing Local and Organic
The most responsible alternative to pesticides and genetic engineering, of course, is organic agriculture. It is not possible to speak about the dramatic growth of the market for organic foods without mentioning Whole Foods Market, reportedly the largest seller of organic produce in the country. The company also has a notable commitment to local food producers. The company reports that in 2013 approximately 25 percent of its produce came from local farms and that it disbursed $10 million in loans to 147 local producers. The company also has a strong commitment to GMO labeling and has received consistently high marks for its seafood practices from Greenpeace.
United Natural Foods, an important supplier to Whole Foods, reports that it is the largest wholesale trader of organic foods in the U.S., and the nation’s leading distributor of organic fresh produce and perishable items. The company supports GMO labeling and helped to launch the Non-GMO Project, which maintains a GMO verification and labeling program.
Casino Guichard-Perrachon (France) operates more than 11,000 supermarkets and convenience stores in France, Latin America and Southeast Asia. Founded in 1898, the company has made impressive commitments to the environment, to local farmers and to consumers, through budget-conscious private label products and improved nutritional content. It has also been steadily increasing its organic product offerings. The company maintains a consistent “no-GMO” policy and eliminated palm oil from 73 percent of its Casino-branded products by 2012. It has also launched a number of commitments to local sourcing, and has developed various partnerships with local small-scale farmers, including providing funding in times of financial stress. In Colombia, as of 2010, the company’s local subsidiary procured 88 percent of its products from local small and medium-sized enterprises.
Deforestation
Deforestation is one of the principal drivers of climate change, accounting for 17 percent of greenhouse gas emissions. The Consumer Goods Forum, an industry association, has acknowledged that “the consumer goods industry, through its growing use of soya, palm oil, beef, paper and board, creates many of the economic incentives which drive deforestation.” The Forum has committed to mobilize resources to achieve “zero net deforestation,” and although the term “net” deforestation is cause for concern because it implies that one forest is interchangeable for another, the industry’s acknowledgment of its impact is a hopeful sign. All 400 members of the Forum, representing all the world’s major consumer goods manufacturers, retailers and service providers, have committed to zero net deforestation by 2020.
9
THE WAY YOU INVEST MATTERS®
Corporations like Mondelēz International and PepsiCo purchase significant quantities of these commodities through supply chains that may begin in a rainforest in Indonesia or a farm in Brazil. Climate change impacts from deforestation and poor forest management can be reduced through increased use of recycled materials, independent third party certification schemes, and monitoring of supply chains.
The shareholder proposal is an effective tool for encouraging corporate management to come to the table to discuss our concerns. We developed a proposal that we have submitted to several of the largest food companies, asking for public reports assessing each company’s impact on deforestation and its plans to mitigate these risks. We’ve asked these companies to report on their impact by commodity, as each carries its own set of risks and possible solutions. Among these commodities, palm oil has received the most attention because its production is responsible for large-scale forest conversion in the tropics and extensive carbon emissions.
In January, Mondelēz International (Oreo, Nutter Butter and Ritz Crackers) updated its website to address deforestation in its supply chain — a direct response to our shareholder proposal. These new disclosures were followed by the publication of an action plan to ensure that all palm oil is produced on legally held land without the use of forced or child labor. We are currently in dialogue on these policies, encouraging the company to provide more robust data to its investors.
Our shareholder proposal also brought PepsiCo to the table. Although best known for its iconic namesake, Pepsi now offers a diversified line of brands including Frito-Lay, Quaker Oats, Tropicana, Izze, and Sabra hummus. In May, after we withdrew our shareholder proposal and in the face of a continuing campaign led by Rainforest Action Network, the company adopted forestry and palm oil policies, including a number of notable commitments. We will continue to work with Pepsi to discuss how these commitments will be implemented and publicly reported.
Unilever, the owner of numerous brands, including Ben & Jerry’s and Lipton tea, is among the world’s largest consumers of palm oil, using 1.5 million tons a year to make products such as Dove soap, Magnum ice cream and Vaseline lotion, representing about 3 percent of global production. The company has set a target of buying all of its palm oil from traceable sources by 2020, meaning that the company will be able to track all of the oil it buys back to the plantation on which it was grown. Traceability is a key concern in this area and a number of companies have made similar commitments.
Like many companies of Unilever’s size, we see numerous causes for both praise and concern. In September 2013, Domini publicly endorsed Oxfam International’s “Behind the Brands” campaign, an assessment of the ten
10
THE WAY YOU INVEST MATTERS®
largest food companies on a range of issues, including climate change and the rights of farmers and women. In Oxfam’s latest report from February 2014, Unilever ranked second out of the ten food companies scored, with an overall rating of “fair.” Unilever was the first company to be awarded a “good” score for its impact on farmers. According to Oxfam, “Farmers are likely to get a better deal with Unilever than with many companies. The company understands farmers’ issues and is addressing them. More could be done to ensure suppliers’ are treating farmers fairly, however.” Oxfam also noted actions taken on climate change and water usage, and new commitments on land rights supporting women.
The big news in the palm oil industry this year was the adoption of forestry and human rights policies by Wilmar International, Golden Agri-Resources and Cargill, three of the largest palm oil traders. Although none of these companies are currently approved for the Domini Funds’ portfolios, we remain cautiously optimistic that these policies will bring meaningful change to the palm oil industry, a $44 billion industry that currently presents severe risks to forests and human rights. Much credit is due to the persistent work of committed activists, including Rainforest Action Network, Greenpeace and Oxfam, as well as concerned social investors.
* * *
Consider this report to be a work in progress. None of the companies cited here are without controversy and few of these problems will be solved overnight. In addition, the issues discussed here just scratch the surface. As diversified investors, however, we must wrestle with all of these issues — from risks to critical ecosystems to labor rights.
The issues presented by global food production are serious, but there has never been such a bright spotlight shining on them, giving us hope for continued progress. In the meantime, we will continue to monitor corporate behavior and use our influence when we see an opportunity to ensure that your concerns are addressed.
The holdings discussed above can be found in the portfolios of the Domini Funds, included herein. Bayer, Dow Chemical, DuPont, Golden Agri-Resources, Hershey, Monsanto, Syngenta, Walmart and Wilmar International are not currently approved for, or held by, any of the Domini Funds. Cargill is privately held and is therefore ineligible for investment. As of July 31, 2014, Campbell’s, Lindt & Sprüngli, Nissin Foods, United Natural Foods and WhiteWave Foods were not held by any of the Domini Funds. The composition of the Funds’ portfolios is subject to change.
An investment in the Domini Social Equity Fund and the Domini International Social Equity Fund is subject to market risks such as sector concentration and style risk. Investing internationally involves special risks, such as currency fluctuations, social and economic instability, differing securities regulations and accounting standards, limited public information, possible changes in taxation, and periods of illiquidity. You may lose money.
The preceding profiles should not be deemed an offer to sell or a solicitation of an offer to buy the stock or bonds of any of the companies noted, or a recommendation concerning the merits of any of these companies as an investment.
This material must be preceded or accompanied by a current prospectus. DSIL Investment Services LLC, Distributor. 09/14
11
Performance Commentary (Unaudited)
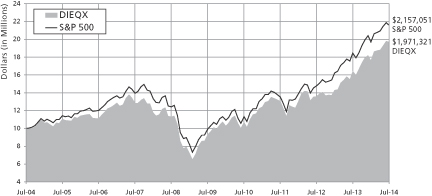
For the year ended July 31, 2014, the Fund’s Investor shares gained 20.07%, outperforming the S&P 500 Index, which returned 16.94%.
The Fund is managed through a two-step process designed to capitalize on the strengths of Domini Social Investments and Wellington Management. Domini creates an approved list of companies based on its social, environmental and governance analysis, and Wellington then utilizes a systematic and disciplined process to manage the portfolio.
The environment over the past year was especially conducive for the Fund’s approach, which seeks to identify stocks that we believe will outperform based on defined quantitative factors, such as valuation, quality and momentum. In this period, these factors were very effective and contributed to the relative outperformance, aided by improving macroeconomic conditions in the United States. A modest number of ADR (American depository receipt) positions in European and Asian companies, such as Shire PLC, also boosted relative results.
Individual stock selection, as opposed to our exposure to specific industries, drove the fiscal year’s relative outperformance. Stock selection within the health care, industrials, information technology and telecommunications sectors was particularly beneficial to performance.
Top contributors to performance relative to the S&P 500 included: Southwest Airlines, a passenger airline that saw its shares rise after the company posted impressive fourth quarter 2013 results driven by higher unit revenue growth, lower total unit costs and more capacity; Shire, an Irish specialty pharmaceutical company that beat expectations in the first quarter of 2014 due to a combination of strong product sales and cost discipline, along with speculation of a proposed acquisition by AbbVie that valued the company at a large premium to its pre-announcement market price; and Mylan, a global pharmaceutical company that saw its shares rise as the company performed above expectations after its Agila acquisition and the FDA’s new guidance on generic drug Advair, which the company believes will support its development program. Due to these factors, we eliminated our position in Mylan during the period.
The top detractors from relative performance during the period included: Coach, an international accessory retailer that saw its shares fall as declining market share, weak online revenues and margin compression in the North American handbag segment lowered future sales expectations; J.M. Smucker, a manufacturer and marketer of branded food products that saw profits fall as lower coffee prices weighed on sales; and AGCO, an agricultural equipment manufacturer that saw its shares fall as a result of a decline in earnings and falling commodity prices reducing demand for agricultural equipment.
12
TEN LARGEST HOLDING (Unaudited)
| SECURITY DESCRIPTION | % NET ASSETS | SECURITY DESCRIPTION | % NET ASSETS | |||||||
| Microsoft Corporation | 4.2% | Kroger Co/The | 2.7% | |||||||
| Intel Corp | 3.3% | National Oilwell Varco Inc | 2.5% | |||||||
| Apache Corp | 3.1% | Celgene Corp | 2.5% | |||||||
| Eli Lilly & Co | 3.1% | Consolidated Edison Inc | 2.4% | |||||||
| Apple Inc | 3.1% | Southwest Airlines Co | 2.4% | |||||||
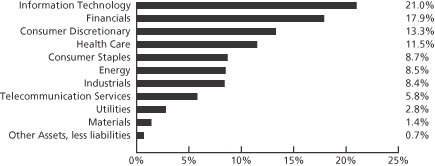
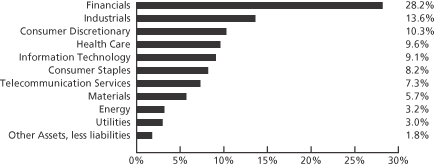
PORTFOLIO HOLDINGS BY INDUSTRY SECTOR (% OF NET ASSETS) (Unaudited)
13
| AVERAGE ANNUAL TOTAL RETURNS (Unaudited) | Investor shares | S&P 500 | ||||
| As of 7/31/14 | 1 Year | 20.07% | 16.94% | |||
| 5 Year | 16.13% | 16.79% | ||||
| 10 Year | 7.02% | 8.00% | ||||
| Since Inception (6/3/91) | 8.71% | 9.36% | ||||
COMPARISON OF $10,000 INVESTMENT IN THE DOMINI SOCIAL EQUITY FUND INVESTOR SHARES AND S&P 500 (Unaudited)
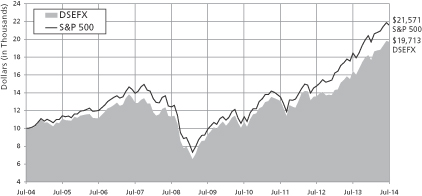
Past performance is no guarantee of future results. The Fund’s returns quoted above represent past performance after all expenses. Investment return, principal value, and yield will fluctuate. Your shares, when redeemed, may be worth more or less than their original cost. Call 1-800-582-6757 or visit www.domini.com for performance information current to the most recent month-end, which may be lower or higher. A 2.00% fee applies on sales/exchanges made less than 30 days after purchase/exchange, with certain exceptions. Quoted performance data does not reflect the deduction of this fee, which would reduce the performance quoted. See the Fund’s prospectus for further information.
The Fund’s gross annual operating expenses totaled 1.20% of net assets as of 7/31/14. Until 11/30/14, the Fund’s Manager has contractually agreed to limit certain ordinary Investor share expenses to 1.25% of its average daily net assets per annum, absent an earlier modification by the Fund’s Board.
The table and the graph do not reflect the deduction of taxes that a shareholder would pay on Fund distributions or the redemption of Fund shares. The graph illustrates the growth of a hypothetical $10,000 initial investment. Total return for the Domini Social Equity Fund is based on the Fund’s net asset values and assumes all dividend and capital gains were reinvested. An investment in the Fund is not a bank deposit and is not insured. The Fund is subject to market risks such as sector concentration and style risk. You may lose money.
The Standard & Poor’s 500 Index (S&P 500) is an unmanaged index of common stocks. Investors cannot invest directly in the S&P 500.
14
| AVERAGE ANNUAL TOTAL RETURNS (Unaudited) | ||||||||
| Class A shares (with 4.75% maximum Sales Charge) | Class A shares (without Sales Charge) | S&P 500 | ||||||
| As of 7/31/14 | 1 Year | 14.46% | 20.17% | 16.94% | ||||
| 5 Year | 15.05% | 16.18% | 16.79% | |||||
| 10 Year* | 6.50% | 7.02% | 8.00% | |||||
| Since Inception (6/3/91)* | 8.48% | 8.71% | 9.36% | |||||
COMPARISON OF $10,000 INVESTMENT IN THE DOMINI SOCIAL EQUITY FUND CLASS A SHARES AND S&P 500 (WITH 4.75% MAXIMUM SALES CHARGE)* (Unaudited)
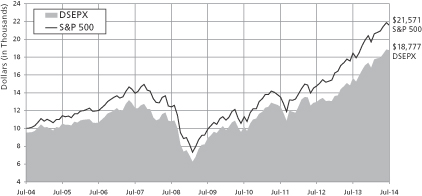
Past performance is no guarantee of future results. The Fund’s returns quoted above represent past performance after all expenses. Investment return, principal value, and yield will fluctuate. Your shares, when redeemed, may be worth more or less than their original cost. Call 1-800-498-1351 or visit www.domini.com for performance information current to the most recent month-end, which may be lower or higher. A 2.00% fee applies on sales/exchanges made less than 30 days after purchase/exchange, with certain exceptions. Quoted performance data does not reflect the deduction of this fee, which would reduce the performance quoted. See the Fund’s prospectus for further information.
The Fund’s gross annual operating expenses totaled 1.54% of net assets as of 7/31/14. Until 11/30/14, the Fund’s Manager has contractually agreed to limit certain ordinary A share expenses to 1.18% of its average daily net assets per annum absent an earlier modification by the Fund’s Board. The Fund’s total return would have been lower without this limit.
The table and the graph do not reflect the deduction of taxes that a shareholder would pay on Fund distributions or the redemption of Fund shares. The graph illustrates the growth of a hypothetical $10,000 initial investment. Total return for the Domini Social Equity Fund is based on the Fund’s net asset values and assumes all dividend and capital gains were reinvested. An investment in the Fund is not a bank deposit and is not insured. The Fund is subject to market risks such as sector concentration and style risk. You may lose money.
The Standard & Poor’s 500 Index (S&P 500) is an unmanaged index of common stocks. Investors cannot invest directly in the S&P 500.
*Class A shares were not offered prior to November 28, 2008. All performance information for time periods beginning prior to November 28, 2008 is the performance of the Investor shares. This performance has not been adjusted to reflect the lower expenses of the Class A shares, but does, where noted, reflect an adjustment for the maximum applicable sales charge of 4.75%.
15
| AVERAGE ANNUAL TOTAL RETURNS (Unaudited) | Institutional shares | S&P 500 | ||||
| As of 7/31/14 | 1 Year | 20.59% | 16.94% | |||
| 5 Year | 16.65% | 16.79% | ||||
| 10 Year* | 7.02% | 8.00% | ||||
| Since Inception (6/3/91)* | 8.71% | 9.36% | ||||
COMPARISON OF $1 MILLION INVESTMENT IN THE DOMINI SOCIAL EQUITY FUND INSTITUTIONAL SHARES AND S&P 500* (Unaudited)
Past performance is no guarantee of future results. The Fund’s returns quoted above represent past performance after all expenses. Investment return, principal value, and yield will fluctuate. Your shares, when redeemed, may be worth more or less than their original cost. Call 1-800-498-1351 or visit www.domini.com for performance information current to the most recent month-end, which may be lower or higher. A 2.00% fee applies on sales/exchanges made less than 30 days after purchase/exchange, with certain exceptions. Quoted performance data does not reflect the deduction of this fee, which would reduce the performance quoted. See the Fund’s prospectus for further information.
The Fund’s gross annual operating expenses totaled 0.81% of net assets as of 7/31/14. Until 11/30/14, the Fund’s Manager has contractually agreed to limit certain ordinary Institutional share expenses to 0.80% of its average daily net assets per annum absent an earlier modification by the Fund’s Board. The Fund’s total return would have been lower without this limit.
The table and the graph do not reflect the deduction of taxes that a shareholder would pay on Fund distributions or the redemption of Fund shares. The graph illustrates the growth of a hypothetical $1,000,000 initial investment. Total return for the Domini Social Equity Fund is based on the Fund’s net asset values and assumes all dividend and capital gains were reinvested. An investment in the Fund is not a bank deposit and is not insured. The Fund is subject to market risks such as sector concentration and style risk. You may lose money.
The Standard & Poor’s 500 Index (S&P 500) is an unmanaged index of common stocks. Investors cannot invest directly in the S&P 500.
*Institutional shares were not offered prior to November 28, 2008. All performance information for time periods beginning prior to November 28, 2008 is the performance of the Investor shares. This performance has not been adjusted to reflect the lower expenses of the Institutional shares.
16
| AVERAGE ANNUAL TOTAL RETURNS (Unaudited) | Class R shares | S&P 500 | ||||
| As of 7/31/14 | 1 Year | 20.52% | 16.94% | |||
| 5 Year | 16.54% | 16.79% | ||||
| 10 Year | 7.38% | 8.00% | ||||
| Since Inception (6/3/91)* | 8.87% | 9.36% | ||||
COMPARISON OF $10,000 INVESTMENT IN THE DOMINI SOCIAL EQUITY FUND CLASS R SHARES AND S&P 500*(Unaudited)

Past performance is no guarantee of future results. The Fund’s returns quoted above represent past performance after all expenses. Investment return, principal value, and yield will fluctuate. Your shares, when redeemed, may be worth more or less than their original cost. Call 1-800-498-1351 or visit www.domini.com for performance information current to the most recent month-end, which may be lower or higher. A 2.00% fee applies on sales/exchanges made less than 30 days after purchase/exchange, with certain exceptions. Quoted performance data does not reflect the deduction of this fee, which would reduce the performance quoted. See the Fund’s prospectus for further information.
The Fund’s gross annual operating expenses totaled 0.90% of net assets as of 7/31/14. Until 11/30/14, the Fund’s Manager has contractually agreed to limit certain ordinary R share expenses to 0.90% of its average daily net assets per annum absent an earlier modification by the Fund’s Board.
The table and the graph do not reflect the deduction of taxes that a shareholder would pay on Fund distributions or the redemption of Fund shares. The graph illustrates the growth of a hypothetical $10,000 initial investment. Total return for the Domini Social Equity Fund is based on the Fund’s net asset values and assumes all dividend and capital gains were reinvested. An investment in the Fund is not a bank deposit and is not insured. The Fund is subject to market risks such as sector concentration and style risk. You may lose money.
The Standard & Poor’s 500 Index (S&P 500) is an unmanaged index of common stocks. Investors cannot invest directly in the S&P 500.
*Class R shares were not offered prior to November 28, 2003. All performance information for time periods beginning prior to November 28, 2003 is the performance of the Investor shares. This performance has not been adjusted to reflect the lower expenses of the Class R shares.
17
DOMINI SOCIAL EQUITY FUND
PORTFOLIOOF INVESTMENTS
July 31, 2014
| SECURITY | SHARES | VALUE | ||||||
Common Stocks – 99.3% |
| |||||||
Consumer Discretionary – 13.3% |
| |||||||
Amazon.com Inc (a) | 29 | $ | 9,077 | |||||
AutoZone Inc (a) | 7,500 | 3,877,725 | ||||||
Bed Bath & Beyond Inc (a) | 256,100 | 16,208,569 | ||||||
Best Buy Co Inc | 866 | 25,746 | ||||||
Brinker International Inc | 51,300 | 2,300,292 | ||||||
Buckle Inc/The | 43,100 | 1,917,950 | ||||||
Chipotle Mexican Grill Inc (a) | 11,635 | 7,824,538 | ||||||
Coach Inc | 133 | 4,596 | ||||||
DIRECTV (a) | 233,300 | 20,075,465 | ||||||
Expedia Inc | 66,100 | 5,249,662 | ||||||
FUJIFILM Holdings Corp ADR | 92,900 | 2,648,579 | ||||||
Fossil Group Inc (a) | 58,800 | 5,762,400 | ||||||
Gap Inc/The | 255,545 | 10,249,910 | ||||||
Harman International Industries Inc | 23,100 | 2,507,505 | ||||||
Home Depot Inc/The | 218 | 17,625 | ||||||
JC Penney Co Inc (a) | 1,546 | 14,501 | ||||||
Johnson Controls Inc | 283 | 13,369 | ||||||
Kohl’s Corp | 405,600 | 21,715,824 | ||||||
L Brands Inc | 219 | 12,695 | ||||||
Lowe’s Cos Inc | 364 | 17,417 | ||||||
Macy’s Inc | 78,100 | 4,513,399 | ||||||
McDonald’s Corp | 101 | 9,551 | ||||||
Michael Kors Holdings Ltd (a) | 88,600 | 7,219,128 | ||||||
NIKE Inc Cl B | 188 | 14,500 | ||||||
PetSmart Inc | 63,800 | 4,347,332 | ||||||
Priceline Group Inc/The (a) | 5,800 | 7,206,210 | ||||||
Scholastic Corp | 316 | 11,193 | ||||||
Staples Inc | 666 | 7,719 | ||||||
Starbucks Corp | 207 | 16,080 | ||||||
TJX Cos Inc/The | 37,500 | 1,998,375 | ||||||
Target Corp | 181 | 10,786 | ||||||
Tiffany & Co | 152 | 14,837 | ||||||
TripAdvisor Inc (a) | 28,200 | 2,674,488 | ||||||
Viacom Inc Cl B | 23,900 | 1,975,813 | ||||||
Walt Disney Co/The | 56,742 | 4,873,003 | ||||||
|
| |||||||
| 135,345,859 | ||||||||
|
| |||||||
| SECURITY | SHARES | VALUE | ||||||
Consumer Staples – 8.7% |
| |||||||
Avon Products Inc | 374 | $ | 4,937 | |||||
Coca-Cola Co/The | 292 | 11,473 | ||||||
Costco Wholesale Corp | 120 | 14,105 | ||||||
Delhaize Group SA ADR | 226,400 | 3,674,472 | ||||||
Estee Lauder Cos Inc/The Cl A | 63,600 | 4,672,056 | ||||||
JM Smucker Co/The | 195,400 | 19,469,656 | ||||||
Kellogg Co | 85,800 | 5,133,414 | ||||||
Keurig Green Mountain Inc | 44,400 | 5,296,032 | ||||||
Kimberly-Clark Corp | 21,241 | 2,206,303 | ||||||
Koninklijke Ahold NV ADR | 586,800 | 10,251,396 | ||||||
Kraft Foods Group Inc | 223 | 11,949 | ||||||
Kroger Co/The | 555,430 | 27,204,961 | ||||||
Mondelez International Inc Cl A | 265 | 9,540 | ||||||
PepsiCo Inc | 161 | 14,184 | ||||||
Procter & Gamble Co/The | 155 | 11,985 | ||||||
Sysco Corp | 293,100 | 10,460,739 | ||||||
Whole Foods Market Inc | 248 | 9,479 | ||||||
|
| |||||||
| 88,456,681 | ||||||||
|
| |||||||
Energy – 8.5% | ||||||||
ARC Resources Ltd | 380 | 10,486 | ||||||
Apache Corp | 309,591 | 31,782,612 | ||||||
Concho Resources Inc (a) | 100 | 14,080 | ||||||
National Oilwell Varco Inc | 316,120 | 25,618,365 | ||||||
Newfield Exploration Co (a) | 58,300 | 2,349,490 | ||||||
Noble Energy Inc | 170 | 11,303 | ||||||
Oil States International Inc (a) | 158,100 | 9,689,949 | ||||||
Penn West Petroleum Ltd | 915 | 7,073 | ||||||
Pioneer Natural Resources Co | 88 | 19,488 | ||||||
18
DOMINI SOCIAL EQUITY FUND
PORTFOLIOOF INVESTMENTS (continued)
July 31, 2014
| SECURITY | SHARES | VALUE | ||||||
Energy (Continued) |
| |||||||
Southwestern Energy Co (a) | 424,237 | $ | 17,215,537 | |||||
|
| |||||||
| 86,718,383 | ||||||||
|
| |||||||
Financials – 17.9% |
| |||||||
American Capital Agency Corp | 110,000 | 2,543,200 | ||||||
American Express Co | 191 | 16,808 | ||||||
Apollo Investment Corp | 1,851,500 | 15,719,235 | ||||||
Brandywine Realty Trust | 164,600 | 2,559,530 | ||||||
E*TRADE Financial Corp (a) | 153,600 | 3,228,672 | ||||||
Generac Holdings Inc (a) | 82,360 | 3,574,424 | ||||||
Genworth Financial Inc Cl A (a) | 173,000 | 2,266,300 | ||||||
Hartford Financial Services Group Inc/The | 596,600 | 20,379,856 | ||||||
Hatteras Financial Corp | 315,100 | 6,034,165 | ||||||
ING Groep NV ADR (a) | 196,800 | 2,552,496 | ||||||
Invesco Mortgage Capital Inc | 153,900 | 2,613,222 | ||||||
KeyCorp | 333,200 | 4,511,528 | ||||||
Kimco Realty Corp | 453,200 | 10,142,616 | ||||||
Lincoln National Corp | 162,300 | 8,502,897 | ||||||
MFA Financial Inc | 927,600 | 7,550,664 | ||||||
MetLife Inc | 107,900 | 5,675,540 | ||||||
PNC Financial Services Group Inc/The | 195,490 | 16,139,654 | ||||||
Piedmont Office Realty Trust Inc Cl A | 792,200 | 15,408,290 | ||||||
Prudential Financial Inc | 202,800 | 17,637,516 | ||||||
Retail Properties of America Inc Cl A | 282,600 | 4,253,130 | ||||||
Symetra Financial Corp | 145,300 | 3,312,840 | ||||||
Two Harbors Investment Corp | 722,600 | 7,392,198 | ||||||
| SECURITY | SHARES | VALUE | ||||||
Financials (Continued) |
| |||||||
US Bancorp/MN | 346 | $ | 14,542 | |||||
Unum Group | 556,700 | 19,111,511 | ||||||
|
| |||||||
| 181,140,834 | ||||||||
|
| |||||||
Health Care – 11.5% |
| |||||||
Alexion Pharmaceuticals Inc (a) | 40,900 | 6,502,691 | ||||||
Becton Dickinson and Co | 128 | 14,879 | ||||||
CR Bard Inc | 18,000 | 2,686,140 | ||||||
CareFusion Corp (a) | 94,200 | 4,125,018 | ||||||
Celgene Corp (a) | 292,600 | 25,500,090 | ||||||
Edwards Lifesciences Corp (a) | 30,000 | 2,707,500 | ||||||
Eli Lilly & Co | 513,200 | 31,335,992 | ||||||
Gilead Sciences Inc (a) | 216,700 | 19,838,885 | ||||||
Hospira Inc (a) | 57,800 | 3,206,166 | ||||||
Novartis AG ADR | 161,000 | 13,997,340 | ||||||
Novo Nordisk A/S ADR | 67,200 | 3,094,560 | ||||||
Owens & Minor Inc | 110,100 | 3,643,209 | ||||||
|
| |||||||
| 116,652,470 | ||||||||
|
| |||||||
Industrials – 8.4% | ||||||||
3M Co | 115 | 16,202 | ||||||
AGCO Corp | 340,500 | 16,585,755 | ||||||
Cummins Inc | 83 | 11,569 | ||||||
Deere & Co | 162,800 | 13,855,908 | ||||||
Emerson Electric Co | 38,400 | 2,444,160 | ||||||
First Solar Inc (a) | 358 | 22,593 | ||||||
Herman Miller Inc | 422 | 12,339 | ||||||
Interface Inc | 692 | 10,968 | ||||||
JetBlue Airways Corp (a) | 1,688 | 18,095 | ||||||
Pitney Bowes Inc | 549,300 | 14,864,058 | ||||||
RR Donnelley & Sons Co | 739,829 | 12,843,431 | ||||||
Southwest Airlines Co | 856,754 | 24,229,003 | ||||||
United Parcel Service Inc Cl B | 131 | 12,719 | ||||||
|
| |||||||
| 84,926,800 | ||||||||
|
| |||||||
19
DOMINI SOCIAL EQUITY FUND
PORTFOLIOOF INVESTMENTS (continued)
July 31, 2014
| SECURITY | SHARES | VALUE | ||||||
Information Technology – 21.0% |
| |||||||
Advanced Micro Devices Inc (a) | 3,150 | $ | 12,317 | |||||
Apple Inc | 324,630 | 31,024,889 | ||||||
Applied Materials Inc | 762 | 15,972 | ||||||
Cisco Systems Inc | 504 | 12,716 | ||||||
EMC Corp/MA | 373 | 10,929 | ||||||
F5 Networks Inc (a) | 66,300 | 7,464,717 | ||||||
Facebook Inc Cl A (a) | 71,500 | 5,194,475 | ||||||
Google Inc Cl A (a) | 2,016 | 1,168,373 | ||||||
Google Inc Cl C (a) | 3,016 | 1,723,946 | ||||||
Intel Corp | 985,541 | 33,399,984 | ||||||
International Business Machines Corp | 72,452 | 13,886,875 | ||||||
MasterCard Inc Cl A | 173,800 | 12,887,270 | ||||||
Microsoft Corp | 983,339 | 42,440,911 | ||||||
Motorola Solutions Inc | 201 | 12,800 | ||||||
NVIDIA Corp | 645,500 | 11,296,250 | ||||||
Oracle Corp | 423,600 | 17,109,204 | ||||||
Power Integrations Inc | 260 | 13,996 | ||||||
QUALCOMM Inc | 134,700 | 9,927,390 | ||||||
SanDisk Corp | 76,400 | 7,006,644 | ||||||
SunPower Corp (a) | 1,124 | 41,285 | ||||||
Symantec Corp | 141,700 | 3,352,622 | ||||||
Texas Instruments Inc | 300 | 13,875 | ||||||
United Microelectronics Corp ADR | 1,786,000 | 3,911,340 | ||||||
Western Digital Corp | 112,400 | 11,220,892 | ||||||
| SECURITY | SHARES | VALUE | ||||||
Information Technology (Continued) |
| |||||||
Xerox Corp | 1,209 | $ | 16,031 | |||||
Yahoo! Inc (a) | 649 | 23,241 | ||||||
|
| |||||||
| 213,188,944 | ||||||||
|
| |||||||
Materials – 1.4% |
| |||||||
Domtar Corp | 395,200 | 14,195,584 | ||||||
MeadWestvaco Corp | 329 | 13,752 | ||||||
Nucor Corp | 230 | 11,551 | ||||||
|
| |||||||
| 14,220,887 | ||||||||
|
| |||||||
Telecommunication Services – 5.8% |
| |||||||
AT&T Inc | 63,535 | 2,261,211 | ||||||
CenturyLink Inc | 594,900 | 23,343,876 | ||||||
Frontier Communications Corp | 2,767,000 | 18,123,850 | ||||||
KT Corp ADR | 576,500 | 9,258,590 | ||||||
Spark New Zealand Ltd ADR | 321,100 | 3,838,751 | ||||||
TELUS Corp | 63,700 | 2,223,130 | ||||||
Verizon Communications Inc | 263 | 13,260 | ||||||
|
| |||||||
| 59,062,668 | ||||||||
|
| |||||||
Utilities – 2.8% | ||||||||
Cia Paranaense de Energia ADR | 208,300 | 3,236,982 | ||||||
Consolidated Edison Inc | 441,900 | 24,786,171 | ||||||
Energen Corp | 187 | 15,265 | ||||||
|
| |||||||
| 28,038,418 | ||||||||
|
| |||||||
Total Common Stocks – 99.3% |
| 1,007,751,944 | ||||||
Other Assets, less liabilities – 0.7% |
| 7,285,791 | ||||||
|
| |||||||
Net Assets – 100.0% |
| $ | 1,015,037,735 | |||||
|
| |||||||
(a) Non-income producing security.
(b) The aggregate cost for federal income tax purposes is $822,604,740. The aggregate gross unrealized appreciation is $200,964,449 and the aggregate gross unrealized depreciation is $15,817,245, resulting in net unrealized appreciation of $185,147,204.
ADR — American Depository Receipt
SEE NOTES TO FINANCIAL STATEMENTS
20
DOMINI INTERNATIONAL SOCIAL EQUITY FUND
Performance Commentary (Unaudited)
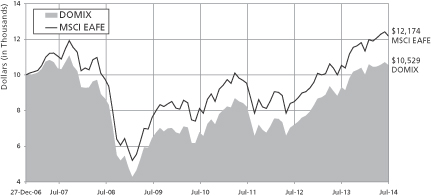
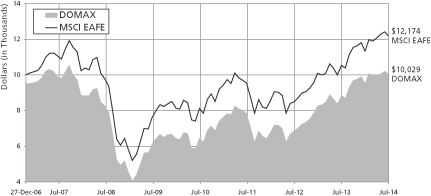
For the year ended July 31, 2014, the Fund’s Investor shares gained 13.15%, underperforming the MSCI EAFE Index, which returned 15.55%.
The Fund is managed through a two-step process designed to capitalize on the strengths of Domini Social Investments and Wellington Management. Domini creates an approved list of companies based on its social, environmental and governance analysis, and Wellington then utilizes a disciplined and systematic process to manage the portfolio.
Performance benefited over the period from a modest tilt toward cheaper, more cyclically-sensitive stocks in Europe and Japan, as investors increasingly took on additional risk following improvement in the macroeconomic conditions of both regions. An overweight to emerging market stocks was also rewarded during the period, as emerging markets rallied to break a prolonged slump. Factors detracting from performance during the period included an overweight to mid-cap stocks, which lagged the rest of the market-capitalization spectrum on a relative basis.
Individual stock selection, rather than our exposure to particular industries, was the predominant contributor to the fiscal year’s relative performance. In particular, the Fund benefited from strong stock selection within the consumer discretionary, information technology and health care sectors.
Top contributors to performance relative to MSCI EAFE included: Shire, an Irish specialty pharmaceutical company that beat expectations in the first quarter of 2014 due to a combination of strong product sales and cost discipline, along with speculation of a proposed acquisition by AbbVie that valued the company at a large premium to its pre-announcement market price; Next, a UK-based retailer that saw its shares rise after reporting strong fiscal year 2013 results highlighted by 24% earnings growth, driven primarily by lower tax charges and boosts from share buybacks; and Orange, a French multinational telecommunications provider that saw its shares rise after the company predicted a key measure of earnings would hold steady after years of decline, along with talk of a possible bid from German rival Deutsche Telekom.
The top detractors from relative performance during the period included: Arrium, an Australian-based international mining and materials company that saw its shares drop as it was impacted by an adverse exchange rate, weaker iron ore prices, delays in long-product demand from infrastructure projects and overall slowing mining activity; Fred Olsen Energy, a Norwegian offshore-drilling contractor that fell after reporting below-consensus results, partially driven by increased operating costs and an operating loss in its Engineering division; and WM Morrison Supermarkets, a UK-based food retailer that fell sharply after management announced a profit warning for the 2014 and 2015
21
fiscal years due to a strong shift in strategy implemented in response to deteriorating sales trends and strong competition from hard discounters.
TEN LARGEST HOLDINGS (Unaudited)
| SECURITY DESCRIPTION | % NET ASSETS | SECURITY DESCRIPTION | % NET ASSETS | |||||||
| Novartis AG | 2.9% | Next plc | 1.8% | |||||||
| BT Group plc | 2.1% | Continental AG | 1.7% | |||||||
| Associated British Foods plc | 2.0% | Otsuka Holdings Co Ltd | 1.7% | |||||||
| Merck KGaA | 1.9% | Dai Nippon Printing Co Ltd | 1.7% | |||||||
| Shire plc | 1.9% | FUJIFILM Holdings Corp | 1.6% | |||||||
PORTFOLIO HOLDINGS BY INDUSTRY SECTOR (% OF NET ASSETS) (Unaudited)
PORTFOLIO HOLDINGS BY COUNTRY (% OF NET ASSETS) (Unaudited)
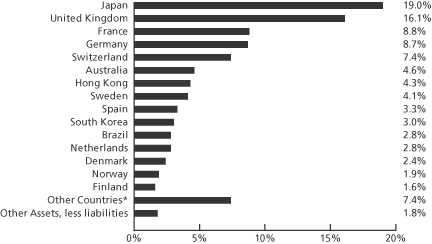
*Other countries include South Africa (1.3%), New Zealand (1.3%), Austria (1.1%), United States (0.9%), China (0.7%), Belgium (0.6%), Taiwan (0.5%), Ireland (0.4%), Malaysia (0.2%), Poland (0.2%), India (0.1%) and Singapore (0.1%).
22
| AVERAGE ANNUAL TOTAL RETURNS (Unaudited) | Investor shares | MSCI EAFE | ||||
| As of 7/31/14 | 1 Year | 13.15% | 15.55% | |||
| 5 Year | 10.32% | 9.88% | ||||
| Since Inception (12/27/06) | 0.68% | 2.62% | ||||
COMPARISON OF $10,000 INVESTMENT IN THE DOMINI INTERNATIONAL SOCIAL EQUITY FUND INVESTOR SHARES AND MSCI EAFE (Unaudited)
Past performance is no guarantee of future results. The Fund’s returns quoted above represent past performance after all expenses. Investment return, principal value, and yield will fluctuate. Your shares, when redeemed, may be worth more or less than their original cost. Call 1-800-582-6757 or visit www.domini.com for performance information current to the most recent month-end, which may be lower or higher. A 2.00% fee applies on sales/exchanges made less than 30 days after purchase/exchange, with certain exceptions. Quoted performance data does not reflect the deduction of this fee, which would reduce the performance quoted. See the Fund’s prospectus for further information.
The Fund’s gross annual operating expenses totaled 1.62% of net assets as of 7/31/14. Until 11/30/14, the Fund’s Manager has contractually agreed to limit certain ordinary Investor share expenses to 1.60% of its average daily net assets per annum absent an earlier modification by the Fund’s Board. The Fund’s total return would have been lower without this limit.
The table and the graph do not reflect the deduction of taxes that a shareholder would pay on Fund distributions or the redemption of Fund shares. The graph illustrates the growth of a hypothetical $10,000 initial investment. Total return for the Domini International Social Equity Fund is based on the Fund’s net asset values and assumes all dividend and capital gains were reinvested. An investment in the Fund is not a bank deposit and is not insured. The Fund is subject to market risks such as sector concentration and style risk. You may lose money.
Investing internationally involves special risks, such as currency fluctuations, social and economic instability, differing securities regulations and accounting standards, limited public information, possible changes in taxation, and periods of illiquidity. These risks are magnified in emerging markets.
The Morgan Stanley Capital International Europe Australasia Far East (MSCI EAFE) index is an unmanaged index of common stocks. Investors cannot invest directly in an index.
23
| AVERAGE ANNUAL TOTAL RETURNS (Unaudited) | ||||||||
| Class A shares (with 4.75% maximum Sales Charge) | Class A shares (with- out Sales Charge) | MSCI EAFE | ||||||
| As of 7/31/14 | 1 Year | 7.78% | 13.16% | 15.55% | ||||
| 5 Year | 9.29% | 10.36% | 9.88% | |||||
| Since Inception (12/27/06)* | 0.04% | 0.68% | 2.62% | |||||
COMPARISON OF $10,000 INVESTMENT IN THE DOMINI INTERNATIONAL SOCIAL EQUITY FUND CLASS A SHARES AND MSCI EAFE (WITH 4.75% MAXIMUM SALES CHARGE)* (Unaudited)
Past performance is no guarantee of future results. The Fund’s returns quoted above represent past performance after all expenses. Investment return, principal value, and yield will fluctuate. Your shares, when redeemed, may be worth more or less than their original cost. Call 1-800-498-1351 or visit www.domini.com for performance information current to the most recent month-end, which may be lower or higher. A 2.00% fee applies on sales/exchanges made less than 30 days after purchase/exchange, with certain exceptions. Quoted performance data does not reflect the deduction of this fee, which would reduce the performance quoted. See the Fund’s prospectus for further information.
The Fund’s gross annual operating expenses totaled 1.82% of net assets as of 7/31/14. Until 11/30/14, the Fund’s Manager has contractually agreed to limit certain ordinary A share expenses to 1.57% of its average daily net assets per annum absent an earlier modification by the Fund’s Board. The Fund’s total return would have been lower without this limit.
The table and the graph do not reflect the deduction of taxes that a shareholder would pay on Fund distributions or the redemption of Fund shares. The graph illustrates the growth of a hypothetical $10,000 initial investment. Total return for the Domini International Social Equity Fund is based on the Fund’s net asset values and assumes all dividend and capital gains were reinvested. An investment in the Fund is not a bank deposit and is not insured. The Fund is subject to market risks such as sector concentration and style risk. You may lose money.
Investing internationally involves special risks, such as currency fluctuations, social and economic instability, differing securities regulations and accounting standards, limited public information, possible changes in taxation, and periods of illiquidity. These risks are magnified in emerging markets.
The Morgan Stanley Capital International Europe Australasia Far East (MSCI EAFE) index is an unmanaged index of common stocks. Investors cannot invest directly in an index.
*Class A shares were not offered prior to November 28, 2008. All performance information for time periods beginning prior to November 28, 2008 is the performance of the Investor shares. Unless otherwise noted, this performance has not been adjusted to reflect the lower expenses of the Class A shares, but does, where noted, reflect an adjustment for the maximum applicable sales charges of 4.75%.
24
| AVERAGE ANNUAL TOTAL RETURNS (Unaudited) | Institutional shares | MSCI EAFE | ||||
| As of 7/31/14 | 1 Year | 13.60% | 15.55% | |||
| 5 Year* | 10.32% | 9.88% | ||||
| Since Inception (12/27/06)* | 0.68% | 2.62% | ||||
COMPARISON OF $1 MILLION INVESTMENT IN THE DOMINI INTERNATIONAL SOCIAL EQUITY FUND INSTITUTIONAL SHARES AND MSCI EAFE* (Unaudited)

Past performance is no guarantee of future results. The Fund’s returns quoted above represent past performance after all expenses. Investment return, principal value, and yield will fluctuate. Your shares, when redeemed, may be worth more or less than their original cost. Call 1-800-498-1351 or visit www.domini.com for performance information current to the most recent month-end, which may be lower or higher. A 2.00% fee applies on sales/exchanges made less than 30 days after purchase/exchange, with certain exceptions. Quoted performance data does not reflect the deduction of this fee, which would reduce the performance quoted. See the Fund’s prospectus for further information.
The Fund’s gross annual operating expenses totaled 1.16% of net assets as of 7/31/14. Until 11/30/14, the Fund’s Manager has contractually agreed to limit certain ordinary Institutional share expenses to 1.27% of its average daily net assets per annum absent an earlier modification by the Fund’s Board.
The table and the graph do not reflect the deduction of taxes that a shareholder would pay on Fund distributions or the redemption of Fund shares. The graph illustrates the growth of a hypothetical $1,000,000 initial investment. Total return for the Domini International Social Equity Fund is based on the Fund’s net asset values and assumes all dividend and capital gains were reinvested. An investment in the Fund is not a bank deposit and is not insured. The Fund is subject to market risks such as sector concentration and style risk. You may lose money.
Investing internationally involves special risks, such as currency fluctuations, social and economic instability, differing securities regulations and accounting standards, limited public information, possible changes in taxation, and periods of illiquidity. These risks are magnified in emerging markets.
The Morgan Stanley Capital International Europe Australasia Far East (MSCI EAFE) index is an unmanaged index of common stocks. Investors cannot invest directly in an index.
*Institutional shares were not offered prior to November 30, 2012. All performance information for time periods beginning prior to November 28, 2012 is the performance of the Investor shares. Unless otherwise noted, this performance has not been adjusted to reflect the lower expenses of the Institutional shares.
25
DOMINI INTERNATIONAL SOCIAL EQUITY FUND
PORTFOLIOOF INVESTMENTS
July 31, 2014
| COUNTRY/SECURITY | INDUSTRY | SHARES | VALUE | |||||||
Common Stock – 94.6% | ||||||||||
Australia – 4.6% | ||||||||||
Bank of Queensland Ltd | Banks | 186,755 | $ | 2,156,274 | ||||||
Bendigo and Adelaide Bank Ltd | Banks | 170,240 | 2,003,769 | |||||||
Dexus Property Group | Real Estate | 2,447,163 | 2,689,880 | |||||||
GPT Group/The | Real Estate | 164,311 | 618,890 | |||||||
REA Group Ltd | Media | 96,790 | 4,217,289 | |||||||
TPG Telecom Ltd | Telecommunication Services | 419,520 | 2,131,464 | |||||||
|
| |||||||||
| 13,817,566 | ||||||||||
|
| |||||||||
Austria – 1.1% | ||||||||||
EVN AG | Utilities | 73,053 | 1,010,124 | |||||||
Voestalpine AG | Materials | 49,604 | 2,181,247 | |||||||
|
| |||||||||
| 3,191,371 | ||||||||||
|
| |||||||||
Belgium – 0.6% | ||||||||||
Delhaize Group SA | Food & Staples Retailing | 29,215 | 1,904,991 | |||||||
|
| |||||||||
| 1,904,991 | ||||||||||
|
| |||||||||
China – 0.7% | ||||||||||
Beijing Capital International Airport Co Ltd Cl H | Transportation | 492,000 | 338,478 | |||||||
Byd Co Ltd Cl H | Automobiles & Components | 3,000 | 19,841 | |||||||
China Travel International Investment Hong Kong Ltd | Consumer Services | 4,776,000 | 1,137,063 | |||||||
Sino-Ocean Land Holdings Ltd | Real Estate | 1,016,401 | 593,604 | |||||||
|
| |||||||||
| 2,088,986 | ||||||||||
|
| |||||||||
Denmark – 2.4% | ||||||||||
Danske Bank A/S | Banks | 124,909 | 3,606,369 | |||||||
Pandora A/S | Consumer Durables & Apparel | 7,470 | 510,849 | |||||||
Rockwool International A/S Cl B | Capital Goods | 6,669 | 1,111,311 | |||||||
Vestas Wind Systems A/S (a) | Capital Goods | 43,046 | 1,939,570 | |||||||
|
| |||||||||
| 7,168,099 | ||||||||||
|
| |||||||||
Finland – 1.6% | ||||||||||
Neste Oil OYJ | Energy | 217,225 | 4,010,930 | |||||||
Nokia OYJ | Technology Hardware & Equipment | 115,012 | 910,454 | |||||||
|
| |||||||||
| 4,921,384 | ||||||||||
|
| |||||||||
France – 8.8% | ||||||||||
Accor SA | Consumer Services | 27,947 | 1,352,345 | |||||||
AXA SA | Insurance | 184,070 | 4,225,627 | |||||||
Cap Gemini SA | Software & Services | 39,193 | 2,839,785 | |||||||
Casino Guichard Perrachon SA | Food & Staples Retailing | 18,439 | 2,220,620 | |||||||
Cie Generale des Etablissements Michelin | Automobiles & Components | 19,817 | 2,172,211 | |||||||
CNP Assurances | Insurance | 133,651 | 2,623,717 | |||||||
26
DOMINI INTERNATIONAL SOCIAL EQUITY FUND
PORTFOLIOOF INVESTMENTS (continued)
July 31, 2014
| COUNTRY/SECURITY | INDUSTRY | SHARES | VALUE | |||||||
France (Continued) | ||||||||||
Credit Agricole SA | Banks | 272,893 | $ | 3,688,640 | ||||||
Orange SA | Telecommunication Services | 294,069 | 4,601,306 | |||||||
Sanofi | Pharma, Biotech & Life Sciences | 3,950 | 414,389 | |||||||
SCOR SE | Insurance | 52,494 | 1,687,346 | |||||||
Valeo SA | Automobiles & Components | 6,648 | 795,923 | |||||||
|
| |||||||||
| 26,621,909 | ||||||||||
|
| |||||||||
Germany – 7.9% | ||||||||||
Allianz SE | Insurance | 22,606 | 3,760,633 | |||||||
Continental AG | Automobiles & Components | 24,425 | 5,256,151 | |||||||
Deutsche Post AG | Transportation | 131,940 | 4,218,067 | |||||||
Merck KGaA | Pharma, Biotech & Life Sciences | 64,310 | 5,682,473 | |||||||
Muenchener Rueckversicherungs AG | Insurance | 19,291 | 4,089,802 | |||||||
Talanx AG | Insurance | 22,517 | 801,101 | |||||||
|
| |||||||||
| 23,808,227 | ||||||||||
|
| |||||||||
Hong Kong – 4.3% | ||||||||||
Great Eagle Holdings Ltd | Real Estate | 325,585 | 1,171,576 | |||||||
Hongkong Land Holdings Ltd | Real Estate | 507,000 | 3,465,389 | |||||||
Hysan Development Co Ltd | Real Estate | 301,000 | 1,444,679 | |||||||
Jardine Strategic Holdings Ltd | Capital Goods | 16,000 | 571,860 | |||||||
Johnson Electric Holdings Ltd | Capital Goods | 147,625 | 571,448 | |||||||
Sino Land Co Ltd | Real Estate | 1,125,045 | 1,932,664 | |||||||
Swire Pacific Ltd Cl A | Real Estate | 110,500 | 1,421,993 | |||||||
Wheelock & Co Ltd | Real Estate | 470,471 | 2,372,219 | |||||||
|
| |||||||||
| 12,951,828 | ||||||||||
|
| |||||||||
India – 0.1% | ||||||||||
Hero MotoCorp Ltd | Automobiles & Components | 9,593 | 411,737 | |||||||
|
| |||||||||
| 411,737 | ||||||||||
|
| |||||||||
Ireland – 0.4% | ||||||||||
Irish Bank Resolution Corp Ltd/Old (a) (c) | Banks | 138,674 | 0 | |||||||
Smurfit Kappa Group PLC | Materials | 60,293 | 1,307,404 | |||||||
|
| |||||||||
| 1,307,404 | ||||||||||
|
| |||||||||
Japan – 19.0% | ||||||||||
Asahi Glass Co Ltd | Capital Goods | 612,000 | 3,627,645 | |||||||
Astellas Pharma Inc | Pharma, Biotech & Life Sciences | 35,500 | 481,542 | �� | ||||||
Bandai Namco Holdings Inc | Consumer Durables & Apparel | 38,600 | 977,205 | |||||||
Calsonic Kansei Corp | Automobiles & Components | 237,000 | 1,559,188 | |||||||
Central Japan Railway Co | Transportation | 22,400 | 3,182,218 | |||||||
Dai Nippon Printing Co Ltd | Commercial & Professional Services | 487,000 | 4,997,268 | |||||||
Daiwa House Industry Co Ltd | Real Estate | 128,000 | 2,599,058 | |||||||
Fast Retailing Co Ltd | Retailing | 48 | 15,852 | |||||||
FUJIFILM Holdings Corp | Technology Hardware & Equipment | 164,823 | 4,706,380 | |||||||
Honda Motor Co Ltd | Automobiles & Components | 260 | 9,054 | |||||||
Ibiden Co Ltd | Technology Hardware & Equipment | 92,100 | 1,840,882 | |||||||
Kawasaki Kisen Kaisha Ltd | Transportation | 774,000 | 1,650,515 | |||||||
27
DOMINI INTERNATIONAL SOCIAL EQUITY FUND
PORTFOLIOOF INVESTMENTS (continued)
July 31, 2014
| COUNTRY/SECURITY | INDUSTRY | SHARES | VALUE | |||||||
Japan (Continued) | ||||||||||
Konica Minolta Inc | Technology Hardware & Equipment | 131,400 | $ | 1,403,223 | ||||||
MS&AD Insurance Group Holdings Inc | Insurance | 87,400 | 1,990,010 | |||||||
Nippon Electric Glass Co Ltd | Technology Hardware & Equipment | 379,000 | 2,123,956 | |||||||
Nishi-Nippon City Bank Ltd/The | Banks | 169,000 | 438,874 | |||||||
Nissan Motor Co Ltd | Automobiles & Components | 55,800 | 547,580 | |||||||
Nisshin Seifun Group Inc | Food & Beverage | 204,150 | 2,384,743 | |||||||
Nisshin Steel Co Ltd | Materials | 114,980 | 1,552,998 | |||||||
Nomura Real Estate Holdings Inc | Real Estate | 30,900 | 574,292 | |||||||
NTN Corp | Capital Goods | 5,300 | 25,550 | |||||||
ORIX Corp | Diversified Financials | 31,200 | 504,379 | |||||||
Otsuka Holdings Co Ltd | Pharma, Biotech & Life Sciences | 159,500 | 5,080,405 | |||||||
Ricoh Co Ltd | Technology Hardware & Equipment | 106,900 | 1,224,096 | |||||||
Rohm Co Ltd | Semiconductors & Semiconductor Equipment | 11,600 | 654,146 | |||||||
Seiko Epson Corp | Technology Hardware & Equipment | 23,900 | 1,023,359 | |||||||
Seino Holdings Co Ltd | Transportation | 252,693 | 2,717,547 | |||||||
T&D Holdings Inc | Insurance | 61,200 | 768,319 | |||||||
Tokyo Gas Co Ltd | Utilities | 214,000 | 1,222,873 | |||||||
Toppan Printing Co Ltd | Commercial & Professional Services | 577,451 | 4,399,945 | |||||||
Toray Industries Inc | Materials | 1,394 | 9,439 | |||||||
Toyo Seikan Group Holdings Ltd | Materials | 120,300 | 1,874,133 | |||||||
Yamada Denki Co Ltd | Retailing | 119,800 | 425,323 | |||||||
Yamazaki Baking Co Ltd | Food & Beverage | 52,000 | 658,374 | |||||||
|
| |||||||||
| 57,250,371 | ||||||||||
|
| |||||||||
Malaysia – 0.2% | ||||||||||
YTL Corp Bhd | Utilities | 1,217,900 | 597,874 | |||||||
|
| |||||||||
| 597,874 | ||||||||||
|
| |||||||||
Netherlands – 2.8% | ||||||||||
Aegon NV | Insurance | 180,942 | 1,466,228 | |||||||
Akzo Nobel NV | Materials | 40,847 | 2,939,641 | |||||||
Koninklijke Ahold NV | Food & Staples Retailing | 225,481 | 3,928,476 | |||||||
|
| |||||||||
| 8,334,345 | ||||||||||
|
| |||||||||
New Zealand – 1.3% | ||||||||||
Telecom Corp of New Zealand Ltd (d) | Telecommunication Services | 1,594,989 | 3,844,642 | |||||||
|
| |||||||||
| 3,844,642 | ||||||||||
|
| |||||||||
Norway – 1.9% | ||||||||||
DNB ASA | Banks | 92,478 | 1,635,812 | |||||||
Norsk Hydro ASA | Materials | 272,694 | 1,613,684 | |||||||
Subsea 7 SA | Energy | 144,627 | 2,409,836 | |||||||
|
| |||||||||
| 5,659,332 | ||||||||||
|
| |||||||||
28
DOMINI INTERNATIONAL SOCIAL EQUITY FUND
PORTFOLIOOF INVESTMENTS (continued)
July 31, 2014
| COUNTRY/SECURITY | INDUSTRY | SHARES | VALUE | |||||||
Poland – 0.2% | ||||||||||
Orange Polska SA | Telecommunication Services | 174,403 | $ | 575,467 | ||||||
|
| |||||||||
| 575,467 | ||||||||||
|
| |||||||||
Singapore – 0.1% | ||||||||||
Singapore Airlines Ltd | Transportation | 53,000 | 435,406 | |||||||
|
| |||||||||
| 435,406 | ||||||||||
|
| |||||||||
South Africa – 1.3% | ||||||||||
MTN Group Ltd | Telecommunication Services | 190,610 | 3,947,901 | |||||||
Sanlam Ltd | Insurance | 2,531 | 14,365 | |||||||
|
| |||||||||
| 3,962,266 | ||||||||||
|
| |||||||||
South Korea – 3.0% | ||||||||||
GS Holdings | Energy | 52,988 | 2,410,026 | |||||||
Industrial Bank of Korea | Banks | 91,435 | 1,355,684 | |||||||
KT Corp | Telecommunication Services | 75,020 | 2,419,905 | |||||||
SK Hynix Inc (a) | Semiconductors & Semiconductor Equipment | 64,420 | 2,802,886 | |||||||
|
| |||||||||
| 8,988,501 | ||||||||||
|
| |||||||||
Spain – 3.3% | ||||||||||
Acerinox SA | Materials | 177,600 | 2,953,275 | |||||||
Banco Santander SA | Banks | 44,444 | 446,192 | |||||||
Banco Santander SA Rights (a) (c) | Banks | 44,444 | 9,106 | |||||||
Gamesa Corp Tecnologica SA (a) | Capital Goods | 134,681 | 1,685,184 | |||||||
Red Electrica Corp SA | Utilities | 54,505 | 4,679,903 | |||||||
|
| |||||||||
| 9,773,660 | ||||||||||
|
| |||||||||
Sweden – 4.1% | ||||||||||
Atlas Copco AB Cl A | Capital Goods | 440 | 13,113 | |||||||
Hennes & Mauritz AB Cl B | Retailing | 277 | 11,311 | |||||||
Holmen AB Cl B | Materials | 72,009 | 2,422,374 | |||||||
Husqvarna AB Cl B | Consumer Durables & Apparel | 89,365 | 704,070 | |||||||
Investor AB Cl B | Diversified Financials | 72,380 | 2,599,065 | |||||||
Skandinaviska Enskilda Banken AB Cl A | Banks | 122,894 | 1,643,332 | |||||||
Skanska AB Cl B | Capital Goods | 209,819 | 4,354,837 | |||||||
SKF AB Cl B | Capital Goods | 385 | 9,065 | |||||||
TeliaSonera AB | Telecommunication Services | 60,364 | 451,602 | |||||||
|
| |||||||||
| 12,208,769 | ||||||||||
|
| |||||||||
Switzerland – 7.4% | ||||||||||
Aryzta AG | Food & Beverage | 25,919 | 2,342,969 | |||||||
Baloise Holding AG | Insurance | 17,225 | 2,072,725 | |||||||
Clariant AG | Materials | 21,488 | 399,798 | |||||||
Logitech International SA | Technology Hardware & Equipment | 76,076 | 1,115,121 | |||||||
Novartis AG | Pharma, Biotech & Life Sciences | 100,823 | 8,766,154 | |||||||
Swiss Life Holding AG (a) | Insurance | 13,792 | 3,187,447 | |||||||
29
DOMINI INTERNATIONAL SOCIAL EQUITY FUND
PORTFOLIOOF INVESTMENTS (continued)
July 31, 2014
| COUNTRY/SECURITY | INDUSTRY | SHARES | VALUE | |||||||
Switzerland (Continued) | ||||||||||
Swiss Re AG | Insurance | 51,704 | $ | 4,392,569 | ||||||
|
| |||||||||
| 22,276,783 | ||||||||||
|
| |||||||||
Taiwan – 0.5% | ||||||||||
Asustek Computer Inc | Technology Hardware & Equipment | 139,000 | 1,468,863 | |||||||
|
| |||||||||
| 1,468,863 | ||||||||||
|
| |||||||||
United Kingdom – 16.1% | ||||||||||
3i Group PLC | Diversified Financials | 610,898 | 3,880,099 | |||||||
Associated British Foods PLC | Food & Beverage | 131,108 | 6,137,406 | |||||||
Aviva PLC | Insurance | 409,687 | 3,467,093 | |||||||
Barratt Developments PLC | Consumer Durables & Apparel | 301,640 | 1,769,567 | |||||||
Berendsen PLC | Commercial & Professional Services | 106,439 | 1,877,267 | |||||||
BG Group PLC | Energy | 20,954 | 413,197 | |||||||
BT Group PLC | Telecommunication Services | 950,855 | 6,225,147 | |||||||
Hammerson PLC | Real Estate | 324,977 | 3,286,137 | |||||||
InterContinental Hotels Group PLC | Consumer Services | 36,140 | 1,466,227 | |||||||
Kingfisher PLC | Retailing | 87,299 | 440,936 | |||||||
Marks & Spencer Group PLC | Retailing | 1,781 | 12,892 | |||||||
Next PLC | Retailing | 48,516 | 5,537,224 | |||||||
Persimmon PLC | Consumer Durables & Apparel | 62,920 | 1,325,190 | |||||||
Sage Group PLC/The | Software & Services | 164,810 | 1,023,638 | |||||||
Shire PLC | Pharma, Biotech & Life Sciences | 67,849 | 5,584,538 | |||||||
Smith & Nephew PLC | Health Care Equipment & Services | 174,848 | 3,009,083 | |||||||
Taylor Wimpey PLC | Consumer Durables & Apparel | 882,584 | 1,649,698 | |||||||
Travis Perkins PLC | Capital Goods | 24,992 | 703,701 | |||||||
Unilever PLC | Food & Beverage | 16,872 | 728,980 | |||||||
|
| |||||||||
| 48,538,020 | ||||||||||
|
| |||||||||
United States – 0.9% | ||||||||||
Core Laboratories NV | Energy | 18,300 | 2,679,669 | |||||||
|
| |||||||||
| 2,679,669 | ||||||||||
|
| |||||||||
Total Common Stock | 284,787,470 | |||||||||
|
| |||||||||
Preferred Stock – 3.6% | ||||||||||
Brazil – 2.8% | ||||||||||
Banco Bradesco SA | Banks | 175,900 | 2,686,747 | |||||||
Cia Brasileira de Distribuicao | Food & Staples Retailing | 37,000 | 1,788,031 | |||||||
Cia Paranaense de Energia | Utilities | 97,700 | 1,517,737 | |||||||
Itau Unibanco Holding SA | Banks | 157,370 | 2,437,745 | |||||||
|
| |||||||||
| 8,430,260 | ||||||||||
|
| |||||||||
30
DOMINI INTERNATIONAL SOCIAL EQUITY FUND
PORTFOLIOOF INVESTMENTS (continued)
July 31, 2014
| COUNTRY/SECURITY | INDUSTRY | SHARES | VALUE | |||||||
Germany – 0.8% | ||||||||||
Henkel AG & Co KGaA | Household & Personal Products | 20,584 | $ | 2,287,150 | ||||||
|
| |||||||||
| 2,287,150 | ||||||||||
|
| |||||||||
Total Preferred Stock (Cost $9,223,753) | 10,717,410 | |||||||||
|
| |||||||||
Total Investments – 98.2% (Cost $260,546,376) (b) | 295,504,880 | |||||||||
Other Assets, less liabilities – 1.8% | 5,556,668 | |||||||||
|
| |||||||||
Net Assets – 100.0% | $ | 301,061,548 | ||||||||
|
| |||||||||
(a) Non-income producing security.
(b) The aggregate cost for federal income tax purposes is $263,780,345. The aggregate gross unrealized appreciation is $36,910,831 and the aggregate gross unrealized depreciation is $5,186,296, resulting in net unrealized appreciation of $31,724,535.
(c) Securities for which there are no such quotations or valuations are valued at fair value as determined in good faith by or at the direction of the Fund’s Board of Trustees.
(d) Effective August 8, 2014, name changed to Spark New Zealand Ltd.
As of the date of this report, certain foreign securities were fair valued by an independent pricing service under the direction of the Board of Trustees or its delegates in accordance with the Trust’s Valuation and Pricing Policies and Procedures.
SEE NOTES TO FINANCIAL STATEMENTS
31
Performance Commentary (Unaudited)
For the year ended July 31, 2014, the Fund’s Investor shares returned 2.59%, lagging the Barclays Capital Intermediate Aggregate (BCIA) Index, which returned 2.95%.
The primary positive contributor to the Fund’s relative performance came from its Residential Mortgage Backed Securities (“RMBS”) strategies. For most of the fiscal year, the Fund maintained an overweight to 15-year mortgage-backed securities because they are less exposed to mortgage-prepayment and extension risk than are 30-year issues, and because the 30-year RMBS sector is more directly (and adversely) affected by the Fed’s marketplace interventions. The Fund’s overweight to longer-term bonds also made a positive contribution to relative performance during the fiscal year. Lastly, the Fund’s policy not to invest in US Treasuries contributed positively to performance, as most non-Treasury sectors outperformed Treasuries for the fiscal year.
The Fund’s corporate bond exposure was a drag on performance, due to both the particular corporate debt invested in, as well as an overall underweighting in this sector relative to the benchmark. This underweighting was based on our elevated concerns about risk in corporate bonds during the latter half of the fiscal year.
The Fund seeks to play a positive role in the economic development of struggling communities. As part of this ongoing commitment, as of July 31, the Fund had direct investments with 14 community development financial institutions, serving low- to medium-income borrowers across the country.
PORTFOLIO COMPOSITION (% OF NET ASSETS) (Unaudited)
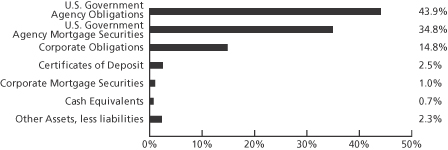
32
| AVERAGE ANNUAL TOTAL RETURNS (Unaudited) | Investor shares | BCIA | ||||
| As of 7/31/14 | 1 Year | 2.59% | 2.95% | |||
| 5 Year | 2.92% | 3.87% | ||||
| 10 Year | 3.80% | 4.44% | ||||
| Since Inception (6/1/00) | 4.68% | 5.39% | ||||
COMPARISON OF $10,000 INVESTMENT IN THE DOMINI SOCIAL BOND FUND INVESTOR SHARES AND BCIA (Unaudited)
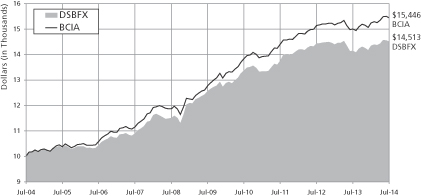
Past performance is no guarantee of future results. The Fund’s returns quoted above represent past performance after all expenses. Investment return, principal value, and yield will fluctuate. Your shares, when redeemed, may be worth more or less than their original cost. Call 1-800-582-6757 or visit www.domini.com for performance information current to the most recent month-end, which may be lower or higher. A 2.00% fee applies on sales/exchanges made less than 30 days after purchase/exchange, with certain exceptions. Quoted performance data does not reflect the deduction of this fee, which would reduce the performance quoted. See the Fund’s prospectus for further information.
The Fund’s gross annual operating expenses totaled 1.24% of net assets as of 7/31/14. Until 11/30/14, the Fund’s Manager has contractually agreed to limit certain ordinary Investor share expenses to 0.95% of its average daily net assets per annum absent an earlier modification by the Fund’s Board. The Fund’s total return would have been lower without this limit.
The table does not reflect the deduction of taxes that a shareholder would pay on Fund distributions or the redemption of Fund shares. The graph illustrates the growth of a hypothetical $10,000 initial investment. Total return for the Domini Social Bond Fund is based on the Fund’s net asset values and assumes all dividend and capital gains were reinvested. An investment in the Fund is not a bank deposit and is not insured. You may lose money.
The Domini Social Bond Fund is not insured and is subject to market risks, interest rate risks, and credit risks. During periods of rising interest rates, bond funds can lose value. The Fund’s community development investments may be unrated and may carry greater risks than the Fund’s other holdings. The Fund currently holds a large percentage of its portfolio in mortgage-backed securities. During periods of falling interest rates these securities may prepay the principal due, which may lower the Fund’s return by causing it to reinvest at lower interest rates.
The Barclays Capital Intermediate Aggregate Index is an unmanaged index of intermediate-duration fixed-income securities. You cannot invest directly in an index.
33
| AVERAGE ANNUAL TOTAL RETURNS (Unaudited) | Institutional shares | BCIA | ||||
| As of 7/31/14 | 1 Year | 2.80% | 2.95% | |||
| 5 Year* | 2.92% | 3.87% | ||||
| 10 Year* | 3.80% | 4.44% | ||||
| Since Inception (6/1/00)* | 4.68% | 5.39% | ||||
COMPARISON OF $500,000 INVESTMENT IN THE DOMINI SOCIAL BOND FUND INSTITUTIONAL SHARES AND BCIA* (Unaudited)
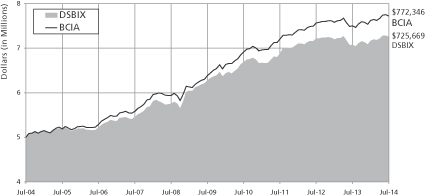
Past performance is no guarantee of future results. The Fund’s returns quoted above represent past performance after all expenses. Investment return, principal value, and yield will fluctuate. Your shares, when redeemed, may be worth more or less than their original cost. Call 1-800-498-1351 or visit www.domini.com for performance information current to the most recent month-end, which may be lower or higher. A 2.00% fee applies on sales/exchanges made less than 30 days after purchase/exchange, with certain exceptions. Quoted performance data does not reflect the deduction of this fee, which would reduce the performance quoted. See the Fund’s prospectus for further information.
The Fund’s gross operating expenses totaled 1.02% of net assets for the period ended 7/31/14. Until 11/30/14, the Fund’s Manager has contractually agreed to limit certain ordinary Institutional share expenses to 0.65% of its average daily net assets per annum absent an earlier modification by the Fund’s Board. The Fund’s total return would have been lower without this limit.
The table does not reflect the deduction of taxes that a shareholder would pay on Fund distributions or the redemption of Fund shares. The graph illustrates the growth of a hypothetical $500,000 initial investment. Total return for the Domini Social Bond Fund is based on the Fund’s net asset values and assumes all dividend and capital gains were reinvested. An investment in the Fund is not a bank deposit and is not insured. You may lose money.
The Domini Social Bond Fund is not insured and is subject to market risks, interest rate risks, and credit risks. During periods of rising interest rates, bond funds can lose value. The Fund’s community development investments may be unrated and may carry greater risks than the Fund’s other holdings. The Fund currently holds a large percentage of its portfolio in mortgage-backed securities. During periods of falling interest rates these securities may prepay the principal due, which may lower the Fund’s return by causing it to reinvest at lower interest rates.
The Barclays Capital Intermediate Aggregate Index is an unmanaged index of intermediate-duration fixed-income securities. You cannot invest directly in an index.
*Institutional shares were not offered prior to November 30, 2011. All performance information for time periods beginning prior to November 30, 2011 is the performance of the Investor shares. This performance has not been adjusted to reflect the lower expenses of the Institutional shares.
34
DOMINI SOCIAL BOND FUND
PORTFOLIOOF INVESTMENTS
July 31, 2014
| Principal Amount | Value (Note 1) | |||||||
U.S. Government Agency Obligations – 43.9% | ||||||||
Freddie Mac: | ||||||||
0.500%, 5/13/2016 (e) | $ | 22,790,000 | $ | 22,770,036 | ||||
2.375%, 1/13/2022 | 17,395,000 | 17,284,176 | ||||||
1.000%, 7/28/2017 | 2,690,000 | 2,685,327 | ||||||
1.250%, 10/2/2019 | 14,765,000 | 14,270,889 | ||||||
|
| |||||||
Total U.S. Government Agency Obligations | 57,010,428 | |||||||
|
| |||||||
U.S. Government Agency Mortgage Securities – 34.8% | ||||||||
Fannie Mae: | ||||||||
190370, 6.000%, 6/1/2036 | 276,304 | 311,553 | ||||||
471333, 3.120%, 8/1/2022 | 1,938,381 | 1,991,940 | ||||||
471478, 2.610%, 8/1/2022 | 1,450,148 | 1,443,711 | ||||||
745044, 4.500%, 8/1/2035 | 112,349 | 121,480 | ||||||
745327, 6.000%, 3/1/2036 | 760,857 | 859,080 | ||||||
889529, 6.000%, 3/1/2038 | 144,157 | 162,260 | ||||||
890248, 6.000%, 8/1/2037 | 59,343 | 67,159 | ||||||
890547, 4.000%, 11/1/2036 | 376,819 | 397,321 | ||||||
930672, 4.500%, 3/1/2039 | 369,688 | 402,686 | ||||||
932441, 4.000%, 1/1/2040 | 1,030,258 | 1,084,607 | ||||||
932871, 3.000%, 1/1/2026 | 1,226,632 | 1,267,790 | ||||||
995082, 5.500%, 8/1/2037 | 239,607 | 268,177 | ||||||
995243, 4.500%, 8/1/2038 | 340,733 | 367,041 | ||||||
AB1343, 4.500%, 8/1/2040 | 314,139 | 342,424 | ||||||
AB1763, 4.000%, 11/1/2030 | 67,637 | 72,143 | ||||||
AB2694, 4.500%, 4/1/2041 | 160,823 | 173,833 | ||||||
AB3274, 4.500%, 7/1/2041 | 619,974 | 672,640 | ||||||
AB4168, 3.500%, 1/1/2032 | 566,566 | 588,808 | ||||||
AB6472, 2.000%, 10/1/2027 | 337,024 | 330,030 | ||||||
AB6644, 2.500%, 10/1/2027 | 37,296 | 37,590 | ||||||
AB7142, 2.500%, 12/1/2027 | 128,981 | 130,001 | ||||||
AB7158, 2.500%, 12/1/2027 | 178,869 | 180,284 | ||||||
AC1877, 4.500%, 9/1/2039 | 185,307 | 199,792 | ||||||
AC5445, 5.000%, 11/1/2039 | 187,402 | 209,022 | ||||||
AC9564, 4.500%, 2/1/2040 | 129,870 | 141,368 | ||||||
AD1649, 4.000%, 3/1/2040 | 154,714 | 162,876 | ||||||
AD8033, 4.000%, 8/1/2040 | 61,666 | 64,919 | ||||||
AE0215, 4.000%, 12/1/2039 | 145,264 | 152,927 | ||||||
AE0216, 4.000%, 8/1/2040 | 324,864 | 342,001 | ||||||
AE0624, 4.000%, 11/1/2040 | 148,170 | 155,986 | ||||||
AE0625, 4.000%, 12/1/2040 | 155,042 | 164,116 | ||||||
AE4113, 4.000%, 10/1/2040 | 98,844 | 104,227 | ||||||
AE4192, 4.000%, 10/1/2040 | 455,188 | 480,696 | ||||||
AE4414, 4.000%, 11/1/2040 | 565,105 | 594,915 | ||||||
AE5143, 4.000%, 11/1/2040 | 69,437 | 73,100 | ||||||
AE9284, 4.000%, 11/1/2040 | 300,444 | 316,294 | ||||||
AH2434, 3.000%, 12/1/2025 | 102,356 | 105,682 | ||||||
AH3586, 4.000%, 1/1/2041 | 330,179 | 347,596 | ||||||
AI7951, 4.500%, 8/1/2036 | 140,166 | 150,988 | ||||||
AJ5974, 4.000%, 12/1/2036 | 88,028 | 92,843 | ||||||
35
DOMINI SOCIAL BOND FUND
PORTFOLIOOF INVESTMENTS (continued)
July 31, 2014
| Principal Amount | Value (Note 1) | |||||||
U.S. Government Agency Mortgage Securities (Continued) | ||||||||
AL0005, 4.500%, 1/1/2041 | $ | 145,065 | $ | 156,526 | ||||
AL0049, 6.000%, 12/1/2035 | 159,796 | 179,394 | ||||||
AL0215, 4.500%, 4/1/2041 | 869,816 | 939,216 | ||||||
AL0240, 4.000%, 4/1/2041 | 377,987 | 399,200 | ||||||
AL1627, 4.500%, 9/1/2041 | 263,441 | 285,098 | ||||||
AL2716, 2.000%, 12/1/2027 | 158,378 | 155,091 | ||||||
AL3274, 3.000%, 5/1/2027 | 296,119 | 306,152 | ||||||
AM3278, 2.850%, 5/1/2023 | 743,331 | 746,685 | ||||||
AM4253, 3.220%, 9/1/2020 | 1,843,639 | 1,920,893 | ||||||
AM4796, 3.300%, 12/1/2023 | 778,868 | 803,475 | ||||||
AM5146, 3.470%, 1/1/2024 | 500,513 | 522,469 | ||||||
AP6251, 2.500%, 10/1/2027 | 147,041 | 148,205 | ||||||
AP9592, 3.500%, 10/1/2032 | 434,614 | 451,590 | ||||||
AP9623, 2.000%, 10/1/2027 | 167,507 | 164,030 | ||||||
AR1524, 2.000%, 1/1/2028 | 447,514 | 438,225 | ||||||
AR6867, 2.000%, 2/1/2028 | 737,966 | 722,652 | ||||||
AR9198, 3.000%, 3/1/2043 (d) | 1,155,895 | 1,136,113 | ||||||
AU4728, 4.000%, 9/1/2038 | 296,178 | 312,363 | ||||||
FNR 2011-89 BT, 3.500%, 9/25/2026 | 500,000 | 516,365 | ||||||
FNR 2012-17 BC, 3.500%, 3/25/2027 | 368,000 | 377,245 | ||||||
FNR 2012-93 CY, 1.500%, 9/25/2027 | 166,000 | 136,779 | ||||||
MA0199, 4.000%, 10/1/2029 | 63,694 | 67,614 | ||||||
MA0427, 4.000%, 5/1/2030 | 122,828 | 130,412 | ||||||
MA0639, 4.000%, 2/1/2041 | 238,824 | 251,422 | ||||||
MA0804, 4.000%, 7/1/2031 | 173,468 | 185,067 | ||||||
MA0949, 3.500%, 1/1/2032 | 750,407 | 779,958 | ||||||
MA1630, 4.000%, 10/1/2033 | 355,261 | 377,512 | ||||||
Freddie Mac: | ||||||||
A12413, 5.000%, 8/1/2033 | 64,046 | 70,536 | ||||||
A37619, 4.500%, 9/1/2035 | 463,932 | 501,325 | ||||||
A87874, 4.000%, 8/1/2039 | 132,952 | 140,207 | ||||||
A89148, 4.000%, 10/1/2039 | 211,271 | 222,041 | ||||||
A89384, 4.000%, 10/1/2039 | 289,815 | 304,589 | ||||||
A89729, 4.000%, 11/1/2039 | 142,208 | 149,457 | ||||||
A93101, 5.000%, 7/1/2040 | 282,244 | 310,674 | ||||||
A93996, 4.500%, 9/1/2040 | 132,900 | 143,030 | ||||||
A94362, 4.000%, 10/1/2040 | 320,935 | 338,466 | ||||||
A94742, 4.000%, 11/1/2040 | 55,303 | 58,272 | ||||||
A95084, 4.000%, 11/1/2040 | 60,201 | 64,014 | ||||||
A95085, 4.000%, 11/1/2040 | 471,843 | 495,897 | ||||||
A95796, 4.000%, 12/1/2040 | 221,965 | 233,280 | ||||||
A95822, 4.000%, 12/1/2040 | 549,293 | 578,774 | ||||||
A97047, 4.500%, 2/1/2041 | 148,479 | 159,807 | ||||||
FHR 3768 CB, 3.500%, 12/15/2025 | 343,000 | 355,769 | ||||||
FHR 3800 CB, 3.500%, 2/15/2026 | 383,000 | 397,028 | ||||||
FHR 3806 L, 3.500%, 2/15/2026 | 847,000 | 875,801 | ||||||
FHR 3877 LM, 3.500%, 6/15/2026 | 780,000 | 808,224 | ||||||
FHR 3745 AY, 4.000%, 10/15/2030 | 73,000 | 76,740 | ||||||
G01779, 5.000%, 4/1/2035 | 84,008 | 92,709 | ||||||
G01828, 4.500%, 4/1/2035 | 379,626 | 410,571 | ||||||
G01837, 5.000%, 7/1/2035 | 565,938 | 624,641 | ||||||
36
DOMINI SOCIAL BOND FUND
PORTFOLIOOF INVESTMENTS (continued)
July 31, 2014
| Principal Amount | Value (Note 1) | |||||||
U.S. Government Agency Mortgage Securities (Continued) | ||||||||
G01838, 5.000%, 7/1/2035 | $ | 101,307 | $ | 111,773 | ||||
G02424, 5.500%, 12/1/2036 | 430,305 | 475,878 | ||||||
G04997, 5.000%, 1/1/2037 | 366,332 | 404,006 | ||||||
G05052, 5.000%, 10/1/2033 | 40,928 | 45,050 | ||||||
G06061, 4.000%, 10/1/2040 | 497,987 | 524,619 | ||||||
G06079, 6.000%, 7/1/2039 | 352,127 | 395,394 | ||||||
G06802, 4.500%, 10/1/2041 | 610,192 | 656,611 | ||||||
G06990, 5.500%, 8/1/2040 | 623,554 | 688,700 | ||||||
G08347, 4.500%, 6/1/2039 | 686,896 | 739,302 | ||||||
G08353, 4.500%, 7/1/2039 | 745,533 | 802,399 | ||||||
G08372, 4.500%, 11/1/2039 | 385,789 | 415,246 | ||||||
G14599, 2.500%, 11/1/2027 | 415,867 | 418,700 | ||||||
G30614, 3.500%, 12/1/2032 | 632,896 | 656,569 | ||||||
J14244, 3.000%, 1/1/2026 | 277,651 | 286,286 | ||||||
J14245, 3.000%, 1/1/2026 | 148,437 | 153,076 | ||||||
J17791, 3.000%, 1/1/2027 | 605,459 | 623,646 | ||||||
J18800, 3.000%, 4/1/2027 | 283,072 | 291,659 | ||||||
J20118, 2.500%, 8/1/2027 | 159,295 | 160,380 | ||||||
J21439, 2.500%, 12/1/2027 | 1,255,572 | 1,264,364 | ||||||
Q00291, 5.000%, 4/1/2041 | 253,074 | 279,304 | ||||||
Q01807, 4.500%, 7/1/2036 | 261,891 | 282,031 | ||||||
Q06160, 4.000%, 2/1/2037 | 95,474 | 100,341 | ||||||
Q17103, 4.000%, 6/1/2041 | 50,595 | 53,344 | ||||||
Z40004, 6.000%, 8/1/2036 | 68,881 | 77,212 | ||||||
Ginnie Mae CMO: | ||||||||
2006-9 B, 5.211%, VR, 3/16/2037 | 186,989 | 193,235 | ||||||
|
| |||||||
Total U.S. Government Agency Mortgage Securities | 45,252,634 | |||||||
|
| |||||||
Corporate Obligations – 14.8% | ||||||||
3M Company, 1.375%, 9/29/2016 | 1,171,000 | 1,188,762 | ||||||
American Express Credit, 2.375%, 3/24/2017 | 1,171,000 | 1,207,851 | ||||||
American Tower Corp, 5.000%, 2/15/2024 | 437,000 | 471,657 | ||||||
American Tower Corp., 3.500%, 1/31/2023 | 281,000 | 273,916 | ||||||
Analog Devices, 3.000%, 4/15/2016 | 333,000 | 344,455 | ||||||
Apple Inc, 2.850%, 5/6/2021 | 442,000 | 444,338 | ||||||
AT&T Inc, 2.375%, 11/27/2018 | 500,000 | 507,047 | ||||||
CC Holdings GS V LLC/CRO, 3.849%, 4/15/2023 | 568,000 | 567,059 | ||||||
Cisco Systems Inc, 2.125%, 3/1/2019 | 229,000 | 229,829 | ||||||
Cisco Systems Inc., 5.500%, 2/22/2016 | 388,000 | 417,466 | ||||||
Delphi Corp, 4.150%, 3/15/2024 | 191,000 | 195,603 | ||||||
Digital Realty Trust LP, 5.875%, 2/1/2020 | 1,000,000 | 1,113,362 | ||||||
ENSCO PLC, 4.700%, 3/15/2021 | 1,597,000 | 1,734,603 | ||||||
ERAC USA Finance LLC 144A, 3.850%, 11/15/2024 (f) | 1,000,000 | 1,005,249 | ||||||
Fifth Third Bank, 1.450%, 2/28/2018 | 374,000 | 370,631 | ||||||
Howard Hughes Medical Institute, 3.500%, 9/1/2023 | 252,000 | 258,688 | ||||||
Intel Corp, 1.950%, 10/1/2016 | 1,171,000 | 1,200,270 | ||||||
Intel Corp, 2.700%, 12/15/2022 | 328,000 | 317,781 | ||||||
Intesa Sanpaolo SPA 144A, 5.017%, 6/26/2024 (f) | 234,000 | 231,938 | ||||||
John Deere Capital Corporation, 1.250%, 12/2/2014 | 1,000,000 | 1,003,176 | ||||||
37
DOMINI SOCIAL BOND FUND
PORTFOLIOOF INVESTMENTS (continued)
July 31, 2014
| Principal Amount | Value (Note 1) | |||||||
Corporate Obligations (Continued) | ||||||||
Key Bank NA, 1.650%, 2/1/2018 | $ | 250,000 | $ | 249,228 | ||||
Lear Corp, 4.750%, 1/15/2023 | 132,000 | 130,598 | ||||||
MassMutual Global Funding 144A, 2.000%, 4/5/2017 (f) | 462,000 | 471,005 | ||||||
Morgan Stanley, 5.000%, 11/24/2025 | 528,000 | 563,167 | ||||||
Morgan Stanley, 3.875%, 4/29/2024 | 241,000 | 243,407 | ||||||
Mylan Inc 144A, 3.125%, 1/15/2023 (f) | 73,000 | 70,127 | ||||||
Oracle Corp, 1.200%, 10/15/2017 | 65,000 | 64,677 | ||||||
Oracle Corp, 2.375%, 1/15/2019 | 105,000 | 106,592 | ||||||
PACCAR Financial Corp, 1.550%, 9/29/2014 | 1,000,000 | 1,002,083 | ||||||
Praxair Inc., 4.625%, 3/30/2015 | 647,000 | 665,342 | ||||||
Reinsurance Group of America, 4.700%, 9/15/2023 | 125,000 | 133,879 | ||||||
Thermo Fisher Scientific, 4.150%, 2/1/2024 | 202,000 | 209,939 | ||||||
TSMC Global Ltd 144A, 1.625%, 4/3/2018 (f) | 266,000 | 261,510 | ||||||
United Air 2014 1 A PTT, 4.000%, 10/11/2027 | 265,000 | 268,644 | ||||||
US Bank NA Cincinnati, 1.100%, 1/30/2017 | 339,000 | 339,328 | ||||||
Verizon Communications, 5.150%, 9/15/2023 | 1,251,000 | 1,386,999 | ||||||
|
| |||||||
Total Corporate Obligations | 19,250,206 | |||||||
|
| |||||||
Corporate Mortgage Securities – 1.0% | ||||||||
CRFCM 2004-1A A 144A, 5.500%, VR, 4/25/2035 (g) | 354,567 | 354,819 | ||||||
OBP Depositor LLC Trust 144A, 4.646%, 7/15/2045 (f) | 806,000 | 892,844 | ||||||
|
| |||||||
Total Corporate Mortgage Securities | 1,247,663 | |||||||
|
| |||||||
Certificates of Deposit – 2.5% | ||||||||
Alternatives Federal Credit Union, 0.300%, 3/5/2015 (a) | 250,000 | 250,000 | ||||||
BANK2, 0.850%, 11/4/2014 (a) | 250,000 | 250,000 | ||||||
Central Bank of Kansas City, 0.300%, 5/30/2015 (a) | 250,000 | 250,000 | ||||||
City First Bank of D.C., 0.450%, 2/5/2015 (a) | 250,000 | 250,000 | ||||||
Community Capital Bank of Virginia, 0.350%, 2/9/2015 (a) | 250,000 | 250,000 | ||||||
Eastern Bank, 0.100%, 12/20/2014 (a) | 250,000 | 250,000 | ||||||
Hope Federal Credit Union, 0.850%, 2/12/2015 (a) | 250,000 | 250,000 | ||||||
Latino Community Credit Union, 0.600%, 6/9/2015 (a) | 250,000 | 250,000 | ||||||
New Resource Bank, 0.150%, 4/5/2015 (a) | 250,000 | 250,000 | ||||||
Proamerica Bank, 0.350%, 2/8/2015 (a) | 250,000 | 250,000 | ||||||
Self Help Credit Untion, 0.550%, 12/12/2014 (a) | 250,000 | 250,000 | ||||||
Self Help Federal Credit Union, 0.550%, 12/22/2014 (a) | 250,000 | 250,000 | ||||||
Southern Bancorp, 0.400%, 6/20/2015 (a) | 250,000 | 250,000 | ||||||
|
| |||||||
Total Certificates of Deposit | 3,250,000 | |||||||
|
| |||||||
38
DOMINI SOCIAL BOND FUND
PORTFOLIOOF INVESTMENTS (continued)
July 31, 2014
| Principal Amount | Value (Note 1) | |||||||
Cash Equivalents – 0.7% | ||||||||
Money Market Demand Accounts: | ||||||||
Bank2 Money Market Account, 0.550%, 8/15/2014 (a) | $ | 100,826 | $ | 100,826 | ||||
Latino Community Credit Union, 0.005%, 8/15/2014 (a) | 102,596 | 102,596 | ||||||
Liberty Bank and Trust Money Market, 0.150%, 8/15/2014 (a) | 200,190 | 200,190 | ||||||
New Resource Bank Money Market, 0.100%, 8/15/2014 (a) | 100,019 | 100,019 | ||||||
Self-Help Federal Credit Union, 0.40%, 8/15/2014 (a) | 100,700 | 100,700 | ||||||
Self-Help Money Market Demand, 0.40%, 8/15/2014 (a) | 102,558 | 102,558 | ||||||
Southern Bancorp Money Market, 0.200%, 8/15/2014 (a) | 251,443 | 251,443 | ||||||
|
| |||||||
Total Cash Equivalents | 958,332 | |||||||
|
| |||||||
Total Investments – 97.7% (Cost $125,473,944) (b) | 126,969,263 | |||||||
Other Assets, less liabilities – 2.3% | 3,026,288 | |||||||
|
| |||||||
Net Assets – 100.0% | $ | 129,995,551 | ||||||
|
| |||||||
(a) Securities (other than short-term obligations with remaining maturities of less than 60 days) for which there are no such quotations or valuations are valued at fair value as determined in good faith by or at the direction of the Fund’s Board of Trustees.
(b) The aggregate cost for federal income tax purposes is $125,791,530. The aggregate gross unrealized appreciation is $1,383,157, and the aggregate gross unrealized depreciation is $205,424, resulting in net unrealized appreciation of $1,177,733.
(d) A portion or all of the security was purchased as a when issued or delayed delivery security.
(e) A portion or all of the security was segregated for collateral for when issued or delayed delivery securities.
(f) This security has been determined to be liquid under guidelines established by the Fund’s Board of Trustees.
(g) This security has been determined to be illiquid under guidelines established by the Fund’s Board of Trustees.
VR — Variable interest rate. Rate shown is that on July 31, 2014.
144A — Security that may be sold to qualified institutional buyers under Rule 144A of the Securities Act of 1933, as amended. This security has been determined to be liquid under guidelines established by the Fund’s Board of Trustees.
SEE NOTES TO FINANCIAL STATEMENTS
39
DOMINI FUNDS EXPENSE EXAMPLE (Unaudited)
As a shareholder of the Domini Funds, you incur two types of costs:
(1) Transaction costs such as redemption fees deducted from any redemption or exchange proceeds if you sell or exchange shares of the fund after holding them less than 30 days and sales charges (loads) on Class A shares and
(2) Ongoing costs, including management fees, distribution (12b-1) fees, and other Fund expenses.
This example is intended to help you understand your ongoing costs (in dollars) of investing in the Fund and to compare these costs with the ongoing costs of investing in other mutual funds. The example is based on an investment of $1,000 invested on February 1, 2014, and held through July 31, 2014.
Certain Account Fees
Some accounts are subject to recurring annual service fees and maintenance fees that are not included in the expenses shown in the table. If your account was subject to these fees, then the actual account values at the end of the period would be lower and the actual expense would be higher. You may avoid the annual service fee by choosing paperless electronic delivery of statements, prospectuses, shareholder reports and other materials.
Actual Expenses
The line of the table captioned ‘‘Actual Expenses’’ below provides information about actual account value and actual expenses. You may use the information in this line, together with the amount invested, to estimate the expenses that you paid over the period as follows:
(1) Divide your account value by $1,000.
(2) Multiply your result in step 1 by the number in the first line under the heading ‘‘Expenses Paid During Period’’ in the table.
The result equals the estimated expenses you paid on your account during the period.
Hypothetical Expenses
The second line of the table below provides information about hypothetical account values and hypothetical expenses based on the Fund’s actual expense ratio and an assumed rate of return of 5% per year before expenses, which is not the Fund’s return. The hypothetical account values and expenses may not be used to estimate actual ending account balance or expenses you paid for the period. You may use this information to compare the ongoing costs of investing in the Fund and other mutual funds. To do so, compare this 5% hypothetical example with the 5% hypothetical example that appears in the shareholder reports of the other funds.
40
Please note that the expenses shown in the table are meant to highlight your ongoing costs only and do not reflect any transactional costs, such as redemption fees. Therefore, the second line of the table is useful in comparing ongoing costs only, and will not help you determine the relative total costs of owning different funds. In addition, if these transactional costs were included, your costs would have been higher.
| Fund Name | Expenses | Beginning Account Value as of 2/1/2014 | Ending Account Value as of 7/31/2014 | Expenses Paid During Period 2/1/2014 – 7/31/2014 | ||||
| Domini Social Equity Fund Investor Shares | Actual Expenses | $1,000.00 | $1,118.60 | $6.251 | ||||
| Hypothetical Expenses (5% return before expenses) | $1,000.00 | $1,018.89 | $5.961 | |||||
| Domini Social Equity Fund Class A Shares | Actual Expenses | $1,000.00 | $1,118.40 | $6.201 | ||||
| Hypothetical Expenses (5% return before expenses) | $1,000.00 | $1,018.94 | $5.911 | |||||
| Domini Social Equity Fund Institutional Shares | Actual Expenses | $1,000.00 | $1,120.70 | $4.211 | ||||
| Hypothetical Expenses (5% return before expenses) | $1,000.00 | $1,020.83 | $4.011 | |||||
Domini Social Equity Fund Class R Shares | Actual Expenses | $1,000.00 | $1,120.30 | $4.731 | ||||
| Hypothetical Expenses (5% return before expenses) | $1,000.00 | $1,020.33 | $4.511 | |||||
Domini International Social Equity Fund Investor Shares | Actual Expenses | $1,000.00 | $1,053.60 | $8.152 | ||||
| Hypothetical Expenses (5% return before expenses) | $1,000.00 | $1,016.86 | $8.002 | |||||
Domini International Social Equity Fund Class A Shares | Actual Expenses | $1,000.00 | $1,053.70 | $7.992 | ||||
| Hypothetical Expenses (5% return before expenses) | $1,000.00 | $1,017.01 | $7.852 | |||||
Domini International Social Equity Fund Institutional Shares | Actual Expenses | $1,000.00 | $1,054.80 | $5.862 | ||||
| Hypothetical Expenses (5% return before expenses) | $1,000.00 | $1,019.09 | $5.762 | |||||
Domini Social Bond Fund Investor Shares | Actual Expenses | $1,000.00 | $1,011.80 | $4.743 | ||||
| Hypothetical Expenses (5% return before expenses) | $1,000.00 | $1,020.08 | $4.763 | |||||
Domini Social Institutional Shares | Actual Expenses | $1,000.00 | $1,012.40 | $3.243 | ||||
| Hypothetical Expenses (5% return before expenses) | $1,000.00 | $1,021.57 | $3.263 |
1Expenses are equal to the Fund’s annualized expense ratio of 1.19% for Investor shares, or 1.18% for Class A shares, or 0.80% for Institutional Class, or 0.90% for Class R shares, multiplied by average account value over the period, multiplied by 181, and divided by 365.
2Expenses are equal to the Fund’s annualized expense ratio of 1.60% for Investor shares, or 1.57% for Class A shares, or 1.15% for Institutional shares, multiplied by average account value over the period, multiplied by 181, and divided by 365.
3Expenses are equal to the Fund’s annualized expense ratio of 0.95% for Investor Shares, or 0.65% for Institutional Class, multiplied by average account value over the period, multiplied by 181, and divided by 365.
41
STATEMENTS OF ASSETS AND LIABILITIES
July 31, 2014
* Redemption price is equal to net asset value less any applicable redemption fees retained by the Fund.
SEE NOTES TO FINANCIAL STATEMENTS
42
STATEMENTS OF OPERATIONS
For the Year Ended July 31, 2014
| Domini Social Equity Fund | Domini International Social Equity Fund | |||||||
INCOME | ||||||||
Dividends (net of foreign taxes $254,531, and $801,001, respectively) | $ | 18,740,687 | $ | 7,769,290 | ||||
|
|
|
| |||||
Investment Income | 18,740,687 | 7,769,290 | ||||||
|
|
|
| |||||
EXPENSES | ||||||||
Management /Sponsorship fees | 7,035,125 | 2,554,564 | ||||||
Distribution fees – Investor shares | 1,680,940 | 492,346 | ||||||
Distribution fees – Class A shares | 16,040 | 57,822 | ||||||
Transfer agent fees – Investor shares | 853,581 | 376,746 | ||||||
Transfer agent fees – Class A shares | 9,974 | 63,713 | ||||||
Transfer agent fees – Institutional shares | 4,466 | 6,090 | ||||||
Transfer agent fees – Class R shares | 8,853 | - | ||||||
Custody and Accounting fees | 182,072 | 275,187 | ||||||
Registration fees – Investor shares | 58,649 | 29,048 | ||||||
Registration fees – Class A shares | 18,858 | 24,254 | ||||||
Registration fees – Institutional shares | 20,918 | 2,447 | ||||||
Registration fees – Class R shares | 23,909 | - | ||||||
Shareholder Communication fees | 78,922 | 22,831 | ||||||
Miscellaneous | 71,392 | 25,253 | ||||||
Shareholder Service fees – Investor shares | 67,082 | 22,339 | ||||||
Shareholder Service fees – Class A shares | 985 | 7,224 | ||||||
Shareholder Service fees – Institutional shares | 158 | 24 | ||||||
Shareholder Service fees – Class R shares | 206 | - | ||||||
Professional fees | 64,631 | 49,950 | ||||||
Trustees fees | 64,531 | 15,585 | ||||||
|
|
|
| |||||
Total expenses | 10,261,292 | 4,025,423 | ||||||
Fees waived and expenses reimbursed | (39,981) | (91,986) | ||||||
|
|
|
| |||||
Net expenses | 10,221,311 | 3,933,437 | ||||||
|
|
|
| |||||
NET INVESTMENT INCOME (LOSS) | 8,519,376 | 3,835,853 | ||||||
|
|
|
| |||||
REALIZED AND UNREALIZED GAIN (LOSS) FROM INVESTMENTS AND FOREIGN CURRENCY | ||||||||
NET REALIZED GAIN (LOSS) FROM: | ||||||||
Investments | 135,289,392 | 17,255,451 | ||||||
Foreign Currency | 8,870 | 14,206 | ||||||
|
|
|
| |||||
Net realized gain (loss) | 135,298,262 | 17,269,657 | ||||||
NET CHANGES IN UNREALIZED APPRECIATION (DEPRECIATION) FROM: | ||||||||
Investments | 27,641,364 | 7,748,342 | ||||||
Translation of assets and liabilities in foreign currencies | - | (9,086) | ||||||
|
|
|
| |||||
Net change in unrealized appreciation (depreciation) | 27,641,364 | 7,739,256 | ||||||
|
|
|
| |||||
NET REALIZED AND UNREALIZED GAIN (LOSS) | 162,939,626 | 25,008,913 | ||||||
|
|
|
| |||||
NET INCREASE (DECREASE) IN NET ASSETS RESULTING FROM OPERATIONS | 171,459,002 | 28,844,766 | ||||||
|
|
|
| |||||
SEE NOTES TO FINANCIAL STATEMENTS
43
DOMINI SOCIAL EQUITY FUND
STATEMENTS OF CHANGES IN NET ASSETS
| Year Ended July 31, 2014 | Year Ended July 31, 2013 | |||||||
INCREASE IN NET ASSETS | ||||||||
FROM OPERATIONS | ||||||||
Net investment income (loss) | $ | 8,519,376 | $ | 8,749,824 | ||||
Net realized gain (loss) | 135,298,262 | 113,438,543 | ||||||
Net change in unrealized appreciation (depreciation) | 27,641,364 | 33,156,924 | ||||||
|
|
|
| |||||
Net Increase (Decrease) in Net Assets Resulting from Operations | 171,459,002 | 155,345,291 | ||||||
|
|
|
| |||||
DISTRIBUTIONS AND/OR DIVIDENDS | ||||||||
Dividends to shareholders from net investment income: | ||||||||
Investor shares | (4,110,200) | (3,810,358) | ||||||
Class A shares | (177,773) | (160,635) | ||||||
Institutional shares | (3,180,600) | (4,095,883) | ||||||
Class R shares | (897,802) | (1,000,392) | ||||||
Distributions to shareholders from net realized gain: | ||||||||
Investor shares | - | - | ||||||
Class A shares | - | - | ||||||
Institutional shares | - | - | ||||||
Class R shares | - | - | ||||||
|
|
|
| |||||
Net Decrease in Net Assets from Distributions and/or Dividends | (8,366,375) | (9,067,268) | ||||||
|
|
|
| |||||
CAPITAL SHARE TRANSACTIONS | ||||||||
Proceeds from sale of shares | 141,650,897 | 92,296,604 | ||||||
Net asset value of shares issued in reinvestment of distributions and dividends | 7,984,421 | 8,790,242 | ||||||
Payments for shares redeemed | (171,392,631) | (130,878,503) | ||||||
Redemption fees | 16,409 | 6,203 | ||||||
|
|
|
| |||||
Net Increase (Decrease) in Net Assets from Capital Share Transactions | (21,740,904) | (29,785,454) | ||||||
|
|
|
| |||||
Total Increase (Decrease) in Net Assets | 141,351,723 | 116,492,569 | ||||||
|
|
|
| |||||
NET ASSETS | ||||||||
Beginning of period | $ | 873,686,012 | $ | 757,193,443 | ||||
|
|
|
| |||||
End of period | $ | 1,015,037,735 | $ | 873,686,012 | ||||
|
|
|
| |||||
Undistributed net investment income (loss) | $ | 147,435 | $ | 1,015,872 | ||||
|
|
|
| |||||
SEE NOTES TO FINANCIAL STATEMENTS
44
DOMINI INTERNATIONAL SOCIAL EQUITY FUND
STATEMENTS OF CHANGES IN NET ASSETS
| Year Ended July 31, 2014 | Year Ended July 31, 2013 | |||||||
INCREASE IN NET ASSETS | ||||||||
FROM OPERATIONS | ||||||||
Net investment income (loss) | $ | 3,835,853 | $ | 2,931,468 | ||||
Net realized gain (loss) | 17,269,657 | 13,227,215 | ||||||
Net change in unrealized appreciation (depreciation) | 7,739,256 | 24,143,371 | ||||||
|
|
|
| |||||
Net Increase (Decrease) in Net Assets Resulting from Operations | 28,844,766 | 40,302,054 | ||||||
|
|
|
| |||||
DISTRIBUTIONS AND/OR DIVIDENDS | ||||||||
Dividends to shareholders from net investment income: | ||||||||
Investor shares | (5,652,570) | (1,211,612) | ||||||
Class A shares | (606,614) | (108,546) | ||||||
Institutional shares | (1,135,764) | (255,115) | ||||||
Class R shares | - | - | ||||||
Distributions to shareholders from net realized gain: | ||||||||
Investor shares | (3,360,560) | - | ||||||
Class A shares | (368,244) | - | ||||||
Institutional shares | (668,266) | - | ||||||
Class R shares | - | - | ||||||
|
|
|
| |||||
Net Decrease in Net Assets from Distributions and/or Dividends | (11,792,018) | (1,575,273) | ||||||
|
|
|
| |||||
CAPITAL SHARE TRANSACTIONS | ||||||||
Proceeds from sale of shares | 112,539,220 | 75,530,023 | ||||||
Net asset value of shares issued in reinvestment of distributions and dividends | 9,054,596 | 1,076,056 | ||||||
Payments for shares redeemed | (35,731,602) | (49,777,366) | ||||||
Redemption fees | 6,627 | 1,162 | ||||||
|
|
|
| |||||
Net Increase (Decrease) in Net Assets from Capital Share Transactions | 85,868,841 | 26,829,875 | ||||||
|
|
|
| |||||
Total Increase (Decrease) in Net Assets | 102,921,589 | 65,556,656 | ||||||
|
|
|
| |||||
NET ASSETS | ||||||||
Beginning of period | $ | 198,139,959 | $ | 132,583,303 | ||||
|
|
|
| |||||
End of period | $ | 301,061,548 | $ | 198,139,959 | ||||
|
|
|
| |||||
Undistributed net investment income (loss) | $ | (2,146,799) | $ | 982,969 | ||||
|
|
|
| |||||
SEE NOTES TO FINANCIAL STATEMENTS
45
DOMINI SOCIAL EQUITY FUND — INVESTOR SHARES
FINANCIAL HIGHLIGHTS
| Year Ended July 31, | ||||||||||||||||||||
| 2014 | 2013 | 2012 | 2011 | 2010 | ||||||||||||||||
For a share outstanding for the period: | ||||||||||||||||||||
Net asset value, beginning of period | $39.22 | $32.66 | $31.56 | $26.00 | $22.83 | |||||||||||||||
|
|
|
|
|
|
|
|
|
| |||||||||||
Income from investment operations: | ||||||||||||||||||||
Net investment income (loss) | 0.39 | 0.37 | 0.36 | 0.27 | 0.22 | |||||||||||||||
Net realized and unrealized gain (loss) on investments | 7.47 | 6.43 | 0.95 | 5.44 | 3.09 | |||||||||||||||
|
|
|
|
|
|
|
|
|
| |||||||||||
Total income from investment operations | 7.86 | 6.80 | 1.31 | 5.71 | 3.31 | |||||||||||||||
|
|
|
|
|
|
|
|
|
| |||||||||||
Less dividends and distributions: | ||||||||||||||||||||
Dividends to shareholders from net investment income | (0.26) | (0.24) | (0.21) | (0.15) | (0.14) | |||||||||||||||
Distributions to shareholders from net realized gain | - | - | - | - | - | |||||||||||||||
|
|
|
|
|
|
|
|
|
| |||||||||||
Total distributions | (0.26) | (0.24) | (0.21) | (0.15) | (0.14) | |||||||||||||||
|
|
|
|
|
|
|
|
|
| |||||||||||
Redemption fee proceeds 5 | 0.00 | 1 | 0.00 | 1 | 0.00 | 1 | 0.00 | 1 | 0.00 | 1 | ||||||||||
|
|
|
|
|
|
|
|
|
| |||||||||||
Net asset value, end of period | $46.82 | $39.22 | $32.66 | $31.56 | $26.00 | |||||||||||||||
|
|
|
|
|
|
|
|
|
| |||||||||||
Total return 2 | 20.07% | 20.87% | 4.15% | 22.01% | 14.51% | |||||||||||||||
Portfolio turnover | 86% | 97% | 94% | 87% | 95% | |||||||||||||||
Ratios/supplemental data (annualized): | ||||||||||||||||||||
Net assets, end of period (in millions) | $699 | $625 | $546 | $561 | $562 | |||||||||||||||
Ratio of expenses to average net assets 3 | 1.20% | 1.24% | 4 | 1.25% | 4 | 1.23% | 4 | 1.23% | 4 | |||||||||||
Ratio of net investment income (loss) to average net assets | 0.80% | 0.96% | 1.06% | 0.72% | 0.77% | |||||||||||||||
1 Amount represents less than 0.005 per share.
2 Not annualized for periods less than one year.
3 Reflects a waiver of fees by the Manager, the Sponsor, and the Distributor of the Fund. Had the Manager, the Sponsor, and the Distributor not waived their fees or reimbursed expenses, the ratio of expenses to average net assets would have been 1.20%, 1.24%, 1.26%, 1.23%, and 1.29%, for the years ended July 31, 2014, 2013, 2012, 2011 and 2010, respectively.
4 Ratio of expenses to average net assets includes indirectly paid expenses. Excluding indirectly paid expenses the ratio of expenses to average net assets would have been 1.24%, 1.25%, 1.23%, and 1.23% for the years ended July 31, 2013, 2012, 2011 and 2010, respectively.
5 Based on average shares outstanding.
SEE NOTES TO FINANCIAL STATEMENTS
46
DOMINI SOCIAL EQUITY FUND — CLASS A SHARES
FINANCIAL HIGHLIGHTS
| Year Ended July 31, | ||||||||||||||||||||
| 2014 | 2013 | 2012 | 2011 | 2010 | ||||||||||||||||
For a share outstanding for the period: | ||||||||||||||||||||
Net asset value, beginning of period | $11.84 | $10.16 | $10.12 | $8.51 | $7.63 | |||||||||||||||
|
|
|
|
|
|
|
|
|
| |||||||||||
Income from investment operations: | ||||||||||||||||||||
Net investment income (loss) | 0.25 | 0.22 | 0.37 | 0.07 | 0.10 | |||||||||||||||
Net realized and unrealized gain (loss) on investments | 2.12 | 1.86 | 0.05 | 1.80 | 1.01 | |||||||||||||||
|
|
|
|
|
|
|
|
|
| |||||||||||
Total income from investment operations | 2.37 | 2.08 | 0.42 | 1.87 | 1.11 | |||||||||||||||
|
|
|
|
|
|
|
|
|
| |||||||||||
Less dividends and/or distributions: | ||||||||||||||||||||
Dividends to shareholders from net investment income | (0.34) | (0.40) | (0.38) | (0.26) | (0.23) | |||||||||||||||
Distributions to shareholders from net realized gain | - | - | - | - | - | |||||||||||||||
|
|
|
|
|
|
|
|
|
| |||||||||||
Total distributions | (0.34) | (0.40) | (0.38) | (0.26) | (0.23) | |||||||||||||||
|
|
|
|
|
|
|
|
|
| |||||||||||
Redemption fee proceeds | - | - | - | - | - | |||||||||||||||
|
|
|
|
|
|
|
|
|
| |||||||||||
Net asset value, end of period | $13.87 | $11.84 | $10.16 | $10.12 | $8.51 | |||||||||||||||
|
|
|
|
|
|
|
|
|
| |||||||||||
Total return 2 | 20.17% | 20.88% | 4.20% | 22.16% | 14.47% | |||||||||||||||
Portfolio turnover | 86% | 97% | 94% | 87% | 95% | |||||||||||||||
Ratios/supplemental data (annualized): | ||||||||||||||||||||
Net assets, end of period (in millions) | $8 | $5 | $4 | $2 | $2 | |||||||||||||||
Ratio of expenses to average net assets 3 | 1.18% | 1.18% | 4 | 1.18% | 4 | 1.18% | 4 | 1.18% | 4 | |||||||||||
Ratio of net investment income (loss) to average net assets | 0.83% | 1.02% | 1.09% | 0.76% | 0.81% | |||||||||||||||
2 Total return does not reflect sales commissions and is not annualized for periods less than one year.
3 Reflects a waiver of fees by the Manager, the Sponsor, and the Distributor of the Fund. Had the Manager, the Sponsor, and the Distributor not waived their fees or reimbursed expenses, the ratio of expenses to average net assets would have been 1.54%, 1.74%, 2.09%, 2.54%, and 2.56%, for the years ended July 31, 2014, 2013, 2012, 2011 and 2010, respectively.
4 Ratio of expenses to average net assets includes indirectly paid expenses. Excluding indirectly paid expenses the ratio of expenses to average net assets would have been 1.18%, 1.18%, 1.18%, and 1.18% for the years ended July 31, 2013, 2012, 2011 and 2010 respectively.
SEE NOTES TO FINANCIAL STATEMENTS
47
DOMINI SOCIAL EQUITY FUND — INSTITUTIONAL SHARES
FINANCIAL HIGHLIGHTS
| Year Ended July 31, | ||||||||||||||||||||
| 2014 | 2013 | 2012 | 2011 | 2010 | ||||||||||||||||
For a share outstanding for the period: | ||||||||||||||||||||
Net asset value, beginning of period | $23.94 | $20.12 | $19.65 | $16.26 | $14.35 | |||||||||||||||
|
|
|
|
|
|
|
|
|
| |||||||||||
Income from investment operations: | ||||||||||||||||||||
Net investment income (loss) | 0.32 | 0.29 | 0.33 | 0.23 | 0.21 | |||||||||||||||
Net realized and unrealized gain (loss) on investments | 4.60 | 3.96 | 0.57 | 3.42 | 1.96 | |||||||||||||||
|
|
|
|
|
|
|
|
|
| |||||||||||
Total income from investment operations | 4.92 | 4.25 | 0.90 | 3.65 | 2.17 | |||||||||||||||
|
|
|
|
|
|
|
|
|
| |||||||||||
Less dividends and/or distributions: | ||||||||||||||||||||
Dividends to shareholders from net investment income | (0.37) | (0.43) | (0.43) | (0.26) | (0.26) | |||||||||||||||
Distributions to shareholders from net realized gain | - | - | - | - | - | |||||||||||||||
|
|
|
|
|
|
|
|
|
| |||||||||||
Total distributions | (0.37) | (0.43) | (0.43) | (0.26) | (0.26) | |||||||||||||||
|
|
|
|
|
|
|
|
|
| |||||||||||
Redemption fee proceeds 5 | 0.00 | 1 | 0.00 | 1 | - | - | - | |||||||||||||
|
|
|
|
|
|
|
|
|
| |||||||||||
Net asset value, end of period | $28.49 | $23.94 | $20.12 | $19.65 | $16.26 | |||||||||||||||
|
|
|
|
|
|
|
|
|
| |||||||||||
Total return 2 | 20.59% | 21.36% | 4.62% | 22.55% | 15.08% | |||||||||||||||
Portfolio turnover | 86% | 97% | 94% | 87% | 95% | |||||||||||||||
Ratios/supplemental data (annualized): | ||||||||||||||||||||
Net assets, end of period (in millions) | $260 | $216 | $182 | $143 | $103 | |||||||||||||||
Ratio of expenses to average net assets 3 | 0.80% | 0.80% | 4 | 0.80% | 4 | 0.80% | 4 | 0.75% | 4 | |||||||||||
Ratio of net investment income (loss) to average net assets | 1.19% | 1.41% | 1.49% | 1.17% | 1.24% | |||||||||||||||
1 Amount represents less than 0.005 per share.
2 Not annualized for periods less than one year.
3 Reflects a waiver of fees by the Manager, and the Sponsor. Had the Manager and the Sponsor not waived their fees or reimbursed expenses, the ratio of expenses to average net assets would have been 0.81%, 0.81%, 0.83%, 0.82%, and 0.83%, for the years ended July 31, 2014, 2013, 2012, 2011 and 2010, respectively.
4 Ratio of expenses to average net assets includes indirectly paid expenses. Excluding indirectly paid expenses the ratio of expenses to average net assets would have been 0.80%, 0.80%, 0.80%, and 0.75% for the years ended July 31, 2013, 2012, 2011 and 2010, respectively.
5 Based on average shares outstanding.
SEE NOTES TO FINANCIAL STATEMENTS
48
DOMINI SOCIAL EQUITY FUND — CLASS R SHARES
FINANCIAL HIGHLIGHTS
| Year Ended July 31, | ||||||||||||||||||||
| 2014 | 2013 | 2012 | 2011 | 2010 | ||||||||||||||||
For a share outstanding for the period: | ||||||||||||||||||||
Net asset value, beginning of period | $10.94 | $9.41 | $9.40 | $7.91 | $7.09 | |||||||||||||||
|
|
|
|
|
|
|
|
|
| |||||||||||
Income from investment operations: | ||||||||||||||||||||
Net investment income (loss) | 1.00 | (0.03) | 1.16 | (1.15) | (0.11) | |||||||||||||||
Net realized and unrealized gain (loss) on investments | 1.23 | 1.98 | (0.74) | 2.90 | 1.18 | |||||||||||||||
|
|
|
|
|
|
|
|
|
| |||||||||||
Total income from investment operations | 2.23 | 1.95 | 0.42 | 1.75 | 1.07 | |||||||||||||||
|
|
|
|
|
|
|
|
|
| |||||||||||
Less dividends and/or distributions: | ||||||||||||||||||||
Dividends to shareholders from net investment income | (0.36) | (0.42) | (0.41) | (0.26) | (0.25) | |||||||||||||||
Distributions to shareholders from net realized gain | - | - | - | - | - | |||||||||||||||
|
|
|
|
|
|
|
|
|
| |||||||||||
Total distributions | (0.36) | (0.42) | (0.41) | (0.26) | (0.25) | |||||||||||||||
|
|
|
|
|
|
|
|
|
| |||||||||||
Redemption fee proceeds 5 | 0.00 | 1 | 0.00 | 1 | 0.00 | 1 | 0.00 | 1 | 0.00 | 1 | ||||||||||
|
|
|
|
|
|
|
|
|
| |||||||||||
Net asset value, end of period | $12.81 | $10.94 | $9.41 | $9.40 | $7.91 | |||||||||||||||
|
|
|
|
|
|
|
|
|
| |||||||||||
Total return 2 | 20.52% | 21.21% | 4.58% | 22.29% | 15.05% | |||||||||||||||
Portfolio turnover | 86% | 97% | 94% | 87% | 95% | |||||||||||||||
Ratios/supplemental data (annualized): | ||||||||||||||||||||
Net assets, end of period (in millions) | $49 | $28 | $26 | $16 | $28 | |||||||||||||||
Ratio of expenses to average net assets 3 | 0.90% | 0.90% | 4 | 0.90% | 4 | 0.85% | 4 | 0.85% | 4 | |||||||||||
Ratio of net investment income (loss) to average net assets | 1.07% | 1.31% | 1.38% | 1.16% | 1.16% | |||||||||||||||
1 Amount represents less than 0.005 per share.
2 Not annualized for periods less than one year.
3 Reflects a waiver of fees by the Manager, and the Sponsor, of the Fund. Had the Manager, and the Sponsor, not waived their fees or reimbursed expenses, the ratio of expenses to average net assets would have been 0.90%, 0.90%, 0.91%, 0.85%, and 0.92%, for the years ended July 31, 2014, 2013, 2012, 2011 and 2010, respectively.
4 Ratio of expenses to average net assets includes indirectly paid expenses. Excluding indirectly paid expenses the ratio of expenses to average net assets would have been 0.90%, 0.90%, 0.85%, and 0.85% for the years ended July 31, 2013, 2012, 2011 and 2010, respectively.
5 Based on average shares outstanding.
SEE NOTES TO FINANCIAL STATEMENTS
49
DOMINI INTERNATIONAL SOCIAL EQUITY FUND — INVESTOR SHARES
FINANCIAL HIGHLIGHTS
| Year Ended July 31, | ||||||||||||||||||||
| 2014 | 2013 | 2012 | 2011 | 2010 | ||||||||||||||||
For a share outstanding for the period: | ||||||||||||||||||||
Net asset value, beginning of period | $7.67 | $5.98 | $7.43 | $6.24 | $6.05 | |||||||||||||||
|
|
|
|
|
|
|
|
|
| |||||||||||
Income from investment operations: | ||||||||||||||||||||
Net investment income (loss) | 0.14 | 0.11 | 0.09 | 0.13 | 0.12 | |||||||||||||||
Net realized and unrealized gain (loss) on investments | 0.85 | 1.64 | (1.04) | 1.18 | 0.20 | |||||||||||||||
|
|
|
|
|
|
|
|
|
| |||||||||||
Total income from investment operations | 0.99 | 1.75 | (0.95) | 1.31 | 0.32 | |||||||||||||||
|
|
|
|
|
|
|
|
|
| |||||||||||
Less dividends and/or distributions: | ||||||||||||||||||||
Dividends to shareholders from net investment income | (0.25) | (0.06) | (0.28) | (0.12) | (0.13) | |||||||||||||||
Distributions to shareholders from net realized gain | (0.15) | - | (0.20) | - | - | |||||||||||||||
Tax return of capital 5 | - | - | (0.02) | - | - | |||||||||||||||
|
|
|
|
|
|
|
|
|
| |||||||||||
Total distributions | (0.40) | (0.06) | (0.50) | (0.12) | (0.13) | |||||||||||||||
|
|
|
|
|
|
|
|
|
| |||||||||||
Redemption fee proceeds 5 | 0.00 | 1 | 0.00 | 1 | 0.00 | 1 | 0.00 | 1 | 0.00 | 1 | ||||||||||
|
|
|
|
|
|
|
|
|
| |||||||||||
Net asset value, end of period | $8.26 | $7.67 | $5.98 | $7.43 | $6.24 | |||||||||||||||
|
|
|
|
|
|
|
|
|
| |||||||||||
Total return 2 | 13.15% | 29.26% | -12.38% | 21.10% | 5.34% | |||||||||||||||
Portfolio turnover | 86% | 87% | 110% | 84% | 85% | |||||||||||||||
Ratios/supplemental data (annualized): | ||||||||||||||||||||
Net assets, end of period (in millions) | $232 | $160 | $127 | $137 | $111 | |||||||||||||||
Ratio of expenses to average net assets 3 | 1.60% | 1.60% | 4 | 1.60% | 4 | 1.60% | 4 | 1.69% | 4 | |||||||||||
Ratio of net investment income (loss) to average net assets | 1.43% | 1.70% | 1.64% | 1.75% | 1.73% | |||||||||||||||
1 Amount represents less than 0.005 per share.
2 Not annualized for periods less than one year.
3 Reflects a waiver of fees by the Manager, and the Distributor of the Fund. Had the Manager, and the Distributor not waived their fees or reimbursed expenses, the ratio of expenses to average net assets would have been 1.62%, 1.68%, 1.74%, 1.70%, and 2.03%, for the years ended July 31, 2014, 2013, 2012, 2011 and 2010, respectively.
4 Ratio of expenses to average net assets includes indirectly paid expenses. Excluding indirectly paid expenses the ratio of expenses to average net assets would have been 1.60%, 1.60%, 1.60% and 1.70% for the years ended July 31, 2013, 2012, 2011 and 2010, respectively.
5 Based on average shares outstanding.
SEE NOTES TO FINANCIAL STATEMENTS
50
DOMINI INTERNATIONAL SOCIAL EQUITY FUND — CLASS A SHARES
FINANCIAL HIGHLIGHTS
| Year Ended July 31, | ||||||||||||||||||||
| 2014 | �� | 2013 | 2012 | 2011 | 2010 | |||||||||||||||
For a share outstanding for the period: | ||||||||||||||||||||
Net asset value, beginning of period | $8.00 | $6.24 | $7.73 | $6.50 | $6.30 | |||||||||||||||
|
|
|
|
|
|
|
|
|
| |||||||||||
Income from investment operations: | ||||||||||||||||||||
Net investment income (loss) | 0.14 | 0.12 | 0.14 | 0.14 | 0.14 | |||||||||||||||
Net realized and unrealized gain (loss) on investments | 0.90 | 1.71 | (1.12) | 1.22 | 0.20 | |||||||||||||||
|
|
|
|
|
|
|
|
|
| |||||||||||
Total income from investment operations | 1.04 | 1.83 | (0.98) | 1.36 | 0.34 | |||||||||||||||
|
|
|
|
|
|
|
|
|
| |||||||||||
Less dividends and/or distributions: | ||||||||||||||||||||
Dividends to shareholders from net investment income | (0.25) | (0.07) | (0.29) | (0.13) | (0.14) | |||||||||||||||
Distributions to shareholders from net realized gain | (0.15) | - | (0.20) | - | - | |||||||||||||||
Tax return of capital 5 | - | - | (0.02) | - | - | |||||||||||||||
|
|
|
|
|
|
|
|
|
| |||||||||||
Total distributions | (0.40) | (0.07) | (0.51) | (0.13) | (0.14) | |||||||||||||||
|
|
|
|
|
|
|
|
|
| |||||||||||
Redemption fee proceeds 5 | 0.00 | 1 | - | - | - | - | ||||||||||||||
|
|
|
|
|
|
|
|
|
| |||||||||||
Net asset value, end of period | $8.64 | $8.00 | $6.24 | $7.73 | $6.50 | |||||||||||||||
|
|
|
|
|
|
|
|
|
| |||||||||||
Total return 2 | 13.16% | 29.30% | -12.26% | 21.05% | 5.35% | |||||||||||||||
Portfolio turnover | 86% | 87% | 110% | 84% | 85% | |||||||||||||||
Ratios/supplemental data (annualized): | ||||||||||||||||||||
Net assets, end of period (in millions) | $29 | $13 | $6 | $4 | $3 | |||||||||||||||
Ratio of expenses to average net assets 3 | 1.57% | 1.57% | 4 | 1.57% | 4 | 1.57% | 4 | 1.62% | 4 | |||||||||||
Ratio of net investment income (loss) to average net assets | 1.51% | 1.91% | 1.85% | 1.82% | 2.03% | |||||||||||||||
1 Amount represents less than 0.005 per share.
2 Total return does not reflect sales commissions and is not annualized for periods less than one year.
3 Reflects a waiver of fees by the Manager, and the Distributor of the Fund. Had the Manager, and the Distributor not waived their fees or reimbursed expenses, the ratio of expenses to average net assets would have been 1.82%, 2.13%, 2.33%, 2.42%, and 3.58%, for the years ended July 31, 2014, 2013, 2012, 2011 and 2010, respectively.
4 Ratio of expenses to average net assets includes indirectly paid expenses. Excluding indirectly paid expenses the ratio of expenses to average net assets would have been 1.57%, 1.57%, 1.57%, and 1.63% for the years ended July 31, 2013, 2012, 2011 and 2010, respectively.
5 Based on average shares outstanding.
SEE NOTES TO FINANCIAL STATEMENTS
51
DOMINI INTERNATIONAL SOCIAL EQUITY FUND — INSTITUTIONAL SHARES
FINANCIAL HIGHLIGHTS
| Year Ended July 31, 2014 | For the Period November 30, 2012 (commencement of operations) through July 31, 2013 | |||||||
For a share outstanding for the period: | ||||||||
Net asset value, beginning of period | $7.66 | $6.59 | ||||||
|
|
|
| |||||
Income from investment operations: | ||||||||
Net investment income (loss) | 0.13 | 0.11 | ||||||
Net realized and unrealized gain (loss) on investments | 0.89 | 1.04 | ||||||
|
|
|
| |||||
Total income from investment operations | 1.02 | 1.15 | ||||||
|
|
|
| |||||
Less dividends and/or distributions: | ||||||||
Dividends to shareholders from net investment income | (0.25) | (0.08) | ||||||
Distributions to shareholders from net realized gain | (0.15) | - | ||||||
|
|
|
| |||||
Total distributions | (0.40) | (0.08) | ||||||
|
|
|
| |||||
Redemption fee proceeds 5 | 0.00 | 1 | - | |||||
|
|
|
| |||||
Net asset value, end of period | $8.28 | $7.66 | ||||||
|
|
|
| |||||
Total return 2 | 13.60% | 17.50% | ||||||
Portfolio turnover | 86% | 87% | ||||||
Ratios/supplemental data (annualized): | ||||||||
Net assets, end of period (in millions) | $39 | $25 | ||||||
Ratio of expenses to average net assets 3 | 1.16% | 1.25% | 4 | |||||
Ratio of net investment income (loss) to average net assets | 1.82% | 2.40% | ||||||
1 Amount represents less than 0.005 per share.
2 Not annualized for periods less than one year.
3 Reflects a waiver of fees by the Manager of the Fund. Had the Manager not waived their fees or reimbursed expenses, the ratio of expenses to average net assets would have been 1.16%, and 1.25% for the years ended July 31, 2014 and 2013, respectively.
4 Ratio of expenses to average net assets includes indirectly paid expenses. Excluding indirectly paid expenses the ratio of expenses to average net assets would have been 1.25% for the period ended July 31, 2013.
5 Based on average shares outstanding.
SEE NOTES TO FINANCIAL STATEMENTS
52
DOMINI SOCIAL EQUITY FUND
DOMINI INTERNATIONAL SOCIAL EQUITY FUND
NOTES TO FINANCIAL STATEMENTS
July 31, 2014
1. ORGANIZATION AND SIGNIFICANT ACCOUNTING POLICIES
The Domini Social Investment Trust is a Massachusetts business trust registered under the Investment Company Act of 1940 as an open-end management investment company. The Domini Social Investment Trust comprises three separate series: Domini Social Equity Fund, Domini International Social Equity Fund (formerly, Domini European PacAsia Social Equity Fund), and Domini Social Bond Fund (each the “Fund,” collectively the “Funds”). The financial statements of the Domini Social Bond Fund are included on page 67 of this report. The Domini Social Equity Fund offers Investor shares, Class A shares, Institutional shares and Class R shares. The Domini International Social Equity Fund offers Investor shares, Class A shares and Institutional Shares. Institutional shares of the Domini International Social Equity Fund were not offered prior to November 30, 2012. The Investor shares, Institutional shares and Class R shares are sold at their offering price, which is net asset value. The Class A shares are sold with a front-end sales charge (load) of up to 4.75%. Class R shares are generally available only to certain eligible retirement plans and endowments, foundations, religious organizations, and other tax-exempt entities that are approved by the Fund’s Distributor. All classes of shares have identical rights and voting privileges with respect to the Fund in general and exclusive voting rights on matters that affect that class alone. Earnings, net assets, and net asset value per share may differ due to each class having its own expenses, such as transfer and shareholder servicing agent fees and registration fees, directly attributable to that class. Class R shares are not subject to distribution and service fees. Institutional shares are not subject to distribution fees.
The preparation of financial statements in conformity with U.S. generally accepted accounting principles requires management to make estimates and assumptions that affect the reported amounts of assets and liabilities and disclosure of contingent liabilities at the date of the financial statements and the reported amounts of revenues and expenses during the reporting period. Actual results could differ from those estimates. The following is a summary of the Funds’ significant accounting policies.
(A) Valuation of Investments. Securities listed or traded on national securities exchanges are valued at the last sale price reported by the security’s primary exchange or, if there have been no sales that day, at the mean of the current bid and ask price that represents the current value of the security. Securities listed on the NASDAQ National Market System are valued using the NASDAQ
53
DOMINI SOCIAL EQUITY FUND
DOMINI INTERNATIONAL SOCIAL EQUITY FUND
NOTES TO FINANCIAL STATEMENTS (continued)
July 31, 2014
Official Closing Price (the “NOCP”). If an NOCP is not available for a security listed on the NASDAQ National Market System, the security will be valued at the last sale price or, if there have been no sales that day, at the mean of the current bid and ask price. Securities for which market quotations are not readily available or as a result of an event occurring after the close of the foreign market but before pricing the Funds are valued at fair value as determined in good faith under procedures established by and under the supervision of the Funds’ Board of Trustees. Securities that are primarily traded on foreign exchanges generally are valued at the closing price of such securities on their respective exchanges, except that if the Trusts’ manager or submanager, as applicable, is of the opinion that such price would result in an inappropriate value for a security, including as a result of an occurrence subsequent to the time a value was so established, then the fair value of those securities may be determined by consideration of other factors (including the use of an independent pricing service) by or under the direction of the Board of Trustees or its delegates.
The Funds follow a fair value hierarchy that distinguishes between (a) market participant assumptions developed based on market data obtained from sources independent of the reporting entity (observable inputs) and (b) the Fund’s own assumptions about market participant assumptions developed based on the best information available in the circumstances (unobservable inputs). These inputs are used in determining the value of the Funds’ investments and are summarized in the following fair value hierarchy:
Level 1 — quoted prices in active markets for identical securities
Level 2 — other significant observable inputs (including quoted prices for similar securities, interest rates, and evaluated quotation obtained from pricing services)
Level 3 — significant unobservable inputs (including the Funds’ own assumptions in determining the fair value of investments)
The inputs or methodology used for valuing securities are not an indication of the risk associated with investing in those securities.
54
DOMINI SOCIAL EQUITY FUND
DOMINI INTERNATIONAL SOCIAL EQUITY FUND
NOTES TO FINANCIAL STATEMENTS (continued)
July 31, 2014
The following is a summary of the inputs used by the Domini Social Equity Fund, as of July 31, 2014, in valuing the Fund’s assets carried at fair value:
| Level 1 - Quoted Prices | Level 2 - Other Significant Observable Inputs | Level 3 - Significant Unobservable Inputs | Total | |||||||||||||
Common Stocks | ||||||||||||||||
Consumer Discretionary | $ | 135,345,859 | $ | - | $ | - | $ | 135,345,859 | ||||||||
Consumer Staples | 88,456,681 | - | - | 88,456,681 | ||||||||||||
Energy | 86,718,383 | - | - | 86,718,383 | ||||||||||||
Financials | 181,140,834 | - | - | 181,140,834 | ||||||||||||
Health Care | 116,652,470 | - | - | 116,652,470 | ||||||||||||
Industrials | 84,926,800 | - | - | 84,926,800 | ||||||||||||
Information Technology | 213,188,944 | - | - | 213,188,944 | ||||||||||||
Materials | 14,220,887 | - | - | 14,220,887 | ||||||||||||
Telecommunication Services | 59,062,668 | - | - | 59,062,668 | ||||||||||||
Utilities | 28,038,418 | - | - | 28,038,418 | ||||||||||||
|
|
|
|
|
|
|
| |||||||||
Total | $ | 1,007,751,944 | $ | - | $ | - | $ | 1,007,751,944 | ||||||||
|
|
|
|
|
|
|
| |||||||||
The following is a summary of the inputs used by the Domini International Social Equity Fund, as of July 31, 2014, in valuing the Fund’s assets carried at fair value:
| Level 1 - Quoted Prices | Level 2 - Other Significant Observable Inputs | Level 3 - Significant Unobservable Inputs | Total | |||||||||||||
Common Stocks | ||||||||||||||||
Consumer Discretionary | $ | - | $ | 30,922,759 | $ | - | $ | 30,922,759 | ||||||||
Consumer Staples | - | 20,306,560 | - | 20,306,560 | ||||||||||||
Energy | 6,690,599 | 2,823,033 | - | 9,513,632 | ||||||||||||
Financials | - | 79,825,717 | 9,106 | 79,834,823 | ||||||||||||
Health Care | - | 29,018,584 | - | 29,018,584 | ||||||||||||
Industrials | 571,448 | 40,434,849 | - | 41,006,297 | ||||||||||||
Information Technology | - | 27,354,077 | - | 27,354,077 | ||||||||||||
Materials | - | 17,253,993 | - | 17,253,993 | ||||||||||||
Telecommunication Services | 3,844,642 | 18,221,329 | - | 22,065,971 | ||||||||||||
Utilities | - | 7,510,774 | - | 7,510,774 | ||||||||||||
Preferred Stocks | ||||||||||||||||
Consumer Staples | - | 4,075,181 | - | 4,075,181 | ||||||||||||
Financials | - | 5,124,492 | - | 5,124,492 | ||||||||||||
Utilities | - | 1,517,737 | - | 1,517,737 | ||||||||||||
|
|
|
|
|
|
|
| |||||||||
Total | $ | 11,106,689 | $ | 284,389,085 | $ | 9,106 | $ | 295,504,880 | ||||||||
|
|
|
|
|
|
|
| |||||||||
55
DOMINI SOCIAL EQUITY FUND
DOMINI INTERNATIONAL SOCIAL EQUITY FUND
NOTES TO FINANCIAL STATEMENTS (continued)
July 31, 2014
The following is a reconciliation of Level 3 assets for which significant unobservable inputs were used to determine fair value:
| Domini International Social Equity Fund | ||||
Investments in Securities | ||||
Balance as of July 31, 2013 | $ | 9,315 | ||
Realized Gain (loss) | - | |||
Change in unrealized appreciation (depreciation) | 2,807 | |||
Purchases | - | |||
Sales | - | |||
Transfers in and/or out of Level Three | (3,016) | |||
|
| |||
Balance as of July 31, 2014 | $ | 9,106 | ||
|
| |||
The change in unrealized appreciation (depreciation) included in earnings relating to securities still held at July 31, 2014: | $ | (242) | ||
|
| |||
Transfers from Level 1 to Level 3 included securities valued at $312,946 that were transferred as a result of quoted prices in active markets not being readily available. Transfers out of Level 3 into Level 1 included securities valued at $315,962 because market values were readily available from a pricing agent for which fair value factors were previously applied.
(B) Foreign Currency Translation. Securities and other assets and liabilities denominated in foreign currencies are translated into U.S. dollar amounts on the date of valuation. Purchases and sales of securities, and income and expense items denominated in foreign currencies, are translated into U.S. dollar amounts on the respective dates of such transactions. Occasionally, events impact the availability or reliability of foreign exchange rates used to convert the U.S. dollar equivalent value. If such an event occurs, the foreign exchange rate will be valued at fair value using procedures established and approved by the Board of Trustees.
The Funds do not separately report the effect of fluctuations in foreign exchange rates from changes in market prices on securities held. Such fluctuations are included with the net realized and unrealized gain or loss from investments. Realized foreign exchange gains or losses arise from sales of foreign currencies, currency gains or losses realized between the trade and settlement dates on securities transactions, and the difference between the recorded amounts of dividends, interest, and foreign withholding taxes and the U.S. dollar equivalent of the amounts actually received or paid. Net unrealized foreign exchange gains and losses arise from changes in fair value of assets and liabilities other than investments in securities held at the end of the reporting period, resulting from changes in exchange rates.
56
DOMINI SOCIAL EQUITY FUND
DOMINI INTERNATIONAL SOCIAL EQUITY FUND
NOTES TO FINANCIAL STATEMENTS (continued)
July 31, 2014
(C) Foreign Currency Contracts. When the Funds purchase or sell foreign securities they enter into foreign exchange contracts to minimize foreign exchange risk from the trade date to the settlement date of the transactions. A foreign exchange contract is an agreement between two parties to exchange different currencies at an agreed-upon exchange rate on a specified date. There were no open contracts at July 31, 2014.
(D) Investment Transactions, Investment Income and Dividends to Shareholders. The Funds earn income daily, net of Fund expenses. Dividends to shareholders of the Domini International Social Equity Fund are usually declared and paid semiannually from net investment income. Dividends to shareholders of the Domini Social Equity Fund are usually declared and paid quarterly from net investment income. Distributions to shareholders of realized capital gains, if any, are made annually. Distributions are determined in conformity with income tax regulations, which may differ from generally accepted accounting principles. Reclassifications have been made to the Funds’ components of net assets to reflect income and gains available for distribution (or available capital loss carryovers, as applicable) under income tax regulations.
Investment transactions are accounted for on trade date. Realized gains and losses from security transactions are determined on the basis of identified cost. Interest income is recorded on an accrual basis. Dividend income, net of any applicable withholding tax, is recorded on the ex-dividend date or for certain foreign securities, when the information becomes available to the Funds.
(E) Federal Taxes. Each Fund’s policy is to comply with the provisions of the Internal Revenue Code applicable to regulated investment companies and to distribute substantially all of its taxable income, including net realized gains, if any, within the prescribed time periods. Accordingly, no provision for federal income or excise tax is deemed necessary. As of July 31, 2014, tax years 2011 through 2014 remain subject to examination by the Funds’ major tax jurisdictions, which include the United States of America, the Commonwealth of Massachusetts, and New York State.
(F) Redemption Fees. Redemptions and exchanges of Fund shares held less than 30 days may be subject to the Funds’ redemption fee, which is 2% of the amount redeemed. Such fees are retained by the Funds and are recorded as an adjustment to paid-in capital.
(G) Other. Income, expenses (other than those attributable to a specific class), gains, and losses are allocated on a daily basis to each class of shares based
57
DOMINI SOCIAL EQUITY FUND
DOMINI INTERNATIONAL SOCIAL EQUITY FUND
NOTES TO FINANCIAL STATEMENTS (continued)
July 31, 2014
upon the relative proportion of net assets represented by such class. Operating expenses directly attributable to a specific class are charged against the operations of that class.
(H) Indemnification. The Funds’ organizational documents provide current and former trustees and officers with a limited indemnification against liabilities arising in connection with the performance of their duties to the Funds. In the normal course of business, the Funds may also enter into contracts that provide general indemnifications. The Funds’ maximum exposure under these arrangements is unknown as this would be dependent on future claims that may be made against the Funds. The risk of material loss from such claims is considered remote.
2. TRANSACTIONS WITH AFFILIATES
(A) Manager/Sponsor. The Funds have retained Domini Social Investments LLC (Domini) to serve as investment manager and administrator. Domini is registered as an investment advisor under the Investment Advisers Act of 1940. The services provided by Domini consist of investment supervisory services, overall operational support, and administrative services. The administrative services include the provision of general office facilities and supervising the overall administration of the Funds. For its services under the Management Agreements, Domini receives from each Fund a fee accrued daily and paid monthly at the annual rate below of the respective Funds’ average daily net assets before any fee waivers:
| Domini Social Equity Fund | 0.30% of the first $2 billion of net assets managed, | |
| 0.29% of the next $1 billion of net assets managed, and | ||
| 0.28% of net assets managed in excess of $3 billion | ||
| Domini International Social Equity Fund | 1.00% of the first $250 million of net assets managed, | |
| 0.94% of the next $250 million of net assets managed, and | ||
| 0.88% of net assets managed in excess of $500 million |
Pursuant to a Sponsorship Agreement (with respect to the Domini Social Equity Fund) Domini provides the Funds with the administrative personnel and services necessary to operate the Funds. In addition to general administrative services and facilities for the Funds similar to those provided by Domini under the Management Agreements, Domini answers questions from the general public and the media regarding the securities holdings of the Funds. For these services and facilities, Domini receives fees accrued daily and paid monthly
58
DOMINI SOCIAL EQUITY FUND
DOMINI INTERNATIONAL SOCIAL EQUITY FUND
NOTES TO FINANCIAL STATEMENTS (continued)
July 31, 2014
from the Funds at the annual rate below of the respective Funds’ average daily net assets before any fee waivers:
| Domini Social Equity Fund | 0.45% of the first $2 billion of net assets managed, | |
| 0.44% of the next $1 billion of net assets managed, and | ||
| 0.43% of net assets managed in excess of $3 billion |
Effective November 30, 2013, Domini reduced its fees and reimbursed expenses, not including reorganization related expenses, to the extent necessary to keep the aggregate annual operating expenses of the Domini Social Equity Fund at no greater than 1.25%, 1.18%, 0.80%, and 0.90% of the average daily net assets representing Investor shares, Class A shares, Institutional shares and Class R shares, respectively. For the periods prior to November 30, 2013, similar arrangements were in effect. The waivers currently in effect are contractual and in effect until November 30, 2014, absent an earlier modification by the Board of Trustees which oversees the Funds. Effective November 30, 2013, Domini reduced its fees and reimbursed expenses to the extent necessary to keep the aggregate annual operating expenses, not including reorganization expenses, of the Domini International Social Equity Fund no greater than 1.60%, 1.57% and 1.27% of the average daily net assets representing Investor shares, Class A shares and Institutional Shares, respectively. For the period prior to November 30, 2013, similar arrangements were in effect. The waivers currently in effect are contractual and in effect until November 30, 2014, absent an earlier modification by the Board of Trustees which oversees the Funds.
For the year ended July 31, 2014, Domini waived fees and reimbursed expenses as follows:
| FEES WAIVED | EXPENSES REIMBURSED | |||||||
Domini Social Equity Fund . . . . . . . . . . . . . . . .. | $ | - | $ | 23,783 | ||||
Domini International Social Equity Fund. . . . .. . | - | - | ||||||
(B) Submanager. Wellington Management Company, LLP (Wellington) provides investment submanagement services to the Funds on a day-to-day basis pursuant to Submanagement Agreements with Domini.
(C) Distributor. The Board of Trustees of the Funds has adopted a Distribution Plan with respect to the Funds’ Investor shares and Class A shares in accordance with Rule 12b-1 under the Act. DSIL Investment Services LLC, a wholly owned subsidiary of Domini (DSILD), acts as agent of the Funds in connection with the offering of Investor shares of the Funds pursuant to a Distribution Agreement. Under the Distribution Plan, the Funds pay expenses
59
DOMINI SOCIAL EQUITY FUND
DOMINI INTERNATIONAL SOCIAL EQUITY FUND
NOTES TO FINANCIAL STATEMENTS (continued)
July 31, 2014
incurred in connection with the sale of Investor shares and Class A shares and pay DSILD a distribution fee at an aggregate annual rate not to exceed 0.25% of the average daily net assets representing the Investor shares and Class A shares. For the year ended July 31, 2014, fees waived were as follows:
| FEES WAIVED | ||||
Domini Social Equity Fund Investor shares | $ | - | ||
Domini Social Equity Fund Class A shares | 16,040 | |||
Domini International Social Equity Fund Investor shares | 34,164 | |||
Domini International Social Equity Fund Class A shares | 57,822 | |||
DSIL Investment Services, LLC, (DSIL) the Funds’ Distributor, has received commissions related to the sales of fund shares. For the year ended July 31, 2014, DSIL received $7,546, and $6,920 from the Domini Social Equity Fund Class A Shares, and the Domini International Social Equity Fund Class A shares, respectively.
(D) Shareholder Service Agent. The Trust has retained Domini to provide certain shareholder services with respect to the Domini Social Equity Fund, and Domini International Social Equity Fund and their shareholders, which services were previously provided by BNY Asset Servicing (“BNY”) or another fulfillment and mail service provider and are supplemental to services currently provided by BNY, pursuant to a transfer agency agreement between each Fund and BNY. For these services, Domini receives fees from each Fund paid monthly at an annual rate of $4.00 per active account. For the year ended July 31, 2014, Domini waived fees as follows:
| FEES WAIVED | ||||
Domini Social Equity Fund Investor shares | $ | - | ||
Domini Social Equity Fund Class A shares | - | |||
Domini Social Equity Fund Institutional shares | 158 | |||
Domini Social Equity Fund Class R shares | - | |||
Domini International Social Equity Fund Investor shares | - | |||
Domini International Social Equity Fund Class A shares | - | |||
Domini International Social Equity Fund Institutional shares | - | |||
3. INVESTMENT TRANSACTIONS
For the year ended July 31, 2014, cost of purchase and proceeds from sales of investments other than short-term obligations were as follows:
| PURCHASE | SALES | |||||||
Domini Social Equity Fund | $ | 801,590,996 | $ | 824,408,732 | ||||
Domini International Social Equity Fund | 292,138,504 | 215,948,230 | ||||||
60
DOMINI SOCIAL EQUITY FUND
DOMINI INTERNATIONAL SOCIAL EQUITY FUND
NOTES TO FINANCIAL STATEMENTS (continued)
July 31, 2014
4. SUMMARY OF SHARE TRANSACTIONS
| Year Ended July 31, | ||||||||||||||||
| 2014 | 2013 | |||||||||||||||
| Shares | Amount | Shares | Amount | |||||||||||||
Domini Social Equity Fund | ||||||||||||||||
Investor Shares | ||||||||||||||||
Shares sold | 1,476,027 | $ | 65,030,883 | 1,326,785 | $ | 46,366,600 | ||||||||||
Shares issued in reinvestment of dividends and distributions | 86,006 | 3,923,408 | 101,248 | 3,640,475 | ||||||||||||
Shares redeemed | (2,571,296) | (113,814,059) | (2,208,468) | (76,970,213) | ||||||||||||
Redemption fees | - | 11,383 | - | 4,157 | ||||||||||||
|
|
|
|
|
|
|
| |||||||||
Net increase (decrease) | (1,009,263) | $ | (44,848,385) | (780,435) | $ | (26,958,981) | ||||||||||
|
|
|
|
|
|
|
| |||||||||
Class A Shares | ||||||||||||||||
Shares sold | 159,325 | $ | 2,058,334 | 145,158 | $ | 1,563,507 | ||||||||||
Shares issued in reinvestment of dividends and distributions | 11,698 | 158,194 | 13,183 | 142,636 | ||||||||||||
Shares redeemed | (53,538) | (675,327) | (68,720) | (730,533) | ||||||||||||
Redemption fees | - | - | - | - | ||||||||||||
|
|
|
|
|
|
|
| |||||||||
Net increase (decrease) | 117,485 | $ | 1,541,201 | 89,621 | $ | 975,610 | ||||||||||
|
|
|
|
|
|
|
| |||||||||
Institutional Shares | ||||||||||||||||
Shares sold | 1,856,018 | $ | 49,579,968 | 1,782,287 | $ | 37,433,238 | ||||||||||
Shares issued in reinvestment of dividends and distributions | 109,217 | 3,015,008 | 185,550 | 4,008,573 | ||||||||||||
Shares redeemed | (1,862,024) | (47,399,505) | (1,980,983) | (43,254,480) | ||||||||||||
Redemption fees | - | 4,260 | - | 1,902 | ||||||||||||
|
|
|
|
|
|
|
| |||||||||
Net increase (decrease) | 103,211 | $ | 5,199,731 | (13,146) | $ | (1,810,767) | ||||||||||
|
|
|
|
|
|
|
| |||||||||
Class R Shares | ||||||||||||||||
Shares sold | 1,975,059 | $ | 24,981,712 | 685,285 | $ | 6,933,259 | ||||||||||
Shares issued in reinvestment of dividends and distributions | 71,272 | 887,811 | 100,200 | 998,558 | ||||||||||||
Shares redeemed | (776,092) | (9,503,740) | (1,028,170) | (9,923,277) | ||||||||||||
Redemption fees | - | 766 | - | 144 | ||||||||||||
|
|
|
|
|
|
|
| |||||||||
Net increase (decrease) | 1,270,239 | $ | 16,366,549 | (242,685) | $ | (1,991,316) | ||||||||||
|
|
|
|
|
|
|
| |||||||||
Total | ||||||||||||||||
Shares sold | 5,466,429 | $ | 141,650,897 | 3,939,515 | $ | 92,296,604 | ||||||||||
Shares issued in reinvestment of dividends and distributions | 278,193 | 7,984,421 | 400,181 | 8,790,242 | ||||||||||||
Shares redeemed | (5,262,950) | (171,392,631) | (5,286,341) | (130,878,503) | ||||||||||||
Redemption fees | - | 16,409 | - | 6,203 | ||||||||||||
|
|
|
|
|
|
|
| |||||||||
Net increase (decrease) | 481,672 | $ | (21,740,904) | (946,645) | $ | (29,785,454) | ||||||||||
|
|
|
|
|
|
|
| |||||||||
61
DOMINI SOCIAL EQUITY FUND
DOMINI INTERNATIONAL SOCIAL EQUITY FUND
NOTES TO FINANCIAL STATEMENTS (continued)
July 31, 2014
| Year Ended July 31, | ||||||||||||||||
| 2014 | 2013 | |||||||||||||||
| Shares | Amount | Shares | Amount | |||||||||||||
Domini International Social Equity Fund | ||||||||||||||||
Investor Shares | ||||||||||||||||
Shares sold | 9,956,600 | $ | 81,189,777 | 6,500,207 | $ | 46,141,404 | ||||||||||
Shares issued in reinvestment of dividends and distributions | 896,604 | 7,128,001 | 129,361 | 975,385 | ||||||||||||
Shares redeemed | (3,551,984) | (28,923,487) | (6,993,286) | (47,524,063) | ||||||||||||
Redemption fees | - | 4,915 | - | 1,162 | ||||||||||||
|
|
|
|
|
|
|
| |||||||||
Net increase (decrease) | 7,301,220 | $ | 59,399,206 | (363,718) | $ | (406,112) | ||||||||||
|
|
|
|
|
|
|
| |||||||||
Class A Shares | ||||||||||||||||
Shares sold | 2,091,101 | $ | 17,768,073 | 1,006,185 | $ | 7,478,207 | ||||||||||
Shares issued in reinvestment of dividends and distributions | 109,531 | 911,302 | 12,770 | 100,495 | ||||||||||||
Shares redeemed | (479,746) | (4,096,933) | (270,928) | (2,036,729) | ||||||||||||
Redemption fees | - | 1,370 | - | - | ||||||||||||
|
|
|
|
|
|
|
| |||||||||
Net increase (decrease) | 1,720,886 | $ | 14,583,812 | 748,027 | $ | 5,541,973 | ||||||||||
|
|
|
|
|
|
|
| |||||||||
Institutional Shares | ||||||||||||||||
Shares sold | 1,695,152 | $ | 13,581,370 | 3,280,861 | $ | 21,910,412 | ||||||||||
Shares issued in reinvestment of dividends and distributions | 127,710 | 1,015,293 | 23 | 176 | ||||||||||||
Shares redeemed | (331,917) | (2,711,182) | (29,836) | (216,574) | ||||||||||||
Redemption fees | - | 342 | - | - | ||||||||||||
|
|
|
|
|
|
|
| |||||||||
Net increase (decrease) | 1,490,945 | $ | 11,885,823 | 3,251,048 | $ | 21,694,014 | ||||||||||
|
|
|
|
|
|
|
| |||||||||
Total | ||||||||||||||||
Shares sold | 13,742,853 | $ | 112,539,220 | 10,787,253 | $ | 75,530,023 | ||||||||||
Shares issued in reinvestment of dividends and distributions | 1,133,845 | 9,054,596 | 142,154 | 1,076,056 | ||||||||||||
Shares redeemed | (4,363,647) | (35,731,602) | (7,294,050) | (49,777,366) | ||||||||||||
Redemption fees | - | 6,627 | - | 1,162 | ||||||||||||
|
|
|
|
|
|
|
| |||||||||
Net increase (decrease) | 10,513,051 | $ | 85,868,841 | 3,635,357 | $ | 26,829,875 | ||||||||||
|
|
|
|
|
|
|
| |||||||||
62
DOMINI SOCIAL EQUITY FUND
DOMINI INTERNATIONAL SOCIAL EQUITY FUND
NOTES TO FINANCIAL STATEMENTS (continued)
July 31, 2014
5. FEDERAL TAX STATUS
The tax basis of the components of net assets for the Funds at July 31, 2014, is as follows:
| Domini Social Equity Fund | Domini International Social Equity Fund | |||||||
Undistributed ordinary income | $ | 147,435 | $ | 613,931 | ||||
Undistributed long term capital gains | 68,731,559 | 11,295,765 | ||||||
Capital losses, other losses and other temporary differences | - | (510,243) | ||||||
Unrealized appreciation/(depreciation) | 185,147,205 | 31,716,014 | ||||||
|
|
|
| |||||
Distributable net earnings/(deficit) | $ | 254,026,199 | $ | 43,115,467 | ||||
|
|
|
| |||||
The difference between components of Distributable Earnings on a tax basis and the amounts reflected in the statement of assets and liabilities is primarily due to differences in book and tax policies.
For the year ended July 31, 2014, the Funds made the following reclassifications to the components of net assets to align financial reporting with tax reporting:
| Domini Social Equity Fund | Domini International Social Equity Fund | |||||||
Paid-in capital | $ | - | $ | (170,081) | ||||
Undistributed net investment income (loss) | (1,021,438) | 429,327 | ||||||
Accumulated net realized gain (loss) | 1,021,438 | (259,246) | ||||||
The Funds have accumulated capital loss carryforwards that will expire as follows:
| Domini Social Equity Fund | Domini International Social Equity Fund | |||||||
Unlimited | - | - | ||||||
2017 | - | 510,243 | ||||||
|
|
|
| |||||
| $ | - | $ | 510,243 | |||||
|
|
|
| |||||
To the extent that the Funds realize future net capital gains, those gains will be offset by any unused capital loss carryforwards. Under recently enacted Regulated Investment Company Modernization Act of 2010, the Funds will be permitted to carry forward capital losses incurred in taxable years beginning after December 22, 2010, for an unlimited time period.
63
DOMINI SOCIAL EQUITY FUND
DOMINI INTERNATIONAL SOCIAL EQUITY FUND
NOTES TO FINANCIAL STATEMENTS (continued)
July 31, 2014
However, any losses incurred during those future taxable years will be required to be utilized prior to the losses incurred in pre-enactment taxable years. As a result of this ordering rule, pre-enactment capital loss carryforwards may be more likely to expire unused. Additionally, post-enactment capital losses that are carried forward will retain their character as either short-term or long-term capital losses rather than being considered all short-term as under previous law.
For federal income tax purposes, dividends paid were characterized as follows:
| Domini Social Equity Fund | Domini International Social Equity Fund | |||||||||||||||
| Year Ended July 31, | Year Ended July 31, | |||||||||||||||
| 2014 | 2013 | 2014 | 2013 | |||||||||||||
Ordinary income | $ | 8,366,375 | $ | 9,067,268 | $ | 7,783,739 | $ | 1,575,273 | ||||||||
Long-term capital gain | - | - | 4,008,279 | - | ||||||||||||
Return of Capital | - | - | - | - | ||||||||||||
|
|
|
|
|
|
|
| |||||||||
Total | $ | 8,366,375 | $ | 9,067,268 | $ | 11,792,018 | $ | 1,575,273 | ||||||||
|
|
|
|
|
|
|
| |||||||||
The Funds are subject to the provisions of Accounting Standards Codification ASC 740 Income Taxes (ASC 740). ASC 740 sets forth a minimum threshold for financial statement recognition of the benefit of a tax position taken or expected to be taken in a tax return. The Funds did not have a liability to record for any unrecognized tax benefits in the accompanying financial statements. No provision has been made for taxes on income, capital gains or unrealized appreciation on securities held or for excise tax on income and capital gains.
64
Report of Independent Registered Public Accounting Firm
Board of Trustees and Shareholders of
Domini Social Investment Trust:
We have audited the accompanying statements of assets and liabilities, including the portfolios of investments, of the Domini Social Equity Fund and the Domini International Social Equity Fund (collectively the “Funds”), each a Fund within the series of the Domini Social Investment Trust, as of July 31, 2014, and the related statements of operations for the year then ended, the statements of changes in net assets for each of the years in the two-year period then ended, and the financial highlights for each of the years or periods in the five-year period then ended. These financial statements and financial highlights are the responsibility of the Funds’ management. Our responsibility is to express an opinion on these financial statements and financial highlights based on our audits.
We conducted our audits in accordance with the standards of the Public Company Accounting Oversight Board (United States). Those standards require that we plan and perform the audits to obtain reasonable assurance about whether the financial statements and financial highlights are free of material misstatement. An audit includes examining, on a test basis, evidence supporting the amounts and disclosures in the financial statements. Our procedures included confirmation of securities owned as of July 31, 2014, by correspondence with the custodian and brokers, or by other appropriate auditing procedures. An audit also includes assessing the accounting principles used and significant estimates made by management, as well as evaluating the overall financial statement presentation. We believe that our audits provide a reasonable basis for our opinion.
In our opinion, the financial statements and financial highlights referred to above present fairly, in all material respects, the financial position of the Domini Social Equity Fund and the Domini International Social Equity Fund as of July 31, 2014, the results of their operations for the year then ended, the changes in their net assets for each of the years in the two-year period then ended, and the financial highlights for each of the years or periods in the five-year period then ended, in conformity with U.S. generally accepted accounting principles.
Boston, Massachusetts
September 25, 2014

65
THIS PAGE INTENTIONALLY LEFT BLANK
STATEMENT OF ASSETS AND LIABILITIES
July 31, 2014
ASSETS: | ||||
Investments at value (cost $125,473,944) | $ | 126,969,263 | ||
Cash | 2,957,696 | |||
Receivable for securities sold | 5,026,694 | |||
Interest receivable | 450,878 | |||
Receivable for capital shares | 395,352 | |||
Interest reclaim receivable | 297 | |||
|
| |||
Total assets | 135,800,180 | |||
|
| |||
LIABILITIES: | ||||
Payable for securities purchased | 5,619,829 | |||
Payable for capital shares | 63,427 | |||
Management fee payable | 71,460 | |||
Distribution fee payable | 14,307 | |||
Other accrued expenses | 18,583 | |||
Dividend payable | 17,023 | |||
|
| |||
Total liabilities | 5,804,629 | |||
|
| |||
NET ASSETS | $ | 129,995,551 | ||
|
| |||
NET ASSETS CONSIST OF: | ||||
Paid-in capital | $ | 128,850,049 | ||
Undistributed net investment loss | (17,023) | |||
Accumulated net realized loss from investments | (332,794) | |||
Net unrealized appreciation from investments | 1,495,319 | |||
|
| |||
| $ | 129,995,551 | |||
|
| |||
NET ASSET VALUE PER SHARE | ||||
Investor Shares | ||||
Net assets | $ | 125,899,159 | ||
|
| |||
Outstanding shares of beneficial interest | 11,202,577 | |||
|
| |||
Net asset value and offering price per share* | $ | 11.24 | ||
|
| |||
Institutional Shares | ||||
Net assets | $ | 4,096,392 | ||
|
| |||
Outstanding shares of beneficial interest | 364,795 | |||
|
| |||
Net asset value and offering price per share* | $ | 11.23 | ||
|
|
* Redemption price is equal to net asset value less any applicable redemption fees retained by the Fund.
SEE NOTES TO FINANCIAL STATEMENTS
67
DOMINI SOCIAL BOND FUND
STATEMENT OF OPERATIONS
For the Year Ended July 31, 2014
INCOME: | ||||
Interest income | $ | 3,005,419 | ||
|
| |||
EXPENSES: | ||||
Management fee | 506,241 | |||
Administrative fee | 316,400 | |||
Distribution fees – Investor shares | 307,006 | |||
Transfer agent fees – Investor shares | 208,100 | |||
Transfer agent fees – Institutional shares | 311 | |||
Accounting and custody fees | 91,854 | |||
Professional fees | 46,143 | |||
Registration – Investor shares | 25,330 | |||
Registration – Insitutional shares | 8,188 | |||
Shareholding servicing fees – Investor shares | 15,109 | |||
Shareholding servicing fees – Institutional shares | 42 | |||
Shareholder communications | 12,736 | |||
Miscellaneous | 11,476 | |||
Trustees fees | 8,323 | |||
|
| |||
Total expenses | 1,557,259 | |||
Fees waived and expense reimbursed | (365,752) | |||
|
| |||
Net expenses | 1,191,507 | |||
|
| |||
NET INVESTMENT INCOME | 1,813,912 | |||
|
| |||
NET REALIZED AND UNREALIZED GAIN/(LOSS): | ||||
Net realized gain (loss) on investments | (77,804) | |||
Net change in unrealized appreciation (depreciation) on investments | 1,418,168 | |||
|
| |||
Net realized and unrealized gain (loss) from investments | 1,340,364 | |||
|
| |||
NET INCREASE IN NET ASSETS RESULTING FROM OPERATIONS | $ | 3,154,276 | ||
|
|
SEE NOTES TO FINANCIAL STATEMENTS
68
DOMINI SOCIAL BOND FUND
STATEMENTS OF CHANGES IN NET ASSETS
| Year Ended July 31, | ||||||||
| 2014 | 2013 | |||||||
INCREASE IN NET ASSETS: | ||||||||
FROM OPERATIONS: | ||||||||
Net investment income (loss) | $ | 1,813,912 | $ | 1,889,638 | ||||
Net realized gain (loss) on investments | (77,804) | 320,270 | ||||||
Net change in unrealized appreciation (depreciation) on investments | 1,418,168 | (4,984,143) | ||||||
|
|
|
| |||||
Net Increase (Decrease) in Net Assets Resulting from Operations | 3,154,276 | (2,774,235) | ||||||
|
|
|
| |||||
DISTRIBUTIONS AND DIVIDENDS: | ||||||||
Dividends to shareholders from net investment income: | ||||||||
Investor shares | (1,748,919) | (1,834,174) | ||||||
Institutional shares | (64,993) | (55,464) | ||||||
Distributions to shareholders from net realized gain: | ||||||||
Investor shares | (397,247) | (1,248,847) | ||||||
Institutional shares | (11,082) | (15,147) | ||||||
|
|
|
| |||||
Net Decrease in Net Assets from Distributions and Dividends | (2,222,241) | (3,153,632) | ||||||
|
|
|
| |||||
CAPITAL SHARE TRANSACTIONS: | ||||||||
Proceeds from sale of shares | 27,436,965 | 34,305,140 | ||||||
Net asset value of shares issued in reinvestment of distributions and dividends | 2,006,250 | 2,913,277 | ||||||
Payment for shares redeemed | (34,059,983) | (36,442,282) | ||||||
Redemption fee | 8,390 | 1,764 | ||||||
|
|
|
| |||||
Net Increase (Decrease) in Net Assets from Capital Share Transactions | (4,608,378) | 777,899 | ||||||
|
|
|
| |||||
Total Increase (Decrease) in Net Assets | (3,676,343) | (5,149,968) | ||||||
|
|
|
| |||||
NET ASSETS: | ||||||||
Beginning of period | $ | 133,671,894 | $ | 138,821,862 | ||||
|
|
|
| |||||
End of period | $ | 129,995,551 | $ | 133,671,894 | ||||
|
|
|
| |||||
Undistributed net investment income (loss) | $ | (17,023) | $ | (15,043) | ||||
|
|
|
| |||||
SEE NOTES TO FINANCIAL STATEMENTS
69
DOMINI SOCIAL BOND FUND — INVESTOR SHARES
FINANCIAL HIGHLIGHTS
| Year Ended July 31, | ||||||||||||||||||||
| 2014 | 2013 | 2012 | 2011 | 2010 | ||||||||||||||||
For a share outstanding for the period: | ||||||||||||||||||||
Net asset value, beginning of period | $11.15 | $11.64 | $11.61 | $11.76 | $11.36 | |||||||||||||||
|
|
|
|
|
|
|
|
|
| |||||||||||
Income from investment operations: | ||||||||||||||||||||
Net investment income (loss) | 0.16 | 0.16 | 0.21 | 0.28 | 0.33 | |||||||||||||||
Net realized and unrealized gain (loss) on investments | 0.13 | (0.38) | 0.34 | 0.06 | 0.40 | |||||||||||||||
|
|
|
|
|
|
|
|
|
| |||||||||||
Total income from investment operations | 0.29 | (0.22) | 0.55 | 0.34 | 0.73 | |||||||||||||||
|
|
|
|
|
|
|
|
|
| |||||||||||
Less dividends and distributions: | ||||||||||||||||||||
Dividends to shareholders from net investment income | (0.16) | (0.16) | (0.21) | (0.28) | (0.33) | |||||||||||||||
Distributions to shareholders from net realized gain | (0.04) | (0.11) | (0.31) | (0.21) | - | |||||||||||||||
|
|
|
|
|
|
|
|
|
| |||||||||||
Total dividends and distributions | (0.20) | (0.27) | (0.52) | (0.49) | (0.33) | |||||||||||||||
|
|
|
|
|
|
|
|
|
| |||||||||||
Redemption fee proceeds 5 | 0.00 | 1 | 0.00 | 1 | 0.00 | 1 | 0.00 | 1 | 0.00 | 1 | ||||||||||
|
|
|
|
|
|
|
|
|
| |||||||||||
Net asset value, end of period | $11.24 | $11.15 | $11.64 | $11.61 | $11.76 | |||||||||||||||
|
|
|
|
|
|
|
|
|
| |||||||||||
Total return 2 | 2.59% | -2.01% | 4.80% | 2.94% | 6.49% | |||||||||||||||
Portfolio turnover | 120% | 129% | 126% | 151% | 66% | |||||||||||||||
Ratios/supplemental data (annualized): | ||||||||||||||||||||
Net assets, end of period (in millions) | $126 | $130 | $138 | $121 | $112 | |||||||||||||||
Ratio of expenses to average net assets 3 | 0.95% | 0.95% | 4 | 0.95% | 4 | 0.95% | 4 | 0.95% | 4 | |||||||||||
Ratio of net investment income to average net assets | 1.42% | 1.35% | 1.76% | 2.39% | 2.82% | |||||||||||||||
1 Amount represents less than $0.005 per share.
2 Not annualized for periods less than one year.
3 Reflects a waiver of fees by the Manager and the Distributor due to a contractual fee waiver. Had the Manager and the Distributor not waived their fees and reimbursed expenses, the ratio of expenses to average net assets would have been 1.24%, 1.24%, 1.28%, 1.29%, and 1.33%, for the years ended July 31, 2014, 2013, 2012, 2011, and 2010, respectively.
4 Ratio of expenses to average net assets includes indirectly paid expenses. Excluding indirectly paid expenses the ratio of expenses to average net assets would have been 0.95%, 0.95%, 0.96%, and 0.95%, for the years ended July 31, 2013, 2012, 2011, and 2010, respectively.
5 Based on average shares outstanding.
SEE NOTES TO FINANCIAL STATEMENTS
70
DOMINI SOCIAL BOND FUND — INSTITUTIONAL SHARES
FINANCIAL HIGHLIGHTS
| Year Ended July 31, | For the period November 30, 2011 (commencement of operations) through July 31, 2012 | |||||||||||
| 2014 | 2013 | |||||||||||
For a share outstanding for the period: | ||||||||||||
Net asset value, beginning of period | $11.15 | $11.64 | $11.74 | |||||||||
|
|
|
|
|
| |||||||
Income from investment operations: | ||||||||||||
Net investment income (loss) | 0.19 | 0.19 | 0.15 | |||||||||
Net realized and unrealized gain (loss) on investments | 0.12 | (0.38) | 0.21 | |||||||||
|
|
|
|
|
| |||||||
Total income from investment operations | 0.31 | (0.19) | 0.36 | |||||||||
|
|
|
|
|
| |||||||
Less dividends and distributions: | ||||||||||||
Dividends to shareholders from net investment income | (0.19) | (0.19) | (0.15) | |||||||||
Distributions to shareholders from net realized gain | (0.04) | (0.11) | (0.31) | |||||||||
|
|
|
|
|
| |||||||
Total dividends and distributions | (0.23) | (0.30) | (0.46) | |||||||||
|
|
|
|
|
| |||||||
Redemption fee proceeds 5 | - | - | - | |||||||||
|
|
|
|
|
| |||||||
Net asset value, end of period | $11.23 | $11.15 | $11.64 | |||||||||
|
|
|
|
|
| |||||||
Total return 2 | 2.80% | -1.72% | 3.17% | |||||||||
Portfolio turnover | 120% | 129% | 126% | |||||||||
Ratios/supplemental data (annualized): | ||||||||||||
Net assets, end of period (in millions) | $4 | $3 | $1 | |||||||||
Ratio of expenses to average net assets 3 | 0.65% | 0.65% | 4 | 0.65% | 4 | |||||||
Ratio of net investment income to average net assets | 1.73% | 1.54% | 1.88% | |||||||||
2 Not annualized for periods less than one year.
3 Reflects a waiver of fees by the Manager due to a contractual fee waiver. Had the Manager not waived its fee and reimbursed expenses, the ratio of expenses to average net assets would have been 1.02%, 0.97% and 3.99% for the years ended July 31, 2014, 2013 and 2012, respectively.
4 Ratio of expenses to average net assets includes indirectly paid expenses. Excluding indirectly paid expenses the ratio of expenses to average net assets would have been 0.65% and 0.65% for the years ended July 31, 2013 and 2012, respectively.
5 Based on average shares outstanding.
SEE NOTES TO FINANCIAL STATEMENTS
71
DOMINI SOCIAL BOND FUND
NOTES TO FINANCIAL STATEMENTS
July 31, 2014
1. ORGANIZATION AND SIGNIFICANT ACCOUNTING POLICIES
The Domini Social Bond Fund (the “Fund”) is a series of the Domini Social Investment Trust. The Trust is a Massachusetts business trust registered under the Investment Company Act of 1940 as an open-end management investment company. The Fund offers Investor Shares and Institutional Shares. Institutional shares were not offered prior to November 30, 2011. Each class of shares is sold at its offering price, which is net asset value. The Institutional shares may only be purchased by or for the benefit of investors that meet the minimum investment requirements, fall within the following categories: endowments, foundations, religious organizations and other nonprofit entities, individuals, retirement plan sponsors, family office clients, certain corporate or similar institutions, or omnibus accounts maintained by financial intermediaries and that are approved by the Fund’s Distributor. Both classes of shares have identical rights and voting privileges with respect to the Fund in general and exclusive voting rights on matters that affect that class alone. Earnings, net assets, and net asset value per share may differ due to each class having its own expenses, such as transfer and shareholder servicing agent fees and registration fees, directly attributable to that class. Institutional shares are not subject to distribution fees. The Fund seeks to provide its shareholders with a high level of current income and total return by investing in bonds and other debt instruments that are consistent with the Fund’s social and environmental standards and the submanager’s security selection approach.
The preparation of financial statements in conformity with U.S. generally accepted accounting principles requires management to make estimates and assumptions that affect the reported amounts of assets and liabilities and disclosure of contingent liabilities at the date of the financial statements and the reported amounts of revenues and expenses during the reporting period. Actual results could differ from those estimates. The following is a summary of the Fund’s significant accounting policies.
(A) Valuation of Investments. Bonds and other fixed-income securities (other than obligations with maturities of 60 days or less) are valued on the basis of valuations furnished by an independent pricing service, use of which has been approved by the Board of Trustees of the Fund. In making such valuations, the pricing service utilizes both dealer-supplied valuations and electronic data processing techniques that take into account appropriate factors such as institutional-size trading in similar groups of securities, yield, quality, coupon rate, maturity, type of issue, trading characteristics, and other market data, without exclusive reliance upon quoted prices or exchange or over-the-counter
72
DOMINI SOCIAL BOND FUND
NOTES TO FINANCIAL STATEMENTS (continued)
July 31, 2014
prices, since such valuations are believed to reflect more accurately the fair value of such securities. Short-term obligations of sufficient credit quality (maturing in 60 days or less) are valued at amortized cost, which constitutes fair value as determined by the Board of Trustees of the Fund. Securities (other than short-term obligations with remaining maturities of 60 days or less) for which there are no such quotations or valuations are valued at fair value as determined in good faith by or at the direction of the Fund’s Board of Trustees.
The Funds follow a fair value hierarchy that distinguishes between (a) market participant assumptions developed based on market data obtained from sources independent of the reporting entity (observable inputs) and (b) the Fund’s own assumptions about market participant assumptions developed based on the best information available in the circumstances (unobservable inputs). These inputs are used in determining the value of the Funds’ investments and are summarized in the following fair value hierarchy:
Level 1 — quoted prices in active markets for identical securities
Level 2 — other significant observable inputs (including quoted prices for similar securities, interest rates, and evaluated quotation obtained from pricing services)
Level 3 — significant unobservable inputs (including the Funds’ own assumptions in determining the fair value of investments)
The inputs or methodology used for valuing securities are not an indication of the risk associated with investing in those securities.
The following is a summary of the inputs used, as of July 31, 2014, in valuing the Fund’s assets carried at fair value:
| Level 1 - Quoted Prices | Level 2 - Other Significant Observable Inputs | Level 3 - Significant Unobservable Inputs | Total | |||||||||||||
U.S. Government Agency Obligations | $ | - | $ | 57,010,428 | $ | - | $ | 57,010,428 | ||||||||
U.S. Government Agency Mortgage Securities | - | 45,252,634 | - | 45,252,634 | ||||||||||||
Corporate Obligations | - | 19,250,206 | - | 19,250,206 | ||||||||||||
Corporate Mortgage Securities | - | 1,247,663 | - | 1,247,663 | ||||||||||||
Certificates of Deposit | - | 3,250,000 | - | 3,250,000 | ||||||||||||
Cash Equivalents | - | 958,332 | - | 958,332 | ||||||||||||
|
|
|
|
|
|
|
| |||||||||
Total | $ | - | $ | 126,969,263 | $ | - | $ | 126,969,263 | ||||||||
|
|
|
|
|
|
|
| |||||||||
73
DOMINI SOCIAL BOND FUND
NOTES TO FINANCIAL STATEMENTS (continued)
July 31, 2014
The following is a reconciliation of Level 3 assets for which significant unobservable inputs were used to determine fair value:
Investments in Securities | ||||
Balance as of July 31, 2013 | $ | 1,912,352 | ||
Realized Gain (loss) | - | |||
Change in unrealized appreciation (depreciation) | 35,326 | |||
Purchases | 2,708,727 | |||
Sales | (963,679) | |||
Transfers in and/or out of Level Three | (3,692,726) | |||
|
| |||
Balance as of July 31, 2014 | $ | - | ||
|
| |||
The change in unrealized appreciation (depreciation) included in earnings relating to securities still held at July 31, 2014 | $ | - | ||
|
|
Transfers from Level 2 to Level 3 included securities valued at $963,769 that were transferred as a result of quoted prices in active markets not being readily available. Transfers out of Level 3 into Level 2 included securities valued at $4,656,405 because market values were readily available from a pricing agent for which fair value factors were previously applied.
(B) Investment Transactions, Investment Income, and Dividends to Shareholders. The Fund earns income daily, net of Fund expenses. Dividends to shareholders are usually declared daily and paid monthly from net investment income. Distributions to shareholders of realized capital gains, if any, are made annually. Distributions are determined in conformity with income tax regulations, which may differ from generally accepted accounting principles. Reclassifications have been made to the Fund’s components of net assets to reflect income and gains available for distribution (or available capital loss carryovers, as applicable) under income tax regulations. Investment transactions are accounted for on trade date. Realized gains and losses from security transactions are determined on the basis of identified cost. Interest income is recorded on an accrual basis.
(C) Federal Taxes. The Fund’s policy is to comply with the provisions of the Internal Revenue Code applicable to regulated investment companies and to distribute substantially all of its taxable income, including net realized gains, if any, within the prescribed time periods. Accordingly, no provision for federal income or excise tax is deemed necessary. As of July 31, 2014, tax years 2011 through 2014 remain subject to examination by the Fund’s major tax jurisdictions, which include the United States of America, the Commonwealth of Massachusetts, and New York State.
74
DOMINI SOCIAL BOND FUND
NOTES TO FINANCIAL STATEMENTS (continued)
July 31, 2014
(D) Redemption Fees. Redemptions and exchanges of Fund shares held less than 30 days may be subject to the Fund’s redemption fee, which is 2% of the amount redeemed. Such fees are retained by the Fund and are recorded as an adjustment to paid-in capital.
(E) Other. Income, expenses (other than those attributable to a specific class), gains, and losses are allocated on a daily basis to each class of shares based upon the relative proportion of net assets represented by such class. Operating expenses directly attributable to a specific class are charged against the operations of that class.
(F) Indemnification. The Fund’s organizational documents provide current and former trustees and officers with a limited indemnification against liabilities arising in connection with the performance of their duties to the Fund. In the normal course of business, the Fund may also enter into contracts that provide general indemnifications. The Fund’s maximum exposure under these arrangements is unknown as this would be dependent on future claims that may be made against the Fund. The risk of material loss from such claims is considered remote.
2. TRANSACTIONS WITH AFFILIATES
(A) Manager/Administrator. The Fund has retained Domini Social Investments LLC (Domini) to serve as investment manager and administrator. The services provided by Domini consist of investment supervisory services, overall operational support, and administrative services, including the provision of general office facilities and supervising the overall administration of the Fund. For its services under the Management Agreement, Domini receives from the Fund a fee accrued daily and paid monthly at an annual rate equal to 0.40% of the first $500 million of the Fund’s net assets managed, 0.38% of the next $500 million of the Fund’s net assets managed, and 0.35% of net assets managed in excess of $1 billion. For its services under the Administration Agreement, Domini receives from the Fund a fee accrued daily and paid monthly at an annual rate equal to 0.25% of the Fund’s average daily net assets. For the period from November 30, 2013, until November 30, 2014, Domini is waiving its fee and reimbursing expenses to the extent necessary to keep the aggregate annual operating expenses of the Fund (excluding brokerage fees and commissions, interest, taxes, and other extraordinary expenses), net of waivers and reimbursements, at no greater than 0.95% and 0.65% of the average daily net assets representing Investor shares and Institutional shares, respectively. A similar fee waiver arrangement was in effect in prior periods. For the year ended July 31, 2014, Domini reimbursed expenses totaling $178,797.
75
DOMINI SOCIAL BOND FUND
NOTES TO FINANCIAL STATEMENTS (continued)
July 31, 2014
(B) Submanager. Seix Investment Advisors LLC (“Seix”), a wholly owned subsidiary of RidgeWorth LLC (“RidgeWorth”) (formerly known as RidgeWorth Capital Management, Inc.) provides investment submanagement services to the Fund on a day-to-day basis pursuant to a Submanagement Agreement with Domini. Prior to April 25, 2008, Seix Investment Advisors, Inc., a predecessor of the submanager provided investment submanagement services to the Fund. Effective May 30, 2014, RidgeWorth LLC is owned by its employees and Lightyear Capital, a private equity firm.
(C) Distributor. The Board of Trustees of the Fund has adopted a Distribution Plan in accordance with Rule 12b-1 under the Act. DSIL Investment Services LLC, a wholly owned subsidiary of Domini (DSILD), acts as agent of the Fund in connection with the offering of shares of the Fund pursuant to a Distribution Agreement. Under the Distribution Plan, the Fund pays expenses incurred in connection with the sale of Investor shares and pays DSILD a distribution fee at an aggregate annual rate not to exceed 0.25% of the average daily net assets representing the Investor shares. For the year ended July 31, 2014, fees waived by the Investor shares totaled $186,913.
(D) Shareholder Service Agent. The Trust has retained Domini to provide certain shareholder services to the Fund and its shareholders, which services were previously provided by BNY Asset Servicing (“BNY”) or another fulfillment and mail service provider and are supplemental to services currently provided by BNY, pursuant to a transfer agency agreement between each Fund and BNY. For these services, Domini receives a fee from the Fund paid monthly at an annual rate of $4.00 per active account. For the year ended July 31, 2014, Domini waived fees as follows:
| FEES WAIVED | ||||
Domini Social Bond Fund Investor shares | $ | - | ||
Domini Social Bond Fund Institutional shares | 42 | |||
3. INVESTMENT TRANSACTIONS
For the year ended July 31, 2014, cost of purchase and proceeds from sales of investments other than short-term obligations were as follows:
| PURCHASES | SALES | |||||||
Government Securities | $ | 135,119,969 | $ | 136,518,194 | ||||
Corporate Obligations | 12,887,640 | 17,634,216 | ||||||
76
DOMINI SOCIAL BOND FUND
NOTES TO FINANCIAL STATEMENTS (continued)
July 31, 2014
4. SUMMARY OF SHARE TRANSACTIONS
| Year Ended July 31, | ||||||||||||||||
| 2014 | 2013 | |||||||||||||||
| Shares | Amount | Shares | Amount | |||||||||||||
Investor Shares | ||||||||||||||||
Shares sold | 2,323,812 | $ | 25,988,133 | 2,156,020 | $ | 24,671,279 | ||||||||||
Shares issued in reinvestment of dividends and distributions | 179,352 | 2,006,229 | 252,364 | 2,893,839 | ||||||||||||
Shares redeemed | (2,987,328) | (33,341,287) | (2,605,244) | (29,803,241) | ||||||||||||
Redemption fees | - | 8,390 | - | 1,764 | ||||||||||||
|
|
|
|
|
|
|
| |||||||||
Net increase (decrease) | (484,164) | $ | (5,338,535) | (196,860) | $ | (2,236,359) | ||||||||||
|
|
|
|
|
|
|
| |||||||||
Institutional Shares | ||||||||||||||||
Shares sold | 130,643 | $ | 1,448,832 | 841,872 | $ | 9,633,861 | ||||||||||
Shares issued in reinvestment of dividends and distributions | 2 | 21 | 1,702 | 19,438 | ||||||||||||
Shares redeemed | (64,563) | (718,696) | (588,390) | (6,639,041) | ||||||||||||
Redemption fees | - | - | - | - | ||||||||||||
|
|
|
|
|
|
|
| |||||||||
Net increase (decrease) | 66,082 | $ | 730,157 | 255,184 | $ | 3,014,258 | ||||||||||
|
|
|
|
|
|
|
| |||||||||
Total | ||||||||||||||||
Shares sold | 2,454,455 | $ | 27,436,965 | 2,997,892 | $ | 34,305,140 | ||||||||||
Shares issued in reinvestment of dividends and distributions | 179,354 | 2,006,250 | 254,066 | 2,913,277 | ||||||||||||
Shares redeemed | (3,051,891) | (34,059,983) | (3,193,634) | (36,442,282) | ||||||||||||
Redemption fees | - | 8,390 | - | 1,764 | ||||||||||||
|
|
|
|
|
|
|
| |||||||||
Net increase (decrease) | (418,082) | $ | (4,608,378) | 58,324 | $ | 777,899 | ||||||||||
|
|
|
|
|
|
|
| |||||||||
5. FEDERAL TAX STATUS
The tax basis of the components of net assets at July 31, 2014 is as follows:
Undistributed long term gains | $ | 24,729 | ||
Capital losses, other losses and other temporary differences . . . | (56,960) | |||
Unrealized appreciation/(depreciation) . . . . . . . . . . . . . . . . . . . . | 1,177,733 | |||
|
| |||
Distributable net earnings/(deficit) . . . . . . . . . . . . . . . . . . . . . . . | $ | 1,145,502 | ||
|
|
The difference between components of Distributable Earnings on a tax basis and the amounts reflected in the statement of assets and liabilities are primarily due to wash sales.
For the year ended July 31, 2014, the Fund reclassified $1,980 from undistributed net investment income to accumulated net realized gains to align financial reporting and tax reporting.
Under recently enacted Regulated Investment Company Modernization Act of 2010, the Fund will be permitted to carry forward capital losses incurred in taxable years beginning after December 22, 2010, for an unlimited time period.
77
DOMINI SOCIAL BOND FUND
NOTES TO FINANCIAL STATEMENTS (continued)
July 31, 2014
However, any losses incurred during those future taxable years will be required to be utilized prior to the losses incurred in pre-enactment taxable years. As a result of this ordering rule, pre-enactment capital loss carryforwards may be more likely to expire unused. Additionally, post-enactment capital losses that are carried forward will retain their character as either short-term or long-term capital losses rather than being considered all short-term as under previous law.
For federal income tax purposes, dividends paid were characterized as follows:
| Year Ended July 31, | ||||||||
| 2014 | 2013 | |||||||
Ordinary income . . . . . . . . . . . . . | $ | 1,489,918 | $ | 1,506,732 | ||||
Long-term capital gain . . . . . . . . . | 732,323 | 1,646,900 | ||||||
|
|
|
| |||||
Total . . . . . . . . . . . . . . . . . . . . . . . | $ | 2,222,241 | $ | 3,153,632 | ||||
|
|
|
| |||||
The Fund is subject to the provisions of Accounting Standards Codification ASC 740 Income Taxes (ASC 740). ASC 740 sets forth a minimum threshold for financial statement recognition of the benefit of a tax position taken or expected to be taken in a tax return. The Fund did not have a liability to record for any unrecognized tax benefits in the accompanying financial statements. No provision has been made for taxes on income, capital gains or unrealized appreciation on securities held or for excise tax on income and capital gains.
78
Report of Independent Registered Public Accounting Firm
Board of Trustees and Shareholders of
Domini Social Investment Trust:
We have audited the accompanying statements of assets and liabilities, including the portfolio of investments, of the Domini Social Bond Fund (the “Fund”), a Fund in the series of the Domini Social Investment Trust, as of July 31, 2014, and the related statement of operations for the year then ended, the statements of changes in net assets for each of the years in the two-year period then ended, and the financial highlights for each of the years or periods in the five-year period then ended. These financial statements and financial highlights are the responsibility of the Fund’s management. Our responsibility is to express an opinion on these financial statements and financial highlights based on our audits.
We conducted our audits in accordance with the standards of the Public Company Accounting Oversight Board (United States). Those standards require that we plan and perform the audits to obtain reasonable assurance about whether the financial statements and financial highlights are free of material misstatement. An audit includes examining, on a test basis, evidence supporting the amounts and disclosures in the financial statements. Our procedures include confirmation of securities owned as of July 31, 2014, by correspondence with the custodian and brokers, or by other appropriate auditing procedures. An audit also includes assessing the accounting principles used and significant estimates made by management, as well as evaluating the overall financial statement presentation. We believe that our audits provide a reasonable basis for our opinion.
In our opinion, the financial statements and financial highlights referred to above present fairly, in all material respects, the financial position of the Domini Social Bond Fund as of July 31, 2014, the results of its operations for the year then ended, the changes in its net assets for each of the years in the two-year period then ended, and the financial highlights for each of the years or periods in the five-year period then ended, in conformity with U.S. generally accepted accounting principles.
Boston, Massachusetts
September 25, 2014
79
THE DOMINI FUNDS
TAX INFORMATION (UNAUDITED)
FOR THE YEAR ENDED JULY 31, 2014
The amount of long-term capital gains paid for the year ended July 31, 2014 was as follows:
Domini Social Equity Fund | $ | - | ||
Domini International Social Equity Fund | 4,008,279 | |||
Domini Social Bond Fund | 732,323 |
For dividends paid from net investment income during the year ended July 31, 2014, the Funds designated the following as Qualified Dividend Income:
Domini Social Equity Fund | $ | 15,330,142 | ||
Domini International Social Equity Fund | 7,255,899 |
Of the ordinary distributions made by the Domini Social Bond Fund during the fiscal year ended July 31, 2014, 51% has been derived from investments in US Government and Agency Obligations. All or a portion of the distributions from this income may be exempt from taxation at the state level. Consult your tax advisor for state specific information.
For corporate shareholders, 100% of dividends paid from net investment income for the Domini Social Equity Fund were eligible for the corporate dividends received deduction.
| Foreign Tax Paid | Foreign Source Income | |||||||||||||||
| TOTAL | PER SHARE | TOTAL | PER SHARE | |||||||||||||
Domini International Social Equity Fund | $ | 801,001 | $ | 0.02 | $ | 8,569,804 | $ | 0.24 | ||||||||
The foreign taxes paid or withheld per share represent taxes incurred by the Funds on interest and dividends received by the Fund from foreign sources. Foreign taxes paid or withheld should be included in taxable income with an offsetting deduction from gross income or as a credit for taxes paid to foreign governments. Consult your tax advisor regarding the appropriate treatment of foreign taxes paid.
80
APPROVAL OF MANAGEMENT AND SUBMANAGEMENT AGREEMENTS (UNAUDITED)
Section 15(c) of the Investment Company Act of 1940, as amended (the “1940 Act”) requires that each mutual fund’s board of trustees, including a majority of those trustees who are not “interested persons” of the mutual fund, as defined in the 1940 Act (the “Independent Trustees”), annually review and consider the continuation of the fund’s investment management and submanagement agreements. At its meeting held on April 25, 2014, the Board of Trustees (“Board”) of the Domini Social Equity Fund (the “Equity Fund”), Domini International Social Equity Fund (the “International Fund”), and the Domini Social Bond Fund (the “Bond Fund”) (each a “Fund,” and collectively the “Funds”), including a majority of the Independent Trustees, voted to approve the continuation of the management agreement for the Funds with Domini Social Investments LLC (“Domini”), the continuation and approval of the submanagement agreement between Domini and Wellington Management Company LLP (“Wellington Management”) for the Equity Fund and International Fund; the continuation of the current submanagement agreement (the “Current Seix Submanagement Agreement”) between Domini and Seix Investment Advisors, LLC (“Seix,” and together with Domini and Wellington Management, the “Advisers”) for the Bond Fund; and the approval of a new submanagement agreement (the “New Seix Submanagement Agreement”) between Domini and Seix which is substantially similar to the Current Seix Submanagement Agreement and would take effect upon the termination of such Agreement.
Prior to the April 25, 2014, meeting, the Board requested, received, and reviewed written responses from the Advisers to questions posed to them on behalf of the Independent Trustees and supporting materials relating to those questions and responses. The Board considered information furnished to the Board at its meetings throughout the year, as well as information specifically prepared in connection with the approval of the management and submanagement agreements at the Board’s meeting on April 25, 2014. Information provided to the Board at its meetings throughout the year included, among other things, reports on each Fund’s performance, legal and compliance matters, sales and marketing activity, shareholder services, and the other service provided to the Funds by the Advisers. Information specifically prepared in connection with the approval of the New Seix Submanagement Agreement included materials regarding a transaction between RidgeWorth Capital Management, Inc. (“RidgeWorth Inc.”), the parent company of Seix, and certain RidgeWorth Inc. employees, in partnership with affiliated investment funds of Lightyear Capital, a private equity firm (the “Transaction”).
In determining to continue the above-referenced management and submanagement agreements and approve a New Seix Submanagement Agreement, the Board reviewed and evaluated information and factors it believed to be relevant and appropriate in light of the information that the
81
Trustees deemed necessary and appropriate through the exercise of their reasonable business judgment. The Board noted that the pending Transaction would result in an “assignment” of the Current Seix Submanagement Agreement under the Investment Company Act of 1940, as amended (the “1940 Act”) and the termination of such Agreement in accordance with its terms and applicable law. The Board discussed the Transaction with representatives of Domini and considered the implications, if any, of the Transaction on the performance of Seix as submanager of the Fund. While individual Trustees may have weighed certain factors differently, the Board’s determination to continue the management and submanagement agreements and approve the New Seix Submanagement Agreement was based on a comprehensive consideration of all information provided to the Board throughout the year and specifically with respect to the continuation or approval of such agreements, as applicable. The Trustees did not identify any particular information or factor that was all-important or controlling.
Set forth below is a discussion of the factors that the Board considered with respect to its approval of the above-referenced management and submanagement agreements.
EQUITY FUND
Nature, Quality, and Extent of Services Provided. The Trustees noted that pursuant to the Equity Fund’s management agreement, Domini, subject to the direction of the Board, is responsible for providing advice and guidance with respect to the Equity Fund and for managing the investment of the assets of the Equity Fund, which it does by engaging and overseeing the activities of Wellington Management. They considered that under the management agreement, Domini is responsible for applying social and environmental standards to a universe of securities. In addition, they noted that Domini manages the Equity Fund’s business and affairs, including coordination of the activities of service providers, pursuant to a sponsorship agreement. The Trustees considered the scope and quality of the services provided by Wellington Management, such as the provision of the day-to-day portfolio management of the Equity Fund, including making purchases and sales of socially screened portfolio securities consistent with the Equity Fund’s investment objective and policies.
The Trustees considered the professional experience, tenure, and qualifications of the portfolio management team and the other senior personnel at Domini and Wellington Management. They also considered Domini’s capabilities and experience in the development and application of social and environmental standards and its reputation, leadership in the socially responsible investment community, and quality of management and administrative services provided to the Fund. In addition, they considered the compliance policies, procedures, and record of Domini and Wellington Management. The Trustees concluded that Domini and Wellington Management had the necessary capabilities, resources,
82
and personnel to continue providing services under the management and submanagement agreements.
Investment Results. The Trustees reviewed information provided to them by Domini regarding the net investment returns of the Equity Fund for the year to date, 6-month, and 1-, 3-, 5- and 10-year periods ended December 31, 2013 and February 28, 2014, as well as the Equity Fund’s performance for each full calendar year since inception (June 3, 1991) and cumulative performance from inception, through December 31, 2013 and February 28, 2014. They compared those returns to the returns of the applicable benchmark for the Equity Fund (S&P 500), for the same periods, the performance of the relevant peer group of funds as classified by Strategic Insight, as well as the applicable decile ranks, for the for the 1-, 3-, 5-, and 10-year periods ended February 28, 2014. The Trustees noted that the Equity Fund Investor shares had positive net investment returns as of December 31, 2013 and had outperformed relative to the S&P 500 for the latest year-to-date, 6-month, 1- and 5-year periods. The Trustees noted that the Equity Fund Investor shares had outperformed its SRI peer group, compared to the group’s median performance for each of the 1-, 3-, and 5-year periods ended February 28, 2014, and were in the 2nd decile for the 1-year period, 4th decile for the 3-year period, and 3rd decile for the 5-year period. The Trustees considered that Wellington Management commenced submanagement of the Fund late in 2006, the recent market conditions, and the information they received regarding the performance of the Wellington Management quantitative model. The Trustees concluded that they had continued confidence in the capability of Domini and Wellington Management to manage the Equity Fund but would continue to monitor the performance of the Fund.
Fees and Other Expenses. The Trustees considered the management and submanagement fees paid to Domini and Wellington Management with respect to the Equity Fund, the portion of the fees retained by Domini, Domini’s contractual fee waiver arrangements with respect to the Fund, and that no changes to the existing fee arrangements with Domini or the submanager were under consideration. The Trustees also considered the sponsorship fee rate paid by the Equity Fund to Domini under the sponsorship agreement. The Trustees considered the responses Domini and Wellington Management provided with respect to the fees that each of Domini and Wellington Management charges its other clients with similar investment objectives and strategies. The Trustees considered Wellington Management’s representation that the submanagement fee it receives with respect to the Fund is competitive with the general range of the fees Wellington Management receives with respect to other client funds of similar size. The Trustees considered that Domini (and not the Equity Fund) pays Wellington Management from its advisory fee and no changes had been made to that advisory fee. The Trustees considered the information provided to them by Strategic Insight regarding the level of the Equity Fund Investor shares aggregate management and sponsorship fees versus the median management
83
and administrative fees for a relevant peer group of socially responsible funds and compared the Fund’s total expense ratio with and without distribution/marketing to the median total expense ratios of those peers, taking into account the agreed upon waiver of fees. The Trustees noted that the Fund’s aggregate management and sponsorship fees were slightly higher relative to the median management and administrative fees of the peer group taking into account applicable contractual fee waivers. The Trustees noted that the Fund’s total expense ratio with and without marketing/distribution, after giving effect to the contractual fee waiver arrangements, was about the same or slightly higher relative to the median and average total expense ratios of the peer group. In light of the foregoing, and taking into account such other matters as the Trustees considered relevant in the exercise of their reasonable judgment, the Trustees concluded that the management and submanagement fees payable with respect to the Equity Fund were reasonable in relation to the nature and quality of the services to be provided and supported the approval of continuing of the existing management and submanagement agreements.
Costs of Services Provided and Profitability. The Trustees reviewed information provided to them by Domini concerning the costs borne by and profitability of Domini with respect to the advisory and sponsorship services provided, along with a description of the methodology used by Domini in preparing the profitability information. The Trustees also reviewed the financial results realized by Domini as of December 31, 2013. The Trustees concluded that they were satisfied that Domini’s level of profitability with respect to the Equity Fund was not excessive in view of the nature, quality, and extent of services provided.
The Trustees reviewed Wellington Management’s audited consolidated balance sheet as of December 31, 2013. The Trustees also considered Wellington Management’s representation that there have been no material changes in the firm since December 31, 2013 and that the pro-forma income statement for the year ended December 31, 2013, reflected partnership income as if the firm was in corporate form. The pro-forma statement provided supplementally identified the revenues generated by the Equity Fund as a separate item and reflected assumptions and estimates regarding operating expenses. Based on the information provided, the Trustees concluded that they were satisfied that Wellington Management’s level of profitability with respect to the Equity Fund was not excessive in view of the nature, quality, and extent of services provided to the Equity Fund.
Economies of Scale. The Trustees also considered whether economies of scale would be realized by Domini and Wellington Management as assets grew and the extent to which economies of scale were reflected in the fees charged under the management and submanagement agreements. The Trustees noted that there were breakpoints in the fees charged under the management and submanagement agreements, and no changes were made to those arrangements.
84
They concluded that breakpoints were an effective way to share economies of scale with shareholders and that this was a positive factor in support of approval of the continuance of the management and submanagement agreements.
Other Benefits. The Trustees considered the other benefits that Domini, Wellington Management, and their respective affiliates receive from their relationship with the Equity Fund. The Trustees reviewed the character and amount of payments received by Domini and its affiliates in connection with the Equity Fund, including sponsorship fees. The Trustees considered that Domini’s profitability would be lower if the benefits related to distribution fees and sales charges were not received. The Trustees considered the brokerage practices of Domini and Wellington Management, including their use of soft dollar arrangements. The Trustees also considered the intangible benefits that would continue to accrue to Domini, Wellington Management, and each of their respective affiliates by virtue of their relationship with Equity Fund and the other Domini funds. The Trustees concluded that the benefits received by Domini, Wellington Management, and their respective affiliates were reasonable and supported the approval of the continuance of the management and submanagement agreements.
DOMINI INTERNATIONAL SOCIAL EQUITY FUND
Nature, Quality, and Extent of Services Provided. The Trustees noted that pursuant to the Fund’s management agreement, Domini, subject to the direction of the Board, is responsible for providing advice and guidance with respect to the Fund and for managing the investment of the assets of the Fund, which it does by engaging and overseeing the activities of Wellington Management. They considered that under the management agreement, Domini is responsible for applying social and environmental standards to a universe of securities. The Trustees considered the scope and quality of the services provided by Wellington Management pursuant the submanagement agreement, such as the provision of the day-to-day portfolio management of the Fund, including making purchases and sales of socially screened portfolio securities consistent with the Fund’s investment objective and policies.
The Trustees considered the professional experience, tenure, and qualifications of the portfolio management teams and the other senior personnel at Domini and Wellington Management. They also considered Domini’s capabilities and experience in the development and application of social and environmental standards and its reputation and leadership in the socially responsible investment community, and quality of management and administrative services provided to the Fund. In addition, they considered the compliance policies, procedures, and record of Domini and Wellington Management. The Trustees concluded that Domini and Wellington Management had the necessary capabilities, resources, and personnel to continue providing services under the management and submanagement agreements.
85
Investment Results. The Trustees reviewed information provided to them by Domini regarding the net investment returns of the International Fund for the year to date, 6-month, and 1-, 3-, and 5-year periods ended December 31, 2013 and February 28, 2014, as well as the International Fund’s performance for each full calendar year since inception (December 27, 2006) and cumulative performance from inception, through December 31, 2013 and February 28, 2014. They compared those returns to the returns of the applicable benchmark for the International Fund (MSCI EAFE Index), for the same periods, the performance of the relevant peer group of funds as classified by Strategic Insight, as well as the applicable decile ranks, for the 1-, 3-, and 5-year periods ended February 28, 2014. The Trustees noted that the International Fund Investor shares net returns as of December 31, 2013 were positive and had outperformed relative to its benchmark for the latest year-to-date, 6-month, 1-, 3-, and 5-year periods. The Trustees noted that the International Fund Investor shares had outperformed relative to its SRI and non-SRI peer groups, compared to each group’s median performance, for the 1-, 3- and 5-year periods ended February 28, 2014. The Trustees also noted that the International Fund Investor shares were in the 4th decile for the 1- and 3-, year period, and the 3rd decile for the 5-year period. The Trustees considered the recent market conditions and the information they received regarding the performance of Wellington Management’s quantitative model. The Trustees concluded that they had continued confidence in the capability of Domini and Wellington Management to manage the International Fund.
Fees and Other Expenses. The Trustees considered the management and submanagement fees paid to Domini and Wellington Management with respect to the International Fund, the portion of the fees retained by Domini, and Domini’s contractual fee waiver arrangement. The Trustees considered the responses Domini and Wellington Management provided with respect to the fees that each of Domini and Wellington Management charges its other clients with similar investment objectives. The Trustees considered that Domini (and not the Fund) pays Wellington Management from its advisory fee and that no changes to the existing fee arrangements with Domini or the submanager were under consideration. The Trustees considered Wellington Management’s representation that the submanagement fee it receives is competitive with the general range of the fees Wellington Management receives with respect to its other client funds of similar size. The Trustees considered the information provided to them by Strategic Insight regarding the level of the International Fund Investor shares management and administrative fees versus the median management and administrative fees for relevant peer groups of socially responsible (SRI) and non-SRI funds and compared the Fund’s total expense ratio with and without distribution/marketing to the median total expense ratios of those peers, taking into account the agreed upon waiver of fees. The Trustees noted that the Fund’s management fees, were higher relative to the median management and administrative fees of the relevant non-SRI peer
86
groups taking into account the applicable contractual fee waiver arrangements but were about the same as the median management and administrative fees of the SRI peer group without agreed upon fee waivers. The Trustees noted that the Fund’s total expense ratio with marketing, after giving effect to contractual expense waivers, was higher relative to the median total expense ratio of the non-SRI peer group, but lower relative to the median total expense ratio of the SRI peer group. In light of the foregoing, and taking into account such other matters as the Trustees considered relevant in the exercise of their reasonable judgment, the Trustees concluded that the management and submanagement fees payable with respect to each Fund were reasonable in relation to the nature and quality of services to be provided and supported continuance of the management and submanagement agreements.
Costs of Services Provided and Profitability. The Trustees reviewed information provided to them by Domini concerning the costs borne by and profitability of Domini with respect to the advisory services provided, along with a description of the methodology used by Domini in preparing the profitability information. The Trustees also reviewed the financial results realized by Domini as of December 31, 2013. The Trustees concluded that they were satisfied that Domini’s level of profitability with respect to the Fund was not excessive in view of the nature, quality, and extent of services provided.
The Trustees reviewed Wellington Management’s audited consolidated balance sheet as of December 31, 2013. The Trustees also considered Wellington Management’s representation that there have been no material changes in the firm since December 31, 2013 and that its unaudited pro-forma income statement for the year ended December 31, 2013 reflected partnership income as if the firm was in corporate form. The pro-forma income statement provided supplementally identified the revenues generated by each Fund as a separate item and reflected assumptions and estimates regarding operating expenses. Based on the information provided, the Trustees concluded that they were satisfied that Wellington Management’s level of profitability with respect to the Funds was not excessive in view of the nature, quality, and extent of services provided to each Fund.
Economies of Scale. The Trustees also considered whether economies of scale would be realized by Domini and Wellington Management as assets grew and the extent to which economies of scale were reflected in the fees charged under the management and submanagement agreements. The Trustees noted that there were breakpoints in the fees charged under the management and submanagement agreements and no changes were made to such arrangements. They concluded that breakpoints were an effective way to share economies of scale with shareholders and that this was a positive factor in support of approval of the continuance of the management and submanagement agreements.
87
Other Benefits. The Trustees considered the other benefits that Domini, Wellington Management, and their respective affiliates receive from their relationship with the International Fund. The Trustees reviewed the character and amount of payments received by Domini and its affiliates in connection with the Fund. The Trustees considered that Domini’s profitability would be lower if the benefits related to distribution fees and sales charges were not received. The Trustees considered the brokerage practices of Domini and Wellington Management, including their use of soft dollar arrangements. The Trustees also considered the intangible benefits that would continue to accrue to Domini, Wellington Management, and each of their respective affiliates by virtue of their relationship with each Fund and the other Domini funds. The Trustees concluded that the benefits received by Domini, Wellington Management, and their respective affiliates were reasonable and supported the approval of the continuance of the management and submanagement agreements.
BOND FUND
Nature, Quality, and Extent of Services Provided. The Trustees noted that pursuant to the management agreement for the Bond Fund, Domini, subject to the direction of the Board, is responsible for providing advice and guidance with respect to the Bond Fund and for managing the investment of the assets of the Bond Fund, which it does by engaging and overseeing the activities of Seix. They considered that under the management agreement, Domini is responsible for applying social and environmental standards to a universe of securities. They also noted that Domini is responsible for administrative services to the Fund pursuant to an administration agreement. The Trustees considered the scope and quality of the services provided by Seix pursuant to the current submanagement agreement such as the provision of the day-to-day portfolio management of the Bond Fund, including making purchases and sales of socially screened portfolio securities consistent with the Bond Fund’s investment objective and policies. The Trustees noted that the Transaction was not expected to have a material effect on the nature, quality, and extent of services that will be provided by Seix to the Bond Fund and that the terms of the New Submanagement Agreement are substantially the same as the terms of the Current Submanagement Agreement. The Trustees considered the professional experience, tenure, and qualifications of the portfolio management team and the other senior personnel at Domini and Seix and that there had been no material changes to the team providing services to the Bond Fund. The Trustees also considered the information provided by Seix representing that the same Seix personnel would continue to provide services to the Bond Fund under the New Submanagement Agreement. They also considered Domini’s capabilities and experience in the development and application of social and environmental standards and its reputation and leadership in the socially responsible investment community. The Trustees considered the information they had received from Domini concerning Domini’s social research team and the fact
88
that Domini was responsible for the Bond Fund’s community development investments. They considered the quality of the management and administrative services Domini provided to the Bond Fund. In addition, they considered the compliance policies, procedures, and record of Domini and Seix. The Trustees concluded that they were satisfied with the nature, quality, and extent of services provided by Domini and Seix to the Bond Fund under the management and Current Seix Submanagement agreements and to be provided under the New Seix Submanagement Agreement.
Investment Results. The Trustees reviewed the net investment performance of the Bond Fund provided to them by Domini for the year to date, 6-month, and 1-, 3-, 5- and 10-year periods ended December 31, 2013 and February 28, 2014, as well as the Bond Fund’s performance for each full calendar year since inception (June 1, 2000) and cumulative performance from inception, through December 31, 2013 and February 28, 2014. They compared those returns to the returns of the applicable benchmark, the Barclays Capital Intermediate Aggregate Index, for the same periods, the performance of relevant peer group of funds as classified by Strategic Insight, as well as the applicable decile ranks for the 1-, 3-, 5-, and 10-year periods ended February 28, 2014. The Trustees noted that the Bond Fund Investor shares had positive net investment returns for all periods except the 1-year period ended February 28, 2014 but had underperformed relative to its benchmark for each period except the 2008 calendar year. The Trustees noted that the Bond Fund Investor shares had underperformed relative to its peer group compared to the group’s median performance for the 1-, 3-, 5-, and 10-year periods. The Trustees noted that the Bond Fund was in the 8th decile for the 1-year period, 9th decile for the 3- and 5-year periods, and 7th decile for the 10-year period. The Trustees considered the recent market conditions, the portfolio’s high portfolio quality, diversification, the low volatility of the Fund’s performance, and the submanager’s focus on income rather than risk to drive returns. In light of the foregoing, the Trustees concluded that they had continued confidence in the capability of Domini and Seix to manage the Bond Fund but would continue to monitor the performance of the Fund.
Fees and Other Expenses. The Trustees considered the management and submanagement fees paid to Domini and Seix with respect to the Bond Fund, and the submanagement fee to be paid to Seix under the New Seix Submanagement Agreement, and the portion of the fees retained by Domini. The Trustees also considered the administrative fees paid by the Bond Fund to Domini. The Trustees considered that Domini (and not the Bond Fund) pays Seix from its advisory fee and that no changes to the fee arrangements with Domini or the submanager were under consideration. The Trustees considered the information provided to them by Strategic Insight regarding the level of the Bond Fund Investor shares management and administrative fees versus the median management and administrative fees for a relevant peer group of socially responsible (SRI) and non-SRI funds and compared the Bond Fund’s
89
total expense ratio with and without distribution/marketing to the median total expense ratios of those peers, taking into account the agreed-upon waiver of fees. The Trustees considered that the submanagement fees Seix receives with respect to the Bond Fund and the identical fee arrangement proposed to be paid under the New Seix Submanagement Agreement are consistent with the fees Seix charges with respect to other accounts with similar investment objectives and strategies. The Trustees noted that the management and administrative fee for the Bond Fund, after giving effect to contractual expense waivers, was higher than the median management and administrative fees of the relevant peer groups. The Trustees also noted that the total expense ratio of the Bond Fund, after giving effect to contractual expense waivers, was slightly lower than the median total expense ratio of the SRI peer groups with and without distribution/marketing and slightly higher than the median total expense ratio of only the non-SRI peers with and without distribution/marketing. In light of the foregoing, and taking into account the size of the Bond Fund and such other matters as the Trustees considered relevant in the exercise of their reasonable judgment, the Trustees concluded that the management and submanagement fees payable with respect to the Bond Fund under each agreement are reasonable in relation to the nature and quality of the services to be provided and supported continuance of the management and Current Seix submanagement agreements and approval of the New Seix Submanagement Agreement.
Costs of Services Provided and Profitability. The Trustees reviewed information provided to them by Domini concerning the costs borne by and profitability of Domini with respect to the advisory and administrative services provided to the Bond Fund in 2013 along with a description of the methodology used by Domini in preparing the profitability information. The Trustees also reviewed the financial results realized by Domini as of December 31, 2013. The Trustees concluded that they were satisfied that Domini’s level of profitability with respect to the Bond Fund was not excessive in view of the nature, quality, and extent of services provided.
The Trustees considered the information provided by Seix regarding its estimated range of profitability with respect to the Bond Fund in comparison to industry data provided by Domini. The Trustees also reviewed the most recent annual report for SunTrust Banks, Inc. (the parent company of Seix) and considered information regarding the finances and corporate structure of Seix’s parent after the Transaction. Based on the information provided, the Trustees concluded that they were satisfied that Seix’s level of profitability with respect to the Bond Fund was not excessive in view of the nature, quality, and extent of services provided to the Fund.
Economies of Scale. The Trustees also considered whether economies of scale would be realized by Domini and Seix as assets grew and the extent to which economies of scale were reflected in the fees charged under the management and
90
submanagement agreements. The Trustees noted that there were breakpoints in the fees charged under each agreement and no changes were made to such arrangements. They concluded that breakpoints were an effective way to share economies of scale with shareholders and that this was a positive factor in support of approval of the continuance of the management and Current Seix Submanagement agreements and approval of the New Seix Submanagement Agreement.
Other Benefits. The Trustees considered the other benefits that Domini, Seix, and their respective affiliates receive from their relationship with the Bond Fund, noting that Seix and its affiliates provide no other services to the Domini funds. The Trustees reviewed the character and amount of payments received by Domini and its affiliates in connection with the Bond Fund and the other Domini funds. The Trustees considered that Domini’s profitability would be lower if the benefits related to distribution fees and administrative services were not received. The Trustees considered the brokerage practices of Domini and Seix, and noted that neither Domini nor Seix received the benefit of “soft dollar” commissions in connection with the Bond Fund. The Trustees also considered the intangible benefits that would continue to accrue to Domini, Seix, and each of their respective affiliates by virtue of their relationship with the Bond Fund and the other Domini funds. The Trustees concluded that the benefits received by Domini, Seix, and their respective affiliates were reasonable and supported the continuance of the management and Current Seix Submanagement agreements and approval of the New Seix Submanagement Agreement.
91
The following table presents information about each Trustee and each Officer of the Domini Social Investment Trust (the “Trust”) as of July 31, 2014. Asterisks indicate that those Trustees and Officers are “interested persons” (as defined in the Investment Company Act of 1940) of the Trust. Each Trustee and each Officer of the Trust noted as an interested person is interested by virtue of his or her position with Domini Social Investments LLC as described below. Unless otherwise indicated below, the address of each Trustee and each Officer is 532 Broadway, 9th Floor, New York, NY 10012. Neither the Funds nor the Trust holds annual shareholder meetings for the purpose of electing Trustees, and Trustees are not elected for fixed terms. This means that each Trustee will be elected to hold office until his or her successor is elected or until he or she retires, resigns, dies, or is removed from office. No Trustee or Officer is a director of a public company or a registered investment company other than, with respect to the Trustees, the Domini Funds.
INTERESTED TRUSTEE AND OFFICER | ||||
| Name, Age, Position(s) Held, and Length of Time Served | Principal Occupation(s) During Past 5 Years and Other Directorships Held | Number of Funds in the Domini Family of Funds Overseen by Trustee | ||
Amy Domini Thornton* (64) Chair, Trustee, and President of the Trust since 1990 | CIO (since 2010), CEO (since 2002), Member (since 1997), and Manager (since 1997), Domini Social Investments LLC; Manager, DSIL Investment Services LLC (since 1998); Manager, Domini Holdings LLC (holding company) (since 2002); CEO (since 2013), NIA Global Solutions (a division of Domini Social Investments); Trustee, New England Quarterly (periodical) (since 1998); Private Trustee, Loring, Wolcott & Coolidge Office (fiduciary) (since 1987); Partner (since 1994), Member (since 2010), Loring Wolcott & Coolidge Fiduciary Advisers, LLP (investment advisor); Member, Loring, Wolcott & Coolidge Trust, LLC (trust company), (2010-present); Chair, Director, and President, Domini Foundation (nonprofit humanitarian organization) (2004-2009); Trustee, Church Investment Group (2010-July 2014). | 3 | ||
DISINTERESTED TRUSTEES | ||||
| Name, Age, Position(s) Held, and Length of Time Served | Principal Occupation(s) During Past 5 Years and Other Directorships Held | Number of Funds in the Domini Family of Funds Overseen by Trustee | ||
Kirsten S. Moy (67) Trustee of the Trust since 1999 | Board Member, Community Reinvestment Fund (non-profit investment fund) (2003-2011); Senior Fellow with the Economic Opportunities Program, The Aspen Institute (research and education) (since July 2014); Director, Scale Initiatives, The Economic Opportunities Program, The Aspen Institute (research and education) (2010 to 2014), Director, Economic Opportunities Program, The Aspen Institute (research and education) (2001-2010); Board Member, Low Income Investment Fund (housing and community revitalization nonprofit) (since 2009); Board Member, Community Development Finance (asset building non-profit) (since 2006). | 3 | ||
92
DISINTERESTED TRUSTEES (continued) | ||||
| Name, Age, Position(s) Held, and Length of Time Served | Principal Occupation(s) During Past 5 Years and Other Directorships Held | Number of Funds in the Domini Family of Funds Overseen by Trustee | ||
Gregory A. Ratliff (54) Trustee of the Trust since 1999 | Senior Program Officer, Bill & Melinda Gates Foundation (philanthropy) (since 2007). | 3 | ||
John L. Shields (61) Trustee of the Trust since 2004 | Director, Navigant Consulting, Inc. (management consulting firm) (since 2014); President, Advisor Guidance, Inc. (management consulting firm) (2010-2014); Managing Principal, MainStay Consulting Group, LLC (management consulting firm) (2006-2014); Director, Cogo Labs, Inc. (technology company) (since 2008); Advisory Board Member, Vestmark, Inc. (software company) (since 2003). | 3 | ||
OFFICERS | ||||
| Name, Age, Position(s) Held, and Length of Time Served | Principal Occupation(s) During Past 5 Years and Other Directorships Held | Number of Funds in the Domini Family of Funds Overseen by Trustee | ||
Megan L. Dunphy* (44) Secretary of the Trust since 2005 | Deputy General Counsel (since 2009), Mutual Fund Counsel (2005-2009), Domini Social Investments LLC; Secretary, Domini Funds (since 2005). | N/A | ||
Adam M. Kanzer* (48) Chief Legal Officer of the Trust since 2003 Vice President of the Trust since 2007 | Managing Director (since 2007), General Counsel and Director of Shareholder Advocacy (since 1998), Domini Social Investments LLC; Chief Legal Officer (since 2003), Vice President (since 2007), Domini Funds; Member, Securities and Exchange Commission Investor Advisory Committee (2009-2010; since 2012), Member, Advisory Council, Sustainability Accounting Standards Board (since 2012); Director, Global Network Initiative (nonprofit human rights organization) (2010-2014; alternate Director since 2014); Director, Tax Justice Network-USA (non-profit organization) (since 2013). | N/A | ||
Carole M. Laible* (50) Treasurer of the Trust since 1997 Vice President of the Trust since 2007 | President (since 2005), Member (since 2006), Chief Operating Officer (2002-2011), Domini Social Investments LLC; President and CEO (since 2002), Chief Compliance Officer (since 2001), Chief Financial Officer, Secretary, and Treasurer (since 1998), DSIL Investment Services LLC; Treasurer (since 1997), Vice President (since 2007), Domini Funds. | N/A | ||
Douglas Lowe* (58) Assistant Secretary of the Trust since 2007 | Senior Compliance Manager and Counsel, Domini Social Investments LLC (since 2006); Assistant Secretary, Domini Funds (since 2007); Registered Operations Professional, DSIL Investment Services LLC (since 2012). | N/A | ||
Meaghan O’Rourke-Alexander* (34) Assistant Secretary of the Trust since 2007 | Compliance Officer (since 2012), Senior Compliance Analyst (2009-2012), Compliance Associate (2005 to 2009), Domini Social Investments LLC; Assistant Secretary, Domini Funds (since 2007). | N/A | ||
93
OFFICERS (continued) | ||||
| Name, Age, Position(s) Held, and Length of Time Served | Principal Occupation(s) During Past 5 Years and Other Directorships Held | Number of Funds in the Domini Family of Funds Overseen by Trustee | ||
Christina Povall* (44) Assistant Treasurer of the Trust since 2007 | Director of Finance, Domini Social Investments LLC (since 2004); Assistant Treasurer, Domini Funds (since 2007); Registered Operations Professional, DSIL Investment Services LLC (since 2012). | N/A | ||
Maurizio Tallini* (40) Chief Compliance Officer of the Trust since 2005 Vice President of the Trust since 2007 | Chief Operating Officer (since 2011), Member (since 2007), Managing Director (2007-2011), Chief Compliance Officer (since 2005), Domini Social Investments LLC; Vice President (since 2007), Chief Compliance Officer (since 2005), Domini Funds; Registered Representative, (since 2012), DSIL Investments Services, LLC. | N/A | ||
The Funds’ Statement of Additional Information includes additional information about the Trustees and is available without charge, upon request, by calling the following toll-free number: 1-800-582-6757.
94
The Domini Funds have established Proxy Voting Policies and Procedures that the Funds use to determine how to vote proxies relating to portfolio securities. The Domini Funds’ Proxy Voting Policies and Procedures are available, free of charge, by calling 1-800-762-6814, by visiting www.domini.com/domini-funds/proxy-voting, or by visiting the EDGAR database on the Securities and Exchange Commission’s (SEC) website at http://www.sec.gov. All proxy votes cast for the Domini Funds are posted to Domini’s website on an ongoing basis over the course of the year. An annual record of all proxy votes cast for the Funds during the most recent 12-month period ended June 30 can be obtained, free of charge, at www.domini.com, and on the EDGAR database on the SEC’s website at http://www.sec.gov.
QUARTERLY PORTFOLIO SCHEDULE INFORMATION
The Domini Funds file their complete schedule of portfolio holdings with the SEC for the first and third quarters of each fiscal year on Form N-Q. The Domini Funds’ Forms N-Q are available on the EDGAR database on the SEC’s website at http://www.sec.gov. These Forms may also be reviewed and copied at the SEC’s Public Reference Room in Washington, D.C. Information about the operation of the Public Reference Room may be obtained by calling 1-800-SEC-0330. The information on Form N-Q is also available to be viewed at www.domini.com.
95
DOMINI FUNDS
P.O. Box 9785
Providence, RI 02940-9785
1-800-582-6757
www.domini.com
Investment Manager, Sponsor, and Distributor:
Domini Social Investments LLC (Investment Manager and Sponsor)
DSIL Investment Services LLC (Distributor)
532 Broadway, 9th Floor
New York, NY 10012
Investment Submanagers:
Domini Social Equity Fund
Domini International Social Equity Fund
Wellington Management Company, LLP
280 Congress Street
Boston, MA 02210
Domini Social Bond Fund
Seix Investment Advisors LLC
10 Mountain View Road, Suite C-200
Upper Saddle River, NJ 07458
Transfer Agent:
BNY Mellon Asset Servicing
760 Moore Road
King of Prussia, PA 19406
Custodian:
State Street Bank and Trust Company
Channel Center
One Iron Street
Boston, MA 02210
Independent Registered Public Accounting Firm:
KPMG LLP
Two Financial Center
60 South Street
Boston, MA 02111
Legal Counsel:
Bingham McCutchen LLP
One Federal Street
Boston, MA 02110

 facebook.com/dominifunds
 twitter.com/dominifunds
Domini Social Equity Fund Investor Shares: CUSIP 257132100 | DSEFX Class A Shares: CUSIP 257132860 | DSEPX Institutional Shares: CUSIP 257132852 | DIEQX Class R Shares: CUSIP 257132308 | DSFRX
| Domini International Social Equity Fund Investor Shares: CUSIP 257132704 | DOMIX Class A Shares: CUSIP 257132886 | DOMAX Institutional Shares: CUSIP 257132811 | DOMOX
Domini Social Bond Fund Investor Shares: CUSIP 257132209 | DSBFX Institutional Shares: CUSIP 257132829 | DSBIX |
Printed on elemental chlorine free paper from well-managed forests, containing 10% post consumer waste.

| Item 2. | Code of Ethics. |
(a) As of the end of the period covered by this report on Form N-CSR, the registrant has adopted a code of ethics that applies to the registrant’s principal executive officer, principal financial officer, and principal accounting officer.
(c) Not applicable.
(d) Not applicable.
(e) Not applicable.
(f) Registrant is filing its code of ethics with this report.
| Item 3. | Audit Committee Financial Expert. |
John L. Shields, a member of the Audit Committee, has been determined by the Board of Trustees of the registrant in its reasonable business judgment to meet the definition of “audit committee financial expert” as such term is defined in the instructions to Form N-CSR. In addition, Mr. Shields is an “independent” member of the Audit Committee as defined in the instructions to Form N-CSR.
| Item 4. | Principal Accountant Fees and Services. |
(a) Audit Fees
For the fiscal years ended July 31, 2014, and July 31, 2013, the aggregate audit fees billed to the registrant by KPMG LLP (“KPMG”) for professional services rendered for the audits of the financial statements, or services that are normally provided in connection with statutory and regulatory filings or engagements for those fiscal years, are shown in the table below:
Fund | 2014 | 2013 | ||
Domini Social Equity Fund | $36,600 | $35,500 | ||
Domini Social Bond Fund | $30,400 | $29,500 | ||
Domini International Social Equity Fund | $30,400 | $29,500 | ||
(b) Audit-Related Fees
There were no audit-related fees billed by KPMG for services rendered for assurance and related services to the registrant that were reasonably related to the performance of the audit or review of the registrant’s financial statements, but not reported as audit fees, for the fiscal years ended July 31, 2014, and July 31, 2013.
There were no audit-related fees billed by KPMG for the fiscal years ended July 31, 2014, and July 31, 2013 that were required to be approved by the registrant’s Audit Committee for
services rendered on behalf of Domini Social Investments LLC and entities controlling, controlled by, or under common control with Domini Social Investments LLC (not including any subadviser whose role is primarily portfolio management and is subcontracted with or overseen by another investment adviser) that provide ongoing services to the registrant (“Service Providers”).
(c) Tax Fees
In each of the fiscal years ended July 31, 2014, and July 31, 2013, the aggregate tax fees billed by KPMG for professional services rendered for tax compliance, tax advice, and tax planning for the registrant are shown in the table below:
Fund | 2014 | 2013 | ||
Domini Social Equity Fund | $6,400 | $6,200 | ||
Domini Social Bond Fund | $6,400 | $6,200 | ||
Domini International Social Equity Fund | $6,400 | $6,200 | ||
There were no tax fees billed by KPMG for the fiscal years ended July 31, 2014, and July 31, 2013 that were required to be approved by the registrant’s Audit Committee for services rendered on behalf of the registrant’s Service Providers.
(d) All Other Fees
There were no other fees billed by KPMG for the fiscal years ended July 31, 2014 and July 31, 2013 for other non-audit services rendered to the registrant.
There were no other fees billed by KPMG for the fiscal years ended July 31, 2014, and July 31, 2013 that were required to be approved by the registrant’s Audit Committee for other non-audit services rendered on behalf of the registrant’s Service Providers.
(e)(1) Audit Committee Preapproval Policy: The Registrant’s Audit Committee Preapproval Policy is set forth below:
| 1. | Statement of Principles |
The Audit Committee is required to preapprove audit and non-audit services performed for each series of the Domini Social Investment Trust, (each such series a “Fund” and collectively, the “Funds”) by the independent registered public accountant in order to assure that the provision of such services does not impair the accountant’s independence. The Audit Committee also is required to preapprove non-audit services performed by the Funds’ independent registered public accountant for the Funds’ investment adviser, and certain of the adviser’s affiliates that provide ongoing services to the Funds, if the services to be provided by the accountant relate directly to the operations and financial reporting of the Funds. The preapproval of these services also is intended to assure that the provision of the services does not impair the accountant’s independence.
Unless a type of service to be provided by the independent registered public accountant has received preapproval, it will require separate preapproval by the Audit Committee. Also, any proposed services exceeding preapproved cost levels will require separate preapproval by the Audit Committee. When considering services for preapproval the Audit Committee will take into account such matters as it deems appropriate or advisable, including applicable rules regarding auditor independence.
The appendices to this Policy describe the Audit, Audit-related, Tax and All Other services for the Funds, that have the preapproval of the Audit Committee. The term of any preapproval is 12 months from the date of preapproval, unless the Audit Committee specifically provides for a different period. The Audit Committee will periodically revise the list of preapproved services based on subsequent determinations.
Notwithstanding any provision of this Policy, the Audit Committee is not required to preapprove services for which preapproval is not required by applicable law, including de minimis and grandfathered services.
| 2. | Delegation |
The Audit Committee may delegate preapproval authority to one or more of its members. The member or members to whom such authority is delegated shall report any preapproval decisions to the Audit Committee at its next scheduled meeting. By adopting this Policy the Audit Committee does not delegate to management the Audit Committee’s responsibilities to preapprove services performed by the independent auditor.
| 3. | Audit Services |
The annual Audit services engagement terms and fees for the Funds will be subject to the preapproval of the Audit Committee. The Audit Committee will approve, if necessary, any changes in terms, conditions and fees resulting from changes in audit scope or other matters.
In addition to the annual Audit services engagement approved by the Audit Committee, the Audit Committee may grant preapproval for other Audit services, which are those services that only the independent registered public accountant reasonably can provide. The Audit Committee has preapproved the Audit services listed in Appendix A. All Audit services not listed in Appendix A must be separately preapproved by the Audit Committee.
| 4. | Audit-Related Services |
Audit-related services are assurance and related services for the Funds that are reasonably related to the performance of the audit or review of the Funds’ financial statements or that are traditionally performed by the independent registered public accountant. The Audit Committee believes that the provision of Audit-related services does not impair the independence of the accountant, and has preapproved the Audit-related services listed in Appendix B. All Audit-related services not listed in Appendix B must be separately preapproved by the Audit Committee.
| 5. | Tax Services |
The Audit Committee believes that the independent registered public accountant can provide Tax services to the Funds such as tax compliance, tax planning and tax advice without impairing the accountant’s independence. However, the Audit Committee will not permit the retention of the independent registered public accountant in connection with a transaction initially recommended by the independent registered public accountant, the purpose of which may be tax avoidance and the tax treatment of which may not be supported in the Internal Revenue Code and related regulations. The Audit Committee has preapproved the Tax services listed in Appendix C. All Tax services not listed in Appendix C must be separately preapproved by the Audit Committee.
| 6. | All Other Services |
The Audit Committee may grant preapproval to those permissible non-audit services for the Funds classified as All Other services that it believes are routine and recurring services, and would not impair the independence of the accountant. The Audit Committee has preapproved the All Other services listed in Appendix D. Permissible All Other services not listed in Appendix D must be separately preapproved by the Audit Committee.
A list of the SEC’s prohibited non-audit services is attached to this policy as Exhibit 1. The SEC’s rules and relevant guidance should be consulted to determine the precise definitions of these services and the applicability of exceptions to certain of the prohibitions.
| 7. | Preapproval Fee Levels |
Preapproval fee levels for all services to be provided by the independent registered public accountant to the Funds, and applicable non-audit services to be provided by the accountant to the Funds’ investment adviser and its affiliates, will be established periodically by the Audit Committee. Any proposed services exceeding these levels will require specific preapproval by the Audit Committee.
| 8. | Supporting Documentation |
With respect to each service that is separately preapproved, the independent auditor will provide detailed back-up documentation, which will be provided to the Audit Committee, regarding the specific services to be provided.
| 9. | Procedures |
Requests or applications to provide services that require separate approval by the Audit Committee will be submitted to the Audit Committee by both the independent registered public accountant and the Funds’ treasurer, and must include a joint statement as to whether, in their view, the request or application is consistent with the SEC’s rules on auditor independence.
Management will promptly report to the Chair of the Audit Committee any violation of this Policy of which it becomes aware.
Appendix A – Audit Committee Preapproval Policy
Preapproved Audit Services
for
October 24, 2014 through October 31, 2015
| Service | Fee Range | |
| Statutory audits or financial audits (including tax services associated with non-audit services) | As presented to Audit Committee in a separate engagement letter1 | |
| Services associated with SEC registration statements, periodic reports and other documents filed with the SEC or other documents issued in connection with securities offerings (e.g., consents), and assistance in responding to SEC comment letters | Not to exceed $9,000 per filing |
Appendix B - Audit Committee Preapproval Policy
Preapproved Audit-Related Services
for
October 24, 2014 through October 31, 2015
| Service | Fee Range | |
| Consultations by Fund management with respect to the accounting or disclosure treatment of securities, transactions or events and/or the actual or potential impact of final or proposed rules, standards or interpretations by the SEC, FASB, or other regulatory or standard-setting bodies | Not to exceed $5,000 per occurrence during the Pre-Approval Period | |
| Review of Funds’ semi-annual financial statements | Not to exceed $2,000 per set of financial statements per fund | |
| Regulatory compliance assistance | Not to exceed $5,000 per quarter | |
| Training Courses | Not to exceed $5,000 per course |
Appendix C – Audit Committee Preapproval Policy
Preapproved Tax Services
for
October 24, 2014 through October 31, 2015
| Service | Fee Range | |
| Review of federal and state income tax returns and federal excise tax returns for the Funds including assistance and review with excise tax distributions. | As presented to Audit Committee in a separate engagement letter1 | |
| Tax assistance and advice regarding statutory, regulatory or administrative developments | Not to exceed $5,000 for the Funds’ or for the Funds’ investment adviser during the Pre-Approval period | |
| Assistance with custom tax audits and related matters | Not to exceed $15,000 per Fund during the Pre-Approval Period | |
| Tax Training Courses | Not to exceed $5,000 per course during the Pre-Approval Period | |
| M & A tax due diligence services associated with Fund mergers including: review of the target fund’s historical tax filings, review of the target fund’s tax audit examination history, and hold discussions with target management and external tax advisors. Advice regarding the target fund’s overall tax posture and historical and future tax exposures. | Not to exceed $8,000 per merger during the Pre-Approval Period | |
| Tax services related to the preparation of annual PFIC statements and annual Form 5471 (Controlled Foreign Corporation for structured finance vehicles) | Not to exceed $20,000 during the Pre-Approval Period |
Appendix D – Audit Committee Preapproval Policy
Preapproved All Other Services
for
October 24, 2014 through October 31, 2015
| Service | Fee Range | |
| No other services for the Pre-Approval Period have been specifically preapproved by the Audit Committee. | N/A |
Exhibit 1 – Audit Committee Preapproval Policy
Prohibited Non-Audit Services
| ¡ | Bookkeeping or other services related to the accounting records or financial statements of the audit client |
| ¡ | Financial information systems design and implementation |
| ¡ | Appraisal or valuation services, fairness opinions or contribution-in-kind reports |
| ¡ | Actuarial services |
| ¡ | Internal audit outsourcing services |
| ¡ | Management functions |
| ¡ | Human resources |
| ¡ | Broker-dealer, investment adviser or investment banking services |
| ¡ | Legal services |
| ¡ | Expert services unrelated to the audit |
1 For new funds launched during the Pre-Approval Period, the fee ranges pre-approved will be the same as those for existing funds, pro-rated in accordance with inception dates as provided in the auditors’ proposal or any engagement letter covering the period at issue. Fees in the engagement letter will be controlling.
(e)(2) None, or 0%, of the services relating to the audit-related fees, tax fees, and all other fees paid by the registrant disclosed above were approved by the Audit Committee pursuant to paragraph (c)(7)(i)(C) of Rule 2-01 of Regulation S-X (which permits audit committee approval after the start of the engagement with respect to services other than audit review or attest services, if certain conditions are satisfied).
(f) According to KPMG for the fiscal year ended July 31, 2013, the percentage of hours spent on the audit of the registrant’s financial statements for the most recent fiscal year that were attributed to work performed by persons other than KPMG’s full-time, permanent employees is as follows:
Fund | 2014 | |||
Domini Social Equity Fund | 0% | |||
Domini Social Bond Fund | 0% | |||
Domini International Social Equity Fund | 0% | |||
(g) There were no non-audit services rendered to the registrant’s Service Providers for the fiscal years ended July 31, 2014 and July 31, 2013.
The aggregate non-audit fees billed by KPMG for services rendered to the registrant for the fiscal year ended July 31, 2014 was $ 19,200. These fees related to the 2013 Tax Fees described in Item 4 (c). The aggregate non-audit fees billed by KPMG for services rendered to the registrant for the fiscal year ended July 31, 2013, were $18,600. These fees related to the 2013 Tax Fees described in Item 4 (c).
(h) Not applicable.
| Item 5. | Audit Committee of Listed Registrants. |
Not applicable to the registrant.
| Item 6. | Schedule of Investments. |
(a) The Schedule of Investments is included as part of the report to stockholders filed under Item 1.
(b) Not applicable
| Item 7. | Disclosure of Proxy Voting Policies and Procedures for Closed-End Management Investment Companies. |
Not applicable to the registrant.
| Item 8. | Portfolio Managers of Closed-End Management Investment Companies. |
Not applicable to the registrant.
| Item 9. | Purchases of Equity Securities by Closed-End Management Investment Company and Affiliated Purchasers. |
Not applicable to the registrant.
| Item 10. | Submission of Matters to a Vote of Security Holders. |
There were no material changes to the procedures by which shareholders may submit recommendations for nominees to the registrant’s Board of Trustees.
| Item 11. | Controls and Procedures. |
(a) Within 90 days prior to the filing of this report on Form N-CSR, Amy Domini Thornton, the registrant’s President and Principal Executive Officer, and Carole M. Laible, the registrant’s Treasurer and Principal Financial Officer, reviewed the registrant’s disclosure controls and procedures (as defined in Rule 30a-3(c) of the Investment Company Act of 1940) and evaluated their effectiveness. Based on their evaluation, Ms. Thornton and Ms. Laible determined that the disclosure controls and procedures adequately ensure that information required to be disclosed by the registrant in this report on Form N-CSR is recorded, processed, summarized, and reported within the time periods required by the Securities and Exchange Commission’s rules and forms, including ensuring that information required to be disclosed in this report on Form N-CSR is accumulated and communicated to the registrant’s management, including the Ms. Thornton and Ms. Laible, as appropriate to allow timely decisions regarding required disclosures.
(b) There were no changes in the registrant’s internal control over financial reporting (as defined in Rule 30a-3(d) under the Investment Company Act of 1940) that occurred during the second fiscal quarter of the period covered by this report that have materially affected, or are reasonably likely to materially affect, the registrant’s internal control over financial reporting.
| Item 12. | Exhibits. |
(a)(1) The Code of Ethics referred to in Item 2 is filed herewith.
(a)(2) Separate certifications required by Rule 30a-2(a) under the Investment Company Act of 1940 for each principal executive officer and principal financial officer of the registrant are filed herewith.
(a)(3) Not applicable to the registrant.
(b) A single certification required by Rule 30a-2(b) under the Investment Company Act of 1940, Rule 13a-14b or Rule 15d-14(b) under the Securities Exchange Act of 1934, and Section 1350 of Chapter 63 of Title 18 of the United States Code for the chief executive officer and the chief financial officer of the registrant is filed herewith.
SIGNATURES
Pursuant to the requirements of the Securities Exchange Act of 1934 and the Investment Company Act of 1940, the registrant has duly caused this report to be signed on its behalf by the undersigned, thereunto duly authorized.
DOMINI SOCIAL INVESTMENT TRUST
| By: | /s/ Amy Domini Thornton | |
Amy Domini Thornton President |
Date: October 8, 2014
Pursuant to the requirements of the Securities Exchange Act of 1934 and the Investment Company Act of 1940, this report has been signed below by the following persons on behalf of the registrant and in the capacities and on the dates indicated.
| By: | /s/ Amy Domini Thornton | |
Amy Domini Thornton President (Principal Executive Officer) |
Date: October 8, 2014
| By: | /s/ Carole M. Laible | |
Carole M. Laible Treasurer (Principal Financial Officer) |
Date: October 8, 2014