UNITED STATES
SECURITIES AND EXCHANGE COMMISSION
Washington, D.C. 20549
FORM N-CSR
CERTIFIED SHAREHOLDER REPORT OF REGISTERED
MANAGEMENT INVESTMENT COMPANIES
Investment Company Act File Number 811-05823
DOMINI INVESTMENT TRUST
(Exact Name of Registrant as Specified in Charter)
532 Broadway, 9th Floor, New York, New York 10012
(Address of Principal Executive Offices)
Carole M. Laible
Domini Impact Investments LLC
532 Broadway, 9th Floor
New York, New York 10012
(Name and Address of Agent for Service)
Registrant’s Telephone Number, including Area Code: 212-217-1100
Date of Fiscal Year End: July 31
Date of Reporting Period: July 31, 2017
| Item 1. | Reports to Stockholders. |
A copy of the report transmitted to stockholders pursuant to Rule 30e-1 under the Investment Company Act of 1940 follows.
| KEEP IN TOUCH WITH DOMINI |
A report like this comes twice a year, but your dollars work for change all year long. Stay connected with us on Facebook and Twitter:
|
 facebook.com/dominifunds
 twitter.com/dominifunds
| SIGN UP FOR E-DELIVERY |
If you invest directly with Domini, you can avoid an annual fee of $15 by signing up for paperless E-Delivery of your statements, reports and tax forms — just log into your account, go to “Account Options,” and select “E-Delivery Option.”
If you invest through a financial advisor, brokerage firm, or employer-sponsored retirement plan, why not ask your advisor or plan sponsor how to receive your documents electronically? It can reduce your carbon footprint, save trees, and unclutter your life, all with just a few strokes of your keyboard! |
THE WAY YOU INVEST MATTERS®
Dear Fellow Shareholders:
The past few years have been extraordinary. Reviewing the headlines, one sees a broad range of issues that continue to develop: The Syrian refugee crisis, the scandalous revelation of sham accounts at one of our nation’s leading banks — along with the resignation of the CEO, the Panama Papers and the zika virus. The Department of Labor withdrew two legal bulletins that discouraged fiduciaries from considering the social and environmental impacts of their investments, and there were concerted efforts to avoid a point of no return on climate change. Meanwhile, the globe’s population continued to grow. Then came November, and the Presidential election, the sweep of the Senate, and a whole new approach to stewardship of this great American experiment.
For those of us interested in tracking social and environmental progress, the news has not been encouraging. We have had further affirmation that climate change is real and is manmade. We have had continuing acts of terror. Meanwhile, corporations have taken increasingly open positions that seem to refute the Administration’s stated policies, whether relating to immigration, gender-identity, climate, or race relations.
To say that global markets have shrugged off the tumult would be an understatement. Markets have been rising with extremely low volatility, in an almost eerily calm fashion. While on the one hand it makes sense — corporate earnings continue to rise and that is good for stocks — on the other hand one is left wondering how we can possibly see companies growing their earnings amidst all the uncertainty in the world.
There are some reasons for the market’s continued rise. Going forward, investors anticipate a potentially lower corporate tax rate in the U.S., making their ownership more valuable still. Interest rates, while rising, are nowhere near high enough to offer competition to stocks for investable dollars. The financial case still exists for equities. Higher earnings, less pesky government interest in how the profits are made, little competition from other potential investments, and that potential ability to keep more of the profits, by paying lower taxes, provide a formidable backdrop. This has all been good for stocks in the short term. However, as investors for the long haul, and as citizens of this planet, we have many concerns.
2
THE WAY YOU INVEST MATTERS®
One of the most exciting developments of the past year has been the rapid acceptance of the United Nations Sustainable Development Goals (SDGs). This 17-point program was adopted in 2015 and lays out the issues, from Zero Hunger to Decent Work and Economic Growth, to Life Below Water, that the world’s nations have committed to address, in partnership with the private sector. Strongly supportive of Peace, Justice and Strong Institutions, the goals focus on cross-cutting issues such as gender equality and North-South economic cooperation. They even include a nod to corporate sustainability reporting, a provision Domini Impact Investments urged UN delegates and ambassadors to include, in meetings we attended back in 2012 and 2013.
The SDGs present an ambitious vision for the future, recognizing that societal and environmental challenges are intertwined. According to the UN Development Programme Administrator, Helen Clark, “We are advocating for countries to have access to the funding they need to improve the lives of all their peoples and to be able to do that in ways which safeguard the integrity of vital ecosystems.” At Domini Impact Investments, “universal human dignity and ecological sustainability” have long been our guiding principles. We were delighted to see the close alignment between our approach and the SDGs, as a more holistic vision for the future has taken hold globally.
As your mutual fund manager, we have undertaken an initiative to more deliberately track our efforts on your behalf and to consider how they support the SDGs. The essay in this annual report is a part of that initiative. In it we study one aspect of Life Below Water, sustainable seafood. As with all the goals, the hurdles are enormous and progress slow. Nonetheless, noteworthy actions have been taken. We hope you enjoy reading about these efforts.
On social and ecological levels, the past twelve months have documented for us the continuing need to have the voice of investors at the table as citizens of the planet. Investors stand at the junction between one of the strongest, most organized and universal forces on the planet — finance — and the very real impact that finance has, for good or bad. The role of the socially responsible investor has never been more important.
Thank you for your investment and for your continuing support of responsible investing.
Sincerely,
Amy Domini Chair
|
Carole Laible President |


3
THE WAY YOU INVEST MATTERS®
Michael Kors Adopts Protections for Migrant Workers
No worker should ever have to pay for their job. Once they are employed, they must be able to understand the terms of their employment and be free to leave at any time. These are basic principles that most of us take for granted, but for millions of migrant workers around the world, they are very far from the norm. Many workers are placed in conditions of bonded labor, indebted to unscrupulous recruitment agencies, sometimes without access to their passports. We have been working with other investors and companies in our portfolios to change that.
We reached agreement to withdraw our shareholder proposal with Michael Kors, after constructive conversations with the company’s General Counsel. Michael Kors improved its labor requirements for its suppliers, and updated its public reporting describing the actions it is taking to address modern slavery. Among the company’s new commitments, the company will ensure that no worker in its global supply chain pays for employment, and that any recruitment fees found will be “promptly” reimbursed. Michael Kors will also require all new suppliers to disclose information about the recruitment agencies they use, prior to onboarding these suppliers into its supply chain. In addition, the company strengthened its non-discrimination policies and its protections for younger workers. We look forward to continuing our conversation with the company about implementation of these strong commitments.
Visit domini.com to read our paper, Protecting Migrant Workers.
Defending our Right to Submit Shareholder Proposals
Domini has submitted more than 280 shareholder proposals to more than 100 companies since 1994, because the shareholder proposal has proven to be a highly effective corporate accountability tool. The Financial CHOICE Act, pending before the U.S. Senate, includes a provision that would effectively eliminate our ability to submit shareholder proposals by raising the bar so high to submit a proposal that only a handful of the largest institutional investors in the world could do so. We are actively coordinating with other investors to defeat this legislation.
We published two articles on the topic, in Responsible Investor and on the Harvard Law School Forum on Corporate Governance and Financial Regulation (available at domini.com). In mid-July, we joined other investors in meetings with Senate Banking Committee staff. Our articles were used by the investor coalition to help educate Senate staff about the importance of the shareholder proposal rule.
Visit domini.com to learn more about our work on your behalf to engage corporations and policy makers on social and environmental issues, and read our quarterly Social Impact Updates.
4
THE WAY YOU INVEST MATTERS®
The Impact of How We Eat
The oceans cover more than 70% of the Earth’s surface, representing 99% of the living space on our planet, by volume. More than three billion people depend on marine and coastal biodiversity for their livelihoods, and their primary source of protein.
Today, however, the oceans are under severe threat from climate change, toxic pollution and unsustainable fishing practices. These factors threaten both the continued availability of fish for consumption as well as the healthiness of the fish we consume.
The idea that the supply of fish in the ocean is limitless has contributed to all of us taking it for granted. It is estimated that two-thirds of the world’s fish stocks are either fished at their limit or overfished, and Greenpeace reports that fish at the top of the food chain, such as tuna, are disappearing quickly. Additionally, the World Bank estimates that the economic losses due to overfishing are approximately $50 billion per year.
Seafood differs substantially from other animal-based industrial agriculture. While it is easy to track and manage livestock, there isn’t a single scientific authority that can conclusively answer the question of how many fish are in the sea, or even how many species of life the oceans support. According to the United Nations, our oceans contain nearly 200,000 species, but actual numbers may lie in the millions.
Companies that depend on the seafood supply chain have a host of issues to manage, including overfishing, destructive fishing practices, and labor rights abuses. The field of sustainable seafood is complex, with a bewildering array of acronyms, certification systems and open questions to consider. We hope that this essay will help to clear up some of that confusion and give you a good sense of what some companies in our portfolios are doing to address these key challenges. We also provide some resources that you, as a consumer, can use to make smarter seafood choices.
The Cost of Modern Fishing
Seafood is the last major food source that is still caught in the wild, but the oceans cannot replenish fish at the rate we are pulling them out. Currently, about half of the world’s seafood is wild-caught and, as discussed below, farmed fish depend heavily on wild-caught feed. Modern fishing fleets are capable of catching larger quantities of fish at a time, but do not always efficiently target their nets to ensure they avoid accidentally catching other species (these non-target species are known as “bycatch”). According to Greenpeace, 100 million sharks, 300,000 whales and dolphins and 100,000 albatrosses are inadvertently caught and killed
5
THE WAY YOU INVEST MATTERS®
every year in nets or on fishing lines. In addition, some fishing practices — like bottom trawling — destroy habitats, including coral formations.
Illegal, unreported and unregulated fishing is also a substantial problem, accounting for an estimated 19% of the global catch. One-third of all fish sold in the United States is believed to be caught illegally. Not only do poachers ignore catch quotas established by governments, they also use outlawed equipment, including nets stretching 15 miles or more that scoop up everything in their path. The Wall Street Journal reports that “the most critical area for poaching is off the coast of West Africa, where illegal, unauthorized and unregulated fishing accounts for an estimated 40% of fish caught.” Illegal fishing threatens marine ecosystems and food security in some of the world’s poorest countries.
The Hope for Sustainable Aquaculture
The other half of the world’s seafood is produced via aquaculture, or fish farming, a practice that dates back thousands of years. Today, the vast majority of aquaculture production comes from Asia, with China alone accounting for 60% of the global aquaculture output. Aquaculture has grown in response to rising consumer demand and declining stocks of wild fish. According to experts, farmed fish production may surpass wild catches by 2019.
As the production of farmed fish increases, so do its side effects. The most common type of aquaculture consists of farming in net pens or cages anchored to the sea floor in the ocean or near the coast. As with many other types of farming practices, aquaculture presents challenges. In some fish farms, densely packed pens can lead to high disease rates, which producers try to avoid with the liberal use of antibiotics. Infectious diseases among farmed fish can also spread to native populations, introducing non-native diseases into the environment or facilitating disease through unsanitary conditions. When farmed fish escape their pens, they pose a threat to wild fish populations.
Another issue with farmed fish is their feed. Fish species like salmon and tuna are carnivorous and require a diet high in fat. To feed and sustain these kinds of farmed fish, other fish species, such as sardines or mackerel, must be harvested from the ocean. Producers use fish meal, which combines fish oil, wheat products, and chemicals into pellets which are then fed to cultivated fish. The National Oceanic and Atmospheric Administration (NOAA), a U.S. government agency, reports that one pound of farmed salmon uses the fish oil from about five pounds of wild fish and fish meal from 1.3 pounds of fish. If we accept that large scale aquaculture is here to stay, we must ensure that it is done sustainably.
Open ocean aquaculture can be part of the solution, but it should only be used to cultivate species that are native in open water systems. Open
6
THE WAY YOU INVEST MATTERS®
ocean aquaculture entails moving pens into the open ocean where the water is pristine and currents are strong enough to continually flush the farms of fish waste and pests. The open ocean also provides fish with more consistent salinity and temperature. That means the fish are less stressed and vulnerable to disease, which promotes better growth and minimizes the need for antibiotics or vaccines.
For the cultivation of non-native species, land-based tank systems can be used. Due to the high costs of operation, however, tank-based systems currently represent just half a percent of total industry production. The best land-based closed systems are capable of recycling 99% of their water. In addition, the water can be monitored continuously, which lessens the risk of disease and the need for antibiotics.
Plant-based feeds may also be a sustainable option for fish farms. Efforts to replace proteins from fish meal with grains and oilseeds started many years ago. Today, entrepreneurs are working on alternative feeds like algae and large corporations like Cargill (not currently approved for the Domini Funds) are investing in genetically modified oilseeds. In addition, researchers are trying to determine whether popular carnivorous fish like trout, yellowtail, walleye, and Atlantic salmon can survive on vegetarian and fish-free diets. If so, fish farmers would be able to drastically reduce their use of fish meal.
Currently, there are no publicly traded aquaculture companies that meet Domini’s standards for investment. Farmed fish, however, is part of the supply chain of many companies in the food industry, including food manufacturers, distributors, and retailers that meet Domini’s standards for investment.
Labor Rights in The Seafood Supply Chain
Labor rights are a major concern throughout the seafood supply chain, whether it’s wild-caught or farmed. In “Protecting Migrant Workers,” an essay in the Domini Funds’ most recent Semi-Annual Report, we described how our research department identified the enslavement of migrant workers as a high risk in the seafood supply chain. Costco, Sysco, William Morrisons and other major companies have joined the Seafood Task Force (www.seafoodtaskforce.global), a multi-stakeholder alliance that aims to tackle forced labor and human trafficking in seafood production. Domini continues to work with other investors and companies on these and other challenges facing migrant workers.
Certifications and Traceability
Companies depend upon global supply chains that can be complex, multi-tiered and opaque. However, we cannot hope to ensure that our seafood is truly sustainably sourced without end-to-end traceability, meaning that each unit of seafood sold to a consumer can be traced all the way back to
7
THE WAY YOU INVEST MATTERS®
its point of harvest at sea or on a farm. Traceability of supply chains also supports compliance with restrictions on illegal, unreported and unregulated fishing. Traceability is a daunting logistical task, but rapid advances are being made in the development of affordable tracking systems. Companies are increasingly using a variety of certifications, as well as joining multi-stakeholder task forces and industry associations, to advance the dialogue on sustainable seafood sourcing practices.
The Marine Stewardship Council (MSC), originally formed out of a collaboration between the World Wildlife Fund (WWF) and Unilever (at the time, one of the world’s largest producers of frozen seafood), offers one of the most widely used sustainable seafood certification systems for wild-catch fisheries. The MSC Fisheries Standard is based on three pillars: sustainable fish stocks, minimizing environmental impact, and effective management. It is important to view MSC as a process, rather than a “seal of approval.” Many MSC-certified fisheries have significant room to improve. If a fishery meets the standard for certification, the fishery then must submit an action plan on how it will improve its performance and must undergo surveillance audits on an annual basis. The certification must be renewed every five years. MSC also offers a Chain of Custody standard, which ensures that seafood is traceable to an MSC-certified fishery.
The Aquaculture Stewardship Council (ASC) standards were developed by NGOs, marine scientists and the salmon industry. ASC certifies twelve species of farm-raised seafood against standards that focus on both the environmental and social impacts of farming.
Two other initiatives we are watching closely include the Ocean Disclosure Project and Fish Tracker. The Ocean Disclosure Project, launched by the Sustainable Fisheries Partnership (SFP), prompts companies to publicly disclose extensive information about the wild-caught seafood they buy. William Morrison Supermarket (UK) was one of the five initial signatories when it launched in 2015 and remains the project’s only publicly traded participant. We are also optimistic about the launch of Fish Tracker, an initiative by Investor Watch, to align capital markets with sustainable fisheries management. Though these initiatives are in their early stages, Domini values these resources to further our research and engagement activities.
Finally, the Monterey Bay Aquarium’s Seafood Watch program has developed science-based standards for fisheries and aquaculture to help distinguish between which species are sustainable options and which seafood would be best to avoid (“red-rated”) due to concerns with overfishing or destructive fishing or farming practices. Similarly, Greenpeace maintains its own “Red List” which highlights species of
8
THE WAY YOU INVEST MATTERS®
seafood the organization believes should not be made commercially available due to various risks such as overfishing or illegal fishing practices.
The Corporate Response
Corporate sustainable seafood policies generally rely upon a mix of certification standards, including MSC, ASC and others, as well as, species-specific policies. As you will see from the brief profiles below, among our Funds’ current holdings with exposure to seafood, there are a range of policies and approaches to the difficult issues companies face.
In the United States, Whole Foods was the first retailer to sell MSC-certified products back in 2000. For three consecutive years, Whole Foods has received the top ranking in Greenpeace’s “Carting Away the Oceans” report, which annually ranks supermarket chains on their approach to seafood sourcing. Whole Foods prohibits the sale of red-rated seafood, and states that it will not sell seafood that is overfished, poorly managed, or caught in ways that cause harm to habitats or other wildlife. In March 2017, the company announced that it was establishing sustainability and traceability requirements for canned tuna. Whole Foods also requires suppliers to track each lot of tuna from the boat to the cannery. In addition, the company requires that farm-raised seafood be third-party verified to meet its Responsibly Farmed Standards, which prohibits the use of antibiotics. In August, Amazon.com acquired Whole Foods. We will be watching closely to see whether Amazon maintains Whole Foods’ long-term commitment to sustainable seafood.
Sainsbury’s, the second largest British supermarket chain, has also been sourcing MSC-certified fish since 2000 and, according to MSC, is considered a global leader in sustainable seafood. In 2016, 76% of its wild-caught seafood was MSC-certified and the company is working towards having all fish it sells certified sustainable by 2020.
Unlike Whole Foods, which will not carry “red-rated” species under any circumstances, Costco’s seafood sourcing policy states that it will not sell certain wild species that have been identified as at great risk, unless sources are certified by the MSC. Rather than simply avoid fish from fisheries that fail to meet MSC standards, the company is working with a group of WWF sponsored Fishery Improvement Projects (FIP) designed to bring fisheries up to MSC standards. Costco’s major canned tuna suppliers are participants in the International Seafood Sustainability Foundation, which is undertaking “science-based initiatives for the long-term conservation and sustainable use of tuna stocks, reducing bycatch and promoting ecosystem health.” The company works to source farmed fish from suppliers that are ASC-certified and has participated in the implementation of ASC dialogues that include salmon, shrimp, tilapia,
9
THE WAY YOU INVEST MATTERS®
and pangasius. Domini has been in dialogue with Costco on seafood issues since 2010, most recently around its involvement in addressing human rights issues in the supply of shrimp from Thailand.
U.S. supermarket chain Kroger reports that 69% of its total seafood volume came from MSC-certified fisheries. The company states that traceability and the removal of illegally sourced seafood is a critical component of a comprehensive sustainable seafood policy and commitment. Since 2009, Kroger has reportedly supported 23 FIPs through sourcing, letters to stakeholders, and/or direct funding.
Metro AG is the third-largest retailer in Germany and one of Europe’s leading fish wholesalers. Metro has a sustainable fish selection that includes a wide range of MSC and ASC-certified products. By 2020, Metro is seeking to offer 80% of its twelve best-selling types of fish and seafood from sustainably certified sources. Currently, Metro reports that 90% of its aquaculture seafood is certified. The company also works with small-scale fishermen in support of more sustainable practices. To address the substantial pressure on fish stocks in Japan, Metro’s subsidiary Metro Cash & Carry Japan is working with a local university to raise fish from fertilized fish eggs to ensure a fully traceable and sustainable aquaculture process.
Sysco, a food distribution company that supplies restaurants, hotels, hospitals and schools, reports that as of 2015, 9 of its top 10 Sysco Brand seafood products came from certified fisheries or fisheries engaged in a comprehensive FIP. Sysco is also collaborating with WWF to improve its seafood procurement practices.
The seafood supply chain does not only affect food for human consumption. The Canadian retailer, Loblaw, for example, offers MSC-certified dog and cat food products across over 1,000 supermarkets.
Tiger Brands, South Africa’s largest food and consumer healthcare company, has a 42% ownership in Oceana Group Ltd, which is the only direct exposure to a fishery in the Domini Funds’ portfolios. Oceana, a black-owned company, publishes reports on its environmental and social impact and has partnered with WWF to advance ecosystem-focused fisheries management practices.
10
THE WAY YOU INVEST MATTERS®
Looking Ahead
On September 25, 2015, the United Nations announced its new global sustainability agenda, in the form of seventeen Sustainable Development Goals (SDGs). SDG 14 is to “Conserve and sustainably use the oceans, seas and marine resources.” Each goal is accompanied by a set of targets.
We believe that it is critical for the private sector, including corporations, investors and consumers, to play an active role in promoting the SDGs and delivering on their ambitious targets. This is an imperative if we are to serve the needs of a rapidly growing human population while respecting planetary limits.
Human civilization cannot survive without healthy ecosystems. Financial returns, of course, are also at stake, as corporations depend upon dwindling natural resources to deliver value to shareholders. You’ll be hearing more from Domini on how our work aligns with the SDGs and how we intend to strengthen those efforts, including efforts to improve the sustainability of seafood.
With the exception of Cargill, which is not currently approved for investment, the holdings discussed above can be found in the portfolios of the Domini Funds, included herein. The composition of the Funds’ portfolios is subject to change.
The Domini Funds are not insured and are subject to market risks. Investment return, principal value, and yield may fluctuate. An investor’s shares when redeemed may be worth more or less than their original cost. You may lose money.
This report is not authorized for distribution to prospective investors of the Domini Funds referenced herein unless preceded or accompanied by a current prospectus for the relevant Fund. Nothing herein contained is to be considered a recommendation concerning the merits of any noted company, or an offer of sale or a solicitation of an offer to buy shares of any Fund or company referenced in this report. Such offering is only made by prospectus, which includes details as to the offering price and other material information. Please read the prospectus carefully before investing. The Domini Funds are distributed by DSIL Investment Services LLC (DSILD), Member FINRA. Domini Impact Investments LLC (Domini) is the Funds’ investment manager. The Funds are subadvised by Wellington Management Company LLP. DSILD and Domini are not affiliated with Wellington Management Company LLP 9/17
11
Don’t underestimate your effectiveness as a consumer — you have the power to change entire industries with your choices and collective voice. Here are some fish-buying tips and resources:
| • | Diversify the species of seafood you consume. Shrimp, salmon, tuna, tilapia, and pollock are among the most widely consumed seafood in the United States. Environmental organizations warn that the overconsumption of certain species can lead to various risks for consumers and the environment. |
NRDC: The Smart Seafood Buying Guide (www.nrdc.org/stories/smart-seafood-buying-guide) helps consumers diversify the types of seafood they eat, avoid species high in mercury, buy seafood sourced from countries with strong regulations and support local community fisheries.
| • | Be picky about where you shop. You can choose to shop at retailers that have made a concerted effort to offer more certified and sustainable seafood. You can request to talk to the manager of the seafood department or reach out to the corporate office to inquire about what it would take for the store to support more sustainable seafood options. If you notice that your local grocery store is doing a poor job communicating their policies or consistently performing low in reports such as Greenpeace’s annual Carting Away the Oceans, don’t be afraid to speak up. |
Greenpeace: Carting Away the Oceans (cato.greenpeaceusa.org) provides annual rankings of food retailers that can help consumers make educated decisions on where to shop for seafood. See also Greenpeace’s Sustainable Seafood Consumer Hub at http://seafood.greenpeaceusa.org/
| • | Choose your fish wisely. Take advantage of available consumer resources and guides — they exist to help empower consumers to make sustainable seafood choices, whether you are shopping at your local grocery store or if you are out to dinner. |
Monterey Bay Aquarium: Seafood Watch (www.seafoodwatch.org) highlights which species of fish are “Best Choices” (green), “Good Alternatives” (yellow), or ones to “Avoid” (red). The aquarium also offers national, regional and state guides on their website and as a smartphone app.
NOAA: FishWatch: (www.fishwatch.gov) The National Oceanic and Atmospheric Administration publishes FishWatch U.S. Seafood Facts, a comprehensive online resource where you can view profiles of over 100 species of U.S. farmed or U.S. wild-caught species of seafood that include information on population, fishing rates, habitat impacts, as well as health and nutrition facts.
12
Performance Commentary (Unaudited)
For the year ended July 31, 2017, the Domini Impact Equity Fund Investor shares returned 14.07%, lagging the S&P 500 Index, which returned 16.04%.
The Fund is managed through a two-step process designed to capitalize on the strengths of Domini Impact Investments LLC (“Domini”) and Wellington Management Company LLP (“Wellington Management”). Domini creates an approved list of companies based on its social, environmental and governance analysis, and Wellington then utilizes a disciplined and systematic process to manage the portfolio. Wellington Management’s philosophy relies on systematically exploiting sources of excess returns, stemming from both common behavioral, market structure, and risk premia inefficiencies in the market and the belief that certain factors are strongly associated with stock outperformance.
Security selection was the primary detractor from the Fund’s performance relative to the S&P 500 Index, driven by weak selection in the consumer discretionary, information technology, and health care sectors. Within consumer discretionary, underperformance was driven primarily by positions in retailers, particularly Foot Locker and Ross Stores. Relative underperformance in information technology was driven by our overweight position in IBM, and our underweight positions of strong-performing Apple and Facebook during the period. In health care, our overweight position in Edwards Lifesciences detracted most during the period. Both the Foot Locker and Edwards Lifesciences positions were eliminated by the end of the period.
The Fund’s sector allocations partially offset the negative results from security selection, primarily driven by an underweight allocation to the poor performing energy sector and an overweight allocation to the strong performing information technology sector. Additionally, security selection in the industrials, financials, and energy sectors aided relative performance.
From a market capitalization standpoint, the portfolio’s strong security selection within mid-cap securities ($2 to $10 billion) and large-cap ($20 to $50 billion) compared to the S&P 500 Index were primary contributors to relative performance. However, weak security selection in mega-cap (>$50 billion) securities partially offset these strong returns. The portfolio benefited from an overweight allocation to small-cap (<$2 billion) securities.
Over the last year, the Fund’s positive relative exposure to Wellington’s valuation and quality themes added to returns compared to the benchmark. Valuation did particularly well in the second half of 2016 at the expense of momentum. These trends have reversed in 2017, with the market becoming more singularly focused on momentum.
13
Top detractors from relative performance, compared to the S&P 500 Index, included Foot Locker (consumer discretionary), Ross Stores (consumer discretionary), and Verizon (telecommunication services). Top contributors to relative performance included Prudential Financial (financials), Applied Materials (information technology), and Unum Group (financials).
During the period Wellington Management deployed refinements to its portfolio construction process, to reduce trading costs and market impact by making better use of available liquidity. These refinements are designed to augment Wellington’s historically strong management of trading costs.
TEN LARGEST HOLDING (Unaudited)
| SECURITY DESCRIPTION | % NET ASSETS | SECURITY DESCRIPTION | % NET ASSETS | |||||||
| Apple Inc. | 3.7% | Consolidated Edison Inc. | 2.8% | |||||||
| Alphabet Inc. Class A | 3.3% | Gilead Sciences Inc. | 2.7% | |||||||
| PepsiCo Inc. | 3.1% | Cummins Inc. | 2.6% | |||||||
| Prudential Financial Inc. | 3.0% | International Business Machines Corp |
| 2.5% |
| |||||
| Amazon.com Inc. | 2.9% | |||||||||
| Unum Group | 2.4% | |||||||||
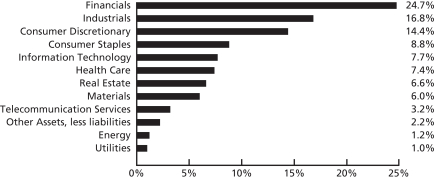
PORTFOLIO HOLDINGS BY INDUSTRY SECTOR (% OF NET ASSETS) (Unaudited)
The Fund is subject to market, sector concentration, style and foreign investing risks. Investing internationally involves special risks, such as currency fluctuations, social and economic instability, differing security regulations and accounting standards limited public information possible changes in taxation, and periods of illiquidity.
14
| AVERAGE ANNUAL TOTAL RETURNS (Unaudited) | Investor shares | S&P 500 | ||||
| As of 7/31/17 | 1 Year | 14.07% | 16.04% | |||
| 5 Year | 11.19% | 14.78% | ||||
| 10 Year | 6.04% | 7.74% | ||||
| Since Inception (6/3/91) | 8.33% | 9.53% | ||||
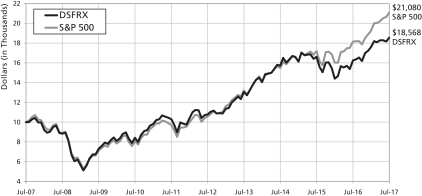
COMPARISON OF $10,000 INVESTMENT IN THE DOMINI IMPACT EQUITY FUND INVESTOR SHARES AND S&P 500 (Unaudited)
Past performance is no guarantee of future results. The Fund’s returns quoted above represent past performance after all expenses. The returns reflect any applicable expense waivers in effect during the periods shown. Without such waivers, Fund performance would be lower. Investment return, principal value, and yield will fluctuate. Your shares, when redeemed, may be worth more or less than their original cost. Call 1-800-582-6757 or visit www.domini.com for performance information current to the most recent month-end, which may be lower or higher. A 2.00% fee applies on sales/exchanges made less than 30 days after purchase/exchange, with certain exceptions. Quoted performance data does not reflect the deduction of this fee, which would reduce the performance quoted. See the Fund’s prospectus for further information.
On November 30, 2006, the Fund changed from a passive to active management strategy. Performance from Fund inception through November 29, 2006, reflects the former passive investment strategy.
Per the prospectus supplement dated May 1, 2017, the Fund’s gross and net annual operating expenses totaled 1.08% of net assets. Until 11/30/17, the Fund’s Manager has contractually agreed to limit certain ordinary Investor share expenses to 1.25% of its average daily net assets per annum, absent an earlier modification by the Fund’s Board.
The table and the graph do not reflect the deduction of fees and taxes that a shareholder would pay on Fund distributions or the redemption of Fund shares. Total return for the Domini Impact Equity Fund is based on the Fund’s net asset values and assumes all dividend and capital gains were reinvested. An investment in the Fund is not a bank deposit and is not insured. You may lose money.
The Standard & Poor’s 500 Index (S&P 500) is an unmanaged index of common stocks. Investors cannot invest directly in the S&P 500.
15
| AVERAGE ANNUAL TOTAL RETURNS (Unaudited) | ||||||||
| Class A shares (with 4.75% maximum Sales Charge) | Class A shares (without Sales Charge) | S&P 500 | ||||||
| As of 7/31/17 | 1 Year | 8.55% | 13.97% | 16.04% | ||||
| 5 Year | 10.10% | 11.17% | 14.78% | |||||
| 10 Year* | 5.53% | 6.04% | 7.74% | |||||
| Since Inception (6/3/91)* | 8.12% | 8.33% | 9.53% | |||||
COMPARISON OF $10,000 INVESTMENT IN THE DOMINI IMPACT EQUITY FUND CLASS A SHARES AND S&P 500 (WITH 4.75% MAXIMUM SALES CHARGE)* (Unaudited)
Past performance is no guarantee of future results. The Fund’s returns quoted above represent past performance after all expenses. The returns reflect any applicable expense waivers in effect during the periods shown. Without such waivers, Fund performance would be lower. Investment return, principal value, and yield will fluctuate. Your shares, when redeemed, may be worth more or less than their original cost. Call 1-800-498-1351 or visit www.domini.com for performance information current to the most recent month-end, which may be lower or higher. A 2.00% fee applies on sales/exchanges made less than 30 days after purchase/exchange, with certain exceptions. Quoted performance data does not reflect the deduction of this fee, which would reduce the performance quoted. See the Fund’s prospectus for further information.
On November 30, 2006, the Fund changed from a passive to active management strategy. Performance from Fund inception through November 29, 2006, reflects the former passive investment strategy.
Per the prospectus supplement dated May 1, 2017, the Fund’s gross and net annual operating expenses totaled 1.35% and 1.12% of net assets, respectively. Until 11/30/17, the Fund’s Manager has contractually agreed to limit certain ordinary Class A share expenses to 1.18% of its average daily net assets per annum absent an earlier modification by the Fund’s Board. The Fund’s total return would have been lower without this limit.
The table and the graph do not reflect the deduction of fees and taxes that a shareholder would pay on Fund distributions or the redemption of Fund shares. Total return for the Domini Impact Equity Fund is based on the Fund’s net asset values and assumes all dividend and capital gains were reinvested. An investment in the Fund is not a bank deposit and is not insured. You may lose money.
The Standard & Poor’s 500 Index (S&P 500) is an unmanaged index of common stocks. Investors cannot invest directly in the S&P 500.
*Class A shares were not offered prior to November 28, 2008. All performance information for time periods beginning prior to November 28, 2008 is the performance of the Investor shares. This performance has not been adjusted to reflect the expenses of the Class A shares, but does, where noted, reflect an adjustment for the maximum applicable sales charge of 4.75%.
16
| AVERAGE ANNUAL TOTAL RETURNS (Unaudited) | Institutional shares | S&P 500 | ||||
| As of 7/31/17 | 1 Year | 14.51% | 16.04% | |||
| 5 Year | 11.61% | 14.78% | ||||
| 10 Year* | 6.04% | 7.74% | ||||
| Since Inception (6/3/91)* | 8.33% | 9.53% | ||||
COMPARISON OF $500,000 INVESTMENT IN THE DOMINI IMPACT EQUITY FUND INSTITUTIONAL SHARES AND S&P 500* (Unaudited)

Past performance is no guarantee of future results. The Fund’s returns quoted above represent past performance after all expenses. The returns reflect any applicable expense waivers in effect during the periods shown. Without such waivers, Fund performance would be lower. Investment return, principal value, and yield will fluctuate. Your shares, when redeemed, may be worth more or less than their original cost. Call 1-800-498-1351 or visit www.domini.com for performance information current to the most recent month-end, which may be lower or higher. A 2.00% fee applies on sales/exchanges made less than 30 days after purchase/exchange, with certain exceptions. Quoted performance data does not reflect the deduction of this fee, which would reduce the performance quoted. See the Fund’s prospectus for further information.
On November 30, 2006, the Fund changed from a passive to active management strategy. Performance from Fund inception through November 29, 2006, reflects the former passive investment strategy.
Per the prospectus supplement dated May 1, 2017, the Fund’s gross and net annual operating expenses totaled 0.75% and 0.74% of net assets, respectively. Until 11/30/17, the Fund’s Manager has contractually agreed to limit certain ordinary Institutional share expenses to 0.80% of its average daily net assets per annum absent an earlier modification by the Fund’s Board.
The table and the graph do not reflect the deduction of fees and taxes that a shareholder would pay on Fund distributions or the redemption of Fund shares. Total return for the Domini Impact Equity Fund is based on the Fund’s net asset values and assumes all dividend and capital gains were reinvested. An investment in the Fund is not a bank deposit and is not insured. You may lose money.
The Standard & Poor’s 500 Index (S&P 500) is an unmanaged index of common stocks. Investors cannot invest directly in the S&P 500.
*Institutional shares were not offered prior to November 28, 2008. All performance information for time periods beginning prior to November 28, 2008 is the performance of the Investor shares. This performance has not been adjusted to reflect the expenses of the Institutional shares.
17
| AVERAGE ANNUAL TOTAL RETURNS (Unaudited) | Class R shares | S&P 500 | ||||
| As of 7/31/17 | 1 Year | 14.20% | 16.04% | |||
| 5 Year | 11.52% | 14.78% | ||||
| 10 Year | 6.38% | 7.74% | ||||
| Since Inception (6/3/91)* | 8.50% | 9.53% | ||||
COMPARISON OF $10,000 INVESTMENT IN THE DOMINI IMPACT EQUITY FUND CLASS R SHARES AND S&P 500* (Unaudited)
Past performance is no guarantee of future results. The Fund’s returns quoted above represent past performance after all expenses. The returns reflect any applicable expense waivers in effect during the periods shown. Without such waivers, Fund performance would be lower. Investment return, principal value, and yield will fluctuate. Your shares, when redeemed, may be worth more or less than their original cost. Call 1-800-498-1351 or visit www.domini.com for performance information current to the most recent month-end, which may be lower or higher. A 2.00% fee applies on sales/exchanges made less than 30 days after purchase/exchange, with certain exceptions. Quoted performance data does not reflect the deduction of this fee, which would reduce the performance quoted. See the Fund’s prospectus for further information.
On November 30, 2006, the Fund changed from a passive to active management strategy. Performance from Fund inception through November 29, 2006, reflects the former passive investment strategy.
Per the prospectus supplement dated May 1, 2017, the Fund’s gross and net annual operating expenses totaled 0.76% of net assets. Until 11/30/17, the Fund’s Manager has contractually agreed to limit certain ordinary Class R share expenses to 0.90% of its average daily net assets per annum absent an earlier modification by the Fund’s Board.
The table and the graph do not reflect the deduction of fees and taxes that a shareholder would pay on Fund distributions or the redemption of Fund shares. Total return for the Domini Impact Equity Fund is based on the Fund’s net asset values and assumes all dividend and capital gains were reinvested. An investment in the Fund is not a bank deposit and is not insured. You may lose money.
The Standard & Poor’s 500 Index (S&P 500) is an unmanaged index of common stocks. Investors cannot invest directly in the S&P 500.
*Class R shares were not offered prior to November 28, 2003. All performance information for the portion of the period prior to November 28, 2003 is the performance of the Investor shares and has not been adjusted to reflect the expenses of the Class R shares.
18
DOMINI IMPACT EQUITY FUND
PORTFOLIOOF INVESTMENTS
July 31, 2017
| SECURITY | SHARES | VALUE | ||||||
| Common Stocks – 99.3% | ||||||||
| Consumer Discretionary – 12.4% | ||||||||
Amazon.com Inc (a) | 25,312 | $ | 25,002,687 | |||||
Best Buy Co Inc | 866 | 50,522 | ||||||
Burlington Stores Inc (a) | 38,047 | 3,311,230 | ||||||
Chipotle Mexican Grill Inc (a) | 29,124 | 10,011,957 | ||||||
Coach Inc | 348 | 16,405 | ||||||
Comcast Corp Cl A | 444,504 | 17,980,187 | ||||||
Gap Inc/The | 445 | 10,604 | ||||||
Home Depot Inc/The | 218 | 32,613 | ||||||
JC Penney Co Inc (a) | 1,546 | 8,364 | ||||||
Kohl’s Corp | 212 | 8,766 | ||||||
L Brands Inc | 219 | 10,159 | ||||||
Lear Corp | 36,990 | 5,481,548 | ||||||
Lowe’s Cos Inc | 364 | 28,174 | ||||||
Marriott International Inc/MD Cl A | 146 | 15,212 | ||||||
Michael Kors Holdings Ltd (a) | 235 | 8,563 | ||||||
NIKE Inc Cl B | 376 | 22,203 | ||||||
Ralph Lauren Corp | 82 | 6,203 | ||||||
Ross Stores Inc | 316,193 | 17,491,797 | ||||||
Scripps Networks Interactive Inc Cl A | 145,764 | 12,741,231 | ||||||
Staples Inc | 666 | 6,760 | ||||||
Starbucks Corp | 414 | 22,348 | ||||||
Target Corp | 181 | 10,257 | ||||||
TJX Cos Inc/The | 205,050 | 14,417,066 | ||||||
Walt Disney Co/The | 242 | 26,603 | ||||||
|
| |||||||
| 106,721,459 | ||||||||
|
| |||||||
| Consumer Staples – 11.0% | ||||||||
Avon Products Inc (a) | 2,873 | 10,458 | ||||||
Campbell Soup Co | 80,865 | 4,272,098 | ||||||
Coca Cola Co/The | 292 | 13,385 | ||||||
Colgate-Palmolive Co | 218,787 | 15,796,421 | ||||||
Costco Wholesale Corp | 73,364 | 11,628,928 | ||||||
Estee Lauder Cos Inc/The Cl A | 120 | 11,879 | ||||||
General Mills Inc | 175 | 9,741 | ||||||
Kimberly-Clark Corp | 141 | 17,366 | ||||||
Kraft Heinz Co/The | 223 | 19,504 | ||||||
Kroger Co/The | 860 | 21,087 | ||||||
Loblaw Companies LTD | 79,972 | 4,342,168 | ||||||
Mondelez International Inc Cl A | 265 | 11,665 | ||||||
National Beverage Corp | 28,556 | 2,916,139 | ||||||
PepsiCo Inc | 228,424 | 26,636,523 | ||||||
Procter + Gamble Co/The | 155 | 14,077 | ||||||
Sysco Corp | 178,211 | 9,377,463 | ||||||
Walgreens Boots Alliance Inc | 244,345 | 19,711,311 | ||||||
Whole Foods Market Inc | 248 | 10,356 | ||||||
|
| |||||||
| 94,820,569 | ||||||||
|
| |||||||
19
DOMINI IMPACT EQUITY FUND
PORTFOLIOOF INVESTMENTS (continued)
July 31, 2017
| SECURITY | SHARES | VALUE | ||||||
| Energy – 0.2% | ||||||||
Subsea 7 SA ADR | 134,203 | $ | 1,987,546 | |||||
|
| |||||||
| 1,987,546 | ||||||||
|
| |||||||
| Financials – 15.4% | ||||||||
AGNC Investment Corp | 109,628 | 2,321,921 | ||||||
American Express Co | 191 | 16,279 | ||||||
Banco Santander Brasil SA | 211,722 | 1,721,300 | ||||||
Bank of America Corp | 120,524 | 2,907,039 | ||||||
Bank of Montreal | 34,100 | 2,587,167 | ||||||
Bank of Nova Scotia/The | 37,616 | 2,343,853 | ||||||
Canadian Imperial Bank of Commerce | 53,003 | 4,602,781 | ||||||
DBS Group Holdings Ltd ADR | 106,738 | 6,847,243 | ||||||
Hartford Financial Services Group Inc/The | 96,599 | 5,312,945 | ||||||
Intercontinental Exchange Inc | 195 | 13,008 | ||||||
Invesco Mortgage Capital Inc | 125,474 | 2,086,633 | ||||||
Lincoln National Corp | 53,106 | 3,879,924 | ||||||
Loews Corp | 56,499 | 2,750,371 | ||||||
MetLife Inc | 264,764 | 14,562,020 | ||||||
MFA Financial Inc | 815,843 | 6,926,507 | ||||||
MGIC Investment Corp (a) | 191,235 | 2,231,712 | ||||||
Morgan Stanley | 292 | 13,695 | ||||||
National Bank Of Canada | 85,343 | 3,831,922 | ||||||
ORIX Corp ADR (a) | 27,030 | 2,238,895 | ||||||
PNC Financial Services Group Inc/The | 190 | 24,472 | ||||||
Popular Inc | 122,024 | 5,142,091 | ||||||
Prudential Financial Inc | 228,412 | 25,863,091 | ||||||
Radian Group Inc | 245,438 | 4,275,530 | ||||||
Regions Financial Corp | 273,143 | 3,987,888 | ||||||
Two Harbors Investment Corp | 538,798 | 5,328,712 | ||||||
Unum Group | 414,409 | 20,774,323 | ||||||
US Bancorp | 346 | 18,262 | ||||||
|
| |||||||
| 132,609,584 | ||||||||
|
| |||||||
| Health Care – 14.6% | ||||||||
Baxter International Inc | 47,532 | 2,874,735 | ||||||
Biogen Inc | 42,139 | 12,203,033 | ||||||
Bruker Corp | 50,108 | 1,437,097 | ||||||
Celgene Corp (a) | 47,243 | 6,397,175 | ||||||
Cooper Cos Inc/The | 19,705 | 4,805,458 | ||||||
Gilead Sciences Inc | 305,710 | 23,261,474 | ||||||
IDEXX Laboratories Inc (a) | 105,948 | 17,636,104 | ||||||
Intuitive Surgical Inc (a) | 899 | 843,496 | ||||||
Masimo Corp (a) | 41,257 | 3,902,912 | ||||||
Merck & Co Inc | 307,178 | 19,622,531 | ||||||
Quest Diagnostics Inc | 184,128 | 19,942,904 | ||||||
Sanofi ADR | 205,652 | 9,739,679 | ||||||
Taro Pharmaceutical Industries Ltd (a) | 13,198 | 1,508,927 | ||||||
Waters Corp (a) | 11,202 | 1,942,875 | ||||||
|
| |||||||
| 126,118,400 | ||||||||
|
| |||||||
20
DOMINI IMPACT EQUITY FUND
PORTFOLIOOF INVESTMENTS (continued)
July 31, 2017
| SECURITY | SHARES | VALUE | ||||||
| Industrials – 8.1% | ||||||||
3m Co | 115 | $ | 23,135 | |||||
Alaska Air Group Inc | 55,468 | 4,727,538 | ||||||
Applied Industrial Technologies Inc | 12,610 | 712,465 | ||||||
Cummins Inc | 132,390 | 22,228,280 | ||||||
Herman Miller Inc | 64,000 | 2,155,200 | ||||||
JetBlue Airways Corp (a) | 1,688 | 37,018 | ||||||
LSC Communications Inc | 409 | 8,744 | ||||||
ManpowerGroup Inc | 44,202 | 4,736,244 | ||||||
PACCAR Inc | 200,455 | 13,721,145 | ||||||
Robert Half International Inc | 246,711 | 11,163,673 | ||||||
RR Donnelley & Sons Co | 569 | 7,033 | ||||||
Toro Co/The | 60,485 | 4,299,879 | ||||||
United Parcel Service Inc Cl B | 131 | 14,448 | ||||||
United Rentals Inc (a) | 52,783 | 6,279,066 | ||||||
|
| |||||||
| 70,113,868 | ||||||||
|
| |||||||
| Information Technology – 24.3% | ||||||||
Advanced Micro Devices Inc (a) | 3,150 | 42,872 | ||||||
Alphabet Inc Cl A (a) | 29,894 | 28,264,777 | ||||||
Apple Inc | 212,755 | 31,643,051 | ||||||
Applied Materials Inc | 446,074 | 19,765,539 | ||||||
Cisco Systems Inc | 504 | 15,851 | ||||||
Citrix Systems Inc | 85,208 | 6,729,728 | ||||||
Electronic Arts Inc (a) | 73,961 | 8,634,207 | ||||||
Euronet Worldwide Inc (a) | 7,138 | 689,602 | ||||||
F5 Networks Inc (a) | 121,545 | 14,676,559 | ||||||
Facebook Inc Cl A (a) | 40,097 | 6,786,417 | ||||||
First Solar Inc (a) | 358 | 17,653 | ||||||
FUJIFILM Holdings Corp ADR (a) | 27,239 | 998,718 | ||||||
HP Inc | 145,662 | 2,782,144 | ||||||
Intel Corp | 563,339 | 19,981,634 | ||||||
International Business Machines Corp | 146,839 | 21,243,198 | ||||||
Lam Research Corp | 100,243 | 15,984,749 | ||||||
Mastercard Inc Cl A | 38,492 | 4,919,278 | ||||||
Microsoft Corp | 88,514 | 6,434,968 | ||||||
Motorola Solutions Inc | 201 | 18,227 | ||||||
Synopsys Inc (a) | 202,264 | 15,487,354 | ||||||
VMware Inc Cl A (a) | 43,116 | 3,997,284 | ||||||
|
| |||||||
| 209,113,810 | ||||||||
|
| |||||||
| Materials – 3.8% | ||||||||
Domtar Corp | 227,700 | 8,893,962 | ||||||
Louisiana-Pacific Corp (a) | 122,001 | 3,063,445 | ||||||
Nucor Corp | 230 | 13,264 | ||||||
Sherwin-Williams Co/The | 26,961 | 9,093,136 | ||||||
Steel Dynamics Inc | 332,713 | 11,781,367 | ||||||
WestRock Co | 256 | 14,700 | ||||||
|
| |||||||
| 32,859,874 | ||||||||
|
| |||||||
21
DOMINI IMPACT EQUITY FUND
PORTFOLIOOF INVESTMENTS (continued)
July 31, 2017
| SECURITY | SHARES | VALUE | ||||||
| Real Estate – 3.4% | ||||||||
CBRE Group Inc Cl A (a) | 60,382 | $ | 2,293,912 | |||||
Equity Commonwealth (a) | 32,842 | 1,037,150 | ||||||
Host Hotels & Resorts Inc | 408,710 | 7,626,529 | ||||||
Mack Cali Realty Corp | 289,321 | 7,591,783 | ||||||
Mid-America Apartment Communities Inc | 39,229 | 4,061,378 | ||||||
Omega Healthcare Investors Inc | 135,542 | 4,281,772 | ||||||
Weingarten Realty Investors | 70,548 | 2,289,988 | ||||||
|
| |||||||
| 29,182,512 | ||||||||
|
| |||||||
| Telecommunication Services – 2.5% | ||||||||
AT&T Inc | 44,897 | 1,750,983 | ||||||
BCE Inc | 85,976 | 4,034,854 | ||||||
Rogers Communications Inc Cl B | 31,553 | 1,640,756 | ||||||
Telephone & Data Systems Inc | 182,230 | 5,180,799 | ||||||
Telus Corporation | 72,044 | 2,594,172 | ||||||
Verizon Communications Inc | 127,078 | 6,150,575 | ||||||
|
| |||||||
| 21,352,139 | ||||||||
|
| |||||||
| Utilities – 3.6% | ||||||||
Avangrid Inc | 119,649 | 5,434,458 | ||||||
Consolidated Edison Inc | 293,201 | 24,294,635 | ||||||
Eversource Energy | 17,833 | 1,084,068 | ||||||
|
| |||||||
| 30,813,161 | ||||||||
|
| |||||||
| Total Investments – 99.3% (Cost $719,142,026) (b) | 855,692,922 | |||||||
| Other Assets, less liabilities – 0.7% | 6,004,646 | |||||||
|
| |||||||
| Net Assets – 100.0% | $861,697,568 | |||||||
|
| |||||||
(a) Non-income producing security.
(b) The aggregate cost for federal income tax purposes is $719,503,911. The aggregate gross unrealized appreciation is $151,371,159 and the aggregate gross unrealized depreciation is $15,182,148, resulting in net unrealized appreciation of $136,189,011.
ADR — American Depository Receipt
SEE NOTES TO FINANCIAL STATEMENTS
22
DOMINI IMPACT INTERNATIONAL EQUITY FUND
Performance Commentary (Unaudited)
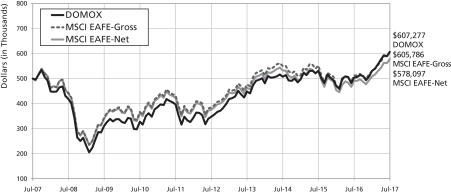
For the year ended July 31, 2017, the Domini Impact International Equity Fund Investor shares returned 20.61%, outperforming the MSCI EAFE Index, which returned 18.32% (gross) and 17.77% (net) during the period.
The Fund is managed through a two-step process designed to capitalize on the strengths of Domini Impact Investments LLC (“Domini”) and Wellington Management Company LLP (“Wellington Management”). Domini creates an approved list of companies based on its social, environmental and governance analysis, and Wellington then utilizes a disciplined and systematic process to manage the portfolio. Wellington Management’s philosophy relies on systematically exploiting sources of excess returns, stemming from both common behavioral, market structure, and risk premia inefficiencies in the market and the belief that certain factors are strongly associated with stock outperformance.
During the period, security selection was the primary driver of outperformance relative to the MSCI EAFE Index. Strong security selection within the materials, consumer staples, and information technology sectors aided relative results. Within materials, our positions in Norsk Hydro, Mitsubishi Gas and Sims Metal Management were particularly additive to EAFE-relative results. Partially offsetting these positive results was weak security selection within the telecommunication services and energy sectors.
Overall, top contributors to relative performance included Norsk Hydro (materials), ING Groep (financials), and STMicroelectronics (information technology). Top detractors included TPG Telecom (telecommunication services), Central Japan Railway Company (industrials) and Royal Mail (industrials). TPG Telecom was eliminated from the portfolio prior to the end of the period.
Typically, the Fund’s sector exposures generally fall within +/- 3% of the benchmark, but occasionally fall outside that range. From an allocation perspective, sector positioning relative to the MSCI EAFE Index contributed to relative results during the period. An underweight allocation to the underperforming health care sector and an overweight allocation to the strong performing information technology sector aided relative performance.
From a regional perspective, the portfolio’s strong security selection within Europe, Japan, and the Middle East contributed to relative results. This positive relative performance was partially offset by negative selection within North America and Asia (ex-Japan). The Fund benefited from an overweight position in European banks and household durables stocks. Our exposure to emerging market stocks, which represent a relatively small portion of the portfolio’s investments (under 10%), also provided a return tailwind. This helped to partially offset an underweight model exposure to European and Japanese equities.
23
From a market capitalization standpoint, the portfolio’s strong security selection within mid-cap securities (US$2 to US$10 billion) and large-cap (US$10 to US$20 billion) compared to the MSCI EAFE Index were primary contributors to relative performance, partially offset by weak security selection in the $20 to $50 billion market cap range. The portfolio also benefited from an underweight allocation to mega-cap (>US$50 billion) securities.
TEN LARGEST HOLDINGS (Unaudited)
| SECURITY DESCRIPTION | % NET ASSETS | SECURITY DESCRIPTION | % NET ASSETS | |||||||
| Sanofi | 2.9% | Allianz SE | 1.8% | |||||||
| Unilever PLC | 2.3% | Cie de Saint-Gobain | 1.7% | |||||||
| Nissan Motor Company Ltd. | 2.1% | Siemens AG | 1.7% | |||||||
| Adecco Group AG | 1.9% | DBS Group Holdings Ltd. | 1.6% | |||||||
| Kering | 1.8% | Sandvik AB | 1.6% | |||||||
PORTFOLIO HOLDINGS BY INDUSTRY SECTOR (% OF NET ASSETS) (Unaudited)
24
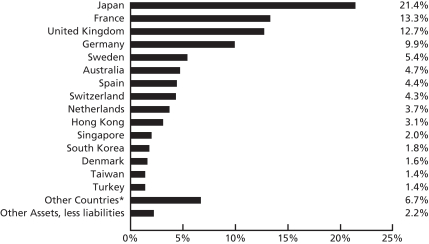
PORTFOLIO HOLDINGS BY COUNTRY (% OF NET ASSETS) (Unaudited)
An investment in the Domini Impact International Equity Fund is not a bank deposit and is not insured. You may lose money. The Fund is subject to market, sector concentration, foreign investing and style risks. Investing internationally involves special risks, such as currency fluctuations, social and economic instability, differing securities regulations and accounting standards, limited public information, possible changes in taxation, and periods of illiquidity. These risks are magnified in emerging markets.
*Other countries include Norway (1.2%), China (0.8%), South Africa (0.8%), United States (0.6%), Belgium (0.5%), Indonesia (0.5%), Panama (0.5%), Brazil (0.4%), Hungary (0.4%), Italy (0.3%), Mexico (0.3%), Finland (0.2%), Israel (0.1%), Thailand (0.1%), and Ireland (0.0%).
25
| AVERAGE ANNUAL TOTAL RETURNS (Unaudited) | ||||||||
| Investor shares | MSCI EAFE (gross) | MSCI EAFE (net) | ||||||
| As of 7/31/17 | 1 Year | 20.61% | 18.32% | 17.77% | ||||
| 5 Year | 11.86% | 9.55% | 9.06% | |||||
| 10 Year | 1.96% | 1.94% | 1.46% | |||||
| Since Inception (12/27/06) | 2.21% | 2.80% | 2.52% | |||||
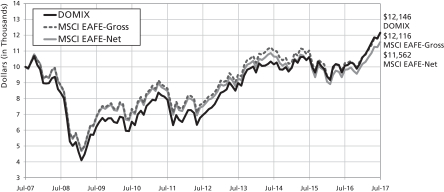
COMPARISON OF $10,000 INVESTMENT IN THE DOMINI IMPACT INTERNATIONAL EQUITY FUND INVESTOR SHARES AND MSCI EAFE (GROSS)/(NET) (Unaudited)
Past performance is no guarantee of future results. The Fund’s returns quoted above represent past performance after all expenses. The returns reflect any applicable expense waivers in effect during the periods shown. Without such waivers, Fund performance would be lower. Investment return, principal value, and yield will fluctuate. Your shares, when redeemed, may be worth more or less than their original cost. Call 1-800-582-6757 or visit www.domini.com for performance information current to the most recent month-end, which may be lower or higher. A 2.00% fee applies on sales/exchanges made less than 30 days after purchase/exchange, with certain exceptions. Quoted performance data does not reflect the deduction of this fee, which would reduce the performance quoted. See the Fund’s prospectus for further information.
Per the prospectus supplement dated May 1, 2017, the Fund’s gross and net annual operating expenses totaled 1.46% of net assets. Until 11/30/17, the Fund’s Manager has contractually agreed to limit certain ordinary Investor share expenses to 1.60% of its average daily net assets per annum absent an earlier modification by the Fund’s Board.
The table and the graph do not reflect the deduction of fees and taxes that a shareholder would pay on Fund distributions or the redemption of Fund shares. Total return for the Domini Impact International Equity Fund is based on the Fund’s net asset values and assumes all dividend and capital gains were reinvested.
The Morgan Stanley Capital International Europe Australasia Far East (MSCI EAFE) index is an unmanaged index of common stocks. It is not available for direct investment. MSCI EAFE (gross) includes the reinvestment of dividends but reflects no deduction for fees, expenses or taxes. MSCI EAFE (net) includes the reinvestment of dividends net of withholding tax, but does not reflect other fees, expenses or taxes.
26
| AVERAGE ANNUAL TOTAL RETURNS (Unaudited) | ||||||||||
| Class A shares (with 4.75% maximum Sales Charge) | Class A shares (without Sales Charge) | MSCI EAFE (gross) | MSCI EAFE (net) | |||||||
| As of 7/31/17 | 1 Year | 14.72% | 20.44% | 18.32% | 17.77% | |||||
| 5 Year | 10.78% | 11.86% | 9.55% | 9.06% | ||||||
| 10 Year* | 1.47% | 1.96% | 1.94% | 1.46% | ||||||
| Since Inception (12/27/06)* | 1.74% | 2.21% | 2.80% | 2.52% | ||||||
COMPARISON OF $10,000 INVESTMENT IN THE DOMINI IMPACT INTERNATIONAL EQUITY FUND CLASS A SHARES AND MSCI EAFE (GROSS)/(NET) (WITH 4.75% MAXIMUM SALES CHARGE)* (Unaudited)

Past performance is no guarantee of future results. The Fund’s returns quoted above represent past performance after all expenses. The returns reflect any applicable expense waivers in effect during the periods shown. Without such waivers, Fund performance would be lower. Investment return, principal value, and yield will fluctuate. Your shares, when redeemed, may be worth more or less than their original cost. Call 1-800-498-1351 or visit www.domini.com for performance information current to the most recent month-end, which may be lower or higher. A 2.00% fee applies on sales/exchanges made less than 30 days after purchase/exchange, with certain exceptions. Quoted performance data does not reflect the deduction of this fee, which would reduce the performance quoted. See the Fund’s prospectus for further information.
Per the prospectus supplement dated May 1, 2017, the Fund’s gross and net annual operating expenses totaled 1.53% and 1.47% of net assets, respectively. Until 11/30/17, the Fund’s Manager has contractually agreed to limit certain ordinary Class A share expenses to 1.57% of its average daily net assets per annum absent an earlier modification by the Fund’s Board.
The table and the graph do not reflect the deduction fees and taxes that a shareholder would pay on Fund distributions or the redemption of Fund shares. Total return for the Domini Impact International Equity Fund is based on the Fund’s net asset values and assumes all dividend and capital gains were reinvested.
The Morgan Stanley Capital International Europe Australasia Far East (MSCI EAFE) index is an unmanaged index of common stocks. It is not available for direct investment. MSCI EAFE (gross) includes the reinvestment of dividends but reflects no deduction for fees, expenses or taxes. MSCI EAFE (net) includes the reinvestment of dividends net of withholding tax, but does not reflect other fees, expenses or taxes.
*Class A shares were not offered prior to November 28, 2008. All performance information for time periods beginning prior to November 28, 2008 is the performance of the Investor shares. Unless otherwise noted, this performance has not been adjusted to reflect the expenses of the Class A shares, but does, where noted, reflect an adjustment for the maximum applicable sales charges of 4.75%.
27
| AVERAGE ANNUAL TOTAL RETURNS (Unaudited) | ||||||||
| Institutional shares | MSCI EAFE (gross) | MSCI EAFE (net) | ||||||
| As of 7/31/17 | 1 Year | 20.80% | 18.32% | 17.77% | ||||
| 5 Year* | 11.86% | 9.55% | 9.06% | |||||
| 10 Year* | 1.96% | 1.94% | 1.46% | |||||
| Since Inception (12/27/06)* | 2.21% | 2.80% | 2.52% | |||||
COMPARISON OF $500,000 INVESTMENT IN THE DOMINI IMPACT INTERNATIONAL EQUITY FUND INSTITUTIONAL SHARES AND MSCI EAFE (GROSS)/(NET)* (Unaudited)
Past performance is no guarantee of future results. The Fund’s returns quoted above represent past performance after all expenses. The returns reflect any applicable expense waivers in effect during the periods shown. Without such waivers, Fund performance would be lower. Investment return, principal value, and yield will fluctuate. Your shares, when redeemed, may be worth more or less than their original cost. Call 1-800-498-1351 or visit www.domini.com for performance information current to the most recent month-end, which may be lower or higher. A 2.00% fee applies on sales/exchanges made less than 30 days after purchase/exchange, with certain exceptions. Quoted performance data does not reflect the deduction of this fee, which would reduce the performance quoted. See the Fund’s prospectus for further information.
Per the prospectus supplement dated May 1, 2017, the Fund’s gross and net annual operating expenses totaled 1.04% of net assets. Until 11/30/17, the Fund’s Manager has contractually agreed to limit certain ordinary Institutional share expenses to 1.27% of its average daily net assets per annum absent an earlier modification by the Fund’s Board.
The table and the graph do not reflect the deduction of taxes that a shareholder would pay on Fund distributions or the redemption of Fund shares. Total return for the Domini Impact International Equity Fund is based on the Fund’s net asset values and assumes all dividend and capital gains were reinvested.
The Morgan Stanley Capital International Europe Australasia Far East (MSCI EAFE) index is an unmanaged index of common stocks. It is not available for direct investment. MSCI EAFE (gross) includes the reinvestment of dividends but reflects no deduction for fees, expenses or taxes. MSCI EAFE (net) includes the reinvestment of dividends net of withholding tax, but does not reflect other fees, expenses or taxes.
*Institutional shares were not offered prior to November 30, 2012. All performance information for time periods beginning prior to November 28, 2012 is the performance of the Investor shares. Unless otherwise noted, this performance has not been adjusted to reflect the expenses of the Institutional shares.
28
DOMINI IMPACT INTERNATIONAL EQUITY FUND
PORTFOLIOOF INVESTMENTS
July 31, 2017
| COUNTRY/SECURITY | INDUSTRY | SHARES | VALUE | |||||||
| Common Stock – 97.8% | ||||||||||
Australia – 4.7% | ||||||||||
Bendigo & Adelaide Bank Ltd | Banks | 559,430 | $ | 4,966,427 | ||||||
BlueScope Steel Ltd | Materials | 171,947 | 1,809,270 | |||||||
Boral Ltd | Materials | 122,264 | 675,458 | |||||||
Challenger Ltd/Australia | Diversified Financials | 707,354 | 7,256,604 | |||||||
Dexus | Real Estate | 1,226,495 | 9,184,639 | |||||||
Flight Centre Travel Group Ltd | Consumer Services | 61,071 | 2,120,888 | |||||||
Fortescue Metals Group Ltd | Materials | 1,009,443 | 4,625,804 | |||||||
Harvey Norman Holdings Ltd | Retailing | 689,641 | 2,406,013 | |||||||
Mirvac Group | Real Estate | 6,813,568 | 11,803,962 | |||||||
Sims Metal Management Ltd | Materials | 389,690 | 4,834,636 | |||||||
Westpac Banking Corp | Banks | 1,344 | 34,143 | |||||||
|
| |||||||||
| 49,717,844 | ||||||||||
|
| |||||||||
Belgium – 0.5% | ||||||||||
UCB SA | Pharma, Biotech & Life Sciences | 69,399 | 5,036,929 | |||||||
|
| |||||||||
| 5,036,929 | ||||||||||
|
| |||||||||
Brazil – 0.4% | ||||||||||
M Dias Branco SA | Food & Beverage | 254,115 | 4,127,641 | |||||||
|
| |||||||||
| 4,127,641 | ||||||||||
|
| |||||||||
China – 0.8% | ||||||||||
Beijing Capital International Airport Co Ltd Cl H | Transportation | 680,188 | 1,071,210 | |||||||
Nine Dragons Paper Holdings Ltd | Materials | 3,783,961 | 5,639,496 | |||||||
Ping An Insurance Group Co of China Ltd Cl H | Insurance | 312,562 | 2,319,157 | |||||||
|
| |||||||||
| 9,029,863 | ||||||||||
|
| |||||||||
Denmark – 1.6% | ||||||||||
Danske Bank A/S | Banks | 47,694 | 1,924,349 | |||||||
H Lundbeck A/S | Pharma, Biotech & Life Sciences | 118,420 | 7,087,196 | |||||||
TDC A/S | Telecommunication Services | 199,762 | 1,227,205 | |||||||
Vestas Wind Systems A/S | Capital Goods | 72,222 | 7,030,242 | |||||||
|
| |||||||||
| 17,268,992 | ||||||||||
|
| |||||||||
Finland – 0.2% | ||||||||||
Orion Oyj Cl B | Pharma, Biotech & Life Sciences | 23,073 | 1,162,388 | |||||||
Valmet OYJ | Capital Goods | 64,720 | 1,175,096 | |||||||
|
| |||||||||
| 2,337,484 | ||||||||||
|
| |||||||||
29
DOMINI IMPACT INTERNATIONAL EQUITY FUND
PORTFOLIOOF INVESTMENTS (continued)
July 31, 2017
| COUNTRY/SECURITY | INDUSTRY | SHARES | VALUE | |||||||
France – 13.3% | ||||||||||
AXA SA | Insurance | 125,123 | $ | 3,682,101 | ||||||
BNP Paribas SA | Banks | 35,345 | 2,732,418 | |||||||
Carrefour SA | Food & Staples Retailing | 355 | 8,500 | |||||||
Casino Guichard Perrachon SA | Food & Staples Retailing | 75,094 | 4,563,139 | |||||||
Cie de Saint-Gobain | Capital Goods | 322,225 | 17,813,673 | |||||||
Cie Generale des Etablissements Michelin | Automobiles & Components | 52,292 | 7,049,940 | |||||||
CNP Assurances | Insurance | 202,651 | 4,874,083 | |||||||
Credit Agricole SA | Banks | 923,550 | 16,169,660 | |||||||
Faurecia | Automobiles & Components | 57,059 | 3,157,103 | |||||||
Kering | Consumer Durables & Apparel | 54,578 | 19,014,684 | |||||||
Orange SA | Telecommunication Services | 411,479 | 6,898,605 | |||||||
Peugeot SA | Automobiles & Components | 755,153 | 16,190,575 | |||||||
Sanofi | Pharma, Biotech & Life Sciences | 323,856 | 30,821,028 | |||||||
STMicroelectronics NV | Semiconductors & Semiconductor Equipment | 477,178 | 8,118,219 | |||||||
|
| |||||||||
| 141,093,728 | ||||||||||
|
| |||||||||
Germany – 9.9% | ||||||||||
adidas AG | Consumer Durables & Apparel | 22,962 | 5,224,937 | |||||||
Allianz SE | Insurance | 89,203 | 18,930,670 | |||||||
Bayerische Motoren Werke AG | Automobiles & Components | 116,260 | 10,651,757 | |||||||
CECONOMY AG | Retailing | 516,121 | 5,781,425 | |||||||
Deutsche Lufthansa AG | Transportation | 380,824 | 8,160,424 | |||||||
Fraport AG Frankfurt Airport Services Worldwide | Transportation | 62,571 | 6,242,523 | |||||||
Innogy SE | Utilities | 185,137 | 7,745,546 | |||||||
Merck KGaA | Pharma, Biotech & Life Sciences | 145,767 | 15,957,143 | |||||||
Metro Wholesale & Food Specialist AG (a) | Food & Staples Retailing | 157,866 | 3,176,208 | |||||||
Siemens AG | Capital Goods | 130,293 | 17,627,381 | |||||||
Suedzucker AG | Food & Beverage | 175,125 | 3,722,699 | |||||||
Vonovia SE | Real Estate | 65,722 | 2,654,292 | |||||||
|
| |||||||||
| 105,875,005 | ||||||||||
|
| |||||||||
Hong Kong – 3.1% | ||||||||||
ASM Pacific Technology Ltd | Semiconductors & Semiconductor Equipment | 539,672 | 6,992,799 | |||||||
Great Eagle Holdings Ltd | Real Estate | 189,790 | 1,041,273 | |||||||
Hongkong Land Holdings Ltd | Real Estate | 281,634 | 2,117,888 | |||||||
Hysan Development Co Ltd | Real Estate | 160,208 | 775,384 | |||||||
Kerry Properties Ltd | Real Estate | 851,179 | 2,986,153 | |||||||
Wharf Holdings Ltd/The | Real Estate | 1,372,526 | 11,677,670 | |||||||
Wheelock & Co Ltd | Real Estate | 926,838 | 6,989,720 | |||||||
Xinyi Glass Holdings Ltd | Automobiles & Components | 684,955 | 708,621 | |||||||
|
| |||||||||
| 33,289,508 | ||||||||||
|
| |||||||||
30
DOMINI IMPACT INTERNATIONAL EQUITY FUND
PORTFOLIOOF INVESTMENTS (continued)
July 31, 2017
| COUNTRY/SECURITY | INDUSTRY | SHARES | VALUE | |||||||
Hungary – 0.4% | ||||||||||
Richter Gedeon Nyrt | Pharma, Biotech & Life Sciences | 150,532 | $ | 3,834,555 | ||||||
|
| |||||||||
| 3,834,555 | ||||||||||
|
| |||||||||
Indonesia – 0.5% | ||||||||||
Telekomunikasi Indonesia Persero Tbk PT | Telecommunication Services | 14,496,126 | 5,102,584 | |||||||
|
| |||||||||
| 5,102,584 | ||||||||||
|
| |||||||||
Ireland – 0.0% | ||||||||||
Irish Bank Resolution Corp Ltd/Old (a) (b) | Banks | 138,674 | 0 | |||||||
|
| |||||||||
| 0 | ||||||||||
|
| |||||||||
Israel – 0.1% | ||||||||||
Taro Pharmaceutical Industries Ltd (a) | Pharma, Biotech & Life Sciences | 13,404 | 1,532,479 | |||||||
|
| |||||||||
| 1,532,479 | ||||||||||
|
| |||||||||
Italy – 0.3% | ||||||||||
A2A SpA | Utilities | 1,604,257 | 2,719,862 | |||||||
|
| |||||||||
| 2,719,862 | ||||||||||
|
| |||||||||
Japan – 21.4% | ||||||||||
Asahi Glass Co Ltd | Capital Goods | 281,973 | 11,866,369 | |||||||
Astellas Pharma Inc | Pharma, Biotech & Life Sciences | 439,466 | 5,599,965 | |||||||
Brother Industries Ltd | Technology Hardware & Equipment | 225,445 | 5,753,698 | |||||||
Central Japan Railway Co | Transportation | 95,110 | 15,278,542 | |||||||
Dai Nippon Printing Co Ltd | Commercial & Professional Services | 845,134 | 9,308,368 | |||||||
Daiichi Sankyo Co Ltd | Pharma, Biotech & Life Sciences | 149,961 | 3,268,076 | |||||||
Ezaki Glico Co Ltd | Food & Beverage | 56,300 | 2,955,247 | |||||||
FUJIFILM Holdings Corp | Technology Hardware & Equipment | 20,044 | 735,222 | |||||||
GungHo Online Entertainment Inc | Software & Services | 620,655 | 1,673,878 | |||||||
Ibiden Co Ltd | Technology Hardware & Equipment | 280,099 | 4,856,959 | |||||||
K’s Holdings Corp | Retailing | 255,899 | 5,132,107 | |||||||
Medipal Holdings Corp | Health Care Equipment & Services | 227,876 | 4,167,948 | |||||||
Mitsubishi Gas Chemical Co Inc | Materials | 566,503 | 13,109,626 | |||||||
Mitsui Fudosan Co Ltd | Real Estate | 519,997 | 11,927,530 | |||||||
Mixi Inc | Software & Services | 149,602 | 8,218,328 | |||||||
Morinaga & Co Ltd/Japan | Food & Beverage | 28,768 | 1,645,448 | |||||||
MS&AD Insurance Group Holdings Inc | Insurance | 433,298 | 15,183,763 | |||||||
Nintendo Co Ltd | Software & Services | 6,406 | 2,172,921 | |||||||
Nippon Electric Glass Co Ltd | Technology Hardware & Equipment | 184,160 | 6,516,726 | |||||||
31
DOMINI IMPACT INTERNATIONAL EQUITY FUND
PORTFOLIOOF INVESTMENTS (continued)
July 31, 2017
| COUNTRY/SECURITY | INDUSTRY | SHARES | VALUE | |||||||
Japan (Continued) | ||||||||||
Nissan Motor Co Ltd | Automobiles & Components | 2,294,238 | $ | 22,756,549 | ||||||
Nisshin Seifun Group Inc | Food & Beverage | 98,025 | 1,607,505 | |||||||
Nomura Holdings Inc | Diversified Financials | 2,699,273 | 16,044,912 | |||||||
Nomura Real Estate Holdings Inc | Real Estate | 104,485 | 2,068,991 | |||||||
NTN Corp | Capital Goods | 5,300 | 24,702 | |||||||
ORIX Corp | Diversified Financials | 540,841 | 8,573,085 | |||||||
Rohm Co Ltd | Semiconductors & Semiconductor Equipment | 154,502 | 11,955,221 | |||||||
Seino Holdings Co Ltd | Transportation | 247,806 | 3,332,637 | |||||||
Shimamura Co Ltd | Retailing | 47,874 | 5,944,443 | |||||||
Tokyo Electron Ltd | Semiconductors & Semiconductor Equipment | 9,783 | 1,378,978 | |||||||
Toppan Printing Co Ltd | Commercial & Professional Services | 891,626 | 9,408,896 | |||||||
Toyo Seikan Group Holdings Ltd | Materials | 184,941 | 3,027,814 | |||||||
Yamada Denki Co Ltd | Retailing | 626,436 | 3,339,253 | |||||||
Yamazaki Baking Co Ltd | Food & Beverage | 85,600 | 1,715,176 | |||||||
Zeon Corp | Materials | 584,300 | 7,313,335 | |||||||
|
| |||||||||
| 227,862,218 | ||||||||||
|
| |||||||||
Mexico – 0.3% | ||||||||||
Arca Continental SAB de CV | Food & Beverage | 390,197 | 2,893,279 | |||||||
|
| |||||||||
| 2,893,279 | ||||||||||
|
| |||||||||
Netherlands – 3.7% | ||||||||||
ABN AMRO Group NV | Banks | 355,880 | 10,032,223 | |||||||
ING Groep NV | Banks | 834,956 | 15,568,501 | |||||||
NN Group NV | Insurance | 335,786 | 13,575,133 | |||||||
|
| |||||||||
| 39,175,857 | ||||||||||
|
| |||||||||
Norway – 1.2% | ||||||||||
Norsk Hydro ASA | Materials | 939,224 | 6,032,553 | |||||||
Subsea 7 SA | Energy | 441,851 | 6,509,157 | |||||||
|
| |||||||||
| 12,541,710 | ||||||||||
|
| |||||||||
Panama – 0.5% | ||||||||||
Copa Holdings SA Cl A | Transportation | 41,832 | 5,248,243 | |||||||
|
| |||||||||
| 5,248,243 | ||||||||||
|
| |||||||||
Singapore – 2.0% | ||||||||||
DBS Group Holdings Ltd | Banks | 1,085,088 | 17,285,295 | |||||||
Oversea-Chinese Banking Corp Ltd | Banks | 289,040 | 2,419,315 | |||||||
United Overseas Bank Ltd | Banks | 102,936 | 1,819,507 | |||||||
|
| |||||||||
| 21,524,117 | ||||||||||
|
| |||||||||
32
DOMINI IMPACT INTERNATIONAL EQUITY FUND
PORTFOLIOOF INVESTMENTS (continued)
July 31, 2017
| COUNTRY/SECURITY | INDUSTRY | SHARES | VALUE | |||||||
South Africa – 0.8% | ||||||||||
Mondi Ltd | Materials | 197,737 | $ | 5,128,610 | ||||||
Sappi Ltd | Materials | 157,688 | 1,043,505 | |||||||
Tiger Brands Ltd | Food & Beverage | 88,523 | 2,680,431 | |||||||
|
| |||||||||
| 8,852,546 | ||||||||||
|
| |||||||||
South Korea – 1.8% | ||||||||||
BNK Financial Group Inc | Banks | 86,977 | 878,281 | |||||||
Industrial Bank of Korea | Banks | 361,876 | 4,996,188 | |||||||
LG Corp | Capital Goods | 8,678 | 584,711 | |||||||
LG Display Co Ltd | Technology Hardware & Equipment | 152,592 | 4,315,747 | |||||||
LG Electronics Inc | Consumer Durables & Apparel | 66,210 | 3,970,056 | |||||||
LG Uplus Corp | Telecommunication Services | 330,092 | 4,911,337 | |||||||
|
| |||||||||
| 19,656,320 | ||||||||||
|
| |||||||||
Spain – 4.4% | ||||||||||
Aena SA | Transportation | 85,725 | 16,701,789 | |||||||
Banco Santander SA | Banks | 2,228,138 | 15,168,159 | |||||||
CaixaBank SA | Banks | 710,119 | 3,697,211 | |||||||
Mapfre SA | Insurance | 2,333,019 | 8,667,238 | |||||||
Telefonica SA | Telecommunication Services | 215,653 | 2,430,678 | |||||||
|
| |||||||||
| 46,665,075 | ||||||||||
|
| |||||||||
Sweden – 5.4% | ||||||||||
Alfa Laval AB | Capital Goods | 120,390 | 2,684,908 | |||||||
Electrolux AB Cl B | Consumer Durables & Apparel | 297,214 | 10,148,350 | |||||||
Holmen AB Cl B | Materials | 57,261 | 2,580,941 | |||||||
ICA Gruppen AB | Food & Staples Retailing | 46,228 | 1,849,337 | |||||||
Investor AB Cl B | Diversified Financials | 256,451 | 12,142,431 | |||||||
L E Lundbergforetagen AB Cl B | Diversified Financials | 6,510 | 511,445 | |||||||
Millicom International Cellular SA | Telecommunication Services | 32,206 | 2,014,604 | |||||||
Oriflame Holding AG | Household & Personal Products | 67,672 | 2,593,422 | |||||||
Sandvik AB | Capital Goods | 1,091,854 | 17,182,860 | |||||||
Svenska Cellulosa AB SCA Cl B | Materials | 707,628 | 5,848,021 | |||||||
|
| |||||||||
| 57,556,319 | ||||||||||
|
| |||||||||
Switzerland – 4.3% | ||||||||||
Adecco Group AG | Commercial & Professional Services | 268,021 | 20,500,544 | |||||||
Baloise Holding AG | Insurance | 74,299 | 11,966,694 | |||||||
Sika AG | Materials | 188 | 1,298,668 | |||||||
Swiss Life Holding AG | Insurance | 34,152 | 12,494,850 | |||||||
|
| |||||||||
| 46,260,756 | ||||||||||
|
| |||||||||
33
DOMINI IMPACT INTERNATIONAL EQUITY FUND
PORTFOLIOOF INVESTMENTS (continued)
July 31, 2017
| COUNTRY/SECURITY | INDUSTRY | SHARES | VALUE | |||||||
Taiwan – 1.4% | ||||||||||
Asustek Computer Inc | Technology Hardware & Equipment | 209,808 | $ | 1,952,478 | ||||||
Epistar Corp (a) | Semiconductors & Semiconductor Equipment | 2,859,891 | 2,737,191 | |||||||
Lite-On Technology Corp | Technology Hardware & Equipment | 1,356,686 | 2,194,834 | |||||||
TPK Holding Co Ltd (a) | Technology Hardware & Equipment | 927,031 | 3,116,148 | |||||||
United Microelectronics Corp | Semiconductors & Semiconductor Equipment | 925,062 | 425,837 | |||||||
Wistron Corp | Technology Hardware & Equipment | 4,966,506 | 5,016,590 | |||||||
|
| |||||||||
| 15,443,078 | ||||||||||
|
| |||||||||
Thailand – 0.1% | ||||||||||
Indorama Ventures PCL | Materials | 1,286,197 | 1,439,780 | |||||||
|
| |||||||||
| 1,439,780 | ||||||||||
|
| |||||||||
Turkey – 1.4% | ||||||||||
Turkiye Garanti Bankasi AS | Banks | 1,361,374 | 4,072,164 | |||||||
Turkiye Is Bankasi | Banks | 2,258,582 | 4,852,203 | |||||||
Turkiye Vakiflar Bankasi TAO | Banks | 1,677,175 | 3,350,875 | |||||||
Yapi ve Kredi Bankasi AS (a) | Banks | 1,741,094 | 2,243,289 | |||||||
|
| |||||||||
| 14,518,531 | ||||||||||
|
| |||||||||
United Kingdom – 12.7% | ||||||||||
3i Group PLC | Diversified Financials | 1,126,535 | 13,901,165 | |||||||
Auto Trader Group PLC | Software & Services | 857,665 | 4,327,199 | |||||||
Aviva PLC | Insurance | 44,068 | 313,143 | |||||||
Barratt Developments PLC | Consumer Durables & Apparel | 1,008,636 | 8,184,520 | |||||||
Berkeley Group Holdings PLC | Consumer Durables & Apparel | 35,264 | 1,625,301 | |||||||
BT Group PLC | Telecommunication Services | 2,826,257 | 11,680,996 | |||||||
Burberry Group PLC | Consumer Durables & Apparel | 99,124 | 2,235,937 | |||||||
Coca-Cola HBC AG | Food & Beverage | 331,990 | 10,031,602 | |||||||
Ferguson PLC | Capital Goods | 15,900 | 948,939 | |||||||
Firstgroup PLC (a) | Transportation | 1,063,350 | 1,619,157 | |||||||
Hammerson PLC | Real Estate | 200,443 | 1,518,139 | |||||||
Inchcape PLC | Retailing | 279,454 | 2,958,398 | |||||||
InterContinental Hotels Group PLC | Consumer Services | 109,869 | 6,215,332 | |||||||
J Sainsbury PLC | Food & Staples Retailing | 3,477,128 | 11,221,806 | |||||||
Land Securities Group PLC | Real Estate | 158,310 | 2,130,908 | |||||||
Persimmon PLC | Consumer Durables & Apparel | 144,634 | 4,774,582 | |||||||
Royal Mail PLC | Transportation | 897,548 | 4,769,811 | |||||||
34
DOMINI IMPACT INTERNATIONAL EQUITY FUND
PORTFOLIOOF INVESTMENTS (continued)
July 31, 2017
| COUNTRY/SECURITY | INDUSTRY | SHARES | VALUE | |||||||
United Kingdom (Continued) | ||||||||||
Segro PLC | Real Estate | 505,371 | $ | 3,511,168 | ||||||
Taylor Wimpey PLC | Consumer Durables & Apparel | 1,657,984 | 4,161,769 | |||||||
Unilever PLC | Household & Personal Products | 433,502 | 24,697,688 | |||||||
Wm Morrison Supermarkets PLC | Food & Staples Retailing | 4,372,896 | 13,859,076 | |||||||
|
| |||||||||
| 134,686,636 | ||||||||||
|
| |||||||||
United States – 0.6% | ||||||||||
Core Laboratories NV | Energy | 49,063 | 4,932,303 | |||||||
Ensco PLC Cl A | Energy | 177,634 | 939,684 | |||||||
|
| |||||||||
| 5,871,987 | ||||||||||
|
| |||||||||
| Total Investments – 97.8% (Cost $898,817,527) (c) | 1,041,162,926 | |||||||||
| Other Assets, less liabilities – 2.2% | 23,363,279 | |||||||||
|
| |||||||||
| Net Assets – 100.0% | $1,064,526,205 | |||||||||
|
| |||||||||
(a) Non-income producing security.
(b) Securities for which there are no such quotations or valuations are valued at fair value as determined in good faith by or at the direction of the Fund’s Board of Trustees.
(c) The aggregate cost for federal income tax purposes is $914,657,413. The aggregate gross unrealized appreciation is $142,254,924 and the aggregate gross unrealized depreciation is $15,749,411, resulting in net unrealized appreciation of $126,505,513.
SEE NOTES TO FINANCIAL STATEMENTS
35
Performance Commentary (Unaudited)
The Domini Impact Bond Fund Investor shares returned -0.32% for the year ending July 31, 2017, outperforming the Bloomberg Barclays U.S. Aggregate Bond Index, which returned -0.51% during the period.
The Fund’s allocations to high yield and to bank loans were the top contributors to performance during the period, driven primarily by positioning within the industrials segment.
The Fund’s positioning within securitized sectors was also positive. Within Mortgage Backed Securities (“MBS”), allocations to Agency Credit Risk Transfer securities and Fannie Mae Delegated Underwriting and Servicing Bonds (“DUS”) were additive. An allocation to high quality Commercial Mortgage Backed Securities (“CMBS”) was also positive.
The Fund’s positioning within the investment-grade credit sector was a modest positive contributor overall to relative outperformance during the period. An overweight to taxable municipals and an overweight to, and security selection within, financials benefitted results. However, this was partially offset by underweight allocations to industrials and utilities.
The Fund’s opportunistic duration and yield curve positioning was also slightly additive to relative performance during the period. The Fund was positioned for an increase in inflation expectations, which also contributed positively to performance during the period.
During the period, the Fund utilized derivatives to help the implementation of the overall investment strategy, including credit default swap indices, interest rate swaps, CPI swaps, currency futures, and currency forwards. The Fund’s position in below investment grade credit default swaps, used to manage risk exposures, detracted from relative performance. Use of CPI swaps in implementing inflation positioning was additive.
At the end of the period, the Fund was positioned with an underweight to governments in favor of being overweight to high quality securitized sectors, like MBS and CMBS, as well as investment grade and below investment grade credit sectors. Within credit, the Fund maintained an allocation to taxable municipals and to high yield and bank loans. Domini excludes U.S. Treasuries from the portfolio because they help to finance the maintenance of our nuclear weapons arsenal.
All corporate debt must meet Domini’s Impact Investment Standards. For non-corporate issuers, Domini seeks to identify investments with a positive impact on communities across multiple themes, including affordable housing, education and climate mitigation. As of July 31, securities Domini characterizes as “high impact” represented 58% of the Fund’s total portfolio, including two
36
bonds totaling more than $300,000 with Kaiser Foundation Hospitals, a nonprofit hospital focusing on preventive healthcare, with financial assistance programs for low-income patients. One of the bonds will be used to finance green projects. Kaiser is working to become “carbon net positive” by eliminating or offsetting all of its greenhouse gas emissions. Kaiser is also working to support sustainable agriculture by purchasing food from local producers that use sustainable practices, like avoiding the overuse of antibiotics. The hospital also plans to cut its water use and recycle or compost all of its non-hazardous waste.
PORTFOLIO COMPOSITION (% OF NET ASSETS) (Unaudited)
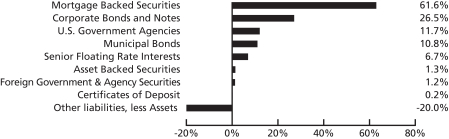
During periods of rising interest rates, bond funds can lose value. Some of the Fund’s community development investments may be unrated and may carry greater risks than the Fund’s other holdings. The Fund currently holds a large percentage of its portfolio in mortgage-backed securities. During periods of falling interest rates these securities may prepay the principal due, which may lower the Fund’s return by causing it to reinvest at lower interest rates.
Investments in derivatives can be volatile. Potential risks include currency risk, leverage risk (the risk that small market movements may result in large changes in the value of an investment), liquidity risk, index risk, pricing risk, and counterparty risk (the risk that the counterparty may be unwilling or unable to honor its obligations). TBA (To Be Announced) securities involve the risk that the security the Fund buys will lose value prior to its delivery. There also is the risk that the security will not be issued or that the other party to the transaction will not meet its obligation, which can adversely affect the Fund’s results.
The reduction or withdrawal of historical financial market support activities by the U.S. Government and Federal Reserve, or other governments/central banks could negatively impact financial markets generally, and increase market, liquidity and interest rate risks which could adversely affect the Fund’s returns.
37
| AVERAGE ANNUAL TOTAL RETURNS (Unaudited) | Investor shares | Bloomberg Barclays | ||||
| As of 7/31/17 | 1 Year | -0.32% | -0.51% | |||
| 5 Year | 1.53% | 2.02% | ||||
| 10 Year | 3.63% | 4.44% | ||||
| Since Inception (6/1/00) | 4.27% | 5.21% | ||||
COMPARISON OF $10,000 INVESTMENT IN THE DOMINI IMPACT BOND FUND INVESTOR SHARES AND BBUSA (Unaudited)

Past performance is no guarantee of future results. The Fund’s returns quoted above represent past performance after all expenses. The returns reflect any applicable expense waivers in effect during the periods shown. Without such waivers, Fund performance would be lower. Investment return, principal value, and yield will fluctuate. Your shares, when redeemed, may be worth more or less than their original cost. Call 1-800-582-6757 or visit www.domini.com for performance information current to the most recent month-end, which may be lower or higher. A 2.00% fee applies on sales/exchanges made less than 30 days after purchase/exchange, with certain exceptions. Quoted performance data does not reflect the deduction of this fee, which would reduce the performance quoted. See the Fund’s prospectus for further information.
Per the prospectus supplement dated May 1, 2017, the Fund’s gross and net annual operating expenses totaled 1.11% and 0.85% of net assets, respectively. Until 11/30/17, the Fund’s Manager has contractually agreed to limit certain ordinary Investor share expenses to 0.95% of its average daily net assets per annum absent an earlier modification by the Fund’s Board. The Fund’s total return would have been lower without this limit.
The table and the graph do not reflect the deduction of fees and taxes that a shareholder would pay on Fund distributions or the redemption of Fund shares. Total return for the Domini Impact Bond Fund is based on the Fund’s net asset values and assumes all dividend and capital gains were reinvested. An investment in the Fund is not a bank deposit and is not insured. You may lose money. The Fund is subject to credit, interest rate, liquidity and market risks.
The Bloomberg Barclays U.S. Aggregate Bond Index is an index representing securities that are U.S. domestic, taxable, and dollar denominated and covering the U.S. investment grade fixed rate bond market, with index components for government and corporate securities and asset-backed securities. You cannot invest directly in an index.
38
| AVERAGE ANNUAL TOTAL RETURNS (Unaudited) | Institutional shares | Bloomberg Barclays | ||||
| As of 7/31/17 | 1 Year | -0.13% | -0.51% | |||
| 5 Year | 1.76% | 2.02% | ||||
| 10 Year* | 3.63% | 4.44% | ||||
| Since Inception (6/1/00)* | 4.27% | 5.21% | ||||
COMPARISON OF $500,000 INVESTMENT IN THE DOMINI IMPACT BOND FUND INSTITUTIONAL SHARES AND BBUSA* (Unaudited)
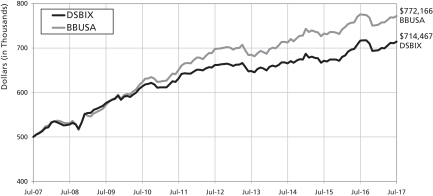
Past performance is no guarantee of future results. The Fund’s returns quoted above represent past performance after all expenses. The returns reflect any applicable expense waivers in effect during the periods shown. Without such waivers, Fund performance would be lower. Investment return, principal value, and yield will fluctuate. Your shares, when redeemed, may be worth more or less than their original cost. Call 1-800-498-1351 or visit www.domini.com for performance information current to the most recent month-end, which may be lower or higher. A 2.00% fee applies on sales/exchanges made less than 30 days after purchase/exchange, with certain exceptions. Quoted performance data does not reflect the deduction of this fee, which would reduce the performance quoted. See the Fund’s prospectus for further information.
Per the prospectus supplement dated May 1, 2017, the Fund’s gross and net operating expenses totaled 1.14% and 0.55% of net assets, respectively. Until 11/30/17, the Fund’s Manager has contractually agreed to limit certain ordinary Institutional share expenses to 0.65% of its average daily net assets per annum absent an earlier modification by the Fund’s Board. The Fund’s total return would have been lower without this limit.
The table and the graph do not reflect the deduction of fees and taxes that a shareholder would pay on Fund distributions or the redemption of Fund shares. Total return for the Domini Impact Bond Fund is based on the Fund’s net asset values and assumes all dividend and capital gains were reinvested. An investment in the Fund is not a bank deposit and is not insured. You may lose money. The Fund is subject to credit, interest rate, liquidity and market risks.
The Bloomberg Barclays U.S. Aggregate Bond Index is an index representing securities that are U.S. domestic, taxable, and dollar denominated and covering the U.S. investment grade fixed rate bond market, with index components for government and corporate securities and asset-backed securities. You cannot invest directly in an index.
*Institutional shares were not offered prior to November 30, 2011. All performance information for time periods beginning prior to November 30, 2011 is the performance of the Investor shares. This performance has not been adjusted to reflect the expenses of the Institutional shares.
39
DOMINI IMPACT BOND FUND
PORTFOLIOOF INVESTMENTS
July 31, 2017
| Principal Amount | Value | |||||||
| Mortgage Backed Securities – 61.6% | ||||||||
Agency Collateralized Mortgage Obligations – 1.4% |
| |||||||
Fannie Mae Connecticut Avenue Securities | ||||||||
4.782%, VR, 7/25/2029 | $ | 120,000 | $ | 129,206 | ||||
5.582%, VR, 5/25/2029 | 235,000 | 262,144 | ||||||
FNR 2012 17 BC, 3.500%, 3/25/2027 | 368,000 | 385,518 | ||||||
FHR 3877 LM, 3.500%, 6/15/2026 | 780,000 | 817,413 | ||||||
FREMF Mortgage Trust | ||||||||
144A, 3.880%, VR, 2/25/2024 (e) | 100,000 | 101,356 | ||||||
144A, 3.980%, VR, 3/25/2027 (e) | 70,000 | 71,651 | ||||||
144A, 4.214%, VR, 5/25/2027 (b) (e) | 155,000 | 159,360 | ||||||
144A, 3.971%, VR, 7/25/2049 (e) | 175,000 | 178,204 | ||||||
|
| |||||||
| 2,104,852 | ||||||||
|
| |||||||
Commercial Mortgage Backed Securities – 7.0% |
| |||||||
Barclays Commercial Mortgage S, 3.674%, 2/15/2050 | 213,000 | 223,442 | ||||||
BWAY 2013-1515 Mortgage Trust 144A, 2.809%, 3/10/2033 (e) | 172,819 | 175,644 | ||||||
Citigroup Commercial Mortgage, 3.717%, 9/15/2048 | 384,000 | 406,860 | ||||||
Commercial Mortgage Trust | ||||||||
3.350%, 2/10/2048 | 326,000 | 333,684 | ||||||
3.644%, 12/10/2047 | 325,000 | 339,565 | ||||||
144A, 3.424%, 3/10/2031 (e) | 640,000 | 671,469 | ||||||
144A, 3.726%, 3/10/2031 (e) | 644,000 | 668,517 | ||||||
CSAIL Commercial Mortgage Trust | ||||||||
3.505%, 4/15/2050 | 394,000 | 408,961 | ||||||
3.808%, 11/15/2048 | 388,000 | 408,078 | ||||||
GS Mortgage Securities Trust 144A, | 395,000 | 395,000 | ||||||
Hudson Yards 144A, 2.835%, 8/10/2038 (e) | 1,000,000 | 981,821 | ||||||
Madison Avenue Trust 144A, 3.355%, VR, 8/15/2034 (c) (e) | 729,000 | 739,935 | ||||||
Morgan Stanley BAML Trust | ||||||||
2.918%, 2/15/2046 | 360,000 | 366,298 | ||||||
3.102%, 5/15/2046 | 300,000 | 307,732 | ||||||
3.526%, 12/15/2047 | 180,167 | 187,246 | ||||||
3.892%, 6/15/2047 | 300,000 | 319,216 | ||||||
4.051%, 4/15/2047 | 300,000 | 321,814 | ||||||
4.083%, VR, 7/15/2046 | 150,000 | 162,274 | ||||||
4.259%, VR, 10/15/2046 | 300,000 | 326,091 | ||||||
OBP Depositor LLC Trust 144A, 4.646%, 7/15/2045 (e) | 806,000 | 858,979 | ||||||
One Market Plaza Trust 144A, 3.614%, 2/10/2032 (e) | 710,000 | 741,971 | ||||||
Park Avenue Trust 144A, 3.508%, 6/5/2037 (e) | 712,000 | 736,479 | ||||||
Wells Fargo Commercial Mortgage, 3.718%, 12/15/2048 | 318,000 | 334,553 | ||||||
|
| |||||||
| 10,415,629 | ||||||||
|
| |||||||
Federal Home Loan Mortgage Corporation – 12.8% |
| |||||||
849167, 2.904%, VR, 10/1/2043 (d) | 436,026 | 445,902 | ||||||
A12413, 5.000%, 8/1/2033 (d) | 29,367 | 32,217 | ||||||
A37619, 4.500%, 9/1/2035 (d) | 210,496 | 226,640 | ||||||
40
DOMINI IMPACT BOND FUND
PORTFOLIOOF INVESTMENTS (continued)
July 31, 2017
| Principal Amount | Value | |||||||
Federal Home Loan Mortgage Corporation (Continued) | ||||||||
A87874, 4.000%, 8/1/2039 (d) | $ | 78,852 | $ | 83,818 | ||||
A89148, 4.000%, 10/1/2039 (d) | 122,891 | 130,015 | ||||||
A89384, 4.000%, 10/1/2039 (d) | 155,740 | 164,767 | ||||||
A89729, 4.000%, 11/1/2039 (d) | 74,391 | 78,703 | ||||||
A93101, 5.000%, 7/1/2040 (d) | 127,040 | 139,655 | ||||||
A93996, 4.500%, 9/1/2040 (d) | 61,884 | 66,643 | ||||||
A94362, 4.000%, 10/1/2040 (d) | 189,348 | 201,807 | ||||||
A94742, 4.000%, 11/1/2040 (d) | 31,628 | 33,690 | ||||||
A95084, 4.000%, 11/1/2040 (d) | 28,229 | 29,863 | ||||||
A95085, 4.000%, 11/1/2040 (d) | 246,925 | 261,218 | ||||||
A95796, 4.000%, 12/1/2040 (d) | 116,467 | 123,202 | ||||||
A97047, 4.500%, 2/1/2041 (d) | 122,606 | 132,290 | ||||||
FHR 3806 L, 3.500%, 2/15/2026 | 847,000 | 891,396 | ||||||
FHR 3800 CB, 3.500%, 2/15/2026 | 383,000 | 404,451 | ||||||
FHR 3768 CB, 3.500%, 12/15/2025 | 343,000 | 361,650 | ||||||
G01779, 5.000%, 4/1/2035 (d) | 37,889 | 41,629 | ||||||
G01828, 4.500%, 4/1/2035 (d) | 178,775 | 192,570 | ||||||
G01837, 5.000%, 7/1/2035 (d) | 252,240 | 276,914 | ||||||
G01838, 5.000%, 7/1/2035 (d) | 44,146 | 48,544 | ||||||
G02424, 5.500%, 12/1/2036 (d) | 174,683 | 195,351 | ||||||
G04997, 5.000%, 1/1/2037 (d) | 153,230 | 167,316 | ||||||
G05052, 5.000%, 10/1/2033 (d) | 16,628 | 18,317 | ||||||
G06079, 6.000%, 7/1/2039 (d) | 156,099 | 177,319 | ||||||
G06990, 5.500%, 8/1/2040 (d) | 235,400 | 262,486 | ||||||
G08347, 4.500%, 6/1/2039 (d) | 382,757 | 412,015 | ||||||
G08499, 3.000%, 7/1/2042 (d) | 88,196 | 88,860 | ||||||
G08741, 3.000%, 1/1/2047 | 4,083,137 | 4,095,195 | ||||||
G14599, 2.500%, 11/1/2027 (d) | 246,992 | 250,807 | ||||||
G30614, 3.500%, 12/1/2032 (d) | 365,119 | 382,173 | ||||||
J17791, 3.000%, 1/1/2027 (d) | 342,208 | 352,458 | ||||||
J20118, 2.500%, 8/1/2027 (d) | 87,948 | 89,306 | ||||||
Q00291, 5.000%, 4/1/2041 (d) | 107,037 | 117,125 | ||||||
Q01807, 4.500%, 7/1/2036 (d) | 180,354 | 194,289 | ||||||
Q06160, 4.000%, 2/1/2037 (d) | 70,163 | 73,969 | ||||||
Q17103, 4.000%, 6/1/2041 (d) | 17,048 | 17,996 | ||||||
Q33602, 3.000%, 5/1/2045 (d) | 680,702 | 683,855 | ||||||
Z40004, 6.000%, 8/1/2036 (d) | 25,834 | 29,219 | ||||||
FHLMC TBA 30 Yr, 3.500%, 8/14/2047 (c) | 5,100,000 | 5,254,594 | ||||||
FHLMC TBA 30 Yr, 4.000%, 8/14/2047 (c) | 1,800,000 | 1,896,047 | ||||||
|
| |||||||
| 19,126,281 | ||||||||
|
| |||||||
Federal National Mortgage Association – 35.3% |
| |||||||
190370, 6.000%, 6/1/2036 (d) | 121,204 | 138,284 | ||||||
469829, 2.720%, 12/1/2018 (d) | 1,624,890 | 1,643,013 | ||||||
469879, 3.220%, 12/1/2021 (d) | 994,969 | 1,040,372 | ||||||
471333, 3.120%, 8/1/2022 (d) | 1,831,144 | 1,880,152 | ||||||
471478, 2.610%, 8/1/2022 (d) | 1,364,213 | 1,395,322 | ||||||
745044, 4.500%, 8/1/2035 (d) | 52,587 | 56,743 | ||||||
41
DOMINI IMPACT BOND FUND
PORTFOLIOOF INVESTMENTS (continued)
July 31, 2017
| Principal Amount | Value | |||||||
Federal National Mortgage Association (Continued) | ||||||||
745327, 6.000%, 3/1/2036 (d) | $ | 336,101 | $ | 383,156 | ||||
889529, 6.000%, 3/1/2038 (d) | 57,738 | 65,753 | ||||||
890248, 6.000%, 8/1/2037 (d) | 30,140 | 34,542 | ||||||
930672, 4.500%, 3/1/2039 (d) | 191,021 | 207,554 | ||||||
932441, 4.000%, 1/1/2040 (d) | 578,647 | 612,384 | ||||||
995082, 5.500%, 8/1/2037 (d) | 107,560 | 120,423 | ||||||
995243, 4.500%, 8/1/2038 (d) | 142,404 | 153,314 | ||||||
AA9846, 4.000%, 8/1/2039 (d) | 87,924 | 93,065 | ||||||
AB1343, 4.500%, 8/1/2040 (d) | 175,541 | 190,829 | ||||||
AB1763, 4.000%, 11/1/2030 (d) | 35,601 | 37,821 | ||||||
AB4168, 3.500%, 1/1/2032 (d) | 316,643 | 331,499 | ||||||
AB6472, 2.000%, 10/1/2027 (d) | 320,807 | 320,133 | ||||||
AC1877, 4.500%, 9/1/2039 (d) | 80,020 | 86,393 | ||||||
AC2817, 4.000%, 10/1/2039 (d) | 47,289 | 50,039 | ||||||
AC5401, 5.000%, 10/1/2039 (d) | 8,510 | 9,306 | ||||||
AC9564, 4.500%, 2/1/2040 (d) | 73,799 | 80,188 | ||||||
AD1649, 4.000%, 3/1/2040 (d) | 84,609 | 89,530 | ||||||
AD8033, 4.000%, 8/1/2040 (d) | 29,659 | 31,378 | ||||||
AE0215, 4.000%, 12/1/2039 (d) | 74,038 | 78,326 | ||||||
AE0216, 4.000%, 8/1/2040 (d) | 167,796 | 177,553 | ||||||
AE0624, 4.000%, 11/1/2040 (d) | 73,112 | 77,310 | ||||||
AE0625, 4.000%, 12/1/2040 (d) | 98,983 | 106,003 | ||||||
AE4113, 4.000%, 10/1/2040 (d) | 55,787 | 59,130 | ||||||
AE4192, 4.000%, 10/1/2040 (d) | 255,627 | 272,257 | ||||||
AE5143, 4.000%, 11/1/2040 (d) | 41,123 | 43,518 | ||||||
AI7951, 4.500%, 8/1/2036 (d) | 73,576 | 79,417 | ||||||
AJ5974, 4.000%, 12/1/2036 (d) | 57,090 | 60,543 | ||||||
AL0005, 4.500%, 1/1/2041 (d) | 68,896 | 74,601 | ||||||
AL0049, 6.000%, 12/1/2035 (d) | 60,248 | 68,922 | ||||||
AL1627, 4.500%, 9/1/2041 (d) | 130,273 | 140,756 | ||||||
AM3278, 2.850%, 5/1/2023 (d) | 707,240 | 731,167 | ||||||
AM4796, 3.300%, 12/1/2023 (d) | 742,760 | 779,614 | ||||||
AM5146, 3.470%, 1/1/2024 (d) | 559,096 | 592,391 | ||||||
AM5197, 4.200%, 1/1/2030 (d) | 1,170,909 | 1,280,260 | ||||||
AM6266, 3.580%, 7/1/2030 (d) | 968,415 | 1,000,804 | ||||||
AM7507, 3.080%, 12/1/2024 (d) | 1,052,011 | 1,089,594 | ||||||
AM7598, 3.070%, 12/1/2024 (d) | 1,397,992 | 1,447,075 | ||||||
AM7812, 3.100%, 1/1/2027 | 471,076 | 483,079 | ||||||
AM8148, 2.680%, 3/1/2027 (d) | 1,000,000 | 995,014 | ||||||
AM8659, 2.880%, 4/1/2031 (d) | 1,262,694 | 1,232,346 | ||||||
AM9154, 3.180%, 6/1/2030 (d) | 1,062,076 | 1,082,228 | ||||||
AM9239, 3.030%, 6/1/2025 (d) | 973,661 | 1,002,662 | ||||||
AN1767, 2.980%, 6/1/2031 (d) | 981,696 | 977,634 | ||||||
AN1840, 2.450%, 6/1/2026 (d) | 1,497,757 | 1,482,207 | ||||||
AN2787, 2.600%, 9/1/2028 (d) | 1,150,000 | 1,124,841 | ||||||
AN2791, 2.440%, 9/1/2026 (d) | 1,132,226 | 1,118,847 | ||||||
AN4301, 3.150%, 1/1/2027 | 2,109,700 | 2,165,172 | ||||||
AP9592, 3.500%, 10/1/2032 (d) | 262,776 | 275,167 | ||||||
42
DOMINI IMPACT BOND FUND
PORTFOLIOOF INVESTMENTS (continued)
July 31, 2017
| Principal Amount | Value | |||||||
Federal National Mortgage Association (Continued) | ||||||||
AR1524, 2.000%, 1/1/2028 (d) | $ | 251,577 | $ | 248,501 | ||||
AR9198, 3.000%, 3/1/2043 (d) | 799,933 | 805,822 | ||||||
AS3608, 2.500%, 12/1/2043 (d) | 367,859 | 356,945 | ||||||
AS8449, 2.500%, 12/1/2031 | 43,691 | 44,096 | ||||||
AW4685, 2.655%, VR, 5/1/2044 (d) | 144,967 | 148,659 | ||||||
AY3370, 2.500%, 4/1/2045 | 280,142 | 271,078 | ||||||
BC1171, 3.500%, 6/1/2046 | 2,348,605 | 2,420,366 | ||||||
BE1416, 2.500%, 11/1/2031 | 209,439 | 211,372 | ||||||
MA0639, 4.000%, 2/1/2041 (d) | 137,105 | 144,975 | ||||||
MA0919, 3.500%, 12/1/2031 (d) | 18,670 | 19,550 | ||||||
MA0949, 3.500%, 1/1/2032 (d) | 183,004 | 191,618 | ||||||
MA1630, 4.000%, 10/1/2033 (d) | 195,590 | 207,927 | ||||||
MA1931, 2.500%, 6/1/2024 | 634,711 | 643,830 | ||||||
FNMA TBA 30 Yr, 3.500%, 8/14/2047 (c) | 13,321,000 | 13,715,426 | ||||||
FNMA TBA 15 YR, 3.000%, 8/16/2032 (c) | 2,600,000 | 2,674,648 | ||||||
FNMA TBA 30 Yr, 4.000%, 8/14/2047 (c) | 1,300,000 | 1,368,707 | ||||||
|
| |||||||
| 52,623,151 | ||||||||
|
| |||||||
Government National Mortgage Association – 5.1% |
| |||||||
GNMA II TBA 30 Yr, 3.500%, 8/21/2047 (c) | 3,100,000 | 3,221,336 | ||||||
GNMA II TBA 30 Yr, 3.000%, 8/21/2047 (c) | 3,300,000 | 3,348,211 | ||||||
GNMA II TBA 30 Yr, 4.500%, 8/21/2047 (c) | 900,000 | 955,828 | ||||||
|
| |||||||
| 7,525,375 | ||||||||
|
| |||||||
Total Mortgage Backed Securities | 91,795,288 | |||||||
|
| |||||||
| Corporate Bonds and Notes – 26.5% | ||||||||
Communications – 3.3% |
| |||||||
AT&T Inc | ||||||||
1.898%, VR, 3/11/2019 | 525,000 | 528,142 | ||||||
3.950%, 1/15/2025 | 445,000 | 456,065 | ||||||
4.750%, 5/15/2046 | 65,000 | 62,657 | ||||||
CBS Corp, 2.900%, 1/15/2027 | 400,000 | 382,825 | ||||||
Charter Communications Operating LLC / Charter Communications Operating Capital senior secured note, 6.484%, 10/23/2045 | 300,000 | 354,876 | ||||||
Cox Communications Inc | ||||||||
144A, 3.850%, 2/1/2025 (e) | 175,000 | 177,351 | ||||||
144A, 4.800%, 2/1/2035 (e) | 200,000 | 198,186 | ||||||
Gray Television Inc 144A, 5.875%, 7/15/2026 (e) | 200,000 | 207,500 | ||||||
Interpublic Group of Cos Inc/The, 4.200%, 4/15/2024 | 250,000 | 263,895 | ||||||
SFR Group SA senior secured note 144A, 7.375%, 5/1/2026 (e) | 200,000 | 217,250 | ||||||
Sprint Communications Inc 144A, 7.000%, 3/1/2020 (e) | 375,000 | 410,625 | ||||||
Time Warner Cable LLC senior secured note | ||||||||
6.750%, 7/1/2018 | 275,000 | 287,120 | ||||||
7.300%, 7/1/2038 | 175,000 | 223,732 | ||||||
43
DOMINI IMPACT BOND FUND
PORTFOLIOOF INVESTMENTS (continued)
July 31, 2017
| Principal Amount | Value | |||||||
Communications (Continued) | ||||||||
Time Warner Inc, 3.600%, 7/15/2025 | $ | 325,000 | $ | 328,959 | ||||
Verizon Communications Inc, 5.150%, 9/15/2023 | 426,000 | 474,588 | ||||||
Viacom Inc | ||||||||
6.875%, 4/30/2036 | 250,000 | 281,924 | ||||||
6.250%, VR, 2/28/2057 | 60,000 | 61,766 | ||||||
|
| |||||||
| 4,917,461 | ||||||||
|
| |||||||
Consumer Discretionary – 2.7% |
| |||||||
ACCO Brands Corp 144A, 5.250%, 12/15/2024 (e) | 130,000 | 135,525 | ||||||
Avis Budget Car Rental LLC / Avis Budget Finance Inc 144A, 6.375%, 4/1/2024 (e) | 295,000 | 304,403 | ||||||
Delphi Automotive PLC | ||||||||
3.150%, 11/19/2020 | 240,000 | 246,104 | ||||||
4.150%, 3/15/2024 | 401,000 | 424,539 | ||||||
ERAC USA Finance LLC 144A, 3.850%, 11/15/2024 (e) | 500,000 | 518,155 | ||||||
Hertz Corp/The 144A, 5.500%, 10/15/2024 (e) | 125,000 | 102,500 | ||||||
Home Depot Inc/The, 5.950%, 4/1/2041 | 420,000 | 552,304 | ||||||
Lear Corp, 4.750%, 1/15/2023 | 173,000 | 179,096 | ||||||
Lennar Corp, 4.125%, 1/15/2022 | 245,000 | 253,114 | ||||||
Marriott International Inc/MD, 2.875%, 3/1/2021 | 500,000 | 508,747 | ||||||
Northeastern University, 5.285%, 3/1/2032 | 100,000 | 108,831 | ||||||
O’Reilly Automotive Inc | ||||||||
3.800%, 9/1/2022 | 155,000 | 162,588 | ||||||
3.850%, 6/15/2023 | 550,000 | 576,775 | ||||||
|
| |||||||
| 4,072,681 | ||||||||
|
| |||||||
Consumer Staples – 0.7% |
| |||||||
JM Smucker Co/The, 4.250%, 3/15/2035 | 380,000 | 399,631 | ||||||
TreeHouse Foods Inc 144A, 6.000%, 2/15/2024 (e) | 530,000 | 571,075 | ||||||
|
| |||||||
| 970,706 | ||||||||
|
| |||||||
Financials – 11.8% |
| |||||||
AerCap Ireland Capital DAC / AerCap Global Aviation Trust, 3.500%, 5/26/2022 | 450,000 | 464,275 | ||||||
AIA Group Ltd 144A, 4.500%, 3/16/2046 (e) | 325,000 | 348,115 | ||||||
Air Lease Corp, 3.875%, 4/1/2021 | 450,000 | 471,675 | ||||||
American Express Credit Corp, 1.587%, VR, 9/22/2017 | 500,000 | 500,226 | ||||||
American Tower Corp, 5.000%, 2/15/2024 | 362,000 | 401,360 | ||||||
Aon PLC, 4.750%, 5/15/2045 | 225,000 | 244,761 | ||||||
AXA SA subordinated note, 8.600%, 12/15/2030 | 400,000 | 571,000 | ||||||
Boston Properties LP, 3.650%, 2/1/2026 | 430,000 | 441,783 | ||||||
BPCE SA | 500,000 | 501,925 | ||||||
144A, 4.875%, 4/1/2026 (e) | 500,000 | 532,979 | ||||||
Brandywine Operating Partnership LP, 4.550%, 10/1/2029 | 725,000 | 737,213 | ||||||
Capital One Financial Corp subordinated note | 80,000 | 78,693 | ||||||
4.200%, 10/29/2025 | 155,000 | 158,253 | ||||||
44
DOMINI IMPACT BOND FUND
PORTFOLIOOF INVESTMENTS (continued)
July 31, 2017
| Principal Amount | Value | |||||||
Financials (Continued) | ||||||||
Cooperatieve Rabobank UA, 3.950%, 11/9/2022 | $ | 375,000 | $ | 395,187 | ||||
Credit Agricole SA/London 144A, 4.125%, 1/10/2027 (e) | 510,000 | 533,109 | ||||||
Crown Castle International Corp, 3.700%, 6/15/2026 | 300,000 | 304,478 | ||||||
Discover Financial Services, 3.750%, 3/4/2025 | 325,000 | 326,914 | ||||||
Duke Realty LP | 200,000 | 206,159 | ||||||
4.375%, 6/15/2022 | 250,000 | 268,534 | ||||||
Fifth Third Bancorp subordinated note, 8.250%, 3/1/2038 | 425,000 | 637,011 | ||||||
Hartford Financial Services Group Inc/The junior secured note, | 275,000 | 288,750 | ||||||
Huntington Bancshares Inc/OH | 425,000 | 435,881 | ||||||
1.700%, 2/26/2018 | 380,000 | 380,229 | ||||||
ING Bank NV 144A, 2.000%, 11/26/2018 (e) | 500,000 | 501,222 | ||||||
Kimco Realty Corp, 3.400%, 11/1/2022 | 160,000 | 164,855 | ||||||
Liberty Property LP, 3.250%, 10/1/2026 | 165,000 | 161,559 | ||||||
Marsh & McLennan Cos Inc, 3.300%, 3/14/2023 | 100,000 | 103,201 | ||||||
Metropolitan Life Global Funding I 144A, 2.300%, 4/10/2019 (e) | 500,000 | 505,142 | ||||||
Morgan Stanley subordinated note | 210,000 | 214,250 | ||||||
5.000%, 11/24/2025 | 250,000 | 273,561 | ||||||
National City Corp subordinated note, 6.875%, 5/15/2019 | 275,000 | 298,747 | ||||||
Nuveen Finance LLC 144A, 4.125%, 11/1/2024 (e) | 160,000 | 168,755 | ||||||
Regency Centers LP, 3.750%, 6/15/2024 | 300,000 | 306,965 | ||||||
Regions Financial Corp, 3.200%, 2/8/2021 | 500,000 | 512,862 | ||||||
Reinsurance Group of America Inc | 250,000 | 255,679 | ||||||
4.700%, 9/15/2023 | 164,000 | 178,413 | ||||||
Santander UK PLC subordinated note 144A, 5.000%, 11/7/2023 (e) | 650,000 | 705,000 | ||||||
Standard Chartered PLC subordinated note 144A, 5.700%, 3/26/2044 (e) | 250,000 | 292,740 | ||||||
Swedbank AB | 650,000 | 652,335 | ||||||
144A, 2.800%, 3/14/2022 (e) | 250,000 | 253,882 | ||||||
Total System Services Inc, 3.800%, 4/1/2021 | 600,000 | 626,211 | ||||||
Unum Group, 3.000%, 5/15/2021 | 180,000 | 182,117 | ||||||
US Bancorp subordinated note, 3.600%, 9/11/2024 | 493,000 | 514,062 | ||||||
Ventas Realty LP, 3.500%, 2/1/2025 | 500,000 | 502,438 | ||||||
Vornado Realty LP, 2.500%, 6/30/2019 | 325,000 | 328,100 | ||||||
Voya Financial Inc, 5.650%, VR, 5/15/2053 | 130,000 | 139,750 | ||||||
Welltower Inc, 5.250%, 1/15/2022 | 400,000 | 442,127 | ||||||
|
| |||||||
| 17,512,483 | ||||||||
|
| |||||||
45
DOMINI IMPACT BOND FUND
PORTFOLIOOF INVESTMENTS (continued)
July 31, 2017
| Principal Amount | Value | |||||||
Health Care – 4.0% |
| |||||||
Allergan Funding SCS | $ | 420,000 | $ | 430,086 | ||||
3.800%, 3/15/2025 | 350,000 | 364,419 | ||||||
Allina Health System, 4.805%, 11/15/2045 | 660,000 | 718,768 | ||||||
Boston Medical Center Corp, 4.519%, 7/1/2026 | 705,000 | 741,903 | ||||||
Celgene Corp, 3.875%, 8/15/2025 | 325,000 | 344,897 | ||||||
Children’s Hospital Corp/The, 4.115%, 1/1/2047 | 230,000 | 243,075 | ||||||
City of Hope senior secured note, 5.623%, 11/15/2043 | 250,000 | 309,942 | ||||||
Kaiser Foundation Hospitals | 185,000 | 186,652 | ||||||
3.500%, 4/1/2022 | 110,000 | 115,321 | ||||||
Mayo Clinic, 4.128%, 11/15/2052 | 165,000 | 171,098 | ||||||
Memorial Sloan-Kettering Cancer Center | 200,000 | 202,618 | ||||||
4.200%, 7/1/2055 | 60,000 | 61,427 | ||||||
New York and Presbyterian Hospital/The | 365,000 | 369,752 | ||||||
4.063%, 8/1/2056 | 250,000 | 247,369 | ||||||
Ochsner Clinic Foundation, 5.897%, 5/15/2045 | 650,000 | 810,599 | ||||||
Orlando Health Obligated Group, 4.416%, 10/1/2044 | 395,000 | 391,326 | ||||||
Thermo Fisher Scientific Inc, 4.150%, 2/1/2024 | 265,000 | 284,127 | ||||||
|
| |||||||
| 5,993,379 | ||||||||
|
| |||||||
Industrials – 2.0% |
| |||||||
Canadian Pacific Railway Co, 4.500%, 1/15/2022 | 400,000 | 429,381 | ||||||
CD&R Waterworks Merger Sub LLC 144A, 6.125%, 8/15/2025 (c) (e) | 45,000 | 46,013 | ||||||
CNH Industrial Capital LLC, 4.875%, 4/1/2021 | 750,000 | 795,525 | ||||||
Illinois Tool Works Inc, 4.875%, 9/15/2041 | 175,000 | 204,515 | ||||||
Ryder System Inc | 500,000 | 503,788 | ||||||
2.500%, 5/11/2020 | 145,000 | 146,569 | ||||||
SBA Tower Trust senior secured note 144A, 3.168%, 4/9/2047 (e) | 290,000 | 292,208 | ||||||
United Rentals North America Inc, 4.625%, 7/15/2023 | 500,000 | 525,625 | ||||||
|
| |||||||
| 2,943,624 | ||||||||
|
| |||||||
Materials – 0.3% | ||||||||
Ardagh Packaging Finance PLC / Ardagh Holdings USA Inc senior secured note 144A, 4.250%, 9/15/2022 (e) | 260,000 | 267,800 | ||||||
Standard Industries Inc/NJ 144A, 5.125%, 2/15/2021 (e) | 180,000 | 187,200 | ||||||
|
| |||||||
| 455,000 | ||||||||
|
| |||||||
Technology – 1.0% | ||||||||
Broadcom Corp / Broadcom Cayman Finance Ltd 144A, 3.625%, 1/15/2024 (e) | 355,000 | 365,829 | ||||||
CDW LLC / CDW Finance Corp, 5.000%, 9/1/2023 | 145,000 | 151,525 | ||||||
46
DOMINI IMPACT BOND FUND
PORTFOLIOOF INVESTMENTS (continued)
July 31, 2017
| Principal Amount | Value | |||||||
Technology (Continued) | ||||||||
Microsoft Corp, 3.700%, 8/8/2046 | $ | 395,000 | $ | 391,205 | ||||
SS&C Technologies Holdings Inc, 5.875%, 7/15/2023 | 65,000 | 69,388 | ||||||
TSMC Global Ltd 144A, 1.625%, 4/3/2018 (e) | 523,000 | 522,826 | ||||||
|
| |||||||
| 1,500,773 | ||||||||
|
| |||||||
Utilities – 0.7% | ||||||||
Consolidated Edison Co of New York Inc, 3.300%, 12/1/2024 | 500,000 | 515,046 | ||||||
Greenko Dutch BV senior secured note 144A, 5.250%, 7/24/2024 (e) | 545,000 | 546,362 | ||||||
|
| |||||||
| 1,061,408 | ||||||||
|
| |||||||
Total Corporate Bonds and Notes | 39,427,515 | |||||||
|
| |||||||
| Municipal Bonds – 10.8% | ||||||||
American Municipal Power Inc, 6.270%, 2/15/2050 | 300,000 | 369,957 | ||||||
Bay Area Toll Authority | 125,000 | 180,200 | ||||||
7.043%, 4/1/2050 | 325,000 | 501,455 | ||||||
City of Chicago IL | 250,000 | 249,020 | ||||||
7.045%, 1/1/2029 | 295,000 | 320,090 | ||||||
City of Los Angeles Department of Airports, 3.887%, 5/15/2038 | 140,000 | 142,044 | ||||||
Commonwealth of Massachusetts, 3.277%, 6/1/2046 | 130,000 | 124,899 | ||||||
Cook County Community High School District No 228 Bremen, 5.019%, 12/1/2041 (Insurer: AGM) | 435,000 | 466,529 | ||||||
County of Sacramento CA, 5.730%, VR, 8/15/2023 (Insurer: NATL) | 340,000 | 377,645 | ||||||
County of San Bernardino CA, 6.020%, 8/1/2023 (Insurer: AGM) | 320,000 | 348,522 | ||||||
District of Columbia, 4.125%, 7/1/2027 (c) | 500,000 | 498,174 | ||||||
Hillsborough County Aviation Authority, 3.549%, 10/1/2022 | 190,000 | 198,007 | ||||||
Indiana Finance Authority, 3.624%, 7/1/2036 | 235,000 | 235,249 | ||||||
Inland Valley Development Agency, 5.500%, 3/1/2033 (Insurer: AGM) | 70,000 | 78,291 | ||||||
Lancaster County Hospital Authority/PA | 165,000 | 183,929 | ||||||
5.000%, 7/1/2025 | 135,000 | 149,672 | ||||||
Los Angeles County Public Works Financing Authority, 7.488%, 8/1/2033 | 540,000 | 736,776 | ||||||
Maryland Health & Higher Educational Facilities Authority 3.968%, 7/1/2027 | 205,000 | 210,299 | ||||||
4.068%, 7/1/2028 | 240,000 | 248,158 | ||||||
4.168%, 7/1/2029 | 40,000 | 40,872 | ||||||
47
DOMINI IMPACT BOND FUND
PORTFOLIOOF INVESTMENTS (continued)
July 31, 2017
| Principal Amount | Value | |||||||
| Municipal Bonds (Continued) | ||||||||
Massachusetts Health & Educational Facilities Authority, 6.432%, 10/1/2035 | $ | 420,000 | $ | 490,543 | ||||
Metropolitan Government Nashville & Davidson County Health & Educational Facs Bd, 4.053%, 7/1/2026 | 270,000 | 282,112 | ||||||
Metropolitan Transportation Authority, 5.000%, 11/15/2038 | 1,275,000 | 1,508,745 | ||||||
Michigan Finance Authority | 250,000 | 249,130 | ||||||
2.267%, 4/1/2019 | 260,000 | 257,704 | ||||||
2.491%, 4/1/2020 | 250,000 | 246,465 | ||||||
2.741%, 4/1/2021 | 320,000 | 313,600 | ||||||
New Jersey Economic Development Authority, 3.882%, 6/15/2019 | 270,000 | 274,196 | ||||||
New Jersey Turnpike Authority | 225,000 | 328,104 | ||||||
7.414%, 1/1/2040 | 200,000 | 303,016 | ||||||
New York Transportation Development Corp, 3.473%, 7/1/2028 | 500,000 | 470,765 | ||||||
Oregon Health & Science University, 5.000%, 7/1/2045 | 350,000 | 389,011 | ||||||
Pennsylvania Industrial Development Authority, 144A, 3.556%, 7/1/2024 (e) | 505,000 | 505,449 | ||||||
Public Finance Authority | ||||||||
144A, 3.000%, 11/15/2022 (e) | 360,000 | 361,210 | ||||||
144A, 3.500%, 11/15/2023 (e) | 185,000 | 186,782 | ||||||
Puerto Rico Commonwealth Government Employees Retirement System, 6.150%, 7/1/2038 | 825,000 | 354,750 | ||||||
Shelby County Health Educational & Housing Facilities Board 4.000%, 9/1/2022 | 250,000 | 267,898 | ||||||
4.000%, 9/1/2021 | 250,000 | 267,053 | ||||||
State of California, 7.625%, 3/1/2040 | 525,000 | 810,274 | ||||||
State of Illinois | 215,000 | 211,637 | ||||||
5.100%, 6/1/2033 | 335,000 | 336,229 | ||||||
5.163%, 2/1/2018 | 25,000 | 25,301 | ||||||
5.547%, 4/1/2019 | 325,000 | 336,512 | ||||||
5.665%, 3/1/2018 | 70,000 | 71,191 | ||||||
5.877%, 3/1/2019 | 425,000 | 443,662 | ||||||
Washington State Housing Finance Commission | 800,000 | 787,872 | ||||||
144A, 4.375%, 1/1/2021 (f) | 400,000 | 400,128 | ||||||
|
| |||||||
Total Municipal Bonds | 16,139,127 | |||||||
|
| |||||||
| Senior Floating Rate Interests – 6.7% | ||||||||
Communications – 1.4% | ||||||||
Charter Communications Operating LLC, 3.484%, 1/15/2024 | 296,250 | 298,554 | ||||||
Mission Broadcasting Inc term loan B, 3.783%, 1/17/2024 | 25,494 | 25,694 | ||||||
48
DOMINI IMPACT BOND FUND
PORTFOLIOOF INVESTMENTS (continued)
July 31, 2017
| Principal Amount | Value | |||||||
Communications (Continued) | ||||||||
Nexstar Broadcasting Inc term loan B, 3.783%, 1/17/2024 | $ | 208,542 | $ | 210,171 | ||||
SFR Group SA, 4.561%, 1/14/2025 | 740,653 | 744,951 | ||||||
Sprint Communications Inc term loan B, 3.750%, 2/2/2024 | 408,975 | 410,722 | ||||||
Univision Communications Inc, 3.984%, 3/15/2024 | 486,894 | 485,474 | ||||||
|
| |||||||
| 2,175,566 | ||||||||
|
| |||||||
Consumer Discretionary – 1.2% | ||||||||
American Builders & Contractors Supply Co Inc term loan B, 3.734%, 10/31/2023 | 897,750 | 903,718 | ||||||
Camelot Finance LP term loan, 4.734%, 10/3/2023 | 138,952 | 140,139 | ||||||
Harbor Freight Tools USA Inc term loan, 4.484%, 8/18/2023 | 240,713 | 241,582 | ||||||
KAR Auction Services Inc term loan B, 3.813%, 3/9/2023 | 116,504 | 117,499 | ||||||
On Assignment Inc term loan B, 3.484%, 6/3/2022 | 331,200 | 333,822 | ||||||
|
| |||||||
| 1,736,760 | ||||||||
|
| |||||||
Consumer Staples – 0.8% | ||||||||
Coty Inc term loan B, 3.727%, 10/27/2022 | 202,445 | 204,027 | ||||||
Energizer Holdings Inc term loan B, 3.250%, 6/30/2022 | 612,500 | 616,903 | ||||||
Galleria Co term loan B, 4.250%, 9/29/2023 | 410,000 | 413,521 | ||||||
|
| |||||||
| 1,234,451 | ||||||||
|
| |||||||
Financials – 0.8% | ||||||||
Avolon TLB Borrower 1 US LLC term loan, 3.978%, 3/20/2022 | 240,000 | 241,275 | ||||||
DTZ US Borrower LLC term loan, 4.452%, 11/4/2021 | 490,000 | 492,511 | ||||||
Russell Investments US Institutional Holdco Inc term loan, 6.972%, 6/1/2023 | 445,500 | 450,790 | ||||||
|
| |||||||
| 1,184,576 | ||||||||
|
| |||||||
Health Care – 0.2% | ||||||||
Alere Inc term loan B, 4.490%, 6/18/2022 | 248,101 | 248,838 | ||||||
|
| |||||||
| 248,838 | ||||||||
|
| |||||||
Industrials – 0.1% | ||||||||
Diamond (BC) B.V. term loan, 0.000%, 7/12/2024 (c) (g) | 150,000 | 150,188 | ||||||
|
| |||||||
| 150,188 | ||||||||
|
| |||||||
Materials – 0.2% | ||||||||
Nexeo Solutions LLC, 4.952%, 6/9/2023 | 282,157 | 286,257 | ||||||
|
| |||||||
| 286,257 | ||||||||
|
| |||||||
Technology – 1.8% | ||||||||
CDW LLC term loan, 3.300%, 8/17/2023 | 487,445 | 490,828 | ||||||
Dell International LLC, 3.740%, 9/7/2023 | 277,904 | 279,678 | ||||||
Equinix Inc. term loan B, 3.734%, 1/6/2023 | 153,063 | 154,019 | ||||||
49
DOMINI IMPACT BOND FUND
PORTFOLIOOF INVESTMENTS (continued)
July 31, 2017
| Principal Amount | Value | |||||||
Technology (Continued) | ||||||||
Go Daddy Operating Co LLC term loan, 3.734%, 2/15/2024 | $ | 254,726 | $ | 256,016 | ||||
MA Financeco, LLC term loan B, 3.979%, 6/21/2024 | 30,310 | 30,345 | ||||||
Maxlinear Inc. term loan B, 3.724%, 5/12/2024 | 300,176 | 301,677 | ||||||
Misys Europe SA term loan, 4.737%, 6/13/2024 | 275,000 | 277,166 | ||||||
ON Semiconductor Corp term loan, 3.484%, 3/31/2023 | 264,762 | 266,052 | ||||||
Seattle Spinco term loan B, 4.030%, 6/21/2024 | 204,690 | 204,925 | ||||||
SS&C European Holdings Sarl, 3.484%, 7/8/2022 | 15,824 | 15,926 | ||||||
SS&C Technologies Inc, 3.484%, 7/8/2022 | 275,385 | 277,149 | ||||||
Zayo Group LLC, 3.478%, 1/19/2024 | 100,095 | 100,558 | ||||||
|
| |||||||
| 2,654,339 | ||||||||
|
| |||||||
Utilities – 0.2% | ||||||||
Calpine Corp term loan B, 4.050%, 1/15/2023 | 313,953 | 315,392 | ||||||
|
| |||||||
| 315,392 | ||||||||
|
| |||||||
Total Senior Floating Rate Interests | 9,986,367 | |||||||
|
| |||||||
| U.S. Government Agencies – 5.7% | ||||||||
Fannie Mae, 1.500%, 6/22/2020 (d) | 5,328,000 | 5,327,286 | ||||||
Fannie Mae, 5.625%, 7/15/2037 (d) | 2,376,000 | 3,240,729 | ||||||
|
| |||||||
Total U.S. Government Agencies | 8,568,015 | |||||||
|
| |||||||
| Asset Backed Securities – 1.3% | ||||||||
SBA Tower Trust, Series 2014-2A Class C 144A, | 500,000 | 509,777 | ||||||
Carmax Auto Owner Trust 1.900%, 4/15/2022 | 95,000 | 94,233 | ||||||
2.150%, 5/15/2019 | 750,000 | 750,643 | ||||||
2.160%, 12/15/2021 | 135,000 | 135,050 | ||||||
2.200%, 6/15/2022 | 75,000 | 74,540 | ||||||
2.560%, 2/15/2022 | 260,000 | 261,569 | ||||||
2.580%, 11/16/2020 | 130,000 | 130,352 | ||||||
CNH Equipment Trust, 1.930%, 3/15/2024 | 20,000 | 19,849 | ||||||
|
| |||||||
Total Asset Backed Securities | 1,976,013 | |||||||
|
| |||||||
| Foreign Government & Agency Securities – 1.2% | ||||||||
Province of Ontario Canada, 1.950%, 1/27/2023 | 1,000,000 | CAD | 788,045 | |||||
Province of Quebec Canada, 1.650%, 3/3/2022 | 815,000 | CAD | 640,315 | |||||
Queensland Treasury Corporation, 144A, 3.000%, 3/22/2024 | 500,000 | AUD | 406,647 | |||||
|
| |||||||
Total Foreign Government & Agency Securities | 1,835,007 | |||||||
|
| |||||||
50
DOMINI IMPACT BOND FUND
PORTFOLIOOF INVESTMENTS (continued)
July 31, 2017
| Principal Amount | Value | |||||||
| Certificates of Deposit – 0.2% | ||||||||
Self-Help Federal Credit Union, 1.150%, 3/18/2019 | $ | 250,000 | $ | 248,408 | ||||
|
| |||||||
Total Certificates of Deposit | 248,408 | |||||||
|
| |||||||
Total Long Term Investments | 169,975,740 | |||||||
|
| |||||||
| Short Term Investments – 6.0% | ||||||||
U.S. Government Agency Obligations – 6.0% |
| |||||||
Federal Home Loan Discount Notes, 0.000%, 8/23/2017 | 4,500,000 | 4,497,278 | ||||||
Federal Home Loan Discount Notes, 0.000%, 8/25/2017 | 4,500,000 | 4,497,030 | ||||||
|
| |||||||
Total Short Term Investments | 8,994,308 | |||||||
|
| |||||||
| Total Investments – 120.0% (Cost $177,338,162) (a) | 178,970,048 | |||||||
| Other liabilities, less assets – (20.0)% | (29,877,009) | |||||||
|
| |||||||
| Net Assets – 100.0% | $149,093,039 | |||||||
|
| |||||||
(a) The aggregate cost for book and federal income purposes is $177,406,326. The aggregate gross unrealized appreciation is $3,536,709, and the aggregate gross unrealized depreciation is $1,972,987, resulting in net unrealized appreciation of $1,563,722.
(b) Securities for which there are no such quotations or valuations are valued at fair value as determined in good faith by or at the direction of the Fund’s Board of Trustees.
(c) A portion or all of the security was purchased as a when issued or delayed delivery security.
(d) A portion or all of the security was segregated for collateral for when issued or delayed delivery securities.
(e) This security has been determined to be liquid under guidelines established by the Fund’s Board of Trustees.
(f) This security has been determined to be illiquid under guidelines established by the Fund’s Board of Trustees.
(g) Represents an unsettled loan contract. The coupon rate will be determined at time of settlement.
The principal amount is stated in U.S. dollars unless otherwise indicated.
TBA — To Be Announced
VR — Variable interest rate. Rate shown is that on July 31, 2017.
144A — Security that may be sold to qualified institutional buyers under Rule 144A of the Securities Act of 1933, as amended. At July 31, 2017, the aggregate value of these securities was $18,007,819, representing 12.1% of net assets.
AGM — Assured Guaranty Municipal Corporation
NATL — National Public Finance Guarantee Corporation
AUD — Australian Dollar
CAD — Canadian Dollar
51
DOMINI IMPACT BOND FUND
PORTFOLIOOF INVESTMENTS (continued)
July 31, 2017
At July 31, 2017, the Fund had the following forward currency contracts outstanding.
| Counterparty | Currency | Contract Type | Settlement Date | Value | Unrealized Appreciation (Depreciation) | |||||||||||||
Credit Suisse International | AUD | Sell | 9/20/2017 | $ | 198,668 | $ | (11,430 | ) | ||||||||||
Canadian Imperial Bank of Commerce | AUD | Sell | 9/20/2017 | 199,466 | (11,469 | ) | ||||||||||||
Bank of America N.A. | EUR | Sell | 8/31/2017 | 236,153 | (852 | ) | ||||||||||||
Citibank N.A. | RON | Buy | 8/28/2017 | 300,409 | 26,442 | |||||||||||||
Citibank N.A. | RON | Buy | 8/28/2017 | 3,885 | 340 | |||||||||||||
JP Morgan Chase Bank | RON | Sell | 8/28/2017 | 189,050 | (2,731 | ) | ||||||||||||
BNP Parabas SA | RON | Sell | 8/28/2017 | 115,243 | (1,795 | ) | ||||||||||||
|
|
|
| |||||||||||||||
| $ | 1,242,874 | $ | (1,495 | ) | ||||||||||||||
|
|
|
| |||||||||||||||
At July 31, 2017, the Fund had the following future contracts outstanding.
| Description | Number of Contracts | Value | Expiration Date | Unrealized Appreciation (Depreciation) | ||||||||||
Long Gilt 10 YR (Short) | 21 | $ | 2,646,420 | 9/27/2017 | $ | 42,399 | ||||||||
|
| |||||||||||||
| $ | 42,399 | |||||||||||||
|
| |||||||||||||
At July 31, 2017, the Fund had the following centrally cleared interest rate swap contracts outstanding.
| Description | Counterparty/ Exchange | Expiration Date | Notional Amount | Value | Unrealized Appreciation (Depreciation) | |||||||||||||
Receive Floating rate 3 month USD BBA LIBOR Pay Fixed rate 1.604% | Morgan Stanley/LCH | 3/27/2019 | $ | 728,500 | $ | 729,187 | $ | (687 | ) | |||||||||
Receive Floating rate 3 month USD BBA LIBOR Pay Fixed rate 1.600% | Morgan Stanley/LCH | 4/8/2019 | 3,606,000 | 3,608,808 | (2,010 | ) | ||||||||||||
Receive Floating rate 3 month USD BBA LIBOR Pay Fixed rate 2.124% | Morgan Stanley/LCH | 6/7/2027 | 770,000 | 762,112 | 7,888 | |||||||||||||
Receive Floating rate 3 month USD BBA LIBOR Pay Fixed rate 2.117% | Morgan Stanley/LCH | 6/7/2027 | 670,000 | 662,714 | 7,286 | |||||||||||||
Receive Floating rate 3 month USD BBA LIBOR Pay Fixed rate 2.122% | Morgan Stanley/LCH | 6/7/2027 | 675,000 | 667,933 | 7,067 | |||||||||||||
Receive Floating rate 3 month USD BBA LIBOR Pay Fixed rate 2.121% | Morgan Stanley/LCH | 6/7/2027 | 765,000 | 756,956 | 8,044 | |||||||||||||
52
DOMINI IMPACT BOND FUND
PORTFOLIOOF INVESTMENTS (continued)
July 31, 2017
| Description | Counterparty/ Exchange | Expiration Date | Notional Amount | Value | Unrealized Appreciation (Depreciation) | |||||||||||||
Receive Floating rate 1 day USD Fed Fund Pay Fixed rate 1.000% | Morgan Stanley/LCH | 9/29/2026 | $ | 1,001,000 | $ | 1,075,851 | $ | 47,038 | ||||||||||
Receive Floating rate 3 month USD BBA LIBOR Pay Fixed rate 2.500% | Morgan Stanley/LCH | 12/20/2027 | 1,936,000 | 1,970,235 | (5,435 | ) | ||||||||||||
Receive Floating rate 3 month USD BBA LIBOR Pay Fixed rate 2.000% | Morgan Stanley/LCH | 12/20/2019 | 7,575,000 | 7,620,200 | - | |||||||||||||
Receive Floating rate 3 month USD BBA LIBOR Pay Fixed rate 2.000% | Morgan Stanley/LCH | 12/20/2019 | 11,200,000 | 11,266,789 | (22,807 | ) | ||||||||||||
Receive Floating rate 3 month USD BBA LIBOR Pay Fixed rate 2.750% | Morgan Stanley/LCH | 9/21/2046 | 4,648,000 | 4,849,517 | (317,913 | ) | ||||||||||||
Receive Floating rate 3 month USD BBA LIBOR Pay Fixed rate 2.250% | Morgan Stanley/LCH | 9/21/2026 | 11,688,000 | 11,739,078 | 429,367 | |||||||||||||
|
|
|
| |||||||||||||||
| $ | 45,709,380 | $ | 157,838 | |||||||||||||||
|
|
|
| |||||||||||||||
At July 31, 2017, the Fund had the following OTC interest rate swap contracts outstanding.
| Rate Type | ||||||||||||||||||||||
| Counterparty | Payments made by the Fund | Payments received by the Fund | Expiration Date | Notional Amount | Value | Appreciation (Depreciation) | ||||||||||||||||
Deutsche Bank AG | 1.898% | USA-CPI-U | 7/15/2024 | $ | 4,928,000 | $ | 5,001,747 | $ | 73,747 | |||||||||||||
Deutsche Bank AG | 1.860% | USA-CPI-U | 7/15/2024 | 2,445,000 | 2,466,841 | 21,841 | ||||||||||||||||
|
|
|
| |||||||||||||||||||
| $ | 7,468,588 | $ | 95,588 | |||||||||||||||||||
|
|
|
| |||||||||||||||||||
53
DOMINI IMPACT BOND FUND
PORTFOLIOOF INVESTMENTS (continued)
July 31, 2017
At July 31, 2017, the Fund had the following centrally cleared credit default swap contracts outstanding.
| Description | Counterparty/ Exchange | Expiration Date | Notional Amount(i) | Value(j) | Unrealized Appreciation (Depreciation) | |||||||||||||||||
Buy Protection (h): | ||||||||||||||||||||||
CDX-NAIG Series 28, Version 1, | Morgan Stanley/ICE | 6/20/2022 | $ | 202,000 | $ | 205,996 | $ | (302 | ) | |||||||||||||
CDX-NAHY Series 28, Version 1, | Morgan Stanley/ICE | 6/20/2022 | 3,241,000 | 3,488,228 | (11,498 | ) | ||||||||||||||||
iTraxx Europe Series 27, Version 1, | Morgan Stanley/ICE | 6/20/2022 | 1,336,000 | EUR | 1,611,357 | (8,616 | ) | |||||||||||||||
|
|
|
| |||||||||||||||||||
| $ | 5,305,581 | $ | (20,416 | ) | ||||||||||||||||||
|
|
|
| |||||||||||||||||||
ICE — Intercontinental Exchange
LCH — London Clearing House
(h) If the Fund is a seller of protection and a credit event occurs, as defined under the terms of that particular swap agreement, the Fund will either (i) pay to the buyer of protection an amount equal to the notional amount of the swap and take delivery of the referenced obligation or underlying securities comprising the referenced index or (ii) pay a net settlement amount in the form of cash or securities equal to the notional amount of the swap less the recovery value of the referenced obligation of underlying securities comprising the referenced index.
(i) The maximum potential amount the Fund could be required to pay as a seller of credit protection or receive as a buyer of credit protection if a credit event occurs as defined under the terms of that particular swap agreement.
(j) The prices and resulting values for credit default swap agreements on credit indices serve as an indicator of the current status of the payment/performance risk and represent the likelihood of an expected liability (or profit) for the credit derivative should the notional amount of the swap agreement be closed/sold as of the period end. Increasing market values, in absolute terms when compared to the notional amount of the swap, represent a deterioration of the referenced entity’s credit soundness and a greater likelihood or risk of default or other credit event occurring as defined under the terms of the agreement.
(k) Ratings of Moody’s/S&P - Baa1/BBB+
(l) Ratings of Moody’s/S&P - B1/B+
SEE NOTES TO FINANCIAL STATEMENTS
54
DOMINI FUNDS EXPENSE EXAMPLE (Unaudited)
As a shareholder of the Domini Funds, you incur two types of costs:
(1) Transaction costs such as redemption fees deducted from any redemption or exchange proceeds if you sell or exchange shares of the fund after holding them less than 30 days and sales charges (loads) on Class A shares and
(2) Ongoing costs, including management fees, distribution (12b-1) fees, and other Fund expenses.
This example is intended to help you understand your ongoing costs (in dollars) of investing in the Fund and to compare these costs with the ongoing costs of investing in other mutual funds. The example is based on an investment of $1,000 invested on February 1, 2017, and held through July 31, 2017.
Certain Account Fees
Some accounts are subject to recurring annual service fees and maintenance fees that are not included in the expenses shown in the table. If your account was subject to these fees, then the actual account values at the end of the period would be lower and the actual expense would be higher. You may avoid the annual service fee by choosing paperless electronic delivery of statements, prospectuses, shareholder reports and other materials.
Actual Expenses
The line of the table captioned ‘‘Actual Expenses’’ below provides information about actual account value and actual expenses. You may use the information in this line, together with the amount invested, to estimate the expenses that you paid over the period as follows:
(1) Divide your account value by $1,000.
(2) Multiply your result in step 1 by the number in the first line under the heading ‘‘Expenses Paid During Period’’ in the table.
The result equals the estimated expenses you paid on your account during the period.
Hypothetical Expenses
The second line of the following table provides information about hypothetical account values and hypothetical expenses based on the Fund’s actual expense ratio and an assumed rate of return of 5% per year before expenses, which is not the Fund’s return. The hypothetical account values and expenses may not be used to estimate actual ending account balance or expenses you paid for the period. You may use this information to compare the ongoing costs of investing in the Fund and other mutual funds. To do so, compare this 5% hypothetical example with the 5% hypothetical example that appears in the shareholder reports of the other funds.
55
Please note that the expenses shown in the table are meant to highlight your ongoing costs only and do not reflect any transactional costs, such as redemption fees. Therefore, the second line of the table is useful in comparing ongoing costs only, and will not help you determine the relative total costs of owning different funds. In addition, if these transactional costs were included, your costs would have been higher.
| Fund Name | Expenses | Beginning Account Value as of 2/1/2017 | Ending Account Value as of 7/31/2017 | Expenses Paid During Period 2/1/2017 – 7/31/2017 | ||||
Domini Impact Equity Fund Investor Shares | Actual Expenses | $1,000.00 | $1,056.10 | $5.761 | ||||
| Hypothetical Expenses (5% return before expenses) | $1,000.00 | $1,019.19 | $5.651 | |||||
Domini Impact Equity Fund Class A Shares | Actual Expenses | $1,000.00 | $1,055.70 | $5.861 | ||||
| Hypothetical Expenses (5% return before expenses) | $1,000.00 | $1,019.09 | $5.761 | |||||
Domini Impact Equity Fund Institutional Shares | Actual Expenses | $1,000.00 | $1,058.00 | $3.931 | ||||
| Hypothetical Expenses (5% return before expenses) | $1,000.00 | $1,020.98 | $3.861 | |||||
Domini Impact Equity Fund Class R Shares | Actual Expenses | $1,000.00 | $1,055.60 | $4.211 | ||||
| Hypothetical Expenses (5% return before expenses) | $1,000.00 | $1,020.70 | $4.141 | |||||
Domini Impact International Equity Fund Investor Shares | Actual Expenses | $1,000.00 | $1,146.70 | $7.692 | ||||
| Hypothetical Expenses (5% return before expenses) | $1,000.00 | $1,017.63 | $7.232 | |||||
Domini Impact International Equity Fund Class A Shares | Actual Expenses | $1,000.00 | $1,146.80 | $8.032 | ||||
| Hypothetical Expenses (5% return before expenses) | $1,000.00 | $1,017.31 | $7.552 | |||||
Domini Impact International Equity Fund Institutional Shares | Actual Expenses | $1,000.00 | $1,147.20 | $5.612 | ||||
| Hypothetical Expenses (5% return before expenses) | $1,000.00 | $1,019.57 | $5.272 | |||||
Domini Impact Investor Shares | Actual Expenses | $1,000.00 | $1,027.20 | $4.573 | ||||
| Hypothetical Expenses (5% return before expenses) | $1,000.00 | $1,020.29 | $4.553 | |||||
Domini Impact Institutional Shares | Actual Expenses | $1,000.00 | $1,027.80 | $3.033 | ||||
| Hypothetical Expenses (5% return before expenses) | $1,000.00 | $1,021.81 | $3.023 |
1Expenses are equal to the Fund’s annualized expense ratio of 1.13% for Investor shares, or 1.15% for Class A shares, or 0.77% for Institutional Class, or 0.83% for Class R shares, multiplied by average account value over the period, multiplied by 181, and divided by 365.
2Expenses are equal to the Fund’s annualized expense ratio of 1.45% for Investor shares, or 1.51% for Class A shares, or 1.05% for Institutional shares, multiplied by average account value over the period, multiplied by 181, and divided by 365.
3Expenses are equal to the Fund’s annualized expense ratio of 0.91% for Investor Shares, or 0.60% for Institutional Class, multiplied by average account value over the period, multiplied by 181, and divided by 365.
56
STATEMENTS OF ASSETS AND LIABILITIES
July 31, 2017
| Domini Impact Equity Fund | Domini Impact International Equity Fund | |||||||
ASSETS | ||||||||
Investments at value (cost $719,142,026, and $898,817,527, respectively) | $ | 855,692,922 | $ | 1,041,162,926 | ||||
Cash | 6,715,508 | 20,859,714 | ||||||
Foreign currency, at value (cost $0, and $24, respectively) | - | 24 | ||||||
Receivable for capital shares | 136,203 | 2,896,764 | ||||||
Dividend receivable | 547,759 | 1,153,124 | ||||||
Tax reclaim receivable | 492 | 785,282 | ||||||
|
|
|
| |||||
Total assets | 863,092,884 | 1,066,857,834 | ||||||
|
|
|
| |||||
LIABILITIES | ||||||||
Payable for capital shares | 622,162 | 895,598 | ||||||
Management /Sponsorship fee payable | 501,735 | 789,490 | ||||||
Distribution fee payable | 143,138 | 153,928 | ||||||
Other accrued expenses | 118,662 | 230,120 | ||||||
Foreign tax payable | 9,619 | 262,493 | ||||||
|
|
|
| |||||
Total liabilities | 1,395,316 | 2,331,629 | ||||||
|
|
|
| |||||
NET ASSETS | $ | 861,697,568 | $ | 1,064,526,205 | ||||
|
|
|
| |||||
NET ASSETS CONSIST OF | ||||||||
Paid-in capital | $ | 690,324,714 | $ | 924,382,631 | ||||
Undistributed net investment income (loss) | - | 9,259,050 | ||||||
Accumulated net realized gain (loss) | 34,820,260 | (11,508,022) | ||||||
Net unrealized appreciation (depreciation) | 136,552,594 | 142,392,546 | ||||||
|
|
|
| |||||
NET ASSETS | $ | 861,697,568 | $ | 1,064,526,205 | ||||
|
|
|
| |||||
NET ASSET VALUE PER SHARE | ||||||||
Investor Shares | ||||||||
Net assets | $ | 674,906,745 | $ | 594,874,625 | ||||
|
|
|
| |||||
Outstanding shares of beneficial interest | 14,567,414 | 67,917,140 | ||||||
|
|
|
| |||||
Net asset value and offering price per share* | $ | 46.33 | $ | 8.76 | ||||
|
|
|
| |||||
Class A Shares | ||||||||
Net assets | $ | 8,492,022 | $ | 85,380,971 | ||||
|
|
|
| |||||
Outstanding shares of beneficial interest | 1,178,794 | 9,274,866 | ||||||
|
|
|
| |||||
Net asset value* | $ | 7.20 | $ | 9.21 | ||||
|
|
|
| |||||
Maximum offering price per share (net asset value per share / (1-4.75%)) | $ | 7.56 | $ | 9.67 | ||||
|
|
|
| |||||
Institutional shares | ||||||||
Net assets | $ | 157,240,800 | $ | 384,270,609 | ||||
|
|
|
| |||||
Outstanding shares of beneficial interest | 6,429,694 | 43,941,839 | ||||||
|
|
|
| |||||
Net asset value and offering price per share* | $ | 24.46 | $ | 8.74 | ||||
|
|
|
| |||||
Class R shares | ||||||||
Net assets | $ | 21,058,001 | ||||||
|
|
|
| |||||
Outstanding shares of beneficial interest | 3,572,850 | |||||||
|
|
|
| |||||
Net asset value and offering price per share* | $ | 5.89 | ||||||
|
|
|
| |||||
* Redemption price is equal to net asset value less any applicable redemption fees retained by the Fund.
SEE NOTES TO FINANCIAL STATEMENTS
57
STATEMENTS OF OPERATIONS
For the Year Ended July 31, 2017
| Domini Impact Equity Fund | Domini Impact International Equity Fund | |||||||
INCOME | ||||||||
Dividends (net of foreign taxes $159,693, and $2,197,805, respectively) | $ | 18,509,163 | $ | 27,208,428 | ||||
|
|
|
| |||||
Investment Income | 18,509,163 | 27,208,428 | ||||||
|
|
|
| |||||
EXPENSES | ||||||||
Management /Sponsorship fees | 6,515,501 | 6,980,265 | ||||||
Distribution fees – Investor shares | 1,662,253 | 1,136,637 | ||||||
Distribution fees – Class A shares | 21,384 | 167,132 | ||||||
Transfer agent fees – Investor shares | 661,895 | 710,506 | ||||||
Transfer agent fees – Class A shares | 10,625 | 114,333 | ||||||
Transfer agent fees – Institutional shares | 6,415 | 6,705 | ||||||
Transfer agent fees – Class R shares | 1,794 | - | ||||||
Custody and Accounting fees | 181,737 | 634,613 | ||||||
Registration fees – Investor shares | 32,805 | 45,890 | ||||||
Registration fees – Class A shares | 23,821 | 30,455 | ||||||
Registration fees – Institutional shares | 24,709 | 73,456 | ||||||
Registration fees – Class R shares | 24,099 | - | ||||||
Professional fees | 67,241 | 54,942 | ||||||
Shareholder Service fees – Investor shares | 59,279 | 40,522 | ||||||
Shareholder Service fees – Class A shares | 1,031 | 11,143 | ||||||
Shareholder Service fees – Institutional shares | 157 | 627 | ||||||
Shareholder Service fees – Class R shares | 201 | - | ||||||
Shareholder Communication fees | 48,692 | 41,141 | ||||||
Miscellaneous | 47,778 | 4,654 | ||||||
Trustees fees | 40,838 | 31,680 | ||||||
|
|
|
| |||||
Total expenses | 9,432,255 | 10,084,701 | ||||||
Fees waived and expenses reimbursed | (46,908) | (7,327) | ||||||
|
|
|
| |||||
Net expenses | 9,385,347 | 10,077,374 | ||||||
|
|
|
| |||||
NET INVESTMENT INCOME (LOSS) | 9,123,816 | 17,131,054 | ||||||
|
|
|
| |||||
REALIZED AND UNREALIZED GAIN (LOSS) FROM INVESTMENTS AND FOREIGN CURRENCY | ||||||||
NET REALIZED GAIN (LOSS) FROM: | ||||||||
Investments | 54,917,836 | 14,445,094 | ||||||
Foreign currency | 6,366 | (275,545) | ||||||
|
|
|
| |||||
Net realized gain (loss) | 54,924,202 | 14,169,549 | ||||||
NET CHANGES IN UNREALIZED APPRECIATION (DEPRECIATION) FROM: | ||||||||
Investments | 54,791,832 | 117,351,440 | ||||||
Translation of assets and liabilities in foreign currencies | 1,716 | 82,988 | ||||||
|
|
|
| |||||
Net change in unrealized appreciation (depreciation) | 54,793,548 | 117,434,428 | ||||||
|
|
|
| |||||
NET REALIZED AND UNREALIZED GAIN (LOSS) | 109,717,750 | 131,603,977 | ||||||
|
|
|
| |||||
NET INCREASE (DECREASE) IN NET ASSETS RESULTING FROM OPERATIONS | $ | 118,841,566 | $ | 148,735,031 | ||||
|
|
|
| |||||
SEE NOTES TO FINANCIAL STATEMENTS
58
DOMINI IMPACT EQUITY FUND
STATEMENTS OF CHANGES IN NET ASSETS
| Year Ended July 31, 2017 | Year Ended July 31, 2016 | |||||||
INCREASE (DECREASE) IN NET ASSETS | ||||||||
FROM OPERATIONS | ||||||||
Net investment income (loss) | $ | 9,123,816 | $ | 20,065,234 | ||||
Net realized gain (loss) | 54,924,202 | 8,238,864 | ||||||
Net change in unrealized appreciation (depreciation) | 54,793,548 | (57,998,308) | ||||||
|
|
|
| |||||
Net Increase (Decrease) in Net Assets Resulting from Operations | 118,841,566 | (29,694,210) | ||||||
|
|
|
| |||||
DISTRIBUTIONS AND/OR DIVIDENDS | ||||||||
Dividends to shareholders from net investment income: | ||||||||
Investor shares | (3,565,551) | (7,760,110) | ||||||
Class A shares | (414,948) | (644,111) | ||||||
Institutional shares | (3,170,592) | (6,399,233) | ||||||
Class R shares | (2,673,873) | (4,453,212) | ||||||
Distributions to shareholders from net realized gain: | ||||||||
Investor shares | (10,974,157) | (34,944,459) | ||||||
Class A shares | (810,823) | (2,048,824) | ||||||
Institutional shares | (5,617,485) | (19,710,187) | ||||||
Class R shares | (4,749,954) | (12,600,332) | ||||||
Tax return of capital distribution | ||||||||
Investor shares | - | (142,401) | ||||||
Class A shares | - | (1,843) | ||||||
Institutional shares | - | (44,435) | ||||||
Class R shares | - | (9,599) | ||||||
|
|
|
| |||||
Net Decrease in Net Assets from Distributions and/or Dividends | (31,977,383) | (88,758,746) | ||||||
|
|
|
| |||||
CAPITAL SHARE TRANSACTIONS | ||||||||
Proceeds from sale of shares | 47,295,654 | 65,303,360 | ||||||
Net asset value of shares issued in reinvestment of distributions and dividends | 30,817,443 | 86,546,917 | ||||||
Payments for shares redeemed | (216,646,740) | (174,857,028) | ||||||
Redemption fees | 5,397 | 11,090 | ||||||
|
|
|
| |||||
Net Increase (Decrease) in Net Assets from Capital Share Transactions | (138,528,246) | (22,995,661) | ||||||
|
|
|
| |||||
Total Increase (Decrease) in Net Assets | (51,664,063) | (141,448,617) | ||||||
|
|
|
| |||||
NET ASSETS | ||||||||
Beginning of period | $ | 913,361,631 | $ | 1,054,810,248 | ||||
|
|
|
| |||||
End of period | $ | 861,697,568 | $ | 913,361,631 | ||||
|
|
|
| |||||
Undistributed net investment income (loss) | $ | - | $ | (4,419) | ||||
|
|
|
| |||||
SEE NOTES TO FINANCIAL STATEMENTS
59
DOMINI IMPACT INTERNATIONAL EQUITY FUND
STATEMENTS OF CHANGES IN NET ASSETS
| Year Ended July 31, 2017 | Year Ended July 31, 2016 | |||||||
INCREASE (DECREASE) IN NET ASSETS | ||||||||
FROM OPERATIONS | ||||||||
Net investment income (loss) | $ | 17,131,054 | $ | 8,857,333 | ||||
Net realized gain (loss) | 14,169,549 | (22,594,223) | ||||||
Net change in unrealized appreciation (depreciation) | 117,434,428 | (3,357,498) | ||||||
|
|
|
| |||||
Net Increase (Decrease) in Net Assets Resulting from Operations | 148,735,031 | (17,094,388) | ||||||
|
|
|
| |||||
DISTRIBUTIONS AND/OR DIVIDENDS | ||||||||
Dividends to shareholders from net investment income: | ||||||||
Investor shares | (6,741,209) | (3,272,324) | ||||||
Class A shares | (956,280) | (494,389) | ||||||
Institutional shares | (4,421,473) | (1,952,818) | ||||||
Class R shares | - | - | ||||||
Distributions to shareholders from net realized gain: | ||||||||
Investor shares | - | (8,095,893) | ||||||
Class A shares | - | (1,288,949) | ||||||
Institutional shares | - | (2,922,571) | ||||||
Class R shares | - | - | ||||||
Tax return of capital distribution | ||||||||
Investor shares | - | - | ||||||
Class A shares | - | - | ||||||
Institutional shares | - | - | ||||||
Class R shares | - | - | ||||||
|
|
|
| |||||
Net Decrease in Net Assets from Distributions and/or Dividends | (12,118,962) | (18,026,944) | ||||||
|
|
|
| |||||
CAPITAL SHARE TRANSACTIONS | ||||||||
Proceeds from sale of shares | 467,849,480 | 373,227,416 | ||||||
Net asset value of shares issued in reinvestment of distributions and dividends | 8,708,204 | 14,258,096 | ||||||
Payments for shares redeemed | (155,565,756) | (177,027,885) | ||||||
Redemption fees | 16,669 | 23,851 | ||||||
|
|
|
| |||||
Net Increase (Decrease) in Net Assets from Capital Share Transactions | 321,008,597 | 210,481,478 | ||||||
|
|
|
| |||||
Total Increase (Decrease) in Net Assets | 457,624,666 | 175,360,146 | ||||||
|
|
|
| |||||
NET ASSETS | ||||||||
Beginning of period | $ | 606,901,539 | $ | 431,541,393 | ||||
|
|
|
| |||||
End of period | $ | 1,064,526,205 | $ | 606,901,539 | ||||
|
|
|
| |||||
Undistributed net investment income (loss) | $ | 9,259,050 | $ | 2,868,101 | ||||
|
|
|
| |||||
SEE NOTES TO FINANCIAL STATEMENTS
60
DOMINI IMPACT EQUITY FUND — INVESTOR SHARES
FINANCIAL HIGHLIGHTS
| Year Ended July 31, | ||||||||||||||||||||
| 2017 | 2016 | 2015 | 2014 | 2013 | ||||||||||||||||
For a share outstanding for the period: | ||||||||||||||||||||
Net asset value, beginning of period | $41.49 | $45.38 | $46.82 | $39.22 | $32.66 | |||||||||||||||
|
|
|
|
|
|
|
|
|
| |||||||||||
Income from investment operations: | ||||||||||||||||||||
Net investment income (loss) | 0.41 | 5 | 0.90 | 0.52 | 5 | 0.39 | 0.37 | |||||||||||||
Net realized and unrealized gain (loss) on investments | 5.38 | (2.10) | 1.86 | 7.47 | 6.43 | |||||||||||||||
|
|
|
|
|
|
|
|
|
| |||||||||||
Total income from investment operations | 5.79 | (1.20) | 2.38 | 7.86 | 6.80 | |||||||||||||||
|
|
|
|
|
|
|
|
|
| |||||||||||
Less dividends and distributions: | ||||||||||||||||||||
Dividends to shareholders from net investment income | (0.23) | (0.48) | (0.36) | (0.26) | (0.24) | |||||||||||||||
Distributions to shareholders from net realized gain | (0.72) | (2.20) | (3.46) | - | - | |||||||||||||||
Tax return of capital 5 | - | (0.01) | - | - | - | |||||||||||||||
|
|
|
|
|
|
|
|
|
| |||||||||||
Total distributions | (0.95) | (2.69) | (3.82) | (0.26) | (0.24) | |||||||||||||||
|
|
|
|
|
|
|
|
|
| |||||||||||
Redemption fee proceeds 5 | 0.00 | 1 | 0.00 | 1 | 0.00 | 1 | 0.00 | 1 | 0.00 | 1 | ||||||||||
|
|
|
|
|
|
|
|
|
| |||||||||||
Net asset value, end of period | $46.33 | $41.49 | $45.38 | $46.82 | $39.22 | |||||||||||||||
|
|
|
|
|
|
|
|
|
| |||||||||||
Total return 2 | 14.07% | -2.47% | 5.21% | 20.07% | 20.87% | |||||||||||||||
Portfolio turnover | 85% | 91% | 103% | 86% | 97% | |||||||||||||||
Ratios/supplemental data (annualized): | ||||||||||||||||||||
Net assets, end of period (in millions) | $675 | $656 | $752 | $699 | $625 | |||||||||||||||
Ratio of expenses to average net assets | 1.14% | 1.14% | 1.16% | 1.20% | 1.24% | 4 | ||||||||||||||
Ratio of gross expenses to average net assets | 1.14% | 1.14% | 1.16% | 1.20% | 1.24% | |||||||||||||||
Ratio of net investment income (loss) to average net assets | 0.94% | 2.06% | 1.10% | 0.80% | 0.96% | |||||||||||||||
1 Amount represents less than 0.005 per share.
2 Not annualized for periods less than one year.
3 Reflects a waiver of fees by the Manager, the Sponsor, and the Distributor of the Fund.
4 Ratio of expenses to average net assets includes indirectly paid expenses. Excluding indirectly paid expenses the ratio of expenses to average net assets would have been 1.24% for the year ended July 31, 2013.
5 Based on average shares outstanding.
SEE NOTES TO FINANCIAL STATEMENTS
61
DOMINI IMPACT EQUITY FUND — CLASS A SHARES
FINANCIAL HIGHLIGHTS
| Year Ended July 31, | ||||||||||||||||||||
| 2017 | 2016 | 2015 | 2014 | 2013 | ||||||||||||||||
For a share outstanding for the period: | ||||||||||||||||||||
Net asset value, beginning of period | $7.33 | $10.54 | $13.87 | $11.84 | $10.16 | |||||||||||||||
|
|
|
|
|
|
|
|
|
| |||||||||||
Income from investment operations: | ||||||||||||||||||||
Net investment income (loss) | 0.07 | 5 | 0.33 | 0.12 | 5 | 0.25 | 0.22 | |||||||||||||
Net realized and unrealized gain (loss) on investments | 0.89 | (0.69) | 0.53 | 2.12 | 1.86 | |||||||||||||||
|
|
|
|
|
|
|
|
|
| |||||||||||
Total income from investment operations | 0.96 | (0.36) | 0.65 | 2.37 | 2.08 | |||||||||||||||
|
|
|
|
|
|
|
|
|
| |||||||||||
Less dividends and/or distributions: | ||||||||||||||||||||
Dividends to shareholders from net investment income | (0.37) | (0.65) | (0.52) | (0.34) | (0.40) | |||||||||||||||
Distributions to shareholders from net realized gain | (0.72) | (2.20) | (3.46) | - | - | |||||||||||||||
Tax return of capital 5 | - | (0.00) | 1 | - | - | - | ||||||||||||||
|
|
|
|
|
|
|
|
|
| |||||||||||
Total distributions | (1.09) | (2.85) | (3.98) | (0.34) | (0.40) | |||||||||||||||
|
|
|
|
|
|
|
|
|
| |||||||||||
Redemption fee proceeds 5 | - | - | - | - | - | |||||||||||||||
|
|
|
|
|
|
|
|
|
| |||||||||||
Net asset value, end of period | $7.20 | $7.33 | $10.54 | $13.87 | $11.84 | |||||||||||||||
|
|
|
|
|
|
|
|
|
| |||||||||||
Total return 2 | 13.97% | -2.61% | 5.19% | 20.17% | 20.88% | |||||||||||||||
Portfolio turnover | 85% | 91% | 103% | 86% | 97% | |||||||||||||||
Ratios/supplemental data (annualized): | ||||||||||||||||||||
Net assets, end of period (in millions) | $8 | $8 | $11 | $8 | $5 | |||||||||||||||
Ratio of expenses to average net assets | 1.16% | 3 | 1.18% | 3 | 1.18% | 3 | 1.18% | 3 | 1.18% | 3,4 | ||||||||||
Ratio of gross expenses to average net assets | 1.46% | 1.41% | 1.39% | 1.54% | 1.74% | |||||||||||||||
Ratio of net investment income (loss) to average net assets | 0.92% | 2.00% | 1.06% | 0.83% | 1.02% | |||||||||||||||
1 Amount represents less than 0.005 per share.
2 Total return does not reflect sales commissions and is not annualized for periods less than one year.
3 Reflects a waiver of fees by the Manager, the Sponsor, and the Distributor of the Fund.
4 Ratio of expenses to average net assets includes indirectly paid expenses. Excluding indirectly paid expenses the ratio of expenses to average net assets would have been 1.18% for the year ended July 31, 2013.
5 Based on average shares outstanding.
SEE NOTES TO FINANCIAL STATEMENTS
62
DOMINI IMPACT EQUITY FUND — INSTITUTIONAL SHARES
FINANCIAL HIGHLIGHTS
| Year Ended July 31, | ||||||||||||||||||||
| 2017 | 2016 | 2015 | 2014 | 2013 | ||||||||||||||||
For a share outstanding for the period: | ||||||||||||||||||||
Net asset value, beginning of period | $22.40 | $25.95 | $28.49 | $23.94 | $20.12 | |||||||||||||||
|
|
|
|
|
|
|
|
|
| |||||||||||
Income from investment operations: | ||||||||||||||||||||
Net investment income (loss) | 0.31 | 5 | 0.55 | 0.40 | 5 | 0.32 | 0.29 | |||||||||||||
Net realized and unrealized gain (loss) on investments | 2.87 | (1.20) | 1.11 | 4.60 | 3.96 | |||||||||||||||
|
|
|
|
|
|
|
|
|
| |||||||||||
Total income from investment operations | 3.18 | (0.65) | 1.51 | 4.92 | 4.25 | |||||||||||||||
|
|
|
|
|
|
|
|
|
| |||||||||||
Less dividends and/or distributions: | ||||||||||||||||||||
Dividends to shareholders from net investment income | (0.40) | (0.70) | (0.59) | (0.37) | (0.43) | |||||||||||||||
Distributions to shareholders from net realized gain | (0.72) | (2.20) | (3.46) | - | - | |||||||||||||||
Tax return of capital 5 | - | (0.00) | 1 | - | - | - | ||||||||||||||
|
|
|
|
|
|
|
|
|
| |||||||||||
Total distributions | (1.12) | (2.90) | (4.05) | (0.37) | (0.43) | |||||||||||||||
|
|
|
|
|
|
|
|
|
| |||||||||||
Redemption fee proceeds 5 | 0.00 | 1 | 0.00 | 1 | 0.00 | 1 | 0.00 | 1 | 0.00 | 1 | ||||||||||
|
|
|
|
|
|
|
|
|
| |||||||||||
Net asset value, end of period | $24.46 | $22.40 | $25.95 | $28.49 | $23.94 | |||||||||||||||
|
|
|
|
|
|
|
|
|
| |||||||||||
Total return 2 | 14.51% | -2.14% | 5.56% | 20.59% | 21.36% | |||||||||||||||
Portfolio turnover | 85% | 91% | 103% | 86% | 97% | |||||||||||||||
Ratios/supplemental data (annualized): | ||||||||||||||||||||
Net assets, end of period (in millions) | $157 | $205 | $237 | $260 | $216 | |||||||||||||||
Ratio of expenses to average net assets | 0.79% | 0.80% | 3 | 0.80% | 3 | 0.80% | 3 | 0.80% | 3,4 | |||||||||||
Ratio of gross expenses to average net assets | 0.79% | 0.81% | 0.80% | 0.81% | 0.81% | |||||||||||||||
Ratio of net investment income (loss) to average net assets | 1.31% | 2.40% | 1.47% | 1.19% | 1.41% | |||||||||||||||
1 Amount represents less than 0.005 per share.
2 Not annualized for periods less than one year.
3 Reflects a waiver of fees by the Manager, and the Sponsor of the Fund.
4 Ratio of expenses to average net assets includes indirectly paid expenses. Excluding indirectly paid expenses the ratio of expenses to average net assets would have been 0.80% for the year ended July 31, 2013.
5 Based on average shares outstanding.
SEE NOTES TO FINANCIAL STATEMENTS
63
DOMINI IMPACT EQUITY FUND — CLASS R SHARES
FINANCIAL HIGHLIGHTS
| Year Ended July 31, | ||||||||||||||||||||
| 2017 | 2016 | 2015 | 2014 | 2013 | ||||||||||||||||
For a share outstanding for the period: | ||||||||||||||||||||
Net asset value, beginning of period | $6.20 | $9.40 | $12.81 | $10.94 | $9.41 | |||||||||||||||
|
|
|
|
|
|
|
|
|
| |||||||||||
Income from investment operations: | ||||||||||||||||||||
Net investment income (loss) | 0.08 | 5 | 0.49 | 0.15 | 5 | 1.00 | (0.03) | |||||||||||||
Net realized and unrealized gain (loss) on investments | 0.73 | (0.79) | 0.49 | 1.23 | 1.98 | |||||||||||||||
|
|
|
|
|
|
|
|
|
| |||||||||||
Total income from investment operations | 0.81 | (0.30) | 0.64 | 2.23 | 1.95 | |||||||||||||||
|
|
|
|
|
|
|
|
|
| |||||||||||
Less dividends and/or distributions: | ||||||||||||||||||||
Dividends to shareholders from net investment income | (0.40) | (0.70) | (0.59) | (0.36) | (0.42) | |||||||||||||||
Distributions to shareholders from net realized gain | (0.72) | (2.20) | (3.46) | - | - | |||||||||||||||
Tax return of capital 5 | - | (0.00) | 1 | - | - | - | ||||||||||||||
|
|
|
|
|
|
|
|
|
| |||||||||||
Total distributions | (1.12) | (2.90) | (4.05) | (0.36) | (0.42) | |||||||||||||||
|
|
|
|
|
|
|
|
|
| |||||||||||
Redemption fee proceeds 5 | 0.00 | 1 | 0.00 | 1 | 0.00 | 1 | 0.00 | 1 | 0.00 | 1 | ||||||||||
|
|
|
|
|
|
|
|
|
| |||||||||||
Net asset value, end of period | $5.89 | $6.20 | $9.40 | $12.81 | $10.94 | |||||||||||||||
|
|
|
|
|
|
|
|
|
| |||||||||||
Total return 2 | 14.20% | -2.22% | 5.55% | 20.52% | 21.21% | |||||||||||||||
Portfolio turnover | 85% | 91% | 103% | 86% | 97% | |||||||||||||||
Ratios/supplemental data (annualized): | ||||||||||||||||||||
Net assets, end of period (in millions) | $21 | $44 | $55 | $49 | $28 | |||||||||||||||
Ratio of expenses to average net assets | 0.83% | 3 | 0.82% | 0.85% | 0.90% | 0.90% | 4 | |||||||||||||
Ratio of gross expenses to average net assets | 0.85% | 0.82% | 0.85% | 0.90% | 0.90% | |||||||||||||||
Ratio of net investment income (loss) to average net assets | 1.28% | 2.39% | 1.41% | 1.07% | 1.31% | |||||||||||||||
1 Amount represents less than 0.005 per share.
2 Not annualized for periods less than one year.
3 Reflects a waiver of fees by the Manager, and the Sponsor, of the Fund.
4 Ratio of expenses to average net assets includes indirectly paid expenses. Excluding indirectly paid expenses the ratio of expenses to average net assets would have been 0.90% for the year ended July 31, 2013.
5 Based on average shares outstanding.
SEE NOTES TO FINANCIAL STATEMENTS
64
DOMINI IMPACT INTERNATIONAL EQUITY FUND — INVESTOR SHARES
FINANCIAL HIGHLIGHTS
| Year Ended July 31, | ||||||||||||||||||||
| 2017 | 2016 | 2015 | 2014 | 2013 | ||||||||||||||||
For a share outstanding for the period: | ||||||||||||||||||||
Net asset value, beginning of period | $7.38 | $8.05 | $8.26 | $7.67 | $5.98 | |||||||||||||||
|
|
|
|
|
|
|
|
|
| |||||||||||
Income from investment operations: | ||||||||||||||||||||
Net investment income (loss) | 0.15 | 0.12 | 0.13 | 0.14 | 0.11 | |||||||||||||||
Net realized and unrealized gain (loss) on investments | 1.35 | (0.53) | 0.20 | 0.85 | 1.64 | |||||||||||||||
|
|
|
|
|
|
|
|
|
| |||||||||||
Total income from investment operations | 1.50 | (0.41) | 0.33 | 0.99 | 1.75 | |||||||||||||||
|
|
|
|
|
|
|
|
|
| |||||||||||
Less dividends and/or distributions: | ||||||||||||||||||||
Dividends to shareholders from net investment income | (0.12) | (0.07) | (0.11) | (0.25) | (0.06) | |||||||||||||||
Distributions to shareholders from net realized gain | - | (0.19) | (0.43) | (0.15) | - | |||||||||||||||
|
|
|
|
|
|
|
|
|
| |||||||||||
Total distributions | (0.12) | (0.26) | (0.54) | (0.40) | (0.06) | |||||||||||||||
|
|
|
|
|
|
|
|
|
| |||||||||||
Redemption fee proceeds 5 | 0.00 | 1 | 0.00 | 1 | 0.00 | 1 | 0.00 | 1 | 0.00 | 1 | ||||||||||
|
|
|
|
|
|
|
|
|
| |||||||||||
Net asset value, end of period | $8.76 | $7.38 | $8.05 | $8.26 | $7.67 | |||||||||||||||
|
|
|
|
|
|
|
|
|
| |||||||||||
Total return 2 | 20.61% | -5.12% | 4.65% | 13.15% | 29.26% | |||||||||||||||
Portfolio turnover | 73% | 89% | 88% | 86% | 87% | |||||||||||||||
Ratios/supplemental data (annualized): | ||||||||||||||||||||
Net assets, end of period (in millions) | $595 | $385 | $320 | $232 | $160 | |||||||||||||||
Ratio of expenses to average net assets | 1.46% | 1.52% | 1.59% | 1.60% | 3 | 1.60% | 3,4 | |||||||||||||
Ratio of gross expenses to average net assets | 1.46% | 1.52% | 1.59% | 1.62% | 1.68% | |||||||||||||||
Ratio of net investment income (loss) to average net assets | 2.06% | 1.59% | 1.32% | 1.43% | 1.70% | |||||||||||||||
1 Amount represents less than 0.005 per share.
2 Not annualized for periods less than one year.
3 Reflects a waiver of fees by the Manager, and the Distributor of the Fund.
4 Ratio of expenses to average net assets includes indirectly paid expenses. Excluding indirectly paid expenses the ratio of expenses to average net assets would have been 1.60% for the year ended July 31, 2013.
5 Based on average shares outstanding.
SEE NOTES TO FINANCIAL STATEMENTS
65
DOMINI IMPACT INTERNATIONAL EQUITY FUND — CLASS A SHARES
FINANCIAL HIGHLIGHTS
| Year Ended July 31, | ||||||||||||||||||||
| 2017 | 2016 | 2015 | 2014 | 2013 | ||||||||||||||||
For a share outstanding for the period: | ||||||||||||||||||||
Net asset value, beginning of period | $7.76 | $8.45 | $8.64 | $8.00 | $6.24 | |||||||||||||||
|
|
|
|
|
|
|
|
|
| |||||||||||
Income from investment operations: | ||||||||||||||||||||
Net investment income (loss) | 0.14 | 0.11 | 0.14 | 0.14 | 0.12 | |||||||||||||||
Net realized and unrealized gain (loss) on investments | 1.43 | (0.54) | 0.21 | 0.90 | 1.71 | |||||||||||||||
|
|
|
|
|
|
|
|
|
| |||||||||||
Total income from investment operations | 1.57 | (0.43) | 0.35 | 1.04 | 1.83 | |||||||||||||||
|
|
|
|
|
|
|
|
|
| |||||||||||
Less dividends and/or distributions: | ||||||||||||||||||||
Dividends to shareholders from net investment income | (0.12) | (0.07) | (0.11) | (0.25) | (0.07) | |||||||||||||||
Distributions to shareholders from net realized gain | - | (0.19) | (0.43) | (0.15) | - | |||||||||||||||
|
|
|
|
|
|
|
|
|
| |||||||||||
Total distributions | (0.12) | (0.26) | (0.54) | (0.40) | (0.07) | |||||||||||||||
|
|
|
|
|
|
|
|
|
| |||||||||||
Redemption fee proceeds 5 | 0.00 | 1 | 0.00 | 1 | 0.00 | 1 | 0.00 | 1 | - | |||||||||||
|
|
|
|
|
|
|
|
|
| |||||||||||
Net asset value, end of period | $9.21 | $7.76 | $8.45 | $8.64 | $8.00 | |||||||||||||||
|
|
|
|
|
|
|
|
|
| |||||||||||
Total return 2 | 20.44% | -5.07% | 4.71% | 13.16% | 29.30% | |||||||||||||||
Portfolio turnover | 73% | 89% | 88% | 86% | 87% | |||||||||||||||
Ratios/supplemental data (annualized): | ||||||||||||||||||||
Net assets, end of period (in millions) | $85 | $55 | $51 | $29 | $13 | |||||||||||||||
Ratio of expenses to average net assets | 1.52% | 3 | 1.53% | 3 | 1.57% | 3 | 1.57% | 3 | 1.57% | 3,4 | ||||||||||
Ratio of gross expenses to average net assets | 1.53% | 1.59% | 1.68% | 1.82% | 2.13% | |||||||||||||||
Ratio of net investment income (loss) to average net assets | 1.99% | 1.47% | 1.46% | 1.51% | 1.91% | |||||||||||||||
1 Amount represents less than 0.005 per share.
2 Total return does not reflect sales commissions and is not annualized for periods less than one year.
3 Reflects a waiver of fees by the Manager, and the Distributor of the Fund.
4 Ratio of expenses to average net assets includes indirectly paid expenses. Excluding indirectly paid expenses the ratio of expenses to average net assets would have been 1.57% for the year ended July 31, 2013.
5 Based on average shares outstanding.
SEE NOTES TO FINANCIAL STATEMENTS
66
DOMINI IMPACT INTERNATIONAL EQUITY FUND — INSTITUTIONAL SHARES
FINANCIAL HIGHLIGHTS
Year Ended July 31 | For the Period November 30, 2012 (commencement of operations) through July 31, 2013 | |||||||||||||||||||
| 2017 | 2016 | 2015 | 2014 | |||||||||||||||||
For a share outstanding for the period: | ||||||||||||||||||||
Net asset value, beginning of period | $7.39 | $8.07 | $8.28 | $7.66 | $6.59 | |||||||||||||||
|
|
|
|
|
|
|
|
|
| |||||||||||
Income from investment operations: | ||||||||||||||||||||
Net investment income (loss) | 0.19 | 0.15 | 0.16 | 0.13 | 0.11 | |||||||||||||||
Net realized and unrealized gain (loss) on investments | 1.32 | (0.54) | 0.21 | 0.89 | 1.04 | |||||||||||||||
|
|
|
|
|
|
|
|
|
| |||||||||||
Total income from investment operations | 1.51 | (0.39) | 0.37 | 1.02 | 1.15 | |||||||||||||||
|
|
|
|
|
|
|
|
|
| |||||||||||
Less dividends and/or distributions: | ||||||||||||||||||||
Dividends to shareholders from net investment income | (0.16) | (0.10) | (0.15) | (0.25) | (0.08) | |||||||||||||||
Distributions to shareholders from net realized gain | - | (0.19) | (0.43) | (0.15) | - | |||||||||||||||
|
|
|
|
|
|
|
|
|
| |||||||||||
Total distributions | (0.16) | (0.29) | (0.58) | (0.40) | (0.08) | |||||||||||||||
|
|
|
|
|
|
|
|
|
| |||||||||||
Redemption fee proceeds 5 | 0.00 | 1 | 0.00 | 1 | 0.00 | 1 | 0.00 | 1 | - | |||||||||||
|
|
|
|
|
|
|
|
|
| |||||||||||
Net asset value, end of period | $8.74 | $7.39 | $8.07 | $8.28 | $7.66 | |||||||||||||||
|
|
|
|
|
|
|
|
|
| |||||||||||
Total return 2 | 20.80% | -4.74% | 5.24% | 13.60% | 17.50% | |||||||||||||||
Portfolio turnover | 73% | 89% | 88% | 86% | 87% | |||||||||||||||
Ratios/supplemental data (annualized): | ||||||||||||||||||||
Net assets, end of period (in millions) | $384 | $167 | $61 | $39 | $25 | |||||||||||||||
Ratio of expenses to average net assets | 1.07% | 1.10% | 1.15% | 3 | 1.16% | 1.25% | 3,4 | |||||||||||||
Ratio of gross expenses to average net assets | 1.07% | 1.10% | 1.15% | 1.16% | 1.25% | |||||||||||||||
Ratio of net investment income (loss) to average net assets | 2.82% | 2.22% | 1.78% | 1.82% | 2.40% | |||||||||||||||
1 Amount represents less than 0.005 per share.
2 Not annualized for periods less than one year.
3 Reflects a waiver of fees by the Manager of the Fund.
4 Ratio of expenses to average net assets includes indirectly paid expenses. Excluding indirectly paid expenses the ratio of expenses to average net assets would have been 1.25% for the period ended July 31, 2013.
5 Based on average shares outstanding.
SEE NOTES TO FINANCIAL STATEMENTS
67
DOMINI IMPACT EQUITY FUND
DOMINI IMPACT INTERNATIONAL EQUITY FUND
NOTES TO FINANCIAL STATEMENTS
July 31, 2017
1. ORGANIZATION AND SIGNIFICANT ACCOUNTING POLICIES
The Domini Investment Trust (formerly Domini Social Investment Trust) is a Massachusetts business trust registered under the Investment Company Act of 1940 as an open-end management investment company. The Domini Investment Trust comprises three separate series: Domini Impact Equity Fund (formerly, Domini Social Equity Fund), Domini Impact International Equity Fund (formerly, Domini International Social Equity Fund), and Domini Impact Bond Fund (formerly Domini Social Bond Fund) (each the “Fund,” collectively the “Funds”). The financial statements of the Domini Impact Bond Fund are included on page 82 of this report. The Domini Impact Equity Fund offers Investor shares, Class A shares, Institutional shares and Class R shares. Class R shares of the Domini Impact Equity Fund commenced on November 28, 2003. Class A and Institutional shares of the Domini Impact Equity Fund commenced on November 28, 2008. The Domini Impact International Equity Fund offers Investor shares, Class A shares and Institutional Shares. Class A and Institutional shares of the Domini Impact International Equity Fund were not offered prior to November 28, 2008 and November 30, 2012, respectively. The Investor shares, Institutional shares and Class R shares are sold at their offering price, which is net asset value. The Class A shares are sold with a front-end sales charge (load) of up to 4.75%. The Institutional shares may only be purchased by or for the benefit of investors that meet the minimum investment requirements, and fall within the following categories: endowments, foundations, religious organizations and other nonprofit entities, individuals, retirement plan sponsors, family office clients, certain corporate or similar institutions, or omnibus accounts maintained by financial intermediaries and that are approved by the Fund’s Distributor. Class R shares are generally available only to certain eligible retirement plans and endowments, foundations, religious organizations, and other tax-exempt entities that are approved by the Fund’s Distributor. All classes of shares have identical rights and voting privileges with respect to the Fund in general and exclusive voting rights on matters that affect that class alone. Earnings, net assets, and net asset value per share may differ due to each class having its own expenses, such as transfer and shareholder servicing agent fees and registration fees, directly attributable to that class. Class R and Institutional shares are not subject to distribution and service fees.
The preparation of financial statements in conformity with U.S. generally accepted accounting principles requires management to make estimates and assumptions that affect the reported amounts of assets and liabilities and disclosure of contingent liabilities at the date of the financial statements and the
68
DOMINI IMPACT EQUITY FUND
DOMINI IMPACT INTERNATIONAL EQUITY FUND
NOTES TO FINANCIAL STATEMENTS (continued)
July 31, 2017
reported amounts of revenues and expenses during the reporting period. Actual results could differ from those estimates. The following is a summary of the Funds’ significant accounting policies.
(A) Valuation of Investments. Securities listed or traded on national securities exchanges are valued at the last sale price reported by the security’s primary exchange or, if there have been no sales that day, at the mean of the current bid and ask price that represents the current value of the security. Securities listed on the NASDAQ National Market System are valued using the NASDAQ Official Closing Price (the “NOCP”). If an NOCP is not available for a security listed on the NASDAQ National Market System, the security will be valued at the last sale price or, if there have been no sales that day, at the mean of the current bid and ask price. Securities for which market quotations are not readily available or as a result of an event occurring after the close of the foreign market but before pricing the Funds are valued at fair value as determined in good faith under procedures established by and under the supervision of the Funds’ Board of Trustees. Securities that are primarily traded on foreign exchanges generally are valued at the closing price of such securities on their respective exchanges, except that if the Trusts’ manager or submanager, as applicable, is of the opinion that such price would result in an inappropriate value for a security, including as a result of an occurrence subsequent to the time a value was so established, then the fair value of those securities may be determined by consideration of other factors (including the use of an independent pricing service) by or under the direction of the Board of Trustees or its delegates.
The Funds follow a fair value hierarchy that distinguishes between (a) market participant assumptions developed based on market data obtained from sources independent of the reporting entity (observable inputs) and (b) the Fund’s own assumptions about market participant assumptions developed based on the best information available in the circumstances (unobservable inputs). These inputs are used in determining the value of the Funds’ investments and are summarized in the following fair value hierarchy:
Level 1 — quoted prices in active markets for identical securities
Level 2 — other significant observable inputs (including quoted prices for similar securities, interest rates, and evaluated quotation obtained from pricing services)
Level 3 — significant unobservable inputs (including the Funds’ own assumptions in determining the fair value of investments)
69
DOMINI IMPACT EQUITY FUND
DOMINI IMPACT INTERNATIONAL EQUITY FUND
NOTES TO FINANCIAL STATEMENTS (continued)
July 31, 2017
The inputs or methodology used for valuing securities are not an indication of the risk associated with investing in those securities.
The following is a summary of the inputs used by the Domini Impact Equity Fund, as of July 31, 2017, in valuing the Fund’s assets carried at fair value:
| Level 1 - Quoted Prices | Level 2 - Other Significant Observable Inputs | Level 3 - Significant Unobservable Inputs | Total | |||||||||||||
Common Stocks | ||||||||||||||||
Consumer Discretionary | $ | 106,721,459 | $ | - | $ | - | $ | 106,721,459 | ||||||||
Consumer Staples | 94,820,569 | - | - | 94,820,569 | ||||||||||||
Energy | 1,987,546 | - | - | 1,987,546 | ||||||||||||
Financials | 132,609,584 | - | - | 132,609,584 | ||||||||||||
Health Care | 126,118,400 | - | - | 126,118,400 | ||||||||||||
Industrials | 70,113,868 | - | - | 70,113,868 | ||||||||||||
Information Technology | 209,113,810 | - | - | 209,113,810 | ||||||||||||
Materials | 32,859,874 | - | - | 32,859,874 | ||||||||||||
Real Estate | 29,182,512 | - | - | 29,182,512 | ||||||||||||
Telecommunication Services | 21,352,139 | - | - | 21,352,139 | ||||||||||||
Utilities | 30,813,161 | - | - | 30,813,161 | ||||||||||||
|
|
|
|
|
|
|
| |||||||||
Total | $ | 855,692,922 | $ | - | $ | - | $ | 855,692,922 | ||||||||
|
|
|
|
|
|
|
| |||||||||
The following is a summary of the inputs used by the Domini Impact International Equity Fund, as of July 31, 2017, in valuing the Fund’s assets carried at fair value:
| Level 1 - Quoted Prices | Level 2 - Other Significant Observable Inputs | Level 3 - Significant Unobservable Inputs | Total | |||||||||||||
Common Stocks | ||||||||||||||||
Consumer Discretionary | $ | 153,752,540 | $ | - | $ | - | $ | 153,752,540 | ||||||||
Consumer Staples | 93,348,203 | - | - | 93,348,203 | ||||||||||||
Energy | 12,381,145 | - | - | 12,381,145 | ||||||||||||
Financials | 262,646,682 | - | - | 262,646,682 | ||||||||||||
Health Care | 78,467,707 | - | - | 78,467,707 | ||||||||||||
Industrials | 178,581,025 | - | - | 178,581,025 | ||||||||||||
Information Technology | 82,458,973 | - | - | 82,458,973 | ||||||||||||
Materials | 64,407,517 | - | - | 64,407,517 | ||||||||||||
Real Estate | 70,387,717 | - | - | 70,387,717 | ||||||||||||
Telecommunication Services | 34,266,009 | - | - | 34,266,009 | ||||||||||||
Utilities | 10,465,408 | - | - | 10,465,408 | ||||||||||||
|
|
|
|
|
|
|
| |||||||||
Total | $ | 1,041,162,926 | $ | - | $ | - | $ | 1,041,162,926 | ||||||||
|
|
|
|
|
|
|
| |||||||||
70
DOMINI IMPACT EQUITY FUND
DOMINI IMPACT INTERNATIONAL EQUITY FUND
NOTES TO FINANCIAL STATEMENTS (continued)
July 31, 2017
The following is a reconciliation of Level 3 assets for which significant unobservable inputs were used to determine fair value:
| Domini Impact International Equity Fund | ||||
Investments in Securities | ||||
Balance as of July 31, 2016 | $ | - | ||
Realized Gain (loss) | - | |||
Change in unrealized appreciation (depreciation) | 1,861,528 | |||
Purchases | - | |||
Sales | - | |||
Transfers in and/or out of Level Three | (1,861,528) | |||
|
| |||
Balance as of July 31, 2017 | $ | - | ||
|
| |||
The change in unrealized appreciation (depreciation) included in earnings relating to securities still held at July 31, 2017: | $ | - | ||
|
| |||
For the Domini Impact International Equity Fund transfers from Level 1 to Level 3 included securities valued at $39,736,075 that were transferred as a result of quoted prices in active markets not being readily available. Transfers out of Level 3 into Level 1 included securities valued at $41,597,603 because market values were readily available from a pricing agent for which fair value factors were previously applied.
(B) Foreign Currency Translation. Securities and other assets and liabilities denominated in foreign currencies are translated into U.S. dollar amounts on the date of valuation. Purchases and sales of securities, and income and expense items denominated in foreign currencies, are translated into U.S. dollar amounts on the respective dates of such transactions. Occasionally, events impact the availability or reliability of foreign exchange rates used to convert the U.S. dollar equivalent value. If such an event occurs, the foreign exchange rate will be valued at fair value using procedures established and approved by the Board of Trustees. The Funds do not separately report the effect of fluctuations in foreign exchange rates from changes in market prices on securities held. Such fluctuations are included with the net realized and unrealized gain or loss from investments. Realized foreign exchange gains or losses arise from sales of foreign currencies, currency gains or losses realized between the trade and settlement dates on securities transactions, and the difference between the recorded amounts of dividends, interest, and foreign withholding taxes and the U.S. dollar equivalent of the amounts actually received or paid. Net unrealized foreign exchange gains and losses arise from changes in fair value of assets and liabilities other than investments in securities held at the end of the reporting period, resulting from changes in exchange rates.
71
DOMINI IMPACT EQUITY FUND
DOMINI IMPACT INTERNATIONAL EQUITY FUND
NOTES TO FINANCIAL STATEMENTS (continued)
July 31, 2017
(C) Foreign Currency Contracts. When the Funds purchase or sell foreign securities, they enter into foreign exchange contracts to minimize foreign exchange risk from the trade date to the settlement date of the transactions. A foreign exchange contract is an agreement between two parties to exchange different currencies at an agreed-upon exchange rate on a specified date. The Domini Impact Equity Fund and the Domini Impact International Equity Fund had no open foreign currency spot contracts as of July 31, 2017.
(D) Investment Transactions, Investment Income and Dividends to Shareholders. The Funds earn income daily, net of Fund expenses. Dividends to shareholders of the Domini Impact International Equity Fund are usually declared and paid semiannually from net investment income. Dividends to shareholders of the Domini Impact Equity Fund are usually declared and paid quarterly from net investment income. Distributions to shareholders of realized capital gains, if any, are made annually. Distributions are determined in conformity with income tax regulations, which may differ from generally accepted accounting principles. Reclassifications have been made to the Funds’ components of net assets to reflect income and gains available for distribution (or available capital loss carryovers, as applicable) under income tax regulations.
Investment transactions are accounted for on trade date. Realized gains and losses from security transactions are determined on the basis of identified cost. Interest income is recorded on an accrual basis. Dividend income, net of any applicable withholding tax, is recorded on the ex-dividend date or for certain foreign securities, when the information becomes available to the Funds.
(E) Federal Taxes. Each Fund’s policy is to comply with the provisions of the Internal Revenue Code applicable to regulated investment companies and to distribute substantially all of its taxable income, including net realized gains, if any, within the prescribed time periods. Accordingly, no provision for federal income or excise tax is deemed necessary. As of July 31, 2017, tax years 2014 through 2017 remain subject to examination by the Funds’ major tax jurisdictions, which include the United States of America, the Commonwealth of Massachusetts, and New York State.
(F) Redemption Fees. Redemptions and exchanges of Fund shares held less than 30 days may be subject to the Funds’ redemption fee, which is 2% of the amount redeemed. The fee is imposed to offset transaction costs and other expenses associated with short-term investing. The fee may be waived in certain circumstances at the discretion of the Funds. Such fees are retained by the Funds and are recorded as an adjustment to paid-in capital.
72
DOMINI IMPACT EQUITY FUND
DOMINI IMPACT INTERNATIONAL EQUITY FUND
NOTES TO FINANCIAL STATEMENTS (continued)
July 31, 2017
(G) Other. Income, expenses (other than those attributable to a specific class), gains, and losses are allocated on a daily basis to each class of shares based upon the relative proportion of net assets represented by such class. Operating expenses directly attributable to a specific class are charged against the operations of that class.
(H) Indemnification. The Funds’ organizational documents provide current and former trustees and officers with a limited indemnification against liabilities arising in connection with the performance of their duties to the Funds. In the normal course of business, the Funds may also enter into contracts that provide general indemnifications. The Funds’ maximum exposure under these arrangements is unknown as this would be dependent on future claims that may be made against the Funds. The risk of material loss from such claims is considered remote.
2. TRANSACTIONS WITH AFFILIATES
(A) Manager/Sponsor. The Funds have retained Domini Impact Investments LLC (Domini) to serve as investment manager and administrator. Domini is registered as an investment advisor under the Investment Advisers Act of 1940. The services provided by Domini consist of investment supervisory services, overall operational support, and administrative services. The administrative services include the provision of general office facilities and supervising the overall administration of the Funds. For its services under the Management Agreements, Domini receives from each Fund a fee accrued daily and paid monthly at the annual rate below of the respective Funds’ average daily net assets before any fee waivers:
| Domini Impact Equity Fund | 0.30% of the first $2 billion of net assets managed, | |
| (prior to May 1, 2017) | 0.29% of the next $1 billion of net assets managed, and | |
| 0.28% of net assets managed in excess of $3 billion | ||
| (effective May 1, 2017) | 0.245% of the first $250 million of net assets managed, | |
| 0.24% of the next $250 million of net assets managed, and | ||
| 0.235% of the next $500 million of net assets managed | ||
| 0.23% of net assets managed in excess of $1 billion | ||
| Domini Impact International Equity Fund | 1.00% of the first $250 million of net assets managed, | |
| (prior to May 1, 2017) | 0.94% of the next $250 million of net assets managed, and | |
| 0.88% of net assets managed in excess of $500 million | ||
| (effective May 1, 2017) | 0.97% of the first $250 million of net assets managed, | |
| 0.92% of the next $250 million of net assets managed, and | ||
| 0.855% of the next $500 million of net assets managed | ||
| 0.83% of net assets managed in excess of $1 billion |
73
DOMINI IMPACT EQUITY FUND
DOMINI IMPACT INTERNATIONAL EQUITY FUND
NOTES TO FINANCIAL STATEMENTS (continued)
July 31, 2017
Pursuant to a Sponsorship Agreement (with respect to the Domini Impact Equity Fund) Domini provides the Funds with the administrative personnel and services necessary to operate the Funds. In addition to general administrative services and facilities for the Funds similar to those provided by Domini under the Management Agreements, Domini answers questions from the general public and the media regarding the securities holdings of the Funds. For these services and facilities, Domini receives fees accrued daily and paid monthly from the Funds at the annual rate below of the respective Funds’ average daily net assets before any fee waivers:
| Domini Impact Equity Fund | 0.45% of the first $2 billion of net assets managed, | |
| 0.44% of the next $1 billion of net assets managed, and | ||
| 0.43% of net assets managed in excess of $3 billion |
Effective November 30, 2016, Domini agreed to reduce its fees and reimburse expenses, not including reorganization related expenses, to the extent necessary to keep the aggregate annual operating expenses of the Domini Impact Equity Fund at no greater than 1.25%, 1.18%, 0.80%, and 0.90% of the average daily net assets representing Investor shares, Class A shares, Institutional shares and Class R shares, respectively. For the periods prior to November 30, 2016, similar arrangements were in effect. The waivers currently in effect are contractual and in effect until November 30, 2017, absent an earlier modification by the Board of Trustees which oversees the Funds. Effective November 30, 2016, Domini reduced its fees and reimbursed expenses to the extent necessary to keep the aggregate annual operating expenses, not including reorganization expenses, of the Domini Impact International Equity Fund no greater than 1.60%, 1.57% and 1.27% of the average daily net assets representing Investor shares, Class A shares and Institutional Shares, respectively. For the periods prior to November 30, 2016, similar arrangements were in effect. The waivers currently in effect are contractual and in effect until November 30, 2017, absent an earlier modification by the Board of Trustees which oversees the Funds. For the year ended July 31, 2017, Domini waived fees and reimbursed expenses as follows:
| FEES WAIVED | EXPENSES REIMBURSED | |||||||
Domini Impact Equity Fund | $ | - | $ | 27,939 | ||||
Domini Impact International Equity Fund | - | - | ||||||
Fees waived and/or expenses reimbursed under the Expense Limitation Agreement are only recoverable by Domini and/or its affiliates in the current fiscal year to the extent actual Fund expenses are less than the contractual expense cap during such year.
74
DOMINI IMPACT EQUITY FUND
DOMINI IMPACT INTERNATIONAL EQUITY FUND
NOTES TO FINANCIAL STATEMENTS (continued)
July 31, 2017
As of July 31, 2017, Domini owned less than 1% of any class of the outstanding shares of each Fund.
(B) Submanager. Wellington Management Company LLP (Wellington), a Delaware limited liability partnership, provides investment submanagement services to the Funds on a day-to-day basis pursuant to Submanagement Agreements with Domini.
(C) Distributor. The Board of Trustees of the Funds has adopted a Distribution Plan with respect to the Funds’ Investor shares and Class A shares in accordance with Rule 12b-1 under the Act. DSIL Investment Services LLC, a wholly owned subsidiary of Domini (DSIL), acts as agent of the Funds in connection with the offering of Investor shares of the Funds pursuant to a Distribution Agreement. Under the Distribution Plan, the Funds pay expenses incurred in connection with the sale of Investor shares and Class A shares and pay DSIL a distribution fee at an aggregate annual rate not to exceed 0.25% of the average daily net assets representing the Investor shares and Class A shares. For the year ended July 31, 2017, fees waived were as follows:
| FEES WAIVED | ||||
Domini Impact Equity Fund Investor shares | $ | - | ||
Domini Impact Equity Fund Class A shares | 18,969 | |||
Domini Impact International Equity Fund Investor shares | - | |||
Domini Impact International Equity Fund Class A shares | 7,327 | |||
DSIL Investment Services, LLC, the Funds’ Distributor, has received commissions related to the sales of fund shares. For the year ended July 31, 2017, DSIL received $3,675, and $11,993 from the Domini Impact Equity Fund Class A Shares, and the Domini Impact International Equity Fund Class A shares, respectively.
(D) Shareholder Service Agent. The Trust has retained Domini to provide certain shareholder services with respect to the Domini Impact Equity Fund, and Domini Impact International Equity Fund and their shareholders, which services were previously provided by BNY Asset Servicing (“BNY”) or another fulfillment and mail service provider and are supplemental to services currently provided by BNY, pursuant to a transfer agency agreement between each Fund and BNY. For these services, Domini receives fees from each Fund paid monthly at an annual rate of $4.00 per active account. For the year ended July 31, 2017, there were no fees waived.
(E) Trustees and Officers. Each of the Independent Trustees receives an annual retainer for serving as a Trustee of the Trust of $14,000. The Lead Independent
75
DOMINI IMPACT EQUITY FUND
DOMINI IMPACT INTERNATIONAL EQUITY FUND
NOTES TO FINANCIAL STATEMENTS (continued)
July 31, 2017
Trustee and Chair of the Audit Committee receive an additional chairperson fee of $5,000. Each Independent Trustee also receives $1,500 for attendance at each meeting of the Board of the Trust (reduced to $625 in the event that a Trustee participates at an in-person meeting by telephone). In addition, each Trustee receives reimbursement for reasonable expenses incurred in attending meetings. These expenses are allocated on a pro-rata basis to each shares class of a Fund according to their respective net assets.
As of July 31, 2017, all Trustees and officers of the Trust as a group owned less than 1% of each Fund’s outstanding shares.
3. INVESTMENT TRANSACTIONS
For the year ended July 31, 2017, cost of purchase and proceeds from sales of investments other than short-term obligations were as follows:
| PURCHASE | SALES | |||||||
Domini Impact Equity Fund | $ | 745,489,601 | $ | 909,335,082 | ||||
Domini Impact International Equity Fund | 852,228,213 | 541,845,662 | ||||||
76
DOMINI IMPACT EQUITY FUND
DOMINI IMPACT INTERNATIONAL EQUITY FUND
NOTES TO FINANCIAL STATEMENTS (continued)
July 31, 2017
4. SUMMARY OF SHARE TRANSACTIONS
| Year Ended July 31, | ||||||||||||||||
| 2017 | 2016 | |||||||||||||||
| Shares | Amount | Shares | Amount | |||||||||||||
Domini Impact Equity Fund |
| |||||||||||||||
Investor Shares | ||||||||||||||||
Shares sold | 689,761 | $ | 30,311,165 | 946,947 | $ | 38,245,827 | ||||||||||
Shares issued in reinvestment of dividends and distributions | 321,526 | 14,002,465 | 1,022,290 | 41,403,426 | ||||||||||||
Shares redeemed | (2,255,487) | (98,661,333) | (2,736,834) | (111,244,077) | ||||||||||||
Redemption fees | - | 1,588 | - | 8,929 | ||||||||||||
|
|
|
|
|
|
|
| |||||||||
Net increase (decrease) | (1,244,200) | $ | (54,346,115) | (767,597) | $ | (31,585,895) | ||||||||||
|
|
|
|
|
|
|
| |||||||||
Class A Shares | ||||||||||||||||
Shares sold | 106,625 | $ | 764,838 | 206,193 | $ | 1,609,232 | ||||||||||
Shares issued in reinvestment of dividends and distributions | 172,689 | 1,175,431 | 348,082 | 2,564,298 | ||||||||||||
Shares redeemed | (258,159) | (1,847,749) | (396,575) | (3,154,114) | ||||||||||||
Redemption fees | - | - | - | - | ||||||||||||
|
|
|
|
|
|
|
| |||||||||
Net increase (decrease) | 21,155 | $ | 92,520 | 157,700 | $ | 1,019,416 | ||||||||||
|
|
|
|
|
|
|
| |||||||||
Institutional Shares | ||||||||||||||||
Shares sold | 578,405 | $ | 13,512,200 | 911,656 | $ | 20,564,743 | ||||||||||
Shares issued in reinvestment of dividends and distributions | 359,815 | 8,260,329 | 1,170,773 | 25,713,177 | ||||||||||||
Shares redeemed | (3,646,470) | (84,938,591) | (2,081,982) | (46,764,660) | ||||||||||||
Redemption fees | - | 3,273 | - | 2,125 | ||||||||||||
|
|
|
|
|
|
|
| |||||||||
Net increase (decrease) | (2,708,250) | $ | (63,162,789) | 447 | $ | (484,615) | ||||||||||
|
|
|
|
|
|
|
| |||||||||
Class R Shares | ||||||||||||||||
Shares sold | 456,316 | $ | 2,707,451 | 700,694 | $ | 4,883,558 | ||||||||||
Shares issued in reinvestment of dividends and distributions | 1,324,218 | 7,379,218 | 2,696,629 | 16,866,016 | ||||||||||||
Shares redeemed | (5,337,591) | (31,199,067) | (2,095,090) | (13,694,177) | ||||||||||||
Redemption fees | - | 536 | - | 36 | ||||||||||||
|
|
|
|
|
|
|
| |||||||||
Net increase (decrease) | (3,557,057) | $ | (21,111,862) | 1,302,233 | $ | 8,055,433 | ||||||||||
|
|
|
|
|
|
|
| |||||||||
Total | ||||||||||||||||
Shares sold | 1,831,107 | $ | 47,295,654 | 2,765,490 | $ | 65,303,360 | ||||||||||
Shares issued in reinvestment of dividends and distributions | 2,178,248 | 30,817,443 | 5,237,774 | 86,546,917 | ||||||||||||
Shares redeemed | (11,497,707) | (216,646,740) | (7,310,481) | (174,857,028) | ||||||||||||
Redemption fees | - | 5,397 | - | 11,090 | ||||||||||||
|
|
|
|
|
|
|
| |||||||||
Net increase (decrease) | (7,488,352) | $ | (138,528,246) | 692,783 | $ | (22,995,661) | ||||||||||
|
|
|
|
|
|
|
| |||||||||
77
DOMINI IMPACT EQUITY FUND
DOMINI IMPACT INTERNATIONAL EQUITY FUND
NOTES TO FINANCIAL STATEMENTS (continued)
July 31, 2017
| Year Ended July 31, | ||||||||||||||||
| 2017 | 2016 | |||||||||||||||
| Shares | Amount | Shares | Amount | |||||||||||||
Domini Impact International Equity Fund |
| |||||||||||||||
Investor Shares | ||||||||||||||||
Shares sold | 27,855,309 | $ | 221,158,105 | 30,048,006 | $ | 219,906,322 | ||||||||||
Shares issued in reinvestment of dividends and distributions | 743,730 | 5,610,587 | 1,379,616 | 10,002,392 | ||||||||||||
Shares redeemed | (12,795,171) | (98,997,807) | (19,052,183) | (137,921,955) | ||||||||||||
Redemption fees | - | 9,524 | - | 19,441 | ||||||||||||
|
|
|
|
|
|
|
| |||||||||
Net increase (decrease) | 15,803,868 | $ | 127,780,409 | 12,375,439 | $ | 92,006,200 | ||||||||||
|
|
|
|
|
|
|
| |||||||||
Class A Shares | ||||||||||||||||
Shares sold | 3,805,913 | $ | 31,187,717 | 3,345,919 | $ | 25,706,276 | ||||||||||
Shares issued in reinvestment of dividends and distributions | 115,359 | 912,573 | 224,297 | 1,709,871 | ||||||||||||
Shares redeemed | (1,753,052) | (14,333,930) | (2,487,440) | (18,672,019) | ||||||||||||
Redemption fees | - | 1,059 | - | 381 | ||||||||||||
|
|
|
|
|
|
|
| |||||||||
Net increase (decrease) | 2,168,220 | $ | 17,767,419 | 1,082,776 | $ | 8,744,509 | ||||||||||
|
|
|
|
|
|
|
| |||||||||
Institutional Shares | ||||||||||||||||
Shares sold | 26,497,994 | $ | 215,503,658 | 17,538,735 | $ | 127,614,818 | ||||||||||
Shares issued in reinvestment of dividends and distributions | 287,709 | 2,185,044 | 351,789 | 2,545,833 | ||||||||||||
Shares redeemed | (5,435,327) | (42,234,019) | (2,805,570) | (20,433,911) | ||||||||||||
Redemption fees | - | 6,086 | - | 4,029 | ||||||||||||
|
|
|
|
|
|
|
| |||||||||
Net increase (decrease) | 21,350,376 | $ | 175,460,769 | 15,084,954 | $ | 109,730,769 | ||||||||||
|
|
|
|
|
|
|
| |||||||||
Total | ||||||||||||||||
Shares sold | 58,159,216 | $ | 467,849,480 | 50,932,660 | $ | 373,227,416 | ||||||||||
Shares issued in reinvestment of dividends and distributions | 1,146,798 | 8,708,204 | 1,955,702 | 14,258,096 | ||||||||||||
Shares redeemed | (19,983,550) | (155,565,756) | (24,345,193) | (177,027,885) | ||||||||||||
Redemption fees | - | 16,669 | - | 23,851 | ||||||||||||
|
|
|
|
|
|
|
| |||||||||
Net increase (decrease) | 39,322,464 | $ | 321,008,597 | 28,543,169 | $ | 210,481,478 | ||||||||||
|
|
|
|
|
|
|
| |||||||||
78
DOMINI IMPACT EQUITY FUND
DOMINI IMPACT INTERNATIONAL EQUITY FUND
NOTES TO FINANCIAL STATEMENTS (continued)
July 31, 2017
5. FEDERAL TAX STATUS
The tax basis of the components of net assets for the Funds at July 31, 2017, is as follows:
| Domini Impact Equity Fund | Domini Impact International Equity Fund | |||||||
Undistributed ordinary income | $ | - | $ | 24,540,361 | ||||
Capital losses, other losses and other temporary differences | 35,182,143 | (10,949,447) | ||||||
Unrealized appreciation/(depreciation) | 136,190,711 | 126,552,660 | ||||||
|
|
|
| |||||
Distributable net earnings/(deficit) | $ | 171,372,854 | $ | 140,143,574 | ||||
|
|
|
| |||||
The difference between components of Distributable Earnings on a tax basis and the amounts reflected in the statement of assets and liabilities is primarily due to differences in book and tax policies. For the year ended July 31, 2017, the Funds made the following reclassifications to the components of net assets to align financial reporting with tax reporting:
| Domini Impact Equity Fund | Domini Impact International Equity Fund | |||||||
Paid-in capital | $ | (5,603,908) | $ | (340,162) | ||||
Undistributed net investment income (loss) | 705,567 | 1,378,857 | ||||||
Accumulated net realized gain (loss) | 4,898,341 | (1,038,695) | ||||||
To the extent that the Funds realize future net capital gains, those gains will be offset by any unused capital loss carryforwards. Under recently enacted Regulated Investment Company Modernization Act of 2010, the Funds will be permitted to carry forward capital losses incurred in taxable years beginning after December 22, 2010, for an unlimited time period. As of July 31, 2017, the Domini Impact Equity Fund and the Domini Impact International Equity Fund have accumulated capital loss carryforwards of $0 and $10,949,447, respectively.
However, any losses incurred during those future taxable years will be required to be utilized prior to the losses incurred in pre-enactment taxable years. As a result of this ordering rule, pre-enactment capital loss carryforwards may be more likely to expire unused. Additionally, post-enactment capital losses that are carried forward will retain their character as either short-term or long-term capital losses rather than being considered all short-term as under previous law. As of July 31, 2017, the Domini Impact International Equity Fund had expired unused capital loss carryforwards of $170,081.
79
DOMINI IMPACT EQUITY FUND
DOMINI IMPACT INTERNATIONAL EQUITY FUND
NOTES TO FINANCIAL STATEMENTS (continued)
July 31, 2017
For federal income tax purposes, dividends paid were characterized as follows:
| Domini Impact Equity Fund | Domini Impact International Equity Fund | |||||||||||||||
| Year Ended July 31, | Year Ended July 31, | |||||||||||||||
| 2017 | 2016 | 2017 | 2016 | |||||||||||||
Ordinary income | $ | 8,566,436 | $ | 24,441,067 | $ | 12,118,962 | $ | 7,042,460 | ||||||||
Long-term capital gain | 23,410,947 | 64,119,401 | - | 10,984,484 | ||||||||||||
Return of Capital | - | 198,278 | - | - | ||||||||||||
|
|
|
|
|
|
|
| |||||||||
Total | $ | 31,977,383 | $ | 88,758,746 | $ | 12,118,962 | $ | 18,026,944 | ||||||||
|
|
|
|
|
|
|
| |||||||||
The Funds are subject to the provisions of Accounting Standards Codification ASC 740 Income Taxes (ASC 740). ASC 740 sets forth a minimum threshold for financial statement recognition of the benefit of a tax position taken or expected to be taken in a tax return. The Funds did not have a liability to record for any unrecognized tax benefits in the accompanying financial statements. No provision has been made for taxes on income, capital gains or unrealized appreciation on securities held or for excise tax on income and capital gains.
80
Report of Independent Registered Public Accounting Firm
Board of Trustees and Shareholders of
Domini Investment Trust:
We have audited the accompanying statements of assets and liabilities, including the portfolios of investments, of Domini Impact Equity Fund and Domini Impact International Equity Fund (collectively, the “Funds”), each a Fund within the series of the Domini Investment Trust, as of July 31, 2017, and the related statements of operations for the year then ended, the statements of changes in net assets for each of the years or periods in the two-year period then ended, and the financial highlights for each of the years or periods in the five-year period then ended. These financial statements and financial highlights are the responsibility of the Funds’ management. Our responsibility is to express an opinion on these financial statements and financial highlights based on our audits.
We conducted our audits in accordance with the auditing standards of the Public Company Accounting Oversight Board (United States). Those standards require that we plan and perform the audit to obtain reasonable assurance about whether the financial statements and financial highlights are free from material misstatement. An audit includes examining, on a test basis, evidence supporting the amounts and disclosures in the financial statements. Our procedures included confirmation of securities owned as of July 31, 2017, by correspondence with custodian and brokers, or by other appropriate auditing procedures. An audit also includes assessing the accounting principles used and significant estimates made by management, as well as evaluating the overall financial statement presentation. We believe that our audits provide a reasonable basis for our opinion.
In our opinion, the financial statements and financial highlights referred to above present fairly, in all material respects, the financial position of the Domini Impact Equity Fund and the Domini Impact International Equity Fund as of July 31, 2017, and the results of their operations for the year then ended, the changes in their net assets for each of the years or periods in the two-year period then ended, and the financial highlights for each of the years or periods in the five-year period then ended, in conformity with U.S. generally accepted accounting principles.

September 27, 2017
Boston, MA
81
STATEMENT OF ASSETS AND LIABILITIES
July 31, 2017
ASSETS: | ||||
Investments at value (cost $177,338,162) | $ | 178,970,048 | ||
Cash | 2,979,041 | |||
Foreign currency (cost $2,875) | 2,956 | |||
Receivable for securities sold | 9,180,713 | |||
Interest receivable | 874,652 | |||
Colleratal on certain derivative contracts | 709,806 | |||
Cash held at other banks (cost $319,481) | 319,549 | |||
Receivable for capital shares | 236,858 | |||
Receivable for variation margin swap contracts | 137,422 | |||
Unrealized appreciation on OTC swap contracts | 95,588 | |||
Receivable for variation margin futures | 42,423 | |||
Unrealized appreciation on forward currency contracts | 26,782 | |||
|
| |||
Total assets | 193,575,838 | |||
|
| |||
LIABILITIES: | ||||
Payable for securities purchased | 43,449,105 | |||
Payable for capital shares | 296,671 | |||
Premium paid swap contracts | 228,602 | |||
Interest payable | 153,741 | |||
Colleratal on certain derivative contracts | 100,000 | |||
Cash due to broker (cost $92,315) | 95,085 | |||
Management fee payable | 71,870 | |||
Distribution fee payable | 19,686 | |||
Other accrued expenses | 16,851 | |||
Dividend payable | 22,911 | |||
Unrealized depreciation on forward currency contracts | 28,277 | |||
|
| |||
Total liabilities | 44,482,799 | |||
|
| |||
NET ASSETS | $ | 149,093,039 | ||
|
| |||
NET ASSETS CONSIST OF: | ||||
Paid-in capital | $ | 147,609,756 | ||
Undistributed net investment loss | (128,270) | |||
Accumulated net realized loss | (214,487) | |||
Net unrealized appreciation | 1,826,040 | |||
|
| |||
| $ | 149,093,039 | |||
|
| |||
NET ASSET VALUE PER SHARE | ||||
Investor Shares | ||||
Net assets | $ | 142,599,539 | ||
|
| |||
Outstanding shares of beneficial interest | 12,659,669 | |||
|
| |||
Net asset value and offering price per share* | $ | 11.26 | ||
|
| |||
Institutional Shares | ||||
Net assets | $ | 6,493,500 | ||
|
| |||
Outstanding shares of beneficial interest | 578,174 | |||
|
| |||
Net asset value and offering price per share* | $ | 11.23 | ||
|
|
* Redemption price is equal to net asset value less any applicable redemption fees retained by the Fund.
SEE NOTES TO FINANCIAL STATEMENTS
82
DOMINI IMPACT BOND FUND
STATEMENT OF OPERATIONS
For the Year Ended July 31, 2017
INCOME: | ||||
Interest income | $ | 4,402,727 | ||
|
| |||
EXPENSES: | ||||
Management fee | 559,979 | |||
Administrative fee | 368,243 | |||
Distribution fees – Investor shares | 356,981 | |||
Transfer agent fees – Investor shares | 173,529 | |||
Transfer agent fees – Institutional shares | 138 | |||
Accounting and custody fees | 113,098 | |||
Professional fees | 46,277 | |||
Registration – Investor shares | 30,750 | |||
Registration – Insitutional shares | 11,960 | |||
Shareholding servicing fees – Investor shares | 13,973 | |||
Shareholding servicing fees – Institutional shares | 12 | |||
Shareholder communications | 14,227 | |||
Miscellaneous | 9,715 | |||
Trustees fees | 5,862 | |||
|
| |||
Total expenses | 1,704,744 | |||
Fees waived and expense reimbursed | (349,393) | |||
|
| |||
Net expenses | 1,355,351 | |||
|
| |||
NET INVESTMENT INCOME | 3,047,376 | |||
|
| |||
REALIZED AND UNREALIZED GAINS (LOSSES) | ||||
NET REALIZED GAIN/(LOSS) FROM: | ||||
Investments | (327,200) | |||
Swap contracts | 493,924 | |||
Futures contracts | (68,783) | |||
Foreign currency | 76,757 | |||
Options | (626) | |||
|
| |||
Net realized gain (loss) | 174,072 | |||
|
| |||
NET CHANGES IN UNREALIZED APPRECIATION (DEPRECIATION) FROM: | ||||
Investments, futures and swap contracts | (3,580,669) | |||
Translation of assets and liabilitites in foreign currencies | (84,894) | |||
|
| |||
Net change in unrealized appreciation (depreciation) | (3,665,563) | |||
|
| |||
NET REALIZED AND UNREALIZED GAIN (LOSS) | (3,491,491) | |||
|
| |||
NET DECREASE IN NET ASSETS RESULTING FROM OPERATIONS | $ | (444,115) | ||
|
|
SEE NOTES TO FINANCIAL STATEMENTS
83
DOMINI IMPACT BOND FUND
STATEMENTS OF CHANGES IN NET ASSETS
| Year Ended July 31, 2017 | Year Ended July 31, 2016 | |||||||
INCREASE (DECREASE) IN NET ASSETS: | ||||||||
FROM OPERATIONS: | ||||||||
Net investment income (loss) | $ | 3,047,376 | $ | 2,876,709 | ||||
Net realized gain (loss) on investments | 174,072 | 657,181 | ||||||
Net change in unrealized appreciation (depreciation) on investments | (3,665,563) | 5,499,895 | ||||||
|
|
|
| |||||
Net Increase (Decrease) in Net Assets Resulting from Operations | (444,115) | 9,033,785 | ||||||
|
|
|
| |||||
DISTRIBUTIONS AND DIVIDENDS: | ||||||||
Dividends to shareholders from net investment income: | ||||||||
Investor shares | (2,931,223) | (2,794,993) | ||||||
Institutional shares | (106,025) | (55,786) | ||||||
Distributions to shareholders from net realized gain: | ||||||||
Investor shares | (667,809) | (699,959) | ||||||
Institutional shares | (20,200) | (9,583) | ||||||
Tax return of capital distribution: | ||||||||
Investor shares | (41,581) | - | ||||||
Institutional shares | (1,893) | - | ||||||
|
|
|
| |||||
Net Decrease in Net Assets from Distributions and Dividends | (3,768,731) | (3,560,321) | ||||||
|
|
|
| |||||
CAPITAL SHARE TRANSACTIONS: | ||||||||
Proceeds from sale of shares | 34,139,779 | 28,148,855 | ||||||
Net asset value of shares issued in reinvestment of distributions and dividends | 3,542,027 | 3,337,264 | ||||||
Payment for shares redeemed | (31,823,837) | (21,135,652) | ||||||
Redemption fee | 5,342 | 2,901 | ||||||
|
|
|
| |||||
Net Increase in Net Assets from Capital Share Transactions | 5,863,311 | 10,353,368 | ||||||
|
|
|
| |||||
Total Increase (Decrease) in Net Assets | 1,650,465 | 15,826,832 | ||||||
|
|
|
| |||||
NET ASSETS: | ||||||||
Beginning of period | $ | 147,442,574 | $ | 131,615,742 | ||||
|
|
|
| |||||
End of period | $ | 149,093,039 | $ | 147,442,574 | ||||
|
|
|
| |||||
Undistributed net investment income (loss) | $ | (128,270) | $ | (65,454) | ||||
|
|
|
| |||||
SEE NOTES TO FINANCIAL STATEMENTS
84
DOMINI IMPACT BOND FUND — INVESTOR SHARES
FINANCIAL HIGHLIGHTS
| Year Ended July 31, | ||||||||||||||||||||
| 2017 | 2016 | 2015 | 2014 | 2013 | ||||||||||||||||
For a share outstanding for the period: | ||||||||||||||||||||
Net asset value, beginning of period | $11.60 | $11.16 | $11.24 | $11.15 | $11.64 | |||||||||||||||
|
|
|
|
|
|
|
|
|
| |||||||||||
Income from investment operations: | ||||||||||||||||||||
Net investment income (loss) | 0.23 | 0.24 | 0.17 | 0.16 | 0.16 | |||||||||||||||
Net realized and unrealized gain (loss) on investments | (0.29) | 0.50 | (0.07) | 0.13 | (0.38) | |||||||||||||||
|
|
|
|
|
|
|
|
|
| |||||||||||
Total income (loss) from investment operations | (0.06) | 0.74 | 0.10 | 0.29 | (0.22) | |||||||||||||||
|
|
|
|
|
|
|
|
|
| |||||||||||
Less dividends and distributions: | ||||||||||||||||||||
Dividends to shareholders from net investment income | (0.23) | (0.24) | (0.17) | (0.16) | (0.16) | |||||||||||||||
Distributions to shareholders from net realized gain | (0.05) | (0.06) | (0.01) | (0.04) | (0.11) | |||||||||||||||
Tax return of capital 5 | (0.00) | 1 | - | - | - | - | ||||||||||||||
|
|
|
|
|
|
|
|
|
| |||||||||||
Total distributions | (0.28) | (0.30) | (0.18) | (0.20) | (0.27) | |||||||||||||||
|
|
|
|
|
|
|
|
|
| |||||||||||
Redemption fee proceeds 5 | 0.00 | 1 | 0.00 | 1 | 0.00 | 1 | 0.00 | 1 | 0.00 | 1 | ||||||||||
|
|
|
|
|
|
|
|
|
| |||||||||||
Net asset value, end of period | $11.26 | $11.60 | $11.16 | $11.24 | $11.15 | |||||||||||||||
|
|
|
|
|
|
|
|
|
| |||||||||||
Total return 2 | -0.32% | 6.73% | 0.89% | 2.59% | -2.01% | |||||||||||||||
Portfolio turnover | 386% | 297% | 348% | 120% | 129% | |||||||||||||||
Ratios/supplemental data (annualized): | ||||||||||||||||||||
Net assets, end of period (in millions) | $143 | $144 | $129 | $126 | $130 | |||||||||||||||
Ratio of expenses to average net assets | 0.93% | 3 | 0.93% | 3 | 0.95% | 3 | 0.95% | 3 | 0.95% | 3,4 | ||||||||||
Ratio of gross expenses to average net assets | 1.16% | 1.19% | 1.24% | 1.24% | 1.24% | |||||||||||||||
Ratio of net investment income to average net assets | 2.06% | 2.13% | 1.52% | 1.42% | 1.35% | |||||||||||||||
1 Amount represents less than $0.005 per share.
2 Not annualized for periods less than one year.
3 Reflects a waiver of fees by the Manager and the Distributor of the Fund.
4 Ratio of expenses to average net assets includes indirectly paid expenses. Excluding indirectly paid expenses the ratio of expenses to average net assets would have been 0.95% for the year ended July 31, 2013.
5 Based on average shares outstanding.
SEE NOTES TO FINANCIAL STATEMENTS
85
DOMINI IMPACT BOND FUND — INSTITUTIONAL SHARES
FINANCIAL HIGHLIGHTS
| For the year ended July 31, | ||||||||||||||||||||
| 2017 | 2016 | 2015 | 2014 | 2013 | ||||||||||||||||
For a share outstanding for the period: | ||||||||||||||||||||
Net asset value, beginning of period | $11.57 | $11.14 | $11.23 | $11.15 | $11.64 | |||||||||||||||
|
|
|
|
|
|
|
|
|
| |||||||||||
Income from investment operations: | ||||||||||||||||||||
Net investment income (loss) | 0.27 | 0.27 | 0.20 | 0.19 | 0.19 | |||||||||||||||
Net realized and unrealized gain (loss) on investments | (0.29) | 0.49 | (0.09) | 0.12 | (0.38) | |||||||||||||||
|
|
|
|
|
|
|
|
|
| |||||||||||
Total income (loss) from investment operations | (0.02) | 0.76 | 0.11 | 0.31 | (0.19) | |||||||||||||||
|
|
|
|
|
|
|
|
|
| |||||||||||
Less dividends and distributions: | ||||||||||||||||||||
Dividends to shareholders from net investment income | (0.27) | (0.27) | (0.20) | (0.19) | (0.19) | |||||||||||||||
Distributions to shareholders from net realized gain | (0.05) | (0.06) | (0.01) | (0.04) | (0.11) | |||||||||||||||
Tax return of capital 5 | (0.00) | 1 | - | - | - | - | ||||||||||||||
|
|
|
|
|
|
|
|
|
| |||||||||||
Total distributions | (0.32) | (0.33) | (0.21) | (0.23) | (0.30) | |||||||||||||||
|
|
|
|
|
|
|
|
|
| |||||||||||
Redemption fee proceeds 5 | 0.00 | 1 | 0.00 | 1 | 0.01 | - | - | |||||||||||||
|
|
|
|
|
|
|
|
|
| |||||||||||
Net asset value, end of period | $11.23 | $11.57 | $11.14 | $11.23 | $11.15 | |||||||||||||||
|
|
|
|
|
|
|
|
|
| |||||||||||
Total return 2 | -0.13% | 6.96% | 1.10% | 2.80% | -1.72% | |||||||||||||||
Portfolio turnover | 386% | 297% | 348% | 120% | 129% | |||||||||||||||
Ratios/supplemental data (annualized): | ||||||||||||||||||||
Net assets, end of period (in millions) | $6 | $3 | $2 | $4 | $3 | |||||||||||||||
Ratio of expenses to average net assets | 0.62% | 3 | 0.63% | 3 | 0.65% | 3 | 0.65% | 3 | 0.65% | 3,4 | ||||||||||
Ratio of gross expenses to average net assets | 1.02% | 1.22% | 1.07% | 1.02% | 0.97% | |||||||||||||||
Ratio of net investment income to average net assets | 2.38% | 2.46% | 1.79% | 1.73% | 1.54% | |||||||||||||||
1 Amount represents less than $0.005 per share.
2 Not annualized for periods less than one year.
3 Reflects a waiver of fees by the Manager of the Fund.
4 Ratio of expenses to average net assets includes indirectly paid expenses. Excluding indirectly paid expenses the ratio of expenses to average net assets would have been 0.65% for the year ended July 31, 2013.
5 Based on average shares outstanding.
SEE NOTES TO FINANCIAL STATEMENTS
86
DOMINI IMPACT BOND FUND
NOTES TO FINANCIAL STATEMENTS
July 31, 2017
1. ORGANIZATION AND SIGNIFICANT ACCOUNTING POLICIES
The Domini Impact Bond Fund (formerly Domini Social Bond Fund) (the “Fund”) is a series of the Domini Investment Trust (formerly Domini Social Investment Trust). The Trust is a Massachusetts business trust registered under the Investment Company Act of 1940 as an open-end management investment company. The Fund offers Investor Shares and Institutional Shares. Institutional shares were not offered prior to November 30, 2011. Each class of shares is sold at its offering price, which is net asset value. The Institutional shares may only be purchased by or for the benefit of investors that meet the minimum investment requirements, and fall within the following categories: endowments, foundations, religious organizations and other nonprofit entities, individuals, retirement plan sponsors, family office clients, certain corporate or similar institutions, or omnibus accounts maintained by financial intermediaries and that are approved by the Fund’s Distributor. Both classes of shares have identical rights and voting privileges with respect to the Fund in general and exclusive voting rights on matters that affect that class alone. Earnings, net assets, and net asset value per share may differ due to each class having its own expenses, such as transfer and shareholder servicing agent fees and registration fees, directly attributable to that class. Institutional shares are not subject to distribution fees. The Fund seeks to provide its shareholders with a high level of current income and total return by investing in bonds and other debt instruments that are consistent with the Fund’s social and environmental standards and the submanager’s security selection approach.
The preparation of financial statements in conformity with U.S. generally accepted accounting principles requires management to make estimates and assumptions that affect the reported amounts of assets and liabilities and disclosure of contingent liabilities at the date of the financial statements and the reported amounts of revenues and expenses during the reporting period. Actual results could differ from those estimates. The following is a summary of the Fund’s significant accounting policies.
(A) Valuation of Investments. Bonds and other fixed-income securities (other than obligations with maturities of 60 days or less) are valued on the basis of valuations furnished by an independent pricing service, use of which has been approved by the Board of Trustees of the Fund. In making such valuations, the pricing service utilizes both dealer-supplied valuations and electronic data processing techniques that take into account appropriate factors such as institutional-size trading in similar groups of securities, yield, quality, coupon rate, maturity, type of issue, trading characteristics, and other market data,
87
DOMINI IMPACT BOND FUND
NOTES TO FINANCIAL STATEMENTS (continued)
July 31, 2017
without exclusive reliance upon quoted prices or exchange or over-the-counter prices, since such valuations are believed to reflect more accurately the fair value of such securities. Short-term obligations of sufficient credit quality (maturing in 60 days or less) are valued at amortized cost, which constitutes fair value as determined by the Board of Trustees of the Fund. Securities (other than short-term obligations with remaining maturities of 60 days or less) for which there are no such quotations or valuations are valued at fair value as determined in good faith by or at the direction of the Fund’s Board of Trustees. The Funds follow a fair value hierarchy that distinguishes between (a) market participant assumptions developed based on market data obtained from sources independent of the reporting entity (observable inputs) and (b) the Fund’s own assumptions about market participant assumptions developed based on the best information available in the circumstances (unobservable inputs). These inputs are used in determining the value of the Funds’ investments and are summarized in the following fair value hierarchy:
Level 1 — quoted prices in active markets for identical securities
Level 2 — other significant observable inputs (including quoted prices for similar securities, interest rates, and evaluated quotation obtained from pricing services)
Level 3 — significant unobservable inputs (including the Funds’ own assumptions in determining the fair value of investments) The inputs or methodology used for valuing securities are not an indication of the risk associated with investing in those securities.
88
DOMINI IMPACT BOND FUND
NOTES TO FINANCIAL STATEMENTS (continued)
July 31, 2017
The following is a summary of the inputs used, as of July 31, 2017, in valuing the Fund’s assets carried at fair value:
| Level 1 - Quoted Prices | Level 2 - Other Significant Observable Inputs | Level 3 - Significant Unobservable Inputs | Total | |||||||||||||
Assets: | ||||||||||||||||
Long-Term Investments in Securities: | ||||||||||||||||
Mortgage Backed Securities | $ | - | $ | 91,635,928 | $ | 159,360 | $ | 91,795,288 | ||||||||
Corporate Bonds and Notes | - | 39,427,515 | - | 39,427,515 | ||||||||||||
Municipal Bonds | - | 16,139,127 | - | 16,139,127 | ||||||||||||
Senior Floating Rate Interests | - | 9,986,367 | 9,986,367 | |||||||||||||
U.S. Government Agencies | - | 8,568,015 | - | 8,568,015 | ||||||||||||
Asset Backed Securities | - | 1,976,013 | - | 1,976,013 | ||||||||||||
Foreign Government & Agency Securities | - | 1,835,007 | - | 1,835,007 | ||||||||||||
Certificates of Deposit | - | 248,408 | - | 248,408 | ||||||||||||
|
|
|
|
|
|
|
| |||||||||
Total Long-Term Securities | $ | - | $ | 169,816,380 | $ | 159,360 | $ | 169,975,740 | ||||||||
|
|
|
|
|
|
|
| |||||||||
Short Term Investments in Securities: | ||||||||||||||||
U.S. Government Agencies | - | 8,994,308 | - | 8,994,308 | ||||||||||||
|
|
|
|
|
|
|
| |||||||||
Total Short-Term Securities | $ | - | $ | 8,994,308 | $ | - | $ | 8,994,308 | ||||||||
|
|
|
|
|
|
|
| |||||||||
Total Investment in Securities | $ | - | $ | 178,810,688 | $ | 159,360 | $ | 178,970,048 | ||||||||
|
|
|
|
|
|
|
| |||||||||
Other Financial Instruments: | ||||||||||||||||
Forward currency Contracts | $ | - | $ | 26,782 | $ | - | $ | 26,782 | ||||||||
OTC Swap Contracts | - | 95,588 | - | 95,588 | ||||||||||||
Variation Margin Swap Contracts | - | 137,422 | - | 137,422 | ||||||||||||
Variation Margin Futures | - | 42,423 | - | 42,423 | ||||||||||||
|
|
|
|
|
|
|
| |||||||||
Total Other Financial Instruments | $ | - | $ | 302,215 | $ | - | $ | 302,215 | ||||||||
|
|
|
|
|
|
|
| |||||||||
Liabilities: | ||||||||||||||||
Other Financial Instruments: | ||||||||||||||||
Foreign Exchange Contracts | $ | - | $ | 28,277 | $ | - | $ | 28,277 | ||||||||
|
|
|
|
|
|
|
| |||||||||
Total Other Financial Instruments | $ | - | $ | 28,277 | $ | - | $ | 28,277 | ||||||||
|
|
|
|
|
|
|
| |||||||||
89
DOMINI IMPACT BOND FUND
NOTES TO FINANCIAL STATEMENTS (continued)
July 31, 2017
The following is a reconciliation of Level 3 assets for which significant unobservable inputs were used to determine fair value:
Investments in Securities | ||||
Balance as of July 31, 2016 | $ | 260,722 | ||
Realized gain (loss) | - | |||
Change in unrealized appreciation (depreciation) | 33,138 | |||
Purchases | - | |||
Sales | - | |||
Transfers in and/or out of level three | (134,500) | |||
|
| |||
Balance as of July 31, 2017 | $ | 159,360 | ||
|
| |||
The change in unrealized appreciation (depreciation) included in earnings relating to securities still held at July 31, 2017 | $ | 1,361 | ||
|
|
Transfers from Level 2 to Level 3 included securities valued at $5,516,926 that were transferred as a result of quoted prices in active markets not being readily available. Transfers out of Level 3 into Level 2 included securities valued at $5,651,426 because market values were readily available from a pricing agent for which fair value factors were previously applied. The Level 3 security was valued using a pricing vendor other than the Fund’s primary pricing vendor.
(B) Foreign Currency Translation. Securities and other assets and liabilities denominated in foreign currencies are translated into U.S. dollar amounts on the date of valuation. Purchases and sales of securities, and income and expense items denominated in foreign currencies, are translated into U.S. dollar amounts on the respective dates of such transactions. Occasionally, events impact the availability or reliability of foreign exchange rates used to convert the U.S. dollar equivalent value. If such an event occurs, the foreign exchange rate will be valued at fair value using procedures established and approved by the Board of Trustees. The Funds do not separately report the effect of fluctuations in foreign exchange rates from changes in market prices on securities held. Such fluctuations are included with the net realized and unrealized gain or loss from investments. Realized foreign exchange gains or losses arise from sales of foreign currencies, currency gains or losses realized between the trade and settlement dates on securities transactions, and the difference between the recorded amounts of dividends, interest, and foreign withholding taxes and the U.S. dollar equivalent of the amounts actually received or paid. Net unrealized foreign exchange gains and losses arise from changes in fair value of assets and liabilities other than investments in securities held at the end of the reporting period, resulting from changes in exchange rates.
(C) Foreign Currency Contracts. When the Funds purchase or sell foreign securities they enter into foreign exchange contracts to minimize foreign
90
DOMINI IMPACT BOND FUND
NOTES TO FINANCIAL STATEMENTS (continued)
July 31, 2017
exchange risk from the trade date to the settlement date of the transactions. A foreign exchange contract is an agreement between two parties to exchange different currencies at an agreed-upon exchange rate on a specified date. The Fund had $1,602,522 outstanding in open foreign currency spot contracts as of July 31, 2017.
(D) Securities Purchased on a When-Issued or Delayed Delivery Basis. The Fund may invest in when-issued or delayed delivery securities where the price of the security is fixed at the time of the commitment but delivery and payment take place beyond customary settlement time. These securities are subject to market fluctuation, and no interest accrues on the security to the purchaser during this period. The payment obligation and the interest rate that will be received on the securities are each fixed at the time the purchaser enters into the commitment. Purchasing obligations on a when-issued or delayed delivery basis is a form of leveraging and can involve a risk that the yields available in the market when the delivery takes place may actually be higher than those obtained in the transaction, which could result in an unrealized loss at the time of delivery. The Fund establishes a segregated account consisting of liquid securities equal to the amount of the commitments to purchase securities on such basis.
(E) Derivative Financial Instruments. The Fund may invest in derivatives in order to hedge market risks, or to seek to increase the Fund’s income or gain. Derivatives in certain circumstances may require that the Fund segregate cash or other liquid assets to the extent the Fund’s obligations are not otherwise covered through ownership of the underlying security, financial instrument, or currency. Derivatives involve special risks, including possible default by the other party to the transaction, illiquidity, and the risk that the use of derivatives could result in greater losses than if it had not been used. Some derivative transactions, including options, swaps, forward contracts, and options on foreign currencies, are entered into directly by the counterparties or through financial institutions acting as market makers (OTC derivatives), rather than being traded on exchanges or in markets registered with the Commodity Futures Trading Commission or the SEC.
(F) Option Contracts. The Fund may purchase or write option contracts primarily to manage and/or gain exposure to interest rate, foreign exchange rate and credit risk. An option is a contract entitling the holder to purchase or sell a specific amount of shares or units of an asset or notional amount of a swap (swaption), at a specified price. Options purchased are recorded as an asset while options written are recorded as a liability. Upon exercise of an option, the acquisition cost or sales proceeds of the underlying investment is adjusted by any premium received or paid. Upon expiration of an option, any premium
91
DOMINI IMPACT BOND FUND
NOTES TO FINANCIAL STATEMENTS (continued)
July 31, 2017
received or paid is recorded as a realized gain or loss. Upon closing an option other than through expiration or exercise, the difference between the premium and the cost to close the position is recorded as a realized gain or loss. There are no purchased option contracts outstanding at July 31, 2017.
(G) Futures Contracts. The Fund may purchase and sell futures contracts based on various securities, securities indexes, and other financial instruments and indexes. The Fund intends to use futures contracts for hedging purposes. Futures contracts provide for the future sale by one party and purchase by another party of a specified amount of a specified security or financial instrument at a specified future time and at a specified price. When the Fund purchases or sells a futures contract, the Fund must allocate certain of its assets as an initial deposit on the contract. The futures contract is marked to market daily thereafter, and the Fund may be required to pay or entitled to receive additional “variation margin,” based on decrease or increase in the value of the futures contract. Future contracts outstanding at July 31, 2017 are listed in the Fund’s Portfolio of Investments.
(H) Forward Currency Contracts. The Fund may enter into forward currency contracts with counterparties to hedge the value of portfolio securities denominated in particular currencies against fluctuations in relative value or to generate income or gain. These contracts are used to hedge foreign exchange risk and to gain exposure on currency. The U.S. dollar value of forward currency contracts is determined using current forward exchange rates supplied by a quotation service. The fair value of the contract will fluctuate with changes in currency exchange rates. The contract is marked to market daily and the change in fair value is recorded as an unrealized gain or loss. The Fund record a realized gain or loss equal to the difference between the value of the contract at the time it was opened and the value at the time it was closed when the contract matures or by delivery of the currency. The Fund could be exposed to risk if the value of the currency changes unfavorably, if the counterparties to the contracts are unable to meet the terms of their contracts or if the Fund is unable to enter into a closing position. Risk may exceed amounts recognized on the Statement of Assets and Liabilities. Forward currency contracts outstanding at July 31, 2017 are listed in the Fund’s Portfolio of Investments.
(I) Interest Rate Swap Contracts. The Fund may enter into interest rate swap contracts to hedge interest rate risk. An interest rate swap is an agreement between the Fund and a counterparty to exchange cash flows based on the difference between two interest rates, applied to a notional amount. Interest rate swap contracts are marked to market daily based upon quotations from an independent pricing service or market maker. Any change on an OTC interest
92
DOMINI IMPACT BOND FUND
NOTES TO FINANCIAL STATEMENTS (continued)
July 31, 2017
rate swap is recorded as an unrealized gain or loss on the Statement of Assets and Liabilities. Daily fluctuations in the value of centrally cleared interest rate swaps are settled though a central clearing agent and are recorded in variation margin on the Statement of Assets and Liabilities and recorded as unrealized gain or loss. OTC and centrally cleared interest rate swap contracts outstanding at July 31, 2017, are listed in the Fund’s Portfolio of Investments.
(J) Credit Default Swap Contracts. The Fund may enter into credit default swap contracts primarily to manage and/or gain exposure to credit risk. A credit default swap is an agreement between the fund and a counterparty whereby the buyer of the contract receives credit protection and the seller of the contract guarantees the credit worthiness of a referenced debt obligation. These agreements may be privately negotiated in the over-the-counter market (“OTC credit default swaps”) or may be executed in a multilateral trade facility platform, such as a registered exchange (“centrally cleared credit default swaps”). The underlying referenced debt obligation may be a single issuer of corporate or sovereign debt, a credit index, or a tranche of a credit index. In the event of a default of the underlying referenced debt obligation, the buyer is entitled to receive the notional amount of the credit default swap contract from the seller in exchange for the referenced debt obligation, a net settlement amount equal to the notional amount of the credit default swap less the recovery value of the referenced debt obligation, or other agreed upon amount. For centrally cleared credit default swaps, required initial margins are pledged by the fund, and the daily change in fair value is accounted for as a variation margin payable or receivable on the Statements of Assets and Liabilities. Over the term of the contract, the buyer pays the seller a periodic stream of payments, provided that no event of default has occurred. Such periodic payments are accrued daily as an unrealized appreciation or depreciation until the payments are made, at which time they are realized. Payments received or paid to initiate a credit default swap contract are reflected on the Statements of Assets and Liabilities and represent compensating factors between stated terms of the credit default swap agreement and prevailing market conditions (credit spreads and other relevant factors). These upfront payments are amortized over the term of the contract as a realized gain or loss on the Statements of Operations. OTC and centrally cleared credit default swap contracts outstanding at July 31, 2017 are listed in the Fund’s Portfolio of Investments.
(K) Master Agreements. The Fund is a party to ISDA (International Swaps and Derivatives Association, Inc.) Master Agreements that govern OTC derivative and foreign exchange contracts (Master Agreements) with certain counterparties entered into from time to time. The Master Agreements may contain provisions regarding, among other things, the parties’ general
93
DOMINI IMPACT BOND FUND
NOTES TO FINANCIAL STATEMENTS (continued)
July 31, 2017
obligations, representations, agreements, collateral requirements, events of default and early termination. With respect to certain counterparties, in accordance with the terms of the Master Agreements, collateral posted to the Fund is held in a segregated account by the Fund’s custodian and with respect to those amounts which can be sold or repledged, are presented in the Fund’s portfolio. Collateral pledged by the Fund is segregated by the Fund’s custodian and identified in the Fund’s portfolio. Collateral can be in the form of cash or other marketable securities as agreed to by the Fund and the applicable counterparty. Collateral requirements are determined based on the Fund’s net position with each counterparty.
With respect to ISDA Master Agreements, termination events applicable to the counterparty include certain deteriorations in the credit quality of the counterparty. Termination events applicable to the Fund include failure of the Fund to maintain certain net asset levels and/or limit the decline in net assets over various periods of time. In the event of default or early termination, the ISDA Master Agreement gives the non-defaulting party the right to net and close-out all transactions traded, whether or not arising under the ISDA agreement, to one net amount payable by one counterparty to the other. However, absent an event of default or early termination, OTC derivative assets and liabilities are presented gross and not offset in the Statements of Assets and Liabilities. Early termination by the counterparty may result in an immediate payment by the Fund of any net liability owed to that counterparty under the ISDA agreement.
In a centrally cleared swap, while the Fund enters into an agreement with a clearing broker to execute contracts with a counterparty, the performance of the swap is guaranteed by the central clearinghouse, which reduces the Fund’s exposure to counterparty risk. The Fund is still exposed to the counterparty risk through the clearing broker and clearinghouse. The clearinghouse attempts to minimize this risk to its participants through the use of mandatory margin requirements, daily cash settlements and other procedures. Likewise, the clearing broker reduces its risk through margin requirements and required segregation of customer balances.
(L) Investment Transactions, Investment Income, and Dividends to Shareholders. The Fund earns income daily, net of Fund expenses. Dividends to shareholders are usually declared daily and paid monthly from net investment income. Distributions to shareholders of realized capital gains, if any, are made annually. Distributions are determined in conformity with income tax regulations, which may differ from generally accepted accounting principles. Reclassifications have been made to the Fund’s components of net assets to
94
DOMINI IMPACT BOND FUND
NOTES TO FINANCIAL STATEMENTS (continued)
July 31, 2017
reflect income and gains available for distribution (or available capital loss carryovers, as applicable) under income tax regulations. Investment transactions are accounted for on trade date. Realized gains and losses from security transactions are determined on the basis of identified cost. Interest income is recorded on an accrual basis.
(M) Federal Taxes. The Fund’s policy is to comply with the provisions of the Internal Revenue Code applicable to regulated investment companies and to distribute substantially all of its taxable income, including net realized gains, if any, within the prescribed time periods. Accordingly, no provision for federal income or excise tax is deemed necessary. As of July 31, 2017, tax years 2014 through 2017 remain subject to examination by the Fund’s major tax jurisdictions, which include the United States of America, the Commonwealth of Massachusetts, and New York State.
(N) Redemption Fees. Redemptions and exchanges of Fund shares held less than 30 days may be subject to the Fund’s redemption fee, which is 2% of the amount redeemed. The fee is imposed to offset transaction costs and other expenses associated with short-term investing. The fee may be waived in certain circumstances at the discretion of the Fund. Such fees are retained by the Fund and are recorded as an adjustment to paid-in capital.
(O) Other. Income, expenses (other than those attributable to a specific class), gains, and losses are allocated on a daily basis to each class of shares based upon the relative proportion of net assets represented by such class. Operating expenses directly attributable to a specific class are charged against the operations of that class.
(P) Indemnification. The Fund’s organizational documents provide current and former trustees and officers with a limited indemnification against liabilities arising in connection with the performance of their duties to the Fund. In the normal course of business, the Fund may also enter into contracts that provide general indemnifications. The Fund’s maximum exposure under these arrangements is unknown as this would be dependent on future claims that may be made against the Fund. The risk of material loss from such claims is considered remote.
2. TRANSACTIONS WITH AFFILIATES
(A) Manager/Administrator. The Fund has retained Domini Impact Investments LLC (Domini) to serve as investment manager and administrator. The services provided by Domini consist of investment supervisory services, overall operational support, and administrative services, including the provision of
95
DOMINI IMPACT BOND FUND
NOTES TO FINANCIAL STATEMENTS (continued)
July 31, 2017
general office facilities and supervising the overall administration of the Fund. For its services under the Management Agreement, Domini receives from the Fund a fee accrued daily and paid monthly at the annual rate below of the Fund’s average daily net assets before any fee waivers:
| (prior to May 1, 2017) | 0.40% of the first $500 million of net assets managed, | |
| 0.38% of the next $500 million of net assets managed, and | ||
| 0.35% of net assets managed in excess of $1 billion | ||
| (effective May 1, 2017) | 0.33% of the first $50 million of net assets managed, | |
| 0.32% of the next $50 million of net assets managed, and | ||
| 0.315% of net assets managed in excess of $100 million |
For its services under the Administration Agreement, Domini receives from the Fund a fee accrued daily and paid monthly at an annual rate equal to 0.25% of the Fund’s average daily net assets.
For the period from November 30, 2016, until November 30, 2017, Domini is waiving its fee and reimbursing expenses to the extent necessary to keep the aggregate annual operating expenses of the Fund (excluding brokerage fees and commissions, interest, taxes, and other extraordinary expenses), net of waivers and reimbursements, at no greater than 0.95% and 0.65% of the average daily net assets representing Investor shares and Institutional shares, respectively. A similar fee waiver arrangement was in effect in prior periods. For the year ended July 31, 2017, Domini reimbursed expenses totaling $202,509.
Fees waived and/or expenses reimbursed under the Expense Limitation Agreement are only recoverable by Domini and/or its affiliates in the current fiscal year to the extent actual Fund expenses are less than the contractual expense cap during such year.
As of July 31, 2017, Domini owned less than 1% of any class of the outstanding Shares of the Fund.
(B) Submanager. Wellington Management Company LLP (Wellington), a Delaware limited liability partnership, provides investment management services to the Fund on a day-to-day basis pursuant to a submanagement agreement with Domini. Prior to January 7, 2015, Seix Investment Advisors LLC (“Seix”), a wholly owned subsidiary of RidgeWorth LLC (formerly known as RidgeWorth Capital Management, Inc.), and its predecessors, provided investment submanagement services to the Fund.
(C) Distributor. The Board of Trustees of the Fund has adopted a Distribution Plan in accordance with Rule 12b-1 under the Act. DSIL Investment Services LLC, a wholly owned subsidiary of Domini (DSIL), acts as agent of the Fund
96
DOMINI IMPACT BOND FUND
NOTES TO FINANCIAL STATEMENTS (continued)
July 31, 2017
in connection with the offering of shares of the Fund pursuant to a Distribution Agreement. Under the Distribution Plan, the Fund pays expenses incurred in connection with the sale of Investor shares and pays DSIL a distribution fee at an aggregate annual rate not to exceed 0.25% of the average daily net assets representing the Investor shares. For the year ended July 31, 2017, fees waived by the Investor shares totaled $146,884.
(D) Shareholder Service Agent. The Trust has retained Domini to provide certain shareholder services to the Fund and its shareholders, which services were previously provided by BNY Asset Servicing (“BNY”) or another fulfillment and mail service provider and are supplemental to services currently provided by BNY, pursuant to a transfer agency agreement between each Fund and BNY. For these services, Domini receives a fee from the Fund paid monthly at an annual rate of $4.00 per active account. For the year ended July 31, 2017, Domini waived fees as follows:
| FEES WAIVED | ||||
Domini Impact Bond Fund Investor shares | $ | - | ||
Domini Impact Bond Fund Institutional shares | 12 | |||
(E) Trustees and Officers. Each of the Independent Trustees receives an annual retainer for serving as a Trustee of the Trust of $14,000. The Lead Independent Trustee and Chair of the Audit Committee receive an additional chairperson fee of $5,000. Each Independent Trustee also receives $1,500 for attendance at each meeting of the Board of the Trust (reduced to $625 in the event that a Trustee participates at an in-person meeting by telephone). In addition, each Trustee receives reimbursement for reasonable expenses incurred in attending meetings. These expenses are allocated on a pro-rata basis to each shares class of a Fund according to their respective net assets.
As of July 31, 2017, all Trustees and officers of the Trust as a group owned less than 1% of the Fund’s outstanding shares.
3. INVESTMENT TRANSACTIONS
For the year ended July 31, 2017, cost of purchase and proceeds from sales of investments other than short-term obligations were as follows:
| PURCHASES | SALES | |||||||
U.S. Government Securities | $ | 431,248,658 | $ | 438,133,298 | ||||
Investments in Securities | 218,824,963 | 200,932,075 | ||||||
97
DOMINI IMPACT BOND FUND
NOTES TO FINANCIAL STATEMENTS (continued)
July 31, 2017
4. SUMMARY OF SHARE TRANSACTIONS
| Year Ended July 31, | ||||||||||||||||
| 2017 | 2016 | |||||||||||||||
| Shares | Amount | Shares | Amount | |||||||||||||
Investor Shares | ||||||||||||||||
Shares sold | 2,631,798 | $ | 29,586,950 | 2,293,262 | $ | 25,800,027 | ||||||||||
Shares issued in reinvestment of dividends and distributions | 307,843 | 3,452,693 | 292,524 | 3,279,951 | ||||||||||||
Shares redeemed | (2,715,791) | (30,544,065) | (1,732,531) | (19,432,723) | ||||||||||||
Redemption fees | - | 5,008 | - | 2,900 | ||||||||||||
|
|
|
|
|
|
|
| |||||||||
Net increase (decrease) | 223,850 | $ | 2,500,586 | 853,255 | $ | 9,650,155 | ||||||||||
|
|
|
|
|
|
|
| |||||||||
Institutional Shares | ||||||||||||||||
Shares sold | 405,346 | $ | 4,552,829 | 210,616 | $ | 2,348,828 | ||||||||||
Shares issued in reinvestment of dividends and distributions | 7,977 | 89,334 | 5,092 | 57,313 | ||||||||||||
Shares redeemed | (113,635) | (1,279,772) | (152,917) | (1,702,929) | ||||||||||||
Redemption fees | - | 334 | - | 1 | ||||||||||||
|
|
|
|
|
|
|
| |||||||||
Net increase (decrease) | 299,688 | $ | 3,362,725 | 62,791 | $ | 703,213 | ||||||||||
|
|
|
|
|
|
|
| |||||||||
Total | ||||||||||||||||
Shares sold | 3,037,144 | $ | 34,139,779 | 2,503,878 | $ | 28,148,855 | ||||||||||
Shares issued in reinvestment of dividends and distributions | 315,820 | 3,542,027 | 297,616 | 3,337,264 | ||||||||||||
Shares redeemed | (2,829,426) | (31,823,837) | (1,885,448) | (21,135,652) | ||||||||||||
Redemption fees | - | 5,342 | - | 2,901 | ||||||||||||
|
|
|
|
|
|
|
| |||||||||
Net increase (decrease) | 523,538 | $ | 5,863,311 | 916,046 | $ | 10,353,368 | ||||||||||
|
|
|
|
|
|
|
| |||||||||
5. SUMMARY OF DERIVATIVE ACTIVITY
At July 31, 2017, the Fund’s investments in derivative contracts are reflected on the Statement of Assets and Liabilities as follows:
Asset Derivatives | Liability Derivatives | |||||||||||
| Derivative Contracts Not Accounted for as Hedging Instruments | Statement of Asssets and Liabilities Location | Fair Value | Statement of Asssets and Liabilities Location | Fair Value | ||||||||
Interest rate contracts | Variation Margin /Unrealized appreciation on OTC swap contracts / Net assets consist of - net unrealized appreciation | $ | 602,278 | Variation Margin / Net assets consist of - net unrealized depreciation | $ | 348,852 | ||||||
Credit contracts | Variation Margin / Net assets consist of - net unrealized appreciation (depreciation) | - | Variation Margin / Net assets consist of - net unrealized appreciation (depreciation) | 20,416 | ||||||||
98
DOMINI IMPACT BOND FUND
NOTES TO FINANCIAL STATEMENTS (continued)
July 31, 2017
Asset Derivatives | Liability Derivatives | |||||||||||
| Derivative Contracts Not Accounted for as Hedging Instruments | Statement of Asssets and Liabilities Location | Fair Value | Statement of Asssets and Liabilities Location | Fair Value | ||||||||
Foreign exchange contracts | Unrealized appreciation on forward currency contracts / Net assets consist of - net unrealized appreciation | $ | 26,782 | Unrealized depreciation on forward currency contracts / Net assets consist of - net unrealized depreciation | $ | 28,277 | ||||||
Future contracts | Receivable for variation margin futures / Net assets consist of - net unrealized appreciation | 42,423 | Payable for variation margin futures / Net assets consist of - net unrealized depreciation | - | ||||||||
|
|
|
| |||||||||
Total | $ | 671,483 | $ | 397,545 | ||||||||
|
|
|
| |||||||||
For the year ended July 31, 2017, the effect of derivative contracts on the Fund’s Statement of Operations was as follows:
Derivative Contracts Not Accounted for as Hedging Instruments | Statement of Operations Location | Realized Gain (Loss) | Change in Unrealized Appreciation (Depreciation) | |||||||
Interest rate contracts | Net realized gain (loss) from swap contracts/ Net change in unrealized appreciation (depreciation) from investments, futures and swap contracts | $ | 486,516 | $ | 181,434 | |||||
Credit contracts | Net realized gain (loss) from swap contracts/ Net change in unrealized appreciation (depreciation) from investments, futures and swap contracts | 7,302 | (45,175 | ) | ||||||
Foreign exchange contracts | Net realized gain (loss) from foreign currency/ Net change in unrealized appreciation (depreciation) from translation of assets and liabilities in foreign currencies | 76,757 | (83,107 | ) | ||||||
99
DOMINI IMPACT BOND FUND
NOTES TO FINANCIAL STATEMENTS (continued)
July 31, 2017
Derivative Contracts Not Accounted for as Hedging Instruments | Statement of Operations Location | Realized Gain (Loss) | Change in Unrealized Appreciation (Depreciation) | |||||||
Futures contracts | Net realized gain (loss) from futures contracts/ Net change in unrealized appreciation (depreciation) from investments, futures and swap contracts | $ | (68,783 | ) | $ | 51,929 | ||||
Options purchases | Net realized gain (loss) from options contracts/ Net change in unrealized appreciation (depreciation) from investments, futures and swap contracts | (626 | ) | - | ||||||
|
|
|
| |||||||
Total | $ | 501,166 | $ | 105,081 | ||||||
|
|
|
| |||||||
6. OFFSETTING OF FINANCIAL AND DERIVATIVE ASSETS AND LIABILITIES
The following table summarizes any derivatives, at the end of the reporting period, that are subject to a master netting agreement or similar agreement. For financial reporting purposes, the Fund does not offset assets and liabilities that are subject to the master netting agreements in the Statement of Assets and Liabilities.
| Credit Suisse International | Deutsche Bank AG | Morgan Stanley | Total | |||||||||||||
Assets: | ||||||||||||||||
Cash held at other banks | $ | 53,080 | $ | - | $ | 266,469 | $ | 319,549 | ||||||||
Unrealized appreciation on OTC swaps contracts* | - | 95,588 | - | 95,588 | ||||||||||||
Receivable for variation margin swap contracts | - | - | 518,989 | 518,989 | ||||||||||||
|
|
|
|
|
|
|
| |||||||||
Total Assets | $ | 53,080 | $ | 95,588 | $ | 785,458 | $ | 934,126 | ||||||||
Liabilities: | ||||||||||||||||
Cash due to broker | 30,277 | - | 64,808 | 95,085 | ||||||||||||
Payable for variation margin swap contracts | - | - | 381,567 | 381,567 | ||||||||||||
|
|
|
|
|
|
|
| |||||||||
Total Liabilities | $ | 30,277 | $ | - | $ | 446,375 | $ | 476,652 | ||||||||
|
|
|
|
|
|
|
| |||||||||
Total Derivative Net Assets | $ | 22,803 | $ | 95,588 | $ | 339,083 | $ | 457,474 | ||||||||
|
|
|
|
|
|
|
| |||||||||
Total collateral received (pledged) | - | (100,000) | 709,806 | 609,806 | ||||||||||||
Net Amount | $ | 22,803 | $ | (4,412) | $ | 1,048,889 | $ | 1,067,280 | ||||||||
|
|
|
|
|
|
|
| |||||||||
* Excludes premiums if any. Included in unrealized appreciation/depreciation on OTC swap contracts on the Statement of Assets and Liabilities.
100
DOMINI IMPACT BOND FUND
NOTES TO FINANCIAL STATEMENTS (continued)
July 31, 2017
7. SUMMARY OF DERIVATIVE ACTIVITY
The volume of activity for the reporting period for any derivative type that was held during the period is listed below and was as follows based on an average of the holdings at the end of each fiscal quarter:
Futures contracts (number of contracts) | 10 | |||
Forward currency contracts (contract amount) | $ | 1,891,607 | ||
OTC interest rate swap contracts (notional) | $ | 5,539,250 | ||
Centrally cleared interest rate swap contracts (notional) | $ | 33,690,625 | ||
OTC credit default contracts (notional) | $ | 1,278,354 | ||
Centrally cleared credit default contracts (notional) | $ | 4,621,325 |
8. FEDERAL TAX STATUS
The tax basis of the components of net assets at July 31, 2017 is as follows:
Undistributed ordinary income | $ | - | ||
Capital losses, other losses and other temporary differences | (331,013) | |||
Unrealized appreciation (depreciation) | 1,814,296 | |||
|
| |||
Distributable net earnings (deficit) | $ | 1,483,283 | ||
|
|
The difference between components of Distributable Earnings on a tax basis and the amounts reflected in the statement of assets and liabilities are primarily due to differences in book and tax policies.
For the year ended July 31, 2017, the Fund reclassified $29,470 from undistributed net investment income to accumulated net realized gain (loss) and $43,474 from paid in capital to accumulated net realized gain (loss) to align financial reporting and tax reporting.
During the period November 1, 2016 through July 31, 2017, the Domini Impact Bond Fund had net realized capital losses of $103,926 and ordinary losses of $184,094. These losses are deferred and will be recognized on August 1, 2017, for tax purposes.
Under recently enacted Regulated Investment Company Modernization Act of 2010, the Fund will be permitted to carry forward capital losses incurred in taxable years beginning after December 22, 2010, for an unlimited time period. However, any losses incurred during those future taxable years will be required to be utilized prior to the losses incurred in pre-enactment taxable years. As a result of this ordering rule, pre-enactment capital loss carryforwards may be more likely to expire unused. Additionally, post-enactment capital losses that are carried forward will retain their character as either short-term or long-term capital losses rather than being considered all short-term as under previous law.
101
DOMINI IMPACT BOND FUND
NOTES TO FINANCIAL STATEMENTS (continued)
July 31, 2017
For federal income tax purposes, dividends paid were characterized as follows:
| Year Ended | ||||||||
| 2017 | 2016 | |||||||
Ordinary income | $ | 3,496,189 | $ | 3,172,492 | ||||
Long-term capital gain | 229,068 | 387,829 | ||||||
Return of capital | 43,474 | - | ||||||
|
|
|
| |||||
Total | $ | 3,768,731 | $ | 3,560,321 | ||||
|
|
|
| |||||
The Fund is subject to the provisions of Accounting Standards Codification ASC 740 Income Taxes (ASC 740). ASC 740 sets forth a minimum threshold for financial statement recognition of the benefit of a tax position taken or expected to be taken in a tax return. The Fund did not have a liability to record for any unrecognized tax benefits in the accompanying financial statements. No provision has been made for taxes on income, capital gains or unrealized appreciation on securities held or for excise tax on income and capital gains.
102
Report of Independent Registered Public Accounting Firm
Board of Trustees and Shareholders of
Domini Investment Trust:
We have audited the accompanying statements of assets and liabilities, including the portfolio of investments, of Domini Impact Bond Fund (the “Fund”), a Fund within the series of the Domini Investment Trust, as of July 31, 2017, and the related statements of operations for the year then ended, the statements of changes in net assets for each of the years in the two-year period then ended, and the financial highlights for each of the years in the five-year period then ended. These financial statements and financial highlights are the responsibility of the Fund’s management. Our responsibility is to express an opinion on these financial statements and financial highlights based on our audits.
We conducted our audits in accordance with the auditing standards of the Public Company Accounting Oversight Board (United States). Those standards require that we plan and perform the audit to obtain reasonable assurance about whether the financial statements and financial highlights are free from material misstatement. An audit includes examining, on a test basis, evidence supporting the amounts and disclosures in the financial statements. Our procedures included confirmation of securities owned as of July 31, 2017, by correspondence with custodian and brokers, or by other appropriate auditing procedures. An audit also includes assessing the accounting principles used and significant estimates made by management, as well as evaluating the overall financial statement presentation. We believe that our audits provide a reasonable basis for our opinion.
In our opinion, the financial statements and financial highlights referred to above present fairly, in all material respects, the financial position of the Domini Impact Bond Fund as of July 31, 2017, and the results of its operations for the year then ended, the changes in its net assets for each of the years in the two-year period then ended, and the financial highlights for each of the years in the five-year period then ended, in conformity with U.S. generally accepted accounting principles.
September 27, 2017
Boston, MA
103
THE DOMINI FUNDS
TAX INFORMATION (UNAUDITED)
FOR THE YEAR ENDED JULY 31, 2017
The amount of long-term capital gains paid for the year ended July 31, 2017 was as follows:
Domini Impact Equity Fund | $ | 23,410,947 | ||
Domini Impact International Equity Fund | - | |||
Domini Impact Bond Fund | 229,068 |
For dividends paid from net investment income during the year ended July 31, 2017, the Funds designated the following as Qualified Dividend Income:
Domini Impact Equity Fund | $ | 15,498,644 | ||
Domini Impact International Equity Fund | 26,134,203 |
Of the ordinary distributions made by the Domini Impact Bond Fund during the fiscal year ended July 31, 2017, 34% has been derived from investments in US Government and Agency Obligations. All or a portion of the distributions from this income may be exempt from taxation at the state level. Consult your tax advisor for state specific information.
For corporate shareholders, 100% of dividends paid from net investment income for the Domini Impact Equity Fund were eligible for the corporate dividends received deduction.
| Foreign Tax Paid | Foreign Source Income | |||||||||||||||
| TOTAL | PER SHARE | TOTAL | PER SHARE | |||||||||||||
Domini Impact International Equity Fund | $ | 2,182,260 | $ | 0.02 | $ | 29,401,704 | $ | 0.24 | ||||||||
The foreign taxes paid or withheld per share represent taxes incurred by the Funds on interest and dividends received by the Fund from foreign sources. Foreign taxes paid or withheld should be included in taxable income with an offsetting deduction from gross income or as a credit for taxes paid to foreign governments. Consult your tax advisor regarding the appropriate treatment of foreign taxes paid.
104
BOARD OF TRUSTEES’ APPROVAL OF MANAGEMENT AND SUBMANAGEMENT AGREEMENTS (UNAUDITED)
Section 15(c) of the Investment Company Act of 1940, as amended (the “1940 Act”) requires that each mutual fund’s board of trustees, including a majority of those trustees who are not “interested persons” of the mutual fund, as defined in the 1940 Act (the “Independent Trustees”), annually review and consider the fund’s investment management and submanagement agreements. At its meeting held on April 27, 2017, the Board of Trustees (“Board”) of the Domini Impact Equity Fund (the “Equity Fund”), Domini Impact International Equity Fund (the “International Fund”), and the Domini Impact Bond Fund (the “Bond Fund”) (each a “Fund,” and collectively the “Funds”), including a majority of the Independent Trustees, voted to approve the proposed management agreements for the Funds with Domini Impact Investments LLC (“Domini”), and the proposed submanagement agreements between Domini and Wellington Management Company LLP (“Wellington Management”) for the Equity Fund, International Fund and Bond Fund (together, Domini and Wellington Management, the “Advisers”).
Prior to the April 27, 2017, meeting, the Board requested, received, and reviewed written responses from the Advisers to questions posed to them on behalf of the Independent Trustees and supporting materials relating to those questions and responses. The Board considered information furnished to the Board at its meetings throughout the year, as well as information specifically prepared in connection with the approval of the proposed management and submanagement agreements at the Board’s meeting on April 27, 2017. Information provided to the Board at its meetings throughout the year included, among other things, reports on each Fund’s performance, legal and compliance matters, sales and marketing activity, shareholder services, and the other service provided to the Funds by the Advisers.
In determining to approve the above-referenced management and submanagement agreements, the Board reviewed and evaluated information and factors it believed to be relevant and appropriate in light of the information that the Trustees deemed necessary and appropriate through the exercise of their reasonable business judgment. While individual Trustees may have weighed certain factors differently, the Board’s determination to continue the management and submanagement agreements was based on a comprehensive consideration of all information provided to the Board throughout the year and specifically with respect to the continuation or approval of such agreements, as applicable. The Trustees did not identify any particular information or factor that was all-important or controlling.
Set forth below is a discussion of the factors that the Board considered with respect to its approval of the above-referenced management and submanagement agreements.
105
DOMINI IMPACT EQUITY FUND
Nature, Quality, and Extent of Services Provided. The Trustees noted that pursuant to the Equity Fund’s management agreement, Domini, subject to the direction of the Board, is responsible for providing advice and guidance with respect to the Equity Fund and for managing the investment of the assets of the Equity Fund, which it does by engaging and overseeing the activities of Wellington Management. They considered that under the management agreement, Domini is responsible for applying social and environmental standards to a universe of securities. In addition, they noted that Domini manages the Equity Fund’s business and affairs, including coordination of the activities of service providers, pursuant to a sponsorship agreement. The Trustees considered the scope and quality of the services to be provided by Wellington Management, such as the provision of the day-to-day portfolio management of the Equity Fund, including making purchases and sales of socially screened portfolio securities consistent with the Equity Fund’s investment objective and policies.
The Trustees considered the professional experience, tenure, and qualifications of the portfolio management team and the other senior personnel at Domini and Wellington Management. They also considered Domini’s capabilities and experience in the development and application of social and environmental standards and its reputation, leadership in the socially responsible investment community, and quality of management and administrative services provided to the Fund. In addition, they considered the compliance policies, procedures, and record of Domini and Wellington Management. The Trustees concluded that Domini and Wellington Management had the necessary capabilities, resources, and personnel to continue providing services under the management and submanagement agreements.
Investment Results. The Trustees reviewed information provided to them by Domini regarding the net investment returns of the Equity Fund for the year to date, 6-month, and 1-, 3-, 5- and 10-year periods ended December 31, 2016 and February 28, 2017, as well as the Equity Fund’s performance for each full calendar year since inception (June 3, 1991) and cumulative performance from inception, through December 31, 2016 and February 28, 2017. They compared those returns to the returns of the applicable benchmark for the Equity Fund (S&P 500), for the same periods, the performance of the relevant socially responsible (SRI) peer group of funds as classified by Strategic Insight, as well as the applicable decile ranks, for the for the 1-, 3-, 5-, and 10-year periods ended February 28, 2017. The Trustees noted that the Equity Fund’s Investor share net investment returns as of December 31 for each calendar year were positive for all years since Wellington became submanager except for each of the full calendar years 2008 and 2015, and had outperformed relative to the S&P 500 for each of the 2009, 2013 and 2014 calendar years. The Trustees noted that the Equity Fund Investor shares had positive net investment
106
performance for each of the year to date, 6-month, 1-, 3-, 5-, and 10-year periods as of February 28, 2017, and had outperformed relative to the applicable SRI peer group for the 1-year period compared to the group’s average and median performance for the same period. The Trustees also considered the decile rank of the Equity Fund for the 1-, 3-, 5- and 10- year periods ended February 28, 2017, compared to the decile ranks of its peer group for the same periods noting that the Investor shares of the Equity Fund are in the 3rd decile for the 1- and 3-year periods and 4th decile for the 5- and 10-year periods.
The Trustees considered recent market conditions, and the information they received from Wellington Management and Domini regarding the performance of and enhancements to the Wellington Management quantitative model. The Trustees concluded that they had continued confidence in the capability of Domini and Wellington Management to manage the Equity Fund but would continue to monitor the performance of the Fund.
Fees and Other Expenses. The Trustees considered the management and submanagement fees paid to Domini and Wellington Management with respect to the Equity Fund, the portion of the fees retained by Domini, Domini’s contractual fee waiver arrangements with respect to the Fund, and the proposed changes to the existing fee arrangements with Domini and the submanager. The Trustees also considered the sponsorship fee rate paid by the Equity Fund to Domini under the sponsorship agreement. The Trustees considered the responses Domini and Wellington Management provided with respect to the fees that each of Domini and Wellington Management charges its other clients with similar investment objectives and strategies. The Trustees considered Wellington Management’s representation that the submanagement fee it receives with respect to the Fund is competitive with the general range of the fees Wellington Management receives with respect to other client funds of similar size. The Trustees considered that Domini (and not the Equity Fund) pays Wellington Management from its advisory fee and that the proposed aggregate advisory fee was lower than the current aggregate fee. The Trustees considered the information provided to them by Strategic Insight regarding the level of the Equity Fund Investor shares aggregate management and sponsorship fees versus the management and administrative fees for a relevant peer group of socially responsible funds and compared the Fund’s total expense ratio to the total expense ratios of those peers, taking into account the agreed upon waiver of fees. The Trustees noted that the Fund’s aggregate management and sponsorship fees were slightly higher relative to the average and median management and administrative fees of the relevant peer group taking into account applicable contractual fee waivers. The Trustees noted that the Fund’s total expense ratio, after giving effect to the contractual fee waiver arrangements, was slightly higher relative to the median and average total expense ratios of the relevant peer group. It was noted that both Domini and Wellington Management had proposed changes to their fee arrangements and
107
that the aggregate advisory fee would be lower relative to the average and median of the relevant peer group under the proposed management agreement. In light of the foregoing, and taking into account such other matters as the Trustees considered relevant in the exercise of their reasonable judgment, the Trustees concluded that the management and submanagement fees payable with respect to the Equity Fund were reasonable in relation to the nature and quality of the services to be provided and supported the approval of the management and submanagement agreements.
Costs of Services Provided and Profitability. The Trustees reviewed information provided to them by Domini concerning the costs borne by and profitability of Domini with respect to the advisory and sponsorship services provided, along with a description of the methodology used by Domini in preparing the profitability information. The Trustees also reviewed the financial results realized by Domini as of December 31, 2016. The Trustees concluded that they were satisfied that Domini’s level of profitability with respect to the Equity Fund was not excessive in view of the nature, quality, and extent of services provided.
The Trustees reviewed Wellington Management’s audited consolidated balance sheet as of December 31, 2015. The Trustees also considered Wellington Management’s representation that there have been no material changes in the firm since December 31, 2015 and that the pro-forma income statement for the year ended December 31, 2016, reflected partnership income as if the firm was in corporate form. The pro-forma statement provided supplementally identified the revenues generated by the Equity Fund as a separate item and reflected assumptions and estimates regarding operating expenses. Based on the information provided, the Trustees concluded that they were satisfied that Wellington Management’s level of profitability with respect to the Equity Fund was not excessive in view of the nature, quality, and extent of services provided to the Equity Fund.
Economies of Scale. The Trustees also considered whether economies of scale would be realized by Domini and Wellington Management as assets grew and the extent to which economies of scale were reflected in the fees to be charged under the proposed management and submanagement agreements. The Trustees noted that there were breakpoints in the proposed fee schedules for each agreement. They concluded that breakpoints were an effective way to share economies of scale with shareholders and that this was a positive factor in support of approval of the management and submanagement agreements.
Other Benefits. The Trustees considered the other benefits that Domini, Wellington Management, and their respective affiliates receive from their relationship with the Equity Fund. The Trustees reviewed the character and amount of payments received by Domini and its affiliates in connection with the Equity Fund, including sponsorship fees. The Trustees considered the brokerage
108
practices of Domini and Wellington Management, including their use of soft dollar arrangements. The Trustees also considered the intangible benefits that would continue to accrue to Domini, Wellington Management, and each of their respective affiliates by virtue of their relationship with Equity Fund and the other Domini funds. The Trustees concluded that the benefits received by Domini, Wellington Management, and their respective affiliates were reasonable and supported the approval of the management and submanagement agreements.
DOMINI IMPACT INTERNATIONAL EQUITY FUND
Nature, Quality, and Extent of Services Provided. The Trustees noted that pursuant to the Fund’s management agreement, Domini, subject to the direction of the Board, is responsible for providing advice and guidance with respect to the Fund and for managing the investment of the assets of the Fund, which it does by engaging and overseeing the activities of Wellington Management. They considered that under the management agreement, Domini is responsible for applying social and environmental standards to a universe of securities. The Trustees considered the scope and quality of the services to be provided by Wellington Management pursuant the submanagement agreement, such as the provision of the day-to-day portfolio management of the Fund, including making purchases and sales of socially screened portfolio securities consistent with the Fund’s investment objective and policies.
The Trustees considered the professional experience, tenure, and qualifications of the portfolio management teams and the other senior personnel at Domini and Wellington Management. They also considered Domini’s capabilities and experience in the development and application of social and environmental standards and its reputation and leadership in the socially responsible investment community, and quality of management and administrative services provided to the Fund. In addition, they considered the compliance policies, procedures, and record of Domini and Wellington Management. The Trustees concluded that Domini and Wellington Management had the necessary capabilities, resources, and personnel to continue providing services under the management and submanagement agreements.
Investment Results. The Trustees reviewed information provided to them by Domini regarding the net investment returns of the International Fund for the year to date, 6-month, and 1-, 3-, 5- and 10-year periods ended December 31, 2016 and February 28, 2017, as well as the International Fund’s performance for each full calendar year since inception (December 27, 2006) and cumulative performance from inception, through December 31, 2016 and February 28, 2017. They compared those returns to the returns of the applicable benchmark for the International Fund (MSCI EAFE Index), for the same periods, the performance of the relevant peer group of funds as classified by Strategic Insight, as well as the applicable decile ranks, for the 1-, 3- and 5-year periods
109
ended February 28, 2017. The Trustees noted that the International Fund Investor shares net returns as of December 31, 2016 were positive for the latest 6month,1- 3-, 5-, and 10-year periods and had outperformed relative to its benchmark for the 1-, 3- and 5-year periods. The Trustees noted that the International Fund Investor shares had positive net investment returns for all periods ended February 28, 2017, and outperformed relative to its relevant peer groups of socially responsible (SRI) and non-SRI funds compared to each group’s median and average performance for the 5-year period ended February 28, 2017. The Trustees also noted that the International Fund Investor shares were in the 6th decile for the 1- and 3- year periods, the 4th decile for the 5-year period, and the 8th decile for the 10-year period. The Trustees considered the recent market conditions and the information they received regarding the performance of Wellington Management’s quantitative model. The Trustees concluded that they had continued confidence in the capability of Domini and Wellington Management to manage the International Fund.
Fees and Other Expenses. The Trustees considered the management and submanagement fees paid to Domini and Wellington Management with respect to the International Fund, the portion of the fees retained by Domini, Domini’s contractual fee waiver arrangement, and the proposed changes to the existing fee arrangements with Domini and the submanager. The Trustees considered the responses Domini and Wellington Management provided with respect to the fees that each of Domini and Wellington Management charges its other clients with similar investment objectives. The Trustees considered that Domini (and not the Fund) pays Wellington Management from its advisory fee and that that the proposed aggregate advisory fee was lower than the current aggregate fee. The Trustees considered Wellington Management’s representation that the submanagement fee it receives is competitive with the general range of the fees Wellington Management receives with respect to its other client funds of similar size. The Trustees considered the information provided to them by Strategic Insight regarding the level of the International Fund Investor shares management and administrative fees versus the median management and administrative fees for relevant peer groups of SRI and non-SRI funds and compared the Fund’s total expense ratio to the median total expense ratios of those peers, taking into account the agreed upon waiver of fees. The Trustees noted that the Fund’s management fees, were higher relative to the median management and administrative fees of the relevant SRI and non-SRI peer groups taking into account the applicable contractual fee waiver arrangements but were about the same as the median management and administrative fees of the SRI peer group without agreed upon fee waivers. The Trustees noted that the Fund’s total expense ratio, after giving effect to contractual expense waivers, was higher relative to the median and average total expense ratio of the SRI peer group. It was noted that both Domini and Wellington Management had proposed changes to their fee arrangements and that the aggregate advisory fee would be about the same or lower relative to the average
110
and median of the relevant peer groups under the proposed management agreement. In light of the foregoing, and taking into account such other matters as the Trustees considered relevant in the exercise of their reasonable judgment, the Trustees concluded that the management and submanagement fees payable with respect to each Fund were reasonable in relation to the nature and quality of services to be provided and supported approval of the management and submanagement agreements.
Costs of Services Provided and Profitability. The Trustees reviewed information provided to them by Domini concerning the costs borne by and profitability of Domini with respect to the advisory services provided, along with a description of the methodology used by Domini in preparing the profitability information. The Trustees also reviewed the financial results realized by Domini as of December 31, 2016. The Trustees concluded that they were satisfied that Domini’s level of profitability with respect to the Fund was not excessive in view of the nature, quality, and extent of services provided.
The Trustees reviewed Wellington Management’s audited consolidated balance sheet as of December 31, 2015. The Trustees also considered Wellington Management’s representation that there have been no material changes in the firm since December 31, 2015 and that its unaudited pro-forma income statement for the year ended December 31, 2016 reflected partnership income as if the firm was in corporate form. The pro-forma income statement provided supplementally identified the revenues generated by each Fund as a separate item and reflected assumptions and estimates regarding operating expenses. Based on the information provided, the Trustees concluded that they were satisfied that Wellington Management’s level of profitability with respect to the Funds was not excessive in view of the nature, quality, and extent of services provided to each Fund.
Economies of Scale. The Trustees also considered whether economies of scale would be realized by Domini and Wellington Management as assets grew and the extent to which economies of scale were reflected in the fees charged under the proposed management and submanagement agreements. The Trustees noted that there were breakpoints in the fees charged under the proposed management and submanagement agreements. They concluded that breakpoints were an effective way to share economies of scale with shareholders and that this was a positive factor in support of approval of the management and submanagement agreements.
Other Benefits. The Trustees considered the other benefits that Domini, Wellington Management, and their respective affiliates receive from their relationship with the International Fund. The Trustees reviewed the character and amount of payments received by Domini and its affiliates in connection with the Fund. The Trustees considered the brokerage practices of Domini and Wellington Management, including their use of soft dollar arrangements. The
111
Trustees also considered the intangible benefits that would continue to accrue to Domini, Wellington Management, and each of their respective affiliates by virtue of their relationship with each Fund and the other Domini funds. The Trustees concluded that the benefits received by Domini, Wellington Management, and their respective affiliates were reasonable and supported the approval of the management and submanagement agreements.
DOMINI IMPACT BOND FUND
Nature, Quality, and Extent of Services Provided. The Trustees noted that pursuant to the management agreement for the Bond Fund, Domini, subject to the direction of the Board, is responsible for providing advice and guidance with respect to the Bond Fund and for managing the investment of the assets of the Bond Fund, which it does by engaging and overseeing the activities of Wellington Management, the submanager to the Fund as of January 7, 2015. They considered that under the management agreement, Domini is responsible for applying social and environmental standards to a universe of securities. They also noted that Domini is responsible for administrative services to the Fund pursuant to an administration agreement. The Trustees also considered the scope and quality of the services to be provided by Wellington Management pursuant the submanagement agreement, such as the provision of the day-to-day portfolio management of the Fund, including making purchases and sales of socially screened portfolio securities consistent with the Fund’s investment objective and policies.
The Trustees considered the professional experience, tenure, and qualifications of the portfolio management team and the other senior personnel at Domini and Wellington Management and that there had been no material changes to the team providing services to the Bond Fund. They also considered Domini’s capabilities and experience in the development and application of social and environmental standards and its reputation and leadership in the socially responsible investment community. The Trustees considered the information they had received from Domini concerning Domini’s social research team. They considered the quality of the management and administrative services Domini provided to the Bond Fund. In addition, they considered the compliance policies, procedures, and record of Domini and Wellington Management. The Trustees concluded that they were satisfied with the nature, quality, and extent of services provided by Domini and Wellington Management to the Bond Fund under the management and submanagement agreements, respectively.
Investment Results. The Trustees reviewed the net investment performance of the Bond Fund provided to them by Domini for the year to date, 6-month, and 1-, 3-, 5- and 10-year periods ended December 31, 2016 and February 28, 2017, as well as the Bond Fund’s performance for each full calendar year since inception (June 1, 2000) and cumulative performance from inception, through December 31, 2016 and February 28, 2017. The Trustees compared these
112
investment returns to the returns of the Bond Fund’s benchmark, the Bloomberg Barclays U.S. Aggregate Bond Index, for the same periods as of December 31, 2016 and February 28, 2017, and the performance of relevant peer groups of socially responsible (SRI) and non-SRI funds as classified by Strategic Insight, as well as the applicable decile ranks for the 1, 3-, 5-, and 10-year periods ended February 28, 2017. The Trustees noted that the Bond Fund Investor shares had positive net investment performance for all periods provided to them by Domini except the latest 6-month, and 2013 and 2015 calendar year periods ended December 31, 2016 and February 28, 2017, and had outperformed relative to its benchmark for the year to date, six-month and 1-year period ended December 31, 2016, as well as the 2016 calendar year. The Trustees noted that the Bond Fund Investor shares had underperformed its SRI and non-SRI peer groups relative to the groups’ median performance for all periods for both groups. The Trustees noted that the Bond Fund was in the 9th decile for the 1-year period, 7th decile for the 3-year period, 9th decile for the 5-year period and the 6th decile for the 10-year period. The Trustees considered the recent market conditions, the relatively short tenure of the current submanager, the prior change in the Funds’ benchmark and the impact of the legacy performance of the Bond Fund. In light of the foregoing, the Trustees concluded that they had continued confidence in the capability of Domini and Wellington Management to manage the Bond Fund but would continue to monitor the performance of the Fund.
Fees and Other Expenses. The Trustees considered the management and submanagement fees paid to Domini and Wellington Management with respect to the Bond Fund, the portion of the fees retained by Domini, Domini’s contractual fee waiver arrangement and the proposed changes to the existing fee arrangements with Domini and the submanager. The Trustees also considered the administrative fees paid by the Bond Fund to Domini. The Trustees considered that Domini (and not the Bond Fund) pays the submanager from its advisory fee and that that the proposed aggregate advisory fee was lower than the current aggregate fee. The Trustees considered the information provided to them by Strategic Insight regarding the level of the Bond Fund Investor shares management and administrative fees versus the management and administrative fees for a relevant peer group of SRI and non-SRI funds and compared the Bond Fund’s total expense ratio to the total expense ratios of those peers, taking into account the agreed-upon waiver of fees. The Trustees noted that the management and administrative fee for the Bond Fund, after giving effect to contractual expense waivers, was lower than the median management and administrative fees of the relevant SRI peer group and about the same as the median for the non-SRI peer group. The Trustees also noted that the total expense ratio of the Bond Fund after giving effect to contractual expense waivers was about the same relative to the median total expense ratio of its SRI peer group. It was noted that both Domini and Wellington Management had proposed changes to their fee arrangements and that the aggregate advisory fee
113
would be lower relative to the average and median of the relevant peer groups under the proposed management agreement. In light of the foregoing, and taking into account the size of the Bond Fund and such other matters as the Trustees considered relevant in the exercise of their reasonable judgment, the Trustees concluded that the management and submanagement fees payable with respect to the Bond Fund under the applicable agreement are reasonable in relation to the nature and quality of the services to be provided and supported approval of the management and submanagement agreements.
Costs of Services Provided and Profitability. The Trustees reviewed information provided to them by Domini concerning the costs borne by and profitability of Domini with respect to the advisory and administrative services provided to the Bond Fund in 2016 along with a description of the methodology used by Domini in preparing the profitability information. The Trustees also reviewed the financial results realized by Domini as of December 31, 2016. The Trustees concluded that they were satisfied that Domini’s level of profitability with respect to the Bond Fund was not excessive in view of the nature, quality, and extent of services provided.
The Trustees reviewed Wellington Management’s audited consolidated balance sheet as of December 31, 2015. The Trustees also considered Wellington Management’s representation that there have been no material changes in the firm since December 31, 2015 and that its unaudited pro-forma income statement for the year ended December 31, 2016 reflected partnership income as if the firm was in corporate form. The pro-forma income statement provided supplementally identified the revenues generated by the Funds as a separate item and reflected assumptions and estimates regarding operating expenses. Based on the information provided, the Trustees concluded that they were satisfied that Wellington Management’s level of profitability with respect to the Bond Fund was not excessive in view of the nature, quality, and extent of services provided to the Fund.
Economies of Scale. The Trustees also considered whether economies of scale would be realized by Domini and Wellington Management as assets grew and the extent to which economies of scale were reflected in the fees charged under the proposed management and submanagement agreements. The Trustees noted that there were breakpoints in the fees charged under the management and submanagement agreement. They concluded that breakpoints were an effective way to share economies of scale with shareholders and that this was a positive factor in support of approval of the management and submanagement agreements.
Other Benefits. The Trustees considered the other benefits that Domini, Wellington Management, and their respective affiliates receive from their relationship with the Bond Fund. The Trustees reviewed the character and amount of payments received by Domini and its affiliates in connection with the
114
Bond Fund and the other Domini funds. The Trustees considered that Domini’s profitability would be lower if the benefits related to administrative services were not received. The Trustees considered the brokerage practices of Domini and Wellington Management, including their use of soft dollar arrangements and noted that Domini did not receive the benefit of “soft dollar” commissions in connection with the Bond Fund. The Trustees also considered the intangible benefits that would continue to accrue to Domini, Wellington Management, and each of their respective affiliates by virtue of their relationship with the Bond Fund and the other Domini funds. The Trustees concluded that the benefits received by Domini, Wellington Management and their respective affiliates were reasonable and supported the approval of the continuance of the management and submanagement agreements.
115
The following table presents information about each Trustee and each Officer of the Domini Investment Trust (the “Trust”) as of July 31, 2017. Asterisks indicate that those Trustees and Officers are “interested persons” (as defined in the Investment Company Act of 1940) of the Trust. Each Trustee and each Officer of the Trust noted as an interested person is interested by virtue of his or her position with Domini Impact Investments LLC as described below. Unless otherwise indicated below, the address of each Trustee and each Officer is 532 Broadway, 9th Floor, New York, NY 10012. Neither the Funds nor the Trust holds annual shareholder meetings for the purpose of electing Trustees, and Trustees are not elected for fixed terms. This means that each Trustee will be elected to hold office until his or her successor is elected or until he or she retires, resigns, dies, or is removed from office. No Trustee or Officer is a director of a public company or a registered investment company other than, with respect to the Trustees, the Domini Funds.
INTERESTED TRUSTEE AND OFFICER | ||||
Name, Age, Position(s) Held, and Length of Time Served | Principal Occupation(s) During Past 5 Years and Other Directorships Held | Number of Funds in the Domini Family of Funds Overseen by Trustee | ||
Amy L. Domini* (67) Chair and Trustee, of the Trust since 1990 | Chairperson (since 2016), CIO (2010-2014), CEO (2002-2015), Member (since 1997), and Manager (since 1997), Domini Impact Investments LLC; Manager (since 1998) and Registered Principal (2003-2017), DSIL Investment Services LLC; Manager, Domini Holdings LLC (holding company) (since 2002); CEO and CIO (2013-2015), NIA Global Solutions (a former division of Domini Impact Investments); Trustee, New England Quarterly (periodical) (since 1998); Private Trustee, Loring, Wolcott & Coolidge Office (fiduciary) (since 1987); Partner (since 1994), Member (since 2010), Loring Wolcott & Coolidge Fiduciary Advisers, LLP (investment advisor); Member (since 2010), Loring, Wolcott & Coolidge Trust, LLC (trust company); Trustee, Church Investment Group (2010-2014); Board Member (since 2016), Cambridge Public Library Foundation (nonprofit). | 3 | ||
DISINTERESTED TRUSTEES | ||||
| Name, Age, Position(s) Held, and Length of Time Served | Principal Occupation(s) During Past 5 Years and Other Directorships Held | Number of Funds in the Domini Family of Funds Overseen by Trustee | ||
Kirsten S. Moy (70) Trustee of the Trust since 1999 | Senior Fellow, The Aspen Institute (research and education) (since July 2014); Scholar in Residence (since 2016) and Board Member (2009-2014), Low Income Investment Fund (housing and community revitalization nonprofit); Board Member, Community Development Finance (asset building non-profit) (since 2006), Visiting Scholar, Federal Reserve Bank of San Francisco (since 2016). | 3 | ||
116
DISINTERESTED TRUSTEES (continued) | ||||
| Name, Age, Position(s) Held, and Length of Time Served | Principal Occupation(s) During Past 5 Years and Other Directorships Held | Number of Funds in the Domini Family of Funds Overseen by Trustee | ||
Gregory A. Ratliff (57) Trustee of the Trust since 1999 | Senior Program Officer, Bill & Melinda Gates Foundation (philanthropy) (2007-2017). | 3 | ||
John L. Shields (64) Trustee of the Trust since 2004 | Managing Director, CFGI, LLC (accounting and finance advisory firm) (since 2016); Director, Navigant Consulting, Inc. (management consulting firm) (2014-2016); President, Advisor Guidance, Inc. (management consulting firm) (2010-2014); Managing Principal, MainStay Consulting Group, LLC (management consulting firm) (2006-2014); Director, Cogo Labs, Inc. (technology company) (since 2008); Advisory Board Member (2003-2015) and Director (since 2015), Vestmark, Inc. (software company). | 3 | ||
OFFICERS | ||||
Name, Age, Position(s) Held, and Length of Time Served | Principal Occupation(s) During Past 5 Years and Other Directorships Held | Number of Funds in the Domini Family of Funds Overseen by Trustee | ||
Megan L. Dunphy* (47) Chief Legal Officer since 2014, Vice President since 2013, Secretary of the Trust since 2005 | General Counsel (since 2014) and Managing Director (2015-2017), Deputy General Counsel (2009-2014), Member (since 2017), Domini Impact Investments LLC; Chief Legal Officer (since 2014), Vice President (since 2013) and Secretary (since 2005), Domini Funds. | N/A | ||
Adam M. Kanzer* (51) Vice President of the Trust since 2007 | Managing Director of Corporate Engagement and Public Policy (since 2017), Managing Director (2007-2017), General Counsel and Director of Shareholder Advocacy (1998-2014), Director of Corporate Engagement and Public Policy (2014-2017), Domini Impact Investments LLC; Chief Legal Officer (2003-2014), Vice President (since 2007), Domini Funds; Member, Securities and Exchange Commission Investor Advisory Committee (2012-2016), Member, Advisory Council, Sustainability Accounting Standards Board (2012-2014); Director, Global Network Initiative (nonprofit human rights organization) (2010-2014; since 2017), Alternate Director 2014-2017). | N/A | ||
117
OFFICERS (continued) | ||||
Name, Age, Position(s) Held, and Length of Time Served | Principal Occupation(s) During Past 5 Years and Other Directorships Held | Number of Funds in the Domini Family of Funds Overseen by Trustee | ||
Carole M. Laible* (53) President of the Trust since 2017 | CEO and Manager (since 2016), President (2005-2015), Member (since 2006), Chief Operating Officer (2013-2015), Nia Global Solutions (a former division of Domini Impact Investments LLC), Domini Impact Investments LLC; President and CEO (since 2002), Chief Compliance Officer (2001-2014), Chief Financial Officer, Secretary, and Treasurer (since 1998), Registered Principal (since 1998), DSIL Investment Services LLC; Manager (since 2016), Domini Holdings LLC (holding company); Treasurer (1997-2015), Vice President (2007-2017), President (since 2017), Domini Funds. | N/A | ||
Douglas Lowe* (61) Assistant Secretary of the Trust since 2007 | Senior Compliance Manager and Counsel, Domini Impact Investments LLC (since 2006); Assistant Secretary, Domini Funds (since 2007); Registered Operations Professional, DSIL Investment Services LLC (since 2012). | N/A | ||
Meaghan O’Rourke-Alexander* (37) Assistant Secretary of the Trust since 2007 | Compliance Officer (since 2012), Senior Compliance Analyst (2009-2012), Domini Impact Investments LLC; Assistant Secretary, Domini Funds (since 2007). | N/A | ||
Christina Povall* (47) Treasurer (since 2017) and Vice President of the Trust since 2013 | Chief Financial Officer (since 2014), Managing Director (2014-2017), Director of Finance (2004-2014), Member (since 2017), Domini Impact Investments LLC; Treasurer (since 2017), Assistant Treasurer (2007-2017) and Vice President (since 2013), Domini Funds; Registered Operations Professional, DSIL Investment Services LLC (since 2012). | N/A | ||
Maurizio Tallini* (43) Chief Compliance Officer of the Trust since 2005 Vice President of the Trust since 2007 | Chief Compliance Officer (since 2005), Chief Operating Officer (2011-2017), Member (since 2007), Domini Impact Investments LLC; Vice President (since 2007), Chief Compliance Officer (since 2005), Domini Funds; Chief Compliance Officer (since 2015), Registered Principal (since 2014) Registered Representative (2012-2015), DSIL Investment Services, LLC. | N/A | ||
The Funds’ Statement of Additional Information includes additional information about the Trustees and is available without charge, upon request, by calling the following toll-free number: 1-800-582-6757.
118
The Domini Funds have established Proxy Voting Policies and Procedures that the Funds use to determine how to vote proxies relating to portfolio securities. The Domini Funds’ Proxy Voting Policies and Procedures are available, free of charge, by calling 1-800-762-6814, by visiting www.domini.com/domini-funds/proxy-voting, or by visiting the EDGAR database on the Securities and Exchange Commission’s (SEC) website at http://www.sec.gov. All proxy votes cast for the Domini Funds are posted to Domini’s website on an ongoing basis over the course of the year. An annual record of all proxy votes cast for the Funds during the most recent 12-month period ended June 30 can be obtained, free of charge, at www.domini.com, and on the EDGAR database on the SEC’s website at http://www.sec.gov.
QUARTERLY PORTFOLIO SCHEDULE INFORMATION
The Domini Funds file their complete schedule of portfolio holdings with the SEC for the first and third quarters of each fiscal year on Form N-Q. The Domini Funds’ Forms N-Q are available on the EDGAR database on the SEC’s website at http://www.sec.gov. These Forms may also be reviewed and copied at the SEC’s Public Reference Room in Washington, D.C. Information about the operation of the Public Reference Room may be obtained by calling 1-800-SEC-0330. The information on Form N-Q is also available to be viewed at www.domini.com.
119
DOMINI FUNDS
P.O. Box 9785
Providence, RI 02940-9785
1-800-582-6757
www.domini.com
Investment Manager, Sponsor, and Distributor:
Domini Impact Investments LLC (Investment Manager and Sponsor)
DSIL Investment Services LLC (Distributor)
532 Broadway, 9th Floor
New York, NY 10012
Investment Submanager:
Domini Impact Equity Fund
Domini Impact International Equity Fund
Domini Impact Bond Fund
Wellington Management Company LLP
280 Congress Street
Boston, MA 02210
Transfer Agent:
BNY Mellon Asset Servicing
760 Moore Road
King of Prussia, PA 19406
Custodian:
State Street Bank and Trust Company
1 Iron Street
Boston, MA 02210
Independent Registered Public Accounting Firm:
KPMG LLP
Two Financial Center
60 South Street
Boston, MA 02111
Legal Counsel:
Morgan, Lewis & Bockius LLP
One Federal Street
Boston, MA 02110
| Item 2. | Code of Ethics. |
(a) As of the end of the period covered by this report on Form N-CSR, the registrant has adopted a code of ethics that applies to the registrant’s principal executive officer, principal financial officer, and principal accounting officer.
(c) Not applicable.
(d) Not applicable.
(e) Not applicable.
(f) Registrant is filing its code of ethics with this report.
| Item 3. | Audit Committee Financial Expert. |
John L. Shields, a member of the Audit Committee, has been determined by the Board of Trustees of the registrant in its reasonable business judgment to meet the definition of “audit committee financial expert” as such term is defined in the instructions to Form N-CSR. In addition, Mr. Shields is an “independent” member of the Audit Committee as defined in the instructions to Form N-CSR.
| Item 4. | Principal Accountant Fees and Services. |
(a) Audit Fees
For the fiscal years ended July 31, 2017, and July 31, 2016, the aggregate audit fees billed to the registrant by KPMG LLP (“KPMG”) for professional services rendered for the audits of the financial statements, or services that are normally provided in connection with statutory and regulatory filings or engagements for those fiscal years, are shown in the table below:
Fund | 2017 | 2016 | ||
| Domini Impact Equity Fund | $38,400 | $38,400 | ||
| Domini Impact Bond Fund | $32,000 | $32,000 | ||
| Domini Impact International Equity Fund | $32,000 | $32,000 | ||
(b) Audit-Related Fees
There were no audit-related fees billed by KPMG for services rendered for assurance and related services to the registrant that were reasonably related to the performance of the audit or review of the registrant’s financial statements, but not reported as audit fees, for the fiscal years ended July 31, 2017, and July 31, 2016.
There were no audit-related fees billed by KPMG for the fiscal years ended July 31, 2017, and July 31, 2016 that were required to be approved by the registrant’s Audit Committee for services rendered on behalf of Domini Impact Investments LLC and entities controlling, controlled by, or under common control with Domini Impact Investments LLC (not including any subadviser whose role is primarily portfolio management and is subcontracted with or overseen by another investment adviser) that provide ongoing services to the registrant (“Service Providers”).
(c) Tax Fees
In each of the fiscal years ended July 31, 2017, and July 31, 2016, the aggregate tax fees billed by KPMG for professional services rendered for tax compliance, tax advice, and tax planning for the registrant are shown in the table below:
Fund | 2017 | 2016 | ||
| Domini Impact Equity Fund | $6,700 | $6,700 | ||
| Domini Impact Bond Fund | $6,700 | $6,700 | ||
| Domini Impact International Equity Fund | $6,700 | $6,700 | ||
There were no tax fees billed by KPMG for the fiscal years ended July 31, 2017, and July 31, 2016 that were required to be approved by the registrant’s Audit Committee for services rendered on behalf of the registrant’s Service Providers.
(d) All Other Fees
There were no other fees billed by KPMG for the fiscal years ended July 31, 2017 and July 31, 2016 for other non-audit services rendered to the registrant.
There were no other fees billed by KPMG for the fiscal years ended July 31, 2017, and July 31, 2016 that were required to be approved by the registrant’s Audit Committee for other non-audit services rendered on behalf of the registrant’s Service Providers.
(e)(1) Audit Committee Preapproval Policy: The Registrant’s Audit Committee Preapproval Policy is set forth below:
| 1. | Statement of Principles |
The Audit Committee is required to preapprove audit and non-audit services performed for each series of the Domini Investment Trust, (each such series a “Fund” and collectively, the “Funds”) by the independent registered public accountant in order to assure that the provision of such services does not impair the accountant’s independence. The Audit Committee also is required to preapprove non-audit services performed by the Funds’ independent registered public
accountant for the Funds’ investment adviser, and certain of the adviser’s affiliates that provide ongoing services to the Funds, if the services to be provided by the accountant relate directly to the operations and financial reporting of the Funds. The preapproval of these services also is intended to assure that the provision of the services does not impair the accountant’s independence.
Unless a type of service to be provided by the independent registered public accountant has received preapproval, it will require separate preapproval by the Audit Committee. Also, any proposed services exceeding preapproved cost levels will require separate preapproval by the Audit Committee. When considering services for preapproval the Audit Committee will take into account such matters as it deems appropriate or advisable, including applicable rules regarding auditor independence.
The appendices to this Policy describe the Audit, Audit-related, Tax and All Other services for the Funds, that have the preapproval of the Audit Committee. The term of any preapproval is 12 months from the date of preapproval, unless the Audit Committee specifically provides for a different period. The Audit Committee will periodically revise the list of preapproved services based on subsequent determinations.
Notwithstanding any provision of this Policy, the Audit Committee is not required to preapprove services for which preapproval is not required by applicable law, including de minimis and grandfathered services.
| 2. | Delegation |
The Audit Committee may delegate preapproval authority to one or more of its members. The member or members to whom such authority is delegated shall report any preapproval decisions to the Audit Committee at its next scheduled meeting. By adopting this Policy the Audit Committee does not delegate to management the Audit Committee’s responsibilities to preapprove services performed by the independent auditor.
| 3. | Audit Services |
The annual Audit services engagement terms and fees for the Funds will be subject to the preapproval of the Audit Committee. The Audit Committee will approve, if necessary, any changes in terms, conditions and fees resulting from changes in audit scope or other matters.
In addition to the annual Audit services engagement approved by the Audit Committee, the Audit Committee may grant preapproval for other Audit services, which are those services that only the independent registered public accountant reasonably can provide. The Audit Committee has preapproved the Audit services listed in Appendix A. All Audit services not listed in Appendix A must be separately preapproved by the Audit Committee.
| 4. | Audit-Related Services |
Audit-related services are assurance and related services for the Funds that are reasonably related to the performance of the audit or review of the Funds’ financial statements or that are traditionally performed by the independent registered public accountant. The Audit Committee believes that the provision of Audit-related services does not impair the independence of the accountant, and has preapproved the Audit-related services listed in Appendix B. All Audit-related services not listed in Appendix B must be separately preapproved by the Audit Committee.
| 5. | Tax Services |
The Audit Committee believes that the independent registered public accountant can provide Tax services to the Funds such as tax compliance, tax planning and tax advice without impairing the accountant’s independence. However, the Audit Committee will not permit the retention of the independent registered public accountant in connection with a transaction initially recommended by the independent registered public accountant, the purpose of which may be tax avoidance and the tax treatment of which may not be supported in the Internal Revenue Code and related regulations. The Audit Committee has preapproved the Tax services listed in Appendix C. All Tax services not listed in Appendix C must be separately preapproved by the Audit Committee.
| 6. | All Other Services |
The Audit Committee may grant preapproval to those permissible non-audit services for the Funds classified as All Other services that it believes are routine and recurring services, and would not impair the independence of the accountant. The Audit Committee has preapproved the All Other services listed in Appendix D. Permissible All Other services not listed in Appendix D must be separately preapproved by the Audit Committee.
A list of the SEC’s prohibited non-audit services is attached to this policy as Exhibit 1. The SEC’s rules and relevant guidance should be consulted to determine the precise definitions of these services and the applicability of exceptions to certain of the prohibitions.
| 7. | Preapproval Fee Levels |
Preapproval fee levels for all services to be provided by the independent registered public accountant to the Funds, and applicable non-audit services to be provided by the accountant to the Funds’ investment adviser and its affiliates, will be established periodically by the Audit Committee. Any proposed services exceeding these levels will require specific preapproval by the Audit Committee.
| 8. | Supporting Documentation |
With respect to each service that is separately preapproved, the independent auditor will provide detailed back-up documentation, which will be provided to the Audit Committee, regarding the specific services to be provided.
| 9. | Procedures |
Requests or applications to provide services that require separate approval by the Audit Committee will be submitted to the Audit Committee by both the independent registered public accountant and the Funds’ treasurer, and must include a joint statement as to whether, in their view, the request or application is consistent with the SEC’s rules on auditor independence.
Management will promptly report to the Chair of the Audit Committee any violation of this Policy of which it becomes aware.
Appendix A – Audit Committee Preapproval Policy
Preapproved Audit Services
for
October 27, 2016 through October 31, 2017
| Service | Fee Range | |
| Statutory audits or financial audits (including tax services associated with non-audit services) | As presented to Audit Committee in a separate engagement letter1 | |
| Services associated with SEC registration statements, periodic reports and other documents filed with the SEC or other documents issued in connection with securities offerings (e.g., consents), and assistance in responding to SEC comment letters | Not to exceed $9,000 per filing |
Appendix B - Audit Committee Preapproval Policy
Preapproved Audit-Related Services
for
October 27, 2016 through October 31, 2017
| Service | Fee Range | |
Consultations by Fund management with respect to the accounting or disclosure treatment of securities, transactions or events and/or the actual or potential impact of final or proposed rules, standards or interpretations by the SEC, FASB, or other regulatory or standard-setting bodies
| Not to exceed $5,000 per occurrence during the Pre-Approval Period
|
| Review of Funds’ semi-annual financial statements | Not to exceed $2,000 per set of financial statements per fund | |
| Regulatory compliance assistance | Not to exceed $5,000 per quarter
| |
| Training Courses | Not to exceed $5,000 per course
|
Appendix C – Audit Committee Preapproval Policy
Preapproved Tax Services
for
October 27, 2016 through October 31, 2017
| Service | Fee Range | |
| Review of federal and state income tax returns and federal excise tax returns for the Funds including assistance and review with excise tax distributions. | As presented to Audit Committee in a separate engagement letter1 | |
| Tax assistance and advice regarding statutory, regulatory or administrative developments | Not to exceed $5,000 for the Funds’ or for the Funds’ investment adviser during the Pre-Approval period | |
| Assistance with custom tax audits and related matters | Not to exceed $15,000 per Fund during the Pre-Approval Period | |
| Tax Training Courses | Not to exceed $5,000 per course during the Pre-Approval Period | |
M & A tax due diligence services associated with Fund mergers including: review of the target fund’s historical tax filings, review of the target fund’s tax audit examination history, and hold discussions with target management and external tax advisors. Advice regarding the target fund’s overall tax posture and historical and future tax exposures.
| Not to exceed $8,000 per merger during the Pre-Approval Period | |
| Tax services related to the preparation of annual PFIC statements and annual Form 5471 (Controlled Foreign Corporation for structured finance vehicles) | Not to exceed $20,000 during the Pre-Approval Period |
Appendix D – Audit Committee Preapproval Policy
Preapproved All Other Services
for
October 27, 2016 through October 31, 2017
| Service | Fee Range | |
| No other services for the Pre-Approval Period have been specifically preapproved by the Audit Committee. | N/A |
Exhibit 1 – Audit Committee Preapproval Policy
Prohibited Non-Audit Services
| ◾ | Bookkeeping or other services related to the accounting records or financial statements of the audit client |
| ◾ | Financial information systems design and implementation |
| ◾ | Appraisal or valuation services, fairness opinions or contribution-in-kind reports |
| ◾ | Actuarial services |
| ◾ | Internal audit outsourcing services |
| ◾ | Management functions |
| ◾ | Human resources |
| ◾ | Broker-dealer, investment adviser or investment banking services |
| ◾ | Legal services |
| ◾ | Expert services unrelated to the audit |
1 For new funds launched during the Pre-Approval Period, the fee ranges pre-approved will be the same as those for existing funds, pro-rated in accordance with inception dates as provided in the auditors’ proposal or any engagement letter covering the period at issue. Fees in the engagement letter will be controlling.
(e)(2) None, or 0%, of the services relating to the audit-related fees, tax fees, and all other fees paid by the registrant disclosed above were approved by the Audit Committee pursuant to paragraph (c)(7)(i)(C) of Rule 2-01 of Regulation S-X (which permits audit committee approval after the start of the engagement with respect to services other than audit review or attest services, if certain conditions are satisfied).
(f) According to KPMG for the fiscal year ended July 31, 2017, the percentage of hours spent on the audit of the registrant’s financial statements for the most recent fiscal year that were attributed to work performed by persons other than KPMG’s full-time, permanent employees is as follows:
| Fund | 2017 | |
| Domini Impact Equity Fund | 0% | |
| Domini Impact Bond Fund | 0% | |
| Domini Impact International Equity Fund | 0% | |
(g) There were no non-audit services rendered to the registrant’s Service Providers for the fiscal years ended July 31, 2017 and July 31, 2016.
The aggregate non-audit fees billed by KPMG for services rendered to the registrant for the fiscal year ended July 31, 2017 was $ 20,100. These fees related to the 2017 Tax Fees described in Item 4 (c). The aggregate non-audit fees billed by KPMG for services rendered to the registrant for the fiscal year ended July 31, 2016, were $20,100. These fees related to the 2016 Tax Fees described in Item 4 (c).
(h) Not applicable.
| Item 5. | Audit Committee of Listed Registrants. |
Not applicable to the registrant.
| Item 6. | Schedule of Investments. |
(a) The Schedule of Investments is included as part of the report to stockholders filed under Item 1.
(b) Not applicable
| Item 7. | Disclosure of Proxy Voting Policies and Procedures for Closed-End Management Investment Companies. |
Not applicable to the registrant.
| Item 8. | Portfolio Managers of Closed-End Management Investment Companies. |
Not applicable to the registrant.
| Item 9. | Purchases of Equity Securities by Closed-End Management Investment Company and Affiliated Purchasers. |
Not applicable to the registrant.
| Item 10. | Submission of Matters to a Vote of Security Holders. |
There were no material changes to the procedures by which shareholders may submit recommendations for nominees to the registrant’s Board of Trustees.
| Item 11. | Controls and Procedures. |
(a) Within 90 days prior to the filing of this report on Form N-CSR, Carole M. Laible, the registrant’s President and Principal Executive Officer, and Christina Povall, the registrant’s Treasurer and Principal Financial Officer, reviewed the registrant’s disclosure controls and procedures (as defined in Rule 30a-3(c) of the Investment Company Act of 1940) and evaluated their effectiveness. Based on their evaluation, Ms. Laible and Ms. Povall determined that the disclosure controls and procedures adequately ensure that information required to be disclosed by the registrant in this report on Form N-CSR is recorded, processed, summarized, and reported within the time periods required by the Securities and Exchange Commission’s rules and forms, including ensuring that information required to be disclosed in this report on Form N-CSR is accumulated and communicated to the registrant’s management, including the Ms. Laible and Ms. Povall, as appropriate to allow timely decisions regarding required disclosures.
(b) There were no changes in the registrant’s internal control over financial reporting (as defined in Rule 30a-3(d) under the Investment Company Act of 1940) that occurred during the second fiscal quarter of the period covered by this report that have materially affected, or are reasonably likely to materially affect, the registrant’s internal control over financial reporting.
| Item 12. | Exhibits. |
(a)(1) The Code of Ethics referred to in Item 2 is filed herewith.
(a)(2) Separate certifications required by Rule 30a-2(a) under the Investment Company Act of 1940 for each principal executive officer and principal financial officer of the registrant are filed herewith.
(a)(3) Not applicable to the registrant.
(b) A single certification required by Rule 30a-2(b) under the Investment Company Act of 1940, Rule 13a-14b or Rule 15d-14(b) under the Securities Exchange Act of 1934, and Section 1350 of Chapter 63 of Title 18 of the United States Code for the chief executive officer and the chief financial officer of the registrant is filed herewith.
SIGNATURES
Pursuant to the requirements of the Securities Exchange Act of 1934 and the Investment Company Act of 1940, the registrant has duly caused this report to be signed on its behalf by the undersigned, thereunto duly authorized.
| DOMINI INVESTMENT TRUST | ||
| By: | /s/ Carole M. Laible | |
| Carole M. Laible | ||
| President | ||
| Date: October 6, 2017 | ||
Pursuant to the requirements of the Securities Exchange Act of 1934 and the Investment Company Act of 1940, this report has been signed below by the following persons on behalf of the registrant and in the capacities and on the dates indicated.
| By: | /s/ Carole M. Laible | |
| Carole M. Laible | ||
| President (Principal Executive Officer) | ||
| Date: October 6, 2017 | ||
| By: | /s/ Christina Povall | |
| Christina Povall | ||
| Treasurer (Principal Financial Officer) | ||
| Date: October 6, 2017 | ||