UNITED STATES
SECURITIES AND EXCHANGE COMMISSION
Washington, D.C. 20549
FORM N-CSR
CERTIFIED SHAREHOLDER REPORT OF REGISTERED
MANAGEMENT INVESTMENT COMPANIES
Investment Company Act File Number 811-05823
DOMINI INVESTMENT TRUST
(Exact Name of Registrant as Specified in Charter)
180 Maiden Lane, Suite 1302, New York, New York 10038
(Address of Principal Executive Offices)
Carole M. Laible
Domini Impact Investments LLC
180 Maiden Lane, Suite 1302
New York, New York 10038
(Name and Address of Agent for Service)
Registrant’s Telephone Number, including Area Code: 212-217-1100
Date of Fiscal Year End: July 31
Date of Reporting Period: July 31, 2020
| Item 1. | Reports to Stockholders. |
A copy of the report transmitted to stockholders pursuant to Rule 30e-1 under the Investment Company Act of 1940 follows.

TABLE OF CONTENTS
INVESTINGFOR GOOD®
LETTER TO SHAREHOLDERS
Dear Fellow Shareholder,
The twelve months ending July 31, 2020 brought into sharp focus many forks in the road that we, both as investors and as citizens, find ourselves traveling. Our delicate détente with China is collapsing; our relationships with allies in Europe and Japan have been strained; our commitment to bring human rights into international dialogs has halted. The nation and the planet were pummeled by fires, floods, extreme heat, and swarming desert locusts as we dismantled climate change protections. Our nation’s health care system and workers faced extraordinary challenges as we ineffectively grappled with a national defense against the global coronavirus pandemic. Cities around the world mobilized to protest against systemic racism following the death of Mr. George Floyd. Americans suffered the largest unemployment increase since the Great Depression. While faith in institutions is at an extreme low, we continue to seek a path forward for a better world.
Against this backdrop, the stock markets around the world had a very good year. Markets rallied at the government stimulus that was more than four times what was spent during the financial crisis of 2008-9. Companies that add value to our lives in a manner that reduces the cost, enhances the experience and improves the outcome have always been popular with impact investors, but now became the darlings of Wall Street.
In a relatively short period of time, we have seen an acceleration of technological advances that are without precedent. Zoom Video Communications, which so many businesses now rely on for work-from-home, is less than 10 years old. Payment services company Square is 12 years old. Apple’s iPhone is less than 15 years old. The first Tesla car was released 12 years ago. The scope of technology and the software that supports it has begun to dwarf more traditional industries. Along the way it provides jobs, wealth, comforts and benefits to individuals and business alike. This has been most evident throughout the global pandemic. Those that could, rearranged their businesses and their lives while growing increasingly dependent upon functioning high-speed internet. Home offices, online video visits with your doctor, virtual conferences, even a livestream of your friend’s wedding became the norm.
2
INVESTINGFOR GOOD®
We continue to demonstrate the value of applying societal considerations when making investment decisions. Our value of an investment and risk aversion is defined by a company’s impact on people and the planet. We search for companies that effectively manage their key sustainability challenges. The demand for and growth of impact investing products became even more apparent this year and the past twelve months have demonstrated the merits of our approach. Please be sure to review the performance section of this report to see the results.
During the year, we have had two gratifying successes. In December 2018, we determined that it was time to retool our domestic equity fund, the Domini Impact Equity Fund. We made social and environmental information the primary input for the shaping of the portfolio. We built a portfolio we believe is representative of the U.S. economy through the lens of the classic impact investor through macro, top-down assessment of our portfolio. We also complement this approach by allocating investment to a group of solution-oriented companies. The results of the strategy change have been impressive and are discussed on page 27 of this report.
On April 1, 2020 we launched our first new fund in over a decade. The Domini Sustainable Solutions Fund was launched for the investor seeking an unconstrained portfolio in search of answers to society’s challenges, anywhere in the world and at any market capitalization. We considered the postponement of the planned launch at the onset of the pandemic, but we proceeded on schedule with the belief that financial markets needed more products of this kind. Although very short-term, just over one quarter, the results have been powerful and are discussed on page 44 of this report.
This is a difficult period in the history of humankind, and we are grateful to you, our investors, for your continued loyalty to us and to the field of responsible investing. Your support leaves us with hope and further builds on our belief that your investments will have a positive impact on the future. Please read our essay which continues on the themes of this letter and the urgency we face in recognizing the interconnectedness of our world. We welcome your feedback.
Sincerely,
| | |

Carole Laible CEO | | 
Amy Domini Founder and Chair |
3
INVESTINGFOR GOOD®
THE IMPORTANCE OF VALUE CREATOR COMPANIES
An Early Read Out of Domini’s Forest Project
The 2020s opened with convergent and connected crises unfolding on a global scale: the climate emergency, the coronavirus pandemic, and incidents of systemic racism boiling over into the mainstream public consciousness. Despite the continuing tragedies and challenges we face in our own lives, work and communities, this disruption may be cause for hope. It brings a rare opportunity for change right when we need it most and a lesson long overdue: we are all connected.
The health of the planet, the health of people, and the health of the economy all depend on each other. We can’t reopen our economy without first making our communities healthy. We can’t avoid future pandemics if we continue to destroy the natural environment. Favoring one system at the expense of another doesn’t work either. With this truth and opportunity in hand, it is incumbent on all of us to find our way to a more sustainable future.
Domini has been striving to do just that since the inception of our first mutual fund in 1991 by taking a holistic approach to sustainability challenges. We look at the full picture of a company, not just financial statements, to understand its risks and opportunities – an approach now widely accepted as best practice. We also work directly on addressing the biggest risks that face our planet, people and our portfolios.
The health of the planet, the health of people, and the health of the economy all depend on each other.
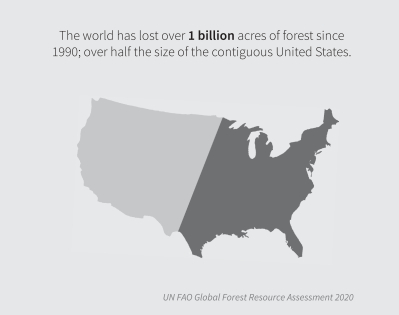
We launched our Forest project in the hopes that we would build a model to better address those large, intractable, foundational issues. In the context of forests, the dynamics are clear. We all — including companies — depend on forests, whether it’s because they stabilize the global climate, provide a home for pollinators, create rain, or just help us connect with nature. The value may be hard to ‘price’ but it’s not hard to understand. Still, we lost the equivalent of a soccer field of forest every 4 seconds in 2019.
4
INVESTINGFOR GOOD®
The world appears to be caught in this losing paradox: Forests provide essential value on which we rely and offer solutions to the biggest problems we face, yet we continue to participate in their destruction, as consumers, as investors, and as a global community. We can observe a similar paradox in the coronavirus pandemic: ‘essential’ frontline workers on whom we rely for our health, food, deliveries and so much more are lacking the basic protections they need in return. (See domini.com/covid19-statement.)
The world appears to be caught in this losing paradox: Forests provide essential value on which we rely, yet we continue to participate in their destruction.
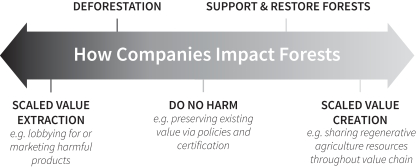
In order to find the answer to why this paradigm continues and in search of a more sustainable future, we looked across our portfolios for the industries that most clearly embody the forest paradox: companies we believe may negatively impact forests but depend on forests for a key resource or service. Those companies have the strongest business case to innovate and take action.
While the work is ongoing, some pieces of that picture are coming into view. Out of our conversations with those companies emerged a profile of
5
INVESTINGFOR GOOD®
a forest value creator, i.e. a company that delivers returns to shareholders by creating value alongside and for other stakeholders rather than relying on extracting or destroying value for profitability.
Crucially, we went beyond asking companies to be neutral with respect to the forest, and instead focused on identifying those that have aligned their business strategies with solutions for shared value creation that we can help to accelerate. However, this analysis is not limited to forests. Indeed, we are seeing many of the same characteristics emerge in companies’ responses to the coronavirus pandemic as well.
To be sure, these companies have not cured the world or even themselves of destroying value in pursuit of profit. The examples that arose are largely pilot projects not yet implemented at scale, but they show a commitment to innovation and offer a potential road map to a sustainable economy, where systems like forests and communities are stronger, healthier and more resilient for the benefit of all stakeholders (companies included).
6
INVESTINGFOR GOOD®
Forest Value Creators
The following characteristics were gleaned from a series of conversations with portfolio companies and comprise the profile of a forest value creator (FVC), a company that has aligned its core business strategy with sustainable and shared value creation.
| | |
 | | 1. Seek solutions proactively. Obstacles to action and excuses for inaction are plentiful, for example, what some psychologists have called the “It’s Not My Problem” problem1 when it comes to climate change. FVCs act, they are willing to lead. |
| |
 | | 2. Recognize the scale and larger scope of the problem. System level risks like deforestation, climate change and the coronavirus are not addressable by individual actors. FVCs take responsibility for their impact but recognize that the problem to be solved goes beyond their organization. |
| |
 | | 3. Cooperate with communities and nature. Working with the flow of existing systems helps to leverage natural efficiencies and avoid unintended consequences. FVCs rely on practices like regenerative agriculture and empowering emergent community and worker organizers. |
| |
 | | 4. Collaborate vertically, horizontally and across sectors to scale up solutions. Agility and resilience are built on networks. FVCs work with diverse and outside-the-box partners to innovate and scale solutions. |
| |
 | | 5. Focus on impacted communities first and adopt an inclusive approach. Designing for and from the margins leads to inclusive solutions that better serve all stakeholders. FVCs can deploy learnings from all corners to develop solutions more likely to gain traction and succeed. |
1. “The Psychology of Climate Change Denial.” The psychology of climate change denial | APS. Accessed August 24, 2020. https://www.psychology.org.au/About-Us/What-we-do/advocacy/Advocacy-social-issues/Environment-climate-change-psychology/Resources-for-Psychologists-and-others-advocating/The-psychology-of-climate-change-denial
7
INVESTINGFOR GOOD®
Value Creators in Action
Lowe’s Home Improvement: Building Resilient Cities
Lowe’s partnership with The Nature Conservancy (TNC) on resilient cities provides an example of a shared value creator in action.2 The project started with three pilot programs in Houston, Louisville and Philadelphia that leverage planting trees and gardens to address heat islands, public health, and stormwater surges.3 In Louisville, for example, the “Green Heart Project” partnered with over 20 community organizations to plant 8,000 trees and shrubs and conserve over 100 ash trees.4 It will study the long-term effects on air quality and noise pollution and the corresponding health impacts for the community. Urban green spaces can also combat excessive heat, slow flooding, decrease stormwater runoff, and increase property values.5 More resilient communities and homes may also be eligible for improved insurance premiums.
While this approach clearly leverages natural solutions and key partnerships, it is also aligned with Lowe’s core business. Lawn and garden, seasonal and outdoor living, hardware and tools together represent 30% of its revenue base. Do-It-Yourself (“DIY”) homeowners represent a key customer base. Through strategic marketing and education campaigns, Lowe’s can drive sales and build brand engagement and loyalty with key customers by deploying sustainability solutions that generate collateral benefits for other members of the community. The project has delivered value not just to the company’s shareholders, but also to its consumers, their communities and their cities.
Other Value Creators Respond to a Pandemic
While corporate responses to the coronavirus are still unfolding, some companies were quick to find creative ways to leverage their core business and networks to help address the crisis. Old Mutual, an insurance company in the UK, provided free life insurance to 25,000 frontline workers through this fall. Helvetia Holding, an insurance company in Switzerland with its own real estate portfolio, waived rents for some tenants especially small and mid-size companies that haven’t been able to operate during the pandemic. Companies like Zoom provided free unlimited access to its services and offered support for users quickly transitioning to remote work like schoolteachers and mental health
2. “Building Healthy Cities with Lowe’s.” The Nature Conservancy. Accessed August 24, 2020. https://www.nature.org/en-us/lowes-stewardship/.
3. “Philadelphia.” The Nature Conservancy. Accessed August 24, 2020. https://www.nature.org/en-us/lowes-stewardship/philadelphia/.
4. “Green Heart by the Numbers.” The Green Heart Project. The Nature Conservancy. Accessed August 24, 2020. https://tnc.app.box.com/s/yfip2ixbtayg6uwobtgb2rw5ni14skkd.
5. “Louisville.” The Nature Conservancy. Accessed August 24, 2020. https://www.nature.org/en-us/lowes-stewardship/louisville/.
8
INVESTINGFOR GOOD®
providers. Tingyi Holdings Corp, a leading producer of instant noodles in China, captured market share by cutting the price of its products.
Each of these actions created value for the companies – whether through protecting its value chain, its workforce, building brand awareness and loyalty, or capturing market share – while also creating value for other stakeholders.
…
As we recognize the interconnectedness of our people, planet, and profit, we see the characteristics of a Value Creator as a model to persuade companies to contribute to the social, environmental and financial systems that we all rely on for our health and well-being. Given the scale and scope of the challenges we face, we all need to be value creators for a healthier, safer and stronger future.
| | | | |
| | Sign up for Domini news and impact updates at domini.com/subscribe | | |
The holdings discussed above can be found in the portfolio of the Domini Impact Equity Fund, Domini Impact International Equity Fund, Domini Sustainable Solutions Fund and Domini Impact Bond Fund, included herein. The composition of each portfolio is subject to change.
The Domini Funds are not bank deposits and are not insured. You may lose money. Investment return, principal value, and yield will fluctuate so that an investor’s shares, when redeemed, may be worth more or less than their original cost.
The Domini Impact Equity Fund is subject to market, recent events, impact investing, portfolio management, information, and mid-to large-cap companies risks. The Domini Impact International Equity Fund is subject to market, recent events, impact investing, portfolio management, information, and mid-to large-cap companies risks. The Domini Sustainable Solutions Fund is subject to market, recent events, sustainable investing, portfolio management, information, mid- to large-cap companies, and small-cap companies risks. Investing internationally involves special risks, such as currency fluctuations, social and economic instability, differing security regulations and accounting standards limited public information possible changes in taxation, and periods of illiquidity. The Domini Impact Bond Fund is subject to market, recent events, impact investing, style, information, interest rate, and credit risks.
This report is not authorized for distribution to prospective investors of the Domini Funds referenced herein unless preceded or accompanied by a current prospectus for the relevant Fund. Nothing herein is to be considered a recommendation concerning the merits of any noted company, or an offer of sale or solicitation of an offer to buy shares of any Fund or company referenced herein. Such offering is only made by prospectus, which includes details as to the offering price and other material information. Carefully consider the Funds’ investment objectives, risk factors and charges and expenses before investing. This and other information can be found in the Funds’ prospectus, which may be obtained by calling 1-800-582-6757 or at www.domini.com. Domini Impact Investments LLC is each Fund’s investment manager. The Funds are subadvised by unaffiliated entities. Shares of the Domini Funds are offered for sale only in the United States DSIL Investment Services LLC, Distributor, Member FINRA. 9/20
9
DOMINI IMPACT INTERNATIONAL EQUITY FUND
Performance Commentary (Unaudited)
The Fund invests primarily in mid- to large-cap equities across Europe, the Asia-Pacific region, and throughout the rest of the world. It is managed through a two-step process designed to capitalize on the strengths of Domini Impact Investments and Wellington Management Company, the Fund’s subadviser. Domini creates an approved list of companies based on its social, environmental and governance analysis, and Wellington seeks to add value and manage risk through a systematic and disciplined portfolio construction process.
Market Overview:
International equities, as measured by the MSCI EAFE Index (net)*, declined 1.67% over the trailing twelve-month period ending July 31, 2020.
In the fourth quarter of 2019, waning recession fears and forecasts for improving global growth in 2020 helped to bolster risk sentiment, while geopolitics and trade disputes continued to be major drivers of market volatility. The U.S. canceled tariffs that had been scheduled to take effect in an effort to secure a phase one trade deal with China. It was subsequently announced that the first phase of a trade agreement would be signed on January 15, 2020, providing significant relief to global markets.
However, global equities ended the first quarter of 2020 sharply lower, as the coronavirus pandemic spread rapidly across the globe, causing unprecedented disruption to financial markets and economies and overshadowing optimism about a phase-one trade deal between the U.S. and China. Market volatility intensified, and liquidity plunged to record lows. Most global central banks and governments took extraordinary measures in an effort to limit financial market stress, mitigate the economic fallout, and cushion household and business income. The U.S. government unleashed a massive fiscal stimulus plan to stem economic damage. The European Union (EU) suspended budget and borrowing rules to give governments more fiscal flexibility to deal with the crisis. The price of oil plunged to its lowest level since 2002, as the world’s largest oil producers failed to agree on whether to reduce output as demand collapsed. The United Kingdom (UK) officially departed the EU on January 31, 2020, and discussions about a new UK-EU trade agreement were delayed due to the coronavirus outbreak.
Nevertheless, global equities recovered significantly during the second quarter of 2020. Markets were fueled by optimism about successful early-stage trials for a potential coronavirus vaccine, ongoing fiscal and monetary stimulus, and signs that global economic activity is improving. As new infections declined in most countries, governments shifted their focus toward gradually lifting lockdown restrictions and supporting the recovery of their economies; however, new cases rose sharply in some areas of the U.S., while India and much of Latin
10
America struggled to bring the virus under control. The European Commission (EC) announced a proposal for a €750 billion recovery fund to provide grants and loans to eurozone economies that have been devastated by the coronavirus pandemic. Tensions between the U.S. and China escalated during the quarter after China’s decision to impose a controversial national security law on Hong Kong invoked a host of retaliatory responses from the U.S. and increased concerns about the city’s future as a global financial center. After plummeting to historic lows in April amid a pandemic-induced collapse in demand, oil rebounded later in the quarter as the global economy began to recover.
Portfolio Performance:
The Domini Impact International Equity Fund Investor shares declined 3.49% for the twelve-month period ending July 31, 2020, underperforming the MSCI EAFE Index (net) return of -1.67%.
Security selection was the primary driver of underperformance relative to the benchmark. Weak security selection within the Health Care, Consumer Disctretionary, and Communication Services sectors hindered relative results. Partially offsetting these negative results was strong security selection within the Materials and Industrials sectors. From an allocation perspective, sector positioning relative to the benchmark contributed positively to relative results during the period. This was primarily driven by the Fund’s exclusion of the energy sector, which was the worst performing sector in the benchmark during the period. The Fund’s overweight allocations to the Health Care and Information Technology sectors, which were the best performing sectors in the benchmark during the period, also contributed positively to relative performance.
From a regional perspective, poor security selection within developed European markets (excluding the UK) and Japan detracted from relative results. This negative impact was partially offset by positive selection within developed Asia-Pacific markets (excluding Japan) and the UK regions. An out-of-benchmark allocation to emerging markets marginally contributed to relative performance, driven primarily by strong performance in Taiwan.
From a market capitalization standpoint, the Fund’s weak security selection within large-cap securities (over $10 billion) was the primary detractor from relative performance. The Fund also maintained an overweight allocation to mid-cap securities (between $2 billion and $10 billion) that detracted from relative results.
Over the period, the submanager’s quantitative model detracted from performance overall. Both its value and quality themes detracted from results, while its momentum theme contributed. Within value, both fair and pure value themes detracted from returns, but most of the underperformance came from the pure value theme. Within quality, the management behavior theme was positive but was more than offset by weakness from the earnings quality theme.
11
Within momentum, short-term momentum produced slightly negative results, however, this was more than offset by strong returns from long-term momentum.
In terms of holdings, top detractors to relative results during the period included overweight positions in the Central Japan Railway Company, Japanese automotive manufacturer Nissan Motor, French automotive manufactuer Peugeot, and Spanish telecommunications company Telefónica. Relative results were also hurt by not owning Swiss pharmaceutical company Roche Holding, which is not currently eligible for investment by Domini as of July 31.
Top contributors to relative performance included overweight positions in Australia’s Fortescue Metals Group, German pharmaceutical company Merck, and Dutch food retailer Ahold Delhaize. Relative results also benefitted from not owning British-Dutch oil and gas company Royal Dutch Shell and British investment bank HSBC Holdings. Shell is not currently eligible for investment by Domini as of July 31.
* MSCI EAFE Index (net) returns reflect reinvested dividends net of withholding taxes but reflect no deduction for fees, expenses or other taxes.
12
TEN LARGEST HOLDINGS (Unaudited)
| | | | | | | | | | |
| | | | |
| SECURITY DESCRIPTION | | % NET
ASSETS | | | SECURITY DESCRIPTION | | % NET
ASSETS | |
| | | | |
| Novartis AG | | | 3.6% | | | Sanofi | | | 1.7% | |
| | | | |
| Schneider Electric SE | | | 2.6% | | | Intesa Sanpaolo SpA | | | 1.7% | |
| | | | |
| Koninklijke Ahold Delhaize NV | | | 2.2% | | | Vodafone Group PLC | | | 1.6% | |
| | | | |
| Hong Kong Exchanges & Clearing, Ltd | | | 1.9% | | | Nintendo Co., Ltd | | | 1.5% | |
| | | | |
| Fortescue Metals Group Ltd | | | 1.8% | | | Hennes & Mauritz AB Class B | | | 1.5% | |
PORTFOLIO HOLDINGS BY INDUSTRY SECTOR (% OF NET ASSETS) (Unaudited)
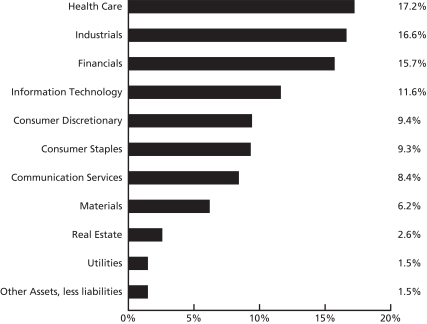
The Global Industry Classification Standard (“GICS”) was developed by and is the exclusive property and a service mark of MSCI Inc. (“MSCI”) and Standard & Poor’s, a division of The McGraw-Hill Companies, Inc. (“S&P”) and is licensed for use by Domini Impact Investments. Neither MSCI, S&P nor any third party involved in making or compiling the GICS or any GICS classifications makes any express or implied warranties or representations with respect to such standard or classification nor shall any such party have any liability therefrom.
13
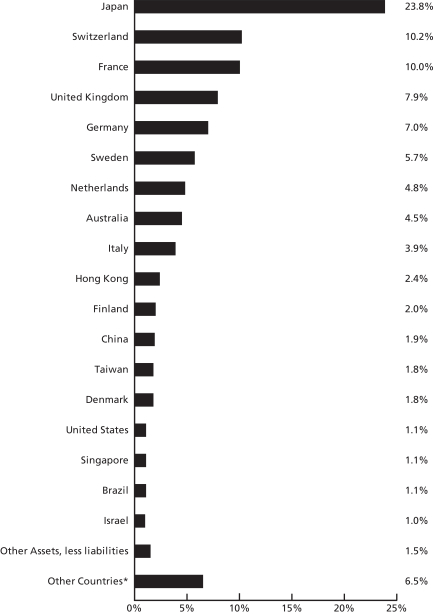
PORTFOLIO HOLDINGS BY COUNTRY (% OF NET ASSETS) (Unaudited)
The holdings mentioned above are described in the Fund’s Portfolio of Investments (as of 7/31/2020) included herein. The composition of the Fund’s portfolio is subject to change.
*Other countries include Norway 0.9%, Belgium 0.9%, Spain 0.8%, Jordan 0.8%, India 0.6%, South Africa 0.5%, Ireland 0.5%, Mexico 0.4%, Hungary 0.4%, South Korea 0.3%, Panama 0.2%, Malaysia 0.1% and Austria 0.1%.
14
| | | | | | |
| |
| AVERAGE ANNUAL TOTAL RETURNS (Unaudited) |
| | |
| | | Investor shares | | MSCI EAFE (NET) |
| | | |
| As of 7/31/20 | | 1 Year | | -3.49% | | -1.67% |
| | | |
| | 5 Year | | 0.99% | | 2.10% |
| | | |
| | | 10 Year | | 5.49% | | 5.02% |
Comparison of $10,000 Investment in the Domini Impact International Equity Fund Investor Shares (DOMIX) and MSCI EAFE (NET) (Unaudited)
Past performance is no guarantee of future results. The Fund’s returns quoted above represent past performance after all expenses. The returns reflect any applicable expense waivers in effect during the periods shown. Without such waivers, Fund performance would be lower. Investment return, principal value, and yield will fluctuate. Your shares, when redeemed, may be worth more or less than their original cost. Call 1-800-582-6757 or visit www.domini.com for performance information current to the most recent month-end, which may be lower or higher than the performance data quoted. A 2.00% redemption fee applies on sales or exchanges of shares made less than 30 days after the settlement of purchase or acquisition through exchange, with certain exceptions. Quoted performance data does not reflect the deduction of this fee, which would reduce the performance quoted. See the prospectus for further information.
Per the prospectus dated November 29, 2019 and updated August 1, 2020, the Fund’s annual operating expenses totaled: 1.38% (gross/net).
The table and the graph do not reflect the deduction of fees and taxes that a shareholder would pay on Fund distributions or the redemption of Fund shares. Total return is based on the Fund’s net asset values and assumes all dividends and capital gains were reinvested.
An investment in the Fund is not a bank deposit and is not insured. You may lose money. The Fund is subject to market, recent events, impact investing, portfolio management, information, and mid-to large-cap companies risks. Investing internationally involves special risks, such as currency fluctuations, social and economic instability, differing security regulations and accounting standards, limited public information, possible changes in taxation, and periods of illiquidity.
The Morgan Stanley Capital International Europe Australasia Far East (MSCI EAFE) index (net) is an unmanaged index of common stocks. MSCI EAFE (net) includes the reinvestment of dividends net of withholding tax, but does not reflect other fees, expenses or taxes. It is not available for direct investment.
15
| | | | | | | | |
| |
| AVERAGE ANNUAL TOTAL RETURNS (Unaudited) |
| | | |
| | | Class A shares
(with 4.75%
maximum
Sales Charge) | | Class A shares
(without Sales
Charge) | | MSCI EAFE (NET) |
| | | | |
| As of 7/31/20 | | 1 Year | | -8.16% | | -3.58% | | -1.67% |
| | | | |
| | 5 Year | | -0.05% | | 0.93% | | 2.10% |
| | | | |
| | | 10 Year | | 4.96% | | 5.47% | | 5.02% |
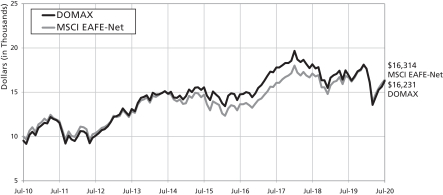
Comparison of $10,000 Investment in the Domini Impact International Equity Fund Class A Shares (DOMAX) and MSCI EAFE (NET) (with 4.75% maximum sales charge) (Unaudited)
Past performance is no guarantee of future results. The Fund’s returns quoted above represent past performance after all expenses. The returns reflect any applicable expense waivers in effect during the periods shown. Without such waivers, Fund performance would be lower. Investment return, principal value, and yield will fluctuate. Your shares, when redeemed, may be worth more or less than their original cost. Call 1-800-762-6814 or visit www.domini.com for performance information current to the most recent month-end, which may be lower or higher than the performance data quoted. A 2.00% redemption fee applies on sales or exchanges of shares made less than 30 days after the settlement of purchase or acquisition through exchange, with certain exceptions. Quoted performance data does not reflect the deduction of this fee, which would reduce the performance quoted. See the prospectus for further information.
Per the prospectus dated November 29, 2019 and updated August 1, 2020, the Fund’s annual operating expenses totaled: 1.56%/1.43% (gross/net). The Fund’s adviser has contractually agreed to waive certain fees and/or reimburse certain ordinary operating expenses in order to limit Class A share expenses to 1.43% through November 30, 2020, absent an earlier modification approved by the Fund’s Board of Trustees.
The table and graph do not reflect the deduction of fees and taxes that a shareholder would pay on Fund distributions or the redemption of Fund shares. Total return is based on the Fund’s net asset values and assumes all dividends and capital gains were reinvested.
An investment in the Fund is not a bank deposit and is not insured. You may lose money. The Fund is subject to market, recent events, impact investing, portfolio management, information, and mid-to large-cap companies risks. Investing internationally involves special risks, such as currency fluctuations, social and economic instability, differing security regulations and accounting standards, limited public information, possible changes in taxation, and periods of illiquidity.
The Morgan Stanley Capital International Europe Australasia Far East (MSCI EAFE) index (net) is an unmanaged index of common stocks. MSCI EAFE (net) includes the reinvestment of dividends net of withholding tax, but does not reflect other fees, expenses or taxes. It is not available for direct investment.
16
| | | | | | |
| |
| AVERAGE ANNUAL TOTAL RETURNS (Unaudited) |
| | |
| | | Institutional shares | | MSCI EAFE (NET) |
| | | |
| As of 7/31/20 | | 1 Year | | -3.05% | | -1.67% |
| | | |
| | 5 Year | | 1.37% | | 2.10% |
| | | |
| | | 10 Year* | | 5.49% | | 5.02% |
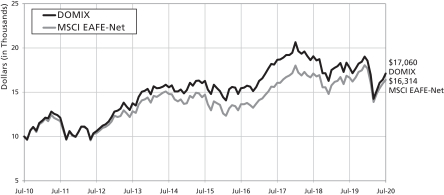
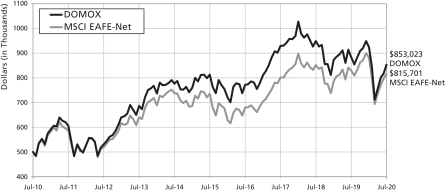
Comparison of $500,000 Investment in the Domini Impact International Equity Fund Institutional Shares (DOMOX) and MSCI EAFE (NET)* (Unaudited)
Past performance is no guarantee of future results. The Fund’s returns quoted above represent past performance after all expenses. The returns reflect any applicable expense waivers in effect during the periods shown. Without such waivers, Fund performance would be lower. Investment return, principal value, and yield will fluctuate. Your shares, when redeemed, may be worth more or less than their original cost. Call 1-800-762-6814 or visit www.domini.com for performance information current to the most recent month-end, which may be lower or higher than the performance data quoted. A 2.00% redemption fee applies on sales or exchanges of shares made less than 30 days after the settlement of purchase or acquisition through exchange, with certain exceptions. Quoted performance data does not reflect the deduction of this fee, which would reduce the performance quoted. See the prospectus for further information.
Per the prospectus dated Novemeber 29, 2019 and updated August 1, 2020, the Fund’s annual operating expenses totaled: 0.98% (gross/net).
The table does not reflect the deduction of fees and taxes that a shareholder would pay on Fund distributions or the redemption of Fund shares. Total return is based on the Fund’s net asset values and assumes all dividends and capital gains were reinvested.
An investment in the Fund is not a bank deposit and is not insured. You may lose money. The Fund is subject to market, recent events, impact investing, portfolio management, information, and mid-to large-cap companies risks. Investing internationally involves special risks, such as currency fluctuations, social and economic instability, differing security regulations and accounting standards, limited public information, possible changes in taxation, and periods of illiquidity.
The Morgan Stanley Capital International Europe Australasia Far East (MSCI EAFE) index (net) is an unmanaged index of common stocks. MSCI EAFE (net) includes the reinvestment of dividends net of withholding tax, but does not reflect other fees, expenses or taxes. It is not available for direct investment
* Institutional shares were not offered prior to November 30, 2012. All performance information for time periods beginning prior to November 28, 2012 is the performance of the Investor shares. Unless otherwise noted, this performance has not been adjusted to reflect the lower expenses of the Institutional shares.
17
| | | | | | |
| |
| AVERAGE ANNUAL TOTAL RETURNS (Unaudited) |
| | |
| | | Class Y shares | | MSCI EAFE (NET) |
| | | |
| As of 7/31/20 | | 1 Year | | -3.28% | | -1.67% |
| | | |
| | 5 Year* | | 0.99% | | 2.10% |
| | | |
| | | 10 Year* | | 5.49% | | 5.02% |
Comparison of $10,000 Investment in the Domini Impact International Equity Fund Class Y Shares (DOMYX) and MSCI EAFE (NET)* (Unaudited)

Past performance is no guarantee of future results. The Fund’s returns quoted above represent past performance after all expenses. The returns reflect any applicable expense waivers in effect during the periods shown. Without such waivers, Fund performance would be lower. Investment return, principal value, and yield will fluctuate. Your shares, when redeemed, may be worth more or less than their original cost. Call 1-800-762-6814 or visit www.domini.com for performance information current to the most recent month-end, which may be lower or higher than the performance data quoted. A 2.00% redemption fee applies on sales or exchanges of shares made less than 30 days after the settlement of purchase or acquisition through exchange, with certain exceptions. Quoted performance data does not reflect the deduction of this fee, which would reduce the performance quoted. See the prospectus for further information.
Per the prospectus dated November 29, 2019 and updated August 1, 2020, the Fund’s annual operating expenses totaled: 1.10% (gross/net). The Fund’s adviser has contractually agreed to waive certain fees and/or reimburse certain ordinary operating expenses in order to limit Class Y share expenses to 1.15%, through November 30, 2020, absent an earlier modification approved by the Funds’ Board of Trustees.
The table does not reflect the deduction of fees and taxes that a shareholder would pay on Fund distributions or the redemption of Fund shares. Total return is based on the Fund’s net asset values and assumes all dividends and capital gains were reinvested.
An investment in the Fund is not a bank deposit and is not insured. You may lose money. The Fund is subject to market, recent events, impact investing, portfolio management, information, and mid-to large-cap companies risks. Investing internationally involves special risks, such as currency fluctuations, social and economic instability, differing security regulations and accounting standards, limited public information, possible changes in taxation, and periods of illiquidity.
The Morgan Stanley Capital International Europe Australasia Far East (MSCI EAFE) index (net) is an unmanaged index of common stocks. MSCI EAFE (net) includes the reinvestment of dividends net of withholding tax, but does not reflect other fees, expenses or taxes. It is not available for direct investment
* Y Shares did not commence operations until July 23, 2018. All performance information for time periods beginning prior to July 23, 2018 is the performance of the Investor Shares. Unless otherwise noted, this performance has not been adjusted to reflect the lower expenses of the Institutional shares.
18
DOMINI IMPACT INTERNATIONAL EQUITY FUND
PORTFOLIOOF INVESTMENTS
July 31, 2020
| | | | | | | | | | |
| COUNTRY/SECURITY | | INDUSTRY | | SHARES | | | VALUE | |
| Common Stocks – 98.5% | | | | | | | | |
Australia – 4.5% | | | | | | | | | | |
BlueScope Steel, Ltd. | | Materials | | | 1,050,332 | | | $ | 8,431,652 | |
Flight Centre Travel Group, Ltd. | | Consumer Services | | | 233,818 | | | | 1,781,088 | |
Fortescue Metals Group, Ltd. | | Materials | | | 1,577,547 | | | | 19,710,266 | |
Harvey Norman Holdings, Ltd. | | Retailing | | | 1,225,801 | | | | 3,252,812 | |
Magellan Financial Group, Ltd. | | Diversified Financials | | | 335,995 | | | | 14,652,558 | |
| | | | | | | | | | |
| | | | | | | | | 47,828,376 | |
| | | | | | | | | | |
| | | | | | | | | | |
Austria – 0.1% | | | | | | | | | | |
Raiffeisen Bank International AG (a) | | Banks | | | 61,016 | | | | 1,053,642 | |
| | | | | | | | | | |
| | | | | | | | | 1,053,642 | |
| | | | | | | | | | |
| | | | | | | | | | |
Belgium – 0.9% | | | | | | | | | | |
Ageas SA | | Insurance | | | 186,584 | | | | 7,011,944 | |
UCB SA | | Pharmaceuticals, Biotechnology & Life Sciences | | | 16,082 | | | | 2,074,385 | |
| | | | | | | | | | |
| | | | | | | | | 9,086,329 | |
| | | | | | | | | | |
| | | | | | | | | | |
Brazil – 1.1% | | | | | | | | | | |
Cia de Transmissao de Energia Eletrica Paulista | | Utilities | | | 358,800 | | | | 1,553,527 | |
Lojas Americanas SA | | Retailing | | | 466,600 | | | | 3,056,410 | |
Raia Drogasil SA | | Food & Staples Retailing | | | 75,600 | | | | 1,802,213 | |
WEG SA | | Capital Goods | | | 372,800 | | | | 4,823,098 | |
| | | | | | | | | | |
| | | | | | | | | 11,235,248 | |
| | | | | | | | | | |
| | | | | | | | | | |
China – 1.9% | | | | | | | | | | |
China Life Insurance Co., Ltd., Class H | | Insurance | | | 2,201,000 | | | | 5,048,965 | |
Li Ning Co., Ltd. | | Consumer Durables & Apparel | | | 1,542,142 | | | | 4,970,705 | |
Tingyi Cayman Islands Holding Corp. | | Food, Beverage & Tobacco | | | 1,942,000 | | | | 3,620,317 | |
Yangzijiang Shipbuilding Holdings, Ltd. | | Capital Goods | | | 2,822,300 | | | | 1,894,963 | |
Zhongsheng Group Holdings, Ltd. | | Retailing | | | 812,000 | | | | 5,019,658 | |
| | | | | | | | | | |
| | | | | | | | | 20,554,608 | |
| | | | | | | | | | |
| | | | | | | | | | |
Denmark – 1.8% | | | | | | | | | | |
Novo Nordisk A/S, Class B | | Pharmaceuticals, Biotechnology & Life Sciences | | | 68,529 | | | | 4,512,818 | |
Pandora A/S | | Consumer Durables & Apparel | | | 30,261 | | | | 1,931,681 | |
19
DOMINI IMPACT INTERNATIONAL EQUITY FUND
PORTFOLIOOF INVESTMENTS (continued)
July 31, 2020
| | | | | | | | | | |
| COUNTRY/SECURITY | | INDUSTRY | | SHARES | | | VALUE | |
Denmark (Continued) | | | | | | | | | | |
Vestas Wind Systems A/S | | Capital Goods | | | 98,444 | | | $ | 12,665,220 | |
| | | | | | | | | | |
| | | | | | | | | 19,109,719 | |
| | | | | | | | | | |
| | | | | | | | | | |
Finland – 2.0% | | | | | | | | | | |
Elisa Oyj | | Telecommunication Services | | | 17,583 | | | | 1,046,851 | |
Nordea Bank Abp (a) | | Banks | | | 1,343,389 | | | | 10,419,583 | |
Orion Oyj, Class B | | Pharmaceuticals, Biotechnology & Life Sciences | | | 148,142 | | | | 6,488,257 | |
Valmet Oyj | | Capital Goods | | | 120,012 | | | | 3,375,280 | |
| | | | | | | | | | |
| | | | | | | | | 21,329,971 | |
| | | | | | | | | | |
| | | | | | | | | | |
France – 10.0% | | | | | | | | | | |
Alstom SA (a) | | Capital Goods | | | 230,671 | | | | 12,903,350 | |
BNP Paribas SA (a) | | Banks | | | 302,403 | | | | 12,247,190 | |
Carrefour SA | | Food & Staples Retailing | | | 2,273 | | | | 36,264 | |
CNP Assurances (a) | | Insurance | | | 136,184 | | | | 1,660,464 | |
Credit Agricole SA (a) | | Banks | | | 419,060 | | | | 4,049,347 | |
Eiffage SA (a) | | Capital Goods | | | 136,709 | | | | 11,993,537 | |
Gecina SA | | Real Estate | | | 18,983 | | | | 2,472,027 | |
Kering SA | | Consumer Durables & Apparel | | | 18 | | | | 10,240 | |
Orange SA | | Telecommunication Services | | | 1,078,668 | | | | 12,691,766 | |
Sanofi | | Pharmaceuticals, Biotechnology & Life Sciences | | | 174,290 | | | | 18,370,621 | |
Sartorius Stedim Biotech | | Pharmaceuticals, Biotechnology & Life Sciences | | | 8,930 | | | | 2,803,931 | |
Schneider Electric SE | | Capital Goods | | | 239,813 | | | | 27,603,990 | |
| | | | | | | | | | |
| | | | | | | | | 106,842,727 | |
| | | | | | | | | | |
| | | | | | | | | | |
Germany – 7.0% | | | | | | | | | | |
adidas AG (a) | | Consumer Durables & Apparel | | | 33 | | | | 9,136 | |
Allianz SE | | Insurance | | | 13,705 | | | | 2,854,416 | |
Delivery Hero SE (a) | | Retailing | | | 20,358 | | | | 2,345,949 | |
Deutsche Boerse AG | | Diversified Financials | | | 23,646 | | | | 4,318,859 | |
Deutsche Post AG (a) | | Transportation | | | 382,173 | | | | 15,572,378 | |
Deutsche Telekom AG | | Telecommunication Services | | | 805,539 | | | | 13,500,207 | |
Evonik Industries AG | | Materials | | | 81,405 | | | | 2,207,748 | |
GEA Group AG | | Capital Goods | | | 188,541 | | | | 6,831,784 | |
Merck KGaA | | Pharmaceuticals, Biotechnology & Life Sciences | | | 107,494 | | | | 13,791,411 | |
Muenchener Rueckversicherungs-Gesellschaft AG in Muenchen | | Insurance | | | 11,172 | | | | 2,972,837 | |
SAP SE | | Software & Services | | | 6,544 | | | | 1,036,982 | |
Siemens AG | | Capital Goods | | | 14,185 | | | | 1,814,661 | |
TeamViewer AG (a) | | Software & Services | | | 52,115 | | | | 2,819,389 | |
Telefonica Deutschland Holding AG | | Telecommunication Services | | | 786,922 | | | | 2,155,456 | |
20
DOMINI IMPACT INTERNATIONAL EQUITY FUND
PORTFOLIOOF INVESTMENTS (continued)
July 31, 2020
| | | | | | | | | | |
| COUNTRY/SECURITY | | INDUSTRY | | SHARES | | | VALUE | |
Germany (Continued) | | | | | | | | | | |
United Internet AG | | Telecommunication Services | | | 59,959 | | | $ | 2,731,261 | |
| | | | | | | | | | |
| | | | | | | | | 74,962,474 | |
| | | | | | | | | | |
| | | | | | | | | | |
Hong Kong – 2.4% | | | | | | | | | | |
AIA Group, Ltd. | | Insurance | | | 102,600 | | | | 925,150 | |
Hong Kong Exchanges & Clearing, Ltd. | | Diversified Financials | | | 423,635 | | | | 20,170,852 | |
Sino Land Co., Ltd. | | Real Estate | | | 1,080,000 | | | | 1,308,638 | |
Swire Properties, Ltd. | | Real Estate | | | 649,800 | | | | 1,501,702 | |
Xinyi Glass Holdings, Ltd. | | Automobiles & Components | | | 1,190,000 | | | | 1,745,930 | |
| | | | | | | | | | |
| | | | | | | | | 25,652,272 | |
| | | | | | | | | | |
| | | | | | | | | | |
Hungary – 0.4% | | | | | | | | | | |
Richter Gedeon Nyrt | | Pharmaceuticals, Biotechnology & Life Sciences | | | 163,699 | | | | 3,801,581 | |
| | | | | | | | | | |
| | | | | | | | | 3,801,581 | |
| | | | | | | | | | |
| | | | | | | | | | |
India – 0.6% | | | | | | | | | | |
Cipla, Ltd. | | Pharmaceuticals, Biotechnology & Life Sciences | | | 207,827 | | | | 2,000,434 | |
Dr Reddy’s Laboratories, Ltd. | | Pharmaceuticals, Biotechnology & Life Sciences | | | 67,099 | | | | 4,065,876 | |
| | | | | | | | | | |
| | | | | | | | | 6,066,310 | |
| | | | | | | | | | |
| | | | | | | | | | |
Ireland – 0.5% | | | | | | | | | | |
Cimpress (a) | | Commercial & Professional Services | | | 22,486 | | | | 2,248,600 | |
CRH PLC | | Materials | | | 30,748 | | | | 1,123,813 | |
Smurfit Kappa Group PLC | | Materials | | | 47,111 | | | | 1,597,703 | |
| | | | | | | | | | |
| | | | | | | | | 4,970,116 | |
| | | | | | | | | | |
| | | | | | | | | | |
Israel – 1.0% | | | | | | | | | | |
Check Point Software Technologies, Ltd. (a) | | Software & Services | | | 86,728 | | | | 10,871,355 | |
| | | | | | | | | | |
| | | | | | | | | 10,871,355 | |
| | | | | | | | | | |
| | | | | | | | | | |
Italy – 3.9% | | | | | | | | | | |
Banco BPM SpA (a) | | Banks | | | 2,681,869 | | | | 4,068,537 | |
Buzzi Unicem SpA | | Materials | | | 338,751 | | | | 7,736,935 | |
Intesa Sanpaolo SpA (a) | | Banks | | | 8,729,582 | | | | 17,862,618 | |
Terna Rete Elettrica Nazionale SpA | | Utilities | | | 1,377,337 | | | | 10,318,418 | |
Unipol Gruppo SpA (a) | | Insurance | | | 430,286 | | | | 1,814,722 | |
| | | | | | | | | | |
| | | | | | | | | 41,801,230 | |
| | | | | | | | | | |
| | | | | | | | | | |
Japan – 23.8% | | | | | | | | | | |
Amada Co, Ltd. | | Capital Goods | | | 165,600 | | | | 1,114,218 | |
Benesse Holdings, Inc. | | Consumer Services | | | 53,300 | | | | 1,391,712 | |
21
DOMINI IMPACT INTERNATIONAL EQUITY FUND
PORTFOLIOOF INVESTMENTS (continued)
July 31, 2020
| | | | | | | | | | |
| COUNTRY/SECURITY | | INDUSTRY | | SHARES | | | VALUE | |
Japan (Continued) | | | | | | | | | | |
Brother Industries, Ltd. | | Technology Hardware & Equipment | | | 500 | | | $ | 7,791 | |
Central Japan Railway Co. | | Transportation | | | 115,882 | | | | 14,074,200 | |
Cosmos Pharmaceutical Corp. | | Food & Staples Retailing | | | 29,200 | | | | 5,372,130 | |
Dai Nippon Printing Co., Ltd. | | Commercial & Professional Services | | | 286,341 | | | | 6,228,345 | |
Eisai Co., Ltd. | | Pharmaceuticals, Biotechnology & Life Sciences | | | 150 | | | | 12,120 | |
Fancl Corp. | | Household & Personal Products | | | 204,186 | | | | 5,897,255 | |
FUJIFILM Holdings Corp. | | Technology Hardware & Equipment | | | 36,285 | | | | 1,624,676 | |
GungHo Online Entertainment, Inc. | | Media & Entertainment | | | 283,014 | | | | 5,209,464 | |
Hachijuni Bank, Ltd. (The) | | Banks | | | 488,522 | | | | 1,817,018 | |
Hoya Corp. | | Health Care Equipment & Services | | | 120,569 | | | | 11,904,504 | |
K’s Holdings Corp. | | Retailing | | | 540,872 | | | | 6,951,875 | |
Kurita Water Industries, Ltd. | | Capital Goods | | | 54,800 | | | | 1,475,635 | |
Matsumotokiyoshi Holdings Co., Ltd. | | Food & Staples Retailing | | | 106,700 | | | | 3,568,670 | |
Medipal Holdings Corp. | | Health Care Equipment & Services | | | 299,857 | | | | 5,497,958 | |
Mitsubishi Estate Co., Ltd. | | Real Estate | | | 321,425 | | | | 4,622,821 | |
Mitsubishi Gas Chemical Co., Inc. | | Materials | | | 392,152 | | | | 6,236,042 | |
Mitsui Fudosan Co., Ltd. | | Real Estate | | | 400 | | | | 6,261 | |
MS&AD Insurance Group Holdings, Inc. | | Insurance | | | 86,510 | | | | 2,176,395 | |
Nikon Corp. | | Consumer Durables & Apparel | | | 134,127 | | | | 938,847 | |
Nintendo Co., Ltd. | | Media & Entertainment | | | 37,177 | | | | 16,370,152 | |
Nippon Electric Glass Co., Ltd. | | Technology Hardware & Equipment | | | 350,075 | | | | 5,732,695 | |
Nissan Motor Co., Ltd. | | Automobiles & Components | | | 1,875,599 | | | | 6,423,190 | |
Nitori Holdings Co., Ltd. | | Retailing | | | 32,300 | | | | 7,080,000 | |
Nomura Holdings, Inc. | | Diversified Financials | | | 1,032,209 | | | | 4,863,496 | |
Nomura Real Estate Holdings, Inc. | | Real Estate | | | 430 | | | | 7,117 | |
Nomura Research Institute, Ltd. | | Software & Services | | | 501,944 | | | | 13,263,677 | |
NTN Corp. | | Capital Goods | | | 5,300 | | | | 9,278 | |
Ono Pharmaceutical Co., Ltd. | | Pharmaceuticals, Biotechnology & Life Sciences | | | 158,800 | | | | 4,468,729 | |
Open House Co., Ltd. | | Real Estate | | | 43,200 | | | | 1,220,709 | |
ORIX Corp. | | Diversified Financials | | | 630 | | | | 6,822 | |
Otsuka Holdings Co., Ltd. | | Pharmaceuticals, Biotechnology & Life Sciences | | | 306,486 | | | | 12,726,084 | |
Sawai Pharmaceutical Co., Ltd. | | Pharmaceuticals, Biotechnology & Life Sciences | | | 41,400 | | | | 1,969,033 | |
Seiko Epson Corp. | | Technology Hardware & Equipment | | | 142,800 | | | | 1,516,759 | |
Seino Holdings Co., Ltd. | | Transportation | | | 455,920 | | | | 5,617,995 | |
Sekisui House, Ltd. | | Consumer Durables & Apparel | | | 258,100 | | | | 4,719,447 | |
Shimamura Co., Ltd. | | Retailing | | | 70,391 | | | | 4,900,682 | |
22
DOMINI IMPACT INTERNATIONAL EQUITY FUND
PORTFOLIOOF INVESTMENTS (continued)
July 31, 2020
| | | | | | | | | | |
| COUNTRY/SECURITY | | INDUSTRY | | SHARES | | | VALUE | |
Japan (Continued) | | | | | | | | | | |
Sony Corp. | | Consumer Durables & Apparel | | | 170 | | | $ | 13,224 | |
Sundrug Co., Ltd. | | Food & Staples Retailing | | | 247,829 | | | | 8,443,820 | |
Taiyo Yuden Co., Ltd. | | Technology Hardware & Equipment | | | 297,596 | | | | 9,444,760 | |
TIS, Inc. | | Software & Services | | | 454,362 | | | | 9,741,933 | |
Toho Gas Co., Ltd. | | Utilities | | | 98,700 | | | | 4,312,279 | |
Tokyo Electron, Ltd. | | Semiconductors & Semiconductor Equipment | | | 21,668 | | | | 6,002,998 | |
Toppan Printing Co., Ltd. | | Commercial & Professional Services | | | 541,898 | | | | 8,133,423 | |
Toyo Seikan Group Holdings, Ltd. | | Materials | | | 137,427 | | | | 1,507,081 | |
Tsuruha Holdings, Inc. | | Food & Staples Retailing | | | 28,800 | | | | 3,998,294 | |
Welcia Holdings Co., Ltd. | | Food & Staples Retailing | | | 18,400 | | | | 1,688,073 | |
Yamada Denki Co., Ltd. | | Retailing | | | 1,562,500 | | | | 6,787,072 | |
Yamato Holdings Co., Ltd. | | Transportation | | | 381,700 | | | | 9,854,006 | |
Yamazaki Baking Co., Ltd. | | Food, Beverage & Tobacco | | | 373,900 | | | | 6,281,544 | |
| | | | | | | | | | |
| | | | | | | | | 253,232,309 | |
| | | | | | | | | | |
| | | | | | | | | | |
Jordan – 0.8% | | | | | | | | | | |
Hikma Pharmaceuticals PLC | | Pharmaceuticals, Biotechnology & Life Sciences | | | 310,869 | | | | 8,734,128 | |
| | | | | | | | | | |
| | | | | | | | | 8,734,128 | |
| | | | | | | | | | |
| | | | | | | | | | |
Malaysia – 0.1% | | | | | | | | | | |
RHB Bank Bhd | | Banks | | | 902,248 | | | | 1,068,393 | |
| | | | | | | | | | |
| | | | | | | | | 1,068,393 | |
| | | | | | | | | | |
| | | | | | | | | | |
Mexico – 0.4% | | | | | | | | | | |
Gruma SAB de C.V., Class B | | Food, Beverage & Tobacco | | | 336,170 | | | | 3,952,179 | |
| | | | | | | | | | |
| | | | | | | | | 3,952,179 | |
| | | | | | | | | | |
| | | | | | | | | | |
Netherlands – 4.8% | | | | | | | | | | |
Akzo Nobel NV | | Materials | | | 136,415 | | | | 12,903,269 | |
Altice Europe NV (a) | | Telecommunication Services | | | 1,609,749 | | | | 7,661,725 | |
ASM International NV | | Semiconductors & Semiconductor Equipment | | | 30,468 | | | | 4,678,637 | |
Koninklijke Ahold Delhaize NV | | Food & Staples Retailing | | | 816,398 | | | | 23,603,760 | |
NXP Semiconductors NV | | Semiconductors & Semiconductor Equipment | | | 17,528 | | | | 2,060,066 | |
| | | | | | | | | | |
| | | | | | | | | 50,907,457 | |
| | | | | | | | | | |
| | | | | | | | | | |
Norway – 0.9% | | | | | | | | | | |
Orkla ASA | | Food, Beverage & Tobacco | | | 923,146 | | | | 9,102,910 | |
| | | | | | | | | | |
| | | | | | | | | 9,102,910 | |
| | | | | | | | | | |
23
DOMINI IMPACT INTERNATIONAL EQUITY FUND
PORTFOLIOOF INVESTMENTS (continued)
July 31, 2020
| | | | | | | | | | |
| COUNTRY/SECURITY | | INDUSTRY | | SHARES | | | VALUE | |
Panama – 0.2% | | | | | | | | | | |
Copa Holdings SA, Class A | | Transportation | | | 40,297 | | | $ | 1,669,908 | |
| | | | | | | | | | |
| | | | | | | | | 1,669,908 | |
| | | | | | | | | | |
| | | | | | | | | | |
Singapore – 1.1% | | | | | | | | | | |
Ascendas Real Estate Investment Trust | | Real Estate | | | 485,600 | | | | 1,259,433 | |
CapitaLand, Ltd. | | Real Estate | | | 123,500 | | | | 249,743 | |
Mapletree Logistics Trust | | Real Estate | | | 5,932,600 | | | | 9,259,208 | |
UOL Group, Ltd. | | Real Estate | | | 256,500 | | | | 1,244,903 | |
| | | | | | | | | | |
| | | | | | | | | 12,013,287 | |
| | | | | | | | | | |
| | | | | | | | | | |
South Africa – 0.5% | | | | | | | | | | |
Clicks Group, Ltd. | | Food & Staples Retailing | | | 385,573 | | | | 5,165,191 | |
| | | | | | | | | | |
| | | | | | | | | 5,165,191 | |
| | | | | | | | | | |
| | | | | | | | | | |
South Korea – 0.3% | | | | | | | | | | |
LG Uplus Corp. | | Telecommunication Services | | | 348,694 | | | | 3,356,658 | |
| | | | | | | | | | |
| | | | | | | | | 3,356,658 | |
| | | | | | | | | | |
| | | | | | | | | | |
Spain – 0.8% | | | | | | | | | | |
Acerinox SA (a) | | Materials | | | 378,180 | | | | 3,273,367 | |
Banco Bilbao Vizcaya Argentaria SA | | Banks | | | 1,837,581 | | | | 5,743,809 | |
Banco Santander SA | | Banks | | | 2,078 | | | | 4,474 | |
| | | | | | | | | | |
| | | | | | | | | 9,021,650 | |
| | | | | | | | | | |
| | | | | | | | | | |
Sweden – 5.7% | | | | | | | | | | |
Essity AB, Class B (a) | | Household & Personal Products | | | 369,275 | | | | 12,234,658 | |
Getinge AB, Class B | | Health Care Equipment & Services | | | 367,724 | | | | 8,919,146 | |
Hennes & Mauritz AB, Class B | | Retailing | | | 996,002 | | | | 15,589,595 | |
ICA Gruppen AB | | Food & Staples Retailing | | | 36,903 | | | | 1,820,331 | |
L E Lundbergforetagen AB, Class B (a) | | Diversified Financials | | | 73,640 | | | | 3,473,500 | |
Sandvik AB (a) | | Capital Goods | | | 251,866 | | | | 4,726,572 | |
Skanska AB, Class B (a) | | Capital Goods | | | 141,043 | | | | 2,858,962 | |
Tele2 AB, Class B | | Telecommunication Services | | | 259,715 | | | | 3,699,969 | |
Telefonaktiebolaget LM Ericsson, Class B | | Technology Hardware & Equipment | | | 656,739 | | | | 7,672,969 | |
| | | | | | | | | | |
| | | | | | | | | 60,995,702 | |
| | | | | | | | | | |
| | | | | | | | | | |
Switzerland – 10.2% | | | | | | | | | | |
ABB, Ltd. | | Capital Goods | | | 42,568 | | | | 1,074,725 | |
Adecco Group AG | | Commercial & Professional Services | | | 227,559 | | | | 10,810,370 | |
Logitech International SA | | Technology Hardware & Equipment | | | 162,578 | | | | 11,923,029 | |
Lonza Group AG | | Pharmaceuticals, Biotechnology & Life Sciences | | | 10,046 | | | | 6,315,608 | |
24
DOMINI IMPACT INTERNATIONAL EQUITY FUND
PORTFOLIOOF INVESTMENTS (continued)
July 31, 2020
| | | | | | | | | | |
| COUNTRY/SECURITY | | INDUSTRY | | SHARES | | | VALUE | |
Switzerland (Continued) | | | | | | | | | | |
Novartis AG | | Pharmaceuticals, Biotechnology & Life Sciences | | | 462,696 | | | $ | 38,314,172 | |
Sonova Holding AG (a) | | Health Care Equipment & Services | | | 19,968 | | | | 4,538,916 | |
STMicroelectronics NV | | Semiconductors & Semiconductor Equipment | | | 490,507 | | | | 13,835,076 | |
Swiss Life Holding AG | | Insurance | | | 28,450 | | | | 10,452,244 | |
Swisscom AG | | Telecommunication Services | | | 7,079 | | | | 3,783,012 | |
Zurich Insurance Group AG | | Insurance | | | 21,695 | | | | 8,065,643 | |
| | | | | | | | | | |
| | | | | | | | | 109,112,795 | |
| | | | | | | | | | |
| | | | | | | | | | |
Taiwan – 1.8% | | | | | | | | | | |
Accton Technology Corp. | | Technology Hardware & Equipment | | | 151,000 | | | | 1,182,932 | |
Asia Cement Corp. | | Materials | | | 745,232 | | | | 1,015,865 | |
Cathay Financial Holding Co., Ltd. | | Insurance | | | 1,199,000 | | | | 1,620,834 | |
Lite-On Technology Corp. | | Technology Hardware & Equipment | | | 1,700,447 | | | | 2,876,798 | |
Novatek Microelectronics Corp. | | Semiconductors & Semiconductor Equipment | | | 213,277 | | | | 2,114,184 | |
United Microelectronics Corp. | | Semiconductors & Semiconductor Equipment | | | 7,296,259 | | | | 5,532,715 | |
Wistron Corp. | | Technology Hardware & Equipment | | | 2,609,000 | | | | 3,056,943 | |
Wiwynn | | Technology Hardware & Equipment | | | 38,135 | | | | 1,022,434 | |
Yageo Corp. | | Technology Hardware & Equipment | | | 80,000 | | | | 1,062,296 | |
| | | | | | | | | | |
| | | | | | | | | 19,485,001 | |
| | | | | | | | | | |
| | | | | | | | | | |
United Kingdom – 7.9% | |
3i Group PLC | | Diversified Financials | | | 399,970 | | | | 4,616,156 | |
Avast PLC | | Software & Services | | | 291,529 | | | | 2,191,646 | |
AVEVA Group PLC | | Software & Services | | | 45,288 | | | | 2,450,653 | |
Aviva PLC | | Insurance | | | 445,825 | | | | 1,537,315 | |
Berkeley Group Holdings PLC | | Consumer Durables & Apparel | | | 247,091 | | | | 14,374,758 | |
ConvaTec Group PLC | | Health Care Equipment & Services | | | 1,575,228 | | | | 4,197,617 | |
GlaxoSmithKline PLC | | Pharmaceuticals, Biotechnology & Life Sciences | | | 630,333 | | | | 12,589,998 | |
Great Portland Estates PLC | | Real Estate | | | 155,621 | | | | 1,203,241 | |
Inchcape PLC | | Retailing | | | 320,528 | | | | 1,800,423 | |
J Sainsbury PLC | | Food & Staples Retailing | | | 1,004,544 | | | | 2,454,959 | |
Legal & General Group PLC | | Insurance | | | 700,472 | | | | 1,944,287 | |
M&G PLC | | Diversified Financials | | | 1,405,374 | | | | 2,949,233 | |
Persimmon PLC (a) | | Consumer Durables & Apparel | | | 52,301 | | | | 1,637,213 | |
Segro PLC | | Real Estate | | | 278,493 | | | | 3,536,333 | |
Standard Life Aberdeen PLC | | Diversified Financials | | | 1,874,406 | | | | 6,117,173 | |
Taylor Wimpey PLC | | Consumer Durables & Apparel | | | 2,419,667 | | | | 3,742,380 | |
Unilever PLC | | Household & Personal Products | | | 237 | | | | 14,150 | |
Vodafone Group PLC | | Telecommunication Services | | | 11,464,640 | | | | 17,275,680 | |
| | | | | | | | | | |
| | | | | | | | | 84,633,215 | |
| | | | | | | | | | |
| | | | | | | | | | |
25
DOMINI IMPACT INTERNATIONAL EQUITY FUND
PORTFOLIOOF INVESTMENTS (continued)
July 31, 2020
| | | | | | | | | | |
| COUNTRY/SECURITY | | INDUSTRY | | SHARES | | | VALUE | |
United States – 1.1% | |
Ferguson PLC | | Capital Goods | | | 81,035 | | | $ | 7,162,612 | |
Jazz Pharmaceuticals PLC (a) | | Pharmaceuticals, Biotechnology & Life Sciences | | | 45,301 | | | | 4,903,833 | |
| | | | | | | | | | |
| | | | | | | | | 12,066,445 | |
| | | | | | | | | | |
| | |
| Total Investments – 98.5% (Cost $978,492,155) (b) | | | | | 1,049,683,186 | |
| | |
| Other Assets, less liabilities – 1.5% | | | | | 15,634,838 | |
| | | | | | | | | | |
| | |
| Net Assets – 100.0% | | | | | $1,065,318,024 | |
| | | | | | | | | | |
(a) Non-income producing security.
(b) The aggregate cost for federal income tax purposes is $985,414,315. The aggregate gross unrealized appreciation is $116,335,510 and the aggregate gross unrealized depreciation is $52,066,639, resulting in net unrealized appreciation of $64,268,871.
As of the date of this report, certain foreign securities were fair valued by an independent pricing service under the direction of the Board of Trustees or its delegates in accordance with the Trust’s Valuation and Pricing Policies and Procedures.
SEE NOTES TO FINANCIAL STATEMENTS
26
DOMINI IMPACT EQUITY FUND
Performance Commentary (Unaudited)
The Fund invests in a diversified portfolio of primarily mid- to large-cap U.S. equities. Domini makes all security selections and investment decisions, combining two unique strategies: “U.S. Core” and “Thematic Solutions.” U.S. Core seeks to provide core stock market exposure through a diversified selection of companies that demonstrate strong social and environmental performance relative to their peers. Thematic Solutions seeks to provide opportunistic exposure to solution-oriented companies helping to address sustainability challenges, as determined by Domini’s social, environmental and financial research and analysis. As of July 31, 2020, 89.2% of the Fund’s portfolio was allocated to U.S. Core and 10.8% was allocated to Thematic Solutions (excluding cash).
SSGA Funds Management, Inc, an SEC-registered investment adviser, serves as subadviser to the Fund, responsible for purchasing and selling securities to implement Domini’s investment instructions and for managing the Fund’s short-term investments. SSGA FM is unaffiliated with the Domini Funds, other than with respect to the provision of submanagement services.
Market Overview:
Over the twelve-month period ended July 31, 2020, we witnessed one of the most volatile and extraordinary periods in stock-market history. As the COVID-19 pandemic sent shockwaves through the global economy in early 2020, equities experienced their sharpest selloff since the 2008 financial crisis. However, thanks to a rapid recovery over the spring and early summer months, U.S. equities, as measured by the S&P 500, managed to end the twelve-month period with a gain of 11.96%.
Growth in U.S. equities continued relatively uninterrupted for the first half of the fiscal-year period. At the start, investor focused remained largely on the ongoing trade war between the U.S. and China, as well as on the Federal Reserve Bank (Fed), which came under increasing pressure to provide further monetary accommodation to support continued economic expansion. After cutting interest rates for the first time in over a decade at its July 2019 meeting, the Fed cut rates two more times before the end of the year, citing muted inflation and signs of slowing growth. Higher tariffs and trade uncertainty weighed on business sentiment, leading to a contraction in manufacturing activity throughout the final five months of the year. However, the labor market remained resilient, with unemployment remaining near a 50-year low of 3.5%, even as growth in wages and consumer spending began to slow.
The new year got off to a positive start, with U.S. equities continuing to build momentum throughout January and early February. Wildfires in Australia, rising geopolitical conflict between the U.S. and Iran and early concerns about the spread of the novel coronavirus in China were overshadowed by growing optimism for a trade deal, a recovery in manufacturing activity and business
27
sentiment, and strong fourth-quarter corporate earnings. The S&P 500 peaked at an all-time high on February 19, up nearly 15% since the start of the fiscal-year period.
However, as COVID-19 began to rapidly spread around the world, health and economic risks intensified, and investors began to flee risk assets by the end of February. An emergency rate cut by the Fed and a strong Super Tuesday showing by Joe Biden, which positioned him as the leader and eventual victor in the Democratic presidential primary, helped stem losses in early March, but the selloff resumed in earnest after a breakdown in negotiations between Russia and OPEC sent oil prices plummeting. By mid-March, the World Health Organization (WHO) had officially declared COVID-19 a pandemic, and cases rapidly escalated throughout much of the U.S. Many state and local governments began to enforce social distancing and quarantine measures to help contain the spread of the virus. As a result, many businesses had to close their doors, some permanently. The shutdown had particularly devastating repercussions for those in the services sector, with small businesses and hourly workers bearing the brunt of the impact. By April, jobless claims surpassed 30 million, and the unemployment rate jumped to 14.7%, the highest level since the Great Depression. In response, Congress passed the Coronavirus Aid, Relief, and Economic Security (CARES) Act, a $2.2 trillion stimulus package to help provide emergency assistance to individuals, businesses, and state and local governments, while the Fed slashed benchmark interest rates to near zero and launched a $700 billion quantitative easing program.
The S&P 500 declined nearly 34% from its peak on February 19 to its bottom on March 23. However, over the four months that followed, the market staged a remarkable recovery, with equities managing to recoup the majority of their losses by the end of July. As of July 31, the S&P 500 was off just over 2.5% from its February high.
This quick recovery seemed somewhat at odds with the health and economic realities faced by many, with the U.S. approaching 5 million confirmed COVID-19 cases by the end of July and the economy shrinking by 9.5% during the second quarter. Nevertheless, investors found cause for renewed optimism as businesses began to reopen and rehire workers, supported by unprecedented levels of fiscal and monetary stimulus. By the end of July, the unemployment rate recovered to 10.2%, and the number of unemployed persons fell to 16.3 million. Consumer spending also rebounded, and retail sales recovered 27% from their April low. Corporations indicated that business volumes had begun to stabilize as early as April, and, with over half of companies reporting before the end of July, second-quarter earnings largely exceeded tempered expectations.
Effective lockdown measures around the world have led to a rapid decline in COVID-19 cases for most countries, supporting the case for a sustained global economic recovery. Meanwhile, improvements in testing and contact tracing
28
capabilities and successful early-stage trials in vaccine development provide further cause for optimism that the virus can be successfully contained. Still, there is risk as economies continue to reopen that potential spikes in new cases could lead to temporary setbacks and variation in the pace of recovery across different geographies. For example, a surge in new infections across parts of the U.S. in June and July forced many states to temporarily pause or reverse reopening plans. Ongoing negotiations in Congress over the second stimulus package and the upcoming election in November will also be key points of focus for investors over the coming months.
At Domini, we continue to closely monitor our investments and the positioning of our portfolios in light of evolving market conditions. We remain confident that our investments can play a role in the continued recovery and help better prepare us for potential future health crises—from improvements in testing and the development of needed vaccines, to continued innovation in technologies and services that can help keep us safe, healthy and connected. Regardless of the path of recovery, we remain committed to positioning our Fund portfolios for a more sustainable and equitable future.
Portfolio Performance:
The Domini Impact Equity Fund Investor shares returned 21.98% for the twelve-month period ended July 31, 2020, outperforming the S&P 500 Index return of 11.96% by more than 10%.
Both the Fund’s U.S. Core and Thematic Solutions strategies outperformed over the period. U.S. Core, which accounted on average for 91.1% of the overall Fund, returned 22.0% for the period (gross of fees). Thematic Solutions, which had an average weight of 8.3%, returned 57.4% (gross of fees).
Strong security selection was the primary driver of the Fund’s overall outperformance relative to the benchmark. Selection was particularly strong in the Consumer Discretionary, Industrials and Health Care sectors. Sector positioning relative to the benchmark also made a strong positive contribution to relative results, primarily attributable to the Fund’s underweight to Energy and overweight to Information Technology, which were the benchmark’s weakest and strongest sectors, respectively, for the period. The Fund does not invest in the GICS Energy sector due to Domini’s exclusionary screens on fossil fuels.
From a market capitalization perspective, a positive contribution from the Fund’s strong selection in mid-cap stocks, where the Fund maintains an overweight position, was partly offset by its overweight to small-cap stocks, which underperformed for the period.
At a company level, the single largest contributor to relative results was electric vehicle manufacturer Tesla, a non-benchmark holding that returned 492.2% in Fund’s Thematic Solutions strategy over the period. Other Thematic Solutions
29
investments among the Fund’s top contributors included non-benchmark holding Teladoc Health (+248.2%), a leader in telehealth services, and an overweight position in Dexcom (+177.6%), a leading provider of continuous glucose monitoring devices. Top contributors from the Fund’s Core strategy included overweight positions in technology leaders Apple (+101.9%), Amazon.com (+69.5%), and Microsoft (52.3%). The Fund also benefitted from not owning oil and gas company Exxon Mobil (-40.0%), aerospace and defense company Boeing (-52.9%), and banking and financial services company Wells Fargo (-47.3%), all of which Domini currently considers ineligible for investment based on our Impact Investment Standards.
At the other end, the largest detraction from relative results came from not owning social media and advertising company Facebook (+30.6%), which is also currently ineligible for investment by Domini. The second largest detraction came from not owning payment solutions company PayPal Holdings (+77.6%). Among companies the Fund did own, the largest detractors included non-benchmark Core holdings Toronto-Dominion (TD) Bank (-21.1%) and Novartis (-2.8%), a Swiss pharmaceutical company. From the Thematic Solutions strategy, the largest detractors were non-benchmark positions in OLED manufacturer Universal Display Corporation (-17.1%) and online technology training provider Pluralsight (-31.0%).
We believe the Fund’s strong outperformance over this extremely volatile period, which was largely driven by stock selection across both of its investment strategies, is a testament to the value of social and environmental standards as a primary input in the investment decision-making process. By investing in well-managed companies that demonstrate strong social and environmental performance relative to their peers, coupled with opportunistic exposure to companies at the forefront of delivering needed sustainability solutions, we believe we can continue to create long-term value for our shareholders, as well as our planet and our global community.
30
TEN LARGEST HOLDING (Unaudited)
| | | | | | | | | | |
| | | | |
| SECURITY DESCRIPTION | | % NET
ASSETS | | | SECURITY DESCRIPTION | | % NET
ASSETS | |
| | | | |
| Apple Inc | | | 8.0% | | | Visa Inc Cl A | | | 1.6% | |
| | | | |
| Microsoft Corp | | | 7.5% | | | Home Depot Inc/The | | | 1.4% | |
| | | | |
| Amazon.com, Inc | | | 6.6% | | | Mastercard Inc Cl A | | | 1.3% | |
| | | | |
| Alphabet, Inc Class A | | | 4.3% | | | NVIDIA Corp | | | 1.2% | |
| | | | |
| Procter + Gamble Co/The | | | 1.6% | | | Verizon Communications Inc | | | 1.2% | |
PORTFOLIO HOLDINGS BY INDUSTRY SECTOR (% OF NET ASSETS) (Unaudited)
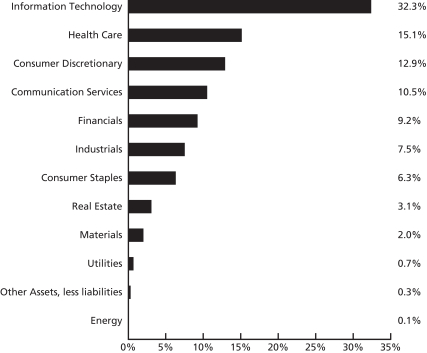
The holdings mentioned above are described in the Domini Impact Equity Fund’s Portfolio of Investments (as of 7/31/20), included herein. The composition of the Fund’s portfolio is subject to change.
The Global Industry Classification Standard (“GICS”) was developed by and is the exclusive property and a service mark of MSCI Inc. (“MSCI”) and Standard & Poor’s, a division of The McGraw-Hill Companies, Inc. (“S&P”) and is licensed for use by Domini Impact Investments. Neither MSCI, S&P nor any third party involved in making or compiling the GICS or any GICS classifications makes any express or implied warranties or representations with respect to such standard or classification nor shall any such party have any liability therefrom.
31
| | | | | | |
| |
| AVERAGE ANNUAL TOTAL RETURNS (Unaudited) |
| | |
| | | Investor shares | | S&P 500 |
| | | |
| As of 7/31/20 | | 1 Year | | 21.98% | | 11.96% |
| | | |
| | 5 Year | | 9.75% | | 11.49% |
| | | |
| | | 10 Year | | 11.94% | | 13.84% |
Comparison of $10,000 Investment in the Domini Impact Equity Fund Investor Shares (DSEFX) and S&P 500 (Unaudited)
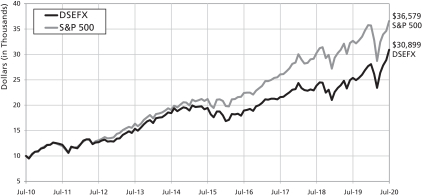
NOTE: The Fund’s current investment strategy commenced on December 1, 2018 with SSGA Funds Management, Inc as its subadviser. Performance information for periods prior to December 1, 2018 reflects the investment strategies employed during those periods.
Past performance is no guarantee of future results. The Fund’s returns quoted above represent past performance after all expenses. The returns reflect any applicable expense waivers in effect during the periods shown. Without such waivers, Fund performance would be lower. Investment return, principal value, and yield will fluctuate. Your shares, when redeemed, may be worth more or less than their original cost. Call 1-800-582-6757 or visit www.domini.com for performance information current to the most recent month-end, which may be lower or higher than the performance data quoted. A 2.00% redemption fee applies on sales or exchanges of shares made less than 30 days after the settlement of purchase or acquisition through exchange, with certain exceptions. Quoted performance data does not reflect the deduction of this fee, which would reduce the performance quoted. See the prospectus for further information.
Per the prospectus dated November 29, 2019, the Fund’s annual operating expenses totaled 1.09% (gross/net). The Fund’s adviser has contractually agreed to waive certain fees and/or reimburse certain ordinary expenses in order to limit Investor share expenses to 1.09% through November 30, 2020, absent an earlier modification approved by the Funds’ Board of Trustees.
The table and the graph do not reflect the deduction of taxes that a shareholder would pay on Fund distributions or the redemption of Fund shares. Total return for the Fund is based on the Fund’s net asset values and assumes all dividend and capital gains were reinvested.
An investment in the Fund is not a bank deposit and is not insured. You may lose money. The Fund is subject to market, recent events, impact investing, portfolio management, information, and mid-to large-cap companies risks.
The Standard & Poor’s 500 Index (S&P 500) is an unmanaged index of common stocks. Investors cannot invest directly in the S&P 500.
32
| | | | | | | | |
| |
| AVERAGE ANNUAL TOTAL RETURNS (Unaudited) |
| | | | |
| | | | | Class A shares
(with 4.75%
maximum
Sales Charge) | | Class A
shares
(without Sales
Charge) | | S&P 500 |
| | | | |
| As of 7/31/20 | | 1 Year | | 16.21% | | 22.01% | | 11.96% |
| | | | |
| | 5 Year | | 8.66% | | 9.73% | | 11.49% |
| | | | |
| | | 10 Year | | 11.41% | | 11.96% | | 13.84% |
Comparison of $10,000 Investment in the Domini Impact Equity Fund Class A Shares (DSEPX) and S&P 500 (with 4.75% maximum sales charge) (Unaudited)
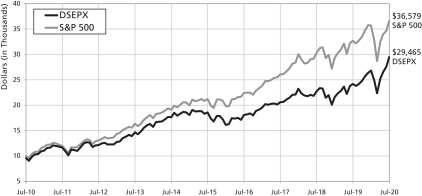
NOTE: The Fund’s current investment strategy commenced on December 1, 2018 with SSGA Funds Management, Inc as its subadviser. Performance information for periods prior to December 1, 2018 reflects the investment strategies employed during those periods.
Past performance is no guarantee of future results. The Fund’s returns quoted above represent past performance after all expenses. The returns reflect any applicable expense waivers in effect during the periods shown. Without such waivers, Fund performance would be lower. Investment return, principal value, and yield will fluctuate. Your shares, when redeemed, may be worth more or less than their original cost. Call 1-800-762-6814 or visit www.domini.com for performance information current to the most recent month-end, which may be lower or higher than the performance data quoted. A 2.00% redemption fee applies on sales or exchanges of shares made less than 30 days after the settlement of purchase or acquisition through exchange, with certain exceptions. Quoted performance data does not reflect the deduction of this fee, which would reduce the performance quoted. See the prospectus for further information.
Per the prospectus dated November 29, 2019, the Fund’s annual operating expenses totaled 1.43% (gross)/1.09% (net). The Fund’s adviser has contractually agreed to waive certain fees and/or reimburse certain ordinary operating expenses in order to limit Class A share expenses to 1.09% through November 30, 2020, absent an earlier modification approved by the Funds’ Board of Trustees.
The table and graph do not reflect the deduction of taxes that a shareholder would pay on Fund distributions or the redemption of Fund shares. Total return for the Fund is based on the Fund’s net asset values and assumes all dividend and capital gains were reinvested.
An investment in the Fund is not a bank deposit and is not insured. You may lose money. The Fund is subject to market, recent events, impact investing, portfolio management, information, and mid-to large-cap companies risks.
The Standard & Poor’s 500 Index (S&P 500) is an unmanaged index of common stocks. Investors cannot invest directly in the S&P 500.
33
| | | | | | |
| |
| AVERAGE ANNUAL TOTAL RETURNS (Unaudited) |
| | |
| | | Institutional shares | | S&P 500 |
| | | |
| As of 7/31/20 | | 1 Year | | 22.43% | | 11.96% |
| | | |
| | 5 Year | | 10.14% | | 11.49% |
| | | |
| | | 10 Year | | 12.37% | | 13.84% |
Comparison of $500,000 Investment in the Domini Impact Equity Fund Institutional (DIEQX) Shares and S&P 500 (Unaudited)
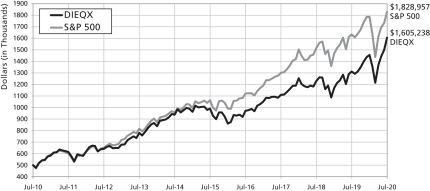
NOTE: The Fund’s current investment strategy commenced on December 1, 2018 with SSGA Funds Management, Inc as its subadviser. Performance information for periods prior to December 1, 2018 reflects the investment strategies employed during those periods.
Past performance is no guarantee of future results. The Fund’s returns quoted above represent past performance after all expenses. The returns reflect any applicable expense waivers in effect during the periods shown. Without such waivers, Fund performance would be lower. Investment return, principal value, and yield will fluctuate. Your shares, when redeemed, may be worth more or less than their original cost. Call 1-800-762-6814 or visit www.domini.com for performance information current to the most recent month-end, which may be lower or higher than the performance data quoted. A 2.00% redemption fee applies on sales or exchanges of shares made less than 30 days after the settlement of purchase or acquisition through exchange, with certain exceptions. Quoted performance data does not reflect the deduction of this fee, which would reduce the performance quoted. See the prospectus for further information.
Per the prospectus dated November 29, 2019, the Fund’s annual operating expenses totaled 0.76% (gross)/0.74% (net). The Fund’s adviser has contractually agreed to waive certain fees and/or reimburse certain ordinary operating expenses in order to limit Institutional share expenses to 0.74% through November 30, 2020, absent an earlier modification approved by the Funds’ Board of Trustees.
The table and graph do not reflect the deduction of taxes that a shareholder would pay on Fund distributions or the redemption of Fund shares. Total return for the Fund is based on the Fund’s net asset values and assumes all dividend and capital gains were reinvested.
An investment in the Fund is not a bank deposit and is not insured. You may lose money. The Fund is subject to market, recent events, impact investing, portfolio management, information, and mid-to large-cap companies risks.
The Standard & Poor’s 500 Index (S&P 500) is an unmanaged index of common stocks. Investors cannot invest directly in the S&P 500.
34
| | | | | | |
| |
| AVERAGE ANNUAL TOTAL RETURNS (Unaudited) |
| | |
| | | Class R shares | | S&P 500 |
| | | |
| As of 7/31/20 | | 1 Year | | 22.34% | | 11.96% |
| | | |
| | 5 Year | | 10.06% | | 11.49% |
| | | |
| | | 10 Year | | 12.28% | | 13.84% |
Comparison of $10,000 Investment in the Domini Impact Equity Fund Class R Shares (DSFRX) and S&P 500 (Unaudited)
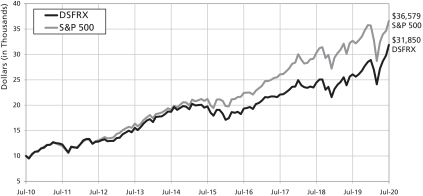
NOTE: The Fund’s current investment strategy commenced on December 1, 2018 with SSGA Funds Management, Inc as its subadviser. Performance information for periods prior to December 1, 2018 reflects the investment strategies employed during those periods.
Past performance is no guarantee of future results. The Fund’s returns quoted above represent past performance after all expenses. The returns reflect any applicable expense waivers in effect during the periods shown. Without such waivers, Fund performance would be lower. Investment return, principal value, and yield will fluctuate. Your shares, when redeemed, may be worth more or less than their original cost. Call 1-800-762-6814 or visit www.domini.com for performance information current to the most recent month-end, which may be lower or higher than the performance data quoted. A 2.00% redemption fee applies on sales or exchanges of shares made less than 30 days after the settlement of purchase or acquisition through exchange, with certain exceptions. Quoted performance data does not reflect the deduction of this fee, which would reduce the performance quoted. See the prospectus for further information.
Per the prospectus dated November 29, 2019, the Fund’s annual operating expenses totaled 0.88% (gross)/0.80% (net). The Fund’s adviser has contractually agreed to waive certain fees and/or reimburse certain ordinary operating expenses in order to limit Class R share expenses to 0.80% through November 30, 2020, absent an earlier modification approved by the Funds’ Board of Trustees.
The table and graph do not reflect the deduction of taxes that a shareholder would pay on Fund distributions or the redemption of Fund shares. Total return for the Fund is based on the Fund’s net asset values and assumes all dividend and capital gains were reinvested.
An investment in the Fund is not a bank deposit and is not insured. You may lose money. The Domini Impact Equity Fund is subject to market, recent events, impact investing, portfolio management, information, and mid-to large-cap companies risks.
The Standard & Poor’s 500 Index (S&P 500) is an unmanaged index of common stocks. Investors cannot invest directly in the S&P 500.
35
DOMINI IMPACT EQUITY FUND
PORTFOLIOOF INVESTMENTS
July 31, 2020
| | | | | | | | |
| SECURITY | | SHARES | | | VALUE | |
| Long Term Investments – 99.7% | | | | | | |
| Common Stocks – 99.7% | | | | | | |
| Communication Services – 10.5% | | | | | | |
Alphabet, Inc., Class A (a) | | | 24,400 | | | $ | 36,305,980 | |
AT&T, Inc. | | | 295,085 | | | | 8,728,614 | |
CenturyLink, Inc. | | | 46,100 | | | | 444,865 | |
Charter Communications, Inc., Class A (a) | | | 5,958 | | | | 3,455,640 | |
Comcast Corp., Class A | | | 187,521 | | | | 8,025,899 | |
Electronic Arts, Inc. (a) | | | 12,018 | | | | 1,701,989 | |
Netflix, Inc. (a) | | | 17,938 | | | | 8,769,529 | |
New York Times Co. (The), Class A | | | 6,000 | | | | 276,840 | |
Omnicom Group, Inc. | | | 8,700 | | | | 467,451 | |
Take-Two Interactive Software, Inc. (a) | | | 4,581 | | | | 751,376 | |
TELUS Corp. | | | 52,794 | | | | 916,504 | |
Verizon Communications, Inc. | | | 171,595 | | | | 9,863,281 | |
Walt Disney Co. (The) | | | 74,793 | | | | 8,746,293 | |
| | | | | | | | |
| | | | | | | 88,454,261 | |
| | | | | | | | |
| | |
| Consumer Discretionary – 12.9% | | | | | | |
Advance Auto Parts, Inc. | | | 2,657 | | | | 398,922 | |
Amazon.com, Inc. (a) | | | 17,519 | | | | 55,442,029 | |
Aptiv PLC | | | 10,300 | | | | 800,825 | |
Best Buy Co., Inc. | | | 9,449 | | | | 941,026 | |
BorgWarner, Inc. | | | 8,800 | | | | 322,080 | |
Bright Horizons Family Solutions, Inc. (a) | | | 2,400 | | | | 257,376 | |
Chegg, Inc. (a) | | | 40,235 | | | | 3,257,828 | |
Chipotle Mexican Grill, Inc. (a) | | | 1,117 | | | | 1,290,314 | |
Cie Generale des Etablissements Michelin SCA ADR | | | 36,650 | | | | 759,798 | |
eBay, Inc. | | | 27,800 | | | | 1,536,784 | |
Fast Retailing Co., Ltd. ADR | | | 22,653 | | | | 1,210,350 | |
Gap, Inc. (The) | | | 12,345 | | | | 165,053 | |
Garmin, Ltd. | | | 5,646 | | | | 556,639 | |
Home Depot, Inc. (The) | | | 44,451 | | | | 11,801,296 | |
Kohl’s Corp. | | | 6,912 | | | | 131,604 | |
Lowe’s Cos., Inc. | | | 31,341 | | | | 4,666,988 | |
NIKE, Inc., Class B | | | 50,749 | | | | 4,953,610 | |
NVR, Inc. (a) | | | 150 | | | | 589,522 | |
Sony Corp. ADR | | | 52,055 | | | | 4,058,208 | |
Starbucks Corp. | | | 48,167 | | | | 3,686,221 | |
Target Corp. | | | 20,551 | | | | 2,586,960 | |
Tesla, Inc. (a) | | | 6,306 | | | | 9,022,373 | |
Ulta Beauty, Inc. (a) | | | 2,198 | | | | 424,192 | |
| | | | | | | | |
| | | | | | | 108,859,998 | |
| | | | | | | | |
| | |
| Consumer Staples – 6.3% | | | | | | |
Beyond Meat, Inc. (a) | | | 20,798 | | | | 2,618,468 | |
Campbell Soup Co. | | | 7,991 | | | | 396,114 | |
Church & Dwight Co., Inc. | | | 10,112 | | | | 974,089 | |
Clorox Co. (The) | | | 5,200 | | | | 1,229,852 | |
Colgate-Palmolive Co. | | | 35,225 | | | | 2,719,370 | |
36
DOMINI IMPACT EQUITY FUND
PORTFOLIOOF INVESTMENTS (continued)
July 31, 2020
| | | | | | | | |
| SECURITY | | SHARES | | | VALUE | |
| | |
| Consumer Staples (Continued) | | | | | | |
Costco Wholesale Corp. | | | 18,003 | | | $ | 5,860,517 | |
Estee Lauder Cos., Inc. (The), Class A | | | 8,277 | | | | 1,635,038 | |
General Mills, Inc. | | | 25,199 | | | | 1,594,341 | |
JM Smucker Co. (The) | | | 4,746 | | | | 518,975 | |
Kimberly-Clark Corp. | | | 14,218 | | | | 2,161,705 | |
Kraft Heinz Co. (The) | | | 26,623 | | | | 915,299 | |
Kroger Co. (The) | | | 31,711 | | | | 1,103,226 | |
Lamb Weston Holdings, Inc. | | | 5,800 | | | | 348,464 | |
McCormick & Co., Inc. | | | 5,400 | | | | 1,052,460 | |
Mondelez International, Inc., Class A | | | 58,147 | | | | 3,226,577 | |
Orkla ASA ADR | | | 29,600 | | | | 287,890 | |
PepsiCo, Inc. | | | 57,431 | | | | 7,905,951 | |
Procter & Gamble Co. (The) | | | 102,125 | | | | 13,390,630 | |
Sysco Corp. | | | 20,003 | | | | 1,057,158 | |
Unilever PLC ADR | | | 45,485 | | | | 2,750,933 | |
Walgreens Boots Alliance, Inc. | | | 30,448 | | | | 1,239,538 | |
| | | | | | | | |
| | | | | | | 52,986,595 | |
| | | | | | | | |
| | |
| Energy – 0.1% | | | | | | |
Legrand SA ADR | | | 55,100 | | | | 847,438 | |
| | | | | | | | |
| | | | | | | 847,438 | |
| | | | | | | | |
| | |
| Financials – 9.2% | | | | | | |
Aflac, Inc. | | | 27,715 | | | | 985,823 | |
AGNC Investment Corp. | | | 22,200 | | | | 301,920 | |
American Express Co. | | | 24,848 | | | | 2,318,815 | |
Annaly Capital Management, Inc. | | | 57,600 | | | | 426,816 | |
Bank of America Corp. | | | 320,754 | | | | 7,980,359 | |
Bank of Montreal | | | 26,831 | | | | 1,489,657 | |
Bank of New York Mellon Corp. (The) | | | 33,200 | | | | 1,190,220 | |
Bank of Nova Scotia (The) | | | 49,966 | | | | 2,054,602 | |
BlackRock, Inc. | | | 5,934 | | | | 3,412,109 | |
Capital One Financial Corp. | | | 18,818 | | | | 1,200,588 | |
Cboe Global Markets, Inc. | | | 4,500 | | | | 394,650 | |
Charles Schwab Corp. (The) | | | 48,458 | | | | 1,606,383 | |
Chubb, Ltd. | | | 16,387 | | | | 2,085,082 | |
Cincinnati Financial Corp. | | | 6,311 | | | | 491,816 | |
Citigroup, Inc. | | | 86,608 | | | | 4,331,266 | |
CME Group, Inc. | | | 14,598 | | | | 2,425,896 | |
Comerica, Inc. | | | 5,954 | | | | 229,348 | |
Discover Financial Services | | | 12,600 | | | | 622,818 | |
DNB ASA ADR (a) | | | 35,948 | | | | 539,759 | |
E*TRADE Financial Corp. | | | 9,514 | | | | 483,026 | |
East West Bancorp, Inc. | | | 6,000 | | | | 207,960 | |
Equitable Holdings, Inc. | | | 16,100 | | | | 329,406 | |
Everest Re Group, Ltd. | | | 1,700 | | | | 371,943 | |
FactSet Research Systems, Inc. | | | 1,500 | | | | 519,450 | |
Federal Agricultural Mortgage Corp., Class C | | | 34,298 | | | | 2,041,074 | |
Fifth Third Bancorp | | | 30,556 | | | | 606,842 | |
37
DOMINI IMPACT EQUITY FUND
PORTFOLIOOF INVESTMENTS (continued)
July 31, 2020
| | | | | | | | |
| SECURITY | | SHARES | | | VALUE | |
| | |
| Financials (Continued) | | | | | | |
First Republic Bank | | | 7,000 | | | $ | 787,360 | |
Franklin Resources, Inc. | | | 12,700 | | | | 267,335 | |
Hartford Financial Services Group, Inc. (The) | | | 14,693 | | | | 621,808 | |
Huntington Bancshares, Inc. | | | 43,800 | | | | 406,026 | |
Intercontinental Exchange, Inc. | | | 22,295 | | | | 2,157,710 | |
Invesco, Ltd. | | | 18,603 | | | | 186,774 | |
KeyCorp. | | | 39,200 | | | | 470,792 | |
London Stock Exchange Group PLC ADR | | | 58,800 | | | | 1,654,044 | |
MarketAxess Holdings, Inc. | | | 1,500 | | | | 775,050 | |
Marsh & McLennan Cos., Inc. | | | 21,130 | | | | 2,463,758 | |
Moody’s Corp. | | | 6,814 | | | | 1,916,778 | |
Morgan Stanley | | | 49,634 | | | | 2,426,110 | |
MSCI, Inc. | | | 3,405 | | | | 1,280,212 | |
Nasdaq, Inc. | | | 4,900 | | | | 643,419 | |
Northern Trust Corp. | | | 8,200 | | | | 642,470 | |
PNC Financial Services Group, Inc. (The) | | | 17,249 | | | | 1,839,951 | |
Principal Financial Group, Inc. | | | 11,800 | | | | 500,674 | |
Progressive Corp. (The) | | | 24,458 | | | | 2,209,536 | |
Prudential Financial, Inc. | | | 16,461 | | | | 1,043,134 | |
Raymond James Financial, Inc. | | | 5,400 | | | | 375,192 | |
Regions Financial Corp. | | | 41,028 | | | | 445,564 | |
Reinsurance Group of America, Inc. | | | 2,600 | | | | 221,650 | |
S&P Global, Inc. | | | 9,998 | | | | 3,501,799 | |
SEI Investments Co. | | | 5,900 | | | | 308,747 | |
Swiss Re AG ADR | | | 45,393 | | | | 887,433 | |
T Rowe Price Group, Inc. | | | 9,211 | | | | 1,272,039 | |
TD Ameritrade Holding Corp. | | | 11,000 | | | | 394,790 | |
Toronto-Dominion Bank (The) | | | 74,617 | | | | 3,304,041 | |
Travelers Cos., Inc. (The) | | | 10,516 | | | | 1,203,241 | |
Truist Financial Corp. | | | 56,202 | | | | 2,105,327 | |
US Bancorp | | | 55,716 | | | | 2,052,577 | |
Voya Financial, Inc. | | | 5,000 | | | | 247,000 | |
Zions Bancorp NA | | | 7,099 | | | | 230,505 | |
| | | | | | | | |
| | | | | | | 77,490,474 | |
| | | | | | | | |
| | |
| Health Care – 15.1% | | | | | | |
AbbVie, Inc. | | | 72,952 | | | | 6,923,874 | |
ABIOMED, Inc. (a) | | | 1,800 | | | | 539,892 | |
Agilent Technologies, Inc. | | | 12,800 | | | | 1,233,024 | |
Alcon, Inc. (a) | | | 20,362 | | | | 1,221,313 | |
Alexion Pharmaceuticals, Inc. (a) | | | 8,781 | | | | 899,965 | |
Align Technology, Inc. (a) | | | 3,000 | | | | 881,460 | |
Amgen, Inc. | | | 24,319 | | | | 5,950,130 | |
Becton Dickinson and Co. | | | 12,151 | | | | 3,418,562 | |
Biogen, Inc. (a) | | | 6,767 | | | | 1,858,827 | |
BioMarin Pharmaceutical, Inc. (a) | | | 7,300 | | | | 874,613 | |
Bio-Rad Laboratories, Inc., Class A (a) | | | 900 | | | | 472,401 | |
Bio-Techne Corp. | | | 1,600 | | | | 440,256 | |
BioTelemetry, Inc. (a) | | | 59,147 | | | | 2,517,296 | |
38
DOMINI IMPACT EQUITY FUND
PORTFOLIOOF INVESTMENTS (continued)
July 31, 2020
| | | | | | | | |
| SECURITY | | SHARES | | | VALUE | |
| | |
| Health Care (Continued) | | | | | | |
Bristol-Myers Squibb Co. | | | 93,601 | | | $ | 5,490,635 | |
Bruker Corp. | | | 4,600 | | | | 205,252 | |
Cerner Corp. | | | 12,923 | | | | 897,502 | |
Cooper Cos., Inc. (The) | | | 2,300 | | | | 650,739 | |
Danaher Corp. | | | 26,115 | | | | 5,322,237 | |
DENTSPLY SIRONA, Inc. | | | 9,416 | | | | 419,954 | |
DexCom, Inc. (a) | | | 9,029 | | | | 3,932,491 | |
Edwards Lifesciences Corp. (a) | | | 25,272 | | | | 1,981,578 | |
Gilead Sciences, Inc. | | | 51,846 | | | | 3,604,852 | |
GlaxoSmithKline PLC ADR | | | 103,525 | | | | 4,174,128 | |
Guardant Health, Inc. (a) | | | 2,400 | | | | 204,432 | |
Haemonetics Corp. (a) | | | 2,051 | | | | 179,791 | |
Henry Schein, Inc. (a) | | | 6,200 | | | | 426,126 | |
Hill-Rom Holdings, Inc. | | | 2,800 | | | | 272,216 | |
Hologic, Inc. (a) | | | 59,510 | | | | 4,152,608 | |
IDEXX Laboratories, Inc. (a) | | | 3,519 | | | | 1,399,682 | |
Illumina, Inc. (a) | | | 6,049 | | | | 2,311,686 | |
Incyte Corp. (a) | | | 7,700 | | | | 760,452 | |
Insulet Corp. (a) | | | 2,700 | | | | 549,072 | |
Ionis Pharmaceuticals, Inc. (a) | | | 5,300 | | | | 305,068 | |
Koninklijke Philips NV (a) | | | 36,876 | | | | 1,908,333 | |
Merck & Co., Inc. | | | 104,535 | | | | 8,387,888 | |
Mettler-Toledo International, Inc. (a) | | | 990 | | | | 925,650 | |
Moderna, Inc. (a) | | | 11,400 | | | | 844,740 | |
Novo Nordisk A/S ADR | | | 69,178 | | | | 4,519,399 | |
OraSure Technologies, Inc. (a) | | | 161,776 | | | | 2,936,234 | |
PerkinElmer, Inc. | | | 4,400 | | | | 523,204 | |
Pfizer, Inc. | | | 230,170 | | | | 8,856,942 | |
Quest Diagnostics, Inc. | | | 5,715 | | | | 726,205 | |
Regeneron Pharmaceuticals, Inc. (a) | | | 3,542 | | | | 2,238,792 | |
ResMed, Inc. | | | 6,046 | | | | 1,224,376 | |
Sanofi ADR | | | 88,616 | | | | 4,647,909 | |
Seattle Genetics, Inc. (a) | | | 20,698 | | | | 3,441,457 | |
STERIS PLC | | | 3,600 | | | | 574,668 | |
Stryker Corp. | | | 13,928 | | | | 2,692,282 | |
Teladoc Health, Inc. (a) | | | 24,772 | | | | 5,886,570 | |
Teleflex, Inc. | | | 1,900 | | | | 708,890 | |
Thermo Fisher Scientific, Inc. | | | 16,388 | | | | 6,783,813 | |
Varian Medical Systems, Inc. (a) | | | 3,900 | | | | 556,608 | |
Veeva Systems, Inc., Class A (a) | | | 5,606 | | | | 1,483,179 | |
Vertex Pharmaceuticals, Inc. (a) | | | 10,743 | | | | 2,922,096 | |
Waters Corp. (a) | | | 2,563 | | | | 546,303 | |
| | | | | | | | |
| | | | | | | 127,807,652 | |
| | | | | | | | |
| | |
| Industrials – 7.5% | | | | | | |
Alaska Air Group, Inc. | | | 5,100 | | | | 175,644 | |
Allegion PLC | | | 3,900 | | | | 387,894 | |
Ameresco, Inc., Class A (a) | | | 139,569 | | | | 3,863,270 | |
AO Smith Corp. | | | 5,800 | | | | 279,212 | |
39
DOMINI IMPACT EQUITY FUND
PORTFOLIOOF INVESTMENTS (continued)
July 31, 2020
| | | | | | | | |
| SECURITY | | SHARES | | | VALUE | |
| | |
| Industrials (Continued) | | | | | | |
Assa Abloy AB ADR | | | 78,242 | | | $ | 848,143 | |
Brambles, Ltd. ADR | | | 30,300 | | | | 466,620 | |
Carlisle Cos., Inc. | | | 2,400 | | | | 285,792 | |
CH Robinson Worldwide, Inc. | | | 5,800 | | | | 543,576 | |
Cintas Corp. | | | 3,600 | | | | 1,086,732 | |
Copart, Inc. (a) | | | 8,800 | | | | 820,600 | |
CoStar Group, Inc. (a) | | | 1,671 | | | | 1,419,949 | |
Cummins, Inc. | | | 6,041 | | | | 1,167,484 | |
Dai Nippon Printing Co., Ltd. ADR | | | 18,200 | | | | 197,561 | |
Deere & Co. | | | 13,145 | | | | 2,317,595 | |
Deutsche Post AG ADR (a) | | | 41,137 | | | | 1,652,885 | |
Donaldson Co., Inc. | | | 5,200 | | | | 251,368 | |
Emerson Electric Co. | | | 24,826 | | | | 1,539,460 | |
Expeditors International of Washington, Inc. | | | 6,600 | | | | 557,766 | |
Fastenal Co. | | | 23,358 | | | | 1,098,760 | |
Flowserve Corp. | | | 5,300 | | | | 147,711 | |
Fortune Brands Home & Security, Inc. | | | 5,800 | | | | 443,700 | |
Graco, Inc. | | | 6,900 | | | | 367,356 | |
HD Supply Holdings, Inc. (a) | | | 6,200 | | | | 217,620 | |
Hubbell, Inc. | | | 2,400 | | | | 323,928 | |
IAA, Inc. (a) | | | 5,500 | | | | 238,425 | |
IDEX Corp. | | | 3,200 | | | | 527,424 | |
IHS Markit, Ltd. | | | 15,394 | | | | 1,242,758 | |
Illinois Tool Works, Inc. | | | 11,952 | | | | 2,211,000 | |
Ingersoll Rand, Inc. (a) | | | 13,969 | | | | 441,281 | |
JB Hunt Transport Services, Inc. | | | 3,400 | | | | 439,960 | |
JetBlue Airways Corp. (a) | | | 9,688 | | | | 100,174 | |
Johnson Controls International PLC | | | 30,936 | | | | 1,190,417 | |
KAR Auction Services, Inc. | | | 5,500 | | | | 83,215 | |
Lennox International, Inc. | | | 1,600 | | | | 429,024 | |
Makita Corp. ADR | | | 10,500 | | | | 414,750 | |
Masco Corp. | | | 10,700 | | | | 611,612 | |
Middleby Corp. (The) (a) | | | 2,400 | | | | 199,344 | |
Nidec Corp. ADR | | | 83,956 | | | | 1,672,404 | |
Nielsen Holdings PLC | | | 15,500 | | | | 223,665 | |
Nordson Corp. | | | 2,100 | | | | 406,623 | |
Old Dominion Freight Line, Inc. | | | 4,400 | | | | 804,408 | |
Owens Corning | | | 4,533 | | | | 274,111 | |
PACCAR, Inc. | | | 14,200 | | | | 1,208,136 | |
Pentair PLC | | | 7,300 | | | | 312,805 | |
Quanta Services, Inc. | | | 6,000 | | | | 239,820 | |
Robert Half International, Inc. | | | 4,751 | | | | 241,683 | |
Rockwell Automation, Inc. | | | 4,772 | | | | 1,040,964 | |
Roper Technologies, Inc. | | | 4,257 | | | | 1,840,940 | |
Schneider Electric SE ADR | | | 115,200 | | | | 2,646,144 | |
Sensata Technologies Holding PLC (a) | | | 6,100 | | | | 231,678 | |
Siemens AG ADR | | | 67,536 | | | | 4,294,614 | |
Simpson Manufacturing Co., Inc. | | | 1,600 | | | | 154,496 | |
SKF AB ADR | | | 18,000 | | | | 328,770 | |
40
DOMINI IMPACT EQUITY FUND
PORTFOLIOOF INVESTMENTS (continued)
July 31, 2020
| | | | | | | | |
| SECURITY | | SHARES | | | VALUE | |
| | |
| Industrials (Continued) | | | | | | |
Snap-on, Inc. | | | 2,300 | | | $ | 335,501 | |
Stanley Black & Decker, Inc. | | | 6,354 | | | | 974,195 | |
Sunrun, Inc. (a) | | | 116,801 | | | | 4,285,429 | |
Thomson Reuters Corp. | | | 6,700 | | | | 467,928 | |
Toro Co. (The) | | | 4,500 | | | | 321,075 | |
Trane Technologies PLC | | | 9,707 | | | | 1,085,922 | |
Trex Co., Inc. (a) | | | 2,300 | | | | 320,459 | |
United Parcel Service, Inc., Class B | | | 29,093 | | | | 4,153,317 | |
United Rentals, Inc. (a) | | | 2,900 | | | | 450,573 | |
Vestas Wind Systems A/S ADR | | | 24,300 | | | | 1,029,591 | |
Watsco, Inc. | | | 1,300 | | | | 306,891 | |
Westinghouse Air Brake Technologies Corp. | | | 7,591 | | | | 472,084 | |
Wolters Kluwer NV ADR | | | 40,075 | | | | 3,151,097 | |
WW Grainger, Inc. | | | 1,870 | | | | 638,661 | |
Xylem, Inc. | | | 7,700 | | | | 561,946 | |
| | | | | | | | |
| | | | | | | 63,065,940 | |
| | | | | | | | |
| | |
| Information Technology – 32.3% | | | | | | |
2U, Inc. (a) | | | 46,923 | | | | 2,209,839 | |
Adobe, Inc. (a) | | | 19,961 | | | | 8,869,072 | |
Advanced Micro Devices, Inc. (a) | | | 48,050 | | | | 3,720,511 | |
Apple, Inc. | | | 158,149 | | | | 67,219,651 | |
Applied Materials, Inc. | | | 37,502 | | | | 2,412,504 | |
Atlassian Corp. PLC, Class A (a) | | | 13,639 | | | | 2,409,329 | |
Autodesk, Inc. (a) | | | 17,283 | | | | 4,086,220 | |
Automatic Data Processing, Inc. | | | 16,368 | | | | 2,175,471 | |
Blackline, Inc. (a) | | | 41,590 | | | | 3,697,767 | |
Broadcom, Inc. | | | 16,113 | | | | 5,103,793 | |
Cadence Design Systems, Inc. (a) | | | 11,484 | | | | 1,254,627 | |
Cisco Systems, Inc. | | | 161,791 | | | | 7,620,356 | |
Cognizant Technology Solutions Corp., Class A | | | 22,523 | | | | 1,538,771 | |
Cree, Inc. (a) | | | 54,260 | | | | 3,739,599 | |
Enphase Energy, Inc. (a) | | | 52,881 | | | | 3,191,897 | |
First Solar, Inc. (a) | | | 62,762 | | | | 3,737,477 | |
Intel Corp. | | | 175,579 | | | | 8,380,386 | |
International Business Machines Corp. | | | 36,666 | | | | 4,507,718 | |
Intuit, Inc. | | | 10,422 | | | | 3,192,988 | |
Itron, Inc. (a) | | | 33,891 | | | | 2,357,458 | |
KLA Corp. | | | 6,410 | | | | 1,280,910 | |
Lam Research Corp. | | | 6,000 | | | | 2,262,960 | |
Mastercard, Inc., Class A | | | 36,352 | | | | 11,215,683 | |
Microsoft Corp. | | | 310,161 | | | | 63,586,107 | |
NetApp, Inc. | | | 9,708 | | | | 430,064 | |
NVIDIA Corp. | | | 24,477 | | | | 10,392,689 | |
Paychex, Inc. | | | 13,231 | | | | 951,574 | |
Pluralsight, Inc., Class A (a) | | | 113,672 | | | | 2,406,436 | |
salesforce.com, Inc. (a) | | | 35,834 | | | | 6,982,255 | |
Square, Inc., Class A (a) | | | 35,498 | | | | 4,609,415 | |
STMicroelectronics NV, Class Y | | | 112,680 | | | | 3,148,279 | |
41
DOMINI IMPACT EQUITY FUND
PORTFOLIOOF INVESTMENTS (continued)
July 31, 2020
| | | | | | | | |
| SECURITY | | SHARES | | | VALUE | |
| | |
| Information Technology (Continued) | | | | | | |
Synopsys, Inc. (a) | | | 6,243 | | | $ | 1,243,730 | |
Texas Instruments, Inc. | | | 38,152 | | | | 4,866,288 | |
Universal Display Corp. | | | 24,661 | | | | 4,302,111 | |
Visa, Inc., Class A | | | 69,503 | | | | 13,233,371 | |
VMware, Inc., Class A (a) | | | 3,275 | | | | 459,188 | |
WEX, Inc. (a) | | | 1,916 | | | | 303,437 | |
| | | | | | | | |
| | | | | | | 273,099,931 | |
| | | | | | | | |
| | |
| Materials – 2.0% | | | | | | |
Air Products & Chemicals, Inc. | | | 9,259 | | | | 2,653,907 | |
AptarGroup, Inc. | | | 2,500 | | | | 288,000 | |
Avery Dennison Corp. | | | 3,500 | | | | 396,690 | |
Ecolab, Inc. | | | 10,548 | | | | 1,973,320 | |
International Paper Co. | | | 15,800 | | | | 549,682 | |
Linde PLC | | | 21,730 | | | | 5,326,240 | |
Novozymes A/S ADR | | | 8,100 | | | | 480,735 | |
Nucor Corp. | | | 12,092 | | | | 507,259 | |
PPG Industries, Inc. | | | 9,842 | | | | 1,059,491 | |
Sherwin-Williams Co. (The) | | | 3,464 | | | | 2,244,395 | |
Sonoco Products Co. | | | 3,900 | | | | 201,786 | |
Steel Dynamics, Inc. | | | 7,800 | | | | 213,798 | |
Vulcan Materials Co. | | | 5,644 | | | | 662,719 | |
Westrock Co. | | | 10,985 | | | | 295,057 | |
| | | | | | | | |
| | | | | | | 16,853,079 | |
| | | | | | | | |
| | |
| Real Estate – 3.1% | | | | | | |
Alexandria Real Estate Equities, Inc. | | | 5,186 | | | | 920,774 | |
American Tower Corp. | | | 18,309 | | | | 4,785,789 | |
Boston Properties, Inc. | | | 6,046 | | | | 538,638 | |
CBRE Group, Inc., Class A (a) | | | 12,822 | | | | 561,732 | |
Crown Castle International Corp. | | | 17,122 | | | | 2,854,237 | |
Digital Realty Trust, Inc. | | | 11,192 | | | | 1,796,764 | |
Duke Realty Corp. | | | 15,500 | | | | 622,945 | |
Equinix, Inc. | | | 3,631 | | | | 2,852,078 | |
Extra Space Storage, Inc. | | | 5,300 | | | | 547,702 | |
Federal Realty Investment Trust | | | 3,400 | | | | 259,420 | |
Host Hotels & Resorts, Inc. | | | 31,322 | | | | 337,651 | |
Iron Mountain, Inc. | | | 12,200 | | | | 343,918 | |
Kilroy Realty Corp. | | | 4,600 | | | | 268,042 | |
Mid-America Apartment Communities, Inc. | | | 4,900 | | | | 584,031 | |
Prologis, Inc. | | | 30,295 | | | | 3,193,699 | |
Public Storage | | | 6,177 | | | | 1,234,659 | |
Realty Income Corp. | | | 14,121 | | | | 847,966 | |
Regency Centers Corp. | | | 7,085 | | | | 290,697 | |
SBA Communications Corp. | | | 4,607 | | | | 1,435,265 | |
UDR, Inc. | | | 12,169 | | | | 440,518 | |
Ventas, Inc. | | | 15,963 | | | | 612,341 | |
Welltower, Inc. | | | 17,671 | | | | 946,459 | |
| | | | | | | | |
| | | | | | | 26,275,325 | |
| | | | | | | | |
42
DOMINI IMPACT EQUITY FUND
PORTFOLIOOF INVESTMENTS (continued)
July 31, 2020
| | | | | | | | |
| SECURITY | | SHARES | | | VALUE | |
| Utilities – 0.7% | | | | | | |
Alliant Energy Corp. | | | 10,200 | | | $ | 549,270 | |
Avangrid, Inc. | | | 2,547 | | | | 126,815 | |
Consolidated Edison, Inc. | | | 13,761 | | | | 1,057,258 | |
Eversource Energy | | | 14,158 | | | | 1,275,211 | |
National Grid PLC ADR | | | 29,419 | | | | 1,738,957 | |
Red Electrica Corp. SA ADR | | | 37,300 | | | | 360,877 | |
SSE PLC ADR | | | 42,500 | | | | 721,650 | |
Terna Rete Elettrica Nazionale SpA ADR | | | 20,500 | | | | 457,560 | |
| | | | | | | | |
| | | | | | | 6,287,598 | |
| | | | | | | | |
| | |
| Rights – 0.0% | | | | | | |
| | |
| Health Care – 0.0% | | | | | | |
Bristol-Myers Squibb Co., Exp. 3/31/21 (a) | | | 19,993 | | | | 71,975 | |
| | | | | | | | |
| | | | | | | 71,975 | |
| | | | | | | | |
| | |
| Total Investments – 99.7% (Cost $569,458,871) (b) | | | | | 842,100,266 | |
| | |
| Other Assets, less liabilities – 0.3% | | | | | 2,636,080 | |
| | | | | | | | |
| | |
| Net Assets – 100.0% | | | | | $844,736,346 | |
| | | | | | | | |
(a) Non-income producing security.
(b) The aggregate cost for federal income tax purposes is $573,555,346. The aggregate gross unrealized appreciation is $293,223,314 and the aggregate gross unrealized depreciation is $24,678,394, resulting in net unrealized appreciation of $268,544,920.
Abbreviations
ADR — American Depositary Receipt
SEE NOTES TO FINANCIAL STATEMENTS
43
DOMINI SUSTAINABLE SOLUTIONS FUND
Performance Commentary (Unaudited)
The Fund invests in a high-conviction global equity portfolio, seeking companies that provide solutions for a more sustainable future. Domini makes all security selections and investment decisions, using proprietary social, environmental and financial research to construct and maintain a portfolio of fewer than 50 equity securities. The Fund may invest in companies of any size around the world, including developed markets across the Americas, Europe and the Asia-Pacific region, as well as select emerging markets. Domini seeks solution-oriented companies that support the Fund’s sustainability themes: accelerate the transition to a low-carbon future; contribute to the development of sustainable communities; ensure access to clean water; support sustainable food systems; promote societal health and well-being; broaden financial inclusion; and bridge the digital divide.
SSGA Funds Management, Inc, an SEC-registered investment adviser, serves as subadviser to the Fund, is responsible for purchasing and selling securities to implement Domini’s investment instructions and for managing the Fund’s short-term investments. SSGA FM is unaffiliated with the Domini Funds, other than with respect to the provision of submanagement services.
Market Overview (Since April 1, 2020):
Following sharp selloff in equity markets earlier in 2020, global equities rebounded with strong gains over the four-month period since the inception of the Domini Sustainable Solutions Fund on April 1. As of July 31, the FTSE Global All Cap Index (gross)* returned 26.17% since the Fund’s inception and was off just 1.8% since the start of the year. Despite the ongoing COVID-19 pandemic, investor sentiment was generally positive over the four months, as economies around the world gradually continued along a path of reopening and recovery.
Most of Europe and the Asia-Pacific region saw the number of new infections fall throughout the period, supporting a robust rally in international equity markets that most of the world’s central banks helped to sustain through ongoing monetary accommodation. Given its early COVID-19 exposure and strict quarantine measures, China became the first global economy to return to growth, reporting a 3.2% rise in second-quarter GDP. The faster-than-expected recovery drove a rally in Chinese equities, overshadowing rising tensions with the U.S. later in the period, as both countries ordered the closure of consulates.
In Europe, following a record 12.1% decline in GDP during the second quarter, economic activity began to recover across the eurozone, with Germany leading the way. Germany, which was successful in slowing the spread of the virus early on, rapidly deployed €1.3 trillion in economic stimulus measures, including a €130 billion spending package aimed at boosting business investment and consumer sentiment. Germany also supported passage of the European Union’s
44
(EU) €750 billion recovery fund. Approval of the fund, which will be backed by common bond issuance of the European Commission, helped to bolster confidence in European assets, as it will establish the foundation for a coordinated economic response across the region and mitigate the risk of another sovereign debt crisis.
The United Kingdom’s (UK) economy, which is heavily reliant on services and household spending, shrank by 20.4% during the second quarter, pushing the UK into the deepest recession of any of the world’s major economies. The Bank of England (BOE) expanded its asset purchasing program by an additional £100 billion during the second quarter, increasing total purchases to £745 billion, while the UK’s Finance Minister pledged an additional £30 billion in stimulus measures to help bolster employment, on top of existing measures worth £133 billion. Ongoing Brexit negotiations continued to pose additional economic risks, although UK and EU officials have indicated that a comprehensive deal could be finalized in September.
Japan doubled its stimulus measures during the second quarter, while the Bank of Japan (BOJ) pledged to buy an unlimited amount of government bonds to help bolster the struggling export-dependent economy.
In the U.S., consumer confidence rebounded as businesses began to reopen, supported by unprecedented levels of fiscal and monetary stimulus. The unemployment rate recovered from its April high of 14.7% to 10.3% in July, while retail sales recovered 27% from their April low. Corporations indicated that business volumes had begun to stabilize as early as April, and, with over half of companies reporting before the end of July, second-quarter earnings largely exceeded tempered expectations.
Effective lockdown measures around the world have led to a rapid decline in COVID-19 cases for most countries, supporting the case for a sustained global economic recovery. Meanwhile, improvements in testing and contact tracing capabilities and successful early-stage trials in vaccine development provide further cause for optimism that the virus can be successfully contained. Still, there is risk as economies continue to reopen that potential spikes in new cases could lead to temporary setbacks and variation in the pace of recovery across different geographies. For example, several countries saw new outbreaks during the early summer months, including the UK and Spain, while the U.S. experienced a surge in new infections across many parts of the country that forced many states to temporarily pause or reverse reopening plans.
At Domini, we continue to closely monitor our investments and the positioning of our portfolios in light of evolving market conditions. We remain confident that our investments can play a role in the continued recovery and help better prepare us for potential future health crises — from improvements in testing and the development of needed vaccines, to continued innovation in technologies and services that can help keep us safe, healthy and connected.
45
Regardless of the path of recovery, we remain committed to positioning our Fund portfolios for a more sustainable and equitable future.
Portfolio Performance Since Inception (April 1, 2020):
As of July 31, 2020, the Domini Sustainable Solutions Fund Investor shares returned 52.80% since inception on April 1, 2020, more than doubling the FTSE Global All Cap Index (gross) return of 26.17% for the four-month period.
Relative to the benchmark, security selection was the primary driver of the Fund’s outperformance, with particularly strong selection in the Consumer Discretionary, Information Technology, and Health Care sectors. Sector positioning was also additive to relative results, primarily attributable to the Fund’s overweight to Information Technology. From a geographic perspective, security selection was particularly strong in the United States, while an overweight to the United States and an underweight to Japan were additive.
The largest individual contributor to the Fund’s absolute total return for the four-month period was electric-vehicle manufacturer Tesla, which returned 198.1%. Other top absolute contributors included rooftop solar installer Sunrun (+220.2%); medical technology and diagnostics company Hologic (+112.6%); plant-based protein company Beyond Meat (+110.2%); merchant services and payment solutions provider Square (+197.0%); LED semiconductor manufacturer Cree (+104.9%); solar-panel manufacturer First Solar (+73.2%); online technology training platform Pluralsight (+115.4%); online education services provider Chegg (+136.4%); and energy efficiency solutions company Ameresco (+77.0%).
The only holdings that detracted from the Fund’s absolute total return over the four-month period were Norwegian insurance and asset management company Storebrand (-3.5%) and British multinational pharmaceutical company GlaxoSmithKline (-2.4%).
We believe the Fund’s exceptional outperformance over its first four months demonstrates the strong potential and the need for solution-oriented investment strategies like this. Now more than ever, as we continue to struggle with the health and economic impacts of this unprecedented pandemic, the world needs solutions like those provided by the companies mentioned above. By focusing on how we can help address some of the world’s greatest sustainability challenges — from climate change to inequality in access to health care — we are confident that we can continue to identify investments with strong long-term growth potential and help create sustainable value for our shareholders, our planet and our global community.
* FTSE Global All Cap Index (gross) returns reflect no deduction for fees, expenses or taxes.
46
TEN LARGEST HOLDINGS (Unaudited)
| | | | | | | | | | |
| | | | |
| SECURITY DESCRIPTION | | % NET
ASSETS | | | SECURITY DESCRIPTION | | % NET
ASSETS | |
| | | | |
| Sunrun Inc | | | 4.9% | | | Autodesk Inc | | | 3.2% | |
| | | | |
| Hologic Inc | | | 3.7% | | | GlaxoSmithKline PLC | | | 3.2% | |
| | | | |
| Tesla Inc | | | 3.4% | | | Universal Display Corp | | | 3.1% | |
| | | | |
| First Solar Inc | | | 3.4% | | | Atlassian Corp PLC Class A | | | 3.1% | |
| | | | |
| Wolters Kluwer NV | | | 3.2% | | | Cree Inc | | | 2.9% | |
PORTFOLIO HOLDINGS BY INDUSTRY SECTOR (% OF NET ASSETS) (Unaudited)
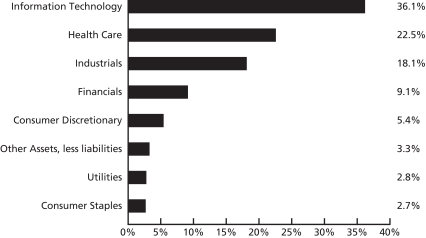
The Global Industry Classification Standard (“GICS”) was developed by and is the exclusive property and a service mark of MSCI Inc. (“MSCI”) and Standard & Poor’s, a division of The McGraw-Hill Companies, Inc. (“S&P”) and is licensed for use by Domini Impact Investments. Neither MSCI, S&P nor any third party involved in making or compiling the GICS or any GICS classifications makes any express or implied warranties or representations with respect to such standard or classification nor shall any such party have any liability therefrom.
47
PORTFOLIO HOLDINGS BY COUNTRY (% OF NET ASSETS) (Unaudited)
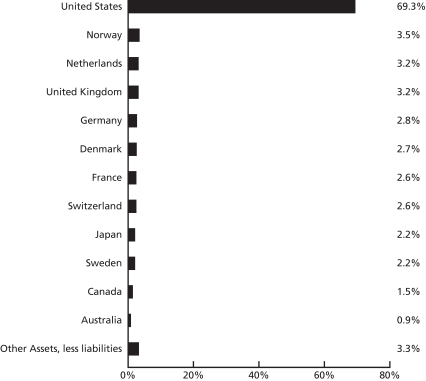
The holdings mentioned above are described in the Domini Sustainable Solutions Fund’s Portfolio of Investments (as of 7/31/2020) included herein. The composition of the Fund’s portfolio is subject to change.
48
| | | | | | |
| |
| AVERAGE ANNUAL TOTAL RETURNS (Unaudited) |
| | |
| | | Investor shares | | FTSE Global
All Cap Index (gross) |
| | | |
| As of 7/31/20 | | 1 Year | | N/A | | N/A |
| | | |
| | 5 Year | | N/A | | N/A |
| | | |
| | 10 Year | | N/A | | N/A |
| | | |
| | | Since Inception1 | | 52.80% | | 26.17% |
Comparison of $10,000 Investment in the Domini Sustainable Solutions Fund Investor Shares (CAREX) and FTSE Global All Cap Index (gross) (Unaudited)
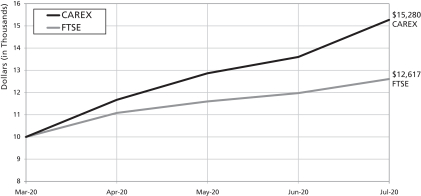
Past performance is no guarantee of future results. The Fund’s returns quoted above represent past performance after all expenses. The returns reflect any applicable expense waivers in effect during the periods shown. Without such waivers, Fund performance would be lower. Investment return, principal value, and yield will fluctuate. Your shares, when redeemed, may be worth more or less than their original cost. Call 1-800-582-6757 or visit www.domini.com for performance information current to the most recent month-end, which may be lower or higher than the performance data quoted. A 2.00% redemption fee applies on sales or exchanges of shares made less than 30 days after the settlement of purchase or acquisition through exchange, with certain exceptions. Quoted performance data does not reflect the deduction of this fee, which would reduce the performance quoted. See the prospectus for further information.
Per the prospectus dated March 2, 2020 the Fund’s annual operating expenses totaled: 1.94% (gross)/1.40% (net). The Fund’s adviser has contractually agreed to waive certain fees and/or reimburse certain ordinary operating expenses in order to limit Investor share expenses to 1.40% through November 30, 2021, absent an earlier modification approved by the Fund’s Board of Trustees.
The table and graph do not reflect the deduction of fees and taxes that a shareholder would pay on Fund distributions or the redemption of Fund shares. Total return is based on the Fund’s net asset values and assumes all dividends and capital gains were reinvested.
An investment in the Fund is not a bank deposit and Is not insured. You may lose money. The Fund is subject to market, recent events, sustainable investing, portfolio management, information, mid- to large-cap companies, and small-cap companies risks. Investing internationally involves special risks, such as currency fluctuations, social and economic instability, differing securities regulations and accounting standards, limited public information, possible changes in taxation, and periods of illiquidity.
The FTSE Global All Cap Index (gross) reflects no deduction for fees, expenses, or taxes. The Index represents returns of large, mid and small capitalization stocks globally. It is not available for direct investment.
1 Inception Date 4/1/2020. “Since Inception” for the FTSE Global All Cap Index (gross) refers to performance since 4/1/2020.
49
| | | | | | |
| |
| AVERAGE ANNUAL TOTAL RETURNS (Unaudited) |
| | |
| | | Institutional shares | | FTSE Global
All Cap
Index (gross) |
| | | |
| As of 7/31/20 | | 1 Year | | N/A | | N/A |
| | | |
| | 5 Year | | N/A | | N/A |
| | | |
| | 10 Year | | N/A | | N/A |
| | | |
| | | Since Inception1 | | 52.90% | | 26.17% |
Comparison of $500,000 Investment in the Domini Sustainable Solutions Fund Institutional Shares (LIFEX) and FTSE Global All Cap Index (gross) (Unaudited)
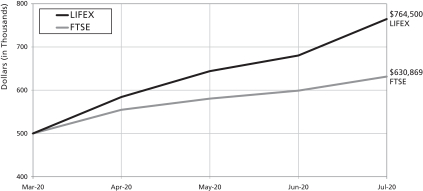
Past performance is no guarantee of future results. The Fund’s returns quoted above represent past performance after all expenses. The returns reflect any applicable expense waivers in effect during the periods shown. Without such waivers, Fund performance would be lower. Investment return, principal value, and yield will fluctuate. Your shares, when redeemed, may be worth more or less than their original cost. Call 1-800-762-6814 or visit www.domini.com for performance information current to the most recent month-end, which may be lower or higher than the performance data quoted. A 2.00% redemption fee applies on sales or exchanges of shares made less than 30 days after the settlement of purchase or acquisition through exchange, with certain exceptions. Quoted performance data does not reflect the deduction of this fee, which would reduce the performance quoted. See the prospectus for further information.
Per the prospectus dated March 2, 2020 the Fund’s annual operating expenses totaled: 1.69% (gross)/1.15% (net). The Fund’s adviser has contractually agreed to waive certain fees and/or reimburse certain ordinary operating expenses in order to limit Institutional share expenses to 1.15% through November 30, 2021, absent an earlier modification approved by the Fund’s Board of Trustees.
The table and graph do not reflect the deduction of fees and taxes that a shareholder would pay on Fund distributions or the redemption of Fund shares. Total return is based on the Fund’s net asset values and assumes all dividends and capital gains were reinvested.
An investment in the Fund is not a bank deposit and is not insured. You may lose money. The Fund is subject to market, recent events, sustainable investing, portfolio management, information, mid- to large-cap companies, and small-cap companies risks. Investing internationally involves special risks, such as currency fluctuations, social and economic instability, differing securities regulations and accounting standards, limited public information, possible changes in taxation, and periods of illiquidity. You may lose money.
The FTSE Global All Cap Index (gross) reflects no deduction for fees, expenses, or taxes. The Index represents returns of large, mid and small capitalization stocks globally. It is not available for direct investment.
1 Inception Date 4/1/2020. “Since Inception” for the FTSE Global All cap Index (gross) refers to performance since 4/1/2020.
50
DOMINI SUSTAINABLE SOLUTIONS FUND
PORTFOLIOOF INVESTMENTS
July 31, 2020
| | | | | | | | |
| Security | | Shares | | | Value | |
| Long Term Investments – 96.7% | | | | | | |
| Common Stocks – 96.7% | | | | | | |
| Consumer Discretionary – 5.4% | | | | | | |
Chegg, Inc. (a) | | | 4,955 | | | $ | 401,206 | |
Tesla, Inc. (a) | | | 468 | | | | 669,596 | |
| | | | | | | | |
| | | | | | | 1,070,802 | |
| | | | | | | | |
| | |
| Consumer Staples – 2.7% | | | | | | |
Beyond Meat, Inc. (a) | | | 4,331 | | | | 545,273 | |
| | | | | | | | |
| | | | | | | 545,273 | |
| | | | | | | | |
| | |
| Financials – 9.1% | | | | | | |
Amalgamated Bank, Class A | | | 37,069 | | | | 428,147 | |
Federal Agricultural Mortgage Corp., Class C | | | 6,553 | | | | 389,969 | |
Muenchener Rueckversicherungs-Gesellschaft AG in Muenchen | | | 2,057 | | | | 547,362 | |
Storebrand ASA (a) | | | 78,409 | | | | 430,169 | |
| | | | | | | | |
| | | | | | | 1,795,647 | |
| | | | | | | | |
| | |
| Health Care – 22.5% | | | | | | |
BioMerieux | | | 3,202 | | | | 518,063 | |
BioTelemetry, Inc. (a) | | | 9,664 | | | | 411,300 | |
Cochlear, Ltd. | | | 1,245 | | | | 170,539 | |
DexCom, Inc. (a) | | | 1,261 | | | | 549,216 | |
GlaxoSmithKline PLC | | | 31,313 | | | | 625,432 | |
Hologic, Inc. (a) | | | 10,440 | | | | 728,503 | |
OraSure Technologies, Inc. (a) | | | 31,562 | | | | 572,850 | |
Seattle Genetics, Inc. (a) | | | 2,669 | | | | 443,775 | |
Teladoc Health, Inc. (a) | | | 1,795 | | | | 426,546 | |
| | | | | | | | |
| | | | | | | 4,446,224 | |
| | | | | | | | |
| | |
| Industrials – 18.1% | | | | | | |
Ameresco, Inc., Class A (a) | | | 20,461 | | | | 566,360 | |
Kurita Water Industries, Ltd. | | | 15,952 | | | | 429,550 | |
Sunrun, Inc. (a) | | | 26,557 | | | | 974,376 | |
Sweco AB, Class B | | | 7,326 | | | | 423,839 | |
Vestas Wind Systems A/S | | | 4,210 | | | | 541,634 | |
Wolters Kluwer NV | | | 8,033 | | | | 635,105 | |
| | | | | | | | |
| | | | | | | 3,570,864 | |
| | | | | | | | |
| | |
| Information Technology – 36.1% | | | | | | |
2U, Inc. (a) | | | 9,639 | | | | 453,949 | |
Atlassian Corp. PLC, Class A (a) | | | 3,433 | | | | 606,439 | |
Autodesk, Inc. (a) | | | 2,652 | | | | 627,012 | |
Blackbaud, Inc. | | | 4,534 | | | | 283,556 | |
Blackline, Inc. (a) | | | 6,174 | | | | 548,930 | |
Cree, Inc. (a) | | | 8,363 | | | | 576,378 | |
Enphase Energy, Inc. (a) | | | 8,384 | | | | 506,058 | |
First Solar, Inc. (a) | | | 11,153 | | | | 664,161 | |
Itron, Inc. (a) | | | 6,687 | | | | 465,148 | |
51
DOMINI SUSTAINABLE SOLUTIONS FUND
PORTFOLIOOF INVESTMENTS (continued)
July 31, 2020
| | | | | | | | |
| Security | | Shares | | | Value | |
| | |
| Information Technology (Continued) | | | | | | |
Pluralsight, Inc., Class A (a) | | | 25,350 | | | $ | 536,660 | |
Square, Inc., Class A (a) | | | 3,682 | | | | 478,108 | |
STMicroelectronics NV | | | 17,879 | | | | 507,709 | |
Universal Display Corp. | | | 3,491 | | | | 609,005 | |
Zoom Video Communications, Inc., Class A (a) | | | 1,050 | | | | 266,606 | |
| | | | | | | | |
| | | | | | | 7,129,719 | |
| | | | | | | | |
| | |
| Utilities – 2.8% | | | | | | |
Innergex Renewable Energy, Inc. | | | 17,071 | | | | 292,991 | |
Scatec Solar ASA | | | 14,784 | | | | 258,349 | |
| | | | | | | | |
| | | | | | | 551,340 | |
| | | | | | | | |
| | |
| Total Investments – 96.7% (Cost $14,670,916) (b) | | | | | 19,109,869 | |
| | |
| Other Assets, less liabilities – 3.3% | | | | | 648,068 | |
| | | | | | | | |
| | |
| Net Assets – 100.0% | | | | | $19,757,937 | |
| | | | | | | | |
(a) Non-income producing security.
(b) The aggregate cost for federal income tax purposes is $14,671,480. The aggregate gross unrealized appreciation is $4,468,465 and the aggregate gross unrealized depreciation is $30,076, resulting in net unrealized appreciation of $4,438,389.
As of the date of this report, certain foreign securities were fair valued by an independent pricing service under the direction of the Board of Trustees or its delegates in accordance with the Trust’s Valuation and Pricing Policies and Procedures.
Portfolio Holdings by Country (% Of Net Assets) (Unaudited)
| | | | |
United States | | | 69.3% | |
Norway | | | 3.5% | |
Netherlands | | | 3.2% | |
United Kingdom | | | 3.2% | |
Germany | | | 2.8% | |
Denmark | | | 2.7% | |
France | | | 2.6% | |
Switzerland | | | 2.6% | |
Japan | | | 2.2% | |
Sweden | | | 2.2% | |
Canada | | | 1.5% | |
Australia | | | 0.9% | |
| | | | |
Total | | | 96.7% | |
| | | | |
SEE NOTES TO FINANCIAL STATEMENTS
52
DOMINI IMPACT BOND FUND
Performance Commentary (Unaudited)
The Fund invests primarily in investment-grade fixed-income securities, including government, corporate, mortgage-backed and asset-backed securities, and U.S. dollar-denominated bonds issued by non-U.S. entities. It is managed through a two-step process designed to capitalize on the strengths of Domini Impact Investments and Wellington Management Company. Domini sets social and environmental guidelines and objectives for each asset class, and develops an approved universe of issuers and securities, and Wellington utilizes proprietary analytical tools to manage the portfolio.
Market Overview:
U.S. fixed-income markets largely generated positive total returns over the twelve-month period ended July 31, 2020. In response to the coronavirus pandemic, the U.S. Federal Reserve (Fed) cut interest rates to near zero, committed to buying an unlimited amount of U.S. Treasury* and agency mortgage-backed securities, and increased the size and scope of its asset purchase program. Sovereign yields also declined to historic lows across several developed markets due to fear and uncertainty stemming from the pandemic. The Bloomberg Barclays U.S. Aggregate (BBUSA) Bond Index returned 10.12% during the period.
Credit spreads—the difference in yield between bonds with different credit qualities—widened as the pandemic led to a flight to safety in U.S. Treasuries. Investment-grade corporate spreads widened by 0.25% while high-yield corporate spreads widened by 1.17%, according to Bloomberg Barclays Index data.
Prior to the pandemic, monetary policy had already taken a dovish pivot in 2019 on account of tepid economic data, trade policy uncertainty, and stubbornly low inflation. In 2020, global central banks added extraordinary monetary stimulus to support global economies amid the crisis. The Fed increased the size and scope of its asset purchase program to include corporate bonds, agency commercial mortgage-backed securities, and short-term corporate debt, while also lending support to the municipal market. The European Central Bank (ECB) launched its own massive asset purchase program, which included short-term debt issued by non-financial institutions for the first time, while also easing collateral rules..
Global economic activity was strong in the latter half of 2019 but slid to a halt by the end of the first quarter of 2020 amid global economic shutdowns stemming from the coronavirus pandemic. U.S. housing activity recovered after a challenging start to the year, but consumer confidence remained strained amid rising coronavirus case counts in re-opened states. Eurozone manufacturing Purchasing Managers’ Index (PMI) fell deep into contractionary territory toward the end of March, as global economic activity ground to a halt, but
53
ended the period in expansionary territory amid a further easing of restrictions within eurozone economies. China’s GDP contracted at an annualized rate of 6.80% over the first quarter of 2020 but recovered with an annualized growth rate of 3.2% in the second quarter of 2020 to beat consensus estimates.
Portfolio Performance:
The Domini Impact Bond Fund Investor shares returned 11.09% for the twelve-month period ended July 31, 2020, outperforming its benchmark, the BBUSA Bond Index return of 10.12%.
Throughout the period, the Fund remained underweight investment-grade corporate credit in favor of high-yield credit, U.S. bank loans, and taxable municipals where the submanager saw more attractive risk and reward profiles. The Fund’s allocation to high-yield credit contributed positively to relative results, particularly in the industrials sector. Positioning within investment-grade credit was also additive to relative results, driven by an underweight to industrials and utilities and positioning within technology and consumer cyclicals.
In aggregate, the Fund’s positioning within mortgage- and asset-backed securities also contributed favorably to relative results. Within agency mortgage-backed securities (MBS), an overweight allocation and security selection within conventional pass-through securities had a positive impact on relative results over the period, while an allocation to collateralized mortgage obligations (CMOs) detracted slightly. Out-of-benchmark allocations to commercial mortgage-backed securities (CMBS) and non-agency residential mortgage-backed securities (NA RMBS) detracted from performance, as liquidity within these sectors came under pressure in late March amid the pandemic.
During the period, the Fund used derivatives to help the implementation of the submanager’s overall investment strategy, including credit default swap indices, interest rate swaps, consumer price index (CPI) swaps, and currency forwards. The Fund’s positioning in below-investment-grade credit default swaps, which are used to manage risk exposures, contributed favorably to relative performance. CPI swaps, used to position the Fund for rising inflation expectations, detracted from relative results, as inflation expectations declined over the period. Duration and yield-curve positioning detracted from relative results, as global sovereign yields declined to historic lows toward the back-end of the period.
At the end of the period, the Fund was positioned with underweights to government bonds and investment-grade corporate bonds in favor of taxable municipals and high-quality securitized sectors, including CMBS and agency MBS. The Fund also maintained an allocation to high-yield corporate credit and bank loans, as well as select exposure to emerging-market corporate debt.
* The Domini Impact Bond Fund does not invest in U.S. Treasury securities per Domini’s Impact Investment Standards.
54
PORTFOLIO COMPOSITION (% OF NET ASSETS) (Unaudited)
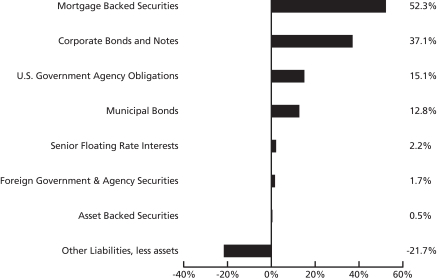
During periods of rising interest rates, the Fund can lose value. Some of the Fund’s community development investments may be unrated and may carry greater credit risks than the Fund’s other holdings. The Fund currently holds a large percentage of its portfolio in mortgage-backed securities. During periods of falling interest rates, mortgage-backed securities may prepay the principal due, which may lower the Fund’s return by causing it to reinvest at lower interest rates.
Investments in derivatives can be volatile. Potential risks include currency risk, leverage risk (the risk that small market movements may result in large changes in the value of an investment), liquidity risk, index risk, pricing risk, and counterparty risk (the risk that the counterparty may be unwilling or unable to honor its obligations).
The reduction or withdrawal of historical financial market support activities by the U.S. Government and Federal Reserve, or other governments/central banks could negatively impact financial markets generally, and increase market, liquidity and interest rate risks which could adversely affect the Fund’s returns.
The Global Industry Classification Standard (“GICS”) was developed by and is the exclusive property and a service mark of MSCI Inc. (“MSCI”) and Standard & Poor’s, a division of The McGraw-Hill Companies, Inc. (“S&P”) and is licensed for use by Domini Impact Investments. Neither MSCI, S&P nor any third party involved in making or compiling the GICS or any GICS classifications makes any express or implied warranties or representations with respect to such standard or classification nor shall any such party have any liability therefrom.
55
| | | | | | |
| |
| AVERAGE ANNUAL TOTAL RETURNS (Unaudited) |
| | |
| | | Investor shares | | Bloomberg Barclays
U.S. Aggregate
Index (BBUSA) |
| | | |
| As of 7/31/20 | | 1 Year | | 11.09% | | 10.12% |
| | | |
| | 5 Year | | 4.80% | | 4.47% |
| | | |
| | | 10 Year | | 3.30% | | 3.87% |
Comparison of $10,000 Investment in the Domini Impact Bond Fund Investor Shares (DSBFX) and BBUSA (Unaudited)
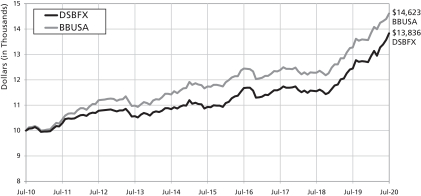
Past performance is no guarantee of future results. The Fund’s returns quoted above represent past performance after all expenses. The returns reflect any applicable expense waivers in effect during the periods shown. Without such waivers, Fund performance would be lower. Investment return, principal value, and yield will fluctuate. Your shares, when redeemed, may be worth more or less than their original cost. Call 1-800-582-6757 or visit www.domini.com for performance information current to the most recent month-end, which may be lower or higher than the performance data quoted. A 2.00% redemption fee applies on sales or exchanges of shares made less than 30 days after the settlement of purchase or acquisition through exchange, with certain exceptions. Quoted performance data does not reflect the deduction of this fee, which would reduce the performance quoted. See the prospectus for further information.
Per the prospectus dated November 29, 2019 the Fund’s annual operating expenses totaled: 1.20%(gross)/ 0.87% (net). The Fund’s adviser has contractually agreed to waive certain fees and/or reimburse certain ordinary operating expenses in order to limit Investor share expenses to 0.87% until November 30, 2020 absent an earlier modification approved by the Fund’s Board of Trustees.
The table and graph do not reflect the deduction of fees and taxes that a shareholder would pay on Fund distributions or the redemption of Fund shares. Total return is based on the Fund’s net asset values and assumes all dividends and capital gains were reinvested.
An investment in the Fund is not a bank deposit and is not insured. You may lose money. The Fund is subject to market, recent events, impact investing, style, information, interest rate, and credit risks.
TBA (To Be Announced) securities involve the risk that the security the Fund buys will lose value prior to its delivery. There also is the risk that the security will not be issued or that the other party to the transaction will not meet its obligation, which can adversely affect the Fund’s returns.
The Bloomberg Barclays U.S. Aggregate Index is an index representing securities that are U.S. domestic, taxable, and dollar denominated and covering the U.S. investment grade fixed rate bond market, with index components for government and corporate securities and asset-backed securities. You cannot invest directly in an index.
56
| | | | | | |
| |
| AVERAGE ANNUAL TOTAL RETURNS (Unaudited) |
| | |
| | | Institutional shares | | Bloomberg Barclays
U.S. Aggregate
Index (BBUSA) |
| | | |
| As of 7/31/20 | | 1 Year | | 11.49% | | 10.12% |
| | | |
| | 5 Year | | 5.10% | | 4.47% |
| | | |
| | | 10 Year* | | 3.30% | | 3.87% |
Comparison of $500,000 Investment in the Domini Impact Bond Fund Institutional Shares (DSBIX) and BBUSA (Unaudited)
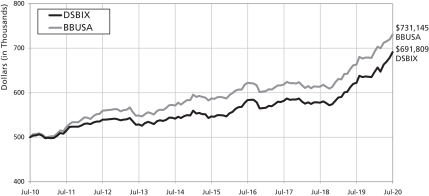
Past performance is no guarantee of future results. The Fund’s returns quoted above represent past performance after all expenses. The returns reflect any applicable expense waivers in effect during the periods shown. Without such waivers, Fund performance would be lower. Investment return, principal value, and yield will fluctuate. Your shares, when redeemed, may be worth more or less than their original cost. Call 1-800-762-6814 or visit www.domini.com for performance information current to the most recent month-end, which may be lower or higher than the performance data quoted. A 2.00% redemption fee applies on sales or exchanges of shares made less than 30 days after the settlement of purchase or acquisition through exchange, with certain exceptions. Quoted performance data does not reflect the deduction of this fee, which would reduce the performance quoted. See the prospectus for further information.
Per the prospectus dated November 29, 2019, the Fund’s annual operating expenses totaled: 0.84% (gross)/ 0.57% (net). The Fund’s adviser has contractually agreed to waive certain fees and/or reimburse certain ordinary operating expenses in order to limit Institutional share expenses to 0.57% until November 30, 2020 absent an earlier modification approved by the Fund’s Board of Trustees.
The table and graph do not reflect the deduction of fees and taxes that a shareholder would pay on Fund distributions or the redemption of Fund shares. Total return is based on the Fund’s net asset values and assumes all dividends and capital gains were reinvested.
An investment in the Fund is not a bank deposit and is not insured. You may lose money. The Fund is subject to market, recent events, impact investing, style, information, interest rate, and credit risks.
TBA (To Be Announced) securities involve the risk that the security the Fund buys will lose value prior to its delivery. There also is the risk that the security will not be issued or that the other party to the transaction will not meet its obligation, which can adversely affect the Fund’s returns.
The Bloomberg Barclays U.S. Aggregate Index is an index representing securities that are U.S. domestic, taxable, and dollar denominated and covering the U.S. investment grade fixed rate bond market, with index components for government and corporate securities and asset-backed securities. You cannot Invest directly In an Index.
* Institutional shares were not offered prior to 11/30/2011. All performance information for time periods beginning prior to 11/30/2011 is the performance of the Investor shares, which has not been adjusted to reflect the lower expenses of the Institutional shares.
57
DOMINI IMPACT BOND FUND
PORTFOLIOOF INVESTMENTS
July 31, 2020
| | | | | | | | |
| Security | | Principal
Amount* | | | Value | |
| Long Term Investments – 121.7% | | | | | | |
| Mortgage Backed Securities – 52.3% | | | | | | |
Agency Collateralized Mortgage Obligations – 3.7% | | | | | | | | |
Federal Home Loan Mortgage Corp. | | | | | | | | |
Series 3768, Class CB, 3.500%, 12/15/25 | | | 225,282 | | | $ | 236,777 | |
Series 3800, Class CB, 3.500%, 2/15/26 | | | 383,000 | | | | 403,097 | |
Series 3806, Class L, 3.500%, 2/15/26 | | | 821,355 | | | | 874,738 | |
Series 3877, Class LM, 3.500%, 6/15/26 | | | 772,462 | | | | 812,460 | |
Series 4961, Class JB, 2.500%, 12/15/42 | | | 344,366 | | | | 359,139 | |
Federal National Mortgage Association | | | | | | | | |
Series 2012-17, Class BC, 3.500%, 3/25/27 | | | 368,000 | | | | 402,056 | |
Series 2017-72, Class B, 3.000%, 9/25/47 | | | 132,127 | | | | 141,642 | |
Series 2017-72, Class CD, 3.000%, 9/25/47 | | | 138,921 | | | | 149,219 | |
Series 2018-72, Class BA, 3.500%, 7/25/54 | | | 200,672 | | | | 211,553 | |
Series 2020-1, Class AC, 3.500%, 8/25/58 | | | 498,569 | | | | 540,137 | |
Federal National Mortgage Association Connecticut Avenue Securities | | | | | | | | |
Series C01, Class 1M2, 3.722%, (1 Month USD-LIBOR + 3.550%), 7/25/29 (a) | | | 99,364 | | | | 100,951 | |
Series C07, Class 2M2, 4.522%, (1 Month USD-LIBOR + 4.350%), 5/25/29 (a) | | | 144,794 | | | | 149,104 | |
Freddie Mac Multifamily Structured Pass Through Certificates | | | | | | | | |
Series K112, Class X1, 1.536%, 5/25/30 (a) | | | 1,505,000 | | | | 180,977 | |
Series K113, Class X1, 1.490%, 6/25/30 (a) | | | 2,105,000 | | | | 243,841 | |
FREMF Mortgage Trust | | | | | | | | |
Series 2017-K64, Class B, 3.981%, 5/25/50 (a)(b) | | | 70,000 | | | | 79,545 | |
Series 2017-K65, Class B, 4.073%, 7/25/50 (a)(b) | | | 155,000 | | | | 174,292 | |
Series 2017-K66, Class B, 4.035%, 7/25/27 (a)(b) | | | 136,000 | | | | 154,566 | |
Series 2017-K67, Class B, 3.944%, 9/25/49 (a)(b) | | | 85,000 | | | | 95,114 | |
Series 2017-K68, Class B, 3.844%, 10/25/49 (a)(b) | | | 90,000 | | | | 100,428 | |
Series 2017-K69, Class C, 3.727%, 10/25/49 (a)(b) | | | 40,000 | | | | 41,889 | |
Series 2017-K71, Class B, 3.753%, 11/25/50 (a)(b) | | | 220,000 | | | | 244,809 | |
Series 2017-K71, Class C, 3.753%, 11/25/50 (a)(b) | | | 65,000 | | | | 68,215 | |
Series 2017-K725, Class B, 3.879%, 2/25/50 (a)(b) | | | 100,000 | | | | 106,901 | |
Series 2017-K726, Class B, 3.991%, 7/25/49 (a)(b) | | | 175,000 | | | | 188,276 | |
Series 2017-K729, Class B, 3.674%, 11/25/49 (a)(b) | | | 250,000 | | | | 265,754 | |
Series 2017-K729, Class C, 3.674%, 11/25/49 (a)(b) | | | 90,000 | | | | 92,064 | |
Series 2018-K154, Class B, 4.021%, 11/25/32 (a)(b) | | | 67,000 | | | | 63,061 | |
Series 2018-KW07, Class B, 4.081%, 10/25/31 (a)(b) | | | 461,000 | | | | 432,204 | |
STACR Trust, Series 2018-HRP1, Class M2, 1.822%, (1 Month USD-LIBOR + 1.650%), 4/25/43 (a)(b) | | | 52,656 | | | | 52,195 | |
| | | | | | | | |
| | | | | | | 6,965,004 | |
| | | | | | | | |
| | | | | | | | |
Commercial Mortgage-Backed Securities – 6.2% | | | | | | | | |
245 Park Avenue Trust, Series 2017-245P, Class A, 3.508%, 6/5/37 (b) | | | 1,567,000 | | | | 1,745,143 | |
BANK, Series 2017-BNK8, Class ASB, 3.314%, 11/15/50 | | | 147,000 | | | | 161,428 | |
Benchmark Mortgage Trust, Series 2020-B18, Class XA, 1.919%, 7/15/53 (a) | | | 505,000 | | | | 63,271 | |
58
DOMINI IMPACT BOND FUND
PORTFOLIOOF INVESTMENTS (continued)
July 31, 2020
| | | | | | | | |
| Security | | Principal
Amount* | | | Value | |
Commercial Mortgage-Backed Securities (Continued) | | | | | | | | |
BWAY Mortgage Trust | | | | | | | | |
Series 2013-1515, Class A1, 2.809%, 3/10/33 (b) | | | 111,409 | | | $ | 115,623 | |
Series 2013-1515, Class A2, 3.454%, 3/10/33 (b) | | | 1,000,000 | | | | 1,083,036 | |
COMM Mortgage Trust | | | | | | | | |
Series 2013-WWP, Class A2, 3.424%, 3/10/31 (b) | | | 640,000 | | | | 680,232 | |
Series 2013-WWP, Class B, 3.726%, 3/10/31 (b) | | | 644,000 | | | | 688,969 | |
Series LC19, Class A4, 3.183%, 2/10/48 | | | 291,000 | | | | 315,621 | |
Series LC6, Class A4, 2.941%, 1/10/46 | | | 304,902 | | | | 316,506 | |
CPT Mortgage Trust, Series 2019-CPT, Class A, 2.865%, 11/13/39 (b) | | | 240,000 | | | | 267,566 | |
DC Office Trust, Series MTC, Class A, 2.965%, 9/15/45 (b) | | | 370,000 | | | | 410,768 | |
GS Mortgage Securities Corp. Trust, Series 2017-500K, Class A, 0.875%, (1 Month USD-LIBOR + 0.700%), 7/15/32 (a)(b) | | | 395,000 | | | | 393,371 | |
Hudson Yards Mortgage Trust, Series 2016-10HY, Class A, 2.835%, 8/10/38 (b) | | | 1,000,000 | | | | 1,083,550 | |
JP Morgan Chase Commercial Mortgage Securities Corp., Series 2018-AON, Class A, 4.128%, 7/5/31 (b) | | | 555,000 | | | | 591,556 | |
MAD Mortgage Trust, Series 2017-330M, Class A, 3.188%, 8/15/34 (a)(b) | | | 729,000 | | | | 765,007 | |
MKT Mortgage Trust, Series 525M, Class A, 2.694%, 2/12/40 (b) | | | 600,000 | | | | 660,474 | |
Morgan Stanley Bank of America Merrill Lynch Trust | | | | | | | | |
Series 2013-C12, Class A4, 4.259%, 10/15/46 (a) | | | 300,000 | | | | 325,124 | |
Series 2014-C15, Class A4, 4.051%, 4/15/47 | | | 300,000 | | | | 328,852 | |
Series 2014-C19, Class A4, 3.526%, 12/15/47 | | | 180,167 | | | | 195,611 | |
Morgan Stanley Capital I Trust, Series 2017-CLS, Class A, 0.875%, (1 Month USD-LIBOR + 0.700%), 11/15/34 (a)(b) | | | 531,000 | | | | 528,584 | |
One Market Plaza Trust, Series 2017-1MKT, Class A, 3.614%, 2/10/32 (b) | | | 710,000 | | | | 738,771 | |
Wells Fargo Commercial Mortgage Trust, Series 2015-NXS3, Class A4, 3.617%, 9/15/57 | | | 340,000 | | | | 378,141 | |
| | | | | | | | |
| | | | | | | 11,837,204 | |
| | | | | | | | |
| | | | | | | | |
Federal Home Loan Mortgage Corporation – 2.8% | | | | | | | | |
Federal Home Loan Mortgage Corp. | | | | | | | | |
2.500%, 8/1/27 | | | 46,032 | | | | 48,450 | |
2.500%, 11/1/27 | | | 120,270 | | | | 127,852 | |
2.845%, (12 Month USD-LIBOR + 1.635%), 10/1/43 (a) | | | 124,851 | | | | 129,676 | |
3.000%, 1/1/27 | | | 163,034 | | | | 172,627 | |
3.000%, 7/1/42 | | | 60,067 | | | | 64,550 | |
3.000%, 5/1/45 | | | 401,675 | | | | 433,758 | |
3.500%, 12/1/32 | | | 206,183 | | | | 223,333 | |
3.500%, 6/1/48 | | | 1,646,061 | | | | 1,736,720 | |
4.000%, 2/1/37 | | | 55,413 | | | | 59,705 | |
4.000%, 8/1/39 | | | 47,459 | | | | 52,741 | |
59
DOMINI IMPACT BOND FUND
PORTFOLIOOF INVESTMENTS (continued)
July 31, 2020
| | | | | | | | |
| Security | | Principal
Amount* | | | Value | |
Federal Home Loan Mortgage Corporation (Continued) | | | | | | | | |
4.000%, 10/1/39 | | | 94,707 | | | $ | 104,230 | |
4.000%, 10/1/39 | | | 78,884 | | | | 86,870 | |
4.000%, 11/1/39 | | | 42,410 | | | | 46,623 | |
4.000%, 10/1/40 | | | 118,954 | | | | 132,556 | |
4.000%, 11/1/40 | | | 141,450 | | | | 155,359 | |
4.000%, 11/1/40 | | | 20,918 | | | | 23,127 | |
4.000%, 11/1/40 | | | 15,996 | | | | 17,556 | |
4.000%, 12/1/40 | | | 67,701 | | | | 74,402 | |
4.000%, 6/1/41 | | | 11,190 | | | | 11,915 | |
4.500%, 4/1/35 | | | 102,281 | | | | 111,741 | |
4.500%, 9/1/35 | | | 139,040 | | | | 152,773 | |
4.500%, 7/1/36 | | | 91,055 | | | | 100,627 | |
4.500%, 6/1/39 | | | 213,273 | | | | 237,098 | |
4.500%, 9/1/40 | | | 32,760 | | | | 36,316 | |
4.500%, 2/1/41 | | | 67,704 | | | | 75,298 | |
5.000%, 8/1/33 | | | 16,711 | | | | 19,164 | |
5.000%, 10/1/33 | | | 8,847 | | | | 9,823 | |
5.000%, 4/1/35 | | | 21,653 | | | | 24,870 | |
5.000%, 7/1/35 | | | 140,130 | | | | 160,877 | |
5.000%, 7/1/35 | | | 24,467 | | | | 28,084 | |
5.000%, 1/1/37 | | | 87,965 | | | | 100,941 | |
5.000%, 7/1/40 | | | 71,673 | | | | 82,405 | |
5.000%, 4/1/41 | | | 60,380 | | | | 69,411 | |
5.500%, 12/1/36 | | | 91,925 | | | | 106,343 | |
5.500%, 8/1/40 | | | 126,568 | | | | 145,646 | |
6.000%, 8/1/36 | | | 14,293 | | | | 16,875 | |
6.000%, 7/1/39 | | | 87,048 | | | | 102,693 | |
| | | | | | | | |
| | | | | | | 5,283,035 | |
| | | | | | | | |
| | | | | | | | |
Federal National Mortgage Association – 30.3% | | | | | | | | |
Federal National Mortgage Association | | | | | | | | |
2.000%, 10/1/27 | | | 160,793 | | | | 169,146 | |
2.000%, 1/1/28 | | | 132,700 | | | | 138,753 | |
2.500%, 6/1/24 | | | 214,191 | | | | 224,974 | |
2.500%, 11/1/31 | | | 115,005 | | | | 120,811 | |
2.500%, 12/1/31 | | | 27,149 | | | | 28,569 | |
2.500%, 12/1/43 | | | 240,476 | | | | 255,018 | |
2.500%, 4/1/45 | | | 196,756 | | | | 209,959 | |
2.661%, (12 Month USD-LIBOR + 1.580%), 5/1/44 (a) | | | 47,053 | | | | 48,710 | |
3.000%, 8/1/46 | | | 72,552 | | | | 77,046 | |
3.000%, 10/1/46 | | | 1,242,452 | | | | 1,319,373 | |
3.000%, 11/1/46 | | | 1,564,288 | | | | 1,662,763 | |
3.000%, 12/1/46 | | | 552,577 | | | | 587,111 | |
3.000%, 2/25/49 | | | 158,696 | | | | 168,366 | |
3.500%, 12/1/31 | | | 10,697 | | | | 11,562 | |
3.500%, 1/1/32 | | | 189,741 | | | | 204,980 | |
3.500%, 1/1/32 | | | 105,245 | | | | 113,708 | |
3.500%, 10/1/32 | | | 146,803 | | | | 158,974 | |
60
DOMINI IMPACT BOND FUND
PORTFOLIOOF INVESTMENTS (continued)
July 31, 2020
| | | | | | | | |
| Security | | Principal
Amount* | | | Value | |
Federal National Mortgage Association (Continued) | | | | | | | | |
3.500%, 6/1/46 | | | 1,130,405 | | | $ | 1,206,698 | |
3.500%, 1/1/48 | | | 994,471 | | | | 1,052,791 | |
4.000%, 11/1/30 | | | 19,813 | | | | 21,369 | |
4.000%, 10/1/33 | | | 111,543 | | | | 120,393 | |
4.000%, 12/1/36 | | | 34,303 | | | | 36,934 | |
4.000%, 8/1/39 | | | 47,671 | | | | 52,363 | |
4.000%, 10/1/39 | | | 30,650 | | | | 33,682 | |
4.000%, 12/1/39 | | | 43,535 | | | | 47,831 | |
4.000%, 1/1/40 | | | 387,753 | | | | 425,948 | |
4.000%, 3/1/40 | | | 48,676 | | | | 53,524 | |
4.000%, 8/1/40 | | | 99,752 | | | | 109,674 | |
4.000%, 8/1/40 | | | 17,717 | | | | 19,481 | |
4.000%, 10/1/40 | | | 161,357 | | | | 179,883 | |
4.000%, 10/1/40 | | | 32,108 | | | | 35,307 | |
4.000%, 11/1/40 | | | 39,761 | | | | 43,728 | |
4.000%, 11/1/40 | | | 21,921 | | | | 23,782 | |
4.000%, 12/1/40 | | | 63,955 | | | | 72,374 | |
4.000%, 2/1/41 | | | 83,267 | | | | 91,565 | |
4.500%, 8/1/35 | | | 30,896 | | | | 33,763 | |
4.500%, 8/1/36 | | | 35,039 | | | | 38,800 | |
4.500%, 8/1/38 | | | 79,704 | | | | 88,604 | |
4.500%, 3/1/39 | | | 104,009 | | | | 115,749 | |
4.500%, 9/1/39 | | | 43,927 | | | | 48,656 | |
4.500%, 2/1/40 | | | 46,958 | | | | 52,421 | |
4.500%, 8/1/40 | | | 105,768 | | | | 119,014 | |
4.500%, 1/1/41 | | | 37,522 | | | | 41,743 | |
4.500%, 9/1/41 | | | 69,110 | | | | 76,972 | |
5.000%, 10/1/39 | | | 4,436 | | | | 5,090 | |
5.500%, 8/1/37 | | | 59,945 | | | | 70,012 | |
6.000%, 12/1/35 | | | 33,854 | | | | 39,714 | |
6.000%, 3/1/36 | | | 194,335 | | | | 229,792 | |
6.000%, 6/1/36 | | | 68,313 | | | | 80,820 | |
6.000%, 8/1/37 | | | 17,809 | | | | 21,041 | |
6.000%, 3/1/38 | | | 32,142 | | | | 37,892 | |
TBA 15 Yr, 2.000%, 8/17/35 (c) | | | 900,000 | | | | 936,487 | |
TBA 15 Yr, 2.000%, 9/17/35 (c) | | | 800,000 | | | | 831,330 | |
TBA 15 Yr, 2.500%, 8/17/35 (c) | | | 1,300,000 | | | | 1,364,636 | |
TBA 15 Yr, 2.500%, 9/17/35 (c) | | | 1,300,000 | | | | 1,362,846 | |
TBA 15 Yr, 3.000%, 8/17/35 (c) | | | 1,700,000 | | | | 1,784,269 | |
TBA 30 Yr, 2.000%, 9/14/50 (c) | | | 4,565,000 | | | | 4,722,409 | |
TBA 30 Yr, 2.000%, 10/14/50 (c) | | | 4,565,000 | | | | 4,712,970 | |
TBA 30 Yr, 2.500%, 8/13/50 (c) | | | 8,900,000 | | | | 9,351,258 | |
TBA 30 Yr, 3.000%, 9/14/50 (c) | | | 8,800,000 | | | | 9,289,204 | |
TBA 30 Yr, 3.500%, 8/13/50 (c) | | | 3,200,000 | | | | 3,374,750 | |
TBA 30 Yr, 3.500%, 9/14/50 (c) | | | 3,200,000 | | | | 3,376,230 | |
TBA 30 Yr, 4.000%, 8/13/50 (c) | | | 2,900,000 | | | | 3,081,023 | |
TBA 30 Yr, 4.000%, 9/14/50 (c) | | | 2,900,000 | | | | 3,083,437 | |
| | | | | | | | |
| | | | | | | 57,498,082 | |
| | | | | | | | |
| | | | | | | | |
61
DOMINI IMPACT BOND FUND
PORTFOLIOOF INVESTMENTS (continued)
July 31, 2020
| | | | | | | | |
| Security | | Principal
Amount* | | | Value | |
Government National Mortgage Association – 9.3% | | | | | | | | |
Government National Mortgage Association | | | | | | | | |
TBA 30 Yr, 2.500%, 8/20/50 (c) | | | 1,435,000 | | | $ | 1,516,279 | |
TBA 30 Yr, 3.000%, 8/20/50 (c) | | | 7,600,000 | | | | 8,037,297 | |
TBA 30 Yr, 3.500%, 8/20/50 (c) | | | 2,700,000 | | | | 2,840,168 | |
TBA 30 Yr, 3.500%, 9/21/50 (c) | | | 2,600,000 | | | | 2,735,586 | |
TBA 30 Yr, 4.000%, 9/21/50 (c) | | | 1,600,000 | | | | 1,698,625 | |
TBA 30 Yr, 4.500%, 8/20/50 (c) | | | 900,000 | | | | 961,278 | |
| | | | | | | | |
| | | | | | | 17,789,233 | |
| | | | | | | | |
Total Mortgage Backed Securities
(Cost $97,412,112) | | | | | | | 99,372,558 | |
| | | | | | | | |
| | | | | | | | |
| Corporate Bonds and Notes – 37.1% | | | | | | |
Communications – 2.8% | | | | | | | | |
Alibaba Group Holding, Ltd., 2.800%, 6/6/23 | | | 200,000 | | | | 212,410 | |
Amazon.com, Inc. | | | | | | | | |
3.875%, 8/22/37 | | | 200,000 | | | | 260,072 | |
4.800%, 12/5/34 | | | 325,000 | | | | 459,581 | |
AT&T, Inc. | | | | | | | | |
2.750%, 6/1/31 | | | 1,000,000 | | | | 1,073,091 | |
3.950%, 1/15/25 | | | 445,000 | | | | 501,840 | |
4.750%, 5/15/46 | | | 485,000 | | | | 605,225 | |
CBS Corp., 2.900%, 1/15/27 | | | 400,000 | | | | 431,616 | |
Charter Communications Operating LLC/Charter Communications Operating Capital senior secured note | | | | | | | | |
5.750%, 4/1/48 | | | 225,000 | | | | 296,714 | |
6.484%, 10/23/45 | | | 300,000 | | | | 420,274 | |
Cox Communications, Inc. | | | | | | | | |
3.150%, 8/15/24 (b) | | | 165,000 | | | | 179,302 | |
3.850%, 2/1/25 (b) | | | 10,000 | | | | 11,152 | |
eBay, Inc., 3.600%, 6/5/27 | | | 195,000 | | | | 222,363 | |
Gray Television, Inc., 5.875%, 7/15/26 (b) | | | 200,000 | | | | 207,324 | |
Verizon Communications, Inc., 3.376%, 2/15/25 | | | 57,000 | | | | 64,043 | |
Vodafone Group PLC | | | | | | | | |
4.375%, 2/19/43 | | | 70,000 | | | | 85,645 | |
6.150%, 2/27/37 | | | 185,000 | | | | 273,830 | |
| | | | | | | | |
| | | | | | | 5,304,482 | |
| | | | | | | | |
| | | | | | | | |
Consumer, Cyclical – 3.2% | | | | | | | | |
Aptiv Corp., 4.150%, 3/15/24 | | | 401,000 | | | | 442,541 | |
Core & Main L.P., 6.125%, 8/15/25 (b) | | | 45,000 | | | | 46,466 | |
Home Depot, Inc. (The), 5.950%, 4/1/41 | | | 420,000 | | | | 673,640 | |
Kohl’s Corp., 9.500%, 5/15/25 | | | 405,000 | | | | 479,466 | |
Lennar Corp., 4.125%, 1/15/22 | | | 245,000 | | | | 251,364 | |
Marriott International, Inc., 2.875%, 3/1/21 | | | 1,025,000 | | | | 1,034,386 | |
O’Reilly Automotive, Inc., 3.800%, 9/1/22 | | | 155,000 | | | | 162,961 | |
Starbucks Corp. | | | | | | | | |
2.550%, 11/15/30 | | | 990,000 | | | | 1,064,076 | |
62
DOMINI IMPACT BOND FUND
PORTFOLIOOF INVESTMENTS (continued)
July 31, 2020
| | | | | | | | |
| Security | | Principal
Amount* | | | Value | |
Consumer, Cyclical (Continued) | | | | | | | | |
3.750%, 12/1/47 | | | 275,000 | | | $ | 323,061 | |
4.450%, 8/15/49 | | | 750,000 | | | | 983,963 | |
Toll Brothers Finance Corp., 4.350%, 2/15/28 | | | 600,000 | | | | 651,636 | |
| | | | | | | | |
| | | | | | | 6,113,560 | |
| | | | | | | | |
| | | | | | | | |
Consumer, Non-cyclical – 10.5% | | | | | | | | |
Advocate Health & Hospitals Corp., 2.211%, 6/15/30 | | | 325,000 | | | | 341,668 | |
Allina Health System, 4.805%, 11/15/45 | | | 291,000 | | | | 403,074 | |
Amgen, Inc. | | | | | | | | |
2.300%, 2/25/31 | | | 1,000,000 | | | | 1,069,122 | |
3.200%, 11/2/27 | | | 525,000 | | | | 600,336 | |
Banner Health, 2.338%, 1/1/30 | | | 1,000,000 | | | | 1,041,928 | |
Biogen, Inc., 5.200%, 9/15/45 | | | 400,000 | | | | 572,026 | |
Boston Medical Center Corp., 4.519%, 7/1/26 | | | 705,000 | | | | 780,251 | |
Bristol-Myers Squibb Co., 3.875%, 8/15/25 | | | 325,000 | | | | 374,947 | |
Children’s Hospital Corp. (The), 4.115%, 1/1/47 | | | 230,000 | | | | 304,808 | |
City of Hope, 5.623%, 11/15/43 | | | 250,000 | | | | 367,476 | |
CommonSpirit Health, 3.347%, 10/1/29 | | | 600,000 | | | | 633,920 | |
Conservation Fund A Nonprofit Corp. (The), 3.474%, 12/15/29 | | | 800,000 | | | | 875,268 | |
Dignity Health | | | | | | | | |
4.500%, 11/1/42 | | | 408,000 | | | | 442,359 | |
5.267%, 11/1/64 | | | 250,000 | | | | 314,657 | |
ERAC USA Finance LLC, 3.850%, 11/15/24 (b) | | | 500,000 | | | | 547,052 | |
Fred Hutchinson Cancer, 3.949%, 1/1/50 | | | 900,000 | | | | 1,022,897 | |
Howard University | | | | | | | | |
2.657%, 10/1/26 | | | 100,000 | | | | 103,483 | |
3.476%, 10/1/41 | | | 1,850,000 | | | | 1,943,077 | |
Iowa Health System, 3.665%, 2/15/50 | | | 845,000 | | | | 987,412 | |
JM Smucker Co. (The), 4.250%, 3/15/35 | | | 380,000 | | | | 466,488 | |
Kaiser Foundation Hospitals, 3.150%, 5/1/27 | | | 185,000 | | | | 209,192 | |
McCormick & Co, Inc., 2.500%, 4/15/30 | | | 155,000 | | | | 169,277 | |
Memorial Sloan-Kettering Cancer Center | | | | | | | | |
4.125%, 7/1/52 | | | 120,000 | | | | 165,275 | |
Series 2015, 4.200%, 7/1/55 | | | 10,000 | | | | 13,981 | |
New York and Presbyterian Hospital (The), 4.024%, 8/1/45 | | | 215,000 | | | | 280,988 | |
Northeastern University, 5.285%, 3/1/32 | | | 100,000 | | | | 121,866 | |
Ochsner Clinic Foundation, 5.897%, 5/15/45 | | | 400,000 | | | | 537,061 | |
Orlando Health Obligated Group, 4.416%, 10/1/44 | | | 395,000 | | | | 484,426 | |
President & Fellows of Harvard College, 2.517%, 10/15/50 | | | 1,025,000 | | | | 1,142,869 | |
Rush Obligated Group, 3.922%, 11/15/29 | | | 375,000 | | | | 434,121 | |
Stanford Health Care, 3.310%, 8/15/30 | | | 595,000 | | | | 676,271 | |
Thermo Fisher Scientific, Inc. | | | | | | | | |
2.375%, 4/15/32 | | | 305,000 | | | | 425,392 | |
4.133%, 3/25/25 | | | 375,000 | | | | 432,545 | |
4.150%, 2/1/24 | | | 265,000 | | | | 295,681 | |
Trinity Health Corp., 3.434%, 12/1/48 | | | 800,000 | | | | 890,570 | |
63
DOMINI IMPACT BOND FUND
PORTFOLIOOF INVESTMENTS (continued)
July 31, 2020
| | | | | | | | |
| Security | | Principal
Amount* | | | Value | |
Consumer, Non-cyclical (Continued) | | | | | | | | |
Yale University, 1.482%, 4/15/30 | | | 460,000 | | | $ | 473,807 | |
| | | | | | | | |
| | | | | | | 19,945,571 | |
| | | | | | | | |
| | | | | | | | |
Energy – 0.6% | | | | | | | | |
Azure Power Solar Energy Pvt, Ltd., 5.650%, 12/24/24 (b) | | | 500,000 | | | | 512,188 | |
Greenko Dutch BV, 5.250%, 7/24/24 (b) | | | 545,000 | | | | 557,345 | |
| | | | | | | | |
| | | | | | | 1,069,533 | |
| | | | | | | | |
| | | | | | | | |
Financial – 12.9% | | | | | | | | |
AerCap Ireland Capital DAC/AerCap Global Aviation Trust, 3.500%, 5/26/22 | | | 775,000 | | | | 771,103 | |
AIA Group, Ltd., 4.500%, 3/16/46 (b) | | | 325,000 | | | | 410,885 | |
Air Lease Corp., 3.625%, 12/1/27 | | | 500,000 | | | | 495,743 | |
American International Group, Inc., 3.900%, 4/1/26 | | | 380,000 | | | | 438,003 | |
American Tower Corp. | | | | | | | | |
3.375%, 5/15/24 | | | 235,000 | | | | 257,088 | |
5.000%, 2/15/24 | | | 362,000 | | | | 415,849 | |
Aon PLC, 4.750%, 5/15/45 | | | 500,000 | | | | 691,196 | |
AXA SA, 8.600%, 12/15/30 | | | 400,000 | | | | 596,453 | |
Bank of America Corp. | | | | | | | | |
Series MTN, 2.456%, (3 Month USD-LIBOR + 0.87%), 10/22/25 (a) | | | 545,000 | | | | 578,700 | |
Series MTN, 3.124%, (3 Month USD-LIBOR + 1.16%), 1/20/23 (a) | | | 725,000 | | | | 750,885 | |
BlackRock, Inc., 1.900%, 1/28/31 | | | 740,000 | | | | 786,981 | |
BlueHub Loan Fund, Inc., 2.890%, 1/1/27 | | | 600,000 | | | | 608,051 | |
BNP Paribas SA, 3.800%, 1/10/24 (b) | | | 245,000 | | | | 268,839 | |
Boston Properties L.P., 3.650%, 2/1/26 | | | 430,000 | | | | 485,091 | |
BPCE SA | | | | | | | | |
3.000%, 5/22/22 (b) | | | 250,000 | | | | 259,369 | |
4.875%, 4/1/26 (b) | | | 500,000 | | | | 575,687 | |
Brandywine Operating Partnership L.P., 4.550%, 10/1/29 | | | 500,000 | | | | 540,319 | |
Brighthouse Financial, Inc., 5.625%, 5/15/30 | | | 890,000 | | | | 1,026,452 | |
Citigroup, Inc. | | | | | | | | |
1.678%, (SOFR + 1.667), 5/15/24 (a) | | | 1,000,000 | | | | 1,029,549 | |
3.352%, (3 Month USD-LIBOR + 0.8966%), 4/24/25 (a) | | | 475,000 | | | | 517,519 | |
Cooperatieve Rabobank UA | | | | | | | | |
3.875%, 9/26/23 (b) | | | 250,000 | | | | 275,343 | |
3.950%, 11/9/22 | | | 375,000 | | | | 399,191 | |
Credit Agricole SA, 4.125%, 1/10/27 (b) | | | 510,000 | | | | 588,768 | |
Crown Castle International Corp., 3.700%, 6/15/26 | | | 300,000 | | | | 343,026 | |
Discover Financial Services, 3.750%, 3/4/25 | | | 325,000 | | | | 354,651 | |
Duke Realty L.P., 3.625%, 4/15/23 | | | 200,000 | | | | 213,415 | |
Fifth Third Bancorp, 8.250%, 3/1/38 | | | 425,000 | | | | 718,749 | |
HAT Holdings I LLC/HAT Holdings II LLC,
6.000%, 4/15/25 (b) | | | 450,000 | | | | 484,875 | |
64
DOMINI IMPACT BOND FUND
PORTFOLIOOF INVESTMENTS (continued)
July 31, 2020
| | | | | | | | |
| Security | | Principal
Amount* | | | Value | |
Financial (Continued) | | | | | | | | |
Huntington Bancshares, Inc., 3.150%, 3/14/21 | | | 425,000 | | | $ | 431,358 | |
ING Groep NV, 4.625%, 1/6/26 (b) | | | 750,000 | | | | 889,192 | |
Kimco Realty Corp., 3.400%, 11/1/22 | | | 160,000 | | | | 168,387 | |
Marsh & McLennan Cos., Inc., 3.300%, 3/14/23 | | | 100,000 | | | | 106,429 | |
Massachusetts Mutual Life Insurance Co., 3.375%, 4/15/50 (b) | | | 550,000 | | | | 611,546 | |
Morgan Stanley, 3.950%, 4/23/27 | | | 210,000 | | | | 240,301 | |
Nationwide Mutual Insurance Co., 4.350%, 4/30/50 (b) | | | 550,000 | | | | 625,255 | |
New York Life Insurance Co., 3.750%, 5/15/50 (b) | | | 160,000 | | | | 195,093 | |
Nuveen Finance LLC, 4.125%, 11/1/24 (b) | | | 160,000 | | | | 181,958 | |
Prologis L.P., 3.250%, 10/1/26 | | | 165,000 | | | | 186,991 | |
Prudential PLC, 3.125%, 4/14/30 | | | 155,000 | | | | 172,540 | |
Regency Centers L.P., 3.750%, 6/15/24 | | | 300,000 | | | | 316,710 | |
Reinsurance Group of America, Inc. | | | | | | | | |
3.950%, 9/15/26 | | | 250,000 | | | | 279,971 | |
Series MTN, 4.700%, 9/15/23 | | | 164,000 | | | | 181,333 | |
SBA Tower Trust, 3.168%, 4/9/47 (b) | | | 290,000 | | | | 295,045 | |
Scentre Group Trust 1/Scentre Group Trust 2, 4.375%, 5/28/30 (b) | | | 615,000 | | | | 694,633 | |
Self-Help Credit Union, 2.200%, 6/25/21 | | | 100,000 | | | | 101,907 | |
Self-Help Federal Credit Union, 2.500%, 6/27/22 | | | 400,000 | | | | 417,965 | |
Standard Chartered PLC, 5.700%, 3/26/44 (b) | | | 250,000 | | | | 320,313 | |
Truist Financial Corp., 3.875%, 3/19/29 | | | 575,000 | | | | 678,878 | |
U.S. Bancorp, 3.600%, 9/11/24 | | | 493,000 | | | | 551,329 | |
Unum Group, 4.500%, 3/15/25 | | | 415,000 | | | | 458,596 | |
USAA Capital Corp., 2.125%, 5/1/30 (b) | | | 885,000 | | | | 951,131 | |
Ventas Realty L.P., 3.500%, 2/1/25 | | | 500,000 | | | | 533,345 | |
| | | | | | | | |
| | | | | | | 24,471,986 | |
| | | | | | | | |
| | | | | | | | |
Industrial – 1.7% | | | | | | | | |
Ardagh Packaging Finance PLC/Ardagh Holdings USA, Inc., 5.250%, 8/15/27 (b) | | | 360,000 | | | | 377,197 | |
CNH Industrial Capital LLC, 4.875%, 4/1/21 | | | 750,000 | | | | 769,514 | |
Illinois Tool Works, Inc., 4.875%, 9/15/41 | | | 175,000 | | | | 252,840 | |
Klabin Austria GmbH, 5.750%, 4/3/29 (b) | | | 480,000 | | | | 521,909 | |
WRKCo, Inc., 3.000%, 9/15/24 | | | 375,000 | | | | 402,920 | |
Xylem, Inc., 2.250%, 1/30/31 | | | 900,000 | | | | 954,986 | |
| | | | | | | | |
| | | | | | | 3,279,366 | |
| | | | | | | | |
| | | | | | | | |
Technology – 2.6% | | | | | | | | |
Apple, Inc., 2.650%, 5/11/50 | | | 300,000 | | | | 332,781 | |
Broadcom, Inc., 4.150%, 11/15/30 (b) | | | 1,010,000 | | | | 1,136,803 | |
Change Healthcare Holdings LLC/Change Healthcare Finance, Inc., 5.750%, 3/1/25 (b) | | | 395,000 | | | | 404,381 | |
Hewlett Packard Enterprise Co., 4.650%, 10/1/24 | | | 1,200,000 | | | | 1,350,842 | |
HP, Inc., 3.000%, 6/17/27 | | | 1,250,000 | | | | 1,348,296 | |
Micron Technology, Inc., 4.640%, 2/6/24 | | | 260,000 | | | | 289,049 | |
65
DOMINI IMPACT BOND FUND
PORTFOLIOOF INVESTMENTS (continued)
July 31, 2020
| | | | | | | | |
| Security | | Principal
Amount* | | | Value | |
Technology (Continued) | | | | | | | | |
Microsoft Corp., 3.700%, 8/8/46 | | | 5,000 | | | $ | 6,523 | |
| | | | | | | | |
| | | | | | | 4,868,675 | |
| | | | | | | | |
| | | | | | | | |
Utilities – 2.8% | | | | | | | | |
Aegea Finance S.a.r.l., 5.750%, 10/10/24 (b) | | | 370,000 | | | | 384,191 | |
Avangrid, Inc., 3.200%, 4/15/25 | | | 615,000 | | | | 681,777 | |
Clearway Energy Operating LLC,
4.750%, 3/15/28 (b) | | | 800,000 | | | | 855,752 | |
Consolidated Edison Co of New York, Inc. | | | | | | | | |
3.950%, 4/1/50 | | | 915,000 | | | | 1,183,295 | |
Series A, 4.125%, 5/15/49 | | | 155,000 | | | | 204,565 | |
NSTAR Electric Co., 3.950%, 4/1/30 | | | 830,000 | | | | 1,029,887 | |
Pattern Energy Operations L.P./Pattern Energy Operations, Inc., 4.500%, 8/15/28 (b) | | | 475,000 | | | | 504,688 | |
Public Service Co. of Colorado, 4.100%, 6/15/48 | | | 420,000 | | | | 568,063 | |
| | | | | | | | |
| | | | | | | 5,412,218 | |
| | | | | | | | |
Total Corporate Bonds and Notes
(Cost $62,709,746) | | | | | | | 70,465,391 | |
| | | | | | | | |
| | | | | | | | |
| U.S. Government Agency Obligations – 15.1% | | | | | | |
Federal Farm Credit Banks Funding Corp. | | | | | | | | |
2.625%, 10/15/49 | | | 1,140,000 | | | | 1,332,188 | |
2.780%, 11/2/37 | | | 1,800,000 | | | | 2,117,566 | |
3.430%, 4/6/45 | | | 1,000,000 | | | | 1,310,543 | |
3.660%, 3/7/44 | | | 974,000 | | | | 1,310,669 | |
Federal Home Loan Bank Discount Notes , 0.000%, 8/26/20 | | | 13,000,000 | | | | 12,999,502 | |
Federal Home Loan Banks , 2.375%, 3/14/25 | | | 2,710,000 | | | | 2,953,699 | |
Federal Home Loan Mortgage Corp. , 1.500%, 2/12/25 | | | 5,600,000 | | | | 5,885,273 | |
Federal National Mortgage Association , 5.625%, 7/15/37 | | | 391,000 | | | | 646,660 | |
| | | | | | | | |
Total U.S. Government Agencies
(Cost $27,102,588) | | | | | | | 28,556,100 | |
| | | | | | | | |
| | | | | | | | |
| Municipal Bonds – 12.8% | | | | | | |
American Municipal Power-Ohio, Inc., (Meldahl Hydroelectric Project), 6.270%, 2/15/50 | | | 490,000 | | | | 720,275 | |
Bay Area Toll Authority, CA, Toll Bridge Revenue | | | | | | | | |
6.918%, 4/1/40 | | | 125,000 | | | | 201,008 | |
7.043%, 4/1/50 | | | 325,000 | | | | 608,010 | |
California, 7.625%, 3/1/40 | | | 525,000 | | | | 947,331 | |
California Health Facilities Financing Authority, 2.984%, 6/1/33 | | | 760,000 | | | | 810,844 | |
Commonwealth Financing Authority, 2.758%, 6/1/30 | | | 850,000 | | | | 878,585 | |
Cook County Community High School District No. 228, IL, 5.019%, 12/1/41 (Insurer AGM) | | | 435,000 | | | | 577,702 | |
County of Riverside, CA | | | | | | | | |
2.963%, 2/15/27 | | | 670,000 | | | | 717,871 | |
3.070%, 2/15/28 | | | 670,000 | | | | 724,665 | |
66
DOMINI IMPACT BOND FUND
PORTFOLIOOF INVESTMENTS (continued)
July 31, 2020
| | | | | | | | |
| Security | | Principal
Amount* | | | Value | |
| Municipal Bonds (Continued) | | | | | | |
District of Columbia, (Ingleside at Rock Creek) | | | | | | | | |
3.432%, 4/1/42 | | | 430,000 | | | $ | 449,139 | |
4.125%, 7/1/27 | | | 500,000 | | | | 483,760 | |
Florida Development Finance Corp., 4.009%, 4/1/40 | | | 925,000 | | | | 937,154 | |
Illinois | | | | | | | | |
3.860%, 4/1/21 | | | 215,000 | | | | 214,776 | |
5.100%, 6/1/33 | | | 335,000 | | | | 351,753 | |
Indiana Finance Authority Revenue, 3.624%, 7/1/36 | | | 235,000 | | | | 269,564 | |
Inland Valley Development Agency, 5.500%, 3/1/33 (Insurer AGM) | | | 70,000 | | | | 78,448 | |
Lancaster County Hospital Authority, PA, (Brethren Village) | | | | | | | | |
5.000%, 7/1/24 | | | 165,000 | | | | 173,102 | |
5.000%, 7/1/25 | | | 135,000 | | | | 142,807 | |
Los Angeles Department of Airports, CA, (Los Angeles International Airport), 3.887%, 5/15/38. | | | 140,000 | | | | 156,083 | |
Maryland Health and Higher Educational Facilities Authority, (Meritus Medical Center) | | | | | | | | |
3.968%, 7/1/27 | | | 205,000 | | | | 232,630 | |
4.168%, 7/1/29 | | | 40,000 | | | | 46,714 | |
Massachusetts Development Finance Agency, (NewBridge on the Charles, Inc.), 4.000%, 10/1/27 | | | 100,000 | | | | 106,396 | |
Massachusetts Health and Educational Facilities Authority, (Northeastern University), 6.432%, 10/1/35 | | | 420,000 | | | | 565,274 | |
Metropolitan Transportation Authority | | | | | | | | |
5.000%, 11/15/50 | | | 240,000 | | | | 275,510 | |
5.175%, 11/15/49 | | | 855,000 | | | | 1,005,138 | |
Michigan Finance Authority, (City of Detroit), 2.741%, 4/1/21 | | | 320,000 | | | | 323,421 | |
New Jersey Educational Facilities Authority, 3.958%, 7/1/48 (Insurer AGM) | | | 1,000,000 | | | | 1,063,360 | |
New Jersey Turnpike Authority | | | | | | | | |
7.102%, 1/1/41 | | | 225,000 | | | | 387,419 | |
7.414%, 1/1/40 | | | 200,000 | | | | 353,646 | |
New York Transportation Development Corp., 4.248%, 9/1/35 | | | 595,000 | | | | 653,566 | |
New York Transportation Development Corp., (LaGuardia Airport Terminal B Redevelopment), 3.473%, 7/1/28 | | | 500,000 | | | | 512,155 | |
Oklahoma Development Finance Authority, (OU Medicine) | | | | | | | | |
4.650%, 8/15/30 (Insurer AGM) | | | 130,000 | | | | 152,257 | |
5.450%, 8/15/28 | | | 770,000 | | | | 907,969 | |
Oklahoma State University, 3.627%, 9/1/40 | | | 880,000 | | | | 973,729 | |
Oregon Health and Science University, 5.000%, 7/1/45 | | | 350,000 | | | | 456,610 | |
Pennsylvania Industrial Development Authority,
3.556%, 7/1/24 (b) | | | 505,000 | | | | 535,744 | |
Pennsylvania State University, 2.345%, 9/1/31 | | | 760,000 | | | | 812,706 | |
Philadelphia, PA, Water and Wastewater Revenue | | | | | | | | |
2.034%, 11/1/31 (c) | | | 220,000 | | | | 220,799 | |
4.189%, 10/1/37 | | | 665,000 | | | | 747,945 | |
67
DOMINI IMPACT BOND FUND
PORTFOLIOOF INVESTMENTS (continued)
July 31, 2020
| | | | | | | | |
| Security | | Principal
Amount* | | | Value | |
| Municipal Bonds (Continued) | | | | | | |
Regents of the University of California Medical Center Pooled Revenue, 3.706%, 5/15/20 | | | 900,000 | | | $ | 1,029,609 | |
Sacramento, CA, 5.730%, 8/15/23 (Insurer NATL) (a) | | | 340,000 | | | | 379,195 | |
San Bernardino County, CA, Pension Obligation Revenue, 6.020%, 8/1/23 (Insurer AGM) | | | 245,000 | | | | 268,013 | |
Shelby County, Health, Educational and Housing Facilities Board, (Trezevant Manor Project) | | | | | | | | |
4.000%, 9/1/21 | | | 250,000 | | | | 244,028 | |
4.000%, 9/1/22 | | | 250,000 | | | | 238,548 | |
Sustainable Energy Utility, Inc., 2.344%, 9/15/29 | | | 900,000 | | | | 924,003 | |
Washington Housing Finance Commission, (Presbyterian Retirement Communities), 4.000%, 1/1/24 | | | 400,000 | | | | 405,672 | |
Washington Housing Finance Commission, (Transforming Age), 3.000%, 1/1/25 | | | 985,000 | | | | 973,495 | |
| | | | | | | | |
Total Municipal Bonds
(Cost $22,196,062) | | | | | | | 24,238,428 | |
| | | | | | | | |
| | | | | | | | |
| Senior Floating Rate Interests – 2.2% | | | | | | |
Consumer Discretionary – 0.7% | | | | | | | | |
American Builders & Contractors Supply Co., Inc. 2019 Term Loan, 2.161%, (1 mo. USD LIBOR + 2.000%), 1/15/27 (a) | | | 496,250 | | | | 483,301 | |
Charter Communications Operating, LLC 2019 Term Loan B2, 1.920%, (1 mo. USD LIBOR + 1.750%), 2/1/27 (a) | | | 288,151 | | | | 281,693 | |
Harbor Freight Tools USA, Inc. 2018 Term Loan B, 3.250%, (1 mo. USD LIBOR + 2.500%), 8/18/23 (a) | | | 233,894 | | | | 229,550 | |
Mission Broadcasting, Inc. 2018 Term Loan B3, 2.421%, (1 mo. USD LIBOR + 2.250%), 1/17/24 (a) | | | 26,967 | | | | 26,248 | |
Nexstar Broadcasting, Inc. 2018 Term Loan B3, 2.416%, (1 mo. USD LIBOR + 2.250%), 1/17/24 (a) | | | 105,090 | | | | 102,287 | |
USI, Inc. 2017 Repriced Term Loan, 3.308%, (3 mo. USD LIBOR + 3.000%), 5/16/24 (a) | | | 170,187 | | | | 164,869 | |
Wyndham Hotels & Resorts, Inc. Term Loan B, 1.911%, (1 mo. USD LIBOR + 1.750%), 5/30/25 (a) | | | 127,725 | | | | 122,388 | |
| | | | | | | | |
| | | | | | | 1,410,336 | |
| | | | | | | | |
Consumer Staples – 0.1% | | | | | | | | |
Coty, Inc. 2018 USD Term Loan B, 2.416%, (1 mo. USD LIBOR + 2.250%), 4/7/25 (a) | | | 203,230 | | | | 176,200 | |
| | | | | | | | |
| | | | | | | 176,200 | |
| | | | | | | | |
Financials – 0.1% | | | | | | | | |
Iron Mountain, Inc. 2018 Term Loan B, 1.911%, (1 mo. USD LIBOR + 1.750%), 1/2/26 (a) | | | 141,737 | | | | 136,777 | |
| | | | | | | | |
| | | | | | | 136,777 | |
| | | | | | | | |
Health Care – 0.1% | | | | | | | | |
Nets Holding A/S EUR Term Loan B1E, 3.250%, (3 mo. EUR EURIBOR + 3.250%), 2/6/25 (a) | | | 176,389 | EUR | | | 201,931 | |
| | | | | | | | |
| | | | | | | 201,931 | |
| | | | | | | | |
68
DOMINI IMPACT BOND FUND
PORTFOLIOOF INVESTMENTS (continued)
July 31, 2020
| | | | | | | | |
| Security | | Principal
Amount* | | | Value | |
Information Technology – 0.1% | | | | | | | | |
Blackhawk Network Holdings, Inc 2018 1st Lien Term Loan, 3.161%, (1 mo. USD LIBOR + 3.000%), 6/15/25 (a) | | | 176,400 | | | $ | 165,111 | |
SS&C Technologies Holdings Europe S.A.R.L. 2018 Term Loan B4, 1.911%, (1 mo. USD LIBOR + 1.750%), 4/16/25 (a) | | | 46,323 | | | | 44,991 | |
SS&C Technologies Inc. 2018 Term Loan B3, 1.911%, (1 mo. USD LIBOR + 1.750%), 4/16/25 (a) | | | 65,934 | | | | 64,038 | |
| | | | | | | | |
| | | | | | | 274,140 | |
| | | | | | | | |
Utilities – 1.1% | | | | | | | | |
Adient US LLC Term Loan B, 4.724%, (3 mo. USD LIBOR + 4.250%), 5/6/24 (a) | | | 222,750 | | | | 220,290 | |
Altice France S.A. USD Term Loan B12, 3.862%, (1 mo. USD LIBOR + 3.688%), 1/31/26 (a) | | | 473,458 | | | | 464,285 | |
CHG PPC Parent LLC 2018 Term Loan B, 2.911%, (1 mo. USD LIBOR + 2.750%), 3/31/25 (a) | | | 98,000 | | | | 95,305 | |
Crown Finance US, Inc. 2018 USD Term Loan, 3.322%, (3 mo. USD LIBOR + 2.250%), 2/28/25 (a) | | | 154,297 | | | | 99,521 | |
Diamond (BC) B.V. USD Term Loan, 3.261%, (1 mo. USD LIBOR + 3.000%), 9/6/24 (a) | | | 146,250 | | | | 138,426 | |
Finastra USA, Inc. USD 1st Lien Term Loan, 4.500%, (3 mo. USD LIBOR + 3.500%), 6/13/24 (a) | | | 253,975 | | | | 235,827 | |
Go Daddy Operating Company, LLC 2017 Repriced Term Loan, 1.911%, (1 mo. USD LIBOR + 1.750%), 2/15/24 (a) | | | 185,815 | | | | 181,402 | |
MA FinanceCo., LLC USD Term Loan B3, 2.661%, (1 mo. USD LIBOR + 2.500%), 6/21/24 (a) | | | 28,980 | | | | 27,473 | |
Russell Investments US Inst’l Holdco, Inc. Term Loan B, 3.822%, (6 mo. USD LIBOR + 2.750%), 6/1/23 (a) | | | 387,551 | | | | 382,828 | |
Seattle Spinco, Inc. USD Term Loan B3, 2.661%, (1 mo. USD LIBOR + 2.500%), 6/21/24 (a) | | | 195,711 | | | | 185,534 | |
| | | | | | | | |
| | | | | | | 2,030,891 | |
| | | | | | | | |
Total Senior Floating Rate Interests
(Cost $4,421,405) | | | | | | | 4,230,275 | |
| | | | | | | | |
| | | | | | | | |
| Foreign Government & Agency Securities – 1.7% | | | | | | |
City of Toronto Canada, 2.600%, 9/24/39 | | | 1,060,000 | CAD | | | 863,336 | |
Hong Kong Government International Bond,
2.500%, 5/28/24 (b) | | | 750,000 | | | | 795,923 | |
Republic of Chile, 0.830%, 7/2/31 | | | 1,370,000 | EUR | | | 1,596,186 | |
| | | | | | | | |
Total Foreign Government & Agency Securities
(Cost $3,107,310) | | | | | | | 3,255,445 | |
| | | | | | | | |
| | | | | | | | |
| Asset Backed Securities – 0.5% | | | | | | |
Carmax Auto Owner Trust | | | | | | | | |
Series 2016-3, Class B, 1.900%, 4/15/22 | | | 95,000 | | | | 95,261 | |
Series 2016-3, Class C, 2.200%, 6/15/22 | | | 75,000 | | | | 75,191 | |
Series 2017-4, Class C, 2.700%, 10/16/23 | | | 250,000 | | | | 253,976 | |
69
DOMINI IMPACT BOND FUND
PORTFOLIOOF INVESTMENTS (continued)
July 31, 2020
| | | | | | | | |
| Security | | Principal
Amount* | | | Value | |
| Asset Backed Securities (Continued) | | | | | | |
CNH Equipment Trust Series 2016-C, Class B,
1.930%, 3/15/24 | | | 20,000 | | | $ | 20,053 | |
SBA Tower Trust Series 2014-2A, Class C,
3.869%, 10/15/49 (b)(d) | | | 500,000 | | | | 530,516 | |
| | | | | | | | |
Total Asset Backed Securities
(Cost $939,867) | | | | | | | 974,997 | |
| | | | | | | | |
Total Long Term Investments
(Cost $217,889,090) | | | | | | | 231,093,194 | |
| | | | | | | | |
| | |
| Total Investments – 121.7% (Cost $217,889,090) (e) | | | | | 231,093,194 | |
| | |
| Other Liabilities, less assets – (21.7)% | | | | | (41,175,719) | |
| | | | | | | | |
| | |
| Net Assets – 100.0% | | | | | $189,917,475 | |
| | | | | | | | |
* The principal amount is stated in U.S. dollars unless otherwise indicated.
(a) Floating/Variable note with current rate and current maturity or next reset date shown. Certain variable rate securities are not based on a published reference rate and spread, but are determined by the issuer or agent and are based on current market conditions. These securities do not indicate a reference rate and spread in their description above.
(b) Security that may be sold to qualified institutional buyers under Rule 144A of the Securities Act of 1933, as amended. At July 31, 2020, the aggregate value of these securities was $27,647,828, representing 14.6% of net assets.
(c) A portion or all of the security was purchased as a when issued or delayed delivery security.
(d) Step coupon bond.
(e) The aggregate cost for federal income tax purposes is $217,958,292. The aggregate gross unrealized appreciation is $13,404,181 and the aggregate gross unrealized depreciation is $269,279, resulting in net unrealized appreciation of $13,134,902.
Abbreviations
TBA — To Be Announced
AGM — Assured Guaranty Municipal Corporation
NATL — National Public Finance Guarantee Corporation
CAD – Canadian Dollar
EUR – Euro
70
DOMINI IMPACT BOND FUND
PORTFOLIOOF INVESTMENTS (continued)
July 31, 2020
At July 31, 2020, the Fund had the following forward currency contracts outstanding.
| | | | | | | | | | | | | | | | | | | | | | |
Currency
Bought | | Currency
Sold | | Counterparty | | | Settlement
Date | | | Quantity | | | Value | | | Unrealized
Appreciation
(Depreciation) | |
| | | | | | |
United States Dollar | | Canadian
Dollar | |
| Goldman Sachs
International |
| | | 9/16/20 | | | | 1,052,000 | | | $ | 785,457 | | | $ | (6,155 | ) |
| | | | | | |
United States Dollar | | Euro | |
| JP Morgan
Chase Bank
N.A. |
| | | 8/31/20 | | | | 155,000 | | | | 183,393 | | | | (2,154 | ) |
| | | | | | |
United States Dollar | | Euro | |
| JP Morgan
Chase Bank
N.A. |
| | | 9/16/20 | | | | 1,672,000 | | | | 1,978,955 | | | | (92,284 | ) |
| | | | | | | | | | | | | | | | | | | | | | |
| | | | | | |
| | | | | | | | | | | | | | | | | | | | $ | (100,593 | ) |
| | | | | | | | | | | | | | | | | | | | | | �� |
At July 31, 2020, the Fund had the following future contracts outstanding.
| | | | | | | | | | | | | | | | | | |
| Description | | Number of
Contracts | | Notional
Amount | | | Value | | | Expiration
Date | | | Unrealized
Appreciation
(Depreciation) | |
| | | | | |
Euro Bund (Short) | | 29 | | $ | (2,900,000 | ) | | $ | (6,087,604 | ) | | | 9/8/20 | | | $ | (78,785 | ) |
| | | | | | | | | | | | | | | | | | |
| | | | | |
| | | | | | | | | | | | | | | | $ | (78,785 | ) |
| | | | | | | | | | | | | | | | | | |
At July 31, 2020, the Fund had the following centrally cleared interest rate swap contracts outstanding.
| | | | | | | | | | | | | | | | | | | | | | |
| Description | | Counterparty/
Exchange | | Expiration
Date | | | Notional
Amount | | | Value | | | Upfront
Premiums
Paid
(Received) | | | Unrealized
Appreciation
(Depreciation) | |
| | | | | | |
Pay Fixed rate semi-annually 1.769% Receive Floating rate quarterly 3 month USD BBA LIBOR | | Morgan
Stanley/LCH | | | 10/30/29 | | | $ | 445,000 | | | $ | (52,064 | ) | | $ | - | | | $ | (52,064 | ) |
| | | | | | |
Pay Fixed rate semi-annually 1.766% Receive Floating rate quarterly 3 month USD BBA LIBOR | | Morgan
Stanley/LCH | | | 10/30/29 | | | | 405,000 | | | | (47,254 | ) | | | - | | | | (47,254 | ) |
| | | | | | |
Pay Fixed rate semi-annually 1.727% Receive Floating rate quarterly 3 month USD BBA LIBOR | | Morgan
Stanley/LCH | | | 10/29/29 | | | | 890,000 | | | | (100,633 | ) | | | - | | | | (100,633 | ) |
71
DOMINI IMPACT BOND FUND
PORTFOLIOOF INVESTMENTS (continued)
July 31, 2020
| | | | | | | | | | | | | | | | | | | | | | |
| Description | | Counterparty/
Exchange | | Expiration
Date | | | Notional
Amount | | | Value | | | Upfront
Premiums
Paid
(Received) | | | Unrealized
Appreciation
(Depreciation) | |
| | | | | | |
Pay Fixed rate semi-annually 1.721% Receive Floating rate quarterly 3 month USD BBA LIBOR | | Morgan
Stanley/LCH | | | 10/29/29 | | | $ | 535,000 | | | $ | (60,198 | ) | | $ | - | | | $ | (60,198 | ) |
| | | | | | |
Pay Fixed rate semi-annually 1.765% Receive Floating rate quarterly 3 month USD BBA LIBOR | | Morgan
Stanley/LCH | | | 10/30/29 | | | | 450,000 | | | | (52,463 | ) | | | - | | | | (52,463 | ) |
| | | | | | |
Pay Fixed rate semi-annually 1.770% Receive Floating rate quarterly 3 month USD BBA LIBOR | | Morgan
Stanley/LCH | | | 10/30/29 | | | | 410,000 | | | | (48,007 | ) | | | - | | | | (48,007 | ) |
| | | | | | |
Receive Fixed rate semi-annually 1.430% Pay Floating rate quarterly 3 month USD BBA LIBOR | | Morgan
Stanley/LCH | | | 8/28/29 | | | | 1,790,000 | | | | 152,236 | | | | - | | | | 152,236 | |
| | | | | | |
Pay Fixed rate semi-annually 0.836% Receive Floating rate quarterly 3 month USD BBA LIBOR | | Morgan
Stanley/LCH | | | 3/20/30 | | | | 745,000 | | | | (22,766 | ) | | | - | | | | (22,766 | ) |
| | | | | | |
Pay Fixed rate semi-annually 0.780% Receive Floating rate quarterly 3 month USD BBA LIBOR | | Morgan
Stanley/LCH | | | 4/14/30 | | | | 10,890,000 | | | | (273,720 | ) | | | (130,699 | ) | | | (143,021 | ) |
72
DOMINI IMPACT BOND FUND
PORTFOLIOOF INVESTMENTS (continued)
July 31, 2020
| | | | | | | | | | | | | | | | | | | | | | |
| Description | | Counterparty/
Exchange | | Expiration
Date | | | Notional
Amount | | | Value | | | Upfront
Premiums
Paid
(Received) | | | Unrealized
Appreciation
(Depreciation) | |
| | | | | | |
Receive Fixed rate semi-annually 0.482% Pay Floating rate quarterly 3 month USD BBA LIBOR | | Morgan
Stanley/LCH | | | 4/1/25 | | | $ | 760,000 | | | $ | 8,691 | | | $ | - | | | $ | 8,691 | |
| | | | | | |
Receive Fixed rate semi-annually 0.480% Pay Floating rate quarterly 3 month USD BBA LIBOR | | Morgan
Stanley/LCH | | | 4/7/25 | | | | 1,145,000 | | | | 13,011 | | | | - | | | | 13,011 | |
| | | | | | |
Receive Fixed rate semi-annually 0.810% Pay Floating rate quarterly 3 month USD BBA LIBOR | | Morgan
Stanley/LCH | | | 9/16/50 | | | | 1,205,000 | | | | 9,759 | | | | (40,389 | ) | | | 50,148 | |
| | | | | | |
Pay Fixed rate semi-annually 0.410% Receive Floating rate quarterly 3 month USD BBA LIBOR | | Morgan
Stanley/LCH | | | 9/16/25 | | | | 3,626,000 | | | | (27,235 | ) | | | 16,021 | | | | (43,256 | ) |
| | | | | | |
Pay Fixed rate semi-annually 0.410% Receive Floating rate quarterly 3 month USD BBA LIBOR | | Morgan
Stanley/LCH | | | 6/17/25 | | | | 1,925,000 | | | | (15,286 | ) | | | (852 | ) | | | (14,434 | ) |
| | | | | | |
Pay Fixed rate semi-annually 1.090% Receive Floating rate quarterly 3 month USD BBA LIBOR | | Morgan
Stanley/LCH | | | 9/16/40 | | | | 400,000 | | | | (25,906 | ) | | | (20,804 | ) | | | (5,102 | ) |
| | | | | | |
Receive Fixed rate semi-annually 0.560% Pay Floating rate quarterly 3 month USD BBA LIBOR | | Morgan
Stanley/LCH | | | 9/16/27 | | | | 5,267,000 | | | | 62,099 | | | | 29,373 | | | | 32,726 | |
73
DOMINI IMPACT BOND FUND
PORTFOLIOOF INVESTMENTS (continued)
July 31, 2020
| | | | | | | | | | | | | | | | | | | | | | |
| Description | | Counterparty/
Exchange | | Expiration
Date | | | Notional
Amount | | | Value | | | Upfront
Premiums
Paid
(Received) | | | Unrealized
Appreciation
(Depreciation) | |
| | | | | | |
Receive Fixed rate semi-annually 0.280% Pay Floating rate quarterly 3 month USD BBA LIBOR | | Morgan
Stanley/LCH | | | 9/16/25 | | | $ | 1,890,000 | | | $ | 1,915 | | | $ | 1,017 | | | $ | 898 | |
| | | | | | | | | | | | | | | | | | | | | | |
| | | | | | |
| | | | | | | | | | | | | | | | $ | (146,333 | ) | | $ | (331,488 | ) |
| | | | | | | | | | | | | | | | | | | | | | |
At July 31, 2020, the Fund had the following centrally cleared credit default swap contracts outstanding.
| | | | | | | | | | | | | | | | | | | | | | |
| Description | | Counterparty/
Exchange | | Expiration
Date | | | Notional
Amount(a) | | | Value(b) | | | Upfront
Premiums
Paid
(Received) | | | Unrealized
Appreciation
(Depreciation) | |
| | | | | | |
Buy Protection (c): CDX-NAHY Series 34, Version 7, 5 Year Index, fixed rate 5.000%, (d) | | Morgan
Stanley/ICE | | | 6/20/25 | | | $ | 1,363,000 | | | $ | (35,460 | ) | | $ | (37,662 | ) | | $ | 2,202 | |
| | | | | | | | | | | | | | | | | | | | | | |
| | | | | | |
| | | | | | | | | | | | | | | | $ | (37,662 | ) | | $ | 2,202 | |
| | | | | | | | | | | | | | | | | | | | | | |
(a) The maximum potential amount the Fund could be required to pay as a seller of credit protection or receive as a buyer of credit protection if a credit event occurs as defined under the terms of that particular swap agreement.
(b) The prices and resulting values for credit default swap agreements on credit indices serve as an indicator of the current status of the payment/performance risk and represent the likelihood of an expected liability (or profit) for the credit derivative should the notional amount of the swap agreement be closed/sold as of the period end. Increasing market values, in absolute terms when compared to the notional amount of the swap, represent a deterioration of the referenced entity’s credit soundness and a greater likelihood or risk of default or other credit event occurring as defined under the terms of the agreement.
(c) If the Fund is a buyer/(seller) of protection and a credit event occurs, as defined under the terms of that particular swap agreement, the Fund will either (i) receive from the seller/(pay to the buyer) of protection an amount equal to the notional amount of the swap and deliver/(take delivery) of the referenced obligation or underlying securities comprising the referenced index or (ii) receive/(pay) a net settlement amount in the form of cash or securities equal to the notional amount of the swap less the recovery value of the referenced obligation of underlying securities comprising the referenced index.
(d) Ratings of Moody’s/S&P — B1/B+
Abbreviations
LCH — London Clearing House
ICE — Intercontinental Exchange
SEE NOTES TO FINANCIAL STATEMENTS
74
DOMINI FUNDS EXPENSE EXAMPLE (Unaudited)
As a shareholder of the Domini Funds, you incur two types of costs:
(1) Transaction costs such as redemption fees deducted from any redemption or exchange proceeds if you sell or exchange shares of the fund after holding them less than 30 days and sales charges (loads) on Class A shares and
(2) Ongoing costs, including management fees, distribution (12b-1) fees, and other Fund expenses.
This example is intended to help you understand your ongoing costs (in dollars) of investing in the Fund and to compare these costs with the ongoing costs of investing in other mutual funds. The example is based on an investment of $1,000 invested on February 01, 2020 and held through July 31, 2020.
Certain Account Fees
Some accounts are subject to recurring annual service fees and maintenance fees that are not included in the expenses shown in the table. If your account was subject to these fees, then the actual account values at the end of the period would be lower and the actual expense would be higher. You may avoid the annual service fee by choosing paperless electronic delivery of statements, prospectuses, shareholder reports and other materials.
Actual Expenses
The line of the table captioned ‘‘Actual Expenses’’ below provides information about actual account value and actual expenses. You may use the information in this line, together with the amount invested, to estimate the expenses that you paid over the period as follows:
(1) Divide your account value by $1,000.
(2) Multiply your result in step 1 by the number in the first line under the heading ‘‘Expenses Paid During Period’’ in the table.
The result equals the estimated expenses you paid on your account during the period.
Hypothetical Expenses
The second line of the table below provides information about hypothetical account values and hypothetical expenses based on the Fund’s actual expense ratio and an assumed rate of return of 5% per year before expenses, which is not the Fund’s return. The hypothetical account values and expenses may not be used to estimate actual ending account balance or expenses you paid for the period. You may use this information to compare the ongoing costs of investing in the Fund and other mutual funds. To do so, compare this 5% hypothetical example with the 5% hypothetical example that appears in the shareholder reports of the other funds.
75
Please note that the expenses shown in the table are meant to highlight your ongoing costs only and do not reflect any transactional costs, such as redemption fees. Therefore, the second line of the table is useful in comparing ongoing costs only, and will not help you determine the relative total costs of owning different funds. In addition, if these transactional costs were included, your costs would have been higher.
| | | | | | | | |
| | | | | |
| Fund Name | | Expenses | | Beginning
Account Value
As of 2/1/2020 | | Ending Account
value as of
7/31/2020 | | Expenses Paid
During Period
2/1/2020 –
7/31/2020 |
Domini Impact International Equity Fund Investor Shares | | Actual Expenses | | $1,000.00 | | $923.90 | | $6.361 |
| | Hypothetical Expenses (5% return before expenses) | | $1,000.00 | | $1,018.20 | | $6.671 |
Domini Impact International Equity Fund Class A Shares | | Actual Expenses | | $1,000.00 | | $923.90 | | $6.551 |
| | Hypothetical Expenses (5% return before expenses) | | $1,000.00 | | $1,018.10 | | $6.871 |
Domini Impact International Equity Fund Institutional Shares | | Actual Expenses | | $1,000.00 | | $926.90 | | $4.411 |
| | Hypothetical Expenses (5% return before expenses) | | $1,000.00 | | $1,020.30 | | $4.621 |
Domini Impact International Equity Fund Class Y Shares | | Actual Expenses | | $1,000.00 | | $925.70 | | $4.841 |
| | Hypothetical Expenses (5% return before expenses) | | $1,000.00 | | $1,019.80 | | $5.071 |
Domini Impact Equity Fund Investor Shares | | Actual Expenses | | $1,000.00 | | $1,100.30 | | $5.642 |
| | Hypothetical Expenses (5% return before expenses) | | $1,000.00 | | $1,019.50 | | $5.422 |
Domini Impact Equity Fund Class A Shares | | Actual Expenses | | $1,000.00 | | $1,100.30 | | $5.642 |
| | Hypothetical Expenses (5% return before expenses) | | $1,000.00 | | $1,019.50 | | $5.422 |
Domini Impact Equity Fund Institutional Shares | | Actual Expenses | | $1,000.00 | | $1,102.20 | | $3.822 |
| | Hypothetical Expenses (5% return before expenses) | | $1,000.00 | | $1,021.20 | | $3.672 |
Domini Impact Equity Fund Class R Shares | | Actual Expenses | | $1,000.00 | | $1,101.70 | | $4.132 |
| | Hypothetical Expenses (5% return before expenses) | | $1,000.00 | | $1,020.90 | | $3.972 |
Domini Sustainable Solutions Fund Investor Class | | Actual Expenses | | $1,000.00 | | $1,528.00 | | $5.733 |
| | Hypothetical Expenses (5% return before expenses) | | $1,000.00 | | $1,018.10 | | $6.823 |
Domini Sustainable Solutions Fund Institutional Class | | Actual Expenses | | $1,000.00 | | $1,529.00 | | $4.683 |
| | Hypothetical Expenses (5% return before expenses) | | $1,000.00 | | $1,019.30 | | $5.573 |
76
| | | | | | | | |
| | | | | |
| Fund Name | | Expenses | | Beginning
Account Value
As of 2/1/2020 | | Ending Account
value as of
7/31/2020 | | Expenses Paid
During Period
2/1/2020 –
7/31/2020 |
Domini Impact Bond Fund Investor Shares | | Actual Expenses | | $1,000.00 | | $1,070.00 | | $4.324 |
| | Hypothetical Expenses (5% return before expenses) | | $1,000.00 | | $1,020.70 | | $4.224 |
Domini Impact Bond Fund Institutional Shares | | Actual Expenses | | $1,000.00 | | $1,071.10 | | $2.834 |
| | Hypothetical Expenses (5% return before expenses) | | $1,000.00 | | $1,022.20 | | $2.724 |
1Expenses are equal to the Fund’s annualized expense ratio of 1.33% for Investor shares, or 1.37% for Class A shares, or 0.92% for Institutional shares, or 1.01% for Class Y shares, multiplied by average account value over the period, multiplied by 182, and divided by 366.
2Expenses are equal to the Fund’s annualized expense ratio of 1.08% for Investor shares, or 1.08% for Class A shares, or 0.73% for Institutional shares, or 0.79% for Class R shares, multiplied by average account value over the period, multiplied by 182, and divided by 366.
3Actual Expenses are equal to the Fund’s annualized expense ratio of 1.36% for Investor shares, or 1.11% for Institutional shares, multiplied by average account value over the period beginning 4/1/2020 (commencement of operations), multiplied by 122, and divided by 366. Hypothetical expenses are equal to the Fund’s annualized expense ratio of 1.36% for Investor shares, or 1.11% for Institutional shares, multiplied by average account value over the period, multiplied by 182, and divided by 366.
4Expenses are equal to the Fund’s annualized expense ratio of 0.84% for Investor shares, or 0.54% for Institutional shares, multiplied by average account value over the period, multiplied by 182, and divided by 366.
77
STATEMENT OF ASSETS AND LIABILITIES
July 31, 2020
| | | | |
| | | Domini Impact
International
Equity Fund | |
ASSETS | | | | |
Investments, at value (cost $978,492,155) | | $ | 1,049,683,186 | |
Cash | | | 3,476,116 | |
Foreign currency, at value (cost $2,037,409) | | | 2,037,574 | |
Receivable for securities sold | | | 94,704,889 | |
Receivable for capital shares | | | 496,291 | |
Dividend receivable | | | 2,247,187 | |
Tax reclaim receivable | | | 2,999,411 | |
| | | | |
Total assets | | | 1,155,644,654 | |
| | | | |
LIABILITIES | | | | |
Payable for securities purchased | | | 87,506,244 | |
Payable for capital shares | | | 807,519 | |
Management fee payable | | | 808,596 | |
Distribution fee payable | | | 83,434 | |
Other accrued expenses | | | 746,602 | |
Foreign tax payable | | | 374,235 | |
| | | | |
Total liabilities | | | 90,326,630 | |
| | | | |
NET ASSETS | | $ | 1,065,318,024 | |
| | | | |
NET ASSETS CONSISTS OF | | | | |
Paid-in Capital | | $ | 1,174,756,457 | |
Total distributable earnings (loss) | | | (109,438,433) | |
| | | | |
NET ASSETS | | $ | 1,065,318,024 | |
| | | | |
NET ASSET VALUE PER SHARE | | | | |
| |
Investor Shares | | | | |
Net assets | | $ | 396,619,603 | |
| | | | |
Outstanding shares of beneficial interest | | | 54,487,481 | |
| | | | |
Net Asset Value And Offering Price Per Share* | | $ | 7.28 | |
| | | | |
| |
Class A Shares | | | | |
Net assets | | $ | 20,914,000 | |
| | | | |
Outstanding shares of beneficial interest | | | 2,691,748 | |
| | | | |
Net Asset Value And Offering Price Per Share* | | $ | 7.77 | |
| | | | |
Maximum offering price per share (net asset value per share / (1-4.75%)) | | $ | 8.16 | |
| | | | |
| |
Institutional Shares | | | | |
Net assets | | $ | 473,364,966 | |
| | | | |
Outstanding shares of beneficial interest | | | 65,515,250 | |
| | | | |
Net Asset Value And Offering Price Per Share* | | $ | 7.23 | |
| | | | |
| |
Class Y Shares | | | | |
Net assets | | $ | 174,419,455 | |
| | | | |
Outstanding shares of beneficial interest | | | 24,119,828 | |
| | | | |
Net Asset Value And Offering Price Per Share* | | $ | 7.23 | |
| | | | |
* Redemption price is equal to net asset value less any applicable redemption fees retained by the Fund.
SEE NOTES TO FINANCIAL STATEMENTS
78
STATEMENT OF ASSETS AND LIABILITIES
July 31, 2020
| | | | |
| | | Domini Impact
Equity Fund | |
ASSETS | | | | |
Investments, at value (cost $569,458,871) | | $ | 842,100,266 | |
Cash | | | 3,798,527 | |
Foreign currency, at value (cost $44,858) | | | 44,837 | |
Receivable for capital shares | | | 85,727 | |
Dividend receivable | | | 946,148 | |
Tax reclaim receivable | | | 167,507 | |
| | | | |
Total assets | | | 847,143,012 | |
| | | | |
LIABILITIES | | | | |
Payable for securities purchased | | | 1,003,389 | |
Payable for capital shares | | | 406,402 | |
Management fee payable | | | 456,667 | |
Distribution fee payable | | | 149,622 | |
Other accrued expenses | | | 389,799 | |
Foreign tax payable | | | 787 | |
| | | | |
Total liabilities | | | 2,406,666 | |
| | | | |
NET ASSETS | | $ | 844,736,346 | |
| | | | |
NET ASSETS CONSISTS OF | | | | |
Paid-in Capital | | $ | 563,140,559 | |
Total distributable earnings (loss) | | | 281,595,787 | |
| | | | |
NET ASSETS | | $ | 844,736,346 | |
| | | | |
NET ASSET VALUE PER SHARE | | | | |
| |
Investor Shares | | | | |
Net assets | | $ | 718,958,519 | |
| | | | |
Outstanding shares of beneficial interest | | | 26,904,156 | |
| | | | |
Net Asset Value And Offering Price Per Share* | | $ | 26.72 | |
| | | | |
| |
Class A Shares | | | | |
Net assets | | $ | 6,476,835 | |
| | | | |
Outstanding shares of beneficial interest | | | 242,559 | |
| | | | |
Net Asset Value And Offering Price Per Share* | | $ | 26.70 | |
| | | | |
| |
Institutional Shares | | | | |
Net assets | | $ | 112,804,654 | |
| | | | |
Outstanding shares of beneficial interest | | | 4,242,719 | |
| | | | |
Net Asset Value And Offering Price Per Share* | | $ | 26.59 | |
| | | | |
| |
Class R Shares | | | | |
Net assets | | $ | 6,496,338 | |
| | | | |
Outstanding shares of beneficial interest | | | 244,031 | |
| | | | |
Net Asset Value And Offering Price Per Share* | | $ | 26.62 | |
| | | | |
* Redemption price is equal to net asset value less any applicable redemption fees retained by the Fund.
SEE NOTES TO FINANCIAL STATEMENTS
79
STATEMENT OF ASSETS AND LIABILITIES
July 31, 2020
| | | | |
| | | Domini
Sustainable
Solutions Fund | |
ASSETS: | | | | |
Investments, at value (cost $14,670,916) | | $ | 19,109,869 | |
Cash | | | 671,104 | |
Foreign currency, at value (cost $18,200) | | | 18,217 | |
Receivable for securities sold | | | 12,048 | |
Receivable for capital shares | | | 36,009 | |
Dividend receivable | | | 1,484 | |
Tax reclaim receivable | | | 88 | |
| | | | |
Total assets | | | 19,848,819 | |
| | | | |
LIABILITIES: | | | | |
Payable for securities purchased | | | 65,982 | |
Management fee payable | | | 12,857 | |
Other accrued expenses | | | 11,672 | |
Foreign tax payable | | | 371 | |
| | | | |
Total liabilities | | | 90,882 | |
| | | | |
NET ASSETS | | $ | 19,757,937 | |
| | | | |
NET ASSETS CONSISTS OF | | | | |
Paid-in Capital | | $ | 15,080,182 | |
Total distributable earnings (loss) | | | 4,677,755 | |
| | | | |
NET ASSETS | | $ | 19,757,937 | |
| | | | |
NET ASSET VALUE PER SHARE | | | | |
| |
Investor Class | | | | |
Net assets | | $ | 7,297,848 | |
| | | | |
Outstanding shares of beneficial interest | | | 477,570 | |
| | | | |
Net Asset Value and Offering Price Per Share* | | $ | 15.28 | |
| | | | |
| |
Institutional Class | | | | |
Net assets | | $ | 12,460,089 | |
| | | | |
Outstanding shares of beneficial interest | | | 814,811 | |
| | | | |
Net Asset Value and Offering Price Per Share* | | $ | 15.29 | |
| | | | |
* Redemption price is equal to net asset value less any applicable redemption fees retained by the Fund.
SEE NOTES TO FINANCIAL STATEMENTS
80
STATEMENT OF OPERATIONS
For the Year Ended July 31, 2020
| | | | |
| | | Domini Impact
International
Equity Fund | |
INCOME | | | | |
Dividends (net of foreign taxes $2,639,300) | | $ | 25,540,864 | |
Interest income | | | 16,477 | |
| | | | |
Investment Income | | | 25,557,341 | |
| | | | |
EXPENSES | | | | |
Management/Sponsorship fees | | | 9,952,826 | |
Distribution fees – Investor Shares | | | 1,006,353 | |
Distribution fees – Class A Shares | | | 59,584 | |
Transfer agent fees – Investor Shares | | | 772,657 | |
Transfer agent fees – Class A Shares | | | 67,968 | |
Transfer agent fees – Institutional Shares | | | 28,483 | |
Transfer agent fees – Class Y Shares | | | 127,534 | |
Custody and Accounting fees | | | 168,494 | |
Professional fees | | | 132,642 | |
Registration fees – Investor Shares | | | 31,363 | |
Registration fees – Class A Shares | | | 21,090 | |
Registration fees – Institutional Shares | | | 52,795 | |
Registration fees – Class Y Shares | | | 44,972 | |
Shareholder Communication fees | | | 70,785 | |
Miscellaneous | | | 31,609 | |
Trustees fees | | | 73,847 | |
Shareholder Service fees – Investor Shares | | | 31,363 | |
Shareholder Service fees – Class A Shares | | | 4,486 | |
Shareholder Service fees – Institutional Shares | | | 549 | |
Shareholder Service fees – Class Y Shares | | | 48 | |
| | | | |
Total expenses | | | 12,679,448 | |
| | | | |
Fees waived and expenses reimbursed | | | (111,275) | |
Transfer agent credits | | | (1,583) | |
| | | | |
Net expenses | | | 12,566,590 | |
| | | | |
NET INVESTMENT INCOME (LOSS) | | | 12,990,751 | |
| | | | |
REALIZED AND UNREALIZED GAIN (LOSS) FROM INVESTMENTS AND FOREIGN CURRENCY | | | | |
NET REALIZED GAIN (LOSS) FROM: | | | | |
Investments | | | (64,963,801) | |
Foreign currency | | | (217,832) | |
| | | | |
Net realized gain (loss) | | | (65,181,633) | |
| | | | |
NET CHANGES IN UNREALIZED APPRECIATION (DEPRECIATION) FROM: | | | | |
Investments | | | 14,545,377 | |
Translation of assets and liabilities in foreign currencies | | | 200,484 | |
| | | | |
Net change in unrealized appreciation (depreciation) | | | 14,745,861 | |
| | | | |
| |
NET REALIZED AND UNREALIZED GAIN (LOSS) | | | (50,435,772) | |
| | | | |
| |
NET INCREASE (DECREASE) IN NET ASSETS RESULTING FROM OPERATIONS | | $ | (37,445,021) | |
| | | | |
SEE NOTES TO FINANCIAL STATEMENTS
81
STATEMENT OF OPERATIONS
For the Year Ended July 31, 2020
| | | | |
| | | Domini Impact
Equity Fund | |
INCOME | | | | |
Dividends (net of foreign taxes $247,430) | | $ | 13,336,668 | |
Interest income | | | 26,851 | |
| | | | |
Investment Income | | | 13,363,519 | |
| | | | |
EXPENSES | | | | |
Management/Sponsorship fees | | | 5,008,021 | |
Distribution fees – Investor Shares | | | 1,630,015 | |
Distribution fees – Class A Shares | | | 15,033 | |
Transfer agent fees – Investor Shares | | | 863,587 | |
Transfer agent fees – Class A Shares | | | 8,970 | |
Transfer agent fees – Institutional Shares | | | 3,344 | |
Transfer agent fees – Class R Shares | | | 4,258 | |
Custody and Accounting fees | | | 112,720 | |
Professional fees | | | 94,644 | |
Registration fees – Investor Shares | | | 28,426 | |
Registration fees – Class A Shares | | | 20,826 | |
Registration fees – Institutional Shares | | | 22,449 | |
Registration fees – Class R Shares | | | 25,551 | |
Shareholder Communication fees | | | 33,567 | |
Miscellaneous | | | 82,762 | |
Trustees fees | | | 44,980 | |
Shareholder Service fees – Investor Shares | | | 45,932 | |
Shareholder Service fees – Class A Shares | | | 400 | |
Shareholder Service fees – Institutional Shares | | | 122 | |
Shareholder Service fees – Class R Shares | | | 119 | |
| | | | |
Total expenses | | | 8,045,726 | |
| | | | |
Fees waived and expenses reimbursed | | | (72,890) | |
Transfer agent credits | | | (1,906) | |
| | | | |
Net expenses | | | 7,970,930 | |
| | | | |
NET INVESTMENT INCOME (LOSS) | | | 5,392,589 | |
| | | | |
REALIZED AND UNREALIZED GAIN (LOSS) FROM INVESTMENTS AND FOREIGN CURRENCY | | | | |
NET REALIZED GAIN (LOSS) FROM: | | | | |
Investments | | | 10,673,390 | |
Foreign currency | | | (348) | |
| | | | |
Net realized gain (loss) | | | 10,673,042 | |
| | | | |
NET CHANGES IN UNREALIZED APPRECIATION (DEPRECIATION) FROM: | | | | |
Investments | | | 141,328,682 | |
Translation of assets and liabilities in foreign currencies | | | (40) | |
| | | | |
Net change in unrealized appreciation (depreciation) | | | 141,328,642 | |
| | | | |
NET REALIZED AND UNREALIZED GAIN (LOSS) | | | 152,001,684 | |
| | | | |
NET INCREASE (DECREASE) IN NET ASSETS RESULTING FROM OPERATIONS | | $ | 157,394,273 | |
| | | | |
SEE NOTES TO FINANCIAL STATEMENTS
82
STATEMENT OF OPERATIONS
For the Period Ended July 31, 2020
| | | | |
| | | Domini
Sustainable
Solutions Fund | |
INCOME | | | | |
Dividends (net of foreign taxes $1,429) | | $ | 20,016 | |
| | | | |
Investment Income | | | 20,016 | |
| | | | |
EXPENSES | | | | |
Management/Sponsorship fees | | | 34,987 | |
Distribution fees – Investor Class | | | 2,796 | |
Transfer agent fees – Investor Class | | | 6,060 | |
Transfer agent fees – Institutional Class | | | 301 | |
Custody and Accounting fees | | | 29,048 | |
Professional fees | | | 44,239 | |
Registration fees – Investor Class | | | 4,974 | |
Registration fees – Institutional Class | | | 5,231 | |
Shareholder Communication fees | | | 2,512 | |
Miscellaneous | | | 476 | |
Trustees fees | | | 40 | |
Shareholder Service fees – Investor Class | | | 221 | |
Shareholder Service fees – Institutional Class | | | 7 | |
| | | | |
Total expenses | | | 130,892 | |
| | | | |
Fees waived and expenses reimbursed | | | (81,930) | |
Transfer agent credits | | | (15) | |
| | | | |
Net expenses | | | 48,947 | |
| | | | |
NET INVESTMENT INCOME (LOSS) | | | (28,931) | |
| | | | |
REALIZED AND UNREALIZED GAIN (LOSS) FROM INVESTMENTS AND FOREIGN CURRENCY | | | | |
NET REALIZED GAIN (LOSS) FROM: | | | | |
Investments | | | 263,008 | |
Foreign currency | | | 4,651 | |
| | | | |
Net realized gain (loss) | | | 267,659 | |
| | | | |
NET CHANGES IN UNREALIZED APPRECIATION (DEPRECIATION) FROM: | | | | |
Investments | | | 4,438,953 | |
Translation of assets and liabilities in foreign currencies | | | 74 | |
| | | | |
Net change in unrealized appreciation (depreciation) | | | 4,439,027 | |
| | | | |
NET REALIZED AND UNREALIZED GAIN (LOSS) | | | 4,706,686 | |
| | | | |
NET INCREASE (DECREASE) IN NET ASSETS RESULTING FROM OPERATIONS | | $ | 4,677,755 | |
| | | | |
SEE NOTES TO FINANCIAL STATEMENTS
83
DOMINI IMPACT INTERNATIONAL EQUITY FUND
STATEMENTS OF CHANGES IN NET ASSETS
| | | | | | | | |
| | | Year Ended
July 31, 2020 | | | Year Ended
July 31, 2019 | |
DECREASE IN NET ASSETS FROM OPERATIONS | | | | | | | | |
Net investment income (loss) | | $ | 12,990,751 | | | $ | 26,743,684 | |
Net realized gain (loss) | | | (65,181,633) | | | | (103,322,449) | |
Net change in unrealized appreciation (depreciation) | | | 14,745,861 | | | | (24,024,512) | |
| | | | | | | | |
Net Increase (Decrease) in Net Assets Resulting from Operations | | | (37,445,021) | | | | (100,603,277) | |
| | | | | | | | |
DISTRIBUTIONS TO SHAREHOLDERS | | | | | | | | |
Investor Shares | | | (11,113,787) | | | | (24,163,150) | |
Class A Shares | | | (528,371) | | | | (1,460,369) | |
Institutional Shares | | | (16,980,431) | | | | (29,162,105) | |
Class Y Shares | | | (5,670,750) | | | | (7,093,471) | |
| | | | | | | | |
Net Decrease in Net Assets from Distributions | | | (34,293,339) | | | | (61,879,095) | |
| | | | | | | | |
CAPITAL SHARE TRANSACTIONS | | | | | | | | |
Proceeds from sale of shares | | | 402,564,549 | | | | 676,424,309 | |
Net asset value of shares issued in reinvestment of distributions and dividends | | | 27,442,828 | | | | 46,072,573 | |
Payments for shares redeemed | | | (513,861,795) | | | | (753,471,348) | |
Redemption fees | | | 13,533 | | | | 5,202 | |
| | | | | | | | |
Net Increase (Decrease) in Net Assets from Capital Share Transactions | | | (83,840,885) | | | | (30,969,264) | |
| | | | | | | | |
Total Increase (Decrease) in Net Assets | | | (155,579,245) | | | | (193,451,636) | |
| | | | | | | | |
NET ASSETS | | | | | | | | |
Beginning of period | | $ | 1,220,897,269 | | | $ | 1,414,348,905 | |
| | | | | | | | |
End of period | | $ | 1,065,318,024 | | | $ | 1,220,897,269 | |
| | | | | | | | |
SEE NOTES TO FINANCIAL STATEMENTS
84
DOMINI IMPACT EQUITY FUND
STATEMENTS OF CHANGES IN NET ASSETS
| | | | | | | | |
| | | Year Ended
July 31, 2020 | | | Year Ended
July 31, 2019 | |
INCREASE IN NET ASSETS FROM OPERATIONS | | | | | | | | |
Net investment income (loss) | | $ | 5,392,589 | | | $ | 7,664,039 | |
Net realized gain (loss) | | | 10,673,042 | | | | 23,806,945 | |
Net change in unrealized appreciation (depreciation) | | | 141,328,642 | | | | 11,825,925 | |
| | | | | | | | |
Net Increase (Decrease) in Net Assets Resulting from Operations | | | 157,394,273 | | | | 43,296,909 | |
| | | | | | | | |
DISTRIBUTIONS TO SHAREHOLDERS | | | | | | | | |
Investor Shares | | | (16,690,995) | | | | (71,979,925) | |
Class A Shares | | | (154,455) | | | | (768,457) | |
Institutional Shares | | | (3,065,786) | | | | (13,430,821) | |
Class R Shares | | | (402,768) | | | | (2,084,463) | |
| | | | | | | | |
Net Decrease in Net Assets from Distributions | | | (20,314,004) | | | | (88,263,666) | |
| | | | | | | | |
CAPITAL SHARE TRANSACTIONS | | | | | | | | |
Proceeds from sale of shares | | | 32,168,636 | | | | 31,531,132 | |
Net asset value of shares issued in reinvestment of distributions and dividends | | | 19,005,879 | | | | 82,374,138 | |
Payments for shares redeemed | | | (112,440,380) | | | | (115,143,001) | |
Redemption fees | | | 7,097 | | | | 1,250 | |
| | | | | | | | |
Net Increase (Decrease) in Net Assets from Capital Share Transactions | | | (61,258,768) | | | | (1,236,481) | |
| | | | | | | | |
Total Increase (Decrease) in Net Assets | | | 75,821,501 | | | | (46,203,238) | |
| | | | | | | | |
NET ASSETS | | | | | | | | |
Beginning of period | | $ | 768,914,845 | | | $ | 815,118,083 | |
| | | | | | | | |
End of period | | $ | 844,736,346 | | | $ | 768,914,845 | |
| | | | | | | | |
SEE NOTES TO FINANCIAL STATEMENTS
85
DOMINI SUSTAINABLE SOLUTIONS FUND
STATEMENT OF CHANGES IN NET ASSETS
| | | | |
| | | For the Period
April 1, 2020
(commencement of
operations) through
July 31, 2020 | |
INCREASE IN NET ASSETS FROM OPERATIONS | | | | |
Net investment income (loss) | | $ | (28,931) | |
Net realized gain (loss) | | | 267,659 | |
Net change in unrealized appreciation (depreciation) | | | 4,439,027 | |
| | | | |
Net Increase (Decrease) in Net Assets Resulting from Operations | | | 4,677,755 | |
| | | | |
DISTRIBUTIONS TO SHAREHOLDERS | | | | |
Investor Class | | | - | |
Institutional Class | | | - | |
| | | | |
Net Decrease in Net Assets from Distributions | | | - | |
| | | | |
CAPITAL SHARE TRANSACTIONS | | | | |
Proceeds from sale of shares | | | 15,721,328 | |
Net asset value of shares issued in reinvestment of distributions and dividends | | | - | |
Payments for shares redeemed | | | (641,146) | |
Redemption fees | | | - | |
| | | | |
Net Increase (Decrease) in Net Assets from Capital Share Transactions | | | 15,080,182 | |
| | | | |
Total Increase (Decrease) in Net Assets | | | 19,757,937 | |
| | | | |
NET ASSETS | | | | |
Beginning of period | | $ | - | |
| | | | |
End of period | | $ | 19,757,937 | |
| | | | |
SEE NOTES TO FINANCIAL STATEMENTS
86
DOMINI IMPACT INTERNATIONAL EQUITY FUND — INVESTOR SHARES
FINANCIAL HIGHLIGHTS
| | | | | | | | | | | | | | | | | | | | |
| | | Year Ended July 31, | |
| | | 2020 | | | 2019 | | | 2018 | | | 2017 | | | 2016 | |
For a share outstanding for the period: | | | | | | | | | | | | | | | | | | | | |
Net asset value, beginning of period | | | $7.74 | | | | $8.72 | | | | $8.76 | | | | $7.38 | | | | $8.05 | |
| | | | | | | | | | | | | | | | | | | | |
Income from investment operations: | | | | | | | | | | | | | | | | | | | | |
Net investment income (loss) | | | 0.08 | | | | 0.15 | | | | 0.16 | | | | 0.15 | | | | 0.12 | |
Net realized and unrealized gain (loss) on investments | | | (0.33) | | | | (0.77) | | | | 0.02 | | | | 1.35 | | | | (0.53) | |
| | | | | | | | | | | | | | | | | | | | |
Total Income (loss) From Investment Operations | | | (0.25) | | | | (0.62) | | | | 0.18 | | | | 1.50 | | | | (0.41) | |
| | | | | | | | | | | | | | | | | | | | |
Less dividends and/or distributions: | | | | | | | | | | | | | | | | | | | | |
Dividends to shareholders from net investment income | | | (0.21) | | | | (0.13) | | | | (0.22) | | | | (0.12) | | | | (0.07) | |
Distributions to shareholders from net realized gain | | | - | | | | (0.23) | | | | - | | | | - | | | | (0.19) | |
| | | | | | | | | | | | | | | | | | | | |
Total Distributions | | | (0.21) | | | | (0.36) | | | | (0.22) | | | | (0.12) | | | | (0.26) | |
| | | | | | | | | | | | | | | | | | | | |
Redemption fee proceeds1 | | | 0.00 | 2 | | | 0.00 | 2 | | | 0.00 | 2 | | | 0.00 | 2 | | | 0.00 | 2 |
| | | | | | | | | | | | | | | | | | | | |
Net asset value, end of period | | | $7.28 | | | | $7.74 | | | | $8.72 | | | | $8.76 | | | | $7.38 | |
| | | | | | | | | | | | | | | | | | | | |
Total return | | | -3.49% | | | | -6.81% | | | | 2.08% | | | | 20.61% | | | | -5.12% | |
Portfolio turnover | | | 98% | | | | 77% | | | | 68% | | | | 73% | | | | 89% | |
Ratios/supplemental data (annualized): | | | | | | | | | | | | | | | | | | | | |
Net assets, end of period (in millions) | | | $397 | | | | $432 | | | | $612 | | | | $595 | | | | $385 | |
Ratio of expenses to average net assets | | | 1.36% | 3,4 | | | 1.41% | 3 | | | 1.41% | | | | 1.46% | | | | 1.52% | |
Ratio of gross expenses to average net assets | | | 1.38% | | | | 1.41% | | | | 1.41% | | | | 1.46% | | | | 1.52% | |
Ratio of net investment income (loss) to average net assets | | | 0.93% | | | | 1.70% | | | | 1.81% | | | | 2.06% | | | | 1.59% | |
1 Based on average shares outstanding.
2 Amount represents less than $0.005 per share.
3 Ratio of expenses to average net assets includes transfer agent credits. Excluding transfer agent credits the ratio of expenses to average net assets would have been 1.41% for the year ended July 31, 2019 and 1.36% for the year ended July 31, 2020.
4 Reflects a waiver of fees by the Manager and the Distributor of the Fund.
SEE NOTES TO FINANCIAL STATEMENTS
87
DOMINI IMPACT INTERNATIONAL EQUITY FUND — CLASS A SHARES
FINANCIAL HIGHLIGHTS
| | | | | | | | | | | | | | | | | | | | |
| | | Year Ended July 31, | |
| | | 2020 | | | 2019 | | | 2018 | | | 2017 | | | 2016 | |
For a share outstanding for the period: | | | | | | | | | | | | | | | | | | | | |
Net asset value, beginning of period | | | $8.22 | | | | $9.18 | | | | $9.21 | | | | $7.76 | | | | $8.45 | |
| | | | | | | | | | | | | | | | | | | | |
Income from investment operations: | | | | | | | | | | | | | | | | | | | | |
Net investment income (loss) | | | 0.14 | | | | 0.34 | | | | 0.15 | | | | 0.14 | | | | 0.11 | |
Net realized and unrealized gain (loss) on investments | | | (0.42) | | | | (0.99) | | | | 0.04 | | | | 1.43 | | | | (0.54) | |
| | | | | | | | | | | | | | | | | | | | |
Total Income (loss) From Investment Operations | | | (0.28) | | | | (0.65) | | | | 0.19 | | | | 1.57 | | | | (0.43) | |
| | | | | | | | | | | | | | | | | | | | |
Less dividends and/or distributions: | | | | | | | | | | | | | | | | | | | | |
Dividends to shareholders from net investment income | | | (0.17) | | | | (0.08) | | | | (0.22) | | | | (0.12) | | | | (0.07) | |
Distributions to shareholders from net realized gain | | | - | | | | (0.23) | | | | - | | | | - | | | | (0.19) | |
| | | | | | | | | | | | | | | | | | | | |
Total Distributions | | | (0.17) | | | | (0.31) | | | | (0.22) | | | | (0.12) | | | | (0.26) | |
| | | | | | | | | | | | | | | | | | | | |
Redemption fee proceeds1 | | | 0.00 | 2 | | | 0.00 | 2 | | | 0.00 | 2 | | | 0.00 | 2 | | | 0.00 | 2 |
| | | | | | | | | | | | | | | | | | | | |
Net asset value, end of period | | | $7.77 | | | | $8.22 | | | | $9.18 | | | | $9.21 | | | | $7.76 | |
| | | | | | | | | | | | | | | | | | | | |
Total return3 | | | -3.58% | | | | -6.83% | | | | 2.00% | | | | 20.44% | | | | -5.07% | |
Portfolio turnover | | | 98% | | | | 77% | | | | 68% | | | | 73% | | | | 89% | |
Ratios/supplemental data (annualized): | | | | | | | | | | | | | | | | | | | | |
Net assets, end of period (in millions) | | | $21 | | | | $27 | | | | $81 | | | | $85 | | | | $55 | |
Ratio of expenses to average net assets | | | 1.40% | 4,5 | | | 1.43% | 4 | | | 1.47% | | | | 1.52% | 5 | | | 1.53% | 5 |
Ratio of gross expenses to average net assets | | | 1.54% | | | | 1.43% | | | | 1.47% | | | | 1.53% | | | | 1.59% | |
Ratio of net investment income (loss) to average net assets | | | 0.86% | | | | 1.41% | | | | 1.63% | | | | 1.99% | | | | 1.47% | |
1 Based on average shares outstanding.
2 Amount represents less than $0.005 per share.
3 Total return does not reflect sales commissions.
4 Ratio of expenses to average net assets includes transfer agent credits. Excluding transfer agent credits the ratio of expenses to average net assets would have been 1.43% for the year ended July 31, 2019 and 1.41% for the year ended July 31, 2020.
5 Reflects a waiver of fees by the Manager and the Distributor of the Fund.
SEE NOTES TO FINANCIAL STATEMENTS
88
DOMINI IMPACT INTERNATIONAL EQUITY FUND — INSTITUTIONAL SHARES
FINANCIAL HIGHLIGHTS
| | | | | | | | | | | | | | | | | | | | |
| | | Year Ended July 31, | |
| | | 2020 | | | 2019 | | | 2018 | | | 2017 | | | 2016 | |
For a share outstanding for the period: | | | | | | | | | | | | | | | | | | | | |
Net asset value, beginning of period | | | $7.69 | | | | $8.70 | | | | $8.74 | | | | $7.39 | | | | $8.07 | |
| | | | | | | | | | | | | | | | | | | | |
Income from investment operations: | | | | | | | | | | | | | | | | | | | | |
Net investment income (loss) | | | 0.09 | | | | 0.18 | | | | 0.18 | | | | 0.19 | | | | 0.15 | |
Net realized and unrealized gain (loss) on investments | | | (0.30) | | | | (0.78) | | | | 0.05 | | | | 1.32 | | | | (0.54) | |
| | | | | | | | | | | | | | | | | | | | |
Total Income (loss) From Investment Operations | | | (0.21) | | | | (0.60) | | | | 0.23 | | | | 1.51 | | | | (0.39) | |
| | | | | | | | | | | | | | | | | | | | |
Less dividends and/or distributions: | | | | | | | | | | | | | | | | | | | | |
Dividends to shareholders from net investment income | | | (0.25) | | | | (0.18) | | | | (0.27) | | | | (0.16) | | | | (0.10) | |
Distributions to shareholders from net realized gain | | | - | | | | (0.23) | | | | - | | | | - | | | | (0.19) | |
| | | | | | | | | | | | | | | | | | | | |
Total Distributions | | | (0.25) | | | | (0.41) | | | | (0.27) | | | | (0.16) | | | | (0.29) | |
| | | | | | | | | | | | | | | | | | | | |
Redemption fee proceeds1 | | | 0.00 | 2 | | | 0.00 | 2 | | | 0.00 | 2 | | | 0.00 | 2 | | | 0.00 | 2 |
| | | | | | | | | | | | | | | | | | | | |
Net asset value, end of period | | | $7.23 | | | | $7.69 | | | | $8.70 | | | | $8.74 | | | | $7.39 | |
| | | | | | | | | | | | | | | | | | | | |
Total return | | | -3.05% | | | | -6.49% | | | | 2.58% | | | | 20.80% | | | | -4.74% | |
Portfolio turnover | | | 98% | | | | 77% | | | | 68% | | | | 73% | | | | 89% | |
Ratios/supplemental data (annualized): | | | | | | | | | | | | | | | | | | | | |
Net assets, end of period (in millions) | | | $473 | | | | $524 | | | | $580 | | | | $384 | | | | $167 | |
Ratio of expenses to average net assets | | | 0.95% | 3 | | | 1.01% | 3 | | | 1.02% | | | | 1.07% | | | | 1.10% | |
Ratio of gross expenses to average net assets | | | 0.95% | | | | 1.01% | | | | 1.02% | | | | 1.07% | | | | 1.10% | |
Ratio of net investment income (loss) to average net assets | | | 1.33% | | | | 2.30% | | | | 2.22% | | | | 2.82% | | | | 2.22% | |
1 Based on average shares outstanding.
2 Amount represents less than $0.005 per share.
3 Ratio of expenses to average net assets includes transfer agent credits. Excluding transfer agent credits the ratio of expenses to average net assets would have been 1.01% for the year ended July 31, 2019 and 0.95% for the year ended July 31, 2020.
SEE NOTES TO FINANCIAL STATEMENTS
89
DOMINI IMPACT INTERNATIONAL EQUITY FUND — CLASS Y SHARES
FINANCIAL HIGHLIGHTS
| | | | | | | | | | | | |
| | | Year Ended July 31, | | | For the period
July 23, 2018
(commencement of
operations) through
July 31, 2018 | |
| | | 2020 | | | 2019 | |
For a share outstanding for the period: | | | | | | | | | | | | |
Net asset value, beginning of period | | | $7.70 | | | | $8.71 | | | | $8.56 | |
| | | | | | | | | | | | |
Income from investment operations: | | | | | | | | | | | | |
Net investment income (loss) | | | 0.12 | | | | 0.23 | | | | - | |
Net realized and unrealized gain (loss) on investments | | | (0.35) | | | | (0.83) | | | | 0.15 | |
| | | | | | | | | | | | |
Total Income (loss) From Investment Operations | | | (0.23) | | | | (0.60) | | | | 0.15 | |
| | | | | | | | | | | | |
Less dividends and/or distributions: | | | | | | | | | | | | |
Dividends to shareholders from net investment income | | | (0.24) | | | | (0.18) | | | | - | |
Distributions to shareholders from net realized gain | | | - | | | | (0.23) | | | | - | |
| | | | | | | | | | | | |
Total Distributions | | | (0.24) | | | | (0.41) | | | | - | |
| | | | | | | | | | | | |
Redemption fee proceeds | | | - | | | | - | | | | - | |
| | | | | | | | | | | | |
Net asset value, end of period | | | $7.23 | | | | $7.70 | | | | $8.71 | |
| | | | | | | | | | | | |
Total return | | | -3.28% | | | | -6.50% | | | | 1.75% | |
Portfolio turnover | | | 98% | | | | 77% | | | | 68% | |
Ratios/supplemental data (annualized): | | | | | | | | | | | | |
Net assets, end of period (in millions) | | | $174 | | | | $238 | | | | $142 | |
Ratio of expenses to average net assets | | | 1.06% | 1 | | | 1.13% | 1 | | | 1.13% | |
Ratio of expenses to average net assets | | | 1.06% | | | | 1.13% | | | | 1.13% | |
Ratio of net investment income (loss) to average net assets | | | 1.26% | | | | 2.81% | | | | 0.32% | |
1 Ratio of expenses to average net assets includes transfer agent credits. Excluding transfer agent credits the ratio of expenses to average net assets would have been 1.13% for the year ended July 31, 2019 and 1.06% for the period ended July 31, 2020.
SEE NOTES TO FINANCIAL STATEMENTS
90
DOMINI IMPACT EQUITY FUND — INVESTOR SHARES
FINANCIAL HIGHLIGHTS
| | | | | | | | | | | | | | | | | | | | |
| | | Year Ended July 31, | |
| | | 2020 | | | 2019 | | | 2018 | | | 2017^ | | | 2016^ | |
For a share outstanding for the period: | | | | | | | | | | | | | | | | | | | | |
Net asset value, beginning of period | | | $22.48 | | | | $24.18 | | | | $23.18 | ^ | | | $20.76 | | | | $22.70 | |
| | | | | | | | | | | | | | | | | | | | |
Income from investment operations: | | | | | | | | | | | | | | | | | | | | |
Net investment income (loss) | | | 0.15 | 1 | | | 0.18 | | | | 0.27 | 1 | | | 0.21 | 1 | | | 0.45 | |
Net realized and unrealized gain (loss) on investments | | | 4.69 | 1 | | | 0.81 | | | | 2.09 | 1 | | | 2.69 | | | | (1.04) | |
| | | | | | | | | | | | | | | | | | | | |
Total Income (loss) From Investment Operations | | | 4.84 | | | | 0.99 | | | | 2.36 | | | | 2.90 | | | | (0.59) | |
| | | | | | | | | | | | | | | | | | | | |
Less dividends and/or distributions: | | | | | | | | | | | | | | | | | | | | |
Dividends to shareholders from net investment income | | | (0.14) | | | | (0.21) | | | | (0.17) | ^ | | | (0.12) | | | | (0.24) | |
Distributions to shareholders from net realized gain | | | (0.46) | | | | (2.48) | | | | (1.19) | ^ | | | (0.36) | | | | (1.10) | |
Tax return of capital1 | | | - | | | | - | | | | - | | | | - | | | | (0.01) | |
| | | | | | | | | | | | | | | | | | | | |
Total Distributions | | | (0.60) | | | | (2.69) | | | | (1.36) | | | | (0.48) | | | | (1.35) | |
| | | | | | | | | | | | | | | | | | | | |
Redemption fee proceeds1 | | | 0.00 | 2 | | | 0.00 | 2 | | | 0.00 | 2 | | | 0.00 | 2 | | | 0.00 | 2 |
| | | | | | | | | | | | | | | | | | | | |
Net asset value, end of period | | | $26.72 | | | | $22.48 | | | | $24.18 | | | | $23.18 | | | | $20.76 | |
| | | | | | | | | | | | | | | | | | | | |
Total return | | | 21.98% | | | | 6.31% | | | | 10.32% | | | | 14.07% | | | | -2.47% | |
Portfolio turnover | | | 21% | | | | 95% | | | | 78% | | | | 85% | | | | 91% | |
Ratios/supplemental data (annualized): | | | | | | | | | | | | | | | | | | | | |
Net assets, end of period (in millions) | | | $719 | | | | $643 | | | | $669 | | | | $675 | | | | $656 | |
Ratio of expenses to average net assets | | | 1.08% | 3,4 | | | 1.07% | 3,4 | | | 1.10% | | | | 1.14% | | | | 1.14% | |
Ratio of gross expenses to average net assets | | | 1.09% | | | | 1.09% | | | | 1.10% | | | | 1.14% | | | | 1.14% | |
Ratio of net investment income (loss) to average net assets | | | 0.65% | | | | 0.96% | | | | 1.15% | | | | 0.94% | | | | 2.06% | |
1 Based on average shares outstanding.
2 Amount represents less than $0.005 per share.
3 Ratio of expenses to average net assets includes transfer agent credits. Excluding transfer agent credits the ratio of expenses to average net assets would have been 1.07% for the year ended July 31, 2019 and 1.08% for the year ended July 31, 2020.
4 Reflects a waiver of fees by the Manager, the Sponsor and the Distributor of the Fund.
^ All per share amounts and net asset values have been adjusted as a result of the 1.9988601 for 1 share split on January 26, 2018.
SEE NOTES TO FINANCIAL STATEMENTS
91
DOMINI IMPACT EQUITY FUND — CLASS A SHARES
FINANCIAL HIGHLIGHTS
| | | | | | | | | | | | | | | | | | | | |
| | | Year Ended July 31, | |
| | | 2020 | | | 2019 | | | 2018 | | | 2017^ | | | 2016^ | |
For a share outstanding for the period: | | | | | | | | | | | | | | | | | | | | |
Net asset value, beginning of period | | | $22.46 | | | | $24.17 | | | | $33.41 | ^ | | | $34.01 | | | | $48.90 | |
| | | | | | | | | | | | | | | | | | | | |
Income from investment operations: | | | | | | | | | | | | | | | | | | | | |
Net investment income (loss) | | | 0.15 | 1 | | | 0.23 | | | | 0.31 | 1 | | | 0.32 | 1 | | | 1.53 | |
Net realized and unrealized gain (loss) on investments | | | 4.69 | 1 | | | 0.75 | | | | 2.84 | 1 | | | 4.14 | | | | (3.19) | |
| | | | | | | | | | | | | | | | | | | | |
Total Income (loss) From Investment Operations | | | 4.84 | | | | 0.98 | | | | 3.15 | | | | 4.46 | | | | (1.66) | |
| | | | | | | | | | | | | | | | | | | | |
Less dividends and/or distributions: | | | | | | | | | | | | | | | | | | | | |
Dividends to shareholders from net investment income | | | (0.14) | | | | (0.21) | | | | (1.35) | ^ | | | (1.72) | | | | (3.02) | |
Distributions to shareholders from net realized gain | | | (0.46) | | | | (2.48) | | | | (11.04) | ^ | | | (3.34) | | | | (10.21) | |
Tax return of capital1 | | | - | | | | - | | | | - | | | | - | | | | (0.00) | 2 |
| | | | | | | | | | | | | | | | | | | | |
Total Distributions | | | (0.60) | | | | (2.69) | | | | (12.39) | | | | (5.06) | | | | (13.23) | |
| | | | | | | | | | | | | | | | | | | | |
Redemption fee proceeds1 | | | - | | | | 0.00 | 2 | | | - | | | | - | | | | - | |
| | | | | | | | | | | | | | | | | | | | |
Net asset value, end of period | | | $26.70 | | | | $22.46 | | | | $24.17 | | | | $33.41 | | | | $34.01 | |
| | | | | | | | | | | | | | | | | | | | |
Total return3 | | | 22.01% | | | | 6.28% | | | | 10.36% | | | | 13.97% | | | | -2.61% | |
Portfolio turnover | | | 21% | | | | 95% | | | | 78% | | | | 85% | | | | 91% | |
Ratios/supplemental data (annualized): | | | | | | | | | | | | | | | | | | | | |
Net assets, end of period (in millions) | | | $6 | | | | $7 | | | | $7 | | | | $8 | | | | $8 | |
Ratio of expenses to average net assets | | | 1.09% | 4,5 | | | 1.09% | 4,5 | | | 1.12% | 5 | | | 1.16% | 5 | | | 1.18% | 5 |
Ratio of gross expenses to average net assets | | | 1.47% | | | | 1.43% | | | | 1.38% | | | | 1.46% | | | | 1.41% | |
Ratio of net investment income (loss) to average net assets | | | 0.64% | | | | 0.95% | | | | 1.14% | | | | 0.92% | | | | 2.00% | |
1 Based on average shares outstanding.
2 Amount represents less than $0.005 per share.
3 Total return does not reflect sales commissions.
4 Ratio of expenses to average net assets includes transfer agent credits. Excluding transfer agent credits the ratio of expenses to average net assets would have been 1.09% for the year ended July 31, 2019 and 1.09% for the year ended July 31, 2020.
5 Reflects a waiver of fees by the Manager, the Sponsor and the Distributor of the Fund.
^ All per share amounts and net asset values have been adjusted as a result of the 0.2155310 for 1 reverse share split on January 26, 2018.
SEE NOTES TO FINANCIAL STATEMENTS
92
DOMINI IMPACT EQUITY FUND — INSTITUTIONAL SHARES
FINANCIAL HIGHLIGHTS
| | | | | | | | | | | | | | | | | | | | |
| | | Year Ended July 31, | |
| | | 2020 | | | 2019 | | | 2018 | | | 2017 | | | 2016 | |
For a share outstanding for the period: | | | | | | | | | | | | | | | | | | | | |
Net asset value, beginning of period | | | $22.41 | | | | $24.18 | | | | $24.46 | | | | $22.40 | | | | $25.95 | |
| | | | | | | | | | | | | | | | | | | | |
Income from investment operations: | | | | | | | | | | | | | | | | | | | | |
Net investment income (loss) | | | 0.23 | 1 | | | 0.08 | | | | 0.37 | | | | 0.31 | 1 | | | 0.55 | |
Net realized and unrealized gain (loss) on investments | | | 4.67 | 1 | | | 0.98 | | | | 2.17 | | | | 2.87 | | | | (1.20) | |
| | | | | | | | | | | | | | | | | | | | |
Total Income (loss) From Investment Operations | | | 4.90 | | | | 1.06 | | | | 2.54 | | | | 3.18 | | | | (0.65) | |
| | | | | | | | | | | | | | | | | | | | |
Less dividends and/or distributions: | | | | | | | | | | | | | | | | | | | | |
Dividends to shareholders from net investment income | | | (0.26) | | | | (0.35) | | | | (0.44) | | | | (0.40) | | | | (0.70) | |
Distributions to shareholders from net realized gain | | | (0.46) | | | | (2.48) | | | | (2.38) | | | | (0.72) | | | | (2.20) | |
Tax return of capital1 | | | - | | | | - | | | | - | | | | - | | | | (0.00) | 2 |
| | | | | | | | | | | | | | | | | | | | |
Total Distributions | | | (0.72) | | | | (2.83) | | | | (2.82) | | | | (1.12) | | | | (2.90) | |
| | | | | | | | | | | | | | | | | | | | |
Redemption fee proceeds1 | | | 0.00 | 2 | | | 0.00 | 2 | | | 0.00 | 2 | | | 0.00 | 2 | | | 0.00 | 2 |
| | | | | | | | | | | | | | | | | | | | |
Net asset value, end of period | | | $26.59 | | | | $22.41 | | | | $24.18 | | | | $24.46 | | | | $22.40 | |
| | | | | | | | | | | | | | | | | | | | |
Total return | | | 22.43% | | | | 6.69% | | | | 10.68% | | | | 14.51% | | | | -2.14% | |
Portfolio turnover | | | 21% | | | | 95% | | | | 78% | | | | 85% | | | | 91% | |
Ratios/supplemental data (annualized): | | | | | | | | | | | | | | | | | | | | |
Net assets, end of period (in millions) | | | $113 | | | | $99 | | | | $120 | | | | $157 | | | | $205 | |
Ratio of expenses to average net assets | | | 0.74% | 3 | | | 0.74% | 3,4 | | | 0.74% | 4 | | | 0.79% | | | | 0.80% | 4 |
Ratio of gross expenses to average net assets | | | 0.74% | | | | 0.76% | | | | 0.76% | | | | 0.79% | | | | 0.81% | |
Ratio of net investment income (loss) to average net assets | | | 0.99% | | | | 1.31% | | | | 1.52% | | | | 1.31% | | | | 2.40% | |
1 Based on average shares outstanding.
2 Amount represents less than $0.005 per share.
3 Ratio of expenses to average net assets includes transfer agent credits. Excluding transfer agent credits the ratio of expenses to average net assets would have been 0.74% for the year ended July 31, 2019 and 0.74% for the year ended July 31, 2020.
4 Reflects a waiver of fees by the Manager and the Sponsor of the Fund.
SEE NOTES TO FINANCIAL STATEMENTS
93
DOMINI IMPACT EQUITY FUND — CLASS R SHARES
FINANCIAL HIGHLIGHTS
| | | | | | | | | | | | | | | | | | | | |
| | | Year Ended July 31, | |
| | | 2020 | | | 2019 | | | 2018 | | | 2017^ | | | 2016^ | |
For a share outstanding for the period: | | | | | | | | | | | | | | | | | | | | |
Net Asset Value, beginning of period | | | $22.42 | | | | $24.18 | | | | $37.86 | ^ | | | $39.86 | | | | $60.43 | |
| | | | | | | | | | | | | | | | | | | | |
Income from investment operations: | | | | | | | | | | | | | | | | | | | | |
Net investment income (loss) | | | 0.21 | 1 | | | 3.04 | | | | 0.41 | 1 | | | 0.51 | 1 | | | 3.15 | |
Net realized and unrealized gain (loss) on investments | | | 4.68 | 1 | | | (2.00) | | | | 3.21 | 1 | | | 4.69 | | | | (5.08) | |
| | | | | | | | | | | | | | | | | | | | |
Total Income (loss) From Investment Operations | | | 4.89 | | | | 1.04 | | | | 3.62 | | | | 5.20 | | | | (1.93) | |
| | | | | | | | | | | | | | | | | | | | |
Less dividends and/or distributions: | | | | | | | | | | | | | | | | | | | | |
Dividends to shareholders from net investment income | | | (0.23) | | | | (0.32) | | | | (2.00) | ^ | | | (2.57) | | | | (4.50) | |
Distributions to shareholders from net realized gain | | | (0.46) | | | | (2.48) | | | | (15.30) | ^ | | | (4.63) | | | | (14.14) | |
Tax return of capital1 | | | - | | | | - | | | | - | | | | - | | | | (0.00) | 2 |
| | | | | | | | | | | | | | | | | | | | |
Total Distributions | | | (0.69) | | | | (2.80) | | | | (17.30) | | | | (7.20) | | | | (18.64) | |
| | | | | | | | | | | | | | | | | | | | |
Redemption fee proceeds1 | | | 0.00 | 2 | | | 0.00 | 2 | | | 0.00 | 2 | | | 0.00 | 2 | | | 0.00 | 2 |
| | | | | | | | | | | | | | | | | | | | |
Net asset value, end of period | | | $26.62 | | | | $22.42 | | | | $24.18 | | | | $37.86 | | | | $39.86 | |
| | | | | | | | | | | | | | | | | | | | |
Total return | | | 22.34% | | | | 6.62% | | | | 10.71% | | | | 14.20% | | | | -2.22% | |
Portfolio turnover | | | 21% | | | | 95% | | | | 78% | | | | 85% | | | | 91% | |
Ratios/supplemental data (annualized): | | | | | | | | | | | | | | | | | | | | |
Net assets, end of period (in millions) | | | $6 | | | | $20 | | | | $18 | | | | $21 | | | | $44 | |
Ratio of expenses to average net assets | | | 0.79% | 3,4 | | | 0.80% | 3,4 | | | 0.80% | 4 | | | 0.83% | 4 | | | 0.82% | |
Ratio of gross expenses to average net assets | | | 0.94% | | | | 0.88% | | | | 0.84% | | | | 0.85% | | | | 0.82% | |
Ratio of net investment income (loss) to average net assets | | | 0.92% | | | | 1.23% | | | | 1.46% | | | | 1.28% | | | | 2.39% | |
1 Based on average shares outstanding.
2 Amount represents less than $0.005 per share.
3 Ratio of expenses to average net assets includes transfer agent credits. Excluding transfer agent credits the ratio of expenses to average net assets would have been 0.80% for the year ended July 31, 2019 and 0.79% for the year ended July 31, 2020.
4 Reflects a waiver of fees by the Manager and the Sponsor of the Fund.
^ All per share amounts and net asset values have been adjusted as a result of the 0.1555580 for 1 reverse share split on January 26, 2018.
SEE NOTES TO FINANCIAL STATEMENTS
94
DOMINI SUSTAINABLE SOLUTIONS FUND — INVESTOR SHARES
FINANCIAL HIGHLIGHTS
| | | | |
| | | For the Period
April 1, 2020
(commencement of
operations) through
July 31, 2020 | |
For a share outstanding for the period: | | | | |
Net asset value, beginning of period | | | $10.00 | |
| | | | |
Income from investment operations: | | | | |
Net investment income (loss) | | | (0.02) | |
Net realized and unrealized gain (loss) on investments | | | 5.30 | |
| | | | |
Total Income (loss) From Investment Operations | | | 5.28 | |
| | | | |
Less dividends and/or distributions: | | | | |
Dividends to shareholders from net investment income | | | - | |
Distributions to shareholders from net realized gain | | | - | |
| | | | |
Total Distributions | | | - | |
| | | | |
Redemption fee proceeds1 | | | - | |
| | | | |
Net asset value, end of period | | | $15.28 | |
| | | | |
Total return2 | | | 52.80% | |
Portfolio turnover | | | 10% | |
Ratios/supplemental data (annualized): | | | | |
Net assets, end of period (in millions) | | | $7 | |
Ratio of expenses to average net assets | | | 1.37% | 3,4 |
Ratio of gross expenses to average net assets | | | 3.95% | |
Ratio of net investment income (loss) to average net assets | | | (0.94)% | |
1 Based on average shares outstanding.
2 Not annualized for periods less than one year.
3 Ratio of expenses to average net assets includes transfer agent credits. Excluding transfer agent credits the ratio of expenses to average net assets would have been 1.37% for the period ended July 31, 2020.
4 Reflects a waiver of fees by the Manager and the Distributor of the Fund.
SEE NOTES TO FINANCIAL STATEMENTS
95
DOMINI SUSTAINABLE SOLUTIONS FUND — INSTITUTIONAL SHARES
FINANCIAL HIGHLIGHTS
| | | | |
| | | For the Period
April 1, 2020
(commencement of
operations) through
July 31, 2020 | |
For a share outstanding for the period: | | | | |
Net asset value, beginning of period | | | $10.00 | |
| | | | |
| |
Income from investment operations: | | | | |
Net investment income (loss) | | | (0.02) | |
Net realized and unrealized gain (loss) on investments | | | 5.31 | |
| | | | |
Total Income (loss) From Investment Operations | | | 5.29 | |
| | | | |
| |
Less dividends and/or distributions: | | | | |
Dividends to shareholders from net investment income | | | - | |
Distributions to shareholders from net realized gain | | | - | |
| | | | |
Total Distributions | | | - | |
| | | | |
Redemption fee proceeds1 | | | - | |
| | | | |
Net asset value, end of period | | | $15.29 | |
| | | | |
Total return2 | | | 52.90% | |
Portfolio turnover | | | 10% | |
| |
Ratios/supplemental data (annualized): | | | | |
Net assets, end of period (in millions) | | | $12 | |
Ratio of expenses to average net assets | | | 1.12% | 3,4 |
Ratio of gross expenses to average net assets | | | 2.89% | |
Ratio of net investment income (loss) to average net assets | | | (0.61)% | |
1 Based on average shares outstanding.
2 Not annualized for periods less than one year.
3 Ratio of expenses to average net assets includes transfer agent credits. Excluding transfer agent credits the ratio of expenses to average net assets would have been 1.12% for the period ended July 31, 2020.
4 Reflects a waiver of fees by the Manager of the Fund.
SEE NOTES TO FINANCIAL STATEMENTS
96
DOMINI IMPACT INTERNATIONAL EQUITY FUND
DOMINI IMPACT EQUITY FUND
DOMINI SUSTAINABLE SOLUTIONS FUND
NOTES TO FINANCIAL STATEMENTS
July 31, 2020
1. ORGANIZATION AND SIGNIFICANT ACCOUNTING POLICIES
The Domini Investment Trust is a Massachusetts business trust registered under the Investment Company Act of 1940 as an open-end management investment company. The Domini Investment Trust comprises four separate series: Domini Impact International Equity Fund, Domini Impact Equity Fund, Domini Sustainable Solutions Fund and Domini Impact Bond Fund (each the “Fund,” collectively the “Funds”). The financial statements of the Domini Impact Bond Fund are included on page 114 of this report. Each Fund is an investment company and accordingly follows the investment company accounting and reporting guidance of the Financial Accounting Standards Board (the “FASB”) Accounting Standard Codification Topic 946 “Financial Services — Investment Companies”. The Domini Impact International Equity Fund offers Investor shares, Class A shares, Institutional shares and Class Y shares. Class A, Institutional and Class Y shares of the Domini Impact International Equity Fund were not offered prior to November 28, 2008, November 30, 2012, and June 15, 2018 respectively. The Domini Impact Equity Fund offers Investor shares, Class A shares, Institutional shares and Class R shares. Class R shares of the Domini Impact Equity Fund commenced on November 28, 2003. Class A and Institutional shares of the Domini Impact Equity Fund commenced on November 28, 2008. The Domini Sustainable Solutions Fund commenced on April 1, 2020 and offers Investor shares and Institutional shares. The Investor shares, Institutional shares, Class R shares and Class Y shares are sold at their offering price, which is net asset value. The Class A shares are sold with a front-end sales charge (load) of up to 4.75%. The Institutional shares may only be purchased by or for the benefit of investors that meet the minimum investment requirements, and fall within the following categories: endowments, foundations, religious organizations and other nonprofit entities, individuals, retirement plan sponsors, family office clients, certain corporate or similar institutions, or omnibus accounts maintained by financial intermediaries and that are approved by the Fund’s Distributor. Class R shares are generally available only to certain eligible retirement plans and endowments, foundations, religious organizations, and other tax-exempt entities that are approved by the Fund’s Distributor. Class Y shares may only be purchased through omnibus accounts held on the books of the Fund for financial intermediaries that have been approved by the Funds’ distributor. All classes of shares have identical rights and voting privileges with respect to the Fund in general and exclusive voting rights on matters that affect that class alone. Earnings, net assets, and net
97
DOMINI IMPACT INTERNATIONAL EQUITY FUND
DOMINI IMPACT EQUITY FUND
DOMINI SUSTAINABLE SOLUTIONS FUND
NOTES TO FINANCIAL STATEMENTS (continued)
July 31, 2020
asset value per share may differ due to each class having its own expenses, such as transfer and shareholder servicing agent fees and registration fees, directly attributable to that class. Class R, Institutional and Class Y shares are not subject to distribution and service fees.
The preparation of financial statements in conformity with U.S. generally accepted accounting principles requires management to make estimates and assumptions that affect the reported amounts of assets and liabilities and disclosure of contingent liabilities at the date of the financial statements and the reported amounts of revenues and expenses during the reporting period. Actual results could differ from those estimates. The following is a summary of the Funds’ significant accounting policies.
(A) Valuation of Investments. Securities listed or traded on national securities exchanges are valued at the last sale price reported by the security’s primary exchange or, if there have been no sales that day, at the mean of the current bid and ask price that represents the current value of the security. Securities listed on the NASDAQ National Market System are valued using the NASDAQ Official Closing Price (the “NOCP”). If an NOCP is not available for a security listed on the NASDAQ National Market System, the security will be valued at the last sale price or, if there have been no sales that day, at the mean of the current bid and ask price. Securities for which market quotations are not readily available or as a result of an event occurring after the close of the foreign market but before pricing the Funds are valued at fair value as determined in good faith under procedures established by and under the supervision of the Funds’ Board of Trustees. Securities that are primarily traded on foreign exchanges generally are valued at the closing price of such securities on their respective exchanges, except that if the Trusts’ manager or submanager, as applicable, is of the opinion that such price would result in an inappropriate value for a security, including as a result of an occurrence subsequent to the time a value was so established, then the fair value of those securities may be determined by consideration of other factors (including the use of an independent pricing service) by or under the direction of the Board of Trustees or its delegates.
The Funds follow a fair value hierarchy that distinguishes between (a) market participant assumptions developed based on market data obtained from sources independent of the reporting entity (observable inputs) and (b) the Fund’s own assumptions about market participant assumptions developed based on the best
98
DOMINI IMPACT INTERNATIONAL EQUITY FUND
DOMINI IMPACT EQUITY FUND
DOMINI SUSTAINABLE SOLUTIONS FUND
NOTES TO FINANCIAL STATEMENTS (continued)
July 31, 2020
information available in the circumstances (unobservable inputs). These inputs are used in determining the value of the Funds’ investments and are summarized in the following fair value hierarchy:
Level 1 — quoted prices in active markets for identical securities
Level 2 — other significant observable inputs (including quoted prices for similar securities, interest rates, and evaluated quotation obtained from pricing services)
Level 3 — significant unobservable inputs (including the Funds’ own assumptions in determining the fair value of investments)
The inputs or methodology used for valuing securities are not an indication of the risk associated with investing in those securities.
The following is a summary of the inputs used by the Domini Impact International Equity Fund, as of July 31, 2020, in valuing the Fund’s assets carried at fair value:
| | | | | | | | | | | | | | | | |
| | | Level 1 -
Quoted Prices | | | Level 2 -
Other
Significant
Observable
Inputs | | | Level 3 -
Significant
Unobservable
Inputs | | | Total | |
| | | | | | | | | | | | | | | | |
Common Stocks | | | | | | | | | | | | | | | | |
Communication Services | | $ | - | | | $ | 89,482,201 | | | $ | - | | | $ | 89,482,201 | |
Consumer Discretionary | | | 3,056,410 | | | | 97,417,617 | | | | - | | | | 100,474,027 | |
Consumer Staples | | | 7,442,465 | | | | 91,614,253 | | | | - | | | | 99,056,718 | |
Financials | | | - | | | | 167,588,476 | | | | - | | | | 167,588,476 | |
Health Care | | | 4,903,833 | | | | 178,097,327 | | | | - | | | | 183,001,160 | |
Industrials | | | 8,741,606 | | | | 167,795,504 | | | | - | | | | 176,537,110 | |
Information Technology | | | 15,750,810 | | | | 107,972,583 | | | | - | | | | 123,723,393 | |
Materials | | | - | | | | 65,743,741 | | | | - | | | | 65,743,741 | |
Real Estate | | | - | | | | 27,892,136 | | | | - | | | | 27,892,136 | |
Utilities | | | 1,553,527 | | | | 14,630,697 | | | | - | | | | 16,184,224 | |
| | | | | | | | | | | | | | | | |
Total | | $ | 41,448,651 | | | $ | 1,008,234,535 | | | $ | - | | | $ | 1,049,683,186 | |
| | | | | | | | | | | | | | | | |
99
DOMINI IMPACT INTERNATIONAL EQUITY FUND
DOMINI IMPACT EQUITY FUND
DOMINI SUSTAINABLE SOLUTIONS FUND
NOTES TO FINANCIAL STATEMENTS (continued)
July 31, 2020
The following is a summary of the inputs used by the Domini Impact Equity Fund, as of July 31, 2020, in valuing the Fund’s assets carried at fair value:
| | | | | | | | | | | | | | | | |
| | | Level 1 -
Quoted Prices | | | Level 2 -
Other
Significant
Observable
Inputs | | | Level 3 -
Significant
Unobservable
Inputs | | | Total | |
| | | | | | | | | | | | | | | | |
Common Stocks | | | | | | | | | | | | | | | | |
Communication Services | | $ | 88,454,261 | | | $ | - | | | $ | - | | | $ | 88,454,261 | |
Consumer Discretionary | | | 108,859,998 | | | | - | | | | - | | | | 108,859,998 | |
Consumer Staples | | | 52,986,595 | | | | - | | | | - | | | | 52,986,595 | |
Energy | | | 847,438 | | | | - | | | | - | | | | 847,438 | |
Financials | | | 77,490,474 | | | | - | | | | - | | | | 77,490,474 | |
Health Care | | | 127,807,652 | | | | - | | | | - | | | | 127,807,652 | |
Industrials | | | 63,065,940 | | | | - | | | | - | | | | 63,065,940 | |
Information Technology | | | 273,099,931 | | | | - | | | | - | | | | 273,099,931 | |
Materials | | | 16,853,079 | | | | - | | | | - | | | | 16,853,079 | |
Real Estate | | | 26,275,325 | | | | - | | | | - | | | | 26,275,325 | |
Utilities | | | 6,287,598 | | | | - | | | | - | | | | 6,287,598 | |
Rights | | | | | | | | | | | | | | | | |
Health Care | | | 71,975 | | | | - | | | | - | | | | 71,975 | |
| | | | | | | | | | | | | | | | |
Total | | $ | 842,100,266 | | | $ | - | | | $ | - | | | $ | 842,100,266 | |
| | | | | | | | | | | | | | | | |
The following is a summary of the inputs used by the Domini Sustainable Solutions Fund, as of July 31, 2020, in valuing the Fund’s assets carried at fair value:
| | | | | | | | | | | | | | | | |
| | | Level 1 -
Quoted Prices | | | Level 2 -
Other
Significant
Observable
Inputs | | | Level 3 -
Significant
Unobservable
Inputs | | | Total | |
| | | | | | | | | | | | | | | | |
Common Stocks | | | | | | | | | | | | | | | | |
Consumer Discretionary | | $ | 1,070,802 | | | $ | - | | | $ | - | | | $ | 1,070,802 | |
Consumer Staples | | | 545,273 | | | | - | | | | - | | | | 545,273 | |
Financials | | | 818,116 | | | | 977,531 | | | | - | | | | 1,795,647 | |
Health Care | | | 3,132,190 | | | | 1,314,034 | | | | - | | | | 4,446,224 | |
Industrials | | | 2,175,841 | | | | 1,395,023 | | | | - | | | | 3,570,864 | |
Information Technology | | | 6,622,010 | | | | 507,709 | | | | - | | | | 7,129,719 | |
Utilities | | | 292,991 | | | | 258,349 | | | | - | | | | 551,340 | |
| | | | | | | | | | | | | | | | |
Total | | $ | 14,657,223 | | | $ | 4,452,646 | | | $ | - | | | $ | 19,109,869 | |
| | | | | | | | | | | | | | | | |
(B) Foreign Currency Translation. Securities and other assets and liabilities denominated in foreign currencies are translated into U.S. dollar amounts on the date of valuation. Purchases and sales of securities, and income and expense items denominated in foreign currencies, are translated into U.S. dollar amounts on the respective dates of such transactions. Occasionally, events impact the
100
DOMINI IMPACT INTERNATIONAL EQUITY FUND
DOMINI IMPACT EQUITY FUND
DOMINI SUSTAINABLE SOLUTIONS FUND
NOTES TO FINANCIAL STATEMENTS (continued)
July 31, 2020
availability or reliability of foreign exchange rates used to convert the U.S. dollar equivalent value. If such an event occurs, the foreign exchange rate will be valued at fair value using procedures established and approved by the Board of Trustees. The Funds do not separately report the effect of fluctuations in foreign exchange rates from changes in market prices on securities held. Such fluctuations are included with the net realized and unrealized gain or loss from investments. Realized foreign exchange gains or losses arise from sales of foreign currencies, currency gains or losses realized between the trade and settlement dates on securities transactions, and the difference between the recorded amounts of dividends, interest, and foreign withholding taxes and the U.S. dollar equivalent of the amounts actually received or paid. Net unrealized foreign exchange gains and losses arise from changes in fair value of assets and liabilities other than investments in securities held at the end of the reporting period, resulting from changes in exchange rates.
(C) Foreign Currency Contracts. When the Funds purchase or sell foreign securities, they enter into foreign exchange contracts to minimize foreign exchange risk from the trade date to the settlement date of the transactions. A foreign exchange contract is an agreement between two parties to exchange different currencies at an agreed-upon exchange rate on a specified date. As of July 31, 2020, the Domini Impact International Equity Fund had $37,186,676 of open foreign currency spot contracts, the Domini Impact Equity Fund had no open foreign currency spot contracts and the Domini Sustainable Solutions Fund had $12,000 of open foreign currency spot contracts.
(D) Investment Transactions, Investment Income and Dividends to Shareholders. Investment transactions are accounted for on trade date. Realized gains and losses from security transactions are determined on the basis of identified cost. Interest income is recorded on an accrual basis. Dividend income, net of any applicable withholding tax, is recorded on the ex-dividend date or for certain foreign securities, when the information becomes available to the Funds. The Funds earn income daily, net of Fund expenses. Dividends to shareholders of the Domini Impact International Equity Fund and the Domini Sustainable Solutions Fund are usually declared and paid semiannually from net investment income. Dividends to shareholders of the Domini Impact Equity Fund are usually declared and paid quarterly from net investment income. Distributions to shareholders of realized capital gains, if any, are made annually. Distributions are determined in conformity with income tax regulations, which may differ from generally accepted accounting principles. Reclassifications have been made to the Funds’
101
DOMINI IMPACT INTERNATIONAL EQUITY FUND
DOMINI IMPACT EQUITY FUND
DOMINI SUSTAINABLE SOLUTIONS FUND
NOTES TO FINANCIAL STATEMENTS (continued)
July 31, 2020
components of net assets to reflect income and gains available for distribution (or available capital loss carryovers, as applicable) under income tax regulations.
(E) Federal Taxes. Each Fund’s policy is to comply with the provisions of the Internal Revenue Code applicable to regulated investment companies and to distribute substantially all of its taxable income, including net realized gains, if any, within the prescribed time periods. Accordingly, no provision for federal income or excise tax is deemed necessary. As of July 31, 2020, tax years 2017 through 2020 remain subject to examination by the Funds’ major tax jurisdictions, which include the United States of America, the Commonwealth of Massachusetts, and New York State.
(F) Redemption Fees. Redemptions and exchanges of Fund shares held less than 30 days may be subject to the Funds’ redemption fee, which is 2% of the amount redeemed. The fee is imposed to offset transaction costs and other expenses associated with short-term investing. The fee may be waived in certain circumstances at the discretion of the Funds. Such fees are retained by the Funds and are recorded as an adjustment to paid-in capital.
(G) Other. Income, expenses (other than those attributable to a specific class), gains, and losses are allocated on a daily basis to each class of shares based upon the relative proportion of net assets represented by such class. Operating expenses directly attributable to a specific class are charged against the operations of that class.
(H) Transfer Agent Credits. Per the arrangement with the Funds’ former transfer agent, BNY Mellon Investment Servicing (U.S.) Inc., the Funds have arrangements whereby they may receive earnings credits when positive cash balances are maintained, which are used to offset transfer agency fees. For financial reporting purposes, the Funds include earnings credits as an expense offset in the Statement of Operations. For the year ended July 31, 2020, Transfer agency fees of the Funds, under these arrangements, were reduced as follows:
| | | | |
Domini Impact International Equity Fund Investor Shares | | $ | 1,333 | |
Domini Impact International Equity Fund Class A Shares | | | 226 | |
Domini Impact International Equity Fund Institutional Shares | | | 22 | |
Domini Impact International Equity Fund Class Y Shares | | | 2 | |
Domini Impact Equity Fund Investor Shares | | | 1,876 | |
Domini Impact Equity Fund Class A Shares | | | 17 | |
Domini Impact Equity Fund Institutional Shares | | | 5 | |
Domini Impact Equity Fund Class R Shares | | | 8 | |
Domini Sustainable Solutions Fund Investor Class | | | 2 | |
Domini Sustainable Solutions Fund Institutional Class | | | 13 | |
102
DOMINI IMPACT INTERNATIONAL EQUITY FUND
DOMINI IMPACT EQUITY FUND
DOMINI SUSTAINABLE SOLUTIONS FUND
NOTES TO FINANCIAL STATEMENTS (continued)
July 31, 2020
(I) Indemnification. The Funds’ organizational documents provide current and former trustees and officers with a limited indemnification against liabilities arising in connection with the performance of their duties to the Funds. In the normal course of business, the Funds may also enter into contracts that provide general indemnifications. The Funds’ maximum exposure under these arrangements is unknown as this would be dependent on future claims that may be made against the Funds. The risk of material loss from such claims is considered remote.
2. TRANSACTIONS WITH AFFILIATES
(A) Manager/Sponsor. The Funds have retained Domini Impact Investments LLC (Domini) to serve as investment manager and administrator. Domini is registered as an investment adviser under the Investment Advisers Act of 1940. The services provided by Domini consist of investment supervisory services, overall operational support, and administrative services. The administrative services include the provision of general office facilities and supervising the overall administration of the Funds. For its services under the Management Agreements, Domini receives from each Fund a fee accrued daily and paid monthly at the annual rate below of the respective Funds’ average daily net assets before any fee waivers:
| | |
| Domini Impact International Equity Fund | | 0.97% of the first $250 million of net assets managed, |
| | 0.92% of the next $250 million of net assets managed, and |
| | 0.855% of the next $500 million of net assets managed |
| | 0.83% of net assets managed in excess of $1 billion |
| | |
| Domini Impact Equity Fund | | 0.20% of the first $2 billion of net assets managed, |
| | 0.19% of the next $1 billion of net assets managed, and |
| | 0.18% of net assets managed in excess of $3 billion |
| | |
| Domini Sustainable Solutions Fund | | 0.85% of the first $500 million of net assets managed, |
| | 0.83% of the next $500 million of net assets managed, and, |
| | 0.80% of net assets managed in excess of $1 billion |
Pursuant to a Sponsorship Agreement (with respect to the Domini Impact Equity Fund) Domini provides the Fund with the administrative personnel and services necessary to operate the Fund. In addition to general administrative services and facilities for the Fund similar to those provided by Domini under the Management Agreement, Domini answers questions from the general public and the media regarding the securities holdings of the Fund. For these services
103
DOMINI IMPACT INTERNATIONAL EQUITY FUND
DOMINI IMPACT EQUITY FUND
DOMINI SUSTAINABLE SOLUTIONS FUND
NOTES TO FINANCIAL STATEMENTS (continued)
July 31, 2020
and facilities, Domini receives fees accrued daily and paid monthly from the Fund at the annual rate below of the respective Fund’s average daily net assets before any fee waivers:
| | |
| Domini Impact Equity Fund | | 0.45% of the first $2 billion of net assets managed, |
| | 0.44% of the next $1 billion of net assets managed, and |
| | 0.43% of net assets managed in excess of $3 billion |
Domini has contractually agreed to reduce its fees and/or reimburse certain ordinary operating expenses of the Funds (excluding brokerage fees and commissions, interest taxes, and other extraordinary expenses) until November 30, 2020, absent an earlier modification as mutually agreed to by the Adviser and Board of Trustees which oversees the Funds, in order to limit the annual operating expenses of each share class, net of applicable waivers and reimbursements, as follows:
| | |
| |
| Domini Impact International Equity Fund – Class A shares | | 1.43% |
| |
| Domini Impact International Equity Fund – Class Y shares | | 1.15% |
| |
| Domini Impact Equity Fund – Investor shares | | 1.09% |
| |
| Domini Impact Equity Fund – Class A shares | | 1.09% |
| |
| Domini Impact Equity Fund – Institutional shares | | 0.74% |
| |
| Domini Impact Equity Fund – Class R shares | | 0.80% |
Domini has contractually agreed to reduce its fees and/or reimburse certain ordinary operating expenses of the Domini Sustainable Solutions Fund (excluding brokerage fees and commissions, interest taxes, and other extraordinary expenses) until November 30, 2021, absent an earlier modification as mutually agreed to by the Adviser and Board of Trustees which oversees the Fund, in order to limit the annual operating expenses of each share class, net of applicable waivers and reimbursements, as follows:
| | |
| |
| Domini Sustainable Solutions Fund – Investor shares* | | 1.40% |
| |
| Domini Sustainable Solutions Fund – Institutional shares* | | 1.15% |
* Domini Sustainable Solutions Fund commenced operations on April 1, 2020.
For the year ended July 31, 2020, Domini waived fees and reimbursed expenses as follows:
| | | | | | | | |
| | | FEES WAIVED | | | EXPENSES REIMBURSED | |
| | | | | | | | |
Domini Impact International Equity Fund | | $ | - | | | $ | 84,746 | |
Domini Impact Equity Fund | | | - | | | | 57,857 | |
Domini Sustainable Solutions Fund | | | - | | | | 79,134 | |
104
DOMINI IMPACT INTERNATIONAL EQUITY FUND
DOMINI IMPACT EQUITY FUND
DOMINI SUSTAINABLE SOLUTIONS FUND
NOTES TO FINANCIAL STATEMENTS (continued)
July 31, 2020
Fees waived and/or expenses reimbursed under the Expense Limitation Agreement are only recoverable by Domini and/or its affiliates in the current fiscal year to the extent actual Fund expenses are less than the contractual expense cap during such year.
As of July 31, 2020, Domini owned less than 1% of any class of the outstanding shares of each Fund.
(B) Submanager. Wellington Management Company LLP (Wellington), a Delaware limited liability partnership, provides investment submanagement services to the Domini Impact International Equity Fund on a day-to-day basis pursuant to a Submanagement Agreement with Domini. SSGA Funds Management, Inc. (“SSGA”) provides investment submanagement services to the Domini Impact Equity Fund and the Domini Sustainable Solutions Fund on a day-to-day basis pursuant to a submanagement Agreement with Domini.
(C) Distributor. The Board of Trustees of the Funds has adopted a Distribution Plan with respect to the Funds’ Investor shares and Class A shares in accordance with Rule 12b-1 under the Act. DSIL Investment Services LLC, a wholly owned subsidiary of Domini (DSIL), acts as agent of the Funds in connection with the offering of Investor shares of the Funds pursuant to a Distribution Agreement. Under the Distribution Plan, the Funds pay expenses incurred in connection with the sale of Investor shares and Class A shares and pay DSIL a distribution fee at an aggregate annual rate not to exceed 0.25% of the average daily net assets representing the Investor shares and Class A shares. For the year ended July 31, 2020, fees waived were as follows:
| | | | |
| | | FEES WAIVED | |
Domini Impact International Equity Fund Investor Shares | | $ | - | |
Domini Impact International Equity Fund Class A Shares | | | 26,529 | |
Domini Impact Equity Fund Investor Shares | | | - | |
Domini Impact Equity Fund Class A Shares | | | 15,033 | |
Domini Sustainable Solutions Fund Investor Class | | | 2,796 | |
DSIL, the Funds’ Distributor, has received commissions related to the sales of fund shares. For the year ended July 31, 2020, DSIL received $2,713, and $2,033 from the Domini Impact International Equity Fund Class A Shares, and the Domini Impact Equity Fund Class A shares, respectively.
105
DOMINI IMPACT INTERNATIONAL EQUITY FUND
DOMINI IMPACT EQUITY FUND
DOMINI SUSTAINABLE SOLUTIONS FUND
NOTES TO FINANCIAL STATEMENTS (continued)
July 31, 2020
(D) Shareholder Service Agent. The Trust has retained Domini to provide certain shareholder services with respect to the Domini Impact Equity Fund, Domini Impact International Equity Fund, and Domini Sustainable Solutions Fund and their shareholders, which services were previously provided by the former transfer agent for the funds or another fulfillment and mail service provider and are supplemental to services currently provided by Ultimus Fund Solutions, LLC (“Ultimus”) as transfer agent to the Funds, pursuant to a master services agreement between each Fund and Ultimus. For these services, Domini receives fees from each Fund paid monthly at an annual rate of $4.00 per active account. For the year ended July 31, 2020, there were no fees waived.
(E) Trustees and Officers. Each of the Independent Trustees received an annual retainer for serving as a Trustee of the Trust of $28,000. The Lead Independent Trustee and Chair of the Audit Committee receive an additional chairperson fee of $5,000. Each Independent Trustee also receives $2,000 for attendance at each meeting of the Board of the Trust (reduced to $1,000 in the event that a Trustee participates at an in-person meeting by telephone). In addition, each Trustee receives reimbursement for reasonable expenses incurred in attending meetings. These expenses are allocated on a pro-rata basis to each shares class of a Fund according to their respective net assets.
As of July 31, 2020, all Trustees and officers of the Trust as a group owned less than 1% of each Fund’s outstanding shares.
3. INVESTMENT TRANSACTIONS
For the year ended July 31, 2020, cost of purchase and proceeds from sales of investments other than short-term obligations were as follows:
| | | | | | | | |
| | | PURCHASE | | | SALES | |
Domini Impact International Equity Fund | | $ | 1,071,663,998 | | | $ | 1,175,298,388 | |
Domini Impact Equity Fund | | | 163,037,499 | | | | 243,296,345 | |
Domini Sustainable Solutions Fund | | | 15,828,942 | | | | 1,421,034 | |
106
DOMINI IMPACT INTERNATIONAL EQUITY FUND
DOMINI IMPACT EQUITY FUND
DOMINI SUSTAINABLE SOLUTIONS FUND
NOTES TO FINANCIAL STATEMENTS (continued)
July 31, 2020
4. SHARES OF BENEFICIAL INTEREST
At July 31, 2020, there was an unlimited number of shares authorized ($0.00001 par value). Transactions in the Funds’ shares were as follows:
| | | | | | | | | | | | | | | | |
| | | Year Ended July 31, | |
| | | 2020 | | | 2019 | |
| | | Shares | | | Amount | | | Shares | | | Amount | |
| | | |
Domini Impact International
Equity Fund | | | | | | | | | | | | | |
| | | | |
Investor Shares | | | | | | | | | | | | | | | | |
Shares sold | | | 19,114,068 | | | $ | 136,900,825 | | | | 24,303,904 | | | $ | 190,673,932 | |
Shares issued in reinvestment of dividends and distributions | | | 1,249,596 | | | | 10,096,732 | | | | 3,091,753 | | | | 22,137,191 | |
Shares redeemed | | | (21,653,741) | | | | (157,553,525) | | | | (41,786,713) | | | | (323,770,731) | |
Redemption fees | | | - | | | | 7,071 | | | | - | | | | 805 | |
| | | | | | | | | | | | | | | | |
Net decrease | | | (1,290,077) | | | $ | (10,548,897) | | | | (14,391,056) | | | $ | (110,958,803) | |
| | | | | | | | | | | | | | | | |
| | | | |
Class A Shares | | | | | | | | | | | | | | | | |
Shares sold | | | 360,128 | | | $ | 2,867,073 | | | | 967,602 | | | $ | 8,251,715 | |
Shares issued in reinvestment of dividends and distributions | | | 55,690 | | | | 480,601 | | | | 177,655 | | | | 1,348,666 | |
Shares redeemed | | | (1,023,316) | | | | (8,008,184) | | | | (6,684,078) | | | | (53,663,751) | |
Redemption fees | | | - | | | | 670 | | | | - | | | | 124 | |
| | | | | | | | | | | | | | | | |
Net decrease | | | (607,498) | | | $ | (4,659,840) | | | | (5,538,821) | | | $ | (44,063,246) | |
| | | | | | | | | | | | | | | | |
| | | | |
Institutional Shares | | | | | | | | | | | | | | | | |
Shares sold | | | 22,615,758 | | | $ | 158,744,158 | | | | 33,570,307 | | | $ | 259,151,456 | |
Shares issued in reinvestment of dividends and distributions | | | 1,525,183 | | | | 12,201,461 | | | | 3,069,246 | | | | 21,899,374 | |
Shares redeemed | | | (26,751,604) | | | | (187,596,632) | | | | (35,175,817) | | | | (270,160,153) | |
Redemption fees | | | - | | | | 5,792 | | | | - | | | | 4,273 | |
| | | | | | | | | | | | | | | | |
Net decrease (increase) | | | (2,610,663) | | | $ | (16,645,221) | | | | 1,463,736 | | | $ | 10,894,950 | |
| | | | | | | | | | | | | | | | |
| | | | |
Class Y Shares | | | | | | | | | | | | | | | | |
Shares sold | | | 14,391,149 | | | $ | 104,052,493 | | | | 28,384,340 | | | $ | 218,347,206 | |
Shares issued in reinvestment of dividends and distributions | | | 581,550 | | | | 4,664,034 | | | | 89,854 | | | | 687,342 | |
Shares redeemed | | | (21,762,865) | | | | (160,703,454) | | | | (13,816,929) | | | | (105,876,713) | |
Redemption fees | | | - | | | | - | | | | - | | | | - | |
| | | | | | | | | | | | | | | | |
Net decrease (increase) | | | (6,790,166) | | | $ | (51,986,927) | | | | 14,657,265 | | | $ | 113,157,835 | |
| | | | | | | | | | | | | | | | |
107
DOMINI IMPACT INTERNATIONAL EQUITY FUND
DOMINI IMPACT EQUITY FUND
DOMINI SUSTAINABLE SOLUTIONS FUND
NOTES TO FINANCIAL STATEMENTS (continued)
July 31, 2020
| | | | | | | | | | | | | | | | |
| | | Year Ended July 31, | |
| | | 2020 | | | 2019 | |
| | | Shares | | | Amount | | | Shares | | | Amount | |
| | | | |
Total | | | | | | | | | | | | | | | | |
Shares sold | | | 56,481,103 | | | $ | 402,564,549 | | | | 87,226,153 | | | $ | 676,424,309 | |
Shares issued in reinvestment of dividends and distributions | | | 3,412,019 | | | | 27,442,828 | | | | 6,428,508 | | | | 46,072,573 | |
Shares redeemed | | | (71,191,526) | | | | (513,861,795) | | | | (97,463,537) | | | | (753,471,348) | |
Redemption fees | | | - | | | | 13,533 | | | | - | | | | 5,202 | |
| | | | | | | | | | | | | | | | |
Net decrease | | | (11,298,404) | | | $ | (83,840,885) | | | | (3,808,876) | | | $ | (30,969,264) | |
| | | | | | | | | | | | | | | | |
| | | | |
Domini Impact Equity Fund | | | | | | | | | | | | | | | | |
| | | | |
Investor Shares | | | | | | | | | | | | | | | | |
Shares sold | | | 862,267 | | | $ | 20,063,206 | | | | 879,355 | | | $ | 19,126,285 | |
Shares issued in reinvestment of dividends and distributions | | | 706,693 | | | | 16,220,552 | | | | 3,661,035 | | | | 69,217,851 | |
Shares redeemed | | | (3,276,885) | | | | (76,191,366) | | | | (3,591,902) | | | | (78,754,646) | |
Redemption fees | | | - | | | | 6,010 | | | | - | | | | 445 | |
| | | | | | | | | | | | | | | | |
Net decrease (increase) | | | (1,707,925) | | | $ | (39,901,598) | | | | 948,488 | | | $ | 9,589,935 | |
| | | | | | | | | | | | | | | | |
| | | | |
Class A Shares | | | | | | | | | | | | | | | | |
Shares sold | | | 20,280 | | | $ | 459,657 | | | | 42,283 | | | $ | 898,425 | |
Shares issued in reinvestment of dividends and distributions | | | 6,252 | | | | 144,278 | | | | 31,521 | | | | 597,049 | |
Shares redeemed | | | (93,996) | | | | (2,151,604) | | | | (72,624) | | | | (1,633,260) | |
Redemption fees | | | - | | | | - | | | | - | | | | 681 | |
| | | | | | | | | | | | | | | | |
Net decrease (increase) | | | (67,464) | | | $ | (1,547,669) | | | | 1,180 | | | $ | (137,105) | |
| | | | | | | | | | | | | | | | |
| | | | |
Institutional Shares | | | | | | | | | | | | | | | | |
Shares sold | | | 397,105 | | | $ | 9,215,561 | | | | 352,336 | | | $ | 7,669,099 | |
Shares issued in reinvestment of dividends and distributions | | | 97,693 | | | | 2,238,525 | | | | 555,983 | | | | 10,479,770 | |
Shares redeemed | | | (662,359) | | | | (15,394,066) | | | | (1,475,974) | | | | (31,469,527) | |
Redemption fees | | | - | | | | 528 | | | | - | | | | 119 | |
| | | | | | | | | | | | | | | | |
Net decrease | | | (167,561) | | | $ | (3,939,452) | | | | (567,655) | | | $ | (13,320,539) | |
| | | | | | | | | | | | | | | | |
108
DOMINI IMPACT INTERNATIONAL EQUITY FUND
DOMINI IMPACT EQUITY FUND
DOMINI SUSTAINABLE SOLUTIONS FUND
NOTES TO FINANCIAL STATEMENTS (continued)
July 31, 2020
| | | | | | | | | | | | | | | | |
| | | Year Ended July 31, | |
| | | 2020 | | | 2019 | |
| | | Shares | | | Amount | | | Shares | | | Amount | |
| | | | |
Class R Shares | | | | | | | | | | | | | | | | |
Shares sold | | | 106,860 | | | $ | 2,430,212 | | | | 172,370 | | | $ | 3,837,323 | |
Shares issued in reinvestment of dividends and distributions | | | 17,365 | | | | 402,524 | | | | 110,110 | | | | 2,079,468 | |
Shares redeemed | | | (771,266) | | | | (18,703,344) | | | | (154,772) | | | | (3,285,568) | |
Redemption fees | | | - | | | | 559 | | | | - | | | | 5 | |
| | | | | | | | | | | | | | | | |
Net decrease (increase) | | | (647,041) | | | $ | (15,870,049) | | | | 127,708 | | | $ | 2,631,228 | |
| | | | | | | | | | | | | | | | |
| | | | |
Total | | | | | | | | | | | | | | | | |
Shares sold | | | 1,386,512 | | | $ | 32,168,636 | | | | 1,446,344 | | | $ | 31,531,132 | |
Shares issued in reinvestment of dividends and distributions | | | 828,003 | | | | 19,005,879 | | | | 4,358,649 | | | | 82,374,138 | |
Shares redeemed | | | (4,804,506) | | | | (112,440,380) | | | | (5,295,272) | | | | (115,143,001) | |
Redemption fees | | | - | | | | 7,097 | | | | - | | | | 1,250 | |
| | | | | | | | | | | | | | | | |
Net decrease (increase) | | | (2,589,991) | | | $ | (61,258,768) | | | | 509,721 | | | $ | (1,236,481) | |
| | | | | | | | | | | | | | | | |
| | | | | | | | |
| | | For the Period
April 1, 2020
(commencement of
operations) through
July 31, 2020 | |
| | | Shares | | | Amount | |
| | | | | | | | |
| | |
Domini Sustainable Solutions Fund | | | | | | | | |
| | |
Investor Class | | | | | | | | |
Shares sold | | | 481,421 | | | $ | 6,135,189 | |
Shares issued in reinvestment of dividends and distributions | | | - | | | | - | |
Shares redeemed | | | (3,851) | | | | (57,181) | |
Redemption fees | | | - | | | | - | |
| | | | | | | | |
Net increase | | | 477,570 | | | $ | 6,078,008 | |
| | | | | | | | |
| | |
Institutional Class | | | | | | | | |
Shares sold | | | 852,805 | | | $ | 9,586,139 | |
Shares issued in reinvestment of dividends and distributions | | | - | | | | - | |
Shares redeemed | | | (37,994) | | | | (583,965) | |
Redemption fees | | | - | | | | - | |
| | | | | | | | |
Net increase | | | 814,811 | | | $ | 9,002,174 | |
| | | | | | | | |
| | |
Total | | | | | | | | |
Shares sold | | | 1,334,226 | | | $ | 15,721,328 | |
Shares issued in reinvestment of dividends and distributions | | | - | | | | - | |
Shares redeemed | | | (41,845) | | | | (641,146) | |
Redemption fees | | | - | | | | - | |
| | | | | | | | |
Net increase | | | 1,292,381 | | | $ | 15,080,182 | |
| | | | | | | | |
109
DOMINI IMPACT INTERNATIONAL EQUITY FUND
DOMINI IMPACT EQUITY FUND
DOMINI SUSTAINABLE SOLUTIONS FUND
NOTES TO FINANCIAL STATEMENTS (continued)
July 31, 2020
5. FEDERAL TAX STATUS
The tax basis of the components of net assets for the Funds at July 31, 2020, are as follows:
| | | | | | | | | | | | |
| | | Domini Impact
International
Equity Fund | | | Domini Impact
Equity Fund | | | Domini
Sustainable
Solutions Fund | |
| | | | | | | | | | | | |
Undistributed Ordinary Income | | $ | 11,006,806 | | | $ | 5,577,710 | | | $ | 239,292 | |
Undistributed capital gains | | | - | | | | 7,473,177 | | | | - | |
Unrealized appreciation/(depreciation) | | | 64,416,039 | | | | 268,544,900 | | | | 4,438,463 | |
Capital losses, other losses and other temporary differences | | | (184,861,278) | | | | - | | | | - | |
| | | | | | | | | | | | |
Distributable net earnings/(deficit) | | $ | (109,438,433) | | | $ | 281,595,787 | | | $ | 4,677,755 | |
| | | | | | | | | | | | |
For the year ended July 31, 2020, the Funds made the following reclassification to the components of net assets to align financial reporting with tax reporting:
| | | | | | | | | | | | |
| | | Domini Impact
International
Equity Fund | | | Domini Impact
Equity Fund | | | Domini
Sustainable
Solutions Fund | |
| | | | | | | | | | | | |
Paid-in Capital | | $ | 573 | | | $ | - | | | $ | - | |
Distributable Earnings | | | (573) | | | | - | | | | - | |
Carryforwards of losses from previous taxable years do not expire and retain their character as either short-term or long-term capital losses. As of July 31, 2020, the Domini Impact International Equity Fund had a short-term capital loss carryover of $110,979,256 and long-term capital loss carryover of $73,882,022.
For federal income tax purposes, dividends paid were characterized as follows:
| | | | | | | | | | | | | | | | | | | | |
| | | Domini Impact
International
Equity Fund | | | Domini Impact
Equity Fund | | | Domini
Sustainable
Solutions Fund | |
| | | Year Ended July 31, | | | Year Ended July 31, | | | For the Period
April 1, 2020
(commencement of
operations) through
July 31, | |
| | | 2020 | | | 2019 | | | 2020 | | | 2019 | | | 2020 | |
| | | | | | | | | | | | | | | | | | | | |
| | | | | | | | | | | | | | | | | | | | |
Ordinary income | | $ | 34,293,339 | | | $ | 25,106,722 | | | $ | 4,993,996 | | | $ | 21,310,037 | | | $ | - | |
Long-term capital gain | | | - | | | | 36,772,373 | | | | 15,320,008 | | | | 66,953,629 | | | | - | |
| | | | | | | | | | | | | | | | | | | | |
Total | | $ | 34,293,339 | | | $ | 61,879,095 | | | $ | 20,314,004 | | | $ | 88,263,666 | | | $ | - | |
| | | | | | | | | | | | | | | | | | | | |
110
DOMINI IMPACT INTERNATIONAL EQUITY FUND
DOMINI IMPACT EQUITY FUND
DOMINI SUSTAINABLE SOLUTIONS FUND
NOTES TO FINANCIAL STATEMENTS (continued)
July 31, 2020
The Funds are subject to the provisions of Accounting Standards Codification ASC 740 Income Taxes (ASC 740). ASC 740 sets forth a minimum threshold for financial statement recognition of the benefit of a tax position taken or expected to be taken in a tax return. The Funds did not have a liability to record for any unrecognized tax benefits in the accompanying financial statements. No provision has been made for taxes on income, capital gains or unrealized appreciation on securities held or for excise tax on income and capital gains.
6. OTHER RISKS
The Funds’ risks include, but are not limited to, some or all of the risks discussed below:
Market Risk: The market values of securities or other assets will fluctuate, sometimes sharply and unpredictably, due to changes in general market conditions, overall economic trends or events, governmental actions or intervention, market disruptions caused by trade disputes or other factors, political developments, recessions, the spread of infectious illness or other public health issues, investor sentiment and other factors that may or may not be related to the issuer of the security or other asset. If the market values of the securities or other assets held by the Funds fall, including a complete loss on any individual security, the value of your investment will go down. Economies and financial markets throughout the world are increasingly interconnected. Economic, financial or political events, trading or tariff arrangements, terrorism, natural disasters and other circumstances in one country or region could have profound impacts on global economies or markets. As a result, whether or not the Funds invests in securities of issuers located in or with significant exposure to the countries directly affected, the value and liquidity of the Funds’ investments may be negatively affected.
Recent Events Risk: The respiratory illness COVID-19 caused by a novel coronavirus has resulted in a global pandemic and major disruption to economies and markets around the world, including the United States. Global financial markets have experienced extreme volatility and severe losses, and trading in many instruments has been disrupted. Liquidity for many instruments has been greatly reduced for periods of time. Some interest rates are very low and in some cases yields are negative. Some sectors of the economy and individual issuers have experienced particularly large losses. Some sectors of the economy and individual issuers have experienced particularly large losses. These
111
DOMINI IMPACT INTERNATIONAL EQUITY FUND
DOMINI IMPACT EQUITY FUND
DOMINI SUSTAINABLE SOLUTIONS FUND
NOTES TO FINANCIAL STATEMENTS (continued)
July 31, 2020
circumstances may continue for an extended period of time and may adversely affect the value and/or liquidity of the Fund’s investments. The ultimate economic fallout from the pandemic, and the long-term impact on economies, markets, industries and individual issuers, are not known. Governments and central banks, including the Federal Reserve in the U.S., have taken extraordinary and unprecedented actions to support national economies and the financial markets. These actions have resulted in significant expansion of public debt, including in the U.S. The impact of these measures, and whether they will be effective to mitigate the economic and market disruption, may not be known for some time. The consequences of high public debt, including its future impact on the economy and securities markets, likewise may not be known for some time.
112
Report of Independent Registered Public Accounting Firm
To the Shareholders of Domini Impact Bond Fund and Board of Trustees Domini Investment Trust:
Opinion on the Financial Statements
We have audited the accompanying statement of assets and liabilities of Domini Impact Bond Fund (the Fund), a Fund within the series of the Domini Investment Trust, including the portfolio of investments, as of July 31, 2020, the related statement of operations for the year then ended, the statements of changes in net assets for each of the years in the two-year period then ended, and the related notes (collectively, the financial statements) and the financial highlights for each of the years in the five-year period then ended. In our opinion, the financial statements and financial highlights present fairly, in all material respects, the financial position of the Fund as of July 31, 2020, the results of its operations for the year then ended, the changes in its net assets for each of the years in the two-year period then ended, and the financial highlights for each of the years in the five-year period then ended, in conformity with U.S. generally accepted accounting principles.
Basis for Opinion
These financial statements and financial highlights are the responsibility of the Fund’s management. Our responsibility is to express an opinion on these financial statements and financial highlights based on our audits. We are a public accounting firm registered with the Public Company Accounting Oversight Board (United States) (PCAOB) and are required to be independent with respect to the Company in accordance with the U.S. federal securities laws and the applicable rules and regulations of the Securities and Exchange Commission and the PCAOB.
We conducted our audits in accordance with the standards of the PCAOB. Those standards require that we plan and perform the audit to obtain reasonable assurance about whether the financial statements and financial highlights are free of material misstatement, whether due to error or fraud. Our audits included performing procedures to assess the risks of material misstatement of the financial statements and financial highlights, whether due to error or fraud, and performing procedures that respond to those risks. Such procedures included examining, on a test basis, evidence regarding the amounts and disclosures in the financial statements and financial highlights. Such procedures also included confirmation of securities owned as of July 31, 2020, by correspondence with custodians and brokers, or by other appropriate audit procedures. Our audits also included evaluating the accounting principles used and significant estimates made by management, as well as evaluating the overall presentation of the financial statements and financial highlights. We believe that our audits provide a reasonable basis for our opinion.

We have served as the auditor of one or more Domini investment companies since 1993.
Boston, Massachusetts
September 28, 2020
113
DOMINI IMPACT BOND FUND
STATEMENT OF ASSETS AND LIABILITIES
July 31, 2020
| | | | |
ASSETS | | | | |
Investments, at value (cost $217,889,090) | | $ | 231,093,194 | |
Cash | | | 22,261,201 | |
Foreign currency, at value (cost $16,599) | | | 17,113 | |
Receivable for securities sold | | | 35,953,823 | |
Interest receivable | | | 1,023,163 | |
Collateral on certain derivative contracts | | | 980,320 | |
Receivable for variation margin swaps | | | 276,076 | |
Receivable for capital shares | | | 142,098 | |
Cash held at other banks (cost $755,209) | | | 756,091 | |
| | | | |
Total assets | | | 292,503,079 | |
| | | | |
LIABILITIES | | | | |
Payable for securities purchased | | | 101,214,449 | |
Payable for capital shares | | | 132,637 | |
Payable for variation margin swaps | | | 639,692 | |
Cash due to broker (cost $37,045) | | | 37,047 | |
Management fee payable | | | 90,360 | |
Distribution fee payable | | | 17,555 | |
Other accrued expenses | | | 50,573 | |
Dividend payable | | | 39,948 | |
Payable for variation margin futures | | | 78,755 | |
Premium received swap contracts | | | 183,995 | |
Unrealized depreciation on forward currency contracts | | | 100,593 | |
| | | | |
Total liabilities | | | 102,585,604 | |
| | | | |
NET ASSETS | | $ | 189,917,475 | |
| | | | |
NET ASSETS CONSISTS OF | | | | |
Paid-in Capital | | $ | 171,083,670 | |
Total distributable earnings (loss) | | | 18,833,805 | |
| | | | |
NET ASSETS | | $ | 189,917,475 | |
| | | | |
NET ASSET VALUE PER SHARE | | | | |
| |
Investor Shares | | | | |
Net assets | | $ | 144,222,793 | |
| | | | |
Outstanding shares of beneficial interest | | | 11,545,217 | |
| | | | |
Net Asset Value And Offering Price Per Share* | | $ | 12.49 | |
| | | | |
| |
Institutional Shares | | | | |
Net assets | | $ | 45,694,682 | |
| | | | |
Outstanding shares of beneficial interest | | | 3,682,457 | |
| | | | |
Net Asset Value And Offering Price Per Share* | | $ | 12.41 | |
| | | | |
* Redemption price is equal to net asset value less any applicable redemption fees retained by the Fund.
SEE NOTES TO FINANCIAL STATEMENTS
114
DOMINI IMPACT BOND FUND
STATEMENT OF OPERATIONS
For the Year Ended July 31, 2020
| | | | |
INCOME | | | | |
Interest income | | $ | 4,597,642 | |
| | | | |
EXPENSES | | | | |
Management fee | | | 547,974 | |
Administrative fee | | | 426,964 | |
Distribution fees – Investor Shares | | | 325,701 | |
Transfer agent fees – Investor Shares | | | 239,354 | |
Transfer agent fees – Institutional Shares | | | 1,128 | |
Custody and Accounting fees | | | 101,533 | |
Professional fees | | | 58,343 | |
Registration fees – Investor Shares | | | 30,382 | |
Registration fees – Institutional Shares | | | 23,001 | |
Shareholder Communication fees | | | 5,733 | |
Miscellaneous | | | 19,572 | |
Trustees fees | | | 8,991 | |
Shareholder Service fees – Investor Shares | | | 10,810 | |
Shareholder Service fees – Institutional Shares | | | 80 | |
| | | | |
Total expenses | | | 1,799,566 | |
| | | | |
Fees waived and expenses reimbursed | | | (460,163) | |
Transfer agent credits | | | (442) | |
| | | | |
Net expenses | | | 1,338,961 | |
| | | | |
NET INVESTMENT INCOME (LOSS) | | | 3,258,681 | |
| | | | |
REALIZED AND UNREALIZED GAIN (LOSS) FROM INVESTMENTS AND FOREIGN CURRENCY | | | | |
NET REALIZED GAIN (LOSS) FROM: | | | | |
Investments | | | 6,285,629 | |
Swap Contracts | | | 958,324 | |
Futures Contracts | | | (58,655) | |
Foreign currency | | | 36,119 | |
Forward contracts | | | 58,888 | |
| | | | |
Net realized gain (loss) | | | 7,280,305 | |
| | | | |
NET CHANGES IN UNREALIZED APPRECIATION (DEPRECIATION) FROM: | | | | |
Investments | | | 8,080,038 | |
Swap Contracts | | | 264,266 | |
Futures Contracts | | | (51,070) | |
Forward Contracts | | | (100,146) | |
Translation of assets and liabilities in foreign currencies | | | 1,902 | |
| | | | |
Net change in unrealized appreciation (depreciation) | | | 8,194,990 | |
| | | | |
NET REALIZED AND UNREALIZED GAIN (LOSS) | | | 15,475,295 | |
| | | | |
NET INCREASE (DECREASE) IN NET ASSETS RESULTING FROM OPERATIONS | | $ | 18,733,976 | |
| | | | |
SEE NOTES TO FINANCIAL STATEMENTS
115
DOMINI IMPACT BOND FUND
STATEMENTS OF CHANGES IN NET ASSETS
| | | | | | | | |
| | | Year Ended
July 31, 2020 | | | Year Ended
July 31, 2019 | |
INCREASE IN NET ASSETS FROM OPERATIONS | | | | | | | | |
Net investment income (loss) | | $ | 3,258,681 | | | $ | 3,784,465 | |
Net realized gain (loss) | | | 7,280,305 | | | | 27,122 | |
Net change in unrealized appreciation (depreciation) | | | 8,194,990 | | | | 6,819,008 | |
| | | | | | | | |
Net Increase (Decrease) in Net Assets Resulting from Operations | | | 18,733,976 | | | | 10,630,595 | |
| | | | | | | | |
DISTRIBUTIONS TO SHAREHOLDERS | | | | | | | | |
Investor Shares | | | (2,521,089) | | | | (3,063,693) | |
Institutional Shares | | | (903,512) | | | | (678,202) | |
Tax return of capital distribution: | | | | | | | | |
Investor Shares | | | - | | | | (212,844) | |
Institutional Shares | | | - | | | | (65,315) | |
| | | | | | | | |
Net Decrease in Net Assets from Distributions | | | (3,424,601) | | | | (4,020,054) | |
| | | | | | | | |
CAPITAL SHARE TRANSACTIONS | | | | | | | | |
Proceeds from sale of shares | | | 40,899,419 | | | | 51,634,024 | |
Net asset value of shares issued in reinvestment of distributions and dividends | | | 2,918,086 | | | | 3,641,521 | |
Payments for shares redeemed | | | (27,333,533) | | | | (60,280,384) | |
Redemption fees | | | 3,948 | | | | 1,618 | |
| | | | | | | | |
Net Increase (Decrease) in Net Assets from Capital Share Transactions | | | 16,487,920 | | | | (5,003,221) | |
| | | | | | | | |
Total Increase (Decrease) in Net Assets | | | 31,797,295 | | | | 1,607,320 | |
| | | | | | | | |
NET ASSETS | | | | | | | | |
Beginning of period | | $ | 158,120,180 | | | $ | 156,512,860 | |
| | | | | | | | |
End of period | | $ | 189,917,475 | | | $ | 158,120,180 | |
| | | | | | | | |
SEE NOTES TO FINANCIAL STATEMENTS
116
DOMINI IMPACT BOND FUND — INVESTOR SHARES
FINANCIAL HIGHLIGHTS
| | | | | | | | | | | | | | | | | | | | |
| | | Year Ended July 31, | |
| | | 2020 | | | 2019 | | | 2018 | | | 2017 | | | 2016 | |
For a share outstanding for the period: | | | | | | | | | | | | | | | | | | | | |
Net asset value, beginning of period | | | $11.46 | | | | $10.92 | | | | $11.26 | | | | $11.60 | | | | $11.16 | |
| | | | | | | | | | | | | | | | | | | | |
Income from investment operations: | | | | | | | | | | | | | | | | | | | | |
Net investment income (loss) | | | 0.22 | | | | 0.28 | | | | 0.26 | | | | 0.23 | | | | 0.24 | |
Net realized and unrealized gain (loss) on investments | | | 1.04 | | | | 0.55 | | | | (0.33) | | | | (0.29) | | | | 0.50 | |
| | | | | | | | | | | | | | | | | | | | |
Total Income (loss) From Investment Operations | | | 1.26 | | | | 0.83 | | | | (0.07) | | | | (0.06) | | | | 0.74 | |
| | | | | | | | | | | | | | | | | | | | |
Less dividends and/or distributions: | | | | | | | | | | | | | | | | | | | | |
Dividends to shareholders from net investment income | | | (0.23) | | | | (0.27) | | | | (0.26) | | | | (0.23) | | | | (0.24) | |
Distributions to shareholders from net realized gain | | | - | | | | - | | | | (0.01) | | | | (0.05) | | | | (0.06) | |
Tax return of capital 1 | | | - | | | | (0.02) | | | | - | | | | (0.00) | 2 | | | - | |
| | | | | | | | | | | | | | | | | | | | |
Total Distributions | | | (0.23) | | | | (0.29) | | | | (0.27) | | | | (0.28) | | | | (0.30) | |
| | | | | | | | | | | | | | | | | | | | |
Redemption fee proceeds 1 | | | 0.00 | 2 | | | 0.00 | 2 | | | 0.00 | 2 | | | 0.00 | 2 | | | 0.00 | 2 |
| | | | | | | | | | | | | | | | | | | | |
Net asset value, end of period | | | $12.49 | | | | $11.46 | | | | $10.92 | | | | $11.26 | | | | $11.60 | |
| | | | | | | | | | | | | | | | | | | | |
Total return | | | 11.09% | | | | 7.77% | | | | -0.74% | | | | -0.32% | | | | 6.73% | |
Portfolio turnover | | | 469% | | | | 319% | | | | 326% | | | | 386% | | | | 297% | |
Ratios/supplemental data (annualized): | | | | | | | | | | | | | | | | | | | | |
Net assets, end of period (in millions) | | | $144 | | | | $121 | | | | $144 | | | | $ 143 | | | | $144 | |
Ratio of expenses to average net assets | | | 0.86% | 3,4 | | | 0.87% | 3,4 | | | 0.87% | 4 | | | 0.93% | 4 | | | 0.93% | 4 |
Ratio of gross expenses to average net assets | | | 1.15% | | | | 1.20% | | | | 1.14% | | | | 1.16% | | | | 1.19% | |
Ratio of net investment income (loss) to average net assets | | | 1.84% | | | | 2.55% | | | | 2.37% | | | | 2.06% | | | | 2.13% | |
1 Based on average shares outstanding.
2 Amount represents less than $0.005 per share.
3 Ratio of expenses to average net assets includes transfer agent credits. Excluding transfer agent credits the ratio of expenses to average net assets would have been 0.87% for the year ended July 31, 2019 and 0.86% for the year ended July 31, 2020.
4 Reflects a waiver of fees by the Manager and the Distributor of the Fund.
SEE NOTES TO FINANCIAL STATEMENTS
117
DOMINI IMPACT BOND FUND — INSTITUTIONAL SHARES
FINANCIAL HIGHLIGHTS
| | | | | | | | | | | | | | | | | | | | |
| | | Year Ended July 31, | |
| | | 2020 | | | 2019 | | | 2018 | | | 2017 | | | 2016 | |
For a share outstanding for the period: | | | | | | | | | | | | | | | | | | | | |
Net asset value, beginning of period | | | $11.38 | | | | $10.89 | | | | $11.23 | | | | $11.57 | | | | $11.14 | |
| | | | | | | | | | | | | | | | | | | | |
Income from investment operations: | | | | | | | | | | | | | | | | | | | | |
Net investment income (loss) | | | 0.25 | | | | 0.33 | | | | 0.30 | | | | 0.27 | | | | 0.27 | |
Net realized and unrealized gain (loss) on investments | | | 1.04 | | | | 0.53 | | | | (0.34) | | | | (0.29) | | | | 0.49 | |
| | | | | | | | | | | | | | | | | | | | |
Total Income (loss) From Investment Operations | | | 1.29 | | | | 0.86 | | | | (0.04) | | | | (0.02) | | | | 0.76 | |
| | | | | | | | | | | | | | | | | | | | |
Less dividends and/or distributions: | | | | | | | | | | | | | | | | | | | | |
Dividends to shareholders from net investment income | | | (0.26) | | | | (0.34) | | | | (0.29) | | | | (0.27) | | | | (0.27) | |
Distributions to shareholders from net realized gain | | | - | | | | - | | | | (0.01) | | | | (0.05) | | | | (0.06) | |
Tax return of capital 1 | | | - | | | | (0.03) | | | | - | | | | (0.00) | 2 | | | - | |
| | | | | | | | | | | | | | | | | | | | |
Total Distributions | | | (0.26) | | | | (0.37) | | | | (0.30) | | | | (0.32) | | | | (0.33) | |
| | | | | | | | | | | | | | | | | | | | |
Redemption fee proceeds 1 | | | 0.00 | 2 | | | 0.00 | 2 | | | 0.00 | 2 | | | 0.00 | 2 | | | 0.00 | 2 |
| | | | | | | | | | | | | | | | | | | | |
Net asset value, end of period | | | $12.41 | | | | $11.38 | | | | $10.89 | | | | $11.23 | | | | $11.57 | |
| | | | | | | | | | | | | | | | | | | | |
Total return | | | 11.49% | | | | 8.06% | | | | -0.36% | | | | -0.13% | | | | 6.96% | |
Portfolio turnover | | | 469% | | | | 319% | | | | 326% | | | | 386% | | | | 297% | |
Ratios/supplemental data (annualized): | | | | | | | | | | | | | | | | | | | | |
Net assets, end of period (in millions) | | | $46 | | | | $37 | | | | $13 | | | | $6 | | | | $3 | |
Ratio of expenses to average net assets | | | 0.56% | 3,4 | | | 0.57% | 3,4 | | | 0.57% | 4 | | | 0.62% | 4 | | | 0.63% | 4 |
Ratio of gross expenses to average net assets | | | 0.74% | | | | 0.84% | | | | 1.03% | | | | 1.02% | | | | 1.22% | |
Ratio of net investment income (loss) to average net assets | | | 2.13% | | | | 2.84% | | | | 2.67% | | | | 2.38% | | | | 2.46% | |
1 Based on average shares outstanding.
2 Amount represents less than $0.005 per share.
3 Ratio of expenses to average net assets includes transfer agent credits. Excluding transfer agent credits the ratio of expenses to average net assets would have been 0.57% for the year ended July 31, 2019 and 0.56% for the year ended July 31, 2020.
4 Reflects a waiver of fees by the Manager of the Fund.
SEE NOTES TO FINANCIAL STATEMENTS
118
DOMINI IMPACT BOND FUND
NOTES TO FINANCIAL STATEMENTS
July 31, 2020
1. ORGANIZATION AND SIGNIFICANT ACCOUNTING POLICIES
The Domini Impact Bond Fund (the “Fund”) is a series of the Domini Investment Trust. The Trust is a Massachusetts business trust registered under the Investment Company Act of 1940 as an open-end management investment company. The Fund is an investment company and accordingly follows the investment company accounting and reporting guidance of the Financial Accounting Standards Board (the “FASB”) Accounting Standard Codification Topic 946 “Financial Services — Investment Companies”. The Fund offers Investor Shares, Institutional Shares and Class Y shares. Institutional shares and Class Y shares were not offered prior to November 30, 2011, and June 15, 2018, respectively. As of July 31, 2020, the Class Y shares of the Bond Fund had not yet commenced operations. Each class of shares is sold at its offering price, which is net asset value. The Institutional shares may only be purchased by or for the benefit of investors that meet the minimum investment requirements, and fall within the following categories: endowments, foundations, religious organizations and other nonprofit entities, individuals, retirement plan sponsors, family office clients, certain corporate or similar institutions, or omnibus accounts maintained by financial intermediaries and that are approved by the Fund’s Distributor. Class Y shares may only be purchased through omnibus accounts held on the books of the Fund for financial intermediaries that have been approved by the Funds’ distributor. Each class of shares has identical rights and voting privileges with respect to the Fund in general and exclusive voting rights on matters that affect that class alone. Earnings, net assets, and net asset value per share may differ due to each class having its own expenses, such as transfer and shareholder servicing agent fees and registration fees, directly attributable to that class. Institutional shares are not subject to distribution fees. The Fund seeks to provide its shareholders with a high level of current income and total return by investing in bonds and other debt instruments that are consistent with the Fund’s social and environmental standards and the submanager’s security selection approach.
The preparation of financial statements in conformity with U.S. generally accepted accounting principles requires management to make estimates and assumptions that affect the reported amounts of assets and liabilities and disclosure of contingent liabilities at the date of the financial statements and the reported amounts of revenues and expenses during the reporting period. Actual results could differ from those estimates. The following is a summary of the Fund’s significant accounting policies.
119
DOMINI IMPACT BOND FUND
NOTES TO FINANCIAL STATEMENTS (continued)
July 31, 2020
(A) Valuation of Investments. Bonds and other fixed-income securities (other than obligations with maturities of 60 days or less) are valued on the basis of valuations furnished by an independent pricing service, use of which has been approved by the Board of Trustees of the Fund. In making such valuations, the pricing service utilizes both dealer-supplied valuations and electronic data processing techniques that take into account appropriate factors such as institutional-size trading in similar groups of securities, yield, quality, coupon rate, maturity, type of issue, trading characteristics, and other market data, without exclusive reliance upon quoted prices or exchange or over-the-counter prices, since such valuations are believed to reflect more accurately the fair value of such securities. Short-term obligations of sufficient credit quality (maturing in 60 days or less) are valued at amortized cost, which constitutes fair value as determined by the Board of Trustees of the Fund. Securities (other than short-term obligations with remaining maturities of 60 days or less) for which there are no such quotations or valuations are valued at fair value as determined in good faith by or at the direction of the Fund’s Board of Trustees.
The Fund follows a fair value hierarchy that distinguishes between (a) market participant assumptions developed based on market data obtained from sources independent of the reporting entity (observable inputs) and (b) the Fund’s own assumptions about market participant assumptions developed based on the best information available in the circumstances (unobservable inputs). These inputs are used in determining the value of the Fund’s investments and are summarized in the following fair value hierarchy:
Level 1 — quoted prices in active markets for identical securities
Level 2 — other significant observable inputs (including quoted prices for similar securities, interest rates, and evaluated quotation obtained from pricing services)
Level 3 — significant unobservable inputs (including the Fund’s own assumptions in determining the fair value of investments).
The inputs or methodology used for valuing securities are not an indication of the risk associated with investing in those securities.
120
DOMINI IMPACT BOND FUND
NOTES TO FINANCIAL STATEMENTS (continued)
July 31, 2020
The following is a summary of the inputs used, as of July 31, 2020, in valuing the Fund’s assets carried at fair value:
| | | | | | | | | | | | | | | | |
| | | Level 1 -
Quoted Prices | | | Level 2 -
Other
Significant
Observable
Inputs | | | Level 3 -
Significant
Unobservable
Inputs | | | Total | |
| | | | | | | | | | | | | | | | |
Assets: | | | | | | | | | | | | | | | | |
| | | | |
Long Term Investments in Securities: | | | | | | | | | | | | | | | | |
Mortgage Backed Securities | | $ | - | | | $ | 99,372,558 | | | $ | - | | | $ | 99,372,558 | |
Corporate Bonds and Notes | | | - | | | | 70,465,391 | | | | - | | | | 70,465,391 | |
U.S. Government Agency Obligations | | | - | | | | 28,556,100 | | | | - | | | | 28,556,100 | |
Municipal Bonds | | | - | | | | 24,238,428 | | | | - | | | | 24,238,428 | |
Senior Floating Rate Interests | | | - | | | | 4,230,275 | | | | - | | | | 4,230,275 | |
Foreign Government & Agency Securities | | | - | | | | 3,255,445 | | | | - | | | | 3,255,445 | |
Asset Backed Securities | | | - | | | | 974,997 | | | | - | | | | 974,997 | |
| | | | | | | | | | | | | | | | |
Total Long Term Investments | | $ | - | | | $ | 231,093,194 | | | $ | - | | | $ | 231,093,194 | |
| | | | | | | | | | | | | | | | |
Total Investment in Securities | | $ | - | | | $ | 231,093,194 | | | $ | - | | | $ | 231,093,194 | |
| | | | | | | | | | | | | | | | |
| | | | |
Other Financial Instruments: | | | | | | | | | | | | | | | | |
Credit Default Swap - CCP | | | - | | | | 2,202 | | | | - | | | | 2,202 | |
Interest Rate Swap - CCP | | | - | | | | 257,710 | | | | - | | | | 257,710 | |
| | | | | | | | | | | | | | | | |
Total Other Financial Instruments | | $ | - | | | $ | 259,912 | | | $ | - | | | $ | 259,912 | |
| | | | | | | | | | | | | | | | |
Liabilities: | | | | | | | | | | | | | | | | |
| | | | |
Other Financial Instruments: | | | | | | | | | | | | | | | | |
Forward Currency Contracts | | | - | | | | (100,593) | | | | - | | | | (100,593) | |
Futures | | | - | | | | (78,785) | | | | - | | | | (78,785) | |
Interest Rate Swap - CCP | | | - | | | | (589,198) | | | | - | | | | (589,198) | |
| | | | | | | | | | | | | | | | |
Total Other Financial Instruments | | $ | - | | | $ | (768,576) | | | $ | - | | | $ | (768,576) | |
| | | | | | | | | | | | | | | | |
(B) Foreign Currency Translation. Securities and other assets and liabilities denominated in foreign currencies are translated into U.S. dollar amounts on the date of valuation. Purchases and sales of securities, and income and expense items denominated in foreign currencies, are translated into U.S. dollar amounts on the respective dates of such transactions. Occasionally, events impact the availability or reliability of foreign exchange rates used to convert the U.S. dollar equivalent value. If such an event occurs, the foreign exchange rate will be valued at fair value using procedures established and approved by the Board of Trustees. The Funds do not separately report the effect of fluctuations in
121
DOMINI IMPACT BOND FUND
NOTES TO FINANCIAL STATEMENTS (continued)
July 31, 2020
foreign exchange rates from changes in market prices on securities held. Such fluctuations are included with the net realized and unrealized gain or loss from investments. Realized foreign exchange gains or losses arise from sales of foreign currencies, currency gains or losses realized between the trade and settlement dates on securities transactions, and the difference between the recorded amounts of dividends, interest, and foreign withholding taxes and the U.S. dollar equivalent of the amounts actually received or paid. Net unrealized foreign exchange gains and losses arise from changes in fair value of assets and liabilities other than investments in securities held at the end of the reporting period, resulting from changes in exchange rates.
(C) Foreign Currency Contracts. When the Funds purchase or sell foreign securities they enter into foreign exchange contracts to minimize foreign exchange risk from the trade date to the settlement date of the transactions. A foreign exchange contract is an agreement between two parties to exchange different currencies at an agreed-upon exchange rate on a specified date. The Fund had no outstanding open foreign currency spot contracts as of July 31, 2020.
(D) Securities Purchased on a When-Issued or Delayed Delivery Basis. The Fund may invest in when-issued or delayed delivery securities where the price of the security is fixed at the time of the commitment but delivery and payment take place beyond customary settlement time. These securities are subject to market fluctuation, and no interest accrues on the security to the purchaser during this period. The payment obligation and the interest rate that will be received on the securities are each fixed at the time the purchaser enters into the commitment. Purchasing obligations on a when-issued or delayed delivery basis is a form of leveraging and can involve a risk that the yields available in the market when the delivery takes place may be higher than those obtained in the transaction, which could result in an unrealized loss at the time of delivery. The Fund establishes a segregated account consisting of liquid securities equal to the amount of the commitments to purchase securities on such basis.
(E) TBA Purchase and Forward Sale Commitments. The Fund may enter into TBA commitments to purchase or sell securities for a fixed price at a future date. TBA commitments are considered securities in themselves and involve a risk of loss if the value of the security to be purchase or sold declines or increases prior to the settlement date, which is in addition to the risk of decline in the value of the Fund’s other assets.
122
DOMINI IMPACT BOND FUND
NOTES TO FINANCIAL STATEMENTS (continued)
July 31, 2020
(F) Derivative Financial Instruments. The Fund may invest in derivatives in order to hedge market risks, or to seek to increase the Fund’s income or gain. Derivatives in certain circumstances may require that the Fund segregate cash or other liquid assets to the extent the Fund’s obligations are not otherwise covered through ownership of the underlying security, financial instrument, or currency. Derivatives involve special risks, including possible default by the other party to the transaction, illiquidity, and the risk that the use of derivatives could result in greater losses than if it had not been used. Some derivative transactions, including options, swaps, forward contracts, and options on foreign currencies, are entered into directly by the counterparties or through financial institutions acting as market makers (OTC derivatives), rather than being traded on exchanges or in markets registered with the Commodity Futures Trading Commission or the SEC.
(G) Option Contracts. The Fund may purchase or write option contracts primarily to manage and/or gain exposure to interest rate, foreign exchange rate and credit risk. An option is a contract entitling the holder to purchase or sell a specific number of shares or units of an asset or notional amount of a swap (swaption), at a specified price. Options purchased are recorded as an asset while options written are recorded as a liability. Upon exercise of an option, the acquisition cost or sales proceeds of the underlying investment is adjusted by any premium received or paid. Upon expiration of an option, any premium received or paid is recorded as a realized gain or loss. Upon closing an option other than through expiration or exercise, the difference between the premium and the cost to close the position is recorded as a realized gain or loss. The Fund had no purchased option contracts outstanding as of July 31, 2020.
(H) Futures Contracts. The Fund may purchase and sell futures contracts based on various securities, securities indexes, and other financial instruments and indexes. The Fund intends to use futures contracts for hedging purposes. Futures contracts provide for the future sale by one party and purchase by another party of a specified amount of a specified security or financial instrument at a specified future time and at a specified price. When the Fund purchases or sells a futures contract, the Fund must allocate certain of its assets as an initial deposit on the contract. The futures contract is marked to market daily thereafter, and the Fund may be required to pay or entitled to receive additional “variation margin,” based on decrease or increase in the value of the futures contract. Future contracts outstanding at July 31, 2020 are listed in the Fund’s Portfolio of Investments.
123
DOMINI IMPACT BOND FUND
NOTES TO FINANCIAL STATEMENTS (continued)
July 31, 2020
(I) Forward Currency Contracts. The Fund may enter into forward currency contracts with counterparties to hedge the value of portfolio securities denominated in particular currencies against fluctuations in relative value or to generate income or gain. These contracts are used to hedge foreign exchange risk and to gain exposure on currency. The U.S. dollar value of forward currency contracts is determined using current forward exchange rates supplied by a quotation service. The fair value of the contract will fluctuate with changes in currency exchange rates. The contract is marked to market daily and the change in fair value is recorded as an unrealized gain or loss. The Fund records a realized gain or loss equal to the difference between the value of the contract at the time it was opened and the value at the time it was closed when the contract matures or by delivery of the currency. The Fund could be exposed to risk if the value of the currency changes unfavorably, if the counterparties to the contracts are unable to meet the terms of their contracts or if the Fund is unable to enter into a closing position. Risk may exceed amounts recognized on the Statement of Assets and Liabilities. Forward currency contracts outstanding at July 31, 2020 are listed in the Fund’s Portfolio of Investments.
(J) Interest Rate Swap Contracts. The Fund may enter into interest rate swap contracts to hedge interest rate risk. An interest rate swap is an agreement between the Fund and a counterparty to exchange cash flows based on the difference between two interest rates, applied to a notional amount. Interest rate swap contracts are marked to market daily based upon quotations from an independent pricing service or market maker. Any change on an OTC interest rate swap is recorded as an unrealized gain or loss on the Statement of Assets and Liabilities. Daily fluctuations in the value of centrally cleared interest rate swaps are settled though a central clearing agent and are recorded in variation margin on the Statement of Assets and Liabilities and recorded as unrealized gain or loss. OTC and centrally cleared interest rate swap contracts outstanding at July 31, 2020, are listed in the Fund’s Portfolio of Investments.
(K) Credit Default Swap Contracts. The Fund may enter into credit default swap contracts primarily to manage and/or gain exposure to credit risk. A credit default swap is an agreement between the fund and a counterparty whereby the buyer of the contract receives credit protection and the seller of the contract guarantees the credit worthiness of a referenced debt obligation. These agreements may be privately negotiated in the over-the-counter market (“OTC credit default swaps”) or may be executed in a multilateral trade facility platform, such as a registered exchange (“centrally cleared credit default swaps”). The underlying referenced debt obligation may be a single issuer of corporate or sovereign debt, a credit index, or a tranche of a credit index. In the event of a default of the underlying
124
DOMINI IMPACT BOND FUND
NOTES TO FINANCIAL STATEMENTS (continued)
July 31, 2020
referenced debt obligation, the buyer is entitled to receive the notional amount of the credit default swap contract from the seller in exchange for the referenced debt obligation, a net settlement amount equal to the notional amount of the credit default swap less the recovery value of the referenced debt obligation, or other agreed upon amount. For centrally cleared credit default swaps, required initial margins are pledged by the fund, and the daily change in fair value is accounted for as a variation margin payable or receivable on the Statements of Assets and Liabilities. Over the term of the contract, the buyer pays the seller a periodic stream of payments, provided that no event of default has occurred. Such periodic payments are accrued daily as an unrealized appreciation or depreciation until the payments are made, at which time they are realized. Payments received or paid to initiate a credit default swap contract are reflected on the Statements of Assets and Liabilities and represent compensating factors between stated terms of the credit default swap agreement and prevailing market conditions (credit spreads and other relevant factors). These upfront payments are amortized over the term of the contract as a realized gain or loss on the Statements of Operations. OTC and centrally cleared credit default swap contracts outstanding at July 31, 2020 are listed in the Fund’s Portfolio of Investments.
(L) Master Agreements. The Fund is a party to ISDA (International Swaps and Derivatives Association, Inc.) Master Agreements that govern OTC derivative and foreign exchange contracts (Master Agreements) with certain counterparties entered into from time to time. The Master Agreements may contain provisions regarding, among other things, the parties’ general obligations, representations, agreements, collateral requirements, events of default and early termination. With respect to certain counterparties, in accordance with the terms of the Master Agreements, collateral posted to the Fund is held in a segregated account by the Fund’s custodian and with respect to those amounts which can be sold or repledged, are presented in the Fund’s portfolio. Collateral pledged by the Fund is segregated by the Fund’s custodian and identified in the Fund’s portfolio. Collateral can be in the form of cash or other marketable securities as agreed to by the Fund and the applicable counterparty. Collateral requirements are determined based on the Fund’s net position with each counterparty.
With respect to ISDA Master Agreements, termination events applicable to the counterparty include certain deteriorations in the credit quality of the counterparty. Termination events applicable to the Fund include failure of the Fund to maintain certain net asset levels and/or limit the decline in net assets over various periods of time. In the event of default or early termination, the ISDA Master Agreement gives the non-defaulting party the right to net and close-out all
125
DOMINI IMPACT BOND FUND
NOTES TO FINANCIAL STATEMENTS (continued)
July 31, 2020
transactions traded, whether or not arising under the ISDA agreement, to one net amount payable by one counterparty to the other. However, absent an event of default or early termination, OTC derivative assets and liabilities are presented gross and not offset in the Statements of Assets and Liabilities. Early termination by the counterparty may result in an immediate payment by the Fund of any net liability owed to that counterparty under the ISDA agreement.
In a centrally cleared swap, while the Fund enters into an agreement with a clearing broker to execute contracts with a counterparty, the performance of the swap is guaranteed by the central clearinghouse, which reduces the Fund’s exposure to counterparty risk. The Fund is still exposed to the counterparty risk through the clearing broker and clearinghouse. The clearinghouse attempts to minimize this risk to its participants through the use of mandatory margin requirements, daily cash settlements and other procedures. Likewise, the clearing broker reduces its risk through margin requirements and required segregation of customer balances.
(M) Investment Transactions, Investment Income, and Dividends to Shareholders. Investment transactions are accounted for on trade date. Realized gains and losses from security transactions are determined on the basis of identified cost. Interest income is recorded on an accrual basis. The Fund earns income daily, net of Fund expenses. Paydown gains and losses are recorded as an adjustment to interest income. Dividends to shareholders are usually declared daily and paid monthly from net investment income. Distributions to shareholders of realized capital gains, if any, are made annually. Distributions are determined in conformity with income tax regulations, which may differ from generally accepted accounting principles. Reclassifications have been made to the Fund’s components of net assets to reflect income and gains available for distribution (or available capital loss carryovers, as applicable) under income tax regulations.
(N) Federal Taxes. The Fund’s policy is to comply with the provisions of the Internal Revenue Code applicable to regulated investment companies and to distribute substantially all of its taxable income, including net realized gains, if any, within the prescribed time periods. Accordingly, no provision for federal income or excise tax is deemed necessary. As of July 31, 2020, tax years 2017 through 2020 remain subject to examination by the Fund’s major tax jurisdictions, which include the United States of America, the Commonwealth of Massachusetts, and New York State.
(O) Redemption Fees. Redemptions and exchanges of Fund shares held less than 30 days may be subject to the Fund’s redemption fee, which is 2% of the amount redeemed. The fee is imposed to offset transaction costs and other
126
DOMINI IMPACT BOND FUND
NOTES TO FINANCIAL STATEMENTS (continued)
July 31, 2020
expenses associated with short-term investing. The fee may be waived in certain circumstances at the discretion of the Fund. Such fees are retained by the Fund and are recorded as an adjustment to paid-in capital.
(P) Other. Income, expenses (other than those attributable to a specific class), gains, and losses are allocated on a daily basis to each class of shares based upon the relative proportion of net assets represented by such class. Operating expenses directly attributable to a specific class are charged against the operations of that class.
(Q) Transfer Agent Credits. Per the arrangement with the Fund’s former transfer agent, BNY Mellon Investment Servicing (U.S.) Inc., the Fund has arrangements whereby it may receive earnings credits when positive cash balances are maintained, which are used to offset transfer agent fees. For financial reporting purposes, the Fund includes earnings credits as an expense offset in the Statement of Operations. For the year ended July 31, 2020, Transfer agent fees of the Fund, under these arrangements, were reduced as follows:
| | | | |
Domini Impact Bond Fund Investor Shares | | | $439 | |
Domini Impact Bond Fund Institutional Shares | | | 3 | |
(R) Indemnification.The Fund’s organizational documents provide current and former trustees and officers with a limited indemnification against liabilities arising in connection with the performance of their duties to the Fund. In the normal course of business, the Fund may also enter into contracts that provide general indemnifications. The Fund’s maximum exposure under these arrangements is unknown as this would be dependent on future claims that may be made against the Fund. The risk of material loss from such claims is considered remote.
2. TRANSACTIONS WITH AFFILIATES
(A) Manager/Administrator. The Fund has retained Domini Impact Investments LLC (Domini) to serve as investment manager and administrator. The services provided by Domini consist of investment supervisory services, overall operational support, and administrative services, including the provision of general office facilities and supervising the overall administration of the Fund. For its services under the Management Agreement, Domini receives from the Fund a fee accrued daily and paid monthly at the annual rate of the Fund’s average daily net assets before any fee waivers of 0.33% of the first $50 million of net assets managed, 0.32% of the next $50 million of net assets managed, and 0.315% of next assets managed in excess of $100 million.
127
DOMINI IMPACT BOND FUND
NOTES TO FINANCIAL STATEMENTS (continued)
July 31, 2020
For its services under the Administration Agreement, Domini receives from the Fund a fee accrued daily and paid monthly at an annual rate equal to 0.25% of the Fund’s average daily net assets.
Effective November 29, 2019, Domini has contractually agreed to reduce its fees and/or reimburse certain ordinary operating expenses (excluding brokerage fees and commissions, interest, taxes, and other extraordinary expenses) in order to limit Investor, Institutional, and Class Y share expenses to 0.87%, 0.57%, and 0.65%, respectively, until November 30, 2020, absent an earlier modification by the Board of Trustees which oversee the Fund. For the year ended July 31, 2020, Domini reimbursed expenses totaling $259,813.
Fees waived and/or expenses reimbursed under the Expense Limitation Agreement are only recoverable by Domini and/or its affiliates in the current fiscal year to the extent actual Fund expenses are less than the contractual expense cap during such year.
As of July 31, 2020, Domini owned less than 1% of any class of the outstanding Shares of the Fund.
(B) Submanager. Wellington Management Company LLP (Wellington), a Delaware limited liability partnership, provides investment management services to the Fund on a day-to-day basis pursuant to a submanagement agreement with Domini.
(C) Distributor. The Board of Trustees of the Fund has adopted a Distribution Plan in accordance with Rule 12b-1 under the Act. DSIL Investment Services LLC, a wholly owned subsidiary of Domini (DSIL), acts as agent of the Fund in connection with the offering of shares of the Fund pursuant to a Distribution Agreement. Under the Distribution Plan, the Fund pays expenses incurred in connection with the sale of Investor shares and pays DSIL a distribution fee at an aggregate annual rate not to exceed 0.25% of the average daily net assets representing the Investor shares. For the year ended July 31, 2020, fees waived by the Investor shares totaled $200,269.
(D) Shareholder Service Agent. The Trust has retained Domini to provide certain shareholder services to the Fund and its shareholders, which services were previously provided by the former transfer agent for the Fund or another fulfillment and mail service provider and are supplemental to services currently provided by Ultimus Fund Soultions, LLC (“Ultimus”) as transfer agent to the Fund, pursuant to a master services agreement between the Fund and Ultimus.
128
DOMINI IMPACT BOND FUND
NOTES TO FINANCIAL STATEMENTS (continued)
July 31, 2020
For these services, Domini receives a fee from the Fund paid monthly at an annual rate of $4.00 per active account. For the year ended July 31, 2020, Domini waived fees as follows:
| | | | |
| | | FEES WAIVED | |
Domini Impact Bond Fund Investor Shares | | $ | - | |
Domini Impact Bond Fund Institutional Shares | | | 81 | |
(E) Trustees and Officers. Each of the Independent Trustees received an annual retainer for serving as a Trustee of the Trust of $28,000. The Lead Independent Trustee and Chair of the Audit Committee receive an additional chairperson fee of $5,000. Each Independent Trustee also receives $2,500 for attendance at each meeting of the Board of the Trust (reduced to $1,000 in the event that a Trustee participates at an in-person meeting by telephone). In addition, each Trustee receives reimbursement for reasonable expenses incurred in attending meetings. These expenses are allocated on a pro-rata basis to each shares class of a Fund according to their respective net assets.
As of July 31, 2020, all Trustees and officers of the Trust as a group owned less than 1% of the Fund’s outstanding shares.
3. INVESTMENT TRANSACTIONS
For the year ended July 31, 2020, cost of purchase and proceeds from sales of investments other than short-term obligations were as follows:
| | | | | | | | |
| | | PURCHASES | | | SALES | |
U.S. Government Securities | | $ | 892,055,059 | | | $ | 889,455,781 | |
Investments in Securities | | | 51,071,520 | | | | 19,906,600 | |
129
DOMINI IMPACT BOND FUND
NOTES TO FINANCIAL STATEMENTS (continued)
July 31, 2020
4. SHARES OF BENEFICIAL INTEREST
| | | | | | | | | | | | | | | | |
| | | Year Ended July 31, | |
| | | 2020 | | | 2019 | |
| | | Shares | | | Amount | | | Shares | | | Amount | |
| | | | |
Investor Shares | | | | | | | | | | | | | | | | |
Shares sold | | | 2,510,484 | | | $ | 29,633,328 | | | | 1,920,264 | | | $ | 21,154,970 | |
Shares issued in reinvestment of dividends and distributions | | | 205,156 | | | | 2,438,618 | | | | 284,558 | | | | 3,141,224 | |
Shares redeemed | | | (1,731,485) | | | | (20,462,811) | | | | (4,830,641) | | | | (52,541,300) | |
Redemption fees | | | - | | | | 3,893 | | | | - | | | | 1,403 | |
| | | | | | | | | | | | | | | | |
Net increase (decrease) | | | 984,155 | | | $ | 11,613,028 | | | | (2,625,819) | | | $ | (28,243,703) | |
| | | | | | | | | | | | | | | | |
| | | | |
Institutional Shares | | | | | | | | | | | | | | | | |
Shares sold | | | 960,080 | | | $ | 11,266,091 | | | | 2,776,997 | | | $ | 30,479,054 | |
Shares issued in reinvestment of dividends and distributions | | | 40,554 | | | | 479,468 | | | | 45,513 | | | | 500,297 | |
Shares redeemed | | | (581,293) | | | | (6,870,722) | | | | (711,155) | | | | (7,739,084) | |
Redemption fees | | | - | | | | 55 | | | | - | | | | 215 | |
| | | | | | | | | | | | | | | | |
Net increase | | | 419,341 | | | $ | 4,874,892 | | | | 2,111,355 | | | $ | 23,240,482 | |
| | | | | | | | | | | | | | | | |
| | | | |
Total | | | | | | | | | | | | | | | | |
Shares sold | | | 3,470,564 | | | $ | 40,899,419 | | | | 4,697,261 | | | $ | 51,634,024 | |
Shares issued in reinvestment of dividends and distributions | | | 245,710 | | | | 2,918,086 | | | | 330,071 | | | | 3,641,521 | |
Shares redeemed | | | (2,312,778) | | | | (27,333,533) | | | | (5,541,796) | | | | (60,280,384) | |
Redemption fees | | | - | | | | 3,948 | | | | - | | | | 1,618 | |
| | | | | | | | | | | | | | | | |
Net increase (decrease) | | | 1,403,496 | | | $ | 16,487,920 | | | | (514,464) | | | $ | (5,003,221) | |
| | | | | | | | | | | | | | | | |
130
DOMINI IMPACT BOND FUND
NOTES TO FINANCIAL STATEMENTS (continued)
July 31, 2020
5. SUMMARY OF DERIVATIVE ACTIVITY
At July 31, 2020, the Fund’s investments in derivative contracts are reflected on the Statement of Assets and Liabilities as follows:
| | | | | | | | | | | | |
| | | Asset Derivatives | | | Liability Derivatives | |
Derivative Contracts Not
Accounted for as
Hedging Instruments | | Statement of Assets
and Liabilities Location | | Fair Value | | | Statement of Assets
and Liabilities Location | | Fair Value | |
Interest Rate contracts | | Receivable for Variation Margin swaps / Unrealized appreciation on OTC swap contracts/Net assets consist of - Total distributable earnings | | $ | 273,874 | | | Payable for Variation Margin swaps / Unrealized appreciation on OTC swap contracts/Net assets consist of - Total distributable earnings | | $ | 632,120 | |
| | | | | | | | | | | | |
Credit contracts | | Receivable for Variation Margin swaps / Unrealized appreciation on OTC swap contracts/Net assets consist of - Total distributable earnings | | | 2,202 | | | Payable for Variation Margin swaps / Unrealized appreciation on OTC swap contracts/Net assets consist of - Total distributable earnings | | | 7,572 | |
| | | | | | | | | | | | |
Forward currency contracts | | Unrealized appreciation on forward currency contracts/Net assets consist of -Total distributable earnings | | | — | | | Unrealized depreciation on forward currency contracts/Net assets consist of -Total distributable earnings | | | 100,593 | |
| | | | | | | | | | | | |
Futures contracts | | Receivable for Variation margin futures/Net assets consist of -Total distributable earnings | | | — | | | Payable for Variation margin futures/Net assets consist of -Total distributable earnings | | | 78,755 | |
| | | | | | | | | | | | |
Total | | $ | 276,076 | | | | | $ | 819,040 | |
| | | | | | | | | | | | |
131
DOMINI IMPACT BOND FUND
NOTES TO FINANCIAL STATEMENTS (continued)
July 31, 2020
For the year ended July 31, 2020, the effect of derivative contracts on the Fund’s Statement of Operations was as follows:
| | | | | | | | | | |
Derivative Contracts Not
Accounted for as Hedging
Instruments | | Statement of Operations
Location | | Realized Gain
(Loss) | | | Change in Unrealized
Appreciation
(Depreciation) | |
Interest rate contracts | | Net realized gain (loss) from swap contracts/ Net change in unrealized appreciation (depreciation) from swap contracts | | | 134,386 | | | | 251,668 | |
| | | | | | | | | | |
Credit contracts | | Net realized gain (loss) from swap contracts/ Net change in unrealized appreciation (depreciation) from swap contracts | | | 823,938 | | | | 12,598 | |
| | | | | | | | | | |
Forward currency contracts | | Net realized gain (loss) from forward contracts/ Net change in unrealized appreciation (depreciation) from forward contracts | | | 58,888 | | | $ | (100,146 | ) |
| | | | | | | | | | |
Futures contracts | | Net realized gain (loss) from future contracts/ Net change in unrealized appreciation (depreciation) from future contracts | | | (58,655 | ) | | | (51,070 | ) |
| | | | | | | | | | |
Total | | $ | 958,557 | | | | 113,050 | |
| | | | | | | | | | |
The average notional cost of futures contracts and average notional amounts of other derivative contracts outstanding during the year ended July 31, 2020, which are indicative of the volume of these derivative types, were approximately as follows
| | | | |
Futures contracts (notional) | | $ | 3,759,602 | |
Forward currency contracts (contract amount) | | $ | 5,531,700 | |
OTC interest rate swap contracts (notional) | | $ | 2,355,965 | |
Centrally cleared interest rate swap contracts (notional) | | $ | 37,092,712 | |
Centrally cleared credit default contracts (notional) | | $ | 968,265 | |
132
DOMINI IMPACT BOND FUND
NOTES TO FINANCIAL STATEMENTS (continued)
July 31, 2020
6. FEDERAL TAX STATUS
The tax basis of the components of net assets at July 31, 2020, is as follows:
| | | | |
Undistributed Ordinary Income | | $ | 5,679,765 | |
Undistributed capital gains | | | 388,807 | |
Unrealized appreciation/(depreciation) | | | 12,805,230 | |
Capital losses, other losses and other temporary differences | | | - | |
| | | | |
Distributable net earnings/(deficit) | | $ | 18,873,802 | |
| | | | |
For federal income tax purposes, dividends paid were characterized as follows:
| | | | | | | | |
| | | Year Ended July 31, | |
| | | 2020 | | | 2019 | |
Ordinary income | | $ | 3,424,601 | | | $ | 3,741,895 | |
Long-term capital gain | | | - | | | | - | |
Return of capital | | | - | | | | 278,159 | |
| | | | | | | | |
Total | | $ | 3,424,601 | | | $ | 4,020,054 | |
| | | | | | | | |
The Fund is subject to the provisions of Accounting Standards Codification ASC 740 Income Taxes (ASC 740). ASC 740 sets forth a minimum threshold for financial statement recognition of the benefit of a tax position taken or expected to be taken in a tax return. The Fund did not have a liability to record for any unrecognized tax benefits in the accompanying financial statements. No provision has been made for taxes on income, capital gains or unrealized appreciation on securities held or for excise tax on income and capital gains.
7. OTHER RISKS
The Fund’s risks include, but are not limited to, some or all of the risks discussed below:
Market Risk: The market values of securities or other assets will fluctuate, sometimes sharply and unpredictably, due to changes in general market conditions, overall economic trends or events, governmental actions or intervention, market disruptions caused by trade disputes or other factors, political developments, recessions, the spread of infectious illness or other public health issues, investor sentiment and other factors that may or may not be related to the issuer of the security or other asset. If the market values of the securities or other assets held by the Fund fall, including a complete loss on any individual security, the value of your investment will go down. Economies and financial markets throughout the world are increasingly interconnected. Economic, financial or political events, trading or tariff arrangements, terrorism, natural disasters, global pandemics and other circumstances in one
133
DOMINI IMPACT BOND FUND
NOTES TO FINANCIAL STATEMENTS (continued)
July 31, 2020
country or region could have profound impacts on global economies or markets. As a result, whether or not the Fund invests in securities of issuers located in or with significant exposure to the countries directly affected, the value and liquidity of the Fund’s investments may be negatively affected.
Recent events: The respiratory illness COVID-19 caused by a novel coronavirus has resulted in a global pandemic and major disruption to economies and markets around the world, including the United States. Global financial markets have experienced extreme volatility and severe losses, and trading in many instruments has been disrupted. Liquidity for many instruments has been greatly reduced for periods of time. Some interest rates are very low and in some cases yields are negative. Some sectors of the economy and individual issuers have experienced particularly large losses. Some sectors of the economy and individual issuers have experienced particularly large losses. These circumstances may continue for an extended period of time and may adversely affect the value and/or liquidity of the Fund’s investments. The ultimate economic fallout from the pandemic, and the long-term impact on economies, markets, industries and individual issuers, are not known. Governments and central banks, including the Federal Reserve in the U.S., have taken extraordinary and unprecedented actions to support national economies and the financial markets. These actions have resulted in significant expansion of public debt, including in the U.S. The impact of these measures, and whether they will be effective to mitigate the economic and market disruption, may not be known for some time. The consequences of high public debt, including its future impact on the economy and securities markets, likewise may not be known for some time.
134
Report of Independent Registered Public Accounting Firm
To the Shareholders and Board of Trustees
Domini Investment Trust:
Opinion on the Financial Statements
We have audited the accompanying statements of assets and liabilities of Domini Impact Equity Fund, Domini Impact International Equity Fund, and Domini Sustainable Solutions Fund (collectively, the Funds), each a Fund within the series of the Domini Investment Trust, including the portfolios of investments, as of July 31, 2020, the related statements of operations for the year then ended or for Domini Sustainable Solutions Fund for the period from April 1, 2020 (commencement of operations) to July 31, 2020, the statements of changes in net assets for each of the years in the two-year period then ended or for Domini Sustainable Solutions Fund for the period ended April 1, 2020 (commencement of operations) to July 31, 2020, and the related notes (collectively, the financial statements) and the financial highlights for each of the years or periods in the five-year period then ended. In our opinion, the financial statements and financial highlights present fairly, in all material respects, the financial position of the Funds as of July 31, 2020, the results of their operations for the year then ended or for the period from April 1, 2020 to July 31, 2020, the changes in their net assets for each of the years in the two-year period then ended or for the period from April 1, 2020 to July 31, 2020, and the financial highlights for each of the years or periods in the five-year period then ended, in conformity with U.S. generally accepted accounting principles.
Basis for Opinion
These financial statements and financial highlights are the responsibility of the Funds’ management. Our responsibility is to express an opinion on these financial statements and financial highlights based on our audits. We are a public accounting firm registered with the Public Company Accounting Oversight Board (United States) (PCAOB) and are required to be independent with respect to the Funds in accordance with the U.S. federal securities laws and the applicable rules and regulations of the Securities and Exchange Commission and the PCAOB.
We conducted our audits in accordance with the standards of the PCAOB. Those standards require that we plan and perform the audit to obtain reasonable assurance about whether the financial statements and financial highlights are free of material misstatement, whether due to error or fraud. Our audits included performing procedures to assess the risks of material misstatement of the financial statements and financial highlights, whether due to error or fraud, and performing procedures that respond to those risks. Such procedures included examining, on a test basis, evidence regarding the amounts and disclosures in the financial statements and financial highlights. Such procedures also included confirmation of securities owned as of July 31, 2020, by correspondence with custodians and brokers, or by other appropriate auditing procedures. Our audits also included evaluating the accounting principles used and significant estimates made by management, as well as evaluating the overall presentation of the financial statements and financial highlights. We believe that our audits provide a reasonable basis for our opinion.
We have served as the auditor of one or more Domini investment companies since 1993.
Boston, Massachusetts
September 28, 2020
135
THE DOMINI FUNDS
TAX INFORMATION (UNAUDITED)
FOR THE YEAR ENDED JULY 31, 2020
The amount of long-term capital gains paid for the year ended July 31, 2020 was as follows:
| | | | |
Domini Impact International Equity Fund | | $ | - | |
Domini Impact Equity Fund | | | 15,320,008 | |
Domini Sustainable Solutions Fund | | | - | |
Domini Impact Bond Fund | | | - | |
For dividends paid from net investment income during the year ended July 31, 2020, the Funds designated the following as Qualified Dividend Income:
| | | | |
Domini Impact International Equity Fund | | $ | 23,160,029 | |
Domini Impact Equity Fund | | | 12,807,031 | |
Of the ordinary distributions made by the Domini Impact Bond Fund during the fiscal year ended July 31, 2020, 36% has been derived from investments in US Government and Agency Obligations. All or a portion of the distributions from this income may be exempt from taxation at the state level. Consult your tax advisor for state specific information.
For corporate shareholders, 100% of dividends paid from net investment income for the Domini Impact Equity Fund were eligible for the corporate dividends received deduction.
| | | | | | | | | | | | | | | | |
| | | Foreign Tax Paid | | | Foreign Source Income | |
| | | TOTAL | | | PER SHARE | | | TOTAL | | | PER SHARE | |
| | | | | | | | | | | | | | | | |
Domini Impact International Equity Fund | | $ | 2,604,992 | | | $ | 0.02 | | | $ | 28,180,164 | | | $ | 0.19 | |
Domini Impact Equity Fund | | | - | | | | - | | | | - | | | | - | |
Domini Sustainable Solutions Fund | | | - | | | | - | | | | - | | | | - | |
Domini Impact Bond Fund | | | - | | | | - | | | | - | | | | - | |
The foreign taxes paid or withheld per share represent taxes incurred by the Funds on interest and dividends received by the Fund from foreign sources. Foreign taxes paid or withheld should be included in taxable income with an offsetting deduction from gross income or as a credit for taxes paid to foreign governments. Consult your tax advisor regarding the appropriate treatment of foreign taxes paid.
136
APPROVAL OF AMENDED AND RESTATED MANAGEMENT AGREEMENT AND SUBMANAGEMENT AGREEMENT WITH RESPECT TO DOMINI SUSTAINABLE SOLUTIONS FUND (UNAUDITED)
Section 15(c) of the Investment Company Act of 1940, as amended (the “1940 Act”) requires that each mutual fund’s board of trustees, including a majority of those trustees who are not “interested persons” of the mutual fund, as defined in the 1940 Act (the “Independent Trustees”), consider and approve the fund’s investment management and submanagement agreements. At its meeting held on October 29, 2019, the Board of Trustees (“Board” or “Trustees”) of the Domini Investment Trust (the Trust”), including all of the Independent Trustees, voted to approve the: (i) the Amended and Restated Management Agreement with Domini Impact Investments LLC (“Domini”) for the Domini Sustainable Solutions Fund (the “Sustainable Solutions Fund” or “Fund’)(the “Management Agreement”) with Domini Impact Investments LLC (“Domini” or the “Adviser”), and (ii) the Submanagement Agreement between Domini and SSGA Funds Management, Inc. (“SSGA” or “Subadviser”), with respect to the Sustainable Solutions Fund (the “Submanagement Agreement” and with the Management Agreement, the “Agreements”).
Prior to the October 29, 2019, meeting, the Board requested, received, and reviewed written responses from Domini and SSGA to questions posed to them on behalf of the Independent Trustees and supporting materials relating to those questions and responses. The Board considered both written and verbal information furnished to the Board at its meetings throughout the year, as well as information specifically prepared in connection with the approval of the Agreements at the Board’s meeting on October 29, 2019. In addition, the Trustees also reviewed and discussed the proposal relating to the Fund at its regular July 2019 quarterly meeting and at a special meeting held on September 24, 2019. Information provided to the Board at its meetings throughout the year included, among other things, reports on performance, legal and compliance matters, sales and marketing activity, shareholder services, and the other service provided to other Domini Funds by SSGA and Domini and their affiliates.
The Board considered the Management Agreement and the Submanagement Agreement separately in the course of its review. In doing so, the Board noted the respective roles of the Adviser and Subadviser in providing services to the Fund.
Throughout the process, the Board had the opportunity to ask questions of and request additional information from Domini and SSGA. The Board was assisted by legal counsel for the Trust and the Independent Trustees were also separately assisted by independent legal counsel throughout the process. The Independent Trustees also received memoranda from counsel to the Trust discussing the legal standards for their consideration of the Agreements. The Independent Trustees
137
were advised by and met in executive sessions with their independent legal counsel at which no representatives of management were present to discuss the proposed continuation of the Agreements, including at meetings on September 24, October 28 and October 29, 2019.
In connection with the Board’s consideration of the approval of the Agreement with respect to the Fund, the Board received written materials in advance of the meeting, which included information regarding: (i) the nature, extent, and quality of services to be provided to the Fund by Domini and by SSGA; (ii) a description of Domini and SSGA’s proposed investment management and other personnel and their background and experience; (iii) an overview of Domini’s and SSGA’s operations and financial condition; (iv) a comparison of the Funds’ estimated advisory fee and overall expenses with those of comparable mutual funds selected by Strategic Insight, a third party provider of mutual fund data; (v) performance information for Domini’s comparably managed accounts; (vi) the anticipated level of profitability from Domini and SSGA’s relationships with respect to the Fund; (vii) a description of Domini’s and SSGA’s brokerage practices (including any soft dollar arrangements); and (viii) Domini’s and SSGA’s compliance policies and procedures, including policies and procedures for personal securities transactions and with respect to cybersecurity, business continuity and disaster recovery.
In reaching their determination to approve the Management Agreement and Submanagement Agreement with respect to the Fund, the Trustees reviewed and evaluated information and a variety of factors that they believed relevant and appropriate through the exercise of their reasonable business judgment. The Trustees’ determination to approve the Agreements was based on a comprehensive consideration of all written and verbal information provided to the Board about Domini and SSGA throughout the year and specifically with respect to the approval of such Agreements, as applicable. In this regard, in addition to the meeting at which approval of the Submanagement Agreement was considered, the Trustees also reviewed and discussed the proposal relating to the Fund at its regular July 2019 quarterly meeting and at a special meeting held on September 24, 2019.
APPROVAL OF THE MANAGEMENT AGREEMENT
The primary factors and the conclusions regarding the Management Agreement are described below. The Board did not identify any particular information or factor that was all-important or controlling, and each Trustee may have weighted certain factors differently. The Board noted that the evaluation process with respect to Domini and the Management Agreement is an ongoing one. In evaluating the Management Agreement, the Trustees also took into account their knowledge of Domini, its proposed services with respect to the Fund, and the other Domini funds resulting from their meetings and other information and interactions in past years. The Board also considered other
138
factors (including conditions and trends prevailing generally in the economy, the securities markets and the industry).
Nature, Quality, and Extent of Services Provided. The Trustees reviewed information and materials provided by Domini related to the Management Agreement, including the Management Agreement, Domini’s Form ADV, a description of the firm and its organizational and management structure, its operational history and its legal and regulatory history, the manner in which investment decisions are expected to be made and executed with respect to the Fund, the financial condition of Domini and its ability to provide the services required under the Management Agreement, an overview of the personnel that are expected to perform services for the Fund, and Domini’s compliance policies and procedures. The Board also considered Domini’s risk management processes and its policies and procedures with respect to cybersecurity, business continuity and disaster recovery.
The Trustees reviewed the terms of the Management Agreement and considered that, pursuant to the Management Agreement, Domini, subject to the direction of the Board, is responsible for providing advice and guidance with respect to the Fund and for managing the investment of the assets of the Fund, including by engaging and overseeing the activities of the Fund’s submanager. It was noted that Domini would apply its social and environmental standards to select the Fund’s investments and that SSGA Funds Management, Inc. (“SSGA”), the Fund’s submanager, would be responsible for purchasing and selling securities to implement Domini’s selections and manage the amount of the Fund’s assets to be held in short-term investments.
The Trustees considered the scope and the quality of the services to be provided by Domini to the Fund under the Management Agreement. They considered the professional experience, tenure, and qualifications of the investment management team and the other senior personnel at Domini who will be responsible for the management of the Fund, including the oversight of the Fund’s submanager. They also considered Domini’s capabilities and experience in the development and application of social and environmental investment standards and its reputation and leadership in the socially responsible investment community. The Trustees considered the information they had received from Domini concerning the professional experience of its research team. They noted that the senior members of Domini’s research team had years of experience in the development and application of social and environmental investment standards. The terms of the Management Agreement were also reviewed by the Trustees. In addition, they considered Domini’s compliance record. The Trustees also noted that, on a regular basis, they receive information from the Trust’s Chief Compliance Officer (CCO) regarding Domini’s compliance policies and procedures, including its Code of Ethics. The Trustees took into account the scope of compliance services to be provided by Domini and the undertakings required of Domini in connection with those
139
services. They also considered the quality of Domini’s compliance oversight program with respect to the Fund’s service providers, including the Fund submanager. They also considered both the investment advisory services and the nature, quality and extent of the administrative and other non-advisory services, including shareholder servicing and distribution support services to be provided to the Fund and its shareholders by Domini and its affiliates. The Board also considered the significant risks Domini would assume in connection with the services to be provided to the Fund, including entrepreneurial risk and ongoing risks including investment, operational, enterprise, litigation, regulatory and compliance risks with respect to the Fund.
The Trustees noted that Domini will administer the Fund’s business and other affairs pursuant to the Management Agreement. It was noted that, among other things, Domini will provide the Fund with office space, administrative services and personnel as are necessary for operations, and that Domini will pay all of the compensation of the officers and the Trustees who are not Independent Trustees. The Trustees considered the quality of the administrative services Domini will provide to the Fund, including Domini’s role in coordinating and monitoring the activities of service providers. They noted that they were satisfied with the quality of the management and administrative services to be provided by Domini to the Fund, particularly Domini’s oversight of the Fund’s submanager and development and application of social and environmental investment standards.
Based on the foregoing, the Trustees concluded that the nature, quality and extent of services to be provided by Domini to the Fund under the Management Agreement were expected to be satisifactory.
Performance Information. The Trustees did not consider the Fund’s performance in approving the Management Agreement because the Fund has not commenced operations and does not have a performance history. The Trustees considered the investment performance of a separate account managed by Domini that has the same investment objective and similar investment stratregies as the Fund. Among other performance data considered, the Trustees reviewed the net investment performance of the separate account based on data provided to them by Domini for various time periods, including for the year-to-date, 1-, 3- and 5-year periods, and since the inception of that account. The Trustees compared these investment returns to the returns of the proposed benchmark index for the Fund for the same periods. The Trustees also took into account management’s discussion of the Fund’s anticipated performance. The Trustees concluded that they had confidence in Domini’s overall capability to manage the Fund.
Fees and Other Expenses. The Trustees considered the proposed management fees to be paid by the Fund to Domini, the proposed submanagement fees to be paid by Domini to the Fund’s submanager, the portion of the fees to be retained
140
by Domini, and Domini’s contractual expense limitation arrangement with respect to the Fund.
The Trustees considered the information provided to them by Strategic Insight including data relating to the level of the Fund’s proposed management fee versus the aggregate management fee for the relevant Strategic Insight peer groups of SRI and non-SRI funds and compared the Fund’s total expense ratio, after giving effect to contractual fee waiver arrangements, to the total expense ratio of those peers. The Trustees also considered that Domini (and not the Funds) would pay the Fund’s submanager from its advisory fee.
Based on the information provided by Strategic Insight, the Trustees noted that the proposed aggregate management fees for the Fund’s Investor shares, after giving effect to Domini’s contractual fee waiver arrangement, were below the median aggregate management fees of its SRI and non-SRI peer group net of applicable waivers. They also considered that the total expense ratio of the Fund’s Investor shares, after giving effect to the contractual expense waivers, was above the median total expense ratio of the SRI and non-SRI peer groups after waivers.
The Board took into account management’s discussion of the Fund’s anticipated expenses, including regarding the differences between the amount of those expenses and the expenses borne by the funds in the Fund’s expense peer group, as well as the impact of the size of the Domini fund complex on expenses relative to those of the other funds in the Fund’s peer group. The Board also noted management’s discussion of the management fee structure and considered that Domini would be waiving and/or reimbursing expenses for the Fund.
Based on the foregoing, the Trustees concluded that the proposed management fees payable by the Fund were fair and reasonable in relation to the nature and quality of services to be provided and supported approval of the Management Agreement.
Costs of Services Provided and Profitability. The Trustees reviewed information provided to them by Domini concerning the estimated costs to be borne by and profitability of Domini in respect of its management relationship with the Fund for the 2020 calendar year, along with a description of the methodology used by Domini in preparing the profitability information. The Trustees also noted that Domini would pay the submanagement fees for the Fund out of the management fees that it received from the Fund. The Trustees also considered that Domini would enter into an expense limitation arrangement with respect to the Fund. The Board also took into account the risks that Domini would assume as Adviser including entrepreneurial, operational, reputational, litigation and regulatory risk. The Trustees concluded that they were satisfied that the estimated level of profitability of Domini and its affiliates with respect to the services to be provided to the Fund was not excessive in view of the nature, quality and extent of services to be provided.
141
Economies of Scale. The Trustees also considered whether economies of scale would be realized by Domini as the Fund’s assets increased and the extent to which such economies of scale were reflected in the proposed fees to be charged with respect to the Fund under the Management Agreement. The Trustees noted that there were breakpoints in the management fee schedule. The Trustees concluded that breakpoints were an effective way to share economies of scale and that this was a positive factor in support of the approval of the Management Agreement.
Other Benefits. The Trustees considered the other benefits that Domini and its affiliates would receive from their relationship with the Fund. The Trustees also considered that Domini’s profitability would be lower if the benefits described above were not received. The Trustees considered the brokerage practices of Domini and noted that, based on information provided to them, Domini would was not expected to receive the benefits of soft dollar commissions with respect to the Fund. The Trustees also considered the intangible benefits that may accrue to Domini and its affiliates by virtue of their relationship with the Fund. The Trustees concluded that the benefits to be received by Domini and its affiliates, as outlined above, were reasonable in the context of the relationship between Domini and the Fund, and supported the approval of the Management Agreement.
APPROVAL OF THE SUBMANAGEMENT AGREEMENT
The primary factors and the conclusions regarding the Submanagement Agreement are described below. The Trustees did not identify any particular information or factor that was all-important or controlling, and each Trustee may have weighted certain factors differently. The Trustees noted that the evaluation process with respect to SSGA and the Submanagement Agreement is an ongoing one. In evaluating the Submanagement Agreement, the Trustees took into account their knowledge of SSGA, its proposed services with respect to the Fund and the other Domini Funds resulting from their meetings and other information and interactions in past years. The Board also considered other factors (including conditions and trends prevailing generally in the economy, the securities markets and the industry).
Nature, Quality, and Extent of Services Provided. The Trustees reviewed information and materials provided by SSGA related to the Submanagement Agreement, including the Submanagement Agreement, SSGA’s Form ADV, a description of the firm and its organizational and management structure, its operational history and its legal and regulatory history, the manner in which investment decisions are expected to be made and executed with respect to the Fund, the financial condition of SSGA and its ability to provide the services required under the Submanagement Agreement, an overview of the personnel that are expected to perform services for the Fund, and SSGA’s compliance policies and procedures. The Board also considered SSGA’s risk management
142
processes and its policies and procedures with respect to cybersecurity, business continuity and disaster recovery.
The Trustees reviewed the terms of the Submanagement Agreement and considered the scope and quality of the services to be provided by SSGA to the Fund under the Submanagement Agreement. The Trustees noted that pursuant to the Submanagement Agreement, Domini, subject to the direction of the Board, is responsible for providing advice and guidance with respect to the Fund and for managing the investment of the assets of the Fund, which it proposed to do by engaging and overseeing the activities of SSGA. It was noted that Domini would apply its social and environmental standards to select the Fund’s investments and that SSGA would be responsible for purchasing and selling securities to implement Domini’s selections and for managing the amount of the Fund’s assets to be held in short-term investments.
The Trustees then considered the professional experience, tenure, and qualifications of the proposed portfolio management team of the Fund and the other senior personnel at SSGA. They also reviewed SSGA’s compliance record. The Trustees also noted that, on a regular basis, it receives information from the Trust’s Chief Compliance Officer regarding SSGA’s compliance policies and procedures, including its Code of Ethics. The Trustees also received information with respect to SSGA’s brokerage policies and practices, including with respect to best execution and soft dollars. The terms of the Submanagement Agreement were also reviewed by the Trustees.
Based on the foregoing, the Trustees concluded that the nature, quality and extent of services to be provided by SSGA to the Fund under the Submanagement Agreement were expected to be satisfactory.
Performance Information. The Trustees did not consider the Fund’s performance in approving the Submanagement Agreement because the Fund has not commenced operations and does not have a performance history.
Fees and Other Expenses. The Trustees then considered the proposed submanagement fees to be paid by Domini to SSGA under the Submanagement Agreement. The Trustees noted that the Submanagement Agreement had been negotiated at arms-length between Domini and SSGA. The Trustees also compared SSGA’s proposed fee with respect to the Fund against the submanagement fees paid by another Domini Fund submanaged by SSGA under a similar submanagement structure and took into account the different investment strategies of each Fund. The Trustees also noted the comparative sub-advisory fee information, as available, in the report provided by Strategic Insight with respect to the Fund. The Trustees noted that Domini (and not the Fund) would pay SSGA from its management fee and that they had reviewed the proposed management fee and comparative fee information in connection with their consideration of the Management Agreement.
143
The Trustees determined, based on the nature and quality of the services to be provided by SSGA, and in light of the preceding factors, that the fees to be paid by Domini to SSGA with respect to the Fund were fair and reasonable in relation to the nature and quality of services provided and supported approval of the Submanagement Agreement.
Costs of Services Provided and Profitability. Among other information, the Trustees reviewed SSGA’s financial statements. The Trustees concluded that they were satisfied that the estimated level of profitability of SSGA with respect to services provided to the Fund was not excessive. However, the Board also took into account that the Submanagement Agreement was negotiated on an arms-length basis and that Domini, and not the Fund, would pay the cost of the submanagement fees to be paid to SSGA and that, therefore, the costs of the services to be provided and the profitability to be realized by SSGA was not a material factor in the Board consideration.
Economies of Scale. The Trustees also considered whether economies of scale would be realized by SSGA as the assets in the Fund increased and the extent to which economies of scale were reflected in the proposed fees to be charged under the Submanagement Agreement. The Trustees noted that the submanagement fees would be paid by Domini and not the Fund. However, the Trustees noted the breakpoints in fees payable under the Submanagement Agreement, as well as breakpoints in the fees payable to Domini under the Management Agreement for the Fund, and concluded that such breakpoints were an effective way to share economies of scale with shareholders as the assets in the Fund grew and supported the approval of the Submanagement Agreement.
Other Benefits. The Trustees considered the other benefits that SSGA and its affiliates received from their relationship with the Fund. They considered that SSGA’s affiliate, State Street Bank & Trust Company, provides custody, fund accounting and administration serivces to the Domini Funds, including the Fund. The Trustees also considered the brokerage practices of SSGA including its use of soft dollar arrangements. In addition, the Trustees considered the intangible benefits that may accrue to SSGA and its affiliates by virtue of their relationship with the Fund.
The Trustees concluded that the benefits to be received by SSGA and its affiliates, as noted above, were reasonable in the context of the relationship between SSGA and the Fund and supported the approval of the Submanagement Agreement.
* * * * * *
Based on the Board’s evaluation of all factors that the Board deemed to be material, including those factors described above, the Board, including the Independent Trustees, concluded that approval of the Management Agreement
144
and the Submanagement Agreement would be in the best interest of the Fund and its shareholders. Accordingly, the Board, and the Independent Trustees voting separately, approved the Management Agreement and Submanagement Agreement.
145
APPROVAL OF CONTINUANCE OF MANAGEMENT AND SUBMANAGEMENT AGREEMENTS WITH RESPECT TO THE DOMINI IMPACT EQUITY FUND, DOMINI IMPACT INTERNATIONAL EQUITY FUND AND DOMINI IMPACT BOND FUND (UNAUDITED)
Section 15(c) of the Investment Company Act of 1940, as amended (the “1940 Act”) requires that each mutual fund’s board of trustees, including a majority of those trustees who are not “interested persons” of the mutual fund, as defined in the 1940 Act (the “Independent Trustees”), annually review and consider the fund’s investment management and submanagement agreements. At its meeting held on April 28, 2020, the Board of Trustees (“Board” or “Trustees”) of the Domini Investment Trust (the Trust”), including all of the Independent Trustees, voted to approve the continuance of: (i) the Amended and Restated Management Agreement with Domini Impact Investments LLC (“Domini”) for the Domini Impact Equity Fund (“Equity Fund”) and Domini Impact International Equity Fund (“International Fund”) and the Amended and Restated Management Agreement with respect to the Domini Impact Bond Fund (the “Bond Fund”)(each a “Management Agreement” and collectively, the “Management Agreements”) with Domini Impact Investments LLC (“Domini” or the “Adviser”), and (ii) the Submanagement Agreement between Domini and SSGA Funds Management, Inc. (“SSGA” or “Subadviser”) with respect to the Equity Fund, the Amended and Restated Submanagement Agreement between Domini and Wellington Management Company LLP (“Wellington Management” or “Subadviser”) with respect to the International Fund and the Amended and Restated Submanagement Agreement between Domini and Wellington Management with respect to the Bond Fund (each a “Submanagement Agreement” and collectively, the “Submanagement Agreements” and with the Management Agreements, the “Agreements”). The Equity Fund, International Fund and Bond Fund are each referred to as a “Fund” and collectively, the “Funds.”
Prior to the April 28, 2020, meeting, the Board requested, received, and reviewed written responses from Domini, SSGA and Wellington Management to questions posed to them on behalf of the Independent Trustees and supporting materials relating to those questions and responses. The Board considered both written and verbal information furnished to the Board at its meetings throughout the year, as well as information specifically prepared in connection with the approval of the continuation of the Agreements at the Board’s meeting on April 15, 2020. Information provided to the Board at its meetings throughout the year included, among other things, reports on each Fund’s performance, legal and compliance matters, sales and marketing activity, shareholder services, and the other service provided to the Funds by SSGA, Wellington Management, and Domini and their affiliates.
146
The Board considered the Management Agreements and the Submanagement Agreements separately in the course of its review. In doing so, the Board noted the respective roles of the Adviser and Subadviser in providing services to the Funds.
Throughout the process, the Board had the opportunity to ask questions of and request additional information from Domini, SSGA, and Wellington Management. The Board was assisted by legal counsel for the Trust and the Independent Trustees were also separately assisted by independent legal counsel throughout the process. The Independent Trustees also received memoranda from counsel to the Trust discussing the legal standards for their consideration of the Agreements. The Independent Trustees were advised by and met in executive sessions with their independent legal counsel at which no representatives of management were present to discuss the proposed continuation of the Agreements, including prior to the April 28, 2020, meeting.
In connection with the Board’s consideration of the renewal of the Agreements with respect to each of the Funds, the Board received written materials in advance of the meeting, which included information regarding: (i) the nature, extent, and quality of services provided to the Funds by Domini and by Wellington Management; (ii) a description of Domini, SSGA’s, and Wellington Management’s investment management and other personnel and their background and experience; (iii) an overview of Domini’s, SSGA’s, and Wellington Management’s operations and financial condition; (iv) a comparison of each Funds’ advisory fee and overall expenses with those of comparable mutual funds selected by Strategic Insight, a third party provider of mutual fund data; (v) performance information for comparable mutual funds and for comparatively managed accounts, if any; (vi) the level of profitability from Domini, SSGA, and Wellington Management’s relationships with the Funds; (vii) a description of Domini’s, SSGA’s, and Wellington Management’s brokerage practices (including any soft dollar arrangements); and (viii) Domini’s, SSGA’s, and Wellington Management’s compliance policies and procedures, including policies and procedures for personal securities transactions and with respect to cybersecurity, business continuity and disaster recovery.
In reaching their determination to approve the continuance of the Management Agreements and Submanagement Agreements with respect to each Fund, the Trustees reviewed and evaluated information and a variety of factors that they believed relevant and appropriate through the exercise of their reasonable business judgment. The Trustees’ determination to approve the continuation of each Agreement was based on a comprehensive consideration of all written and verbal information provided to the Board throughout the year and specifically with respect to the continuation or approval of such Agreements, as applicable, as well as information considered in connection with continuation or initial approval of the Agreements in prior years. In addition to the April 28, 2020, meeting at which continuation of the Agreements was considered, the Independent Trustees met separately on April 15, 2020, and reviewed and discussed such Agreements.
147
APPROVAL OF THE MANAGEMENT AGREEMENTS
The primary factors and the conclusions regarding the Management Agreements with respect to each Fund are described below. The Board did not identify any particular information or factor that was all-important or controlling, and each Trustee may have weighted certain factors differently. The Trustees noted that the evaluation process with respect to Domini and the Management Agreements is an ongoing one. In evaluating the Management Agreements, the Trustees also took into account their knowledge of Domini, its services and the Funds resulting from their meetings and other information and interactions in past years. The Board also considered other factors (including conditions and trends prevailing generally in the economy, the securities markets and the industry).
Nature, Quality, and Extent of Services Provided. The Trustees reviewed information and materials provided by Domini related to the Management Agreement with respect to each Fund, including each Management Agreement, Domini’s Form ADV, a description of the firm and its organizational and management structure, its operational history and its legal and regulatory history, the manner in which investment decisions are made and executed, the financial condition of Domini and its ability to provide the services required under the Management Agreements, an overview of the personnel that perform services for the Funds, and Domini’s compliance policies and procedures. The Board also considered Domini’s risk management processes and its policies and procedures with respect to cybersecurity, business continuity and disaster recovery. The Board considered Domini’s financial condition and operations during the COVID-19 pandemic and noted that there had been no material disruption of Domini’s services to the Funds and that Domini had continued to provide the same level, quality and extent of services to the Funds.
The Trustees reviewed the terms of the Management Agreements and considered that, pursuant to each Management Agreement, Domini, subject to the direction of the Board, is responsible for providing advice and guidance with respect to each Fund and for managing the investment of the assets of each Fund, including by engaging and overseeing the activities of each Fund’s Subadviser. It was noted that, with respect to the Equity Fund, Domini applies its environmental and social standards to select such Fund’s investments and that SSGA Funds Management, Inc. (“SSGA”), the Fund’s subadviser, purchases and sells securities to implement Domini’s selections and for managing the amount of the Fund’s assets to be held in short-term investments. It was noted that, with respect to the International Equity Fund and the Bond Fund, Domini applies its environmental and social standards to a universe of securities provided by Wellington Management Company LLP (“Wellington Management”), such Funds’ subadviser, and that Wellington Management provides the day-to-day portfolio management of such Funds, including making purchases and sales of eligible portfolio securities consistent with each such Fund’s investment objective and policies.
148
The Trustees considered the scope and the quality of the services provided by Domini to each Fund under the respective Management Agreement. They considered the professional experience, tenure, and qualifications of the investment management team and the other senior personnel at Domini who are responsible for the management of the Funds, including the oversight of each Fund’s subadviser. They also considered Domini’s capabilities and experience in the development and application of environmental and social investment standards and its reputation and leadership in the socially responsible investment community. The Trustees considered the information they had received from Domini concerning the professional experience of its research team. They noted that the senior members of Domini’s research team had years of experience in the development and application of environmental and social investment standards. The terms of each Management Agreement were also reviewed by the Trustees. It was noted that no change to services was proposed. In addition, they considered Domini’s compliance record. The Trustees also noted that, on a regular basis, they receive information from the Trust’s Chief Compliance Officer (CCO) regarding Domini’s compliance policies and procedures, including its Code of Ethics. The Trustees also took into account that the scope of services provided by Domini and the undertakings required of Domini in connection with those services, including maintaining and monitoring its own and the Funds’ compliance programs, had expanded over time as a result of regulatory, market and other developments. In this regard, they considered Domini’s services with respect to compliance with reporting modernization and liquidity risk management requirements. They also considered the quality of Domini’s compliance oversight program with respect to the Funds’ service providers, including each Fund’s subadviser. They also considered both the investment advisory services and the nature, quality and extent of the administrative and other non-advisory services, including shareholder servicing and distribution support services that are provided to the Funds and its shareholders by Domini and its affiliates. The Board also considered the significant risks assumed by Domini in connection with the services provided to the Funds, including entrepreneurial risk and ongoing risks including investment, operational, enterprise, litigation, regulatory and compliance risks with respect to the Funds.
The Trustees noted that Domini administers each Fund’s business and other affairs pursuant to the Management Agreements, and with respect to the Equity Fund, also pursuant to a Sponsorship Agreement, and with respect to the Bond Fund, also pursuant to an Administration Agreement. It was noted that, among other things, Domini provides each Fund with office space, administrative services and personnel as are necessary for operations, and that Domini pays all of the compensation of the officers and the Trustees who are not Independent Trustees. The Trustees considered the quality of the administrative services Domini provided to each Fund, including Domini’s role in coordinating and monitoring the activities of service providers. They noted that they were
149
satisfied with the quality of the management and administrative services provided by Domini to each Fund, particularly Domini’s oversight of each Fund’s subadviser and development and application of environmental and social investment standards.
Based on the foregoing, the Trustees concluded that they were satisfied with the nature, quality and extent of services provided by Domini to each Fund under the respective Management Agreement.
Performance Information. The Trustees considered the investment performance of each of the Funds. They considered whether the Funds had operated within their respective investment objectives, as well as their compliance with their investment restrictions. Among other performance data considered, the Trustees reviewed the net investment performance of each of the Funds based on data provided to them by Domini for various time periods, including for the 1-, 3-, 5- and 10-year periods ended December 31, 2019. The Trustees compared these investment returns to the returns of each Fund’s respective benchmark index for the same periods. The Trustees also compared each Fund’s Investor shares’ net investment returns for the 1-, 3-, 5-, and 10-year periods as of February 29, 2020 to the performance of a peer group of socially responsible (SRI) funds and non-SRI Funds, as applicable, as identified by Strategic Insight, an independent third-party data provider.
The Board noted that while it found the data provided by the third-party data provider generally useful, the Board recognized the data’s limitations, including in particular that the data may vary depending on the end date selected and that the results of the performance comparisons may vary depending on the selection of the performance peer group. The Board also took into account management’s discussion of the Morningstar categories in which the Funds were placed, including any differences between each Fund’s investment strategy and the strategy of the funds in that Fund’s respective category, as well as compared to the peer group selected by the independent third-party data provider.
Among other performance data considered, the Trustees took into account the following:
Equity Fund
The Trustees considered that, based on data provided by Strategic Insight, the Equity Fund’s Investor shares had positive net investment performance for all periods ended February 29, 2020, and had outperformed relative to the applicable SRI peer group for the 1-year period and underperformed for the 3-, 5- and 10- year periods ended February 29, 2020 compared to the group’s average performance for the same period. The Trustees also noted that the Fund’s net investment returns outperformed relative to the Fund’s benchmark for the 1-year period and underperformed for the, 3-, 5- and 10-year periods ended December 31, 2019.
150
The Trustees took into account Domini’s discussion of the Fund’s performance relative to its peers and benchmark, and the actions taken to address the Fund’s performance including the changes to the Fund’s investment strategy and Subadviser that took effect December 1, 2018. The Board also noted Domini’s discussion of the Fund’s more recent improved performance since the change to the Fund’s investment strategy. The Trustees concluded that they had continued confidence in Domini’s overall capability to manage the Equity Fund.
International Fund
The Trustees considered that, based on data provided by Strategic Insight, the International Fund’s Investor shares had positive net investment returns for all periods ended February 29, 2020, except the 1-year period. The Trustees considered that the International Fund’s Investor shares had underperformed the applicable SRI peer group average for the 1-, 3-, 5- and 10-year periods. The Trustees also noted that the International Fund had outperformed relative to the Fund’s benchmark for the 10-year period ended December 31, 2019 and had underperformed for the 1-, 3- and 5-year periods.
The Trustees considered Domini’s and Wellington Management’s discussion of the Fund’s performance over various periods, including the performance of its quantitative model, the impact of current market conditions on the Fund’s investment style and took into account management’s discussion of the Fund’s performance over the longer term. The Trustees took into account the actions taken by management to address the Fund’s underperformance. The Trustees concluded that they had continued confidence in Domini’s overall capability to manage the International Fund.
Bond Fund
The Trustees considered that, based on data provided by Strategic Insight, the Bond Fund’s Investor shares had outperformed the applicable SRI peer groups compared to each group’s average performance for the 1-, and 3-year periods and underperformed for the 5- and 10-year periods. The Bond Fund’s Investor shares had outperformed the non-SRI peer group’s average performance for the 1-, 3-, and 5-year periods and had underperformed for the 10-year period. The Trustees also noted that the Bond Fund had outperformed relative to the Fund’s benchmark for the 1-year period ended December 31, 2019, and underperformed for the 3-, 5-, and 10-year periods.
The Trustees considered Domini’s discussion of the Fund’s performance, including its strong performance over the more recent periods relative to the funds in its peer groups and the impact of the performance of the Bond Fund for periods prior to the change in the Fund’s Subadviser to Wellington Management and the change in the Fund’s benchmark to the Barclays U.S. Aggregate Bond Index in January 2015 on the longer-term periods. The Trustees concluded that they had continued confidence in Domini’s overall capability to manage the Bond Fund.
151
Fees and Other Expenses. The Trustees considered the management fees paid by each Fund to Domini, the submanagement fees paid by Domini to each Fund’s subadviser with respect to each Fund, the portion of the fees retained by Domini, and Domini’s contractual expense limitation arrangement with respect to each Fund. It was noted that the management fee for each Fund was lowered in 2017. It was noted that the management fee for the Equity Fund had been lowered further in connection with the changes to the Fund’s investment strategy and Subadviser that took effect December 1, 2018. The Trustees also considered the sponsorship fee rate paid by the Equity Fund to Domini under the Sponsorship Agreement and the administrative fee paid by the Bond Fund to Domini under the Administration Agreement and the services provided under each such agreement. The Board took into account management’s discussion of the Funds’ expenses, including the differences between the amount of those expenses and the expenses borne by the funds in the Funds’ respective expense peer groups, as well as the impact of the size of the Domini fund complex on expenses relative to those of the other funds in each Fund’s respective peer group. The Board also took into account the level and type of services provided by Domini to the Funds. The Board also noted management’s discussion of the management fee structure with respect to each Fund and considered that Domini was waiving and/or reimbursing certain expenses for each of the Funds.
The Trustees also considered the information provided to them by Strategic Insight including data relating to the level of the each Fund’s management fee (aggregate of any sponsorship or administrative fee, as applicable) versus the aggregate management fee (which includes advisory and administrative fees) for the relevant Strategic Insight peer groups of SRI and non-SRI funds and compared each Fund’s total expense ratio, after giving effect to contractual fee waiver arrangements, to the total expense ratio of those peers. The Trustees also considered that Domini (and not the Funds) pays each Fund’s subadviser from its advisory fee.
Among other expense data considered, the Trustees took into account the following:
Equity Fund
Based on the information provided by Strategic Insight, the Trustees noted that the aggregate management fees for the Equity Fund’s Investor shares, after giving effect to Domini’s contractual fee waiver arrangement and management fee reduction effective December 1, 2018, were the same as the median aggregate management fees of its SRI peer group net of applicable waivers. They also considered that the total expense ratio of the Equity Fund’s Investor shares, after giving effect to the applicable contractual expense waivers, was below the average total expense ratio of the SRI peer group after waivers.
152
International Fund
Based on the information provided by Strategic Insight, the Trustees considered that the aggregate management fees for the International Fund’s Investor shares were above the median aggregate management fees of the SRI peer group net of applicable waivers. They also noted that the total expense ratio of the International Fund’s Investor shares, after giving effect to waiver arrangements, above the median total expense ratio of the SRI peer group, but about the same as the average.
Bond Fund
Based on the information provided by Strategic Insight, the Trustees considered that the aggregate management fees for the Bond Fund’s Investor shares, after giving effect to Domini’s contractual fee waiver arrangement, were below the median aggregate management fees of the relevant SRI and non-SRI peer groups, after waivers. They also noted that the total expense ratio of the Bond Fund’s Investor shares, after giving effect to applicable contractual expense waivers, was above the median total expense ratio of the SRI and non-SRI peer groups, after waivers.
Based on the foregoing, the Trustees concluded that management fees payable by each of the Funds were fair and reasonable in relation to the nature and quality of services provided and supported approval of the continuance of the Management Agreements.
Costs of Services Provided and Profitability. The Trustees reviewed information provided to them by Domini concerning the costs borne by and profitability of Domini in respect of its management relationship with each Fund and sponsorship relationship with the Equity Fund and administrative relationship with the Bond Fund for the 2019 calendar year, along with a description of the methodology used by Domini in preparing the profitability information. The Trustees also reviewed the financial results realized by Domini in connection with the operations of each Fund for December 31, 2019. The Board also considered more recent updated financial information that reflected the period during the COVID-19 pandemic. The Trustees also noted that Domini paid the submanagement fees for each of the Funds out of the management fees that it received from each Fund. The Trustees also considered that Domini had entered into expense limitation arrangements with respect to the Funds. The Board also took into account the risks that Domini assumes as Adviser including entrepreneurial, operational, reputational, litigation and regulatory risk. The Trustees concluded that they were satisfied that the level of profitability of Domini and its affiliates with respect to the services provided to each Fund was not excessive in view of the nature, quality and extent of services provided.
Economies of Scale. The Trustees also considered whether economies of scale would be realized by Domini as each Fund’s assets increased and the extent to
153
which such economies of scale were reflected in the fees charged with respect to each Fund under the Management Agreements. The Trustees noted that there were breakpoints in the fee schedules with respect to each Fund. The Trustees concluded that breakpoints were an effective way to share economies of scale and that this was a positive factor in support of the approval of the continuance of the Management Agreements.
Other Benefits. The Trustees considered the other benefits that Domini and its affiliates receive from their relationship with each Fund. The Trustees also considered the fees payable to Domini under the Sponsorship Agreement and Administration Agreement. The Trustees considered that Domini’s profitability would be lower if the benefits described above were not received. The Trustees considered the brokerage practices of Domini and noted that, based on information provided to them, Domini does not currently receive the benefits of soft dollar commissions with respect to the Funds. The Trustees also considered the intangible benefits that may accrue to Domini and its affiliates by virtue of their relationship with the Funds. The Trustees concluded that the benefits received by Domini and its affiliates, as outlined above, were reasonable in the context of the relationship between Domini and each of the Funds, and supported the approval of the continuance of the Management Agreements.
APPROVAL OF THE SUBMANAGEMENT AGREEMENTS
The primary factors and the conclusions regarding the Submanagement Agreements with respect to each Fund are described below. The Trustees did not identify any particular information or factor that was all-important or controlling, and each Trustee may have weighted certain factors differently. The Trustees noted that the evaluation process with respect to Wellington Management and the Submanagement Agreements is an ongoing one. In evaluating the Submanagement Agreements, the Trustees took into account their knowledge of SSGA and Wellington Management, and each of their services and the Funds resulting from their meetings and other information and interactions in past years. The Trustees also took into account the recommendations and performance evaluations of Domini with respect to SSGA and Wellington Management and considered other factors (including conditions and trends prevailing generally in the economy, the securities markets and the industry).
Nature, Quality, and Extent of Services Provided. The Trustees reviewed information and materials provided by SSGA and Wellington Management related to the Submanagement Agreements with respect to each Fund, including each Submanagement Agreement, SSGA and Wellington Management’s Form ADV, a description of each firm and its organizational and management structure, its operational history and its legal and regulatory history, the manner in which investment decisions are made and executed, the financial condition of SSGA and Wellington Management and its ability to provide the services required under the Submanagement Agreements, an overview of the
154
personnel that perform services for each Fund, and SSGA and Wellington Management’s compliance policies and procedures. The Board also considered SSGA’s and Wellington Management’s risk management processes and its policies and procedures with respect to cybersecurity, business continuity and disaster recovery. The Board considered the financial condition and operations of each of SSGA and Wellington Management during the COVID-19 pandemic and noted that there had been no material disruption of SSGA’s or Wellington Management’s services to the Funds and that SSGA and Wellington Management had each continued to provide the same level, quality and extent of services to the respective Funds.
The Trustees reviewed the terms of each Submanagement Agreement and considered the scope and quality of the services provided by SSGA amd Wellington Management to each Fund under the respective Submanagement Agreement. The Trustees noted that pursuant to each Submanagement Agreement, Domini, subject to the direction of the Board, is responsible for providing advice and guidance with respect to each Fund and for managing the investment of the assets of each Fund, which it does by engaging and overseeing the activities of SSGA and Wellington Management. It was noted, with respect to the Equity Fund, that Domini applies its environmental and social standards to select such Fund’s investments and that SSGA, the Fund’s subadviser, purchases and sells securities to implement Domini’s selections and for managing the amount of the Fund’s assets to be held in short-term investments. It was noted with respect to the International and Bond Funds, that Domini applies its environmental and social standards to a universe of securities provided by Wellington Management with respect to each Fund and that Wellington Management provides the day-to-day portfolio management of each Fund, including making purchases and sales of securities consistent with each Fund’s investment objective and policies and Domini’s environmental and social standards.
The Trustees then considered the professional experience, tenure, and qualifications of the portfolio management team of each Fund and the other senior personnel at SSGA and Wellington Management. They also reviewed SSGA and Wellington Management’s compliance record. The Trustees also noted that, on a regular basis, it receives information from the Trust’s Chief Compliance Officer (CCO) regarding SSGA and Wellington Management’s compliance policies and procedures, including its Code of Ethics. They noted SSGA and Wellington Management’s implementation of liquidity risk management reporting requirements required by SEC regulation. The Trustees noted that there were no material changes to the teams providing services to each Fund. The Trustees also received information with respect to SSGA and Wellington Management’s brokerage policies and practices, including with respect to best execution and soft dollars. The terms of the Submanagement Agreements were also reviewed by the Trustees.
155
Based on the foregoing, the Trustees concluded that they were satisfied with the nature, quality and extent of services provided by SSGA and Wellington Management to each Fund under the applicable Submanagement Agreement.
Performance Information. As noted above, the Trustees reviewed the investment performance (gross and net of all fees and expenses) of the Equity, International, and Bond Funds over various periods based on data provided to them by SSGA, Wellington Management and by Domini with respect to each Fund. This information was compared to performance information with respect to each Fund’s applicable benchmark. The Trustees also compared each Fund’s Investor shares’ net investment returns for the 1-, 3-, 5-, and 10-year periods as of February 29, 2020, to the performance of a peer group of socially responsible (SRI) funds and non-SRI Funds, as applicable, as identified by Strategic Insight, an independent third-party data provider. The Trustees also took into account Domini’s evaluation of SSGA and Wellington Management’s performance with respect to each Fund.
The Trustees concluded that they had continued confidence in SSGA’s and Wellington Management’s overall capability to manage the respective Fund(s) for which they served as Subadviser.
Fees and Other Expenses. The Trustees considered the submanagement fees paid by Domini to SSGA and Wellington Management under the Submanagement Agreements with respect to each Fund. The Trustees noted that each Submanagement Agreement had been negotiated at arms-length between Domini and SSGA or Wellington Management, as applicable. It was noted that the submanagement and management fees with respect to each Fund were lowered in 2017. It was noted that the management and submanagement fee for the Equity Fund had been lowered further in connection with the changes to the Fund’s investment strategy and Subadviser that took effect December 1, 2018. The Trustees noted SSGA’s representation that it does not manage any other client portfolios that have similar investment objectives and strategies to the Equity Fund because of the unique investment approach applied to the Fund (combining investment selection from Domini and trade implementation and management of short-term investments by SSGA). The Trustees noted Wellington Management’s representation that it does not manage any other client portfolios that have similar investment objectives and strategies to the Funds because of the unique investment approach applied to each of the Funds (combining proprietary analysis from Domini and Wellington Management). The Trustees also compared SSGA and Wellington Management’s fee with respect to each Fund against the other Funds and took into account the different investment strategies of each Fund. The Trustees also noted the comparative sub-advisory fee information, as available, in the report provided by Strategic Insight with respect to each Fund. The Trustees noted that, with respect to each Fund, Domini (and not the applicable Fund) pays SSGA and Wellington Management from its management fee and that they had
156
reviewed the management fee and comparative fee information in connection with their consideration of the Management Agreement with respect to each Fund.
The Trustees determined, based on the nature and quality of the services provided by Wellington Management, and in light of the preceding factors, that the fees paid by Domini to Wellington Management with respect to each Fund were fair and reasonable in relation to the nature and quality of services provided and supported approval of the continuance of the Submanagement Agreement with respect to each Fund.
Costs of Services Provided and Profitability.
Equity Fund
The Trustees reviewed SSGA’s audited financial statements for the year ended December 31, 2019. The Board noted that it would be difficult for SSGA to estimate profitability with respect to the Fund given the aggregated reporting used by the parent company. Based on the allocation methodology described and information provided, the Trustees concluded that they were satisfied that SSGA’s level of profitability with respect to services provided to the Fund was not excessive. However, the Board also took into account that the Submanagement Agreement was negotiated on an arms-length basis and that Domini paid the cost of the submanagement fees paid to SSGA and not the Fund and that, therefore, the costs of the services provided and the profitability realized by SSGA was not a material factor in the Board consideration.
International and Bond Funds
The Trustees reviewed Wellington Management’s audited statement of financial position as of December 31, 2019. The Trustees also reviewed a pro-forma income statement for the year ended December 31, 2019 provided by Wellington Management, which identified the revenues generated by the Funds as a separate item and reflected assumptions and estimates regarding operating expenses Based on the information provided, the Trustees concluded that they were satisfied that Wellington Management’s level of profitability with respect to services provided to that Fund was not excessive. However, the Board also took into account that the Submanagement Agreements were negotiated on an arms-length basis and that Domini paid the cost of the submanagement fees paid to Wellington Management and not the Funds and that, therefore, the costs of the services provided and the profitability realized by Wellington Management was not a material factor in the Board consideration.
Economies of Scale. The Trustees also considered whether economies of scale would be realized by SSGA and Wellington Management as the assets in each Fund increased and the extent to which economies of scale were reflected in the fee schedule for that Fund under each Submanagement Agreement. The Trustees noted that the submanagement fees are paid by Domini and not the
157
Fund. However, the Trustees noted the breakpoints in fees payable under each Submanagement Agreement with respect to each Fund, as well as breakpoints in the fees payable to Domini under the Management Agreement for each Fund, and concluded that such breakpoints were an effective way to share economies of scale with shareholders as the assets in each Fund grew and supported the approval of the applicable Submanagement Agreement.
Other Benefits. The Trustees considered the other benefits that SSGA and Wellington Management and their respective affiliates received from their relationship with the Funds. The Board noted that one of SSGA’s affiliates currently serves as the Funds’ Custodian. They noted in particular that none of Wellington Management or any of its affiliates provided any other services to the Funds. The Trustees also considered the brokerage practices of SSGA and Wellington Management including each entity’s use of soft dollar arrangements. In addition, the Trustees considered the intangible benefits that accrued to SSGA and Wellington Management and their respective affiliates by virtue of their relationship with the Funds.
The Trustees concluded that the benefits received by SSGA, Wellington Management, and their respective affiliates were reasonable in the context of the relationship between SSGA or Wellington Management, and each applicable Fund, and supported the approval of the Submanagement Agreements with respect to each Fund.
* * * * * *
Based on the Board’s evaluation of all factors that the Board deemed to be material, including those factors described above, the Board, including the Independent Trustees, concluded that renewal of the Management Agreements and the Submanagement Agreements would be in the best interest of the respective Fund and its shareholders. Accordingly, the Board, and the Independent Trustees voting separately, approved the Management Agreements and Submanagement Agreements respectively for an additional one-year period.
158
STATEMENT REGARDING LIQUIDITY RISK MANAGEMENT PROGRAM (UNAUDITED)
As required by law, the Domini Investment Trust (the “Trust”) has adopted and implemented a liquidity risk management program (the “Program”) for each series of the Trust (each a “Fund” and collectively, the “Funds”), that is designed to assess and manage liquidity risk. Liquidity risk is the risk that a Fund could not meet requests to redeem its shares without significant dilution of remaining investors’ interests in the Fund. The Funds’ Board of Trustees designated a liquidity risk management committee (the “Committee”) consisting of employees of Domini Impact Investments LLC (the “Adviser”) to administer the Program.
The Committee provided the Board of Trustees with a report through March 31, 2020 (the “Reporting Period”) that addressed the operation of the Program, assessed its adequacy and effectiveness of implementation, including, if applicable, the operation of any Highly Liquid Investment Minimum, and described any material changes that had been made to the Program or were recommended (the “Report”).
The Report confirmed that there were no material changes to the Program during the Reporting Period and that no changes were recommended.
The Report also confirmed that, throughout the Reporting Period, the Committee had monitored each Fund’s portfolio liquidity and liquidity risk on an ongoing basis, as described in the Program and in Board reporting throughout the Reporting Period.
The Report discussed the Committee’s annual review of the Program, which addressed, among other things, the following elements of the Program:
Assessment, Management, and Periodic Review of Liquidity Risk. The Committee reviewed each Fund’s investment strategy and liquidity of portfolio investments during both normal and reasonably foreseeable stressed conditions. The Committee noted that each Fund’s investment strategy continues to be appropriate for an open-end fund, taking into account, among other things, whether and to what extent the Fund held less liquid and illiquid assets and the extent to which any such investments affected the Fund’s ability to meet redemption requests. In managing and reviewing each Fund’s liquidity risk, the Committee also considered the extent to which the Fund’s investment strategy involves a relatively concentrated portfolio or large positions in particular issuers, the extent to which the Fund uses borrowing for investment purposes, and the extent to which the Fund uses derivatives (including for hedging purposes). The Committee also reviewed each Fund’s short-term and long-term cash flow projections during both normal and reasonably foreseeable stressed conditions. In assessing each Fund’s cash flow projections, the Committee considered, among other factors, historical net redemption activity, redemption
159
policies, ownership concentration, distribution channels, and the degree of certainty associated with the Fund’s short-term and long-term cash flow projections. The Committee also considered each Fund’s holdings of cash and cash equivalents, as well as borrowing arrangements and other funding sources as components of the Fund’s ability to meet redemption requests.
Liquidity Classification. The Committee reviewed the Program’s liquidity classification methodology for categorizing each Fund’s investments into one of four liquidity buckets. In reviewing each Fund’s investments, the Committee considered, among other factors, whether trading varying portions of a position in a particular portfolio investment or asset class in sizes the Fund would reasonably anticipate trading, would be reasonably expected to significantly affect liquidity.
Highly Liquid Investment Minimum. For each Fund, the Committee performed an analysis to determine whether the Fund is required to maintain a Highly Liquid Investment Minimum and determined that no such minimum is required because the Fund primarily holds highly liquid investments.
Compliance with Limitation on Illiquid Investments. The Committee confirmed that during the Reporting Period, no Fund acquired any illiquid investment such that, after the acquisition, the Fund would have invested more than 15% of its assets in illiquid investments that are assets, in accordance with the Program and applicable SEC rules.
Redemptions in Kind. The Committee confirmed that no redemptions in-kind were effected by a Fund during the Reporting Period.
The Report stated that the Committee concluded the Program operates adequately and effectively, in all material respects, to assess and manage each Fund’s liquidity risk throughout the Reporting Period.
160
TRUSTEES AND OFFICERS
The following table presents information about each Trustee and each Officer of the Domini Investment Trust (the “Trust”) as of July 31, 2020. Asterisks indicate that those Trustees and Officers are “interested persons” (as defined in the Investment Company Act of 1940) of the Trust. Each Trustee and each Officer of the Trust noted as an interested person is interested by virtue of his or her position with Domini Impact Investments LLC as described below. Unless otherwise indicated below, the address of each Trustee and each Officer is 180 Maiden Lane, Suite 1302, New York, NY 10038. Neither the Funds nor the Trust holds annual shareholder meetings for the purpose of electing Trustees, and Trustees are not elected for fixed terms. This means that each Trustee will be elected to hold office until his or her successor is elected or until he or she retires, resigns, dies, or is removed from office. No Trustee or Officer is a director of a public company or a registered investment company other than, with respect to the Trustees, the Domini Funds.
| | | | |
INTERESTED TRUSTEE AND OFFICER |
Name, Age,
Position(s) Held,
and Length of
Time Served | | Principal Occupation(s) During Past 5 Years and
Other Directorships Held | | Number of Funds
in the Domini
Family of Funds
Overseen by
Trustee |
| | |
Amy L. Domini* (70) Chair and Trustee, of the Trust since 1990 | | Portfolio Manager, Domini Sustainable Solutions Fund (since 2020) and Domini Impact Equity Fund (since 2018), Chairperson (since 2016), CEO (2002-2015), Member (since 1997), and Manager (since 1997), Domini Impact Investments LLC; Manager (1998-2017) and Registered Principal (2003-2017), DSIL Investment Services LLC; Manager, Domini Holdings LLC (holding company) (since 2002); President (1990-2017), Domini Investment Trust; CEO and CIO (2013-2015), NIA Global Solutions (a former division of Domini Impact Investments); Trustee, New England Quarterly (periodical) (since 1998); Private Trustee, Loring, Wolcott & Coolidge Office (fiduciary) (since 1987); Partner (since 1994), Loring, Wolcott & Coolidge Fiduciary Advisors, LLP (investment advisor); Manager (since 2010), Loring, Wolcott & Coolidge Trust, LLC (trust company); Board Member (since 2016), Cambridge Public Library Foundation (nonprofit). | | 4 |
161
| | | | |
DISINTERESTED TRUSTEES |
Name, Age,
Position(s) Held,
and Length of
Time Served | | Principal Occupation(s) During Past 5 Years and
Other Directorships Held | | Number of Funds
in the Domini
Family of Funds
Overseen by
Trustee |
| | |
Kirsten S. Moy (73) Trustee of the Trust since 1999 | | Senior Fellow (since 2014), The Aspen Institute (research and education); Visiting Scholar (2016-2018) and Board Member (2009-2015), Low Income Investment Fund (housing and community revitalization nonprofit); Board Member, Community Development Finance (asset building non-profit) (since 2012), Visiting Scholar, Federal Reserve Bank of San Francisco (2016-2018). | | 4 |
| | |
Gregory A. Ratliff (60) Trustee of the Trust since 1999 | | Vice President, Rockefeller Philanthropy Advisors (philanthropy) (since 2019); Vice President, ACT, Inc (education testing) (2017-2019); Lead Senior Program Officer, Gates Foundation (philanthropy) (2007-2017). | | 4 |
| | |
John L. Shields (67) Trustee of the Trust since 2004 | | President, Advisor Guidance, Inc (management consulting firm) (2006-2014; since 2018); Managing Director, CFGI, LLC (management consulting firm) (2016-2018); Director, Navigant Consulting, Inc (management consulting firm) (2014-2016); Director, EverQuote, Inc (technology company) (since 2018); Director, Cogo Labs, Inc (technology company) (since 2008); Director, Vestmark, Inc (software company) (since 2015). | | 4 |
OFFICERS |
Name, Age,
Position(s) Held,
and Length of
Time Served | | Principal Occupation(s) During Past 5 Years and
Other Directorships Held | | Number of Funds
in the Domini
Family of Funds
Overseen by
Trustee |
| | |
Megan L. Dunphy* (50) Chief Legal Officer since 2014, Vice President since 2013, Secretary of the Trust since 2005 | | General Counsel (since 2014), Managing Director (2015-2017), and Member (since 2017), Domini Impact Investments LLC; Chief Legal Officer (since 2014), Vice President (since 2013) and Secretary (since 2005), Domini Funds. | | N/A |
| | |
Carole M. Laible* (56) President of the Trust since 2017 | | Portfolio Manager, Domini Sustainable Solutions Fund (since 2020) and Domini Impact Equity Fund (since 2018), CEO and Manager (since 2016), President (2005-2015), Member (since 2006), Chief Operating Officer (2013-2015), Nia Global Solutions (a former division of Domini Impact Investments LLC), Domini Impact Investments LLC; President and CEO (since 2002), Chief Financial Officer, Secretary, and Treasurer (since 1998), Registered Principal (since 1998), DSIL Investment Services LLC; Manager (since 2016), Domini Holdings LLC (holding company); Treasurer (1997-2015), Vice President (2007-2017), President (since 2017), Domini Funds. | | N/A |
162
| | | | |
OFFICERS (continued) |
Name, Age,
Position(s) Held,
and Length of
Time Served | | Principal Occupation(s) During Past 5 Years and
Other Directorships Held | | Number of Funds
in the Domini
Family of Funds
Overseen by
Trustee |
| | |
Douglas Lowe* (64) Assistant Secretary of the Trust since 2007 | | Senior Call Center Manager (since 2019); Senior Compliance Manager and Counsel (2006-2019), Domini Impact Investments LLC; Assistant Secretary, Domini Funds (since 2007); Registered Operations Professional, DSIL Investment Services LLC (since 2012). | | N/A |
| | |
Meaghan O’Rourke-Alexander* (40) Assistant Secretary of the Trust since 2007 | | Compliance Officer (since 2012), Domini Impact Investments LLC; Assistant Secretary, Domini Funds (since 2007). | | N/A |
| | |
Christina Povall* (50) Treasurer of the Trust since 2017 and Vice President of the Trust since 2013 | | Chief Financial Officer (since 2014), Managing Director (2014-2017), and Member (since 2017), Domini Impact Investments LLC; Treasurer (since 2017), Assistant Treasurer (2007-2017) and Vice President (since 2013), Domini Funds; Registered Operations Professional, DSIL Investment Services LLC (since 2012). | | N/A |
| | |
Maurizio Tallini* (46) Chief Compliance Officer of the Trust since 2005 Vice President of the Trust since 2007 | | Chief Compliance Officer (since 2005), Chief Operating Officer (2011-2017), and Member (since 2007), Domini Impact Investments LLC; Vice President (since 2007), Chief Compliance Officer (since 2005), Domini Funds; Chief Compliance Officer (since 2015), Registered Principal (since 2014), Registered Representative (2012-2015), DSIL Investment Services, LLC. | | N/A |
The Funds’ Statement of Additional Information includes additional information about the Trustees and is available without charge, upon request, by calling the following toll-free number: 1-800-582-6757.
163
PROXY VOTING INFORMATION
The Domini Funds have established Proxy Voting Policies and Procedures that the Funds use to determine how to vote proxies relating to portfolio securities. The Domini Funds’ Proxy Voting Policies and Procedures are available, free of charge, by calling 1-800-762-6814, by visiting www.domini.com/domini-funds/ proxy-voting, or by visiting the EDGAR database on the Securities and Exchange Commission’s (SEC) website at http://www.sec.gov. All proxy votes cast for the Domini Funds are posted to Domini’s website on an ongoing basis over the course of the year. An annual record of all proxy votes cast for the Funds during the most recent 12-month period ended June 30 can be obtained, free of charge, at www.domini.com, and on the EDGAR database on the SEC’s website at http://www.sec.gov.
QUARTERLY PORTFOLIO SCHEDULE INFORMATION
The Domini Funds file their complete schedule of portfolio holdings with the SEC for the first and third quarters of each fiscal year on Form N-Port EX. The Domini Funds’ Forms N-Port EX are available on the EDGAR database on the SEC’s website at http://www.sec.gov. These Forms may also be reviewed and copied at the SEC’s Public Reference Room in Washington, D.C. Information about the operation of the Public Reference Room may be obtained by calling 1-800-SEC-0330. The information on is also available to be viewed at www.domini.com.
164
(a) As of the end of the period covered by this report on Form N-CSR, the registrant has adopted a code of ethics that applies to the registrant’s principal executive officer, principal financial officer, and principal accounting officer.
(c) Not applicable.
(d) Not applicable.
(e) Not applicable.
(f) Registrant is filing its code of ethics with this report.
| Item 3. | Audit Committee Financial Expert. |
John L. Shields, a member of the Audit Committee, has been determined by the Board of Trustees of the registrant in its reasonable business judgment to meet the definition of “audit committee financial expert” as such term is defined in the instructions to Form N-CSR. In addition, Mr. Shields is an “independent” member of the Audit Committee as defined in the instructions to Form N-CSR.
| Item 4. | Principal Accountant Fees and Services. |
(a) Audit Fees
For the fiscal years ended July 31, 2020, and July 31, 2019, the aggregate audit fees billed to the registrant by KPMG LLP (“KPMG”) for professional services rendered for the audits of the financial statements, or services that are normally provided in connection with statutory and regulatory filings or engagements for those fiscal years, are shown in the table below:
| | | | | | | | |
Fund | | 2020 | | | 2019 | |
Domini Impact Equity Fund | | $ | 41,200 | | | $ | 40,000 | |
Domini Impact Bond Fund | | $ | 34,500 | | | $ | 33,500 | |
Domini Impact International Equity Fund | | $ | 34,500 | | | $ | 33,500 | |
Domini Sustainable Solutions Fund | | $ | 32,500 | | | | N/A | |
(b) Audit-Related Fees
There were no audit-related fees billed by KPMG for services rendered for assurance and related services to the registrant that were reasonably related to the performance of the audit or review of the registrant’s financial statements, but not reported as audit fees, for the fiscal years ended July 31, 2020, and July 31, 2019.
There were no audit-related fees billed by KPMG for the fiscal years ended July 31, 2020, and July 31, 2019 that were required to be approved by the registrant’s Audit Committee for services rendered on behalf of Domini Impact Investments LLC and entities controlling, controlled by, or under common control with Domini Impact Investments LLC (not including any subadviser whose role is primarily portfolio management and is subcontracted with or overseen by another investment adviser) that provide ongoing services to the registrant (“Service Providers”).
(c) Tax Fees
In each of the fiscal years ended July 31, 2020, and July 31, 2019, the aggregate tax fees billed by KPMG for professional services rendered for tax compliance, tax advice, and tax planning for the registrant are shown in the table below:
| | | | | | | | |
Fund | | 2020 | | | 2019 | |
Domini Impact Equity Fund | | $ | 7,350 | | | $ | 7,000 | |
Domini Impact Bond Fund | | $ | 7,350 | | | $ | 7,000 | |
Domini Impact International Equity Fund | | $ | 7,350 | | | $ | 7,000 | |
Domini Sustainable Solutions Fund | | $ | 7,350 | | | | N/A | |
There were no tax fees billed by KPMG for the fiscal years ended July 31, 2020, and July 31, 2019 that were required to be approved by the registrant’s Audit Committee for services rendered on behalf of the registrant’s Service Providers.
(d) All Other Fees
There were no other fees billed by KPMG for the fiscal years ended July 31, 2020 and July 31, 2019 for other non-audit services rendered to the registrant.
There were no other fees billed by KPMG for the fiscal years ended July 31, 2020, and July 31, 2019 that were required to be approved by the registrant’s Audit Committee for other non-audit services rendered on behalf of the registrant’s Service Providers.
(e)(1) Audit Committee Preapproval Policy: The Registrant’s Audit Committee Preapproval Policy is set forth below:
| 1. | Statement of Principles |
The Audit Committee is required to preapprove audit and non-audit services performed for each series of the Domini Investment Trust, (each such series a “Fund” and collectively, the “Funds”) by the independent registered public accountant in order to assure that the provision of such
services does not impair the accountant’s independence. The Audit Committee also is required to preapprove non-audit services performed by the Funds’ independent registered public accountant for the Funds’ investment adviser, and certain of the adviser’s affiliates that provide ongoing services to the Funds, if the services to be provided by the accountant relate directly to the operations and financial reporting of the Funds. The preapproval of these services also is intended to assure that the provision of the services does not impair the accountant’s independence.
Unless a type of service to be provided by the independent registered public accountant has received preapproval, it will require separate preapproval by the Audit Committee. Also, any proposed services exceeding preapproved cost levels will require separate preapproval by the Audit Committee. When considering services for preapproval the Audit Committee will take into account such matters as it deems appropriate or advisable, including applicable rules regarding auditor independence.
The appendices to this Policy describe the Audit, Audit-related, Tax and All Other services for the Funds, that have the preapproval of the Audit Committee. The term of any preapproval is 12 months from the date of preapproval, unless the Audit Committee specifically provides for a different period. The Audit Committee will periodically revise the list of preapproved services based on subsequent determinations.
Notwithstanding any provision of this Policy, the Audit Committee is not required to preapprove services for which preapproval is not required by applicable law, including de minimis and grandfathered services.
The Audit Committee may delegate preapproval authority to one or more of its members. The member or members to whom such authority is delegated shall report any preapproval decisions to the Audit Committee at its next scheduled meeting. By adopting this Policy the Audit Committee does not delegate to management the Audit Committee’s responsibilities to preapprove services performed by the independent auditor.
The annual Audit services engagement terms and fees for the Funds will be subject to the preapproval of the Audit Committee. The Audit Committee will approve, if necessary, any changes in terms, conditions and fees resulting from changes in audit scope or other matters.
In addition to the annual Audit services engagement approved by the Audit Committee, the Audit Committee may grant preapproval for other Audit services, which are those services that only the independent registered public accountant reasonably can provide. The Audit Committee has preapproved the Audit services listed in Appendix A. All Audit services not listed in Appendix A must be separately preapproved by the Audit Committee.
Audit-related services are assurance and related services for the Funds that are reasonably related to the performance of the audit or review of the Funds’ financial statements or that are traditionally performed by the independent registered public accountant. The Audit Committee believes that the provision of Audit-related services does not impair the independence of the accountant, and has preapproved the Audit-related services listed in Appendix B. All Audit-related services not listed in Appendix B must be separately preapproved by the Audit Committee.
The Audit Committee believes that the independent registered public accountant can provide Tax services to the Funds such as tax compliance, tax planning and tax advice without impairing the accountant’s independence. However, the Audit Committee will not permit the retention of the independent registered public accountant in connection with a transaction initially recommended by the independent registered public accountant, the purpose of which may be tax avoidance and the tax treatment of which may not be supported in the Internal Revenue Code and related regulations. The Audit Committee has preapproved the Tax services listed in Appendix C. All Tax services not listed in Appendix C must be separately preapproved by the Audit Committee.
The Audit Committee may grant preapproval to those permissible non-audit services for the Funds classified as All Other services that it believes are routine and recurring services, and would not impair the independence of the accountant. The Audit Committee has preapproved the All Other services listed in Appendix D. Permissible All Other services not listed in Appendix D must be separately preapproved by the Audit Committee.
A list of the SEC’s prohibited non-audit services is attached to this policy as Exhibit 1. The SEC’s rules and relevant guidance should be consulted to determine the precise definitions of these services and the applicability of exceptions to certain of the prohibitions.
Preapproval fee levels for all services to be provided by the independent registered public accountant to the Funds, and applicable non-audit services to be provided by the accountant to the Funds’ investment adviser and its affiliates, will be established periodically by the Audit Committee. Any proposed services exceeding these levels will require specific preapproval by the Audit Committee.
| 8. | Supporting Documentation |
With respect to each service that is separately preapproved, the independent auditor will provide detailed back-up documentation, which will be provided to the Audit Committee, regarding the specific services to be provided.
Requests or applications to provide services that require separate approval by the Audit Committee will be submitted to the Audit Committee by both the independent registered public accountant and the Funds’ treasurer, and must include a joint statement as to whether, in their view, the request or application is consistent with the SEC’s rules on auditor independence.
Management will promptly report to the Chair of the Audit Committee any violation of this Policy of which it becomes aware.
Appendix A – Audit Committee Preapproval Policy
Preapproved Audit Services
for
October 29, 2019 through October 31, 2020
| | |
| Service | | Fee Range |
| Statutory audits or financial audits (including tax services associated with non-audit services) | | As presented to Audit Committee in a separate engagement letter1 |
| Services associated with SEC registration statements, periodic reports and other documents filed with the SEC or other documents issued in connection with securities offerings (e.g., consents), and assistance in responding to SEC comment letters | | Not to exceed $9,000 per filing |
Appendix B - Audit Committee Preapproval Policy
Preapproved Audit-Related Services
for
October 29, 2019 through October 31, 2020
| | |
| Service | | Fee Range |
| Consultations by Fund management with respect to the accounting or disclosure treatment of securities, transactions or events and/or the actual or potential impact of final or proposed rules, standards or interpretations by the SEC, FASB, or other regulatory or standard-setting bodies | | Not to exceed $5,000 per occurrence during the Pre-Approval Period |
| | |
| Review of Funds’ semi-annual financial statements | | Not to exceed $2,000 per set of financial statements per fund |
| Regulatory compliance assistance | | Not to exceed $5,000 per quarter |
| Training Courses | | Not to exceed $5,000 per course |
Appendix C – Audit Committee Preapproval Policy
Preapproved Tax Services
for
October 29, 2019 through October 31, 2020
| | |
| Service | | Fee Range |
| Review of federal and state income tax returns and federal excise tax returns for the Funds including assistance and review with excise tax distributions. | | As presented to Audit Committee in a separate engagement letter1 |
| Tax assistance and advice regarding statutory, regulatory or administrative developments | | Not to exceed $5,000 for the Funds’ or for the Funds’ investment adviser during the Pre-Approval period |
| Assistance with custom tax audits and related matters | | Not to exceed $15,000 per Fund during the Pre-Approval Period |
| Tax Training Courses | | Not to exceed $5,000 per course during the Pre-Approval Period |
| M & A tax due diligence services associated with Fund mergers including: review of the target fund’s historical tax filings, review of the target fund’s tax audit examination history, and hold discussions with target management and external tax advisors. Advice regarding the target fund’s overall tax posture and historical and future tax exposures. | | Not to exceed $8,000 per merger during the Pre-Approval Period |
| Tax services related to the preparation of annual PFIC statements and annual Form 5471 (Controlled Foreign Corporation for structured finance vehicles) | | Not to exceed $20,000 during the Pre-Approval Period |
Appendix D – Audit Committee Preapproval Policy
Preapproved All Other Services
for
October 29, 2019 through October 31, 2020
| | |
| Service | | Fee Range |
| With respect to any service set forth in Appendices A, B, or C, and any other permitted services not listed herein, the Audit Committee Chair is delegated pre-approval authority. | | Not to exceed $20,000 per service, or $75,000 per annum in the aggregate for all such services. |
| No other services for the Pre-Approval Period have been specifically preapproved by the Audit Committee. | | N/A |
Exhibit 1 – Audit Committee Preapproval Policy
Prohibited Non-Audit Services
| ◾ | | Bookkeeping or other services related to the accounting records or financial statements of the audit client |
| ◾ | | Financial information systems design and implementation |
| ◾ | | Appraisal or valuation services, fairness opinions or contribution-in-kind reports |
| ◾ | | Internal audit outsourcing services |
| ◾ | | Broker-dealer, investment adviser or investment banking services |
| ◾ | | Expert services unrelated to the audit |
(1) For new funds launched during the Pre-Approval Period, the fee ranges pre-approved will be the same as those for existing funds, pro-rated in accordance with inception dates as provided in the auditors’ proposal or any engagement letter covering the period at issue. Fees in the engagement letter will be controlling.
(e)(2) None, or 0%, of the services relating to the audit-related fees, tax fees, and all other fees paid by the registrant disclosed above were approved by the Audit Committee pursuant to paragraph (c)(7)(i)(C) of Rule 2-01 of Regulation S-X (which permits audit committee approval after the start of the engagement with respect to services other than audit review or attest services, if certain conditions are satisfied).
(f) According to KPMG for the fiscal year ended July 31, 2020, the percentage of hours spent on the audit of the registrant’s financial statements for the most recent fiscal year that were attributed to work performed by persons other than KPMG’s full-time, permanent employees is as follows:
| | | | |
Fund | | 2020 | |
Domini Social Equity Fund | | | 0 | % |
Domini Social Bond Fund | | | 0 | % |
Domini International Social Equity Fund | | | 0 | % |
Domini Sustainable Solutions Fund | | | 0 | % |
(g) There were no non-audit services rendered to the registrant’s Service Providers for the fiscal years ended July 31, 2020 and July 31, 2019.
The aggregate non-audit fees billed by KPMG for services rendered to the registrant for the fiscal year ended July 31, 2020 was $ 29,400. These fees related to the 2020 Tax Fees described in Item 4 (c). The aggregate non-audit fees billed by KPMG for services rendered to the registrant for the fiscal year ended July 31, 2019, were $21,000. These fees related to the 2019 Tax Fees described in Item 4 (c).
(h) Not applicable.
| Item 5. | Audit Committee of Listed Registrants. |
Not applicable to the registrant.
| Item 6. | Schedule of Investments. |
(a) The Schedule of Investments is included as part of the report to stockholders filed under Item 1.
(b) Not applicable
| Item 7. | Disclosure of Proxy Voting Policies and Procedures for Closed-End Management Investment Companies. |
Not applicable to the registrant.
| Item 8. | Portfolio Managers of Closed-End Management Investment Companies. |
Not applicable to the registrant.
| Item 9. | Purchases of Equity Securities by Closed-End Management Investment Company and Affiliated Purchasers. |
Not applicable to the registrant.
| Item 10. | Submission of Matters to a Vote of Security Holders. |
There were no material changes to the procedures by which shareholders may submit recommendations for nominees to the registrant’s Board of Trustees.
Item 11. Controls and Procedures.
(a) Within 90 days prior to the filing of this report on Form N-CSR, Carole M. Laible, the registrant’s President and Principal Executive Officer, and Christina Povall, the registrant’s Treasurer and Principal Financial Officer, reviewed the registrant’s disclosure controls and procedures (as defined in Rule 30a-3(c) of the Investment Company Act of 1940) and evaluated their effectiveness. Based on their evaluation, Ms. Laible and Ms. Povall determined that the disclosure controls and procedures adequately ensure that information required to be disclosed by the registrant in this report on Form N-CSR is recorded, processed, summarized, and reported within the time periods required by the Securities and Exchange Commission’s rules and forms, including ensuring that information required to be disclosed in this report on Form N-CSR is accumulated and communicated to the registrant’s management, including the Ms. Laible and Ms. Povall, as appropriate to allow timely decisions regarding required disclosures.
(b) There were no changes in the registrant’s internal control over financial reporting (as defined in Rule 30a-3(d) under the Investment Company Act of 1940) that occurred during the second fiscal quarter of the period covered by this report that have materially affected, or are reasonably likely to materially affect, the registrant’s internal control over financial reporting.
Item 12. Disclosure of Securities Lending Activities for Closed-End Management Investment Companies.
Not applicable to the registrant.
SIGNATURES
Pursuant to the requirements of the Securities Exchange Act of 1934 and the Investment Company Act of 1940, the registrant has duly caused this report to be signed on its behalf by the undersigned, thereunto duly authorized.
| | |
DOMINI INVESTMENT TRUST |
| |
| By: | | /s/ Carole M. Laible |
| | Carole M. Laible |
| | President (Principal Executive Officer) |
Date: October 7, 2020
Pursuant to the requirements of the Securities Exchange Act of 1934 and the Investment Company Act of 1940, this report has been signed below by the following persons on behalf of the registrant and in the capacities and on the dates indicated.
| | |
| |
| By: | | /s/ Carole M. Laible |
| | Carole M. Laible |
| | President (Principal Executive Officer) |
Date: October 7, 2020
| | |
| |
| By: | | /s/ Christina Povall |
| | Christina Povall |
| | Treasurer (Principal Financial Officer) |
Date: October 7, 2020