UNITED STATES
SECURITIES AND EXCHANGE COMMISSION
Washington, D.C. 20549
FORM N-CSR
CERTIFIED SHAREHOLDER REPORT OF REGISTERED
MANAGEMENT INVESTMENT COMPANIES
Investment Company Act File Number 811-05823
DOMINI INVESTMENT TRUST
(Exact Name of Registrant as Specified in Charter)
180 Maiden Lane, Suite 1302, New York, New York 10038
(Address of Principal Executive Offices)
Carole M. Laible
Domini Impact Investments LLC
180 Maiden Lane, Suite 1302
New York, New York 10038
(Name and Address of Agent for Service)
Registrant’s Telephone Number, including Area Code: 212-217-1100
Date of Fiscal Year End: July 31
Date of Reporting Period: July 31, 2018
Item 1. Reports to Stockholders.
A copy of the report transmitted to stockholders pursuant to Rule 30e-1 under the Investment Company Act of 1940 follows.
INVESTING FOR IMPACT |
We are honored to work on your behalf to create a better future.
In addition to our annual Impact Report, we provide quarterly updates to keep you informed on our most recent advocacy work, exciting new initiatives, and highlights of interesting investments.
Visit domini.com/impact
|
| SIGN UP FOR E-DELIVERY |
If you invest directly with Domini, you can avoid an annual fee of $15 by signing up for paperless E-Delivery of your statements, reports and tax forms — just log into your account, go to “Account Options,” and select “E-Delivery Option.”
If you invest through a financial advisor, brokerage firm, or employer-sponsored retirement plan, why not ask your advisor or plan sponsor how to receive your documents electronically? It can reduce your carbon footprint, save trees, and unclutter your life, all with just a few strokes of your keyboard! |
| Investing For Good | ||
| 2 | Letter from the President | |
| 4 | What Impact Do Your Investments Have? | |
| 5 | Focus on Community Investing | |
| Fund Performance and Holdings | ||
| 14 | Domini Impact Equity Fund | |
| 25 | Domini Impact International Equity Fund | |
| 42 | Domini Impact Bond Fund | |
| 62 | Expense Example | |
| Financial Statements | ||
| 65 | Domini Impact Equity Fund | |
| 65 | Domini Impact International Equity Fund | |
| 94 | Domini Impact Bond Fund | |
| 120 | Board of Trustees’ Approval of Management and Submanagement Agreements | |
| 132 | Trustees and Officers | |
| 136 | Proxy Voting Information | |
| 136 | Quarterly Portfolio Schedule Information | |
INVESTINGFOR GOOD®
Dear Fellow Shareholders,
Each year, we use the occasion of writing a letter for our Annual Report to reflect upon an issue of importance to responsible investors. This year, we focus on community. In the pages that follow, you will learn more about what the Domini Impact Bond Fund is doing to build healthy communities, but here we reflect on some of the larger issues.
A great deal of academic work has been done on the importance of community. For us, the most influential book was Making Democracy Work, by Robert Putnam. Putnam studied regions of Italy to understand where government functions best. Graduate students phoned local city halls with questions like, “where can I take a driving test?” or “I lost my health card. How do I get it replaced?” He found that Northern Italy had better functioning government for simple needs than Southern Italy. Why? Attendance at voluntary associations like church, choral societies, soccer games, street festivals, or an after-dinner stroll meant more than class, religion, job, or other such factors. In other words, the very functioning of civil society depends on physical interactions with relative strangers. Familiarity breeds trust, and democratic societies cannot function without trust.
At Domini Impact Investments, we seek out opportunities to help create or maintain healthy communities because we believe that more than just something nice is at stake. What is at stake is democracy itself, and without a healthy democracy, it is difficult to reap the benefits of investment. Yes, we would argue that successful investing depends on healthy grassroots.
The Federal Reserve Bank of St. Louis Economic Data (FRED) provide a rich source of raw data to consider. According to FRED, personal consumption represents 70 percent of the nation’s gross domestic product. In other words, ordinary consumers are the primary driver of our economic well-being. So, if more people could spend, the economy would grow more quickly. As an investor, we want to see that. This is likely why the stock market generally rallies on days that positive employment figures are released. More people with jobs leads to more personal consumption and greater growth for the companies that provide the goods and services these consumers desire.
If both democracy and investment success depend on communities nurturing their citizens and creating an environment in which jobs can be created, then such work is of the utmost importance. Efforts must encompass housing, health care, education, recreation, safety, and public services. The parts must interconnect in such a way that people move seamlessly through these supporting systems toward a successful outcome.
2
INVESTINGFOR GOOD®
Consider your local library. It provides, not just books, but also computers, videos, newspaper and magazine archives, and more — all usually free to anyone who walks in. Five years ago, Pew Research Center found that 94 percent of the population said that having a public library improves the quality of life in their community and 81 percent said that public libraries provide many services people would have a hard time finding elsewhere.
What services are so essential? Which would they miss? According to Pew, 51 percent said the library offers help finding a job; 53 percent said it helps them get government services and fill out forms; 58 percent use programs on subjects ranging from genealogy or gardening to English as a second language; 69 percent use children’s programs such as reading hour or puppet shows. We know how to build healthy communities here in America. Virtually every hamlet in this country has done it by building and supporting a public library through taxpayer dollars and taxpayer hours, in the form of volunteerism. These two elements — community financial support and personal commitment — are essential to every effort to build a healthy and safe community.
For decades, responsible investing has consisted of three important aspects. First, we apply standards to our investments that reflect our objectives for society and the environment. For example, we seek to understand how a company affects the communities it interacts with. Is it a polluter? Did the community protest its presence in some way? Does it add value where it does business? Second, we advocate. We enter into conversations, file shareholder resolutions and engage with others to ask companies to commit to actions that are good for communities, like paying fair taxes, building low carbon-footprint facilities, and sourcing locally. Third, we make investments that directly build needed services. Our Bond Fund helps finance affordable housing, new school facilities, healthcare needs, efficient infrastructure, and more.
We hope that you will enjoy learning more about our initiatives and that you feel inspired to tell your own circle of community that there are investors out there trying to build a better future. Thank you for your investment with us.
Sincerely,
Carole Laible President |
Amy Domini Chair |


3
INVESTINGFOR GOOD®
WHAT IMPACT DO YOUR INVESTMENTS HAVE?
Domini Impact Investments LLC is a women-led SEC-registered investment adviser that specializes exclusively in impact investing. We serve individual and institutional investors who wish to create positive social and environmental outcomes while seeking competitive financial returns.
As an investor in the Domini Funds, your money is at work for change. We are honored to work on your behalf to create a better future for generations to come — defending diversity, tackling climate change, advocating for sensible gun control, promoting an inclusive economy, and much more.
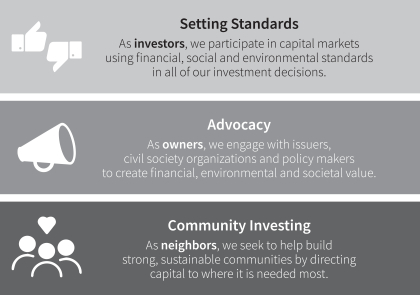
Our mutual funds employ three fundamental impact-investing strategies:
Earlier this year, we were very happy to release the Domini Funds 2017 Impact Report, our inaugural report detailing the positive impacts your investments have on society and the environment. We also provide quarterly Impact Updates to keep you informed throughout the year on our most recent advocacy work, exciting new initiatives, and highlights of interesting investments.
In the pages that follow, we highlight our approach to community investing, but you can learn more about all of the strategies above in the Impact Report.
| Visit us online at Domini.com to read the Domini Funds 2017 Impact Report and quarterly Impact Updates, request printed copies, or sign up to receive future updates. You can also email us at info@domini.com, or call us at 1-800-582-6757. |
4
INVESTINGFOR GOOD®
Fixed-income investments are particularly well suited for addressing a wide range of economic disparities in our society. The Domini Impact Bond Fund seeks to help build healthy and vibrant communities by directing capital to where it is needed most.
When considering any fixed-income investment, we always start by asking two questions: Who is the issuer, and what is the intended use of proceeds? Or, in other words, to whom are we loaning your money, and for what purpose?
We then use proprietary key performance indicators to determine if the answers to those questions are aligned with our fundamental goals of universal human dignity and ecological sustainability. If the issuer is a corporation, our evaluation focuses on the company’s core business model and the strength of its relations with key stakeholders, including its employees, local and national communities, and ecosystems. This is the same evaluation process we use for our equity funds.
Within fixed income, however, there are many other types of issuers to consider in addition to public corporations, including governments and government agencies, government-sponsored enterprises, municipalities, universities, hospitals, and various other for-profit and not-for-profit public and private entities.
Fixed-income investing presents many unique opportunities for lasting impact. We focus on three key goals to help build a more sustainable and equitable society:
| • | Increasing access to capital for those historically underserved by the mainstream financial community; |
| • | Creating public goods for those most in need; and |
| • | Filling capital gaps left by current financial practice. |
These goals stem from our belief that healthy economies must be built on a strong foundation of fairness and opportunity for all.
The Bond Fund seeks impact in a variety of areas, including housing, health care, education, infrastructure, and climate-change mitigation and adaptation.
We classify our Bond Fund investments into impact themes and sub-themes. The allocations to those themes, based on portfolio market values as of July 31, 2018, can be found on the next page. In the pages that follow, we take a closer look at each theme, highlighting specific holdings.
5
INVESTINGFOR GOOD®
Domini Impact Bond Fund: Impact Theme Allocations1
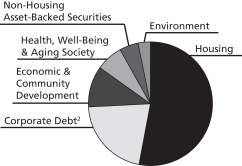 | Green Bonds As of July 31, 2018, the Fund held nearly $9 million in labeled and unlabeled green bonds, representing 5.0% of the portfolio. Several of these bonds, marked with a |
| Housing (52.9%) |
FNMA DUS: Low- and Very Low-Income Housing (14.7%) |
Derivatives: TBA or When-Issued Affordable Housing Securities (14.6%) |
Affordable Housing Mortgage-Backed Securities (11.8%) |
Affordable Housing Agency Obligations (10.0%) |
Multi-Family Housing Mortgage-Backed Securities (1.9%) |
| Corporate Debt2 (21.2%) |
Companies that Meet Impact Investment Standards (19.7%) |
Companies with Notably Strong ESG Profiles (1.5%) |
| Economic and Community Development (10.7%) |
Sovereign Debt (2.7%) |
Transportation (2.1%) |
Municipal General Obligations (2.0%) |
Farm Credit (1.9%) |
Nonprofit Education (1.5%) |
Community Development Financial Institutions (0.3%) |
Business and Job Creation (0.3%) |
| Health, Well-Being, and Aging Society (7.0%) |
Nonprofit Healthcare and Healthcare Education Facilities (4.9%) |
Continuing Care Retirement Communities (1.5%) |
Pensions (0.6%) |
| Non-Housing Asset-Backed Securities (4.9%) |
Commercial Mortgage-Backed Securities (4.0%) |
Auto Loans (0.5%) |
Other Asset-Backed Securities (0.4%) |
| Environment (3.2%) |
Low-Carbon Transition (2.6%) |
Energy Efficiency (0.7%) |
Numbers may not sum to 100% due to rounding.
1. Based on portfolio holdings as of 7/31/18, excluding cash & cash equivalents, cash offsets, futures and swaps, with the exception of short-term U.S. Agency bonds and Certificates of Deposit, which are reflected in this reporting.
2. “Corporate Debt” includes general-obligation corporate bonds, bank loans, and corporate debt not classified under other themes.
The composition of the Fund’s portfolios is subject to change. Visit www.domini.com to view the most current list of the Fund’s holdings.
6
INVESTINGFOR GOOD®
Housing
We seek to help build a sustainable housing system through investments that provide access to affordable mortgage credit and rental properties.
In keeping with our commitment to increasing access to capital for those historically underserved, our Bond Fund has, since its inception, maintained a substantial, long-term commitment to affordable housing primarily through the purchase of securities backed by pools of residential mortgages. The vast majority of the investments under our Housing theme support affordable housing for communities across the U.S., including mortgage-backed securities (MBS), collateralized mortgage obligations (CMOs) and to-be-announced (TBA) derivatives issued by the Federal National Mortgage Association (FNMA, or “Fannie Mae”) and the Federal Home Loan Mortgage Corporation (FHLMC, or “Freddie Mac”). Other securities include direct agency obligations that finance the operations of Fannie Mae and Freddie Mac, and CMOs that support the acquisition, refinancing, or moderate rehabilitation of multifamily housing communities.
We are particularly interested in making affordable-housing investments that support low-income communities. As of July 31, the Fund’s largest allocation within Housing was to Fannie Mae Delegated Underwriting and Servicing (DUS) bonds, mortgage-backed securities that finance low- and very low-income housing. These investments represented 3,958 multifamily rental housing units for low- and very low-income tenants. Of these, 92.4% (3,657 units) were designated for low-income households, defined as those below 60% of area median income. Nearly 1,200 of these units were reserved for very low-income households, with income below 50% of the median.
One of the major challenges for affordable multifamily housing is the cost of energy in rental apartments, which are less energy-efficient and typically have higher energy expenditures than those in owner-occupied units. Energy efficiency is an important consideration for low-income families, particularly because monthly expenses attributed to housing and utilities continue to increase over time. We therefore also seek investments in bonds that finance low-carbon, sustainable construction and retrofits, such as energy- and water-efficiency systems.
Current investments in Housing include:
| FNMA Pool AN5557: This DUS bond provided financing to the Oakbrook Terrace housing complex in Orange, VA. Oakbrook Terrace has 80 housing units, all of which are designated for low-income households. The bond is also part of Fannie Mae’s Green Financing program, which requires that properties possess a |

7
INVESTINGFOR GOOD®
nationally recognized current Green Building Certification and/or make improvements that target reductions in energy and/or water use. |
| State of Oregon Sustainability Bond: The Fund recently invested in Oregon’s first series of Sustainability Bonds, which will help fund the State’s Local Innovation and Fast Track (LIFT) Affordable Housing Program. LIFT provides financing for new affordable housing projects in the State’s historically underserved communities and for households earning at or below 60% of Area Median Income. The proceeds from this issuance will be used to develop 500 units of affordable housing statewide, with a focus on stimulating economic growth and revitalizing underserved communities. The program will target populations of families, homeless and formerly homeless, veterans and elderly, as well as the State’s agriculture workforce, children and young adults under Department of Human Services programs, and those previously incarcerated or in alcohol and drug recovery programs. |
Corporate Debt
We seek to invest in companies that responsibly address the key sustainability challenges and opportunities presented by their business models.
The Fund invests in bonds and bank loans of corporations that meet our social and environmental standards. Most of these are general-obligation bonds (meaning that the company may use the money for any legal purpose), but corporations may also issue bonds to raise proceeds to finance specific projects.3
Current investments in Corporate Debt include:
| • | Liberty Property LP: This real estate investment trust develops and leases commercial properties. Liberty Property Trust has a strong commitment to sustainability, and has invested $4.1 billion in high-performance green development. It currently has 128 LEED projects certified or under construction, and recently developed the first procedure-based LEED Volume Program, which will ensure that all of its industrial developments achieve LEED certification. |
| • | Swedbank AB: The Fund holds a bond issued by Swedbank, a Swedish bank that has specific socially responsible investing and sustainability criteria that represent approximately 40% of its total assets under management. |
3. Corporate-issued green bonds are classified under our Environment theme.
8
INVESTINGFOR GOOD®
Economic and Community Development
We seek to support the creation of public goods essential to meeting the basic needs of society.
The Fund invests in municipal general obligations issued by cities, counties, and states across the U.S. We seek investments that support basic infrastructure and transportation systems, including energy-efficient transport and commuter systems that meet standards for climate integrity, improvements in highways and roads, and aviation-related financing. We also seek investments that support business and job creation, projects for nonprofit education facilities, and rural communities and agriculture. In all of these cases, we favor bonds that serve marginalized and low-income communities.
The Fund also has a long-standing commitment to supporting community development financial institutions (CDFIs). By placing deposits with CDFIs, we channel money directly to projects that serve neighborhoods and regions of great need through the creation of, among other things, low-income housing, loans to small-business entrepreneurs, financial literacy programs, and the provision of affordable financial services for those who lack access to the mainstream banking community.
Current investments in Economic and Community Development include:
| • | Self-Help Credit Union and Self-Help Federal Credit Union: The Fund owns certificates of deposit with these two credit unions in the Self-Help family of organizations. Self-Help’s mission is to create and protect ownership and economic opportunity for all, especially minority, female-headed, rural, and low-income families. |
Sovereign Debt: Why the Fund Does Not Invest in U.S. Treasuries
Our Economic and Community Development theme also includes debt issued by national governments (“sovereign debt”). For example, the Fund recently purchased obligations issued by the government of Japan.
We seek to avoid debt issued by non-democratic countries; countries with a significant record of systemic corruption; countries that fail to adequately protect press freedoms; and countries with significant human rights concerns, including human trafficking.
Our standards include a long-standing policy to exclude securities issued by the U.S. Department of the Treasury, primarily due to concerns about financing our nation’s nuclear weapons arsenal. Instead of investing in these general government obligations, the Fund invests in bonds issued by government agencies that serve purposes aligned with our goals. This primarily includes housing agency bonds, which have similar risk/return characteristics to U.S. Treasuries. |
9
INVESTINGFOR GOOD®
Investing and Banking for Impact
Your investments are one way you can have a positive impact on communities. Where you bank is another.
We do so with our own corporate banking. Domini Impact Investments LLC banks with Southern Bancorp, Inc. a CDFI serving impoverished areas in Arkansas and Mississippi. Southern combines traditional banking and lending services with financial-development tools and public-policy advocacy to promote economic development in underserved communities. The CDFI seeks to empower individuals to build net worth by supporting homeownership, entrepreneurship, and savings. We are proud to support their mission. |
| • | Cook County Community High School District No. 228: The Fund holds a qualified school construction bond issued by a public high school district that serves Bremen Township in Cook County, Illinois, located in the south suburbs of Chicago. Proceeds will be used to improve and repair school buildings and facilities, including building and equipping a new field-house and cafeteria, roof repair, security upgrades, health and safety improvements, HVAC renovations, and exterior improvements. |
| • | Pennsylvania Industrial Development Authority (PIDA): The Fund holds a municipal revenue bond issued by this component of the Pennsylvania state government. PIDA provides low-interest loans to local industrial development corporations (IDCs) for eligible businesses that commit to creating and/or retaining jobs. PIDA also lends to IDCs directly for the development of industrial parks and multi-tenant facilities. |
| Metropolitation Transportation Authority (MTA): The Fund holds a “Climate Bond Certified” green bond issued by New York’s MTA, which operates the bus, subway, and commuter train systems in the City of New York and its surrounding counties. Proceeds will be used to refinance debt from previous eligible transit and commuter capital projects. |
| • | Federal Farm Credit Banks (FFCB): The Fund holds two securities issued by FFCB to finance the Farm Credit System, a government-sponsored enterprise that provides capital to retail associations around the U.S. that lend to farmers, ranchers, rural homeowners, and agricultural cooperatives in their local communities. |
Health, Well-Being, and Aging Society
We seek to support health equity through the financing of affordable, high-quality, and accessible health care across health systems. We
10
INVESTINGFOR GOOD®
consider health care to be a public good and acknowledge the limitations of private for-profit organizations in providing this good.
We seek to invest in public and private nonprofit healthcare and healthcare education facilities to help address the health needs of society at large and, in particular, the unmet needs of underserved communities. As population aging is expected to be one of the most significant social transformations of this century, we also seek investments that support health care, housing, and financial stability for aging communities, including bonds that finance continuing care retirement communities (CCRCs) and pension obligation bonds.
Current investments in Health, Well-Being, and Aging Society include:
| • | Boston Medical Center Corporation: The Fund owns a general-obligation bond issued by this nonprofit, academic medical center, which provides health screenings, smoking cessation, preventative food pantry, and medical services to communities in the State of Massachusetts. It is New England’s largest safety net hospital. Fifty-seven percent of its patients are from underserved populations, and 32 percent do not speak English as their primary language. |
| • | Mary’s Woods at Marylhurst: The Fund holds a revenue bond issued by Wisconsin’s Public Finance Authority to raise proceeds lent to Mary’s Woods at Marylhurst, a nonprofit in Lake Oswego, Oregon. Mary’s Woods provides healthcare services for seniors, including independent and assisted living and home care services. |
| Kaiser Foundation Hospitals: The Fund holds a green bond issued by Kaiser Foundation Hospitals, an Oakland-based nonprofit. Kaiser offers preventative care, immunizations, emergency care, screening diagnostics, and pharmacy services in eight states and the District of Columbia. Proceeds are used to finance LEED Gold- or Platinum-certified medical facilities. |
| • | Indiana Finance Authority: This state agency offers effective financing solutions to facilitate state, local, and business investments in Indiana. The Fund holds a municipal revenue bond issued to finance the construction of a new public mental health facility that provides mental health care and addiction services for underserved populations. |
Non-Housing Asset-Backed Securities
Asset-backed securities (ABS) can help provide responsible credit to underserved and unbanked borrowers.
In addition to mortgage-backed securities that support affordable and multi-family housing, the Bond Fund invests in various other types of
11
INVESTINGFOR GOOD®
asset-backed securities, including commercial mortgage-backed securities (CMBS) and auto loans. However, we are selective in both the issuers and the types of underlying assets involved. For example, we seek to avoid certain securities backed by student loans due to concerns over a series of abusive lending practices. Our due diligence includes monitoring regulatory trends, with a focus on consumer protection enforcement actions led by the Department of Justice, the Consumer Financial Protection Bureau, and other regulatory agencies.
Current investments in Non-Housing ABS include:
| • | Hudson Yards: The Fund holds a CMBS that provides financing for Hudson Yards, a large-scale redevelopment project in Manhattan. The Hudson Yards Development Corporation is working with various City and State entities to plan, develop, and construct a subway extension, new rail yards, improvements to streets, parks and other infrastructure, and affordable housing development. |
| • | SBA Tower Trust: The Fund holds a security backed by North American wireless tower assets owned by SBA Communications, which owns and operates wireless communication infrastructure. |
Environment
We seek to invest in bonds that support the transition to a low-carbon future.
The majority of the bonds classified under the Environment theme are labeled and unlabeled green bonds,4 which finance projects and activities that address climate change or serve other environmentally beneficial purposes. The Fund invests in bonds that help mitigate the impact of fossil fuels, and promote renewable energy and energy efficiency. We seek to avoid bonds that we determine to be overly aggressive in use of the term “green,” such as first-generation biofuels, waste-to-energy facilities that use toxic substances, or projects that prolong the use of fossil fuels, such as coal-power-plant refurbishment and carbon capture and sequestration.
Current investments in Environment include:
| City of Toronto: The Fund owns a green bond issued by Toronto as part of its Green Debenture Program, established to leverage the City’s low borrowing interest rates to help finance capital projects that contribute to environmental sustainability. Proceeds from the bond will finance sustainable projects such as public transportation, renewable energy, water infrastructure, and green building. |
4. Although the majority of the Fund’s green-bond investments are classified under Environment, some have been classified under other themes that we have determined to be their primary areas of impact. All of the green bonds highlighted in this report are noted with a  ..
..
12
INVESTINGFOR GOOD®
| State of Massachusetts: The Fund owns a green bond issued by Massachusetts, which became the first of any U.S. state or local government to issue green bonds in 2013. Proceeds from this issuance are used for energy efficiency projects in State buildings, as well as stormwater management, open space protection, environmental remediation, river revitalization, and habitat restoration projects. |
| Toronto-Dominion Bank (TD): The Fund is invested in a corporate green bond issued by TD Bank to support projects in North America that contribute to the low-carbon economy through either renewable-energy generation, energy efficiency and management, or green infrastructure and sustainable land use. |
| Queensland Treasury Corporation: The Fund holds a green bond issued by the Queensland Treasury Corporation in Australia. Proceeds are expected to be invested in any one or more of the following projects: a light-rail link, electric trains, cycleways, and the Sunshine Coast solar farm. |
The holdings discussed above can be found in the Portfolio of Investments of the Domini Impact Bond Fund, included herein. The composition of the Fund’s portfolio is subject to change.
An investment in the Domini Impact Bond Fund is not a bank deposit and is not insured. You may lose money. An investment in the Domini Impact Bond Fund is subject to credit, interest rate, liquidity, impact investing, and market risks.
The Domini Funds are not insured and are subject to market risks. Investment return, principal value, and yield may fluctuate. An investor’s shares when redeemed may be worth more or less than their original cost. You may lose money.
This report is not authorized for distribution to prospective investors of the Domini Funds referenced herein unless preceded or accompanied by a current prospectus for the relevant Fund. Nothing contained herein is to be considered a recommendation concerning the merits of a noted company, or an offer of sale or a solicitation of an offer to buy shares of any Fund or company referenced in this report. Such offering is only made by prospectus, which includes details as to the offering price and other material information. Carefully consider the Funds’ investment objectives, risk factors and charges and expenses before investing. This and other information can be found in the Funds’ prospectus, which may be obtained by calling 1-800-582-6757, or at www.domini.com. Please read the prospectus carefully before investing. The Domini Funds are distributed by DSIL Investment Services LLC (DSILD), Member FINRA. Domini Impact Investments LLC (Domini) is the Funds’ investment manager. The Funds are subadvised by Wellington Management Company LLP. DSILD and Domini are not affiliated with Wellington Management Company LLP and Southern Bancorp, Inc. 9/18
13
Performance Commentary (Unaudited)
The Fund invests primarily in mid- and large-cap U.S. equities. It is managed through a two-step process designed to capitalize on the strengths of Domini Impact Investments and Wellington Management Company, the Fund’s subadviser. Domini creates an approved list of companies based on its social, environmental and governance analysis, and Wellington seeks to add value and manage risk through a systematic and disciplined portfolio construction process.
Market Overview:
U.S. equities posted strong positive gains during the twelve-month period ended July 31, 2018, with the S&P 500 Index returning 16.24%. Despite elevated political uncertainty at home and abroad, markets were supported by generally robust economic data and strong corporate earnings.
The S&P 500 peaked at an all-time high on January 26, but rising inflation risks and concerns over a global trade war caused a spike in market volatility, starting with a selloff in late January. By the final few months of the period, the market resumed its growth trajectory, supported by continued economic momentum and positive quarterly earnings announcements in July. U.S. gross domestic product (GDP) grew at a 4.1% annualized rate for the second quarter of 2018. The labor market continued to gain strength, with unemployment hitting an 18-year low of 3.8% in May, and small-business and consumer sentiment surveys painted an optimistic outlook for the economy. Due to low inventory and higher mortgage rates, housing market data was more mixed.
The Federal Reserve Bank (Fed) continued to tighten monetary policy during the period, hiking benchmark rates three times. Despite rising uncertainties over the sustainability of growth in light of broader macroeconomic risks — including ongoing trade tensions and slowing growth in Europe — the Fed lifted its economic growth forecast for 2018 and signaled the potential for two additional hikes this year.
Portfolio Performance:
The Domini Impact Equity Fund Investor shares returned 10.32% for the twelve-month period ended July 31, 2018, underperforming relative to the S&P 500 Index, which returned 16.24%.
Security selection was the primary driver of underperformance relative to the benchmark, with especially weak selection in the financials and health care sectors. Selection was also weak in information technology and telecommunication services, offsetting stronger selection in real estate and consumer discretionary.
14
Although the Fund generally does not deviate significantly from the benchmark’s sector weights, overall sector allocation detracted from relative results for the period. This was driven primarily by the Fund’s overweight to telecommunication services, which was the worst performing sector for the benchmark over the period and underweights to the outperforming consumer discretionary and energy sectors. The Fund maintains a significant underweight to the energy sector largely due to its exclusion of oil and gas exploration and production companies.*
From a market capitalization standpoint, security selection was particularly weak within mega-cap stocks, which have market caps greater than $50 billion, as well as within mid-cap stocks, which have market caps between $2 billion and $10 billion.
Over the last year, the Fund’s exposure to momentum and quality themes added to relative returns. Quality did particularly well in the first half of 2018 at the expense of valuation. The value factor was challenged for the trailing twelve-month period and was a primary driver of underperformance relative to the Fund’s public benchmark, the S&P 500 Index. Slight industry tilts such as an overweight to U.S. insurance and an underweight to U.S. health care providers & services industries also hurt relative performance during the period.
At a security level, the top contributors to relative performance were human resource consulting firm Robert Half International, discount department-store retailer Ross Stores, payments and technology company Mastercard, and orthodontic medical device company Align Technology. Relative results were also helped by the Fund not holding General Electric (GE) which declined 44.93% for the benchmark. GE is not approved for investment by the Domini Funds due to its involvement in nuclear technology and military weapons.
The largest detractors from relative results included engines and generators manufacturer Cummins, insurance groups Prudential Financial and Unum, and pharmacy retailer Walgreens Boots Alliance. Relative results were also hurt by the Fund being underweight to online retailer Amazon.com, which returned 79.12% during the period.
* Domini excludes companies included in the Integrated Oil & Gas or Oil & Gas Exploration & Production Industries as defined by the Global Industry Classification System (GICS).
15
TEN LARGEST HOLDING (Unaudited)
| SECURITY DESCRIPTION | % NET ASSETS | SECURITY DESCRIPTION | % NET ASSETS | |||||||
| Alphabet Inc Cl A | 4.0% | Gilead Sciences Inc | 2.6% | |||||||
| Microsoft Corp | 2.9% | Prudential Financial Inc | 2.6% | |||||||
| Intel Corp | 2.9% | PACCAR Inc | 2.5% | |||||||
| Walgreens Boots Alliance Inc | 2.7% | Apple Inc | 2.5% | |||||||
| International Business Machines Corp | 2.6% | Robert Half International Inc | 2.4% | |||||||
PORTFOLIO HOLDINGS BY INDUSTRY SECTOR (% OF NET ASSETS) (Unaudited)
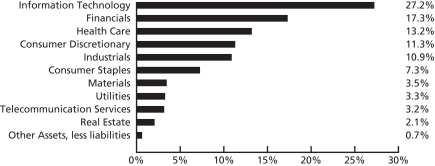
The holdings mentioned above are described in the Domini Impact Equity Fund’s Portfolio of Investments (as of 7/31/18), included herein. The composition of the Fund’s portfolio is subject to change.
The Fund is not insured and is subject to market, market segment, style and foreign investing risks. Investing internationally involves special risks, such as currency fluctuations, social and economic instability, differing security regulations and accounting standards limited public information possible changes in taxation, and periods of illiquidity.
The Global Industry Classification Standard (“GICS”) was developed by and is the exclusive property and a service mark of MSCI Inc. (“MSCI”) and Standard & Poor’s, a division of The McGraw-Hill Companies, Inc. (“S&P”) and is licensed for use by Domini Impact Investments. Neither MSCI, S&P nor any third party involved in making or compiling the GICS or any GICS classifications makes any express or implied warranties or representations with respect to such standard or classification nor shall any such party have any liability therefrom.
16
| AVERAGE ANNUAL TOTAL RETURNS (Unaudited) | Investor shares | S&P 500 | ||||
| As of 7/31/18 | 1 Year | 10.32% | 16.24% | |||
| 5 Year | 9.18% | 13.12% | ||||
| 10 Year | 8.45% | 10.67% | ||||
COMPARISON OF $10,000 INVESTMENT IN THE DOMINI IMPACT EQUITY FUND INVESTOR SHARES (DSEFX) AND S&P 500 (Unaudited)
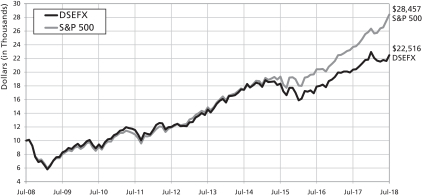
Past performance is no guarantee of future results. The Fund’s returns quoted above represent past performance after all expenses. The returns reflect any applicable expense waivers in effect during the periods shown. Without such waivers, Fund performance would be lower. Investment return, principal value, and yield will fluctuate. Your shares, when redeemed, may be worth more or less than their original cost. Call 1-800-582-6757 or visit www.domini.com for performance information current to the most recent month-end, which may be lower or higher. A 2.00% fee applies on sales/exchanges made less than 30 days after purchase/exchange, with certain exceptions. Quoted performance data does not reflect the deduction of this fee, which would reduce the performance quoted. See the Fund’s prospectus for further information.
Per the prospectus dated June 15, 2018, the Fund’s net annual operating expenses totaled 1.09%.
The table and the graph do not reflect the deduction of fees and taxes that a shareholder would pay on Fund distributions or the redemption of Fund shares. Total return for the Domini Impact Equity Fund is based on the Fund’s net asset values and assumes all dividend and capital gains were reinvested. An investment in the Fund is not a bank deposit and is not insured. You may lose money.
The Standard & Poor’s 500 Index (S&P 500) is an unmanaged index of common stocks. Investors cannot invest directly in the S&P 500.
17
| AVERAGE ANNUAL TOTAL RETURNS (Unaudited) | Class A shares (with 4.75% maximum Sales Charge) | Class A shares (without Sales Charge) | S&P 500 | |||||
| As of 7/31/18 | 1 Year | 5.12% | 10.36% | 16.24% | ||||
| 5 Year | 8.11% | 9.17% | 13.12% | |||||
| 10 Year* | 7.93% | 8.45% | 10.67% | |||||
COMPARISON OF $10,000 INVESTMENT IN THE DOMINI IMPACT EQUITY FUND CLASS A SHARES (DSEPX) AND S&P 500 (WITH 4.75% MAXIMUM SALES CHARGE)* (Unaudited)
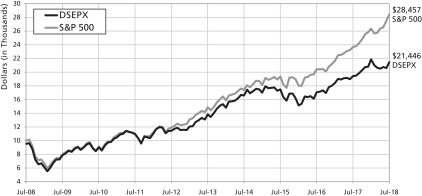
Past performance is no guarantee of future results. The Fund’s returns quoted above represent past performance after all expenses. The returns reflect any applicable expense waivers in effect during the periods shown. Without such waivers, Fund performance would be lower. Investment return, principal value, and yield will fluctuate. Your shares, when redeemed, may be worth more or less than their original cost. Call 1-800-582-6757 or visit www.domini.com for performance information current to the most recent month-end, which may be lower or higher. A 2.00% fee applies on sales/exchanges made less than 30 days after purchase/exchange, with certain exceptions. Quoted performance data does not reflect the deduction of this fee, which would reduce the performance quoted. See the Fund’s prospectus for further information.
Per the prospectus dated June 15, 2018, the Fund’s annual operating expenses totaled 1.41% (gross)/1.09% (net). The Fund’s adviser has contractually agreed to waive certain fees and/or reimburse certain ordinary operating expenses in order to limit Class A shares to 1.09% until November 30, 2019, absent an earlier modification by the Fund’s Board. The Fund’s total return would be lower without these limits. For the period November 30, 2017 through June 14, 2018, the Fund’s adviser agreed to waive certain fees and/or reimburse certain ordinary expenses in order to limit Class A share expenses to 1.12%.
The table and the graph do not reflect the deduction of fees and taxes that a shareholder would pay on Fund distributions or the redemption of Fund shares. Total return for the Domini Impact Equity Fund is based on the Fund’s net asset values and assumes all dividend and capital gains were reinvested. An investment in the Fund is not a bank deposit and is not insured. You may lose money.
The Standard & Poor’s 500 Index (S&P 500) is an unmanaged index of common stocks. Investors cannot invest directly in the S&P 500.
*Class A shares were not offered prior to November 28, 2008. All performance information for time periods beginning prior to November 28, 2008 is the performance of the Investor shares. This performance has not been adjusted to reflect the lower expenses of the Class A shares, but does, where noted, reflect an adjustment for the maximum applicable sales charge of 4.75%.
18
| AVERAGE ANNUAL TOTAL RETURNS (Unaudited) | Institutional shares | S&P 500 | ||||
| As of 7/31/18 | 1 Year | 10.68% | 16.24% | |||
| 5 Year | 9.58% | 13.12% | ||||
| 10 Year* | 8.45% | 10.67% | ||||
COMPARISON OF $500,000 INVESTMENT IN THE DOMINI IMPACT EQUITY FUND INSTITUTIONAL SHARES (DIEQX) AND S&P 500* (Unaudited)
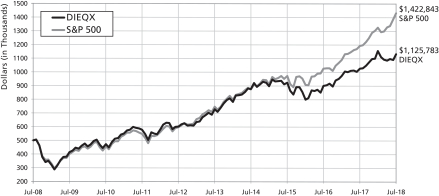
Past performance is no guarantee of future results. The Fund’s returns quoted above represent past performance after all expenses. The returns reflect any applicable expense waivers in effect during the periods shown. Without such waivers, Fund performance would be lower. Investment return, principal value, and yield will fluctuate. Your shares, when redeemed, may be worth more or less than their original cost. Call 1-800-582-6757 or visit www.domini.com for performance information current to the most recent month-end, which may be lower or higher. A 2.00% fee applies on sales/exchanges made less than 30 days after purchase/exchange, with certain exceptions. Quoted performance data does not reflect the deduction of this fee, which would reduce the performance quoted. See the Fund’s prospectus for further information.
Per the prospectus dated June 15, 2018, the Fund’s annual operating expenses totaled 0.74% (gross)/0.74% (net). The Fund’s adviser has contractually agreed to waive certain fees and/or reimburse certain ordinary operating expenses in order to limit Institutional shares to 0.74% until November 30, 2018, absent an earlier modification by the Fund’s Board.
The table and the graph do not reflect the deduction of fees and taxes that a shareholder would pay on Fund distributions or the redemption of Fund shares. Total return for the Domini Impact Equity Fund is based on the Fund’s net asset values and assumes all dividend and capital gains were reinvested. An investment in the Fund is not a bank deposit and is not insured. You may lose money.
The Standard & Poor’s 500 Index (S&P 500) is an unmanaged index of common stocks. Investors cannot invest directly in the S&P 500.
*Institutional shares were not offered prior to November 28, 2008. All performance information for time periods beginning prior to November 28, 2008 is the performance of the Investor shares. This performance has not been adjusted to reflect the lower expenses of the Institutional shares.
19
| AVERAGE ANNUAL TOTAL RETURNS (Unaudited) | Class R shares | S&P 500 | ||||
| As of 7/31/18 | 1 Year | 10.71% | 16.24% | |||
| 5 Year | 9.51% | 13.12% | ||||
| 10 Year | 8.80% | 10.67% | ||||
COMPARISON OF $10,000 INVESTMENT IN THE DOMINI IMPACT EQUITY FUND CLASS R SHARES (DSFRX) AND S&P 500 (Unaudited)
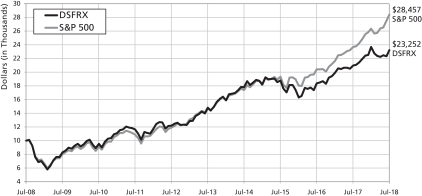
Past performance is no guarantee of future results. The Fund’s returns quoted above represent past performance after all expenses. The returns reflect any applicable expense waivers in effect during the periods shown. Without such waivers, Fund performance would be lower. Investment return, principal value, and yield will fluctuate. Your shares, when redeemed, may be worth more or less than their original cost. Call 1-800-582-6757 or visit www.domini.com for performance information current to the most recent month-end, which may be lower or higher. A 2.00% fee applies on sales/exchanges made less than 30 days after purchase/exchange, with certain exceptions. Quoted performance data does not reflect the deduction of this fee, which would reduce the performance quoted. See the Fund’s prospectus for further information.
Per the prospectus dated June 15, 2018, the Fund’s net annual operating expenses totaled 0.80%.
The table and the graph do not reflect the deduction of fees and taxes that a shareholder would pay on Fund distributions or the redemption of Fund shares. Total return for the Domini Impact Equity Fund is based on the Fund’s net asset values and assumes all dividend and capital gains were reinvested. An investment in the Fund is not a bank deposit and is not insured. You may lose money.
The Standard & Poor’s 500 Index (S&P 500) is an unmanaged index of common stocks. Investors cannot invest directly in the S&P 500.
20
DOMINI IMPACT EQUITY FUND
PORTFOLIOOF INVESTMENTS
July 31, 2018
| SECURITY | SHARES | VALUE | ||||||
| Common Stocks – 99.3% | ||||||||
| Consumer Discretionary – 11.3% | ||||||||
Amazon.com Inc (a) | 4,513 | $ | 8,021,587 | |||||
American Eagle Outfitters Inc | 58,678 | 1,477,512 | ||||||
Best Buy Co Inc | 147,903 | 11,097,162 | ||||||
Chipotle Mexican Grill Inc (a) | 6,988 | 3,030,416 | ||||||
Comcast Corp Cl A | 62,078 | 2,221,151 | ||||||
Deckers Outdoor Corp (a) | 22,222 | 2,507,308 | ||||||
Foot Locker Inc | 122,325 | 5,970,683 | ||||||
Gap Inc/The | 24,442 | 737,415 | ||||||
Guess? Inc | 91,109 | 2,064,530 | ||||||
Home Depot Inc/The | 218 | 43,059 | ||||||
Hyatt Hotels Corp Cl A | 71,426 | 5,587,656 | ||||||
Kohl’s Corp | 212 | 15,660 | ||||||
L Brands Inc | 219 | 6,936 | ||||||
Lear Corp | 38,338 | 6,905,824 | ||||||
Lowe’s Cos Inc | 364 | 36,160 | ||||||
Marriott International Inc/MD Cl A | 18,809 | 2,404,543 | ||||||
Michael Kors Holdings Ltd (a) | 235 | 15,682 | ||||||
NIKE Inc Cl B | 376 | 28,918 | ||||||
NVR Inc (a) | 271 | 747,806 | ||||||
Nordstrom Inc | 38,549 | 2,020,353 | ||||||
RH (a) | 19,178 | 2,605,523 | ||||||
Ralph Lauren Corp | 120,239 | 16,229,860 | ||||||
Shutterfly Inc (a) | 61,863 | 5,088,850 | ||||||
Starbucks Corp | 414 | 21,689 | ||||||
Tapestry Inc | 348 | 16,398 | ||||||
Target Corp | 140,633 | 11,346,270 | ||||||
Tenneco Inc | 36,698 | 1,691,778 | ||||||
Walt Disney Co/The | 242 | 27,482 | ||||||
|
| |||||||
| 91,968,211 | ||||||||
|
| |||||||
| Consumer Staples – 7.3% | ||||||||
Avon Products Inc (a) | 2,873 | 4,568 | ||||||
Campbell Soup Co | 191 | 7,812 | ||||||
Coca-Cola Co/The | 292 | 13,616 | ||||||
Colgate-Palmolive Co | 153 | 10,253 | ||||||
Costco Wholesale Corp | 120 | 26,245 | ||||||
Estee Lauder Cos Inc/The Cl A | 117,067 | 15,797,021 | ||||||
Flowers Foods Inc | 44,655 | 910,962 | ||||||
General Mills Inc | 175 | 8,061 | ||||||
JM Smucker Co/The | 82,215 | 9,135,731 | ||||||
Kimberly-Clark Corp | 141 | 16,054 | ||||||
Koninklijke Ahold Delhaize NV ADR | 35,528 | 902,589 | ||||||
Kraft Heinz Co/The | 223 | 13,436 | ||||||
Kroger Co/The | 354,732 | 10,287,228 | ||||||
Mondelez International Inc Cl A | 265 | 11,496 | ||||||
PepsiCo Inc | 161 | 18,515 | ||||||
Procter & Gamble Co/The | 155 | 12,536 | ||||||
Sysco Corp | 248 | 16,668 | ||||||
21
DOMINI IMPACT EQUITY FUND
PORTFOLIOOF INVESTMENTS (continued)
July 31, 2018
| SECURITY | SHARES | VALUE | ||||||
| Consumer Staples (Continued) | ||||||||
Walgreens Boots Alliance Inc | 326,211 | $ | 22,058,388 | |||||
|
| |||||||
| 59,251,179 | ||||||||
|
| |||||||
| Financials – 17.3% | ||||||||
Aegon NV | 249,349 | 1,633,236 | ||||||
Aflac Inc | 236,852 | 11,023,092 | ||||||
Allstate Corp/The | 25,949 | 2,468,269 | ||||||
American Express Co | 191 | 19,008 | ||||||
Banco Santander Brasil SA | 316,923 | 3,061,476 | ||||||
Bank of America Corp | 623,083 | 19,240,803 | ||||||
Bank of Nova Scotia/The | 57,539 | 3,409,186 | ||||||
Canadian Imperial Bank of Commerce | 62,695 | 5,719,665 | ||||||
Capital One Financial Corp | 32,159 | 3,033,237 | ||||||
DBS Group Holdings Ltd ADR | 106,738 | 8,471,261 | ||||||
E*TRADE Financial Corp (a) | 247,538 | 14,805,248 | ||||||
Intercontinental Exchange Inc | 195 | 14,412 | ||||||
Invesco Mortgage Capital Inc | 228,574 | 3,792,043 | ||||||
Lincoln National Corp | 82,956 | 5,649,304 | ||||||
MFA Financial Inc | 430,285 | 3,463,794 | ||||||
MGIC Investment Corp (a) | 113,790 | 1,420,099 | ||||||
MetLife Inc | 150,788 | 6,897,043 | ||||||
Morgan Stanley | 292 | 14,764 | ||||||
ORIX Corp ADR | 27,030 | 2,191,592 | ||||||
PNC Financial Services Group Inc/The | 190 | 27,518 | ||||||
Park Hotels & Resorts Inc | 262,054 | 8,197,049 | ||||||
Progressive Corp/The | 82,138 | 4,929,101 | ||||||
Prudential Financial Inc | 206,487 | 20,836,603 | ||||||
Radian Group Inc | 106,390 | 2,037,369 | ||||||
Regions Financial Corp | 43,728 | 813,778 | ||||||
Toronto-Dominion Bank/The | 33,821 | 2,001,527 | ||||||
Two Harbors Investment Corp | 295,454 | 4,579,537 | ||||||
US Bancorp | 346 | 18,341 | ||||||
Woori Bank ADR | 33,536 | 1,539,638 | ||||||
|
| |||||||
| 141,307,993 | ||||||||
|
| |||||||
| Health Care – 13.2% | ||||||||
Align Technology Inc (a) | 13,040 | 4,650,716 | ||||||
Amgen Inc | 68,465 | 13,456,796 | ||||||
Baxter International Inc | 89,121 | 6,456,816 | ||||||
Biogen Inc (a) | 42,139 | 14,090,017 | ||||||
Bristol-Myers Squibb Co | 274,387 | 16,120,236 | ||||||
Gilead Sciences Inc | 268,565 | 20,902,414 | ||||||
Merck & Co Inc | 260,001 | 17,126,266 | ||||||
Perrigo Co PLC | 24,964 | 2,010,101 | ||||||
ResMed Inc | 37,346 | 3,950,460 | ||||||
Varian Medical Systems Inc (a) | 28,773 | 3,321,843 | ||||||
Waters Corp (a) | 26,947 | 5,315,835 | ||||||
|
| |||||||
| 107,401,500 | ||||||||
|
| |||||||
22
DOMINI IMPACT EQUITY FUND
PORTFOLIOOF INVESTMENTS (continued)
July 31, 2018
| SECURITY | SHARES | VALUE | ||||||
| Industrials – 10.9% | ||||||||
3M Co | 115 | $ | 24,417 | |||||
AGCO Corp | 18,612 | 1,172,928 | ||||||
Applied Industrial Technologies Inc | 11,105 | 828,988 | ||||||
Bombardier Inc Cl B (a) | 606,661 | 2,283,133 | ||||||
Cummins Inc | 133,912 | 19,123,973 | ||||||
FTI Consulting Inc (a) | 19,062 | 1,505,136 | ||||||
HD Supply Holdings Inc (a) | 54,852 | 2,412,391 | ||||||
Herman Miller Inc | 39,497 | 1,494,961 | ||||||
JetBlue Airways Corp (a) | 1,688 | 30,384 | ||||||
Korn/Ferry International | 15,953 | 1,052,579 | ||||||
LSC Communications Inc | 409 | 6,143 | ||||||
PACCAR Inc | 309,251 | 20,323,976 | ||||||
Regal Beloit Corp | 35,110 | 3,017,705 | ||||||
Robert Half International Inc | 261,014 | 19,774,421 | ||||||
Terex Corp | 71,769 | 3,166,448 | ||||||
Trinity Industries Inc | 56,924 | 2,168,804 | ||||||
United Parcel Service Inc Cl B | 131 | 15,706 | ||||||
WW Grainger Inc | 29,570 | 10,247,779 | ||||||
|
| |||||||
| 88,649,872 | ||||||||
|
| |||||||
| Information Technology – 27.2% | ||||||||
Advanced Micro Devices Inc (a) | 3,150 | 57,740 | ||||||
Akamai Technologies Inc (a) | 83,921 | 6,315,894 | ||||||
Alphabet Inc Cl A (a) | 26,462 | 32,474,696 | ||||||
Apple Inc | 105,824 | 20,137,249 | ||||||
Cisco Systems Inc | 217,244 | 9,187,249 | ||||||
Citrix Systems Inc (a) | 138,685 | 15,251,189 | ||||||
DXC Technology Co | 117,747 | 9,977,881 | ||||||
First Solar Inc (a) | 358 | 18,742 | ||||||
Intel Corp | 483,973 | 23,279,101 | ||||||
International Business Machines Corp | 146,839 | 21,281,376 | ||||||
Lam Research Corp | 11,294 | 2,153,088 | ||||||
Mastercard Inc Cl A | 99,846 | 19,769,508 | ||||||
Micron Technology Inc (a) | 127,312 | 6,720,800 | ||||||
Microsoft Corp | 224,524 | 23,817,506 | ||||||
Motorola Solutions Inc | 201 | 24,381 | ||||||
NetApp Inc | 120,808 | 9,365,036 | ||||||
Seagate Technology PLC | 83,511 | 4,394,349 | ||||||
Total System Services Inc | 49,004 | 4,485,826 | ||||||
Twitter Inc (a) | 74,998 | 2,390,186 | ||||||
VMware Inc Cl A (a) | 43,116 | 6,234,142 | ||||||
Western Digital Corp | 62,538 | 4,387,041 | ||||||
|
| |||||||
| 221,722,980 | ||||||||
|
| |||||||
| Materials – 3.5% | ||||||||
Alcoa Corp (a) | 19,271 | 833,856 | ||||||
Domtar Corp | 279,631 | 13,483,807 | ||||||
Louisiana-Pacific Corp | 305,438 | 8,222,391 | ||||||
Nucor Corp | 230 | 15,394 | ||||||
23
DOMINI IMPACT EQUITY FUND
PORTFOLIOOF INVESTMENTS (continued)
July 31, 2018
| SECURITY | SHARES | VALUE | ||||||
| Materials (Continued) | ||||||||
Steel Dynamics Inc | 128,436 | $ | 6,048,051 | |||||
WestRock Co | 256 | 14,843 | ||||||
|
| |||||||
| 28,618,342 | ||||||||
|
| |||||||
| Real Estate – 2.1% | ||||||||
Host Hotels & Resorts Inc | 299,358 | 6,268,557 | ||||||
Life Storage Inc | 34,799 | 3,339,312 | ||||||
Mid-America Apartment Communities Inc | 80,066 | 8,069,051 | ||||||
|
| |||||||
| 17,676,920 | ||||||||
|
| |||||||
| Telecommunication Services – 3.2% | ||||||||
AT&T Inc | 529,951 | 16,942,533 | ||||||
Rogers Communications Inc Cl B | 18,626 | 947,505 | ||||||
TELUS Corp | 72,044 | 2,631,100 | ||||||
Telephone & Data Systems Inc | 182,230 | 4,601,308 | ||||||
Verizon Communications Inc | 263 | 13,581 | ||||||
Vodafone Group PLC ADR | 34,946 | 857,924 | ||||||
|
| |||||||
| 25,993,951 | ||||||||
|
| |||||||
| Utilities – 3.3% | ||||||||
Avangrid Inc | 184,747 | 9,248,435 | ||||||
Consolidated Edison Inc | 220,724 | 17,421,745 | ||||||
|
| |||||||
| 26,670,180 | ||||||||
|
| |||||||
| Total Investments – 99.3% (Cost $689,774,321) (b) | 809,261,128 | |||||||
| Other Assets, less liabilities – 0.7% | 5,856,955 | |||||||
|
| |||||||
| Net Assets – 100.0% | $815,118,083 | |||||||
|
| |||||||
(a) Non-income producing security.
(b) The aggregate cost for federal income tax purposes is $690,159,709. The aggregate gross unrealized appreciation is $137,316,391 and the aggregate gross unrealized depreciation is $18,214,972, resulting in net unrealized appreciation of $119,101,419.
ADR — American Depository Receipt
SEE NOTES TO FINANCIAL STATEMENTS
24
DOMINI IMPACT INTERNATIONAL EQUITY FUND
Performance Commentary (Unaudited)
The Fund invests primarily in mid- to large-cap equities across Europe, the Asia-Pacific region, and throughout the rest of the world. It is managed through a two-step process designed to capitalize on the strengths of Domini Impact Investments and Wellington Management Company, the Fund’s subadviser. Domini creates an approved list of companies based on its social, environmental and governance analysis, and Wellington seeks to add value and manage risk through a systematic and disciplined portfolio construction process.
Market Overview:
International equities posted positive gains during the twelve-month period ended July 31, 2018, with the MSCI EAFE Index (net)* returning 6.40%. Expanding economic growth, robust employment, and low inflation were key themes supporting the broad market rally.
Stocks rallied late in 2017 against a backdrop of supportive monetary policy, low unemployment, rising home values, and positive consumer and business sentiment. Early in 2018, markets encountered heightened volatility, with a sharp correction in global markets initially triggered by concerns about rising inflation in the U.S. Fears of a global trade war further unsettled financial markets after the Trump administration imposed stiff tariffs on steel and aluminum and announced plans to implement tariffs on Chinese imports, while also enacting tighter restrictions on acquisitions and technology transfers. Concerns escalated in the second quarter, as the U.S. threatened tariffs on European autos in response to the European Union’s retaliatory tariffs on American products. The U.S. also imposed additional levies on Chinese goods, and China vowed retaliatory tariffs.
Despite the announced tariffs and rising political instabilities, Eurozone economic confidence held firm, and strong corporate earnings helped support European equities. The European Central Bank (ECB) announced an end to quantitative easing, slated for December 2018, but kept a cautious tone, noting increased risks to the economic outlook and indicating that rates will not increase at least until summer 2019. The Bank of England hiked rates for the first time in ten years but noted that future rate hikes would depend on the stability of the Brexit transition.
Japan’s jobless rate fell to the lowest level in 25 years, helping to lift core inflation, but manufacturing weakened on higher input costs. The Bank of Japan (BOJ) pushed back against speculation that it would begin to unwind its fiscal stimulus, pledging “unlimited” purchases of government bonds to maintain its zero-interest-rate policy. The People’s Bank of China (PBOC) also maintained its accommodative stance and cut its reserve-requirement ratio for
25
most banks by 100 basis points to free up lending to small businesses. Chinese manufacturing eased late in the period due to weaker exports, while new orders helped boost non-manufacturing activity.
The U.S. dollar ended flat versus most major currencies over the period. Questionable political support for a strong currency extended the dollar’s 2017 decline into early 2018, particularly given escalating trade tensions. However, the dollar rallied late in the period, supported by strong U.S. economic growth and rising inflation, as well as the Federal Reserve’s (Fed) persistent monetary tightening. Emerging-markets currencies bore the brunt of the sell-off, especially in countries with high debt refinancing needs and current account deficits perceived to be most vulnerable to U.S. tightening and changing global financial conditions.
Portfolio Performance:
The Domini Impact International Equity Fund Investor shares returned 2.08% for the twelve-month period ended July 31, 2018, underperforming relative to the MSCI EAFE Index (net), which returned 6.40%.
Security selection was the primary driver of underperformance relative to the benchmark. Strong selection within the consumer discretionary and consumer staples sectors was more than offset by weak selection within the information technology, industrials, materials, and health care sectors.
From an allocation perspective, sector positioning relative to the MSCI EAFE Index (net) detracted from relative results during the period. This was primarily attributable to the Fund’s underweight to the energy sector, which was the best performing sector in the benchmark during the period. The Fund maintains this underweight largely due to its exclusion of oil and gas exploration and production companies.**
From a regional perspective, poor security selection in Japan offset stronger selection in other developed Asia-Pacific and European markets. In Asia, selection was particularly strong in Singapore; while in Europe, strong selection in Sweden and Belgium helped offset weaker selection in the United Kingdom and Germany. The Fund’s out-of-benchmark emerging markets positions detracted from relative performance, driven primarily by exposure to Turkey and South Korea.
From a market capitalization standpoint, the Fund’s overweight to mid-cap securities — stocks with market caps between $2 billion and $10 billion, which outperformed for the benchmark for the period — was additive to relative results. However, weak selection among this group of stocks more than offset that benefit. Selection was also weak among mega-cap stocks, which have market caps greater than $50 billion.
26
Over the period, the Fund benefited overall from the submanager’s exposure to fair value and both its long-term and short-term momentum, most notably in Europe and Asia. Additional contributions to Fund performance resulted from an overweight position in European automobile stocks, and underweight positioning in Japanese bank stocks. Detractors from performance over the past year included an underweight to European equities. The positive exposure to pure value themes in Japan and Europe was the largest detractor to performance.
At a security level, the top contributors to relative performance were French luxury goods company Kering, the Central Japan Railway Company (“JR Central”), French automotive manufacturer Peugeot (PSA Groupe) British grocery retailer Sainsbury’s, and Singapore’s DBS Bank.
The largest detractors from relative results included Japanese social-networking company Mixi, British telecommunications company Vodafone, non-benchmark Turkish bank Türkiye Vakiflar Bankasi and Australian iron ore company Fortescue Metals Group. Relative results were also hurt by the Fund not holding British-Dutch oil and gas company Shell.**
*Reflects reinvested dividends net of withholding taxes but reflects no deduction for fees, expenses or other taxes.
**Domini excludes companies included in the Integrated Oil & Gas or Oil & Gas Exploration & Production Industries as defined by the Global Industry Classification System (GICS).
27
TEN LARGEST HOLDINGS (Unaudited)
| SECURITY DESCRIPTION | % NET ASSETS | SECURITY DESCRIPTION | % NET ASSETS | |||||||
| Sanofi | 2.9% | Allianz SE | 2.0% | |||||||
| Nissan Motor Co Ltd | 2.2% | Novartis AG | 2.0% | |||||||
| Central Japan Railway Co | 2.2% | Kering SA | 1.8% | |||||||
| Sandvik AB | 2.1% | Koninklijke Ahold Delhaize NV | 1.8% | |||||||
| Vodafone Group PLC | 2.0% | Swisscom AG | 1.7% | |||||||
PORTFOLIO HOLDINGS BY INDUSTRY SECTOR (% OF NET ASSETS) (Unaudited)

The Global Industry Classification Standard (“GICS”) was developed by and is the exclusive property and a service mark of MSCI Inc. (“MSCI”) and Standard & Poor’s, a division of The McGraw-Hill Companies, Inc. (“S&P”) and is licensed for use by Domini Impact Investments. Neither MSCI, S&P nor any third party involved in making or compiling the GICS or any GICS classifications makes any express or implied warranties or representations with respect to such standard or classification nor shall any such party have any liability therefrom.
28
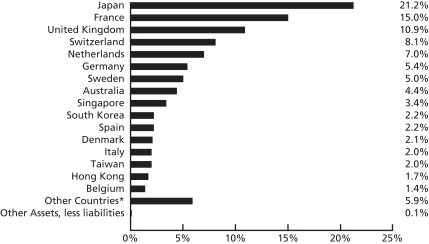
PORTFOLIO HOLDINGS BY COUNTRY (% OF NET ASSETS) (Unaudited)
The holdings mentioned above are described in the Fund’s Portfolio of Investments (as of 7/31/2018) included herein. The composition of the Fund’s portfolio is subject to change.
An investment in the Fund is not a bank deposit and is not insured and is subject to market, market segment, style and foreign investing risks. Investing internationally involves special risks, such as currency fluctuations, social and economic instability, differing security regulations and accounting standards, limited public information, possible changes in taxation, and periods of illiquidity.
*Other countries include South Africa (0.9%), Norway (0.7%), India (0.6%), China (0.5%), Mexico (0.5%), Panama (0.5%), Thailand (0.5%), Turkey (0.5%), Brazil (0.4%), United States (0.3%), Austria (0.2%), Finland (0.1%), Hungary (0.1%), Malaysia (0.1%), and Ireland (0.0%).
29
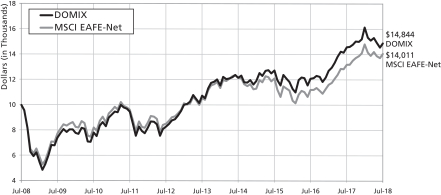
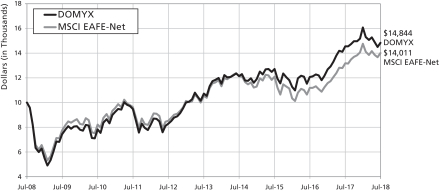
| AVERAGE ANNUAL TOTAL RETURNS (Unaudited) | Investor shares | MSCI EAFE (NET) | ||||
| As of 7/31/18 | 1 Year | 2.08% | 6.40% | |||
| 5 Year | 6.70% | 5.86% | ||||
10 Year | 4.03% | 3.43% | ||||
COMPARISON OF $10,000 INVESTMENT IN THE DOMINI IMPACT INTERNATIONAL EQUITY FUND INVESTOR SHARES (DOMIX) AND MSCI EAFE (NET) (Unaudited)
Past performance is no guarantee of future results. The Fund’s returns quoted above represent past performance after all expenses. The returns reflect any applicable expense waivers in effect during the periods shown. Without such waivers, Fund performance would be lower. Investment return, principal value, and yield will fluctuate. Your shares, when redeemed, may be worth more or less than their original cost. Call 1-800-582-6757 or visit www.domini.com for performance information current to the most recent month-end, which may be lower or higher. A 2.00% fee applies on sales/exchanges made less than 30 days after purchase/exchange, with certain exceptions. Quoted performance data does not reflect the deduction of this fee, which would reduce the performance quoted. See the Fund’s prospectus for further information.
Per the prospectus dated June 15, 2018, the Fund’s net annual operating expenses totaled 1.43%.
The table and the graph do not reflect the deduction of fees and taxes that a shareholder would pay on Fund distributions or the redemption of Fund shares. Total return for the Domini Impact International Equity Fund is based on the Fund’s net asset values and assumes all dividend and capital gains were reinvested.
The Morgan Stanley Capital International Europe Australasia Far East (MSCI EAFE) Index (net) is an unmanaged index of common stocks. MSCI EAFE (net) includes the reinvestment of dividends net of withholding tax, but does not reflect other fees, expenses or taxes. It is not available for direct investment.
30
| AVERAGE ANNUAL TOTAL RETURNS (Unaudited) | Class A shares (with 4.75% maximum Sales Charge) | Class A shares (without Sales Charge) | MSCI EAFE (NET) | |||||
| As of 7/31/18 | 1 Year | -2.85% | 2.00% | 6.40% | ||||
| 5 Year | 5.64% | 6.68% | 5.86% | |||||
| 10 Year* | 3.52% | 4.03% | 3.43% | |||||
COMPARISON OF $10,000 INVESTMENT IN THE DOMINI INTERNATIONAL SOCIAL EQUITY FUND CLASS A SHARES (DOMAX) AND MSCI EAFE (NET) (WITH 4.75% MAXIMUM SALES CHARGE)* (Unaudited)

Past performance is no guarantee of future results. The Fund’s returns quoted above represent past performance after all expenses. The returns reflect any applicable expense waivers in effect during the periods shown. Without such waivers, Fund performance would be lower. Investment return, principal value, and yield will fluctuate. Your shares, when redeemed, may be worth more or less than their original cost. Call 1-800-582-6757 or visit www.domini.com for performance information current to the most recent month-end, which may be lower or higher. A 2.00% fee applies on sales/exchanges made less than 30 days after purchase/exchange, with certain exceptions. Quoted performance data does not reflect the deduction of this fee, which would reduce the performance quoted. See the Fund’s prospectus for further information.
Per the prospectus dated June 15, 2018, the Fund’s annual operating expenses totaled 1.50% (gross)/1.43% (net). The Fund’s adviser has contractually agreed to waive certain fees and/or reimburse certain ordinary operating expenses in order to limit Class A shares to 1.43% until November 30, 2019, absent an earlier modification by the Fund’s Board. For the period November 30, 2017 through June 14, 2018, the Fund’s adviser agreed to waive certain fees and/or reimburse certain ordinary expenses in order to limit Class A share expenses to 1.51%.
The table and the graph do not reflect the deduction of fees and taxes that a shareholder would pay on Fund distributions or the redemption of Fund shares. Total return for the Domini Impact International Equity Fund is based on the Fund’s net asset values and assumes all dividend and capital gains were reinvested.
The Morgan Stanley Capital International Europe Australasia Far East (MSCI EAFE) Index (net) is an unmanaged index of common stocks. MSCI EAFE (net) includes the reinvestment of dividends net of withholding tax, but does not reflect other fees, expenses or taxes. It is not available for direct investment.
*Class A shares were not offered prior to November 28, 2008. All performance information for time periods beginning prior to November 28, 2008 is the performance of the Investor shares. This performance has not been adjusted to reflect the lower expenses of the Class A shares, but does, where noted, reflect an adjustment for the maximum applicable sales charges of 4.75%.
31
| AVERAGE ANNUAL TOTAL RETURNS (Unaudited) | Institutional shares | MSCI EAFE (NET) | ||||
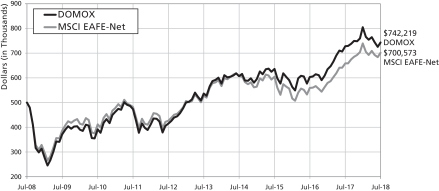
| As of 7/31/18 | 1 Year | 2.58% | 6.40% | |||
| 5 Year | 7.13% | 5.86% | ||||
| 10 Year* | 4.03% | 3.43% | ||||
COMPARISON OF $500,000 INVESTMENT IN THE DOMINI IMPACT INTERNATIONAL EQUITY FUND INSTITUTIONAL SHARES (DOMOX) AND MSCI EAFE (NET)* (Unaudited)
Past performance is no guarantee of future results. The Fund’s returns quoted above represent past performance after all expenses. The returns reflect any applicable expense waivers in effect during the periods shown. Without such waivers, Fund performance would be lower. Investment return, principal value, and yield will fluctuate. Your shares, when redeemed, may be worth more or less than their original cost. Call 1-800-582-6757 or visit www.domini.com for performance information current to the most recent month-end, which may be lower or higher. A 2.00% fee applies on sales/exchanges made less than 30 days after purchase/exchange, with certain exceptions. Quoted performance data does not reflect the deduction of this fee, which would reduce the performance quoted. See the Fund’s prospectus for further information.
Per the prospectus dated June 15, 2018, the Fund’s net annual operating expenses totaled 1.04%.
The table and the graph do not reflect the deduction of fees and taxes that a shareholder would pay on Fund distributions or the redemption of Fund shares. Total return for the Domini Impact International Equity Fund is based on the Fund’s net asset values and assumes all dividend and capital gains were reinvested.
The Morgan Stanley Capital International Europe Australasia Far East (MSCI EAFE) Index (net) is an unmanaged index of common stocks. MSCI EAFE (net) includes the reinvestment of dividends net of withholding tax, but does not reflect other fees, expenses or taxes. It is not available for direct investment.
*Institutional shares were not offered prior to November 30, 2012. All performance information for time periods beginning prior to November 30, 2012 is the performance of the Investor shares. This performance has not been adjusted to reflect the lower expenses of the Institutional shares.
32
| AVERAGE ANNUAL TOTAL RETURNS (Unaudited) | Class Y shares | MSCI EAFE (NET) | ||||
| As of 7/31/18 | 1 Year* | 2.08% | 6.40% | |||
| 5 Year* | 6.70% | 5.86% | ||||
| 10 Year* | 4.03% | 3.43% | ||||
COMPARISON OF $10,000 INVESTMENT IN THE DOMINI IMPACT INTERNATIONAL EQUITY FUND CLASS Y SHARES (DOMYX) AND MSCI EAFE (NET)* (Unaudited)
Past performance is no guarantee of future results. The Fund’s returns quoted above represent past performance after all expenses. The returns reflect any applicable expense waivers in effect during the periods shown. Without such waivers, Fund performance would be lower. Investment return, principal value, and yield will fluctuate. Your shares, when redeemed, may be worth more or less than their original cost. Call 1-800-582-6757 or visit www.domini.com for performance information current to the most recent month-end, which may be lower or higher. A 2.00% fee applies on sales/exchanges made less than 30 days after purchase/exchange, with certain exceptions. Quoted performance data does not reflect the deduction of this fee, which would reduce the performance quoted. See the Fund’s prospectus for further information.
Per the prospectus dated June 15, 2018, the Fund’s net annual operating expenses totaled 1.13%. The Fund’s adviser has contractually agreed to waive certain fees and/or reimburse certain ordinary operating expenses in order to limit Class Y shares to 1.15% until November 30, 2019, absent an earlier modification by the Fund’s Board.
The table and the graph do not reflect the deduction of fees and taxes that a shareholder would pay on Fund distributions or the redemption of Fund shares. Total return for the Domini Impact International Equity Fund is based on the Fund’s net asset values and assumes all dividend and capital gains were reinvested.
The Morgan Stanley Capital International Europe Australasia Far East (MSCI EAFE) Index (net) is an unmanaged index of common stocks. MSCI EAFE (net) includes the reinvestment of dividends net of withholding tax, but does not reflect other fees, expenses or taxes. It is not available for direct investment.
*Class Y Shares did not commence operations until July 23, 2018. All performance information for time periods beginning prior to July 23, 2018 is the performance of the Investor Shares. This performance has not been adjusted to reflect the lower expenses of the Class Y shares.
33
DOMINI IMPACT INTERNATIONAL EQUITY FUND
PORTFOLIOOF INVESTMENTS
July 31, 2018
| COUNTRY/SECURITY | INDUSTRY | SHARES | VALUE | |||||||
| Common Stock – 99.9% | ||||||||||
Australia – 4.4% | ||||||||||
BlueScope Steel Ltd | Materials | 961,203 | $ | 12,637,724 | ||||||
Dexus | Real Estate | 1,051,983 | 7,897,115 | |||||||
Flight Centre Travel Group Ltd | Consumer Services | 309,139 | 15,642,741 | |||||||
Fortescue Metals Group Ltd | Materials | 3,756,021 | 12,224,026 | |||||||
Harvey Norman Holdings Ltd | Retailing | 689,641 | 1,822,362 | |||||||
Mirvac Group | Real Estate | 7,518,213 | 12,768,886 | |||||||
|
| |||||||||
| 62,992,854 | ||||||||||
|
| |||||||||
Austria – 0.2% | ||||||||||
Raiffeisen Bank International AG | Banks | 84,100 | 2,806,009 | |||||||
|
| |||||||||
| 2,806,009 | ||||||||||
|
| |||||||||
Belgium – 1.4% | ||||||||||
Ageas | Insurance | 186,584 | 10,013,461 | |||||||
UCB SA | Pharma, Biotech & Life Sciences | 117,327 | 10,093,192 | |||||||
|
| |||||||||
| 20,106,653 | ||||||||||
|
| |||||||||
Brazil – 0.4% | ||||||||||
Banco do Brasil SA | Banks | 248,999 | 2,154,171 | |||||||
Cyrela Brazil Realty SA Empreendimentos e Participacoes | Consumer Durables & Apparel | 424,446 | 1,309,499 | |||||||
Hypera SA | Pharma, Biotech & Life Sciences | 167,998 | 1,240,985 | |||||||
Itausa – Investimentos Itau SA | Banks | 571,900 | 1,586,306 | |||||||
|
| |||||||||
| 6,290,961 | ||||||||||
|
| |||||||||
China – 0.5% | ||||||||||
Ping An Insurance Group Co of China Ltd | Insurance | 254,743 | 2,372,048 | |||||||
Tingyi Cayman Islands Holding Corp | Food & Beverage | 2,109,280 | 4,875,954 | |||||||
|
| |||||||||
| 7,248,002 | ||||||||||
|
| |||||||||
Denmark – 2.1% | ||||||||||
DSV A/S | Transportation | 43,834 | 3,675,393 | |||||||
FLSmidth & Co A/S | Capital Goods | 38,945 | 2,565,218 | |||||||
H Lundbeck A/S | Pharma, Biotech & Life Sciences | 195,065 | 14,128,803 | |||||||
Orsted A/S | Utilities | 107,340 | 6,629,291 | |||||||
Rockwool International A/S Cl B | Capital Goods | 6,601 | 2,645,261 | |||||||
|
| |||||||||
| 29,643,966 | ||||||||||
|
| |||||||||
34
DOMINI IMPACT INTERNATIONAL EQUITY FUND
PORTFOLIOOF INVESTMENTS (continued)
July 31, 2018
| COUNTRY/SECURITY | INDUSTRY | SHARES | VALUE | |||||||
Finland – 0.1% | ||||||||||
Valmet OYJ | Capital Goods | 64,720 | $ | 1,345,379 | ||||||
|
| |||||||||
| 1,345,379 | ||||||||||
|
| |||||||||
France – 15.0% | ||||||||||
AXA SA | Insurance | 946,122 | 23,853,871 | |||||||
BNP Paribas SA | Banks | 222,215 | 14,423,679 | |||||||
Capgemini SE | Software & Services | 107,081 | 13,707,432 | |||||||
Carrefour SA | Food & Staples Retailing | 365 | 6,548 | |||||||
Cie de Saint-Gobain | Capital Goods | 163,086 | 7,254,871 | |||||||
CNP Assurances | Insurance | 202,651 | 4,735,177 | |||||||
Eiffage SA | Capital Goods | 136,863 | 15,303,705 | |||||||
Eurazeo SA | Diversified Financials | 2 | 155 | |||||||
Faurecia SA | Automobiles & Components | 175,378 | 11,920,252 | |||||||
Kering SA | Consumer Durables & Apparel | 48,457 | 25,769,610 | |||||||
Klepierre SA | Real Estate | 93,587 | 3,526,698 | |||||||
Orange SA | Telecommunication Services | 500,500 | 8,534,481 | |||||||
Peugeot SA | Automobiles & Components | 755,153 | 21,702,467 | |||||||
Sanofi | Pharma, Biotech & Life Sciences | 469,826 | 40,897,608 | |||||||
Schneider Electric SE | Capital Goods | 74,160 | 5,956,079 | |||||||
STMicroelectronics NV | Semiconductors & Semiconductor Equipment | 275,530 | 5,950,001 | |||||||
Teleperformance | Commercial & Professional Services | 46,031 | 8,434,783 | |||||||
|
| |||||||||
| 211,977,417 | ||||||||||
|
| |||||||||
Germany – 5.4% | ||||||||||
adidas AG | Consumer Durables & Apparel | 70,336 | 15,560,142 | |||||||
AIXTRON SE (a) | Semiconductors & Semiconductor Equipment | 80,112 | 1,153,339 | |||||||
Allianz SE | Insurance | 129,804 | 28,736,917 | |||||||
CECONOMY AG | Retailing | 734,217 | 6,034,765 | |||||||
Deutsche Boerse AG | Diversified Financials | 48,336 | 6,373,843 | |||||||
Puma SE | Consumer Durables & Apparel | 4,038 | 1,941,837 | |||||||
Vonovia SE | Real Estate | 156,016 | 7,555,270 | |||||||
Wacker Chemie AG | Materials | 58,983 | 8,581,113 | |||||||
|
| |||||||||
| 75,937,226 | ||||||||||
|
| |||||||||
Hong Kong – 1.7% | ||||||||||
CK Asset Holdings Ltd | Real Estate | 1,115,592 | 8,545,807 | |||||||
Hongkong Land Holdings Ltd | Real Estate | 506,800 | 3,690,552 | |||||||
Kerry Properties Ltd | Real Estate | 851,179 | 4,318,876 | |||||||
Swire Properties Ltd | Real Estate | 368,734 | 1,452,551 | |||||||
Wharf Holdings Ltd/The | Real Estate | 1,372,526 | 4,545,047 | |||||||
Wheelock & Co Ltd | Real Estate | 297,708 | 2,114,053 | |||||||
|
| |||||||||
| 24,666,886 | ||||||||||
|
| |||||||||
35
DOMINI IMPACT INTERNATIONAL EQUITY FUND
PORTFOLIOOF INVESTMENTS (continued)
July 31, 2018
| COUNTRY/SECURITY | INDUSTRY | SHARES | VALUE | |||||||
Hungary – 0.1% | ||||||||||
Richter Gedeon Nyrt | Pharma, Biotech & Life Sciences | 81,493 | $ | 1,473,890 | ||||||
|
| |||||||||
| 1,473,890 | ||||||||||
|
| |||||||||
India – 0.6% | ||||||||||
Infosys Ltd | Software & Services | 368,453 | 7,332,925 | |||||||
Wipro Ltd | Software & Services | 363,301 | 1,469,820 | |||||||
|
| |||||||||
| 8,802,745 | ||||||||||
|
| |||||||||
Ireland – 0.0% | ||||||||||
Irish Bank Resolution Corp Ltd/Old (a) (c) | Banks | 138,674 | 0 | |||||||
|
| |||||||||
| 0 | ||||||||||
|
| |||||||||
Italy – 2.0% | ||||||||||
CNH Industrial NV | Capital Goods | 459,099 | 5,392,830 | |||||||
Intesa Sanpaolo SpA | Banks | 1,725,917 | 5,292,476 | |||||||
Poste Italiane SpA | Insurance | 1,926,174 | 17,930,805 | |||||||
|
| |||||||||
| 28,616,111 | ||||||||||
|
| |||||||||
Japan – 21.2% | ||||||||||
Aeon Mall Co Ltd | Real Estate | 63,985 | 1,119,684 | |||||||
Brother Industries Ltd | Technology Hardware & Equipment | 448,072 | 9,130,061 | |||||||
Central Japan Railway Co | Transportation | 146,483 | 30,475,091 | |||||||
Coca-Cola Bottlers Japan Holdings Inc | Food & Beverage | 123,506 | 4,448,390 | |||||||
Dai Nippon Printing Co Ltd | Commercial & Professional Services | 383,241 | 8,363,908 | |||||||
FUJIFILM Holdings Corp | Technology Hardware & Equipment | 419,785 | 17,307,183 | |||||||
GungHo Online Entertainment Inc | Software & Services | 1,248,060 | 2,661,560 | |||||||
Hachijuni Bank Ltd/The | Banks | 1,127,837 | 4,966,659 | |||||||
K’s Holdings Corp | Retailing | 765,107 | 8,604,673 | |||||||
Kose Corp | Household & Personal Products | 70,748 | 13,545,722 | |||||||
KYORIN Holdings Inc | Pharma, Biotech & Life Sciences | 60,597 | 1,232,447 | |||||||
Matsumotokiyoshi Holdings Co Ltd | Food & Staples Retailing | 87,169 | 3,776,179 | |||||||
Medipal Holdings Corp | Health Care Equipment & Services | 335,600 | 6,816,268 | |||||||
MINEBEA MITSUMI Inc | Capital Goods | 105,825 | 1,897,132 | |||||||
Mitsubishi Estate Co Ltd | Real Estate | 170,982 | 2,963,670 | |||||||
Mitsubishi Gas Chemical Co Inc | Materials | 566,503 | 12,643,226 | |||||||
Mitsui Fudosan Co Ltd | Real Estate | 560,607 | 13,390,107 | |||||||
Mixi Inc | Software & Services | 302,213 | 7,949,709 | |||||||
MS&AD Insurance Group Holdings Inc | Insurance | 267,005 | 8,169,142 | |||||||
36
DOMINI IMPACT INTERNATIONAL EQUITY FUND
PORTFOLIOOF INVESTMENTS (continued)
July 31, 2018
| COUNTRY/SECURITY | INDUSTRY | SHARES | VALUE | |||||||
Japan (Continued) | ||||||||||
Murata Manufacturing Co Ltd | Technology Hardware & Equipment | 20,324 | $ | 3,552,236 | ||||||
Nintendo Co Ltd | Software & Services | 13,892 | 4,692,849 | |||||||
Nippon Electric Glass Co Ltd | Technology Hardware & Equipment | 171,462 | 5,535,525 | |||||||
Nippon Telegraph & Telephone Corp | Telecommunication Services | 29,995 | 1,385,826 | |||||||
Nissan Motor Co Ltd | Automobiles & Components | 3,292,857 | 31,112,676 | |||||||
Nisshin Seifun Group Inc | Food & Beverage | 199,686 | 3,908,482 | |||||||
Nomura Holdings Inc | Diversified Financials | 242,788 | 1,149,871 | |||||||
Nomura Real Estate Holdings Inc | Real Estate | 104,485 | 2,278,129 | |||||||
NTN Corp | Capital Goods | 5,300 | 23,372 | |||||||
Ono Pharmaceutical Co Ltd | Pharma, Biotech & Life Sciences | 58,164 | 1,372,838 | |||||||
ORIX Corp | Diversified Financials | 1,357,923 | 21,970,381 | |||||||
Rohm Co Ltd | Semiconductors & Semiconductor Equipment | 77,526 | 6,600,412 | |||||||
Seino Holdings Co Ltd | Transportation | 379,939 | 6,628,424 | |||||||
Shimamura Co Ltd | Retailing | 23,749 | 2,219,862 | |||||||
Sony Corp | Consumer Durables & Apparel | 68,006 | 3,651,024 | |||||||
Sumitomo Dainippon Pharma Co Ltd | Pharma, Biotech & Life Sciences | 134,428 | 2,605,855 | |||||||
Suzuken Co Ltd/Aichi Japan | Health Care Equipment & Services | 75,672 | 3,310,022 | |||||||
THK Co Ltd | Capital Goods | 139,846 | 3,805,165 | |||||||
Tokyo Electron Ltd | Semiconductors & Semiconductor Equipment | 11,109 | 1,945,232 | |||||||
Toppan Printing Co Ltd | Commercial & Professional Services | 1,082,717 | 8,321,432 | |||||||
Toyo Seikan Group Holdings Ltd | Materials | 348,727 | 6,423,650 | |||||||
Yamada Denki Co Ltd | Retailing | 1,974,934 | 9,784,994 | |||||||
Yamazaki Baking Co Ltd | Food & Beverage | 255,674 | 6,350,750 | |||||||
Zeon Corp | Materials | 209,097 | 2,366,315 | |||||||
|
| |||||||||
| 300,456,133 | ||||||||||
|
| |||||||||
Malaysia – 0.1% | ||||||||||
Top Glove Corp Bhd | Health Care Equipment & Services | 516,842 | 1,290,869 | |||||||
|
| |||||||||
| 1,290,869 | ||||||||||
|
| |||||||||
Mexico – 0.5% | ||||||||||
Grupo Financiero Banorte SAB de CV | Banks | 961,201 | 6,696,829 | |||||||
|
| |||||||||
| 6,696,829 | ||||||||||
|
| |||||||||
Netherlands – 7.0% | ||||||||||
ABN AMRO Group NV | Banks | 166,025 | 4,597,654 | |||||||
Aegon NV | Insurance | 1,091,680 | 7,200,711 | |||||||
37
DOMINI IMPACT INTERNATIONAL EQUITY FUND
PORTFOLIOOF INVESTMENTS (continued)
July 31, 2018
| COUNTRY/SECURITY | INDUSTRY | SHARES | VALUE | |||||||
Netherlands (Continued) | ||||||||||
ASR Nederland NV | Insurance | 123,306 | $ | 5,519,581 | ||||||
Coca-Cola European Partners PLC | Food & Beverage | 195,850 | 8,076,854 | |||||||
Koninklijke Ahold Delhaize NV | Food & Staples Retailing | 976,496 | 24,847,814 | |||||||
Koninklijke DSM NV | Materials | 125,374 | 13,370,351 | |||||||
Koninklijke Philips NV | Health Care Equipment & Services | 465,368 | 20,441,683 | |||||||
NN Group NV | Insurance | 335,786 | 14,842,952 | |||||||
|
| |||||||||
| 98,897,600 | ||||||||||
|
| |||||||||
Norway – 0.7% | ||||||||||
Orkla ASA | Food & Beverage | 638,977 | 5,413,101 | |||||||
TGS NOPEC Geophysical Co ASA | Energy | 135,049 | 5,154,833 | |||||||
|
| |||||||||
| 10,567,934 | ||||||||||
|
| |||||||||
Panama – 0.5% | ||||||||||
Copa Holdings SA Cl A | Transportation | 71,790 | 6,988,039 | |||||||
|
| |||||||||
| 6,988,039 | ||||||||||
|
| |||||||||
Singapore – 3.4% | ||||||||||
ComfortDelGro Corp Ltd | Transportation | 1,486,064 | 2,568,806 | |||||||
DBS Group Holdings Ltd | Banks | 1,094,516 | 21,535,737 | |||||||
Oversea-Chinese Banking Corp Ltd | Banks | 1,401,618 | 11,941,059 | |||||||
United Overseas Bank Ltd | Banks | 591,255 | 11,757,820 | |||||||
|
| |||||||||
| 47,803,422 | ||||||||||
|
| |||||||||
South Africa – 0.9% | ||||||||||
Mondi Ltd | Materials | 71,110 | 1,958,620 | |||||||
Nedbank Group Ltd | Banks | 125,948 | 2,620,009 | |||||||
Old Mutual Ltd (a) | Insurance | 3,471,711 | 7,938,830 | |||||||
|
| |||||||||
| 12,517,459 | ||||||||||
|
| |||||||||
South Korea – 2.2% | ||||||||||
BNK Financial Group Inc | Banks | 337,867 | 2,709,446 | |||||||
Hankook Tire Co Ltd | Automobiles & Components | 34,269 | 1,360,185 | |||||||
Industrial Bank of Korea | Banks | 488,439 | 6,842,907 | |||||||
LG Display Co Ltd | Technology Hardware & Equipment | 61,437 | 1,164,733 | |||||||
LG Electronics Inc | Consumer Durables & Apparel | 18,303 | 1,226,812 | |||||||
LG Uplus Corp | Telecommunication Services | 524,931 | 7,226,837 | |||||||
Shinsegae Inc | Retailing | 15,135 | 4,491,474 | |||||||
Woori Bank | Banks | 372,846 | 5,635,541 | |||||||
|
| |||||||||
| 30,657,935 | ||||||||||
|
| |||||||||
38
DOMINI IMPACT INTERNATIONAL EQUITY FUND
PORTFOLIOOF INVESTMENTS (continued)
July 31, 2018
| COUNTRY/SECURITY | INDUSTRY | SHARES | VALUE | |||||||
Spain – 2.2% | ||||||||||
Aena SME SA | Transportation | 118,345 | $ | 21,501,309 | ||||||
Banco Santander SA | Banks | 2,078 | 11,681 | |||||||
Enagas SA | Energy | 327,394 | 9,158,301 | |||||||
|
| |||||||||
| 30,671,291 | ||||||||||
|
| |||||||||
Sweden – 5.0% | ||||||||||
Alfa Laval AB | Capital Goods | 269,829 | 7,422,866 | |||||||
Castellum AB | Real Estate | 177,504 | 3,204,170 | |||||||
Essity AB Cl B | Household & Personal Products | 97,230 | 2,433,931 | |||||||
Holmen AB Cl B | Materials | 114,522 | 2,551,033 | |||||||
Industrivarden AB Cl C | Diversified Financials | 190,791 | 4,021,485 | |||||||
Kinnevik AB Cl B | Diversified Financials | 59,257 | 2,046,671 | |||||||
Sandvik AB | Capital Goods | 1,621,851 | 29,678,240 | |||||||
SKF AB Cl B | Capital Goods | 257,442 | 5,289,228 | |||||||
SSAB AB | Materials | 419,784 | 2,072,253 | |||||||
Svenska Cellulosa AB SCA Cl B | Materials | 1,135,011 | 11,752,447 | |||||||
|
| |||||||||
| 70,472,324 | ||||||||||
|
| |||||||||
Switzerland – 8.1% | ||||||||||
Baloise Holding AG | Insurance | 57,924 | 9,034,014 | |||||||
Chocoladefabriken Lindt & Spruengli AG | Food & Beverage | 1,722 | 11,873,408 | |||||||
Novartis AG | Pharma, Biotech & Life Sciences | 335,886 | 28,192,398 | |||||||
OC Oerlikon Corp AG | Capital Goods | 364,895 | 5,670,373 | |||||||
Swatch Group AG/The | Consumer Durables & Apparel | 10,933 | 4,894,249 | |||||||
Swiss Life Holding AG | Insurance | 40,411 | 14,492,714 | |||||||
Swisscom AG | Telecommunication Services | 51,001 | 23,948,369 | |||||||
Temenos AG | Software & Services | 31,965 | 5,145,591 | |||||||
Vifor Pharma AG | Pharma, Biotech & Life Sciences | 60,245 | 11,397,262 | |||||||
|
| |||||||||
| 114,648,378 | ||||||||||
|
| |||||||||
Taiwan – 2.0% | ||||||||||
Asustek Computer Inc | Technology Hardware & Equipment | 622,194 | 5,363,557 | |||||||
AU Optronics Corp | Technology Hardware & Equipment | 8,780,292 | 3,800,030 | |||||||
Cathay Financial Holding Co Ltd | Insurance | 1,198,415 | 2,066,783 | |||||||
E.Sun Financial Holding Co Ltd | Banks | 2,577,338 | 1,798,709 | |||||||
Nanya Technology Corp | Semiconductors & Semiconductor Equipment | 2,257,837 | 5,809,005 | |||||||
United Microelectronics Corp | Semiconductors & Semiconductor Equipment | 12,227,181 | 7,002,263 | |||||||
Walsin Technology Corp (a) | Technology Hardware & Equipment | 169,320 | 1,928,309 | |||||||
|
| |||||||||
| 27,768,656 | ||||||||||
|
| |||||||||
39
DOMINI IMPACT INTERNATIONAL EQUITY FUND
PORTFOLIOOF INVESTMENTS (continued)
July 31, 2018
| COUNTRY/SECURITY | INDUSTRY | SHARES | VALUE | |||||||
Thailand – 0.5% | ||||||||||
CP ALL PCL | Food & Staples Retailing | 2,233,806 | $ | 5,052,417 | ||||||
Total Access Communication PCL | Telecommunication Services | 1,715,129 | 2,115,713 | |||||||
|
| |||||||||
| 7,168,130 | ||||||||||
|
| |||||||||
Turkey – 0.5% | ||||||||||
Turkiye Garanti Bankasi AS | Banks | 1,361,374 | 1,970,786 | |||||||
Turkiye Is Bankasi AS | Banks | 1,668,836 | 1,731,791 | |||||||
Turkiye Vakiflar Bankasi TAO (a) | Banks | 3,443,022 | 2,895,152 | |||||||
|
| |||||||||
| 6,597,729 | ||||||||||
|
| |||||||||
United Kingdom – 10.9% | ||||||||||
3i Group PLC | Diversified Financials | 1,126,535 | 13,982,792 | |||||||
Berkeley Group Holdings PLC | Consumer Durables & Apparel | 161,860 | 7,917,637 | |||||||
Burberry Group PLC | Consumer Durables & Apparel | 203,275 | 5,611,424 | |||||||
InterContinental Hotels Group PLC | Consumer Services | 94,557 | 5,832,616 | |||||||
J Sainsbury PLC | Food & Staples Retailing | 4,244,620 | 18,190,987 | |||||||
Next PLC | Retailing | 127,895 | 9,951,112 | |||||||
Persimmon PLC | Consumer Durables & Apparel | 144,634 | 4,701,296 | |||||||
Petrofac Ltd | Energy | 901,230 | 7,242,395 | |||||||
Royal Mail PLC | Transportation | 1,652,964 | 10,163,753 | |||||||
Segro PLC | Real Estate | 1,379,643 | 12,018,177 | |||||||
Smith & Nephew PLC | Health Care Equipment & Services | 630,987 | 10,918,293 | |||||||
Taylor Wimpey PLC | Consumer Durables & Apparel | 2,145,941 | 4,921,643 | |||||||
Unilever PLC | Household & Personal Products | 237 | 13,530 | |||||||
Vodafone Group PLC | Telecommunication Services | 11,772,834 | 28,743,064 | |||||||
Wm Morrison Supermarkets PLC | Food & Staples Retailing | 4,129,193 | 14,149,871 | |||||||
|
| |||||||||
| 154,358,590 | ||||||||||
|
| |||||||||
40
DOMINI IMPACT INTERNATIONAL EQUITY FUND
PORTFOLIOOF INVESTMENTS (continued)
July 31, 2018
| COUNTRY/SECURITY | INDUSTRY | SHARES | VALUE | |||||||
United States – 0.3% | ||||||||||
Cimpress NV (a) | Commercial & Professional Services | 27,346 | $ | 3,994,430 | ||||||
|
| |||||||||
| 3,994,430 | ||||||||||
|
| |||||||||
| Total Investments – 99.9% (Cost $1,332,786,535) (b) | 1,413,463,847 | |||||||||
| Other Assets, less liabilities – 0.1% | 885,058 | |||||||||
|
| |||||||||
| Net Assets – 100.0% | $1,414,348,905 | |||||||||
|
| |||||||||
(a) Non-income producing security.
(b) The aggregate cost for federal income tax purposes is $1,346,918,962. The aggregate gross unrealized appreciation is $136,239,363 and the aggregate gross unrealized depreciation is $69,694,478, resulting in net unrealized appreciation $66,544,885.
(c) Securities for which there are no such quotations or valuations are valued at fair value as determined in good faith by or at the direction of the Fund’s Board of Trustees.
As of the date of this report, certain foreign securities were fair valued by an independent pricing service under the direction of the Board of Trustees or its delegates in accordance with the Trust’s Valuation and Pricing Policies and Procedures.
SEE NOTES TO FINANCIAL STATEMENTS
41
Performance Commentary (Unaudited)
The Fund invests primarily in investment-grade fixed-income securities, including government, corporate, mortgage-backed and asset-backed securities, and U.S. dollar-denominated bonds issued by non-U.S. entities. It is managed through a two-step process designed to capitalize on the strengths of Domini Impact Investments and Wellington Management Company. Domini sets social and environmental guidelines and objectives for each asset class, and develops an approved universe of issuers and securities, and Wellington utilizes proprietary analytical tools to manage the portfolio.
Market Overview:
U.S. core fixed-income markets generated negative total returns over the trailing twelve months ended July 31, 2018, as rising U.S. Treasury yields and widening investment-grade corporate credit spreads more than offset the impact of coupon income. The Bloomberg Barclays U.S. Aggregate (BBUSA) Bond Index declined 0.80% during the period.
Escalating geopolitical tensions supported core government bonds over the first half of the period, and U.S. Treasury yields declined. However, the anticipated inflationary impact of U.S. trade tariffs, coupled with the Federal Reserve Bank’s (Fed) continued monetary policy normalization, pushed Treasury yields higher over the second half of the period, despite elevated political uncertainty in Europe.
Even as credit spreads widened, investment-grade credit outperformed against a backdrop of generally strong global economic data and positive corporate earnings trends. Investment-grade corporate spreads widened seven basis points, according to Bloomberg Barclays index data, amid concerns over increased leverage from a pickup in mergers-and-acquisitions activity, higher currency hedging costs, and less demand for credit as U.S. companies repatriated overseas funds. High-yield corporate spreads, on the other hand, tightened sixteen basis points, as lower-rated bonds benefitted from continued demand for yield-producing assets and a lack of supply.
Portfolio Performance:
The Domini Impact Bond Fund Investor shares returned -0.74% for the twelve-month period ended July 31, 2018, modestly outperforming relative to the BBUSA, which returned -0.80%.
Throughout the period, the Fund remained underweight to investment-grade credit in favor of high-yield credit and bank loans, where the submanager saw attractive valuations and low default expectations. These high-yield positions were among the top contributors to relative results. Within investment-grade credit, the Fund maintained an overweight to taxable municipals, which also had a strong positive contribution. Positioning within investment-grade credit
42
was additive overall, with the strong positive contribution from taxable municipals only slightly offset by a negative impact from the Fund’s underweight to the energy sector.
The Fund’s positioning within securitized sectors also contributed positively to relative results. Within agency mortgage-backed securities (MBS), allocations to FNMA (“Fannie Mae”) Delegated Underwriting and Servicing (DUS) bonds and collateralized mortgage obligations (CMOs) were additive, while positioning within agency MBS passthrough securities detracted modestly. An allocation to high-quality commercial mortgage-backed securities (CMBS) was also additive.
During the period, the Fund used derivatives to help the implementation of the submanager’s overall investment strategy, including credit default swap indices, interest rate swaps, Consumer Price Index (CPI) swaps, currency futures, and currency forwards. The Fund’s positioning in below-investment-grade credit default swaps, used to manage risk exposures, contributed positively to relative performance. CPI swaps, used to position the Fund for rising inflation expectations, were also additive to relative results, as inflation expectations increased during the period. The Fund’s duration and yield-curve positioning detracted from relative results.
At the end of the period, the Fund implemented interest-rate positions around the benchmark, and remained positioned for rising inflation expectations, as the submanager continued to believe the market was underpricing inflation risks. The Fund was positioned with underweights to government bonds and investment-grade corporate credit in favor of taxable municipals and high-quality securitized sectors, including agency MBS and CMBS. The Fund also maintained an allocation to high-yield corporate credit and bank loans.
43
PORTFOLIO COMPOSITION (% OF NET ASSETS) (Unaudited)
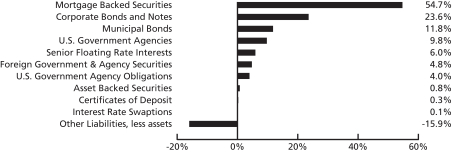
During periods of rising interest rates, bond funds can lose value. Some of the Fund’s community development investments may be unrated and may carry greater risks than the Fund’s other holdings. The Fund currently holds a large percentage of its portfolio in mortgage-backed securities. During periods of falling interest rates these securities may prepay the principal due, which may lower the Fund’s return by causing it to reinvest at lower interest rates.
Investments in derivatives can be volatile. Potential risks include currency risk, leverage risk (the risk that small market movements may result in large changes in the value of an investment), liquidity risk, index risk, pricing risk, and counterparty risk (the risk that the counterparty may be unwilling or unable to honor its obligations). TBA (To Be Announced) securities involve the risk that the security the Fund buys will lose value prior to its delivery. There also is the risk that the security will not be issued or that the other party to the transaction will not meet its obligation, which can adversely affect the Fund’s results.
The reduction or withdrawal of historical financial market support activities by the U.S. Government and Federal Reserve, or other governments/central banks could negatively impact financial markets generally, and increase market, liquidity and interest rate risks which could adversely affect the Fund’s returns.
The Global Industry Classification Standard (“GICS”) was developed by and is the exclusive property and a service mark of MSCI Inc. (“MSCI”) and Standard & Poor’s, a division of The McGraw-Hill Companies, Inc. (“S&P”) and is licensed for use by Domini Impact Investments. Neither MSCI, S&P nor any third party involved in making or compiling the GICS or any GICS classifications makes any express or implied warranties or representations with respect to such standard or classification nor shall any such party have any liability therefrom.
44
| AVERAGE ANNUAL TOTAL RETURNS (Unaudited) | Investor shares | Bloomberg Barclays U.S. Aggregate Index | ||||
| As of 7/31/18 | 1 Year | -0.74% | -0.80% | |||
| 5 Year | 1.80% | 2.25% | ||||
| 10 Year | 3.00% | 3.73% | ||||
COMPARISON OF $10,000 INVESTMENT IN THE DOMINI IMPACT BOND FUND INVESTOR SHARES (DSBFX) AND BBUSA (Unaudited)
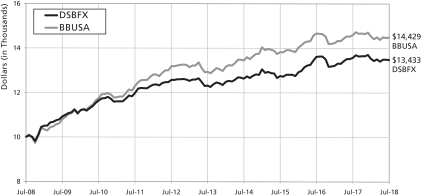
Past performance is no guarantee of future results. The Fund’s returns quoted above represent past performance after all expenses. The returns reflect any applicable expense waivers in effect during the periods shown. Without such waivers, Fund performance would be lower. Investment return, principal value, and yield will fluctuate. Your shares, when redeemed, may be worth more or less than their original cost. Call 1-800-582-6757 or visit www.domini.com for performance information current to the most recent month-end, which may be lower or higher. A 2.00% fee applies on sales/exchanges made less than 30 days after purchase/exchange, with certain exceptions. Quoted performance data does not reflect the deduction of this fee, which would reduce the performance quoted. See the Fund’s prospectus for further information.
Per the prospectus dated June 15, 2018, the Fund’s annual operating expenses totaled 1.10% (gross)/0.87% (net). The Fund’s adviser has contractually agreed to waive certain fees and/or reimburse certain ordinary operating expenses in order to limit Investor shares to 0.87% until November 30, 2018, absent an earlier modification by the Fund’s Board.
The table and the graph do not reflect the deduction of fees and taxes that a shareholder would pay on Fund distributions or the redemption of Fund shares. Total return for the Domini Impact Bond Fund is based on the Fund’s net asset values and assumes all dividend and capital gains were reinvested.
The Bloomberg Barclays U.S. Aggregate Bond Index (“BBUSA”) is an index representing securities that are U.S. domestic, taxable, and dollar denominated and covering the U.S investment grade fixed rate bond market, with index components for government and corporate securities and asset-backed securities. You cannot invest directly in an index.
45
| AVERAGE ANNUAL TOTAL RETURNS (Unaudited) | Institutional shares | Bloomberg Barclays U.S. Aggregate Index | ||||
| As of 7/31/18 | 1 Year | -0.36% | -0.80% | |||
| 5 Year | 2.04% | 2.25% | ||||
| 10 Year* | 3.00% | 3.73% | ||||
COMPARISON OF $500,000 INVESTMENT IN THE DOMINI IMPACT BOND FUND INSTITUTIONAL SHARES (DSBIX) AND BBUSA* (Unaudited)
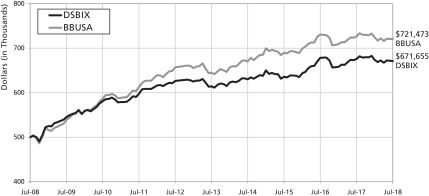
Past performance is no guarantee of future results. The Fund’s returns quoted above represent past performance after all expenses. The returns reflect any applicable expense waivers in effect during the periods shown. Without such waivers, Fund performance would be lower. Investment return, principal value, and yield will fluctuate. Your shares, when redeemed, may be worth more or less than their original cost. Call 1-800-582-6757 or visit www.domini.com for performance information current to the most recent month-end, which may be lower or higher. A 2.00% fee applies on sales/exchanges made less than 30 days after purchase/exchange, with certain exceptions. Quoted performance data does not reflect the deduction of this fee, which would reduce the performance quoted. See the Fund’s prospectus for further information.
Per the prospectus dated June 15, 2018, the Fund’s annual operating expenses totaled 0.96% (gross)/0.57% (net). The Fund’s adviser has contractually agreed to waive certain fees and/or reimburse certain ordinary operating expenses in order to limit Institutional shares to 0.57% until November 30, 2018, absent an earlier modification by the Fund’s Board.
The table and the graph do not reflect the deduction of fees and taxes that a shareholder would pay on Fund distributions or the redemption of Fund shares. Total return for the Domini Impact Bond Fund is based on the Fund’s net asset values and assumes all dividend and capital gains were reinvested.
The Bloomberg Barclays U.S. Aggregate Bond Index (“BBUSA”) is an index representing securities that are U.S. domestic, taxable, and dollar denominated and covering the U.S investment grade fixed rate bond market, with index components for government and corporate securities and asset-backed securities. You cannot invest directly in an index.
*Institutional shares were not offered prior to 11/30/2011. All performance information for time periods beginning prior to 11/30/2011 is the performance of the Investor shares, which has not been adjusted to reflect the lower expenses of the Institutional shares.
46
DOMINI IMPACT BOND FUND
PORTFOLIOOF INVESTMENTS
July 31, 2018
| Principal Amount* | Value | |||||||
| Long Term Investments – 108.6% | ||||||||
| Mortgage Backed Securities – 54.7% | ||||||||
Agency Collateralized Mortgage Obligations – 3.5% | ||||||||
Fannie Mae Connecticut Avenue Securities | ||||||||
5.614%, VR, 7/25/2029 | 120,000 | $ | 131,166 | |||||
6.414%, VR, 5/25/2029 | 235,000 | 263,047 | ||||||
FHMS KBF1 A, 2.480%, VR, 7/25/2024 | 748,000 | 749,670 | ||||||
FHR 3877 LM, 3.500%, 6/15/2026 | 780,000 | 791,463 | ||||||
FNA 2017 M10 AV2, 2.561%, VR, 7/25/2024 | 740,000 | 717,012 | ||||||
FNR 2017 72 CD, 3.000%, 9/25/2047 | 200,766 | 196,618 | ||||||
FNR 2017 72 B, 3.000%, 9/25/2047 | 191,984 | 188,022 | ||||||
FNR 2012 17 BC, 3.500%, 3/25/2027 | 368,000 | 372,933 | ||||||
FREMF Mortgage Trust | 120,000 | 114,551 | ||||||
144A, 3.675%, VR, 11/25/2049 (d) | 250,000 | 243,241 | ||||||
144A, 3.675%, VR, 11/25/2049 (d) | 90,000 | 84,402 | ||||||
144A, 3.726%, VR, 10/25/2049 (d) | 120,000 | 113,907 | ||||||
144A, 3.726%, VR, 10/25/2049 (d) | 40,000 | 37,064 | ||||||
144A, 3.835%, VR, 7/25/2049 (d) | 224,000 | 221,452 | ||||||
144A, 3.844%, VR, 8/25/2027 (d) | 90,000 | 86,449 | ||||||
144A, 3.880%, VR, 2/25/2050 (d) | 100,000 | 97,417 | ||||||
144A, 3.944%, VR, 9/25/2049 (d) | 85,000 | 82,403 | ||||||
144A, 3.981%, VR, 3/25/2027 (d) | 70,000 | 68,425 | ||||||
144A, 4.022%, VR, 11/25/2032 (d) | 67,000 | 54,004 | ||||||
144A, 4.073%, VR, 5/25/2027 (d) | 155,000 | 152,449 | ||||||
144A, 3.753%, VR, 11/25/2050 (d) | 220,000 | 208,790 | ||||||
144A, 3.753%, VR, 11/25/2050 (d) | 65,000 | 60,059 | ||||||
144A, 3.972%, VR, 7/25/2049 (d) | 175,000 | 170,749 | ||||||
144A, 4.034%, VR, 7/25/2027 (d) | 136,000 | 133,339 | ||||||
STACR 2018 HRP1 M2 144A, 3.714%, VR, 4/25/2043 (d) | 125,000 | 125,964 | ||||||
|
| |||||||
| 5,464,596 | ||||||||
|
| |||||||
Commercial Mortgage Backed Securities – 5.2% | ||||||||
BWAY Mortgage Trust 144A, 2.809%, 3/10/2033 (d) | 153,123 | 150,161 | ||||||
Commercial Mortgage Trust | ||||||||
144A, 3.424%, 3/10/2031 (d) | 640,000 | 643,069 | ||||||
144A, 3.726%, 3/10/2031 (d) | 644,000 | 655,424 | ||||||
CSAIL Commercial Mortgage Trust, 3.808%, 11/15/2048 | 388,000 | 391,321 | ||||||
GS Mortgage Securities Trust 144A, | 395,000 | 395,364 | ||||||
Hudson Yards 144A, 2.835%, 8/10/2038 (d) | 1,000,000 | 936,497 | ||||||
JP Morgan Chase Commercial Mortgage Trust 144A, 4.128%, 7/5/2031 (d) | 555,000 | 571,339 | ||||||
Madison Avenue Trust 144A, 3.188%, VR, 8/15/2034 (d) | 729,000 | 711,013 | ||||||
Morgan Stanley BAML Trust | ||||||||
3.526%, 12/15/2047 | 180,167 | 178,768 | ||||||
4.051%, 4/15/2047 | 300,000 | 306,311 | ||||||
4.083%, VR, 7/15/2046 | 150,000 | 153,763 | ||||||
4.259%, VR, 10/15/2046 | 300,000 | 309,483 | ||||||
47
DOMINI IMPACT BOND FUND
PORTFOLIOOF INVESTMENTS (continued)
July 31, 2018
| Principal Amount* | Value | |||||||
Commercial Mortgage Backed Securities (Continued) | ||||||||
Morgan Stanley Capital I Trust 144A, 2.772%, VR, 11/15/2034 (d) | 531,000 | $ | 530,834 | |||||
OBP Depositor LLC Trust 144A, 4.646%, 7/15/2045 (d) | 806,000 | 825,096 | ||||||
One Market Plaza Trust 144A, 3.614%, 2/10/2032 (d) | 710,000 | 707,857 | ||||||
Park Avenue Trust 144A, 3.508%, 6/5/2037 (d) | 712,000 | 695,053 | ||||||
|
| |||||||
| 8,161,353 | ||||||||
|
| |||||||
Federal Home Loan Mortgage Corporation – 8.1% | ||||||||
849167, 2.893%, VR, 10/1/2043 (c) | 282,840 | 281,449 | ||||||
A12413, 5.000%, 8/1/2033 (c) | 23,960 | 25,456 | ||||||
A37619, 4.500%, 9/1/2035 (c) | 179,753 | 187,227 | ||||||
A87874, 4.000%, 8/1/2039 (c) | 71,102 | 72,588 | ||||||
A89148, 4.000%, 10/1/2039 (c) | 108,309 | 110,883 | ||||||
A89384, 4.000%, 10/1/2039 (c) | 136,931 | 140,172 | ||||||
A89729, 4.000%, 11/1/2039 (c) | 61,547 | 63,047 | ||||||
A93101, 5.000%, 7/1/2040 (c) | 99,011 | 105,462 | ||||||
A93996, 4.500%, 9/1/2040 (c) | 49,387 | 51,775 | ||||||
A94362, 4.000%, 10/1/2040 (c) | 160,735 | 164,672 | ||||||
A94742, 4.000%, 11/1/2040 (c) | 26,704 | 27,356 | ||||||
A95084, 4.000%, 11/1/2040 (c) | 23,060 | 23,624 | ||||||
A95085, 4.000%, 11/1/2040 (c) | 207,933 | 213,009 | ||||||
A95796, 4.000%, 12/1/2040 (c) | 98,121 | 100,514 | ||||||
A97047, 4.500%, 2/1/2041 (c) | 101,601 | 106,513 | ||||||
FHR 3806 L, 3.500%, 2/15/2026 | 847,000 | 859,406 | ||||||
FHR 3800 CB, 3.500%, 2/15/2026 | 383,000 | 388,811 | ||||||
FHR 3768 CB, 3.500%, 12/15/2025 | 343,000 | 347,703 | ||||||
G01779, 5.000%, 4/1/2035 (c) | 31,250 | 33,292 | ||||||
G01828, 4.500%, 4/1/2035 (c) | 147,993 | 154,208 | ||||||
G01837, 5.000%, 7/1/2035 (c) | 205,157 | 218,627 | ||||||
G01838, 5.000%, 7/1/2035 (c) | 35,256 | 37,555 | ||||||
G02424, 5.500%, 12/1/2036 (c) | 138,035 | 149,479 | ||||||
G04997, 5.000%, 1/1/2037 (c) | 125,372 | 133,123 | ||||||
G05052, 5.000%, 10/1/2033 (c) | 13,150 | 14,036 | ||||||
G06079, 6.000%, 7/1/2039 (c) | 131,683 | 144,333 | ||||||
G06990, 5.500%, 8/1/2040 (c) | 186,877 | 201,440 | ||||||
G08347, 4.500%, 6/1/2039 (c) | 318,459 | 333,388 | ||||||
G08499, 3.000%, 7/1/2042 | 81,111 | 78,906 | ||||||
G14599, 2.500%, 11/1/2027 (c) | 199,739 | 194,539 | ||||||
G30614, 3.500%, 12/1/2032 (c) | 307,507 | 310,690 | ||||||
J17791, 3.000%, 1/1/2027 (c) | 272,979 | 271,056 | ||||||
J20118, 2.500%, 8/1/2027 (c) | 71,437 | 69,577 | ||||||
Q00291, 5.000%, 4/1/2041 (c) | 85,027 | 90,662 | ||||||
Q01807, 4.500%, 7/1/2036 (c) | 170,569 | 177,762 | ||||||
Q06160, 4.000%, 2/1/2037 (c) | 66,583 | 67,675 | ||||||
Q17103, 4.000%, 6/1/2041 (c) | 13,598 | 13,822 | ||||||
Q33602, 3.000%, 5/1/2045 (c) | 588,123 | 569,991 | ||||||
Z40004, 6.000%, 8/1/2036 (c) | 20,982 | 22,905 | ||||||
FHLMC TBA 30 Yr, 3.500%, 8/13/2048 (b) | 1,500,000 | 1,485,711 | ||||||
48
DOMINI IMPACT BOND FUND
PORTFOLIOOF INVESTMENTS (continued)
July 31, 2018
| Principal Amount* | Value | |||||||
Federal Home Loan Mortgage Corporation (Continued) | ||||||||
FHLMC TBA 30 Yr, 3.500%, 9/13/2048 (b) | 1,500,000 | $ | 1,483,836 | |||||
FHLMC TBA 30 Yr, 4.000%, 8/13/2048 (b) | 3,100,000 | 3,147,533 | ||||||
|
| |||||||
| 12,673,813 | ||||||||
|
| |||||||
Federal National Mortgage Association – 30.4% | ||||||||
190370, 6.000%, 6/1/2036 (c) | 95,208 | 104,217 | ||||||
469683, 3.540%, 11/1/2021 (c) | 710,560 | 719,060 | ||||||
469879, 3.220%, 12/1/2021 (c) | 973,120 | 975,422 | ||||||
471478, 2.610%, 8/1/2022 (c) | 1,333,104 | 1,308,736 | ||||||
745044, 4.500%, 8/1/2035 (c) | 43,058 | 44,926 | ||||||
745327, 6.000%, 3/1/2036 (c) | 269,562 | 294,693 | ||||||
889529, 6.000%, 3/1/2038 (c) | 45,203 | 49,694 | ||||||
890248, 6.000%, 8/1/2037 (c) | 24,929 | 27,272 | ||||||
930672, 4.500%, 3/1/2039 (c) | 157,150 | 164,704 | ||||||
932441, 4.000%, 1/1/2040 (c) | 500,798 | 512,574 | ||||||
995082, 5.500%, 8/1/2037 (c) | 87,361 | 94,600 | ||||||
995243, 4.500%, 8/1/2038 (c) | 114,459 | 119,498 | ||||||
AA9846, 4.000%, 8/1/2039 (c) | 71,026 | 72,697 | ||||||
AB1343, 4.500%, 8/1/2040 (c) | 148,183 | 155,361 | ||||||
AB1763, 4.000%, 11/1/2030 (c) | 29,537 | 30,245 | ||||||
AB4168, 3.500%, 1/1/2032 (c) | 276,796 | 279,770 | ||||||
AB6472, 2.000%, 10/1/2027 (c) | 258,976 | 249,443 | ||||||
AC1877, 4.500%, 9/1/2039 (c) | 66,298 | 69,477 | ||||||
AC2817, 4.000%, 10/1/2039 (c) | 41,148 | 42,116 | ||||||
AC5401, 5.000%, 10/1/2039 (c) | 6,883 | 7,363 | ||||||
AC9564, 4.500%, 2/1/2040 (c) | 63,637 | 66,721 | ||||||
AD1649, 4.000%, 3/1/2040 (c) | 72,835 | 74,564 | ||||||
AD8033, 4.000%, 8/1/2040 (c) | 24,747 | 25,331 | ||||||
AE0215, 4.000%, 12/1/2039 (c) | 62,601 | 64,073 | ||||||
AE0216, 4.000%, 8/1/2040 (c) | 143,288 | 146,688 | ||||||
AE0624, 4.000%, 11/1/2040 (c) | 59,967 | 61,417 | ||||||
AE0625, 4.000%, 12/1/2040 (c) | 85,226 | 87,591 | ||||||
AE4113, 4.000%, 10/1/2040 (c) | 48,044 | 49,181 | ||||||
AE4192, 4.000%, 10/1/2040 (c) | 221,851 | 227,409 | ||||||
AE5143, 4.000%, 11/1/2040 (c) | 36,437 | 37,302 | ||||||
AI7951, 4.500%, 8/1/2036 (c) | 56,298 | 58,709 | ||||||
AJ5974, 4.000%, 12/1/2036 (c) | 47,475 | 48,602 | ||||||
AL0005, 4.500%, 1/1/2041 (c) | 55,817 | 58,523 | ||||||
AL0049, 6.000%, 12/1/2035 (c) | 50,060 | 54,743 | ||||||
AL1627, 4.500%, 9/1/2041 (c) | 109,599 | 114,648 | ||||||
AM3278, 2.850%, 5/1/2023 (c) | 693,932 | 682,334 | ||||||
AM4796, 3.300%, 12/1/2023 (c) | 729,431 | 729,977 | ||||||
AM5146, 3.470%, 1/1/2024 (c) | 549,494 | 554,105 | ||||||
AM5197, 4.200%, 1/1/2030 (c) | 1,158,171 | 1,197,114 | ||||||
AM6266, 3.580%, 7/1/2030 (c) | 956,725 | 943,627 | ||||||
AM7507, 3.080%, 12/1/2024 (c) | 1,031,962 | 1,020,122 | ||||||
AM7598, 3.070%, 12/1/2024 (c) | 1,373,544 | 1,356,965 | ||||||
AM7903, 3.380%, 1/1/2027 (c) | 662,693 | 660,391 | ||||||
49
DOMINI IMPACT BOND FUND
PORTFOLIOOF INVESTMENTS (continued)
July 31, 2018
| Principal Amount* | Value | |||||||
Federal National Mortgage Association (Continued) | ||||||||
AM8148, 2.680%, 3/1/2027 (c) | 994,344 | $ | 942,795 | |||||
AM8659, 2.880%, 4/1/2031 (c) | 1,244,907 | 1,148,716 | ||||||
AM9154, 3.180%, 6/1/2030 (c) | 1,042,588 | 1,016,308 | ||||||
AM9239, 3.030%, 6/1/2025 (c) | 959,817 | 944,422 | ||||||
AN1410, 3.010%, 5/1/2028 | 460,381 | 442,490 | ||||||
AN1767, 2.980%, 6/1/2031 (c) | 964,105 | 909,791 | ||||||
AN1840, 2.450%, 6/1/2026 (c) | 1,471,080 | 1,387,732 | ||||||
AN2787, 2.600%, 9/1/2028 (c) | 1,150,000 | 1,065,730 | ||||||
AN2791, 2.440%, 9/1/2026 (c) | 1,110,343 | 1,045,753 | ||||||
AN4301, 3.150%, 1/1/2027 (c) | 2,109,700 | 2,067,067 | ||||||
AN5557, 2.900%, 5/1/2027 (c) | 1,471,911 | 1,416,729 | ||||||
AN6744, 2.940%, 9/1/2027 (c) | 1,500,000 | 1,439,341 | ||||||
AN7300, 3.290%, 11/1/2027 (c) | 1,225,411 | 1,207,598 | ||||||
AN7540, 2.910%, 11/1/2027 (c) | 1,500,000 | 1,430,597 | ||||||
AP9592, 3.500%, 10/1/2032 (c) | 216,563 | 218,896 | ||||||
AR1524, 2.000%, 1/1/2028 (c) | 206,314 | 197,437 | ||||||
AS3608, 2.500%, 12/1/2043 (c) | 355,098 | 332,800 | ||||||
AS8449, 2.500%, 12/1/2031 | 38,390 | 37,194 | ||||||
AW4685, 2.627%, VR, 5/1/2044 (c) | 131,680 | 131,682 | ||||||
AY3370, 2.500%, 4/1/2045 | 252,775 | 235,878 | ||||||
BC1171, 3.500%, 6/1/2046 (c) | 2,056,119 | 2,043,893 | ||||||
BD1153, 3.000%, 8/1/2046 | 100,090 | 96,647 | ||||||
BD1165, 3.000%, 10/1/2046 | 1,489,578 | 1,438,319 | ||||||
BE1416, 2.500%, 11/1/2031 | 194,034 | 187,990 | ||||||
BE4435, 3.000%, 11/1/2046 | 2,275,621 | 2,197,336 | ||||||
BE8063, 3.000%, 12/1/2046 | 761,218 | 735,058 | ||||||
MA0639, 4.000%, 2/1/2041 (c) | 117,057 | 119,827 | ||||||
MA0919, 3.500%, 12/1/2031 (c) | 15,684 | 15,852 | ||||||
MA0949, 3.500%, 1/1/2032 (c) | 154,273 | 155,930 | ||||||
MA1630, 4.000%, 10/1/2033 (c) | 163,971 | 169,104 | ||||||
MA1931, 2.500%, 6/1/2024 | 462,341 | 458,716 | ||||||
FNMA TBA 30 Yr, 3.500%, 8/13/2048 (b) | 4,421,000 | 4,380,688 | ||||||
FNMA TBA 30 Yr, 3.500%, 9/13/2048 (b) | 4,300,000 | 4,256,734 | ||||||
|
| |||||||
| 47,517,055 | ||||||||
|
| |||||||
Government National Mortgage Association – 7.5% | ||||||||
GNMA II TBA 30 Yr, 3.500%, 8/21/2048 (b) | 5,300,000 | 5,302,691 | ||||||
GNMA II TBA 30 Yr, 3.000%, 8/21/2048 (b) | 3,300,000 | 3,217,371 | ||||||
GNMA II TBA 30 Yr, 4.500%, 8/21/2048 (b) | 900,000 | 934,805 | ||||||
GNMA II TBA 30 Yr, 4.000%, 8/21/2048 (b) | 2,200,000 | 2,249,328 | ||||||
|
| |||||||
| 11,704,195 | ||||||||
|
| |||||||
Total Mortgage Backed Securities | 85,521,012 | |||||||
|
| |||||||
| Corporate Bonds and Notes – 23.6% | ||||||||
Communications – 1.7% | ||||||||
Altice France SA/France senior secured note 144A, 7.375%, 5/1/2026 (d) | 200,000 | 198,500 | ||||||
50
DOMINI IMPACT BOND FUND
PORTFOLIOOF INVESTMENTS (continued)
July 31, 2018
| Principal Amount* | Value | |||||||
Communications (Continued) | ||||||||
AT&T Inc | 350,000 | $ | 351,242 | |||||
3.950%, 1/15/2025 | 445,000 | 438,915 | ||||||
4.750%, 5/15/2046 | 65,000 | 59,819 | ||||||
CBS Corp, 2.900%, 1/15/2027 | 400,000 | 358,010 | ||||||
Charter Communications Operating LLC / Charter Communications Operating Capital senior secured note, 6.484%, 10/23/2045 | 300,000 | 328,400 | ||||||
Cox Communications Inc | 165,000 | 156,667 | ||||||
144A, 3.850%, 2/1/2025 (d) | 10,000 | 9,796 | ||||||
144A, 4.800%, 2/1/2035 (d) | 200,000 | 187,233 | ||||||
Gray Television Inc 144A, 5.875%, 7/15/2026 (d) | 200,000 | 196,000 | ||||||
Verizon Communications Inc, 3.376%, 2/15/2025 | 424,000 | 411,520 | ||||||
|
| |||||||
| 2,696,102 | ||||||||
|
| |||||||
Consumer Discretionary – 2.9% | ||||||||
Alibaba Group Holding Ltd, 2.800%, 6/6/2023 | 200,000 | 193,052 | ||||||
Amazon.com Inc | 200,000 | 199,674 | ||||||
4.800%, 12/5/2034 | 325,000 | 360,624 | ||||||
Aptiv PLC 3.150%, 11/19/2020 | 240,000 | 237,522 | ||||||
AutoNation Inc, 5.500%, 2/1/2020 | 500,000 | 515,740 | ||||||
Delphi Corp 4.150%, 3/15/2024 | 401,000 | 401,522 | ||||||
ERAC USA Finance LLC 144A, 3.850%, 11/15/2024 (d) | 500,000 | 498,044 | ||||||
Home Depot Inc/The, 5.950%, 4/1/2041 | 420,000 | 530,285 | ||||||
Lennar Corp, 4.125%, 1/15/2022 | 245,000 | 243,775 | ||||||
Marriott International Inc/MD, 2.875%, 3/1/2021 | 500,000 | 492,637 | ||||||
Northeastern University, 5.285%, 3/1/2032 | 100,000 | 109,973 | ||||||
O’Reilly Automotive Inc, 3.800%, 9/1/2022 | 155,000 | 156,409 | ||||||
Toll Brothers Finance Corp, 4.350%, 2/15/2028 | 600,000 | 540,750 | ||||||
|
| |||||||
| 4,480,007 | ||||||||
|
| |||||||
Consumer Staples – 0.6% | ||||||||
JM Smucker Co/The, 4.250%, 3/15/2035 | 380,000 | 358,452 | ||||||
TreeHouse Foods Inc 144A, 6.000%, 2/15/2024 (d) | 530,000 | 531,988 | ||||||
|
| |||||||
| 890,440 | ||||||||
|
| |||||||
Financials – 9.3% | ||||||||
AerCap Ireland Capital DAC / AerCap Global Aviation Trust, 3.500%, 5/26/2022 | 450,000 | 441,773 | ||||||
AIA Group Ltd 144A, 4.500%, 3/16/2046 (d) | 325,000 | 338,408 | ||||||
Air Lease Corp, 3.875%, 4/1/2021 | 450,000 | 452,011 | ||||||
American Tower Corp, 5.000%, 2/15/2024 | 362,000 | 378,169 | ||||||
Aon PLC, 4.750%, 5/15/2045 | 225,000 | 227,986 | ||||||
AXA SA subordinated note, 8.600%, 12/15/2030 | 400,000 | 509,200 | ||||||
Boston Properties LP, 3.650%, 2/1/2026 | 430,000 | 418,045 | ||||||
51
DOMINI IMPACT BOND FUND
PORTFOLIOOF INVESTMENTS (continued)
July 31, 2018
| Principal Amount* | Value | |||||||
Financials (Continued) | ||||||||
BPCE SA | 500,000 | $ | 492,639 | |||||
144A 4.875%, 4/1/2026 (d) | 500,000 | 503,245 | ||||||
Brandywine Operating Partnership LP, 4.550%, 10/1/2029 | 725,000 | 710,782 | ||||||
Capital One Financial Corp subordinated note 3.750%, 7/28/2026 | 80,000 | 75,341 | ||||||
4.200%, 10/29/2025 | 155,000 | 152,141 | ||||||
Cooperatieve Rabobank UA, 3.950%, 11/9/2022 | 375,000 | 375,483 | ||||||
Credit Agricole SA/London 144A, 4.125%, 1/10/2027 (d) | 510,000 | 498,323 | ||||||
Crown Castle International Corp, 3.700%, 6/15/2026 | 300,000 | 284,340 | ||||||
Discover Financial Services, 3.750%, 3/4/2025 | 325,000 | 311,616 | ||||||
Duke Realty LP | 200,000 | 198,165 | ||||||
4.375%, 6/15/2022 | 250,000 | 256,615 | ||||||
Fifth Third Bancorp subordinated note, 8.250%, 3/1/2038 | 425,000 | 586,130 | ||||||
Huntington Bancshares Inc/OH, 3.150%, 3/14/2021 | 425,000 | 421,754 | ||||||
ING Bank NV 144A, 2.000%, 11/26/2018 (d) | 300,000 | 299,568 | ||||||
Kimco Realty Corp, 3.400%, 11/1/2022 | 160,000 | 157,449 | ||||||
Liberty Property LP, 3.250%, 10/1/2026 | 165,000 | 153,306 | ||||||
Marsh & McLennan Cos Inc, 3.300%, 3/14/2023 | 100,000 | 98,531 | ||||||
Morgan Stanley subordinated note, 3.950%, 4/23/2027 | 210,000 | 202,614 | ||||||
National City Corp subordinated note, 6.875%, 5/15/2019 | 275,000 | 283,728 | ||||||
Nuveen Finance LLC 144A, 4.125%, 11/1/2024 (d) | 160,000 | 158,174 | ||||||
Regency Centers LP, 3.750%, 6/15/2024 | 300,000 | 294,544 | ||||||
Regions Financial Corp, 3.200%, 2/8/2021 | 500,000 | 497,530 | ||||||
Reinsurance Group of America Inc | ||||||||
3.950%, 9/15/2026 | 250,000 | 243,736 | ||||||
4.700%, 9/15/2023 | 164,000 | 168,984 | ||||||
Santander UK PLC subordinated note 144A, 5.000%, 11/7/2023 (d) | 650,000 | 660,911 | ||||||
Standard Chartered PLC subordinated note 144A, 5.700%, 3/26/2044 (d) | 250,000 | 264,780 | ||||||
Swedbank AB | ||||||||
144A, 2.200%, 3/4/2020 (d) | 650,000 | 640,128 | ||||||
144A, 2.800%, 3/14/2022 (d) | 250,000 | 244,221 | ||||||
Toronto-Dominion Bank/The, 1.850%, 9/11/2020 | 500,000 | 487,751 | ||||||
Total System Services Inc, 4.000%, 6/1/2023 | 375,000 | 376,195 | ||||||
Turkiye Sinai Kalkinma B 144A, 5.500%, 1/16/2023 (d) | 200,000 | 171,575 | ||||||
Unum Group, 3.000%, 5/15/2021 | 180,000 | 176,729 | ||||||
US Bancorp subordinated note, 3.600%, 9/11/2024 | 493,000 | 489,484 | ||||||
Ventas Realty LP, 3.500%, 2/1/2025 | 500,000 | 479,765 | ||||||
Welltower Inc, 5.250%, 1/15/2022 | 400,000 | 417,624 | ||||||
|
| |||||||
| 14,599,493 | ||||||||
|
| |||||||
Health Care – 4.4% | ||||||||
Allergan Funding SCS, 3.000%, 3/12/2020 | 420,000 | 418,440 | ||||||
Allina Health System, 4.805%, 11/15/2045 | 660,000 | 722,955 | ||||||
Biogen Inc, 5.200%, 9/15/2045 | 400,000 | 430,740 | ||||||
Boston Medical Center Corp, 4.519%, 7/1/2026 | 705,000 | 714,169 | ||||||
52
DOMINI IMPACT BOND FUND
PORTFOLIOOF INVESTMENTS (continued)
July 31, 2018
| Principal Amount* | Value | |||||||
Health Care (Continued) | ||||||||
Celgene Corp, 3.875%, 8/15/2025 | 325,000 | $ | 321,379 | |||||
Children’s Hospital Corp/The, 4.115%, 1/1/2047 | 230,000 | 230,344 | ||||||
City of Hope senior secured note, 5.623%, 11/15/2043 | 250,000 | 298,870 | ||||||
Dignity Health | ||||||||
4.500%, 11/1/2042 | 408,000 | 388,785 | ||||||
5.267%, 11/1/2064 | 500,000 | 501,856 | ||||||
Kaiser Foundation Hospitals, 3.150%, 5/1/2027 | 185,000 | 177,334 | ||||||
Mayo Clinic, 4.128%, 11/15/2052 | 165,000 | 168,490 | ||||||
McLaren Health Care Corp, 4.386%, 5/15/2048 | 590,000 | 585,122 | ||||||
Memorial Sloan-Kettering Cancer Center | ||||||||
4.125%, 7/1/2052 | 200,000 | 199,018 | ||||||
4.200%, 7/1/2055 | 60,000 | 61,043 | ||||||
New York and Presbyterian Hospital/The | ||||||||
4.024%, 8/1/2045 | 365,000 | 359,924 | ||||||
4.063%, 8/1/2056 | 250,000 | 243,613 | ||||||
Ochsner Clinic Foundation, 5.897%, 5/15/2045 | 400,000 | 484,965 | ||||||
Orlando Health Obligated Group, 4.416%, 10/1/2044 | 395,000 | 394,028 | ||||||
Thermo Fisher Scientific Inc, 4.150%, 2/1/2024 | 265,000 | 270,526 | ||||||
|
| |||||||
| 6,971,601 | ||||||||
|
| |||||||
Industrials – 2.0% | ||||||||
Canadian Pacific Railway Co, 4.500%, 1/15/2022 | 400,000 | 412,597 | ||||||
CNH Industrial Capital LLC, 4.875%, 4/1/2021 | 750,000 | 770,108 | ||||||
Core & Main LP 144A, 6.125%, 8/15/2025 (d) | 45,000 | 43,425 | ||||||
Illinois Tool Works Inc, 4.875%, 9/15/2041 | 175,000 | 194,121 | ||||||
Mexico City Airport Trust senior secured note 144A, 3.875%, 4/30/2028 (d) | 255,000 | 234,345 | ||||||
Ryder System Inc | ||||||||
2.350%, 2/26/2019 | 500,000 | 498,556 | ||||||
2.500%, 5/11/2020 | 145,000 | 143,012 | ||||||
SBA Tower Trust 144A, 3.168%, 4/9/2047 (d) | 290,000 | 285,323 | ||||||
United Rentals North America Inc, 4.625%, 7/15/2023 | 500,000 | 503,125 | ||||||
|
| |||||||
| 3,084,612 | ||||||||
|
| |||||||
Materials – 0.4% | ||||||||
Ardagh Packaging Finance PLC / Ardagh Holdings USA Inc senior secured note 144A, 4.250%, 9/15/2022 (d) | 260,000 | 256,100 | ||||||
WestRock Co 144A, 3.000%, 9/15/2024 (d) | 375,000 | 354,902 | ||||||
|
| |||||||
| 611,002 | ||||||||
|
| |||||||
Technology – 1.1% | ||||||||
Broadcom Corp / Broadcom Cayman Finance Ltd, 3.625%, 1/15/2024 | 355,000 | 343,875 | ||||||
Microchip Technology Inc senior secured note 144A, 4.333%, 6/1/2023 (d) | 235,000 | 235,174 | ||||||
Microsoft Corp, 3.700%, 8/8/2046 | 395,000 | 384,612 | ||||||
Pitney Bowes Inc, 3.625%, 9/15/2020 | 265,000 | 264,006 | ||||||
Xerox Corp, 5.625%, 12/15/2019 | 475,000 | 487,741 | ||||||
|
| |||||||
| 1,715,408 | ||||||||
|
| |||||||
53
DOMINI IMPACT BOND FUND
PORTFOLIOOF INVESTMENTS (continued)
July 31, 2018
| Principal Amount* | Value | |||||||
Utilities – 1.2% | ||||||||
Aegea Finance Sarl 144A, 5.750%, 10/10/2024 (d) | 370,000 | $ | 357,050 | |||||
Consolidated Edison Co of New York Inc, | 500,000 | 492,343 | ||||||
Greenko Dutch BV senior secured note 144A, 5.250%, 7/24/2024 (d) | 545,000 | 520,475 | ||||||
Public Service Co of Colorado, 4.100%, 6/15/2048 | 500,000 | 504,635 | ||||||
|
| |||||||
| 1,874,503 | ||||||||
|
| |||||||
Total Corporate Bonds and Notes | 36,923,168 | |||||||
|
| |||||||
| Municipal Bonds – 11.8% | ||||||||
American Municipal Power Inc, 6.270%, 2/15/2050 | 490,000 | 614,548 | ||||||
Bay Area Toll Authority | ||||||||
6.918%, 4/1/2040 | 125,000 | 169,288 | ||||||
7.043%, 4/1/2050 | 325,000 | 474,962 | ||||||
Cincinnati City School District, 3.375%, 6/1/2026 | 500,000 | 500,340 | ||||||
City of Chicago, IL | ||||||||
6.207%, 1/1/2032 | 250,000 | 255,783 | ||||||
7.045%, 1/1/2029 | 55,000 | 58,973 | ||||||
7.375%, 1/1/2033 | 250,000 | 282,273 | ||||||
City of Los Angeles Department of Airports, 3.887%, 5/15/2038 | 140,000 | 140,431 | ||||||
Commonwealth Financing Authority, 3.781%, 6/1/2031 | 500,000 | 490,885 | ||||||
Commonwealth of Massachusetts, 3.277%, 6/1/2046 | 130,000 | 118,141 | ||||||
Cook County Community High School District No 228 Bremen, 5.019%, 12/1/2041 (Insurer: AGM) | 435,000 | 478,957 | ||||||
County of Sacramento CA, 5.730%, VR, 8/15/2023 (Insurer: NATL) | 340,000 | 362,035 | ||||||
County of San Bernardino CA, 6.020%, 8/1/2023 | 315,000 | 328,882 | ||||||
District of Columbia, 4.125%, 7/1/2027 | 500,000 | 507,870 | ||||||
Hillsborough County Aviation Authority, | 190,000 | 191,296 | ||||||
Indiana Finance Authority, 3.624%, 7/1/2036 | 235,000 | 228,389 | ||||||
Inland Valley Development Agency, 5.500%, 3/1/2033 (Insurer: AGM) | 70,000 | 76,659 | ||||||
Lancaster County Hospital Authority/PA | ||||||||
5.000%, 7/1/2024 | 165,000 | 181,911 | ||||||
5.000%, 7/1/2025 | 135,000 | 149,873 | ||||||
Los Angeles County Public Works Financing Authority, 7.488%, 8/1/2033 | 540,000 | 710,246 | ||||||
Maryland Health & Higher Educational Facilities Authority 3.968%, 7/1/2027 | 205,000 | 205,191 | ||||||
4.068%, 7/1/2028 | 240,000 | 239,957 | ||||||
Maryland Health & Higher Educational Facilities Authority, 4.168%, 7/1/2029 | 40,000 | 39,562 | ||||||
Massachusetts Development Finance Agency, 4.000%, 10/1/2027 | 100,000 | 102,859 | ||||||
54
DOMINI IMPACT BOND FUND
PORTFOLIOOF INVESTMENTS (continued)
July 31, 2018
| Principal Amount* | Value | |||||||
| Municipal Bonds (Continued) | ||||||||
Massachusetts Educational Financing Authority, 3.911%, 7/1/2025 | 315,000 | $ | 319,753 | |||||
Massachusetts Health & Educational Facilities Authority, 6.432%, 10/1/2035 | 420,000 | 494,088 | ||||||
Metropolitan Government Nashville & Davidson County Health & Educational Facs Bd, 4.053%, 7/1/2026 | 270,000 | 275,492 | ||||||
Metropolitan Transportation Authority, | 1,275,000 | 1,457,911 | ||||||
Michigan Finance Authority | ||||||||
2.267%, 4/1/2019 | 260,000 | 257,395 | ||||||
2.491%, 4/1/2020 | 250,000 | 243,235 | ||||||
Michigan Finance Authority, 2.741%, 4/1/2021 | 320,000 | 306,534 | ||||||
New Jersey Economic Development Authority, 3.882%, 6/15/2019 | 270,000 | 271,804 | ||||||
New Jersey Turnpike Authority, 7.102%, 1/1/2041 | 225,000 | 315,873 | ||||||
New Jersey Turnpike Authority, 7.414%, 1/1/2040 | 200,000 | 289,058 | ||||||
New York Transportation Development Corp, 3.473%, 7/1/2028 | 500,000 | 472,470 | ||||||
Oklahoma Development Finance Authority | ||||||||
4.650%, 8/15/2030 (Insurer: AGM) | 130,000 | 136,366 | ||||||
5.450%, 8/15/2028 | 1,120,000 | 1,173,972 | ||||||
Oregon Health & Science University, 5.000%, 7/1/2045 | 350,000 | 387,195 | ||||||
Pennsylvania Industrial Development Authority 144A, 3.556%, 7/1/2024 (d) | 505,000 | 488,885 | ||||||
Public Finance Authority | ||||||||
144A 3.000%, 11/15/2022 (d) | 360,000 | 360,641 | ||||||
144A 3.500%, 11/15/2023 (d) | 185,000 | 186,426 | ||||||
Puerto Rico Commonwealth Government Employees Retirement System, 6.150%, 7/1/2038 | 825,000 | 360,938 | ||||||
Shelby County Health Educational & Housing Facilities Board 4.000%, 9/1/2021 (e) | 250,000 | 247,495 | ||||||
4.000%, 9/1/2022 (e) | 250,000 | 245,470 | ||||||
State of California, 7.625%, 3/1/2040 | 525,000 | 774,989 | ||||||
State of Illinois | ||||||||
3.860%, 4/1/2021 | 215,000 | 212,730 | ||||||
5.100%, 6/1/2033 | 335,000 | 325,727 | ||||||
5.547%, 4/1/2019 | 325,000 | 329,150 | ||||||
5.877%, 3/1/2019 | 540,000 | 548,321 | ||||||
State of Oregon, 3.724%, 5/1/2029 | 420,000 | 424,112 | ||||||
Washington State Housing Finance Commission, 4.000%, 1/1/2024 | 700,000 | 695,905 | ||||||
|
| |||||||
Total Municipal Bonds | 18,511,246 | |||||||
|
| |||||||
| U.S. Government Agencies – 9.8% | ||||||||
Federal Farm Credit Banks, 3.660%, 3/7/2044 | 974,000 | 984,345 | ||||||
Fannie Mae, 1.500%, 6/22/2020 (c) | 5,328,000 | 5,213,469 | ||||||
Fannie Mae, 5.625%, 7/15/2037 (c) | 5,086,000 | 6,683,655 | ||||||
55
DOMINI IMPACT BOND FUND
PORTFOLIOOF INVESTMENTS (continued)
July 31, 2018
| Principal Amount* | Value | |||||||
| U.S. Government Agencies (Continued) | ||||||||
Federal Farm Credit Bank, 2.780%, 11/2/2037 | 2,730,000 | $ | 2,436,427 | |||||
|
| |||||||
Total U.S. Government Agencies | 15,317,896 | |||||||
|
| |||||||
| Senior Floating Rate Interests – 6.0% | ||||||||
Communications – 1.5% | ||||||||
Charter Communications Operating LLC term loan B, 4.080%, 4/30/2025 | 294,023 | 294,540 | ||||||
Mission Broadcasting Inc term loan B, | 25,233 | 25,296 | ||||||
Nexstar Broadcasting Inc term loan B, | 189,276 | 189,749 | ||||||
Numericable Group SA term loan B, 5.072%, 1/31/2026 | 735,098 | 720,856 | ||||||
Shutterfly Inc term loan B, 4.830%, 8/17/2024 | 135,000 | 135,776 | ||||||
Sprint Communications Inc term loan B, | 404,875 | 405,432 | ||||||
Univision Communications Inc, 4.827%, 3/15/2024 | 481,643 | 468,360 | ||||||
Zayo Group LLC, 4.327%, 1/19/2024 | 100,095 | 100,577 | ||||||
|
| |||||||
| 2,340,586 | ||||||||
|
| |||||||
Consumer Discretionary – 1.2% | ||||||||
American Builders & Contractors Supply Co Inc term loan B, 4.349%, 10/31/2023 | 888,750 | 886,073 | ||||||
ASGN Inc term loan B, 4.077%, 6/5/2022 | 255,927 | 256,447 | ||||||
Crown Finance US Inc term loan, 4.577%, 2/28/2025 | 189,525 | 189,183 | ||||||
Crown Holdings Inc. term loan B, 4.077%, 4/3/2025 | 100,000 | 100,438 | ||||||
Harbor Freight Tools USA Inc, 4.577%, 8/19/2023 | 236,500 | 235,964 | ||||||
KAR Auction Services Inc term loan B, 4.625%, 3/9/2023 | 115,370 | 115,803 | ||||||
Wyndham Hotels & Resorts Inc term loan B, 3.827%, 5/30/2025 | 130,000 | 130,453 | ||||||
|
| |||||||
| 1,914,361 | ||||||||
|
| |||||||
Consumer Staples – 0.5% | ||||||||
CHG PPC Parent LLC term loan B, 4.827%, 3/31/2025 | 100,000 | 100,063 | ||||||
Coty Inc term loan B, 4.347%, 4/7/2025 | 610,400 | 598,192 | ||||||
Diamond BC BV term loan, 5.077%, 9/6/2024 | 149,250 | 147,073 | ||||||
|
| |||||||
| 845,328 | ||||||||
|
| |||||||
Financials – 1.0% | ||||||||
Blackhawk Network Holdings Inc term loan B, 5.072%, 6/15/2025 | 180,000 | 180,630 | ||||||
DTZ US Borrower LLC term loan, 5.558%, 11/4/2021 | 485,000 | 485,404 | ||||||
Iron Mountain Inc term loan B, 3.827%, 1/2/2026 | 144,638 | 143,191 | ||||||
Nets Holding A/S term loan B, 3.250%, 2/6/2025 | 176,389 | EUR | 204,693 | |||||
Russell Investments US Institutional Holdco Inc term loan, 5.327%, 6/1/2023 | 441,000 | 443,150 | ||||||
USI Inc/NY term loan B, 5.334%, 5/16/2024 | 173,688 | 173,511 | ||||||
|
| |||||||
| 1,630,579 | ||||||||
|
| |||||||
56
DOMINI IMPACT BOND FUND
PORTFOLIOOF INVESTMENTS (continued)
July 31, 2018
| Principal Amount* | Value | |||||||
Industrials – 0.2% | ||||||||
Blitz F18 675 Gmbh term loan B, | 255,000 | EUR | $ | 297,897 | ||||
|
| |||||||
| 297,897 | ||||||||
|
| |||||||
Materials – 0.2% | ||||||||
Nexeo Solutions LLC term loan B, 5.592%, 6/9/2023 | 279,337 | 281,345 | ||||||
|
| |||||||
| 281,345 | ||||||||
|
| |||||||
Technology – 1.4% | ||||||||
Almonde Inc term loan B, 5.807%, 6/13/2024 | 272,937 | 269,483 | ||||||
CDW LLC term loan, 3.830%, 8/17/2023 | 482,521 | 483,328 | ||||||
Dell International LLC, 4.080%, 9/7/2023 | 252,579 | 252,917 | ||||||
Go Daddy Operating Co LLC term loan B, 4.327%, 2/15/2024 | 252,176 | 252,964 | ||||||
MA FinanceCo LLC term loan B, 4.577%, 6/21/2024 | 30,158 | 30,064 | ||||||
MaxLinear Inc term loan B, 4.572%, 5/12/2024 | 231,247 | 231,536 | ||||||
ON Semiconductor Corp term loan B, 3.827%, 3/31/2023 | 169,394 | 169,794 | ||||||
Seattle SpinCo Inc term loan B, 4.577%, 6/21/2024 | 203,667 | 203,030 | ||||||
SS&C European Holdings SARL term loan B, 4.577%, 4/16/2025 | 62,369 | 62,670 | ||||||
SS&C Technologies Inc term loan B, 4.577%, 4/16/2025 | 162,598 | 163,383 | ||||||
|
| |||||||
| 2,119,169 | ||||||||
|
| |||||||
Total Senior Floating Rate Interests | 9,429,265 | |||||||
|
| |||||||
| Foreign Government & Agency Securities – 1.6% | ||||||||
City of Toronto Canada, 3.200%, 8/1/2048 | 1,050,000 | CAD | 783,008 | |||||
Province of Ontario Canada, 1.950%, 1/27/2023 | 1,000,000 | CAD | 748,072 | |||||
Province of Quebec Canada, 1.650%, 3/3/2022 | 815,000 | CAD | 609,948 | |||||
Queensland Treasury Corporation 144A, 3.000%, 3/22/2024 | 500,000 | AUD | 378,496 | |||||
|
| |||||||
Total Foreign Government & Agency Securities | 2,519,524 | |||||||
|
| |||||||
| Asset Backed Securities – 0.8% | ||||||||
Carmax Auto Owner Trust | ||||||||
1.900%, 4/15/2022 | 95,000 | 92,095 | ||||||
2.160%, 12/15/2021 | 135,000 | 132,485 | ||||||
2.200%, 6/15/2022 | 75,000 | 73,206 | ||||||
2.560%, 2/15/2022 | 260,000 | 255,867 | ||||||
2.700%, 10/16/2023 | 250,000 | 244,733 | ||||||
CNH Equipment Trust 2016-C, 1.930%, 3/15/2024 | 20,000 | 19,488 | ||||||
SBA Tower Trust 144A, 3.869%, VR, 10/15/2049 (d) | 500,000 | 503,064 | ||||||
|
| |||||||
Total Asset Backed Securities | 1,320,938 | |||||||
|
| |||||||
57
DOMINI IMPACT BOND FUND
PORTFOLIOOF INVESTMENTS (continued)
July 31, 2018
| Principal Amount* | Value | |||||||
| Certificates of Deposit – 0.3% | ||||||||
Self-Help Credit Union, 1.150%, 9/16/2019 | 250,000 | $ | 246,454 | |||||
Self-Help Federal Credit Union, 1.150%, 3/18/2019 | 250,000 | 248,487 | ||||||
|
| |||||||
Total Certificates of Deposit | 494,941 | |||||||
|
| |||||||
Total Long Term Investments | 170,037,990 | |||||||
|
| |||||||
| Short Term Investments – 7.2% | ||||||||
U.S. Government Agency Obligations – 4.0% | ||||||||
Federal Home Loan Discount Notes, | 3,545,000 | 3,538,416 | ||||||
Federal Home Loan Discount Notes, | 2,750,000 | 2,741,830 | ||||||
|
| |||||||
Total U.S. Government Agency Obligations | 6,280,246 | |||||||
|
| |||||||
| Foreign Government & Agency Securities – 3.2% | ||||||||
Japan Treasury Discount Bill, 0.000%, 10/9/2018 | 550,000,000 | JPY | 4,914,545 | |||||
|
| |||||||
Total Foreign Government & Agency Securities | 4,914,545 | |||||||
|
| |||||||
Total Short Term Investments | 11,194,791 | |||||||
|
| |||||||
58
DOMINI IMPACT BOND FUND
PORTFOLIOOF INVESTMENTS (continued)
July 31, 2018
| Notional Amount | Value | |||||||
| Options Purchased – 0.1% | ||||||||
Deutsche Bank: | ||||||||
Pay fixed 3.200%, receive float 3-month USD LIBOR BBA Expires 5/30/2019 (e) | 4,190,000 | $ | 63,366 | |||||
Pay fixed 3.200%, receive float 3-month USD LIBOR BBA Expires 5/30/2019 (e) | 4,080,000 | 61,703 | ||||||
|
| |||||||
Total Options Purchased | 125,069 | |||||||
|
| |||||||
| Total Investments – 115.9% (Cost $184,778,454) (b) | 181,357,850 | |||||||
| Other Liabilities, less assets – (15.9)% | (24,844,990) | |||||||
|
| |||||||
| Net Assets – 100.0% | $156,512,860 | |||||||
|
| |||||||
* The principal amount is stated in U.S. dollars unless otherwise indicated.
(a) The aggregate cost for book and federal income purposes is $184,947,063. The aggregate gross unrealized appreciation is $723,984, and the aggregate gross unrealized depreciation is $4,313,197, resulting in net unrealized depreciation of $3,589,213.
(b) A portion or all of the security was purchased as a when issued or delayed delivery security.
(c) A portion or all of the security was segregated for collateral for when issued or delayed delivery securities.
(d) This security has been determined to be liquid under guidelines established by the Fund’s Board of Trustees.
(e) This security has been determined to be illiquid under guidelines established by the Fund’s Board of Trustees.
(f) Represents an unsettled loan contract. The coupon rate will be determined at time of settlement.
TBA — To Be Announced
VR — Variable interest rate. Rate shown is that on July 31, 2018.
144A — Security that may be sold to qualified institutional buyers under Rule 144A of the Securities Act of 1933, as amended. At July 31, 2018, the aggregate value of these securities was $18,638,239, representing 11.9% of net assets.
AGM — Assured Guaranty Municipal Corporation
NATL — National Public Finance Guarantee Corporation
AUD — Australian Dollar
CAD — Canadian Dollar
EUR — Euro
JPY — Japanese Yen
SEE NOTES TO FINANCIAL STATEMENTS
59
DOMINI IMPACT BOND FUND
PORTFOLIOOF INVESTMENTS (continued)
July 31, 2018
At July 31, 2018, the Fund had the following forward currency contracts outstanding.
| Counterparty | Currency | Contract Type | Settlement Date | Value | Unrealized Appreciation (Depreciation) | |||||||||||||
BNP Parabas SA | AUD | Sell | 9/19/2018 | $ | 371,022 | $ | 7,975 | |||||||||||
Goldman Sachs International | CAD | Sell | 9/19/2018 | 1,389,789 | 1,196 | |||||||||||||
Royal Bank of Canada | CAD | Sell | 9/19/2018 | 804,817 | (13,483 | ) | ||||||||||||
Australia and New Zealand Bank | JPY | Sell | 10/9/2018 | 4,936,120 | (34,181 | ) | ||||||||||||
|
|
|
| |||||||||||||||
| $ | 7,501,748 | $ | (38,493 | ) | ||||||||||||||
|
|
|
| |||||||||||||||
At July 31, 2018, the Fund had the following future contracts outstanding.
| Description | Number of Contracts | Value | Expiration Date | Unrealized Appreciation (Depreciation) | ||||||||||
Long Gilt 10 YR (Short) | 12 | $ | (1,472,160 | ) | 9/26/2018 | $ | 784 | |||||||
CAN 10 YR (Long) | 9 | 1,212,930 | 9/19/2018 | (8,317 | ) | |||||||||
|
| |||||||||||||
| $ | (7,533 | ) | ||||||||||||
|
| |||||||||||||
At July 31, 2018, the Fund had the following centrally cleared interest rate swap contracts outstanding.
| Description | Counterparty/ Exchange | Expiration Date | Notional Amount | Value | Unrealized Appreciation (Depreciation) | |||||||||||||
Pay Floating rate 3 month USD BBA LIBOR Pay Fixed rate 2.250% | Morgan Stanley/LCH | 9/21/2026 | $ | 10,432,000 | $ | 9,857,443 | $ | 752,692 | ||||||||||
Pay Floating rate 3 month USD BBA LIBOR Pay Fixed rate 2.500% | Morgan Stanley/LCH | 12/20/2027 | 6,965,000 | 6,665,027 | 403,704 | |||||||||||||
Receive Floating rate 3 month USD BBA LIBOR Pay Fixed rate 2.000% | Morgan Stanley/LCH | 12/20/2019 | 7,395,000 | 7,316,290 | (78,238 | ) | ||||||||||||
Receive Floating rate 3 month USD BBA LIBOR Pay Fixed rate 2.250% | Morgan Stanley/LCH | 12/20/2020 | 10,505,000 | 10,343,807 | (133,849 | ) | ||||||||||||
Pay Floating rate 3 month USD BBA LIBOR Pay Fixed rate 2.500% | Morgan Stanley/LCH | 3/21/2048 | 1,219,000 | 1,084,697 | 1,904 | |||||||||||||
Receive Floating rate 3 month USD BBA LIBOR Pay Fixed rate 2.755% | Morgan Stanley/LCH | 9/19/2020 | 8,275,000 | 8,246,588 | (321 | ) | ||||||||||||
|
|
|
|
|
| |||||||||||||
| $ | 44,791,000 | $ | 43,513,852 | $ | 945,892 | |||||||||||||
|
|
|
|
|
| |||||||||||||
60
DOMINI IMPACT BOND FUND
PORTFOLIOOF INVESTMENTS (continued)
July 31, 2018
At July 31, 2018, the Fund had the following OTC interest rate swap contracts outstanding.
| Rate Type | ||||||||||||||||||||||
| Counterparty | Payments made by the Fund | Payments received by the Fund | Expiration Date | Notional Amount | Value | Unrealized Appreciation (Depreciation) | ||||||||||||||||
Deutsche Bank AG | 1.898% | USA-CPI-U | 7/15/2024 | $ | 3,758,000 | $ | 3,916,224 | $ | 158,224 | |||||||||||||
Deutsche Bank AG | 2.004% | USA-CPI-U | 1/15/2023 | 3,296,000 | 3,346,708 | 49,907 | ||||||||||||||||
|
|
|
|
|
| |||||||||||||||||
| $ | 7,054,000 | $ | 7,262,932 | $ | 208,131 | |||||||||||||||||
|
|
|
|
|
| |||||||||||||||||
At July 31, 2018, the Fund had the following centrally cleared credit default swap contracts outstanding.
| Description | Counterparty/ Exchange | Expiration Date | Notional Amount(h) | Value(i) | Unrealized Appreciation (Depreciation) | |||||||||||||
Sell Protection (g): | ||||||||||||||||||
CDX-NAHY Series 30, Version 1, 5 Year Index, fixed rate 5.00% (k) | Morgan Stanley/ICE | 6/20/2023 | $ | 983,000 | $ | 1,051,936 | $ | 7,101 | ||||||||||
Buy Protection (g): | ||||||||||||||||||
CDX-NAIG Series 30, Version 1, 5 Year Index, fixed rate 1.00% (j) | Morgan Stanley/ICE | 6/20/2023 | 845,000 | 860,874 | (1,005 | ) | ||||||||||||
iTraxx Europe Series 29 Crossover, Version 1, 5 Year Index (EUR), fixed rate 5.00% (k) | Morgan Stanley/ICE | 6/20/2023 | 665,000 | 852,802 | (6,283 | ) | ||||||||||||
iTraxx Europe Series 29, Version 1, 5 Year Index (EUR), fixed rate 1.00% (j) | Morgan Stanley/ICE | 6/20/2023 | 1,120,000 | 1,335,290 | (5,660 | ) | ||||||||||||
|
|
|
|
|
| |||||||||||||
| $ | 3,613,000 | $ | 4,100,902 | $ | (5,847 | ) | ||||||||||||
|
|
|
|
|
| |||||||||||||
ICE — Intercontinental Exchange
LCH — London Clearing House
(g) If the Fund is a seller of protection and a credit event occurs, as defined under the terms of that particular swap agreement, the Fund will either (i) pay to the buyer of protection an amount equal to the notional amount of the swap and take delivery of the referenced obligation or underlying securities comprising the referenced index or (ii) pay a net settlement amount in the form of cash or securities equal to the notional amount of the swap less the recovery value of the referenced obligation of underlying securities comprising the referenced index.
(h) The maximum potential amount the Fund could be required to pay as a seller of credit protection or receive as a buyer of credit protection if a credit event occurs as defined under the terms of that particular swap agreement.
(i) The prices and resulting values for credit default swap agreements on credit indices serve as an indicator of the current status of the payment/performance risk and represent the likelihood of an expected liability (or profit) for the credit derivative should the notional amount of the swap agreement be closed/sold as of the period end. Increasing market values, in absolute terms when compared to the notional amount of the swap, represent a deterioration of the referenced entity’s credit soundness and a greater likelihood or risk of default or other credit event occurring as defined under the terms of the agreement.
(j) Ratings of Moody’s/S&P — Baa1/BBB+
(k) Ratings of Moody’s/S&P — B1/B+
61
DOMINI FUNDS EXPENSE EXAMPLE (Unaudited)
As a shareholder of the Domini Funds, you incur two types of costs:
(1) Transaction costs such as redemption fees deducted from any redemption or exchange proceeds if you sell or exchange shares of the fund after holding them less than 30 days and sales charges (loads) on Class A shares and
(2) Ongoing costs, including management fees, distribution (12b-1) fees, and other Fund expenses.
This example is intended to help you understand your ongoing costs (in dollars) of investing in the Fund and to compare these costs with the ongoing costs of investing in other mutual funds. The example is based on an investment of $1,000 invested on February 1, 2018 and held through July 31, 2018.
Certain Account Fees
Some accounts are subject to recurring annual service fees and maintenance fees that are not included in the expenses shown in the table. If your account was subject to these fees, then the actual account values at the end of the period would be lower and the actual expense would be higher. You may avoid the annual service fee by choosing paperless electronic delivery of statements, prospectuses, shareholder reports and other materials.
Actual Expenses
The line of the table captioned ‘‘Actual Expenses’’ below provides information about actual account value and actual expenses. You may use the information in this line, together with the amount invested, to estimate the expenses that you paid over the period as follows:
(1) Divide your account value by $1,000.
(2) Multiply your result in step 1 by the number in the first line under the heading ‘‘Expenses Paid During Period’’ in the table.
The result equals the estimated expenses you paid on your account during the period.
Hypothetical Expenses
The second line of the table below provides information about hypothetical account values and hypothetical expenses based on the Fund’s actual expense ratio and an assumed rate of return of 5% per year before expenses, which is not the Fund’s return. The hypothetical account values and expenses may not be used to estimate actual ending account balance or expenses you paid for the period. You may use this information to compare the ongoing costs of investing in the Fund and other mutual funds. To do so, compare this 5% hypothetical example with the 5% hypothetical example that appears in the shareholder reports of the other funds.
62
Please note that the expenses shown in the table are meant to highlight your ongoing costs only and do not reflect any transactional costs, such as redemption fees. Therefore, the second line of the table is useful in comparing ongoing costs only, and will not help you determine the relative total costs of owning different funds. In addition, if these transactional costs were included, your costs would have been higher.
| Fund Name | Expenses | Beginning Account Value as of 2/1/2018 | Ending Account Value as of 7/31/2018 | Expenses Paid During Period 2/1/2018 – 7/31/2018 | ||||
| Domini Impact Equity Fund Investor Shares | Actual Expenses | $1,000.00 | $979.79 | $5.411 | ||||
| Hypothetical Expenses (5% return before expenses) | $1,000.00 | $1,019.33 | $5.511 | |||||
| Domini Impact Equity Fund Class A Shares | Actual Expenses | $1,000.00 | $979.67 | $5.471 | ||||
| Hypothetical Expenses (5% return before expenses) | $1,000.00 | $1,019.27 | $5.581 | |||||
| Domini Impact Equity Fund Institutional Shares | Actual Expenses | $1,000.00 | $981.41 | $3.641 | ||||
| Hypothetical Expenses (5% return before expenses) | $1,000.00 | $1,021.13 | $3.711 | |||||
| Domini Impact Equity Fund Class R Shares | Actual Expenses | $1,000.00 | $981.10 | $3.921 | ||||
| Hypothetical Expenses (5% return before expenses) | $1,000.00 | $1,020.83 | $4.001 | |||||
Domini Impact International Equity Fund Investor Shares | Actual Expenses | $1,000.00 | $923.17 | $6.732 | ||||
| Hypothetical Expenses (5% return before expenses) | $1,000.00 | $1,017.80 | $7.062 | |||||
Domini Impact International Equity Fund Class A Shares | Actual Expenses | $1,000.00 | $922.80 | $6.982 | ||||
| Hypothetical Expenses (5% return before expenses) | $1,000.00 | $1,017.54 | $7.322 | |||||
Domini Impact International Equity Fund Institutional Shares | Actual Expenses | $1,000.00 | $924.50 | $4.872 | ||||
| Hypothetical Expenses (5% return before expenses) | $1,000.00 | $1,019.73 | $5.112 | |||||
Domini Impact International Equity Fund Class Y Shares | Actual Expenses | $1,000.00 | $923.17 | $5.392 | ||||
| Hypothetical Expenses (5% return before expenses) | $1,000.00 | $1,019.19 | $5.662 | |||||
Domini Impact Investor Shares | Actual Expenses | $1,000.00 | $995.61 | $4.323 | ||||
| Hypothetical Expenses (5% return before expenses) | $1,000.00 | $1,020.47 | $4.373 |
63
| Fund Name | Expenses | Beginning Account Value as of 2/1/2018 | Ending Account Value as of 7/31/2018 | Expenses Paid During Period 2/1/2018 – 7/31/2018 | ||||
Domini Impact Institutional Shares | Actual Expenses | $1,000.00 | $997.05 | $2.823 | ||||
| Hypothetical Expenses (5% return before expenses) | $1,000.00 | $1,021.97 | $2.863 |
1Expenses are equal to the Fund’s annualized expense ratio of 1.10% for Investor shares, or 1.11% for Class A shares, or 0.74% for Institutional Class, or 0.80% for Class R shares, multiplied by average account value over the period, multiplied by 181, and divided by 365.
2Expenses are equal to the Fund’s annualized expense ratio of 1.41% for Investor shares, or 1.46% for Class A shares, or 1.02% for Institutional shares, or 1.13% for Class Y shares, multiplied by average account value over the period, multiplied by 181, and divided by 365.
3Expenses are equal to the Fund’s annualized expense ratio of 0.87% for Investor Shares, or 0.57% for Institutional Class, multiplied by average account value over the period, multiplied by 181, and divided by 365.
64
STATEMENTS OF ASSETS AND LIABILITIES
July 31, 2018
| Domini Impact Equity Fund | Domini Impact International Equity Fund | |||||||
ASSETS | ||||||||
Investments at value (cost $689,774,321, and $1,332,786,535, respectively) | $ | 809,261,128 | $ | 1,413,463,847 | ||||
Cash | 7,008,559 | 10,048,380 | ||||||
Foreign currency, at value (cost $0, and $746,253, respectively) | - | 746,708 | ||||||
Receivable for securities sold | 342,789 | 425,629 | ||||||
Receivable for capital shares | 54,856 | 2,727,981 | ||||||
Dividend receivable | 498,922 | 3,183,299 | ||||||
Tax reclaim receivable | 3,722 | 1,363,899 | ||||||
|
|
|
| |||||
Total assets | 817,169,976 | 1,431,959,743 | ||||||
|
|
|
| |||||
LIABILITIES | ||||||||
Payable for capital shares | 1,111,444 | 14,982,993 | ||||||
Management /Sponsorship fee payable | 474,809 | 1,048,409 | ||||||
Distribution fee payable | 141,353 | 167,468 | ||||||
Other accrued expenses | 323,940 | 1,030,988 | ||||||
Foreign tax payable | - | 380,651 | ||||||
Distribution payable | 347 | 329 | ||||||
|
|
|
| |||||
Total liabilities | 2,051,893 | 17,610,838 | ||||||
|
|
|
| |||||
NET ASSETS | $ | 815,118,083 | $ | 1,414,348,905 | ||||
|
|
|
| |||||
NET ASSETS CONSIST OF | ||||||||
Paid-in capital applicable to shares of beneficial interest, unlimited number of $0.00001 par value shares authorized | $ | 625,635,808 | $ | 1,289,566,036 | ||||
Undistributed net investment income (loss) | 654,903 | 9,133,608 | ||||||
Accumulated net realized gain (loss) | 69,340,565 | 35,032,411 | ||||||
Net unrealized appreciation (depreciation) | 119,486,807 | 80,616,850 | ||||||
|
|
|
| |||||
NET ASSETS | $ | 815,118,083 | $ | 1,414,348,905 | ||||
|
|
|
| |||||
SEE NOTES TO FINANCIAL STATEMENTS
65
STATEMENTS OF ASSETS AND LIABILITIES (continued)
July 31, 2018
| Domini Impact Equity Fund | Domini Impact International Equity Fund | |||||||
NET ASSET VALUE PER SHARE | ||||||||
Investor Shares | ||||||||
Net assets | $ | 668,818,356 | $ | 611,772,122 | ||||
|
|
|
| |||||
Outstanding shares of beneficial interest | 27,663,593 | 70,168,614 | ||||||
|
|
|
| |||||
Net asset value and offering price per share* | $ | 24.18 | $ | 8.72 | ||||
|
|
|
| |||||
Class A Shares | ||||||||
Net assets | $ | 7,464,139 | $ | 81,127,132 | ||||
|
|
|
| |||||
Outstanding shares of beneficial interest | 308,843 | 8,838,067 | ||||||
|
|
|
| |||||
Net asset value* | $ | 24.17 | $ | 9.18 | ||||
|
|
|
| |||||
Maximum offering price per share (net asset value per share / (1-4.75%)) | $ | 25.37 | $ | 9.64 | ||||
|
|
|
| |||||
Institutional shares | ||||||||
Net assets | $ | 120,376,461 | $ | 579,833,751 | ||||
|
|
|
| |||||
Outstanding shares of beneficial interest | 4,977,935 | 66,662,177 | ||||||
|
|
|
| |||||
Net asset value and offering price per share* | $ | 24.18 | $ | 8.70 | ||||
|
|
|
| |||||
Class R shares | ||||||||
Net assets | $ | 18,459,127 | ||||||
|
|
|
| |||||
Outstanding shares of beneficial interest | 763,364 | |||||||
|
|
|
| |||||
Net asset value and offering price per share* | $ | 24.18 | ||||||
|
|
|
| |||||
Class Y shares | ||||||||
Net assets | $ | 141,615,900 | ||||||
|
|
|
| |||||
Outstanding shares of beneficial interest | 16,252,729 | |||||||
|
|
|
| |||||
Net asset value and offering price per share* | $ | 8.71 | ||||||
|
|
|
| |||||
* Redemption price is equal to net asset value less any applicable redemption fees retained by the Fund.
SEE NOTES TO FINANCIAL STATEMENTS
66
STATEMENTS OF OPERATIONS
For the Year Ended July 31, 2018
| Domini Impact Equity Fund | Domini Impact International Equity Fund | |||||||
INCOME | ||||||||
Dividends (net of foreign taxes $235,422, and $4,758,075, respectively) | $ | 19,199,166 | $ | 41,569,976 | ||||
|
|
|
| |||||
Investment Income | 19,199,166 | 41,569,976 | ||||||
|
|
|
| |||||
EXPENSES | ||||||||
Management /Sponsorship fees | 5,871,681 | 11,426,415 | ||||||
Distribution fees – Investor shares | 1,703,155 | 1,713,367 | ||||||
Distribution fees – Class A shares | 20,035 | 231,204 | ||||||
Transfer agent fees – Investor shares | 665,191 | 964,139 | ||||||
Transfer agent fees – Class A shares | 11,426 | 135,796 | ||||||
Transfer agent fees – Institutional shares | 5,998 | 21,287 | ||||||
Transfer agent fees – Class R shares | 1,937 | - | ||||||
Transfer agent fees – Class Y shares | - | 3,880 | ||||||
Custody and Accounting fees | 175,534 | 1,063,892 | ||||||
Registration fees – Investor shares | 28,152 | 58,982 | ||||||
Registration fees – Class A shares | 18,726 | 23,011 | ||||||
Registration fees – Institutional shares | 19,619 | 100,633 | ||||||
Registration fees – Class R shares | 18,835 | - | ||||||
Registration fees – Class Y shares | - | 374 | ||||||
Professional fees | 106,124 | 164,302 | ||||||
Miscellaneous | 60,996 | 175,585 | ||||||
Shareholder Communication fees | 60,045 | 132,543 | ||||||
Shareholder Service fees – Investor shares | 54,812 | 44,346 | ||||||
Shareholder Service fees – Class A shares | 804 | 10,778 | ||||||
Shareholder Service fees – Institutional shares | 151 | 853 | ||||||
Shareholder Service fees – Class R shares | 177 | - | ||||||
Shareholder Service fees – Class Y shares | - | - | ||||||
Trustees fees | 36,795 | 54,207 | ||||||
|
|
|
| |||||
Total expenses | 8,860,193 | 16,325,594 | ||||||
Fees waived and expenses reimbursed | (53,624) | - | ||||||
|
|
|
| |||||
Net expenses | 8,806,569 | 16,325,594 | ||||||
|
|
|
| |||||
NET INVESTMENT INCOME (LOSS) | 10,392,597 | 25,244,382 | ||||||
|
|
|
| |||||
REALIZED AND UNREALIZED GAIN (LOSS) FROM INVESTMENTS AND FOREIGN CURRENCY | ||||||||
NET REALIZED GAIN (LOSS) FROM: | ||||||||
Investments | 91,214,019 | 55,378,335 | ||||||
Foreign currency | (8,286) | (315,918) | ||||||
|
|
|
| |||||
Net realized gain (loss) | 91,205,733 | 55,062,417 | ||||||
NET CHANGES IN UNREALIZED APPRECIATION (DEPRECIATION) FROM: | ||||||||
Investments | (17,064,089) | (61,668,087) | ||||||
Translation of assets and liabilities in foreign currencies | (1,698) | (107,609) | ||||||
|
|
|
| |||||
Net change in unrealized appreciation (depreciation) | (17,065,787) | (61,775,696) | ||||||
|
|
|
| |||||
NET REALIZED AND UNREALIZED GAIN (LOSS) | 74,139,946 | (6,713,279) | ||||||
|
|
|
| |||||
NET INCREASE (DECREASE) IN NET ASSETS RESULTING FROM OPERATIONS | $ | 84,532,543 | $ | 18,531,103 | ||||
|
|
|
| |||||
SEE NOTES TO FINANCIAL STATEMENTS
67
DOMINI IMPACT EQUITY FUND
STATEMENTS OF CHANGES IN NET ASSETS
| Year Ended July 31, 2018 | Year Ended July 31, 2017 | |||||||
INCREASE IN NET ASSETS | ||||||||
FROM OPERATIONS | ||||||||
Net investment income (loss) | $ | 10,392,597 | $ | 9,123,816 | ||||
Net realized gain (loss) | 91,205,733 | 54,924,202 | ||||||
Net change in unrealized appreciation (depreciation) | (17,065,787) | 54,793,548 | ||||||
|
|
|
| |||||
Net Increase (Decrease) in Net Assets Resulting from Operations | 84,532,543 | 118,841,566 | ||||||
|
|
|
| |||||
DISTRIBUTIONS AND/OR DIVIDENDS | ||||||||
Dividends to shareholders from net investment income: | ||||||||
Investor shares | (4,746,471) | (3,565,551) | ||||||
Class A shares | (325,093) | (414,948) | ||||||
Institutional shares | (2,441,449) | (3,170,592) | ||||||
Class R shares | (1,091,049) | (2,673,873) | ||||||
Distributions to shareholders from net realized gain: | ||||||||
Investor shares | (33,673,047) | (10,974,157) | ||||||
Class A shares | (2,575,641) | (810,823) | ||||||
Institutional shares | (13,519,409) | (5,617,485) | ||||||
Class R shares | (8,050,960) | (4,749,954) | ||||||
|
|
|
| |||||
Net Decrease in Net Assets from Distributions and/or Dividends | (66,423,119) | (31,977,383) | ||||||
|
|
|
| |||||
CAPITAL SHARE TRANSACTIONS | ||||||||
Proceeds from sale of shares | 41,060,836 | 47,295,654 | ||||||
Net asset value of shares issued in reinvestment of distributions and dividends | 64,190,173 | 30,817,443 | ||||||
Payments for shares redeemed | (169,946,588) | (216,646,740) | ||||||
Redemption fees | 6,670 | 5,397 | ||||||
|
|
|
| |||||
Net Increase (Decrease) in Net Assets from Capital Share Transactions | (64,688,909) | (138,528,246) | ||||||
|
|
|
| |||||
Total Increase (Decrease) in Net Assets | (46,579,485) | (51,664,063) | ||||||
|
|
|
| |||||
NET ASSETS | ||||||||
Beginning of period | $ | 861,697,568 | $ | 913,361,631 | ||||
|
|
|
| |||||
End of period | $ | 815,118,083 | $ | 861,697,568 | ||||
|
|
|
| |||||
Undistributed net investment income (loss) | $ | 654,903 | $ | - | ||||
|
|
|
| |||||
SEE NOTES TO FINANCIAL STATEMENTS
68
DOMINI IMPACT INTERNATIONAL EQUITY FUND
STATEMENTS OF CHANGES IN NET ASSETS
| Year Ended July 31, 2018 | Year Ended July 31, 2017 | |||||||
INCREASE IN NET ASSETS | ||||||||
FROM OPERATIONS | ||||||||
Net investment income (loss) | $ | 25,244,382 | $ | 17,131,054 | ||||
Net realized gain (loss) | 55,062,417 | 14,169,549 | ||||||
Net change in unrealized appreciation (depreciation) | (61,775,696) | 117,434,428 | ||||||
|
|
|
| |||||
Net Increase (Decrease) in Net Assets Resulting from Operations | 18,531,103 | 148,735,031 | ||||||
|
|
|
| |||||
DISTRIBUTIONS AND/OR DIVIDENDS | ||||||||
Dividends to shareholders from net investment income: | ||||||||
Investor shares | (16,514,392) | (6,741,209) | ||||||
Class A shares | (2,135,355) | (956,280) | ||||||
Institutional shares | (15,242,059) | (4,421,473) | ||||||
Class Y shares | - | - | ||||||
Distributions to shareholders from net realized gain: | ||||||||
Investor shares | - | - | ||||||
Class A shares | - | - | ||||||
Institutional shares | - | - | ||||||
Class Y shares | - | - | ||||||
|
|
|
| |||||
Net Decrease in Net Assets from Distributions and/or Dividends | (33,891,806) | (12,118,962) | ||||||
|
|
|
| |||||
CAPITAL SHARE TRANSACTIONS | ||||||||
Proceeds from sale of shares | 794,630,243 | 467,849,480 | ||||||
Net asset value of shares issued in reinvestment of distributions and dividends | 22,168,564 | 8,708,204 | ||||||
Payments for shares redeemed | (451,631,004) | (155,565,756) | ||||||
Redemption fees | 15,600 | 16,669 | ||||||
|
|
|
| |||||
Net Increase (Decrease) in Net Assets from Capital Share Transactions | 365,183,403 | 321,008,597 | ||||||
|
|
|
| |||||
Total Increase (Decrease) in Net Assets | 349,822,700 | 457,624,666 | ||||||
|
|
|
| |||||
NET ASSETS | ||||||||
Beginning of period | $ | 1,064,526,205 | $ | 606,901,539 | ||||
|
|
|
| |||||
End of period | $ | 1,414,348,905 | $ | 1,064,526,205 | ||||
|
|
|
| |||||
Undistributed net investment income (loss) | $ | 9,133,608 | $ | 9,259,050 | ||||
|
|
|
| |||||
SEE NOTES TO FINANCIAL STATEMENTS
69
DOMINI IMPACT EQUITY FUND — INVESTOR SHARES
FINANCIAL HIGHLIGHTS
| Year Ended July 31, | ||||||||||||||||||||
| 2018 | 2017^ | 2016^ | 2015^ | 2014^ | ||||||||||||||||
For a share outstanding for the period: | ||||||||||||||||||||
Net asset value, beginning of period | $23.18 | ^ | $20.76 | $22.70 | $23.42 | $19.62 | ||||||||||||||
|
|
|
|
|
|
|
|
|
| |||||||||||
Income from investment operations: | ||||||||||||||||||||
Net investment income (loss) | 0.27 | 3 | 0.21 | 3 | 0.45 | 0.26 | 3 | 0.20 | ||||||||||||
Net realized and unrealized gain (loss) on investments | 2.09 | 3 | 2.69 | (1.04) | 0.93 | 3.73 | ||||||||||||||
|
|
|
|
|
|
|
|
|
| |||||||||||
Total income (loss) from investment operations | 2.36 | 2.90 | (0.59) | 1.19 | 3.93 | |||||||||||||||
|
|
|
|
|
|
|
|
|
| |||||||||||
Less dividends and distributions: | ||||||||||||||||||||
Dividends to shareholders from net investment income | (0.17) | ^ | (0.12) | (0.24) | (0.18) | (0.13) | ||||||||||||||
Distributions to shareholders from net realized gain | (1.19) | ^ | (0.36) | (1.10) | (1.73) | - | ||||||||||||||
Tax return of capital 3 | - | - | (0.01) | - | - | |||||||||||||||
|
|
|
|
|
|
|
|
|
| |||||||||||
Total distributions | (1.36) | (0.48) | (1.35) | (1.91) | (0.13) | |||||||||||||||
|
|
|
|
|
|
|
|
|
| |||||||||||
Redemption fee proceeds 3 | 0.00 | 1 | 0.00 | 1 | 0.00 | 1 | 0.00 | 1 | 0.00 | 1 | ||||||||||
|
|
|
|
|
|
|
|
|
| |||||||||||
Net asset value, end of period | $24.18 | $23.18 | $20.76 | $22.70 | $23.42 | |||||||||||||||
|
|
|
|
|
|
|
|
|
| |||||||||||
Total return 2 | 10.32% | 14.07% | -2.47% | 5.21% | 20.07% | |||||||||||||||
Portfolio turnover | 78% | 85% | 91% | 103% | 86% | |||||||||||||||
Ratios/supplemental data (annualized): | ||||||||||||||||||||
Net assets, end of period (in millions) | $669 | $675 | $656 | $752 | $699 | |||||||||||||||
Ratio of expenses to average net assets | 1.10% | 1.14% | 1.14% | 1.16% | 1.20% | |||||||||||||||
Ratio of gross expenses to average net assets | 1.10% | 1.14% | 1.14% | 1.16% | 1.20% | |||||||||||||||
Ratio of net investment income (loss) to average net assets | 1.15% | 0.94% | 2.06% | 1.10% | 0.80% | |||||||||||||||
1 Amount represents less than 0.005 per share.
2 Not annualized for periods less than one year.
3 Based on average shares outstanding.
^ All per share amounts and net asset values have been adjusted as a result of the 1.9988601 for 1 share split on January 26, 2018 ( see Note 4).
SEE NOTES TO FINANCIAL STATEMENTS
70
DOMINI IMPACT EQUITY FUND — CLASS A SHARES
FINANCIAL HIGHLIGHTS
| Year Ended July 31, | ||||||||||||||||||||
| 2018 | 2017^ | 2016^ | 2015^ | 2014^ | ||||||||||||||||
For a share outstanding for the period: | ||||||||||||||||||||
Net asset value, beginning of period | $33.41 | ^ | $34.01 | $48.90 | $64.35 | $54.93 | ||||||||||||||
|
|
|
|
|
|
|
|
|
| |||||||||||
Income from investment operations: | ||||||||||||||||||||
Net investment income (loss) | 0.31 | 4 | 0.32 | 4 | 1.53 | 0.56 | 4 | 1.16 | ||||||||||||
Net realized and unrealized gain (loss) on investments | 2.84 | 4 | 4.14 | (3.19) | 2.45 | 9.84 | ||||||||||||||
|
|
|
|
|
|
|
|
|
| |||||||||||
Total income (loss) from investment operations | 3.15 | 4.46 | (1.66) | 3.01 | 11.00 | |||||||||||||||
|
|
|
|
|
|
|
|
|
| |||||||||||
Less dividends and/or distributions: | ||||||||||||||||||||
Dividends to shareholders from net investment income | (1.35) | ^ | (1.72) | (3.02) | (2.41) | (1.58) | ||||||||||||||
Distributions to shareholders from net realized gain | (11.04) | ^ | (3.34) | (10.21) | (16.05) | - | ||||||||||||||
Tax return of capital 4 | - | - | (0.00) | 1 | - | - | ||||||||||||||
|
|
|
|
|
|
|
|
|
| |||||||||||
Total distributions | (12.39) | (5.06) | (13.23) | (18.46) | (1.58) | |||||||||||||||
|
|
|
|
|
|
|
|
|
| |||||||||||
Redemption fee proceeds | - | - | - | - | - | |||||||||||||||
|
|
|
|
|
|
|
|
|
| |||||||||||
Net asset value, end of period | $24.17 | $33.41 | $34.01 | $48.90 | $64.35 | |||||||||||||||
|
|
|
|
|
|
|
|
|
| |||||||||||
Total return 2 | 10.36% | 13.97% | -2.61% | 5.19% | 20.17% | |||||||||||||||
Portfolio turnover | 78% | 85% | 91% | 103% | 86% | |||||||||||||||
Ratios/supplemental data (annualized): | ||||||||||||||||||||
Net assets, end of period (in millions) | $7 | $8 | $8 | $11 | $8 | |||||||||||||||
Ratio of expenses to average net assets | 1.12% | 3 | 1.16% | 3 | 1.18% | 3 | 1.18% | 3 | 1.18% | 3 | ||||||||||
Ratio of gross expenses to average net assets | 1.38% | 1.46% | 1.41% | 1.39% | 1.54% | |||||||||||||||
Ratio of net investment income (loss) to average net assets | 1.14% | 0.92% | 2.00% | 1.06% | 0.83% | |||||||||||||||
1 Amount represents less than 0.005 per share.
2 Total return does not reflect sales commissions and is not annualized for periods less than one year.
3 Reflects a waiver of fees by the Manager, the Sponsor, and the Distributor of the Fund.
4 Based on average shares outstanding.
^ All per share amounts and net asset values have been adjusted as a result of the 0.2155310 for 1 reverse share split on January 26, 2018 ( see Note 4).
SEE NOTES TO FINANCIAL STATEMENTS
71
DOMINI IMPACT EQUITY FUND — INSTITUTIONAL SHARES
FINANCIAL HIGHLIGHTS
| Year Ended July 31, | ||||||||||||||||||||
| 2018 | 2017 | 2016 | 2015 | 2014 | ||||||||||||||||
For a share outstanding for the period: | ||||||||||||||||||||
Net asset value, beginning of period | $24.46 | $22.40 | $25.95 | $28.49 | $23.94 | |||||||||||||||
|
|
|
|
|
|
|
|
|
| |||||||||||
Income from investment operations: | ||||||||||||||||||||
Net investment income (loss) | 0.37 | 0.31 | 4 | 0.55 | 0.40 | 4 | 0.32 | |||||||||||||
Net realized and unrealized gain (loss) on investments | 2.17 | 2.87 | (1.20) | 1.11 | 4.60 | |||||||||||||||
|
|
|
|
|
|
|
|
|
| |||||||||||
Total income (loss) from investment operations | 2.54 | 3.18 | (0.65) | 1.51 | 4.92 | |||||||||||||||
|
|
|
|
|
|
|
|
|
| |||||||||||
Less dividends and/or distributions: | ||||||||||||||||||||
Dividends to shareholders from net investment income | (0.44) | (0.40) | (0.70) | (0.59) | (0.37) | |||||||||||||||
Distributions to shareholders from net realized gain | (2.38) | (0.72) | (2.20) | (3.46) | - | |||||||||||||||
Tax return of capital 4 | - | - | (0.00) | 1 | - | - | ||||||||||||||
|
|
|
|
|
|
|
|
|
| |||||||||||
Total distributions | (2.82) | (1.12) | (2.90) | (4.05) | (0.37) | |||||||||||||||
|
|
|
|
|
|
|
|
|
| |||||||||||
Redemption fee proceeds 4 | 0.00 | 1 | 0.00 | 1 | 0.00 | 1 | 0.00 | 1 | 0.00 | 1 | ||||||||||
|
|
|
|
|
|
|
|
|
| |||||||||||
Net asset value, end of period | $24.18 | $24.46 | $22.40 | $25.95 | $28.49 | |||||||||||||||
|
|
|
|
|
|
|
|
|
| |||||||||||
Total return 2 | 10.68% | 14.51% | -2.14% | 5.56% | 20.59% | |||||||||||||||
Portfolio turnover | 78% | 85% | 91% | 103% | 86% | |||||||||||||||
Ratios/supplemental data (annualized): | ||||||||||||||||||||
Net assets, end of period (in millions) | $120 | $157 | $205 | $237 | $260 | |||||||||||||||
Ratio of expenses to average net assets | 0.74% | 3 | 0.79% | 0.80% | 3 | 0.80% | 3 | 0.80% | 3 | |||||||||||
Ratio of gross expenses to average net assets | 0.76% | 0.79% | 0.81% | 0.80% | 0.81% | |||||||||||||||
Ratio of net investment income (loss) to average net assets | 1.52% | 1.31% | 2.40% | 1.47% | 1.19% | |||||||||||||||
1 Amount represents less than 0.005 per share.
2 Not annualized for periods less than one year.
3 Reflects a waiver of fees by the Manager, and the Sponsor of the Fund.
4 Based on average shares outstanding.
SEE NOTES TO FINANCIAL STATEMENTS
72
DOMINI IMPACT EQUITY FUND — CLASS R SHARES
FINANCIAL HIGHLIGHTS
| Year Ended July 31, | ||||||||||||||||||||
| 2018 | 2017^ | 2016^ | 2015^ | 2014^ | ||||||||||||||||
For a share outstanding for the period: | ||||||||||||||||||||
Net asset value, beginning of period | $37.86 | ^ | $39.86 | $60.43 | $82.35 | $70.33 | ||||||||||||||
|
|
|
|
|
|
|
|
|
| |||||||||||
Income from investment operations: | ||||||||||||||||||||
Net investment income (loss) | 0.41 | 4 | 0.51 | 4 | 3.15 | 0.96 | 4 | 6.43 | ||||||||||||
Net realized and unrealized gain (loss) on investments | 3.21 | 4 | 4.69 | (5.08) | 3.15 | 7.90 | ||||||||||||||
|
|
|
|
|
|
|
|
|
| |||||||||||
Total income (loss) from investment operations | 3.62 | 5.20 | (1.93) | 4.11 | 14.33 | |||||||||||||||
|
|
|
|
|
|
|
|
|
| |||||||||||
Less dividends and/or distributions: | ||||||||||||||||||||
Dividends to shareholders from net investment income | (2.00) | ^ | (2.57) | (4.50) | (3.79) | (2.31) | ||||||||||||||
Distributions to shareholders from net realized gain | (15.30) | ^ | (4.63) | (14.14) | (22.24) | - | ||||||||||||||
Tax return of capital 4 | - | - | (0.00) | 1 | - | - | ||||||||||||||
|
|
|
|
|
|
|
|
|
| |||||||||||
Total distributions | (17.30) | (7.20) | (18.64) | (26.03) | (2.31) | |||||||||||||||
|
|
|
|
|
|
|
|
|
| |||||||||||
Redemption fee proceeds 4 | 0.00 | 1 | 0.00 | 1 | 0.00 | 1 | 0.00 | 1 | 0.00 | 1 | ||||||||||
|
|
|
|
|
|
|
|
|
| |||||||||||
Net asset value, end of period | $24.18 | $37.86 | $39.86 | $60.43 | $82.35 | |||||||||||||||
|
|
|
|
|
|
|
|
|
| |||||||||||
Total return 2 | 10.71% | 14.20% | -2.22% | 5.55% | 20.52% | |||||||||||||||
Portfolio turnover | 78% | 85% | 91% | 103% | 86% | |||||||||||||||
Ratios/supplemental data (annualized): | ||||||||||||||||||||
Net assets, end of period (in millions) | $18 | $21 | $44 | $55 | $49 | |||||||||||||||
Ratio of expenses to average net assets | 0.80% | 3 | 0.83% | 3 | 0.82% | 0.85% | 0.90% | |||||||||||||
Ratio of gross expenses to average net assets | 0.84% | 0.85% | 0.82% | 0.85% | 0.90% | |||||||||||||||
Ratio of net investment income (loss) to average net assets | 1.46% | 1.28% | 2.39% | 1.41% | 1.07% | |||||||||||||||
1 Amount represents less than 0.005 per share.
2 Not annualized for periods less than one year.
3 Reflects a waiver of fees by the Manager, and the Sponsor, of the Fund.
4 Based on average shares outstanding.
^ All per share amounts and net asset values have been adjusted as a result of the 0.1555580 for 1 reverse share split on January 26, 2018 ( see Note 4).
SEE NOTES TO FINANCIAL STATEMENTS
73
DOMINI IMPACT INTERNATIONAL EQUITY FUND — INVESTOR SHARES
FINANCIAL HIGHLIGHTS
| Year Ended July 31, | ||||||||||||||||||||
| 2018 | 2017 | 2016 | 2015 | 2014 | ||||||||||||||||
For a share outstanding for the period: | ||||||||||||||||||||
Net asset value, beginning of period | $8.76 | $7.38 | $8.05 | $8.26 | $7.67 | |||||||||||||||
|
|
|
|
|
|
|
|
|
| |||||||||||
Income from investment operations: | ||||||||||||||||||||
Net investment income (loss) | 0.16 | 0.15 | 0.12 | 0.13 | 0.14 | |||||||||||||||
Net realized and unrealized gain (loss) on investments | 0.02 | 1.35 | (0.53) | 0.20 | 0.85 | |||||||||||||||
|
|
|
|
|
|
|
|
|
| |||||||||||
Total income (loss) from investment operations | 0.18 | 1.50 | (0.41) | 0.33 | 0.99 | |||||||||||||||
|
|
|
|
|
|
|
|
|
| |||||||||||
Less dividends and/or distributions: | ||||||||||||||||||||
Dividends to shareholders from net investment income | (0.22) | (0.12) | (0.07) | (0.11) | (0.25) | |||||||||||||||
Distributions to shareholders from net realized gain | - | - | (0.19) | (0.43) | (0.15) | |||||||||||||||
|
|
|
|
|
|
|
|
|
| |||||||||||
Total distributions | (0.22) | (0.12) | (0.26) | (0.54) | (0.40) | |||||||||||||||
|
|
|
|
|
|
|
|
|
| |||||||||||
Redemption fee proceeds 4 | 0.00 | 1 | 0.00 | 1 | 0.00 | 1 | 0.00 | 1 | 0.00 | 1 | ||||||||||
|
|
|
|
|
|
|
|
|
| |||||||||||
Net asset value, end of period | $8.72 | $8.76 | $7.38 | $8.05 | $8.26 | |||||||||||||||
|
|
|
|
|
|
|
|
|
| |||||||||||
Total return 2 | 2.08% | 20.61% | -5.12% | 4.65% | 13.15% | |||||||||||||||
Portfolio turnover | 68% | 73% | 89% | 88% | 86% | |||||||||||||||
Ratios/supplemental data (annualized): | ||||||||||||||||||||
Net assets, end of period (in millions) | $612 | $595 | $385 | $320 | $232 | |||||||||||||||
Ratio of expenses to average net assets | 1.41% | 1.46% | 1.52% | 1.59% | 1.60% | 3 | ||||||||||||||
Ratio of gross expenses to average net assets | 1.41% | 1.46% | 1.52% | 1.59% | 1.62% | |||||||||||||||
Ratio of net investment income (loss) to average net assets | 1.81% | 2.06% | 1.59% | 1.32% | 1.43% | |||||||||||||||
1 Amount represents less than 0.005 per share.
2 Not annualized for periods less than one year.
3 Reflects a waiver of fees by the Manager, and the Distributor of the Fund.
4 Based on average shares outstanding.
SEE NOTES TO FINANCIAL STATEMENTS
74
DOMINI IMPACT INTERNATIONAL EQUITY FUND — CLASS A SHARES
FINANCIAL HIGHLIGHTS
| Year Ended July 31, | ||||||||||||||||||||
| 2018 | 2017 | 2016 | 2015 | 2014 | ||||||||||||||||
For a share outstanding for the period: | ||||||||||||||||||||
Net asset value, beginning of period | $9.21 | $7.76 | $8.45 | $8.64 | $8.00 | |||||||||||||||
|
|
|
|
|
|
|
|
|
| |||||||||||
Income from investment operations: | ||||||||||||||||||||
Net investment income (loss) | 0.15 | 0.14 | 0.11 | 0.14 | 0.14 | |||||||||||||||
Net realized and unrealized gain (loss) on investments | 0.04 | 1.43 | (0.54) | 0.21 | 0.90 | |||||||||||||||
|
|
|
|
|
|
|
|
|
| |||||||||||
Total income (loss) from investment operations | 0.19 | 1.57 | (0.43) | 0.35 | 1.04 | |||||||||||||||
|
|
|
|
|
|
|
|
|
| |||||||||||
Less dividends and/or distributions: | ||||||||||||||||||||
Dividends to shareholders from net investment income | (0.22) | (0.12) | (0.07) | (0.11) | (0.25) | |||||||||||||||
Distributions to shareholders from net realized gain | - | - | (0.19) | (0.43) | (0.15) | |||||||||||||||
|
|
|
|
|
|
|
|
|
| |||||||||||
Total distributions | (0.22) | (0.12) | (0.26) | (0.54) | (0.40) | |||||||||||||||
|
|
|
|
|
|
|
|
|
| |||||||||||
Redemption fee proceeds 4 | 0.00 | 1 | 0.00 | 1 | 0.00 | 1 | 0.00 | 1 | 0.00 | 1 | ||||||||||
|
|
|
|
|
|
|
|
|
| |||||||||||
Net asset value, end of period | $9.18 | $9.21 | $7.76 | $8.45 | $8.64 | |||||||||||||||
|
|
|
|
|
|
|
|
|
| |||||||||||
Total return 2 | 2.00% | 20.44% | -5.07% | 4.71% | 13.16% | |||||||||||||||
Portfolio turnover | 68% | 73% | 89% | 88% | 86% | |||||||||||||||
Ratios/supplemental data (annualized): | ||||||||||||||||||||
Net assets, end of period (in millions) | $81 | $85 | $55 | $51 | $29 | |||||||||||||||
Ratio of expenses to average net assets | 1.47% | 1.52% | 3 | 1.53% | 3 | 1.57% | 3 | 1.57% | 3 | |||||||||||
Ratio of gross expenses to average net assets | 1.47% | 1.53% | 1.59% | 1.68% | 1.82% | |||||||||||||||
Ratio of net investment income (loss) to average net assets | 1.63% | 1.99% | 1.47% | 1.46% | 1.51% | |||||||||||||||
1 Amount represents less than 0.005 per share.
2 Total return does not reflect sales commissions and is not annualized for periods less than one year.
3 Reflects a waiver of fees by the Manager, and the Distributor of the Fund.
4 Based on average shares outstanding.
SEE NOTES TO FINANCIAL STATEMENTS
75
DOMINI IMPACT INTERNATIONAL EQUITY FUND — INSTITUTIONAL SHARES
FINANCIAL HIGHLIGHTS
| Year Ended July 31 | ||||||||||||||||||||
| 2018 | 2017 | 2016 | 2015 | 2014 | ||||||||||||||||
For a share outstanding for the period: | ||||||||||||||||||||
Net asset value, beginning of period | $8.74 | $7.39 | $8.07 | $8.28 | $7.66 | |||||||||||||||
|
|
|
|
|
|
|
|
|
| |||||||||||
Income from investment operations: | ||||||||||||||||||||
Net investment income (loss) | 0.18 | 0.19 | 0.15 | 0.16 | 0.13 | |||||||||||||||
Net realized and unrealized gain (loss) on investments | 0.05 | 1.32 | (0.54) | 0.21 | 0.89 | |||||||||||||||
|
|
|
|
|
|
|
|
|
| |||||||||||
Total income (loss) from investment operations | 0.23 | 1.51 | (0.39) | 0.37 | 1.02 | |||||||||||||||
|
|
|
|
|
|
|
|
|
| |||||||||||
Less dividends and/or distributions: | ||||||||||||||||||||
Dividends to shareholders from net investment income | (0.27) | (0.16) | (0.10) | (0.15) | (0.25) | |||||||||||||||
Distributions to shareholders from net realized gain | - | - | (0.19) | (0.43) | (0.15) | |||||||||||||||
|
|
|
|
|
|
|
|
|
| |||||||||||
Total distributions | (0.27) | (0.16) | (0.29) | (0.58) | (0.40) | |||||||||||||||
|
|
|
|
|
|
|
|
|
| |||||||||||
Redemption fee proceeds 4 | 0.00 | 1 | 0.00 | 1 | 0.00 | 1 | 0.00 | 1 | 0.00 | 1 | ||||||||||
|
|
|
|
|
|
|
|
|
| |||||||||||
Net asset value, end of period | $8.70 | $8.74 | $7.39 | $8.07 | $8.28 | |||||||||||||||
|
|
|
|
|
|
|
|
|
| |||||||||||
Total return 2 | 2.58% | 20.80% | -4.74% | 5.24% | 13.60% | |||||||||||||||
Portfolio turnover | 68% | 73% | 89% | 88% | 86% | |||||||||||||||
Ratios/supplemental data (annualized): | ||||||||||||||||||||
Net assets, end of period (in millions) | $580 | $384 | $167 | $61 | $39 | |||||||||||||||
Ratio of expenses to average net assets | 1.02% | 1.07% | 1.10% | 1.15% | 3 | 1.16% | ||||||||||||||
Ratio of gross expenses to average net assets | 1.02% | 1.07% | 1.10% | 1.15% | 1.16% | |||||||||||||||
Ratio of net investment income (loss) to average net assets | 2.22% | 2.82% | 2.22% | 1.78% | 1.82% | |||||||||||||||
1 Amount represents less than 0.005 per share.
2 Not annualized for periods less than one year.
3 Reflects a waiver of fees by the Manager of the Fund.
4 Based on average shares outstanding.
SEE NOTES TO FINANCIAL STATEMENTS
76
DOMINI IMPACT INTERNATIONAL EQUITY FUND — CLASS Y SHARES
FINANCIAL HIGHLIGHTS
| For the Period July 23, 2018 (commencement of operations) through July 31, 2018 | ||||
For a share outstanding for the period: | ||||
Net asset value, beginning of period | $8.56 | |||
|
| |||
Income from investment operations: | ||||
Net investment income (loss) | - | |||
Net realized and unrealized gain (loss) on investments | 0.15 | |||
|
| |||
Total income (loss) from investment operations | 0.15 | |||
|
| |||
Less dividends and/or distributions: | ||||
Dividends to shareholders from net investment income | - | |||
Distributions to shareholders from net realized gain | - | |||
|
| |||
Total distributions | - | |||
|
| |||
Redemption fee proceeds | - | |||
|
| |||
Net asset value, end of period | $8.71 | |||
|
| |||
Total return 1 | 1.75% | |||
Portfolio turnover | 68% | |||
Ratios/supplemental data (annualized): | ||||
Net assets, end of period (in millions) | $142 | |||
Ratio of expenses to average net assets | 1.13% | |||
Ratio of gross expenses to average net assets | 1.13% | |||
Ratio of net investment income (loss) to average net assets | 0.32% | |||
1 Not annualized for periods less than one year.
SEE NOTES TO FINANCIAL STATEMENTS
77
DOMINI IMPACT EQUITY FUND
DOMINI IMPACT INTERNATIONAL EQUITY FUND
NOTES TO FINANCIAL STATEMENTS
July 31, 2018
1. ORGANIZATION AND SIGNIFICANT ACCOUNTING POLICIES
The Domini Investment Trust (formerly Domini Social Investment Trust) is a Massachusetts business trust registered under the Investment Company Act of 1940 as an open-end management investment company. The Domini Investment Trust comprises three separate series: Domini Impact Equity Fund (formerly, Domini Social Equity Fund), Domini Impact International Equity Fund (formerly, Domini International Social Equity Fund), and Domini Impact Bond Fund (formerly Domini Social Bond Fund) (each the “Fund,” collectively the “Funds”). The financial statements of the Domini Impact Bond Fund are included on page 94 of this report. The Domini Impact Equity Fund offers Investor shares, Class A shares, Institutional shares and Class R shares. Class R shares of the Domini Impact Equity Fund commenced on November 28, 2003. Class A and Institutional shares of the Domini Impact Equity Fund commenced on November 28, 2008. The Domini Impact International Equity Fund offers Investor shares, Class A shares, Institutional shares and Class Y shares. Class A, Institutional and Class Y shares of the Domini Impact International Equity Fund were not offered prior to November 28, 2008, November 30, 2012, and June 15, 2018 respectively. The Investor shares, Institutional shares, Class R shares and Class Y shares are sold at their offering price, which is net asset value. The Class A shares are sold with a front-end sales charge (load) of up to 4.75%. The Institutional shares may only be purchased by or for the benefit of investors that meet the minimum investment requirements, and fall within the following categories: endowments, foundations, religious organizations and other nonprofit entities, individuals, retirement plan sponsors, family office clients, certain corporate or similar institutions, or omnibus accounts maintained by financial intermediaries and that are approved by the Fund’s Distributor. Class R shares are generally available only to certain eligible retirement plans and endowments, foundations, religious organizations, and other tax-exempt entities that are approved by the Fund’s Distributor. Class Y shares may only be purchased through omnibus accounts held on the books of the Fund for financial intermediaries that have been approved by the Funds’ distributor. All classes of shares have identical rights and voting privileges with respect to the Fund in general and exclusive voting rights on matters that affect that class alone. Earnings, net assets, and net asset value per share may differ due to each class having its own expenses, such as transfer and shareholder servicing agent fees and registration fees, directly attributable to that class. Class R and Institutional shares are not subject to distribution and service fees.
The preparation of financial statements in conformity with U.S. generally accepted accounting principles requires management to make estimates and
78
DOMINI IMPACT EQUITY FUND
DOMINI IMPACT INTERNATIONAL EQUITY FUND
NOTES TO FINANCIAL STATEMENTS (continued)
July 31, 2018
assumptions that affect the reported amounts of assets and liabilities and disclosure of contingent liabilities at the date of the financial statements and the reported amounts of revenues and expenses during the reporting period. Actual results could differ from those estimates. The following is a summary of the Funds’ significant accounting policies.
(A) Valuation of Investments. Securities listed or traded on national securities exchanges are valued at the last sale price reported by the security’s primary exchange or, if there have been no sales that day, at the mean of the current bid and ask price that represents the current value of the security. Securities listed on the NASDAQ National Market System are valued using the NASDAQ Official Closing Price (the “NOCP”). If an NOCP is not available for a security listed on the NASDAQ National Market System, the security will be valued at the last sale price or, if there have been no sales that day, at the mean of the current bid and ask price. Securities for which market quotations are not readily available or as a result of an event occurring after the close of the foreign market but before pricing the Funds are valued at fair value as determined in good faith under procedures established by and under the supervision of the Funds’ Board of Trustees. Securities that are primarily traded on foreign exchanges generally are valued at the closing price of such securities on their respective exchanges, except that if the Trusts’ manager or submanager, as applicable, is of the opinion that such price would result in an inappropriate value for a security, including as a result of an occurrence subsequent to the time a value was so established, then the fair value of those securities may be determined by consideration of other factors (including the use of an independent pricing service) by or under the direction of the Board of Trustees or its delegates.
The Funds follow a fair value hierarchy that distinguishes between (a) market participant assumptions developed based on market data obtained from sources independent of the reporting entity (observable inputs) and (b) the Fund’s own assumptions about market participant assumptions developed based on the best information available in the circumstances (unobservable inputs). These inputs are used in determining the value of the Funds’ investments and are summarized in the following fair value hierarchy:
Level 1 — quoted prices in active markets for identical securities
Level 2 — other significant observable inputs (including quoted prices for similar securities, interest rates, and evaluated quotation obtained from pricing services)
Level 3 — significant unobservable inputs (including the Funds’ own assumptions in determining the fair value of investments)
79
DOMINI IMPACT EQUITY FUND
DOMINI IMPACT INTERNATIONAL EQUITY FUND
NOTES TO FINANCIAL STATEMENTS (continued)
July 31, 2018
The inputs or methodology used for valuing securities are not an indication of the risk associated with investing in those securities.
The following is a summary of the inputs used by the Domini Impact Equity Fund, as of July 31, 2018, in valuing the Fund’s assets carried at fair value:
| Level 1 - Quoted Prices | Level 2 - Other Significant Observable Inputs | Level 3 - Significant Unobservable Inputs | Total | |||||||||||||
Common Stocks | ||||||||||||||||
Consumer Discretionary | $ | 91,968,211 | $ | - | $ | - | $ | 91,968,211 | ||||||||
Consumer Staples | 59,251,179 | - | - | 59,251,179 | ||||||||||||
Financials | 141,307,993 | - | - | 141,307,993 | ||||||||||||
Health Care | 107,401,500 | - | - | 107,401,500 | ||||||||||||
Industrials | 88,649,872 | - | - | 88,649,872 | ||||||||||||
Information Technology | 221,722,980 | - | - | 221,722,980 | ||||||||||||
Materials | 28,618,342 | - | - | 28,618,342 | ||||||||||||
Real Estate | 17,676,920 | - | - | 17,676,920 | ||||||||||||
Telecommunication Services | 25,993,951 | - | - | 25,993,951 | ||||||||||||
Utilities | 26,670,180 | - | - | 26,670,180 | ||||||||||||
|
|
|
|
|
|
|
| |||||||||
Total | $ | 809,261,128 | $ | - | $ | - | $ | 809,261,128 | ||||||||
|
|
|
|
|
|
|
| |||||||||
The following is a summary of the inputs used by the Domini Impact International Equity Fund, as of July 31, 2018, in valuing the Fund’s assets carried at fair value:
| Level 1 - Quoted Prices | Level 2 - Other Significant Observable Inputs | Level 3 - Significant Unobservable Inputs | Total | |||||||||||||
Common Stocks | ||||||||||||||||
Consumer Discretionary | $ | 1,309,499 | $ | 206,675,853 | $ | - | $ | 207,985,352 | ||||||||
Consumer Staples | 13,129,271 | 113,834,667 | - | 126,963,938 | ||||||||||||
Energy | 21,555,529 | - | 21,555,529 | |||||||||||||
Financials | 10,437,306 | 309,989,319 | - | 320,426,625 | ||||||||||||
Health Care | 1,240,985 | 154,171,428 | - | 155,412,413 | ||||||||||||
Industrials | 10,982,469 | 194,382,618 | - | 205,365,087 | ||||||||||||
Information Technology | - | 119,201,773 | - | 119,201,773 | ||||||||||||
Materials | - | 86,580,758 | - | 86,580,758 | ||||||||||||
Real Estate | - | 91,388,791 | - | 91,388,791 | ||||||||||||
Telecommunication Services | 2,115,713 | 69,838,577 | - | 71,954,290 | ||||||||||||
Utilities | - | 6,629,291 | - | 6,629,291 | ||||||||||||
|
|
|
|
|
|
|
| |||||||||
Total | $ | 39,215,243 | $ | 1,374,248,604 | $ | - | $ | 1,413,463,847 | ||||||||
|
|
|
|
|
|
|
| |||||||||
80
DOMINI IMPACT EQUITY FUND
DOMINI IMPACT INTERNATIONAL EQUITY FUND
NOTES TO FINANCIAL STATEMENTS (continued)
July 31, 2018
The following is a reconciliation of Level 3 assets for which significant unobservable inputs were used to determine fair value:
| Domini Impact Equity Fund | Domini Impact International Equity Fund | |||||||
Investments in Securities | ||||||||
Balance as of July 31, 2017 | $ | - | $ | - | ||||
Realized Gain (loss) | - | - | ||||||
Change in unrealized appreciation (depreciation) | 2 | (189,020) | ||||||
Purchases | - | - | ||||||
Sales | - | - | ||||||
Transfers in and/or out of Level Three | (2) | 189,020 | ||||||
|
|
|
| |||||
Balance as of July 31, 2018 | $ | - | $ | - | ||||
|
|
|
| |||||
The change in unrealized appreciation (depreciation) included in earnings relating to securities still held at July 31, 2018: | $ | - | $ | - | ||||
|
|
|
| |||||
For the Domini Impact Equity Fund transfers from Level 1 to Level 3 included securities valued at $10,414 that were transferred as a result of quoted prices in active markets not being readily available. Transfers out of Level 3 into Level 1 included securities valued at $10,416 because market values were readily available from a pricing agent for which fair value factors were previously applied.
For the Domini Impact International Equity Fund transfers from Level 1 to Level 3 included securities valued at $69,328,767 that were transferred as a result of quoted prices in active markets not being readily available. Transfers out of Level 3 into Level 1 included securities valued at $69,139,747 because market values were readily available from a pricing agent for which fair value factors were previously applied.
(B) Foreign Currency Translation. Securities and other assets and liabilities denominated in foreign currencies are translated into U.S. dollar amounts on the date of valuation. Purchases and sales of securities, and income and expense items denominated in foreign currencies, are translated into U.S. dollar amounts on the respective dates of such transactions. Occasionally, events impact the availability or reliability of foreign exchange rates used to convert the U.S. dollar equivalent value. If such an event occurs, the foreign exchange rate will be valued at fair value using procedures established and approved by the Board of Trustees. The Funds do not separately report the effect of fluctuations in foreign exchange rates from changes in market prices on securities held. Such fluctuations are included with the net realized and unrealized gain or loss from investments. Realized foreign exchange gains or losses arise from sales of
81
DOMINI IMPACT EQUITY FUND
DOMINI IMPACT INTERNATIONAL EQUITY FUND
NOTES TO FINANCIAL STATEMENTS (continued)
July 31, 2018
foreign currencies, currency gains or losses realized between the trade and settlement dates on securities transactions, and the difference between the recorded amounts of dividends, interest, and foreign withholding taxes and the U.S. dollar equivalent of the amounts actually received or paid. Net unrealized foreign exchange gains and losses arise from changes in fair value of assets and liabilities other than investments in securities held at the end of the reporting period, resulting from changes in exchange rates.
(C) Foreign Currency Contracts. When the Funds purchase or sell foreign securities, they enter into foreign exchange contracts to minimize foreign exchange risk from the trade date to the settlement date of the transactions. A foreign exchange contract is an agreement between two parties to exchange different currencies at an agreed-upon exchange rate on a specified date. The Domini Impact Equity Fund and the Domini Impact International Equity Fund had no open foreign currency spot contracts outstanding as of July 31, 2018.
(D) Investment Transactions, Investment Income and Dividends to Shareholders. The Funds earn income daily, net of Fund expenses. Dividends to shareholders of the Domini Impact International Equity Fund are usually declared and paid semiannually from net investment income. Dividends to shareholders of the Domini Impact Equity Fund are usually declared and paid quarterly from net investment income. Distributions to shareholders of realized capital gains, if any, are made annually. Distributions are determined in conformity with income tax regulations, which may differ from generally accepted accounting principles. Reclassifications have been made to the Funds’ components of net assets to reflect income and gains available for distribution (or available capital loss carryovers, as applicable) under income tax regulations.
Investment transactions are accounted for on trade date. Realized gains and losses from security transactions are determined on the basis of identified cost. Interest income is recorded on an accrual basis. Dividend income, net of any applicable withholding tax, is recorded on the ex-dividend date or for certain foreign securities, when the information becomes available to the Funds.
(E) Federal Taxes. Each Fund’s policy is to comply with the provisions of the Internal Revenue Code applicable to regulated investment companies and to distribute substantially all of its taxable income, including net realized gains, if any, within the prescribed time periods. Accordingly, no provision for federal income or excise tax is deemed necessary. As of July 31, 2018, tax years 2015 through 2018 remain subject to examination by the Funds’ major tax
82
DOMINI IMPACT EQUITY FUND
DOMINI IMPACT INTERNATIONAL EQUITY FUND
NOTES TO FINANCIAL STATEMENTS (continued)
July 31, 2018
jurisdictions, which include the United States of America, the Commonwealth of Massachusetts, and New York State.
(F) Redemption Fees. Redemptions and exchanges of Fund shares held less than 30 days may be subject to the Funds’ redemption fee, which is 2% of the amount redeemed. The fee is imposed to offset transaction costs and other expenses associated with short-term investing. The fee may be waived in certain circumstances at the discretion of the Funds. Such fees are retained by the Funds and are recorded as an adjustment to paid-in capital.
(G) Other. Income, expenses (other than those attributable to a specific class), gains, and losses are allocated on a daily basis to each class of shares based upon the relative proportion of net assets represented by such class. Operating expenses directly attributable to a specific class are charged against the operations of that class.
(H) Indemnification. The Funds’ organizational documents provide current and former trustees and officers with a limited indemnification against liabilities arising in connection with the performance of their duties to the Funds. In the normal course of business, the Funds may also enter into contracts that provide general indemnifications. The Funds’ maximum exposure under these arrangements is unknown as this would be dependent on future claims that may be made against the Funds. The risk of material loss from such claims is considered remote.
2. TRANSACTIONS WITH AFFILIATES
(A) Manager/Sponsor. The Funds have retained Domini Impact Investments LLC (Domini) to serve as investment manager and administrator. Domini is registered as an investment adviser under the Investment Advisers Act of 1940. The services provided by Domini consist of investment supervisory services, overall operational support, and administrative services. The administrative services include the provision of general office facilities and supervising the overall administration of the Funds. For its services under the Management Agreements, Domini receives from each Fund a fee accrued daily and paid monthly at the annual rate below of the respective Funds’ average daily net assets before any fee waivers:
| Domini Impact Equity Fund | 0.30% of the first $2 billion of net assets managed, | |
| (prior to May 1, 2017) | 0.29% of the next $1 billion of net assets managed, and | |
| 0.28% of net assets managed in excess of $3 billion |
83
DOMINI IMPACT EQUITY FUND
DOMINI IMPACT INTERNATIONAL EQUITY FUND
NOTES TO FINANCIAL STATEMENTS (continued)
July 31, 2018
| (effective May 1, 2017) | 0.245% of the first $250 million of net assets managed, | |
| 0.24% of the next $250 million of net assets managed, and | ||
| 0.235% of the next $500 million of net assets managed | ||
| 0.23% of net assets managed in excess of $1 billion | ||
| Domini Impact International Equity Fund | 1.00% of the first $250 million of net assets managed, | |
| (prior to May 1, 2017) | 0.94% of the next $250 million of net assets managed, and | |
| 0.88% of net assets managed in excess of $500 million | ||
| (effective May 1, 2017) | 0.97% of the first $250 million of net assets managed, | |
| 0.92% of the next $250 million of net assets managed, and | ||
| 0.855% of the next $500 million of net assets managed | ||
| 0.83% of net assets managed in excess of $1 billion |
Pursuant to a Sponsorship Agreement (with respect to the Domini Impact Equity Fund) Domini provides the Funds with the administrative personnel and services necessary to operate the Funds. In addition to general administrative services and facilities for the Funds similar to those provided by Domini under the Management Agreements, Domini answers questions from the general public and the media regarding the securities holdings of the Funds. For these services and facilities, Domini receives fees accrued daily and paid monthly from the Funds at the annual rate below of the respective Funds’ average daily net assets before any fee waivers:
| Domini Impact Equity Fund | 0.45% of the first $2 billion of net assets managed, | |
| 0.44% of the next $1 billion of net assets managed, and | ||
| 0.43% of net assets managed in excess of $3 billion |
Effective June 15, 2018, Domini agreed to reduce its fees and reimburse expenses to keep the aggregate annual operating expenses of the Equity Fund (excluding brokerage fees and commissions, interest, taxes, and other extraordinary expenses), at no greater than 1.09% of the average daily net assets of the Class A shares of the Fund through November 30, 2019, absent an earlier modification by Fund’s Board. For the period from November 30, 2017 through June 14, 2018, Domini agreed to waive certain fees and/or reimburse certain ordinary operating expenses in order to limit Class A share expense to 1.12%. Effective November 30, 2017, Domini agreed to reduce its fees and reimburse expenses to keep the aggregate annual operating expenses of the Equity Fund (excluding brokerage fees and commissions, interest, taxes, and other extraordinary expenses), at no greater than 0.74% of the average daily net assets of the Institutional shares of the Fund. This agreement will continue until November 30, 2018, absent an earlier modification by the Board of Trustees which oversee the Funds. For periods prior to November 30, 2017, Domini contractually agreed to reduce its fees and reimburse expenses to keep the aggregate annual operating expenses of the Equity Fund (excluding brokerage
84
DOMINI IMPACT EQUITY FUND
DOMINI IMPACT INTERNATIONAL EQUITY FUND
NOTES TO FINANCIAL STATEMENTS (continued)
July 31, 2018
fees and commissions, interest, taxes, and other extraordinary expenses), at no greater than 1.25%, 1.18%, 0.80%, and 0.90% of the average daily net assets of the Investor, Class A, Institutional, and Class R shares of the Equity Fund, respectively.
Effective June 15, 2018, Domini agreed to reduce its fees and reimburse expenses to keep the aggregate annual operating expenses of the International Fund (excluding brokerage fees and commissions, interest, taxes, and other extraordinary expenses), at no greater than 1.43% of the average daily net assets of the Class A shares of the Fund through November 30, 2019, absent an earlier modification by Fund’s Board. For the period from November 30, 2017 through June 14, 2018, Domini agreed to reduce its fees and reimburse expenses to keep the aggregate annual operating expenses of the International Fund (excluding brokerage fees and commissions, interest, taxes, and other extraordinary expenses), at no greater than 1.51% of the average daily net assets of the Class A shares of the International Fund. For periods prior to November 30, 2017, Domini contractually agreed to reduce its fees and reimburse expenses to keep the aggregate annual operating expenses of the International Fund (excluding brokerage fees and commissions, interest, taxes, and other extraordinary expenses), at no greater than 1.60%, 1.57%, and 1.27% of the average daily net assets of the Investor, Class A, and Institutional shares of the International Fund, respectively. Effective July 23, 2018, Domini agreed to reduce its fees and reimburse expenses to keep the aggregate annual operating expenses of the Equity Fund (excluding brokerage fees and commissions, interest, taxes, and other extraordinary expenses), at no greater than 1.15% of the average daily net assets of the Class Y shares of the Fund through November 30, 2019, absent an earlier modification by Fund’s Board.
For the year ended July 31, 2018, Domini waived fees and reimbursed expenses as follows:
| FEES WAIVED | EXPENSES REIMBURSED | |||||||
Domini Impact Equity Fund | $ | - | $ | 33,588 | ||||
Domini Impact International Equity Fund | - | - | ||||||
Fees waived and/or expenses reimbursed under the Expense Limitation Agreement are only recoverable by Domini and/or its affiliates in the current fiscal year to the extent actual Fund expenses are less than the contractual expense cap during such year.
As of July 31, 2018, Domini owned less than 1% of any class of the outstanding shares of each Fund.
85
DOMINI IMPACT EQUITY FUND
DOMINI IMPACT INTERNATIONAL EQUITY FUND
NOTES TO FINANCIAL STATEMENTS (continued)
July 31, 2018
(B) Submanager. Wellington Management Company LLP (Wellington), a Delaware limited liability partnership, provides investment submanagement services to the Funds on a day-to-day basis pursuant to Submanagement Agreements with Domini.
(C) Distributor. The Board of Trustees of the Funds has adopted a Distribution Plan with respect to the Funds’ Investor shares and Class A shares in accordance with Rule 12b-1 under the Act. DSIL Investment Services LLC, a wholly owned subsidiary of Domini (DSIL), acts as agent of the Funds in connection with the offering of Investor shares of the Funds pursuant to a Distribution Agreement. Under the Distribution Plan, the Funds pay expenses incurred in connection with the sale of Investor shares and Class A shares and pay DSIL a distribution fee at an aggregate annual rate not to exceed 0.25% of the average daily net assets representing the Investor shares and Class A shares. For the year ended July 31, 2018, fees waived were as follows:
| FEES WAIVED | ||||
Domini Impact Equity Fund Investor shares | $ | - | ||
Domini Impact Equity Fund Class A shares | 20,036 | |||
Domini Impact International Equity Fund Investor shares | - | |||
Domini Impact International Equity Fund Class A shares | - | |||
DSIL, the Funds’ Distributor, has received commissions related to the sales of fund shares. For the year ended ended July 31, 2018, DSIL received $3,536, and $20,229 from the Domini Impact Equity Fund Class A Shares, and the Domini Impact International Equity Fund Class A shares, respectively.
(D) Shareholder Service Agent. The Trust has retained Domini to provide certain shareholder services with respect to the Domini Impact Equity Fund, and Domini Impact International Equity Fund and their shareholders, which services were previously provided by BNY Asset Servicing (“BNY”) or another fulfillment and mail service provider and are supplemental to services currently provided by BNY, pursuant to a transfer agency agreement between each Fund and BNY. For these services, Domini receives fees from each Fund paid monthly at an annual rate of $4.00 per active account. For the year ended July 31, 2018, there were no fees waived.
(E) Trustees and Officers. Each of the Independent Trustees receives an annual retainer for serving as a Trustee of the Trust of $14,000. The Lead Independent Trustee and Chair of the Audit Committee receive an additional chairperson fee of $5,000. Each Independent Trustee also receives $1,500 for attendance at each meeting of the Board of the Trust (reduced to $625 in the event that a Trustee participates at an in-person meeting by telephone). In addition, each
86
DOMINI IMPACT EQUITY FUND
DOMINI IMPACT INTERNATIONAL EQUITY FUND
NOTES TO FINANCIAL STATEMENTS (continued)
July 31, 2018
Trustee receives reimbursement for reasonable expenses incurred in attending meetings. These expenses are allocated on a pro-rata basis to each shares class of a Fund according to their respective net assets.
As of July 31, 2018, all Trustees and officers of the Trust as a group owned less than 1% of each Fund’s outstanding shares.
3. INVESTMENT TRANSACTIONS
For the year ended July 31, 2018, cost of purchase and proceeds from sales of investments other than short-term obligations were as follows:
| PURCHASE | SALES | |||||||
Domini Impact Equity Fund | $ | 658,706,049 | $ | 779,092,281 | ||||
Domini Impact International Equity Fund | 1,234,735,209 | 856,170,099 | ||||||
4. SUMMARY OF SHARE TRANSACTIONS
As approved by the Board of Trustees, the Domini Impact Equity Fund Investor Shares effected a 1.9988601 for 1 share split and the Domini Impact Equity Fund Class A Shares and Domini Impact Equity Fund R Shares effected a 0.2155310 for 1 and 0.1555580 for 1 reverse share split, respectively on January 26, 2018. The net asset value of each share class increased or decreased proportionately at that time.
| Year Ended July 31, | ||||||||||||||||
| 2018 | 2017 | |||||||||||||||
| Shares | Amount | Shares | Amount | |||||||||||||
Domini Impact Equity Fund |
| |||||||||||||||
Investor Shares | ||||||||||||||||
Shares sold | 917,893 | $ | 29,370,549 | 689,761 | $ | 30,311,165 | ||||||||||
Shares issued in reinvestment of dividends and distributions | 838,545 | 36,957,120 | 321,526 | 14,002,465 | ||||||||||||
Shares redeemed | (3,320,197) | (101,150,879) | (2,255,487) | (98,661,333) | ||||||||||||
Redemption fees | - | 5,862 | - | 1,588 | ||||||||||||
Share increase from 1.9988601 for 1 share split | 14,659,938 | - | - | - | ||||||||||||
|
|
|
|
|
|
|
| |||||||||
Net increase (decrease) | 13,096,179 | $ | (34,817,348) | (1,244,200) | $ | (54,346,115) | ||||||||||
|
|
|
|
|
|
|
| |||||||||
87
DOMINI IMPACT EQUITY FUND
DOMINI IMPACT INTERNATIONAL EQUITY FUND
NOTES TO FINANCIAL STATEMENTS (continued)
July 31, 2018
| Year Ended July 31, | ||||||||||||||||
| 2018 | 2017 | |||||||||||||||
| Shares | Amount | Shares | Amount | |||||||||||||
Class A Shares | ||||||||||||||||
Shares sold | 58,766 | $ | 629,074 | 106,625 | $ | 764,838 | ||||||||||
Shares issued in reinvestment of dividends and distributions | 545,022 | 2,812,219 | 172,689 | 1,175,431 | ||||||||||||
Shares redeemed | (261,738) | (2,366,902) | (258,159) | (1,847,749) | ||||||||||||
Redemption fees | - | - | - | - | ||||||||||||
Share decrease from 0.2155310 for 1 reverse share split | (1,212,001) | - | - | - | ||||||||||||
|
|
|
|
|
|
|
| |||||||||
Net increase (decrease) | (869,951) | $ | 1,074,391 | 21,155 | $ | 92,520 | ||||||||||
|
|
|
|
|
|
|
| |||||||||
Institutional Shares | ||||||||||||||||
Shares sold | 399,455 | $ | 9,760,419 | 578,405 | $ | 13,512,200 | ||||||||||
Shares issued in reinvestment of dividends and distributions | 646,168 | 15,326,138 | 359,815 | 8,260,329 | ||||||||||||
Shares redeemed | (2,497,382) | (60,543,234) | (3,646,470) | (84,938,591) | ||||||||||||
Redemption fees | - | 802 | - | 3,273 | ||||||||||||
|
|
|
|
|
|
|
| |||||||||
Net increase (decrease) | (1,451,759) | $ | (35,455,875) | (2,708,250) | $ | (63,162,789) | ||||||||||
|
|
|
|
|
|
|
| |||||||||
Class R Shares | ||||||||||||||||
Shares sold | 155,216 | $ | 1,300,794 | 456,316 | $ | 2,707,451 | ||||||||||
Shares issued in reinvestment of dividends and distributions | 2,439,012 | 9,094,696 | 1,324,218 | 7,379,218 | ||||||||||||
Shares redeemed | (537,937) | (5,885,573) | (5,337,591) | (31,199,067) | ||||||||||||
Redemption fees | - | 6 | - | 536 | ||||||||||||
Share decrease from 0.1555580 for 1 reverse share split | (4,865,777) | - | - | - | ||||||||||||
|
|
|
|
|
|
|
| |||||||||
Net increase (decrease) | (2,809,486) | $ | 4,509,923 | (3,557,057) | $ | (21,111,862) | ||||||||||
|
|
|
|
|
|
|
| |||||||||
Total | ||||||||||||||||
Shares sold | 1,531,330 | $ | 41,060,836 | 1,831,107 | $ | 47,295,654 | ||||||||||
Shares issued in reinvestment of dividends and distributions | 4,468,747 | 64,190,173 | 2,178,248 | 30,817,443 | ||||||||||||
Shares redeemed | (6,617,254) | (169,946,588) | (11,497,707) | (216,646,740) | ||||||||||||
Redemption fees | - | 6,670 | - | 5,397 | ||||||||||||
Share increase from | 8,582,160 | - | - | - | ||||||||||||
|
|
|
|
|
|
|
| |||||||||
Net increase (decrease) | 7,964,983 | $ | (64,688,909) | (7,488,352) | $ | (138,528,246) | ||||||||||
|
|
|
|
|
|
|
| |||||||||
88
DOMINI IMPACT EQUITY FUND
DOMINI IMPACT INTERNATIONAL EQUITY FUND
NOTES TO FINANCIAL STATEMENTS (continued)
July 31, 2018
| Year Ended July 31, | ||||||||||||||||
| 2018 | 2017 | |||||||||||||||
| Shares | Amount | Shares | Amount | |||||||||||||
Domini Impact International Equity Fund |
| |||||||||||||||
Investor Shares | ||||||||||||||||
Shares sold | 39,894,020 | $ | 356,832,367 | 27,855,309 | $ | 221,158,105 | ||||||||||
Shares issued in reinvestment of dividends and distributions | 1,413,528 | 12,462,152 | 743,730 | 5,610,587 | ||||||||||||
Shares redeemed | (39,056,074) | (341,831,670) | (12,795,171) | (98,997,807) | ||||||||||||
Redemption fees | - | 11,010 | - | 9,524 | ||||||||||||
|
|
|
|
|
|
|
| |||||||||
Net increase (decrease) | 2,251,474 | $ | 27,473,859 | 15,803,868 | $ | 127,780,409 | ||||||||||
|
|
|
|
|
|
|
| |||||||||
Class A Shares | ||||||||||||||||
Shares sold | 3,331,819 | $ | 31,380,030 | 3,805,913 | $ | 31,187,717 | ||||||||||
Shares issued in reinvestment of dividends and distributions | 221,769 | 2,059,863 | 115,359 | 912,573 | ||||||||||||
Shares redeemed | (3,990,387) | (37,650,332) | (1,753,052) | (14,333,930) | ||||||||||||
Redemption fees | - | 2,370 | - | 1,059 | ||||||||||||
|
|
|
|
|
|
|
| |||||||||
Net increase (decrease) | (436,799) | $ | (4,208,069) | 2,168,220 | $ | 17,767,419 | ||||||||||
|
|
|
|
|
|
|
| |||||||||
Institutional Shares | ||||||||||||||||
Shares sold | 29,935,225 | $ | 266,559,969 | 26,497,994 | $ | 215,503,658 | ||||||||||
Shares issued in reinvestment of dividends and distributions | 870,749 | 7,646,549 | 287,709 | 2,185,044 | ||||||||||||
Shares redeemed | (8,085,636) | (71,451,343) | (5,435,327) | (42,234,019) | ||||||||||||
Redemption fees | - | 2,220 | - | 6,086 | ||||||||||||
|
|
|
|
|
|
|
| |||||||||
Net increase (decrease) | 22,720,338 | $ | 202,757,395 | 21,350,376 | $ | 175,460,769 | ||||||||||
|
|
|
|
|
|
|
| |||||||||
Class Y Shares | ||||||||||||||||
Shares sold | 16,332,872 | $ | 139,857,877 | - | $ | - | ||||||||||
Shares issued in reinvestment of dividends and distributions | - | - | - | - | ||||||||||||
Shares redeemed | (80,143) | (697,659) | - | - | ||||||||||||
Redemption fees | - | - | - | - | ||||||||||||
|
|
|
|
|
|
|
| |||||||||
Net increase (decrease) | 16,252,729 | $ | 139,160,218 | - | $ | - | ||||||||||
|
|
|
|
|
|
|
| |||||||||
Total | ||||||||||||||||
Shares sold | 89,493,936 | $ | 794,630,243 | 58,159,216 | $ | 467,849,480 | ||||||||||
Shares issued in reinvestment of dividends and distributions | 2,506,046 | 22,168,564 | 1,146,798 | 8,708,204 | ||||||||||||
Shares redeemed | (51,212,240) | (451,631,004) | (19,983,550) | (155,565,756) | ||||||||||||
Redemption fees | - | 15,600 | - | 16,669 | ||||||||||||
|
|
|
|
|
|
|
| |||||||||
Net increase (decrease) | 40,787,742 | $ | 365,183,403 | 39,322,464 | $ | 321,008,597 | ||||||||||
|
|
|
|
|
|
|
| |||||||||
89
DOMINI IMPACT EQUITY FUND
DOMINI IMPACT INTERNATIONAL EQUITY FUND
NOTES TO FINANCIAL STATEMENTS (continued)
July 31, 2018
5. FEDERAL TAX STATUS
The tax basis of the components of net assets for the Funds at July 31, 2018, is as follows:
| Domini Impact Equity Fund | Domini Impact International Equity Fund | |||||||
Undistributed ordinary income | $ | 14,091,309 | $ | 21,526,073 | ||||
Undistributed capital gains | 56,289,547 | 36,772,373 | ||||||
Unrealized appreciation/(depreciation) | 119,101,419 | 66,484,423 | ||||||
|
|
|
| |||||
Distributable net earnings/(deficit) | $ | 189,482,275 | $ | 124,782,869 | ||||
|
|
|
| |||||
The difference between components of Distributable Earnings on a tax basis and the amounts reflected in the statement of assets and liabilities is primarily due to differences in book and tax policies. For the year ended July 31, 2018, the Funds made the following reclassifications to the components of net assets to align financial reporting with tax reporting:
| Domini Impact Equity Fund | Domini Impact International Equity Fund | |||||||
Paid-in capital | $ | 3 | $ | 2 | ||||
Undistributed net investment income (loss) | (1,133,632) | 8,521,982 | ||||||
Accumulated net realized gain (loss) | 1,133,629 | (8,521,984) | ||||||
To the extent that the Funds realize net capital gains in the future, those gains may be offset by any unused net capital loss carryforwards. The Funds are permitted to carry forward a net capital loss from any taxable year that began on or before December 22, 2010 for eight years following the year of the loss. The Funds are permitted to carry forward net capital losses incurred in taxable years beginning after December 22, 2010, for an unlimited time period. Carryforwards of losses from taxable years that began after December 22, 2010, along with any other capital losses deferred and treated as recognized in any such year, are required to be utilized prior to carryforwards of losses incurred in taxable years that began on or before December 22, 2010. As a result of this ordering rule, carryforwards of losses from taxable years that began on or before December 22, 2010 may be more likely to expire unused. Losses from taxable years that begin after December 22, 2010 that are carried forward will retain their character as either short-term or long-term capital losses.
90
DOMINI IMPACT EQUITY FUND
DOMINI IMPACT INTERNATIONAL EQUITY FUND
NOTES TO FINANCIAL STATEMENTS (continued)
July 31, 2018
For federal income tax purposes, dividends paid were characterized as follows:
| Domini Impact Equity Fund | Domini Impact International Equity Fund | |||||||||||||||
| Year Ended July 31, | Year Ended July 31, | |||||||||||||||
| 2018 | 2017 | 2018 | 2017 | |||||||||||||
Ordinary income | $ | 12,405,096 | $ | 8,566,436 | $ | 33,891,806 | $ | 12,118,962 | ||||||||
Long-term capital gain | 54,018,023 | 23,410,947 | - | - | ||||||||||||
|
|
|
|
|
|
|
| |||||||||
Total | $ | 66,423,119 | $ | 31,977,383 | $ | 33,891,806 | $ | 12,118,962 | ||||||||
|
|
|
|
|
|
|
| |||||||||
The Funds are subject to the provisions of Accounting Standards Codification ASC 740 Income Taxes (ASC 740). ASC 740 sets forth a minimum threshold for financial statement recognition of the benefit of a tax position taken or expected to be taken in a tax return. The Funds did not have a liability to record for any unrecognized tax benefits in the accompanying financial statements. No provision has been made for taxes on income, capital gains or unrealized appreciation on securities held or for excise tax on income and capital gains.
6. SUBSEQUENT EVENTS
Effective December 1, 2018, SSGA Funds Management, Inc. (“SSGA”) will replace Wellington Management as the Domini Impact Equity Fund’s subadviser. SSGA will purchase and sell securities to implement Domini’s investment selections and manage the amount of the Fund’s assets to be held in short term investments. Domini, and not the Fund, will compensate SSGA for its services to the Fund.
Effective December 1, 2018, Domini will receive management fees at the following rates: 0.20% of the first $2 billion of net assets managed, 0.19% of the next $1 billion, and 0.18% of net assets managed in excess of $3 billion. The Fund’s sponsorship fee of 0.45% remains unchanged.
Effective as of December 1, 2018, Domini has contractually agreed to waive certain fees and/or reimburse certain ordinary operating expenses for each share class of the Equity Fund, in order to limit Investor, Class A, Institutional, and Class R share expenses to 1.09%, 1.09%, 0.74% and 0.80%, respectively, through November 30, 2019, absent an earlier modification by the Fund’s Board.
Effective August 1, 2018, each of the Independent Trustees receives an annual retainer for serving as a Trustee of the Trust of $23,000. Each Independent Trustee also receives $2,000 for attendance at each meeting of the Board of the Trust (reduced to $1,000 in the event that a Trustee participates at an in-person meeting by telephone).
91
DOMINI IMPACT EQUITY FUND
DOMINI IMPACT INTERNATIONAL EQUITY FUND
NOTES TO FINANCIAL STATEMENTS (continued)
July 31, 2018
7. OTHER RISKS
The Fund’s risks include, but are not limited to, some or all of the risks discussed below:
Foreign Securities Risk: The Fund’s investments in securities of foreign issuers or issuers with significant exposure to foreign markets involve additional risk. Foreign countries in which the Funds may invest may have markets that are less liquid, less regulated and more volatile than US markets. The value of the Funds’ investments may decline because of factors affecting the particular issuer as well as foreign markets and issuers generally, such as unfavorable government actions, and political or financial instability.
Liquidity Risk: The Funds may invest in instruments that trade in lower volumes and are less liquid than other investments. Liquidity risk includes the risk that the Funds may make investments that may become less liquid in response to market developments or adverse investor perceptions. Investments that are illiquid or that trade in lower volumes may be more difficult to value. When there is no willing buyer and investments cannot be readily sold at the desired time or price, the Funds may have to accept a lower price or may not be able to sell the instrument at all. An inability to sell a portfolio position can adversely affect the Funds’ value or prevent the Funds from being able to take advantage of other investment opportunities.
Market and Credit Risk: Securities markets may be volatile, and the market prices of the Funds’ securities may decline. Securities fluctuate in price based on changes in an issuer’s financial condition and overall market and economic conditions. If the market prices of the securities owned by the Funds fall, the value of an investment in the Funds will decline. Additionally, the Funds may also be exposed to credit risk in the event that an issuer or guarantor fails to perform or that an institution or entity with which the Funds has unsettled or open transactions defaults.
Emerging Markets Risk: The risks of foreign investments are greater for investments in or exposed to emerging markets. Emerging market countries typically have economic and political systems that are less fully developed, and can be expected to be less stable, than those of more developed countries. For example, the economies of such countries can be subject to rapid and unpredictable rates of inflation or deflation. Low trading volumes may result in a lack of liquidity and price volatility. Emerging market countries may have policies that restrict investment by non-US investors, or that prevent non-US investors from withdrawing their money at will.
92
Report of Independent Registered Public Accounting Firm
To the Shareholders and Board of Trustees
Domini Investment Trust:
Opinion on the Financial Statements
We have audited the accompanying statement of assets and liabilities of Domini Impact Equity Fund and Domini Impact International Equity Fund (collectively, the Funds), each a Fund within the series of the Domini Investment Trust, including the portfolios of investments, as of July 31, 2018, the related statements of operations for the year then ended, the statements of changes in net assets for each of the years in the two-year period then ended, and the related notes (collectively, the financial statements) and the financial highlights for each of the years or periods in the five-year period then ended. In our opinion, the financial statements and financial highlights present fairly, in all material respects, the financial position of the Funds as of July 31, 2018, the results of its operations for the year then ended, the changes in its net assets for each of the years in the two-year period then ended, and the financial highlights for each of the years or periods in the five-year period then ended, in conformity with U.S. generally accepted accounting principles.
Basis for Opinion
These financial statements and financial highlights are the responsibility of the Funds’ management. Our responsibility is to express an opinion on these financial statements and financial highlights based on our audits. We are a public accounting firm registered with the Public Company Accounting Oversight Board (United States) (PCAOB) and are required to be independent with respect to the Company in accordance with the U.S. federal securities laws and the applicable rules and regulations of the Securities and Exchange Commission and the PCAOB.
We conducted our audits in accordance with the standards of the PCAOB. Those standards require that we plan and perform the audit to obtain reasonable assurance about whether the financial statements and financial highlights are free of material misstatement, whether due to error or fraud. Our audits included performing procedures to assess the risks of material misstatement of the financial statements and financial highlights, whether due to error or fraud, and performing procedures that respond to those risks. Such procedures included examining, on a test basis, evidence regarding the amounts and disclosures in the financial statements and financial highlights. Such procedures also included confirmation of securities owned as of July 31, 2018, by correspondence with custodians and brokers. Our audits also included evaluating the accounting principles used and significant estimates made by management, as well as evaluating the overall presentation of the financial statements and financial highlights. We believe that our audits provide a reasonable basis for our opinion.

We have served as the auditor of one or more Domini investment companies since 1993.
Boston, Massachusetts
September 26, 2018
93
STATEMENT OF ASSETS AND LIABILITIES
July 31, 2018
ASSETS: | ||||
Investments at value (cost $184,778,454) | $ | 181,357,850 | ||
Cash | 1,131,988 | |||
Foreign currency (cost $355,022) | 355,057 | |||
Receivable for securities sold | 18,942,813 | |||
Collateral on certain derivative contracts | 1,042,320 | |||
Interest receivable | 977,164 | |||
Receivable for variation margin swaps | 940,045 | |||
Unrealized appreciation on OTC swap contracts | 208,131 | |||
Receivable for capital shares | 80,283 | |||
Cash held at other banks (cost $18,027) | 17,921 | |||
Unrealized appreciation on forward currency contracts | 9,171 | |||
Premium received for OTC swap contracts | 801 | |||
Receivable for variation margin futures | 797 | |||
|
| |||
Total assets | 205,064,341 | |||
|
| |||
LIABILITIES: | ||||
Payable for securities purchased | 43,332,779 | |||
Payable for capital shares | 3,825,022 | |||
Cash due to broker (cost $598,685) | 598,770 | |||
Premium paid swap contracts | 246,017 | |||
Collateral on certain derivative contracts | 190,000 | |||
Interest Payable | 132,737 | |||
Management fee payable | 77,953 | |||
Distribution fee payable | 42,648 | |||
Other accrued expenses | 34,804 | |||
Unrealized depreciation on forward currency contracts | 47,664 | |||
Dividend payable | 14,775 | |||
Payable for variation margin futures | 8,312 | |||
|
| |||
Total liabilities | 48,551,481 | |||
|
| |||
NET ASSETS | $ | 156,512,860 | ||
|
| |||
NET ASSETS CONSIST OF: | ||||
Paid-in capital applicable to shares of beneficial interest, unlimited number of $0.00001 par value shares authorized | $ | 159,877,130 | ||
Undistributed net investment income | 10,839 | |||
Accumulated net realized loss | (1,058,366) | |||
Net unrealized depreciation | (2,316,743) | |||
|
| |||
| $ | 156,512,860 | |||
|
| |||
NET ASSET VALUE PER SHARE | ||||
Investor Shares | ||||
Net assets | $ | 143,975,304 | ||
|
| |||
Outstanding shares of beneficial interest | 13,186,881 | |||
|
| |||
Net asset value and offering price per share* | $ | 10.92 | ||
|
| |||
Institutional Shares | ||||
Net assets | $ | 12,537,556 | ||
|
| |||
Outstanding shares of beneficial interest | 1,151,761 | |||
|
| |||
Net asset value and offering price per share* | $ | 10.89 | ||
|
|
* Redemption price is equal to net asset value less any applicable redemption fees retained by the Fund.
SEE NOTES TO FINANCIAL STATEMENTS
94
DOMINI IMPACT BOND FUND
STATEMENT OF OPERATIONS
For the Year Ended July 31, 2018
INCOME: | ||||
Interest income | $ | 5,023,857 | ||
|
| |||
EXPENSES: | ||||
Management fee | 497,935 | |||
Administrative fee | 387,250 | |||
Distribution fees – Investor shares | 365,182 | |||
Transfer agent fees – Investor shares | 167,442 | |||
Transfer agent fees – Institutional shares | 265 | |||
Accounting and custody fees | 135,455 | |||
Professional fees | 92,348 | |||
Registration – Investor shares | 40,723 | |||
Registration – Institutional shares | 25,974 | |||
Shareholder Service fees – Investor shares | 13,107 | |||
Shareholder Service fees – Institutional shares | 27 | |||
Shareholder communications | 12,224 | |||
Miscellaneous | 7,140 | |||
Trustees fees | 6,736 | |||
|
| |||
Total expenses | 1,751,808 | |||
Fees waived and expense reimbursed | (425,364) | |||
|
| |||
Net expenses | 1,326,444 | |||
|
| |||
NET INVESTMENT INCOME | 3,697,413 | |||
|
| |||
REALIZED AND UNREALIZED GAINS (LOSSES) | ||||
NET REALIZED GAIN (LOSS) FROM: | ||||
Investments | (418,567) | |||
Swap contracts | (579,971) | |||
Futures contracts | 334,142 | |||
Foreign currency | 16,773 | |||
|
| |||
Net realized gain (loss) | (647,623) | |||
NET CHANGES IN UNREALIZED APPRECIATION (DEPRECIATION) FROM: | ||||
Investments, futures and swap contracts | (4,187,255) | |||
Translation of assets and liabilities in foreign currencies | 44,472 | |||
|
| |||
Net change in unrealized appreciation (depreciation) | (4,142,783) | |||
|
| |||
NET REALIZED AND UNREALIZED GAIN (LOSS) | (4,790,406) | |||
|
| |||
NET DECREASE IN NET ASSETS RESULTING FROM OPERATIONS | $ | (1,092,993) | ||
|
| |||
SEE NOTES TO FINANCIAL STATEMENTS
95
DOMINI IMPACT BOND FUND
STATEMENTS OF CHANGES IN NET ASSETS
| Year Ended July 31, 2018 | Year Ended July 31, 2017 | |||||||
INCREASE IN NET ASSETS: | ||||||||
FROM OPERATIONS: | ||||||||
Net investment income (loss) | $ | 3,697,413 | $ | 3,047,376 | ||||
Net realized gain (loss) on investments | (647,623) | 174,072 | ||||||
Net change in unrealized appreciation (depreciation) on investments | (4,142,783) | (3,665,563) | ||||||
|
|
|
| |||||
Net Increase (Decrease) in Net Assets Resulting from Operations | (1,092,993) | (444,115) | ||||||
|
|
|
| |||||
DISTRIBUTIONS AND DIVIDENDS: | ||||||||
Dividends to shareholders from net investment income: | ||||||||
Investor shares | (3,430,176) | (2,931,223) | ||||||
Institutional shares | (234,362) | (106,025) | ||||||
Distributions to shareholders from net realized gain: | ||||||||
Investor shares | (85,947) | (667,809) | ||||||
Institutional shares | (4,073) | (20,200) | ||||||
Tax return of capital distribution: | ||||||||
Investor shares | - | (41,581) | ||||||
Institutional shares | - | (1,893) | ||||||
|
|
|
| |||||
Net Decrease in Net Assets from Distributions and Dividends | (3,754,558) | (3,768,731) | ||||||
|
|
|
| |||||
CAPITAL SHARE TRANSACTIONS: | ||||||||
Proceeds from sale of shares | 44,398,448 | 34,139,779 | ||||||
Net asset value of shares issued in reinvestment of distributions and dividends | 3,554,681 | 3,542,027 | ||||||
Payment for shares redeemed | (35,687,603) | (31,823,837) | ||||||
Redemption fee | 1,846 | 5,342 | ||||||
|
|
|
| |||||
Net Increase in Net Assets from Capital Share Transactions | 12,267,372 | 5,863,311 | ||||||
|
|
|
| |||||
Total Increase (Decrease) in Net Assets | 7,419,821 | 1,650,465 | ||||||
|
|
|
| |||||
NET ASSETS: | ||||||||
Beginning of period | $ | 149,093,039 | $ | 147,442,574 | ||||
|
|
|
| |||||
End of period | $ | 156,512,860 | $ | 149,093,039 | ||||
|
|
|
| |||||
Undistributed net investment income (loss) | $ | 10,839 | $ | (128,270) | ||||
|
|
|
| |||||
SEE NOTES TO FINANCIAL STATEMENTS
96
DOMINI IMPACT BOND FUND — INVESTOR SHARES
FINANCIAL HIGHLIGHTS
| Year Ended July 31, | ||||||||||||||||||||
| 2018 | 2017 | 2016 | 2015 | 2014 | ||||||||||||||||
For a share outstanding for the period: | ||||||||||||||||||||
Net asset value, beginning of period | $11.26 | $11.60 | $11.16 | $11.24 | $11.15 | |||||||||||||||
|
|
|
|
|
|
|
|
|
| |||||||||||
Income from investment operations: | ||||||||||||||||||||
Net investment income (loss) | 0.26 | 0.23 | 0.24 | 0.17 | 0.16 | |||||||||||||||
Net realized and unrealized gain (loss) on investments | (0.33) | (0.29) | 0.50 | (0.07) | 0.13 | |||||||||||||||
|
|
|
|
|
|
|
|
|
| |||||||||||
Total income (loss) from investment operations | (0.07) | (0.06) | 0.74 | 0.10 | 0.29 | |||||||||||||||
|
|
|
|
|
|
|
|
|
| |||||||||||
Less dividends and distributions: | ||||||||||||||||||||
Dividends to shareholders from net investment income | (0.26) | (0.23) | (0.24) | (0.17) | (0.16) | |||||||||||||||
Distributions to shareholders from net realized gain | (0.01) | (0.05) | (0.06) | (0.01) | (0.04) | |||||||||||||||
Tax return of capital 4 | - | (0.00) | 1 | - | - | - | ||||||||||||||
|
|
|
|
|
|
|
|
|
| |||||||||||
Total distributions | (0.27) | (0.28) | (0.30) | (0.18) | (0.20) | |||||||||||||||
|
|
|
|
|
|
|
|
|
| |||||||||||
Redemption fee proceeds 4 | 0.00 | 1 | 0.00 | 1 | 0.00 | 1 | 0.00 | 1 | 0.00 | 1 | ||||||||||
|
|
|
|
|
|
|
|
|
| |||||||||||
Net asset value, end of period | $10.92 | $11.26 | $11.60 | $11.16 | $11.24 | |||||||||||||||
|
|
|
|
|
|
|
|
|
| |||||||||||
Total return 2 | -0.74% | -0.32% | 6.73% | 0.89% | 2.59% | |||||||||||||||
Portfolio turnover | 326% | 386% | 297% | 348% | 120% | |||||||||||||||
Ratios/supplemental data (annualized): | ||||||||||||||||||||
Net assets, end of period (in millions) | $144 | $143 | $144 | $129 | $126 | |||||||||||||||
Ratio of expenses to average net assets | 0.87% | 3 | 0.93% | 3 | 0.93% | 3 | 0.95% | 3 | 0.95% | 3 | ||||||||||
Ratio of gross expenses to average net assets | 1.14% | 1.16% | 1.19% | 1.24% | 1.24% | |||||||||||||||
Ratio of net investment income to average net assets | 2.37% | 2.06% | 2.13% | 1.52% | 1.42% | |||||||||||||||
1 Amount represents less than $0.005 per share.
2 Not annualized for periods less than one year.
3 Reflects a waiver of fees by the Manager and the Distributor of the Fund.
4 Based on average shares outstanding.
SEE NOTES TO FINANCIAL STATEMENTS
97
DOMINI IMPACT BOND FUND — INSTITUTIONAL SHARES
FINANCIAL HIGHLIGHTS
| For the year ended July 31, | ||||||||||||||||||||
| 2018 | 2017 | 2016 | 2015 | 2014 | ||||||||||||||||
For a share outstanding for the period: | ||||||||||||||||||||
Net asset value, beginning of period | $11.23 | $11.57 | $11.14 | $11.23 | $11.15 | |||||||||||||||
|
|
|
|
|
|
|
|
|
| |||||||||||
Income from investment operations: | ||||||||||||||||||||
Net investment income (loss) | 0.30 | 0.27 | 0.27 | 0.20 | 0.19 | |||||||||||||||
Net realized and unrealized gain (loss) on investments | (0.34) | (0.29) | 0.49 | (0.09) | 0.12 | |||||||||||||||
|
|
|
|
|
|
|
|
|
| |||||||||||
Total income (loss) from investment operations | (0.04) | (0.02) | 0.76 | 0.11 | 0.31 | |||||||||||||||
|
|
|
|
|
|
|
|
|
| |||||||||||
Less dividends and distributions: | ||||||||||||||||||||
Dividends to shareholders from net investment income | (0.29) | (0.27) | (0.27) | (0.20) | (0.19) | |||||||||||||||
Distributions to shareholders from net realized gain | (0.01) | (0.05) | (0.06) | (0.01) | (0.04) | |||||||||||||||
Tax return of capital 4 | - | (0.00) | 1 | - | - | - | ||||||||||||||
|
|
|
|
|
|
|
|
|
| |||||||||||
Total distributions | (0.30) | (0.32) | (0.33) | (0.21) | (0.23) | |||||||||||||||
|
|
|
|
|
|
|
|
|
| |||||||||||
Redemption fee proceeds 4 | 0.00 | 1 | 0.00 | 1 | 0.00 | 1 | 0.01 | - | ||||||||||||
|
|
|
|
|
|
|
|
|
| |||||||||||
Net asset value, end of period | $10.89 | $11.23 | $11.57 | $11.14 | $11.23 | |||||||||||||||
|
|
|
|
|
|
|
|
|
| |||||||||||
Total return 2 | -0.36% | -0.13% | 6.96% | 1.10% | 2.80% | |||||||||||||||
Portfolio turnover | 326% | 386% | 297% | 348% | 120% | |||||||||||||||
Ratios/supplemental data (annualized): | ||||||||||||||||||||
Net assets, end of period (in millions) | $13 | $6 | $3 | $2 | $4 | |||||||||||||||
Ratio of expenses to average net assets | 0.57% | 3 | 0.62% | 3 | 0.63% | 3 | 0.65% | 3 | 0.65% | 3 | ||||||||||
Ratio of gross expenses to average net assets | 1.03% | 1.02% | 1.22% | 1.07% | 1.02% | |||||||||||||||
Ratio of net investment income to average net assets | 2.67% | 2.38% | 2.46% | 1.79% | 1.73% | |||||||||||||||
1 Amount represents less than $0.005 per share.
2 Not annualized for periods less than one year.
3 Reflects a waiver of fees by the Manager of the Fund.
4 Based on average shares outstanding.
SEE NOTES TO FINANCIAL STATEMENTS
98
DOMINI IMPACT BOND FUND
NOTES TO FINANCIAL STATEMENTS
July 31, 2018
1. ORGANIZATION AND SIGNIFICANT ACCOUNTING POLICIES
The Domini Impact Bond Fund (formerly Domini Social Bond Fund) (the “Fund”) is a series of the Domini Investment Trust (formerly Domini Social Investment Trust). The Trust is a Massachusetts business trust registered under the Investment Company Act of 1940 as an open-end management investment company. The Fund offers Investor Shares, Institutional Shares and Class Y shares. Institutional shares and Class Y shares were not offered prior to November 30, 2011, and June 15, 2018, respectively. As of July 31, 2018, the Class Y shares of the Bond Fund had not yet commenced operations. Each class of shares is sold at its offering price, which is net asset value. The Institutional shares may only be purchased by or for the benefit of investors that meet the minimum investment requirements, and fall within the following categories: endowments, foundations, religious organizations and other nonprofit entities, individuals, retirement plan sponsors, family office clients, certain corporate or similar institutions, or omnibus accounts maintained by financial intermediaries and that are approved by the Fund’s Distributor. Class Y shares may only be purchased through omnibus accounts held on the books of the Fund for financial intermediaries that have been approved by the Funds’ distributor. Each class of shares has identical rights and voting privileges with respect to the Fund in general and exclusive voting rights on matters that affect that class alone. Earnings, net assets, and net asset value per share may differ due to each class having its own expenses, such as transfer and shareholder servicing agent fees and registration fees, directly attributable to that class. Institutional shares are not subject to distribution fees. The Fund seeks to provide its shareholders with a high level of current income and total return by investing in bonds and other debt instruments that are consistent with the Fund’s social and environmental standards and the submanager’s security selection approach.
The preparation of financial statements in conformity with U.S. generally accepted accounting principles requires management to make estimates and assumptions that affect the reported amounts of assets and liabilities and disclosure of contingent liabilities at the date of the financial statements and the reported amounts of revenues and expenses during the reporting period. Actual results could differ from those estimates. The following is a summary of the Fund’s significant accounting policies.
(A) Valuation of Investments. Bonds and other fixed-income securities (other than obligations with maturities of 60 days or less) are valued on the basis of valuations furnished by an independent pricing service, use of which has been approved by the Board of Trustees of the Fund. In making such valuations, the
99
DOMINI IMPACT BOND FUND
NOTES TO FINANCIAL STATEMENTS (continued)
July 31, 2018
pricing service utilizes both dealer-supplied valuations and electronic data processing techniques that take into account appropriate factors such as institutional-size trading in similar groups of securities, yield, quality, coupon rate, maturity, type of issue, trading characteristics, and other market data, without exclusive reliance upon quoted prices or exchange or over-the-counter prices, since such valuations are believed to reflect more accurately the fair value of such securities. Short-term obligations of sufficient credit quality (maturing in 60 days or less) are valued at amortized cost, which constitutes fair value as determined by the Board of Trustees of the Fund. Securities (other than short-term obligations with remaining maturities of 60 days or less) for which there are no such quotations or valuations are valued at fair value as determined in good faith by or at the direction of the Fund’s Board of Trustees. The Fund follows a fair value hierarchy that distinguishes between (a) market participant assumptions developed based on market data obtained from sources independent of the reporting entity (observable inputs) and (b) the Fund’s own assumptions about market participant assumptions developed based on the best information available in the circumstances (unobservable inputs). These inputs are used in determining the value of the Fund’s investments and are summarized in the following fair value hierarchy:
Level 1 — quoted prices in active markets for identical securities
Level 2 — other significant observable inputs (including quoted prices for similar securities, interest rates, and evaluated quotation obtained from pricing services)
Level 3 — significant unobservable inputs (including the Fund’s own assumptions in determining the fair value of investments) The inputs or methodology used for valuing securities are not an indication of the risk associated with investing in those securities.
100
DOMINI IMPACT BOND FUND
NOTES TO FINANCIAL STATEMENTS (continued)
July 31, 2018
The following is a summary of the inputs used, as of July 31, 2018, in valuing the Fund’s assets carried at fair value:
| Level 1 - Quoted Prices | Level 2 - Other Significant Observable Inputs | Level 3 - Significant Unobservable Inputs | Total | |||||||||||||
Assets: | ||||||||||||||||
Long-Term Investments in Securities: | ||||||||||||||||
Mortgage Backed Securities | $ | - | $ | 85,521,012 | $ | - | $ | 85,521,012 | ||||||||
Corporate Bonds and Notes | - | 36,923,168 | - | 36,923,168 | ||||||||||||
Municipal Bonds | - | 18,511,246 | - | 18,511,246 | ||||||||||||
U.S. Government Agencies | - | 15,317,896 | - | 15,317,896 | ||||||||||||
Senior Floating Rate Interests | - | 9,429,265 | - | 9,429,265 | ||||||||||||
Foreign Government & Agency Securities | - | 2,519,524 | - | 2,519,524 | ||||||||||||
Asset Backed Securities | - | 1,320,938 | - | 1,320,938 | ||||||||||||
Certificates of Deposit | - | 494,941 | - | 494,941 | ||||||||||||
|
|
|
|
|
|
|
| |||||||||
Total Long-Term Securities | $ | - | $ | 170,037,990 | $ | - | $ | 170,037,990 | ||||||||
|
|
|
|
|
|
|
| |||||||||
Short Term Investments in Securities: | ||||||||||||||||
U.S. Government Agencies | - | 6,280,246 | - | 6,280,246 | ||||||||||||
Foreign Government & Agency Securities | - | 4,914,545 | - | 4,914,545 | ||||||||||||
Options Purchased | - | 125,069 | - | 125,069 | ||||||||||||
|
|
|
|
|
|
|
| |||||||||
Total Short-Term Securities | $ | - | $ | 11,319,860 | $ | - | $ | 11,319,860 | ||||||||
|
|
|
|
|
|
|
| |||||||||
Total Investment in Securities | $ | - | $ | 181,357,850 | $ | - | $ | 181,357,850 | ||||||||
|
|
|
|
|
|
|
| |||||||||
Other Financial Instruments: | ||||||||||||||||
Forward Currency Contracts | $ | - | $ | 9,171 | $ | - | $ | 9,171 | ||||||||
OTC Swap Contracts | - | 208,131 | - | 208,131 | ||||||||||||
Variation Margin Swap Contracts | - | 940,045 | - | 940,045 | ||||||||||||
Premium received for OTC Swap Contracts | - | 801 | - | 801 | ||||||||||||
Variation Margin Futures | - | 797 | - | 797 | ||||||||||||
|
|
|
|
|
|
|
| |||||||||
Total Other Financial Instruments | $ | - | $ | 1,158,945 | $ | - | $ | 1,158,945 | ||||||||
|
|
|
|
|
|
|
| |||||||||
Liabilities: | ||||||||||||||||
Other Financial Instruments: | ||||||||||||||||
Forward Currency Contracts | - | 47,664 | - | 47,664 | ||||||||||||
Premium paid Swap Contracts | - | 246,017 | - | 246,017 | ||||||||||||
Variation Margin Futures | - | 8,312 | - | 8,312 | ||||||||||||
|
|
|
|
|
|
|
| |||||||||
Total Other Financial Instruments | $ | - | $ | 301,993 | $ | - | $ | 301,993 | ||||||||
|
|
|
|
|
|
|
| |||||||||
101
DOMINI IMPACT BOND FUND
NOTES TO FINANCIAL STATEMENTS (continued)
July 31, 2018
The following is a reconciliation of Level 3 assets for which significant unobservable inputs were used to determine fair value:
Investments in Securities | ||||
Balance as of July 31, 2017 | $ | 159,360 | ||
Realized gain (loss) | - | |||
Change in unrealized appreciation (depreciation) | (8,999) | |||
Purchases | - | |||
Sales | - | |||
Transfers in and/or out of level three | (150,361) | |||
|
| |||
Balance as of July 31, 2018 | $ | - | ||
|
| |||
The change in unrealized appreciation (depreciation) included in earnings relating to securities still held at July 31, 2018 | $ | - | ||
|
|
Transfers from Level 2 to Level 3 included securities valued at $2,599,792 that were transferred as a result of quoted prices in active markets not being readily available. Transfers out of Level 3 into Level 2 included securities valued at $2,750,153 because market values were readily available from a pricing agent for which fair value factors were previously applied. The Level 3 security was valued using a pricing vendor other than the Fund’s primary pricing vendor.
(B) Foreign Currency Translation. Securities and other assets and liabilities denominated in foreign currencies are translated into U.S. dollar amounts on the date of valuation. Purchases and sales of securities, and income and expense items denominated in foreign currencies, are translated into U.S. dollar amounts on the respective dates of such transactions. Occasionally, events impact the availability or reliability of foreign exchange rates used to convert the U.S. dollar equivalent value. If such an event occurs, the foreign exchange rate will be valued at fair value using procedures established and approved by the Board of Trustees. The Funds do not separately report the effect of fluctuations in foreign exchange rates from changes in market prices on securities held. Such fluctuations are included with the net realized and unrealized gain or loss from investments. Realized foreign exchange gains or losses arise from sales of foreign currencies, currency gains or losses realized between the trade and settlement dates on securities transactions, and the difference between the recorded amounts of dividends, interest, and foreign withholding taxes and the U.S. dollar equivalent of the amounts actually received or paid. Net unrealized foreign exchange gains and losses arise from changes in fair value of assets and liabilities other than investments in securities held at the end of the reporting period, resulting from changes in exchange rates.
(C) Foreign Currency Contracts. When the Funds purchase or sell foreign securities they enter into foreign exchange contracts to minimize foreign
102
DOMINI IMPACT BOND FUND
NOTES TO FINANCIAL STATEMENTS (continued)
July 31, 2018
exchange risk from the trade date to the settlement date of the transactions. A foreign exchange contract is an agreement between two parties to exchange different currencies at an agreed-upon exchange rate on a specified date. The Fund had $1,557,758 outstanding in open foreign currency spot contracts as of July 31, 2018.
(D) Securities Purchased on a When-Issued or Delayed Delivery Basis. The Fund may invest in when-issued or delayed delivery securities where the price of the security is fixed at the time of the commitment but delivery and payment take place beyond customary settlement time. These securities are subject to market fluctuation, and no interest accrues on the security to the purchaser during this period. The payment obligation and the interest rate that will be received on the securities are each fixed at the time the purchaser enters into the commitment. Purchasing obligations on a when-issued or delayed delivery basis is a form of leveraging and can involve a risk that the yields available in the market when the delivery takes place may actually be higher than those obtained in the transaction, which could result in an unrealized loss at the time of delivery. The Fund establishes a segregated account consisting of liquid securities equal to the amount of the commitments to purchase securities on such basis.
(E) TBA Purchase and Forward Sale Commitments. The Fund may enter into TBA commitments to purchase or sell securities for a fixed price at a future date. TBA commitments are considered securities in themselves and involve a risk of loss if the value of the security to be purchase or sold declines or increases prior to the settlement date, which is in addition to the risk of decline in the value of the Fund’s other assets.
(F) Derivative Financial Instruments. The Fund may invest in derivatives in order to hedge market risks, or to seek to increase the Fund’s income or gain. Derivatives in certain circumstances may require that the Fund segregate cash or other liquid assets to the extent the Fund’s obligations are not otherwise covered through ownership of the underlying security, financial instrument, or currency. Derivatives involve special risks, including possible default by the other party to the transaction, illiquidity, and the risk that the use of derivatives could result in greater losses than if it had not been used. Some derivative transactions, including options, swaps, forward contracts, and options on foreign currencies, are entered into directly by the counterparties or through financial institutions acting as market makers (OTC derivatives), rather than being traded on exchanges or in markets registered with the Commodity Futures Trading Commission or the SEC.
103
DOMINI IMPACT BOND FUND
NOTES TO FINANCIAL STATEMENTS (continued)
July 31, 2018
(G) Option Contracts. The Fund may purchase or write option contracts primarily to manage and/or gain exposure to interest rate, foreign exchange rate and credit risk. An option is a contract entitling the holder to purchase or sell a specific amount of shares or units of an asset or notional amount of a swap (swaption), at a specified price. Options purchased are recorded as an asset while options written are recorded as a liability. Upon exercise of an option, the acquisition cost or sales proceeds of the underlying investment is adjusted by any premium received or paid. Upon expiration of an option, any premium received or paid is recorded as a realized gain or loss. Upon closing an option other than through expiration or exercise, the difference between the premium and the cost to close the position is recorded as a realized gain or loss. Purchased option contracts outstanding at July 31, 2018 are listed in the Fund’s Portfolio of Investments.
(H) Futures Contracts. The Fund may purchase and sell futures contracts based on various securities, securities indexes, and other financial instruments and indexes. The Fund intends to use futures contracts for hedging purposes. Futures contracts provide for the future sale by one party and purchase by another party of a specified amount of a specified security or financial instrument at a specified future time and at a specified price. When the Fund purchases or sells a futures contract, the Fund must allocate certain of its assets as an initial deposit on the contract. The futures contract is marked to market daily thereafter, and the Fund may be required to pay or entitled to receive additional “variation margin,” based on decrease or increase in the value of the futures contract. Future contracts outstanding at July 31, 2018 are listed in the Fund’s Portfolio of Investments.
(I) Forward Currency Contracts. The Fund may enter into forward currency contracts with counterparties to hedge the value of portfolio securities denominated in particular currencies against fluctuations in relative value or to generate income or gain. These contracts are used to hedge foreign exchange risk and to gain exposure on currency. The U.S. dollar value of forward currency contracts is determined using current forward exchange rates supplied by a quotation service. The fair value of the contract will fluctuate with changes in currency exchange rates. The contract is marked to market daily and the change in fair value is recorded as an unrealized gain or loss. The Fund records a realized gain or loss equal to the difference between the value of the contract at the time it was opened and the value at the time it was closed when the contract matures or by delivery of the currency. The Fund could be exposed to risk if the value of the currency changes unfavorably, if the counterparties to the contracts are unable to meet the terms of their contracts or if the Fund is unable to enter
104
DOMINI IMPACT BOND FUND
NOTES TO FINANCIAL STATEMENTS (continued)
July 31, 2018
into a closing position. Risk may exceed amounts recognized on the Statement of Assets and Liabilities. Forward currency contracts outstanding at July 31, 2018 are listed in the Fund’s Portfolio of Investments.
(J) Interest Rate Swap Contracts. The Fund may enter into interest rate swap contracts to hedge interest rate risk. An interest rate swap is an agreement between the Fund and a counterparty to exchange cash flows based on the difference between two interest rates, applied to a notional amount. Interest rate swap contracts are marked to market daily based upon quotations from an independent pricing service or market maker. Any change on an OTC interest rate swap is recorded as an unrealized gain or loss on the Statement of Assets and Liabilities. Daily fluctuations in the value of centrally cleared interest rate swaps are settled though a central clearing agent and are recorded in variation margin on the Statement of Assets and Liabilities and recorded as unrealized gain or loss. OTC and centrally cleared interest rate swap contracts outstanding at July 31, 2018, are listed in the Fund’s Portfolio of Investments.
(K) Credit Default Swap Contracts. The Fund may enter into credit default swap contracts primarily to manage and/or gain exposure to credit risk. A credit default swap is an agreement between the fund and a counterparty whereby the buyer of the contract receives credit protection and the seller of the contract guarantees the credit worthiness of a referenced debt obligation. These agreements may be privately negotiated in the over-the-counter market (“OTC credit default swaps”) or may be executed in a multilateral trade facility platform, such as a registered exchange (“centrally cleared credit default swaps”). The underlying referenced debt obligation may be a single issuer of corporate or sovereign debt, a credit index, or a tranche of a credit index. In the event of a default of the underlying referenced debt obligation, the buyer is entitled to receive the notional amount of the credit default swap contract from the seller in exchange for the referenced debt obligation, a net settlement amount equal to the notional amount of the credit default swap less the recovery value of the referenced debt obligation, or other agreed upon amount. For centrally cleared credit default swaps, required initial margins are pledged by the fund, and the daily change in fair value is accounted for as a variation margin payable or receivable on the Statements of Assets and Liabilities. Over the term of the contract, the buyer pays the seller a periodic stream of payments, provided that no event of default has occurred. Such periodic payments are accrued daily as an unrealized appreciation or depreciation until the payments are made, at which time they are realized. Payments received or paid to initiate a credit default swap contract are reflected on the Statements of Assets and Liabilities and represent compensating factors between stated terms
105
DOMINI IMPACT BOND FUND
NOTES TO FINANCIAL STATEMENTS (continued)
July 31, 2018
of the credit default swap agreement and prevailing market conditions (credit spreads and other relevant factors). These upfront payments are amortized over the term of the contract as a realized gain or loss on the Statements of Operations. OTC and centrally cleared credit default swap contracts outstanding at July 31, 2018 are listed in the Fund’s Portfolio of Investments.
(L) Master Agreements. The Fund is a party to ISDA (International Swaps and Derivatives Association, Inc.) Master Agreements that govern OTC derivative and foreign exchange contracts (Master Agreements) with certain counterparties entered into from time to time. The Master Agreements may contain provisions regarding, among other things, the parties’ general obligations, representations, agreements, collateral requirements, events of default and early termination. With respect to certain counterparties, in accordance with the terms of the Master Agreements, collateral posted to the Fund is held in a segregated account by the Fund’s custodian and with respect to those amounts which can be sold or repledged, are presented in the Fund’s portfolio. Collateral pledged by the Fund is segregated by the Fund’s custodian and identified in the Fund’s portfolio. Collateral can be in the form of cash or other marketable securities as agreed to by the Fund and the applicable counterparty. Collateral requirements are determined based on the Fund’s net position with each counterparty.
With respect to ISDA Master Agreements, termination events applicable to the counterparty include certain deteriorations in the credit quality of the counterparty. Termination events applicable to the Fund include failure of the Fund to maintain certain net asset levels and/or limit the decline in net assets over various periods of time. In the event of default or early termination, the ISDA Master Agreement gives the non-defaulting party the right to net and close-out all transactions traded, whether or not arising under the ISDA agreement, to one net amount payable by one counterparty to the other. However, absent an event of default or early termination, OTC derivative assets and liabilities are presented gross and not offset in the Statements of Assets and Liabilities. Early termination by the counterparty may result in an immediate payment by the Fund of any net liability owed to that counterparty under the ISDA agreement.
In a centrally cleared swap, while the Fund enters into an agreement with a clearing broker to execute contracts with a counterparty, the performance of the swap is guaranteed by the central clearinghouse, which reduces the Fund’s exposure to counterparty risk. The Fund is still exposed to the counterparty risk through the clearing broker and clearinghouse. The clearinghouse attempts to
106
DOMINI IMPACT BOND FUND
NOTES TO FINANCIAL STATEMENTS (continued)
July 31, 2018
minimize this risk to its participants through the use of mandatory margin requirements, daily cash settlements and other procedures. Likewise, the clearing broker reduces its risk through margin requirements and required segregation of customer balances.
(M) Investment Transactions, Investment Income, and Dividends to Shareholders. The Fund earns income daily, net of Fund expenses. Dividends to shareholders are usually declared daily and paid monthly from net investment income. Distributions to shareholders of realized capital gains, if any, are made annually. Distributions are determined in conformity with income tax regulations, which may differ from generally accepted accounting principles. Reclassifications have been made to the Fund’s components of net assets to reflect income and gains available for distribution (or available capital loss carryovers, as applicable) under income tax regulations. Investment transactions are accounted for on trade date. Realized gains and losses from security transactions are determined on the basis of identified cost. Interest income is recorded on an accrual basis.
(N) Federal Taxes. The Fund’s policy is to comply with the provisions of the Internal Revenue Code applicable to regulated investment companies and to distribute substantially all of its taxable income, including net realized gains, if any, within the prescribed time periods. Accordingly, no provision for federal income or excise tax is deemed necessary. As of July 31, 2018, tax years 2015 through 2018 remain subject to examination by the Fund’s major tax jurisdictions, which include the United States of America, the Commonwealth of Massachusetts, and New York State.
(O) Redemption Fees. Redemptions and exchanges of Fund shares held less than 30 days may be subject to the Fund’s redemption fee, which is 2% of the amount redeemed. The fee is imposed to offset transaction costs and other expenses associated with short-term investing. The fee may be waived in certain circumstances at the discretion of the Fund. Such fees are retained by the Fund and are recorded as an adjustment to paid-in capital.
(P) Other. Income, expenses (other than those attributable to a specific class), gains, and losses are allocated on a daily basis to each class of shares based upon the relative proportion of net assets represented by such class. Operating expenses directly attributable to a specific class are charged against the operations of that class.
(Q) Indemnification. The Fund’s organizational documents provide current and former trustees and officers with a limited indemnification against liabilities arising in connection with the performance of their duties to the Fund. In the
107
DOMINI IMPACT BOND FUND
NOTES TO FINANCIAL STATEMENTS (continued)
July 31, 2018
normal course of business, the Fund may also enter into contracts that provide general indemnifications. The Fund’s maximum exposure under these arrangements is unknown as this would be dependent on future claims that may be made against the Fund. The risk of material loss from such claims is considered remote.
2. TRANSACTIONS WITH AFFILIATES
(A) Manager/Administrator. The Fund has retained Domini Impact Investments LLC (Domini) to serve as investment manager and administrator. The services provided by Domini consist of investment supervisory services, overall operational support, and administrative services, including the provision of general office facilities and supervising the overall administration of the Fund. For its services under the Management Agreement, Domini receives from the Fund a fee accrued daily and paid monthly at the annual rate below of the Fund’s average daily net assets before any fee waivers:
| (prior to May 1, 2017) | 0.40% of the first $500 million of net assets managed, | |
| 0.38% of the next $500 million of net assets managed, and | ||
| 0.35% of net assets managed in excess of $1 billion | ||
| (effective May 1, 2017) | 0.33% of the first $50 million of net assets managed, | |
| 0.32% of the next $50 million of net assets managed, and | ||
| 0.315% of net assets managed in excess of $100 million |
For its services under the Administration Agreement, Domini receives from the Fund a fee accrued daily and paid monthly at an annual rate equal to 0.25% of the Fund’s average daily net assets.
Upon commencement of operations, Domini has agreed to reduce its fees and reimburse expenses to keep aggregate annual operating expenses of the Bond Fund (excluding brokerage fees and commission, interest, taxes, and other extraordinary expenses), at no greater than 0.65% of the average daily net assets of the Class Y shares of the Bond Fund, until November 30, 2019, absent an earlier modification by the Fund’s Board. Effective November 30, 2017, Domini agreed to reduce its fees and reimburse expenses to keep the aggregate annual operating expenses of the Bond Fund (excluding brokerage fees and commissions, interest, taxes, and other extraordinary expenses), at no greater than 0.87% and 0.57% of the average daily net assets of the Investor and Institutional shares of the Bond Fund, respectively. This agreement will continue until November 30, 2018, absent an earlier modification by the Board of Trustees which oversee the Funds. For periods prior to November 30, 2017, Domini contractually agreed to reduce its fees and reimburse expenses to keep the aggregate annual operating expenses of the Bond Fund (excluding brokerage
108
DOMINI IMPACT BOND FUND
NOTES TO FINANCIAL STATEMENTS (continued)
July 31, 2018
fees and commissions, interest, taxes, and other extraordinary expenses), at no greater than 0.95% and 0.65% of the average daily net assets of the Investor and Institutional shares of the Bond Fund, respectively. For the year ended July 31, 2018, Domini reimbursed expenses totaling $280,330.
Fees waived and/or expenses reimbursed under the Expense Limitation Agreement are only recoverable by Domini and/or its affiliates in the current fiscal year to the extent actual Fund expenses are less than the contractual expense cap during such year.
As of July 31, 2018, Domini owned less than 1% of any class of the outstanding Shares of the Fund.
(B) Submanager. Wellington Management Company LLP (Wellington), a Delaware limited liability partnership, provides investment management services to the Fund on a day-to-day basis pursuant to a submanagement agreement with Domini. Prior to January 7, 2015, Seix Investment Advisors LLC (“Seix”), a wholly owned subsidiary of RidgeWorth LLC (formerly known as RidgeWorth Capital Management, Inc.), and its predecessors, provided investment submanagement services to the Fund.
(C) Distributor. The Board of Trustees of the Fund has adopted a Distribution Plan in accordance with Rule 12b-1 under the Act. DSIL Investment Services LLC, a wholly owned subsidiary of Domini (DSIL), acts as agent of the Fund in connection with the offering of shares of the Fund pursuant to a Distribution Agreement. Under the Distribution Plan, the Fund pays expenses incurred in connection with the sale of Investor shares and pays DSIL a distribution fee at an aggregate annual rate not to exceed 0.25% of the average daily net assets representing the Investor shares. For the year ended July 31, 2018, fees waived by the Investor shares totaled $145,007.
(D) Shareholder Service Agent. The Trust has retained Domini to provide certain shareholder services to the Fund and its shareholders, which services were previously provided by BNY Asset Servicing (“BNY”) or another fulfillment and mail service provider and are supplemental to services currently provided by BNY, pursuant to a transfer agency agreement between each Fund and BNY. For these services, Domini receives a fee from the Fund paid monthly at an annual rate of $4.00 per active account. For the year ended July 31, 2018, Domini waived fees as follows:
| FEES WAIVED | ||||
Domini Impact Bond Fund Investor shares | $ | - | ||
Domini Impact Bond Fund Institutional shares | 27 | |||
109
DOMINI IMPACT BOND FUND
NOTES TO FINANCIAL STATEMENTS (continued)
July 31, 2018
(E) Trustees and Officers. Each of the Independent Trustees receives an annual retainer for serving as a Trustee of the Trust of $14,000. The Lead Independent Trustee and Chair of the Audit Committee receive an additional chairperson fee of $5,000. Each Independent Trustee also receives $1,500 for attendance at each meeting of the Board of the Trust (reduced to $625 in the event that a Trustee participates at an in-person meeting by telephone). In addition, each Trustee receives reimbursement for reasonable expenses incurred in attending meetings. These expenses are allocated on a pro-rata basis to each shares class of a Fund according to their respective net assets.
As of July 31, 2018, all Trustees and officers of the Trust as a group owned less than 1% of the Fund’s outstanding shares.
3. INVESTMENT TRANSACTIONS
For the year ended July 31, 2018, cost of purchase and proceeds from sales of investments other than short-term obligations were as follows:
| PURCHASES | SALES | |||||||
U.S. Government Securities | $ | 528,756,612 | $ | 518,450,080 | ||||
Investments in Securities | 26,790,786 | 21,868,858 | ||||||
110
DOMINI IMPACT BOND FUND
NOTES TO FINANCIAL STATEMENTS (continued)
July 31, 2018
4. SUMMARY OF SHARE TRANSACTIONS
| Year Ended July 31, | ||||||||||||||||
| 2018 | 2017 | |||||||||||||||
| Shares | Amount | Shares | Amount | |||||||||||||
Investor Shares | ||||||||||||||||
Shares sold | 3,190,767 | $ | 35,441,465 | 2,631,798 | $ | 29,586,950 | ||||||||||
Shares issued in reinvestment of dividends and distributions | 305,407 | 3,390,770 | 307,843 | 3,452,693 | ||||||||||||
Shares redeemed | (2,968,962) | (32,849,386) | (2,715,791) | (30,544,065) | ||||||||||||
Redemption fees | - | 1,022 | - | 5,008 | ||||||||||||
|
|
|
|
|
|
|
| |||||||||
Net increase (decrease) | 527,212 | $ | 5,983,871 | 223,850 | $ | 2,500,586 | ||||||||||
|
|
|
|
|
|
|
| |||||||||
Institutional Shares | ||||||||||||||||
Shares sold | 814,633 | $ | 8,956,983 | 405,346 | $ | 4,552,829 | ||||||||||
Shares issued in reinvestment of dividends and distributions | 14,878 | 163,911 | 7,977 | 89,334 | ||||||||||||
Shares redeemed | (255,924) | (2,838,217) | (113,635) | (1,279,772) | ||||||||||||
Redemption fees | - | 824 | - | 334 | ||||||||||||
|
|
|
|
|
|
|
| |||||||||
Net increase (decrease) | 573,587 | $ | 6,283,501 | 299,688 | $ | 3,362,725 | ||||||||||
|
|
|
|
|
|
|
| |||||||||
Total | ||||||||||||||||
Shares sold | 4,005,400 | $ | 44,398,448 | 3,037,144 | $ | 34,139,779 | ||||||||||
Shares issued in reinvestment of dividends and distributions | 320,285 | 3,554,681 | 315,820 | 3,542,027 | ||||||||||||
Shares redeemed | (3,224,886) | (35,687,603) | (2,829,426) | (31,823,837) | ||||||||||||
Redemption fees | - | 1,846 | - | 5,342 | ||||||||||||
|
|
|
|
|
|
|
| |||||||||
Net increase (decrease) | 1,100,799 | $ | 12,267,372 | 523,538 | $ | 5,863,311 | ||||||||||
|
|
|
|
|
|
|
| |||||||||
111
DOMINI IMPACT BOND FUND
NOTES TO FINANCIAL STATEMENTS (continued)
July 31, 2018
5. SUMMARY OF DERIVATIVE ACTIVITY
At July 31, 2018, the Fund’s investments in derivative contracts are reflected on the Statement of Assets and Liabilities as follows:
Asset Derivatives | Liability Derivatives | |||||||||||
| Derivative Contracts Not Accounted for as Hedging Instruments | Statement of Assets and Liabilities Location | Fair Value | Statement of Assets and Liabilities Location | Fair Value | ||||||||
Interest rate contracts | Variation Margin / Unrealized appreciation on OTC swap contracts/Net assets consist of - net unrealized appreciation | $ | 1,366,431 | Variation Margin / Unrealized depreciation on OTC swap contracts / Net assets consist of - net unrealized depreciation | $ | 212,408 | ||||||
Credit contracts | Variation Margin / Unrealized appreciation on OTC swap contracts / Net assets consist of - net unrealized appreciation (depreciation) | 7,101 | Variation Margin / Unrealized depreciation on OTC swap contracts / Net assets consist of - net unrealized appreciation (depreciation) | 12,948 | ||||||||
Foreign exchange contracts | Unrealized appreciation on forward currency contracts / Net assets consist of - net unrealized appreciation | 9,171 | Unrealized depreciation on forward currency contracts / Net assets consist of - net unrealized depreciation | 47,664 | ||||||||
Future contracts | Receivable for variation margin futures / Net assets consist of - net unrealized appreciation | 797 | Payable for variation margin futures / Net assets consist of - net unrealized depreciation | 8,312 | ||||||||
|
|
|
| |||||||||
Total | $ | 1,383,500 | $ | 281,332 | ||||||||
|
|
|
| |||||||||
112
DOMINI IMPACT BOND FUND
NOTES TO FINANCIAL STATEMENTS (continued)
July 31, 2018
For the year ended July 31, 2018, the effect of derivative contracts on the Fund’s Statement of Operations was as follows:
| Derivative Contracts Not Accounted for as Hedging Instruments | Statement of Operations Location | Realized Gain (Loss) | Change in Unrealized Appreciation (Depreciation) | |||||||
Interest rate contracts | Net realized gain (loss) from swap contracts/ Net change in unrealized appreciation (depreciation) from investments, futures and swap contracts | $ | (596,053 | ) | $ | 900,597 | ||||
Credit contracts | Net realized gain (loss) from swap contracts/ Net change in unrealized appreciation (depreciation) from investments, futures and swap contracts | 16,082 | 14,569 | |||||||
Foreign exchange contracts | Net realized gain (loss) from foreign currency/ Net change in unrealized appreciation (depreciation) from translation of assets and liabilities in foreign currencies | 16,773 | 40,561 | |||||||
Futures contracts | Net realized gain (loss) from futures contracts/ Net change in unrealized appreciation (depreciation) from investments, futures and swap contracts | 334,142 | (49,932 | ) | ||||||
Options purchases | Net realized gain (loss) from options contracts/ Net change in unrealized appreciation (depreciation) from investments, futures and swap contracts | - | 1,427 | |||||||
|
|
|
| |||||||
Total | $ | (229,056 | ) | $ | 907,222 | |||||
|
|
|
| |||||||
113
DOMINI IMPACT BOND FUND
NOTES TO FINANCIAL STATEMENTS (continued)
July 31, 2018
6. OFFSETTING OF FINANCIAL AND DERIVATIVE ASSETS AND LIABILITIES
The following table summarizes any derivatives, at the end of the reporting period, that are subject to a master netting agreement or similar agreement. For financial reporting purposes, the Fund does not offset assets and liabilities that are subject to the master netting agreements in the Statement of Assets and Liabilities.
| Credit Suisse International | Deutsche Bank AG | Morgan Stanley | Total | |||||||||||||
Assets: | ||||||||||||||||
Cash held at other banks | $ | 17,921 | $ | - | $ | - | $ | 17,921 | ||||||||
Unrealized appreciation on OTC swaps contracts* | - | 208,131 | - | 208,131 | ||||||||||||
Receivable for variation margin swaps | - | - | 1,165,401 | 1,165,401 | ||||||||||||
|
|
|
|
|
|
|
| |||||||||
Total Assets | $ | 17,921 | $ | 208,131 | $ | 1,165,401 | $ | 1,391,453 | ||||||||
Liabilities: | ||||||||||||||||
Cash due to broker | 17,193 | - | 581,577 | 598,770 | ||||||||||||
Payable for variation margin swaps | - | - | 225,356 | 225,356 | ||||||||||||
|
|
|
|
|
|
|
| |||||||||
Total Liabilities | $ | 17,193 | $ | - | $ | 806,933 | $ | 824,126 | ||||||||
|
|
|
|
|
|
|
| |||||||||
Total Derivative Net Assets | $ | 728 | $ | 208,131 | $ | 358,468 | $ | 567,327 | ||||||||
Total collateral received (pledged) | - | (190,000) | 1,042,320 | 852,320 | ||||||||||||
|
|
|
|
|
|
|
| |||||||||
Net Amount | $ | 728 | $ | 18,131 | $ | 1,400,788 | $ | 1,419,647 | ||||||||
|
|
|
|
|
|
|
| |||||||||
* Excludes premiums if any. Included in unrealized appreciation/depreciation on OTC swap contracts on the Statement of Assets and Liabilities.
7. SUMMARY OF DERIVATIVE ACTIVITY
The volume of activity for the reporting period for any derivative type that was held during the period is listed below and was as follows based on an average of the holdings at the end of each fiscal quarter:
Futures contracts (number of contracts) | 29 | |||
Forward currency contracts (contract amount) | $ | 3,531,157 | ||
OTC interest rate swap contracts (notional) | $ | 7,238,500 | ||
Centrally cleared interest rate swap contracts (notional) | $ | 37,891,750 | ||
Centrally cleared credit default contracts (notional) | $ | 3,849,500 |
8. FEDERAL TAX STATUS
The tax basis of the components of net assets at July 31, 2018 is as follows:
Undistributed ordinary income | $ | 38,476 | ||
Capital losses, other losses and other temporary differences | (945,977) | |||
Unrealized appreciation (depreciation) | (2,456,769) | |||
|
| |||
Distributable net earnings (deficit) | $ | (3,364,270) | ||
|
|
114
DOMINI IMPACT BOND FUND
NOTES TO FINANCIAL STATEMENTS (continued)
July 31, 2018
The difference between components of Distributable Earnings on a tax basis and the amounts reflected in the statement of assets and liabilities are primarily due to differences in book and tax policies.
For the year ended July 31, 2018, the Fund reclassified $106,234 from accumulated net realized gain (loss) to undistributed net investment income and $2 from accumulated net realized gain (loss) to paid in capital to align financial reporting and tax reporting.
During the period November 1, 2017 through July 31, 2018, the Domini Impact Bond Fund had net realized capital losses of $888,974. These losses are deferred and will be recognized on August 1, 2018, for tax purposes.
To the extent that the Fund realizes net capital gains in the future, those gains may be offset by any unused net capital loss carryforwards. The Fund is permitted to carry forward a net capital loss from any taxable year that began on or before December 22, 2010 for eight years following the year of the loss. The Fund is permitted to carry forward net capital losses incurred in taxable years beginning after December 22, 2010, for an unlimited time period. Carryforwards of losses from taxable years that began after December 22, 2010, along with any other capital losses deferred and treated as recognized in any such year, are required to be utilized prior to carryforwards of losses incurred in taxable years that began on or before December 22, 2010. As a result of this ordering rule, carryforwards of losses from taxable years that began on or before December 22, 2010 may be more likely to expire unused. Losses from taxable years that begin after December 22, 2010 that are carried forward will retain their character as either short-term or long-term capital losses.
For federal income tax purposes, dividends paid were characterized as follows:
| Year Ended | ||||||||
| 2018 | 2017 | |||||||
Ordinary income | $ | 3,664,538 | $ | 3,496,189 | ||||
Long-term capital gain | 90,020 | 229,068 | ||||||
Return of capital | - | 43,474 | ||||||
|
|
|
| |||||
Total | $ | 3,754,558 | $ | 3,768,731 | ||||
|
|
|
| |||||
The Fund is subject to the provisions of Accounting Standards Codification ASC 740 Income Taxes (ASC 740). ASC 740 sets forth a minimum threshold for financial statement recognition of the benefit of a tax position taken or expected to be taken in a tax return. The Fund did not have a liability to record for any unrecognized tax benefits in the accompanying financial statements. No
115
DOMINI IMPACT BOND FUND
NOTES TO FINANCIAL STATEMENTS (continued)
July 31, 2018
provision has been made for taxes on income, capital gains or unrealized appreciation on securities held or for excise tax on income and capital gains.
9. SUBSEQUENT EVENTS
Effective August 1, 2018, each of the Independent Trustees receives an annual retainer for serving as a Trustee of the Trust of $23,000. Each Independent Trustee also receives $2,000 for attendance at each meeting of the Board of the Trust (reduced to $1,000 in the event that a Trustee participates at an in-person meeting by telephone).
10. OTHER RISKS
The Fund’s risks include, but are not limited to, some or all of the risks discussed below:
Bond Obligations Risk: The Fund’s holdings, share price, yield and total return may fluctuate in response to bond market movements. The value of bonds may decline for issuer-related reasons, including management performance, financial leverage and reduced demand for the issuer’s goods and services. Certain types of fixed-income obligations also may be subject to “call and redemption risk,” which is the risk that the issuer may call a bond held by the Fund for redemption before it matures and the Fund may not be able to reinvest at the same level and therefore would earn less income.
Derivatives Risk: Derivatives involve special risks and costs and may result in losses to the Fund. The prices of derivatives may move in unexpected ways, especially in abnormal market conditions. Some derivatives are “leveraged” and therefore may magnify or otherwise increase investment losses to the Fund. The Fund’s use of derivatives may also increase the amount of taxes payable by shareholders. Other risks arise from the potential inability to terminate or close out of derivatives positions. A liquid secondary market may not always exist for the Fund’s derivatives positions. Generally, many OTC derivative instruments will not have liquidity beyond the counterparty to the instrument. OTC derivative instruments also involve the risk that the other party will not meet its obligations to the Fund.
Foreign Securities Risk: The Fund’s investments in securities of foreign issuers or issuers with significant exposure to foreign markets involve additional risk. Foreign countries in which the Fund may invest may have markets that are less liquid, less regulated and more volatile than US markets. The value of the Fund’s investments may decline because of factors affecting the particular issuer as well as foreign markets and issuers generally, such as unfavorable government actions, and political or financial instability.
116
DOMINI IMPACT BOND FUND
NOTES TO FINANCIAL STATEMENTS (continued)
July 31, 2018
Interest Rate Risk: The market price of the Fund’s investments will change in response to changes in interest rate and other factors. During periods of rising interest rates, the market price of fixed income instruments generally declines. As interest rates increase, slower than expected principal payments may extend the average life of securities, potentially locking in below-market interest rates and reducing the Fund’s value. In typical market interest rate environments, the prices of long-term debt obligations generally fluctuate more than prices of short-term debt obligations as interest rates change. Fluctuations in the market price of the Fund’s instruments will not affect interest income derived from the instruments already owned by the Fund, but will be reflected in the Fund’s NAV.
Liquidity Risk: The Fund may invest in instruments that trade in lower volumes and are less liquid than other investments. Liquidity risk includes the risk that the Fund may make investments that may become less liquid in response to market developments or adverse investor perceptions. Investments that are illiquid or that trade in lower volumes may be more difficult to value. When there is no willing buyer and investments cannot be readily sold at the desired time or price, the Fund may have to accept a lower price or may not be able to sell the instrument at all. An inability to sell a portfolio position can adversely affect the Fund’s value or prevent the Fund from being able to take advantage of other investment opportunities.
Market and Credit Risk: Securities markets may be volatile and the market prices of the Fund’s securities may decline. Securities fluctuate in price based on changes in an issuer’s financial condition and overall market and economic conditions. If the market prices of the securities owned by the Fund fall, the value of an investment in the Fund will decline. Additionally, the Fund may also be exposed to credit risk in the event that an issuer or guarantor fails to perform or that an institution or entity with which the Fund has unsettled or open transactions defaults.
Risks of Investments in Bank Loans: The Fund’s ability to receive payments of principal and interest and other amounts in connection with loans (whether through participations, assignments or otherwise) will depend primarily on the financial condition of the borrower. The failure by the Fund to receive scheduled interest or principal payments on a loan because of a default, bankruptcy or any other reason would adversely affect the income of the Fund and would likely reduce the value of its assets. Even with loans secured by collateral, there is the risk that the value of the collateral may decline, may be insufficient to meet the obligations of the borrower, or be difficult to liquidate. In the event of a default, the Fund may have difficulty collecting on any collateral and would not have the ability to collect on any collateral for an uncollateralized loan. Further, the Fund’s access to collateral, if any, may be limited by bankruptcy laws.
117
Report of Independent Registered Public Accounting Firm
To the Shareholders and Board of Trustees
Domini Investment Trust:
Opinion on the Financial Statements
We have audited the accompanying statement of assets and liabilities of Domini Impact Bond Fund (the Fund), a Fund within the series of the Domini Investment Trust, including the portfolio of investments, as of July 31, 2018, the related statement of operations for the year then ended, the statements of changes in net assets for each of the years in the two-year period then ended, and the related notes (collectively, the financial statements) and the financial highlights for each of the years in the five-year period then ended. In our opinion, the financial statements and financial highlights present fairly, in all material respects, the financial position of the Fund as of July 31, 2018, the results of its operations for the year then ended, the changes in its net assets for each of the years in the two-year period then ended, and the financial highlights for each of the years in the five-year period then ended, in conformity with U.S. generally accepted accounting principles.
Basis for Opinion
These financial statements and financial highlights are the responsibility of the Fund’s management. Our responsibility is to express an opinion on these financial statements and financial highlights based on our audits. We are a public accounting firm registered with the Public Company Accounting Oversight Board (United States) (PCAOB) and are required to be independent with respect to the Company in accordance with the U.S. federal securities laws and the applicable rules and regulations of the Securities and Exchange Commission and the PCAOB.
We conducted our audits in accordance with the standards of the PCAOB. Those standards require that we plan and perform the audit to obtain reasonable assurance about whether the financial statements and financial highlights are free of material misstatement, whether due to error or fraud. Our audits included performing procedures to assess the risks of material misstatement of the financial statements and financial highlights, whether due to error or fraud, and performing procedures that respond to those risks. Such procedures included examining, on a test basis, evidence regarding the amounts and disclosures in the financial statements and financial highlights. Such procedures also included confirmation of securities owned as of July 31, 2018, by correspondence with custodians and brokers. Our audits also included evaluating the accounting principles used and significant estimates made by management, as well as evaluating the overall presentation of the financial statements and financial highlights. We believe that our audits provide a reasonable basis for our opinion.
We have served as the auditor of one or more Domini investment companies since 1993.
Boston, Massachusetts
September 26, 2018
118
THE DOMINI FUNDS
TAX INFORMATION (UNAUDITED)
FOR THE YEAR ENDED JULY 31, 2018
The amount of long-term capital gains paid for the year ended July 31, 2018 was as follows:
Domini Impact Equity Fund | $ | 54,018,023 | ||
Domini Impact International Equity Fund | - | |||
Domini Impact Bond Fund | 90,020 |
For dividends paid from net investment income during the year ended July 31, 2018, the Funds designated the following as Qualified Dividend Income:
Domini Impact Equity Fund | $ | 15,404,612 | ||
Domini Impact International Equity Fund | 39,498,105 |
Of the ordinary distributions made by the Domini Impact Bond Fund during the fiscal year ended July 31, 2018, 41% has been derived from investments in US Government and Agency Obligations. All or a portion of the distributions from this income may be exempt from taxation at the state level. Consult your tax advisor for state specific information.
For corporate shareholders, 51% of dividends paid from net investment income for the Domini Impact Equity Fund were eligible for the corporate dividends received deduction.
| Foreign Tax Paid | Foreign Source Income | |||||||||||||||
| TOTAL | PER SHARE | TOTAL | PER SHARE | |||||||||||||
Domini Impact International Equity Fund | $ | 4,734,752 | $ | 0.03 | $ | 46,279,754 | $ | 0.29 | ||||||||
The foreign taxes paid or withheld per share represent taxes incurred by the Funds on interest and dividends received by the Fund from foreign sources. Foreign taxes paid or withheld should be included in taxable income with an offsetting deduction from gross income or as a credit for taxes paid to foreign governments. Consult your tax advisor regarding the appropriate treatment of foreign taxes paid.
119
APPROVAL OF CONTINUANCE OF MANAGEMENT AND SUBMANAGEMENT AGREEMENTS (UNAUDITED)
Section 15(c) of the Investment Company Act of 1940, as amended (the “1940 Act”) requires that each mutual fund’s board of trustees, including a majority of those trustees who are not “interested persons” of the mutual fund, as defined in the 1940 Act (the “Independent Trustees”), annually review and consider the fund’s investment management and submanagement agreements. At its meeting held on April 26, 2018, the Board of Trustees (“Board” or “Trustees”) of the Domini Investment Trust (the Trust”), including a majority of the Independent Trustees, voted to approve the continuance of: (i) the Amended and Restated Management Agreement with Domini Impact Investments LLC (“Domini”) for the Domini Impact Equity Fund (“Equity Fund”) and Domini Impact International Equity Fund (“International Fund”) and the Amended and Restated Management Agreement with respect to the Domini Impact Bond Fund (the “Bond Fund”)(each a “Management Agreement” and collectively, the “Management Agreements”) with Domini Impact Investments LLC (“Domini” or the “Adviser”), and (ii) the Amended and Restated Submanagement Agreement between Domini and Wellington Management Company LLP (“Wellington Management” or “Subadviser”) with respect to each of the Equity Fund and the International Fund and the Amended and Restated Submanagement Agreement between Domini and Wellington Management with respect to the Bond Fund (each a “Submanagement Agreement” and collectively, the “Submanagement Agreements” and with the Management Agreements, the “Agreements”). Equity Fund, International Fund and Bond Fund are each referred to as a “Fund” and collectively, the “Funds.”
Prior to the April 26, 2018, meeting, the Board requested, received, and reviewed written responses from Domini and Wellington Management to questions posed to them on behalf of the Independent Trustees and supporting materials relating to those questions and responses. The Board considered information furnished to the Board at its meetings throughout the year, as well as information specifically prepared in connection with the approval of the continuation of the Agreements at the Board’s meeting on April 26, 2018. Information provided to the Board at its meetings throughout the year included, among other things, reports on each Fund’s performance, legal and compliance matters, sales and marketing activity, shareholder services, and the other service provided to the Funds by Wellington Management and Domini and their affiliates. The Board considered the Management Agreements and the Submanagement Agreements separately in the course of its review. In doing so, the Board noted the respective roles of the Adviser and Subadviser in providing services to the Funds.
Throughout the process, the Board had the opportunity to ask questions of and request additional information from Domini and Wellington Management. The Board was assisted by legal counsel for the Trust and the Independent Trustees
120
were also separately assisted by independent legal counsel throughout the process. The Independent Trustees also received memoranda from counsel to the Trust discussing the legal standards for their consideration of the Agreements. The Independent Trustees were advised by and met in executive sessions with their independent legal counsel at which no representatives of management were present to discuss the proposed continuation of the Agreements, including prior to the April 26, 2018 meeting.
In connection with the Board’s consideration of the renewal of the Agreements with respect to each of the Funds, the Board received written materials in advance of the meeting, which included information regarding: (i) the nature, extent, and quality of services provided to the Funds by Domini and by Wellington Management; (ii) a description of Domini and Wellington Management’s investment management and other personnel and their background and experience; (iii) an overview of Domini’s and Wellington Management’s operations and financial condition; (iv) a comparison of each Funds’ advisory fee and overall expenses with those of comparable mutual funds selected by Strategic Insight, a third party provider of mutual fund data; (v) performance information for comparable mutual funds and for comparatively managed accounts, if any; (vi) the level of profitability from Domini and Wellington Management’s relationships with the Funds; (vii) a description of Domini’s and Wellington’s brokerage practices (including any soft dollar arrangements); and (viii) Domini’s and Wellington Management’s compliance policies and procedures, including policies and procedures for personal securities transactions and with respect to cybersecurity and business continuity and disaster recovery.
In reaching their determination to approve the continuance of the Management Agreements and Submanagement Agreements with respect to each Fund, the Trustees reviewed and evaluated information and a variety of factors that they believed relevant and appropriate through the exercise of their reasonable business judgment. The Trustees’ determination to continue each of the Agreements was based on a comprehensive consideration of all information provided to the Board throughout the year and specifically with respect to the continuation or approval of such Agreements, as applicable.
APPROVAL OF THE MANAGEMENT AGREEMENTS
The primary factors and the conclusions regarding the Management Agreements with respect to each Fund are described below. The Board did not identify any particular information or factor that was all-important or controlling, and each Trustee may have weighted certain factors differently. The Board noted that the evaluation process with respect to Domini and the Management Agreements is an ongoing one. In evaluating the Management Agreements, the Trustees also took into account their knowledge of Domini, its services and the Funds resulting from their meetings and other information and
121
interactions in past years. The Board also considered other factors (including conditions and trends prevailing generally in the economy, the securities markets and the industry).
Nature, Quality, and Extent of Services Provided. The Trustees reviewed information and materials provided by Domini related to the Management Agreement with respect to each Fund, including the Agreement, Domini’s Form ADV, a description of the firm and its organizational and management structure, its operational history and its legal and regulatory history, the manner in which investment decisions are made and executed, the financial condition of Domini and its ability to provide the services required under the Management Agreements, an overview of the personnel that perform services for the Funds, and Domini’s compliance policies and procedures. The Board also considered Domini’s risk management processes and its policies and procedures with respect to cybersecurity, business continuity and disaster recovery.
The Trustees reviewed the terms of the Management Agreements and considered that, pursuant to each Management Agreement, Domini, subject to the direction of the Board, is responsible for providing advice and guidance with respect to each of the Funds and for managing the investment of the assets of each Fund, which it does by engaging and overseeing the activities of Wellington Management. It was noted that Domini applies its social and environmental standards to a universe of securities provided by Wellington Management and that Wellington Management provides the day-to-day portfolio management of each Fund, including making purchases and sales of socially screened portfolio securities consistent with each such Fund’s investment objective and policies.
The Trustees considered the scope and the quality of the services provided by Domini to each Fund under the respective Management Agreement. They considered the professional experience, tenure, and qualifications of the investment management team and the other senior personnel at Domini who are responsible for the management of the Funds, including the oversight of Wellington Management. They also considered Domini’s capabilities and experience in the development and application of social and environmental investment standards and its reputation and leadership in the socially responsible investment community. The Trustees considered the information they had received from Domini concerning the professional experience of its social research team. They noted that the senior members of Domini’s research team had years of experience in the development and application of social and environmental investment standards. The terms of the Management Agreements were also reviewed by the Trustees. It was noted that no change to services was proposed. In addition, they considered Domini’s compliance record. The Trustees also noted that, on a regular basis, it receives information from the Trust’s Chief Compliance Officer (CCO) regarding Domini’s compliance
122
policies and procedures, including its Code of Ethics. The Trustees also took into account that the scope of services provided by Domini and the undertakings required of Domini in connection with those services, including maintaining and monitoring its own and the Funds’ compliance programs, had expanded over time as a result of regulatory, market and other developments. In this regard, they considered Domini’s preparation with respect to the reporting modernization and liquidity risk management requirements required by new SEC regulations. They also considered the quality of Domini’s compliance oversight program with respect to the Funds’ service providers, including Wellington Management. They also considered both the investment advisory services and the nature, quality and extent of the administrative and other non-advisory services, including shareholder servicing and distribution support services, which are provided to the Funds and its shareholders by Domini and its affiliates.
The Trustees noted that Domini administers each Fund’s business and other affairs pursuant to the Agreements, and with respect to the Equity Fund, also pursuant to a Sponsorship Agreement and with respect to the Bond Fund, also pursuant to an Administration Agreement. It was noted that, among other things, Domini provides each Fund with office space, administrative services and personnel as are necessary for operations, and that Domini pays all of the compensation of the officers and the Trustees who are not Independent Trustees. The Trustees considered the quality of the administrative services Domini provided to each Fund, including Domini’s role in coordinating and monitoring the activities of service providers. They noted that they were satisfied with the quality of the management and administrative services provided by Domini to each Fund, particularly Domini’s oversight of Wellington Management and development and application of social and environmental investment standards.
Based on the foregoing, the Trustees concluded that they were satisfied with the nature, quality and extent of services provided by Domini to each Fund under the respective Management Agreement.
Performance Information. The Trustees considered the investment performance of each of the Funds. They considered whether the Funds had operated within their respective investment objectives, as well as their compliance with their investment restrictions. Among other performance data considered, the Trustees reviewed the net investment performance of each of the Funds based on data provided to them by Domini for the year to date, 6-month, and 1-, 3-, 5- and 10-year periods ended December 31, 2017 and February 28, 2018, as well as each Fund’s performance for each full calendar year since inception and cumulative performance through December 31, 2017 and February 28, 2018. The Trustees also were reviewed the Funds’ more recent performance through March 31, 2018. The Trustees compared these investment returns to the returns of each Fund’s respective benchmark for the same periods. The Trustees also
123
compared each Fund’s Investor shares’ net investment returns for the 1-, 3-, 5-, and 10-year periods as of February 28, 2018 to the performance of a peer group of socially responsible (SRI) funds and non-SRI Funds, if any, as identified by Strategic Insight, a third-party data provider.
Among other performance data considered, the Trustees took into account the following:
Equity Fund
The Trustees noted that the Fund’s Investor shares’ net investment returns were positive for each of the 1-, 3-, 5- and 10-year periods ended December 31, 2017 but lagged the benchmark for all such periods.
The Trustees also considered that the Equity Fund’s Investor shares had positive net investment performance for all periods ended February 28, 2018, but had underperformed relative to the applicable SRI peer group for the 1-, 3-, 5- and 10- year periods ended February 28, 2018 compared to the group’s average and median performance for the same period.
The Trustees considered recent market conditions. The Trustees took into account Domini’s discussion of the Fund’s performance relative to its peers and benchmark, including the performance of the quantitative model and the factors that contributed to the Fund’s underperformance. The Board also noted prior actions taken to address the Fund’s performance, as well as plans to address the Fund’s performance going forward. The Trustees concluded that they had continued confidence in Domini’s overall capability to manage the Equity Fund but would continue to monitor the performance of the Fund.
International Fund
The Trustees noted that the International Fund’s Investor shares’ net investment returns were positive for the 1-, 3-, 5-, and 10-year periods ended December 31, 2017 and had outperformed relative to the Fund’s benchmark for the 3-, 5- and 10-year periods ended December 31, 2017 and had underperformed for the 1-year period.
The Trustees also considered that, based on data provided by Strategic Insight, the International Fund’s Investor shares had positive net investment returns for all periods ended February 28, 2018, and outperformed the applicable SRI peer group median for the 5- and 10-year periods and underperformed the SRI peer group average for the 1-, 3-, 5- and 10-year periods while outperforming the non-SRI peer group’s average and median performance for the 3-, 5- and 10-year periods and underperforming the non-SRI peer group’s median and average for the 1-year period.
The Trustees considered the recent market conditions and Domini’s discussion of the Fund’s performance over various periods, including the performance of
124
its quantitative model and noted management’s discussion of the Fund’s strong performance over the longer term. The Trustees concluded that they had continued confidence in Domini’s overall capability to manage the International Fund.
Bond Fund
The Trustees noted that the Bond Fund’s Investor shares had positive net investment performance for the 1-, 3- 5- and 10-year periods ended December 31, 2017, and had outperformed relative to the Fund’s benchmark for the 1-year and 3-year periods ended December 31, 2017 and underperformed for the 5- and 10-year periods.
The Trustees also considered that, based on data provided by Strategic Insight, the Bond Fund’s Investor shares had outperformed the applicable SRI and non-SRI peer groups compared to each group’s median performance for the 1- and 3-year periods, as well as the SRI peer group’s average performance for the 3-year period and underperformed the median of the SRI and non-SRI peer groups for the 5- and 10-year periods, and the average of the non-SRI peer group for the 3-year period and the average of both peer groups for the 1- , 5- and 10-year periods.
The Trustees considered that Wellington Management commenced submanagement of the Fund in January 2015 and that the benchmark for the Fund had been changed to the Barclays U.S. Aggregate Bond Index at that time. The Trustees considered the information provided to them by Domini and Wellington Management regarding recent market conditions and the impact of the legacy performance of the Bond Fund. The Trustees noted the relatively short performance record since Wellington Management began managing the Fund. The Trustees concluded that they had continued confidence in Domini’s overall capability to manage the Bond Fund but would continue to monitor the performance of the Fund.
Fees and Other Expenses. The Trustees considered the management fees paid by each Fund to Domini, the submanagement fees paid by Domini to Wellington Management with respect to each Fund, the portion of the fees retained by Domini, and Domini’s contractual expense limitation arrangement with respect to each Fund. It was noted that the management fee for each Fund was lowered in 2017. The Trustees also considered the sponsorship fee rate paid by the Equity Fund to Domini under the Sponsorship Agreement and the administrative fee paid by the Bond Fund to Domini under the Administration Agreement and the services provided under each such agreement. The Board took into account management’s discussion of the Funds’ expenses, as well as of the management fee structure with respect to each Fund.
The Trustees also considered the information provided to them by Strategic Insight regarding the level of the each Fund’s management fee (aggregate of any
125
sponsorship or administrative fee, as applicable) versus the aggregate advisory and administrative fees for the relevant Strategic Insight peer groups of SRI and non-SRI funds and compared each Fund’s total expense ratio, after giving effect to contractual fee waiver arrangements, to the total expense ratio of those peers. The Trustees also considered that Domini (and not the Funds) pays Wellington Management from its advisory fee.
Among other expense data considered, the Trustees took into account the following:
Equity Fund
Based on the information provided by Strategic Insight, the Trustees noted that the aggregate management and sponsorship fees for the Equity Fund’s Investor shares, after giving effect to Domini’s contractual fee waiver arrangement, were higher than the median advisory and administrative fees of its SRI peer group net of applicable waivers but lower than the average. They also considered that the total expense ratio of the Equity Fund’s Investor shares, after giving effect to the applicable contractual expense waivers, was lower than the median and average total expense ratio of the peer groups after waivers.
International Fund
Based on the information provided by Strategic Insight, the Trustees considered that the aggregate management fees for the International Fund’s Investor shares, after giving effect to Domini’s waiver of a portion of its management fees (which includes administrative fees), were higher relative to the median advisory and administrative fees of the SRI and non-SRI peer groups net of applicable waivers. They also noted that the total expense ratio of the International Fund’s Investor shares, after giving effect to waiver arrangements, was higher relative to the median total expense ratio of the SRI and non-SRI peer groups but similar to the average total expense ratio of the SRI peer group.
Bond Fund
Based on the information provided by Strategic Insight, the Trustees considered that the aggregate management and administrative fees for the Bond Fund’s Investor shares, after giving effect to applicable waivers of a portion of its management and administrative fees, were lower than the median advisory and administrative fees of the relevant SRI peer group and above the median for the non-SRI peer group, after waivers. They also noted that the total expense ratio of the Bond Fund’s Investor shares, after giving effect to applicable contractual expense waivers, was lower than the median total expense ratio of the SRI peer group and above the non-SRI peer group, after waivers.
Based on the foregoing, the Trustees concluded that management fees payable by each of the Funds were fair and reasonable in relation to the nature and quality of services provided and supported approval of the continuance of the Agreement.
126
Costs of Services Provided and Profitability. The Trustees reviewed information provided to them by Domini concerning the costs borne by and profitability of Domini in respect of its management relationship with each Fund and sponsorship relationship with the Equity Fund and administrative relationship with the Bond Fund for the 2017 calendar year, along with a description of the methodology used by Domini in preparing the profitability information. The Trustees also reviewed the financial results realized by Domini in connection with the operations of each Fund for December 31, 2017. The Trustees also considered that Domini had entered into expense limitation arrangements with respect to the Funds. The Trustees concluded that they were satisfied that the level of profitability of Domini and its affiliates with respect to the services provided to each Fund was not excessive in view of the nature, quality and extent of services provided.
Economies of Scale. The Trustees also considered whether economies of scale would be realized by Domini as each Fund’s assets increased and the extent to which such economies of scale were reflected in the fees charged with respect to each Fund under the Agreements. The Trustees noted that there were breakpoints in the fee schedules with respect to each Fund. The Trustees concluded that breakpoints were an effective way to share economies of scale and that this was a positive factor in support of the approval of the continuance of the Agreement.
Other Benefits. The Trustees considered the other benefits that Domini and its affiliates receive from their relationship with each Fund. The Trustees also considered the fees payable to Domini under the Sponsorship Agreement and under the Administration Agreement. The Trustees considered that Domini’s profitability would be lower if the benefits described above were not received. The Trustees considered the brokerage practices of Domini and noted that, based on information provided to them, Domini may receive the benefits of “soft dollar” commissions with respect to equity funds but that Domini did not currently receive the benefits of “soft dollar” commissions with respect to the Equity or International Funds. The Trustees also considered the intangible benefits that may accrue to Domini and its affiliates by virtue of their relationship with the Funds. The Trustees concluded that the benefits received by Domini and its affiliates, as outlined above, were reasonable in the context of the relationship between Domini and each of the Funds, and supported the approval of the continuance of the Agreement.
APPROVAL OF THE SUBMANAGEMENT AGREEMENTS
The primary factors and the conclusions regarding the Submanagement Agreements with respect to each Fund are described below. The Trustees did not identify any particular information or factor that was all-important or controlling, and each Trustee may have weighted certain factors differently. The Trustees noted that the evaluation process with respect to Wellington Management and the Submanagement Agreements is an ongoing one. In
127
evaluating the Submanagement Agreements, the Trustees also took into account their knowledge of Wellington Management, its services and the Funds resulting from their meetings and other information and interactions in past years. The Trustees also took into account the recommendations and performance evaluations of Domini with respect to Wellington Management. The Trustees also considered other factors (including conditions and trends prevailing generally in the economy, the securities markets and the industry).
Nature, Quality, and Extent of Services Provided. The Trustees reviewed information and materials provided by Wellington Management related to the Agreement with respect to each Fund, including the Submanagement Agreement, Wellington Management’s Form ADV, a description of the firm and its organizational and management structure, its operational history and its legal and regulatory history, the manner in which investment decisions are made and executed, the financial condition of Wellington Management and its ability to provide the services required under the Submanagement Agreements, an overview of the personnel that perform services for the Funds, and Wellington Management’s compliance policies and procedures. The Board also considered Wellington Management’s risk management processes and its policies and procedures with respect to cybersecurity, business continuity and disaster recovery.
The Trustees reviewed the terms of each of the Agreement and considered the scope and quality of the services provided by Wellington Management to each Fund under the respective Agreement. The Trustees noted that pursuant to Amended and Restated Management Agreements between each Fund and Domini, Domini, subject to the direction of the Board, is responsible for providing advice and guidance with respect to each Fund and for managing the investment of the assets of each Fund, which it does by engaging and overseeing the activities of Wellington Management. It was noted that Domini applies its social and environmental standards to a universe of securities provided by Wellington Management with respect to each Fund and that Wellington Management provides the day-to-day portfolio management of each Fund, including making purchases and sales of securities consistent with each Fund’s investment objective and policies and Domini’s social and environmental standards.
The Trustees then considered the professional experience, tenure, and qualifications of the portfolio management team of each Fund and the other senior personnel at Wellington Management. They also considered Wellington Management’s experience in socially responsible investing. They also reviewed Wellington Management’s compliance record. The Trustees also noted that, on a regular basis, it receives information from the Trust’s Chief Compliance Officer (CCO) regarding Wellington Management’s compliance policies and procedures, including its Code of Ethics. The Trustees noted that there were no material changes to the team providing services to the Fund or the policies and
128
procedures of the firm. The Trustees also received information with respect to Wellington Management’s brokerage policies and practices, including with respect to best execution and soft dollars. The terms of the Submanagement Agreements were also reviewed by the Trustees. It was noted that no change to services was proposed.
Based on the foregoing, the Trustees concluded that they were satisfied with the nature, quality and extent of services provided by Wellington Management to each Fund under the applicable Submanagement Agreement.
Performance Information. As noted above, the Trustees reviewed the investment performance (gross and net of all fees and expenses) of each of the Funds over various periods based on data provided to them by Wellington Management and by Domini. This information was compared to performance information with respect to each Fund’s applicable benchmark. The Trustees also compared each Fund’s Investor shares’ net investment returns for the 1-, 3-, 5-, and 10-year periods as of February 28, 2018 to the performance of a peer group of socially responsible (SRI) funds and non-SRI Funds, if any, as identified by Strategic Insight, a third-party data provider. The Trustees also took into account Domini’s evaluation of Wellington Management’s performance with respect to each Fund.
Fees and Other Expenses. The Trustees then considered the submanagement fees paid by Domini to Wellington Management under the Submanagement Agreement with respect to each Fund. The Trustees also noted that each Submanagement Agreement had been negotiated at arms’-length between Domini and Wellington. It was noted that the submanagement fee with respect to each Fund was lowered in 2017. The Trustees noted Wellington Management’s representation that it does not manage any other client portfolios that have similar investment objectives and strategies to the Funds because of the unique investment approach applied to each of the Funds (combining proprietary analysis from Domini and Wellington Management). The Trustees also noted Wellington Management’s representation that the submanagement fees Wellington Management receives, considering the nature and quality of service provided with respect to each Fund, are competitive with the fees Wellington Management receives for providing services to similarly sized client funds. The Trustees also compared Wellington Management’s fee with respect to each Fund against the other Funds and took into account the different investment strategies of each Fund. The Trustees also noted the comparative sub-advisory fee information, as available, in the report provided by Strategic Insight with respect to each Fund. The Trustees noted that, with respect to each Fund, Domini (and not the applicable Fund) pays Wellington Management from its management fee and that they had reviewed the management fee and comparative fee information in connection with their consideration of the Domini Amended and Restated Management Agreement with respect to each Fund.
129
The Trustees determined, based on the nature and quality of the services provided by Wellington Management, and in light of the preceding factors, that the fees paid by Domini to Wellington Management with respect to each Fund were fair and reasonable in relation to the nature and quality of services provided and supported approval of the continuance of the Submanagement Agreement.
Costs of Services Provided and Profitability. The Trustees reviewed Wellington Management’s audited statement of financial position as of December 31, 2017. The Trustees also reviewed a pro-forma income statement for the year ended December 31, 2017 provided by Wellington Management, which identified the revenues generated by the Funds as a separate item and reflected assumptions and estimates regarding operating expenses. The Trustees considered that Wellington represented that it would be difficult for Wellington Management to estimate such costs and profits in another form and that Wellington Management did not provide information with respect to its income or the firm’s profitability in any other form. Based on the information provided, the Trustees concluded that they were satisfied that Wellington Management’s level of profitability with respect to services provided to each Fund was not excessive in view of the nature, quality and extent of services provided to that Fund. However, the Board also took into account that the Submanagement Agreements were negotiated on an arms-length basis and that Domini paid the cost of the submanagement fees paid to Wells Management and not the Funds.
Economies of Scale. The Trustees also considered whether economies of scale would be realized by Wellington Management as the assets in each Fund increased and the extent to which economies of scale were reflected in the fee schedule for that Fund under the Submanagement Agreement. The Trustees noted that the submanagement fees are paid by Domini and not the Fund. However, the Trustees noted the breakpoints in fees payable under the Submanagement Agreement with respect to each Fund, as well as breakpoints in the fees payable to Domini under the Management Agreement for each Fund, and concluded that such breakpoints were an effective way to share economies of scale with shareholders as the assets in each Fund grew and supported the approval of the applicable Submanagement Agreement.
Other Benefits. The Trustees considered the other benefits that Wellington Management and its affiliates received from their relationship with the Funds. They noted in particular that none of Wellington Management or any of its affiliates provided any other services to the Funds. The Trustees also considered the brokerage practices of Wellington Management including its use of soft dollar arrangements. In addition, the Trustees considered the intangible benefits that accrued to Wellington Management and its affiliates by virtue of their relationship with the Funds.
130
The Trustees concluded that the benefits received by Wellington Management and its affiliates were reasonable in the context of the relationship between Wellington Management and each Fund and supported the approval of the Submanagement Agreement with respect to each Fund.
* * * * * *
Based on the Board’s evaluation of all factors that the Board deemed to be material, including those factors described above, the Board, including the Independent Trustees, concluded that renewal of the Management Agreement and the Submanagement Agreement with respect to each of the Funds would be in the best interest of the respective Fund and its shareholders. Accordingly, the Board, and the Independent Trustees voting separately, approved the Management Agreement and Submanagement Agreement with respect to each Fund for an additional one-year period.
131
The following table presents information about each Trustee and each Officer of the Domini Investment Trust (the “Trust”) as of July 31, 2018. Asterisks indicate that those Trustees and Officers are “interested persons” (as defined in the Investment Company Act of 1940) of the Trust. Each Trustee and each Officer of the Trust noted as an interested person is interested by virtue of his or her position with Domini Impact Investments LLC as described below. Unless otherwise indicated below, the address of each Trustee and each Officer is 180 Maiden Lane, Suite 1302, New York, NY 10038. Neither the Funds nor the Trust holds annual shareholder meetings for the purpose of electing Trustees, and Trustees are not elected for fixed terms. This means that each Trustee will be elected to hold office until his or her successor is elected or until he or she retires, resigns, dies, or is removed from office. No Trustee is a director of a registered investment company other than the Domini Funds.
INTERESTED TRUSTEE AND OFFICER | ||||||
Name, Age, Position(s) Held, and Length of Time Served | Principal Occupation(s) During Past 5 Years | Number of Funds in the Domini Family of Funds Overseen by Trustee | Other Directorships for Public Companies Held by Trustee | |||
Amy L. Domini* (68) Chair and Trustee, of the Trust since 1990 | Chairperson (since 2016), CIO (2010-2014), CEO (2002-2015), Member (since 1997), and Manager (since 1997), Domini Impact Investments LLC; Manager (since 1998) and Registered Principal (2003-2017), DSIL Investment Services LLC; Manager, Domini Holdings LLC (holding company) (since 2002); CEO and CIO (2013-2015), Nia Global Solutions (a former division of Domini Impact Investments); Trustee, New England Quarterly (periodical) (since 1998); Private Trustee, Loring, Wolcott & Coolidge Office (fiduciary) (since 1987); Partner (since 1994), Member (since 2010), Loring Wolcott & Coolidge Fiduciary Advisers, LLP (investment adviser); Member (since 2010), Loring, Wolcott & Coolidge Trust, LLC (trust company); Trustee, Church Investment Group (2010-2014); Board Member (since 2016), Cambridge Public Library Foundation (nonprofit). | 3 | None | |||
132
DISINTERESTED TRUSTEES | ||||||
| Name, Age, Position(s) Held, and Length of Time Served | Principal Occupation(s) During Past 5 Years and Other Directorships Held | Number of Funds in the Domini Family of Funds Overseen by Trustee | Other Directorships for Public Companies Held by Trustee | |||
Kirsten S. Moy (71) Trustee of the Trust since 1999 | Senior Fellow, The Aspen Institute (research and education) (since 2014); Scholar in Residence (2016-2018) and Board Member (2009-2014), Low Income Investment Fund (housing and community revitalization nonprofit); Board Member, Community Development Finance (asset building non-profit) (since 2006), Visiting Scholar, Federal Reserve Bank of San Francisco (since 2016). | 3 | None | |||
Gregory A. Ratliff (58) Trustee of the Trust since 1999 | Vice President, ACT, Inc. (education) (since 2017); Senior Program Officer, Bill & Melinda Gates Foundation (philanthropy) (2007-2017). | 3 | None | |||
John L. Shields (65) | President, Advisor Guidance, Inc. (management and consulting firm) (since 2010); Managing Director, CFGI, LLC (accounting and finance advisory firm) (2016-2018); Director, Navigant Consulting, Inc. (management consulting firm) (2014-2016); Managing Principal, MainStay Consulting Group, LLC (management consulting firm) (2006-2014); Independent Director, Cogo Labs, Inc. (technology company) (since 2008); Independent Director, Vestmark, Inc. (software company) (since 2015). | 3 | Independent Director, EverQuote, Inc. (technology company) (since 2018) | |||
133
OFFICERS | ||||||
| Name, Age, Position(s) Held, and Length of Time Served | Principal Occupation(s) During Past 5 Years | Number of Funds in the Domini Family of Funds Overseen by Trustee | Other Directorships for Public Companies Held by Trustee | |||
Megan L. Dunphy* (48) Chief Legal Officer since 2014, Vice President since 2013, Secretary of the Trust since 2005 | General Counsel (since 2014) and Managing Director (2015-2017), Deputy General Counsel (2009-2014), Member (since 2017), Domini Impact Investments LLC; Chief Legal Officer (since 2014), Vice President (since 2013) and Secretary (since 2005), Domini Funds. | N/A | N/A | |||
Carole M. Laible* (54) President of the Trust since 2017 | CEO and Manager (since 2016), President (2005-2015), Member (since 2006), Chief Operating Officer (2013-2015), Nia Global Solutions (a former division of Domini Impact Investments LLC), Domini Impact Investments LLC; President and CEO (since 2002), Chief Compliance Officer (2001-2014), Chief Financial Officer, Secretary, and Treasurer (since 1998), Registered Principal (since 1998), DSIL Investment Services LLC; Manager (since 2016), Domini Holdings LLC (holding company); Treasurer (1997-2015), Vice President (2007-2017), President (since 2017), Domini Funds. | N/A | N/A | |||
Douglas Lowe* (62) Assistant Secretary of the Trust since 2007 | Senior Compliance Manager and Counsel, Domini Impact Investments LLC (since 2006); Assistant Secretary, Domini Funds (since 2007); Registered Operations Professional, DSIL Investment Services LLC (since 2012). | N/A | N/A | |||
134
OFFICERS (continued) | ||||||
| Name, Age, Position(s) Held, and Length of Time Served | Principal Occupation(s) During Past 5 Years | Number of Funds in the Domini Family of Funds Overseen by Trustee | Other Directorships for Public Companies Held by Trustee | |||
Meaghan O’Rourke-Alexander* (38) Assistant Secretary of the Trust since 2007 | Compliance Officer (since 2012), Domini Impact Investments LLC; Assistant Secretary, Domini Funds (since 2007). | N/A | N/A | |||
Christina Povall* (48) Treasurer since 2017 and Vice President of the Trust since 2013 | Chief Financial Officer (since 2014), Managing Director (2014-2017), Director of Finance (2004-2014), Member (since 2017), Domini Impact Investments LLC; Treasurer (since 2017), Assistant Treasurer (2007-2017) and Vice President (since 2013), Domini Funds; Registered Operations Professional, DSIL Investment Services LLC (since 2012). | N/A | N/A | |||
Maurizio Tallini* (44) Chief Compliance Officer of the Trust since 2005 | Chief Compliance Officer (since 2005), Chief Operating Officer (2011-2017), Member (since 2007), Domini Impact Investments LLC; Vice President (since 2007), Chief Compliance Officer (since 2005), Domini Funds; Chief Compliance Officer (since 2015), Registered Principal (since 2014) Registered Representative (2012-2015), DSIL Investment Services, LLC. | N/A | N/A | |||
The Funds’ Statement of Additional Information includes additional information about the Trustees and is available without charge, upon request, by calling the following toll-free number: 1-800-582-6757.
135
The Domini Funds have established Proxy Voting Policies and Procedures that the Funds use to determine how to vote proxies relating to portfolio securities. The Domini Funds’ Proxy Voting Policies and Procedures are available, free of charge, by calling 1-800-762-6814, by visiting www.domini.com/domini-funds/proxy-voting, or by visiting the EDGAR database on the Securities and Exchange Commission’s (SEC) website at http://www.sec.gov. All proxy votes cast for the Domini Funds are posted to Domini’s website on an ongoing basis over the course of the year. An annual record of all proxy votes cast for the Funds during the most recent 12-month period ended June 30 can be obtained, free of charge, at www.domini.com, and on the EDGAR database on the SEC’s website at http://www.sec.gov.
QUARTERLY PORTFOLIO SCHEDULE INFORMATION
The Domini Funds file their complete schedule of portfolio holdings with the SEC for the first and third quarters of each fiscal year on Form N-Q. The Domini Funds’ Forms N-Q are available on the EDGAR database on the SEC’s website at http://www.sec.gov. These Forms may also be reviewed and copied at the SEC’s Public Reference Room in Washington, D.C. Information about the operation of the Public Reference Room may be obtained by calling 1-800-SEC-0330. The information on Form N-Q is also available to be viewed at www.domini.com.
136
DOMINI FUNDS
P.O. Box 9785
Providence, RI 02940-9785
1-800-582-6757
www.domini.com
Investment Manager, Sponsor, and Distributor:
Domini Impact Investments LLC (Investment Manager and Sponsor)
DSIL Investment Services LLC (Distributor)
180 Maiden Lane, Suite 1302
New York, NY 10038-4925
Investment Submanager:
Domini Impact Equity Fund
Domini Impact International Equity Fund
Domini Impact Bond Fund
Wellington Management Company LLP
280 Congress Street
Boston, MA 02210
Transfer Agent:
BNY Mellon Asset Servicing
760 Moore Road
King of Prussia, PA 19406
Custodian:
State Street Bank and Trust Company
1 Iron Street
Boston, MA 02210
Independent Registered Public Accounting Firm:
KPMG LLP
Two Financial Center
60 South Street
Boston, MA 02111
Legal Counsel:
Morgan, Lewis & Bockius LLP
One Federal Street
Boston, MA 02110
Presorted Standard U.S.Postage PAID Lancaster,PA Permit No.1793 Domini Funds P.O. Box9785 |Providence, RI 02940 1-800-582-6757 | www.domini.com facebook.com/dominifunds twitter.com/dominifunds Domini Impact Equity Fund SM Domini Impact International Equity FundSM Investor Shares: CUSIP 257132100 |DSEFX Investor Shares: CUSIP 257132704 |DOMIX Class AShares: CUSIP 257132860 |DSEPX Class AShares: CUSIP 257132886 |DOMAX Institutional Shares: CUSIP 257132852 |DIEQX Institutional Shares: CUSIP 257132811 |DOMOX Class RShares: CUSIP 257132308 |DSFRX Class Y Shares: CUSIP 257132787 | DOMYX Domini Impact Bond FundSM Investor Shares: CUSIP 257132209 |DSBFX Institutional Shares: CUSIP 257132829 |DSBIX Class Y Shares: CUSIP 257132795 | DSBYX Printed on elemental chlorine free paper from well-managed forests, containing 10% post-consumer waste.
| Item 2. | Code of Ethics. |
(a) As of the end of the period covered by this report on Form N-CSR, the registrant has adopted a code of ethics that applies to the registrant’s principal executive officer, principal financial officer, and principal accounting officer.
(c) Not applicable.
(d) Not applicable.
(e) Not applicable.
(f) Registrant is filing its code of ethics with this report.
| Item 3. | Audit Committee Financial Expert. |
John L. Shields, a member of the Audit Committee, has been determined by the Board of Trustees of the registrant in its reasonable business judgment to meet the definition of “audit committee financial expert” as such term is defined in the instructions to Form N-CSR. In addition, Mr. Shields is an “independent” member of the Audit Committee as defined in the instructions to Form N-CSR.
| Item 4. | Principal Accountant Fees and Services. |
(a) Audit Fees
For the fiscal years ended July 31, 2018, and July 31, 2017, the aggregate audit fees billed to the registrant by KPMG LLP (“KPMG”) for professional services rendered for the audits of the financial statements, or services that are normally provided in connection with statutory and regulatory filings or engagements for those fiscal years, are shown in the table below:
| Fund | 2018 | 2017 | ||||
Domini Impact Equity Fund | $40,000 | $38,400 | ||||
Domini Impact Bond Fund | $33,500 | $32,000 | ||||
Domini Impact International Equity Fund | $33,500 | $32,000 | ||||
(b) Audit-Related Fees
There were no audit-related fees billed by KPMG for services rendered for assurance and related services to the registrant that were reasonably related to the performance of the audit or review of the registrant’s financial statements, but not reported as audit fees, for the fiscal years ended July 31, 2018, and July 31, 2017.
There were no audit-related fees billed by KPMG for the fiscal years ended July 31, 2018, and July 31, 2017 that were required to be approved by the registrant’s Audit Committee for services rendered on behalf of Domini Impact Investments LLC and entities controlling, controlled by, or under common control with Domini Impact Investments LLC (not including any subadviser whose role is primarily portfolio management and is subcontracted with or overseen by another investment adviser) that provide ongoing services to the registrant (“Service Providers”).
(c) Tax Fees
In each of the fiscal years ended July 31, 2018, and July 31, 2017, the aggregate tax fees billed by KPMG for professional services rendered for tax compliance, tax advice, and tax planning for the registrant are shown in the table below:
| Fund | 2018 | 2017 | ||||
Domini Impact Equity Fund | $7,000 | $6,700 | ||||
Domini Impact Bond Fund | $7,000 | $6,700 | ||||
Domini Impact International Equity Fund | $7,000 | $6,700 | ||||
There were no tax fees billed by KPMG for the fiscal years ended July 31, 2018, and July 31, 2017 that were required to be approved by the registrant’s Audit Committee for services rendered on behalf of the registrant’s Service Providers.
(d) All Other Fees
There were no other fees billed by KPMG for the fiscal years ended July 31, 2018 and July 31, 2017 for other non-audit services rendered to the registrant.
There were no other fees billed by KPMG for the fiscal years ended July 31, 2018, and July 31, 2017 that were required to be approved by the registrant’s Audit Committee for other non-audit services rendered on behalf of the registrant’s Service Providers.
(e)(1) Audit Committee Preapproval Policy: The Registrant’s Audit Committee Preapproval Policy is set forth below:
| 1. | Statement of Principles |
The Audit Committee is required to preapprove audit and non-audit services performed for each series of the Domini Investment Trust, (each such series a “Fund” and collectively, the “Funds”) by the independent registered public accountant in order to assure that the provision of such services does not impair the accountant’s independence. The Audit Committee also is required to preapprove non-audit services performed by the Funds’ independent registered public
accountant for the Funds’ investment adviser, and certain of the adviser’s affiliates that provide ongoing services to the Funds, if the services to be provided by the accountant relate directly to the operations and financial reporting of the Funds. The preapproval of these services also is intended to assure that the provision of the services does not impair the accountant’s independence.
Unless a type of service to be provided by the independent registered public accountant has received preapproval, it will require separate preapproval by the Audit Committee. Also, any proposed services exceeding preapproved cost levels will require separate preapproval by the Audit Committee. When considering services for preapproval the Audit Committee will take into account such matters as it deems appropriate or advisable, including applicable rules regarding auditor independence.
The appendices to this Policy describe the Audit, Audit-related, Tax and All Other services for the Funds, that have the preapproval of the Audit Committee. The term of any preapproval is 12 months from the date of preapproval, unless the Audit Committee specifically provides for a different period. The Audit Committee will periodically revise the list of preapproved services based on subsequent determinations.
Notwithstanding any provision of this Policy, the Audit Committee is not required to preapprove services for which preapproval is not required by applicable law, including de minimis and grandfathered services.
| 2. | Delegation |
The Audit Committee may delegate preapproval authority to one or more of its members. The member or members to whom such authority is delegated shall report any preapproval decisions to the Audit Committee at its next scheduled meeting. By adopting this Policy the Audit Committee does not delegate to management the Audit Committee’s responsibilities to preapprove services performed by the independent auditor.
| 3. | Audit Services |
The annual Audit services engagement terms and fees for the Funds will be subject to the preapproval of the Audit Committee. The Audit Committee will approve, if necessary, any changes in terms, conditions and fees resulting from changes in audit scope or other matters.
In addition to the annual Audit services engagement approved by the Audit Committee, the Audit Committee may grant preapproval for other Audit services, which are those services that only the independent registered public accountant reasonably can provide. The Audit Committee has preapproved the Audit services listed in Appendix A. All Audit services not listed in Appendix A must be separately preapproved by the Audit Committee.
| 4. | Audit-Related Services |
Audit-related services are assurance and related services for the Funds that are reasonably related to the performance of the audit or review of the Funds’ financial statements or that are traditionally performed by the independent registered public accountant. The Audit Committee believes that the provision of Audit-related services does not impair the independence of the accountant, and has preapproved the Audit-related services listed in Appendix B. All Audit-related services not listed in Appendix B must be separately preapproved by the Audit Committee.
| 5. | Tax Services |
The Audit Committee believes that the independent registered public accountant can provide Tax services to the Funds such as tax compliance, tax planning and tax advice without impairing the accountant’s independence. However, the Audit Committee will not permit the retention of the independent registered public accountant in connection with a transaction initially recommended by the independent registered public accountant, the purpose of which may be tax avoidance and the tax treatment of which may not be supported in the Internal Revenue Code and related regulations. The Audit Committee has preapproved the Tax services listed in Appendix C. All Tax services not listed in Appendix C must be separately preapproved by the Audit Committee.
| 6. | All Other Services |
The Audit Committee may grant preapproval to those permissible non-audit services for the Funds classified as All Other services that it believes are routine and recurring services, and would not impair the independence of the accountant. The Audit Committee has preapproved the All Other services listed in Appendix D. Permissible All Other services not listed in Appendix D must be separately preapproved by the Audit Committee.
A list of the SEC’s prohibited non-audit services is attached to this policy as Exhibit 1. The SEC’s rules and relevant guidance should be consulted to determine the precise definitions of these services and the applicability of exceptions to certain of the prohibitions.
| 7. | Preapproval Fee Levels |
Preapproval fee levels for all services to be provided by the independent registered public accountant to the Funds, and applicable non-audit services to be provided by the accountant to the Funds’ investment adviser and its affiliates, will be established periodically by the Audit Committee. Any proposed services exceeding these levels will require specific preapproval by the Audit Committee.
| 8. | Supporting Documentation |
With respect to each service that is separately preapproved, the independent auditor will provide detailed back-up documentation, which will be provided to the Audit Committee, regarding the specific services to be provided.
| 9. | Procedures |
Requests or applications to provide services that require separate approval by the Audit Committee will be submitted to the Audit Committee by both the independent registered public accountant and the Funds’ treasurer, and must include a joint statement as to whether, in their view, the request or application is consistent with the SEC’s rules on auditor independence.
Management will promptly report to the Chair of the Audit Committee any violation of this Policy of which it becomes aware.
Appendix A – Audit Committee Preapproval Policy
Preapproved Audit Services
for
October 26, 2017 through October 31, 2018
| Service | Fee Range | |
| Statutory audits or financial audits (including tax services associated with non-audit services) | As presented to Audit Committee in a separate engagement letter1 | |
| Services associated with SEC registration statements, periodic reports and other documents filed with the SEC or other documents issued in connection with securities offerings (e.g., consents), and assistance in responding to SEC comment letters | Not to exceed $9,000 per filing |
Appendix B - Audit Committee Preapproval Policy
Preapproved Audit-Related Services
for
October 26, 2017 through October 31, 2018
| Service | Fee Range | |
Consultations by Fund management with respect to the accounting or disclosure treatment of securities, transactions or events and/or the actual or potential impact of final or proposed rules, standards or interpretations by the SEC, FASB, or other regulatory or standard-setting bodies
| Not to exceed $5,000 per occurrence during the Pre-Approval Period
|
| Review of Funds’ semi-annual financial statements | Not to exceed $2,000 per set of financial statements per fund | |
| Regulatory compliance assistance | Not to exceed $5,000 per quarter
| |
| Training Courses | Not to exceed $5,000 per course
|
Appendix C – Audit Committee Preapproval Policy
Preapproved Tax Services
for
October 26, 2017 through October 31, 2018
| Service | Fee Range | |
| Review of federal and state income tax returns and federal excise tax returns for the Funds including assistance and review with excise tax distributions. | As presented to Audit Committee in a separate engagement letter1 | |
| Tax assistance and advice regarding statutory, regulatory or administrative developments | Not to exceed $5,000 for the Funds’ or for the Funds’ investment adviser during the Pre-Approval period | |
| Assistance with custom tax audits and related matters | Not to exceed $15,000 per Fund during the Pre-Approval Period | |
| Tax Training Courses | Not to exceed $5,000 per course during the Pre-Approval Period | |
M & A tax due diligence services associated with Fund mergers including: review of the target fund’s historical tax filings, review of the target fund’s tax audit examination history, and hold discussions with target management and external tax advisors. Advice regarding the target fund’s overall tax posture and historical and future tax exposures.
| Not to exceed $8,000 per merger during the Pre-Approval Period | |
| Tax services related to the preparation of annual PFIC statements and annual Form 5471 (Controlled Foreign Corporation for structured finance vehicles) | Not to exceed $20,000 during the Pre-Approval Period |
Appendix D – Audit Committee Preapproval Policy
Preapproved All Other Services
for
October 26, 2017 through October 31, 2018
| Service | Fee Range | |
| No other services for the Pre-Approval Period have been specifically preapproved by the Audit Committee. | N/A |
Exhibit 1 – Audit Committee Preapproval Policy
Prohibited Non-Audit Services
| ◾ | Bookkeeping or other services related to the accounting records or financial statements of the audit client |
| ◾ | Financial information systems design and implementation |
| ◾ | Appraisal or valuation services, fairness opinions or contribution-in-kind reports |
| ◾ | Actuarial services |
| ◾ | Internal audit outsourcing services |
| ◾ | Management functions |
| ◾ | Human resources |
| ◾ | Broker-dealer, investment adviser or investment banking services |
| ◾ | Legal services |
| ◾ | Expert services unrelated to the audit |
1 For new funds launched during the Pre-Approval Period, the fee ranges pre-approved will be the same as those for existing funds, pro-rated in accordance with inception dates as provided in the auditors’ proposal or any engagement letter covering the period at issue. Fees in the engagement letter will be controlling.
(e)(2) None, or 0%, of the services relating to the audit-related fees, tax fees, and all other fees paid by the registrant disclosed above were approved by the Audit Committee pursuant to paragraph (c)(7)(i)(C) of Rule 2-01 of Regulation S-X (which permits audit committee approval after the start of the engagement with respect to services other than audit review or attest services, if certain conditions are satisfied).
(f) According to KPMG for the fiscal year ended July 31, 2018, the percentage of hours spent on the audit of the registrant’s financial statements for the most recent fiscal year that were attributed to work performed by persons other than KPMG’s full-time, permanent employees is as follows:
| Fund | 2018 | |
Domini Social Equity Fund | 0% | |
Domini Social Bond Fund | 0% | |
Domini International Social Equity Fund | 0% | |
(g) There were no non-audit services rendered to the registrant’s Service Providers for the fiscal years ended July 31, 2018 and July 31, 2017.
The aggregate non-audit fees billed by KPMG for services rendered to the registrant for the fiscal year ended July 31, 2018 was $ 21,000. These fees related to the 2018 Tax Fees described in Item 4 (c). The aggregate non-audit fees billed by KPMG for services rendered to the registrant for the fiscal year ended July 31, 2017, were $20,100. These fees related to the 2017 Tax Fees described in Item 4 (c).
(h) Not applicable.
| Item 5. | Audit Committee of Listed Registrants. |
Not applicable to the registrant.
| Item 6. | Schedule of Investments. |
(a) The Schedule of Investments is included as part of the report to stockholders filed under Item 1.
(b) Not applicable
| Item 7. | Disclosure of Proxy Voting Policies and Procedures for Closed-End Management Investment Companies. |
Not applicable to the registrant.
| Item 8. | Portfolio Managers of Closed-End Management Investment Companies. |
Not applicable to the registrant.
| Item 9. | Purchases of Equity Securities by Closed-End Management Investment Company and Affiliated Purchasers. |
Not applicable to the registrant.
Item 10. Submission of Matters to a Vote of Security Holders.
There were no material changes to the procedures by which shareholders may submit recommendations for nominees to the registrant’s Board of Trustees.
Item 11. Controls and Procedures.
(a) Within 90 days prior to the filing of this report on Form N-CSR, Carole M. Laible, the registrant’s President and Principal Executive Officer, and Christina Povall, the registrant’s Treasurer and Principal Financial Officer, reviewed the registrant’s disclosure controls and procedures (as defined in Rule 30a-3(c) of the Investment Company Act of 1940) and evaluated their effectiveness. Based on their evaluation, Ms. Laible and Ms. Povall determined that the disclosure controls and procedures adequately ensure that information required to be disclosed by the registrant in this report on Form N-CSR is recorded, processed, summarized, and reported within the time periods required by the Securities and Exchange Commission’s rules and forms, including ensuring that information required to be disclosed in this report on Form N-CSR is accumulated and communicated to the registrant’s management, including the Ms. Laible and Ms. Povall, as appropriate to allow timely decisions regarding required disclosures.
(b) There were no changes in the registrant’s internal control over financial reporting (as defined in Rule 30a-3(d) under the Investment Company Act of 1940) that occurred during the second fiscal quarter of the period covered by this report that have materially affected, or are reasonably likely to materially affect, the registrant’s internal control over financial reporting.
Item 12. Disclosure of Securities Lending Activities for Closed-End Management Investment Companies.
Not applicable to the registrant.
Item 13. Exhibits.
(a)(1) The Code of Ethics referred to in Item 2 is filed herewith.
(a)(2) Separate certifications required by Rule 30a-2(a) under the Investment Company Act of 1940 for each principal executive officer and principal financial officer of the registrant are filed herewith.
(a)(3) Not applicable to the registrant.
(b) A single certification required by Rule 30a-2(b) under the Investment Company Act of 1940, Rule 13a-14b or Rule 15d-14(b) under the Securities Exchange Act of 1934, and Section 1350 of Chapter 63 of Title 18 of the United States Code for the chief executive officer and the chief financial officer of the registrant is filed herewith.
SIGNATURES
Pursuant to the requirements of the Securities Exchange Act of 1934 and the Investment Company Act of 1940, the registrant has duly caused this report to be signed on its behalf by the undersigned, thereunto duly authorized.
DOMINI INVESTMENT TRUST
|
| By: /s/ Carole M. Laible |
| Carole M. Laible |
| President (Principal Executive Officer) |
Date: October 5, 2018
Pursuant to the requirements of the Securities Exchange Act of 1934 and the Investment Company Act of 1940, this report has been signed below by the following persons on behalf of the registrant and in the capacities and on the dates indicated.
| By: /s/ Carole M. Laible |
| Carole M. Laible |
President (Principal Executive Officer)
|
Date: October 5, 2018
|
| By: /s/ Christina Povall |
| Christina Povall |
Treasurer (Principal Financial Officer)
|
| Date: October 5, 2018 |