| UNITED STATES |
| SECURITIES AND EXCHANGE COMMISSION |
| Washington, D.C. 20549 |
FORM N-CSR |
CERTIFIED SHAREHOLDER REPORT OF REGISTERED |
MANAGEMENT INVESTMENT COMPANIES |
| Investment Company Act File Number: 811-5833 |
| T. Rowe Price Institutional International Funds, Inc. |
| (Exact name of registrant as specified in charter) |
| 100 East Pratt Street, Baltimore, MD 21202 |
| (Address of principal executive offices) |
| David Oestreicher |
| 100 East Pratt Street, Baltimore, MD 21202 |
| (Name and address of agent for service) |
| Registrant’s telephone number, including area code: (410) 345-2000 |
| Date of fiscal year end: October 31 |
| Date of reporting period: October 31, 2009 |
Item 1: Report to Shareholders
 |
| Institutional Emerging Markets Equity Fund | October 31, 2009 |
| Highlights |
• Emerging markets rebounded sharply over the past six months as investors began to turn to riskier assets and the U.S. dollar weakened against many other currencies.
• Every region produced stellar returns, led by emerging Europe and Latin America, which benefited from resurgent commodity prices. China was powered by timely government spending and consumer growth.
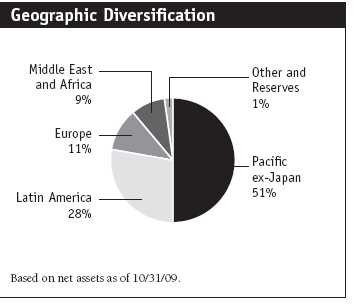
• Latin America remains our largest regional overweight due to its resilient economic growth, though we have trimmed holdings following the recent run-up. We have increased our holdings in emerging Europe.
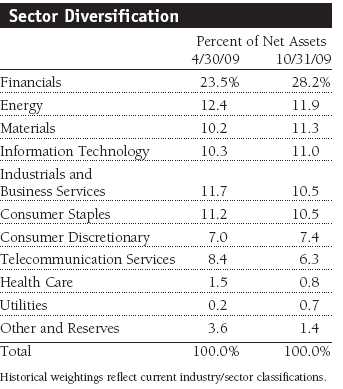
• We are focusing on financial companies and consumer and infrastructure spending, as the domestic growth story throughout much of the emerging world continues to improve.
The views and opinions in this report were current as of October 31, 2009. They are not guarantees of performance or investment results and should not be taken as investment advice. Investment decisions reflect a variety of factors, and the managers reserve the right to change their views about individual stocks, sectors, and the markets at any time. As a result, the views expressed should not be relied upon as a forecast of the fund’s future investment intent. The report is certified under the Sarbanes-Oxley Act, which requires mutual funds and other public companies to affirm that, to the best of their knowledge, the information in their financial reports is fairly and accurately stated in all material respects.
Manager’s Letter
T. Rowe Price Institutional Emerging Markets Equity Fund
Dear Investor
Volatility receded over the last six months, and a powerful rally took hold throughout much of the emerging markets universe. A confluence of events led to a renewed appetite for risk as investors bought companies at depressed levels and pushed prices higher. The key factor that made emerging markets so appealing was their relative health compared with the developed world.
Performance Review
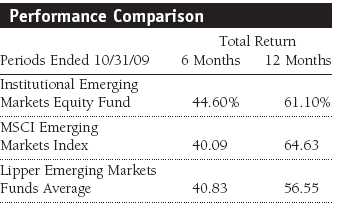
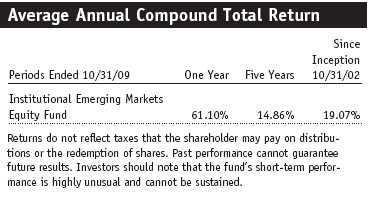
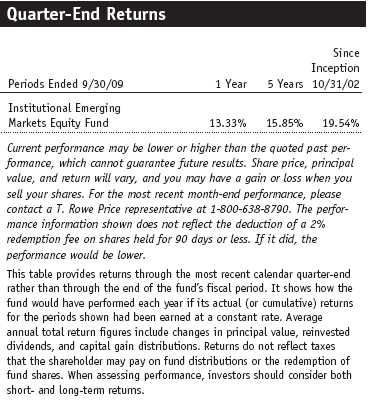
Your fund returned 44.60% in the last six months and 61.10% in the one-year period ended October 31, 2009. As shown in the Performance Comparison table, the fund outperformed the Lipper Emerging Markets Funds Average for both periods. It outpaced the MSCI Emerging Markets Index in the last six months but trailed the benchmark for the one-year period. Investors should note that the fund’s short-term performance is highly unusual and cannot be sustained.
Over the past six months, financials, which composes about 28% of the fund, was the strongest absolute contributor to performance, as select banks in China, Brazil, and Russia rebounded. Energy was another top performer, owing to the surge in commodity prices. Our holdings in Brazil and Mexico were particularly strong. Consumer discretionary shares recovered in many of our markets—an indication of the solid consumption growth among developing markets. Consumer staples and materials also contributed positively to the bottom line. Our holdings in industrials and business services weighed on results. Although the sector was an absolute contributor to the fund’s positive performance, we would have been better off with a slightly lower exposure to the lagging sector. Information technology turned in a good performance, while telecommunication services, a relatively small portion of the fund, recorded excellent results due to solid stock selection.
Market and Portfolio Review
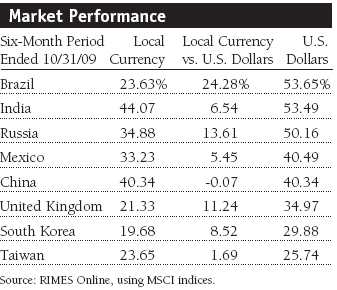
The rebound in emerging markets that began last spring accelerated into the summer. As risk appetite returned, investors pushed every region higher. This was particularly true in Europe, the Middle East, and Africa, which just a short time ago was hampered by growing budget deficits and sagging oil prices. Improved global economic prospects, however, propelled stocks higher. Russia benefited from surging commodity prices and an improved banking industry. Latin America benefited on nearly every front, from higher commodity prices to strong consumer demand. In Asia, China’s aggressive spending measures lifted the fortunes of many companies engaged in ramping up the country’s mammoth infrastructure projects. India soared in May following election results welcomed by many investors and strong domestic growth. South Korea turned the corner later in the period as the export-heavy country benefited from a weaker currency. Taiwan performed well but turned in a slightly lower performance than other countries due to weak demand for its technology products.
While the rebound in emerging markets is welcome news, it is important to note that our fund remains below its all-time high in 2007. The other salient point is that today’s complex global markets are no less intertwined than they were prior to the great collapse of 2008–2009. We believe that many emerging economies are poised for sustained growth and are healthier than their developed counterparts in the U.S. and Europe. However, they are not immune to the type of wild gyrations we saw among markets earlier this year. We would like to remind our investors that this fund can be extremely volatile and should only represent a small portion of a long-term investor’s well-diversified portfolio.
Pacific ex-Japan
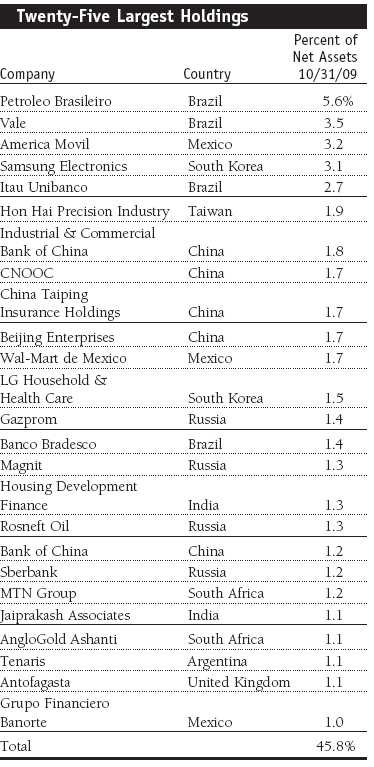
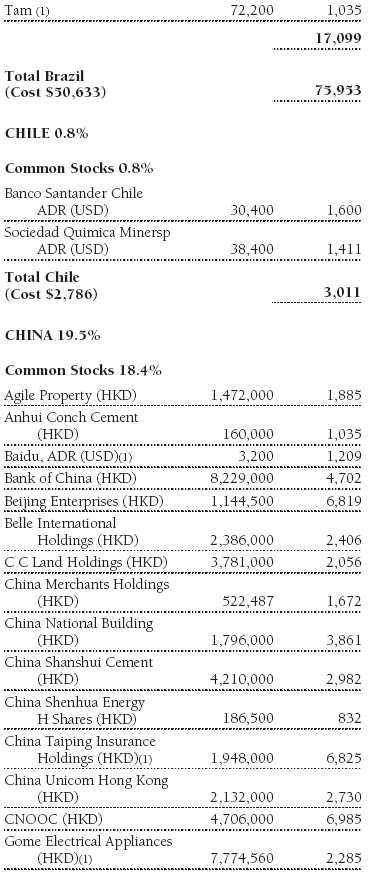
Emerging Asian markets gained about 36% and 62% in dollar terms in the 6- and 12-month periods ended October 31, 2009, respectively. Strong domestic growth and the renewed appetite for risk represented the largest themes during the last year, particularly the previous six months. China remains our largest country allocation at about 20%. It was a top contributor to absolute performance in the last six months. Stock selection was positive. China’s timely and massive government stimulus spending appears to have had an enormous positive impact on the country’s growth story, as well as on confidence among international investors. The Asian giant remains heavily dependent on exports to fuel its growth, but it is beginning to take steps to lay the foundation for consumer-driven gains. The trend appeared to benefit several of our holdings, such as China Taiping Insurance and Gome Electrical Appliances—both plays on a strong domestic economy. Insurance is a fledgling industry in China, and China Taiping Insurance was a large beneficiary of rising investment returns. Gome is a large electronic retailer that is profiting from a strong domestic economy. Similarly, property companies rallied. Shimao Property and Agile Property surged due to increased lending fueled by the stimulus spending. The sharp runup prompted us to trim some of our holdings in the industry. Nonetheless, we have a bias toward other economically sensitive industries such as banking and insurance. (Please refer to the fund’s portfolio of investments for a complete listing of holdings and the amount each represents in the portfolio.)
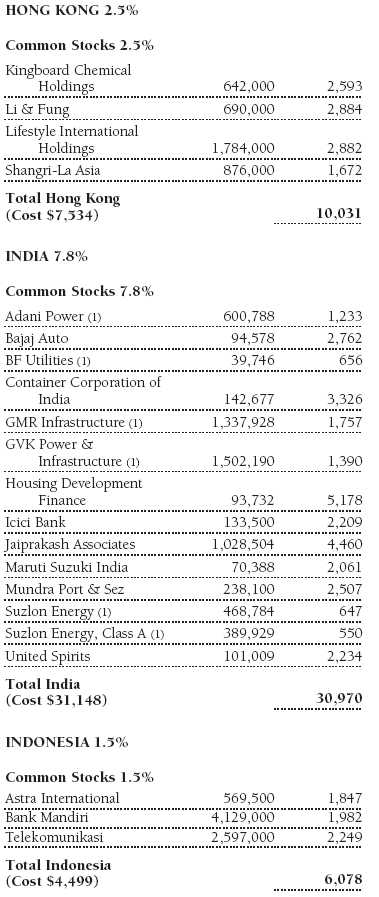
We retain a small overweight in India as the economy remains strong, and we continue to find attractive growth companies in the infrastructure, consumer discretionary, and financials sectors. However, the market is trading at a premium, which has given us pause. Our holdings in particular suffered in the sell-off at the start of the periods, as we have a large exposure to companies tied to India’s infrastructure growth. Infrastructure firms fell out of favor with investors for a number of reasons, including a perceived lack of clarity about future earnings streams and a reliance on debt financing. Large positions in India include Housing Development Finance, a mortgage lender that we believe is better positioned than its peers. The company’s loan growth has been strong but should slow as borrowing costs rise and is susceptible to any property price weakness. Container Corporation of India (Concor) is a subsidiary of Indian Railways. It offers integrated logistics services for container movement through the country’s rail system and has a track record of strong growth and investments in ports companies. It is a key beneficiary of the strong economy and efforts to improve the infrastructure network.
Rising Chinese demand helped power South Korea’s economy to the highest growth levels in seven years. South Korea, which is the fund’s third top country allocation, is on track to post flat or positive growth this year, a far better result than the 1.5% contraction the government recently forecast. Samsung Electronics reported strong earnings growth and was one of the fund’s top 10 contributors. While we remain underweight to the country, we have increased our allocation in recent months. We added to Samsung and Hana Financial, and we bought shares in steelmaker Posco.
Europe, the Middle East, and Africa (EMEA)
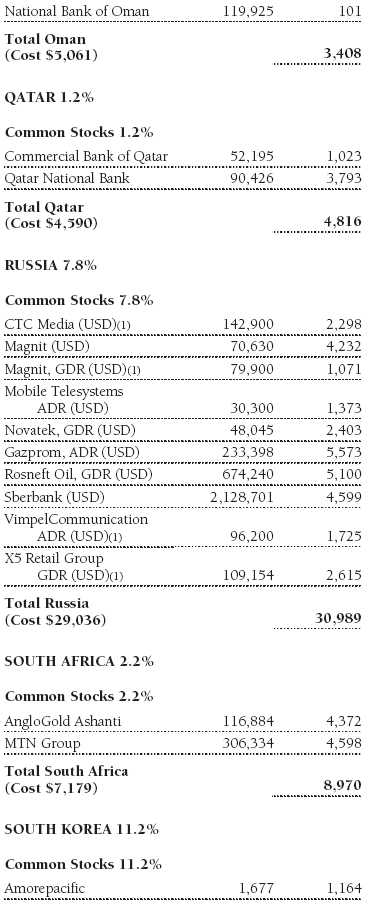
The EMEA region surged nearly 40% in the past six months and about 56% for the full year in U.S. dollar terms. The particularly strong gains have further increased our overall allocation to the region, where the most notable improvement occurred in Russia. The country, which composes about 8% of the fund, posted abysmal returns last year following Russia’s conflict with Georgia, a banking liquidity squeeze, and plunging oil prices. Many of the companies hurt most by the downturn rebounded sharply over the last six months. Sberbank, which had suffered from the liquidity crisis, turned in a solid performance and was the fund’s fifth best performer. Energy giant Gazprom benefited from the upturn and increase in energy prices. Other energy names that enjoyed a decent bounce included Rosneft Oil and Novatek, which is a gas company that is enjoying good production growth. Among domestic companies, the fund benefited from Russia’s growth story by owning consumer staples firm Magnit and X5 Retail, the largest food retailer in Russia that should continue to strengthen as its competitors diminish in a weaker environment. Broadcaster CTC Media also performed well.
Turkey is a small component of the fund, but we expect it to be among the fastest-growing countries in the region as the economy rebounds. We own shares in BIM, an excellently managed food discounter that is enjoying robust growth, and Turkiye Garanti Bank, which has a strong financial position and should benefit from declining interest rates that will lower the bank’s funding costs. We have no holdings in central Eastern Europe due to a weak economic environment and unappealing valuations.
We maintain an underweight in the Middle East and Africa due to our small positions in South Africa, where the economy is fragile and unemployment is high. We hold only two South Africa names in the fund, the gold producer AngloGold Ashanti and MTN Group, a telecommunications company with a wide reach on the continent. We hold several positions in banks in Qatar and Oman, which have relatively strong economies, and in the United Arab Emirates, where we have a position in DP World, a leading global port operator that is expanding capacity rapidly in a number of new ventures.
Latin America
The region surged 47% in the last six months and about 85% for the 12-month period in dollar terms. It remains the largest regional overweight by a comfortable margin, though we have trimmed some of our holdings following the strong performance. The region has proven remarkably resilient to the economic downturn, as it features solid fiscal management and sound economic fundamentals. Brazil, the fund’s second-largest country allocation behind China, had stellar returns. Brazil’s banks did not engage in the speculative business that weakened many global financial institutions, so the country was able to largely escape the liquidity crisis. Banco Itau, Brazil’s largest bank by assets and loans, was a top fund contributor. It is well managed, with a loan book that is evenly split between personal and corporate clients, which should help performance as the domestic economy grows and the global economy recovers. Banco do Brasil also turned in a solid gain. Our holdings in Vale, a leading metals and mining company, and oil and gas giant Petroleo Brasileiro (Petrobras) were among the top performers. Long-term prospects for both companies remain positive as Vale benefits from solid management and a strong balance sheet and Petrobras maintains strong production growth. Apparel retailer Lojas Renner posted solid gains as short-term consumer demand bounced back and investors focused on continued long-term growth in domestic consumption.
On October 20, 2009, the Brazilian government imposed a 2% tax on purchases of domestic equity and debt instruments by foreign investors in an effort to slow the appreciation of its currency. While its effect on currency appreciation is debatable—the Brazilian real actually rose modestly against the U.S. dollar after enactment—the tax should have little impact on fund shareholders due to the relatively low annual turnover rate resulting from our long-term investment approach. Additionally, we are keeping the sale proceeds of any Brazilian shares in local currency whenever practical, thereby avoiding the foreign exchange market to fund future purchases and sidestepping the tax.
In Mexico—the fund’s third-largest country overweight—our largest position is in America Movil, the region’s largest telecommunications company. The company has 165 million subscribers, and penetration levels have increased. But there is still strong growth in subscribers and upside potential to revenues. We also have a large position in Wal-Mart de Mexico, the retail discounter that is a strong play on the Mexican consumer. The company’s expansion plans remain intact, even though the consumer environment is softening.
Outlook
Emerging markets posted a strong gain in the last 12 months or so and are now up more than 100% in U.S. dollar terms since the market lows in October 2008. While we are pleased with the remarkable rebound, we would like to remind our investors, particularly newer investors, that the brisk pace of gains in 2009 is unlikely to be sustained indefinitely. Nonetheless, we think valuations are still at reasonable levels relative to historical levels and when taking the strong upward earnings revisions into account. It may be too soon to definitively assess the recovery, but many emerging markets appear to be in a stronger fundamental position than their developed peers.
In many areas of Asia and Latin America, the return on capital is higher than in the developed market universe. Strong productivity, favorable demographics, and solid domestic demand are likely to continue pushing these markets higher. In addition, many of these maturing markets feature the political will and economic ability to respond quickly and decisively to crises. We have seen significant countercyclical packages announced throughout the emerging world, which will result in increased public sector spending. Interest rates have also been cut aggressively across the emerging markets universe. Banking systems in general are much healthier than in the developed world, with little or no impact from the credit crisis. Consumers and corporations have significantly less debt than their developed market peers. Consumption is a key theme in emerging markets, and the domestic economies remain strong.
Given our view that long-term growth in emerging markets will be driven increasingly by individual wealth and, consequently, consumer spending, we favor sectors such as consumer staples and discretionary as well as financials. Infrastructure is also a strong theme in the fund as many countries launch stimulus packages centered on improving their infrastructure network. We remain focused on companies that will emerge from this downturn in a stronger competitive position.
Respectfully submitted,
Gonzalo Pángaro,
Portfolio manager and chairman of the fund’s Investment
Advisory Committee
November 12, 2009
The chairman of the fund’s Investment Advisory Committee has day-to-day responsibility for managing the portfolio and works with committee members in developing and executing the fund’s investment program.
| Risks of International Investing |
Funds that invest overseas generally carry more risk than funds that invest strictly in U.S. assets. Funds investing in a single country or in a limited geographic region tend to be riskier than more diversified funds. Risks can result from varying stages of economic and political development; differing regulatory environments, trading days, and accounting standards; and higher transaction costs of non-U.S. markets. Non-U.S. investments are also subject to currency risk, or a decline in the value of a foreign currency versus the U.S. dollar, which reduces the dollar value of securities denominated in that currency.
| Glossary |
Lipper averages: The averages of available mutual fund performance returns for specified time periods in defined categories as tracked by Lipper Inc.
MSCI Emerging Markets Index: A capitalization-weighted index of stocks from 26 emerging market countries that only includes securities that may be traded by foreign investors.
Portfolio Highlights
Performance and Expenses
T. Rowe Price Institutional Emerging Markets Equity Fund
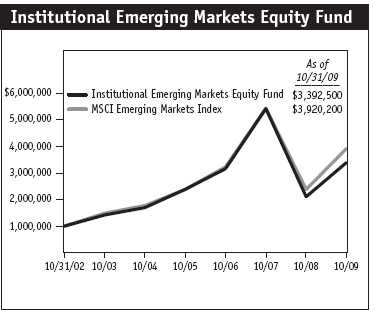
| Performance Comparison |
This chart shows the value of a hypothetical $1 million investment in the fund over the past 10 fiscal year periods or since inception (for funds lacking 10-year records). The result is compared with benchmarks, which may include a broad-based market index and a peer group average or index. Market indexes do not include expenses, which are deducted from fund returns as well as mutual fund averages and indexes.
This table shows how the fund would have performed each year if its actual (or cumulative) returns for the periods shown had been earned at a constant rate.
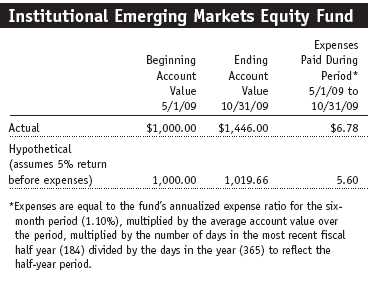
Fund Expense Example
As a mutual fund shareholder, you may incur two types of costs: (1) transaction costs, such as redemption fees or sales loads, and (2) ongoing costs, including management fees, distribution and service (12b-1) fees, and other fund expenses. The following example is intended to help you understand your ongoing costs (in dollars) of investing in the fund and to compare these costs with the ongoing costs of investing in other mutual funds. The example is based on an investment of $1,000 invested at the beginning of the most recent six-month period and held for the entire period.
Actual Expenses
The first line of the following table (“Actual”) provides information about actual account values and actual expenses. You may use the information in this line, together with your account balance, to estimate the expenses that you paid over the period. Simply divide your account value by $1,000 (for example, an $8,600 account value divided by $1,000 = 8.6), then multiply the result by the number in the first line under the heading “Expenses Paid During Period” to estimate the expenses you paid on your account during this period.
Hypothetical Example for Comparison Purposes
The information on the second line of the table (“Hypothetical”) is based on hypothetical account values and expenses derived from the fund’s actual expense ratio and an assumed 5% per year rate of return before expenses (not the fund’s actual return). You may compare the ongoing costs of investing in the fund with other funds by contrasting this 5% hypothetical example and the 5% hypothetical examples that appear in the shareholder reports of the other funds. The hypothetical account values and expenses may not be used to estimate the actual ending account balance or expenses you paid for the period.
You should also be aware that the expenses shown in the table highlight only your ongoing costs and do not reflect any transaction costs, such as redemption fees or sales loads. Therefore, the second line of the table is useful in comparing ongoing costs only and will not help you determine the relative total costs of owning different funds. To the extent a fund charges transaction costs, however, the total cost of owning that fund is higher.
Financial Highlights
T. Rowe Price Institutional Emerging Markets Equity Fund
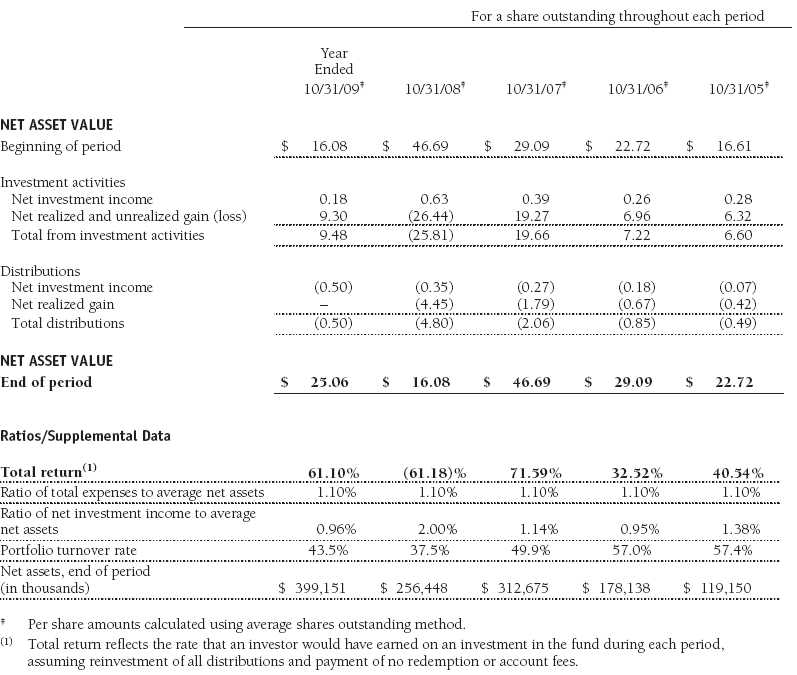
The accompanying notes are an integral part of these financial statements.
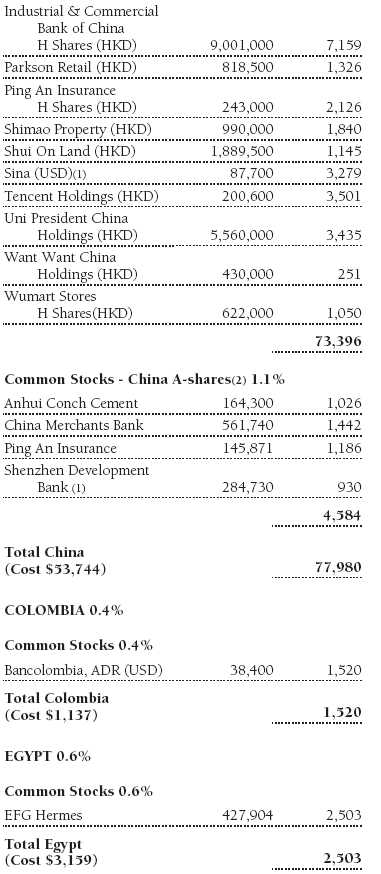
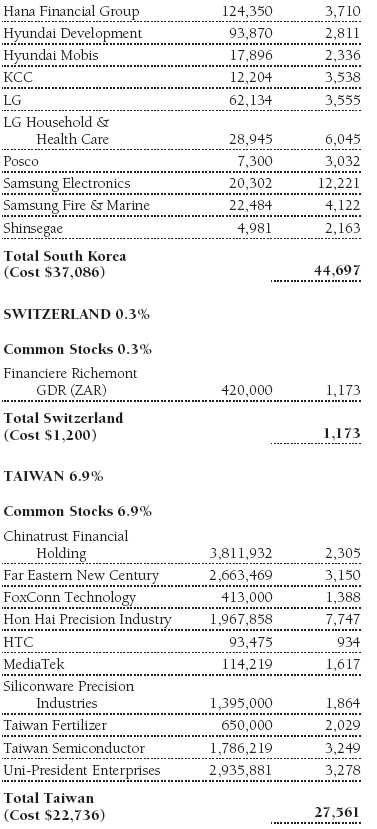
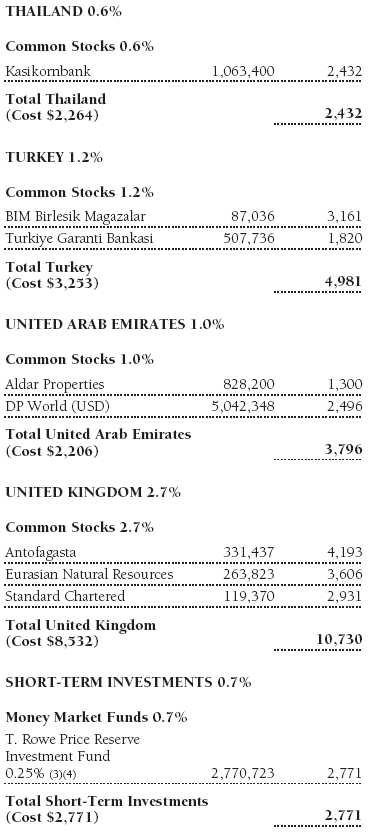
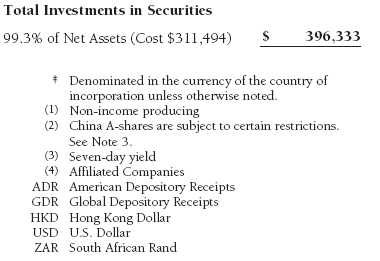
Portfolio of Investments‡
T. Rowe Price Institutional Emerging Markets Equity Fund
October 31, 2009

The accompanying notes are an integral part of these financial statements.
Statement of Assets and Liabilities
T. Rowe Price Institutional Emerging Markets Equity Fund
October 31, 2009
($000s, except shares and per share amounts)
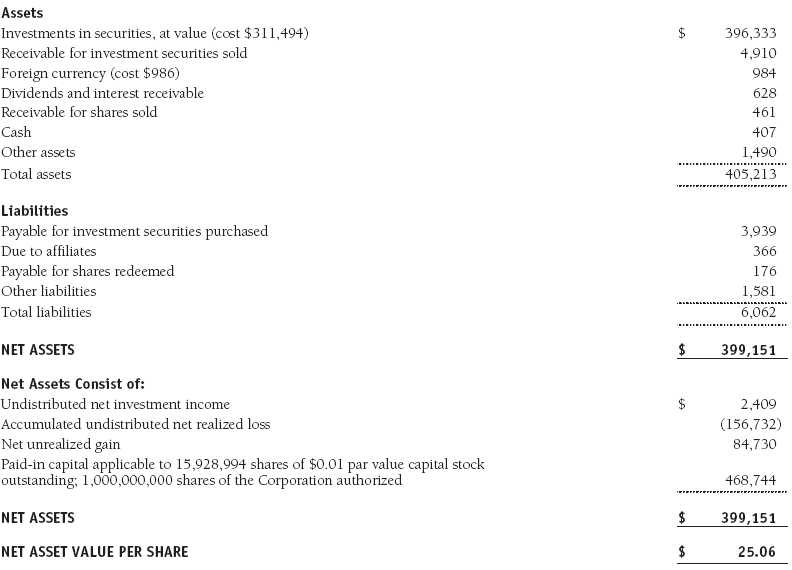
The accompanying notes are an integral part of these financial statements.
Statement of Operations
T. Rowe Price Institutional Emerging Markets Equity Fund
($000s)
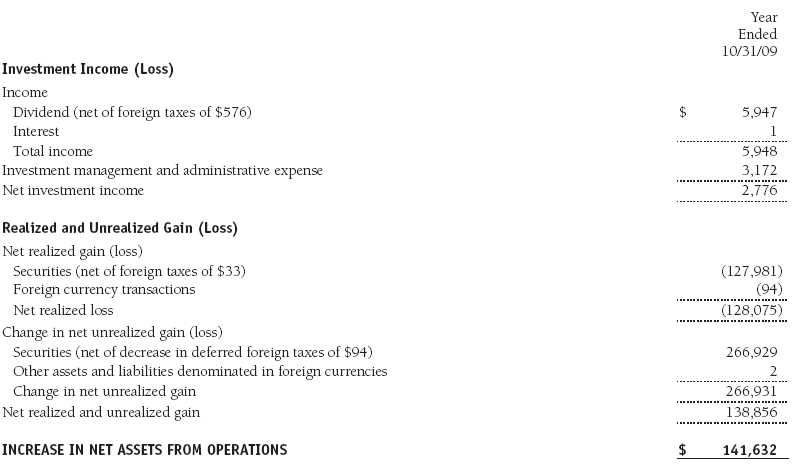
The accompanying notes are an integral part of these financial statements.
Statement of Changes in Net Assets
T. Rowe Price Institutional Emerging Markets Equity Fund
($000s)
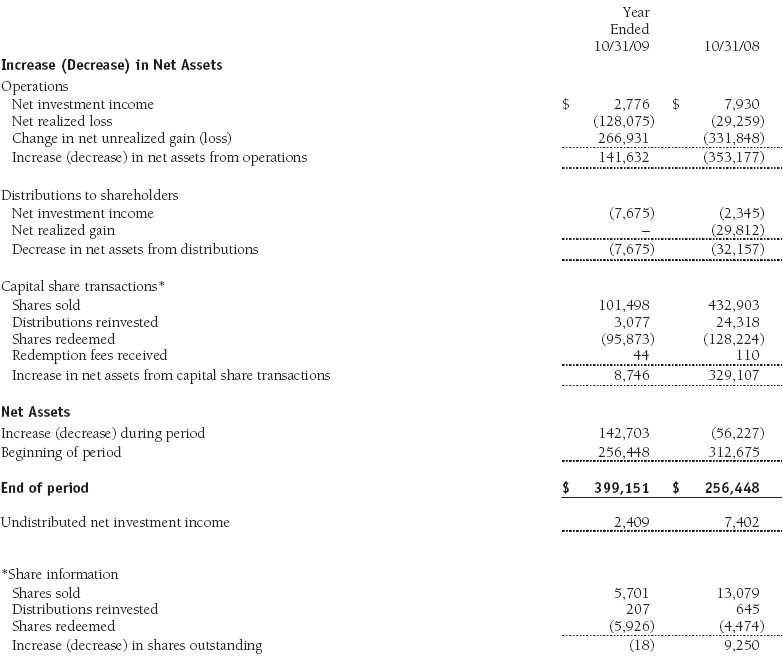
The accompanying notes are an integral part of these financial statements.
Notes to Financial Statements
T. Rowe Price Institutional Emerging Markets Equity Fund
October 31, 2009
T. Rowe Price Institutional International Funds, Inc. (the corporation), is registered under the Investment Company Act of 1940 (the 1940 Act). The Institutional Emerging Markets Equity Fund (the fund), a diversified, open-end management investment company, is one portfolio established by the corporation. The fund commenced operations on October 31, 2002. The fund seeks long-term growth of capital through investments primarily in the common stocks of companies located (or with primary operations) in emerging markets.
NOTE 1 - SIGNIFICANT ACCOUNTING POLICIES
Basis of Preparation The accompanying financial statements were prepared in accordance with accounting principles generally accepted in the United States of America (GAAP), which require the use of estimates made by fund management. Fund management believes that estimates and security valuations are appropriate; however, actual results may differ from those estimates, and the security valuations reflected in the accompanying financial statements may differ from the value the fund ultimately realizes on the securities. Further, fund management believes that no events have occurred between October 31, 2009, the date of this report, and December 22, 2009, the date of issuance of the financial statements, that require adjustment of, or disclosure in, the accompanying financial statements.
Investment Transactions, Investment Income, and Distributions Income and expenses are recorded on the accrual basis. Dividends received from mutual fund investments are reflected as dividend income; capital gain distributions are reflected as realized gain/loss. Dividend income and capital gain distributions are recorded on the ex-dividend date. Income tax-related interest and penalties, if incurred, would be recorded as income tax expense. Investment transactions are accounted for on the trade date. Realized gains and losses are reported on the identified cost basis. Distributions to shareholders are recorded on the ex-dividend date. Income distributions are declared and paid annually. Capital gain distributions, if any, are generally declared and paid by the fund, annually.
Currency Translation Assets, including investments, and liabilities denominated in foreign currencies are translated into U.S. dollar values each day at the prevailing exchange rate, using the mean of the bid and asked prices of such currencies against U.S. dollars as quoted by a major bank. Purchases and sales of securities, income, and expenses are translated into U.S. dollars at the prevailing exchange rate on the date of the transaction. The effect of changes in foreign currency exchange rates on realized and unrealized security gains and losses is reflected as a component of security gains and losses.
Redemption Fees A 2% fee is assessed on redemptions of fund shares held for 90 days or less to deter short-term trading and to protect the interests of long-term shareholders. Redemption fees are withheld from proceeds that shareholders receive from the sale or exchange of fund shares. The fees are paid to the fund and are recorded as an increase to paid-in capital. The fees may cause the redemption price per share to differ from the net asset value per share.
New Accounting Pronouncements On November 1, 2008, the fund adopted new accounting guidance that defines fair value, establishes the framework for measuring fair value, and expands the disclosures of fair value measurements in the financial statements. Adoption of this guidance did not have a material impact on the fund’s net assets or results of operations.
On May 1, 2009, the fund adopted new accounting guidance that requires enhanced disclosures about derivative and hedging activities, including how such activities are accounted for and their effect on financial position, performance, and cash flows. Adoption of this guidance had no impact on the fund’s net assets or results of operations.
NOTE 2 - VALUATION
The fund’s investments are reported at fair value as defined under GAAP. The fund values its investments and computes its net asset value per share at the close of the New York Stock Exchange (NYSE), normally 4 p.m. ET, each day that the NYSE is open for business.
Valuation Methods Equity securities listed or regularly traded on a securities exchange or in the over-the-counter (OTC) market are valued at the last quoted sale price or, for certain markets, the official closing price at the time the valuations are made, except for OTC Bulletin Board securities, which are valued at the mean of the latest bid and asked prices. A security that is listed or traded on more than one exchange is valued at the quotation on the exchange determined to be the primary market for such security. Listed securities not traded on a particular day are valued at the mean of the latest bid and asked prices for domestic securities and the last quoted sale price for international securities.
Investments in mutual funds are valued at the mutual fund’s closing net asset value per share on the day of valuation.
Other investments, including restricted securities, and those for which the above valuation procedures are inappropriate or are deemed not to reflect fair value are stated at fair value as determined in good faith by the T. Rowe Price Valuation Committee, established by the fund’s Board of Directors.
For valuation purposes, the last quoted prices of non-U.S. equity securities may be adjusted under the circumstances described below. If the fund determines that developments between the close of a foreign market and the close of the NYSE will, in its judgment, materially affect the value of some or all of its portfolio securities, the fund will adjust the previous closing prices to reflect what it believes to be the fair value of the securities as of the close of the NYSE. In deciding whether it is necessary to adjust closing prices to reflect fair value, the fund reviews a variety of factors, including developments in foreign markets, the performance of U.S. securities markets, and the performance of instruments trading in U.S. markets that represent foreign securities and baskets of foreign securities. A fund may also fair value securities in other situations, such as when a particular foreign market is closed but the fund is open. The fund uses outside pricing services to provide it with closing prices and information to evaluate and/or adjust those prices. The fund cannot predict how often it will use closing prices and how often it will determine it necessary to adjust those prices to reflect fair value. As a means of evaluating its security valuation process, the fund routinely compares closing prices, the next day’s opening prices in the same markets, and adjusted prices.
Valuation Inputs Various inputs are used to determine the value of the fund’s investments. These inputs are summarized in the three broad levels listed below:
Level 1 – quoted prices in active markets for identical securities
Level 2 – observable inputs other than Level 1 quoted prices (including, but not limited to, quoted prices for similar securities, interest rates, prepayment speeds, credit risk)
Level 3 – unobservable inputs
Observable inputs are those based on market data obtained from sources independent of the fund, and unobservable inputs reflect the fund’s own assumptions based on the best information available. The input levels are not necessarily an indication of the risk or liquidity associated with investments at that level. For example, non-U.S. equity securities actively traded in foreign markets generally are reflected in Level 2 despite the availability of closing prices because the fund evaluates and determines whether those closing prices reflect fair value at the close of the NYSE or require adjustment, as described above. The following table summarizes the fund’s investments, based on the inputs used to determine their values on October 31, 2009:

NOTE 3 - OTHER INVESTMENT TRANSACTIONS
Consistent with its investment objective, the fund engages in the following practices to manage exposure to certain risks or to enhance performance. The investment objective, policies, program, and risk factors of the fund are described more fully in the fund’s prospectus and Statement of Additional Information.
Emerging Markets At October 31, 2009, approximately 94% of the fund’s net assets were invested, either directly or indirectly, in securities of companies located in emerging markets, securities issued by governments of emerging market countries, and/or securities denominated in or linked to the currencies of emerging market countries. Emerging market securities are often subject to greater price volatility, less liquidity, and higher rates of inflation than U.S. securities. In addition, emerging markets may be subject to greater political, economic and social uncertainty, and differing regulatory environments that may potentially impact the fund’s ability to buy or sell certain securities or repatriate proceeds to U.S. dollars.
China A-shares During the year ended October 31, 2009, the fund invested in certain Chinese equity securities (A-shares) available only to local Chinese investors and Qualified Foreign Institutional Investors (QFII). The fund gains access to the A-share market through T. Rowe Price International, Inc. (TRPI), which serves as the registered QFII for all participating T. Rowe Price-sponsored investment companies. Investment decisions related to A-shares are specific to each participating fund, and each fund bears the resultant economic and tax consequences of its holdings and transactions in A-shares. The fund is subject to certain restrictions and administrative processes relating to its ability to repatriate cash balances, investment proceeds, and earnings associated with its A-shares and may incur substantial delays in gaining access to its assets or a loss of value in the event of noncompliance with applicable Chinese rules or requirements. Current Chinese tax law is unclear whether capital gains realized on the fund’s investments in A-shares will be subject to tax. Because management believes it more likely than not that Chinese capital gains tax will be imposed, accrued taxes are reflected in the accompanying financial statements.
Other Purchases and sales of portfolio securities other than short-term securities aggregated $130,560,000 and $122,418,000, respectively, for the year ended October 31, 2009.
NOTE 4 - FEDERAL INCOME TAXES
No provision for federal income taxes is required since the fund intends to continue to qualify as a regulated investment company under Subchapter M of the Internal Revenue Code and distribute to shareholders all of its taxable income and gains. Distributions determined in accordance with federal income tax regulations may differ in amount or character from net investment income and realized gains for financial reporting purposes. Financial reporting records are adjusted for permanent book/tax differences to reflect tax character but are not adjusted for temporary differences.
The fund files U.S. federal, state, and local tax returns as required. The fund’s tax returns are subject to examination by the relevant tax authorities until expiration of the applicable statute of limitations, which is generally three years after filing of the tax return but could be longer in certain circumstances.
Reclassifications between income and gain relate primarily to the character of currency gains and losses. For the year ended October 31, 2009, the following reclassifications, which had no impact on results of operations or net assets, were recorded to reflect tax character:

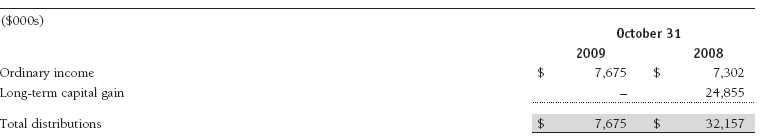
Distributions during the years ended October 31, 2009 and October 31, 2008 were characterized for tax purposes as follows:
At October 31, 2009, the tax-basis cost of investments and components of net assets were as follows:
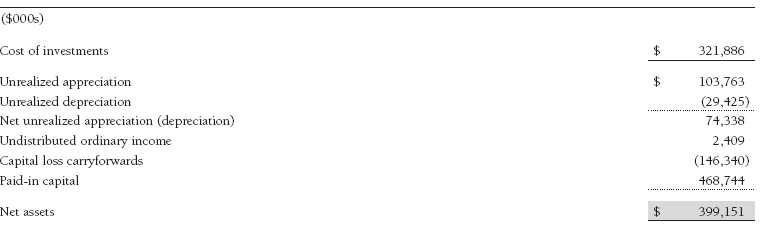
The difference between book-basis and tax-basis net unrealized appreciation (depreciation) is attributable to the deferral of losses from wash sales for tax purposes. The fund intends to retain realized gains to the extent of available capital loss carryforwards. As of October 31, 2009, unused capital loss carryforwards expire as follows: $20,924,000 in fiscal 2016 and $125,416,000 in fiscal 2017.
NOTE 5 - FOREIGN TAXES
The fund is subject to foreign income taxes imposed by certain countries in which it invests. Additionally, capital gains realized by the fund upon disposition of securities issued in or by certain foreign countries are subject to capital gains tax imposed by those countries. All taxes are computed in accordance with the applicable foreign tax law, and, to the extent permitted, capital losses are used to offset capital gains. Tax expense attributable to income is accrued by the fund as a reduction of income. Current and deferred tax expense attributable to net capital gains is reflected as a component of realized and/or change in unrealized gain/loss on securities in the accompanying financial statements. At October 31, 2009, the fund had deferred tax liability of $94,000 attributable to foreign securities and $5,346,000 of foreign capital loss carryforwards, all of which expire in 2017.
NOTE 6 - RELATED PARTY TRANSACTIONS
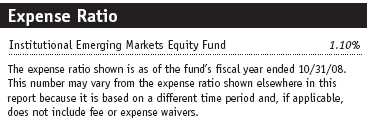
The fund is managed by T. Rowe Price International, Inc. (the manager), a wholly owned subsidiary of T. Rowe Price Associates, Inc. (Price Associates), which is wholly owned by T. Rowe Price Group, Inc. The investment management and administrative agreement between the fund and the manager provides for an all-inclusive annual fee equal to 1.10% of the fund’s average daily net assets. The fee is computed daily and paid monthly. The agreement provides that investment management, shareholder servicing, transfer agency, accounting, custody services, and directors’ fees and expenses are provided to the fund, and interest, taxes, brokerage commissions, and extraordinary expenses are paid directly by the fund.
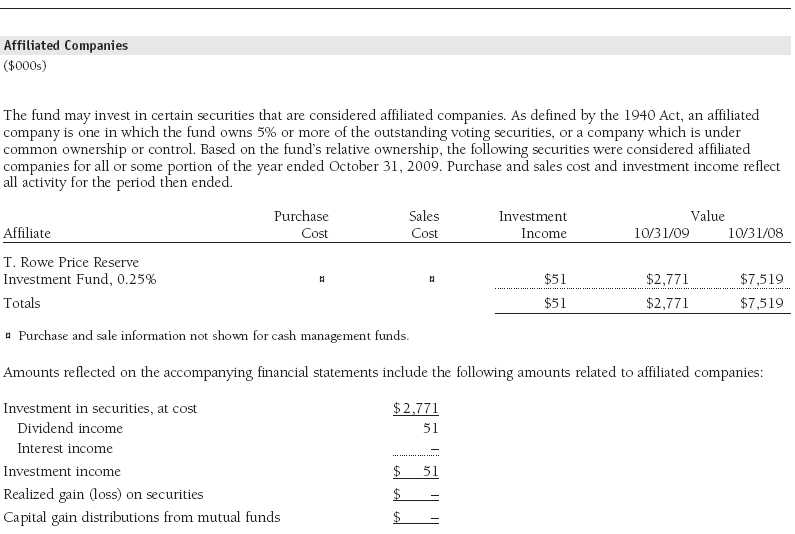
The fund may invest in the T. Rowe Price Reserve Investment Fund and the T. Rowe Price Government Reserve Investment Fund (collectively, the T. Rowe Price Reserve Investment Funds), open-end management investment companies managed by Price Associates and considered affiliates of the fund. The T. Rowe Price Reserve Investment Funds are offered as cash management options to mutual funds, trusts, and other accounts managed by Price Associates and/or its affiliates and are not available for direct purchase by members of the public. The T. Rowe Price Reserve Investment Funds pay no investment management fees.
As of October 31, 2009, T. Rowe Price Group, Inc., and/or its wholly owned subsidiaries owned 261,926 shares of the fund, representing 2% of the fund’s net assets.
Report of Independent Registered Public Accounting Firm
To the Board of Directors of T. Rowe Price Institutional International Funds, Inc. and
Shareholders of T. Rowe Price Institutional Emerging Markets Equity Fund
In our opinion, the accompanying statement of assets and liabilities, including the schedule of investments, and the related statements of operations and of changes in net assets and the financial highlights present fairly, in all material respects, the financial position of T. Rowe Price Institutional Emerging Markets Equity Fund (one of the portfolios comprising T. Rowe Price Institutional International Funds, Inc., hereafter referred to as the “Fund”) at October 31, 2009, the results of its operations for the year then ended, the changes in its net assets for each of the two years in the period then ended and the financial highlights for each of the five years in the period then ended, in conformity with accounting principles generally accepted in the United States of America. These financial statements and financial highlights (hereafter referred to as “financial statements”) are the responsibility of the Fund’s management; our responsibility is to express an opinion on these financial statements based on our audits. We conducted our audits of these financial statements in accordance with the standards of the Public Company Accounting Oversight Board (United States). Those standards require that we plan and perform the audit to obtain reasonable assurance about whether the financial statements are free of material misstatement. An audit includes examining, on a test basis, evidence supporting the amounts and disclosures in the financial statements, assessing the accounting principles used and significant estimates made by management, and evaluating the overall financial statement presentation. We believe that our audits, which included confirmation of securities at October 31, 2009 by correspondence with the custodian, and confirmation of the underlying fund by correspondence with the transfer agent, provide a reasonable basis for our opinion.
PricewaterhouseCoopers LLP
Baltimore, Maryland
December 22, 2009
| TAX INFORMATION (UNAUDITED) FOR THE TAX YEAR ENDED 10/31/09 |
We are providing this information as required by the Internal Revenue Code. The amounts shown may differ from those elsewhere in this report because of differences between tax and financial reporting requirements.
For taxable non-corporate shareholders, $3,254,000 of the fund’s income represents qualified dividend income subject to the 15% rate category.
For corporate shareholders, $47,000 of the fund’s income qualifies for the dividends-received deduction.
The fund will pass through foreign source income of $3,254,000 and foreign taxes paid of $572,000.
| INFORMATION ON PROXY VOTING POLICIES, PROCEDURES, AND RECORDS |
A description of the policies and procedures used by T. Rowe Price funds and portfolios to determine how to vote proxies relating to portfolio securities is available in each fund’s Statement of Additional Information, which you may request by calling 1-800-225-5132 or by accessing the SEC’s Web site, www.sec.gov. The description of our proxy voting policies and procedures is also available on our Web site, www.troweprice.com. To access it, click on the words “Our Company” at the top of our corporate homepage. Then, when the next page appears, click on the words “Proxy Voting Policies” on the left side of the page.
Each fund’s most recent annual proxy voting record is available on our Web site and through the SEC’s Web site. To access it through our Web site, follow the directions above, then click on the words “Proxy Voting Records” on the right side of the Proxy Voting Policies page.
| HOW TO OBTAIN QUARTERLY PORTFOLIO HOLDINGS |
The fund files a complete schedule of portfolio holdings with the Securities and Exchange Commission for the first and third quarters of each fiscal year on Form N-Q. The fund’s Form N-Q is available electronically on the SEC’s Web site (www.sec.gov); hard copies may be reviewed and copied at the SEC’s Public Reference Room, 450 Fifth St. N.W., Washington, DC 20549. For more information on the Public Reference Room, call 1-800-SEC-0330.
| ABOUT THE FUND’S DIRECTORS AND OFFICERS |
Your fund is governed by a Board of Directors (Board) that meets regularly to review a wide variety of matters affecting the fund, including performance, investment programs, compliance matters, advisory fees and expenses, service providers, and other business affairs. The Board elects the fund’s officers, who are listed in the final table. At least 75% of Board members are independent of T. Rowe Price Associates, Inc. (T. Rowe Price), and T. Rowe Price International, Inc. (T. Rowe Price International); “inside” or “interested” directors are employees or officers of T. Rowe Price. The business address of each director and officer is 100 East Pratt Street, Baltimore, Maryland 21202. The Statement of Additional Information includes additional information about the fund directors and is available without charge by calling a T. Rowe Price representative at 1-800-225-5132.
| Independent Directors | |
| Name (Year of Birth) | |
| Year Elected* | Principal Occupation(s) During Past Five Years and Directorships of Other Public Companies |
| Jeremiah E. Casey (1940) | Director, National Life Insurance (2001 to 2005); Director, The Rouse Company, real estate developers |
| 2006 | (1990 to 2004) |
| Anthony W. Deering (1945) | Chairman, Exeter Capital, LLC, a private investment firm (2004 to present); Director, Under Armour |
| 1991 | (2008 to present); Director, Vornado Real Estate Investment Trust (2004 to present); Director, Mercantile |
| Bankshares (2002 to 2007); Member, Advisory Board, Deutsche Bank North America (2004 to present); | |
| Director, Chairman of the Board, and Chief Executive Officer, The Rouse Company, real estate developers | |
| (1997 to 2004) | |
| Donald W. Dick, Jr. (1943) | Principal, EuroCapital Advisors, LLC, an acquisition and management advisory firm (1995 to present) |
| 1989 | |
| Karen N. Horn (1943) | Director, Eli Lilly and Company (1987 to present); Director, Simon Property Group (2004 to present); |
| 2003 | Director, Norfolk Southern (2008 to present); Director, Georgia Pacific (2004 to 2005) |
| Theo C. Rodgers (1941) | President, A&R Development Corporation (1977 to present) |
| 2006 | |
| John G. Schreiber (1946) | Owner/President, Centaur Capital Partners, Inc., a real estate investment company (1991 to present); |
| 2001 | Partner, Blackstone Real Estate Advisors, L.P. (1992 to present) |
| Mark R. Tercek (1957) | President and Chief Executive Officer, The Nature Conservancy (2008 to present); Managing Director, |
| 2009 | The Goldman Sachs Group, Inc. (1984 to 2008) |
| *Each independent director oversees 124 T. Rowe Price portfolios and serves until retirement, resignation, or election of a successor. | |
| Inside Directors | |
| Name | |
| (Year of Birth) | |
| Year Elected* | |
| [Number of T. Rowe Price | |
| Portfolios Overseen] | Principal Occupation(s) During Past Five Years and Directorships of Other Public Companies |
| Edward C. Bernard (1956) | Director and Vice President, T. Rowe Price; Vice Chairman of the Board, Director, and Vice President, T. Rowe |
| 2006 [124] | Price Group, Inc.; Chairman of the Board, Director, and President, T. Rowe Price Investment Services, Inc.; |
| Chairman of the Board and Director, T. Rowe Price Global Asset Management Limited, T. Rowe Price Global | |
| Investment Services Limited, T. Rowe Price Retirement Plan Services, Inc., T. Rowe Price Savings Bank, and | |
| T. Rowe Price Services, Inc.; Director, T. Rowe Price International, Inc.; Chief Executive Officer, Chairman of | |
| the Board, Director, and President, T. Rowe Price Trust Company; Chairman of the Board, all funds | |
| Brian C. Rogers, CFA, CIC (1955) | Chief Investment Officer, Director, and Vice President, T. Rowe Price; Chairman of the Board, Chief Investment |
| 2006 [69] | Officer, Director, and Vice President, T. Rowe Price Group, Inc.; Vice President, T. Rowe Price Trust Company |
| *Each inside director serves until retirement, resignation, or election of a successor. | |
| Officers | |
| Name (Year of Birth) | |
| Position Held With Institutional International Funds | Principal Occupation(s) |
| Christopher D. Alderson (1962) | Chief Executive Officer, Director, and President, T. Rowe Price |
| President | International, Inc.; Vice President, T. Rowe Price Global Investment |
| Services Limited and T. Rowe Price Group, Inc. | |
| Jeffrey W. Arricale, CPA (1971) | Vice President, T. Rowe Price and T. Rowe Price Group, Inc. |
| Vice President | |
| R. Scott Berg, CFA (1972) | Vice President, T. Rowe Price and T. Rowe Price Group, Inc. |
| Executive Vice President | |
| Mark C.J. Bickford-Smith (1962) | Vice President, T. Rowe Price Group, Inc., and T. Rowe Price |
| Vice President | International, Inc. |
| Richard N. Clattenburg, CFA (1979) | Vice President, T. Rowe Price, T. Rowe Price Global Investment Services |
| Vice President | Limited, and T. Rowe Price Group, Inc.; formerly Financial Analyst, |
| Goldman Sachs (to 2005) | |
| Michael J. Conelius, CFA (1964) | Vice President, T. Rowe Price, T. Rowe Price Global Investment Services |
| Executive Vice President | Limited, T. Rowe Price Group, Inc., T. Rowe Price International, Inc., and |
| T. Rowe Price Trust Company | |
| Mark J.T. Edwards (1957) | Vice President, T. Rowe Price Group, Inc., and T. Rowe Price |
| Vice President | International, Inc. |
| Henry M. Ellenbogen (1973) | Vice President, T. Rowe Price and T. Rowe Price Group, Inc. |
| Vice President | |
| Roger L. Fiery III, CPA (1959) | Vice President, T. Rowe Price, T. Rowe Price Group, Inc., T. Rowe Price |
| Vice President | International, Inc., and T. Rowe Price Trust Company |
| Robert N. Gensler (1957) | Vice President, T. Rowe Price, T. Rowe Price Global Investment Services |
| Executive Vice President | Limited, T. Rowe Price Group, Inc., and T. Rowe Price International, Inc. |
| John R. Gilner (1961) | Chief Compliance Officer and Vice President, T. Rowe Price; Vice President, |
| Chief Compliance Officer | T. Rowe Price Group, Inc., and T. Rowe Price Investment Services, Inc. |
| Gregory S. Golczewski (1966) | Vice President, T. Rowe Price and T. Rowe Price Trust Company |
| Vice President | |
| M. Campbell Gunn (1956) | Vice President, T. Rowe Price Global Investment Services Limited, |
| Vice President | T. Rowe Price Group, Inc., and T. Rowe Price International, Inc. |
| Gregory K. Hinkle, CPA (1958) | Vice President, T. Rowe Price, T. Rowe Price Group, Inc., and T. Rowe Price |
| Treasurer | Trust Company; formerly Partner, PricewaterhouseCoopers, LLP |
| (to 2007) | |
| Kris H. Jenner, M.D., D.Phil. (1962) | Vice President, T. Rowe Price, T. Rowe Price Global Investment Services |
| Vice President | Limited, and T. Rowe Price Group, Inc. |
| Ian D. Kelson (1956) | Vice President, T. Rowe Price, T. Rowe Price Global Investment Services |
| Executive Vice President | Limited, T. Rowe Price Group, Inc., and T. Rowe Price International, Inc. |
| Patricia B. Lippert (1953) | Assistant Vice President, T. Rowe Price and T. Rowe Price Investment |
| Secretary | Services, Inc. |
| Anh Lu (1968) | Vice President, T. Rowe Price Group, Inc., and T. Rowe Price |
| Vice President | International, Inc. |
| Charles M. Ober, CFA (1950) | Vice President, T. Rowe Price and T. Rowe Price Group, Inc. |
| Vice President | |
| David Oestreicher (1967) | Director and Vice President, T. Rowe Price Investment Services, Inc., |
| Vice President | T. Rowe Price Trust Company, and T. Rowe Price Services, Inc.; Vice |
| President, T. Rowe Price, T. Rowe Price Global Asset Management Limited, | |
| T. Rowe Price Global Investment Services Limited, T. Rowe Price Group, | |
| Inc., T. Rowe Price International, Inc., and T. Rowe Price Retirement Plan | |
| Services, Inc. | |
| Gonzalo Pángaro, CFA (1968) | Vice President, T. Rowe Price Group, Inc., and T. Rowe Price |
| Executive Vice President | International, Inc. |
| Joseph Rohm (1966) | Vice President, T. Rowe Price Group, Inc., and T. Rowe Price International, |
| Executive Vice President | Inc.; formerly Equity Analyst, Insight Investment (to 2005) |
| Jeffrey Rottinghaus, CPA (1970) | Vice President, T. Rowe Price, T. Rowe Price Global Investment Services |
| Vice President | Limited, and T. Rowe Price Group, Inc. |
| Deborah D. Seidel (1962) | Vice President, T. Rowe Price, T. Rowe Price Investment Services, Inc., and |
| Vice President | T. Rowe Price Services, Inc. |
| Robert W. Sharps, CFA, CPA (1971) | Vice President, T. Rowe Price, T. Rowe Price Group, Inc., and T. Rowe Price |
| Vice President | Trust Company |
| Robert W. Smith (1961) | Vice President, T. Rowe Price, T. Rowe Price Group, Inc., and T. Rowe Price |
| Executive Vice President | Trust Company |
| Dean Tenerelli (1964) | Vice President, T. Rowe Price Group, Inc., and T. Rowe Price |
| Vice President | International, Inc. |
| Julie L. Waples (1970) | Vice President, T. Rowe Price |
| Vice President | |
| Unless otherwise noted, officers have been employees of T. Rowe Price or T. Rowe Price International for at least five years. | |
Item 2. Code of Ethics.
The registrant has adopted a code of ethics, as defined in Item 2 of Form N-CSR, applicable to its principal executive officer, principal financial officer, principal accounting officer or controller, or persons performing similar functions. A copy of this code of ethics is filed as an exhibit to this Form N-CSR. No substantive amendments were approved or waivers were granted to this code of ethics during the period covered by this report.
Item 3. Audit Committee Financial Expert.
The registrant’s Board of Directors/Trustees has determined that Mr. Anthony W. Deering qualifies as an audit committee financial expert, as defined in Item 3 of Form N-CSR. Mr. Deering is considered independent for purposes of Item 3 of Form N-CSR.
Item 4. Principal Accountant Fees and Services.
(a) – (d) Aggregate fees billed to the registrant for the last two fiscal years for professional services rendered by the registrant’s principal accountant were as follows:
Audit fees include amounts related to the audit of the registrant’s annual financial statements and services normally provided by the accountant in connection with statutory and regulatory filings. Audit-related fees include amounts reasonably related to the performance of the audit of the registrant’s financial statements and specifically include the issuance of a report on internal controls and, if applicable, agreed-upon procedures related to fund acquisitions. Tax fees include amounts related to services for tax compliance, tax planning, and tax advice. The nature of these services specifically includes the review of distribution calculations and the preparation of Federal, state, and excise tax returns. All other fees include the registrant’s pro-rata share of amounts for agreed-upon procedures in conjunction with service contract approvals by the registrant’s Board of Directors/Trustees.
(e)(1) The registrant’s audit committee has adopted a policy whereby audit and non-audit services performed by the registrant’s principal accountant for the registrant, its investment adviser, and any entity controlling, controlled by, or under common control with the investment adviser that provides ongoing services to the registrant require pre-approval in advance at regularly scheduled audit committee meetings. If such a service is required between regularly scheduled audit committee meetings, pre-approval may be authorized by one audit committee member with ratification at the next scheduled audit committee meeting. Waiver of pre-approval for audit or non-audit services requiring fees of a de minimis amount is not permitted.
(2) No services included in (b) – (d) above were approved pursuant to paragraph (c)(7)(i)(C) of Rule 2-01 of Regulation S-X.
(f) Less than 50 percent of the hours expended on the principal accountant’s engagement to audit the registrant’s financial statements for the most recent fiscal year were attributed to work performed by persons other than the principal accountant’s full-time, permanent employees.
(g) The aggregate fees billed for the most recent fiscal year and the preceding fiscal year by the registrant’s principal accountant for non-audit services rendered to the registrant, its investment adviser, and any entity controlling, controlled by, or under common control with the investment adviser that provides ongoing services to the registrant were $2,179,000 and $2,174,000, respectively.
(h) All non-audit services rendered in (g) above were pre-approved by the registrant’s audit committee. Accordingly, these services were considered by the registrant’s audit committee in maintaining the principal accountant’s independence.
Item 5. Audit Committee of Listed Registrants.
Not applicable.
Item 6. Investments.
(a) Not applicable. The complete schedule of investments is included in Item 1 of this Form N-CSR.
(b) Not applicable.
Item 7. Disclosure of Proxy Voting Policies and Procedures for Closed-End Management Investment Companies.
Not applicable.
Item 8. Portfolio Managers of Closed-End Management Investment Companies.
Not applicable.
Item 9. Purchases of Equity Securities by Closed-End Management Investment Company and Affiliated Purchasers.
Not applicable.
Item 10. Submission of Matters to a Vote of Security Holders.
Not applicable.
Item 11. Controls and Procedures.
(a) The registrant’s principal executive officer and principal financial officer have evaluated the registrant’s disclosure controls and procedures within 90 days of this filing and have concluded that the registrant’s disclosure controls and procedures were effective, as of that date, in ensuring that information required to be disclosed by the registrant in this Form N-CSR was recorded, processed, summarized, and reported timely.
(b) The registrant’s principal executive officer and principal financial officer are aware of no change in the registrant’s internal control over financial reporting that occurred during the registrant’s second fiscal quarter covered by this report that has materially affected, or is reasonably likely to materially affect, the registrant’s internal control over financial reporting.
Item 12. Exhibits.
(a)(1) The registrant’s code of ethics pursuant to Item 2 of Form N-CSR is attached.
(2) Separate certifications by the registrant's principal executive officer and principal financial officer, pursuant to Section 302 of the Sarbanes-Oxley Act of 2002 and required by Rule 30a-2(a) under the Investment Company Act of 1940, are attached.
(3) Written solicitation to repurchase securities issued by closed-end companies: not applicable.
(b) A certification by the registrant's principal executive officer and principal financial officer, pursuant to Section 906 of the Sarbanes-Oxley Act of 2002 and required by Rule 30a-2(b) under the Investment Company Act of 1940, is attached.
SIGNATURES | |
| Pursuant to the requirements of the Securities Exchange Act of 1934 and the Investment | |
| Company Act of 1940, the registrant has duly caused this report to be signed on its behalf by the | |
| undersigned, thereunto duly authorized. | |
| T. Rowe Price Institutional International Funds, Inc. | |
| By | /s/ Edward C. Bernard |
| Edward C. Bernard | |
| Principal Executive Officer | |
| Date | December 22, 2009 |
| Pursuant to the requirements of the Securities Exchange Act of 1934 and the Investment | |
| Company Act of 1940, this report has been signed below by the following persons on behalf of | |
| the registrant and in the capacities and on the dates indicated. | |
| By | /s/ Edward C. Bernard |
| Edward C. Bernard | |
| Principal Executive Officer | |
| Date | December 22, 2009 |
| By | /s/ Gregory K. Hinkle |
| Gregory K. Hinkle | |
| Principal Financial Officer | |
| Date | December 22, 2009 |