| UNITED STATES |
| SECURITIES AND EXCHANGE COMMISSION |
| Washington, D.C. 20549 |
FORM N-CSR |
CERTIFIED SHAREHOLDER REPORT OF REGISTERED |
MANAGEMENT INVESTMENT COMPANIES |
| Investment Company Act File Number: 811-5833 |
| T. Rowe Price Institutional International Funds, Inc. |
| (Exact name of registrant as specified in charter) |
| 100 East Pratt Street, Baltimore, MD 21202 |
| (Address of principal executive offices) |
| David Oestreicher |
| 100 East Pratt Street, Baltimore, MD 21202 |
| (Name and address of agent for service) |
| Registrant’s telephone number, including area code: (410) 345-2000 |
| Date of fiscal year end: October 31 |
| Date of reporting period: October 31, 2009 |
Item 1: Report to Shareholders
 |
| Institutional Global Large-Cap Equity Fund | October 31, 2009 |
| Highlights |
• Global large-cap equities rebounded sharply from the market sell-off, generating solid returns for the last year.
• Your fund produced exceptional returns during the 6- and 12-month periods ended October 31, 2009, as we took advantage of depressed prices among high-quality companies.
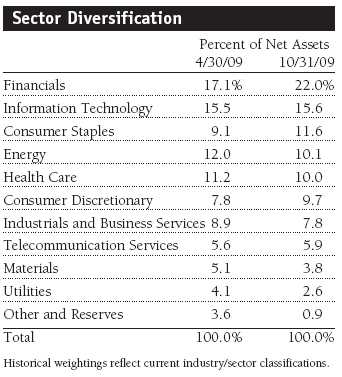
• We increased our exposure to the consumer discretionary and consumer staples sectors, where we have identified stocks that should perform well during a period of modest global expansion.
• We continue to build a portfolio of high-quality companies with robust franchises that should benefit from an improved economy.
The views and opinions in this report were current as of October 31, 2009. They are not guarantees of performance or investment results and should not be taken as investment advice. Investment decisions reflect a variety of factors, and the managers reserve the right to change their views about individual stocks, sectors, and the markets at any time. As a result, the views expressed should not be relied upon as a forecast of the fund’s future investment intent. The report is certified under the Sarbanes-Oxley Act, which requires mutual funds and other public companies to affirm that, to the best of their knowledge, the information in their financial reports is fairly and accurately stated in all material respects.
Manager’s Letter
T. Rowe Price Institutional Global Large-Cap Equity Fund
Dear Investor
Global large-cap equities fell to multiyear lows early in the year before embarking on a strong rally. As the shock waves from one of the worst economic downturns since the Great Depression abated, global markets surged, particularly in the emerging world. Central banks and governments throughout the world took unprecedented steps to ease the credit crisis that had sparked the global sell-off, which enticed investors to buy shares of companies at bargain prices. In this environment, your fund generated extraordinary returns.
Performance Review
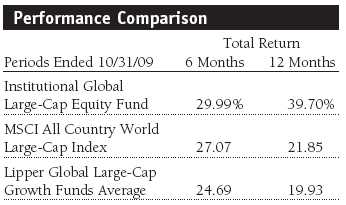
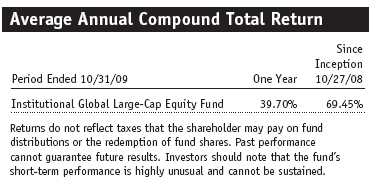
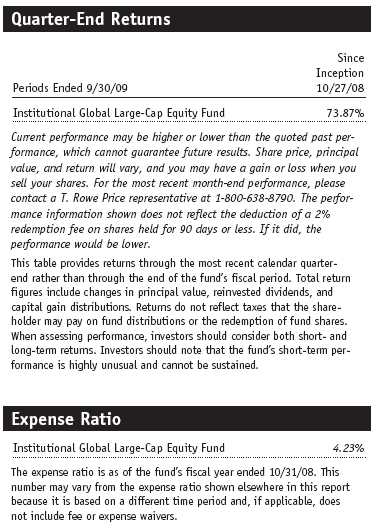
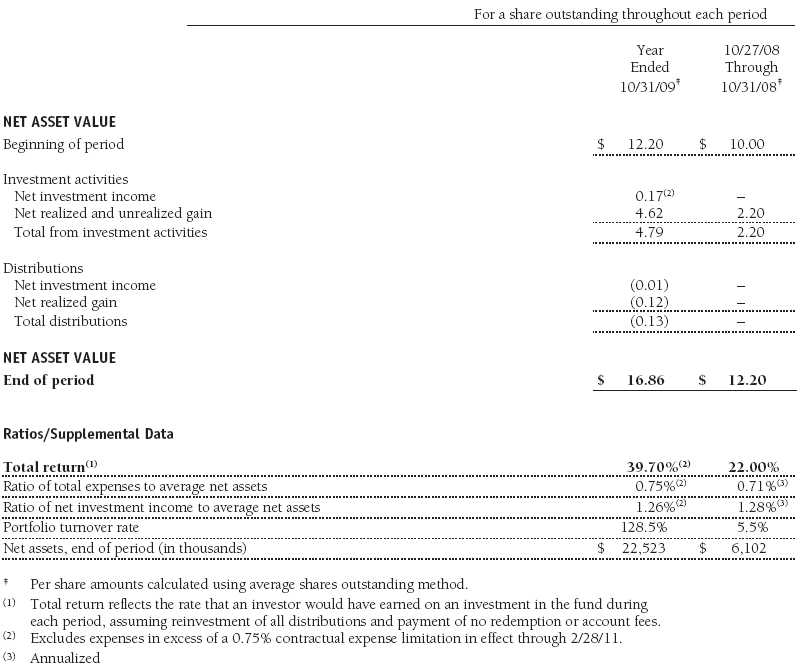
Your fund returned 29.99% and 39.70% during the 6- and 12-month periods ended October 31, 2009, respectively. For the last six months, fund performance exceeded returns for the MSCI All Country World Large-Cap Index and the Lipper Global Large-Cap Growth Funds Average. In the last 12 months, the fund handily outpaced the benchmarks. This was, in part, due to the fact that the fund’s inception on October 27, 2008, following a precipitous drop in stock prices, allowed us to accumulate a large number of shares of high-quality companies at low prices.
Market Review
Shock waves from the financial crisis and the collapse in economic growth that began last year sent global markets plummeting. But unprecedented measures enacted by governments around the world proved an effective response, helping to restore stability to the financial system and open up much-needed access to credit. Interest rate cuts, tax breaks, and subsidies were also implemented in an attempt to underpin consumer spending. Markets hit their lows in early March before turning higher in anticipation of a recovery in the global economy and then strengthened further as most developed countries—which had been hardest hit by the slowdown—showed signs of renewed growth.
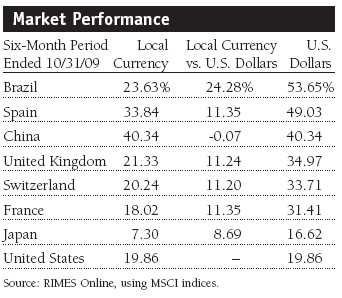
The performances of global economies, stock markets, and currencies varied widely. U.S. and European equities posted double-digit gains, recovering from their steep declines during the period. Corporate earnings in these countries were supportive, holding up better than had been forecast at the depths of the economic slowdown. Many companies cut costs and reduced inventories to counter falling revenues. Among the major developed markets, Japan was particularly weak as it struggled to cope with a rising yen, sluggish exports, and persistent deflationary pressures. However, with the financial crisis originating and principally unfolding in the developed world, many emerging countries experienced a relatively modest negative impact on their financial institutions. The rebound in economic growth, combined with a widespread return in investors’ willingness to buy riskier assets, helped stocks in emerging markets post far higher returns than their developed counterparts. The strength of many currencies against the U.S. dollar augmented returns as investors searched for higher yields.
There was also a sharp difference in performance among sectors. Materials delivered the strongest returns, boosted by renewed global demand for commodities, with China’s capital expenditure program acting as a key influence. The information technology sector outperformed, with many companies that had experienced the bursting of the dot-com bubble proving adept at navigating the downturn. Financials also experienced a sharp turnaround in the second half of the period, more than doubling from its lows as investors became increasingly convinced that the worst of the financial crisis had passed. The health care sector lagged, as it was hampered by uncertainty about U.S. reforms.
Portfolio Review and Strategy
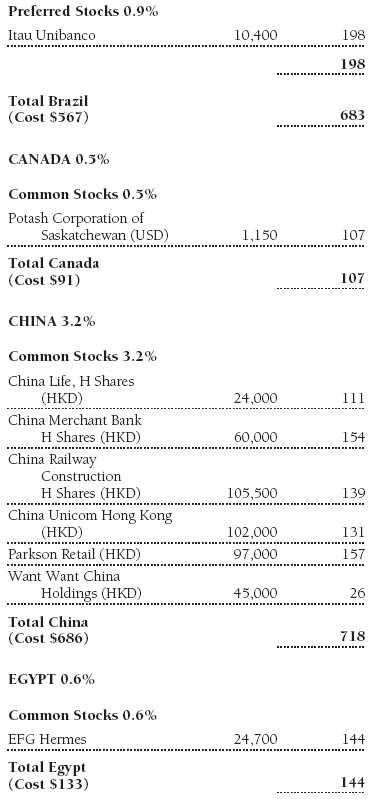
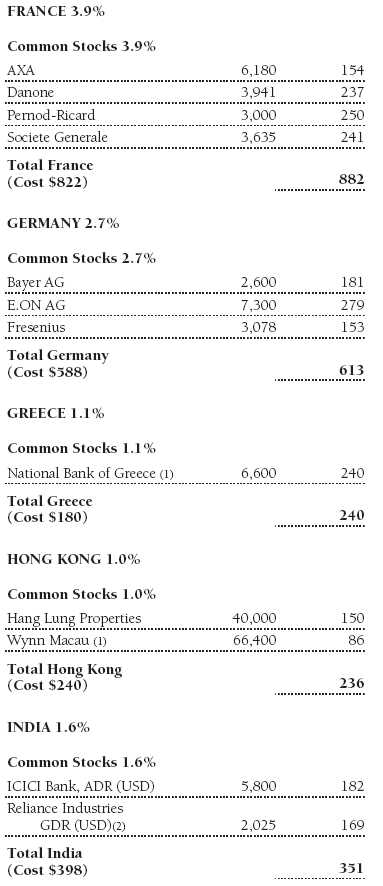
The portfolio delivered strong returns over the period, significantly outpacing the gains of the wider market. Our emphasis on holding well-managed companies that are capable of building profits even in the tougher economic environment proved successful. Two examples were Amazon and Apple, companies we believed would come through the downturn with their market position strengthened. Amazon offered a robust business model and significant competitive advantages while its stock appeared undervalued. The company was able to maintain its high growth rates, with a boost from international operations, as it took market share from competitors that were forced to retrench by the slowdown. Apple’s products clearly demonstrated the ability to redefine the user experience, helping the tech company to continue to build its unique global brand, with competitive pricing power that resulted in high profitability. The iPhone maintained this momentum, allowing Apple to outstrip expectations for sales, take market share from rivals, and deliver strong returns for stockholders. (Please refer to the portfolio of investments for a complete listing of holdings and the amount each represents in the portfolio.)
Financials remained in the spotlight for most of the period, offering several opportunities to buy high-quality companies at depressed prices. In January, we purchased shares in Bank of America (BoA) as we identified a significant disconnect between the bank’s stock price and its earnings potential, given the strength and breadth of its franchise. Considering the severity of the financial crisis, investors were pricing in a worst-case scenario, but this failed to differentiate between BoA and other banks in far weaker positions. With government measures helping to rebuild confidence in the sector, BoA raised additional capital to bolster its balance sheet, further increasing its ability to withstand loan losses from the economic downturn. As its valuation returned to more normal levels, the stock made significant gains, which boosted portfolio returns.
Many of the fund’s top contributors from the financials sector were based in emerging markets, where banking systems continued to function relatively well despite sharp declines in stock markets and economic growth in the second half of 2008. Throughout this turmoil, we focused on companies with the most attractive long-term growth characteristics and valuation potential. Two of them were from Brazil: Latin America’s largest stock exchange, BM&F Bovespa, which benefited in the second half of the period from a recovery in trading volumes and a reduction in costs, and the commercial bank Itau Unibanco, whose profitability remained solid as its loan book continued to expand. Brazil was one of the first countries recognized as having strong secular growth prospects through the downturn, confirming the economy’s comparative resilience. Domestic activity was particularly robust, as rising salaries helped keep consumption and demand for credit at elevated levels.
A similar pattern emerged in the energy sector, with emerging market holdings delivering the strongest contributions. At the start of the period, many of these stocks were trading at depressed levels on speculation that countries that had expanded the fastest during global expansion would suffer excessively during the slowdown. This negative sentiment created opportunities to invest in companies with valuations that did not fully reflect their potential. As emerging market growth held up better than expected, prices for many commodities (including oil) rebounded. Another Brazilian holding in the portfolio, the state-owned oil producer Petroleo Brasileiro, rose sharply as oil prices more than doubled from the lows of late 2008 and investors highlighted the company’s potential to double reserves within a few years. Coal producer China Shenhua Energy also made significant gains on higher volumes, helped by the rise in demand created by the Chinese government’s stimulus program. We have elected to take profits and sell out of the position.
Among industrials, port operator DP World was the most significant contributor. This Dubai-listed company owns a number of ports around the world and is an attractive business due to the long duration and unique nature of these assets. Considering its enduring growth prospects, DP World appeared undervalued compared with its global peers following the sell-off. We added a position in April that proved rewarding as investors began to anticipate a recovery in world trade and the company’s valuation gap relative to its competitors narrowed.
Our selection of holdings in the materials sector proved to be the largest disadvantage to the fund’s performance. Our underweight exposure to the sector, which was the strongest performer over the last 12 months as commodity prices rebounded sharply, also proved detrimental. Among specific holdings that performed poorly, Allied Irish Banks’ earnings power appeared significantly impaired following the Irish government’s reforms of the country’s troubled banking system. We eliminated the position.
The portfolio’s allocation to various sectors is largely in line with the benchmark, given our focus on generating solid returns at the stock level among outstanding companies. However, we have a significant overweight to the information technology sector, where we find a number of high-quality businesses. Apple, Microsoft, and Google share many positive characteristics, such as strong cash flows and balance sheets, the ability to take market share, and reasonable valuations compared with historical levels. These businesses experienced tough conditions in the years following the ending of the tech boom, and they have proved adept at navigating the current downturn.
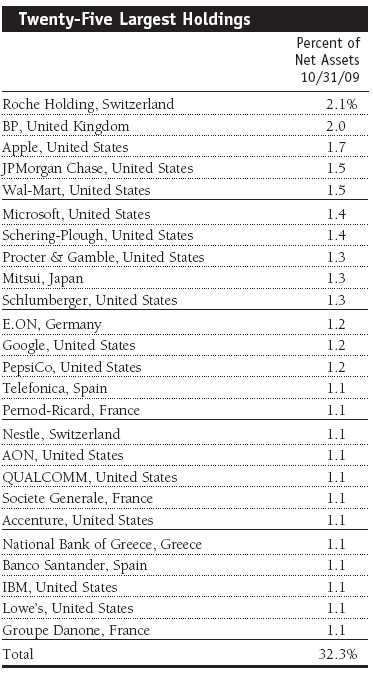
We also moved to an overweight position in consumer discretionary and consumer staples sectors. We identified a number of stocks in both sectors that have the potential to produce moderate but durable growth within a global economy likely to expand at a rate below recent peak levels. In the consumer staples sector, holdings include Procter & Gamble, PepsiCo, and Nestle, all of which have strong global franchises, including a significant presence in higher-growth emerging markets. Among consumer discretionary companies, one of our largest positions is the home improvement group Lowe’s. Although recovery signs in the U.S. housing market are still tentative, Lowe’s benefits from a favorable competitive environment and recently traded at what we believe was an extremely reasonable valuation.
Outlook
We are in the midst of a transition for global equities that promises to challenge investors but present good opportunities in individual stocks. On balance, we remain positive given that equities are still attractive compared with historical valuations and offer better upside potential relative to many asset classes. However, headwinds persist, and global economic conditions are likely to remain tough into 2010. Although the global economic recession may have bottomed out, there is still great uncertainty about the strength of any recovery, with the secondary effects of higher unemployment not yet fully apparent. While it seems we are beyond the midway point of the financial crisis, there are serious ongoing problems, with the emphasis now shifting from high levels of consumer debt and the solvency of financial institutions to the debt burden of governments and potential repercussions for currencies. In addition, we believe the eventual withdrawal of economic and financial stabilization programs could become a concern for investors. A sustained recovery will depend on renewed consumer and corporate demand that will ultimately allow companies to rebuild profitably through sales growth.
We retain our focus on high-quality companies with robust franchises, strong cash flow yields, and solid balance sheets, and we are aiming to identify businesses that will prosper during the next economic cycle. The economic environment, though improving, is likely to remain difficult for many companies. This will provide further market share and consolidation opportunities for stronger players as their weaker peers fall away. The fund continues to seek out the best global growth opportunities, and we believe that our potential to deliver strong returns remains as high as ever, given attractive valuations and the long-term expansion we expect from our holdings.
As always, thank you for investing with T. Rowe Price.
Respectfully submitted,

R. Scott Berg
Portfolio manager and chairman of the fund’s Investment Advisory Committee
November 11, 2009
The committee chairman has day-to-day responsibility for managing the portfolio and works with committee members in developing and executing the fund’s investment program.
| Risks of International Investing |
Funds that invest overseas generally carry more risk than funds that invest strictly in U.S. assets. Funds investing in a single country or in a limited geographic region tend to be riskier than more diversified funds. Risks can result from varying stages of economic and political development; differing regulatory environments, trading days, and accounting standards; and higher transaction costs of non-U.S. markets. Non-U.S. investments are also subject to currency risk, or a decline in the value of a foreign currency versus the U.S. dollar, which reduces the dollar value of securities denominated in that currency.
| Glossary |
Lipper averages: The averages of available mutual fund performance returns for specified periods in defined categories as tracked by Lipper Inc.
MSCI All Country World Large-Cap Index: A capitalization-weighted index of large-cap stocks from developed and emerging markets worldwide.
Portfolio Highlights
Performance and Expenses
T. Rowe Price Institutional Global Large-Cap Equity Fund
| Performance Comparison |
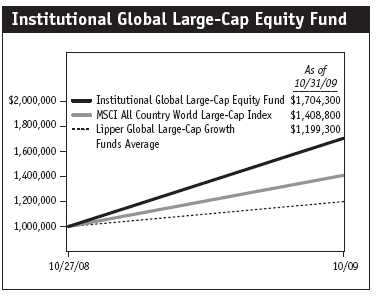
This chart shows the value of a hypothetical $1 million investment in the fund over the past 10 fiscal year periods or since inception (for funds lacking 10-year records). The result is compared with benchmarks, which may include a broad-based market index and a peer group average or index. Market indexes do not include expenses, which are deducted from fund returns as well as mutual fund averages and indexes.
This table shows how the fund would have performed each year if its actual (or cumulative) returns for the periods shown had been earned at a constant rate.
Fund Expense Example
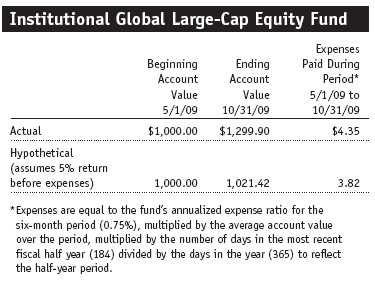
As a mutual fund shareholder, you may incur two types of costs: (1) transaction costs, such as redemption fees or sales loads, and (2) ongoing costs, including management fees, distribution and service (12b-1) fees, and other fund expenses. The following example is intended to help you understand your ongoing costs (in dollars) of investing in the fund and to compare these costs with the ongoing costs of investing in other mutual funds. The example is based on an investment of $1,000 invested at the beginning of the most recent six-month period and held for the entire period.
Actual Expenses
The first line of the following table (“Actual”) provides information about actual account values and actual expenses. You may use the information in this line, together with your account balance, to estimate the expenses that you paid over the period. Simply divide your account value by $1,000 (for example, an $8,600 account value divided by $1,000 = 8.6), then multiply the result by the number in the first line under the heading “Expenses Paid During Period” to estimate the expenses you paid on your account during this period.
Hypothetical Example for Comparison Purposes
The information on the second line of the table (“Hypothetical”) is based on hypothetical account values and expenses derived from the fund’s actual expense ratio and an assumed 5% per year rate of return before expenses (not the fund’s actual return). You may compare the ongoing costs of investing in the fund with other funds by contrasting this 5% hypothetical example and the 5% hypothetical examples that appear in the shareholder reports of the other funds. The hypothetical account values and expenses may not be used to estimate the actual ending account balance or expenses you paid for the period.
You should also be aware that the expenses shown in the table highlight only your ongoing costs and do not reflect any transaction costs, such as redemption fees or sales loads. Therefore, the second line of the table is useful in comparing ongoing costs only and will not help you determine the relative total costs of owning different funds. To the extent a fund charges transaction costs, however, the total cost of owning that fund is higher.
Financial Highlights
T. Rowe Price Institutional Global Large-Cap Equity Fund
The accompanying notes are an integral part of these financial statements.
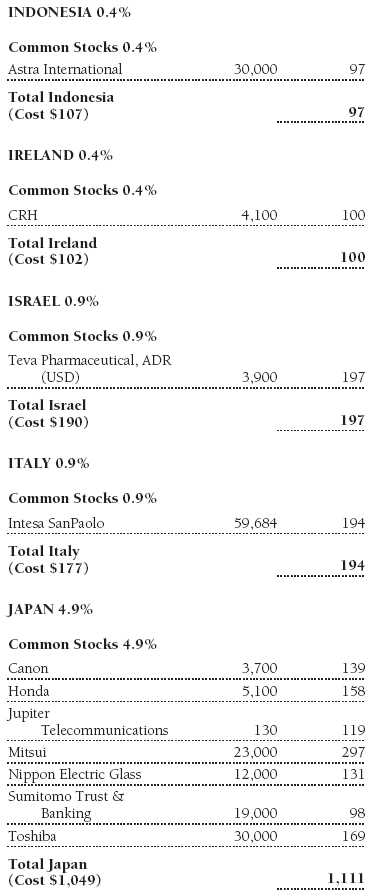
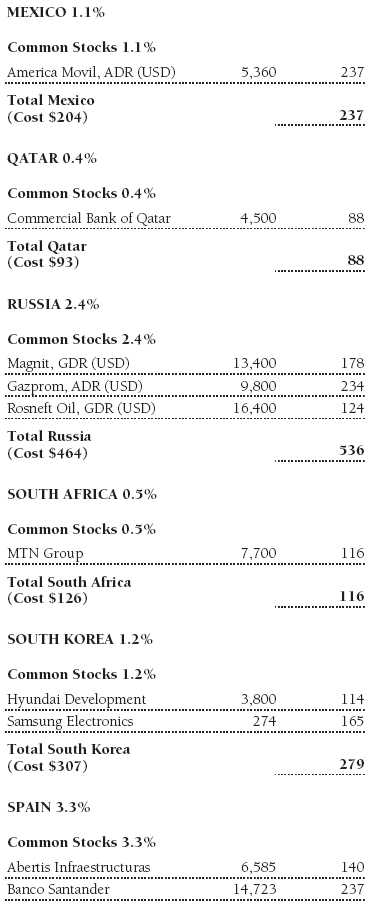
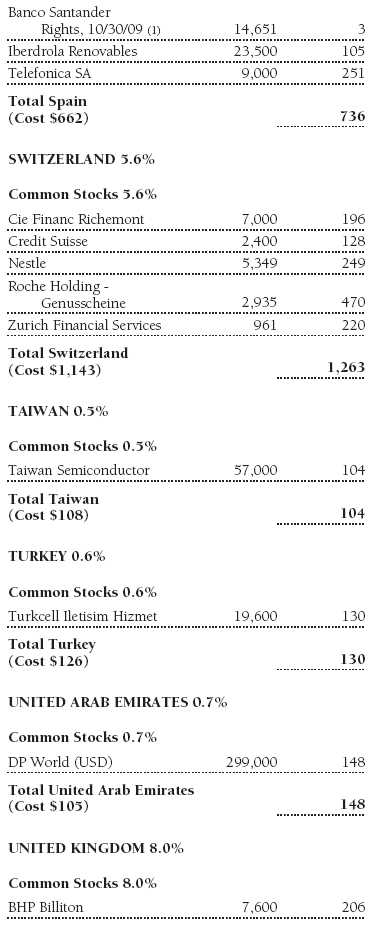
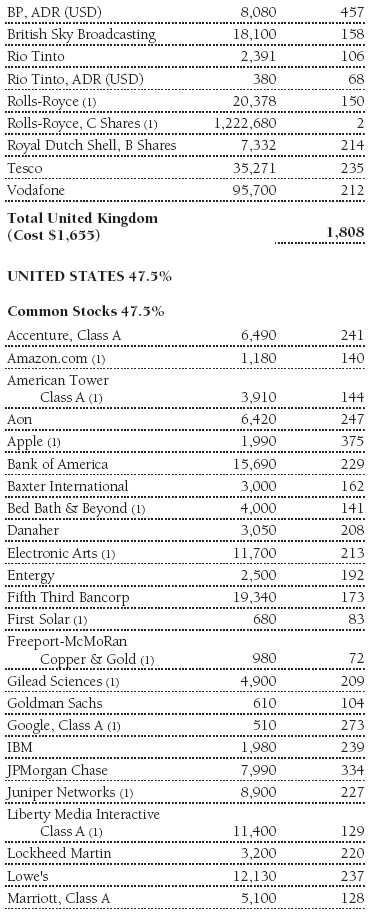
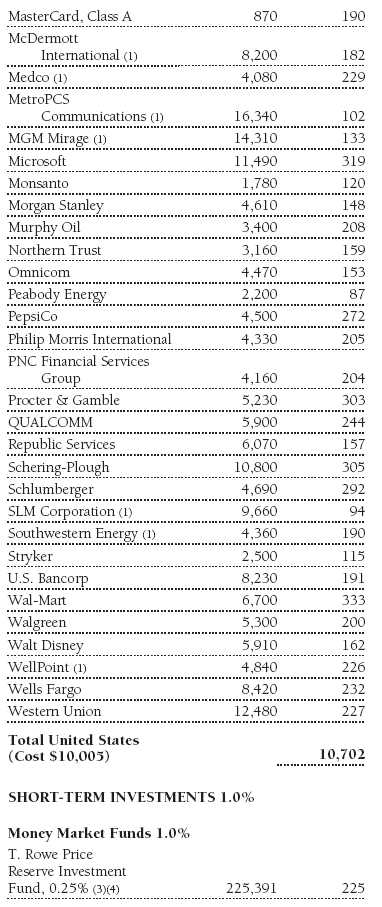
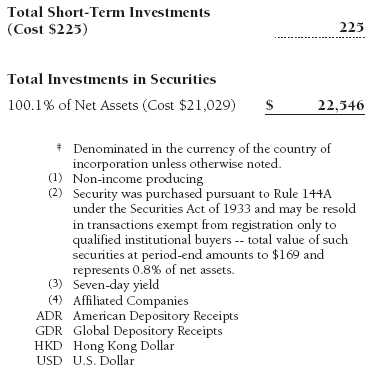
Portfolio of Investments‡
T. Rowe Price Institutional Global Large-Cap Equity Fund
October 31, 2009
The accompanying notes are an integral part of these financial statements.
Statement of Assets and Liabilities
T. Rowe Price Institutional Global Large-Cap Equity Fund
October 31, 2009
($000s except shares and per share amounts)
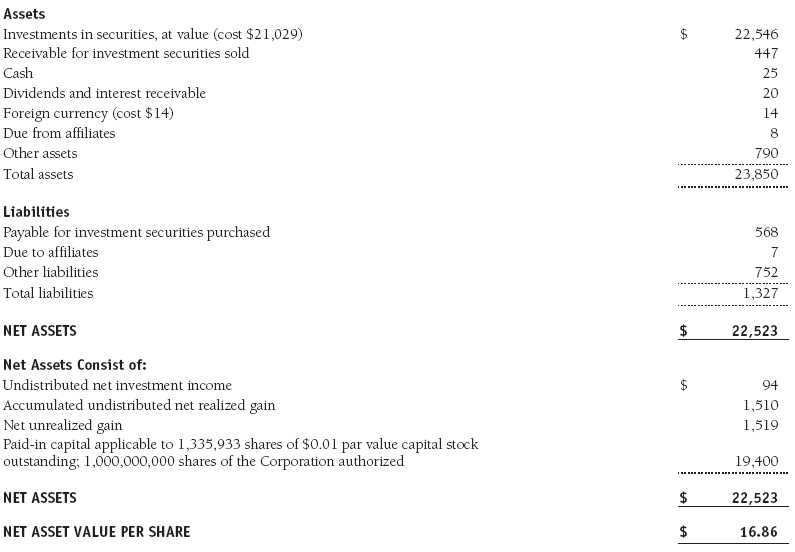
The accompanying notes are an integral part of these financial statements.
Statement of Operations
T. Rowe Price Institutional Global Large-Cap Equity Fund
($000s)
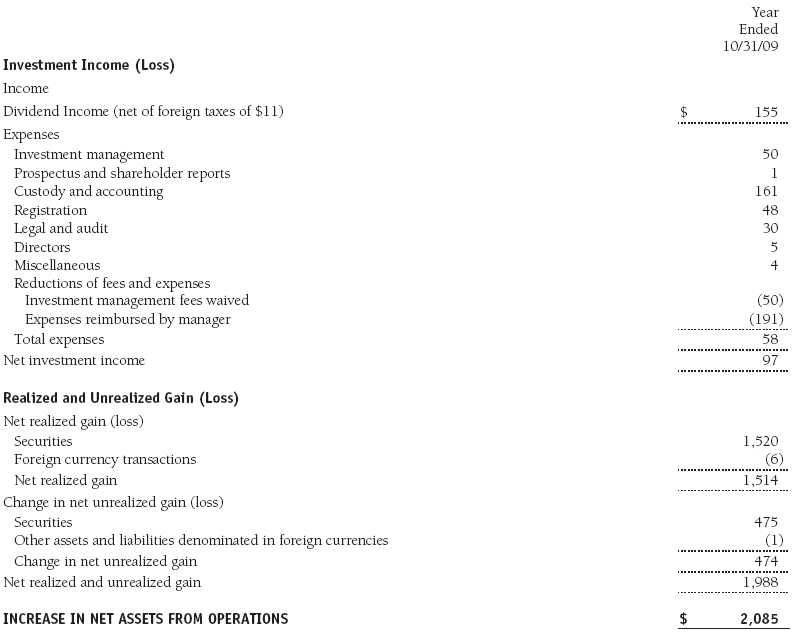
The accompanying notes are an integral part of these financial statements.
Statement of Changes in Net Assets
T. Rowe Price Institutional Global Large-Cap Equity Fund
($000s)

The accompanying notes are an integral part of these financial statements.
Notes to Financial Statements
T. Rowe Price Institutional Global Large-Cap Equity Fund
October 31, 2009
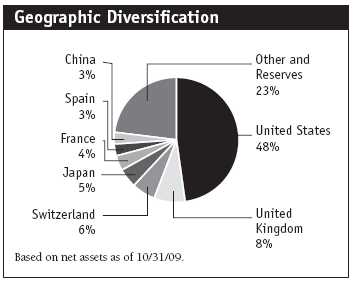
T. Rowe Price Institutional International Funds, Inc. (the corporation), is registered under the Investment Company Act of 1940 (the 1940 Act). The Institutional Global Large-Cap Equity Fund (the fund), a diversified, open-end management investment company, is one portfolio established by the corporation. The fund commenced operations on October 27, 2008. The fund seeks long-term growth of capital through investments primarily in the common stocks of large-cap companies throughout the world, including the U.S.
NOTE 1 - SIGNIFICANT ACCOUNTING POLICIES
Basis of Preparation The accompanying financial statements were prepared in accordance with accounting principles generally accepted in the United States of America (GAAP), which require the use of estimates made by fund management. Fund management believes that estimates and security valuations are appropriate; however, actual results may differ from those estimates, and the security valuations reflected in the accompanying financial statements may differ from the value the fund ultimately realizes on the securities. Further, fund management believes that no events have occurred between October 31, 2009, the date of this report, and December 22, 2009, the date of issuance of the financial statements, that require adjustment of, or disclosure in, the accompanying financial statements.
Investment Transactions, Investment Income, and Distributions Income and expenses are recorded on the accrual basis. Dividends received from mutual fund investments are reflected as dividend income; capital gain distributions are reflected as realized gain/loss. Dividend income and capital gain distributions are recorded on the ex-dividend date. Income tax-related interest and penalties, if incurred, would be recorded as income tax expense. Investment transactions are accounted for on the trade date. Realized gains and losses are reported on the identified cost basis. Distributions to shareholders are recorded on the ex-dividend date. Income distributions are declared and paid annually. Capital gain distributions, if any, are generally declared and paid by the fund, annually.
Currency Translation Assets, including investments, and liabilities denominated in foreign currencies are translated into U.S. dollar values each day at the prevailing exchange rate, using the mean of the bid and asked prices of such currencies against U.S. dollars as quoted by a major bank. Purchases and sales of securities, income, and expenses are translated into U.S. dollars at the prevailing exchange rate on the date of the transaction. The effect of changes in foreign currency exchange rates on realized and unrealized security gains and losses is reflected as a component of security gains and losses.
Redemption Fees A 2% fee is assessed on redemptions of fund shares held for 90 days or less to deter short-term trading and to protect the interests of long-term shareholders. Redemption fees are withheld from proceeds that shareholders receive from the sale or exchange of fund shares. The fees are paid to the fund and are recorded as an increase to paid-in capital. The fees may cause the redemption price per share to differ from the net asset value per share.
In-Kind Subscriptions Under certain circumstances, and when considered to be in the best interest of the fund, the fund may accept portfolio securities rather than cash as payment for the purchase of fund shares (in-kind subscription). For financial reporting and tax purposes, the cost basis of contributed securities is equal to the market value of the securities on the date of contribution. In-kind subscriptions result in no gain or loss and no tax consequences for the fund. During the year ended October 31, 2009, the fund accepted $3,401,000 of in-kind subscriptions, including $2,993,000 from other T. Rowe Price funds.
New Accounting Pronouncements On November 1, 2008, the fund adopted new accounting guidance that defines fair value, establishes the framework for measuring fair value, and expands the disclosures of fair value measurements in the financial statements. Adoption of this guidance did not have a material impact on the fund’s net assets or results of operations.
On May 1, 2009, the fund adopted new accounting guidance that requires enhanced disclosures about derivative and hedging activities, including how such activities are accounted for and their effect on financial position, performance, and cash flows. Adoption of this guidance had no impact on the fund’s net assets or results of operations.
NOTE 2 - VALUATION
The fund’s investments are reported at fair value as defined under GAAP. The fund values its investments and computes its net asset value per share at the close of the New York Stock Exchange (NYSE), normally 4 p.m. ET, each day that the NYSE is open for business.
Valuation Methods Equity securities listed or regularly traded on a securities exchange or in the over-the-counter (OTC) market are valued at the last quoted sale price or, for certain markets, the official closing price at the time the valuations are made, except for OTC Bulletin Board securities, which are valued at the mean of the latest bid and asked prices. A security that is listed or traded on more than one exchange is valued at the quotation on the exchange determined to be the primary market for such security. Listed securities not traded on a particular day are valued at the mean of the latest bid and asked prices for domestic securities and the last quoted sale price for international securities.
Investments in mutual funds are valued at the mutual fund’s closing net asset value per share on the day of valuation.
Other investments, including restricted securities, and those for which the above valuation procedures are inappropriate or are deemed not to reflect fair value are stated at fair value as determined in good faith by the T. Rowe Price Valuation Committee, established by the fund’s Board of Directors.
For valuation purposes, the last quoted prices of non-U.S. equity securities may be adjusted under the circumstances described below. If the fund determines that developments between the close of a foreign market and the close of the NYSE will, in its judgment, materially affect the value of some or all of its portfolio securities, the fund will adjust the previous closing prices to reflect what it believes to be the fair value of the securities as of the close of the NYSE. In deciding whether it is necessary to adjust closing prices to reflect fair value, the fund reviews a variety of factors, including developments in foreign markets, the performance of U.S. securities markets, and the performance of instruments trading in U.S. markets that represent foreign securities and baskets of foreign securities. A fund may also fair value securities in other situations, such as when a particular foreign market is closed but the fund is open. The fund uses outside pricing services to provide it with closing prices and information to evaluate and/or adjust those prices. The fund cannot predict how often it will use closing prices and how often it will determine it necessary to adjust those prices to reflect fair value. As a means of evaluating its security valuation process, the fund routinely compares closing prices, the next day’s opening prices in the same markets, and adjusted prices.
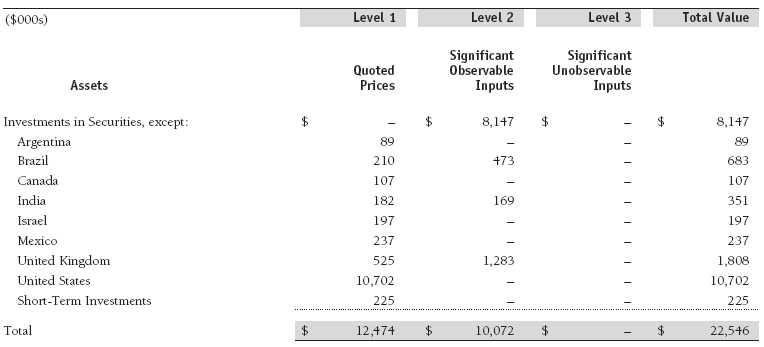
Valuation Inputs Various inputs are used to determine the value of the fund’s investments. These inputs are summarized in the three broad levels listed below:
Level 1 – quoted prices in active markets for identical securities
Level 2 – observable inputs other than Level 1 quoted prices (including, but not limited to, quoted prices for similar securities, interest rates, prepayment speeds, credit risk)
Level 3 – unobservable inputs
Observable inputs are those based on market data obtained from sources independent of the fund, and unobservable inputs reflect the fund’s own assumptions based on the best information available. The input levels are not necessarily an indication of the risk or liquidity associated with investments at that level. For example, non-U.S. equity securities actively traded in foreign markets generally are reflected in Level 2 despite the availability of closing prices because the fund evaluates and determines whether those closing prices reflect fair value at the close of the NYSE or require adjustment, as described above. The following table summarizes the fund’s investments, based on the inputs used to determine their values on October 31, 2009:
NOTE 3 - OTHER INVESTMENT TRANSACTIONS
Consistent with its investment objective, the fund engages in the following practices to manage exposure to certain risks or to enhance performance. The investment objective, policies, program, and risk factors of the fund are described more fully in the fund’s prospectus and Statement of Additional Information.
Emerging Markets At October 31, 2009, approximately 17% of the fund’s net assets were invested, either directly or indirectly, in securities of companies located in emerging markets, securities issued by governments of emerging market countries, and/or securities denominated in or linked to the currencies of emerging market countries. Emerging market securities are often subject to greater price volatility, less liquidity, and higher rates of inflation than U.S. securities. In addition, emerging markets may be subject to greater political, economic and social uncertainty, and differing regulatory environments that may potentially impact the fund’s ability to buy or sell certain securities or repatriate proceeds to U.S. dollars.
Restricted Securities The fund may invest in securities that are subject to legal or contractual restrictions on resale. Prompt sale of such securities at an acceptable price may be difficult and may involve substantial delays and additional costs.
Other Purchases and sales of portfolio securities other than short-term securities aggregated $24,241,000 and $9,902,000, respectively, for the year ended October 31, 2009.
NOTE 4 - FEDERAL INCOME TAXES
No provision for federal income taxes is required since the fund intends to continue to qualify as a regulated investment company under Subchapter M of the Internal Revenue Code and distribute to shareholders all of its taxable income and gains. Distributions determined in accordance with federal income tax regulations may differ in amount or character from net investment income and realized gains for financial reporting purposes. Financial reporting records are adjusted for permanent book/tax differences to reflect tax character but are not adjusted for temporary differences.
The fund files U.S. federal, state, and local tax returns as required. The fund’s tax returns are subject to examination by the relevant tax authorities until expiration of the applicable statute of limitations, which is generally three years after filing of the tax return but could be longer in certain circumstances.
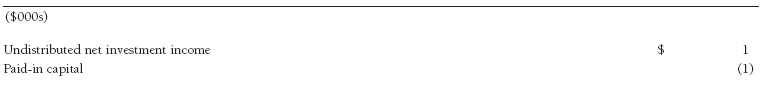
For the year ended October 31, 2009, the following reclassifications, which had no impact on results of operations or net assets, were recorded to reflect tax character:
Distributions during the year ended October 31, 2009 and period ended October 31, 2008, totaled $65,000 and $0, respectively, and were characterized as ordinary income for tax purposes. At October 31, 2009, the tax-basis cost of investments and components of net assets were as follows:
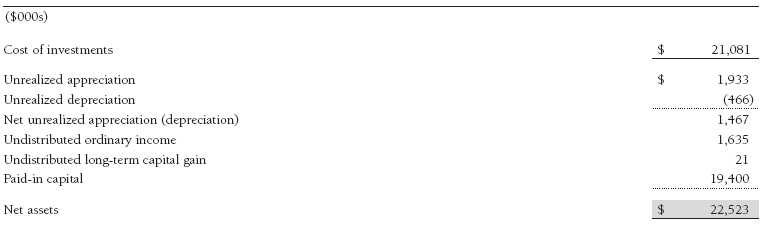
The difference between book-basis and tax-basis net unrealized appreciation (depreciation) is attributable to the deferral of losses from wash sales for tax purposes.
NOTE 5 - FOREIGN TAXES
The fund is subject to foreign income taxes imposed by certain countries in which it invests. Additionally, capital gains realized by the fund upon disposition of securities issued in or by certain foreign countries are subject to capital gains tax imposed by those countries. All taxes are computed in accordance with the applicable foreign tax law, and, to the extent permitted, capital losses are used to offset capital gains. Tax expense attributable to income is accrued by the fund as a reduction of income. Current and deferred tax expense attributable to net capital gains is reflected as a component of realized and/or change in unrealized gain/loss on securities in the accompanying financial statements. At October 31, 2009, the fund had no deferred tax liability attributable to foreign securities and no foreign capital loss carryforwards.
NOTE 6 - RELATED PARTY TRANSACTIONS
The fund is managed by T. Rowe Price International, Inc. (the manager), a wholly owned subsidiary of T. Rowe Price Associates, Inc. (Price Associates), which is wholly owned by T. Rowe Price Group, Inc. The investment management agreement between the fund and the manager provides for an annual investment management fee equal to 0.65% of the fund’s average daily net assets. The fee is computed daily and paid monthly.
The fund is also subject to a contractual expense limitation through February 28, 2011. During the limitation period, the manager is required to waive its management fee and reimburse the fund for any expenses, excluding interest, taxes, brokerage commissions, and extraordinary expenses, that would otherwise cause the fund’s ratio of annualized total expenses to average net assets (expense ratio) to exceed its expense limitation of 0.75%. For a period of three years after the date of any reimbursement or waiver, the fund is required to repay the manager for expenses previously reimbursed and management fees waived to the extent its net assets have grown or expenses have declined sufficiently to allow repayment without causing the fund’s expense ratio to exceed its expense limitation. Pursuant to this agreement, management fees in the amount of $50,000 were waived and expenses in the amount of $191,000 were reimbursed by the manager during the year ended October 31, 2009. Including these amounts, management fees waived and expenses previously reimbursed by the manager in the amount of $243,000 remain subject to repayment by the fund at October 31, 2009.
In addition, the fund has entered into service agreements with Price Associates and a wholly owned subsidiary of Price Associates (collectively, Price). Price Associates computes the daily share price and provides certain other administrative services to the fund. T. Rowe Price Services, Inc., provides shareholder and administrative services in its capacity as the fund’s transfer and dividend disbursing agent. For the year ended October 31, 2009, expenses incurred pursuant to these service agreements were $116,000 for Price Associates and $0 for T. Rowe Price Services, Inc. The total amount payable at period-end pursuant to these service agreements is reflected as Due to Affiliates in the accompanying financial statements.
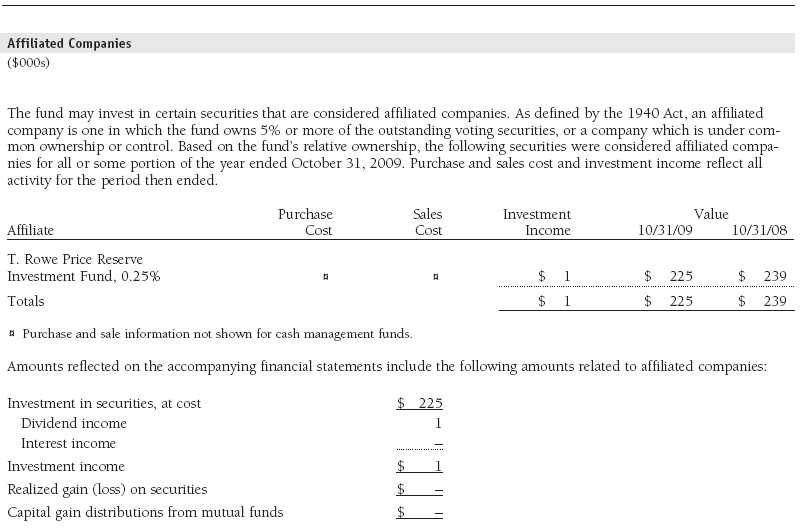
The fund may invest in the T. Rowe Price Reserve Investment Fund and the T. Rowe Price Government Reserve Investment Fund (collectively, the T. Rowe Price Reserve Investment Funds), open-end management investment companies managed by Price Associates and considered affiliates of the fund. The T. Rowe Price Reserve Investment Funds are offered as cash management options to mutual funds, trusts, and other accounts managed by Price Associates and/or its affiliates and are not available for direct purchase by members of the public. The T. Rowe Price Reserve Investment Funds pay no investment management fees.
As of October 31, 2009, T. Rowe Price Group, Inc., and/or its wholly owned subsidiaries owned 500,000 shares of the fund, representing 37% of the fund’s net assets.
Report of Independent Registered Public Accounting Firm
To the Board of Directors of T. Rowe Price Institutional International Funds, Inc. and
Shareholders of T. Rowe Price Institutional Global Large-Cap Equity Fund
In our opinion, the accompanying statement of assets and liabilities, including the schedule of investments, and the related statements of operations and of changes in net assets and the financial highlights present fairly, in all material respects, the financial position of T. Rowe Price Institutional Global Large-Cap Equity Fund (one of the portfolios comprising T. Rowe Price Institutional International Funds, Inc., hereafter referred to as the “Fund”) at October 31, 2009, the results of its operations for the year then ended, the changes in its net assets and the financial highlights for each of the fiscal periods presented, in conformity with accounting principles generally accepted in the United States of America. These financial statements and financial highlights (hereafter referred to as “financial statements”) are the responsibility of the Fund’s management; our responsibility is to express an opinion on these financial statements based on our audits. We conducted our audits of these financial statements in accordance with the standards of the Public Company Accounting Oversight Board (United States). Those standards require that we plan and perform the audit to obtain reasonable assurance about whether the financial statements are free of material misstatement. An audit includes examining, on a test basis, evidence supporting the amounts and disclosures in the financial statements, assessing the accounting principles used and significant estimates made by management, and evaluating the overall financial statement presentation. We believe that our audits, which included confirmation of securities at October 31, 2009 by correspondence with the custodian, and confirmation of the underlying fund by correspondence with the transfer agent, provide a reasonable basis for our opinion.
PricewaterhouseCoopers LLP
Baltimore, Maryland
December 22, 2009
| Tax Information (Unaudited) for the Tax Year Ended 10/31/09 |
We are providing this information as required by the Internal Revenue Code. The amounts shown may differ from those elsewhere in this report because of differences between tax and financial reporting requirements.
The fund’s distributions to shareholders included $60,000 from short-term capital gains.
For taxable non-corporate shareholders, $141,000 of the fund’s income represents qualified dividend income subject to the 15% rate category.
For corporate shareholders, $39,000 of the fund’s income qualifies for the dividends-received deduction.
The fund will pass through foreign source income of $119,000 and foreign taxes paid of $11,000.
| Information on Proxy Voting Policies, Procedures, and Records |
A description of the policies and procedures used by T. Rowe Price funds and portfolios to determine how to vote proxies relating to portfolio securities is available in each fund’s Statement of Additional Information, which you may request by calling 1-800-225-5132 or by accessing the SEC’s Web site, www.sec.gov. The description of our proxy voting policies and procedures is also available on our Web site, www.troweprice.com. To access it, click on the words “Our Company” at the top of our corporate homepage. Then, when the next page appears, click on the words “Proxy Voting Policies” on the left side of the page.
Each fund’s most recent annual proxy voting record is available on our Web site and through the SEC’s Web site. To access it through our Web site, follow the directions above, then click on the words “Proxy Voting Records” on the right side of the Proxy Voting Policies page.
| How to Obtain Quarterly Portfolio Holdings |
The fund files a complete schedule of portfolio holdings with the Securities and Exchange Commission for the first and third quarters of each fiscal year on Form N-Q. The fund’s Form N-Q is available electronically on the SEC’s Web site (www.sec.gov); hard copies may be reviewed and copied at the SEC’s Public Reference Room, 450 Fifth St. N.W., Washington, DC 20549. For more information on the Public Reference Room, call 1-800-SEC-0330.
| About the Fund’s Directors and Officers |
Your fund is governed by a Board of Directors (Board) that meets regularly to review a wide variety of matters affecting the fund, including performance, investment programs, compliance matters, advisory fees and expenses, service providers, and other business affairs. The Board elects the fund’s officers, who are listed in the final table. At least 75% of Board members are independent of T. Rowe Price Associates, Inc. (T. Rowe Price), and T. Rowe Price International, Inc. (T. Rowe Price International); “inside” or “interested” directors are employees or officers of T. Rowe Price. The business address of each director and officer is 100 East Pratt Street, Baltimore, Maryland 21202. The Statement of Additional Information includes additional information about the fund directors and is available without charge by calling a T. Rowe Price representative at 1-800-225-5132.
| Independent Directors | |
| Name (Year of Birth) | |
| Year Elected* | Principal Occupation(s) During Past Five Years and Directorships of Other Public Companies |
| Jeremiah E. Casey (1940) | Director, National Life Insurance (2001 to 2005); Director, The Rouse Company, real estate developers |
| 2006 | (1990 to 2004) |
| Anthony W. Deering (1945) | Chairman, Exeter Capital, LLC, a private investment firm (2004 to present); Director, Under Armour |
| 1991 | (2008 to present); Director, Vornado Real Estate Investment Trust (2004 to present); Director, Mercantile |
| Bankshares (2002 to 2007); Member, Advisory Board, Deutsche Bank North America (2004 to present); | |
| Director, Chairman of the Board, and Chief Executive Officer, The Rouse Company, real estate developers | |
| (1997 to 2004) | |
| Donald W. Dick, Jr. (1943) | Principal, EuroCapital Advisors, LLC, an acquisition and management advisory firm (1995 to present) |
| 1989 | |
| Karen N. Horn (1943) | Director, Eli Lilly and Company (1987 to present); Director, Simon Property Group (2004 to present); |
| 2003 | Director, Norfolk Southern (2008 to present); Director, Georgia Pacific (2004 to 2005) |
| Theo C. Rodgers (1941) | President, A&R Development Corporation (1977 to present) |
| 2006 | |
| John G. Schreiber (1946) | Owner/President, Centaur Capital Partners, Inc., a real estate investment company (1991 to present); |
| 2001 | Partner, Blackstone Real Estate Advisors, L.P. (1992 to present) |
| Mark R. Tercek (1957) | President and Chief Executive Officer, The Nature Conservancy (2008 to present); Managing Director, |
| 2009 | The Goldman Sachs Group, Inc. (1984 to 2008) |
| *Each independent director oversees 124 T. Rowe Price portfolios and serves until retirement, resignation, or election of a successor. | |
| Inside Directors | |
| Name | |
| (Year of Birth) | |
| Year Elected* | |
| [Number of T. Rowe Price | |
| Portfolios Overseen] | Principal Occupation(s) During Past Five Years and Directorships of Other Public Companies |
| Edward C. Bernard (1956) | Director and Vice President, T. Rowe Price; Vice Chairman of the Board, Director, and Vice President, T. Rowe |
| 2006 [124] | Price Group, Inc.; Chairman of the Board, Director, and President, T. Rowe Price Investment Services, Inc.; |
| Chairman of the Board and Director, T. Rowe Price Global Asset Management Limited, T. Rowe Price Global | |
| Investment Services Limited, T. Rowe Price Retirement Plan Services, Inc., T. Rowe Price Savings Bank, and | |
| T. Rowe Price Services, Inc.; Director, T. Rowe Price International, Inc.; Chief Executive Officer, Chairman of | |
| the Board, Director, and President, T. Rowe Price Trust Company; Chairman of the Board, all funds | |
| Brian C. Rogers, CFA, CIC (1955) | Chief Investment Officer, Director, and Vice President, T. Rowe Price; Chairman of the Board, Chief Investment |
| 2006 [69] | Officer, Director, and Vice President, T. Rowe Price Group, Inc.; Vice President, T. Rowe Price Trust Company |
| *Each inside director serves until retirement, resignation, or election of a successor. | |
| Officers | |
| Name (Year of Birth) | |
| Position Held With Institutional International Funds | Principal Occupation(s) |
| Christopher D. Alderson (1962) | Chief Executive Officer, Director, and President, T. Rowe Price |
| President | International, Inc.; Vice President, T. Rowe Price Global Investment |
| Services Limited and T. Rowe Price Group, Inc. | |
| Jeffrey W. Arricale, CPA (1971) | Vice President, T. Rowe Price and T. Rowe Price Group, Inc. |
| Vice President | |
| R. Scott Berg, CFA (1972) | Vice President, T. Rowe Price and T. Rowe Price Group, Inc. |
| Executive Vice President | |
| Mark C.J. Bickford-Smith (1962) | Vice President, T. Rowe Price Group, Inc., and T. Rowe Price |
| Vice President | International, Inc. |
| Richard N. Clattenburg, CFA (1979) | Vice President, T. Rowe Price, T. Rowe Price Global Investment Services |
| Vice President | Limited, and T. Rowe Price Group, Inc.; formerly Financial Analyst, |
| Goldman Sachs (to 2005) | |
| Michael J. Conelius, CFA (1964) | Vice President, T. Rowe Price, T. Rowe Price Global Investment Services |
| Executive Vice President | Limited, T. Rowe Price Group, Inc., T. Rowe Price International, Inc., and |
| T. Rowe Price Trust Company | |
| Mark J.T. Edwards (1957) | Vice President, T. Rowe Price Group, Inc., and T. Rowe Price |
| Vice President | International, Inc. |
| Henry M. Ellenbogen (1973) | Vice President, T. Rowe Price and T. Rowe Price Group, Inc. |
| Vice President | |
| Roger L. Fiery III, CPA (1959) | Vice President, T. Rowe Price, T. Rowe Price Group, Inc., T. Rowe Price |
| Vice President | International, Inc., and T. Rowe Price Trust Company |
| Robert N. Gensler (1957) | Vice President, T. Rowe Price, T. Rowe Price Global Investment Services |
| Executive Vice President | Limited, T. Rowe Price Group, Inc., and T. Rowe Price International, Inc. |
| John R. Gilner (1961) | Chief Compliance Officer and Vice President, T. Rowe Price; Vice President, |
| Chief Compliance Officer | T. Rowe Price Group, Inc., and T. Rowe Price Investment Services, Inc. |
| Gregory S. Golczewski (1966) | Vice President, T. Rowe Price and T. Rowe Price Trust Company |
| Vice President | |
| M. Campbell Gunn (1956) | Vice President, T. Rowe Price Global Investment Services Limited, |
| Vice President | T. Rowe Price Group, Inc., and T. Rowe Price International, Inc. |
| Gregory K. Hinkle, CPA (1958) | Vice President, T. Rowe Price, T. Rowe Price Group, Inc., and T. Rowe Price |
| Treasurer | Trust Company; formerly Partner, PricewaterhouseCoopers, LLP |
| (to 2007) | |
| Kris H. Jenner, M.D., D. Phil. (1962) | Vice President, T. Rowe Price, T. Rowe Price Global Investment Services |
| Vice President | Limited, and T. Rowe Price Group, Inc. |
| Ian D. Kelson (1956) | Vice President, T. Rowe Price, T. Rowe Price Global Investment Services |
| Executive Vice President | Limited, T. Rowe Price Group, Inc., and T. Rowe Price International, Inc. |
| Patricia B. Lippert (1953) | Assistant Vice President, T. Rowe Price and T. Rowe Price Investment |
| Secretary | Services, Inc. |
| Anh Lu (1968) | Vice President, T. Rowe Price Group, Inc., and T. Rowe Price |
| Vice President | International, Inc. |
| Charles M. Ober, CFA (1950) | Vice President, T. Rowe Price and T. Rowe Price Group, Inc. |
| Vice President | |
| David Oestreicher (1967) | Director and Vice President, T. Rowe Price Investment Services, Inc., |
| Vice President | T. Rowe Price Trust Company, and T. Rowe Price Services, Inc.; Vice |
| President, T. Rowe Price, T. Rowe Price Global Asset Management Limited, | |
| T. Rowe Price Global Investment Services Limited, T. Rowe Price Group, | |
| Inc., T. Rowe Price International, Inc., and T. Rowe Price Retirement Plan | |
| Services, Inc. | |
| Gonzalo Pángaro, CFA (1968) | Vice President, T. Rowe Price Group, Inc., and T. Rowe Price |
| Executive Vice President | International, Inc. |
| Joseph Rohm (1966) | Vice President, T. Rowe Price Group, Inc., and T. Rowe Price International, |
| Executive Vice President | Inc.; formerly Equity Analyst, Insight Investment (to 2005) |
| Jeffrey Rottinghaus, CPA (1970) | Vice President, T. Rowe Price, T. Rowe Price Global Investment Services |
| Vice President | Limited, and T. Rowe Price Group, Inc. |
| Deborah D. Seidel (1962) | Vice President, T. Rowe Price, T. Rowe Price Investment Services, Inc., and |
| Vice President | T. Rowe Price Services, Inc. |
| Robert W. Sharps, CFA, CPA (1971) | Vice President, T. Rowe Price, T. Rowe Price Group, Inc., and T. Rowe Price |
| Vice President | Trust Company |
| Robert W. Smith (1961) | Vice President, T. Rowe Price, T. Rowe Price Group, Inc., and T. Rowe Price |
| Executive Vice President | Trust Company |
| Dean Tenerelli (1964) | Vice President, T. Rowe Price Group, Inc., and T. Rowe Price |
| Vice President | International, Inc. |
| Julie L. Waples (1970) | Vice President, T. Rowe Price |
| Vice President | |
| Unless otherwise noted, officers have been employees of T. Rowe Price or T. Rowe Price International for at least five years. | |
Item 2. Code of Ethics.
The registrant has adopted a code of ethics, as defined in Item 2 of Form N-CSR, applicable to its principal executive officer, principal financial officer, principal accounting officer or controller, or persons performing similar functions. A copy of this code of ethics is filed as an exhibit to this Form N-CSR. No substantive amendments were approved or waivers were granted to this code of ethics during the period covered by this report.
Item 3. Audit Committee Financial Expert.
The registrant’s Board of Directors/Trustees has determined that Mr. Anthony W. Deering qualifies as an audit committee financial expert, as defined in Item 3 of Form N-CSR. Mr. Deering is considered independent for purposes of Item 3 of Form N-CSR.
Item 4. Principal Accountant Fees and Services.
(a) – (d) Aggregate fees billed to the registrant for the last two fiscal years for professional services rendered by the registrant’s principal accountant were as follows:
Audit fees include amounts related to the audit of the registrant’s annual financial statements and services normally provided by the accountant in connection with statutory and regulatory filings. Audit-related fees include amounts reasonably related to the performance of the audit of the registrant’s financial statements and specifically include the issuance of a report on internal controls and, if applicable, agreed-upon procedures related to fund acquisitions. Tax fees include amounts related to services for tax compliance, tax planning, and tax advice. The nature of these services specifically includes the review of distribution calculations and the preparation of Federal, state, and excise tax returns. All other fees include the registrant’s pro-rata share of amounts for agreed-upon procedures in conjunction with service contract approvals by the registrant’s Board of Directors/Trustees.
(e)(1) The registrant’s audit committee has adopted a policy whereby audit and non-audit services performed by the registrant’s principal accountant for the registrant, its investment adviser, and any entity controlling, controlled by, or under common control with the investment adviser that provides ongoing services to the registrant require pre-approval in advance at regularly scheduled audit committee meetings. If such a service is required between regularly scheduled audit committee meetings, pre-approval may be authorized by one audit committee member with ratification at the next scheduled audit committee meeting. Waiver of pre-approval for audit or non-audit services requiring fees of a de minimis amount is not permitted.
(2) No services included in (b) – (d) above were approved pursuant to paragraph (c)(7)(i)(C) of Rule 2-01 of Regulation S-X.
(f) Less than 50 percent of the hours expended on the principal accountant’s engagement to audit the registrant’s financial statements for the most recent fiscal year were attributed to work performed by persons other than the principal accountant’s full-time, permanent employees.
(g) The aggregate fees billed for the most recent fiscal year and the preceding fiscal year by the registrant’s principal accountant for non-audit services rendered to the registrant, its investment adviser, and any entity controlling, controlled by, or under common control with the investment adviser that provides ongoing services to the registrant were $2,179,000 and $2,174,000, respectively.
(h) All non-audit services rendered in (g) above were pre-approved by the registrant’s audit committee. Accordingly, these services were considered by the registrant’s audit committee in maintaining the principal accountant’s independence.
Item 5. Audit Committee of Listed Registrants.
Not applicable.
Item 6. Investments.
(a) Not applicable. The complete schedule of investments is included in Item 1 of this Form N-CSR.
(b) Not applicable.
Item 7. Disclosure of Proxy Voting Policies and Procedures for Closed-End Management Investment Companies.
Not applicable.
Item 8. Portfolio Managers of Closed-End Management Investment Companies.
Not applicable.
Item 9. Purchases of Equity Securities by Closed-End Management Investment Company and Affiliated Purchasers.
Not applicable.
Item 10. Submission of Matters to a Vote of Security Holders.
Not applicable.
Item 11. Controls and Procedures.
(a) The registrant’s principal executive officer and principal financial officer have evaluated the registrant’s disclosure controls and procedures within 90 days of this filing and have concluded that the registrant’s disclosure controls and procedures were effective, as of that date, in ensuring that information required to be disclosed by the registrant in this Form N-CSR was recorded, processed, summarized, and reported timely.
(b) The registrant’s principal executive officer and principal financial officer are aware of no change in the registrant’s internal control over financial reporting that occurred during the registrant’s second fiscal quarter covered by this report that has materially affected, or is reasonably likely to materially affect, the registrant’s internal control over financial reporting.
Item 12. Exhibits.
(a)(1) The registrant’s code of ethics pursuant to Item 2 of Form N-CSR is attached.
(2) Separate certifications by the registrant's principal executive officer and principal financial officer, pursuant to Section 302 of the Sarbanes-Oxley Act of 2002 and required by Rule 30a-2(a) under the Investment Company Act of 1940, are attached.
(3) Written solicitation to repurchase securities issued by closed-end companies: not applicable.
(b) A certification by the registrant's principal executive officer and principal financial officer, pursuant to Section 906 of the Sarbanes-Oxley Act of 2002 and required by Rule 30a-2(b) under the Investment Company Act of 1940, is attached.
SIGNATURES | |
| Pursuant to the requirements of the Securities Exchange Act of 1934 and the Investment | |
| Company Act of 1940, the registrant has duly caused this report to be signed on its behalf by the | |
| undersigned, thereunto duly authorized. | |
| T. Rowe Price Institutional International Funds, Inc. | |
| By | /s/ Edward C. Bernard |
| Edward C. Bernard | |
| Principal Executive Officer | |
| Date | December 22, 2009 |
| Pursuant to the requirements of the Securities Exchange Act of 1934 and the Investment | |
| Company Act of 1940, this report has been signed below by the following persons on behalf of | |
| the registrant and in the capacities and on the dates indicated. | |
| By | /s/ Edward C. Bernard |
| Edward C. Bernard | |
| Principal Executive Officer | |
| Date | December 22, 2009 |
| By | /s/ Gregory K. Hinkle |
| Gregory K. Hinkle | |
| Principal Financial Officer | |
| Date | December 22, 2009 |