| UNITED STATES |
| SECURITIES AND EXCHANGE COMMISSION |
| Washington, D.C. 20549 |
FORM N-CSR |
CERTIFIED SHAREHOLDER REPORT OF REGISTERED |
MANAGEMENT INVESTMENT COMPANIES |
| Investment Company Act File Number: 811-5833 |
| T. Rowe Price Institutional International Funds, Inc. |
| (Exact name of registrant as specified in charter) |
| 100 East Pratt Street, Baltimore, MD 21202 |
| (Address of principal executive offices) |
| David Oestreicher |
| 100 East Pratt Street, Baltimore, MD 21202 |
| (Name and address of agent for service) |
| Registrant’s telephone number, including area code: (410) 345-2000 |
| Date of fiscal year end: October 31 |
| Date of reporting period: October 31, 2010 |
Item 1: Report to Shareholders
 |
| Institutional International Core Equity Fund | October 31, 2010 |
| Highlights |
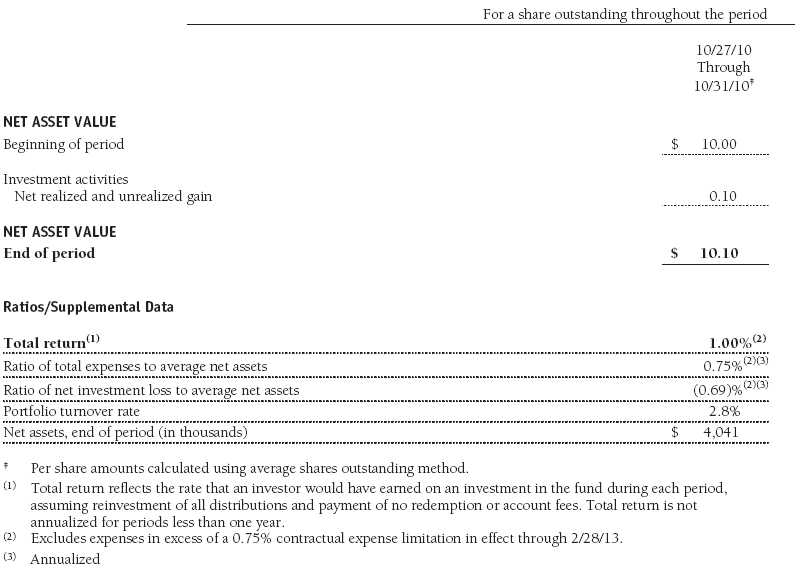
• The Institutional International Core Equity Fund generated a 1.00% return since its inception on October 27, 2010, and kept pace with the MSCI EAFE (Europe, Australasia, and Far East) Index.
• The Institutional International Core Equity fund uses a core investment approach to search for favorable combinations of company fundamentals and valuation among non-U.S. stocks in developed and, to a lesser extent, emerging markets.
• Bottom-up stock selection drives our decision-making, although we invest with an awareness of the global economic backdrop and the outlook for industries, sectors, and individual countries.
• Although the global recovery is gaining traction, particularly in emerging markets, and corporate balance sheets are strong, investors are concerned that large fiscal, economic, and regulatory challenges may weigh on global markets.
The views and opinions in this report were current as of October 31, 2010. They are not guarantees of performance or investment results and should not be taken as investment advice. Investment decisions reflect a variety of factors, and the managers reserve the right to change their views about individual stocks, sectors, and the markets at any time. As a result, the views expressed should not be relied upon as a forecast of the fund’s future investment intent. The report is certified under the Sarbanes-Oxley Act, which requires mutual funds and other public companies to affirm that, to the best of their knowledge, the information in their financial reports is fairly and accurately stated in all material respects.
Manager’s Letter
T. Rowe Price Institutional International Core Equity Fund
Dear Investor
We would like to welcome all investors to the Institutional International Core Equity Fund. This is our first report since the fund’s inception on October 27, 2010. Because the fund’s fiscal year ends on October 31 of each year, this report covers an extremely brief performance period and focuses on the portfolio’s strategy and positioning. Future reports—both semiannual and annual—will typically address the portfolio’s investment activity during the previous six months or year.
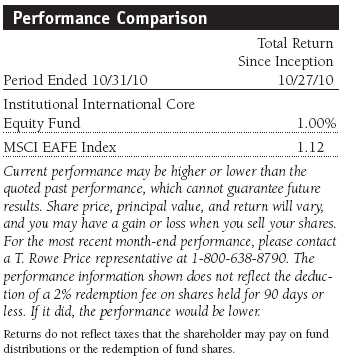
The Institutional International Core Equity Fund generated a 1.00% return since its inception on October 27, 2010, and kept pace with the MSCI EAFE (Europe, Australasia, and Far East) Index.
Portfolio Strategy
The Institutional International Core Equity Fund seeks long-term growth of capital through investments in the common stocks of non-U.S. companies. We take a core approach to investing, meaning that we search for companies possessing a combination of growth potential and valuation among non-U.S. stocks in the world’s developed and, to a lesser extent, emerging markets. Securities will be selected that in our view have the most favorable mix of company fundamentals and valuation. Our approach generally looks for companies with the following characteristics:
• Operate in a business niche with favorable prospects for earnings growth;
• Possess attractive valuation relative to the company’s peers or its own historical norm;
• Have meaningful barriers to entry;
• Employ experienced and capable management;
• Maintain healthy balance sheets; and
• Offer the potential to grow dividends or conduct share repurchases.
Our investment approach offers the flexibility to search for particularly promising investment opportunities. Although the majority of the investments (at least 65%) will be made in established, large-capitalization companies, we may also purchase mid-cap stocks that meet our rigorous investment criteria. We expect to find select investment opportunities in emerging markets as well as in developed markets. We will focus on stocks where we believe the valuation underestimates the company’s potential for earnings and cash flow growth. Such stocks may or may not appear inexpensive on an absolute basis or relative to the rest of the market.
The fund has a relatively moderate risk profile due to its broadly diversified portfolio of established companies, and its diversification across countries and sectors should help reduce its volatility. Of course, investing overseas holds special risks—political uncertainty; potentially unfavorable currency exchange rate changes; and, to a lesser degree, market illiquidity—that could cause the value of this fund to fluctuate more than a similar domestic fund. However, we believe the fund’s flexibility to invest throughout the international marketplace can help reduce volatility relative to funds that concentrate on a particular region or country.
Market Review
The global economy continues to recover from the financial crisis, but growth rates between developed and emerging markets vary greatly. Developed market economies continue to expand at a modest pace but are weighed down by high levels of government and consumer debt that severely limit the investment capital available to drive stronger growth. In contrast, emerging markets, which experienced a period of painful deleveraging in the 1990s, do not have to divert large amounts of resources to debt reduction and are able to continue their more robust growth.
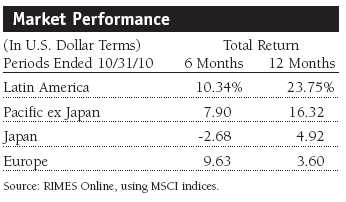
Recent regional market performance generally reflects the divergent economic performance. Latin America and Pacific ex Japan generated the best returns over the past year, with many countries benefiting from favorable demographics and increased trade to fuel China’s torrid growth. Despite modest economic growth rates in many countries, European stocks have posted solid gains over recent months on the heels of rebounding domestic demand, increasing exports, and low starting valuations. Japan’s expansion has been much more subdued. The yen’s appreciation, which curbed its exports and hurt corporate earnings, helped its underlying stock prices in U.S. dollars—the currency that ultimately matters to our investors.
Corporate earnings have been remarkably resilient, driven by aggressive cost cutting, increased productivity, and lean inventories. However, companies have lacked top line revenue growth. We expect corporate earnings to benefit as the global economy gradually recovers, consumers and corporations regain confidence, and revenue growth returns to healthy levels.
Portfolio Positioning
As we said earlier, the fund emphasizes companies that possess a favorable combination of solid growth prospects and attractive valuation. Our global team of analysts and portfolio managers conducts rigorous and comprehensive research to identify investment opportunities. The fund’s portfolio is built primarily from the bottom up and is based on an in-depth assessment of individual investments. However, macroeconomic considerations also play a role in the fund’s diversified allocation across regions, countries, and market sectors.
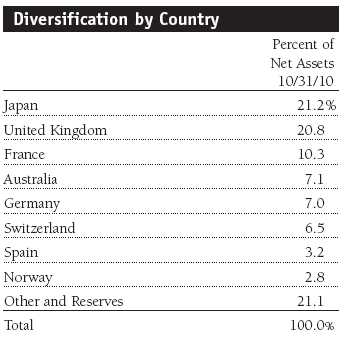
From a geographic perspective, European stocks comprise the bulk of the portfolio due to the larger number of well-established, large-cap companies operating in these markets. European markets have rebounded recently as investors snapped up a number of quality stocks selling at deep discounts in the wake of the continent’s sovereign debt crisis. Although economic and debt challenges continue to plague certain countries, the corporate sector has made great strides in improving balance sheets during a period of low interest rates. We believe this bodes well for companies that have exposure to growing markets, particularly those in the emerging world.
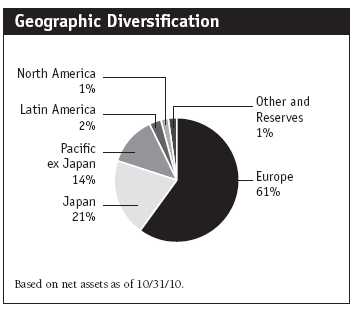
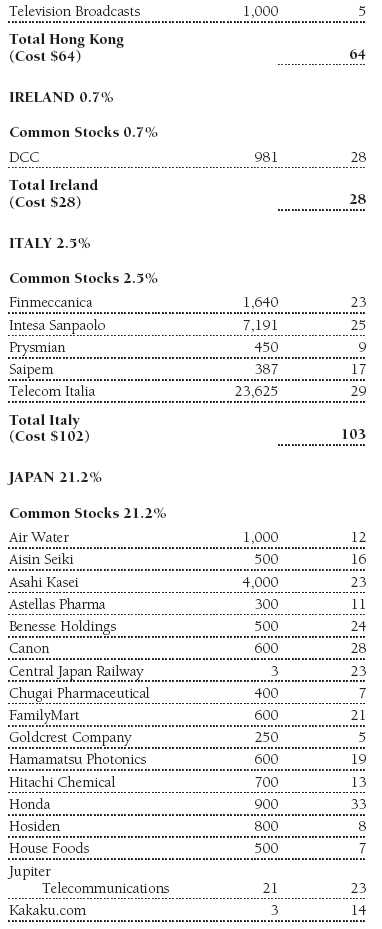
Japan is our next largest geographic allocation. The Japanese economy is still recovering from one of the most severe contractions in its history. Industrial production, shipments, and exports have all seen record percentage improvements but are still below peak levels. Japanese corporations have made meaningful cost reductions, and margins have recovered strongly. As volumes expand further, the outlook is for a strong recovery in operating profits as long as the yen does not strengthen significantly.
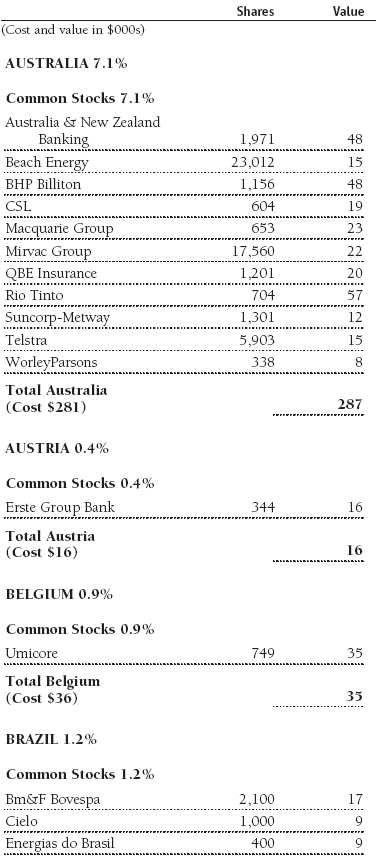
The Pacific ex Japan region has shown impressive resilience compared with much of the developed world. Economic expansion in Asia still remains strong, driven by long-term key themes, such as rising levels of urbanization, industrialization, and domestic consumption. While valuations in aggregate are still reasonable, we are mindful that on an individual stock basis they are looking stretched in some cases. We have significant exposure to Australia, which should continue to benefit from growing trade relationships with the booming Chinese and Indian economies.
We believe emerging economies (but not necessarily emerging markets since economic and market performance tend to have little correlation) are poised to outperform due to the superior economic fundamentals in these countries relative to developed market countries. Latin America is a good example. Deleveraging is not an issue in these economies, employment levels are healthy, wages are on the rise, and the “wealth effect” has the potential to create robust consumer demand for many years to come. If the global economy is going to pull its way out of this low-growth environment, emerging markets will probably have to do a large share of the pulling.
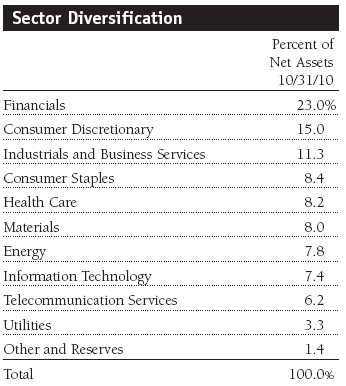
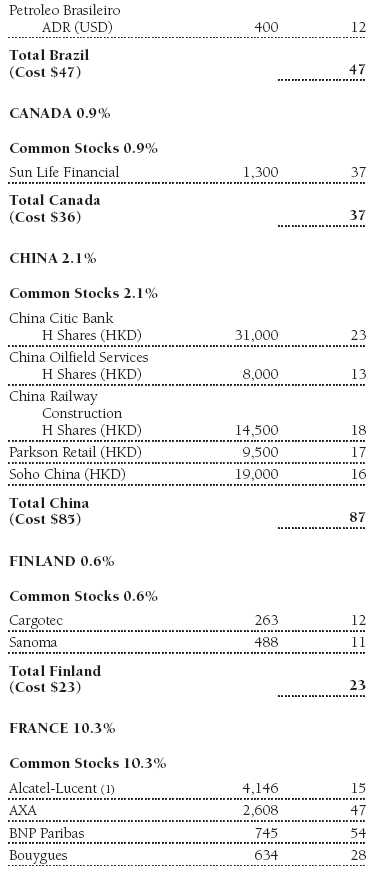
From a sector perspective, financial stocks represent a large portion of the portfolio because of their larger capitalization and attractive valuations. Financials were at the center of the global meltdown, and shares were hit particularly hard. Although they have rebounded significantly from oversold valuations, regulatory and economic uncertainties continue to weigh on the sector. Some of our key holdings in this sector include Standard Chartered (United Kingdom) and BNP Paribas (France), as well as residential and commercial real estate holdings such as Unibail-Rodamco (France) and Soho China, a large commercial property developer in Beijing and Shanghai. (Please refer to the fund’s portfolio of investments for a complete list of holdings and the amount each represents in the portfolio.)
Consumer discretionary holdings also account for a large share of the portfolio and have done particularly well over the past year as the global economy began to recover and consumers began to cautiously loosen their purse strings. Automobiles are an area of focus for the fund as we expect pent-up global demand to drive the industry, particularly in faster-growing emerging economies. Representative holdings in this sector include Volkswagen (Germany), BMW (Germany), and Honda (Japan). Other consumer-oriented stocks include luxury French retailers Compagnie Financiere Richemont and PPR, which should benefit from a renewed willingness to splurge by increasingly confident consumers.
Investment Outlook
Global stock markets have rebounded from their low point a year and a half ago, and the question we face is whether the markets can advance from here. We see many reasons for optimism. Emerging markets are growing rapidly and following responsible fiscal policies. The economies of developed markets are beginning to gain traction, but countries that sell to emerging markets are performing better than those that rely more on domestic consumption.
At a corporate level, companies are in much better financial shape than they were during the depths of the economic downturn. They have shed debt, otherwise strengthened their balance sheets, cut costs, and increased profit margins. We have seen strong earnings so far this year, and we believe that companies are poised to generate large profits once the global expansion picks up momentum. Despite the markets’ rally, valuations still appear reasonable.
Our optimism is tempered by the realization that we are not living in normal times. Interest rates are extremely low in Europe, Japan, and the U.S. Global liquidity is extremely high but largely stuck in neutral. Businesses are not expanding, and unemployment in the developed world remains high. In response, the U.S. Federal Reserve has embarked on a program of quantitative easing—essentially printing dollars to buy U.S. Treasuries—to keep interest rates low, buoy asset values, and increase U.S. competitiveness in order to encourage more economic growth. Government fiscal deficits—along with the costs of social welfare programs—continue to grow and are accelerating toward unsustainable levels in many developed countries. We have never witnessed a convergence of these conditions before. Many responsible observers are asking whether countries will be able to bring their budgets under control. Shifting and generally increasing regulation is adding to the sense of uncertainty because we don’t yet know whether, or to what extent, the new regulatory regimes will discourage long-term, productive investment.
When times are extraordinary and sentiment is uncertain, businesses and investors tend to cut back on their risk exposure. Under the circumstances, strong fundamental research and skilled stock picking will be critical to investment success. Our goal remains to seek stocks with a favorable combination of growth and valuation—companies with solid earnings prospects, sound balance sheets, and sufficient cash flow to generate dividend payments to shareholders. We will maintain our determination and efforts to effectively employ our investment process and global resources to generate long-term gains for our investors.
Respectfully submitted,

Raymond A. Mills
Chairman of the fund’s Investment Advisory Committee
November 19, 2010
The committee chairman has day-to-day responsibility for managing the portfolio and works with committee members in developing and executing the fund’s investment program.
| Risks of International Investing |
Funds that invest overseas generally carry more risk than funds that invest strictly in U.S. assets. Funds investing in a single country or in a limited geographic region tend to be riskier than more diversified funds. Risks can result from varying stages of economic and political development; differing regulatory environments, trading days, and accounting standards; and higher transaction costs of non-U.S. markets. Non-U.S. investments are also subject to currency risk, or a decline in the value of a foreign currency versus the U.S. dollar, which reduces the dollar value of securities denominated in that currency.
| Glossary |
MSCI EAFE Index: Widely accepted as the benchmark for international stock performance (EAFE refers to Europe, Australasia, and Far East). The index represents the major markets of the world.
Price/earnings (P/E) ratio: Shows the “multiple” of earnings at which a stock is selling. The P/E ratio is calculated by dividing a stock’s current price by its current earnings per share. A high multiple means that investors are optimistic about future growth and have bid up the stock’s price.
Portfolio Highlights
Performance and Expenses
T. Rowe Price Institutional International Core Equity Fund
Fund Expense Example
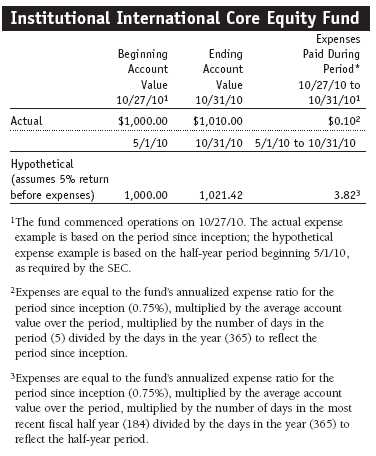
As a mutual fund shareholder, you may incur two types of costs: (1) transaction costs, such as redemption fees or sales loads, and (2) ongoing costs, including management fees, distribution and service (12b-1) fees, and other fund expenses. The following example is intended to help you understand your ongoing costs (in dollars) of investing in the fund and to compare these costs with the ongoing costs of investing in other mutual funds. The example is based on an investment of $1,000 invested at the beginning of the most recent six-month period and held for the entire period.
Actual Expenses
The first line of the following table (“Actual”) provides information about actual account values and actual expenses. You may use the information in this line, together with your account balance, to estimate the expenses that you paid over the period. Simply divide your account value by $1,000 (for example, an $8,600 account value divided by $1,000 = 8.6), then multiply the result by the number in the first line under the heading “Expenses Paid During Period” to estimate the expenses you paid on your account during this period.
Hypothetical Example for Comparison Purposes
The information on the second line of the table (“Hypothetical”) is based on hypothetical account values and expenses derived from the fund’s actual expense ratio and an assumed 5% per year rate of return before expenses (not the fund’s actual return). You may compare the ongoing costs of investing in the fund with other funds by contrasting this 5% hypothetical example and the 5% hypothetical examples that appear in the shareholder reports of the other funds. The hypothetical account values and expenses may not be used to estimate the actual ending account balance or expenses you paid for the period.
You should also be aware that the expenses shown in the table highlight only your ongoing costs and do not reflect any transaction costs, such as redemption fees or sales loads. Therefore, the second line of the table is useful in comparing ongoing costs only and will not help you determine the relative total costs of owning different funds. To the extent a fund charges transaction costs, however, the total cost of owning that fund is higher.
Financial Highlights
T. Rowe Price Institutional International Core Equity Fund
The accompanying notes are an integral part of these financial statements.
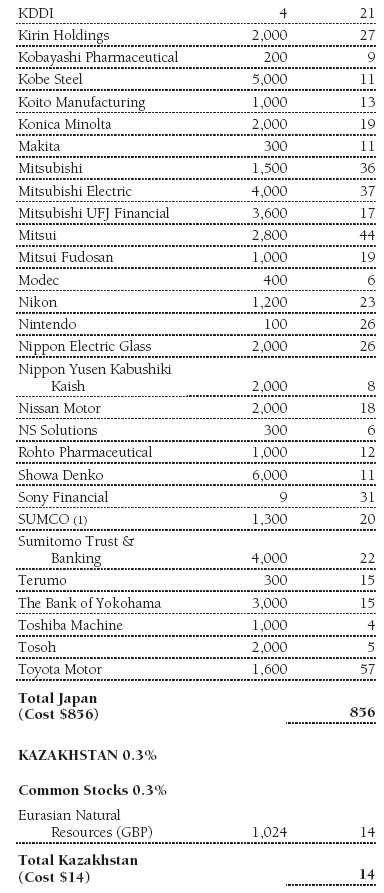
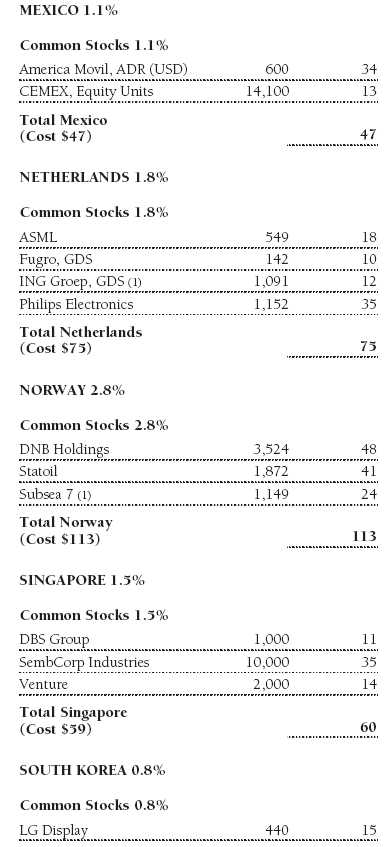
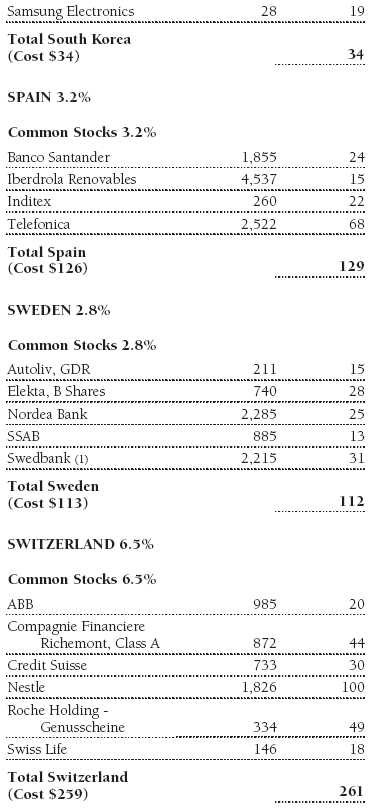
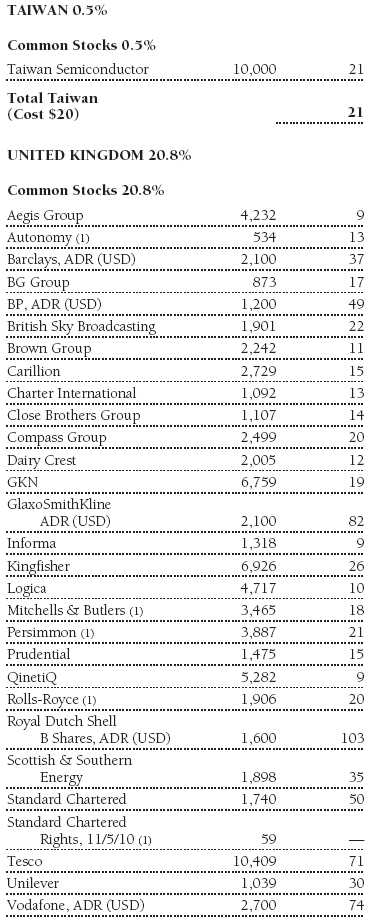
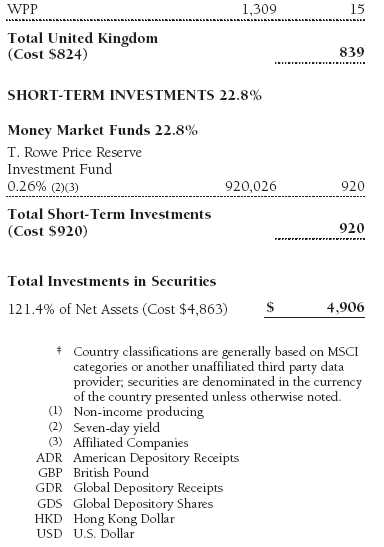
Portfolio of Investments‡
T. Rowe Price Institutional International Core Equity Fund
October 31, 2010
The accompanying notes are an integral part of these financial statements.
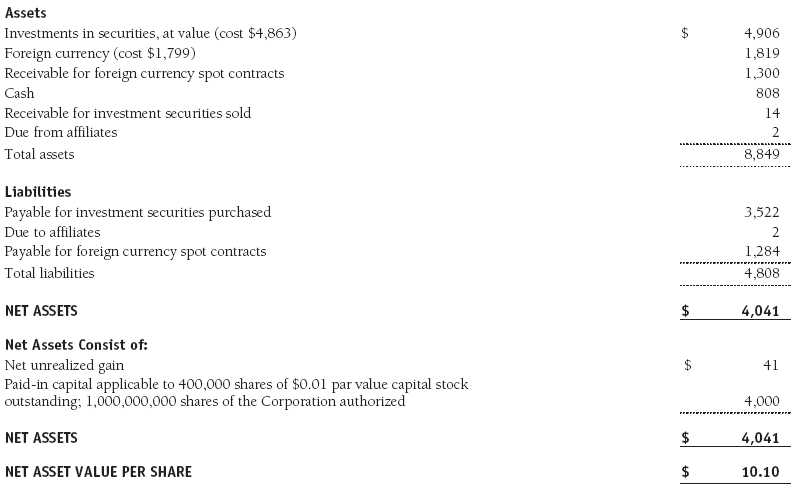
Statement of Assets and Liabilities
T. Rowe Price Institutional International Core Equity Fund
October 31, 2010
($000s, except shares and per share amounts)
The accompanying notes are an integral part of these financial statements.
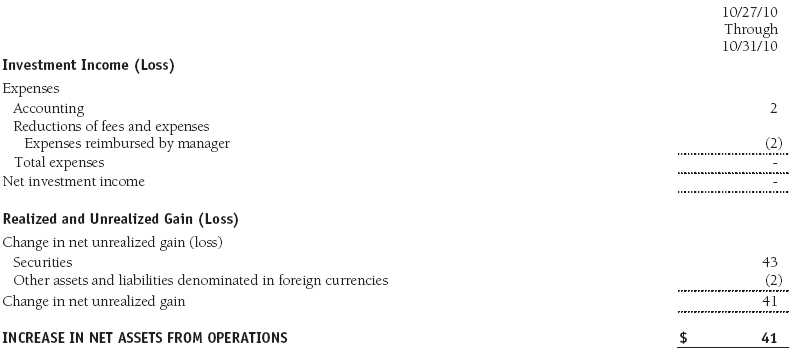
Statement of Operations
T. Rowe Price Institutional International Core Equity Fund
($000s)
The accompanying notes are an integral part of these financial statements.
Statement of Changes in Net Assets
T. Rowe Price Institutional International Core Equity Fund
($000s)
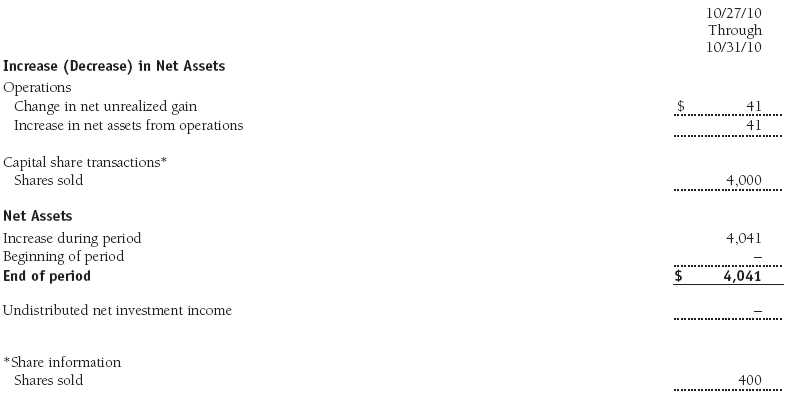
The accompanying notes are an integral part of these financial statements.
Notes to Financial Statements
T. Rowe Price Institutional International Core Equity Fund
October 31, 2010
T. Rowe Price Institutional International Funds, Inc. (the corporation), is registered under the Investment Company Act of 1940 (the 1940 Act). The Institutional International Core Equity Fund (the fund), a diversified, open-end management investment company, is one portfolio established by the corporation. The fund commenced operations on October 27, 2010. The fund seeks long-term growth of capital through investments in the common stocks of non-U.S. companies.
NOTE 1 - SIGNIFICANT ACCOUNTING POLICIES
Basis of Preparation The accompanying financial statements were prepared in accordance with accounting principles generally accepted in the United States of America (GAAP), which require the use of estimates made by fund management. Fund management believes that estimates and valuations are appropriate; however, actual results may differ from those estimates, and the valuations reflected in the accompanying financial statements may differ from the value ultimately realized upon sale of securities.
Investment Transactions, Investment Income, and Distributions Income and expenses are recorded on the accrual basis. Dividends received from mutual fund investments are reflected as dividend income; capital gain distributions are reflected as realized gain/loss. Dividend income and capital gain distributions are recorded on the ex-dividend date. Income tax-related interest and penalties, if incurred, would be recorded as income tax expense. Investment transactions are accounted for on the trade date. Realized gains and losses are reported on the identified cost basis. Distributions to shareholders are recorded on the ex-dividend date. Income distributions are declared and paid annually. Capital gain distributions, if any, are generally declared and paid by the fund annually.
Currency Translation Assets, including investments, and liabilities denominated in foreign currencies are translated into U.S. dollar values each day at the prevailing exchange rate, using the mean of the bid and asked prices of such currencies against U.S. dollars as quoted by a major bank. Purchases and sales of securities, income, and expenses are translated into U.S. dollars at the prevailing exchange rate on the date of the transaction. The effect of changes in foreign currency exchange rates on realized and unrealized security gains and losses is reflected as a component of security gains and losses.
Redemption Fees A 2% fee is assessed on redemptions of fund shares held for 90 days or less to deter short-term trading and to protect the interests of long-term shareholders. Redemption fees are withheld from proceeds that shareholders receive from the sale or exchange of fund shares. The fees are paid to the fund and are recorded as an increase to paid-in capital. The fees may cause the redemption price per share to differ from the net asset value per share.
NOTE 2 - VALUATION
The fund’s financial instruments are reported at fair value as defined by GAAP. The fund determines the values of its assets and liabilities and computes its net asset value per share at the close of the New York Stock Exchange (NYSE), normally 4 p.m. ET, each day that the NYSE is open for business. Values in the accompanying Portfolio of Investments are as of October 29, 2010, the last business day in the fund’s fiscal year ended October 31, 2010. Some foreign markets were open between October 29 and the close of the reporting period on October 31, but any differences in values and foreign exchange rates subsequent to October 29 through October 31 were immaterial to the fund’s financial statements.
Valuation Methods Equity securities listed or regularly traded on a securities exchange or in the over-the-counter (OTC) market are valued at the last quoted sale price or, for certain markets, the official closing price at the time the valuations are made, except for OTC Bulletin Board securities, which are valued at the mean of the latest bid and asked prices. A security that is listed or traded on more than one exchange is valued at the quotation on the exchange determined to be the primary market for such security. Listed securities not traded on a particular day are valued at the mean of the latest bid and asked prices for domestic securities and the last quoted sale price for international securities.
Investments in mutual funds are valued at the mutual fund’s closing net asset value per share on the day of valuation.
Other investments, including restricted securities, and those financial instruments for which the above valuation procedures are inappropriate or are deemed not to reflect fair value are stated at fair value as determined in good faith by the T. Rowe Price Valuation Committee, established by the fund’s Board of Directors.
For valuation purposes, the last quoted prices of non-U.S. equity securities may be adjusted under the circumstances described below. If the fund determines that developments between the close of a foreign market and the close of the NYSE will, in its judgment, materially affect the value of some or all of its portfolio securities, the fund will adjust the previous closing prices to reflect what it believes to be the fair value of the securities as of the close of the NYSE. In deciding whether it is necessary to adjust closing prices to reflect fair value, the fund reviews a variety of factors, including developments in foreign markets, the performance of U.S. securities markets, and the performance of instruments trading in U.S. markets that represent foreign securities and baskets of foreign securities. A fund may also fair value securities in other situations, such as when a particular foreign market is closed but the fund is open. The fund uses outside pricing services to provide it with closing prices and information to evaluate and/or adjust those prices. The fund cannot predict how often it will use closing prices and how often it will determine it necessary to adjust those prices to reflect fair value. As a means of evaluating its security valuation process, the fund routinely compares closing prices, the next day’s opening prices in the same markets, and adjusted prices.
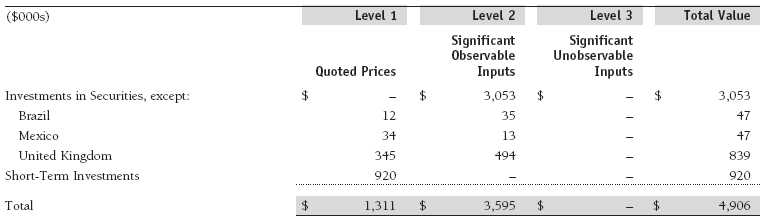
Valuation Inputs Various inputs are used to determine the value of the fund’s financial instruments. These inputs are summarized in the three broad levels listed below:
Level 1 – quoted prices in active markets for identical financial instruments
Level 2 – observable inputs other than Level 1 quoted prices (including, but not limited to, quoted prices for similar financial instruments, interest rates, prepayment speeds, and credit risk)
Level 3 – unobservable inputs
Observable inputs are those based on market data obtained from sources independent of the fund, and unobservable inputs reflect the fund’s own assumptions based on the best information available. The input levels are not necessarily an indication of the risk or liquidity associated with financial instruments at that level. For example, non-U.S. equity securities actively traded in foreign markets generally are reflected in Level 2 despite the availability of closing prices because the fund evaluates and determines whether those closing prices reflect fair value at the close of the NYSE or require adjustment, as described above. The following table summarizes the fund’s financial instruments, based on the inputs used to determine their values on October 31, 2010:
NOTE 3 - OTHER INVESTMENT TRANSACTIONS
Purchases and sales of portfolio securities other than short-term securities aggregated $3,957,000 and $14,000, respectively, for the period ended October 31, 2010.
NOTE 4 - FEDERAL INCOME TAXES
No provision for federal income taxes is required since the fund intends to qualify as a regulated investment company under Subchapter M of the Internal Revenue Code and distribute to shareholders all of its taxable income and gains. Distributions determined in accordance with federal income tax regulations may differ in amount or character from net investment income and realized gains for financial reporting purposes. Financial reporting records are adjusted for permanent book/tax differences to reflect tax character but are not adjusted for temporary differences.
The fund files U.S. federal, state, and local tax returns as required. The fund’s tax returns are subject to examination by the relevant tax authorities until expiration of the applicable statute of limitations, which is generally three years after filing of the tax return, but which can be extended to six years in certain circumstances.
There were no distributions for the partial inception year ended October 31, 2010. At October 31, 2010, the tax-basis cost of investments and components of net assets were as follows:
![]()
NOTE 5 - RELATED PARTY TRANSACTIONS
The fund is managed by T. Rowe Price International, Inc. (the manager), a wholly owned subsidiary of T. Rowe Price Associates, Inc. (Price Associates), which is wholly owned by T. Rowe Price Group, Inc. The investment management agreement between the fund and the manager provides for an annual investment management fee equal to 0.65% of the fund’s average daily net assets. The fee is computed daily and paid monthly.
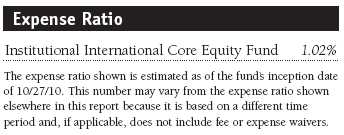
The fund is also subject to a contractual expense limitation through February 28, 2013. During the limitation period, the manager is required to waive its management fee and reimburse the fund for any expenses, excluding interest, taxes, brokerage commissions, and extraordinary expenses that would otherwise cause the fund’s ratio of annualized total expenses to average net assets (expense ratio) to exceed its expense limitation of 0.75%. For a period of three years after the date of any reimbursement or waiver, the fund is required to repay the manager for expenses previously reimbursed and management fees waived to the extent its net assets have grown or expenses have declined sufficiently to allow repayment without causing the fund’s expense ratio to exceed its expense limitation. Pursuant to this agreement, expenses in the amount of $2,000 were reimbursed by the manager during the period ended October 31, 2010. Including these amounts, expenses previously reimbursed by the manager in the amount of $2,000 remain subject to repayment by the fund at October 31, 2010.
In addition, the fund has entered into service agreements with Price Associates and a wholly owned subsidiary of Price Associates (collectively, Price). Price Associates computes the daily share price and provides certain other administrative services to the fund. T. Rowe Price Services, Inc., provides shareholder and administrative services in its capacity as the fund’s transfer and dividend disbursing agent. For the period ended October 31, 2010, expenses incurred pursuant to these service agreements were $2,000 for Price Associates and $0 for T. Rowe Price Services, Inc. The total amount payable at period-end pursuant to these service agreements is reflected as Due to Affiliates in the accompanying financial statements.
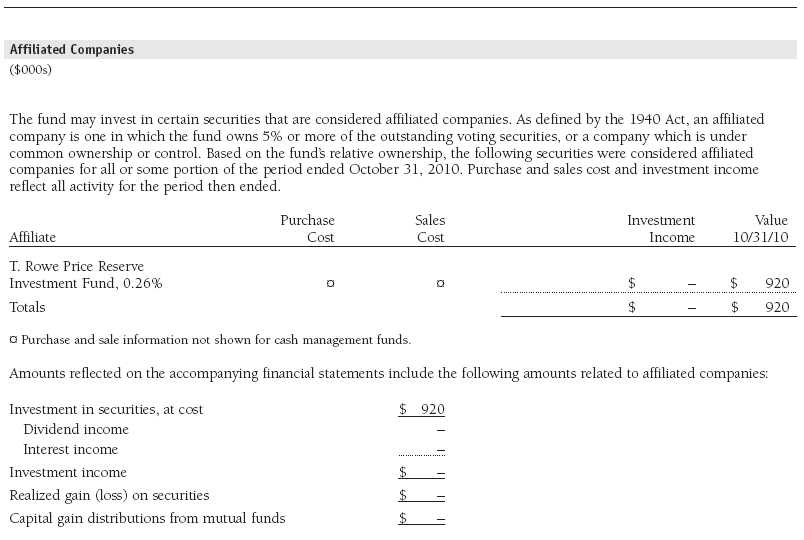
The fund may invest in the T. Rowe Price Reserve Investment Fund and the T. Rowe Price Government Reserve Investment Fund (collectively, the T. Rowe Price Reserve Investment Funds), open-end management investment companies managed by Price Associates and considered affiliates of the fund. The T. Rowe Price Reserve Investment Funds are offered as cash management options to mutual funds, trusts, and other accounts managed by Price Associates and/or its affiliates and are not available for direct purchase by members of the public. The T. Rowe Price Reserve Investment Funds pay no investment management fees.
As of October 31, 2010, T. Rowe Price Group, Inc., and/or its wholly owned subsidiaries owned 400,000 shares of the fund, representing 100% of the fund’s net assets.
Report of Independent Registered Public Accounting Firm
To the Board of Directors of T. Rowe Price Institutional International Funds, Inc. and
Shareholders of T. Rowe Price Institutional International Core Equity Fund
In our opinion, the accompanying statement of assets and liabilities, including the portfolio of investments, and the related statements of operations and of changes in net assets and the financial highlights present fairly, in all material respects, the financial position of T. Rowe Price Institutional International Core Equity Fund (one of the portfolios comprising T. Rowe Price Institutional International Funds, Inc., hereafter referred to as the “Fund”) at October 31, 2010, and the results of its operations, the changes in its net assets and the financial highlights for the period October 27, 2010 (commencement of operations) through October 31, 2010, in conformity with accounting principles generally accepted in the United States of America. These financial statements and financial highlights (hereafter referred to as “financial statements”) are the responsibility of the Fund’s management; our responsibility is to express an opinion on these financial statements based on our audit. We conducted our audit of these financial statements in accordance with the standards of the Public Company Accounting Oversight Board (United States). Those standards require that we plan and perform the audit to obtain reasonable assurance about whether the financial statements are free of material misstatement. An audit includes examining, on a test basis, evidence supporting the amounts and disclosures in the financial statements, assessing the accounting principles used and significant estimates made by management, and evaluating the overall financial statement presentation. We believe that our audit, which included confirmation of securities at October 31, 2010 by correspondence with the custodian and brokers, and confirmation of the underlying fund by correspondence with the transfer agent, provides a reasonable basis for our opinion.
PricewaterhouseCoopers LLP
Baltimore, Maryland
December 17, 2010
| Information on Proxy Voting Policies, Procedures, and Records |
A description of the policies and procedures used by T. Rowe Price funds and portfolios to determine how to vote proxies relating to portfolio securities is available in each fund’s Statement of Additional Information, which you may request by calling 1-800-225-5132 or by accessing the SEC’s website, sec.gov. The description of our proxy voting policies and procedures is also available on our website, troweprice.com. To access it, click on the words “Our Company” at the top of our corporate homepage. Then, when the next page appears, click on the words “Proxy Voting Policies” on the left side of the page.
Each fund’s most recent annual proxy voting record is available on our website and through the SEC’s website. To access it through our website, follow the directions above, then click on the words “Proxy Voting Records” on the right side of the Proxy Voting Policies page.
| How to Obtain Quarterly Portfolio Holdings |
The fund files a complete schedule of portfolio holdings with the Securities and Exchange Commission for the first and third quarters of each fiscal year on Form N-Q. The fund’s Form N-Q is available electronically on the SEC’s website (sec.gov); hard copies may be reviewed and copied at the SEC’s Public Reference Room, 450 Fifth St. N.W., Washington, DC 20549. For more information on the Public Reference Room, call 1-800-SEC-0330.
| About the Fund’s Directors and Officers |
Your fund is overseen by a Board of Directors (Board) that meets regularly to review a wide variety of matters affecting the fund, including performance, investment programs, compliance matters, advisory fees and expenses, service providers, and other business affairs. The Board elects the fund’s officers, who are listed in the final table. At least 75% of the Board’s members are independent of T. Rowe Price Associates, Inc. (T. Rowe Price), and T. Rowe Price International, Inc. (T. Rowe Price International); “inside” or “interested” directors are employees or officers of T. Rowe Price. The business address of each director and officer is 100 East Pratt Street, Baltimore, Maryland 21202. The Statement of Additional Information includes additional information about the fund directors and is available without charge by calling a T. Rowe Price representative at 1-800-225-5132.
| Independent Directors | |
| Name (Year of Birth) | Principal Occupation(s) and Directorships of Public Companies and Other Investment Companies During |
| Year Elected* | the Past Five Years |
| William R. Brody (1944) | President and Trustee, Salk Institute for Biological Studies (2009 to present); Director, Novartis, Inc. (2009 |
| 2009 | to present); Director, IBM (2007 to present); President and Trustee, Johns Hopkins University (1996 to 2009); |
| Chairman of Executive Committee and Trustee, Johns Hopkins Health System (1996 to 2009); Director, Medtronic, | |
| Inc. (1998 to 2007); Director, Mercantile Bankshares (1997 to 2007) | |
| Jeremiah E. Casey (1940) | Director, National Life Insurance (2001 to 2005); Director, NLV Financial Corporation (2004 to 2005) |
| 2006 | |
| Anthony W. Deering (1945) | Chairman, Exeter Capital, LLC, a private investment firm (2004 to present); Director, Under Armour (2008 to |
| 1991 | present); Director, Vornado Real Estate Investment Trust (2004 to present); Director, Mercantile Bankshares |
| (2002 to 2007); Member, Advisory Board, Deutsche Bank North America (2004 to present) | |
| Donald W. Dick, Jr. (1943) | Principal, EuroCapital Partners, LLC, an acquisition and management advisory firm (1995 to present) |
| 1989 | |
| Karen N. Horn (1943) | Senior Managing Director, Brock Capital Group, an advisory and investment banking firm (2004 to present); |
| 2003 | Director, Eli Lilly and Company (1987 to present); Director, Simon Property Group (2004 to present); Director, |
| Norfolk Southern (2008 to present); Director, Fannie Mae (2006 to 2008); Director, Georgia Pacific (2004 | |
| to 2005) | |
| Theo C. Rodgers (1941) | President, A&R Development Corporation (1977 to present) |
| 2006 | |
| John G. Schreiber (1946) | Owner/President, Centaur Capital Partners, Inc., a real estate investment company (1991 to present); Cofounder |
| 2001 | and Partner, Blackstone Real Estate Advisors, L.P. (1992 to present) |
| Mark R. Tercek (1957) | President and Chief Executive Officer, The Nature Conservancy (2008 to present); Managing Director, The Goldman |
| 2009 | Sachs Group, Inc. (1984 to 2008) |
| *Each independent director oversees 128 T. Rowe Price portfolios and serves until retirement, resignation, or election of a successor. | |
| Inside Directors | |
| Name (Year of Birth) | |
| Year Elected* [Number of T. Rowe | Principal Occupation(s) and Directorships of Public Companies and Other Investment Companies During |
| Price Portfolios Overseen] | the Past Five Years |
| Edward C. Bernard (1956) | Director and Vice President, T. Rowe Price; Vice Chairman of the Board, Director, and Vice President, T. Rowe Price |
| 2006 [128] | Group, Inc.; Chairman of the Board, Director, and President, T. Rowe Price Investment Services, Inc.; Chairman of |
| the Board and Director, T. Rowe Price Global Investment Services Limited, T. Rowe Price Retirement Plan Services, | |
| Inc., T. Rowe Price Savings Bank, and T. Rowe Price Services, Inc.; Director, T. Rowe Price International, Inc.; | |
| Chief Executive Officer, Chairman of the Board, Director, and President, T. Rowe Price Trust Company; Chairman | |
| of the Board, all funds | |
| Brian C. Rogers, CFA, CIC (1955) | Chief Investment Officer, Director, and Vice President, T. Rowe Price; Chairman of the Board, Chief Investment |
| 2006 [73] | Officer, Director, and Vice President, T. Rowe Price Group, Inc.; Vice President, T. Rowe Price Trust Company |
| *Each inside director serves until retirement, resignation, or election of a successor. | |
| Officers | |
| Name (Year of Birth) | |
| Position Held With Institutional International Funds | Principal Occupation(s) |
| Ulle Adamson, CFA (1979) | Vice President, T. Rowe Price Group, Inc., and T. Rowe Price |
| Vice President | International, Inc. |
| Christopher D. Alderson (1962) | Chief Executive Officer, Director, and President, T. Rowe Price International, |
| President | Inc.; Vice President, T. Rowe Price Global Investment Services Limited and |
| T. Rowe Price Group, Inc. | |
| Paulina Amieva (1981) | Vice President, T. Rowe Price International, Inc. |
| Vice President | |
| R. Scott Berg, CFA (1972) | Vice President, T. Rowe Price and T. Rowe Price Group, Inc. |
| Executive Vice President | |
| Mark C.J. Bickford-Smith (1962) | Vice President, T. Rowe Price Group, Inc., and T. Rowe Price |
| Vice President | International, Inc. |
| Jose Costa Buck (1972) | Vice President, T. Rowe Price Group, Inc., and T. Rowe Price |
| Vice President | International, Inc. |
| Richard N. Clattenburg, CFA (1979) | Vice President, T. Rowe Price, T. Rowe Price Global Investment Services |
| Vice President | Limited, and T. Rowe Price Group, Inc. |
| Michael J. Conelius, CFA (1964) | Vice President, T. Rowe Price, T. Rowe Price Global Investment Services |
| Executive Vice President | Limited, T. Rowe Price Group, Inc., T. Rowe Price International, Inc., and |
| T. Rowe Price Trust Company | |
| Richard de los Reyes (1975) | Vice President, T. Rowe Price and T. Rowe Price Group, Inc.; formerly |
| Vice President | Analyst, Soros Fund Management (to 2006) |
| Mark J.T. Edwards (1957) | Vice President, T. Rowe Price Group, Inc., and T. Rowe Price |
| Vice President | International, Inc. |
| David J. Eiswert, CFA (1972) | Vice President, T. Rowe Price, T. Rowe Price Global Investment Services |
| Vice President | Limited, and T. Rowe Price Group, Inc. |
| Roger L. Fiery III, CPA (1959) | Vice President, T. Rowe Price, T. Rowe Price Group, Inc., T. Rowe Price |
| Vice President | International, Inc., and T. Rowe Price Trust Company |
| Robert N. Gensler (1957) | Vice President, T. Rowe Price, T. Rowe Price Global Investment Services |
| Executive Vice President | Limited, T. Rowe Price Group, Inc., and T. Rowe Price International, Inc. |
| John R. Gilner (1961) | Chief Compliance Officer and Vice President, T. Rowe Price; Vice President, |
| Chief Compliance Officer | T. Rowe Price Group, Inc., and T. Rowe Price Investment Services, Inc. |
| Gregory S. Golczewski (1966) | Vice President, T. Rowe Price and T. Rowe Price Trust Company |
| Vice President | |
| M. Campbell Gunn (1956) | Vice President, T. Rowe Price Global Investment Services Limited, T. Rowe |
| Vice President | Price Group, Inc., and T. Rowe Price International, Inc. |
| Gregory K. Hinkle, CPA (1958) | Vice President, T. Rowe Price, T. Rowe Price Group, Inc., and T. Rowe Price |
| Treasurer | Trust Company; formerly Partner, PricewaterhouseCoopers LLP (to 2007) |
| Leigh Innes, CFA (1976) | Vice President, T. Rowe Price Group, Inc., and T. Rowe Price |
| Vice President | International, Inc. |
| Randal Spero Jenneke (1971) | Vice President, T. Rowe Price Group, Inc., T. Rowe Price Global Investment |
| Vice President | Services Limited, and T. Rowe Price International, Inc.; formerly Senior |
| Portfolio Manager, Australian Equities (to 2010), and Head of Research, | |
| Australian Equities (to 2007) | |
| Kris H. Jenner, M.D., D.Phil. (1962) | Vice President, T. Rowe Price, T. Rowe Price Global Investment Services |
| Vice President | Limited, and T. Rowe Price Group, Inc. |
| Ian D. Kelson (1956) | Vice President, T. Rowe Price, T. Rowe Price Global Investment Services |
| Executive Vice President | Limited, T. Rowe Price Group, Inc., and T. Rowe Price International, Inc. |
| Mark J. Lawrence (1970) | Vice President, T. Rowe Price Group, Inc., and T. Rowe Price |
| Vice President | International, Inc. |
| David M. Lee, CFA (1962) | Vice President, T. Rowe Price and T. Rowe Price Group, Inc. |
| Vice President | |
| Patricia B. Lippert (1953) | Assistant Vice President, T. Rowe Price and T. Rowe Price Investment |
| Secretary | Services, Inc. |
| Anh Lu (1968) | Vice President, T. Rowe Price Group, Inc., and T. Rowe Price |
| Vice President | International, Inc. |
| Daniel Martino, CFA (1974) | Vice President, T. Rowe Price and T. Rowe Price Group, Inc.; formerly |
| Vice President | Research Analyst and Co-portfolio Manager, Taurus Asset Management |
| (to 2006), and Onex Public Markets Group (to 2006) | |
| Susanta Mazumdar (1968) | Vice President, T. Rowe Price Group, Inc., and T. Rowe Price |
| Vice President | International, Inc. |
| Raymond A. Mills, Ph.D., CFA (1960) | Vice President, T. Rowe Price, T. Rowe Price Group, Inc., T. Rowe Price |
| Executive Vice President | International, Inc., and T. Rowe Price Trust Company |
| Joshua Nelson (1977) | Vice President, T. Rowe Price and T. Rowe Price Group, Inc. |
| Vice President | |
| Jason Nogueira, CFA (1974) | Vice President, T. Rowe Price and T. Rowe Price Group, Inc. |
| Vice President | |
| Charles M. Ober, CFA (1950) | Vice President, T. Rowe Price and T. Rowe Price Group, Inc. |
| Vice President | |
| David Oestreicher (1967) | Director and Vice President, T. Rowe Price Investment Services, Inc., |
| Vice President | T. Rowe Price Trust Company, T. Rowe Price Retirement Plan Services, Inc., |
| and T. Rowe Price Services, Inc.; Vice President, T. Rowe Price, T. Rowe | |
| Price Global Investment Services Limited, T. Rowe Price Group, Inc., and | |
| T. Rowe Price International, Inc. | |
| Gonzalo Pángaro, CFA (1968) | Vice President, T. Rowe Price Group, Inc., and T. Rowe Price |
| Executive Vice President | International, Inc. |
| Timothy E. Parker, CFA (1974) | Vice President, T. Rowe Price and T. Rowe Price Group, Inc. |
| Vice President | |
| Frederick A. Rizzo (1969) | Vice President, T. Rowe Price Group, Inc., and T. Rowe Price International, |
| Vice President | Inc.; formerly Analyst, F&C Asset Management (London) (to 2006) |
| Joseph Rohm (1966) | Vice President, T. Rowe Price Group, Inc., and T. Rowe Price |
| Executive Vice President | International, Inc. |
| Federico Santilli, CFA (1974) | Vice President, T. Rowe Price Group, Inc., and T. Rowe Price |
| Executive Vice President | International, Inc. |
| Sebastian Schrott (1977) | Vice President, T. Rowe Price Group, Inc., and T. Rowe Price |
| Vice President | International, Inc. |
| Deborah D. Seidel (1962) | Vice President, T. Rowe Price, T. Rowe Price Group, Inc., and T. Rowe Price |
| Vice President | Investment Services, Inc.; Vice President and Assistant Treasurer, T. Rowe |
| Price Services, Inc. | |
| Robert W. Sharps, CFA, CPA (1971) | Vice President, T. Rowe Price, T. Rowe Price Group, Inc., and T. Rowe Price |
| Vice President | Trust Company |
| Robert W. Smith (1961) | Vice President, T. Rowe Price, T. Rowe Price Group, Inc., and T. Rowe Price |
| Executive Vice President | Trust Company |
| Jonty Starbuck, Ph.D. (1975) | Vice President, T. Rowe Price Group, Inc., and T. Rowe Price |
| Vice President | International, Inc. |
| Dean Tenerelli (1964) | Vice President, T. Rowe Price Group, Inc., and T. Rowe Price |
| Vice President | International, Inc. |
| Julie L. Waples (1970) | Vice President, T. Rowe Price |
| Vice President | |
| Christopher S. Whitehouse (1972) | Vice President, T. Rowe Price Group, Inc., and T. Rowe Price |
| Vice President | International, Inc. |
| Unless otherwise noted, officers have been employees of T. Rowe Price or T. Rowe Price International for at least 5 years. | |
Item 2. Code of Ethics.
The registrant has adopted a code of ethics, as defined in Item 2 of Form N-CSR, applicable to its principal executive officer, principal financial officer, principal accounting officer or controller, or persons performing similar functions. A copy of this code of ethics is filed as an exhibit to this Form N-CSR. No substantive amendments were approved or waivers were granted to this code of ethics during the period covered by this report.
Item 3. Audit Committee Financial Expert.
The registrant’s Board of Directors/Trustees has determined that Mr. Anthony W. Deering qualifies as an audit committee financial expert, as defined in Item 3 of Form N-CSR. Mr. Deering is considered independent for purposes of Item 3 of Form N-CSR.
Item 4. Principal Accountant Fees and Services.
(a) – (d) Aggregate fees billed to the registrant for the last two fiscal years for professional services rendered by the registrant’s principal accountant were as follows:
Audit fees include amounts related to the audit of the registrant’s annual financial statements and services normally provided by the accountant in connection with statutory and regulatory filings. Audit-related fees include amounts reasonably related to the performance of the audit of the registrant’s financial statements and specifically include the issuance of a report on internal controls and, if applicable, agreed-upon procedures related to fund acquisitions. Tax fees include amounts related to services for tax compliance, tax planning, and tax advice. The nature of these services specifically includes the review of distribution calculations and the preparation of Federal, state, and excise tax returns. All other fees include the registrant’s pro-rata share of amounts for agreed-upon procedures in conjunction with service contract approvals by the registrant’s Board of Directors/Trustees.
(e)(1) The registrant’s audit committee has adopted a policy whereby audit and non-audit services performed by the registrant’s principal accountant for the registrant, its investment adviser, and any entity controlling, controlled by, or under common control with the investment adviser that provides ongoing services to the registrant require pre-approval in advance at regularly scheduled audit committee meetings. If such a service is required between regularly scheduled audit committee meetings, pre-approval may be authorized by one audit committee member with ratification at the next scheduled audit committee meeting. Waiver of pre-approval for audit or non-audit services requiring fees of a de minimis amount is not permitted.
(2) No services included in (b) – (d) above were approved pursuant to paragraph (c)(7)(i)(C) of Rule 2-01 of Regulation S-X.
(f) Less than 50 percent of the hours expended on the principal accountant’s engagement to audit the registrant’s financial statements for the most recent fiscal year were attributed to work performed by persons other than the principal accountant’s full-time, permanent employees.
(g) The aggregate fees billed for the most recent fiscal year and the preceding fiscal year by the registrant’s principal accountant for non-audit services rendered to the registrant, its investment adviser, and any entity controlling, controlled by, or under common control with the investment adviser that provides ongoing services to the registrant were $1,429,000 and $2,179,000, respectively.
(h) All non-audit services rendered in (g) above were pre-approved by the registrant’s audit committee. Accordingly, these services were considered by the registrant’s audit committee in maintaining the principal accountant’s independence.
Item 5. Audit Committee of Listed Registrants.
Not applicable.
Item 6. Investments.
(a) Not applicable. The complete schedule of investments is included in Item 1 of this Form N-CSR.
(b) Not applicable.
Item 7. Disclosure of Proxy Voting Policies and Procedures for Closed-End Management Investment Companies.
Not applicable.
Item 8. Portfolio Managers of Closed-End Management Investment Companies.
Not applicable.
Item 9. Purchases of Equity Securities by Closed-End Management Investment Company and Affiliated Purchasers.
Not applicable.
Item 10. Submission of Matters to a Vote of Security Holders.
Not applicable.
Item 11. Controls and Procedures.
(a) The registrant’s principal executive officer and principal financial officer have evaluated the registrant’s disclosure controls and procedures within 90 days of this filing and have concluded that the registrant’s disclosure controls and procedures were effective, as of that date, in ensuring that information required to be disclosed by the registrant in this Form N-CSR was recorded, processed, summarized, and reported timely.
(b) The registrant’s principal executive officer and principal financial officer are aware of no change in the registrant’s internal control over financial reporting that occurred during the registrant’s second fiscal quarter covered by this report that has materially affected, or is reasonably likely to materially affect, the registrant’s internal control over financial reporting.
Item 12. Exhibits.
(a)(1) The registrant’s code of ethics pursuant to Item 2 of Form N-CSR is attached.
(2) Separate certifications by the registrant's principal executive officer and principal financial officer, pursuant to Section 302 of the Sarbanes-Oxley Act of 2002 and required by Rule 30a-2(a) under the Investment Company Act of 1940, are attached.
(3) Written solicitation to repurchase securities issued by closed-end companies: not applicable.
(b) A certification by the registrant's principal executive officer and principal financial officer, pursuant to Section 906 of the Sarbanes-Oxley Act of 2002 and required by Rule 30a-2(b) under the Investment Company Act of 1940, is attached.
SIGNATURES | |
| Pursuant to the requirements of the Securities Exchange Act of 1934 and the Investment | |
| Company Act of 1940, the registrant has duly caused this report to be signed on its behalf by the | |
| undersigned, thereunto duly authorized. | |
| T. Rowe Price Institutional International Funds, Inc. | |
| By | /s/ Edward C. Bernard |
| Edward C. Bernard | |
| Principal Executive Officer | |
| Date | December 17, 2010 |
| Pursuant to the requirements of the Securities Exchange Act of 1934 and the Investment | |
| Company Act of 1940, this report has been signed below by the following persons on behalf of | |
| the registrant and in the capacities and on the dates indicated. | |
| By | /s/ Edward C. Bernard |
| Edward C. Bernard | |
| Principal Executive Officer | |
| Date | December 17, 2010 |
| By | /s/ Gregory K. Hinkle |
| Gregory K. Hinkle | |
| Principal Financial Officer | |
| Date | December 17, 2010 |