| UNITED STATES |
| SECURITIES AND EXCHANGE COMMISSION |
| Washington, D.C. 20549 |
| |
FORM N-CSR |
| |
CERTIFIED SHAREHOLDER REPORT OF REGISTERED |
MANAGEMENT INVESTMENT COMPANIES |
| |
| |
| |
| Investment Company Act File Number: 811-5833 |
|
| |
| T. Rowe Price Institutional International Funds, Inc. |
|
| (Exact name of registrant as specified in charter) |
| |
| 100 East Pratt Street, Baltimore, MD 21202 |
|
| (Address of principal executive offices) |
| |
| David Oestreicher |
| 100 East Pratt Street, Baltimore, MD 21202 |
|
| (Name and address of agent for service) |
| |
| |
| Registrant’s telephone number, including area code: (410) 345-2000 |
| |
| |
| Date of fiscal year end: October 31 |
| |
| |
| Date of reporting period: April 30, 2010 |
Item 1: Report to Shareholders| Institutional Africa & Middle East Fund | April 30, 2010 |
• Stocks in African and Middle Eastern markets produced solid returns in the last six months, helped by rising commodity prices and signs of improving global economic growth.
• Your fund returned 11.36% in our reporting period but trailed its benchmark, the MSCI Arabian Markets and Africa Index.
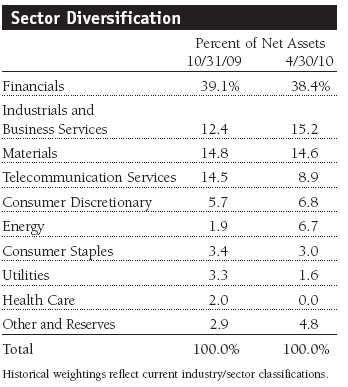
• The fund is currently positioned in what we believe to be the highest-quality growth stocks in the stronger economies in our target regions. We favor financials and industrials that may benefit from economic growth and infrastructure spending, respectively.
• We remain optimistic about the long-term outlook for Africa and the Middle East. Many stocks in these regions are currently trading at attractive valuations that do not fully reflect future growth, in our opinion.
The views and opinions in this report were current as of April 30, 2010. They are not guarantees of performance or investment results and should not be taken as investment advice. Investment decisions reflect a variety of factors, and the managers reserve the right to change their views about individual stocks, sectors, and the markets at any time. As a result, the views expressed should not be relied upon as a forecast of the fund’s future investment intent. The report is certified under the Sarbanes-Oxley Act, which requires mutual funds and other public companies to affirm that, to the best of their knowledge, the information in their financial reports is fairly and accurately stated in all material respects.
Manager’s Letter
T. Rowe Price Institutional Africa & Middle East Fund
Dear Investor
Stocks in African and Middle Eastern markets produced solid returns in the six-month period ended April 30, 2010, helped by continued strength in commodity prices and signs of improving global economic growth. Equities in Kenya and oil producer Nigeria generated the strongest returns. South African shares also did well in U.S. dollar terms, helped by an interest rate cut, rising precious metals prices, and strength in the rand versus the dollar. Among Persian Gulf nations, markets in Oman and Saudi Arabia were lifted by their financials and telecommunication sectors, respectively. Stocks in the United Arab Emirates (UAE) fell sharply due to a debt crisis at Dubai World, a large state-owned company that announced a delay in debt repayment at the beginning of our reporting period. The market trimmed its losses, and investor sentiment improved after Dubai World agreed to restructure its debt.
Performance Comparison
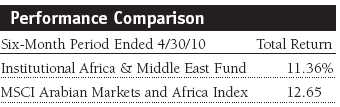
Your fund returned 11.36% in the six-month period ended April 30, 2010, modestly trailing its benchmark, the MSCI Arabian Markets and Africa Index. Performance was weak early in the period but has improved markedly in recent months, as markets have started to reward strong fundamentals again. The fund’s performance was lifted by generally strong stock selection throughout our target regions, such as banks in Oman and Qatar and telecommunication companies in Saudi Arabia. Overweighting Saudi Arabia and Nigeria relative to the benchmark also helped our results. However, our gains were limited by our significant underweighting of South Africa, where we feel there are fewer growth opportunities relative to the rest of our investment universe. Overweighting Lebanon and the UAE also detracted from our results, although we had been reducing our UAE exposure prior to the Dubai World debt crisis. Our UAE holdings were mostly regional companies with very little direct exposure to Dubai, but they were not immune to the sharp sell-off in the market.
Why Invest in Africa and the Middle East?
We continue to believe that many of these frontier markets offer excellent long-term prospects. Valuations relative to the broad emerging markets universe remain attractive, and economic growth in the Middle East has remained relatively strong compared with many other parts of the world over the last year. In addition, few broad emerging markets equity funds have material exposure to these regions. We would like to welcome new investors to the fund and briefly review for all investors the case for investing in African and Middle Eastern markets.
Africa
• Excluding South Africa, growth in the sub-Saharan part of the continent has been strong for much of the last decade, a marked turnaround from the 1980–1999 period, when the region’s expansion lagged the rest of the world.
• The boom in commodity prices has improved the terms of trade for many African countries that export oil, precious metals, bulk commodities, and agricultural produce. In addition, China has actively pursued bilateral agreements to secure supplies for its resource-hungry economy, and it is likely to remain a long-term trade partner.
• Many African countries have been able to reduce their debt obligations, thanks in part to favorable cancellation terms offered by creditor nations in the West and by global institutions. This has enabled them to accumulate exchange reserves that help promote currency stability and, in some cases, currency appreciation.
• Many African nations are implementing economic policies that emphasize fiscal restraint and help lower inflation, while the spread of democracy has helped to build political, social, and economic accountability. All of these developments have stimulated investment.
Middle East
• Since oil prices bottomed in the late 1990s, increased revenues from oil have fueled the economic growth of countries in the Gulf Cooperation Council (GCC): Bahrain, Kuwait, Oman, Qatar, Saudi Arabia, and the UAE.
• GCC countries have robust economic fundamentals and substantial current account surpluses that we believe are likely to continue expanding, unless oil prices fall significantly from current levels.
• Although the region has had oil-driven booms in the 1970s and 1980s, what is different this time is that GCC countries are opening their economies in an attempt to decrease their dependence on crude oil. Specifically, governments are trying to increase non-oil revenues through government-led investment in industry, tourism, and education, among other areas.
• After years of underinvestment in areas such as housing, numerous infrastructure projects in the region are under way. Such projects are encouraging improvements in the political and legislative climate of other GCC countries.
Many countries in our target regions have amassed vast reserves during years of high commodity and oil prices. Slower global growth following the 2008 financial crisis has had an effect on Africa and the Middle East, but regional growth has been underpinned by government spending on infrastructure and investments in many sectors. In addition, many central banks have proactively announced fiscal stimulus packages or provided capital to the banking system to stave off economic weakness.
Portfolio Review
Gulf Cooperation Council (GCC)
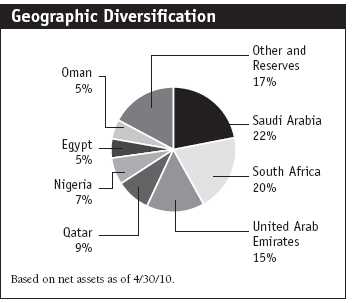
The portfolio remains heavily concentrated in four of the six GCC countries—Saudi Arabia, Oman, Qatar, and the UAE. These markets represented more than 51% of fund assets at the end of our reporting period. We had no investments in Bahrain and Kuwait as of April 30; we eliminated National Bank of Kuwait in the last six months in favor of better investment candidates. We are continuing to look for opportunities to increase the fund’s diversification by investing in new markets and increasing the number of portfolio holdings. (Please refer to the fund’s portfolio of investments for a complete listing of holdings and the amount each represents in the portfolio.)
United Arab Emirates (UAE)
The UAE remains our most significant country overweight relative to the benchmark, representing 15% of fund assets at the end of April. We believe many UAE-based companies will benefit over time from robust economic fundamentals across the region. Unfortunately, the market fell more than 11% in the first half of the fund’s fiscal year, despite a sharp rebound since February, so our overweight hurt our six-month results.
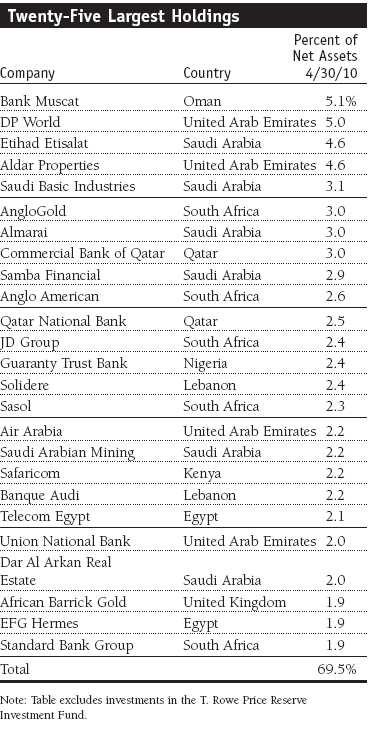
Prior to the Dubai World debt crisis, our UAE holdings included Abu Dhabi-based Union National Bank, Air Arabia, and Aldar Properties, a leading developer backed by the government and one of our largest positions in the portfolio. Its financial management is highly conservative, and the company’s valuation is attractive relative to peers in both emerging and developed markets. In Dubai, we eliminated construction company Arabtec Holding in the last six months but increased our position in DP World, which is owned by Dubai World and is one of the largest port operators in the world. Despite the debt problems of two other Dubai World businesses—Nakheel and Limitless—we continue to believe that DP World is protected from those issues. In fact, shares of DP World have performed very well since the end of February, as the company continues to deliver strong financial results and invest in valuable assets.
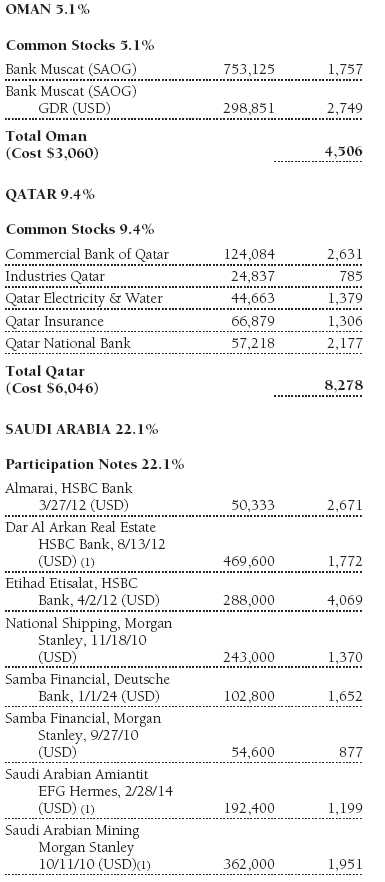
Saudi Arabia
Stocks in Saudi Arabia rose about 10% in the last six months; it was one of the stronger markets in our opportunity set, helped by elevated global oil prices. While the country is best known as the world’s leading producer and exporter of oil, its oil companies are owned by the state and hence uninvestable. Our investments in Saudi Arabia are through participation notes (P-notes), as foreigners may not own shares directly.
We believe Saudi Arabia is one of the most attractive markets in the Middle East, and our investments are mostly focused on companies that should benefit from consumer demand and from the government’s infrastructure spending. Three of the fund’s largest holdings at the end of April—which were also some of our top contributors to the fund’s six-month absolute performance—were wireless telecommunication company Etihad Etisalat, food and dairy producer Almarai, and chemical company Saudi Basic Industries. During the period, we increased our Saudi exposure from 16% to 22% of assets—the largest country allocation in the fund. New portfolio holdings include Yamamah Saudi Cement, National Shipping, and Dar Al Arkan Real Estate, which provides us with direct exposure to the Saudi housing market.
Oman and Qatar
Equities in Oman and Qatar, whose economy is one of the most attractive in the GCC, rose approximately 13% and 12%, respectively, in the last six months. Together these two Persian Gulf countries represented 14% of the fund’s net assets at the end of our reporting period. We continue to favor commercial banks in these markets, as we believe their long-term outlook remains healthy in light of large trade and government budget surpluses, which should help support economic growth. Our key investments include Qatar National Bank, Commercial Bank of Qatar, and Bank Muscat, which is a dominant bank in Oman and was one of our largest contributors to fund performance. Strong loan growth amid increased energy revenues in the last six months created a healthy environment for these banks.
Bank Muscat (5.1% of assets) was our only holding in Oman at the end of April, as we eliminated National Bank of Oman, which underperformed in the last six months, and Raysut Cement, which is facing stiff competition. In Qatar (9% of assets), we pared our positions in Qatar National Bank, conglomerate Industries Qatar, and utility company Qatar Electricity and Water. However, we reestablished a position in Qatar Insurance, which we had owned previously.

Other Middle East Countries
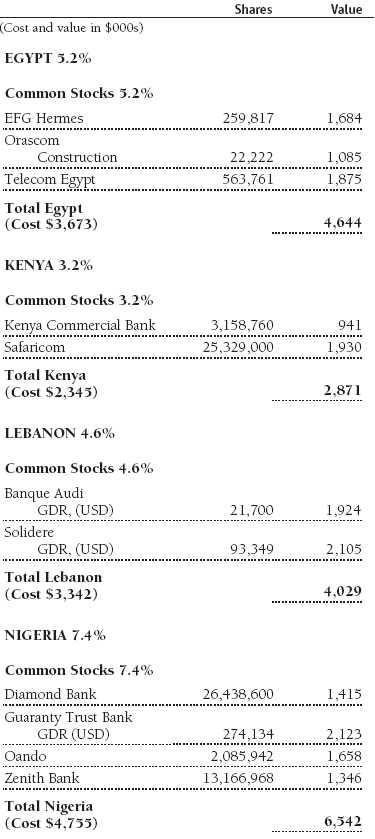
Egypt
Egyptian stocks gained almost 10% in dollar terms in the last six months. The country continues to benefit from its ties to oil-rich Middle East countries, but gains were restrained somewhat by the Dubai World debt crisis. While we continue to believe that Egypt has favorable long-term prospects, we reduced our exposure in the last six months from 12% to 5% of assets. We eliminated Commercial International Bank, which fared poorly in the last six months, but retained positions in investment bank EFG Hermes and tourist destination developer Orascom Development Holding, listed in Switzerland. These companies should benefit from rising investment banking activity across the Middle East and increased tourism, respectively. In the telecommunications sector, we reduced our exposure to Telecom Egypt and eliminated MobiNil-Egyptian into strength: The former could be hurt by increased competition from mobile phone companies; the latter recently reported weaker-than-expected financial results and could also be hurt by rising competition.
Lebanon
The Lebanese stock market underperformed in the last six months, falling more than 2%, so overweighting this country hurt our performance relative to the benchmark. We held only two Lebanese companies in the portfolio at the end of April—Banque Audi and property company Solidere, which was one of our weakest holdings in our reporting period. We trimmed both holdings in favor of better investment opportunities elsewhere.
Jordan
Stocks in Jordan fell about 3% in the last six months. We did not own any Jordan-listed companies, but we did own shares of U.K.-listed company Hikma Pharmaceuticals, a generic drugmaker based in Jordan. While improvements in pricing and profit margins for the company’s generic business appeared encouraging, we felt that they would not be sustainable, so we eliminated our position.
Africa
South Africa
The South African market climbed 17% in dollar terms in the last six months. While it is one of our largest country allocations (20% of assets as of April 30, 2010), we continue to significantly underweight it versus the benchmark. The economy remains fragile, unemployment is over 20%, and we think there are better long-term growth opportunities in other African and Middle Eastern markets. That said, there are some exceptionally well-run companies in South Africa, some of which generate significant revenues from small, faster-growing sub-Saharan markets.
One of our largest holdings and contributors to absolute performance in the last six months was gold mining company AngloGold, which benefited as gold approached $1,200 per ounce. Another strong contributor was Standard Bank Group, whereas media company Naspers and energy company Sasol produced milder gains for the fund. During the last six months, we established positions in leading retailer JD Group, which could benefit from a restructuring and economic recovery, and construction company Murray & Roberts Holdings, a potential beneficiary of increased infrastructure spending by the government. On the other hand, we eliminated telecommunications company MTN Group from the portfolio because we believe it will face increased competition from new entrants to the African telecommunications market.
Kenya and Nigeria
Stocks in Kenya and Nigeria, the top-performing markets in our reporting period, represented about 11% of the fund’s assets at the end of April. Though liquidity is often poor and corporate governance concerns are abundant, we continue to look in these and other sub-Saharan markets for well-managed businesses with favorable prospects. In the last six months, we increased our exposure to Nigeria by adding Zenith Bank and integrated energy company Oando to the portfolio. We maintained our positions in Diamond Bank and Guaranty Trust Bank, one of our largest and best-performing holdings in our reporting period. In Kenya, we added Kenya Commercial Bank to the fund and benefited from telecommunications company Safaricom’s significant gains.
Outlook
We remain optimistic about the long-term outlook for Africa and the Middle East. While equity markets in these regions did not fully participate in the 2009 global emerging markets rally, their performance relative to other major emerging regions has improved in recent months. While the world’s developed economies are just beginning to recover from the deep downturn of 2008, economic growth in the Middle East has remained relatively strong, with the rebound in oil prices over the last year bolstering revenues and investor confidence.
We have positioned the fund in what we believe to be the highest-quality growth stocks in the stronger economies in our target regions, and we believe that many stocks are trading at attractive valuations that do not truly reflect their future growth. In terms of sectors, we favor financials, which should benefit over time from economic growth and increasing wealth and regional investment. We also like industrial companies that may benefit from significant government spending programs, particularly on infrastructure.
In closing, we would like to remind our investors, particularly newer investors, that this fund has a high risk/ return profile. Because of its narrow geographic focus and relatively small number of holdings, this fund can be extremely volatile and should only represent a small portion of a long-term investor’s well-diversified portfolio.
Respectfully submitted,

Joseph Rohm
Portfolio manager
May 24, 2010
The portfolio manager has day-to-day responsibility for managing the portfolio and works with committee members in developing and executing the fund’s investment program.
| Risks of International Investing |
Funds that invest overseas generally carry more risk than funds that invest strictly in U.S. assets. Funds investing in a single country, limited geographic region, or emerging markets tend to be riskier than more diversified funds. Risks can result from varying stages of economic and political development; differing regulatory environments, trading days, and accounting standards; and higher transaction costs of non-U.S. markets. Non-U.S. investments are also subject to currency risk, or a decline in the value of a foreign currency versus the U.S. dollar, which reduces the dollar value of securities denominated in that currency.
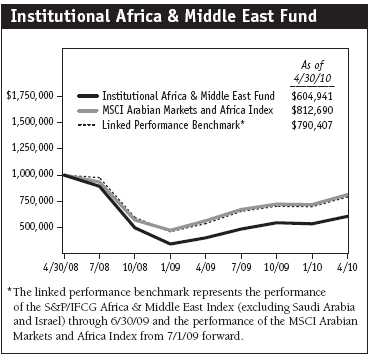
MSCI Arabian Markets and Africa Index: An index created by MSCI that measures the performance of various equity markets in the Middle East, in Africa, and along the Persian Gulf.
Portfolio Highlights
Performance and Expenses
T. Rowe Price Institutional Africa & Middle East Fund
This chart shows the value of a hypothetical $1 million investment in the fund over the past 10 fiscal year periods or since inception (for funds lacking 10-year records). The result is compared with benchmarks, which may include a broad-based market index and a peer group average or index. Market indexes do not include expenses, which are deducted from fund returns as well as mutual fund averages and indexes.
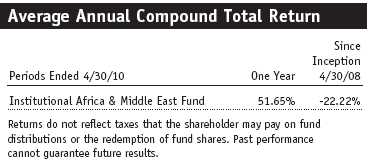
This table shows how the fund would have performed each year if its actual (or cumulative) returns for the periods shown had been earned at a constant rate.
Fund Expense Example
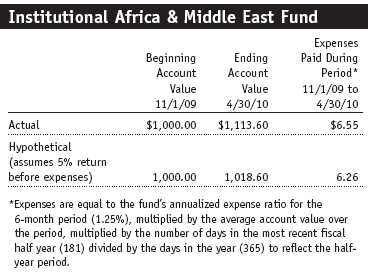
As a mutual fund shareholder, you may incur two types of costs: (1) transaction costs, such as redemption fees or sales loads, and (2) ongoing costs, including management fees, distribution and service (12b-1) fees, and other fund expenses. The following example is intended to help you understand your ongoing costs (in dollars) of investing in the fund and to compare these costs with the ongoing costs of investing in other mutual funds. The example is based on an investment of $1,000 invested at the beginning of the most recent six-month period and held for the entire period.
Actual Expenses
The first line of the following table (“Actual”) provides information about actual account values and actual expenses. You may use the information in this line, together with your account balance, to estimate the expenses that you paid over the period. Simply divide your account value by $1,000 (for example, an $8,600 account value divided by $1,000 = 8.6), then multiply the result by the number in the first line under the heading “Expenses Paid During Period” to estimate the expenses you paid on your account during this period.
Hypothetical Example for Comparison Purposes
The information on the second line of the table (“Hypothetical”) is based on hypothetical account values and expenses derived from the fund’s actual expense ratio and an assumed 5% per year rate of return before expenses (not the fund’s actual return). You may compare the ongoing costs of investing in the fund with other funds by contrasting this 5% hypothetical example and the 5% hypothetical examples that appear in the shareholder reports of the other funds. The hypothetical account values and expenses may not be used to estimate the actual ending account balance or expenses you paid for the period.
You should also be aware that the expenses shown in the table highlight only your ongoing costs and do not reflect any transaction costs, such as redemption fees or sales loads. Therefore, the second line of the table is useful in comparing ongoing costs only and will not help you determine the relative total costs of owning different funds. To the extent a fund charges transaction costs, however, the total cost of owning that fund is higher.
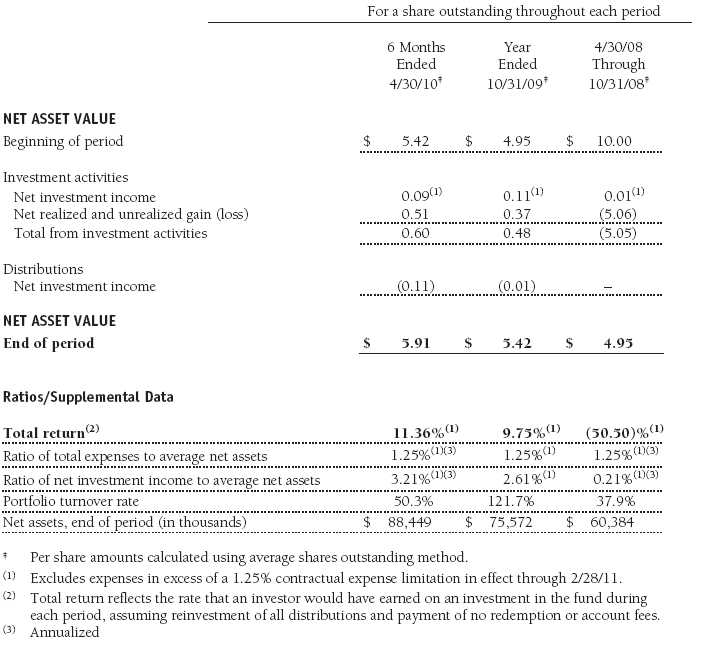
Financial Highlights
T. Rowe Price Institutional Africa & Middle East Fund
(Unaudited)
The accompanying notes are an integral part of these financial statements.
Portfolio of Investments‡
T. Rowe Price Institutional Africa & Middle East Fund
April 30, 2010 (Unaudited)


The accompanying notes are an integral part of these financial statements.
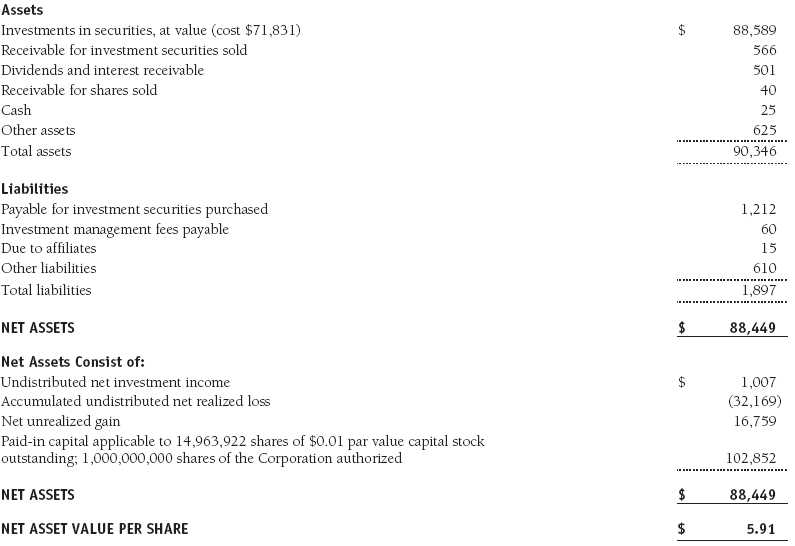
Statement of Assets and Liabilities
T. Rowe Price Institutional Africa & Middle East Fund
April 30, 2010 (Unaudited)
($000s, except shares and per share amounts)
The accompanying notes are an integral part of these financial statements.
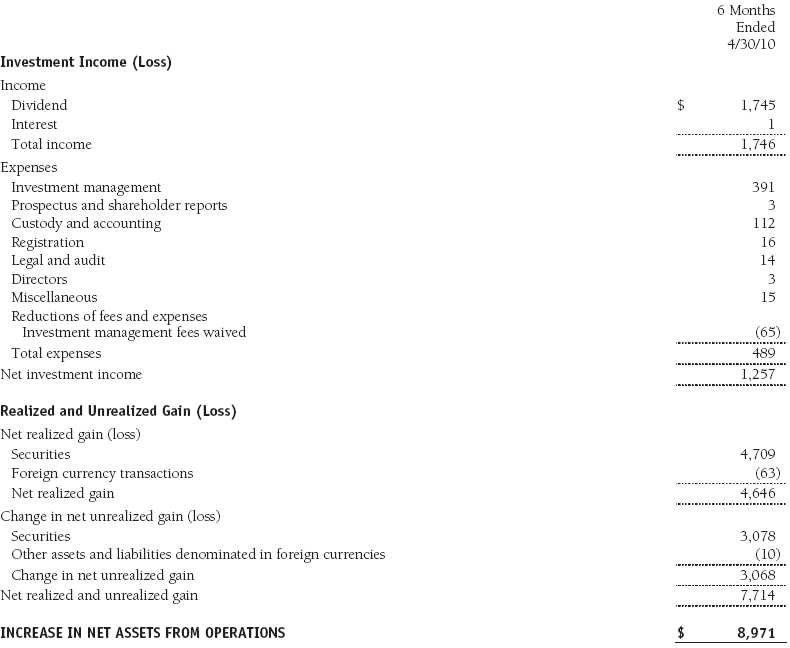
Statement of Operations
T. Rowe Price Institutional Africa & Middle East Fund
(Unaudited)
($000s)
The accompanying notes are an integral part of these financial statements.
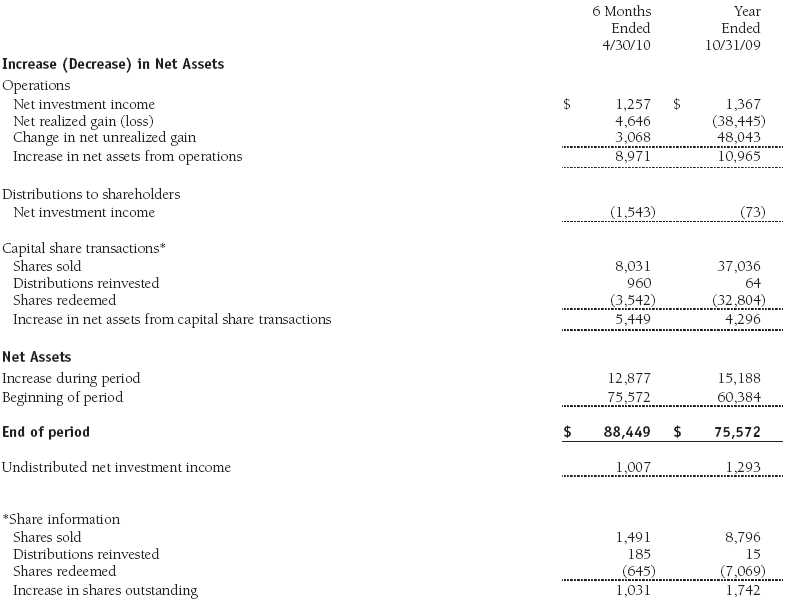
Statement of Changes in Net Assets
T. Rowe Price Institutional Africa & Middle East Fund
(Unaudited)
($000s)
The accompanying notes are an integral part of these financial statements.
Notes to Financial Statements
T. Rowe Price Institutional Africa & Middle East Fund
April 30, 2010 (Unaudited)
T. Rowe Price Institutional International Funds, Inc. (the corporation), is registered under the Investment Company Act of 1940 (the 1940 Act). The Institutional Africa & Middle East Fund (the fund), a nondiversified, open-end management investment company, is one portfolio established by the corporation. The fund commenced operations on April 30, 2008. The fund seeks long-term growth of capital by investing primarily in the common stocks of companies located (or with primary operations) in Africa and the Middle East.
NOTE 1 - SIGNIFICANT ACCOUNTING POLICIES
Basis of Preparation The accompanying financial statements were prepared in accordance with accounting principles generally accepted in the United States of America (GAAP), which require the use of estimates made by fund management. Fund management believes that estimates and security valuations are appropriate; however, actual results may differ from those estimates, and the security valuations reflected in the accompanying financial statements may differ from the value ultimately realized upon sale of the securities.
Investment Transactions, Investment Income, and Distributions Income and expenses are recorded on the accrual basis. Dividends received from mutual fund investments are reflected as dividend income; capital gain distributions are reflected as realized gain/loss. Dividend income and capital gain distributions are recorded on the ex-dividend date. Income tax-related interest and penalties, if incurred, would be recorded as income tax expense. Investment transactions are accounted for on the trade date. Realized gains and losses are reported on the identified cost basis. Distributions to shareholders are recorded on the ex-dividend date. Income distributions are declared and paid annually. Capital gain distributions, if any, are generally declared and paid by the fund, annually.
Currency Translation Assets, including investments, and liabilities denominated in foreign currencies are translated into U.S. dollar values each day at the prevailing exchange rate, using the mean of the bid and asked prices of such currencies against U.S. dollars as quoted by a major bank. Purchases and sales of securities, income, and expenses are translated into U.S. dollars at the prevailing exchange rate on the date of the transaction. The effect of changes in foreign currency exchange rates on realized and unrealized security gains and losses is reflected as a component of security gains and losses.
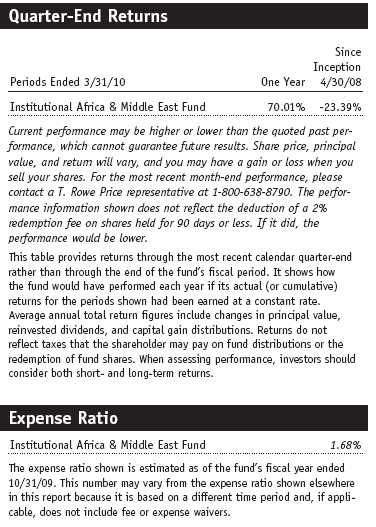
Redemption Fees A 2% fee is assessed on redemptions of fund shares held for 90 days or less to deter short-term trading and to protect the interests of long-term shareholders. Redemption fees are withheld from proceeds that shareholders receive from the sale or exchange of fund shares. The fees are paid to the fund and are recorded as an increase to paid-in capital. The fees may cause the redemption price per share to differ from the net asset value per share.
New Accounting Pronouncements In January 2010, new accounting guidance was issued that requires enhanced disclosures about fair value measurements in the financial statements; it is effective for fiscal years and interim periods beginning after December 15, 2009. Management expects that adoption of this guidance will have no impact on the fund’s net assets or results of operations.
NOTE 2 - VALUATION
The fund’s investments are reported at fair value as defined under GAAP. The fund determines the values of its assets and liabilities and computes its net asset value per share at the close of the New York Stock Exchange (NYSE), normally 4 p.m. ET, each day that the NYSE is open for business.
Valuation Methods Equity securities listed or regularly traded on a securities exchange or in the over-the-counter (OTC) market are valued at the last quoted sale price or, for certain markets, the official closing price at the time the valuations are made, except for OTC Bulletin Board securities, which are valued at the mean of the latest bid and asked prices. A security that is listed or traded on more than one exchange is valued at the quotation on the exchange determined to be the primary market for such security. Listed securities not traded on a particular day are valued at the mean of the latest bid and asked prices for domestic securities and the last quoted sale price for international securities.
Investments in mutual funds are valued at the mutual fund’s closing net asset value per share on the day of valuation.
Other investments, including restricted securities, and those financial instruments for which the above valuation procedures are inappropriate or are deemed not to reflect fair value are stated at fair value as determined in good faith by the T. Rowe Price Valuation Committee, established by the fund’s Board of Directors.
For valuation purposes, the last quoted prices of non-U.S. equity securities may be adjusted under the circumstances described below. If the fund determines that developments between the close of a foreign market and the close of the NYSE will, in its judgment, materially affect the value of some or all of its portfolio securities, the fund will adjust the previous closing prices to reflect what it believes to be the fair value of the securities as of the close of the NYSE. In deciding whether it is necessary to adjust closing prices to reflect fair value, the fund reviews a variety of factors, including developments in foreign markets, the performance of U.S. securities markets, and the performance of instruments trading in U.S. markets that represent foreign securities and baskets of foreign securities. A fund may also fair value securities in other situations, such as when a particular foreign market is closed but the fund is open. The fund uses outside pricing services to provide it with closing prices and information to evaluate and/or adjust those prices. The fund cannot predict how often it will use closing prices and how often it will determine it necessary to adjust those prices to reflect fair value. As a means of evaluating its security valuation process, the fund routinely compares closing prices, the next day’s opening prices in the same markets, and adjusted prices.
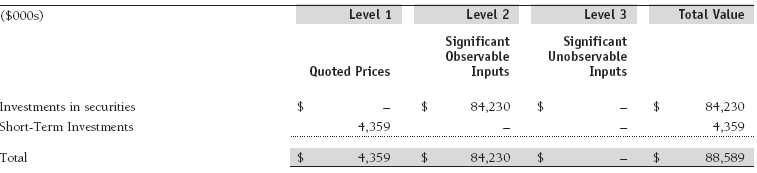
Valuation Inputs Various inputs are used to determine the value of the fund’s financial instruments. These inputs are summarized in the three broad levels listed below:
Level 1 – quoted prices in active markets for identical securities
Level 2 – observable inputs other than Level 1 quoted prices (including, but not limited to, quoted prices for similar securities, interest rates, prepayment speeds, and credit risk)
Level 3 – unobservable inputs
Observable inputs are those based on market data obtained from sources independent of the fund, and unobservable inputs reflect the fund’s own assumptions based on the best information available. The input levels are not necessarily an indication of the risk or liquidity associated with financial instruments at that level. For example, non-U.S. equity securities actively traded in foreign markets generally are reflected in Level 2 despite the availability of closing prices because the fund evaluates and determines whether those closing prices reflect fair value at the close of the NYSE or require adjustment, as described above. The following table summarizes the fund’s financial instruments, based on the inputs used to determine their values on April 30, 2010:
NOTE 3 - OTHER INVESTMENT TRANSACTIONS
Consistent with its investment objective, the fund engages in the following practices to manage exposure to certain risks and/or to enhance performance. The investment objective, policies, program, and risk factors of the fund are described more fully in the fund’s prospectus and Statement of Additional Information.
Emerging Markets At April 30, 2010, approximately 93% of the fund’s net assets were invested, either directly or indirectly, in securities of companies located in emerging markets, securities issued by governments of emerging market countries, and/or securities denominated in or linked to the currencies of emerging market countries. Emerging market securities are often subject to greater price volatility, less liquidity, and higher rates of inflation than U.S. securities. In addition, emerging markets may be subject to greater political, economic and social uncertainty, and differing regulatory environments that may potentially impact the fund’s ability to buy or sell certain securities or repatriate proceeds to U.S. dollars.
Participation Notes During the six months ended April 30, 2010, the fund was a party to participation notes through which it gains exposure to common stock in markets where direct investment by the fund is not possible. Participation notes provide the economic benefit of common stock ownership to the fund, while legal ownership is retained by the counterparty. Although each participation note is structured with a defined maturity date, early redemption may be possible. Risks associated with participation notes include the possible failure of a counterparty to perform in accordance with the terms of the agreement and potential delays or an inability to redeem before maturity under certain market conditions.
Other Purchases and sales of portfolio securities other than short-term securities aggregated $41,171,000 and $38,064,000, respectively, for the six months ended April 30, 2010.
NOTE 4 - FEDERAL INCOME TAXES
No provision for federal income taxes is required since the fund intends to continue to qualify as a regulated investment company under Subchapter M of the Internal Revenue Code and distribute to shareholders all of its taxable income and gains. Distributions determined in accordance with federal income tax regulations may differ in amount or character from net investment income and realized gains for financial reporting purposes. Financial reporting records are adjusted for permanent book/tax differences to reflect tax character but are not adjusted for temporary differences. The amount and character of tax-basis distributions and composition of net assets are finalized at fiscal year-end; accordingly, tax-basis balances have not been determined as of the date of this report.
The fund intends to retain realized gains to the extent of available capital loss carryforwards. As of October 31, 2009, the fund had $31,175,000 of unused capital loss carryforwards, all of which expire in fiscal 2017. Additionally, approximately $13,902,000 of the fund’s unused capital loss carryforwards are subject to certain limitations on amount and/or timing of use related to an ownership change.
At April 30, 2010, the cost of investments for federal income tax purposes was $71,831,000. Net unrealized gain aggregated $16,759,000 at period-end, of which $17,228,000 related to appreciated investments and $469,000 related to depreciated investments.
NOTE 5 - RELATED PARTY TRANSACTIONS
The fund is managed by T. Rowe Price International, Inc. (the manager), a wholly owned subsidiary of T. Rowe Price Associates, Inc. (Price Associates), which is wholly owned by T. Rowe Price Group, Inc. The investment management agreement between the fund and the manager provides for an annual investment management fee equal to 1.00% of the fund’s average daily net assets. The fee is computed daily and paid monthly.
The fund is also subject to a contractual expense limitation through February 28, 2011. During the limitation period, the manager is required to waive its management fee and reimburse the fund for any expenses, excluding interest, taxes, brokerage commissions, and extraordinary expenses, that would otherwise cause the fund’s ratio of annualized total expenses to average net assets (expense ratio) to exceed its expense limitation of 1.25% . For a period of three years after the date of any reimbursement or waiver, the fund is required to repay the manager for expenses previously reimbursed and management fees waived to the extent its net assets have grown or expenses have declined sufficiently to allow repayment without causing the fund’s expense ratio to exceed its expense limitation. Pursuant to this agreement, management fees in the amount of $65,000 were waived during the six months ended April 30, 2010. Including these amounts, management fees in the amount of $345,000 remain subject to repayment at April 30, 2010.
In addition, the fund has entered into service agreements with Price Associates and a wholly owned subsidiary of Price Associates (collectively, Price). Price Associates computes the daily share price and provides certain other administrative services to the fund. T. Rowe Price Services, Inc., provides shareholder and administrative services in its capacity as the fund’s transfer and dividend disbursing agent. For the six months ended April 30, 2010, expenses incurred pursuant to these service agreements were $86,000 for Price Associates and less than $1,000 for T. Rowe Price Services, Inc. The total amount payable at period-end pursuant to these service agreements is reflected as Due to Affiliates in the accompanying financial statements.
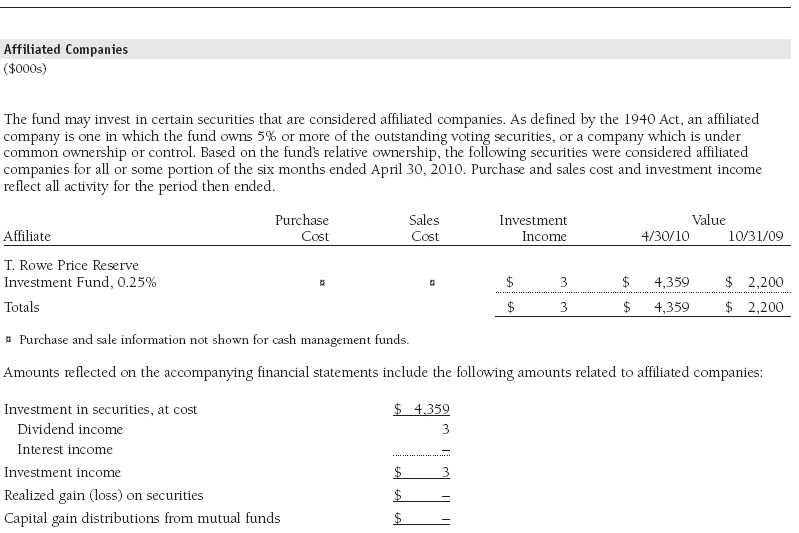
The fund may invest in the T. Rowe Price Reserve Investment Fund and the T. Rowe Price Government Reserve Investment Fund (collectively, the T. Rowe Price Reserve Investment Funds), open-end management investment companies managed by Price Associates and considered affiliates of the fund. The T. Rowe Price Reserve Investment Funds are offered as cash management options to mutual funds, trusts, and other accounts managed by Price Associates and/or its affiliates and are not available for direct purchase by members of the public. The T. Rowe Price Reserve Investment Funds pay no investment management fees.
| Information on Proxy Voting Policies, Procedures, and Records |
A description of the policies and procedures used by T. Rowe Price funds and portfolios to determine how to vote proxies relating to portfolio securities is available in each fund’s Statement of Additional Information, which you may request by calling 1-800-225-5132 or by accessing the SEC’s Web site, www.sec.gov. The description of our proxy voting policies and procedures is also available on our Web site, www.troweprice.com. To access it, click on the words “Our Company” at the top of our corporate homepage. Then, when the next page appears, click on the words “Proxy Voting Policies” on the left side of the page.
Each fund’s most recent annual proxy voting record is available on our Web site and through the SEC’s Web site. To access it through our Web site, follow the directions above, then click on the words “Proxy Voting Records” on the right side of the Proxy Voting Policies page.
| How to Obtain Quarterly Portfolio Holdings |
The fund files a complete schedule of portfolio holdings with the Securities and Exchange Commission for the first and third quarters of each fiscal year on Form N-Q. The fund’s Form N-Q is available electronically on the SEC’s Web site (www.sec.gov); hard copies may be reviewed and copied at the SEC’s Public Reference Room, 450 Fifth St. N.W., Washington, DC 20549. For more information on the Public Reference Room, call 1-800-SEC-0330.
| Approval of Investment Management Agreement |
On March 9, 2010, the fund’s Board of Directors (Board) unanimously approved the continuation of the investment advisory contract (Contract) between the fund and its investment manager, T. Rowe Price International, Inc. (Adviser). The Board considered a variety of factors in connection with its review of the Contract, also taking into account information provided by the Adviser during the course of the year, as discussed below:
Services Provided by the Adviser
The Board considered the nature, quality, and extent of the services provided to the fund by the Adviser. These services included, but were not limited to, management of the fund’s portfolio and a variety of related activities, as well as financial and administrative services, reporting, and communications. The Board also reviewed the background and experience of the Adviser’s senior management team and investment personnel involved in the management of the fund. The Board concluded that it was satisfied with the nature, quality, and extent of the services provided by the Adviser.
Investment Performance of the Fund
The Board reviewed the fund’s average annual total returns over the one-year and since-inception periods, as well as the fund’s year-by-year returns, and compared these returns with a wide variety of previously agreed upon comparable performance measures and market data, including those supplied by Lipper and Morningstar, which are independent providers of mutual fund data. On the basis of this evaluation and the Board’s ongoing review of investment results, and factoring in the severity of the market turmoil during 2008 and 2009, the Board concluded that the fund’s performance was satisfactory.
Costs, Benefits, Profits, and Economies of Scale
The Board reviewed detailed information regarding the revenues received by the Adviser under the Contract and other benefits that the Adviser (and its affiliates) may have realized from its relationship with the fund, including research received under “soft dollar” agreements and commission-sharing arrangements with broker-dealers. The Board considered that the Adviser may receive some benefit from its soft-dollar arrangements pursuant to which it receives research from broker-dealers that execute the applicable fund’s portfolio transactions. The Board did not review information regarding profits realized from managing the fund in particular because the fund had not achieved sufficient scale in terms of portfolio asset size to produce meaningful profit margin percentages. The Board concluded that the Adviser’s profits from advising T. Rowe Price mutual funds were reasonable in light of the services provided to the fund. The Board also considered whether the fund or other funds benefit under the fee levels set forth in the Contract from any economies of scale realized by the Adviser. The Board concluded that the advisory fee structure for the fund continued to provide for a reasonable sharing of benefits from any economies of scale with the fund’s investors.
Fees
The Board reviewed the fund’s management fee rate, operating expenses, and total expense ratio and compared them with fees and expenses of other comparable funds based on information and data supplied by Lipper. The information provided to the Board indicated that the fund’s management fee rate (including any reductions of the management fee rate as a result of any applicable fee waivers or expenses paid by the Adviser) and the fund’s total expense ratio were at or below the median for comparable funds. The Board also reviewed the fee schedules for institutional accounts of the Adviser and its affiliates with smaller mandates. Management informed the Board that the Adviser’s responsibilities for institutional accounts are more limited than its responsibilities for the fund and other T. Rowe Price mutual funds that it or its affiliates advise and that the Adviser performs significant additional services and assumes greater risk for the fund and other T. Rowe Price mutual funds that it advises than it does for institutional accounts. On the basis of the information provided, the Board concluded that the fees paid by the fund under the Contract were reasonable.
Approval of the Contract
As noted, the Board approved the continuation of the Contract. No single factor was considered in isolation or to be determinative to the decision. Rather, the Board was assisted by the advice of independent legal counsel and concluded, in light of a weighting and balancing of all factors considered, that it was in the best interests of the fund to approve the continuation of the Contract, including the fees to be charged for services thereunder.
Item 2. Code of Ethics.
A code of ethics, as defined in Item 2 of Form N-CSR, applicable to its principal executive officer, principal financial officer, principal accounting officer or controller, or persons performing similar functions is filed as an exhibit to the registrant’s annual Form N-CSR. No substantive amendments were approved or waivers were granted to this code of ethics during the registrant’s most recent fiscal half-year.
Item 3. Audit Committee Financial Expert.
Disclosure required in registrant’s annual Form N-CSR.
Item 4. Principal Accountant Fees and Services.
Disclosure required in registrant’s annual Form N-CSR.
Item 5. Audit Committee of Listed Registrants.
Not applicable.
Item 6. Investments.
(a) Not applicable. The complete schedule of investments is included in Item 1 of this Form N-CSR.
(b) Not applicable.
Item 7. Disclosure of Proxy Voting Policies and Procedures for Closed-End Management Investment Companies.
Not applicable.
Item 8. Portfolio Managers of Closed-End Management Investment Companies.
Not applicable.
Item 9. Purchases of Equity Securities by Closed-End Management Investment Company and Affiliated Purchasers.
Not applicable.
Item 10. Submission of Matters to a Vote of Security Holders.
Not applicable.
Item 11. Controls and Procedures.
(a) The registrant’s principal executive officer and principal financial officer have evaluated the registrant’s disclosure controls and procedures within 90 days of this filing and have concluded that the registrant’s disclosure controls and procedures were effective, as of that date, in ensuring that information required to be disclosed by the registrant in this Form N-CSR was recorded, processed, summarized, and reported timely.
(b) The registrant’s principal executive officer and principal financial officer are aware of no change in the registrant’s internal control over financial reporting that occurred during the registrant’s second fiscal quarter covered by this report that has materially affected, or is reasonably likely to materially affect, the registrant’s internal control over financial reporting.
Item 12. Exhibits.
(a)(1) The registrant’s code of ethics pursuant to Item 2 of Form N-CSR is filed with the registrant’s annual Form N-CSR.
(2) Separate certifications by the registrant's principal executive officer and principal financial officer, pursuant to Section 302 of the Sarbanes-Oxley Act of 2002 and required by Rule 30a-2(a) under the Investment Company Act of 1940, are attached.
(3) Written solicitation to repurchase securities issued by closed-end companies: not applicable.
(b) A certification by the registrant's principal executive officer and principal financial officer, pursuant to Section 906 of the Sarbanes-Oxley Act of 2002 and required by Rule 30a-2(b) under the Investment Company Act of 1940, is attached.
| | |
SIGNATURES |
| |
| | Pursuant to the requirements of the Securities Exchange Act of 1934 and the Investment |
| Company Act of 1940, the registrant has duly caused this report to be signed on its behalf by the |
| undersigned, thereunto duly authorized. |
| |
| T. Rowe Price Institutional International Funds, Inc. |
| |
| |
| |
| By | /s/ Edward C. Bernard |
| | Edward C. Bernard |
| | Principal Executive Officer |
| |
| Date | June 17, 2010 |
| |
| |
| |
| | Pursuant to the requirements of the Securities Exchange Act of 1934 and the Investment |
| Company Act of 1940, this report has been signed below by the following persons on behalf of |
| the registrant and in the capacities and on the dates indicated. |
| |
| |
| By | /s/ Edward C. Bernard |
| | Edward C. Bernard |
| | Principal Executive Officer |
| |
| Date | June 17, 2010 |
| |
| |
| |
| By | /s/ Gregory K. Hinkle |
| | Gregory K. Hinkle |
| | Principal Financial Officer |
| |
| Date | June 17, 2010 |