| UNITED STATES |
| SECURITIES AND EXCHANGE COMMISSION |
| Washington, D.C. 20549 |
| |
FORM N-CSR |
| |
CERTIFIED SHAREHOLDER REPORT OF REGISTERED |
MANAGEMENT INVESTMENT COMPANIES |
| |
| |
| |
| Investment Company Act File Number: 811-5833 |
|
| |
| T. Rowe Price Institutional International Funds, Inc. |
|
| (Exact name of registrant as specified in charter) |
| |
| 100 East Pratt Street, Baltimore, MD 21202 |
|
| (Address of principal executive offices) |
| |
| David Oestreicher |
| 100 East Pratt Street, Baltimore, MD 21202 |
|
| (Name and address of agent for service) |
| |
| |
| Registrant’s telephone number, including area code: (410) 345-2000 |
| |
| |
| Date of fiscal year end: October 31 |
| |
| |
| Date of reporting period: April 30, 2010 |
Item 1: Report to Shareholders| Institutional Global Large-Cap Equity Fund | April 30, 2010 |
• Global large-cap equities continued to move higher, generating solid returns in the last six months.
• Strong returns from recently added stocks and some established holdings boosted fund performance, although holdings in the materials sector were less helpful.
• We have increased investments in emerging markets slightly, as improved growth rates should propel stocks higher, and we have reduced exposure in Europe due to the Greek debt crisis.
• We continue to seek out high-quality companies with growing franchises, strong cash flow yields, solid balance sheets, and the potential to prosper in a better economic environment.
The views and opinions in this report were current as of April 30, 2010. They are not guarantees of performance or investment results and should not be taken as investment advice. Investment decisions reflect a variety of factors, and the managers reserve the right to change their views about individual stocks, sectors, and the markets at any time. As a result, the views expressed should not be relied upon as a forecast of the fund’s future investment intent. The report is certified under the Sarbanes-Oxley Act, which requires mutual funds and other public companies to affirm that, to the best of their knowledge, the information in their financial reports is fairly and accurately stated in all material respects.
Manager’s Letter
T. Rowe Price Institutional Global Large-Cap Equity Fund
Dear Investor
Global stock markets delivered healthy gains during the past six months, with many reaching their highest levels since the onset of the financial crisis in 2008. Signs of economic improvements in the U.S. pushed markets higher, while emerging markets continued to gather strength, though at a slower pace than earlier in the recovery. European stocks ended the period flat as investors abandoned Greece and other countries due to the deepening debt crisis.

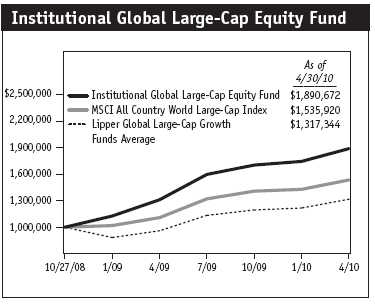
Your fund returned 10.93% during the six-month period ended April 30, 2010, outperforming the MSCI All Country World Large-Cap Index and the Lipper Global Large-Cap Growth Funds Average. Our holdings in the consumer discretionary and health care sectors were largely responsible for the outperformance versus the index and the Lipper average.
Market Review
U.S. stocks performed well compared with other regions as optimism increased about the country’s strengthening economic recovery, widely seen as being more advanced than that of Europe or Japan. The Federal Reserve increased the discount rate in February (the rate at which commercial banks borrow from the central bank), an indication of rising confidence in the economy. Returns across Europe were generally lower, dragged down by the Greek financial crisis and the threat of further instability in the euro zone, with Portugal, Ireland, Spain, and others also shouldering unwieldy debt loads. The euro fell sharply against the dollar, broadly negating gains for U.S. dollar-based investors. Results in Japan were roughly between those in the U.S. and Europe, aided by hopes that the global recovery would benefit earnings for Japanese exporters, as has been the case in previous cycles.
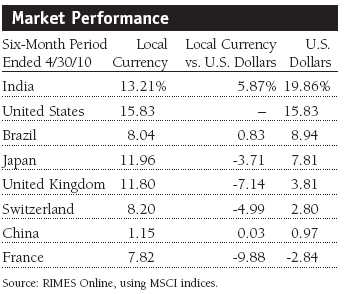
While interest rates in the developed world were held at historic lows to stimulate economic growth, many emerging countries lifted short-term rates to counteract inflationary pressures arising from overheating economies. Overall returns in emerging markets kept pace in U.S. dollar terms, but the impact of monetary tightening was most apparent in China, where equities saw little change during the period and significantly lagged other global markets. By contrast, India posted solid gains despite its adoption of similar policies. India’s robust economic growth attracted foreign investment and, in turn, helped spur the rupee to its highest level since the start of the financial crisis. Brazil posted gains but lagged other Latin American countries due to concerns about inflation.
Portfolio Review and Strategy
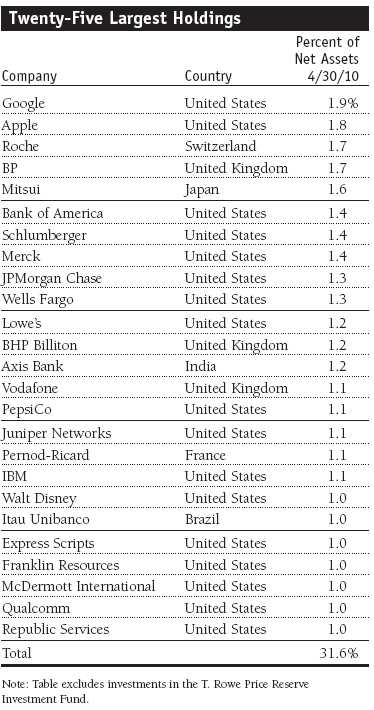
Fund performance was helped by strong returns from several recently added stocks, along with contributions from established holdings. The largest single contributor was DP World, the global port owner and operator, which we sold for a solid gain and later bought again on weakness. This Dubai-listed company’s business proved attractive as investors sensed a recovery in world trade, and we took profits on a significant portion of our position as the stock steadily appreciated. Late last year, DP World’s parent company suspended debt repayments, which resulted in a sharp fall in the stock. But our research reaffirmed the company’s strong long-term position, and we took advantage of the decline to buy back shares. (Please refer to the portfolio of investments for a detailed list of holdings and the amount each represents in the portfolio.)
Consumer discretionary companies provided strong returns, led by the hotel operators MGM Mirage and Marriott International. MGM, which operates hotels in Las Vegas and elsewhere, benefited from a recovery in revenues. Marriott, the diversified hotel chain, posted strong results, which underlined the strength of its business model. In addition to benefiting from the rebound in corporate travel, the company said that it was gaining market share from competitors and improved pricing power. The home improvement retailer Lowe’s also benefited from the uptick in consumer activity, posting its best quarterly performance in three years. Signs of improvement in the housing market and the resumption of a stock buyback program increased investor confidence in the company. During the period, we purchased shares of Japanese auto manufacturer Toyota as its stock price dipped due to the recent negative news surrounding recalls. Toyota has a leading market position, with a strong lineup in the luxury and hybrid segments. Despite its current problems, over time the company should continue to benefit from its strong market position and emerge relatively unaffected.
Our health care companies also had a positive impact, notably the managed care provider WellPoint. During the period, the company reported solid earnings, driven by better-than-expected cost controls. The results boosted the stock’s price, which had been hurt by concerns over pending U.S. health care reform legislation. While eventual passage of the bill weakened health care stocks, the impact was far less severe than had been previously feared.

In the financials sector, we maintained a broadly neutral allocation relative to the benchmark. We took losses in National Bank of Greece. The bank is a well-funded institution with a solid deposit base that did not require outside funding in order to maintain its liquidity during the crisis. But the debt storm and negative adjustments to Greece’s gross domestic product created an untenable situation, and we eliminated our position. By contrast, several of our financial stocks reflect strength in emerging markets. Among Latin American financials, we initiated a position in Banco Santander, one of the leading Brazilian banks, and added to Itau Unibanco. These banks should be rewarded by the robust loan growth in emerging markets as economic activity and domestic consumption continue to rise.
Two commercial lenders that added value included the U.S. regional bank Fifth Third Bancorp and Axis Bank in India. Fifth Third’s stock had sold off due to concerns about its exposure to real estate but rebounded sharply after reporting fourth-quarter losses that were narrower than expected. With credit markets improving, the bank appears poised for profitability. Axis, which focuses primarily on corporate customers, benefited from the increase in loan demand from companies engaged in infrastructure spending.
We also hold JPMorgan Chase, Wells Fargo, and Bank of America (BOA). BOA’s powerful franchises should help it emerge as a competitive winner. Recent earnings results among these institutions clearly demonstrate accelerating capital generation. We believe earnings should return to a more normal trajectory as the credit cycle unwinds. Nevertheless, we remain mindful of the possible effects of a likely increase in industry regulation, particularly in the U.S.
Holdings in the materials sector hurt results. Monsanto, the world’s largest seed technology company, declined after reducing its 2010 sales targets for genetically modified corn and soybean sales due to higher pricing and seasonal surpluses. While this is likely to cause a dip in earnings, we have maintained our position as the company appears well positioned to profit over the long term from growth in global demand for agricultural commodities. The company enjoys a full product pipeline and preeminent market position.
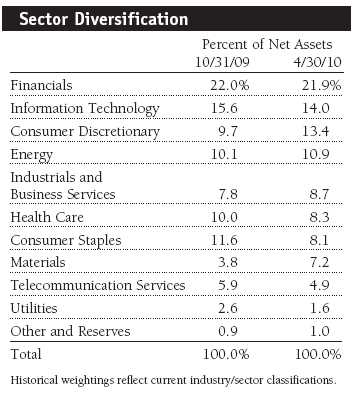
The portfolio’s positioning at the sector and regional levels reflects our preference for taking limited risk by focusing on fewer high-quality companies that we believe can generate good returns. We increased our holdings in consumer discretionary, reflecting our view on the strength of emerging markets. We also remain overweight in information technology, as we see attractive companies with sound balance sheets and good prospects as business spending accelerates.
We have maintained our overweight to the U.S. market and increased investments in emerging markets slightly, as solid growth rates should propel stocks higher. We have reduced exposure in Europe because of the ongoing problems in European Union countries over their debt challenges. However, we are prepared to invest in high-quality companies that are hurt by the overall decline in European markets. We are underweight in Japan, as deflationary pressures continue to constrain the country’s growth potential.
Outlook
We believe that global equity markets present good opportunities to add value over the medium term, although our view is tempered by the many challenges that the global economy still faces. Chief among these are the constraints on many countries in the developed world as they work through the excesses of the previous economic cycle and the indebtedness of governments and consumers that are likely to prove a drag on growth for some time. However, the dynamic secular growth drivers in the emerging world, such as industrialization, urbanization, and rising disposable incomes, should act as an effective counterweight, generating expanding markets and robust margins that will continue to spur many industries in developed and emerging markets. Equities are still reasonably valued compared with historical valuations and relative to many asset classes.
We continue to seek out high-quality companies with growing franchises, strong cash flow yields, and solid balance sheets and strive to identify businesses with the potential to prosper in an improved economic environment. In particular, players that entered and exited the global recession as industry leaders are attractive as they take advantage of their improved competitive positions to boost earnings. We aim to identify the best growth opportunities and their potential to deliver strong returns across the globe, considering that the dispersion of stock fundamentals remains as wide as ever.
As always, thank you for investing with T. Rowe Price.
Respectfully submitted,

R. Scott Berg
Chairman of the fund’s Investment Advisory Committee
May 14, 2010
The committee chairman has day-to-day responsibility for managing the portfolio and works with committee members in developing and executing the fund’s investment program.
| Risks of International Investing |
Funds that invest overseas generally carry more risk than funds that invest strictly in U.S. assets. Funds investing in a single country or in a limited geographic region tend to be riskier than more diversified funds. Risks can result from varying stages of economic and political development; differing regulatory environments, trading days, and accounting standards; and higher transaction costs of non-U.S. markets. Non-U.S. investments are also subject to currency risk, or a decline in the value of a foreign currency versus the U.S. dollar, which reduces the dollar value of securities denominated in that currency.
Lipper averages: The averages of available mutual fund performance returns for specified periods in defined categories as tracked by Lipper Inc.
MSCI All Country World Large-Cap Index: A capitalization-weighted index of stocks from developed and emerging markets worldwide.
Portfolio Highlights
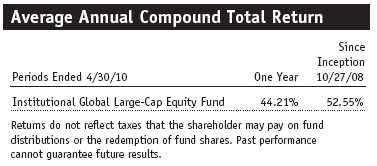
Performance and Expenses
T. Rowe Price Institutional Global Large-Cap Equity Fund
This chart shows the value of a hypothetical $1 million investment in the fund over the past 10 fiscal year periods or since inception (for funds lacking 10-year records). The result is compared with benchmarks, which may include a broad-based market index and a peer group average or index. Market indexes do not include expenses, which are deducted from fund returns as well as mutual fund averages and indexes.
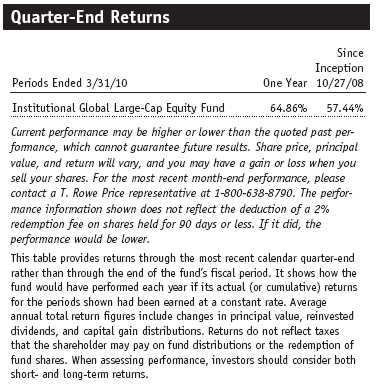
This table shows how the fund would have performed each year if its actual (or cumulative) returns for the periods shown had been earned at a constant rate.
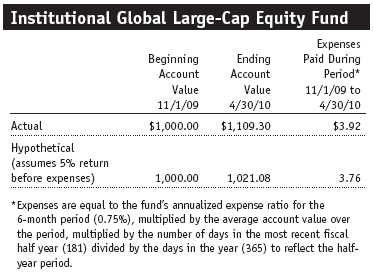
Fund Expense Example
As a mutual fund shareholder, you may incur two types of costs: (1) transaction costs, such as redemption fees or sales loads, and (2) ongoing costs, including management fees, distribution and service (12b-1) fees, and other fund expenses. The following example is intended to help you understand your ongoing costs (in dollars) of investing in the fund and to compare these costs with the ongoing costs of investing in other mutual funds. The example is based on an investment of $1,000 invested at the beginning of the most recent six-month period and held for the entire period.
Actual Expenses
The first line of the following table (“Actual”) provides information about actual account values and actual expenses. You may use the information in this line, together with your account balance, to estimate the expenses that you paid over the period. Simply divide your account value by $1,000 (for example, an $8,600 account value divided by $1,000 = 8.6), then multiply the result by the number in the first line under the heading “Expenses Paid During Period” to estimate the expenses you paid on your account during this period.
Hypothetical Example for Comparison Purposes
The information on the second line of the table (“Hypothetical”) is based on hypothetical account values and expenses derived from the fund’s actual expense ratio and an assumed 5% per year rate of return before expenses (not the fund’s actual return). You may compare the ongoing costs of investing in the fund with other funds by contrasting this 5% hypothetical example and the 5% hypothetical examples that appear in the shareholder reports of the other funds. The hypothetical account values and expenses may not be used to estimate the actual ending account balance or expenses you paid for the period.
You should also be aware that the expenses shown in the table highlight only your ongoing costs and do not reflect any transaction costs, such as redemption fees or sales loads. Therefore, the second line of the table is useful in comparing ongoing costs only and will not help you determine the relative total costs of owning different funds. To the extent a fund charges transaction costs, however, the total cost of owning that fund is higher.
Financial Highlights
T. Rowe Price Institutional Global Large-Cap Equity Fund
(Unaudited)
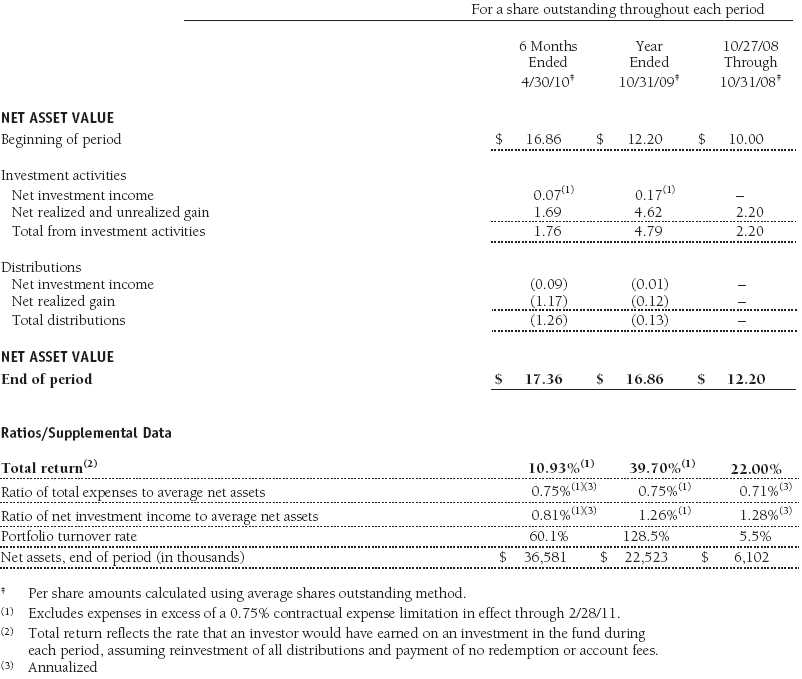
The accompanying notes are an integral part of these financial statements.
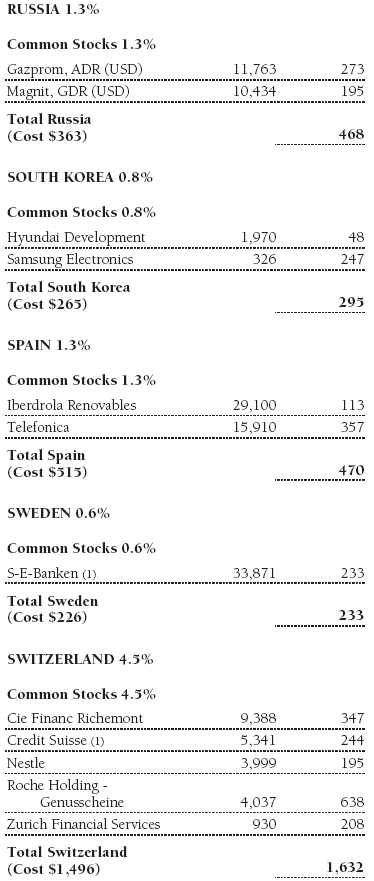
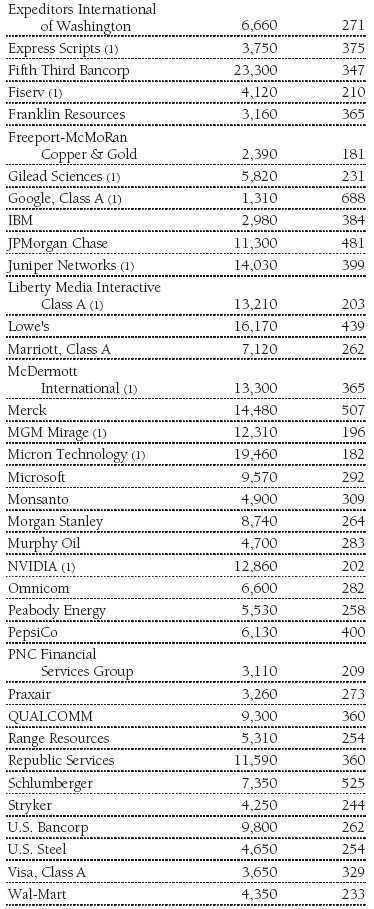
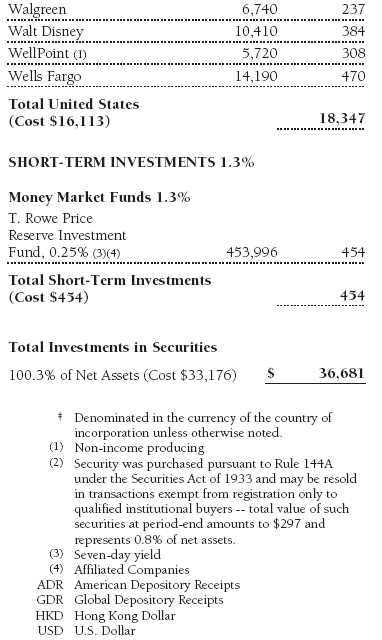
Portfolio of Investments‡
T. Rowe Price Institutional Global Large-Cap Equity Fund
April 30, 2010 (Unaudited)
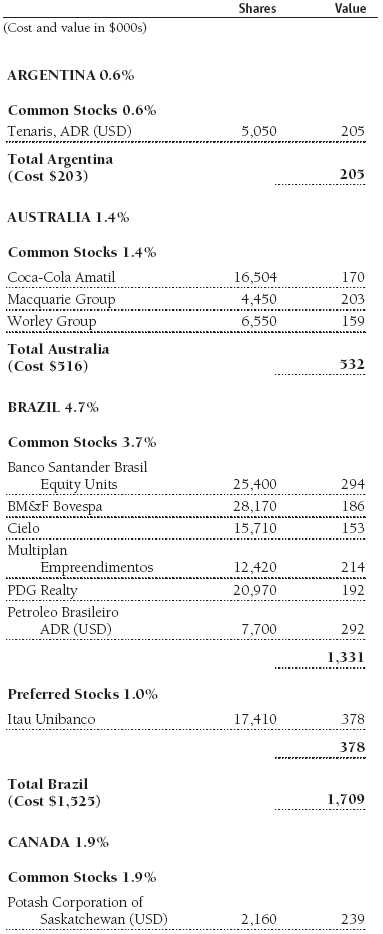
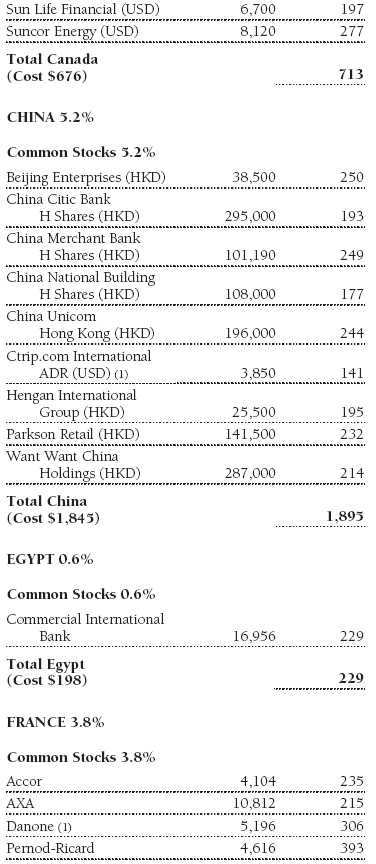
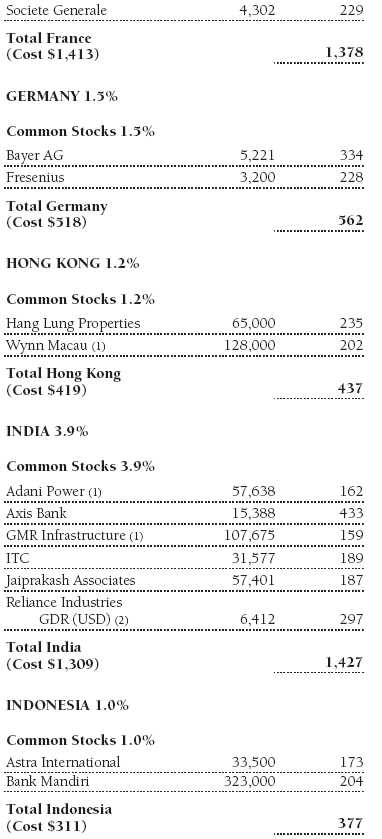


The accompanying notes are an integral part of these financial statements.
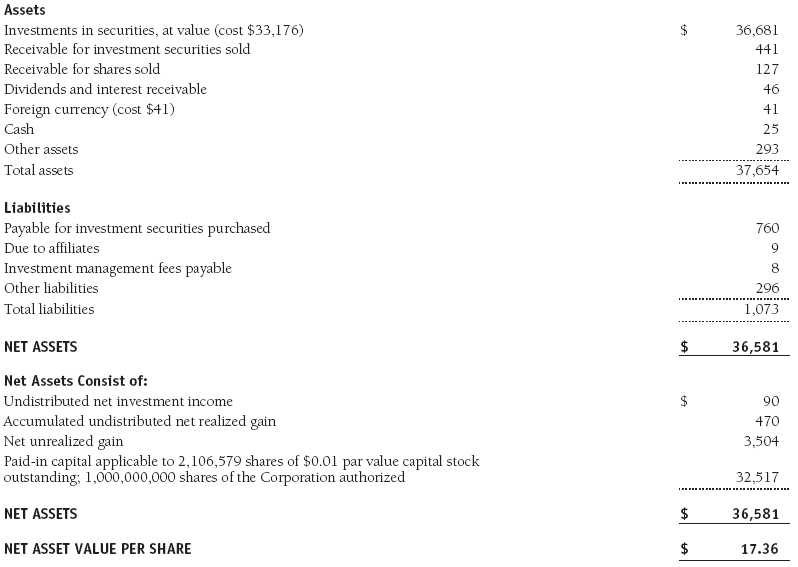
Statement of Assets and Liabilities
T. Rowe Price Institutional Global Large-Cap Equity Fund
April 30, 2010 (Unaudited)
($000s, except shares and per share amounts)
The accompanying notes are an integral part of these financial statements.
Statement of Operations
T. Rowe Price Institutional Global Large-Cap Equity Fund
(Unaudited)
($000s)
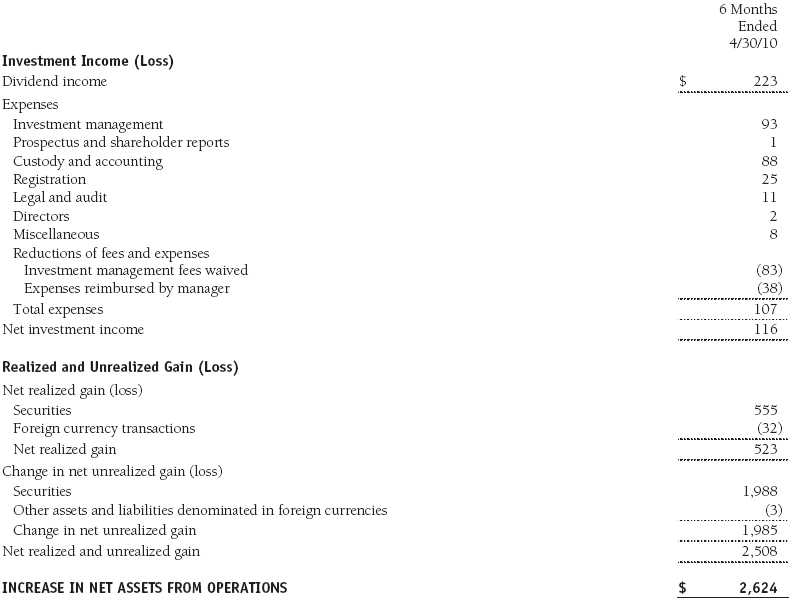
The accompanying notes are an integral part of these financial statements.
Statement of Changes in Net Assets
T. Rowe Price Institutional Global Large-Cap Equity Fund
(Unaudited)
($000s)
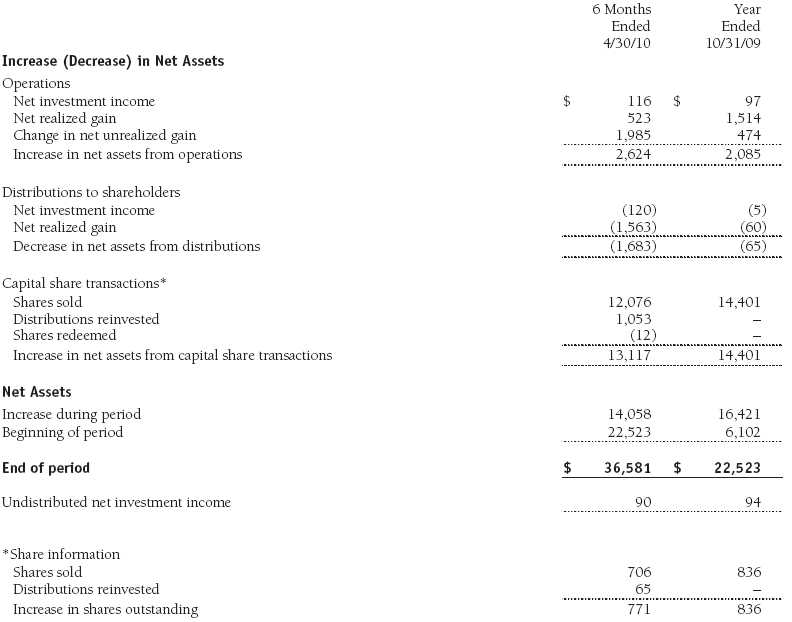
The accompanying notes are an integral part of these financial statements.
Notes to Financial Statements
T. Rowe Price Institutional Global Large-Cap Equity Fund
April 30, 2010 (Unaudited)
T. Rowe Price Institutional International Funds, Inc. (the corporation), is registered under the Investment Company Act of 1940 (the 1940 Act). The Institutional Global Large-Cap Equity Fund (the fund), a diversified, open-end management investment company, is one portfolio established by the corporation. The fund commenced operations on October 27, 2008. The fund seeks long-term growth of capital through investments primarily in the common stocks of large-cap companies throughout the world, including the U.S.
NOTE 1 - SIGNIFICANT ACCOUNTING POLICIES
Basis of Preparation The accompanying financial statements were prepared in accordance with accounting principles generally accepted in the United States of America (GAAP), which require the use of estimates made by fund management. Fund management believes that estimates and security valuations are appropriate; however, actual results may differ from those estimates, and the security valuations reflected in the accompanying financial statements may differ from the value ultimately realized upon sale of the securities.
Investment Transactions, Investment Income, and Distributions Income and expenses are recorded on the accrual basis. Dividends received from mutual fund investments are reflected as dividend income; capital gain distributions are reflected as realized gain/loss. Dividend income and capital gain distributions are recorded on the ex-dividend date. Income tax-related interest and penalties, if incurred, would be recorded as income tax expense. Investment transactions are accounted for on the trade date. Realized gains and losses are reported on the identified cost basis. Distributions to shareholders are recorded on the ex-dividend date. Income distributions are declared and paid annually. Capital gain distributions, if any, are generally declared and paid by the fund, annually.
Currency Translation Assets, including investments, and liabilities denominated in foreign currencies are translated into U.S. dollar values each day at the prevailing exchange rate, using the mean of the bid and asked prices of such currencies against U.S. dollars as quoted by a major bank. Purchases and sales of securities, income, and expenses are translated into U.S. dollars at the prevailing exchange rate on the date of the transaction. The effect of changes in foreign currency exchange rates on realized and unrealized security gains and losses is reflected as a component of security gains and losses.
Redemption Fees A 2% fee is assessed on redemptions of fund shares held for 90 days or less to deter short-term trading and to protect the interests of long-term shareholders. Redemption fees are withheld from proceeds that shareholders receive from the sale or exchange of fund shares. The fees are paid to the fund and are recorded as an increase to paid-in capital. The fees may cause the redemption price per share to differ from the net asset value per share.
New Accounting Pronouncement In January 2010, new accounting guidance was issued that requires enhanced disclosures about fair value measurements in the financial statements; it is effective for fiscal years and interim periods beginning after December 15, 2009. Management expects that adoption of this guidance will have no impact on the fund’s net assets or results of operations.
NOTE 2 - VALUATION
The fund’s investments are reported at fair value as defined under GAAP. The fund determines the values of its assets and liabilities and computes its net asset value per share at the close of the New York Stock Exchange (NYSE), normally 4 p.m. ET, each day that the NYSE is open for business.
Valuation Methods Equity securities listed or regularly traded on a securities exchange or in the over-the-counter (OTC) market are valued at the last quoted sale price or, for certain markets, the official closing price at the time the valuations are made, except for OTC Bulletin Board securities, which are valued at the mean of the latest bid and asked prices. A security that is listed or traded on more than one exchange is valued at the quotation on the exchange determined to be the primary market for such security. Listed securities not traded on a particular day are valued at the mean of the latest bid and asked prices for domestic securities and the last quoted sale price for international securities.
Investments in mutual funds are valued at the mutual fund’s closing net asset value per share on the day of valuation.
Other investments, including restricted securities, and those financial instruments for which the above valuation procedures are inappropriate or are deemed not to reflect fair value are stated at fair value as determined in good faith by the T. Rowe Price Valuation Committee, established by the fund’s Board of Directors.
For valuation purposes, the last quoted prices of non-U.S. equity securities may be adjusted under the circumstances described below. If the fund determines that developments between the close of a foreign market and the close of the NYSE will, in its judgment, materially affect the value of some or all of its portfolio securities, the fund will adjust the previous closing prices to reflect what it believes to be the fair value of the securities as of the close of the NYSE. In deciding whether it is necessary to adjust closing prices to reflect fair value, the fund reviews a variety of factors, including developments in foreign markets, the performance of U.S. securities markets, and the performance of instruments trading in U.S. markets that represent foreign securities and baskets of foreign securities. A fund may also fair value securities in other situations, such as when a particular foreign market is closed but the fund is open. The fund uses outside pricing services to provide it with closing prices and information to evaluate and/or adjust those prices. The fund cannot predict how often it will use closing prices and how often it will determine it necessary to adjust those prices to reflect fair value. As a means of evaluating its security valuation process, the fund routinely compares closing prices, the next day’s opening prices in the same markets, and adjusted prices.
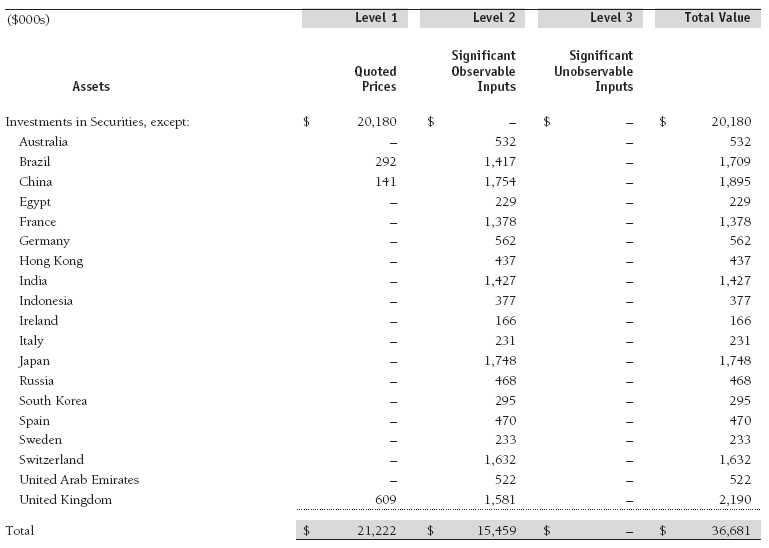
Valuation Inputs Various inputs are used to determine the value of the fund’s financial instruments. These inputs are summarized in the three broad levels listed below:
Level 1 – quoted prices in active markets for identical securities
Level 2 – observable inputs other than Level 1 quoted prices (including, but not limited to, quoted prices for similar securities, interest rates, prepayment speeds, and credit risk)
Level 3 – unobservable inputs
Observable inputs are those based on market data obtained from sources independent of the fund, and unobservable inputs reflect the fund’s own assumptions based on the best information available. The input levels are not necessarily an indication of the risk or liquidity associated with financial instruments at that level. For example, non-U.S. equity securities actively traded in foreign markets generally are reflected in Level 2 despite the availability of closing prices because the fund evaluates and determines whether those closing prices reflect fair value at the close of the NYSE or require adjustment, as described above. The following table summarizes the fund’s financial instruments, based on the inputs used to determine their values on April 30, 2010:
NOTE 3 - OTHER INVESTMENT TRANSACTIONS
Consistent with its investment objective, the fund engages in the following practices to manage exposure to certain risks and/or to enhance performance. The investment objective, policies, program, and risk factors of the fund are described more fully in the fund’s prospectus and Statement of Additional Information.
Emerging Markets At April 30, 2010, approximately 21% of the fund’s net assets were invested, either directly or indirectly, in securities of companies located in emerging markets, securities issued by governments of emerging market countries, and/or securities denominated in or linked to the currencies of emerging market countries. Emerging market securities are often subject to greater price volatility, less liquidity, and higher rates of inflation than U.S. securities. In addition, emerging markets may be subject to greater political, economic and social uncertainty, and differing regulatory environments that may potentially impact the fund’s ability to buy or sell certain securities or repatriate proceeds to U.S. dollars.
Restricted Securities The fund may invest in securities that are subject to legal or contractual restrictions on resale. Prompt sale of such securities at an acceptable price may be difficult and may involve substantial delays and additional costs.
Other Purchases and sales of portfolio securities other than short-term securities aggregated $28,440,000 and $17,075,000, respectively, for the six months ended April 30, 2010.
NOTE 4 - FEDERAL INCOME TAXES
No provision for federal income taxes is required since the fund intends to continue to qualify as a regulated investment company under Subchapter M of the Internal Revenue Code and distribute to shareholders all of its taxable income and gains. Distributions determined in accordance with federal income tax regulations may differ in amount or character from net investment income and realized gains for financial reporting purposes. Financial reporting records are adjusted for permanent book/tax differences to reflect tax character but are not adjusted for temporary differences. The amount and character of tax-basis distributions and composition of net assets are finalized at fiscal year-end; accordingly, tax-basis balances have not been determined as of the date of this report.
At April 30, 2010, the cost of investments for federal income tax purposes was $33,176,000. Net unrealized gain aggregated $3,504,000 at period-end, of which $3,983,000 related to appreciated investments and $479,000 related to depreciated investments.
NOTE 5 - RELATED PARTY TRANSACTIONS
The fund is managed by T. Rowe Price International, Inc. (the manager), a wholly owned subsidiary of T. Rowe Price Associates, Inc. (Price Associates), which is wholly owned by T. Rowe Price Group, Inc. The investment management agreement between the fund and the manager provides for an annual investment management fee equal to 0.65% of the fund’s average daily net assets. The fee is computed daily and paid monthly.
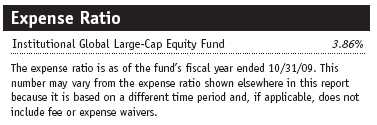
The fund is also subject to a contractual expense limitation through February 28, 2011. During the limitation period, the manager is required to waive its management fee and reimburse the fund for any expenses, excluding interest, taxes, brokerage commissions, and extraordinary expenses, that would otherwise cause the fund’s ratio of annualized total expenses to average net assets (expense ratio) to exceed its expense limitation of 0.75%. For a period of three years after the date of any reimbursement or waiver, the fund is required to repay the manager for expenses previously reimbursed and management fees waived to the extent its net assets have grown or expenses have declined sufficiently to allow repayment without causing the fund’s expense ratio to exceed its expense limitation. Pursuant to this agreement, management fees in the amount of $83,000 were waived and expenses in the amount of $38,000 were reimbursed by the manager during the six months ended April 30, 2010. Including these amounts, management fees waived and expenses previously reimbursed by the manager in the amount of $364,000 remain subject to repayment at April 30, 2010.
In addition, the fund has entered into service agreements with Price Associates and a wholly owned subsidiary of Price Associates (collectively, Price). Price Associates computes the daily share price and provides certain other administrative services to the fund. T. Rowe Price Services, Inc., provides shareholder and administrative services in its capacity as the fund’s transfer and dividend disbursing agent. For the six months ended April 30, 2010, expenses incurred pursuant to these service agreements were $53,000 for Price Associates and less than $1,000 for T. Rowe Price Services, Inc. The total amount payable at period-end pursuant to these service agreements is reflected as Due to Affiliates in the accompanying financial statements.
The fund may invest in the T. Rowe Price Reserve Investment Fund and the T. Rowe Price Government Reserve Investment Fund (collectively, the T. Rowe Price Reserve Investment Funds), open-end management investment companies managed by Price Associates and considered affiliates of the fund. The T. Rowe Price Reserve Investment Funds are offered as cash management options to mutual funds, trusts, and other accounts managed by Price Associates and/or its affiliates and are not available for direct purchase by members of the public. The T. Rowe Price Reserve Investment Funds pay no investment management fees.
As of April 30, 2010, T. Rowe Price Group, Inc., and/or its wholly owned subsidiaries owned 500,000 shares of the fund, representing 24% of the fund’s net assets.
| Information on Proxy Voting Policies, Procedures, and Records |
A description of the policies and procedures used by T. Rowe Price funds and portfolios to determine how to vote proxies relating to portfolio securities is available in each fund’s Statement of Additional Information, which you may request by calling 1-800-225-5132 or by accessing the SEC’s Web site, www.sec.gov. The description of our proxy voting policies and procedures is also available on our Web site, www.troweprice.com. To access it, click on the words “Our Company” at the top of our corporate homepage. Then, when the next page appears, click on the words “Proxy Voting Policies” on the left side of the page.
Each fund’s most recent annual proxy voting record is available on our Web site and through the SEC’s Web site. To access it through our Web site, follow the directions above, then click on the words “Proxy Voting Records” on the right side of the Proxy Voting Policies page.
| How to Obtain Quarterly Portfolio Holdings |
The fund files a complete schedule of portfolio holdings with the Securities and Exchange Commission for the first and third quarters of each fiscal year on Form N-Q. The fund’s Form N-Q is available electronically on the SEC’s Web site (www.sec.gov); hard copies may be reviewed and copied at the SEC’s Public Reference Room, 450 Fifth St. N.W., Washington, DC 20549. For more information on the Public Reference Room, call 1-800-SEC-0330.
| Approval of Investment Management Agreement |
On March 9, 2010, the fund’s Board of Directors (Board) unanimously approved the continuation of the investment advisory contract (Contract) between the fund and its investment manager, T. Rowe Price International, Inc. (Adviser). The Board considered a variety of factors in connection with its review of the Contract, also taking into account information provided by the Adviser during the course of the year, as discussed below:
Services Provided by the Adviser
The Board considered the nature, quality, and extent of the services provided to the fund by the Adviser. These services included, but were not limited to, management of the fund’s portfolio and a variety of related activities, as well as financial and administrative services, reporting, and communications. The Board also reviewed the background and experience of the Adviser’s senior management team and investment personnel involved in the management of the fund. The Board concluded that it was satisfied with the nature, quality, and extent of the services provided by the Adviser.
Investment Performance of the Fund
The Board reviewed the fund’s average annual total returns over the one-year and since-inception periods and compared these returns with a wide variety of previously agreed upon comparable performance measures and market data, including those supplied by Lipper and Morningstar, which are independent providers of mutual fund data. On the basis of this evaluation and the Board’s ongoing review of investment results, and factoring in the severity of the market turmoil during 2008 and 2009, the Board concluded that the fund’s performance was satisfactory.
Costs, Benefits, Profits, and Economies of Scale
The Board reviewed detailed information regarding the revenues received by the Adviser under the Contract and other benefits that the Adviser (and its affiliates) may have realized from its relationship with the fund, including research received under “soft dollar” agreements and commission-sharing arrangements with broker-dealers. The Board considered that the Adviser may receive some benefit from its soft-dollar arrangements pursuant to which it receives research from broker-dealers that execute the applicable fund’s portfolio transactions. The Board did not review information regarding profits realized from managing the fund in particular because the fund had not achieved sufficient scale in terms of portfolio asset size to produce meaningful profit margin percentages. The Board concluded that the Adviser’s profits from advising T. Rowe Price mutual funds were reasonable in light of the services provided to the fund. The Board also considered whether the fund or other funds benefit under the fee levels set forth in the Contract from any economies of scale realized by the Adviser. The Board concluded that the advisory fee structure for the fund continued to provide for a reasonable sharing of benefits from any economies of scale with the fund’s investors.
Fees
The Board reviewed the fund’s management fee rate, operating expenses, and total expense ratio and compared them with fees and expenses of other comparable funds based on information and data supplied by Lipper. The information provided to the Board indicated that the fund’s management fee rate (including any reductions of the management fee rate as a result of any applicable fee waivers or expenses paid by the Adviser) and the fund’s total expense ratio were generally below the median for comparable funds. The Board also reviewed the fee schedules for institutional accounts of the Adviser and its affiliates with smaller mandates. Management informed the Board that the Adviser’s responsibilities for institutional accounts are more limited than its responsibilities for the fund and other T. Rowe Price mutual funds that it or its affiliates advise and that the Adviser performs significant additional services and assumes greater risk for the fund and other T. Rowe Price mutual funds that it advises than it does for institutional accounts. On the basis of the information provided, the Board concluded that the fees paid by the fund under the Contract were reasonable.
Approval of the Contract
As noted, the Board approved the continuation of the Contract. No single factor was considered in isolation or to be determinative to the decision. Rather, the Board was assisted by the advice of independent legal counsel and concluded, in light of a weighting and balancing of all factors considered, that it was in the best interests of the fund to approve the continuation of the Contract, including the fees to be charged for services thereunder.
Item 2. Code of Ethics.
A code of ethics, as defined in Item 2 of Form N-CSR, applicable to its principal executive officer, principal financial officer, principal accounting officer or controller, or persons performing similar functions is filed as an exhibit to the registrant’s annual Form N-CSR. No substantive amendments were approved or waivers were granted to this code of ethics during the registrant’s most recent fiscal half-year.
Item 3. Audit Committee Financial Expert.
Disclosure required in registrant’s annual Form N-CSR.
Item 4. Principal Accountant Fees and Services.
Disclosure required in registrant’s annual Form N-CSR.
Item 5. Audit Committee of Listed Registrants.
Not applicable.
Item 6. Investments.
(a) Not applicable. The complete schedule of investments is included in Item 1 of this Form N-CSR.
(b) Not applicable.
Item 7. Disclosure of Proxy Voting Policies and Procedures for Closed-End Management Investment Companies.
Not applicable.
Item 8. Portfolio Managers of Closed-End Management Investment Companies.
Not applicable.
Item 9. Purchases of Equity Securities by Closed-End Management Investment Company and Affiliated Purchasers.
Not applicable.
Item 10. Submission of Matters to a Vote of Security Holders.
Not applicable.
Item 11. Controls and Procedures.
(a) The registrant’s principal executive officer and principal financial officer have evaluated the registrant’s disclosure controls and procedures within 90 days of this filing and have concluded that the registrant’s disclosure controls and procedures were effective, as of that date, in ensuring that information required to be disclosed by the registrant in this Form N-CSR was recorded, processed, summarized, and reported timely.
(b) The registrant’s principal executive officer and principal financial officer are aware of no change in the registrant’s internal control over financial reporting that occurred during the registrant’s second fiscal quarter covered by this report that has materially affected, or is reasonably likely to materially affect, the registrant’s internal control over financial reporting.
Item 12. Exhibits.
(a)(1) The registrant’s code of ethics pursuant to Item 2 of Form N-CSR is filed with the registrant’s annual Form N-CSR.
(2) Separate certifications by the registrant's principal executive officer and principal financial officer, pursuant to Section 302 of the Sarbanes-Oxley Act of 2002 and required by Rule 30a-2(a) under the Investment Company Act of 1940, are attached.
(3) Written solicitation to repurchase securities issued by closed-end companies: not applicable.
(b) A certification by the registrant's principal executive officer and principal financial officer, pursuant to Section 906 of the Sarbanes-Oxley Act of 2002 and required by Rule 30a-2(b) under the Investment Company Act of 1940, is attached.
| | |
SIGNATURES |
| |
| | Pursuant to the requirements of the Securities Exchange Act of 1934 and the Investment |
| Company Act of 1940, the registrant has duly caused this report to be signed on its behalf by the |
| undersigned, thereunto duly authorized. |
| |
| T. Rowe Price Institutional International Funds, Inc. |
| |
| |
| |
| By | /s/ Edward C. Bernard |
| | Edward C. Bernard |
| | Principal Executive Officer |
| |
| Date | June 17, 2010 |
| |
| |
| |
| | Pursuant to the requirements of the Securities Exchange Act of 1934 and the Investment |
| Company Act of 1940, this report has been signed below by the following persons on behalf of |
| the registrant and in the capacities and on the dates indicated. |
| |
| |
| By | /s/ Edward C. Bernard |
| | Edward C. Bernard |
| | Principal Executive Officer |
| |
| Date | June 17, 2010 |
| |
| |
| |
| By | /s/ Gregory K. Hinkle |
| | Gregory K. Hinkle |
| | Principal Financial Officer |
| |
| Date | June 17, 2010 |