| UNITED STATES |
| SECURITIES AND EXCHANGE COMMISSION |
| Washington, D.C. 20549 |
FORM N-CSR |
CERTIFIED SHAREHOLDER REPORT OF REGISTERED |
MANAGEMENT INVESTMENT COMPANIES |
| Investment Company Act File Number: 811-5833 |
| T. Rowe Price Institutional International Funds, Inc. |
| (Exact name of registrant as specified in charter) |
| 100 East Pratt Street, Baltimore, MD 21202 |
| (Address of principal executive offices) |
| David Oestreicher |
| 100 East Pratt Street, Baltimore, MD 21202 |
| (Name and address of agent for service) |
| Registrant’s telephone number, including area code: (410) 345-2000 |
| Date of fiscal year end: October 31 |
| Date of reporting period: October 31, 2010 |
Item 1: Report to Shareholders
 |
| Institutional Africa & Middle East Fund | October 31, 2010 |
| Highlights |
• Stocks in Africa and the Middle East were widely mixed in the last six months but produced strong returns for the one-year period ended October 31, 2010.
• Your fund lagged its benchmark in both periods due to a large underweighting in the strong South African market and an overweight in the struggling United Arab Emirates market.
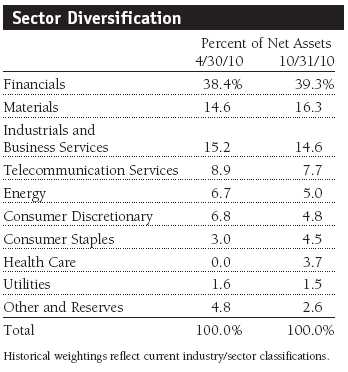
• Throughout our target regions, we continue to favor financial services companies that should benefit over time from economic growth and increasing wealth and regional investment. We also like industrial companies that may benefit from significant government spending programs, particularly on infrastructure.
• We remain constructive about Africa and the Middle East and are encouraged by healthy growth rates across the region. While higher oil prices have been a driver of economic growth, many economies in the region are diversifying away from oil amid continued investment and infrastructure spending.
The views and opinions in this report were current as of October 31, 2010. They are not guarantees of performance or investment results and should not be taken as investment advice. Investment decisions reflect a variety of factors, and the managers reserve the right to change their views about individual stocks, sectors, and the markets at any time. As a result, the views expressed should not be relied upon as a forecast of the fund’s future investment intent. The report is certified under the Sarbanes-Oxley Act, which requires mutual funds and other public companies to affirm that, to the best of their knowledge, the information in their financial reports is fairly and accurately stated in all material respects.
Manager’s Letter
T. Rowe Price Institutional Africa & Middle East Fund
Dear Investor
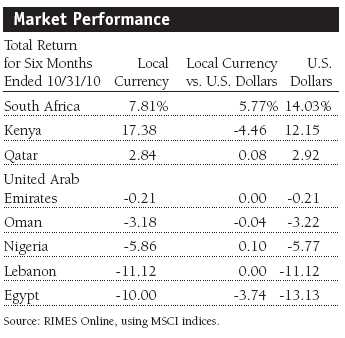
Equity markets in Africa and the Middle East were widely mixed in the last six months but produced strong returns for the one-year period ended October 31, 2010. Stocks in Kenya were top performers in both periods, though the market is highly illiquid. South African shares also produced brisk returns in both periods as the market benefited from increased manufacturing and commodity exports and a stronger currency versus the dollar boosted returns in dollar terms. Stocks in Oman and Nigeria declined in the second half of the fund’s fiscal year, surrendering some of their first-half gains. Egyptian equities fell slightly for the full year as shares fell sharply in the last six months, erasing earlier gains amid concerns about higher food inflation and who might succeed President Hosni Mubarak. Lebanese stocks declined in both periods.
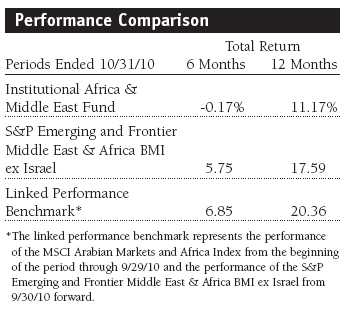
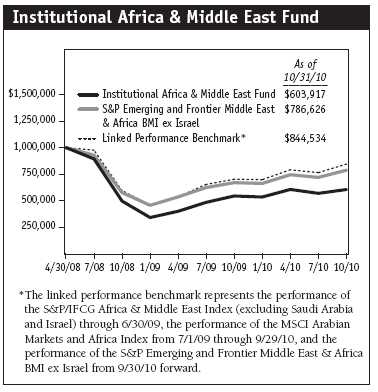
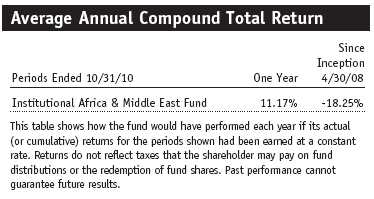
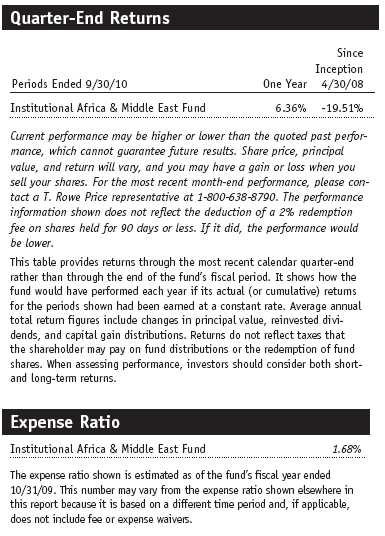
Your fund returned -0.17% in the last six months and 11.17% for the one-year period ended October 31, 2010. As shown in the Performance Comparison table, the fund lagged its new benchmark, the S&P Emerging and Frontier Middle East & Africa Broad Market Index (BMI) ex Israel in both periods. We replaced the MSCI Arabian Markets and Africa Index because MSCI discontinued this index at the close of business on September 29, 2010. We are also listing a linked performance benchmark, which reflects the performance of the MSCI index through September 29 and the new S&P index from September 30 through the end of October. As shown in the table above, the fund lagged this secondary benchmark in both periods.
The fund’s relative performance in the 6- and 12-month reporting periods was hurt by our large underweighting in South Africa. Although the fund currently has about 16% of assets in South Africa, the benchmark weighting is around 50%. We underweight the country because we believe there are better long-term growth opportunities in other African and Middle Eastern markets with stronger growth prospects. Another major reason for the fund’s underperformance was its overweight in the United Arab Emirates (UAE), where equities fell sharply in the first half of our fiscal year and were flat in the second half. At the end of October, the UAE represented 13% of assets versus about 3% for the benchmark. The Dubai debt crisis in late 2009 and the weakening of the UAE real estate market were two primary reasons for the market’s poor performance. Although caution toward the region following the Dubai debt crisis is lingering, we believe that the UAE’s long-term growth prospects remain strong and that our UAE holdings will benefit over time from robust economic fundamentals around the region.
Portfolio Review
Gulf Cooperation Council (GCC)
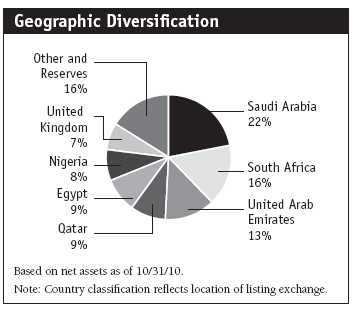
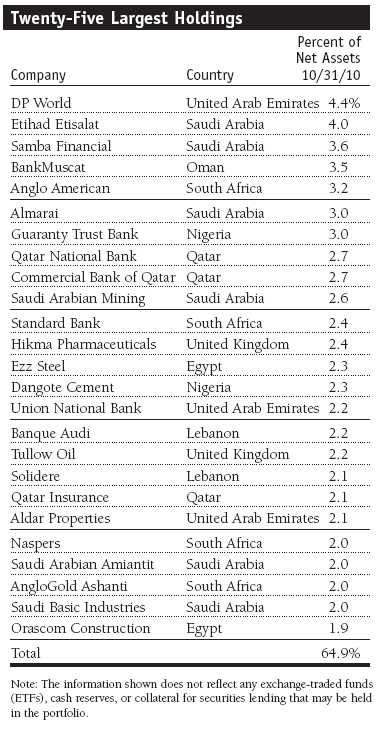
The portfolio remains heavily concentrated in four of the six GCC countries—Saudi Arabia, Oman, Qatar, and the UAE. These markets represented approximately 48% of fund assets at the end of our reporting period. We had no investments in Bahrain or Kuwait at the end of our fiscal year due to concerns about corporate governance structures and protection for minority shareholders.
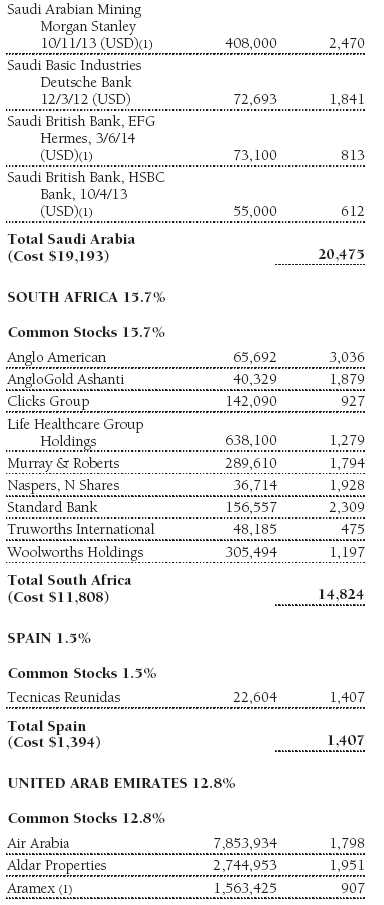
United Arab Emirates
Stocks in the UAE edged lower in the last six months but declined nearly 12% over our fiscal year. As mentioned earlier, our overweight allocation detracted significantly from the fund’s relative performance.
Nevertheless, one of our top contributors to fund performance in absolute terms in both periods was DP World, a leading global ports operator based in Dubai and the portfolio’s largest holding. DP World is owned by Dubai World, which triggered the Dubai debt crisis in November 2009 and eventually agreed to restructure debts related to two other subsidiaries. But shares have performed very well for most of this year, benefiting from increased trade in a recovering global economy. On the other hand, Aldar Properties was one of the worst-performing portfolio holdings throughout the last year. This leading government-backed Abu Dhabi real estate and infrastructure developer struggled amid weak land sales, a sharp economic slowdown, and the Dubai debt crisis. Although we reduced our position in the stock in the last six months, we maintain a positive outlook for the company. As the global economy recovers, investors’ risk appetite improves, and liquidity returns to normal, we believe Abu Dhabi’s real estate sector will see renewed interest. Overall, we are confident in the quality of our holdings in the UAE, which are generally plays on regional growth across the Middle East. (Please refer to the fund’s portfolio of investments for a complete list of holdings and the amount each represents in the portfolio.)
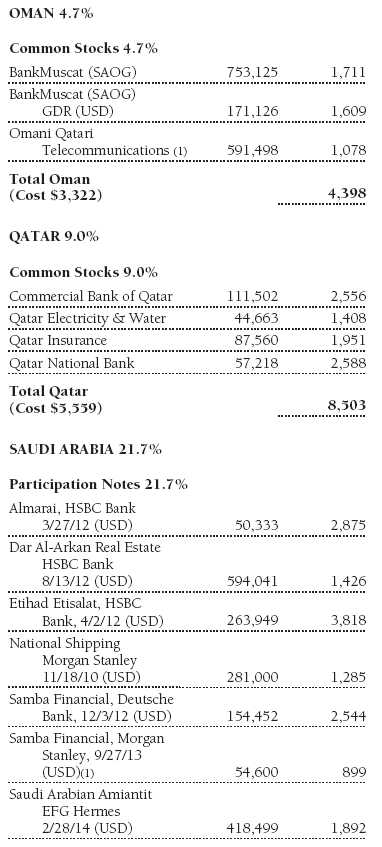
Saudi Arabia
The Saudi Arabian stock market returned approximately -6% and 6% in the 6- and 12-month periods ended October 31, 2010, respectively. This major oil producer remains our largest country allocation in the fund (about 22% of assets at the end of October), reflecting our belief that it is one of the most attractive markets in our opportunity set. While oil revenues have been responsible for Saudi Arabia’s economic strength, these revenues are being reinvested into many projects, such as infrastructure, which should help drive up stock values. For the time being, foreigners may not own Saudi shares directly, so we gain exposure to the country through participation notes (P-notes).
Our positioning in Saudi Arabia is led by Etihad Etisalat, Samba Financial, Almarai, and Saudi Arabian Mining, which are also some of the largest positions in the portfolio. Etihad Etisalat is a leading mobile operator poised to benefit from growth in mobile phone subscriptions, and our investment produced very strong returns over the last year. Samba Financial is a leading bank that we believe will benefit from a steady acceleration of the Saudi economy in the months ahead. Almarai is the largest integrated food and dairy producer in the Persian Gulf area and has built one of the most prominent brands in the region. The company continues to enjoy strong sales growth, and our investment contributed significantly to the fund’s absolute returns in the 6- and 12-month reporting periods. Finally, Saudi Arabian Mining produced very strong returns over the last year, lifted by surging prices of gold and other metals.
Not all of our Saudi investments fared well, however, in part because of investor caution and slower economic growth in the region following the Dubai debt crisis. Yamamah Saudi Cement and pipe manufacturer Saudi Arabian Amiantit, which should benefit from infrastructure spending and development efforts through the region, were disappointing. Dar Al-Arkan Real Estate, which provides direct exposure to the Saudi housing market, struggled along with other property companies in the region in the last six months. Although we eliminated Yamamah in favor of other investment opportunities, we maintained our positions in the other two companies because we believe that long-term real estate and infrastructure development trends in the Middle East remain favorable.
Qatar and Oman
Qatar and Oman, both of which are located on the Arabian Peninsula, together represented approximately 14% of fund assets at the end of October. These markets were little changed in the second half of our fiscal year, as shown in the table on page 3, but produced 15% and 10% gains, respectively, over the full year.
Qatar’s economy is still one of the most attractive in the GCC due to its huge gas reserves, and we continue to have significant holdings in financial companies that we believe have a healthy outlook. Commercial Bank of Qatar, Qatar Insurance, and Qatar National Bank are among our largest positions in the entire portfolio, and they produced good earnings and strong returns for the fund in both our 6- and 12-month reporting periods. Our investment in Qatar Electricity & Water produced reasonable gains in both periods, but we eliminated conglomerate Industries Qatar in the last six months to look for better investment opportunities.
Our primary holding in Oman is BankMuscat, which is the country’s dominant commercial bank. Shares produced strong gains for the fund over the last year but sagged slightly in the last six months. The company recently reported reasonable financial results, though loan growth was somewhat disappointing to us. We anticipate that the stock, which our analysis says is very inexpensive, will perform better as the economic environment normalizes. A new Omani holding for the fund is Omani Qatari Telecommunications, which we purchased at the end of our reporting period. The company’s mobile phone subsidiary, called Nawras, has very strong management and a proven track record for successfully delivering high-quality products and services and strong and efficient growth.
Other Middle East Countries
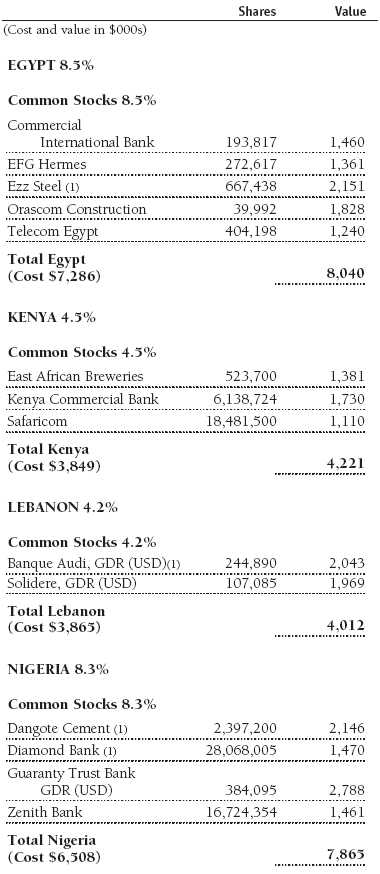
Egypt
Egypt was one of the weaker markets in our opportunity set over the last year, despite a solid economic environment and strong domestic consumption. Shares fell 13% since the end of April and declined about 5% for the 12-month period. The main concerns weighing on the market are inflation exceeding 10%, which we think is at a manageable level relative to where it has been in Egypt’s modern history, and uncertainty about who will succeed the aging Hosni Mubarak, who has been president for nearly 30 years. We anticipate an election will take place in a year or so, and Mubarak’s son, Gamal, is a likely candidate who, if elected, would probably maintain the status quo.
Our Egyptian holdings generally struggled over the last year due to the broad market’s weakness, but we continue to believe that various Egyptian companies will benefit from strong economic growth, rising wealth, infrastructure development, and other trends in Egypt and among GCC nations. Bucking the negative trend was Orascom Construction, which made a modest contribution to our results in the last six months and produced strong gains for the full year. One of our largest performance detractors in the second half of our fiscal year was investment bank EFG Hermes. Shares lagged as the company announced plans to acquire a 65% stake in Lebanese bank Credit Libanais. We think this acquisition could turn the company into a regional giant with universal banking capabilities and a more consistent earnings stream. Telecom Egypt also fared poorly, and tourist destination developer Orascom Development Holding struggled amid a tough sales environment and concerns that European tourist traffic would weaken due to Europe’s financial and economic troubles. We eliminated Orascom Development from the portfolio but added two other Egyptian companies that seem to have better prospects. One is Ezz Steel, which did well in the last six months and should benefit over time as Egypt develops cities and buildings to support its high population growth. The other is Commercial International Bank, a former fund holding that is currently enjoying very strong loan growth.
Lebanon and Jordan
Lebanon and Jordan were two of the weakest markets in our target regions over the last year. Stocks in Lebanon fell 11% in the last six months and 13% for the entire year, while shares in Jordan skidded 7% and 10% in our 6- and 12-month reporting periods, respectively.
Although Lebanon’s economic growth is quite strong and inflation is low, the market was pressured by concerns about the potential for civil unrest if the United Nations (UN) tribunal investigating the 2005 murder of former Prime Minister Rafiq Hariri identifies suspects to go on trial. Market weakness over the last year contributed to the poor performance of our investment in property developer Solidere, a heavyweight in the Lebanese market. Banque Audi struggled to a lesser extent as the Lebanese banking environment remains attractive and the company expands in other countries in our investment universe. We are maintaining these holdings through this uncertain period because we believe they will thrive over the long term.
While we did not own any Jordan-listed companies, we decided to reestablish a position in U.K.-listed company Hikma Pharmaceuticals, a generic drugmaker based in Jordan, in the last six months. Shares reacted positively to news near the end of our reporting period that the company agreed to acquire U.S.-based Baxter International’s injectible medicines unit.
Africa
South Africa
Shares in South Africa advanced 14% and almost 34% in dollar terms over the past 6- and 12-month reporting periods, respectively. While it is one of our largest country allocations and many of our investments performed well in absolute terms in both periods, we continue to significantly underweight the country versus the benchmark, as mentioned earlier, because we believe there are better long-term investment opportunities elsewhere in Africa and the Middle East.
One of our concerns about South Africa is the government’s inability to reform the labor market and to create jobs needed to allow the economy to grow at a faster rate. South Africa is struggling with significant trade and budget deficits and 24% unemployment. That said, the quality of company management, disclosure, and corporate governance in South Africa are probably better than in most countries in the emerging markets universe. In addition, there are some exceptionally well-run companies, some of which offer good exposure to the smaller, faster-growing sub-Saharan markets.
Our largest holding in the country is Standard Bank, the largest bank in South Africa. The domestic banking market is experiencing limited loan growth, but we believe the company is benefiting from its unique presence in more than a dozen African markets. Media company Naspers performed very well throughout the year, helped by good growth in its pay-TV operations domestically and in sub-Saharan Africa. AngloGold Ashanti, which is seeking to improve mining productivity, also produced favorable returns over the last year, lifted by surging metals prices. Murray & Roberts, another significant holding, is an engineering, contracting, and construction services firm that we believe is attractively valued and poised to benefit from increased construction activity. During the last six months, we eliminated specialty retailer JD Group but established positions in Truworths International and Woolworths Holdings—other retailers that we believe have better prospects.
Kenya and Nigeria
Stocks in Kenya and Nigeria represented about 13% of the fund’s assets at the end of October. Kenyan equities fared best in our 6- and 12-month reporting periods, climbing 12% in the last six months and soaring 42% for the full year. Nigerian stocks fell about 6% in the last six months but produced a strong full-year return of 18%, thanks to vigorous gains in the first half of our fiscal year. Though liquidity is often poor and corporate governance concerns are abundant, we continue to look in these and other sub-Saharan markets for high-quality, well-managed businesses with favorable prospects.
In Kenya, the macroeconomic environment is strong, and there are several significant infrastructure projects in the works. In addition, the country is a founding member of the East African Community, which is pursuing a monetary union starting in 2012. The fund benefited from good performance of Kenya Commercial Bank, a leading bank in the midst of restructuring, in both the 6- and 12-month reporting periods, but telecommunications company Safaricom fell sharply in the last six months due to a tough operating environment. During the last six months, we established a position in East African Breweries, a high-quality beverage company with a good growth outlook.
In Nigeria, we maintained our investments in Guaranty Trust Bank, Zenith Bank, and Diamond Bank. Guaranty performed exceptionally well over the last year, but Diamond and Zenith were somewhat disappointing. We eliminated Oando, an integrated energy company that fared poorly in the last six months, but established a position in Dangote Cement, an attractively valued cement company.
Outlook
Africa and the Middle East have been underperforming the broader emerging markets universe for an extended period, but markets in these regions have started to perform better in recent months due to improving sentiment. We believe Africa and the Middle East have lagged due to very low trading volumes, poor sentiment related to Dubai, and risk aversion due to past problems in the banking sector. As these markets do not form part of the broad emerging markets index, they have not benefited from the huge cash flows into emerging markets funds this year. However, given higher prices of oil and other commodities as well as strong economic and corporate fundamentals, we believe market performance should continue to improve.
We remain constructive about the outlook for the Africa and Middle East region because we are encouraged by healthy growth rates across the region. While higher oil prices have been a driver of economic growth, many economies in the region are diversifying away from oil amid continued investment and infrastructure spending. This is particularly true in the Middle East. We consider Saudi Arabia to be one of the most attractive markets and anticipate hundreds of billions of dollars in infrastructure spending over the next few years.
In Africa, the improving macroeconomic outlook has been underpinned by higher commodity prices, reduced debt burdens, and improving sentiment. In addition, we see the consumer as a key driver of these markets and continue to seek opportunities to boost our exposure. However, we remain cautious about South Africa given the poor economic backdrop there. It is important to note that many African markets are prone to periods of sharp underperformance. However, market returns are rising from a low base, and valuations are currently at very attractive levels. We believe there is a very strong case for Africa to continue emerging as an attractive investment destination over time. We intend to add only the highest-quality companies to your fund.
In closing, we would like to remind our shareholders, particularly newer investors, that this fund has a high risk/return profile. Because of its narrow geographic focus and relatively small number of holdings, this fund can be extremely volatile and should represent only a small portion of a long-term investor’s well-diversified portfolio.
Thank you for your confidence in T. Rowe Price.
Respectfully submitted,

Joseph Rohm
Portfolio manager
November 24, 2010
The portfolio manager has day-to-day responsibility for managing the portfolio and works with committee members in developing and executing the fund’s investment program.
| Risks of International Investing |
Funds that invest overseas generally carry more risk than funds that invest strictly in U.S. assets. Funds investing in a single country, limited geographic region, or emerging markets tend to be riskier than more diversified funds. Risks can result from varying stages of economic and political development; differing regulatory environments, trading days, and accounting standards; and higher transaction costs of non-U.S. markets. Non-U.S. investments are also subject to currency risk, or a decline in the value of a foreign currency versus the U.S. dollar, which reduces the dollar value of securities denominated in that currency.
| Glossary |
MSCI Arabian Markets and Africa Index: An index created by MSCI that measures the performance of various equity markets in the Middle East, in Africa, and along the Persian Gulf. MSCI discontinued this index on September 29, 2010.
S&P Emerging and Frontier Middle East & Africa Broad Market Index (BMI) ex Israel: An index created by Standard & Poor’s that includes all of the daily priced, free-float market cap that S&P covers across the Middle East and Africa, excluding Israel.
Portfolio Highlights
Performance and Expenses
T. Rowe Price Institutional Africa & Middle East Fund
| Performance Comparison |
This chart shows the value of a hypothetical $1 million investment in the fund over the past 10 fiscal year periods or since inception (for funds lacking 10-year records). The result is compared with benchmarks, which may include a broad-based market index and a peer group average or index. Market indexes do not include expenses, which are deducted from fund returns as well as mutual fund averages and indexes.
Fund Expense Example
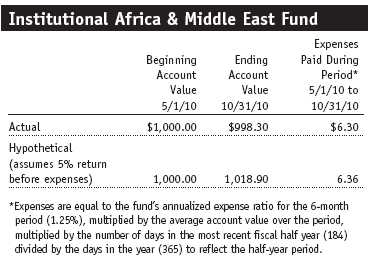
As a mutual fund shareholder, you may incur two types of costs: (1) transaction costs, such as redemption fees or sales loads, and (2) ongoing costs, including management fees, distribution and service (12b-1) fees, and other fund expenses. The following example is intended to help you understand your ongoing costs (in dollars) of investing in the fund and to compare these costs with the ongoing costs of investing in other mutual funds. The example is based on an investment of $1,000 invested at the beginning of the most recent six-month period and held for the entire period.
Actual Expenses
The first line of the following table (“Actual”) provides information about actual account values and actual expenses. You may use the information in this line, together with your account balance, to estimate the expenses that you paid over the period. Simply divide your account value by $1,000 (for example, an $8,600 account value divided by $1,000 = 8.6), then multiply the result by the number in the first line under the heading “Expenses Paid During Period” to estimate the expenses you paid on your account during this period.
Hypothetical Example for Comparison Purposes
The information on the second line of the table (“Hypothetical”) is based on hypothetical account values and expenses derived from the fund’s actual expense ratio and an assumed 5% per year rate of return before expenses (not the fund’s actual return). You may compare the ongoing costs of investing in the fund with other funds by contrasting this 5% hypothetical example and the 5% hypothetical examples that appear in the shareholder reports of the other funds. The hypothetical account values and expenses may not be used to estimate the actual ending account balance or expenses you paid for the period.
You should also be aware that the expenses shown in the table highlight only your ongoing costs and do not reflect any transaction costs, such as redemption fees or sales loads. Therefore, the second line of the table is useful in comparing ongoing costs only and will not help you determine the relative total costs of owning different funds. To the extent a fund charges transaction costs, however, the total cost of owning that fund is higher.
Financial Highlights
T. Rowe Price Institutional Africa & Middle East Fund
The accompanying notes are an integral part of these financial statements.
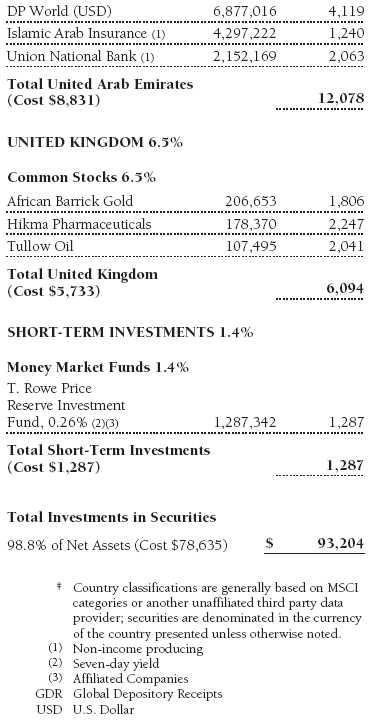
Portfolio of Investments‡
T. Rowe Price Institutional Africa & Middle East Fund
October 31, 2010
The accompanying notes are an integral part of these financial statements.
Statement of Assets and Liabilities
T. Rowe Price Institutional Africa & Middle East Fund
October 31, 2010
($000s, except shares and per share amounts)

The accompanying notes are an integral part of these financial statements.
Statement of Operations
T. Rowe Price Institutional Africa & Middle East Fund
($000s)
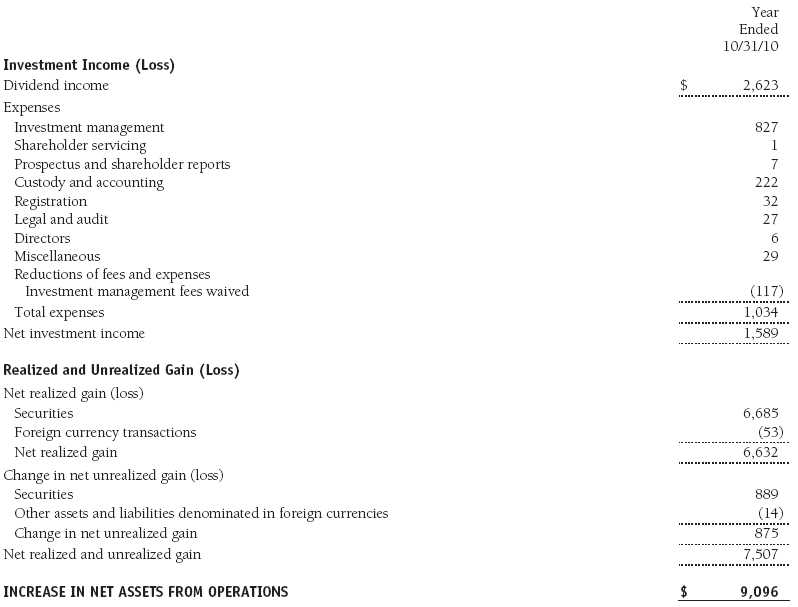
The accompanying notes are an integral part of these financial statements.
Statement of Changes in Net Assets
T. Rowe Price Institutional Africa & Middle East Fund
($000s)
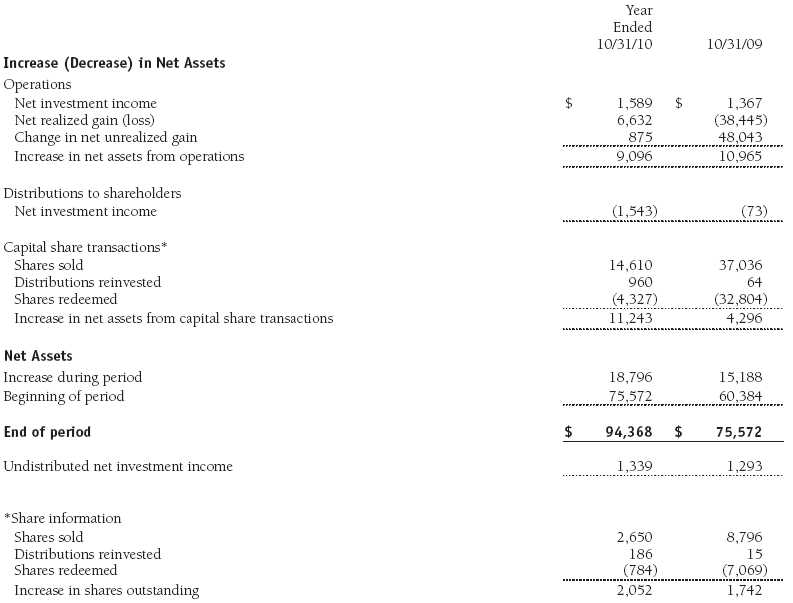
The accompanying notes are an integral part of these financial statements.
Notes to Financial Statements
T. Rowe Price Institutional Africa & Middle East Fund
October 31, 2010
T. Rowe Price Institutional International Funds, Inc. (the corporation), is registered under the Investment Company Act of 1940 (the 1940 Act). The Institutional Africa & Middle East Fund (the fund), a nondiversified, open-end management investment company, is one portfolio established by the corporation. The fund commenced operations on April 30, 2008. The fund seeks long-term growth of capital by investing primarily in the common stocks of companies located (or with primary operations) in Africa and the Middle East.
NOTE 1 - SIGNIFICANT ACCOUNTING POLICIES
Basis of Preparation The accompanying financial statements were prepared in accordance with accounting principles generally accepted in the United States of America (GAAP), which require the use of estimates made by fund management. Fund management believes that estimates and valuations are appropriate; however, actual results may differ from those estimates, and the valuations reflected in the accompanying financial statements may differ from the value ultimately realized upon sale of securities.
Investment Transactions, Investment Income, and Distributions Income and expenses are recorded on the accrual basis. Dividends received from mutual fund investments are reflected as dividend income; capital gain distributions are reflected as realized gain/loss. Dividend income and capital gain distributions are recorded on the ex-dividend date. Income tax-related interest and penalties, if incurred, would be recorded as income tax expense. Investment transactions are accounted for on the trade date. Realized gains and losses are reported on the identified cost basis. Distributions to shareholders are recorded on the ex-dividend date. Income distributions are declared and paid annually. Capital gain distributions, if any, are generally declared and paid by the fund annually.
Currency Translation Assets, including investments, and liabilities denominated in foreign currencies are translated into U.S. dollar values each day at the prevailing exchange rate, using the mean of the bid and asked prices of such currencies against U.S. dollars as quoted by a major bank. Purchases and sales of securities, income, and expenses are translated into U.S. dollars at the prevailing exchange rate on the date of the transaction. The effect of changes in foreign currency exchange rates on realized and unrealized security gains and losses is reflected as a component of security gains and losses.
Credits The fund earns credits on temporarily uninvested cash balances held at the custodian, which reduce the fund’s custody charges. Custody expense in the accompanying financial statements is presented before reduction for credits.
Redemption Fees A 2% fee is assessed on redemptions of fund shares held for 90 days or less to deter short-term trading and to protect the interests of long-term shareholders. Redemption fees are withheld from proceeds that shareholders receive from the sale or exchange of fund shares. The fees are paid to the fund and are recorded as an increase to paid-in capital. The fees may cause the redemption price per share to differ from the net asset value per share.
New Accounting Pronouncement On May 1, 2010, the fund adopted new accounting guidance that requires enhanced disclosures about fair value measurements in the financial statements. Adoption of this guidance had no impact on the fund’s net assets or results of operations.
NOTE 2 - VALUATION
The fund’s financial instruments are reported at fair value as defined by GAAP. The fund determines the values of its assets and liabilities and computes its net asset value per share at the close of the New York Stock Exchange (NYSE), normally 4 p.m. ET, each day that the NYSE is open for business. Values in the accompanying Portfolio of Investments are as of October 29, 2010, the last business day in the fund’s fiscal year ended October 31, 2010. Some foreign markets were open between October 29 and the close of the reporting period on October 31, but any differences in values and foreign exchange rates subsequent to October 29 through October 31 were immaterial to the fund’s financial statements.
Valuation Methods Equity securities listed or regularly traded on a securities exchange or in the over-the-counter (OTC) market are valued at the last quoted sale price or, for certain markets, the official closing price at the time the valuations are made, except for OTC Bulletin Board securities, which are valued at the mean of the latest bid and asked prices. A security that is listed or traded on more than one exchange is valued at the quotation on the exchange determined to be the primary market for such security. Listed securities not traded on a particular day are valued at the mean of the latest bid and asked prices for domestic securities and the last quoted sale price for international securities.
Investments in mutual funds are valued at the mutual fund’s closing net asset value per share on the day of valuation.
Other investments, including restricted securities, and those financial instruments for which the above valuation procedures are inappropriate or are deemed not to reflect fair value are stated at fair value as determined in good faith by the T. Rowe Price Valuation Committee, established by the fund’s Board of Directors.
For valuation purposes, the last quoted prices of non-U.S. equity securities may be adjusted under the circumstances described below. If the fund determines that developments between the close of a foreign market and the close of the NYSE will, in its judgment, materially affect the value of some or all of its portfolio securities, the fund will adjust the previous closing prices to reflect what it believes to be the fair value of the securities as of the close of the NYSE. In deciding whether it is necessary to adjust closing prices to reflect fair value, the fund reviews a variety of factors, including developments in foreign markets, the performance of U.S. securities markets, and the performance of instruments trading in U.S. markets that represent foreign securities and baskets of foreign securities. A fund may also fair value securities in other situations, such as when a particular foreign market is closed but the fund is open. The fund uses outside pricing services to provide it with closing prices and information to evaluate and/or adjust those prices. The fund cannot predict how often it will use closing prices and how often it will determine it necessary to adjust those prices to reflect fair value. As a means of evaluating its security valuation process, the fund routinely compares closing prices, the next day’s opening prices in the same markets, and adjusted prices.
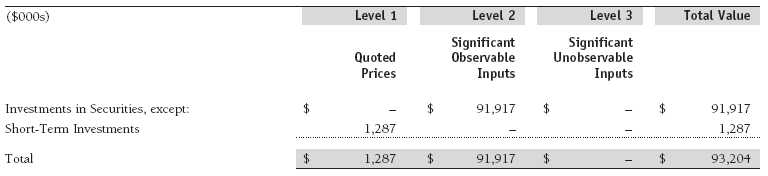
Valuation Inputs Various inputs are used to determine the value of the fund’s financial instruments. These inputs are summarized in the three broad levels listed below:
Level 1 – quoted prices in active markets for identical financial instruments
Level 2 – observable inputs other than Level 1 quoted prices (including, but not limited to, quoted prices for similar financial instruments, interest rates, prepayment speeds, and credit risk)
Level 3 – unobservable inputs
Observable inputs are those based on market data obtained from sources independent of the fund, and unobservable inputs reflect the fund’s own assumptions based on the best information available. The input levels are not necessarily an indication of the risk or liquidity associated with financial instruments at that level. For example, non-U.S. equity securities actively traded in foreign markets generally are reflected in Level 2 despite the availability of closing prices because the fund evaluates and determines whether those closing prices reflect fair value at the close of the NYSE or require adjustment, as described above. The following table summarizes the fund’s financial instruments, based on the inputs used to determine their values on October 31, 2010:
NOTE 3 - OTHER INVESTMENT TRANSACTIONS
Consistent with its investment objective, the fund engages in the following practices to manage exposure to certain risks and/or to enhance performance. The investment objective, policies, program, and risk factors of the fund are described more fully in the fund’s prospectus and Statement of Additional Information.
Emerging Markets At October 31, 2010, approximately 89% of the fund’s net assets were invested, either directly or through investments in T. Rowe Price institutional funds, in securities of companies located in emerging markets, securities issued by governments of emerging market countries, and/or securities denominated in or linked to the currencies of emerging market countries. Emerging market securities are often subject to greater price volatility, less liquidity, and higher rates of inflation than U.S. securities. In addition, emerging markets may be subject to greater political, economic and social uncertainty, and differing regulatory environments that may potentially impact the fund’s ability to buy or sell certain securities or repatriate proceeds to U.S. dollars.
Participation Notes During the year ended October 31, 2010, the fund was a party to participation notes and other types of equity-linked derivative instruments (referred to collectively as participation notes), through which a counterparty provides exposure to common stock, in the form of an unsecured interest, in markets where direct investment by the fund is not possible. Participation notes provide the economic benefit of common stock ownership to the fund, while legal ownership and voting rights are retained by the counterparty. Although participation notes are usually structured with a defined maturity or termination date, early redemption may be possible. Risks associated with participation notes include the possible failure of a counterparty to perform in accordance with the terms of the agreement, inability to transfer or liquidate the notes, potential delays or an inability to redeem before maturity under certain market conditions, and limited legal recourse against the issuer of the underlying common stock.
Other Purchases and sales of portfolio securities other than short-term securities aggregated $77,430,000 and $66,426,000, respectively, for the year ended October 31, 2010.
NOTE 4 - FEDERAL INCOME TAXES
No provision for federal income taxes is required since the fund intends to continue to qualify as a regulated investment company under Subchapter M of the Internal Revenue Code and distribute to shareholders all of its taxable income and gains. Distributions determined in accordance with federal income tax regulations may differ in amount or character from net investment income and realized gains for financial reporting purposes. Financial reporting records are adjusted for permanent book/tax differences to reflect tax character but are not adjusted for temporary differences.
The fund files U.S. federal, state, and local tax returns as required. The fund’s tax returns are subject to examination by the relevant tax authorities until expiration of the applicable statute of limitations, which is generally three years after filing of the tax return, but which can be extended to six years in certain circumstances. Tax returns for open years have incorporated no uncertain tax positions that require a provision for income taxes.
Reclassifications to paid-in capital relate primarily to capital loss carryforwards that, under applicable tax rules, are no longer available to the fund due to an ownership change. For the year ended October 31, 2010, the following reclassifications were recorded to reflect tax character; there was no impact on results of operations or net assets:

Distributions during the years ended October 31, 2010 and October 31, 2009, totaled $1,543,000 and $73,000, respectively, and were characterized as ordinary income for tax purposes. At October 31, 2010, the tax-basis cost of investments and components of net assets were as follows:
![]()
The difference between book-basis and tax-basis net unrealized appreciation (depreciation) is attributable to the deferral of losses from wash sales for tax purposes. The fund intends to retain realized gains to the extent of available capital loss carryforwards. During the year ended October 31, 2010, the fund utilized $4,344,000 of capital loss carryforwards. The fund’s unused capital loss carryforwards as of October 31, 2010, all expire in fiscal 2017. Further, approximately $11,916,000 of the fund’s unused capital loss carryforwards are subject to certain limitations on amount and/or timing of use related to an ownership change.
NOTE 5 - RELATED PARTY TRANSACTIONS
The fund is managed by T. Rowe Price International, Inc. (the manager), a wholly owned subsidiary of T. Rowe Price Associates, Inc. (Price Associates), which is wholly owned by T. Rowe Price Group, Inc. The investment management agreement between the fund and the manager provides for an annual investment management fee equal to 1.00% of the fund’s average daily net assets. The fee is computed daily and paid monthly.
The fund is also subject to a contractual expense limitation through February 28, 2011. During the limitation period, the manager is required to waive its management fee and reimburse the fund for any expenses, excluding interest, taxes, brokerage commissions, and extraordinary expenses that would otherwise cause the fund’s ratio of annualized total expenses to average net assets (expense ratio) to exceed its expense limitation of 1.25% . For a period of three years after the date of any reimbursement or waiver, the fund is required to repay the manager for expenses previously reimbursed and management fees waived to the extent its net assets have grown or expenses have declined sufficiently to allow repayment without causing the fund’s expense ratio to exceed its expense limitation. Pursuant to this agreement, management fees in the amount of $117,000 were waived during the year ended October 31, 2010. Including these amounts, management fees waived and expenses previously reimbursed by the manager in the amount of $396,000 remain subject to repayment by the fund at October 31, 2010.
In addition, the fund has entered into service agreements with Price Associates and a wholly owned subsidiary of Price Associates (collectively, Price). Price Associates computes the daily share price and provides certain other administrative services to the fund. T. Rowe Price Services, Inc., provides shareholder and administrative services in its capacity as the fund’s transfer and dividend disbursing agent. For the year ended October 31, 2010, expenses incurred pursuant to these service agreements were $177,000 for Price Associates and less than $1,000 for T. Rowe Price Services, Inc. The total amount payable at period-end pursuant to these service agreements is reflected as Due to Affiliates in the accompanying financial statements.
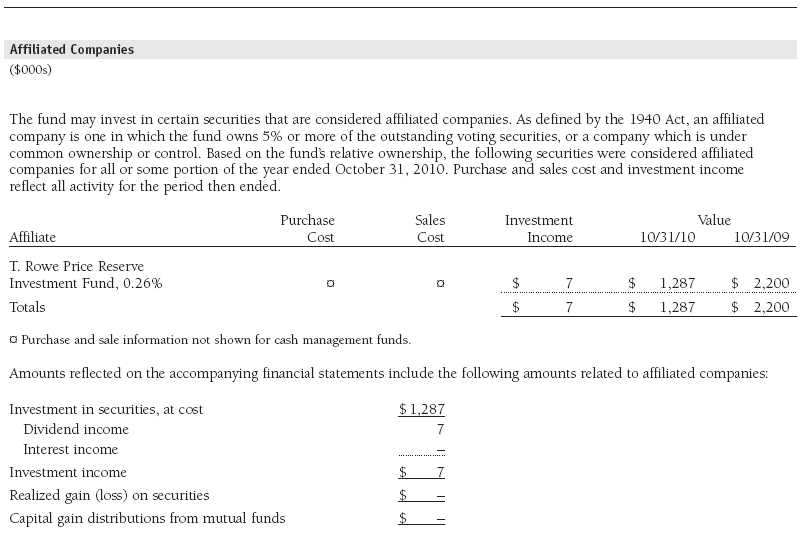
The fund may invest in the T. Rowe Price Reserve Investment Fund and the T. Rowe Price Government Reserve Investment Fund (collectively, the T. Rowe Price Reserve Investment Funds), open-end management investment companies managed by Price Associates and considered affiliates of the fund. The T. Rowe Price Reserve Investment Funds are offered as cash management options to mutual funds, trusts, and other accounts managed by Price Associates and/or its affiliates and are not available for direct purchase by members of the public. The T. Rowe Price Reserve Investment Funds pay no investment management fees.
Report of Independent Registered Public Accounting Firm
To the Board of Directors of T. Rowe Price Institutional International Funds, Inc. and
Shareholders of T. Rowe Price Institutional Africa & Middle East Fund
In our opinion, the accompanying statement of assets and liabilities, including the portfolio of investments, and the related statements of operations and of changes in net assets and the financial highlights present fairly, in all material respects, the financial position of T. Rowe Price Institutional Africa & Middle East Fund (one of the portfolios comprising T. Rowe Price Institutional International Funds, Inc., hereafter referred to as the “Fund”) at October 31, 2010, the results of its operations for the year then ended, the changes in its net assets for each of the two years in the period then ended and the financial highlights for each of the fiscal periods presented, in conformity with accounting principles generally accepted in the United States of America. These financial statements and financial highlights (hereafter referred to as “financial statements”) are the responsibility of the Fund’s management; our responsibility is to express an opinion on these financial statements based on our audits. We conducted our audits of these financial statements in accordance with the standards of the Public Company Accounting Oversight Board (United States). Those standards require that we plan and perform the audit to obtain reasonable assurance about whether the financial statements are free of material misstatement. An audit includes examining, on a test basis, evidence supporting the amounts and disclosures in the financial statements, assessing the accounting principles used and significant estimates made by management, and evaluating the overall financial statement presentation. We believe that our audits, which included confirmation of securities at October 31, 2010 by correspondence with the custodian and brokers, and confirmation of the underlying fund by correspondence with the transfer agent, provide a reasonable basis for our opinion.
PricewaterhouseCoopers LLP
Baltimore, Maryland
December 17, 2010
| Tax Information (Unaudited) for the Tax Year Ended 10/31/10 |
We are providing this information as required by the Internal Revenue Code. The amounts shown may differ from those elsewhere in this report because of differences between tax and financial reporting requirements.
For taxable non-corporate shareholders, $676,000 of the fund’s income represents qualified dividend income subject to the 15% rate category.
The fund will pass through foreign source income of $1,976,000 and foreign taxes paid of $49,000.
| Information on Proxy Voting Policies, Procedures, and Records |
A description of the policies and procedures used by T. Rowe Price funds and portfolios to determine how to vote proxies relating to portfolio securities is available in each fund’s Statement of Additional Information, which you may request by calling 1-800-225-5132 or by accessing the SEC’s website, sec.gov. The description of our proxy voting policies and procedures is also available on our website, troweprice.com. To access it, click on the words “Our Company” at the top of our corporate homepage. Then, when the next page appears, click on the words “Proxy Voting Policies” on the left side of the page.
Each fund’s most recent annual proxy voting record is available on our website and through the SEC’s website. To access it through our website, follow the directions above, then click on the words “Proxy Voting Records” on the right side of the Proxy Voting Policies page.
| How to Obtain Quarterly Portfolio Holdings |
The fund files a complete schedule of portfolio holdings with the Securities and Exchange Commission for the first and third quarters of each fiscal year on Form N-Q. The fund’s Form N-Q is available electronically on the SEC’s website (sec.gov); hard copies may be reviewed and copied at the SEC’s Public Reference Room, 450 Fifth St. N.W., Washington, DC 20549. For more information on the Public Reference Room, call 1-800-SEC-0330.
| About the Fund’s Directors and Officers |
Your fund is overseen by a Board of Directors (Board) that meets regularly to review a wide variety of matters affecting the fund, including performance, investment programs, compliance matters, advisory fees and expenses, service providers, and other business affairs. The Board elects the fund’s officers, who are listed in the final table. At least 75% of the Board’s members are independent of T. Rowe Price Associates, Inc. (T. Rowe Price), and T. Rowe Price International, Inc. (T. Rowe Price International); “inside” or “interested” directors are employees or officers of T. Rowe Price. The business address of each director and officer is 100 East Pratt Street, Baltimore, Maryland 21202. The Statement of Additional Information includes additional information about the fund directors and is available without charge by calling a T. Rowe Price representative at 1-800-225-5132.
| Independent Directors | |
| Name (Year of Birth) | Principal Occupation(s) and Directorships of Public Companies and Other Investment Companies During |
| Year Elected* | the Past Five Years |
| William R. Brody (1944) | President and Trustee, Salk Institute for Biological Studies (2009 to present); Director, Novartis, Inc. (2009 |
| 2009 | to present); Director, IBM (2007 to present); President and Trustee, Johns Hopkins University (1996 to 2009); |
| Chairman of Executive Committee and Trustee, Johns Hopkins Health System (1996 to 2009); Director, Medtronic, | |
| Inc. (1998 to 2007); Director, Mercantile Bankshares (1997 to 2007) | |
| Jeremiah E. Casey (1940) | Director, National Life Insurance (2001 to 2005); Director, NLV Financial Corporation (2004 to 2005) |
| 2006 | |
| Anthony W. Deering (1945) | Chairman, Exeter Capital, LLC, a private investment firm (2004 to present); Director, Under Armour (2008 to |
| 1991 | present); Director, Vornado Real Estate Investment Trust (2004 to present); Director, Mercantile Bankshares |
| (2002 to 2007); Member, Advisory Board, Deutsche Bank North America (2004 to present) | |
| Donald W. Dick, Jr. (1943) | Principal, EuroCapital Partners, LLC, an acquisition and management advisory firm (1995 to present) |
| 1989 | |
| Karen N. Horn (1943) | Senior Managing Director, Brock Capital Group, an advisory and investment banking firm (2004 to present); |
| 2003 | Director, Eli Lilly and Company (1987 to present); Director, Simon Property Group (2004 to present); Director, |
| Norfolk Southern (2008 to present); Director, Fannie Mae (2006 to 2008); Director, Georgia Pacific (2004 | |
| to 2005) | |
| Theo C. Rodgers (1941) | President, A&R Development Corporation (1977 to present) |
| 2006 | |
| John G. Schreiber (1946) | Owner/President, Centaur Capital Partners, Inc., a real estate investment company (1991 to present); Cofounder |
| 2001 | and Partner, Blackstone Real Estate Advisors, L.P. (1992 to present) |
| Mark R. Tercek (1957) | President and Chief Executive Officer, The Nature Conservancy (2008 to present); Managing Director, The Goldman |
| 2009 | Sachs Group, Inc. (1984 to 2008) |
| *Each independent director oversees 128 T. Rowe Price portfolios and serves until retirement, resignation, or election of a successor. | |
| Inside Directors | |
| Name (Year of Birth) | |
| Year Elected* [Number of T. Rowe | Principal Occupation(s) and Directorships of Public Companies and Other Investment Companies During |
| Price Portfolios Overseen] | the Past Five Years |
| Edward C. Bernard (1956) | Director and Vice President, T. Rowe Price; Vice Chairman of the Board, Director, and Vice President, T. Rowe Price |
| 2006 [128] | Group, Inc.; Chairman of the Board, Director, and President, T. Rowe Price Investment Services, Inc.; Chairman of |
| the Board and Director, T. Rowe Price Global Investment Services Limited, T. Rowe Price Retirement Plan Services, | |
| Inc., T. Rowe Price Savings Bank, and T. Rowe Price Services, Inc.; Director, T. Rowe Price International, Inc.; | |
| Chief Executive Officer, Chairman of the Board, Director, and President, T. Rowe Price Trust Company; Chairman | |
| of the Board, all funds | |
| Brian C. Rogers, CFA, CIC (1955) | Chief Investment Officer, Director, and Vice President, T. Rowe Price; Chairman of the Board, Chief Investment |
| 2006 [73] | Officer, Director, and Vice President, T. Rowe Price Group, Inc.; Vice President, T. Rowe Price Trust Company |
| *Each inside director serves until retirement, resignation, or election of a successor. | |
| Officers | |
| Name (Year of Birth) | |
| Position Held With Institutional International Funds | Principal Occupation(s) |
| Ulle Adamson, CFA (1979) | Vice President, T. Rowe Price Group, Inc., and T. Rowe Price |
| Vice President | International, Inc. |
| Christopher D. Alderson (1962) | Chief Executive Officer, Director, and President, T. Rowe Price International, |
| President | Inc.; Vice President, T. Rowe Price Global Investment Services Limited and |
| T. Rowe Price Group, Inc. | |
| Paulina Amieva (1981) | Vice President, T. Rowe Price International, Inc. |
| Vice President | |
| R. Scott Berg, CFA (1972) | Vice President, T. Rowe Price and T. Rowe Price Group, Inc. |
| Executive Vice President | |
| Mark C.J. Bickford-Smith (1962) | Vice President, T. Rowe Price Group, Inc., and T. Rowe Price |
| Vice President | International, Inc. |
| Jose Costa Buck (1972) | Vice President, T. Rowe Price Group, Inc., and T. Rowe Price |
| Vice President | International, Inc. |
| Richard N. Clattenburg, CFA (1979) | Vice President, T. Rowe Price, T. Rowe Price Global Investment Services |
| Vice President | Limited, and T. Rowe Price Group, Inc. |
| Michael J. Conelius, CFA (1964) | Vice President, T. Rowe Price, T. Rowe Price Global Investment Services |
| Executive Vice President | Limited, T. Rowe Price Group, Inc., T. Rowe Price International, Inc., and |
| T. Rowe Price Trust Company | |
| Richard de los Reyes (1975) | Vice President, T. Rowe Price and T. Rowe Price Group, Inc.; formerly |
| Vice President | Analyst, Soros Fund Management (to 2006) |
| Mark J.T. Edwards (1957) | Vice President, T. Rowe Price Group, Inc., and T. Rowe Price |
| Vice President | International, Inc. |
| David J. Eiswert, CFA (1972) | Vice President, T. Rowe Price, T. Rowe Price Global Investment Services |
| Vice President | Limited, and T. Rowe Price Group, Inc. |
| Roger L. Fiery III, CPA (1959) | Vice President, T. Rowe Price, T. Rowe Price Group, Inc., T. Rowe Price |
| Vice President | International, Inc., and T. Rowe Price Trust Company |
| Robert N. Gensler (1957) | Vice President, T. Rowe Price, T. Rowe Price Global Investment Services |
| Executive Vice President | Limited, T. Rowe Price Group, Inc., and T. Rowe Price International, Inc. |
| John R. Gilner (1961) | Chief Compliance Officer and Vice President, T. Rowe Price; Vice President, |
| Chief Compliance Officer | T. Rowe Price Group, Inc., and T. Rowe Price Investment Services, Inc. |
| Gregory S. Golczewski (1966) | Vice President, T. Rowe Price and T. Rowe Price Trust Company |
| Vice President | |
| M. Campbell Gunn (1956) | Vice President, T. Rowe Price Global Investment Services Limited, T. Rowe |
| Vice President | Price Group, Inc., and T. Rowe Price International, Inc. |
| Gregory K. Hinkle, CPA (1958) | Vice President, T. Rowe Price, T. Rowe Price Group, Inc., and T. Rowe Price |
| Treasurer | Trust Company; formerly Partner, PricewaterhouseCoopers LLP (to 2007) |
| Leigh Innes, CFA (1976) | Vice President, T. Rowe Price Group, Inc., and T. Rowe Price |
| Vice President | International, Inc. |
| Randal Spero Jenneke (1971) | Vice President, T. Rowe Price Group, Inc., T. Rowe Price Global Investment |
| Vice President | Services Limited, and T. Rowe Price International, Inc.; formerly Senior |
| Portfolio Manager, Australian Equities (to 2010), and Head of Research, | |
| Australian Equities (to 2007) | |
| Kris H. Jenner, M.D., D.Phil. (1962) | Vice President, T. Rowe Price, T. Rowe Price Global Investment Services |
| Vice President | Limited, and T. Rowe Price Group, Inc. |
| Ian D. Kelson (1956) | Vice President, T. Rowe Price, T. Rowe Price Global Investment Services |
| Executive Vice President | Limited, T. Rowe Price Group, Inc., and T. Rowe Price International, Inc. |
| Mark J. Lawrence (1970) | Vice President, T. Rowe Price Group, Inc., and T. Rowe Price |
| Vice President | International, Inc. |
| David M. Lee, CFA (1962) | Vice President, T. Rowe Price and T. Rowe Price Group, Inc. |
| Vice President | |
| Patricia B. Lippert (1953) | Assistant Vice President, T. Rowe Price and T. Rowe Price Investment |
| Secretary | Services, Inc. |
| Anh Lu (1968) | Vice President, T. Rowe Price Group, Inc., and T. Rowe Price |
| Vice President | International, Inc. |
| Daniel Martino, CFA (1974) | Vice President, T. Rowe Price and T. Rowe Price Group, Inc.; formerly |
| Vice President | Research Analyst and Co-portfolio Manager, Taurus Asset Management |
| (to 2006), and Onex Public Markets Group (to 2006) | |
| Susanta Mazumdar (1968) | Vice President, T. Rowe Price Group, Inc., and T. Rowe Price |
| Vice President | International, Inc. |
| Raymond A. Mills, Ph.D., CFA (1960) | Vice President, T. Rowe Price, T. Rowe Price Group, Inc., T. Rowe Price |
| Executive Vice President | International, Inc., and T. Rowe Price Trust Company |
| Joshua Nelson (1977) | Vice President, T. Rowe Price and T. Rowe Price Group, Inc. |
| Vice President | |
| Jason Nogueira, CFA (1974) | Vice President, T. Rowe Price and T. Rowe Price Group, Inc. |
| Vice President | |
| Charles M. Ober, CFA (1950) | Vice President, T. Rowe Price and T. Rowe Price Group, Inc. |
| Vice President | |
| David Oestreicher (1967) | Director and Vice President, T. Rowe Price Investment Services, Inc., |
| Vice President | T. Rowe Price Trust Company, T. Rowe Price Retirement Plan Services, Inc., |
| and T. Rowe Price Services, Inc.; Vice President, T. Rowe Price, T. Rowe | |
| Price Global Investment Services Limited, T. Rowe Price Group, Inc., and | |
| T. Rowe Price International, Inc. | |
| Gonzalo Pángaro, CFA (1968) | Vice President, T. Rowe Price Group, Inc., and T. Rowe Price |
| Executive Vice President | International, Inc. |
| Timothy E. Parker, CFA (1974) | Vice President, T. Rowe Price and T. Rowe Price Group, Inc. |
| Vice President | |
| Frederick A. Rizzo (1969) | Vice President, T. Rowe Price Group, Inc., and T. Rowe Price International, |
| Vice President | Inc.; formerly Analyst, F&C Asset Management (London) (to 2006) |
| Joseph Rohm (1966) | Vice President, T. Rowe Price Group, Inc., and T. Rowe Price |
| Executive Vice President | International, Inc. |
| Federico Santilli, CFA (1974) | Vice President, T. Rowe Price Group, Inc., and T. Rowe Price |
| Executive Vice President | International, Inc. |
| Sebastian Schrott (1977) | Vice President, T. Rowe Price Group, Inc., and T. Rowe Price |
| Vice President | International, Inc. |
| Deborah D. Seidel (1962) | Vice President, T. Rowe Price, T. Rowe Price Group, Inc., and T. Rowe Price |
| Vice President | Investment Services, Inc.; Vice President and Assistant Treasurer, T. Rowe |
| Price Services, Inc. | |
| Robert W. Sharps, CFA, CPA (1971) | Vice President, T. Rowe Price, T. Rowe Price Group, Inc., and T. Rowe Price |
| Vice President | Trust Company |
| Robert W. Smith (1961) | Vice President, T. Rowe Price, T. Rowe Price Group, Inc., and T. Rowe Price |
| Executive Vice President | Trust Company |
| Jonty Starbuck, Ph.D. (1975) | Vice President, T. Rowe Price Group, Inc., and T. Rowe Price |
| Vice President | International, Inc. |
| Dean Tenerelli (1964) | Vice President, T. Rowe Price Group, Inc., and T. Rowe Price |
| Vice President | International, Inc. |
| Julie L. Waples (1970) | Vice President, T. Rowe Price |
| Vice President | |
| Christopher S. Whitehouse (1972) | Vice President, T. Rowe Price Group, Inc., and T. Rowe Price |
| Vice President | International, Inc. |
| Unless otherwise noted, officers have been employees of T. Rowe Price or T. Rowe Price International for at least 5 years. | |
Item 2. Code of Ethics.
The registrant has adopted a code of ethics, as defined in Item 2 of Form N-CSR, applicable to its principal executive officer, principal financial officer, principal accounting officer or controller, or persons performing similar functions. A copy of this code of ethics is filed as an exhibit to this Form N-CSR. No substantive amendments were approved or waivers were granted to this code of ethics during the period covered by this report.
Item 3. Audit Committee Financial Expert.
The registrant’s Board of Directors/Trustees has determined that Mr. Anthony W. Deering qualifies as an audit committee financial expert, as defined in Item 3 of Form N-CSR. Mr. Deering is considered independent for purposes of Item 3 of Form N-CSR.
Item 4. Principal Accountant Fees and Services.
(a) – (d) Aggregate fees billed to the registrant for the last two fiscal years for professional services rendered by the registrant’s principal accountant were as follows:
Audit fees include amounts related to the audit of the registrant’s annual financial statements and services normally provided by the accountant in connection with statutory and regulatory filings. Audit-related fees include amounts reasonably related to the performance of the audit of the registrant’s financial statements and specifically include the issuance of a report on internal controls and, if applicable, agreed-upon procedures related to fund acquisitions. Tax fees include amounts related to services for tax compliance, tax planning, and tax advice. The nature of these services specifically includes the review of distribution calculations and the preparation of Federal, state, and excise tax returns. All other fees include the registrant’s pro-rata share of amounts for agreed-upon procedures in conjunction with service contract approvals by the registrant’s Board of Directors/Trustees.
(e)(1) The registrant’s audit committee has adopted a policy whereby audit and non-audit services performed by the registrant’s principal accountant for the registrant, its investment adviser, and any entity controlling, controlled by, or under common control with the investment adviser that provides ongoing services to the registrant require pre-approval in advance at regularly scheduled audit committee meetings. If such a service is required between regularly scheduled audit committee meetings, pre-approval may be authorized by one audit committee member with ratification at the next scheduled audit committee meeting. Waiver of pre-approval for audit or non-audit services requiring fees of a de minimis amount is not permitted.
(2) No services included in (b) – (d) above were approved pursuant to paragraph (c)(7)(i)(C) of Rule 2-01 of Regulation S-X.
(f) Less than 50 percent of the hours expended on the principal accountant’s engagement to audit the registrant’s financial statements for the most recent fiscal year were attributed to work performed by persons other than the principal accountant’s full-time, permanent employees.
(g) The aggregate fees billed for the most recent fiscal year and the preceding fiscal year by the registrant’s principal accountant for non-audit services rendered to the registrant, its investment adviser, and any entity controlling, controlled by, or under common control with the investment adviser that provides ongoing services to the registrant were $1,429,000 and $2,179,000, respectively.
(h) All non-audit services rendered in (g) above were pre-approved by the registrant’s audit committee. Accordingly, these services were considered by the registrant’s audit committee in maintaining the principal accountant’s independence.
Item 5. Audit Committee of Listed Registrants.
Not applicable.
Item 6. Investments.
(a) Not applicable. The complete schedule of investments is included in Item 1 of this Form N-CSR.
(b) Not applicable.
Item 7. Disclosure of Proxy Voting Policies and Procedures for Closed-End Management Investment Companies.
Not applicable.
Item 8. Portfolio Managers of Closed-End Management Investment Companies.
Not applicable.
Item 9. Purchases of Equity Securities by Closed-End Management Investment Company and Affiliated Purchasers.
Not applicable.
Item 10. Submission of Matters to a Vote of Security Holders.
Not applicable.
Item 11. Controls and Procedures.
(a) The registrant’s principal executive officer and principal financial officer have evaluated the registrant’s disclosure controls and procedures within 90 days of this filing and have concluded that the registrant’s disclosure controls and procedures were effective, as of that date, in ensuring that information required to be disclosed by the registrant in this Form N-CSR was recorded, processed, summarized, and reported timely.
(b) The registrant’s principal executive officer and principal financial officer are aware of no change in the registrant’s internal control over financial reporting that occurred during the registrant’s second fiscal quarter covered by this report that has materially affected, or is reasonably likely to materially affect, the registrant’s internal control over financial reporting.
Item 12. Exhibits.
(a)(1) The registrant’s code of ethics pursuant to Item 2 of Form N-CSR is attached.
(2) Separate certifications by the registrant's principal executive officer and principal financial officer, pursuant to Section 302 of the Sarbanes-Oxley Act of 2002 and required by Rule 30a-2(a) under the Investment Company Act of 1940, are attached.
(3) Written solicitation to repurchase securities issued by closed-end companies: not applicable.
(b) A certification by the registrant's principal executive officer and principal financial officer, pursuant to Section 906 of the Sarbanes-Oxley Act of 2002 and required by Rule 30a-2(b) under the Investment Company Act of 1940, is attached.
SIGNATURES | |
| Pursuant to the requirements of the Securities Exchange Act of 1934 and the Investment | |
| Company Act of 1940, the registrant has duly caused this report to be signed on its behalf by the | |
| undersigned, thereunto duly authorized. | |
| T. Rowe Price Institutional International Funds, Inc. | |
| By | /s/ Edward C. Bernard |
| Edward C. Bernard | |
| Principal Executive Officer | |
| Date | December 17, 2010 |
| Pursuant to the requirements of the Securities Exchange Act of 1934 and the Investment | |
| Company Act of 1940, this report has been signed below by the following persons on behalf of | |
| the registrant and in the capacities and on the dates indicated. | |
| By | /s/ Edward C. Bernard |
| Edward C. Bernard | |
| Principal Executive Officer | |
| Date | December 17, 2010 |
| By | /s/ Gregory K. Hinkle |
| Gregory K. Hinkle | |
| Principal Financial Officer | |
| Date | December 17, 2010 |