| UNITED STATES |
| SECURITIES AND EXCHANGE COMMISSION |
| Washington, D.C. 20549 |
| |
FORM N-CSR |
| |
CERTIFIED SHAREHOLDER REPORT OF REGISTERED |
MANAGEMENT INVESTMENT COMPANIES |
| |
| |
| |
| Investment Company Act File Number: 811-5833 |
|
| |
| T. Rowe Price Institutional International Funds, Inc. |
|
| (Exact name of registrant as specified in charter) |
| |
| 100 East Pratt Street, Baltimore, MD 21202 |
|
| (Address of principal executive offices) |
| |
| David Oestreicher |
| 100 East Pratt Street, Baltimore, MD 21202 |
|
| (Name and address of agent for service) |
| |
| |
| Registrant’s telephone number, including area code: (410) 345-2000 |
| |
| |
| Date of fiscal year end: October 31 |
| |
| |
| Date of reporting period: April 30, 2011 |
Item 1: Report to Shareholders Institutional Global Large-Cap
Equity Fund | April 30, 2011 |
• Global equities generated solid gains in the last six months, driven by steadily improving corporate profits and a pickup in global demand.
• The fund’s large allocation to emerging markets, which lagged developed markets, moderated gains—especially in the financials sector, which faced tougher headwinds from higher interest rates.
• Market valuations are very reasonable in many markets, though we are mindful that as we enter the third year of a bull market, stock selection will be increasingly important.
• We believe earnings growth in the developed world will begin to slow over the next 12 months due in part to the pressures of higher inflation. We have rotated out of value holdings on recent strength and added to durable growth stocks to insulate the fund from this trend.
The views and opinions in this report were current as of April 30, 2011. They are not guarantees of performance or investment results and should not be taken as investment advice. Investment decisions reflect a variety of factors, and the managers reserve the right to change their views about individual stocks, sectors, and the markets at any time. As a result, the views expressed should not be relied upon as a forecast of the fund’s future investment intent. The report is certified under the Sarbanes-Oxley Act, which requires mutual funds and other public companies to affirm that, to the best of their knowledge, the information in their financial reports is fairly and accurately stated in all material respects.
Manager’s Letter
T. Rowe Price Institutional Global Large-Cap Equity Fund
Dear Investor
Global stocks generated healthy gains during the last six months, driven by improving corporate profits, both in the U.S. and abroad, and a broad pickup in global aggregate demand. The U.S. recovery has been helped by easy monetary policy and a cheaper dollar, which has improved trading conditions. European stocks advanced substantially, particularly in the Nordic region, as attractive valuations outweighed ongoing concerns regarding muted economic growth, sovereign risks, and austerity measures. Japan suffered a devastating earthquake, which in the near term will compound the country’s low-growth economic profile. At the other end of the spectrum, emerging markets grew at a robust pace, heightening inflation concerns and forcing central banks to ratchet up interest rates. Overall, global improvements resulted in a strong gain for the fund.
Performance Review
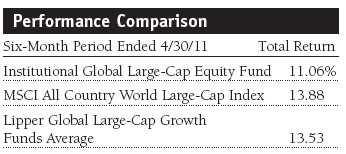
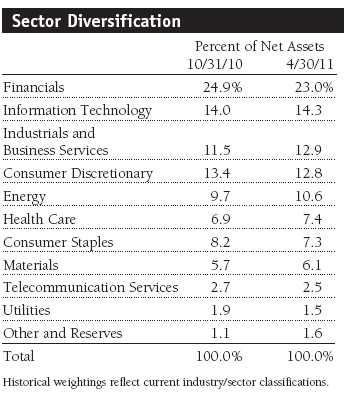
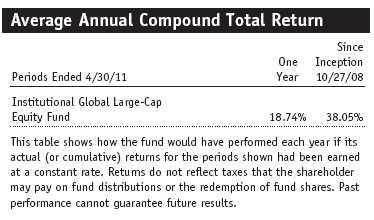
Your fund returned 11.06% during the six-month period ended April 30, 2011, lagging the MSCI All Country World Large-Cap Index and the Lipper Global Large-Cap Growth Funds Average, as shown in the Performance Comparison table. Stock selection among financials, particularly in emerging markets, was largely responsible for the fund’s underperformance versus the index and the Lipper average. The industrials and business services, consumer discretionary, and consumer staples sectors also lagged. Health care, information technology, and telecommunication services outperformed the index and peer group.
Market Review
Global markets generated solid gains over the past six months, with U.S. stocks performing better than most developed markets. Nordic countries turned in the top performance, helping European stocks record a strong gain as investors sought depressed valuations even amid signs that Europe’s recovery may be extremely uneven. Many global companies have weathered the economic downturn artfully, with record amounts of cash on their balance sheets and the wherewithal to refinance debt at bargain interest rates. Nonetheless, macroeconomic conditions continue to dampen spirits. In the U.S., policymakers remain at odds over reducing the country’s structural deficit and raising its debt ceiling, both of which make investors nervous about the dollar’s future.
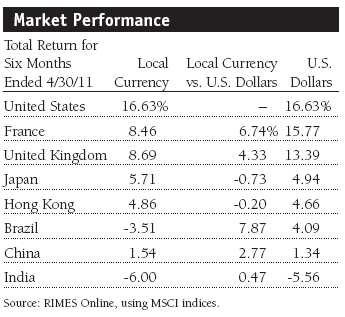
Europe continues to be beset by sovereign debt issues, with Greece, Portugal, and Ireland the most notable examples of enfeebled economies. The United Kingdom is no exception to the theme of low growth and high debt, and the government’s proposed austerity program, which includes £111 billion of spending cuts and tax increases, came under pressure following news that first-quarter gross domestic product grew by a paltry 0.5%. While an improvement from the fourth quarter, the figure reinforced the view that the economy remains fragile. Emerging markets faced a very different headwind, namely rapid expansion, which forced central banks to raise interest rates in an attempt to douse their overheating economies. The measures appeared to gain traction, and, as a consequence, emerging markets had a smaller gain than most international indexes. Japan struggled as investors fled equities following the tragic earthquake on March 11, 2011, and its devastating aftermath. However, bargain hunters bid up stocks late in the period.
Europe’s more hawkish stance on inflation helped the euro rally to its highest level against the dollar since the onset of the Greek debt crisis last spring. The Federal Reserve continued its policy of quantitative easing, saying it was committed to fulfilling its purchase of $600 billion in long-term Treasuries by June 2011. While some policymakers have suggested that the Fed needs to engineer another round of easing, possibly in the form of mortgage securities purchases, others have argued for increasing rates to contain rising prices. However, the Fed offered no signal that it would guide short-term interest rates higher in the coming months. While energy and commodity prices have pushed up inflation in recent months, the central bank said it expected these effects to be “transitory.” In contrast, the European Central Bank announced its first rate increase since mid-2008, expressing concern that rising commodity prices could cause price gains in other areas of the economy.
Portfolio Review and Strategy
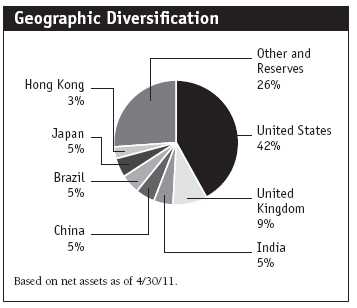
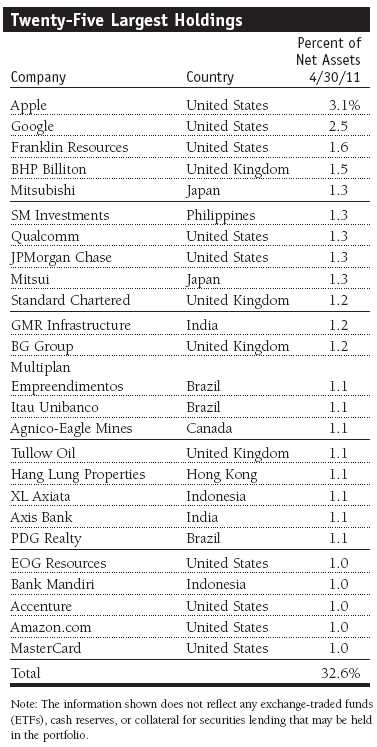
Last year we made major changes to the fund’s geographical allocation that we largely maintained during the last six months. The changes included an increase in the fund’s exposure to rapidly growing emerging markets economies and a reduction to some developed markets, notably Japan and Europe. The strategic decision to increase our emerging markets share—representing 29% of the fund, or twice the benchmark level—is based on the view that these markets offer substantial long-term opportunity for growth. We are mindful that such a large overweight could skew overall results, with both positive and negative consequences. However, as long-term investors, we are firmly committed to investing in stocks in emerging markets where we see a compelling set of developments that we believe will propel markets higher over time. To cite one example of this potential, emerging markets gross domestic product is projected to rise from 34% of global output to 49% in just nine years. However, the last six months illustrated that a strong allocation to one region can result in short-term gyrations. While emerging markets produced solid gains, our large exposure to the region compared with many of our peer groups was a drag on relative performance as some developing markets struggled in the face of inflation headwinds. In absolute terms, India suffered the most, while China eked out a small gain and Brazil fared better.
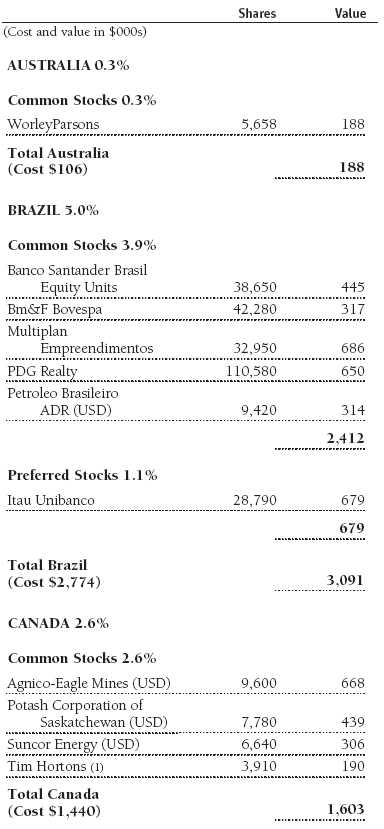
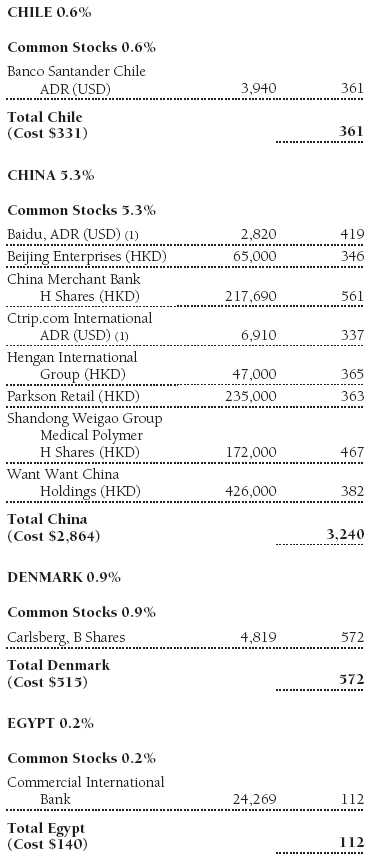
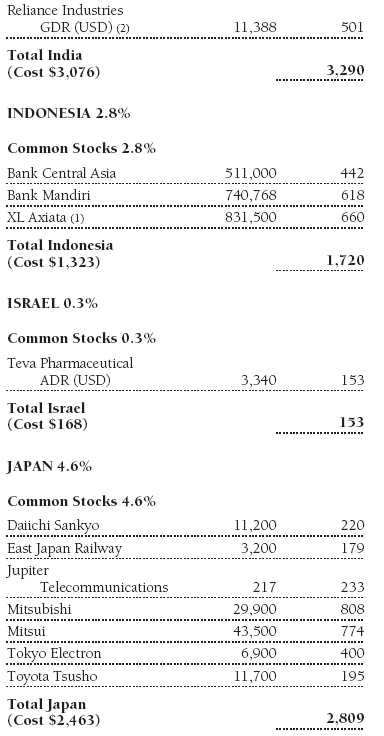
A number of the fund’s commercial banks weighed on performance. Banks with exposure to the Middle East and North Africa were particularly poor performers, including Turkiye Garanti Bankasi (Turkey), which remains a fund holding with strong prospects, and Commercial International Bank (Egypt), which we reduced after Egypt’s market reopened following the political upheaval in that country. Nonetheless, we believe that many of the headwinds facing emerging markets financial institutions are temporary, and, in some cases, we have taken advantage of a sell-off to purchase additional shares of high-quality stocks. Indeed, our emerging markets financials allocation remains a large overweight as many of the holdings are highly leveraged to consumer loan growth. One example is Bank Mandiri (Indonesia), a solid institution in a country with favorable demographics and a relatively healthy financial system. CIMB Group, the leading banking franchise in Malaysia, Thailand, and Indonesia, also has bright prospects. It is a well-managed, well-capitalized bank positioned to benefit from the high-growth economies in Southeast Asia. Similarly, we bought Banco Santander Chile (Chile) and Credicorp (Peru), which we believe should partially benefit from commodity inflation in their respective countries. We continue to focus on high-quality financials with strong exposure to emerging markets. Skandinaviska Enskilda Banken (Sweden) fills this bill, and the well-managed bank also serves customers in the Nordic region and throughout emerging Europe, making it a global player. (Please refer to the portfolio of investments for a complete list of holdings and the amount each represents in the portfolio.)
Our consumer discretionary holdings remain a core part of the fund as we see a number of opportunities in media and Internet retail, such as Amazon.com (U.S.), which continues to perform well on the back of its popular Kindle e-reader. During the period, we took advantage of News Corporation’s bid to purchase British Sky Broadcasting (U.K.) by selling shares for a gain and eliminating our position. One of the fund’s top performers was Hyundai Mobis (South Korea), an automotive parts and equipment manufacturer that is benefiting from the surge in emerging markets demand. PDG Realty (Brazil) performed poorly during the period as monetary tightening hampered the homebuilder’s loan growth. However, prospects for PDG are considerable, as approximately 60% of the low-cost housing that the company builds is supported in some measure by government subsidies. We believe the company could grow by 20% per year. We also favor hotels, which should benefit from improving economic conditions. Our holdings include Accor (France) and Marriott (U.S.), both of which are high-quality, well-managed companies that have limited direct exposure to faltering real estate markets.
Our holdings in information technology included some solid contributors. Notable winners within the sector were Apple (U.S.) and Baidu (China). Apple has been expanding its market share and experiencing sales growth across its portfolio of products, including the iPad and iPhone 4, during the year. Baidu is the premier search engine in China, where the growth in Internet users provides a tailwind to its momentum. Mobile Internet and e-commerce, in particular, have exhibited strong growth trends. Qualcomm (U.S.) and Juniper Networks (U.S.) also performed well. They have strong intellectual property and make products that we believe should provide sustainable growth through multiple phases of the technology cycle. Google stumbled due to a lackluster earnings performance, though it is on pace to deliver solid growth.
We believe that the economic expansion will favor many of the later-cycle companies we own in the industrials sector, including Schneider Electric (France) and Boeing (U.S.), which has a healthy backlog of orders for its new Dreamliner aircraft. GMR Infrastructure (India) and DP World (UAE) should continue benefiting from the strong demand for transportation infrastructure projects in their countries. Similarly, we hold Jaiprakash (India), an engineering and construction conglomerate. We also own Adani Enterprises (India), a diversified industrial company that is particularly attractive due to its interest in the Mundra Port, India’s largest private port.
Our energy holdings generated strong results. While we hold most of our positions for long durations, we took advantage of the sell-off in Japan to buy quality oil and gas exploration company Impex (Japan). The company represents part of the solution to Japan’s energy needs as nuclear capacity is reduced, and its exposure to other markets, including Brazil, gives it an opportunity to benefit from production growth. After our purchase, the stock rose by more than one-third, and we decided to take the profits. We made other adjustments to the portfolio, including buying Cimarex Energy (U.S.), an oil and gas company with operations in the South and West. While it weighed on performance, we believe it has good prospects. Continental Resources (U.S.) also declined but we believe the exploration company will benefit from its extensive leasing operations.
Within the materials sector, we eliminated our position in Freeport-McMoRan Copper & Gold (U.S.) due to the runup in materials prices. The fund benefited from owning chemicals company Potash Corporation of Saskatchewan (Canada), which continued to perform well due to the increase in commodity prices, and we retained our stake in BHP Billiton (U.K.), the most diversified natural resources company in the world. We initiated a position in Agnico-Eagle Mines (Canada), which should benefit from continued strength in gold prices.
Our health care holdings performed well, though we are slightly underweight to the sector due to continuing earnings pressures on many pharmaceuticals. We generally are predisposed toward generic drug producers that stand to benefit from U.S. health care reform and increased global demand. We added a position in Celgene (U.S.), one of the few big pharmaceutical companies offering a strong growth outlook.
Outlook
The global economy continues to recover from the shock waves of 2008, with developed economies on a growth trajectory featuring a manufacturing rebound, increased hiring, and improved consumer spending. Corporate balance sheets are in better financial shape, and profits have surprised on the upside over the past several quarters. At the same time, the housing market in the U.S. and parts of Europe remains dismal with falling prices, oversupply, and increasing foreclosures. As a result, a catalyst of consumer spending that historically has been at the leading edge of a recovery is in the doldrums. The muted state of consumer demand is part of the reason that unemployment has not receded more rapidly, and both corporations and consumers remain somewhat cautious. Europe, too, has rebounded, although markets could remain volatile in the face of sovereign debt challenges that have not fully played out. Questions remain over whether austerity measures in some countries may be too painful for politicians to fully implement.
Meanwhile, emerging markets continue to generate strong domestic growth, which is a long-term trend that should boost living standards and stock prices. As we indicated six months ago, our positioning in emerging markets embodies opportunities and risks. The portfolio, we said, could see short-term fluctuations and an underperformance against its benchmark if investors perceive that emerging markets are losing steam. However, the long-term opportunities in the emerging regions are formidable, and we have purchased high-quality, durable companies that should benefit over the long term, given the positive trends in demographics, urbanization, and consumer demand.
Over the past several months, we reduced our exposure to pure valuation-driven investments to their lowest levels since the fund’s inception in 2008. We have rotated those holdings into what we believe are durable and higher-growth stocks in order to provide insulation against inflationary trends and slowing earnings growth.
We have benefited from extraordinary gains in equity markets since 2009, and we caution investors that the future trajectory may be uneven. As earnings growth in the developed world slows, stock selection will become increasingly important. We will continue to focus on high-quality companies with growing franchises, strong cash flows, and solid balance sheets and strive to identify businesses that we believe can prosper during the next phase of the economic cycle.
As always, thank you for investing with T. Rowe Price.
Respectfully submitted,

R. Scott Berg
Chairman of the fund’s Investment Advisory Committee
May 12, 2011
The committee chairman has day-to-day responsibility for managing the portfolio and works with committee members in developing and executing the fund’s investment program.
| Risks of International Investing |
Funds that invest overseas generally carry more risk than funds that invest strictly in U.S. assets. Funds investing in a single country or in a limited geographic region tend to be riskier than more-diversified funds. Risks can result from varying stages of economic and political development; differing regulatory environments, trading days, and accounting standards; and higher transaction costs of non-U.S. markets. Non-U.S. investments are also subject to currency risk, or a decline in the value of a foreign currency versus the U.S. dollar, which reduces the dollar value of securities denominated in that currency.
Lipper averages: The average of available mutual fund performance returns in defined categories as tracked by Lipper Inc.
MSCI All Country World Large-Cap Index: A capitalization-weighted index of stocks from developed and emerging markets worldwide.
Portfolio Highlights
Performance and Expenses
T. Rowe Price Institutional Global Large-Cap Equity Fund
This chart shows the value of a hypothetical $1 million investment in the fund over the past 10 fiscal year periods or since inception (for funds lacking 10-year records). The result is compared with benchmarks, which may include a broad-based market index and a peer group average or index. Market indexes do not include expenses, which are deducted from fund returns as well as mutual fund averages and indexes.

Fund Expense Example
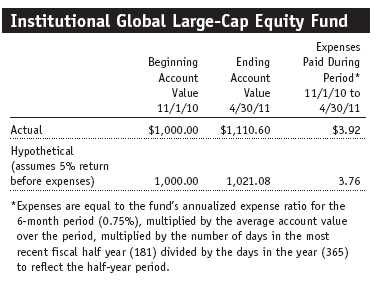
As a mutual fund shareholder, you may incur two types of costs: (1) transaction costs, such as redemption fees or sales loads, and (2) ongoing costs, including management fees, distribution and service (12b-1) fees, and other fund expenses. The following example is intended to help you understand your ongoing costs (in dollars) of investing in the fund and to compare these costs with the ongoing costs of investing in other mutual funds. The example is based on an investment of $1,000 invested at the beginning of the most recent six-month period and held for the entire period.
Actual Expenses
The first line of the following table (“Actual”) provides information about actual account values and actual expenses. You may use the information in this line, together with your account balance, to estimate the expenses that you paid over the period. Simply divide your account value by $1,000 (for example, an $8,600 account value divided by $1,000 = 8.6), then multiply the result by the number in the first line under the heading “Expenses Paid During Period” to estimate the expenses you paid on your account during this period.
Hypothetical Example for Comparison Purposes
The information on the second line of the table (“Hypothetical”) is based on hypothetical account values and expenses derived from the fund’s actual expense ratio and an assumed 5% per year rate of return before expenses (not the fund’s actual return). You may compare the ongoing costs of investing in the fund with other funds by contrasting this 5% hypothetical example and the 5% hypothetical examples that appear in the shareholder reports of the other funds. The hypothetical account values and expenses may not be used to estimate the actual ending account balance or expenses you paid for the period.
You should also be aware that the expenses shown in the table highlight only your ongoing costs and do not reflect any transaction costs, such as redemption fees or sales loads. Therefore, the second line of the table is useful in comparing ongoing costs only and will not help you determine the relative total costs of owning different funds. To the extent a fund charges transaction costs, however, the total cost of owning that fund is higher.

Financial Highlights
T. Rowe Price Institutional Global Large-Cap Equity Fund
(Unaudited)
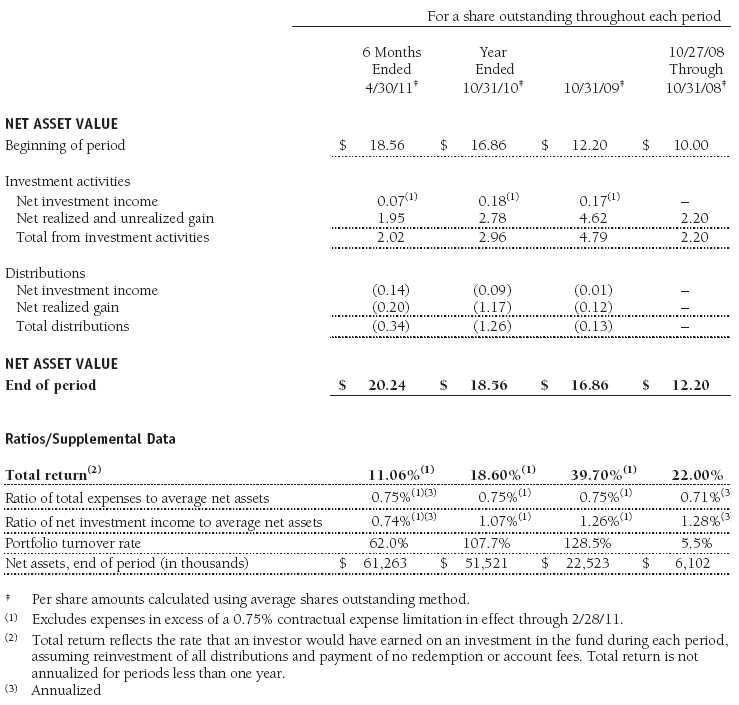
The accompanying notes are an integral part of these financial statements.
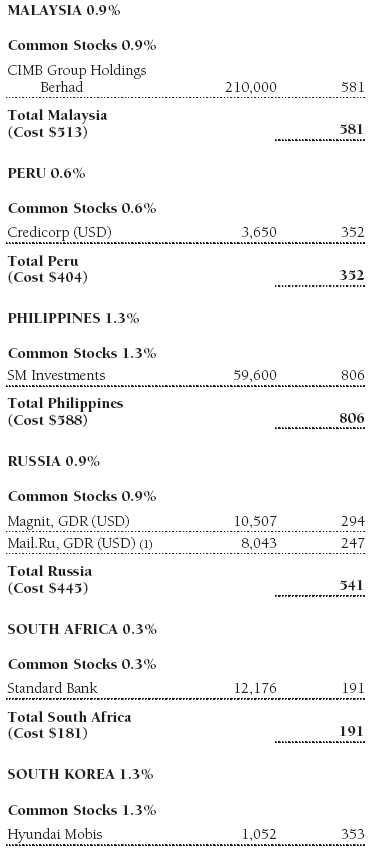
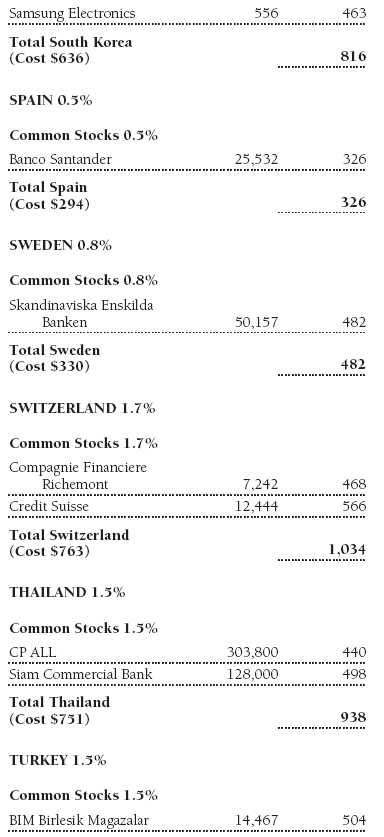
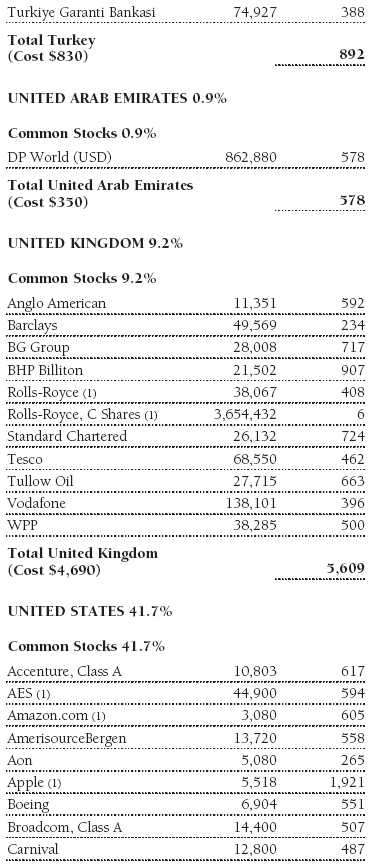
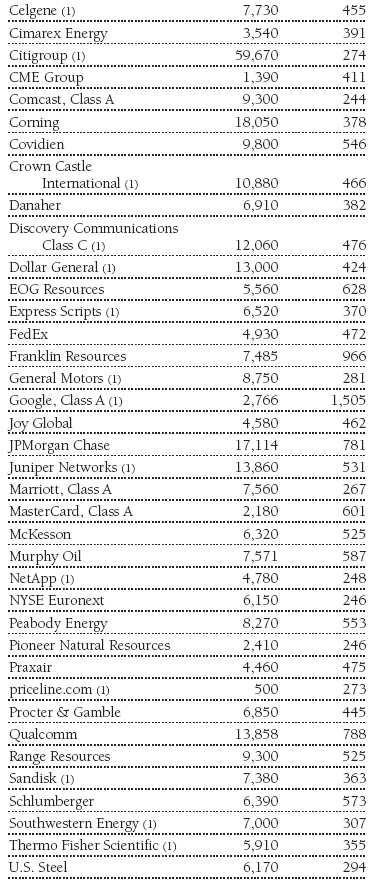
Portfolio of Investments‡
T. Rowe Price Institutional Global Large-Cap Equity Fund
April 30, 2011 (Unaudited)


The accompanying notes are an integral part of these financial statements.
Statement of Assets and Liabilities
T. Rowe Price Institutional Global Large-Cap Equity Fund
April 30, 2011 (Unaudited)
($000s, except shares and per share amounts)

The accompanying notes are an integral part of these financial statements.
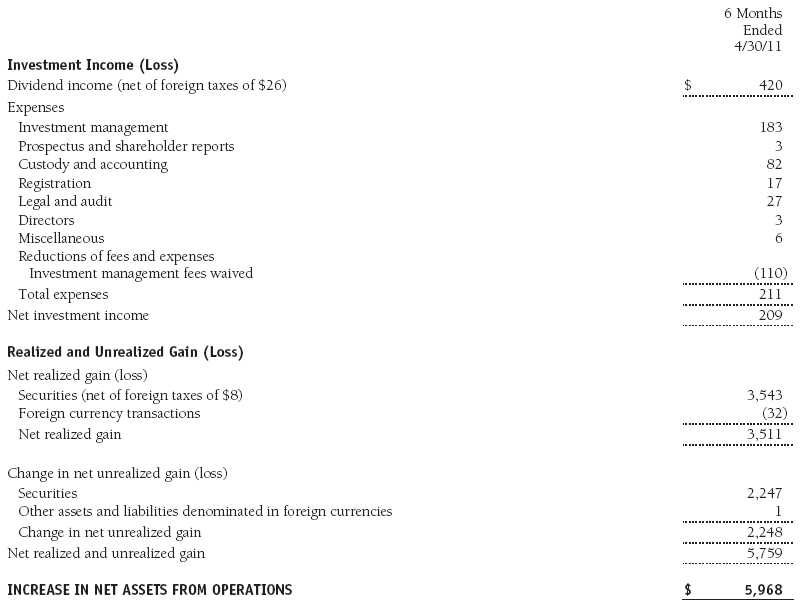
Statement of Operations
T. Rowe Price Institutional Global Large-Cap Equity Fund
(Unaudited)
($000s)
The accompanying notes are an integral part of these financial statements.
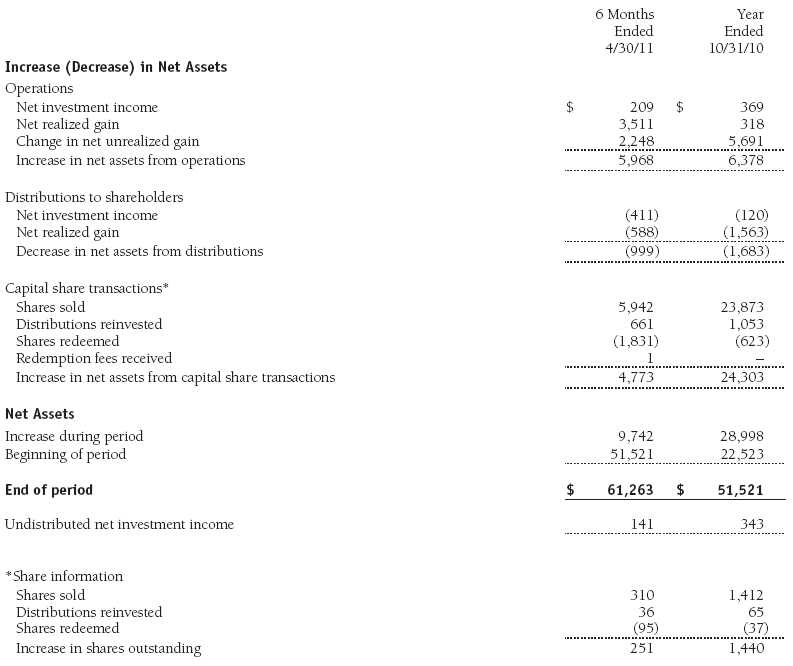
Statement of Changes in Net Assets
T. Rowe Price Institutional Global Large-Cap Equity Fund
(Unaudited)
($000s)
The accompanying notes are an integral part of these financial statements.
Notes to Financial Statements
T. Rowe Price Institutional Global Large-Cap Equity Fund
April 30, 2011 (Unaudited)
T. Rowe Price Institutional International Funds, Inc. (the corporation), is registered under the Investment Company Act of 1940 (the 1940 Act). The Institutional Global Large-Cap Equity Fund (the fund), a diversified, open-end management investment company, is one portfolio established by the corporation. The fund commenced operations on October 27, 2008. The fund seeks long-term growth of capital through investments primarily in the common stocks of large-cap companies throughout the world, including the U.S.
NOTE 1 - SIGNIFICANT ACCOUNTING POLICIES
Basis of Preparation The accompanying financial statements were prepared in accordance with accounting principles generally accepted in the United States of America (GAAP), which require the use of estimates made by management. Management believes that estimates and valuations are appropriate; however, actual results may differ from those estimates, and the valuations reflected in the accompanying financial statements may differ from the value ultimately realized upon sale or maturity.
Investment Transactions, Investment Income, and Distributions Income and expenses are recorded on the accrual basis. Dividends received from mutual fund investments are reflected as dividend income; capital gain distributions are reflected as realized gain/loss. Dividend income and capital gain distributions are recorded on the ex-dividend date. Income tax-related interest and penalties, if incurred, would be recorded as income tax expense. Investment transactions are accounted for on the trade date. Realized gains and losses are reported on the identified cost basis. Distributions to shareholders are recorded on the ex-dividend date. Income distributions are declared and paid annually. Capital gain distributions, if any, are generally declared and paid by the fund annually.
Currency Translation Assets, including investments, and liabilities denominated in foreign currencies are translated into U.S. dollar values each day at the prevailing exchange rate, using the mean of the bid and asked prices of such currencies against U.S. dollars as quoted by a major bank. Purchases and sales of securities, income, and expenses are translated into U.S. dollars at the prevailing exchange rate on the date of the transaction. The effect of changes in foreign currency exchange rates on realized and unrealized security gains and losses is reflected as a component of security gains and losses.
Credits The fund earns credits on temporarily uninvested cash balances held at the custodian, which reduce the fund’s custody charges. Custody expense in the accompanying financial statements is presented before reduction for credits.
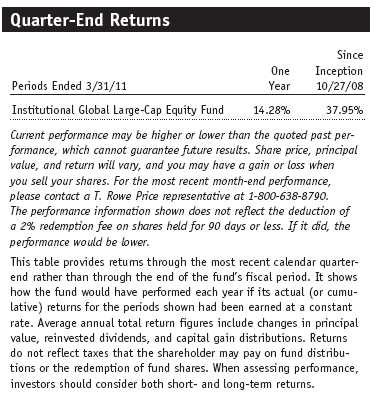
Redemption Fees A 2% fee is assessed on redemptions of fund shares held for 90 days or less to deter short-term trading and to protect the interests of long-term shareholders. Redemption fees are withheld from proceeds that shareholders receive from the sale or exchange of fund shares. The fees are paid to the fund and are recorded as an increase to paid-in capital. The fees may cause the redemption price per share to differ from the net asset value per share.
NOTE 2 - VALUATION
The fund’s financial instruments are reported at fair value as defined by GAAP. The fund determines the values of its assets and liabilities and computes its net asset value per share at the close of the New York Stock Exchange (NYSE), normally 4 p.m. ET, each day that the NYSE is open for business.
Valuation Methods Equity securities listed or regularly traded on a securities exchange or in the over-the-counter (OTC) market are valued at the last quoted sale price or, for certain markets, the official closing price at the time the valuations are made, except for OTC Bulletin Board securities, which are valued at the mean of the latest bid and asked prices. A security that is listed or traded on more than one exchange is valued at the quotation on the exchange determined to be the primary market for such security. Listed securities not traded on a particular day are valued at the mean of the latest bid and asked prices for domestic securities and the last quoted sale price for international securities.
Investments in mutual funds are valued at the mutual fund’s closing net asset value per share on the day of valuation.
Other investments, including restricted securities, and those financial instruments for which the above valuation procedures are inappropriate or are deemed not to reflect fair value are stated at fair value as determined in good faith by the T. Rowe Price Valuation Committee, established by the fund’s Board of Directors.
For valuation purposes, the last quoted prices of non-U.S. equity securities may be adjusted under the circumstances described below. If the fund determines that developments between the close of a foreign market and the close of the NYSE will, in its judgment, materially affect the value of some or all of its portfolio securities, the fund will adjust the previous closing prices to reflect what it believes to be the fair value of the securities as of the close of the NYSE. In deciding whether it is necessary to adjust closing prices to reflect fair value, the fund reviews a variety of factors, including developments in foreign markets, the performance of U.S. securities markets, and the performance of instruments trading in U.S. markets that represent foreign securities and baskets of foreign securities. A fund may also fair value securities in other situations, such as when a particular foreign market is closed but the fund is open. The fund uses outside pricing services to provide it with closing prices and information to evaluate and/or adjust those prices. The fund cannot predict how often it will use closing prices and how often it will determine it necessary to adjust those prices to reflect fair value. As a means of evaluating its security valuation process, the fund routinely compares closing prices, the next day’s opening prices in the same markets, and adjusted prices.
Valuation Inputs Various inputs are used to determine the value of the fund’s financial instruments. These inputs are summarized in the three broad levels listed below:
Level 1 – quoted prices in active markets for identical financial instruments
Level 2 – observable inputs other than Level 1 quoted prices (including, but not limited to, quoted prices for similar financial instruments, interest rates, prepayment speeds, and credit risk)
Level 3 – unobservable inputs
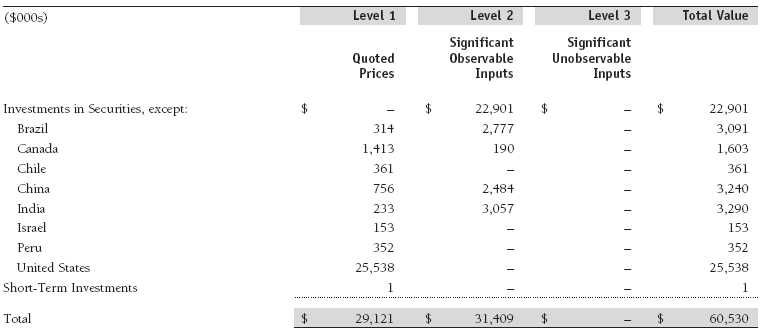
Observable inputs are those based on market data obtained from sources independent of the fund, and unobservable inputs reflect the fund’s own assumptions based on the best information available. The input levels are not necessarily an indication of the risk or liquidity associated with financial instruments at that level. For example, non-U.S. equity securities actively traded in foreign markets generally are reflected in Level 2 despite the availability of closing prices because the fund evaluates and determines whether those closing prices reflect fair value at the close of the NYSE or require adjustment, as described above. The following table summarizes the fund’s financial instruments, based on the inputs used to determine their values on April 30, 2011:
NOTE 3 - OTHER INVESTMENT TRANSACTIONS
Consistent with its investment objective, the fund engages in the following practices to manage exposure to certain risks and/or to enhance performance. The investment objective, policies, program, and risk factors of the fund are described more fully in the fund’s prospectus and Statement of Additional Information.
Emerging Markets At April 30, 2011, approximately 29% of the fund’s net assets were invested, either directly or through investments in T. Rowe Price institutional funds, in securities of companies located in emerging markets, securities issued by governments of emerging market countries, and/or securities denominated in or linked to the currencies of emerging market countries. Emerging market securities are often subject to greater price volatility, less liquidity, and higher rates of inflation than U.S. securities. In addition, emerging markets may be subject to greater political, economic and social uncertainty, and differing regulatory environments that may potentially impact the fund’s ability to buy or sell certain securities or repatriate proceeds to U.S. dollars.
Restricted Securities The fund may invest in securities that are subject to legal or contractual restrictions on resale. Prompt sale of such securities at an acceptable price may be difficult and may involve substantial delays and additional costs.
Other Purchases and sales of portfolio securities other than short-term securities aggregated $38,458,000 and $34,691,000, respectively, for the six months ended April 30, 2011.
NOTE 4 - FEDERAL INCOME TAXES
No provision for federal income taxes is required since the fund intends to continue to qualify as a regulated investment company under Subchapter M of the Internal Revenue Code and distribute to shareholders all of its taxable income and gains. Distributions determined in accordance with federal income tax regulations may differ in amount or character from net investment income and realized gains for financial reporting purposes. Financial reporting records are adjusted for permanent book/tax differences to reflect tax character but are not adjusted for temporary differences. The amount and character of tax-basis distributions and composition of net assets are finalized at fiscal year-end; accordingly, tax-basis balances have not been determined as of the date of this report.
At April 30, 2011, the cost of investments for federal income tax purposes was $51,076,000. Net unrealized gain aggregated $9,459,000 at period-end, of which $9,877,000 related to appreciated investments and $418,000 related to depreciated investments.
NOTE 5 - FOREIGN TAXES
The fund is subject to foreign income taxes imposed by certain countries in which it invests. Acquisition of certain foreign currencies related to security transactions are also subject to tax. Additionally, capital gains realized by the fund upon disposition of securities issued in or by certain foreign countries are subject to capital gains tax imposed by those countries. All taxes are computed in accordance with the applicable foreign tax law, and, to the extent permitted, capital losses are used to offset capital gains. Taxes attributable to income are accrued by the fund as a reduction of income. Taxes incurred on the purchase of foreign currencies are recorded as realized loss on foreign currency transactions. Current and deferred tax expense attributable to net capital gains is reflected as a component of realized and/or change in unrealized gain/loss on securities in the accompanying financial statements. At April 30, 2011, the fund had no deferred tax liability attributable to foreign securities and no foreign capital loss carryforwards.
NOTE 6 - RELATED PARTY TRANSACTIONS
The fund is managed by T. Rowe Price Associates, Inc. (Price Associates), a wholly owned subsidiary of T. Rowe Price Group, Inc. (Price Group). The fund was previously managed by T. Rowe Price International, Inc. (Price International), which was merged into its parent company, Price Associates, effective at the close of business on December 31, 2010.
Thereafter, Price Associates assumed responsibility for all of Price International’s existing investment management contracts, and Price International ceased all further operations. The corporate reorganization was designed to simplify Price Group’s corporate structure related to its international business and was intended to result in no material changes in the nature, quality, level, or cost of services provided to the T. Rowe Price funds.
The investment management agreement between the fund and Price Associates provides for an annual investment management fee equal to 0.65% of the fund’s average daily net assets. The fee is computed daily and paid monthly.
The fund is also subject to a contractual expense limitation through February 28, 2011. During the limitation period, Price Associates is required to waive its management fee and reimburse the fund for any expenses, excluding interest, taxes, brokerage commissions, and extraordinary expenses, that would otherwise cause the fund’s ratio of annualized total expenses to average net assets (expense ratio) to exceed its expense limitation of 0.75%. For a period of three years after the date of any reimbursement or waiver, the fund is required to repay Price Associates for expenses previously reimbursed and management fees waived to the extent its net assets have grown or expenses have declined sufficiently to allow repayment without causing the fund’s expense ratio to exceed its expense limitation. Pursuant to this agreement, management fees in the amount of $110,000 were waived during the six months ended April 30, 2011. Including these amounts, management fees waived and expenses previously reimbursed by Price Associates in the amount of $575,000 remain subject to repayment by the fund at April 30, 2011.
In addition, the fund has entered into service agreements with Price Associates and a wholly owned subsidiary of Price Associates (collectively, Price). Price Associates computes the daily share price and provides certain other administrative services to the fund. T. Rowe Price Services, Inc., provides shareholder and administrative services in its capacity as the fund’s transfer and dividend disbursing agent. For the six months ended April 30, 2011, expenses incurred pursuant to these service agreements were $60,000 for Price Associates and less than $1,000 for T. Rowe Price Services, Inc. The total amount payable at period-end pursuant to these service agreements is reflected as Due to Affiliates in the accompanying financial statements.
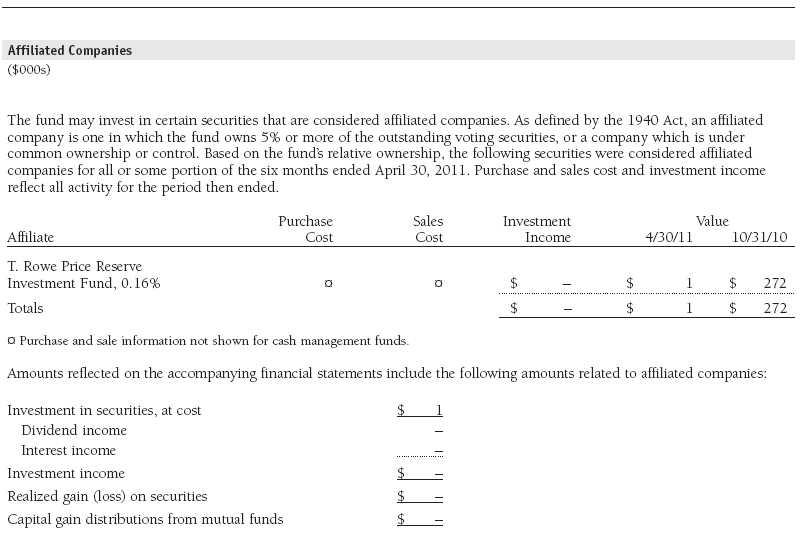
The fund may invest in the T. Rowe Price Reserve Investment Fund and the T. Rowe Price Government Reserve Investment Fund (collectively, the T. Rowe Price Reserve Investment Funds), open-end management investment companies managed by Price Associates and considered affiliates of the fund. The T. Rowe Price Reserve Investment Funds are offered as cash management options to mutual funds, trusts, and other accounts managed by Price Associates and/or its affiliates and are not available for direct purchase by members of the public. The T. Rowe Price Reserve Investment Funds pay no investment management fees.
As of April 30, 2011, T. Rowe Price Group, Inc., and/or its wholly owned subsidiaries owned 500,000 shares of the fund, representing 17% of the fund’s net assets.
| Information on Proxy Voting Policies, Procedures, and Records |
A description of the policies and procedures used by T. Rowe Price funds and portfolios to determine how to vote proxies relating to portfolio securities is available in each fund’s Statement of Additional Information, which you may request by calling 1-800-225-5132 or by accessing the SEC’s website, sec.gov. The description of our proxy voting policies and procedures is also available on our website, troweprice.com. To access it, click on the words “Our Company” at the top of our corporate homepage. Then, when the next page appears, click on the words “Proxy Voting Policies” on the left side of the page.
Each fund’s most recent annual proxy voting record is available on our website and through the SEC’s website. To access it through our website, follow the directions above, then click on the words ��Proxy Voting Records” on the right side of the Proxy Voting Policies page.
| How to Obtain Quarterly Portfolio Holdings |
The fund files a complete schedule of portfolio holdings with the Securities and Exchange Commission for the first and third quarters of each fiscal year on Form N-Q. The fund’s Form N-Q is available electronically on the SEC’s website (sec.gov); hard copies may be reviewed and copied at the SEC’s Public Reference Room, 450 Fifth St. N.W., Washington, DC 20549. For more information on the Public Reference Room, call 1-800-SEC-0330.
| Approval of Investment Management Agreement |
On March 9, 2011, the fund’s Board of Directors (Board) unanimously approved the continuation of the investment advisory contract (Contract) between the fund and its investment advisor, T. Rowe Price Associates, Inc. (Advisor). The Board considered a variety of factors in connection with its review of the Contract, also taking into account information provided by the Advisor during the course of the year, as discussed below:
Services Provided by the Advisor
The Board considered the nature, quality, and extent of the services provided to the fund by the Advisor. These services included, but were not limited to, management of the fund’s portfolio and a variety of related activities, as well as financial and administrative services, reporting, and communications. The Board also reviewed the background and experience of the Advisor’s senior management team and investment personnel involved in the management of the fund. The Board noted that a restructuring involving the Advisor and certain of its affiliated investment advisors led to a restatement of the fund’s investment advisory contract, effective at the close of business on December 31, 2010. This restructuring, which resulted in T. Rowe Price Associates, Inc., becoming the fund’s new investment advisor, had been determined by the Board at a meeting in October 2010 not to diminish the nature, quality, or level of services provided to the fund or to materially change the manner in which advisory services were to be provided. The Board concluded that it was satisfied with the nature, quality, and extent of the services provided by the Advisor.
Investment Performance of the Fund
The Board reviewed the fund’s average annual total returns over the one-year and since-inception periods, as well as the fund’s year-by-year returns, and compared these returns with a wide variety of previously agreed upon comparable performance measures and market data, including those supplied by Lipper and Morningstar, which are independent providers of mutual fund data. On the basis of this evaluation and the Board’s ongoing review of investment results, and factoring in the relative market conditions during certain of the performance periods, the Board concluded that the fund’s performance was satisfactory.
Costs, Benefits, Profits, and Economies of Scale
The Board reviewed detailed information regarding the revenues received by the Advisor under the Contract and other benefits that the Advisor (and its affiliates) may have realized from its relationship with the fund, including research received under “soft dollar” agreements and commission-sharing arrangements with broker-dealers. The Board considered that the Advisor may receive some benefit from soft-dollar arrangements pursuant to which research is received from broker-dealers that execute the applicable fund’s portfolio transactions. The Board also received information on the estimated costs incurred and profits realized by the Advisor and its affiliates from advising T. Rowe Price mutual funds. The Board did not review information regarding profits realized from managing the fund in particular because the fund had not achieved sufficient scale in terms of portfolio asset size to produce meaningful profit margin percentages. Under the Contract, the fund pays a fee to the Advisor based on the fund’s average daily net assets. The Board concluded that the Advisor’s profits were reasonable in light of the services provided to the fund. The Board also considered whether the fund or other funds benefit under the fee levels set forth in the Contract from any economies of scale realized by the Advisor. The Board concluded that, based on the profitability data it reviewed, the advisory fee structure for the fund continued to provide for a reasonable sharing of benefits from any economies of scale with the fund’s investors.
Fees
The Board reviewed the fund’s management fee rate, operating expenses, and total expense ratio and compared them with fees and expenses of other comparable funds based on information and data supplied by Lipper. The information provided to the Board indicated that the fund’s management fee rate (after including reductions of the management fee rate that resulted from applicable fee waivers or expenses paid by the Advisor) and total expense ratio were below the median for comparable funds. The Board also reviewed the fee schedules for institutional accounts of the Advisor and its affiliates with similar mandates. Management provided the Board with information about the Advisor’s responsibilities and services provided to institutional account clients, which are more limited than its responsibilities for the fund and other T. Rowe Price mutual funds that it advises, and showing that the Advisor performs significant additional services and assumes greater risk for the fund and other T. Rowe Price mutual funds that it advises than it does for institutional account clients. On the basis of the information provided, the Board concluded that the fees paid by the fund under the Contract were reasonable.
Approval of the Contract
As noted, the Board approved the continuation of the Contract. No single factor was considered in isolation or to be determinative to the decision. Rather, the Board was assisted by the advice of independent legal counsel and concluded, in light of a weighting and balancing of all factors considered, that it was in the best interests of the fund to approve the continuation of the Contract (including the fees to be charged for services thereunder).
Item 2. Code of Ethics.
A code of ethics, as defined in Item 2 of Form N-CSR, applicable to its principal executive officer, principal financial officer, principal accounting officer or controller, or persons performing similar functions is filed as an exhibit to the registrant’s annual Form N-CSR. No substantive amendments were approved or waivers were granted to this code of ethics during the registrant’s most recent fiscal half-year.
Item 3. Audit Committee Financial Expert.
Disclosure required in registrant’s annual Form N-CSR.
Item 4. Principal Accountant Fees and Services.
Disclosure required in registrant’s annual Form N-CSR.
Item 5. Audit Committee of Listed Registrants.
Not applicable.
Item 6. Investments.
(a) Not applicable. The complete schedule of investments is included in Item 1 of this Form N-CSR.
(b) Not applicable.
Item 7. Disclosure of Proxy Voting Policies and Procedures for Closed-End Management Investment Companies.
Not applicable.
Item 8. Portfolio Managers of Closed-End Management Investment Companies.
Not applicable.
Item 9. Purchases of Equity Securities by Closed-End Management Investment Company and Affiliated Purchasers.
Not applicable.
Item 10. Submission of Matters to a Vote of Security Holders.
Not applicable.
Item 11. Controls and Procedures.
(a) The registrant’s principal executive officer and principal financial officer have evaluated the registrant’s disclosure controls and procedures within 90 days of this filing and have concluded that the registrant’s disclosure controls and procedures were effective, as of that date, in ensuring that information required to be disclosed by the registrant in this Form N-CSR was recorded, processed, summarized, and reported timely.
(b) The registrant’s principal executive officer and principal financial officer are aware of no change in the registrant’s internal control over financial reporting that occurred during the registrant’s second fiscal quarter covered by this report that has materially affected, or is reasonably likely to materially affect, the registrant’s internal control over financial reporting.
Item 12. Exhibits.
(a)(1) The registrant’s code of ethics pursuant to Item 2 of Form N-CSR is filed with the registrant’s annual Form N-CSR.
(2) Separate certifications by the registrant's principal executive officer and principal financial officer, pursuant to Section 302 of the Sarbanes-Oxley Act of 2002 and required by Rule 30a-2(a) under the Investment Company Act of 1940, are attached.
(3) Written solicitation to repurchase securities issued by closed-end companies: not applicable.
(b) A certification by the registrant's principal executive officer and principal financial officer, pursuant to Section 906 of the Sarbanes-Oxley Act of 2002 and required by Rule 30a-2(b) under the Investment Company Act of 1940, is attached.
| | |
SIGNATURES |
| |
| | Pursuant to the requirements of the Securities Exchange Act of 1934 and the Investment |
| Company Act of 1940, the registrant has duly caused this report to be signed on its behalf by the |
| undersigned, thereunto duly authorized. |
| |
| T. Rowe Price Institutional International Funds, Inc. |
| |
| |
| |
| By | /s/ Edward C. Bernard |
| | Edward C. Bernard |
| | Principal Executive Officer |
| |
| Date | June 16, 2011 |
| |
| |
| |
| | Pursuant to the requirements of the Securities Exchange Act of 1934 and the Investment |
| Company Act of 1940, this report has been signed below by the following persons on behalf of |
| the registrant and in the capacities and on the dates indicated. |
| |
| |
| By | /s/ Edward C. Bernard |
| | Edward C. Bernard |
| | Principal Executive Officer |
| |
| Date | June 16, 2011 |
| |
| |
| |
| By | /s/ Gregory K. Hinkle |
| | Gregory K. Hinkle |
| | Principal Financial Officer |
| |
| Date | June 16, 2011 |