| UNITED STATES |
| SECURITIES AND EXCHANGE COMMISSION |
| Washington, D.C. 20549 |
| |
FORM N-CSR |
| |
CERTIFIED SHAREHOLDER REPORT OF REGISTERED |
MANAGEMENT INVESTMENT COMPANIES |
| |
| |
| |
| Investment Company Act File Number: 811-5833 |
|
| |
| T. Rowe Price Institutional International Funds, Inc. |
|
| (Exact name of registrant as specified in charter) |
| |
| 100 East Pratt Street, Baltimore, MD 21202 |
|
| (Address of principal executive offices) |
| |
| David Oestreicher |
| 100 East Pratt Street, Baltimore, MD 21202 |
|
| (Name and address of agent for service) |
| |
| |
| Registrant’s telephone number, including area code: (410) 345-2000 |
| |
| |
| Date of fiscal year end: October 31 |
| |
| |
| Date of reporting period: April 30, 2011 |
Item 1: Report to Shareholders Institutional International Core
Equity Fund | April 30, 2011 |
• International stock markets overcame a number of significant headwinds and generated robust returns over the six-month period ended April 30, 2011.
• The Institutional International Core Equity Fund outperformed the MSCI EAFE Index and its Lipper peer group average over the six-month period.
• Every sector generated positive returns for the reporting period, with the strongest performance in our energy, information technology, and materials holdings.
• Corporations have done much to improve their overall financial condition and are poised to benefit as the global economic recovery unfolds, particularly those with exposure to faster-growing emerging markets.
The views and opinions in this report were current as of April 30, 2011. They are not guarantees of performance or investment results and should not be taken as investment advice. Investment decisions reflect a variety of factors, and the managers reserve the right to change their views about individual stocks, sectors, and the markets at any time. As a result, the views expressed should not be relied upon as a forecast of the fund’s future investment intent. The report is certified under the Sarbanes-Oxley Act, which requires mutual funds and other public companies to affirm that, to the best of their knowledge, the information in their financial reports is fairly and accurately stated in all material respects.
Manager’s Letter
T. Rowe Price Institutional International Core Equity Fund
Dear Investor
International stock markets overcame significant headwinds and generated robust returns over the six-month period ended April 30, 2011. Fallout from the ongoing European debt crisis, political and social unrest in the oil-rich Middle East and North Africa region, and the devastating Japanese earthquake roiled markets throughout the period. Investors looked past these challenges, however, and focused on strong corporate earnings, cash flow, and balance sheets against the backdrop of a gradually improving global economy. The Institutional International Core Equity Fund posted attractive gains in this environment and outpaced its benchmarks.
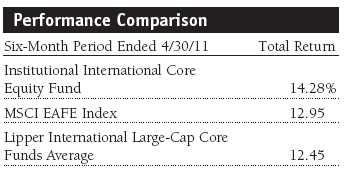
The Institutional International Core Equity Fund returned 14.28% during the six-month period ended April 30, 2011, outperforming the MSCI EAFE Index and the Lipper International Large-Cap Core Funds Average of similarly managed funds. Every sector generated positive returns for the reporting period, with the strongest absolute performance in our energy, information technology, materials, and utilities holdings. Stock selection drove the fund’s strong performance relative to the benchmark MSCI index, with particularly good results in the information technology, energy, utilities, and financials sectors.
We believe our fundamental investment process will continue to serve the fund well. We remain focused on finding investment opportunities in reasonably valued, well-established, large-capitalization companies outside the U.S. that possess earnings growth potential and good prospects for share price appreciation. Developed market countries are our primary focus, while we maintain opportunistic exposure to select emerging markets. Our country and sector allocations are driven primarily by bottom-up stock selection but also are influenced by our assessment of fundamental macroeconomic prospects.
Market Review
Developed market stocks generated strong overall returns for the six-month period. Europe was the top-performing region, with the strength of the euro versus the U.S. dollar enhancing returns. Economic data from the euro zone remain positive, and European corporate profit growth has been robust. However, the sovereign debt crisis continued to simmer. Markets in the affected countries, including Portugal, Spain, Greece, and Ireland, rose overall but were highly volatile as investors tried to determine if the European Union’s periodic efforts to keep a lid on the crisis would be successful.
Developed Asian markets saw more modest gains. The devastating earthquake and tsunami in Japan in March, along with the resulting nuclear crisis, caused Japanese equities to lag most other developed markets in the period. Hong Kong increased moderately, and Singapore shares rose nicely. Australia generated very strong gains.

Emerging markets generally trailed their developed market peers, due largely to weakness in Asia and Latin America. Chinese stocks suffered from concerns that the government would slow growth substantially in its efforts to cool inflation, which has led to sharp increases in food and housing prices. Similar concerns weighed on Brazil, Latin America’s dominant market. Overall demand in emerging markets held steady during the period, which provided some support to export-oriented developed markets.
Sector performance was positive across the board. Corporate earnings remained strong, driven by aggressive cost-cutting, increased productivity, and lean inventories. Energy shares led the way as strong demand and political unrest in the Middle East and North Africa led to higher oil prices. The industrials and business services and materials sectors also generated impressive results. Telecommunication services and utilities lagged but still posted positive returns.
Portfolio Positioning
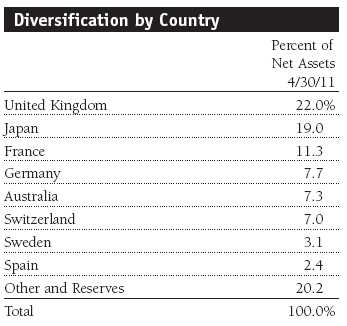
From a geographic perspective, European stocks constitute the bulk of the portfolio due to the larger number of well-established, large-cap companies operating in these markets. Although economic and debt challenges continue to plague certain countries, the corporate sector has made great strides in improving balance sheets during a period of low interest rates, which bodes well for companies that have exposure to growing markets in the emerging world. We purchased equities in the region over the period, with a focus on companies in France, Germany, and Switzerland.
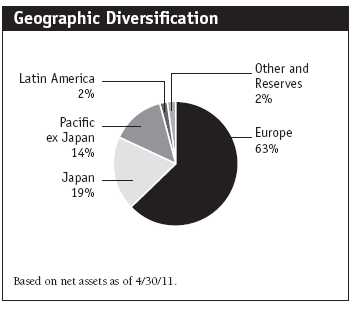
Japan is our next largest geographic allocation. The Japanese economy and markets suffered a severe shock in the wake of a massive earthquake, which resulted in a devastating tsunami and subsequent nuclear crisis. Industrial production, shipments, and exports all suffered as supply disruptions rippled through the economy. Amid depressed valuations, we added to several existing positions that should perform well as the economy begins to rebuild.
Economic expansion in the Pacific ex Japan region remained strong, driven by long-term trends, such as rising levels of urbanization, industrialization, and domestic consumption. While valuations in aggregate are still reasonable, we are mindful that on an individual stock basis they are looking stretched in some cases. We have significant exposure to Australia, which should continue to benefit from growing trade relationships with the booming Chinese and Indian economies.
Key emerging markets in China and Brazil underperformed during the period as government efforts to control the inflationary pressures arising from surging growth rates provided investors an opportunity to take a breather after years of strong performance. However, we still believe emerging economies are poised to outperform due to the superior economic fundamentals in these countries relative to developed market countries. Deleveraging is not an issue in many of these economies, employment levels are healthy, wages are on the rise, and the “wealth effect” has the potential to create robust consumer demand for years to come.
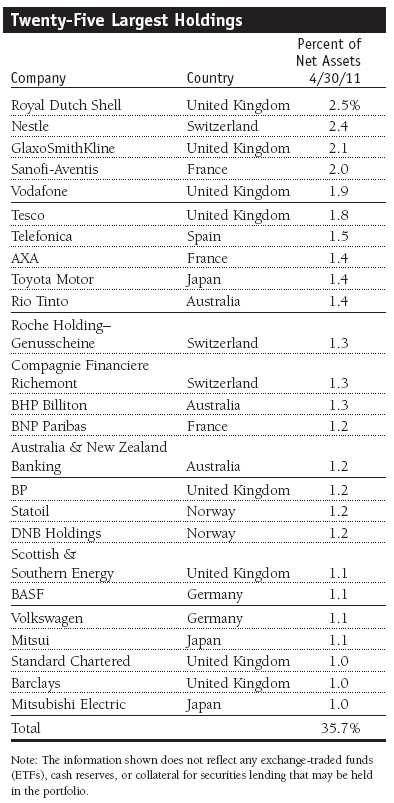
From a sector perspective, financials represent our largest sector allocation and provided the biggest positive contribution to the fund’s overall performance. Our top performers in the sector included AXA, France’s largest multiline insurer, and Swedbank, Sweden’s biggest retail bank. After three years of disappointment, AXA reported earnings in late February that were in line with expectations. The company should continue to benefit from growth in its life insurance and asset management divisions and improving operating margins. Swedbank benefited from a strong economic backdrop in the Nordic region and a significant presence in the improving economies of the Baltic region. Brazilian stock exchange Bm&F Bovespa was among the fund’s weaker performers for the period. However, the company remains fundamentally sound and should benefit from its position as the country’s dominant equities clearinghouse. Valuations in the financials sector remain very attractive, and gradually improving fundamentals should benefit share prices going forward. (Please refer to the fund’s portfolio of investments for a complete list of holdings and the amount each represents in the portfolio.)

The consumer discretionary sector is the fund’s second-largest sector allocation and our largest overweight position relative to the benchmark. Our holdings have done well over the six-month period as the global economy continued to recover and consumer spending increased. French luxury goods maker Compagnie Financiere Richemont generated attractive gains amid strong demand from Asia and a recovery in key developed markets. The company should continue to benefit over the long term as consumers from increasingly wealthy emerging markets account for a larger share of global demand. German automakers Volkswagen and BMW were also solid contributors. Automobiles remain an area of focus as we expect pent-up global demand to drive the industry, particularly in faster-growing emerging economies. Shares in Chinese department store owner Parkson Retail weighed on returns due to concerns about a slowdown in the country’s surging economic growth.
Our stock selection was particularly strong in the information technology sector, driven by positions in the communications equipment and semiconductors and semiconductor equipment industries. Alcatel-Lucent was our top absolute contributor in the sector. This French communications equipment company exceeded earnings expectations and showed significant margin improvement over the period. Major upgrades in the company’s management and organizational structure bode well for the future. ASML, which makes equipment used in semiconductor chip manufacturing, was another good performer. The company has an outstanding management team and enjoys an increasingly large technology advantage over its competitors. We eliminated our position in Konica Minolta, which has been struggling with fierce competition and slowing demand for printers and copiers.
Investment Outlook
Global stock markets continue to rebound from the lows reached during the depths of the recent economic downturn. Developed markets remain on a path toward moderate growth, with positive trends in industrial activity, employment, and consumer spending. Emerging markets continue to benefit from sensible fiscal and monetary policies, increasing industrialization, and expanding consumer wealth.
At a corporate level, companies are in much better financial shape than they have been in some time. They have strengthened their balance sheets, cut costs, and increased profit margins. Wage pressures remain largely under control despite growing employment. We have seen strong earnings so far this year, and we believe that companies should continue to profit as the global economic recovery unfolds, particularly those with exposure to growing markets in the emerging world.
While the corporate world has gone a long way toward getting its financial house in order, governments are a different story. Public debt in the developed world continues to grow at an alarming rate, fed by expensive social welfare programs and the massive economic stimulus costs. The U.S. Federal Reserve must tread carefully as the latest quantitative easing program winds down, making sure that ultra-low interest rates designed to stimulate the economy do not also lead to unintended inflation. In Europe, core economies such as France and Germany face a number of difficult decisions as they consider the ongoing financial and economic burden of bailing out debt-laden peripheral economies—decisions fraught with profound political and social consequences. Although emerging markets generally enjoy healthier fiscal positions, policymakers in these countries face their own challenges as they try to tame mounting inflationary pressures without undermining the economic growth necessary to meet the employment and material aspirations of their people.
Stock valuations remain reasonable overall, but they are approaching more normalized levels after two years of recovery. In this environment, the identification of attractive long-term investment opportunities will depend, as always, on strong fundamental research, adherence to a disciplined selection process, and careful attention to risk—qualities that have always been at the core of our investment approach. Our goal remains to seek stocks with a favorable combination of growth and valuation—companies with solid earnings prospects, sound balance sheets, and ample cash flow. We will maintain our determination and efforts to effectively employ our investment process and global resources to generate long-term gains for our investors.
Respectfully submitted,

Raymond A. Mills
Chairman of the fund’s Investment Advisory Committee
May 12, 2011
The committee chairman has day-to-day responsibility for managing the portfolio and works with committee members in developing and executing the fund’s investment program.
| Risks of International Investing |
Funds that invest overseas generally carry more risk than funds that invest strictly in U.S. assets. Funds investing in a single country or in a limited geographic region tend to be riskier than more-diversified funds. Risks can result from varying stages of economic and political development; differing regulatory environments, trading days, and accounting standards; and higher transaction costs of non-U.S. markets. Non-U.S. investments are also subject to currency risk, or a decline in the value of a foreign currency versus the U.S. dollar, which reduces the dollar value of securities denominated in that currency.
Lipper averages: The averages of available mutual fund performance returns for specified time periods in defined categories by Lipper Inc.
MSCI EAFE Index: Widely accepted as the benchmark for international stock performance (EAFE refers to Europe, Australasia, and the Far East). The index represents the major markets of the world.
Price-to-earnings (P/E) ratio: A valuation measure calculated by dividing the price of a stock by its reported earnings per share. The ratio is a measure of how much investors are willing to pay for the company’s earnings.
Portfolio Highlights
Performance and Expenses
T. Rowe Price Institutional International Core Equity Fund
Fund Expense Example
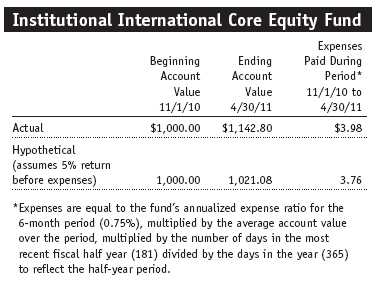
As a mutual fund shareholder, you may incur two types of costs: (1) transaction costs, such as redemption fees or sales loads, and (2) ongoing costs, including management fees, distribution and service (12b-1) fees, and other fund expenses. The following example is intended to help you understand your ongoing costs (in dollars) of investing in the fund and to compare these costs with the ongoing costs of investing in other mutual funds. The example is based on an investment of $1,000 invested at the beginning of the most recent six-month period and held for the entire period.
Actual Expenses
The first line of the following table (“Actual”) provides information about actual account values and actual expenses. You may use the information in this line, together with your account balance, to estimate the expenses that you paid over the period. Simply divide your account value by $1,000 (for example, an $8,600 account value divided by $1,000 = 8.6), then multiply the result by the number in the first line under the heading “Expenses Paid During Period” to estimate the expenses you paid on your account during this period.
Hypothetical Example for Comparison Purposes
The information on the second line of the table (“Hypothetical”) is based on hypothetical account values and expenses derived from the fund’s actual expense ratio and an assumed 5% per year rate of return before expenses (not the fund’s actual return). You may compare the ongoing costs of investing in the fund with other funds by contrasting this 5% hypothetical example and the 5% hypothetical examples that appear in the shareholder reports of the other funds. The hypothetical account values and expenses may not be used to estimate the actual ending account balance or expenses you paid for the period.
You should also be aware that the expenses shown in the table highlight only your ongoing costs and do not reflect any transaction costs, such as redemption fees or sales loads. Therefore, the second line of the table is useful in comparing ongoing costs only and will not help you determine the relative total costs of owning different funds. To the extent a fund charges transaction costs, however, the total cost of owning that fund is higher.
Financial Highlights
T. Rowe Price Institutional International Core Equity Fund
(Unaudited)
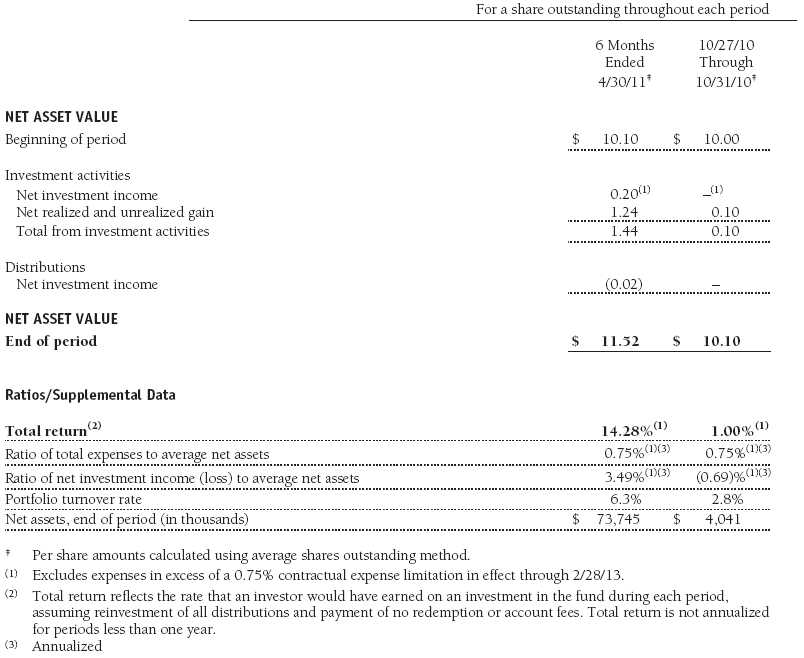
The accompanying notes are an integral part of these financial statements.
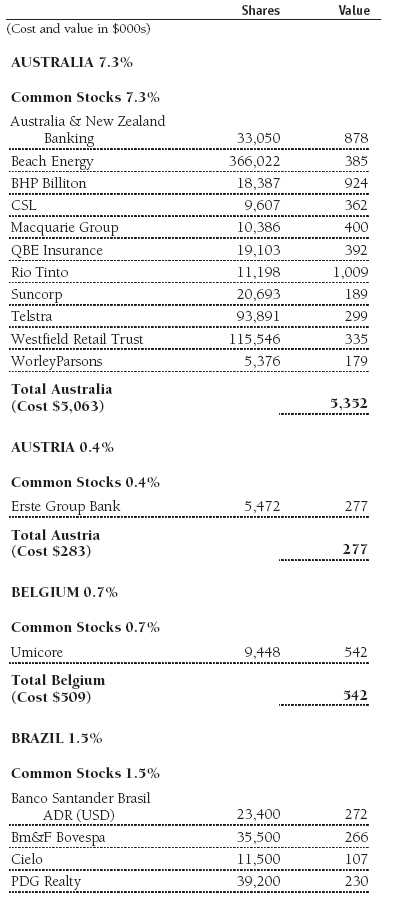
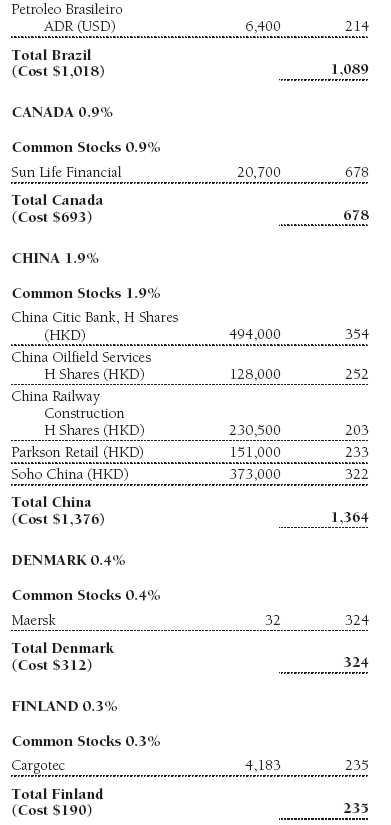
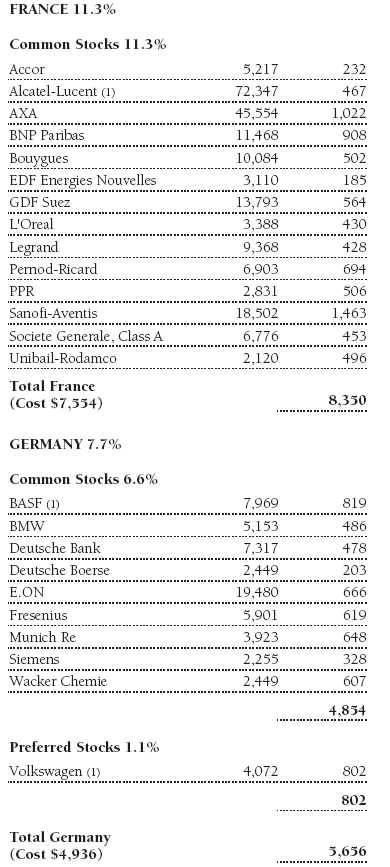
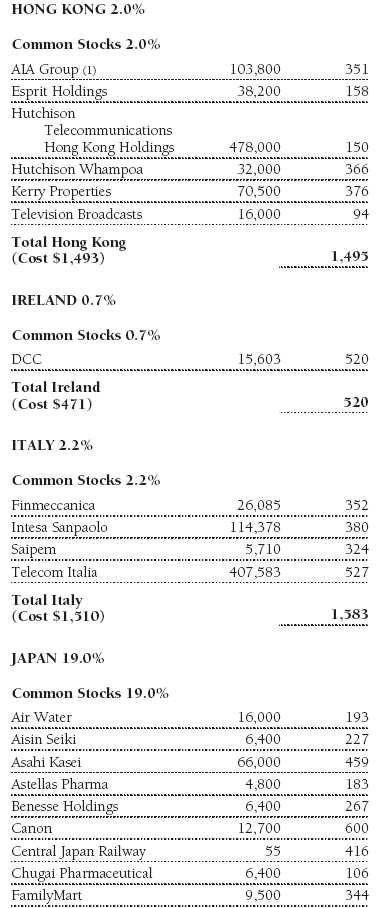
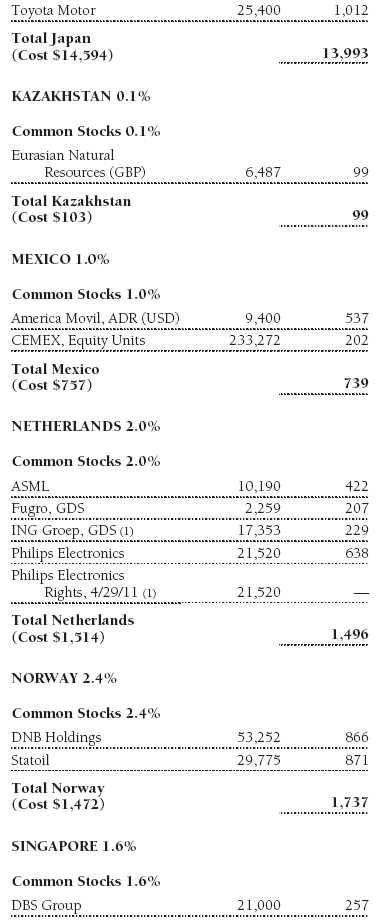
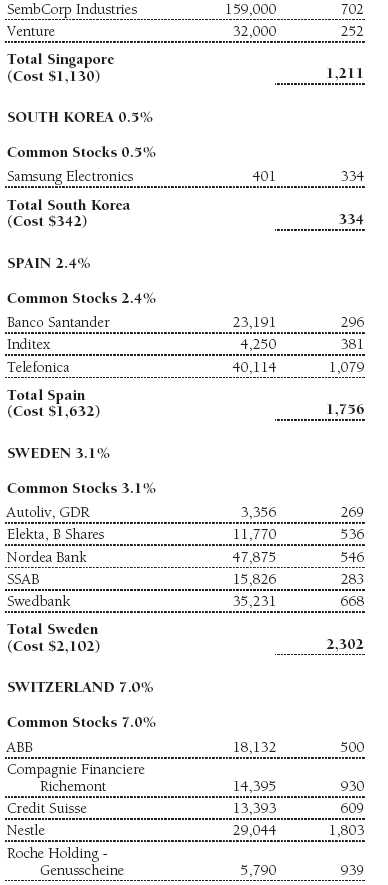
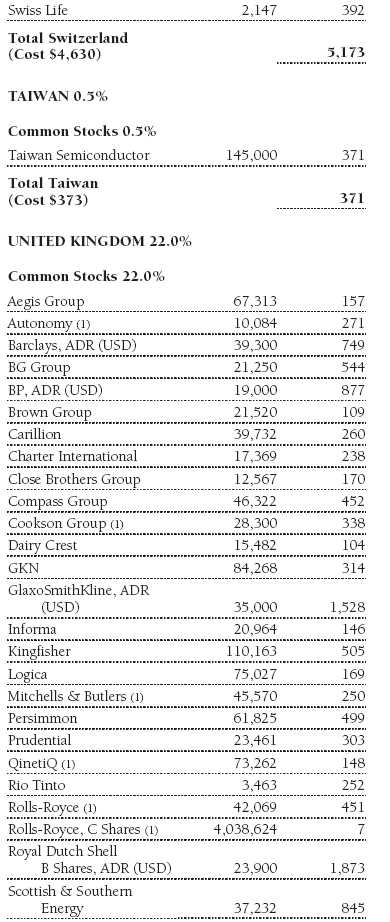
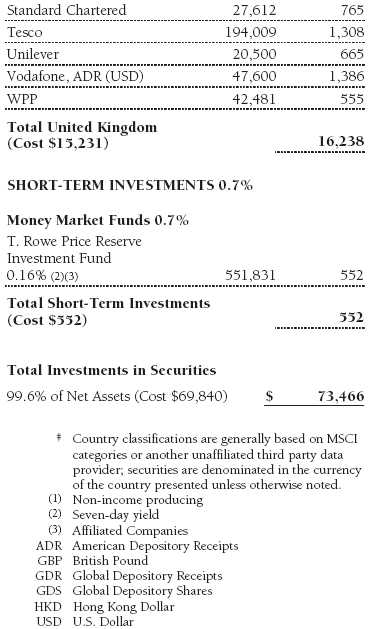
Portfolio of Investments‡
T. Rowe Price Institutional International Core Equity Fund
April 30, 2011 (Unaudited)

The accompanying notes are an integral part of these financial statements.
Statement of Assets and Liabilities
T. Rowe Price Institutional International Core Equity Fund
April 30, 2011 (Unaudited)
($000s, except shares and per share amounts)

The accompanying notes are an integral part of these financial statements.
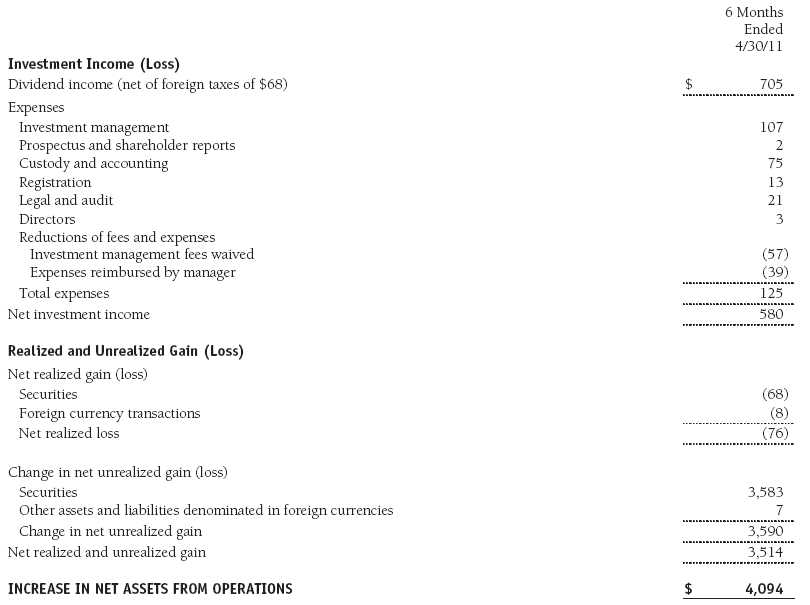
Statement of Operations
T. Rowe Price Institutional International Core Equity Fund
(Unaudited)
($000s)
The accompanying notes are an integral part of these financial statements.
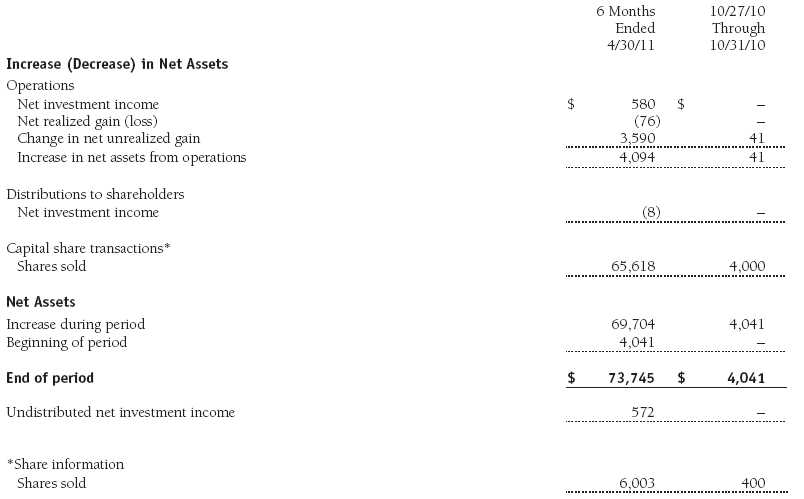
Statement of Changes in Net Assets
T. Rowe Price Institutional International Core Equity Fund
(Unaudited)
($000s)
The accompanying notes are an integral part of these financial statements.
Notes to Financial Statements
T. Rowe Price Institutional International Core Equity Fund
April 30, 2011 (Unaudited)
T. Rowe Price Institutional International Funds, Inc. (the corporation), is registered under the Investment Company Act of 1940 (the 1940 Act). The Institutional International Core Equity Fund (the fund), a diversified, open-end management investment company, is one portfolio established by the corporation. The fund commenced operations on October 27, 2010. The fund seeks long-term growth of capital through investments in the common stocks of non-U.S. companies.
NOTE 1 - SIGNIFICANT ACCOUNTING POLICIES
Basis of Preparation The accompanying financial statements were prepared in accordance with accounting principles generally accepted in the United States of America (GAAP), which require the use of estimates made by management. Management believes that estimates and valuations are appropriate; however, actual results may differ from those estimates, and the valuations reflected in the accompanying financial statements may differ from the value ultimately realized upon sale or maturity.
Investment Transactions, Investment Income, and Distributions Income and expenses are recorded on the accrual basis. Dividends received from mutual fund investments are reflected as dividend income; capital gain distributions are reflected as realized gain/loss. Dividend income and capital gain distributions are recorded on the ex-dividend date. Income tax-related interest and penalties, if incurred, would be recorded as income tax expense. Investment transactions are accounted for on the trade date. Realized gains and losses are reported on the identified cost basis. Distributions to shareholders are recorded on the ex-dividend date. Income distributions are declared and paid annually. Capital gain distributions, if any, are generally declared and paid by the fund annually.
Currency Translation Assets, including investments, and liabilities denominated in foreign currencies are translated into U.S. dollar values each day at the prevailing exchange rate, using the mean of the bid and asked prices of such currencies against U.S. dollars as quoted by a major bank. Purchases and sales of securities, income, and expenses are translated into U.S. dollars at the prevailing exchange rate on the date of the transaction. The effect of changes in foreign currency exchange rates on realized and unrealized security gains and losses is reflected as a component of security gains and losses.
Credits The fund earns credits on temporarily uninvested cash balances held at the custodian, which reduce the fund’s custody charges. Custody expense in the accompanying financial statements is presented before reduction for credits.
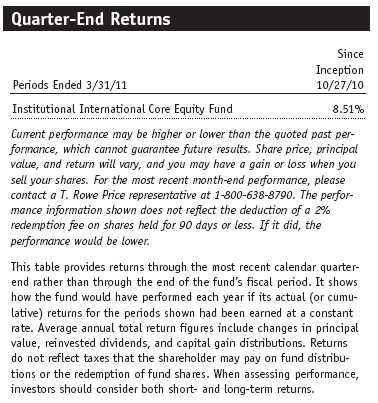
Redemption Fees A 2% fee is assessed on redemptions of fund shares held for 90 days or less to deter short-term trading and to protect the interests of long-term shareholders. Redemption fees are withheld from proceeds that shareholders receive from the sale or exchange of fund shares. The fees are paid to the fund and are recorded as an increase to paid-in capital. The fees may cause the redemption price per share to differ from the net asset value per share.
In-Kind Subscriptions Under certain circumstances, and when considered to be in the best interest of the fund, the fund may accept portfolio securities rather than cash as payment for the purchase of fund shares (in-kind subscription). For financial reporting and tax purposes, the cost basis of contributed securities is equal to the market value of the securities on the date of contribution. In-kind subscriptions result in no gain or loss and no tax consequences for the fund. During the six months ended April 30, 2011, the fund accepted $65,618,000 of in-kind subscriptions, including $63,202,000 from other T. Rowe Price funds.
NOTE 2 - VALUATION
The fund’s financial instruments are reported at fair value as defined by GAAP. The fund determines the values of its assets and liabilities and computes its net asset value per share at the close of the New York Stock Exchange (NYSE), normally 4 p.m. ET, each day that the NYSE is open for business.
Valuation Methods Equity securities listed or regularly traded on a securities exchange or in the over-the-counter (OTC) market are valued at the last quoted sale price or, for certain markets, the official closing price at the time the valuations are made, except for OTC Bulletin Board securities, which are valued at the mean of the latest bid and asked prices. A security that is listed or traded on more than one exchange is valued at the quotation on the exchange determined to be the primary market for such security. Listed securities not traded on a particular day are valued at the mean of the latest bid and asked prices for domestic securities and the last quoted sale price for international securities.
Investments in mutual funds are valued at the mutual fund’s closing net asset value per share on the day of valuation.
Other investments, including restricted securities, and those financial instruments for which the above valuation procedures are inappropriate or are deemed not to reflect fair value are stated at fair value as determined in good faith by the T. Rowe Price Valuation Committee, established by the fund’s Board of Directors.
For valuation purposes, the last quoted prices of non-U.S. equity securities may be adjusted under the circumstances described below. If the fund determines that developments between the close of a foreign market and the close of the NYSE will, in its judgment, materially affect the value of some or all of its portfolio securities, the fund will adjust the previous closing prices to reflect what it believes to be the fair value of the securities as of the close of the NYSE. In deciding whether it is necessary to adjust closing prices to reflect fair value, the fund reviews a variety of factors, including developments in foreign markets, the performance of U.S. securities markets, and the performance of instruments trading in U.S. markets that represent foreign securities and baskets of foreign securities. A fund may also fair value securities in other situations, such as when a particular foreign market is closed but the fund is open. The fund uses outside pricing services to provide it with closing prices and information to evaluate and/or adjust those prices. The fund cannot predict how often it will use closing prices and how often it will determine it necessary to adjust those prices to reflect fair value. As a means of evaluating its security valuation process, the fund routinely compares closing prices, the next day’s opening prices in the same markets, and adjusted prices.
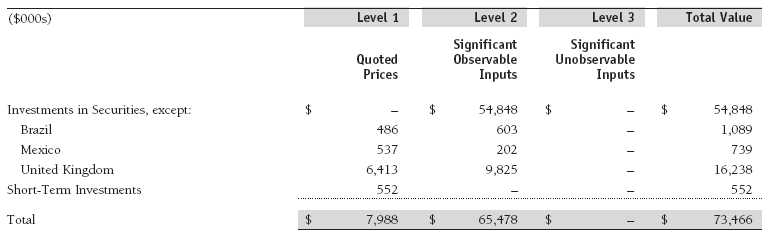
Valuation Inputs Various inputs are used to determine the value of the fund’s financial instruments. These inputs are summarized in the three broad levels listed below:
Level 1 – quoted prices in active markets for identical financial instruments
Level 2 – observable inputs other than Level 1 quoted prices (including, but not limited to, quoted prices for similar financial instruments, interest rates, prepayment speeds, and credit risk)
Level 3 – unobservable inputs
Observable inputs are those based on market data obtained from sources independent of the fund, and unobservable inputs reflect the fund’s own assumptions based on the best information available. The input levels are not necessarily an indication of the risk or liquidity associated with financial instruments at that level. For example, non-U.S. equity securities actively traded in foreign markets generally are reflected in Level 2 despite the availability of closing prices because the fund evaluates and determines whether those closing prices reflect fair value at the close of the NYSE or require adjustment, as described above. The following table summarizes the fund’s financial instruments, based on the inputs used to determine their values on April 30, 2011:
NOTE 3 - OTHER INVESTMENT TRANSACTIONS
Purchases and sales of portfolio securities other than short-term securities aggregated $67,422,000 and $2,051,000, respectively, for the six months ended April 30, 2011.
NOTE 4 - FEDERAL INCOME TAXES
No provision for federal income taxes is required since the fund intends to continue to qualify as a regulated investment company under Subchapter M of the Internal Revenue Code and distribute to shareholders all of its taxable income and gains. Distributions determined in accordance with federal income tax regulations may differ in amount or character from net investment income and realized gains for financial reporting purposes. Financial reporting records are adjusted for permanent book/tax differences to reflect tax character but are not adjusted for temporary differences. The amount and character of tax-basis distributions and composition of net assets are finalized at fiscal year-end; accordingly, tax-basis balances have not been determined as of the date of this report.
At April 30, 2011, the cost of investments for federal income tax purposes was $69,840,000. Net unrealized gain aggregated $3,631,000 at period-end, of which $4,822,000 related to appreciated investments and $1,191,000 related to depreciated investments.
NOTE 5 - FOREIGN TAXES
The fund is subject to foreign income taxes imposed by certain countries in which it invests. Acquisition of certain foreign currencies related to security transactions are also subject to tax. Additionally, capital gains realized by the fund upon disposition of securities issued in or by certain foreign countries are subject to capital gains tax imposed by those countries. All taxes are computed in accordance with the applicable foreign tax law, and, to the extent permitted, capital losses are used to offset capital gains. Taxes attributable to income are accrued by the fund as a reduction of income. Taxes incurred on the purchase of foreign currencies are recorded as realized loss on foreign currency transactions. Current and deferred tax expense attributable to net capital gains is reflected as a component of realized and/or change in unrealized gain/loss on securities in the accompanying financial statements. At April 30, 2011, the fund had no deferred tax liability attributable to foreign securities and no foreign capital loss carryforwards.
NOTE 6 - RELATED PARTY TRANSACTIONS
The fund is managed by T. Rowe Price Associates, Inc. (Price Associates), a wholly owned subsidiary of T. Rowe Price Group, Inc. (Price Group). The fund was previously managed by T. Rowe Price International, Inc. (Price International), which was merged into its parent company, Price Associates, effective at the close of business on December 31, 2010. Thereafter, Price Associates assumed responsibility for all of Price International’s existing investment management contracts, and Price International ceased all further operations. The corporate reorganization was designed to simplify Price Group’s corporate structure related to its international business and was intended to result in no material changes in the nature, quality, level, or cost of services provided to the T. Rowe Price funds.
The investment management agreement between the fund and Price Associates provides for an annual investment management fee equal to 0.65% of the fund’s average daily net assets. The fee is computed daily and paid monthly.
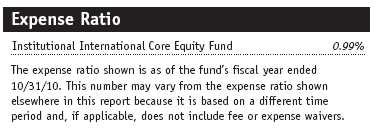
The fund is also subject to a contractual expense limitation through February 28, 2013 During the limitation period, Price Associates is required to waive its management fee and reimburse the fund for any expenses, excluding interest, taxes, brokerage commissions, and extraordinary expenses that would otherwise cause the fund’s ratio of annualized total expenses to average net assets (expense ratio) to exceed its expense limitation of 0.75%. For a period of three years after the date of any reimbursement or waiver, the fund is required to repay Price Associates for expenses previously reimbursed and management fees waived to the extent its net assets have grown or expenses have declined sufficiently to allow repayment without causing the fund’s expense ratio to exceed its expense limitation. Pursuant to this agreement, management fees in the amount of $57,000 were waived and expenses in the amount of $39,000 were reimbursed by Price Associates during the six months ended April 30, 2011. Including these amounts, management fees waived and expenses previously reimbursed by Price Associates in the amount of $98,000 remain subject to repayment by the fund at April 30, 2011.
In addition, the fund has entered into service agreements with Price Associates and a wholly owned subsidiary of Price Associates (collectively, Price). Price Associates computes the daily share price and provides certain other administrative services to the fund. T. Rowe Price Services, Inc., provides shareholder and administrative services in its capacity as the fund’s transfer and dividend disbursing agent. For the six months ended April 30, 2011, expenses incurred pursuant to these service agreements were $66,000 for Price Associates and less than $1,000 for T. Rowe Price Services, Inc. The total amount payable at period-end pursuant to these service agreements is reflected as Due to Affiliates in the accompanying financial statements.
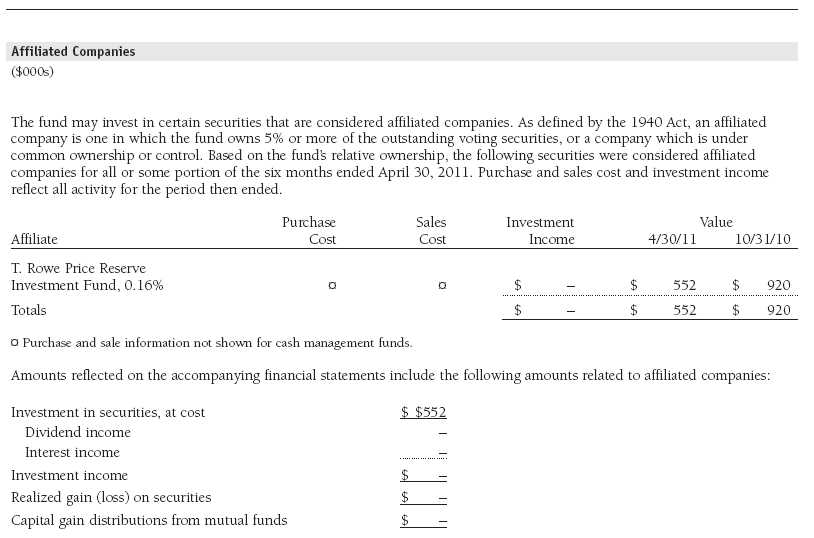
The fund may invest in the T. Rowe Price Reserve Investment Fund and the T. Rowe Price Government Reserve Investment Fund (collectively, the T. Rowe Price Reserve Investment Funds), open-end management investment companies managed by Price Associates and considered affiliates of the fund. The T. Rowe Price Reserve Investment Funds are offered as cash management options to mutual funds, trusts, and other accounts managed by Price Associates and/or its affiliates and are not available for direct purchase by members of the public. The T. Rowe Price Reserve Investment Funds pay no investment management fees.
As of April 30, 2011, T. Rowe Price Group, Inc., and/or its wholly owned subsidiaries owned 400,000 shares of the fund, representing 6% of the fund’s net assets.
| Information on Proxy Voting Policies, Procedures, and Records |
A description of the policies and procedures used by T. Rowe Price funds and portfolios to determine how to vote proxies relating to portfolio securities is available in each fund’s Statement of Additional Information, which you may request by calling 1-800-225-5132 or by accessing the SEC’s website, sec.gov. The description of our proxy voting policies and procedures is also available on our website, troweprice.com. To access it, click on the words “Our Company” at the top of our corporate homepage. Then, when the next page appears, click on the words “Proxy Voting Policies” on the left side of the page.
Each fund’s most recent annual proxy voting record is available on our website and through the SEC’s website. To access it through our website, follow the directions above, then click on the words “Proxy Voting Records” on the right side of the Proxy Voting Policies page.
| How to Obtain Quarterly Portfolio Holdings |
The fund files a complete schedule of portfolio holdings with the Securities and Exchange Commission for the first and third quarters of each fiscal year on Form N-Q. The fund’s Form N-Q is available electronically on the SEC’s website (sec.gov); hard copies may be reviewed and copied at the SEC’s Public Reference Room, 450 Fifth St. N.W., Washington, DC 20549. For more information on the Public Reference Room, call 1-800-SEC-0330.
| Approval of Investment Management Agreement |
On March 9, 2011, the fund’s Board of Directors (Board) unanimously approved the continuation of the investment advisory contract (Contract) between the fund and its investment advisor, T. Rowe Price Associates, Inc. (Advisor), as well as the investment subadvisory contract (Subadvisory Contract) that the Advisor has entered into with T. Rowe Price International Ltd (Subadvisor). The Board considered a variety of factors in connection with its review of the Contract and Subadvisory Contract, also taking into account information provided by the Advisor during the course of the year, as discussed below:
Services Provided by the Advisor
The Board considered the nature, quality, and extent of the services provided to the fund by the Advisor and Subadvisor. These services included, but were not limited to, management of the fund’s portfolio and a variety of related activities, as well as financial and administrative services, reporting, and communications. The Board also reviewed the background and experience of the Advisor’s and Subadvisor’s senior management teams and investment personnel involved in the management of the fund. The Board noted that a restructuring involving the Advisor and certain of its affiliated investment advisors led to a restatement of the fund’s investment advisory contract and a new investment subadvisory contract, effective at the close of business on December 31, 2010. This restructuring, which resulted in T. Rowe Price Associates, Inc., becoming the fund’s new investment advisor and T. Rowe Price International Ltd becoming the fund’s new investment subadvisor, had been determined by the Board at a meeting in October 2010 not to diminish the nature, quality, or level of services provided to the fund or materially to change the manner in which advisory services were to be provided. The Board concluded that it was satisfied with the nature, quality, and extent of the services provided by the Advisor and Subadvisor.
Investment Performance of the Fund
The Board reviewed the fund’s since-inception return and compared this return with the fund’s benchmark and certain comparable performance measures and market data, including those supplied by Lipper and Morningstar, which are independent providers of mutual fund data. On the basis of this evaluation and in light of the fund’s limited operating history, the Board concluded that the fund’s performance was satisfactory.
Costs, Benefits, Profits, and Economies of Scale
The Board reviewed detailed information regarding the revenues received by the Advisor under the Contract and other benefits that the Advisor (and its affiliates, including the Subadvisor) may have realized from its relationship with the fund, including research received under “soft dollar” agreements and commission-sharing arrangements with broker-dealers. The Board considered that the Advisor and Subadvisor may receive some benefit from soft-dollar arrangements pursuant to which research is received from broker-dealers that execute the applicable fund’s portfolio transactions. The Board also received information on the estimated costs incurred and profits realized by the Advisor and its affiliates (including the Subadvisor) from advising T. Rowe Price mutual funds. The Board did not review information regarding profits realized from managing the fund in particular because the fund had not achieved sufficient scale in terms of portfolio asset size to produce meaningful profit margin percentages. Under the Contract, the fund pays a fee to the Advisor based on the fund’s average daily net assets. Under the Subadvisory Contract, the Advisor may pay the Subadvisor up to 60% of the advisory fee that the Advisor receives from the fund. The Board concluded that the Advisor’s profits were reasonable in light of the services provided to the fund. The Board also considered whether the fund or other funds benefit under the fee levels set forth in the Contract from any economies of scale realized by the Advisor. The Board concluded that, based on the profitability data it reviewed and the fund’s limited operating history, the advisory fee structure for the fund continued to provide for a reasonable sharing of benefits from any economies of scale with the fund’s investors.
Fees
The Board reviewed the fund’s management fee rate, operating expenses, and total expense ratio and compared them with fees and expenses of other comparable funds based on information and data supplied by Lipper. The information provided to the Board indicated that the fund’s management fee rate (after including reductions of the management fee rate that resulted from applicable fee waivers or expenses paid by the Advisor) and total expense ratio were below the median for comparable funds. The Board also reviewed the fee schedules for institutional accounts of the Advisor and its affiliates with similar mandates. Management provided the Board with information about the Advisor’s responsibilities and services provided to institutional account clients, which are more limited than its responsibilities for the fund and other T. Rowe Price mutual funds that it advises, and showing that the Advisor performs significant additional services and assumes greater risk for the fund and other T. Rowe Price mutual funds that it advises than it does for institutional account clients. On the basis of the information provided, the Board concluded that the fees paid by the fund under the Contract were reasonable.
Approval of the Contract
As noted, the Board approved the continuation of the Contract and Subadvisory Contract. No single factor was considered in isolation or to be determinative to the decision. Rather, the Board was assisted by the advice of independent legal counsel and concluded, in light of a weighting and balancing of all factors considered and in light of the fund’s limited operating history, that it was in the best interests of the fund to approve the continuation of the Contract and the Subadvisory Contract (including the fees to be charged for services thereunder).
Item 2. Code of Ethics.
A code of ethics, as defined in Item 2 of Form N-CSR, applicable to its principal executive officer, principal financial officer, principal accounting officer or controller, or persons performing similar functions is filed as an exhibit to the registrant’s annual Form N-CSR. No substantive amendments were approved or waivers were granted to this code of ethics during the registrant’s most recent fiscal half-year.
Item 3. Audit Committee Financial Expert.
Disclosure required in registrant’s annual Form N-CSR.
Item 4. Principal Accountant Fees and Services.
Disclosure required in registrant’s annual Form N-CSR.
Item 5. Audit Committee of Listed Registrants.
Not applicable.
Item 6. Investments.
(a) Not applicable. The complete schedule of investments is included in Item 1 of this Form N-CSR.
(b) Not applicable.
Item 7. Disclosure of Proxy Voting Policies and Procedures for Closed-End Management Investment Companies.
Not applicable.
Item 8. Portfolio Managers of Closed-End Management Investment Companies.
Not applicable.
Item 9. Purchases of Equity Securities by Closed-End Management Investment Company and Affiliated Purchasers.
Not applicable.
Item 10. Submission of Matters to a Vote of Security Holders.
Not applicable.
Item 11. Controls and Procedures.
(a) The registrant’s principal executive officer and principal financial officer have evaluated the registrant’s disclosure controls and procedures within 90 days of this filing and have concluded that the registrant’s disclosure controls and procedures were effective, as of that date, in ensuring that information required to be disclosed by the registrant in this Form N-CSR was recorded, processed, summarized, and reported timely.
(b) The registrant’s principal executive officer and principal financial officer are aware of no change in the registrant’s internal control over financial reporting that occurred during the registrant’s second fiscal quarter covered by this report that has materially affected, or is reasonably likely to materially affect, the registrant’s internal control over financial reporting.
Item 12. Exhibits.
(a)(1) The registrant’s code of ethics pursuant to Item 2 of Form N-CSR is filed with the registrant’s annual Form N-CSR.
(2) Separate certifications by the registrant's principal executive officer and principal financial officer, pursuant to Section 302 of the Sarbanes-Oxley Act of 2002 and required by Rule 30a-2(a) under the Investment Company Act of 1940, are attached.
(3) Written solicitation to repurchase securities issued by closed-end companies: not applicable.
(b) A certification by the registrant's principal executive officer and principal financial officer, pursuant to Section 906 of the Sarbanes-Oxley Act of 2002 and required by Rule 30a-2(b) under the Investment Company Act of 1940, is attached.
| | |
SIGNATURES |
| |
| | Pursuant to the requirements of the Securities Exchange Act of 1934 and the Investment |
| Company Act of 1940, the registrant has duly caused this report to be signed on its behalf by the |
| undersigned, thereunto duly authorized. |
| |
| T. Rowe Price Institutional International Funds, Inc. |
| |
| |
| |
| By | /s/ Edward C. Bernard |
| | Edward C. Bernard |
| | Principal Executive Officer |
| |
| Date | June 16, 2011 |
| |
| |
| |
| | Pursuant to the requirements of the Securities Exchange Act of 1934 and the Investment |
| Company Act of 1940, this report has been signed below by the following persons on behalf of |
| the registrant and in the capacities and on the dates indicated. |
| |
| |
| By | /s/ Edward C. Bernard |
| | Edward C. Bernard |
| | Principal Executive Officer |
| |
| Date | June 16, 2011 |
| |
| |
| |
| By | /s/ Gregory K. Hinkle |
| | Gregory K. Hinkle |
| | Principal Financial Officer |
| |
| Date | June 16, 2011 |