| UNITED STATES |
| SECURITIES AND EXCHANGE COMMISSION |
| Washington, D.C. 20549 |
| |
FORM N-CSR |
| |
CERTIFIED SHAREHOLDER REPORT OF REGISTERED |
MANAGEMENT INVESTMENT COMPANIES |
| |
| |
| |
| Investment Company Act File Number: 811-5833 |
|
| |
| T. Rowe Price Institutional International Funds, Inc. |
|
| (Exact name of registrant as specified in charter) |
| |
| 100 East Pratt Street, Baltimore, MD 21202 |
|
| (Address of principal executive offices) |
| |
| David Oestreicher |
| 100 East Pratt Street, Baltimore, MD 21202 |
|
| (Name and address of agent for service) |
| |
| |
| Registrant’s telephone number, including area code: (410) 345-2000 |
| |
| |
| Date of fiscal year end: October 31 |
| |
| |
| Date of reporting period: April 30, 2011 |
Item 1: Report to Shareholders| Institutional Africa & Middle East Fund | April 30, 2011 |
• African and Middle Eastern equity markets were widely mixed in the last six months as political and social unrest spread from North Africa to the Middle East.
• Despite this tough geopolitical environment, your fund was flat in the last six months, held back by poor performance of our Egyptian holdings. Low exposure to South Africa, which had strong performance, also hurt our relative results.
• We took advantage of broad price weakness during the period to purchase additional shares of holdings in which we have high conviction. We also established and added to positions in some very attractive African consumer stocks.
• We are monitoring regional developments very closely but believe that long-term trends—such as rising levels of infrastructure spending across the region and growing consumerism in Africa—remain intact.
The views and opinions in this report were current as of April 30, 2011. They are not guarantees of performance or investment results and should not be taken as investment advice. Investment decisions reflect a variety of factors, and the managers reserve the right to change their views about individual stocks, sectors, and the markets at any time. As a result, the views expressed should not be relied upon as a forecast of the fund’s future investment intent. The report is certified under the Sarbanes-Oxley Act, which requires mutual funds and other public companies to affirm that, to the best of their knowledge, the information in their financial reports is fairly and accurately stated in all material respects.
Manager’s Letter
T. Rowe Price Institutional Africa & Middle East Fund
Fellow Shareholders
African and Middle Eastern equity markets were widely mixed in the six-month period ended April 30, 2011. Political and social unrest that started in Tunisia in December spread to various countries in North Africa and the Middle East, resulting in a spike in oil prices, a capital flight from our target regions, the toppling of governments in Tunisia and Egypt, and a Libyan civil war featuring NATO military intervention against the Gadhafi government. Uprisings in Gulf Cooperation Council (GCC) members have been smaller than the ones in North Africa as several GCC countries have boosted social spending, promised reforms, and implemented other measures to discourage antigovernment protests. South Africa and Qatar were among the best-performing markets in the last six months, while Egypt and Tunisia were among the worst.
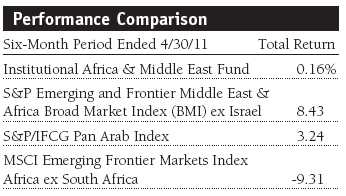
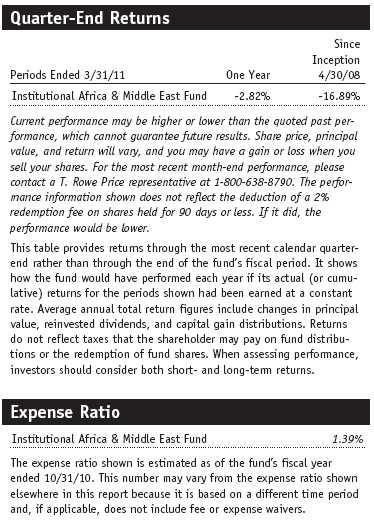
Your fund returned 0.16% in the last six months despite this tough geopolitical environment. As shown in the Performance Comparison table, the fund significantly lagged its primary benchmark, the S&P Emerging and Frontier Middle East & Africa Broad Market Index (BMI) ex Israel. This was largely attributable to our underweight positioning in South Africa, as well as our allocations to a few other markets, as discussed below. Fund performance relative to other indexes representing parts of our investment universe was notably better, as shown in the table. (The S&P/IFCG Pan Arab Index represents the major markets in the Middle East and North Africa region, while the MSCI index covers the major African markets but excludes South Africa.) As a reminder of our investment philosophy, we do not focus on benchmark weights when managing the fund but rather look across the whole region in search of the best long-term growth investments. South Africa is a relatively developed market in an emerging markets context. While it dominates the performance of the fund’s primary benchmark, we believe better long-term growth opportunities can be found elsewhere based on our analysis of the country’s economic prospects and corporate fundamentals.
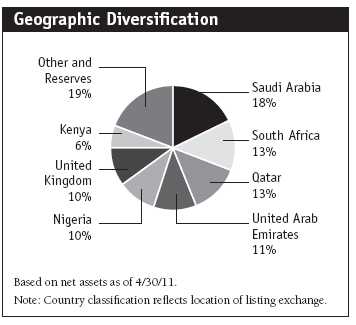
The fund’s performance relative to its primary benchmark was hurt by weakness among our Egyptian holdings, as well as our emphasis on Egypt versus the benchmark. Low exposure to South Africa (13.5% of fund assets at the end of April versus 51.6% for the index) and stock selection, to some extent, also hurt. In addition, overweighting the United Arab Emirates (UAE), which sagged, detracted. On the plus side, an overweight to Qatar helped performance, as did our underweight allocations to Kuwait and Jordan. Our investment in U.K.-listed Tullow Oil, an oil and gas exploration company with operations in Africa, Europe, and India, also added value. (Please refer to the fund’s portfolio of investments for a complete list of holdings and the amount each represents in the portfolio.)
We remain dedicated to finding and investing in companies throughout our target universe with strong long-term growth potential. The recent turmoil in the Middle East and North Africa has hurt the value of some fund holdings, but it also has created opportunities for us to add to positions in some quality companies in which we have high conviction—such as DP World (UAE), Qatar National Bank (Qatar), BankMuscat (Oman), and Orascom Construction (Egypt)—as well as take advantage of new investment candidates with promising prospects. We are continuously evaluating fund holdings as new information becomes available, and we are traveling extensively across the region—recently visiting the UAE, Saudi Arabia, Nigeria, South Africa, Ghana, and Morocco—to conduct thorough, proprietary research on current and potential investments.
Portfolio Review
Gulf Cooperation Council (GCC)
The fund is currently investing in four of the six GCC countries—Saudi Arabia, Oman, Qatar, and the UAE. These markets represented 45% of fund assets at the end of our reporting period. We had no investments in Bahrain or Kuwait at the end of April due to concerns about corporate governance structures and protection for minority shareholders.
United Arab Emirates (UAE)
Stocks in the UAE, a federation of seven states, fell about 2% in the last six months. We are significantly overweighting the UAE relative to the fund’s primary benchmark because we like the emirates’ long-term growth potential and the regional reach of various companies listed there. While the UAE did not experience the turmoil seen in other countries in the region, the emirates continue to struggle with Dubai’s weak property market.
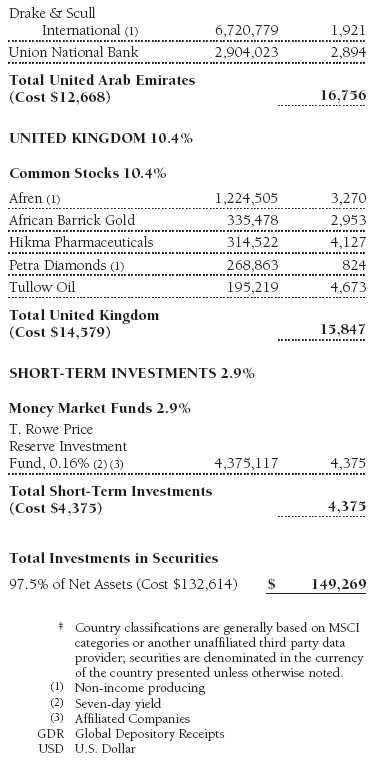
Our UAE holdings were mixed in the first half of our fiscal year. One of the largest absolute contributors in the entire portfolio was DP World, a leading global port operator based in Dubai that reported better-than-expected earnings for 2010. We increased our exposure to the company on weakness in the last few months. Union National Bank and our new investment in construction company Drake & Scull International also produced gains. On the other hand, Aldar Properties, a government-backed Abu Dhabi real estate developer, was one of the weakest holdings in the portfolio. The company is struggling with liquidity issues and has had to rely on funding from the government, which is the largest shareholder of the company and whose stake is likely to increase. Our other UAE holdings declined, and we eliminated Air Arabia and Islamic Arab Insurance from the portfolio in favor of better long-term growth opportunities.
Saudi Arabia
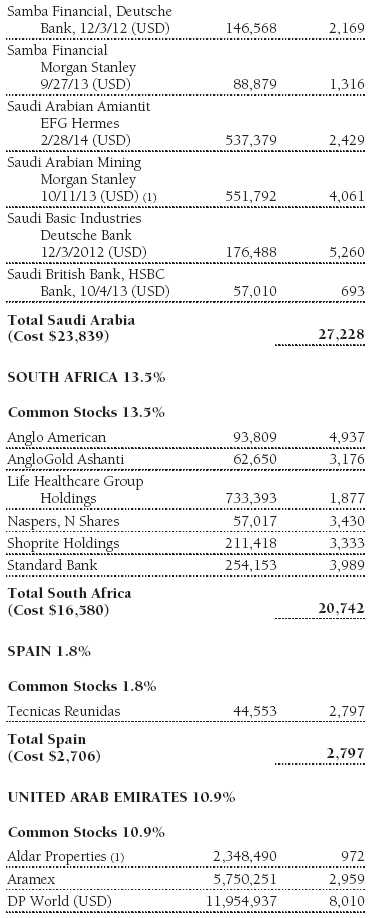
Stocks in OPEC heavyweight Saudi Arabia returned almost 8% in an environment of significantly higher oil prices and ongoing infrastructure spending. As of April 30, 2011, it was our largest country allocation because we continue to believe that Saudi Arabia is one of the most attractive markets in our opportunity set. Because foreign investors may not own Saudi shares directly, we gain exposure to the country via participation notes (P-notes).
Saudi Arabia is politically stable, though fears of instability affecting this significant oil producer have contributed to the spike in oil prices in the last few months, and there are concerns around who will succeed King Abdullah. Protests against the regime in general have been small and defused quickly, though there have been signs of unrest in the country’s Eastern Province, near Bahrain, where tensions have prompted the Saudis to send security forces to support the Al Khalifa regime. To help discourage dissent, Saudi Arabia recently announced two financial aid packages totaling $127 billion—approximately 20% of the kingdom’s gross domestic product (GDP)—to lift wages; create jobs; and to help with inflation, housing, and education costs. Over the long term, we believe Saudi Arabia and other GCC countries must continue to implement reforms that increase political representation and create jobs.
Several of our top-performing holdings in Saudi Arabia—such as Saudi Arabian Mining, pipe manufacturer Saudi Arabian Amiantit, and chemical company Saudi Basic Industries—benefited from higher raw materials prices and expectations for the government to continue investing in the country’s infrastructure. Retailer Jarir Marketing and Saudi British Bank also produced good returns. However, several of our holdings struggled, including leading mobile phone operator Etihad Etisalat, Samba Financial Group, and food and dairy producer Almarai, which was hurt by higher materials and commodity costs.
Qatar and Oman
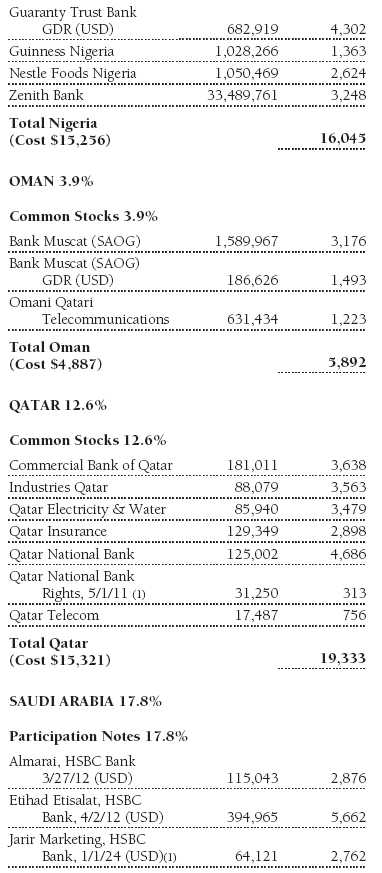
Shares in OPEC member Qatar climbed almost 17% in the last six months, while the Omani stock market rose only 2%. Together, these countries represented almost 17% of fund assets as of April 30, 2011. Qatari stocks benefited from surging oil prices as well as news that the emirate will host the 2022 World Cup soccer tournament, preparation for which will undoubtedly involve increased government spending on infrastructure. In addition, there are expectations that MSCI, a leading provider of investment data, will add Qatar to its broad emerging markets benchmark in the next year or two, which should encourage investment in the country. In Oman, where the populace generally supports Sultan Qaboos, there have been occasional but limited protests against corruption and low wages and growing demands for greater parliamentary powers. The country’s leader has responded with cabinet reshuffling, new spending plans, a monthly minimum wage, and promises for new job creation.
We continue to believe that Qatar has one of the most attractive economies in our investment universe due to its huge gas reserves, and the economic development of the country over the next decade could be brisk. We reestablished a position in Industries Qatar, a holding company with businesses in the petrochemical, fertilizer, steel, and real estate sectors, and initiated a position in Qatar Telecom. Both companies produced relatively mild gains, but one of our top absolute contributors in the last six months was Qatar Electricity & Water. We continue to like financial companies with a healthy outlook, such as Qatar National Bank, whose shares were lifted by favorable first-quarter results featuring strong loan and deposit growth and healthy net interest margins.
In Oman, our primary holding is BankMuscat, an attractively valued company with generally favorable banking metrics. Shares rose in the last six months but gains were limited by wage pressures and by the bank’s modest exposure to Bahrain. Our other Omani investment is Omani Qatari Telecommunications, which has a well-managed mobile phone subsidiary called Nawras. Shares produced mild gains in the last six months.
Other Middle Eastern and North African Countries
Egypt
The Egyptian stock market plunged 24% in the last six months. As violence and protests against the Hosni Mubarak regime escalated, authorities closed the market in late January following sharp losses and did not reopen it until late March. Mubarak resigned in early February and transferred all power to the Egyptian military, which suspended the constitution, dissolved parliament, and promised new elections. The recent passage of a referendum on constitutional amendments and expectations for parliamentary and presidential elections to be held by the end of the year are promising political developments. Also, having met recently with managements of several Egyptian companies, we believe Egypt and Egyptian businesses will continue to promote corporate transparency to attract foreign investment.
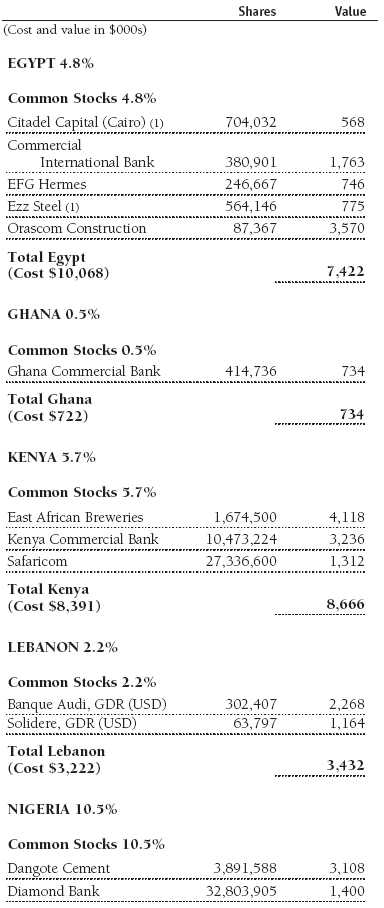
The fund’s six-month performance was hurt by our holdings in Egypt, all of which declined sharply. Given large Egyptian fiscal and current account deficits and the need to increase social spending, we believe 2011 will be a very tough macroeconomic year, with GDP growth expected to be flat. However, over the long term, Egypt could end up with a structurally stronger economy. Because we believe near- to medium-term risks are high, we reduced our exposure to some Egyptian companies that we felt would suffer in the current climate. We sold our Telecom Egypt position but kept stakes in companies with pan-regional exposure and good long-term prospects, such as Commercial International Bank and Orascom Construction, a large infrastructure construction company with operations across the Middle East. Early in our reporting period, we added Citadel Capital, a private-equity firm that should benefit from a return to more normal economic and market conditions in 2012 and beyond.

Lebanon and Jordan
Lebanese stocks fell about 2% in the last six months, while Jordan’s stock market fell about 6.5%. Lebanon is in a state of political limbo because there has been no cabinet since the January resignation of 11 cabinet ministers led to a collapse of a “unity” government. The resignations were related to the United Nations tribunal investigating the 2005 assassination of Prime Minister Rafik Hariri. In Jordan, there have been some demonstrations against the government in which protestors have demanded reforms, as well as some clashes between pro- and antigovernment gatherings, but the violence does not seem to be escalating.
We continue to have very few holdings based in Lebanon and Jordan. In the former, our investment in Banque Audi declined in the last six months, but shares of property developer Solidere added relative value. We still believe that both companies have favorable long-term prospects and should perform well after the current Lebanese political uncertainties have passed. Generic drug company Hikma Pharmaceuticals, which is based in Jordan but listed in the U.K., fared well in the last six months. Recently, the company completed its acquisition of U.S.-based Baxter International’s injectible medicines unit and forged a strategic partnership with an Indian pharmaceutical company to expand its reach.
Africa
We increased the fund’s exposure to Africa (excluding Egypt and including U.K.-listed African stocks) from 33% to about 38% over the last six months. We added to existing positions within the sub-Saharan consumer space as a number of stocks fell during the period and made some new investments. We believe African consumer companies offer high growth potential due to the continent’s large and underpenetrated consumer base, and we continue to search for possible beneficiaries.
South Africa
The South African market was one of the strongest in our opportunity set, advancing nearly 15% in U.S. dollar terms in the last six months. Performance was driven by the surge in global metals prices and strength in the rand versus the greenback. As mentioned earlier, our relatively low exposure to South Africa hurt fund performance in the first half of our fiscal year. While South Africa dominates the fund’s primary benchmark, we consider the country to be a relatively developed market in an emerging markets context, and our underweighting reflects a belief that better growth opportunities can be found elsewhere based on our analysis of the country’s macroeconomic situation—high unemployment, low GDP growth, and large current and fiscal account deficits—and corporate fundamentals. Still, we like some South African companies, particularly those that offer exposure to growth in smaller, fast-growing parts of sub-Saharan Africa.
Two of our strongest performers in South Africa were metals and mining companies Anglo American and AngloGold Ashanti. A new U.K.-listed portfolio holding, Petra Diamonds, also did well, as did media company Naspers, Standard Bank Group, and hospital operator Life Healthcare Group Holdings. On the other hand, our positions in retailers Clicks Group and Woolworths Holdings declined sharply, and we eliminated them. We sold out of our positions in retailer Truworths International and engineering and construction services company Murray & Roberts Holdings. We used the proceeds from these sales to purchase additional shares of our high-conviction holdings in other countries that fell sharply due to Middle Eastern and North African turmoil. We also established or added to positions in some very attractive African consumer stocks, including Shoprite Holdings, one of the largest food retailers in Africa.
Kenya, Nigeria, and Ghana
These African markets were mixed in the last six months. In U.S. dollar terms, Kenyan stocks fell about 5% amid expectations for slower growth as the central bank raises interest rates to fight inflation. Shares in Nigeria rose 6%, helped by rising oil prices, while shares in Ghana soared nearly 24%, in part due to the recent discovery of oil off its coast. Together, these three countries represented nearly 17% of fund assets at the end of April.
In the last six months, we increased our exposure to Kenya and Nigeria and, very recently, started investing in Ghana. These markets have long-term investment potential with improving macroeconomic stories. Within Nigeria, the macroeconomic environment is very strong, with GDP growth of 7% to 8% this year and last year. Oil production is back to 2 million barrels per day, political and exchange rate stability is improving, and the banking sector appears healthy. Ghana, a politically stable commodity exporter and new oil producer, is the fastest-growing country in sub-Saharan Africa, with 13% GDP growth expected in 2011. Economic growth in Kenya is also expected to increase.
In our opinion, the most attractive sectors and industries in Nigeria are the banks, consumer companies, and oil and gas companies. Our holdings here include Guaranty Trust Bank, Zenith Bank, and Diamond Bank, each of which should benefit from the underpenetrated banking sector in Nigeria. We also like Nestle Foods Nigeria and Guinness Nigeria, which should benefit from increasing consumer spending. We have maintained our position in Dangote Cement, a leading cement producer that should benefit as government and private sector infrastructure spending increases. We opened a position in Afren, a U.K.-listed pan-African oil exploration and production (E&P) company. We believe that Afren is well placed to capture more opportunities in Nigeria as the government continues the push for higher participation of the local E&P operators in the Nigerian oil and gas industry.
We continued investing in Kenyan companies that we believe can benefit from the large, underpenetrated consumer base. One example is East African Breweries, a Diageo-controlled company with a significant market share in beer and spirits. We also maintained positions in Kenya Commercial Bank and telecommunication services company Safaricom, both of which have room to grow from current low penetration levels within their respective sectors. Near the end of our reporting period, we added Ghana Commercial Bank to the portfolio.
Outlook
Several countries in Africa and the Middle East continue to experience varying levels of unrest, and we are monitoring regional developments very closely. While risks remain, we believe that long-term trends—such as rising levels of infrastructure spending across the region and growing consumerism in Africa—remain intact. We are encouraged by solid economic and corporate earnings growth rates, sound government fiscal positions, and attractive stock valuations. There is increased risk due to social unrest, and we believe GCC countries, especially Saudi Arabia, must implement government reforms to improve political representation and create jobs for long-term stability. In sub-Saharan Africa, the improving macroeconomic outlook has been underpinned by higher commodity prices, reduced debt burdens, and improving investor confidence. We see the growth of the consumer as a key driver of these markets.
We appreciate your confidence in our investment management abilities as we navigate the portfolio through this extraordinary period of change for Africa and the Middle East. As always, we would like to remind our investors, particularly newer investors, that this fund has a high risk/return profile. Because of its narrow geographic focus and relatively small number of holdings, this fund can be extremely volatile and should represent only a small portion of a long-term investor’s well-diversified portfolio.
Respectfully submitted,

Joseph Rohm
Portfolio manager
May 23, 2011
The portfolio manager has day-to-day responsibility for managing the portfolio and works with committee members in developing and executing the fund’s investment program.
| Risks of International Investing |
Funds that invest overseas generally carry more risk than funds that invest strictly in U.S. assets. Funds investing in a single country, limited geographic region, or emerging markets tend to be riskier than more-diversified funds. Risks can result from varying stages of economic and political development; differing regulatory environments, trading days, and accounting standards; and higher transaction costs of non-U.S. markets. Non-U.S. investments are also subject to currency risk, or a decline in the value of a foreign currency versus the U.S. dollar, which reduces the dollar value of securities denominated in that currency.
Gross domestic product (GDP): The total market value of all goods and services produced in a country in a given year.
MSCI Emerging Frontier Markets Index Africa ex South Africa: An index created by MSCI that includes stocks from African countries other than South Africa.
S&P Emerging and Frontier Middle East & Africa Broad Market Index (BMI) ex Israel: An index created by Standard & Poor’s that includes all of the daily priced, free-float market cap that S&P covers across the Middle East and Africa, excluding Israel.
S&P/IFCG Pan Arab Index: An index created by Standard & Poor’s that includes stocks from listed companies in the countries of Bahrain, Egypt, Jordan, Kuwait, Lebanon, Morocco, Oman, Qatar, Saudi Arabia, Tunisia, and the United Arab Emirates (UAE).
Portfolio Highlights

Performance and Expenses
T. Rowe Price Institutional Africa & Middle East Fund
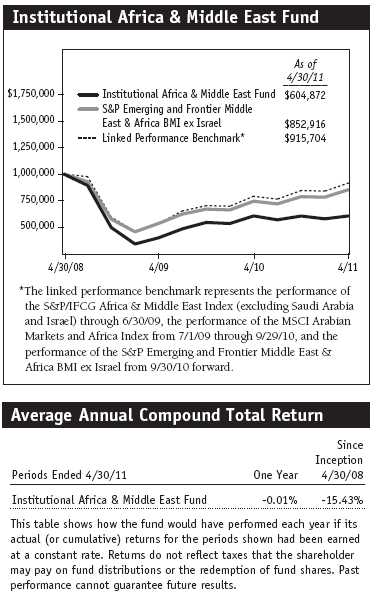
This chart shows the value of a hypothetical $1 million investment in the fund over the past 10 fiscal year periods or since inception (for funds lacking 10-year records). The result is compared with benchmarks, which may include a broad-based market index and a peer group average or index. Market indexes do not include expenses, which are deducted from fund returns as well as mutual fund averages and indexes.
Fund Expense Example
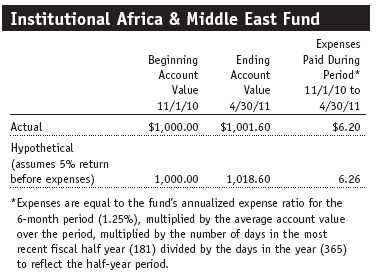
As a mutual fund shareholder, you may incur two types of costs: (1) transaction costs, such as redemption fees or sales loads, and (2) ongoing costs, including management fees, distribution and service (12b-1) fees, and other fund expenses. The following example is intended to help you understand your ongoing costs (in dollars) of investing in the fund and to compare these costs with the ongoing costs of investing in other mutual funds. The example is based on an investment of $1,000 invested at the beginning of the most recent six-month period and held for the entire period.
Actual Expenses
The first line of the following table (“Actual”) provides information about actual account values and actual expenses. You may use the information in this line, together with your account balance, to estimate the expenses that you paid over the period. Simply divide your account value by $1,000 (for example, an $8,600 account value divided by $1,000 = 8.6), then multiply the result by the number in the first line under the heading “Expenses Paid During Period” to estimate the expenses you paid on your account during this period.
Hypothetical Example for Comparison Purposes
The information on the second line of the table (“Hypothetical”) is based on hypothetical account values and expenses derived from the fund’s actual expense ratio and an assumed 5% per year rate of return before expenses (not the fund’s actual return). You may compare the ongoing costs of investing in the fund with other funds by contrasting this 5% hypothetical example and the 5% hypothetical examples that appear in the shareholder reports of the other funds. The hypothetical account values and expenses may not be used to estimate the actual ending account balance or expenses you paid for the period.
You should also be aware that the expenses shown in the table highlight only your ongoing costs and do not reflect any transaction costs, such as redemption fees or sales loads. Therefore, the second line of the table is useful in comparing ongoing costs only and will not help you determine the relative total costs of owning different funds. To the extent a fund charges transaction costs, however, the total cost of owning that fund is higher.
Financial Highlights
T. Rowe Price Institutional Africa & Middle East Fund
(Unaudited)
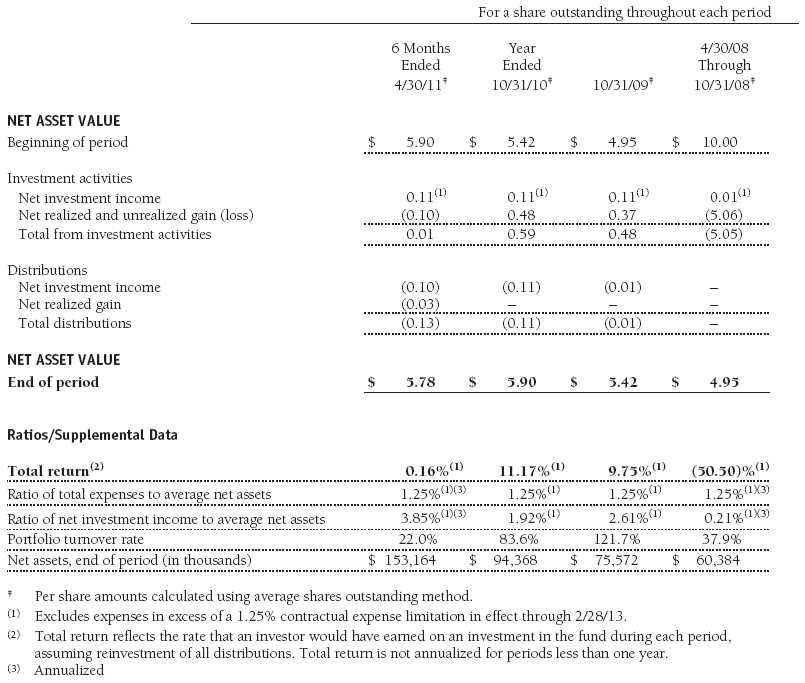
The accompanying notes are an integral part of these financial statements.
Portfolio of Investments‡
T. Rowe Price Institutional Africa & Middle East Fund
April 30, 2011 (Unaudited)
The accompanying notes are an integral part of these financial statements.
Statement of Assets and Liabilities
T. Rowe Price Institutional Africa & Middle East Fund
April 30, 2011 (Unaudited)
($000s, except shares and per share amounts)
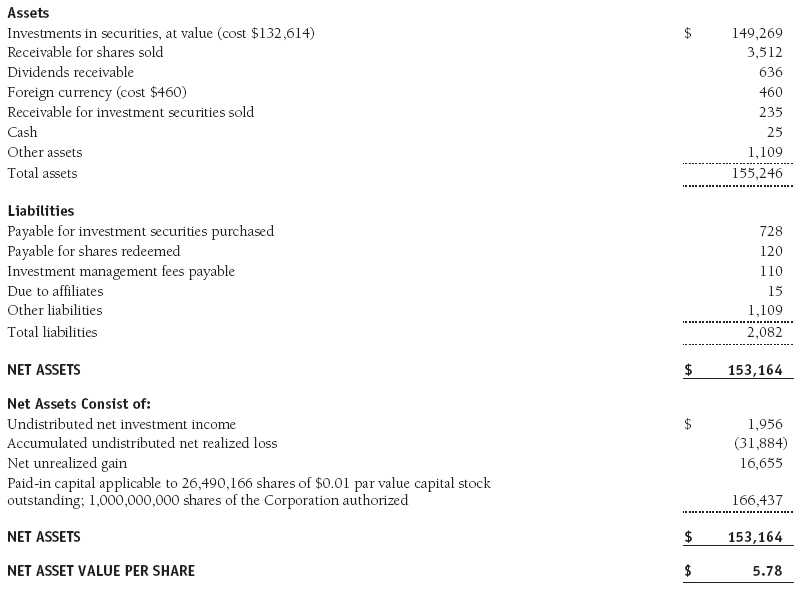
The accompanying notes are an integral part of these financial statements.
Statement of Operations
T. Rowe Price Institutional Africa & Middle East Fund
(Unaudited)
($000s)
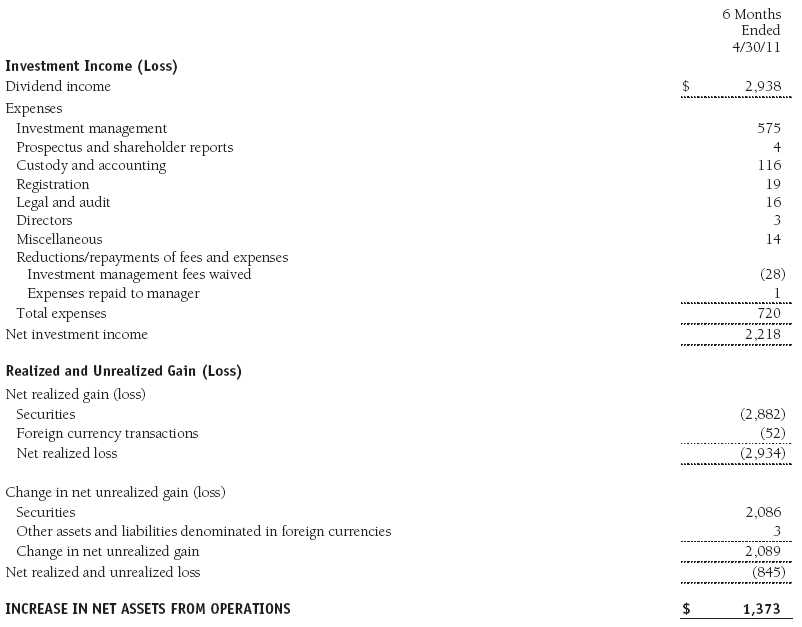
The accompanying notes are an integral part of these financial statements.
Statement of Changes in Net Assets
T. Rowe Price Institutional Africa & Middle East Fund
(Unaudited)
($000s)
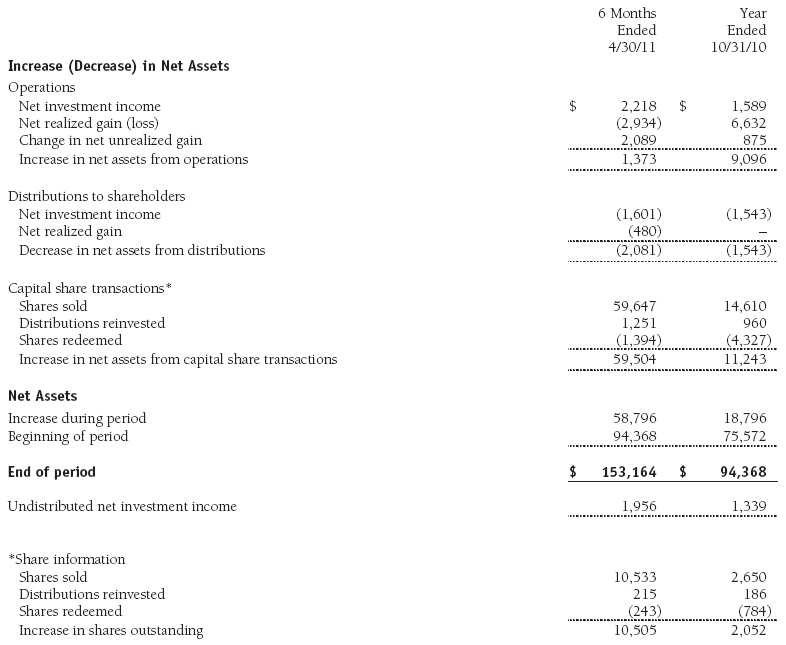
The accompanying notes are an integral part of these financial statements.
Notes to Financial Statements
T. Rowe Price Institutional Africa & Middle East Fund
April 30, 2011 (Unaudited)
T. Rowe Price Institutional International Funds, Inc. (the corporation), is registered under the Investment Company Act of 1940 (the 1940 Act). The Institutional Africa & Middle East Fund (the fund), a nondiversified, open-end management investment company, is one portfolio established by the corporation. The fund commenced operations on April 30, 2008. The fund seeks long-term growth of capital by investing primarily in the common stocks of companies located (or with primary operations) in Africa and the Middle East.
NOTE 1 - SIGNIFICANT ACCOUNTING POLICIES
Basis of Preparation The accompanying financial statements were prepared in accordance with accounting principles generally accepted in the United States of America (GAAP), which require the use of estimates made by management. Management believes that estimates and valuations are appropriate; however, actual results may differ from those estimates, and the valuations reflected in the accompanying financial statements may differ from the value ultimately realized upon sale or maturity.
Investment Transactions, Investment Income, and Distributions Income and expenses are recorded on the accrual basis. Dividends received from mutual fund investments are reflected as dividend income; capital gain distributions are reflected as realized gain/loss. Dividend income and capital gain distributions are recorded on the ex-dividend date. Income tax-related interest and penalties, if incurred, would be recorded as income tax expense. Investment transactions are accounted for on the trade date. Realized gains and losses are reported on the identified cost basis. Distributions to shareholders are recorded on the ex-dividend date. Income distributions are declared and paid annually. Capital gain distributions, if any, are generally declared and paid by the fund annually.
Currency Translation Assets, including investments, and liabilities denominated in foreign currencies are translated into U.S. dollar values each day at the prevailing exchange rate, using the mean of the bid and asked prices of such currencies against U.S. dollars as quoted by a major bank. Purchases and sales of securities, income, and expenses are translated into U.S. dollars at the prevailing exchange rate on the date of the transaction. The effect of changes in foreign currency exchange rates on realized and unrealized security gains and losses is reflected as a component of security gains and losses.
Redemption Fees A 2% fee is assessed on redemptions of fund shares held for 90 days or less to deter short-term trading and to protect the interests of long-term shareholders. Redemption fees are withheld from proceeds that shareholders receive from the sale or exchange of fund shares. The fees are paid to the fund and are recorded as an increase to paid-in capital. The fees may cause the redemption price per share to differ from the net asset value per share.
NOTE 2 - VALUATION
The fund’s financial instruments are reported at fair value as defined by GAAP. The fund determines the values of its assets and liabilities and computes its net asset value per share at the close of the New York Stock Exchange (NYSE), normally 4 p.m. ET, each day that the NYSE is open for business. Values in the accompanying Portfolio of Investments are as of April 29, 2011, the last business day in the fund’s fiscal year ended April 30, 2011. Some foreign markets were open between April 29 and the close of the reporting period on April 30, but any differences in values and foreign exchange rates subsequent to April 29 through April 30 were immaterial to the fund’s financial statements.
Valuation Methods Equity securities listed or regularly traded on a securities exchange or in the over-the-counter (OTC) market are valued at the last quoted sale price or, for certain markets, the official closing price at the time the valuations are made, except for OTC Bulletin Board securities, which are valued at the mean of the latest bid and asked prices. A security that is listed or traded on more than one exchange is valued at the quotation on the exchange determined to be the primary market for such security. Listed securities not traded on a particular day are valued at the mean of the latest bid and asked prices for domestic securities and the last quoted sale price for international securities.
Investments in mutual funds are valued at the mutual fund’s closing net asset value per share on the day of valuation.
Other investments, including restricted securities, and those financial instruments for which the above valuation procedures are inappropriate or are deemed not to reflect fair value are stated at fair value as determined in good faith by the T. Rowe Price Valuation Committee, established by the fund’s Board of Directors.
For valuation purposes, the last quoted prices of non-U.S. equity securities may be adjusted under the circumstances described below. If the fund determines that developments between the close of a foreign market and the close of the NYSE will, in its judgment, materially affect the value of some or all of its portfolio securities, the fund will adjust the previous closing prices to reflect what it believes to be the fair value of the securities as of the close of the NYSE. In deciding whether it is necessary to adjust closing prices to reflect fair value, the fund reviews a variety of factors, including developments in foreign markets, the performance of U.S. securities markets, and the performance of instruments trading in U.S. markets that represent foreign securities and baskets of foreign securities. A fund may also fair value securities in other situations, such as when a particular foreign market is closed but the fund is open. The fund uses outside pricing services to provide it with closing prices and information to evaluate and/or adjust those prices. The fund cannot predict how often it will use closing prices and how often it will determine it necessary to adjust those prices to reflect fair value. As a means of evaluating its security valuation process, the fund routinely compares closing prices, the next day’s opening prices in the same markets, and adjusted prices.
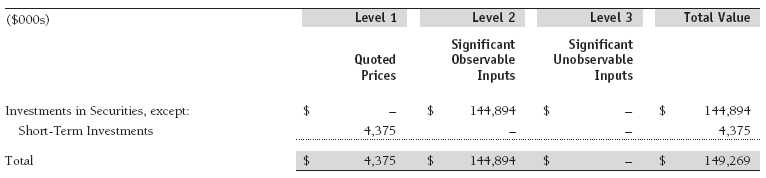
Valuation Inputs Various inputs are used to determine the value of the fund’s financial instruments. These inputs are summarized in the three broad levels listed below:
Level 1 – quoted prices in active markets for identical financial instruments
Level 2 – observable inputs other than Level 1 quoted prices (including, but not limited to, quoted prices for similar financial instruments, interest rates, prepayment speeds, and credit risk)
Level 3 – unobservable inputs
Observable inputs are those based on market data obtained from sources independent of the fund, and unobservable inputs reflect the fund’s own assumptions based on the best information available. The input levels are not necessarily an indication of the risk or liquidity associated with financial instruments at that level. For example, non-U.S. equity securities actively traded in foreign markets generally are reflected in Level 2 despite the availability of closing prices because the fund evaluates and determines whether those closing prices reflect fair value at the close of the NYSE or require adjustment, as described above. The following table summarizes the fund’s financial instruments, based on the inputs used to determine their values on April 30, 2011:
NOTE 3 - OTHER INVESTMENT TRANSACTIONS
Consistent with its investment objective, the fund engages in the following practices to manage exposure to certain risks and/or to enhance performance. The investment objective, policies, program, and risk factors of the fund are described more fully in the fund’s prospectus and Statement of Additional Information.
Emerging Markets At April 30, 2011, approximately 83% of the fund’s net assets were invested, either directly or through investments in T. Rowe Price institutional funds, in securities of companies located in emerging markets, securities issued by governments of emerging market countries, and/or securities denominated in or linked to the currencies of emerging market countries. Emerging market securities are often subject to greater price volatility, less liquidity, and higher rates of inflation than U.S. securities. In addition, emerging markets may be subject to greater political, economic and social uncertainty, and differing regulatory environments that may potentially impact the fund’s ability to buy or sell certain securities or repatriate proceeds to U.S. dollars.
Participation Notes During the six months ended April 30, 2011, the fund was a party to participation notes and other types of equity-linked derivative instruments (referred to collectively as participation notes), through which a counterparty provides exposure to common stock, in the form of an unsecured interest, in markets where direct investment by the fund is not possible. Participation notes provide the economic benefit of common stock ownership to the fund, while legal ownership and voting rights are retained by the counterparty. Although participation notes are usually structured with a defined maturity or termination date, early redemption may be possible. Risks associated with participation notes include the possible failure of a counterparty to perform in accordance with the terms of the agreement, inability to transfer or liquidate the notes, potential delays or an inability to redeem before maturity under certain market conditions, and limited legal recourse against the issuer of the underlying common stock.
Other Purchases and sales of portfolio securities other than short-term securities aggregated $78,040,000 and $24,265,000, respectively, for the six months ended April 30, 2011.
NOTE 4 - FEDERAL INCOME TAXES
No provision for federal income taxes is required since the fund intends to continue to qualify as a regulated investment company under Subchapter M of the Internal Revenue Code and distribute to shareholders all of its taxable income and gains. Distributions determined in accordance with federal income tax regulations may differ in amount or character from net investment income and realized gains for financial reporting purposes. Financial reporting records are adjusted for permanent book/tax differences to reflect tax character but are not adjusted for temporary differences. The amount and character of tax-basis distributions and composition of net assets are finalized at fiscal year-end; accordingly, tax-basis balances have not been determined as of the date of this report.
The fund intends to retain realized gains to the extent of available capital loss carryforwards. As of October 31, 2010, the fund had $25,118,000 of unused capital loss carryforwards, which all expire in fiscal 2017.
At April 30, 2011, the cost of investments for federal income tax purposes was $132,614,000. Net unrealized gain aggregated $16,655,000 at period-end, of which $21,087,000 related to appreciated investments and $4,432,000 related to depreciated investments.
NOTE 5 - RELATED PARTY TRANSACTIONS
The fund is managed by T. Rowe Price Associates, Inc. (Price Associates), a wholly owned subsidiary of T. Rowe Price Group, Inc. (Price Group). Price Associates has entered into a subadvisory agreement with T. Rowe Price International Ltd, a wholly owned subsidiary of Price Associates, to provide investment advisory services to the fund; the subadvisory agreement provides that Price Associates may pay the subadvisor up to 60% of the management fee that Price Associates receives from the fund. The fund was previously managed by T. Rowe Price International, Inc. (Price International), which was merged into its parent company, Price Associates, effective at the close of business on December 31, 2010. Thereafter, Price Associates assumed responsibility for all of Price International’s existing investment management contracts, and Price International ceased all further operations. The corporate reorganization was designed to simplify Price Group’s corporate structure related to its international business and was intended to result in no material changes in the nature, quality, level, or cost of services provided to the T. Rowe Price funds.
The investment management agreement between the fund and Price Associates provides for an annual investment management fee equal to 1.00% of the fund’s average daily net assets. The fee is computed daily and paid monthly.
The fund is also subject to a contractual expense limitation through February 28, 2013. During the limitation period, Price Associates is required to waive its management fee and reimburse the fund for any expenses, excluding interest, taxes, brokerage commissions, and extraordinary expenses that would otherwise cause the fund’s ratio of annualized total expenses to average net assets (expense ratio) to exceed its expense limitation of 1.25%. For a period of three years after the date of any reimbursement or waiver, the fund is required to repay Price Associates for expenses previously reimbursed and management fees waived to the extent its net assets have grown or expenses have declined sufficiently to allow repayment without causing the fund’s expense ratio to exceed its expense limitation. Pursuant to this agreement, management fees in the amount of $28,000 were waived and expenses in the amount of $1,000 were repaid to Price Associates during the six months ended April 30, 2011. Including these amounts, management fees waived in the amount of $424,000 remain subject to repayment at April 30, 2011.
In addition, the fund has entered into service agreements with Price Associates and a wholly owned subsidiary of Price Associates (collectively, Price). Price Associates computes the daily share price and provides certain other administrative services to the fund. T. Rowe Price Services, Inc., provides shareholder and administrative services in its capacity as the fund’s transfer and dividend disbursing agent. For the six months ended April 30, 2011, expenses incurred pursuant to these service agreements were $93,000 for Price Associates and less than $1,000 for T. Rowe Price Services, Inc. The total amount payable at period-end pursuant to these service agreements is reflected as Due to Affiliates in the accompanying financial statements.
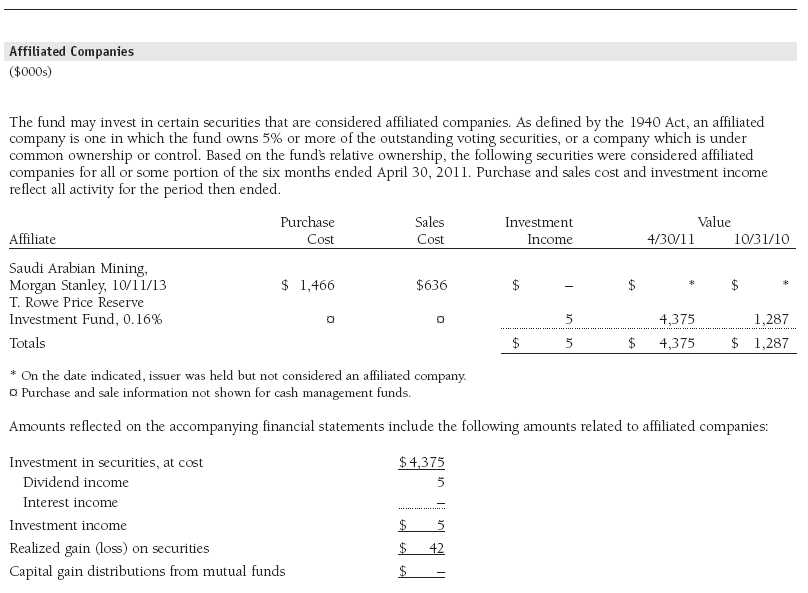
The fund may invest in the T. Rowe Price Reserve Investment Fund and the T. Rowe Price Government Reserve Investment Fund (collectively, the T. Rowe Price Reserve Investment Funds), open-end management investment companies managed by Price Associates and considered affiliates of the fund. The T. Rowe Price Reserve Investment Funds are offered as cash management options to mutual funds, trusts, and other accounts managed by Price Associates and/or its affiliates and are not available for direct purchase by members of the public. The T. Rowe Price Reserve Investment Funds pay no investment management fees.
| Information on Proxy Voting Policies, Procedures, and Records |
A description of the policies and procedures used by T. Rowe Price funds and portfolios to determine how to vote proxies relating to portfolio securities is available in each fund’s Statement of Additional Information, which you may request by calling 1-800-225-5132 or by accessing the SEC’s website, sec.gov. The description of our proxy voting policies and procedures is also available on our website, troweprice.com. To access it, click on the words “Our Company” at the top of our corporate homepage. Then, when the next page appears, click on the words “Proxy Voting Policies” on the left side of the page.
Each fund’s most recent annual proxy voting record is available on our website and through the SEC’s website. To access it through our website, follow the directions above, then click on the words “Proxy Voting Records” on the right side of the Proxy Voting Policies page.
| How to Obtain Quarterly Portfolio Holdings |
The fund files a complete schedule of portfolio holdings with the Securities and Exchange Commission for the first and third quarters of each fiscal year on Form N-Q. The fund’s Form N-Q is available electronically on the SEC’s website (sec.gov); hard copies may be reviewed and copied at the SEC’s Public Reference Room, 450 Fifth St. N.W., Washington, DC 20549. For more information on the Public Reference Room, call 1-800-SEC-0330.
| Approval of Investment Management Agreement |
On March 9, 2011, the fund’s Board of Directors (Board) unanimously approved the continuation of the investment advisory contract (Contract) between the fund and its investment advisor, T. Rowe Price Associates, Inc. (Advisor), as well as the investment subadvisory contract (Subadvisory Contract) that the Advisor has entered into with T. Rowe Price International Ltd (Subadvisor). The Board considered a variety of factors in connection with its review of the Contract and Subadvisory Contract, also taking into account information provided by the Advisor during the course of the year, as discussed below:
Services Provided by the Advisor
The Board considered the nature, quality, and extent of the services provided to the fund by the Advisor and Subadvisor. These services included, but were not limited to, management of the fund’s portfolio and a variety of related activities, as well as financial and administrative services, reporting, and communications. The Board also reviewed the background and experience of the Advisor’s and Subadvisor’s senior management teams and investment personnel involved in the management of the fund. The Board noted that a restructuring involving the Advisor and certain of its affiliated investment advisors led to a restatement of the fund’s investment advisory contract and a new investment subadvisory contract, effective at the close of business on December 31, 2010. This restructuring, which resulted in T. Rowe Price Associates, Inc., becoming the fund’s new investment advisor and T. Rowe Price International Ltd becoming the fund’s new investment subadvisor, had been determined by the Board at a meeting in October 2010 not to diminish the nature, quality, or level of services provided to the fund or to materially change the manner in which advisory services were to be provided. The Board concluded that it was satisfied with the nature, quality, and extent of the services provided by the Advisor and Subadvisor.
Investment Performance of the Fund
The Board reviewed the fund’s average annual total returns over the one-year and since-inception periods, as well as the fund’s year-by-year returns, and compared these returns with a wide variety of previously agreed upon comparable performance measures and market data, including those supplied by Lipper and Morningstar, which are independent providers of mutual fund data. This information, combined with the Board’s ongoing review of investment results and factoring in the severity of the relative market conditions during certain of the performance periods, indicated that in the Board’s view the fund’s results for certain time periods were less than satisfactory. The Advisor provided its assessment of the fund’s investment results and outlook and the Board concluded that it was satisfied with the Advisor’s response.
Costs, Benefits, Profits, and Economies of Scale
The Board reviewed detailed information regarding the revenues received by the Advisor under the Contract and other benefits that the Advisor (and its affiliates, including the Subadvisor) may have realized from its relationship with the fund, including research received under “soft dollar” agreements and commission-sharing arrangements with broker-dealers. The Board considered that the Advisor and Subadvisor may receive some benefit from soft-dollar arrangements pursuant to which research is received from broker-dealers that execute the applicable fund’s portfolio transactions. The Board also received information on the estimated costs incurred and profits realized by the Advisor and its affiliates (including the Subadvisor) from advising T. Rowe Price mutual funds. The Board did not review information regarding profits realized from managing the fund in particular because the fund had not achieved sufficient scale in terms of portfolio asset size to produce meaningful profit margin percentages. Under the Contract, the fund pays a fee to the Advisor based on the fund’s average daily net assets. Under the Subadvisory Contract, the Advisor may pay the Subadvisor up to 60% of the advisory fee that the Advisor receives from the fund. The Board concluded that the Advisor’s profits were reasonable in light of the services provided to the fund. The Board also considered whether the fund or other funds benefit under the fee levels set forth in the Contract from any economies of scale realized by the Advisor. The Board concluded that, based on the profitability data it reviewed, the advisory fee structure for the fund continued to provide for a reasonable sharing of benefits from any economies of scale with the fund’s investors.
Fees
The Board reviewed the fund’s management fee rate, operating expenses, and total expense ratio and compared them with fees and expenses of other comparable funds based on information and data supplied by Lipper. The information provided to the Board indicated that the fund’s management fee rate (after including reductions of the management fee rate that resulted from applicable fee waivers or expenses paid by the Advisor) and total expense ratio were at or below the median for comparable funds. The Board also reviewed the fee schedules for institutional accounts of the Advisor and its affiliates with similar mandates. Management provided the Board with information about the Advisor’s responsibilities and services provided to institutional account clients, which are more limited than its responsibilities for the fund and other T. Rowe Price mutual funds that it advises, and showing that the Advisor performs significant additional services and assumes greater risk for the fund and other T. Rowe Price mutual funds that it advises than it does for institutional account clients. On the basis of the information provided, the Board concluded that the fees paid by the fund under the Contract were reasonable.
Approval of the Contract
As noted, the Board approved the continuation of the Contract and Subadvisory Contract. No single factor was considered in isolation or to be determinative to the decision. Rather, the Board was assisted by the advice of independent legal counsel and concluded, in light of a weighting and balancing of all factors considered, that it was in the best interests of the fund to approve the continuation of the Contract and the Subadvisory Contract (including the fees to be charged for services thereunder).
Item 2. Code of Ethics.
A code of ethics, as defined in Item 2 of Form N-CSR, applicable to its principal executive officer, principal financial officer, principal accounting officer or controller, or persons performing similar functions is filed as an exhibit to the registrant’s annual Form N-CSR. No substantive amendments were approved or waivers were granted to this code of ethics during the registrant’s most recent fiscal half-year.
Item 3. Audit Committee Financial Expert.
Disclosure required in registrant’s annual Form N-CSR.
Item 4. Principal Accountant Fees and Services.
Disclosure required in registrant’s annual Form N-CSR.
Item 5. Audit Committee of Listed Registrants.
Not applicable.
Item 6. Investments.
(a) Not applicable. The complete schedule of investments is included in Item 1 of this Form N-CSR.
(b) Not applicable.
Item 7. Disclosure of Proxy Voting Policies and Procedures for Closed-End Management Investment Companies.
Not applicable.
Item 8. Portfolio Managers of Closed-End Management Investment Companies.
Not applicable.
Item 9. Purchases of Equity Securities by Closed-End Management Investment Company and Affiliated Purchasers.
Not applicable.
Item 10. Submission of Matters to a Vote of Security Holders.
Not applicable.
Item 11. Controls and Procedures.
(a) The registrant’s principal executive officer and principal financial officer have evaluated the registrant’s disclosure controls and procedures within 90 days of this filing and have concluded that the registrant’s disclosure controls and procedures were effective, as of that date, in ensuring that information required to be disclosed by the registrant in this Form N-CSR was recorded, processed, summarized, and reported timely.
(b) The registrant’s principal executive officer and principal financial officer are aware of no change in the registrant’s internal control over financial reporting that occurred during the registrant’s second fiscal quarter covered by this report that has materially affected, or is reasonably likely to materially affect, the registrant’s internal control over financial reporting.
Item 12. Exhibits.
(a)(1) The registrant’s code of ethics pursuant to Item 2 of Form N-CSR is filed with the registrant’s annual Form N-CSR.
(2) Separate certifications by the registrant's principal executive officer and principal financial officer, pursuant to Section 302 of the Sarbanes-Oxley Act of 2002 and required by Rule 30a-2(a) under the Investment Company Act of 1940, are attached.
(3) Written solicitation to repurchase securities issued by closed-end companies: not applicable.
(b) A certification by the registrant's principal executive officer and principal financial officer, pursuant to Section 906 of the Sarbanes-Oxley Act of 2002 and required by Rule 30a-2(b) under the Investment Company Act of 1940, is attached.
| | |
SIGNATURES |
| |
| | Pursuant to the requirements of the Securities Exchange Act of 1934 and the Investment |
| Company Act of 1940, the registrant has duly caused this report to be signed on its behalf by the |
| undersigned, thereunto duly authorized. |
| |
| T. Rowe Price Institutional International Funds, Inc. |
| |
| |
| |
| By | /s/ Edward C. Bernard |
| | Edward C. Bernard |
| | Principal Executive Officer |
| |
| Date | June 16, 2011 |
| |
| |
| |
| | Pursuant to the requirements of the Securities Exchange Act of 1934 and the Investment |
| Company Act of 1940, this report has been signed below by the following persons on behalf of |
| the registrant and in the capacities and on the dates indicated. |
| |
| |
| By | /s/ Edward C. Bernard |
| | Edward C. Bernard |
| | Principal Executive Officer |
| |
| Date | June 16, 2011 |
| |
| |
| |
| By | /s/ Gregory K. Hinkle |
| | Gregory K. Hinkle |
| | Principal Financial Officer |
| |
| Date | June 16, 2011 |