UNITED STATES
SECURITIES AND EXCHANGE COMMISSION
Washington, D.C. 20549
FORM N-CSR
CERTIFIED SHAREHOLDER REPORT OF REGISTERED
MANAGEMENT INVESTMENT COMPANIES
Investment Company Act File Number: 811-05833
| T. Rowe Price Institutional International Funds, Inc. |
| (Exact name of registrant as specified in charter) |
| 100 East Pratt Street, Baltimore, MD 21202 |
| (Address of principal executive offices) |
| David Oestreicher |
| 100 East Pratt Street, Baltimore, MD 21202 |
| (Name and address of agent for service) |
Registrant’s telephone number, including area code: (410) 345-2000
Date of fiscal year end: October 31
Date of reporting period: October 31, 2012
Item 1. Report to Shareholders
 |
| Institutional Global Large-Cap Equity Fund | October 31, 2012 |
| Highlights |
- Global equities generated strong gains in the last year but suffered setbacks in the last six months amid renewed concerns about slower global growth.
- The fund’s returns were broadly in line with its benchmark, particularly on a sector level. Stock selection in the U.S. was a slight drag on performance, while our light exposure to poorly performing Japan helped results.
- Valuations are slightly less appealing than they were one year ago, though we continue to find opportunities among high-quality companies with growing franchises, strong cash flows, and solid balance sheets.
- Despite the recession in Europe and slowdown in the U.S. and China, corporations are strategically deploying their cash reserves to grow their businesses and benefit shareholders over the long term.
The views and opinions in this report were current as of October 31, 2012. They are not guarantees of performance or investment results and should not be taken as investment advice. Investment decisions reflect a variety of factors, and the managers reserve the right to change their views about individual stocks, sectors, and the markets at any time. As a result, the views expressed should not be relied upon as a forecast of the fund’s future investment intent. The report is certified under the Sarbanes-Oxley Act, which requires mutual funds and other public companies to affirm that, to the best of their knowledge, the information in their financial reports is fairly and accurately stated in all material respects.
Manager’s Letter
T. Rowe Price Institutional Global Large-Cap Equity Fund
Dear Investor
Global stocks posted solid gains in the last year but suffered setbacks along the way due to the eurozone debt crisis, a slowdown in China, continued challenges in Japan, and the sluggish U.S. recovery. Austerity measures and a worsening recession in Europe suggested that consumer demand would remain weak for some time, though European stocks bounced back from low levels earlier in the year. In contrast, the U.S. economy improved throughout the year, helped by low interest rates and further easing by the Federal Reserve. Corporations continued to sport attractive balance sheets and deployed their cash reserves strategically to update technology and expand markets. While we became more defensive in the second half of the fiscal year, we bought a number of high-quality companies with growing franchises, strong cash flows, and solid balance sheets that should prosper during the next phase of the economic cycle.
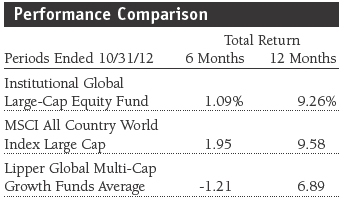
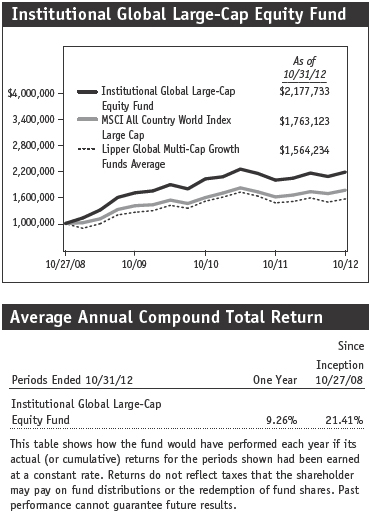
Your fund returned 1.09% and 9.26%, respectively, for the 6- and 12-month periods ended October 31, 2012. The fund slightly lagged results of the MSCI All Country World Index Large Cap for the full year but surpassed returns of the Lipper Global Multi-Cap Growth Funds Average. On July 20, 2012, Lipper’s new holdings-based equity methodology resulted in reclassification of the fund. Previously, the fund was classified in the Lipper Global Large-Cap Growth Funds Average category. The fund’s long-term relative performance remained strong. Based on cumulative total return, Lipper ranked the Institutional Global Large-Cap Equity Fund 76 of 210, 59 of 144, and 18 of 106 global multi-cap growth funds for the one- and three-year and since-inception* (10/27/08) periods ended October 31, 2012, respectively. (Results will vary for other periods. Past performance cannot guarantee future results.)
* The Lipper since-inception ranking was calculated from 10/31/2008 through 10/31/2012.
Stock selection among financials was largely responsible for the fund’s underperformance versus the index in the last six months. Our overweight to information technology also weighed on relative returns. Stock selection in the industrials and business services sector boosted results. Meanwhile, security selection in developed Europe hindered results but was largely offset by stock selection in emerging markets.
Market Review
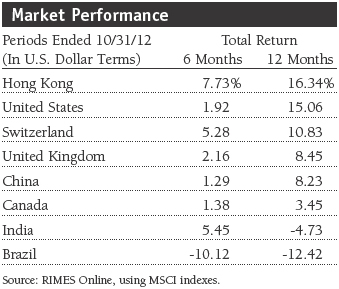
Global markets faltered last spring amid concerns that the eurozone might collapse as Europeans questioned the wisdom of widespread fiscal austerity measures that pushed deficit levels lower but dimmed prospects for growth. Voters in France turned to a socialist government, the latest sign that budget cuts and tax increases were taking a toll on the population. The finances of Spain and Italy weakened during the period, and bond yields rose to unsustainable levels last summer. In contrast, the U.S. economy appeared to strengthen early in the year, with encouraging signs in housing and employment. But while the U.S. economy notched regular improvements, growth remained subdued, and markets faltered as investors feared that the eurozone crisis would imperil the fragile U.S. recovery. Growth in emerging markets economies, led by China and Brazil, also continued to tail off, exacerbating concerns that the U.S. manufacturing sector, which has expanded steadily since 2009, was beginning to weaken.
Fiscal stimulus measures were effectively stymied in the developed world. In Europe, Germany leaned heavily on its eurozone partners to abide by legal agreements to reduce deficits, which resulted in massive austerity measures. The U.S. presidential election featured an intense debate over taxes and spending, but measures to resolve the year-end “fiscal cliff” of deep spending cuts and tax hikes were delayed.
Monetarists rode to the rescue, with the European Central Bank (ECB) and Federal Reserve implementing measures intended to ease the eurozone crisis and avoid a stalled U.S. recovery. In February the ECB launched its second long-term refinancing operation. The combined measures provided more than €1 trillion in cheap three-year loans to hundreds of European banks. The loans are intended to help the banks reduce debt and buy European government bonds to help keep borrowing costs down. The programs were followed in September by the more significant ECB decision to buy sovereign short-term debt of troubled countries that seek formal financial assistance and agree to implement reforms. Meanwhile, the Fed last summer extended “Operation Twist,” a program designed to suppress long-term interest rates and lower borrowing costs, through the end of the year, followed by its decision to implement an open-ended monthly program to buy $40 billion in agency mortgage-backed securities. The Fed also extended its policy rate guidance by half a year, through mid-2015. In emerging markets, China cut interest rates and implemented a stimulus measure to reverse the slowdown, while Brazil cut its benchmark interest rate to an all-time low of 7.25% in October.
Corporate profits were solid through the second quarter but began to weaken in the fall amid the economic slowdown. Many corporations also issued cautious forecasts for the coming several quarters, as the European recession and slower growth throughout most of the world were expected to trim profits. Nonetheless, corporate balance sheets remained relatively healthy, in our view, and many businesses deployed their resources to upgrade technology and expand into select markets.
Performance Review and Strategy
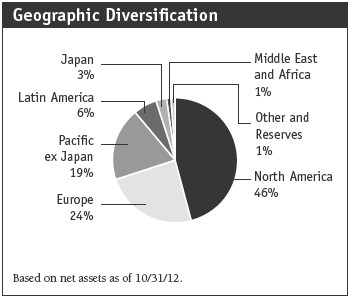
Our focus remains on applying fundamental research to identify stocks with the best prospects for long-term gains. While we believe that valuations vary on a company level, we have maintained a generally broad neutral sector stance. On a regional level, we continue to maintain a significant exposure to emerging markets, where many companies are benefiting from a growing middle class. In recent months, we have increased our positions in smaller emerging markets, such as the Philippines, Indonesia, Malaysia, and others where weakening Chinese demand has less impact than in most emerging markets. We also increased our exposure to European stocks, many of which we believe were undervalued due to the unsettling economic crosscurrents on the Continent. Our Japan holdings remain modest, reflecting the growth-constrained environment of the aging society.
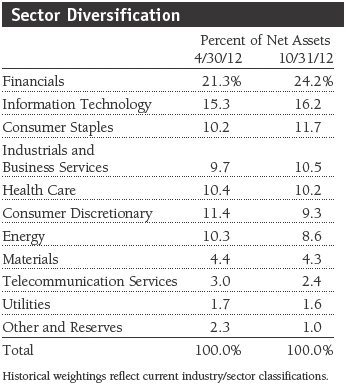
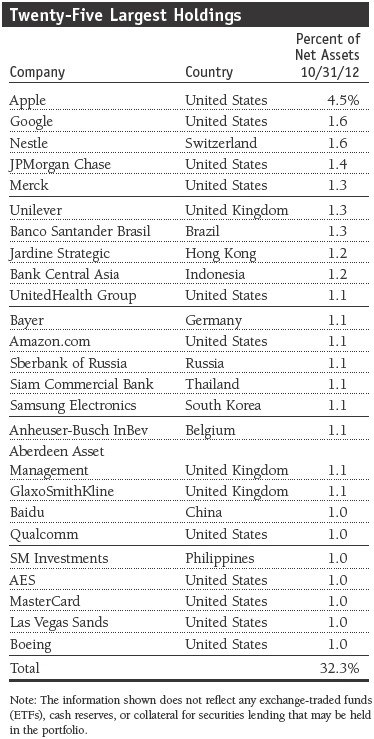
Financials continues to represent the largest share of the portfolio. We are finding solid commercial banks in emerging markets with traditional loan growth linked to gross domestic product growth. We participated in the initial public offering of Banco Santander Mexico, a well-run bank in a growing end market that was offered at an attractive valuation. Mexico’s economy has improved over the past two years, in part because of its trade relationship with and proximity to the recovering U.S. market. The country is also seeing an increase in consumer demand thanks to its growing middle class, a theme we are investing in throughout the globe. We also bought shares of Qatar National Bank, which is operating in one of the better economies in the Middle East. We also continue to have exposure to well-managed Indian institutions, such as Axis Bank and HDFC Bank that should benefit as the country tackles inflation. We continue to hold Banco Santander Brasil, which declined due to a poor credit cycle and growth rates that were worse than we had expected. However, the country has moved aggressively to lower interest rates to spur growth, and we believe these measures will help. We bought shares of Bank of America, a likely beneficiary of the stabilizing U.S. housing market and recent improvement in the credit cycle. Its valuation remains attractive, and the firm’s cost-cutting initiatives have been effective. (Please refer to the portfolio of investments for a detailed list of holdings and the amount each represents in the portfolio.)
We maintained an overweight position to information technology and are finding a number of companies providing outsourcing solutions. We initiated a position in Cognizant Technology Solutions (U.S.), a consulting firm that should continue to benefit from the long-term outsourcing trend. We also bought shares of microprocessor ARM Holdings (UK) after it declined on poor earnings results amid the downturn. We believe the company’s chips, which use less battery power than its competitors’, will help it gain market share in the tablet device industry. We sold shares of Broadcom (U.S.) on valuation. We continue to hold social networking site LinkedIn (U.S.), which offers a natural ecosystem to connect people by incentivizing users to expand contacts.
Among health care stocks, we eliminated pharmacy benefit managers and other companies that stand to benefit from the use of generic drugs in favor of drug manufacturers with promising pipelines, such as Gilead Sciences (U.S.), Alexion Pharmaceuticals (U.S.), and Valeant Pharmaceuticals International (Canada). We bought shares of Merck (U.S.), which is growing its health and beauty businesses and has an appealing valuation. It also stands to benefit from the waning generic drug threat to its products. Bayer (Germany) was a top performer. We initiated a position in the diversified pharmaceutical following a steep decline in its share price more than a year ago.
Industrials and business services stocks performed well in the last six months, driven in part by holdings in the aerospace and defense industry. Rolls-Royce (UK) turned in a solid performance. Despite global cyclical weakness, aerospace manufacturers enjoy a significant backlog of new airplane orders, resulting in steady demand for Rolls-Royce engines. The company has met production targets and offers strong recurring revenues due to a reliable book of servicing contracts. Likewise, Precision Castparts (U.S.), a new holding, also has exposure to commercial aerospace through its commercial metal components and castings products. Our emerging markets holdings also continue to gain market share. We own industrial conglomerate SM Investments (Philippines) and global port operator DP World (United Arab Emirates).
We remain underweight to energy due to modest growth expectations in the sector and our view that the commodities supercycle is coming to an end. While we reduced our exposure to companies dependent on rising commodities prices to boost profits, we increased our allocation to U.S. oil and shale gas producers. Pipeline companies Spectra Energy (U.S.) and Williams Companies (U.S.) should continue to benefit from the natural gas boom, though the current glut of natural gas trimmed their gains in the last six months. Likewise, we believe that U.S. oil and natural gas producers Cimarex Energy, Apache, and Range Resources have some of the best prospects in the industry.
In the consumer discretionary sector, we favor companies that are benefiting from emerging markets growth. We trimmed our position in luxury goods maker Richemont (Switzerland) but believe its long-term prospects are strong. We established a position in media company Astro Malaysia Holdings, which operates in the television, radio, and satellite segments and provides mobile and Internet platforms. Chinese online travel portal operator Ctrip.com declined as worries over growth in China became more acute. Shares also came under pressure after the company issued a disappointing earnings report and guidance for the fourth quarter that was below expectations. While the company holds a strong position in the retail travel space, its position in corporate travel is not as healthy, which is disconcerting as corporate travel growth rates in China are much stronger than in retail travel. We eliminated the holding as a result.
Outlook
Central banks across the globe have provided critical support in the last year, which has helped many weakening economies avoid worse fates. The U.S. recovery has accelerated, as evidenced by improvements in the housing market, the employment picture, and consumer sentiment. In the aftermath of its presidential and congressional elections, the U.S. government remains divided. But we are hopeful that President Obama and congressional Republicans will begin to confront, if not resolve, the nation’s fiscal challenges. Europe appears to be moving in the right direction to get its finances in order. However, a number of minefields remain, particularly in Greece and Spain, which may be forced to seek more ECB support. We believe that China and Brazil are taking the necessary steps to improve their economies.
Despite tempered profit warnings issued by many corporations, we see numerous investment opportunities. Outstanding growth companies with healthy balance sheets are plentiful, and many have been overlooked by investors due to widespread risk aversion. We are focusing on company-specific attributes rather than broad macroeconomic prosperity, and we have been able to establish positions in solid companies featuring attractive valuations following market weakness.
We will continue to leverage our global research platform to uncover unique opportunities. Our portfolio will remain focused on stocks that are growing earnings because of their business models—companies with unique products and a demonstrated ability to innovate, adapt, and capitalize on consumer growth trends. We believe our portfolio holdings can increase their pricing power and earnings growth if they execute successfully in the months ahead.
As always, thank you for investing with T. Rowe Price.
Respectfully submitted,
R. Scott Berg
Chairman of the fund’s Investment Advisory Committee
November 15, 2012
The committee chairman has day-to-day responsibility for managing the portfolio and works with committee members in developing and executing the fund’s investment program.
| Risks of International Investing |
Funds that invest overseas generally carry more risk than funds that invest strictly in U.S. assets. Funds investing in a single country or in a limited geographic region tend to be riskier than more diversified funds. Risks can result from varying stages of economic and political development; differing regulatory environments, trading days, and accounting standards; and higher transaction costs of non-U.S. markets. Non-U.S. investments are also subject to currency risk, or a decline in the value of a foreign currency versus the U.S. dollar, which reduces the dollar value of securities denominated in that currency.
| Glossary |
Gross domestic product: The total market value of all goods and services produced in a country in a given year.
Lipper averages: The average of available mutual fund performance returns in categories defined by Lipper Inc.
MSCI All Country World Index Large Cap: A capitalization-weighted index of stocks from developed and emerging markets worldwide.
Portfolio Highlights
Performance and Expenses
T. Rowe Price Institutional Global Large-Cap Equity Fund
| Performance Comparison |
This chart shows the value of a hypothetical $1 million investment in the fund over the past 10 fiscal year periods or since inception (for funds lacking 10-year records). The result is compared with benchmarks, which may include a broad-based market index and a peer group average or index. Market indexes do not include expenses, which are deducted from fund returns as well as mutual fund averages and indexes.
Fund Expense Example
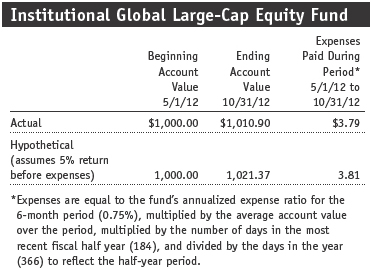
As a mutual fund shareholder, you may incur two types of costs: (1) transaction costs, such as redemption fees or sales loads, and (2) ongoing costs, including management fees, distribution and service (12b-1) fees, and other fund expenses. The following example is intended to help you understand your ongoing costs (in dollars) of investing in the fund and to compare these costs with the ongoing costs of investing in other mutual funds. The example is based on an investment of $1,000 invested at the beginning of the most recent six-month period and held for the entire period.
Actual Expenses
The first line of the following table (Actual) provides information about actual account values and actual expenses. You may use the information on this line, together with your account balance, to estimate the expenses that you paid over the period. Simply divide your account value by $1,000 (for example, an $8,600 account value divided by $1,000 = 8.6), then multiply the result by the number on the first line under the heading “Expenses Paid During Period” to estimate the expenses you paid on your account during this period.
Hypothetical Example for Comparison Purposes
The information on the second line of the table (Hypothetical) is based on hypothetical account values and expenses derived from the fund’s actual expense ratio and an assumed 5% per year rate of return before expenses (not the fund’s actual return). You may compare the ongoing costs of investing in the fund with other funds by contrasting this 5% hypothetical example and the 5% hypothetical examples that appear in the shareholder reports of the other funds. The hypothetical account values and expenses may not be used to estimate the actual ending account balance or expenses you paid for the period.
You should also be aware that the expenses shown in the table highlight only your ongoing costs and do not reflect any transaction costs, such as redemption fees or sales loads. Therefore, the second line of the table is useful in comparing ongoing costs only and will not help you determine the relative total costs of owning different funds. To the extent a fund charges transaction costs, however, the total cost of owning that fund is higher.
Financial Highlights
T. Rowe Price Institutional Global Large-Cap Equity Fund
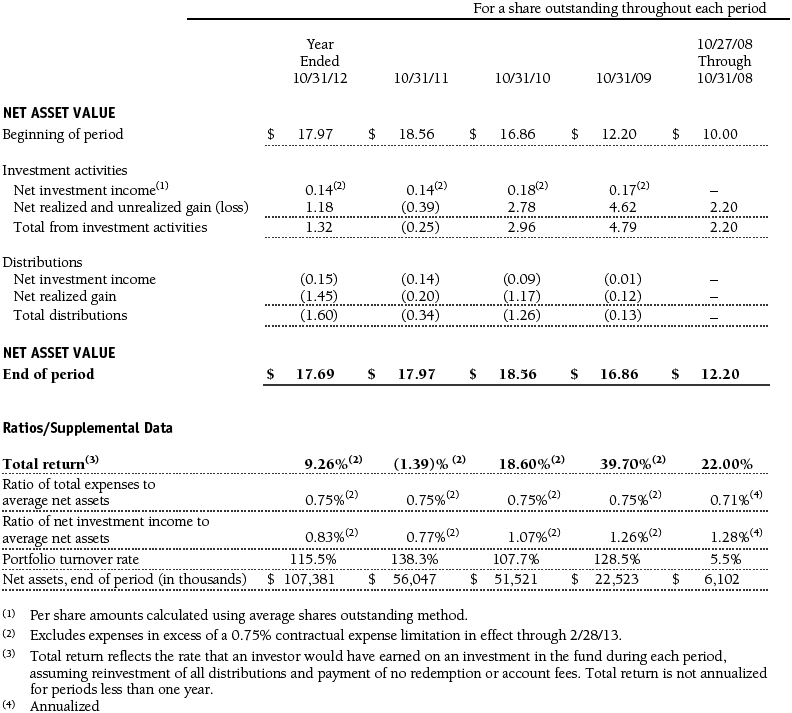
The accompanying notes are an integral part of these financial statements.
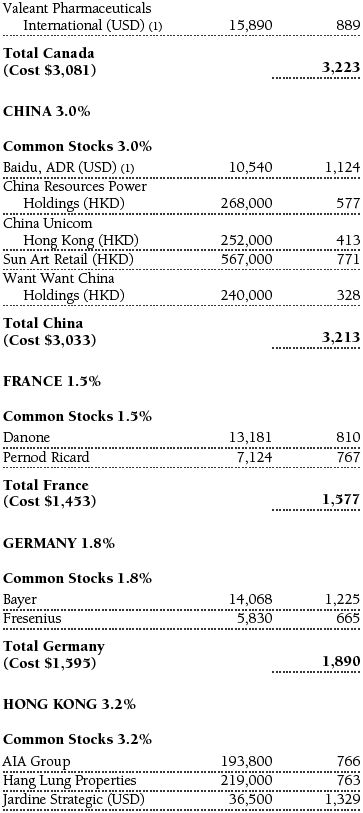
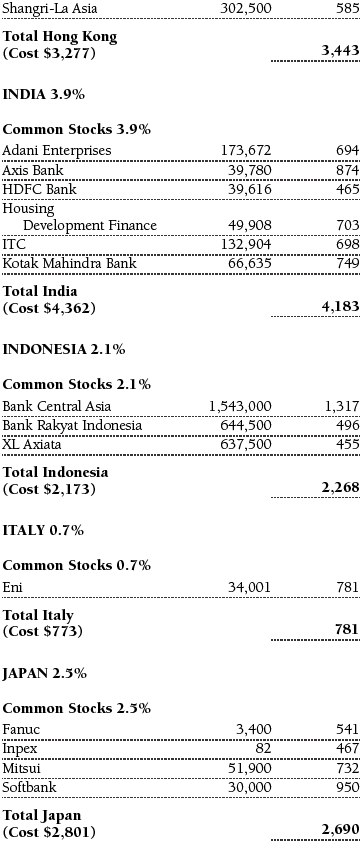
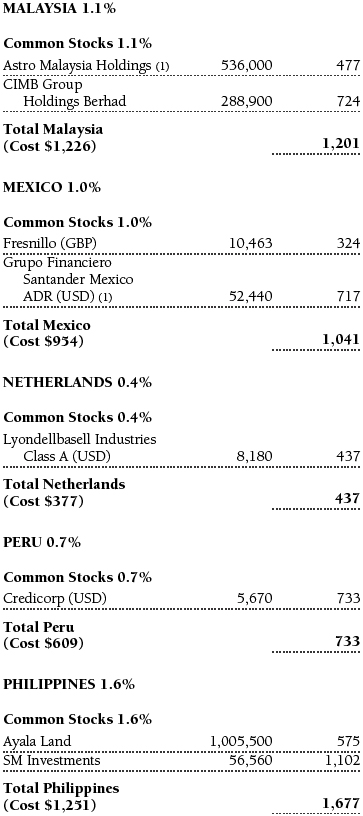
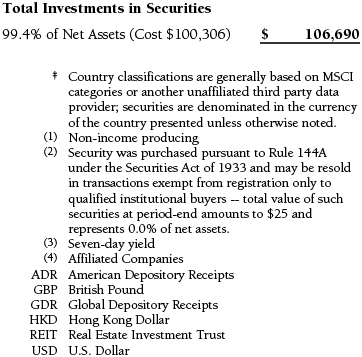
Portfolio of Investments‡
T. Rowe Price Institutional Global Large-Cap Equity Fund
October 31, 2012
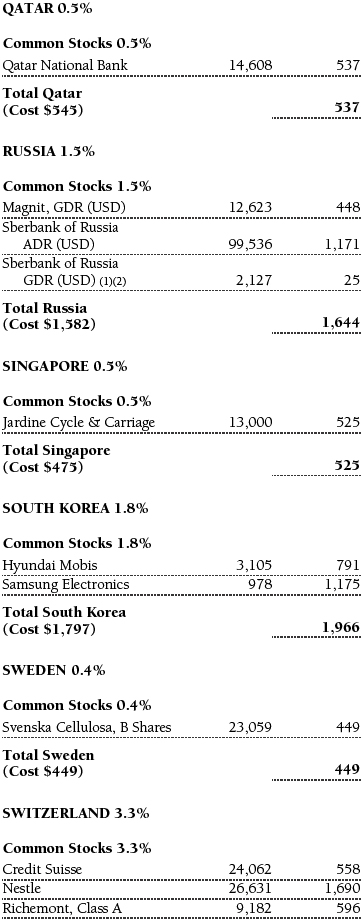
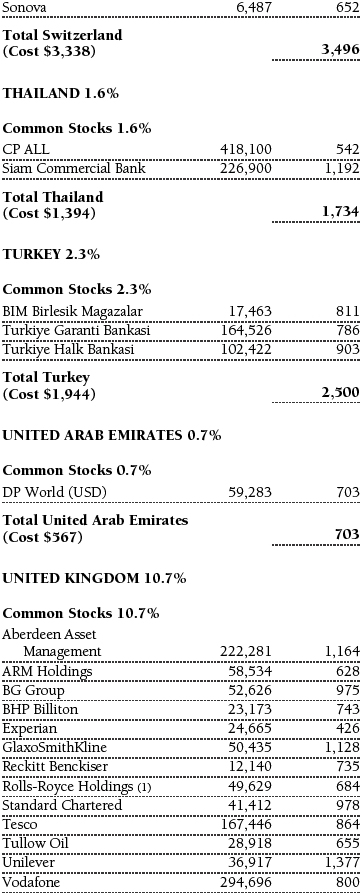
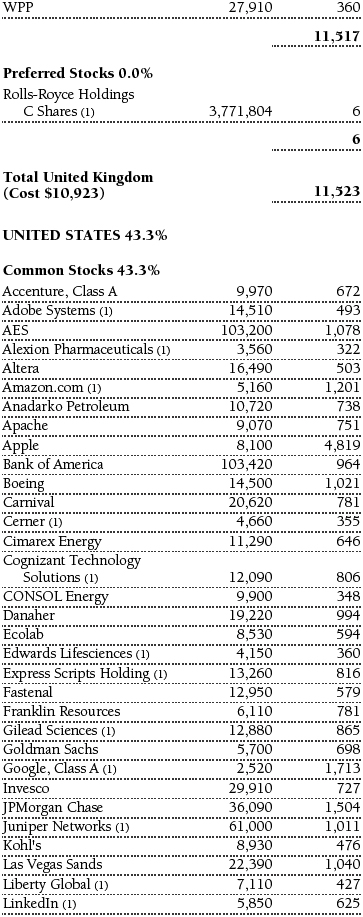
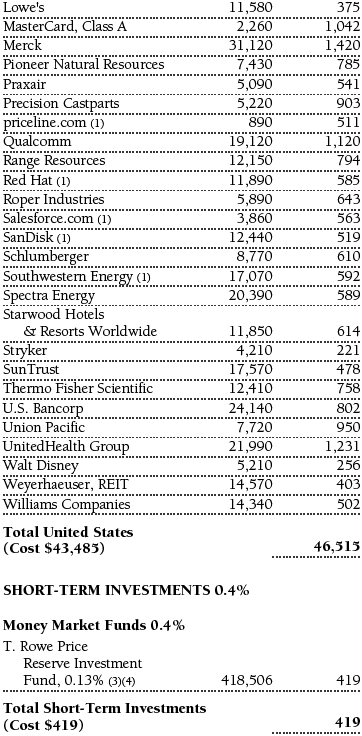
The accompanying notes are an integral part of these financial statements.
Statement of Assets and Liabilities
T. Rowe Price Institutional Global Large-Cap Equity Fund
October 31, 2012
($000s, except shares and per share amounts)
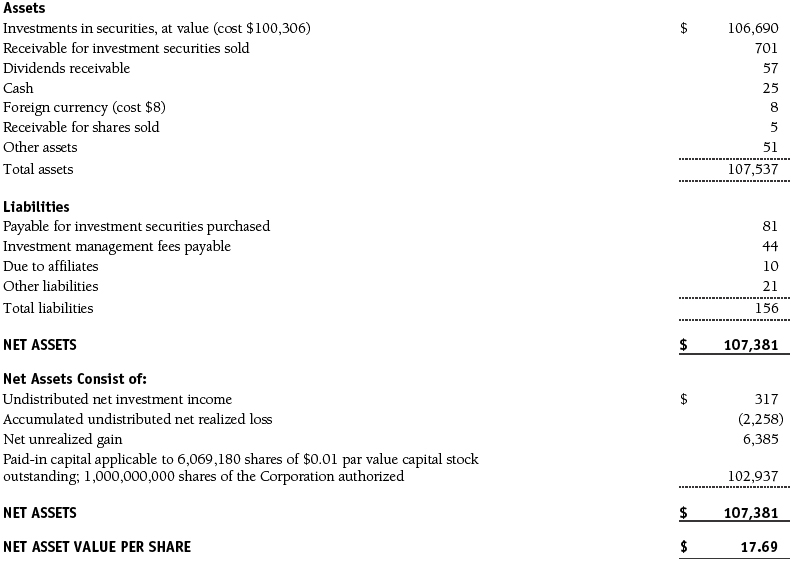
The accompanying notes are an integral part of these financial statements.
Statement of Operations
T. Rowe Price Institutional Global Large-Cap Equity Fund
($000s)
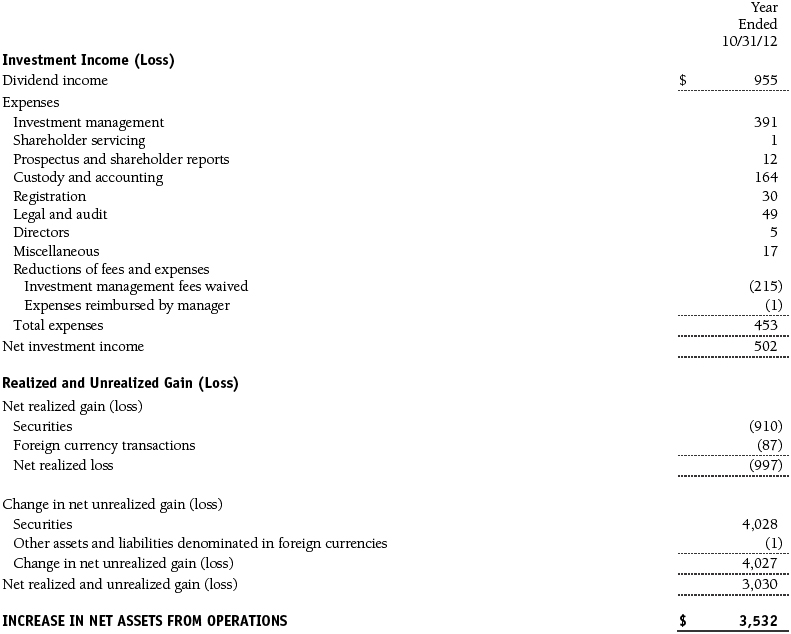
The accompanying notes are an integral part of these financial statements.
Statement of Changes in Net Assets
T. Rowe Price Institutional Global Large-Cap Equity Fund
($000s)
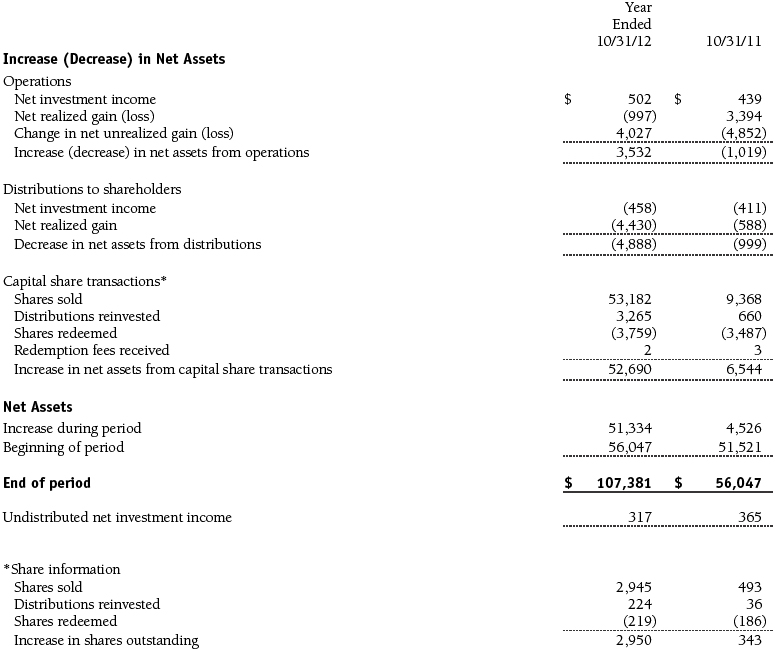
The accompanying notes are an integral part of these financial statements.
Notes to Financial Statements
T. Rowe Price Institutional Global Large-Cap Equity Fund
October 31, 2012
T. Rowe Price Institutional International Funds, Inc. (the corporation), is registered under the Investment Company Act of 1940 (the 1940 Act). The Institutional Global Large-Cap Equity Fund (the fund) is a diversified, open-end management investment company established by the corporation. The fund commenced operations on October 27, 2008. The fund seeks long-term growth of capital through investments primarily in the common stocks of large-cap companies throughout the world, including the U.S.
NOTE 1 - SIGNIFICANT ACCOUNTING POLICIES
Basis of Preparation The accompanying financial statements were prepared in accordance with accounting principles generally accepted in the United States of America (GAAP), which require the use of estimates made by management. Management believes that estimates and valuations are appropriate; however, actual results may differ from those estimates, and the valuations reflected in the accompanying financial statements may differ from the value ultimately realized upon sale or maturity.
Investment Transactions, Investment Income, and Distributions Income and expenses are recorded on the accrual basis. Dividends received from mutual fund investments are reflected as dividend income; capital gain distributions are reflected as realized gain/loss. Dividend income and capital gain distributions are recorded on the ex-dividend date. Income tax-related interest and penalties, if incurred, would be recorded as income tax expense. Investment transactions are accounted for on the trade date. Realized gains and losses are reported on the identified cost basis. Distributions to shareholders are recorded on the ex-dividend date. Income distributions are declared and paid annually. Capital gain distributions, if any, are generally declared and paid by the fund annually.
Currency Translation Assets, including investments, and liabilities denominated in foreign currencies are translated into U.S. dollar values each day at the prevailing exchange rate, using the mean of the bid and asked prices of such currencies against U.S. dollars as quoted by a major bank. Purchases and sales of securities, income, and expenses are translated into U.S. dollars at the prevailing exchange rate on the date of the transaction. The effect of changes in foreign currency exchange rates on realized and unrealized security gains and losses is reflected as a component of security gains and losses.
Credits The fund earns credits on temporarily uninvested cash balances held at the custodian, which reduce the fund’s custody charges. Custody expense in the accompanying financial statements is presented before reduction for credits.
Redemption Fees A 2% fee is assessed on redemptions of fund shares held for 90 days or less to deter short-term trading and to protect the interests of long-term shareholders. Redemption fees are withheld from proceeds that shareholders receive from the sale or exchange of fund shares. The fees are paid to the fund and are recorded as an increase to paid-in capital. The fees may cause the redemption price per share to differ from the net asset value per share.
New Accounting Pronouncements In May 2011, the Financial Accounting Standards Board (FASB) issued amended guidance to align fair value measurement and disclosure requirements in U.S. GAAP with International Financial Reporting Standards. The guidance is effective for fiscal years and interim periods beginning on or after December 15, 2011. Adoption had no effect on net assets or results of operations.
In December 2011, the FASB issued amended guidance to enhance disclosure for offsetting assets and liabilities. The guidance is effective for fiscal years and interim periods beginning on or after January 1, 2013. Adoption will have no effect on the fund’s net assets or results of operations.
NOTE 2 - VALUATION
The fund’s financial instruments are reported at fair value as defined by GAAP. The fund determines the values of its assets and liabilities and computes its net asset value per share at the close of the New York Stock Exchange (NYSE), normally 4 p.m. ET, each day that the NYSE is open for business.
Valuation Methods Equity securities listed or regularly traded on a securities exchange or in the over-the-counter (OTC) market are valued at the last quoted sale price or, for certain markets, the official closing price at the time the valuations are made, except for OTC Bulletin Board securities, which are valued at the mean of the latest bid and asked prices. A security that is listed or traded on more than one exchange is valued at the quotation on the exchange determined to be the primary market for such security. Listed securities not traded on a particular day are valued at the mean of the latest bid and asked prices for domestic securities and the last quoted sale price for international securities.
Investments in mutual funds are valued at the mutual fund’s closing net asset value per share on the day of valuation.
Other investments, including restricted securities and private placements, and those financial instruments for which the above valuation procedures are inappropriate or are deemed not to reflect fair value, are stated at fair value as determined in good faith by the T. Rowe Price Valuation Committee, established by the fund’s Board of Directors (the Board). Subject to oversight by the Board, the Valuation Committee develops pricing-related policies and procedures and approves all fair-value determinations. The Valuation Committee regularly makes good faith judgments, using a wide variety of sources and information, to establish and adjust valuations of certain securities as events occur and circumstances warrant. For instance, in determining the fair value of private-equity instruments, the Valuation Committee considers a variety of factors, including the company’s business prospects, its financial performance, strategic events impacting the company, relevant valuations of similar companies, new rounds of financing, and any negotiated transactions of significant size between other investors in the company. Because any fair-value determination involves a significant amount of judgment, there is a degree of subjectivity inherent in such pricing decisions.
For valuation purposes, the last quoted prices of non-U.S. equity securities may be adjusted under the circumstances described below. If the fund determines that developments between the close of a foreign market and the close of the NYSE will, in its judgment, materially affect the value of some or all of its portfolio securities, the fund will adjust the previous closing prices to reflect what it believes to be the fair value of the securities as of the close of the NYSE. In deciding whether it is necessary to adjust closing prices to reflect fair value, the fund reviews a variety of factors, including developments in foreign markets, the performance of U.S. securities markets, and the performance of instruments trading in U.S. markets that represent foreign securities and baskets of foreign securities. A fund may also fair value securities in other situations, such as when a particular foreign market is closed but the fund is open. The fund uses outside pricing services to provide it with closing prices and information to evaluate and/or adjust those prices. The fund cannot predict how often it will use closing prices and how often it will determine it necessary to adjust those prices to reflect fair value. As a means of evaluating its security valuation process, the fund routinely compares closing prices, the next day’s opening prices in the same markets, and adjusted prices. Additionally, trading in the underlying securities of the fund may take place in various foreign markets on certain days when the fund is not open for business and does not calculate a net asset value. As a result, net asset values may be significantly affected on days when shareholders cannot make transactions.
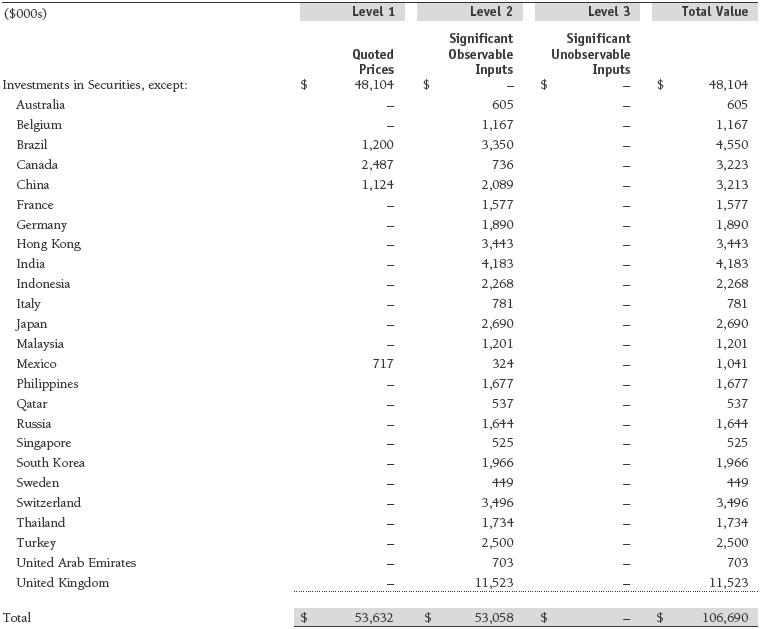
Valuation Inputs Various inputs are used to determine the value of the fund’s financial instruments. These inputs are summarized in the three broad levels listed below:
Level 1 – quoted prices in active markets for identical financial instruments
Level 2 – observable inputs other than Level 1 quoted prices (including, but not limited to, quoted prices for similar financial instruments, interest rates, prepayment speeds, and credit risk)
Level 3 – unobservable inputs
Observable inputs are those based on market data obtained from sources independent of the fund, and unobservable inputs reflect the fund’s own assumptions based on the best information available. The input levels are not necessarily an indication of the risk or liquidity associated with financial instruments at that level. For example, non-U.S. equity securities actively traded in foreign markets generally are reflected in Level 2 despite the availability of closing prices because the fund evaluates and determines whether those closing prices reflect fair value at the close of the NYSE or require adjustment, as described above. The following table summarizes the fund’s financial instruments, based on the inputs used to determine their values on October 31, 2012:
NOTE 3 - OTHER INVESTMENT TRANSACTIONS
Consistent with its investment objective, the fund engages in the following practices to manage exposure to certain risks and/or to enhance performance. The investment objective, policies, program, and risk factors of the fund are described more fully in the fund’s prospectus and Statement of Additional Information.
Emerging Markets At October 31, 2012, approximately 26% of the fund’s net assets were invested, either directly or through investments in T. Rowe Price institutional funds, in securities of companies located in emerging markets, securities issued by governments of emerging market countries, and/or securities denominated in or linked to the currencies of emerging market countries. Emerging market securities are often subject to greater price volatility, less liquidity, and higher rates of inflation than U.S. securities. In addition, emerging markets may be subject to greater political, economic, and social uncertainty, and differing regulatory environments that may potentially impact the fund’s ability to buy or sell certain securities or repatriate proceeds to U.S. dollars.
Restricted Securities The fund may invest in securities that are subject to legal or contractual restrictions on resale. Prompt sale of such securities at an acceptable price may be difficult and may involve substantial delays and additional costs.
Other Purchases and sales of portfolio securities other than short-term securities aggregated $117,070,000 and $68,069,000, respectively, for the year ended October 31, 2012.
NOTE 4 - FEDERAL INCOME TAXES
No provision for federal income taxes is required since the fund intends to continue to qualify as a regulated investment company under Subchapter M of the Internal Revenue Code and distribute to shareholders all of its taxable income and gains. Distributions determined in accordance with federal income tax regulations may differ in amount or character from net investment income and realized gains for financial reporting purposes. Financial reporting records are adjusted for permanent book/tax differences to reflect tax character but are not adjusted for temporary differences.
The fund files U.S. federal, state, and local tax returns as required. The fund’s tax returns are subject to examination by the relevant tax authorities until expiration of the applicable statute of limitations, which is generally three years after the filing of the tax return but which can be extended to six years in certain circumstances. Tax returns for open years have incorporated no uncertain tax positions that require a provision for income taxes.
Reclassifications between income and gain relate primarily to the character of net currency losses. For the year ended October 31, 2012, the following reclassifications were recorded to reflect tax character (there was no impact on results of operations or net assets):

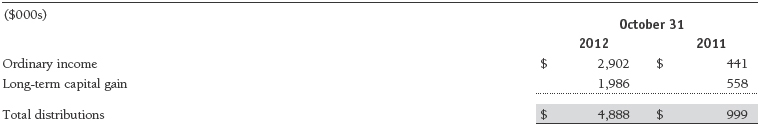
Distributions during the years ended October 31, 2012 and October 31, 2011, were characterized for tax purposes as follows:
At October 31, 2012, the tax-basis cost of investments and components of net assets were as follows:
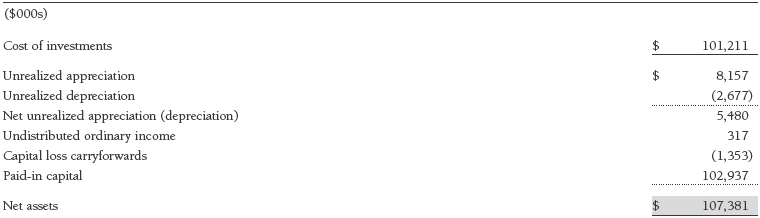
The difference between book-basis and tax-basis net unrealized appreciation (depreciation) is attributable to the deferral of losses from wash sales for tax purposes. The fund intends to retain realized gains to the extent of available capital loss carryforwards. Net realized capital losses may be carried forward indefinitely to offset future realized capital gains.
NOTE 5 - RELATED PARTY TRANSACTIONS
The fund is managed by T. Rowe Price Associates, Inc. (Price Associates), a wholly owned subsidiary of T. Rowe Price Group, Inc. (Price Group). The investment management agreement between the fund and Price Associates provides for an annual investment management fee equal to 0.65% of the fund’s average daily net assets. The fee is computed daily and paid monthly.
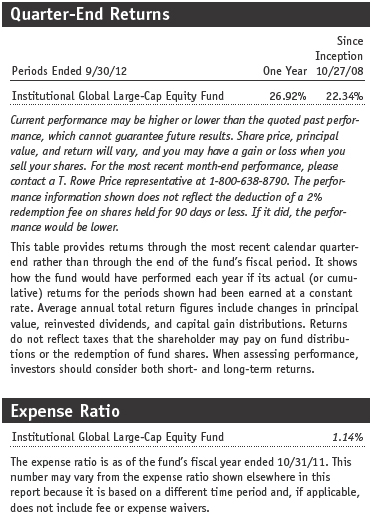
The fund is also subject to a contractual expense limitation through February 28, 2013. During the limitation period, Price Associates is required to waive its management fee and reimburse the fund for any expenses, excluding interest, taxes, brokerage commissions, and extraordinary expenses, that would otherwise cause the fund’s ratio of annualized total expenses to average net assets (expense ratio) to exceed its expense limitation of 0.75%. For a period of three years after the date of any reimbursement or waiver, the fund is required to repay Price Associates for expenses previously reimbursed and management fees waived to the extent its net assets have grown or expenses have declined sufficiently to allow repayment without causing the fund’s expense ratio to exceed its expense limitation. Pursuant to this agreement, management fees in the amount of $215,000 were waived and expenses in the amount of $1,000 were reimbursed by Price Associates during the year ended October 31, 2012. Including these amounts, management fees waived and expenses previously reimbursed by Price Associates in the amount of $661,000 remain subject to repayment by the fund at October 31, 2012.
In addition, the fund has entered into service agreements with Price Associates and a wholly owned subsidiary of Price Associates (collectively, Price). Price Associates computes the daily share price and provides certain other administrative services to the fund. T. Rowe Price Services, Inc., provides shareholder and administrative services in its capacity as the fund’s transfer and dividend disbursing agent. For the year ended October 31, 2012, expenses incurred pursuant to these service agreements were $122,000 for Price Associates and $1,000 for T. Rowe Price Services, Inc. The total amount payable at period-end pursuant to these service agreements is reflected as Due to Affiliates in the accompanying financial statements.
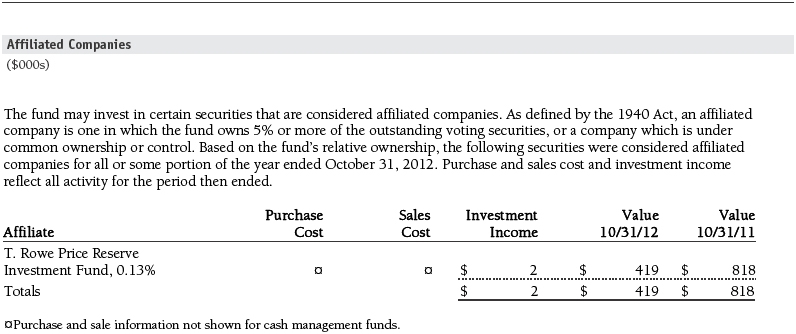
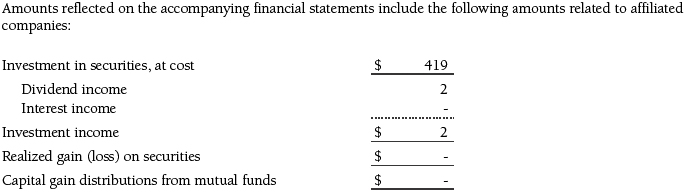
The fund may invest in the T. Rowe Price Reserve Investment Fund and the T. Rowe Price Government Reserve Investment Fund (collectively, the T. Rowe Price Reserve Investment Funds), open-end management investment companies managed by Price Associates and considered affiliates of the fund. The T. Rowe Price Reserve Investment Funds are offered as cash management options to mutual funds, trusts, and other accounts managed by Price Associates and/or its affiliates and are not available for direct purchase by members of the public. The T. Rowe Price Reserve Investment Funds pay no investment management fees.
As of October 31, 2012, T. Rowe Price Group, Inc., and/or its wholly owned subsidiaries owned 500,000 shares of the fund, representing 8% of the fund’s net assets.
Report of Independent Registered Public Accounting Firm
To the Board of Directors of T. Rowe Price Institutional International Funds, Inc. and
Shareholders of T. Rowe Price Institutional Global Large-Cap Equity Fund
In our opinion, the accompanying statement of assets and liabilities, including the portfolio of investments, and the related statements of operations and of changes in net assets and the financial highlights present fairly, in all material respects, the financial position of T. Rowe Price Institutional Global Large-Cap Equity Fund (one of the portfolios comprising T. Rowe Price Institutional International Funds, Inc., hereafter referred to as the “Fund”) at October 31, 2012, and the results of its operations, the changes in its net assets and the financial highlights for each of the periods indicated therein, in conformity with accounting principles generally accepted in the United States of America. These financial statements and financial highlights (hereafter referred to as “financial statements”) are the responsibility of the Fund’s management; our responsibility is to express an opinion on these financial statements based on our audits. We conducted our audits of these financial statements in accordance with the standards of the Public Company Accounting Oversight Board (United States). Those standards require that we plan and perform the audit to obtain reasonable assurance about whether the financial statements are free of material misstatement. An audit includes examining, on a test basis, evidence supporting the amounts and disclosures in the financial statements, assessing the accounting principles used and significant estimates made by management, and evaluating the overall financial statement presentation. We believe that our audits, which included confirmation of securities at October 31, 2012 by correspondence with the custodian and brokers, and confirmation of the underlying funds by correspondence with the transfer agent, provide a reasonable basis for our opinion.
PricewaterhouseCoopers LLP
Baltimore, Maryland
December 14, 2012
| Tax Information (Unaudited) for the Tax Year Ended 10/31/12 |
We are providing this information as required by the Internal Revenue Code. The amounts shown may differ from those elsewhere in this report because of differences between tax and financial reporting requirements.
The fund’s distributions to shareholders included:
- $2,444,000 from short-term capital gains,
- $1,986,000 from long-term capital gains, subject to the 15% rate gains category.
For taxable non-corporate shareholders, $465,000 of the fund’s income represents qualified dividend income subject to the 15% rate category.
For corporate shareholders, $246,000 of the fund’s income qualifies for the dividends-received deduction.
The fund will pass through foreign source income of $465,000 and foreign taxes paid of $47,000.
| Information on Proxy Voting Policies, Procedures, and Records |
A description of the policies and procedures used by T. Rowe Price funds and portfolios to determine how to vote proxies relating to portfolio securities is available in each fund’s Statement of Additional Information, which you may request by calling 1-800-225-5132 or by accessing the SEC’s website, sec.gov. The description of our proxy voting policies and procedures is also available on our website, troweprice.com. To access it, click on the words “Our Company” at the top of our corporate homepage. Then, when the next page appears, click on the words “Proxy Voting Policies” on the left side of the page.
Each fund’s most recent annual proxy voting record is available on our website and through the SEC’s website. To access it through our website, follow the directions above, then click on the words “Proxy Voting Records” on the right side of the Proxy Voting Policies page.
| How to Obtain Quarterly Portfolio Holdings |
The fund files a complete schedule of portfolio holdings with the Securities and Exchange Commission for the first and third quarters of each fiscal year on Form N-Q. The fund’s Form N-Q is available electronically on the SEC’s website (sec.gov); hard copies may be reviewed and copied at the SEC’s Public Reference Room, 100 F St. N.E., Washington, DC 20549. For more information on the Public Reference Room, call 1-800-SEC-0330.
| About the Fund’s Directors and Officers |
Your fund is overseen by a Board of Directors (Board) that meets regularly to review a wide variety of matters affecting the fund, including performance, investment programs, compliance matters, advisory fees and expenses, service providers, and other business affairs. The Board elects the fund’s officers, who are listed in the final table. At least 75% of the Board’s members are independent of T. Rowe Price Associates, Inc. (T. Rowe Price), and its affiliates; “inside” or “interested” directors are employees or officers of T. Rowe Price. The business address of each director and officer is 100 East Pratt Street, Baltimore, Maryland 21202. The Statement of Additional Information includes additional information about the fund directors and is available without charge by calling a T. Rowe Price representative at 1-800-638-5660.
| Independent Directors | ||
| Name (Year of Birth) Year Elected* [Number of T. Rowe Price Portfolios Overseen] | Principal Occupation(s) and Directorships of Public Companies and Other Investment Companies During the Past Five Years | |
| William R. Brody (1944) 2009 [138] | President and Trustee, Salk Institute for Biological Studies (2009 to present); Director, Novartis, Inc. (2009 to present); Director, IBM (2007 to present); President and Trustee, Johns Hopkins University (1996 to 2009); Chairman of Executive Committee and Trustee, Johns Hopkins Health System (1996 to 2009) | |
| Jeremiah E. Casey (1940) 2006 [138] | Retired | |
| Anthony W. Deering (1945) 1991 [138] | Chairman, Exeter Capital, LLC, a private investment firm (2004 to present); Director, Under Armour (2008 to present); Director, Vornado Real Estate Investment Trust (2004 to present); Director and Member of the Advisory Board, Deutsche Bank North America (2004 to present); Director, Mercantile Bankshares (2002 to 2007) | |
| Donald W. Dick, Jr. (1943) 1989 [138] | Principal, EuroCapital Partners, LLC, an acquisition and management advisory firm (1995 to present) | |
| Robert J. Gerrard, Jr. (1952) 2012 [90] | Chairman of Compensation Committee and Director, Syniverse Holdings, Inc. (2008 to 2011); Executive Vice President and General Counsel, Scripps Networks, LLC (1997 to 2009); Advisory Board Member, Pipeline Crisis/Winning Strategies (1997 to present) | |
| Karen N. Horn (1943) 2003 [138] | Senior Managing Director, Brock Capital Group, an advisory and investment banking firm (2004 to present); Director, Eli Lilly and Company (1987 to present); Director, Simon Property Group (2004 to present); Director, Norfolk Southern (2008 to present); Director, Fannie Mae (2006 to 2008) | |
| Theo C. Rodgers (1941) 2006 [138] | President, A&R Development Corporation (1977 to present) | |
| Cecilia E. Rouse, Ph.D. (1963) 2012 [90] | Professor and Researcher, Princeton University (1992 to present); Director, MDRC (2011 to present); Member, National Academy of Education (2010 to present); Research Associate, National Bureau of Economic Research’s Labor Studies Program (1998 to 2009 and 2011 to present); Member, President’s Council of Economic Advisors (2009 to 2011); Member, The MacArthur Foundation Network on the Transition to Adulthood and Public Policy (2000 to 2008); Member, National Advisory Committee for the Robert Wood Johnson Foundation’s Scholars in Health Policy Research Program (2008); Director and Member, National Economic Association (2006 to 2008); Member, Association of Public Policy Analysis and Management Policy Council (2006 to 2008); Member, Hamilton Project’s Advisory Board at The Brookings Institute (2006 to 2008); Chair of Committee on the Status of Minority Groups in the Economic Profession, American Economic Association (2006 to 2008) | |
| John G. Schreiber (1946) 2001 [138] | Owner/President, Centaur Capital Partners, Inc., a real estate investment company (1991 to present); Cofounder and Partner, Blackstone Real Estate Advisors, L.P. (1992 to present); Director, General Growth Properties, Inc. (2010 to present) | |
| Mark R. Tercek (1957) 2009 [138] | President and Chief Executive Officer, The Nature Conservancy (2008 to present); Managing Director, The Goldman Sachs Group, Inc. (1984 to 2008) | |
*Each independent director serves until retirement, resignation, or election of a successor.
| Inside Directors | ||
| Name (Year of Birth) Year Elected* [Number of T. Rowe Price Portfolios Overseen] | Principal Occupation(s) and Directorships of Public Companies and Other Investment Companies During the Past Five Years | |
Edward C. Bernard (1956) | Director and Vice President, T. Rowe Price; Vice Chairman of the Board, Director, and Vice President, T. Rowe Price Group, Inc.; Chairman of the Board, Director, and President, T. Rowe Price Investment Services, Inc.; Chairman of the Board and Director, T. Rowe Price Retirement Plan Services, Inc., T. Rowe Price Savings Bank, and T. Rowe Price Services, Inc.; Chairman of the Board, Chief Executive Officer, and Director, T. Rowe Price International; Chief Executive Officer, Chairman of the Board, Director, and President, T. Rowe Price Trust Company; Chairman of the Board, all funds | |
| Brian C. Rogers, CFA, CIC (1955) 2006 [75] | Chief Investment Officer, Director, and Vice President, T. Rowe Price; Chairman of the Board, Chief Investment Officer, Director, and Vice President, T. Rowe Price Group, Inc.; Vice President, T. Rowe Price Trust Company | |
*Each inside director serves until retirement, resignation, or election of a successor.
Officers
| Name (Year of Birth) | ||
| Position Held With Institutional International Funds | Principal Occupation(s) | |
| Ulle Adamson, CFA (1979) Vice President | Vice President, T. Rowe Price Group, Inc., and T. Rowe Price International, Inc. | |
| Roy H. Adkins (1970) Vice President | Vice President, T. Rowe Price and T. Rowe Price Group, Inc.; formerly employee, African Development Bank (to 2008) | |
| Christopher D. Alderson (1962) President | Director and President–International Equity, T. Rowe Price International; Company’s Representative, Director, and Vice President, Price Hong Kong; Director and Vice President, Price Singapore; Vice President, T. Rowe Price Group, Inc. | |
| Paulina Amieva (1981) Vice President | Vice President, T. Rowe Price Group, Inc., and T. Rowe Price International; formerly student, Harvard Business School (to 2008) | |
| Oliver D.M. Bell, IMC (1969) Executive Vice President | Vice President, T. Rowe Price Group, Inc., and T. Rowe Price International; formerly Head of Global Emerging Markets Research, Pictet Asset Management Ltd. (to 2011), and Portfolio Manager of Africa and Middle East portfolios and other emerging markets strategies, Pictet Asset Management Ltd. (to 2009) | |
| R. Scott Berg, CFA (1972) Executive Vice President | Vice President, T. Rowe Price and T. Rowe Price Group, Inc. | |
| Carolyn Hoi Che Chu (1974) Vice President | Vice President, Price Hong Kong and T. Rowe Price Group, Inc.; formerly Director, Bank of America Merrill Lynch and Co-head of credit and convertibles research team in Hong Kong (to 2010) | |
| Archibald Ciganer Albeniz, CFA (1976) Vice President | Vice President, T. Rowe Price Group, Inc., and T. Rowe Price International | |
| Richard N. Clattenburg, CFA (1979) Executive Vice President | Vice President, Price Singapore, T. Rowe Price, T. Rowe Price Group, Inc., and T. Rowe Price International | |
| Michael J. Conelius, CFA (1964) Executive Vice President | Vice President, T. Rowe Price, T. Rowe Price Group, Inc., T. Rowe Price International, and T. Rowe Price Trust Company | |
| Jose Costa Buck (1972) Vice President | Vice President, T. Rowe Price Group, Inc., and T. Rowe Price International | |
| Richard de los Reyes (1975) Vice President | Vice President, T. Rowe Price and T. Rowe Price Group, Inc. | |
| Michael Della Vedova (1969) Vice President | Vice President, T. Rowe Price Group, Inc., and T. Rowe Price International; formerly Cofounder and Partner, Four Quarter Capital (to 2009) | |
| Bridget A. Ebner (1970) Vice President | Vice President, T. Rowe Price and T. Rowe Price Group, Inc. | |
| Mark J.T. Edwards (1957) Executive Vice President | Vice President, T. Rowe Price Group, Inc., and T. Rowe Price International | |
| David J. Eiswert, CFA (1972) Executive Vice President | Vice President, T. Rowe Price, T. Rowe Price Group, Inc., and T. Rowe Price International | |
| Roger L. Fiery III, CPA (1959) Vice President | Vice President, Price Hong Kong, Price Singapore, T. Rowe Price, T. Rowe Price Group, Inc., T. Rowe Price International, and T. Rowe Price Trust Company | |
| Mark S. Finn, CFA, CPA (1963) Vice President | Vice President, T. Rowe Price, T. Rowe Price Group, Inc., and T. Rowe Price Trust Company | |
Robert N. Gensler (1957) | Vice President, T. Rowe Price, T. Rowe Price Group, Inc., and T. Rowe Price International | |
| John R. Gilner (1961) Chief Compliance Officer | Chief Compliance Officer and Vice President, T. Rowe Price; Vice President, T. Rowe Price Group, Inc., and T. Rowe Price Investment Services, Inc. | |
| Gregory S. Golczewski (1966) Vice President | Vice President, T. Rowe Price and T. Rowe Price Trust Company | |
| M. Campbell Gunn (1956) Vice President | Vice President, T. Rowe Price Group, Inc., and T. Rowe Price International | |
| Gregory K. Hinkle, CPA (1958) Treasurer | Vice President, T. Rowe Price, T. Rowe Price Group, Inc., and T. Rowe Price Trust Company | |
| Leigh Innes, CFA (1976) Vice President | Vice President, T. Rowe Price Group, Inc., and T. Rowe Price International | |
| Randal S. Jenneke (1971) Vice President | Vice President, T. Rowe Price Group, Inc., and T. Rowe Price International; formerly Senior Portfolio Manager, Australian Equities (to 2010) | |
| Kris H. Jenner, M.D., D.Phil. (1962) Vice President | Vice President, T. Rowe Price, T. Rowe Price Group, Inc., and T. Rowe Price International | |
| Yoichiro Kai (1973) Vice President | Vice President, T. Rowe Price Group, Inc., and T. Rowe Price International; formerly Japanese Financial/Real Estate Sector Analyst/Portfolio Manager, Citadel Investment Group, Asia Limited (to 2009) | |
| Andrew J. Keirle (1974) Executive Vice President | Vice President, T. Rowe Price Group, Inc., and T. Rowe Price International | |
| Ian D. Kelson (1956) Executive Vice President | President–International Fixed Income, T. Rowe Price International; Vice President, T. Rowe Price and T. Rowe Price Group, Inc. | |
| Christopher J. Kushlis, CFA (1976) Vice President | Vice President, T. Rowe Price Group, Inc., and T. Rowe Price International | |
| Mark J. Lawrence (1970) Vice President | Vice President, T. Rowe Price Group, Inc., and T. Rowe Price International; formerly Equity Fund Manager, Citi (London) (to 2008) | |
| David M. Lee, CFA (1962) Vice President | Vice President, T. Rowe Price and T. Rowe Price Group, Inc. | |
| Patricia B. Lippert (1953) Secretary | Assistant Vice President, T. Rowe Price and T. Rowe Price Investment Services, Inc. | |
| Christopher C. Loop, CFA (1966) Vice President | Vice President, T. Rowe Price, T. Rowe Price Group, Inc., and T. Rowe Price International | |
| Anh Lu (1968) Vice President | Vice President, Price Hong Kong and T. Rowe Price Group, Inc. | |
| Sebastien Mallet (1974) Executive Vice President | Vice President, T. Rowe Price Group, Inc., and T. Rowe Price International | |
| Daniel Martino, CFA (1974) Vice President | Vice President, T. Rowe Price and T. Rowe Price Group, Inc. | |
| Jonathan H.W. Matthews, CFA (1975) Vice President | Vice President, T. Rowe Price Group, Inc., and T. Rowe Price International; formerly Analyst, Pioneer Investments (to 2008) | |
| Susanta Mazumdar (1968) Vice President | Vice President, Price Singapore and T. Rowe Price Group, Inc. | |
| Raymond A. Mills, Ph.D., CFA (1960) Executive Vice President | Vice President, T. Rowe Price, T. Rowe Price Group, Inc., T. Rowe Price International, and T. Rowe Price Trust Company | |
| Sudhir Nanda, Ph.D., CFA (1959) Vice President | Vice President, T. Rowe Price and T. Rowe Price Group, Inc. | |
| Joshua Nelson (1977) Executive Vice President | Vice President, T. Rowe Price and T. Rowe Price Group, Inc. | |
| Jason Nogueira, CFA (1974) Executive Vice President | Vice President, T. Rowe Price and T. Rowe Price Group, Inc. | |
| David Oestreicher (1967) Vice President | Director, Vice President, and Secretary, T. Rowe Price Investment Services, Inc., T. Rowe Price Retirement Plan Services, Inc., T. Rowe Price Services, Inc., and T. Rowe Price Trust Company; Vice President and Secretary, T. Rowe Price, T. Rowe Price Group, Inc., and T. Rowe Price International; Vice President, Price Hong Kong and Price Singapore | |
| Michael D. Oh, CFA (1974) Vice President | Vice President, T. Rowe Price and T. Rowe Price Group, Inc. | |
| Kenneth A. Orchard (1975) Vice President | Vice President, T. Rowe Price Group, Inc., and T. Rowe Price International; formerly Vice President, Moody’s Investors Service (to 2010) | |
| Gonzalo Pángaro, CFA (1968) Executive Vice President | Vice President, T. Rowe Price Group, Inc., and T. Rowe Price International | |
| Timothy E. Parker, CFA (1974) Vice President | Vice President, T. Rowe Price and T. Rowe Price Group, Inc. | |
| Craig J. Pennington, CFA (1971) Vice President | Vice President, T. Rowe Price Group, Inc., and T. Rowe Price International; formerly Global Energy Analyst, Insight Investment (to 2010); Senior Trader, Brevan Howard (to 2008) | |
| Frederick A. Rizzo (1969) Vice President | Vice President, T. Rowe Price Group, Inc., and T. Rowe Price International | |
| Christopher J. Rothery (1963) Executive Vice President | Vice President, T. Rowe Price Group, Inc., and T. Rowe Price International | |
| Federico Santilli, CFA (1974) Executive Vice President | Vice President, T. Rowe Price Group, Inc., and T. Rowe Price International | |
| Sebastian Schrott (1977) Vice President | Vice President, T. Rowe Price Group, Inc., and T. Rowe Price International | |
| Deborah D. Seidel (1962) Vice President | Vice President, T. Rowe Price, T. Rowe Price Group, Inc., T. Rowe Price Investment Services, Inc., and T. Rowe Price Services, Inc. | |
| Robert W. Sharps, CFA, CPA (1971) Vice President | Vice President, T. Rowe Price, T. Rowe Price Group, Inc., and T. Rowe Price Trust Company | |
| Robert W. Smith (1961) Executive Vice President | Vice President, T. Rowe Price, T. Rowe Price Group, Inc., and T. Rowe Price Trust Company | |
| Joshua K. Spencer, CFA (1973) Vice President | Vice President, T. Rowe Price and T. Rowe Price Group, Inc. | |
| David A. Stanley (1963) Vice President | Vice President, T. Rowe Price Group, Inc., and T. Rowe Price International | |
| Jonty Starbuck, Ph.D. (1975) Vice President | Vice President, T. Rowe Price Group, Inc., and T. Rowe Price International | |
| Ju Yen Tan (1972) Vice President | Vice President, T. Rowe Price Group, Inc., and T. Rowe Price International | |
| Dean Tenerelli (1964) Vice President | Vice President, T. Rowe Price Group, Inc., and T. Rowe Price International | |
| Eric L. Veiel, CFA (1972) Vice President | Vice President, T. Rowe Price and T. Rowe Price Group, Inc. | |
| Julie L. Waples (1970) Vice President | Vice President, T. Rowe Price | |
| Christopher S. Whitehouse (1972) Vice President | Vice President, T. Rowe Price Group, Inc., and T. Rowe Price International | |
| J. Howard Woodward, CFA (1974) Vice President | Vice President, T. Rowe Price Group, Inc., and T. Rowe Price International | |
| Ernest C. Yeung (1979) Vice President | Vice President, Price Hong Kong and T. Rowe Price Group, Inc. |
Unless otherwise noted, officers have been employees of T. Rowe Price or T. Rowe Price International for at least 5 years.
Item 2. Code of Ethics.
The registrant has adopted a code of ethics, as defined in Item 2 of Form N-CSR, applicable to its principal executive officer, principal financial officer, principal accounting officer or controller, or persons performing similar functions. A copy of this code of ethics is filed as an exhibit to this Form N-CSR. No substantive amendments were approved or waivers were granted to this code of ethics during the period covered by this report.
Item 3. Audit Committee Financial Expert.
The registrant’s Board of Directors/Trustees has determined that Mr. Anthony W. Deering qualifies as an audit committee financial expert, as defined in Item 3 of Form N-CSR. Mr. Deering is considered independent for purposes of Item 3 of Form N-CSR.
Item 4. Principal Accountant Fees and Services.
(a) – (d) Aggregate fees billed to the registrant for the last two fiscal years for professional services rendered by the registrant’s principal accountant were as follows:
Audit fees include amounts related to the audit of the registrant’s annual financial statements and services normally provided by the accountant in connection with statutory and regulatory filings. Audit-related fees include amounts reasonably related to the performance of the audit of the registrant’s financial statements and specifically include the issuance of a report on internal controls and, if applicable, agreed-upon procedures related to fund acquisitions. Tax fees include amounts related to services for tax compliance, tax planning, and tax advice. The nature of these services specifically includes the review of distribution calculations and the preparation of Federal, state, and excise tax returns. All other fees include the registrant’s pro-rata share of amounts for agreed-upon procedures in conjunction with service contract approvals by the registrant’s Board of Directors/Trustees.
(e)(1) The registrant’s audit committee has adopted a policy whereby audit and non-audit services performed by the registrant’s principal accountant for the registrant, its investment adviser, and any entity controlling, controlled by, or under common control with the investment adviser that provides ongoing services to the registrant require pre-approval in advance at regularly scheduled audit committee meetings. If such a service is required between regularly scheduled audit committee meetings, pre-approval may be authorized by one audit committee member with ratification at the next scheduled audit committee meeting. Waiver of pre-approval for audit or non-audit services requiring fees of a de minimis amount is not permitted.
(2) No services included in (b) – (d) above were approved pursuant to paragraph (c)(7)(i)(C) of Rule 2-01 of Regulation S-X.
(f) Less than 50 percent of the hours expended on the principal accountant’s engagement to audit the registrant’s financial statements for the most recent fiscal year were attributed to work performed by persons other than the principal accountant’s full-time, permanent employees.
(g) The aggregate fees billed for the most recent fiscal year and the preceding fiscal year by the registrant’s principal accountant for non-audit services rendered to the registrant, its investment adviser, and any entity controlling, controlled by, or under common control with the investment adviser that provides ongoing services to the registrant were $1,333,000 and $1,632,000, respectively.
(h) All non-audit services rendered in (g) above were pre-approved by the registrant’s audit committee. Accordingly, these services were considered by the registrant’s audit committee in maintaining the principal accountant’s independence.
Item 5. Audit Committee of Listed Registrants.
Not applicable.
Item 6. Investments.
(a) Not applicable. The complete schedule of investments is included in Item 1 of this Form N-CSR.
(b) Not applicable.
Item 7. Disclosure of Proxy Voting Policies and Procedures for Closed-End Management Investment Companies.
Not applicable.
Item 8. Portfolio Managers of Closed-End Management Investment Companies.
Not applicable.
Item 9. Purchases of Equity Securities by Closed-End Management Investment Company and Affiliated Purchasers.
Not applicable.
Item 10. Submission of Matters to a Vote of Security Holders.
Not applicable.
Item 11. Controls and Procedures.
(a) The registrant’s principal executive officer and principal financial officer have evaluated the registrant’s disclosure controls and procedures within 90 days of this filing and have concluded that the registrant’s disclosure controls and procedures were effective, as of that date, in ensuring that information required to be disclosed by the registrant in this Form N-CSR was recorded, processed, summarized, and reported timely.
(b) The registrant’s principal executive officer and principal financial officer are aware of no change in the registrant’s internal control over financial reporting that occurred during the registrant’s second fiscal quarter covered by this report that has materially affected, or is reasonably likely to materially affect, the registrant’s internal control over financial reporting.
Item 12. Exhibits.
(a)(1) The registrant’s code of ethics pursuant to Item 2 of Form N-CSR is attached.
(b) A certification by the registrant's principal executive officer and principal financial officer, pursuant to Section 906 of the Sarbanes-Oxley Act of 2002 and required by Rule 30a-2(b) under the Investment Company Act of 1940, is attached.
SIGNATURES
Pursuant to the requirements of the Securities Exchange Act of 1934 and the Investment Company Act of 1940, the registrant has duly caused this report to be signed on its behalf by the undersigned, thereunto duly authorized.
T. Rowe Price Institutional International Funds, Inc.
| By | /s/ Edward C. Bernard | |
| Edward C. Bernard | ||
| Principal Executive Officer | ||
| Date December 14, 2012 | ||
Pursuant to the requirements of the Securities Exchange Act of 1934 and the Investment Company Act of 1940, this report has been signed below by the following persons on behalf of the registrant and in the capacities and on the dates indicated.
| By | /s/ Edward C. Bernard | |
| Edward C. Bernard | ||
| Principal Executive Officer | ||
| Date December 14, 2012 | ||
| By | /s/ Gregory K. Hinkle | |
| Gregory K. Hinkle | ||
| Principal Financial Officer | ||
| Date December 14, 2012 | ||