UNITED STATES
SECURITIES AND EXCHANGE COMMISSION
Washington, D.C. 20549
FORM N-CSR
CERTIFIED SHAREHOLDER REPORT OF REGISTERED
MANAGEMENT INVESTMENT COMPANIES
Investment Company Act File Number: 811-05833
| T. Rowe Price Institutional International Funds, Inc. |
| (Exact name of registrant as specified in charter) |
| 100 East Pratt Street, Baltimore, MD 21202 |
| (Address of principal executive offices) |
| David Oestreicher |
| 100 East Pratt Street, Baltimore, MD 21202 |
| (Name and address of agent for service) |
Registrant’s telephone number, including area code: (410) 345-2000
Date of fiscal year end: December 31
Date of reporting period: December 31, 2012
Item 1. Report to Shareholders
 |
| Institutional Emerging Markets Bond Fund | December 31, 2012 |
| Highlights |
Emerging markets bonds posted strong gains in 2012 as the global economy showed signs of improvement and investors searched for higher-yielding assets.
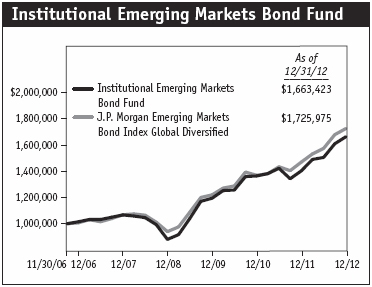
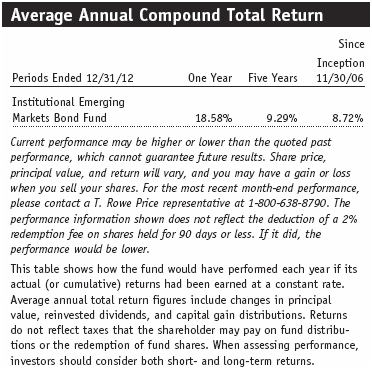
The Institutional Emerging Markets Bond Fund rose 18.58% for the year ended December 31, 2012, outperforming the J.P. Morgan Emerging Markets Bond Index Global Diversified.
We continue to find compelling investment opportunities in emerging markets corporate bonds and select debt denominated in local currencies.
Credit fundamentals and economic growth potential in emerging markets are generally favorable relative to many highly indebted developed countries and should continue to drive capital flows into emerging markets debt.
The views and opinions in this report were current as of December 31, 2012. They are not guarantees of performance or investment results and should not be taken as investment advice. Investment decisions reflect a variety of factors, and the managers reserve the right to change their views about individual stocks, sectors, and the markets at any time. As a result, the views expressed should not be relied upon as a forecast of the fund’s future investment intent. The report is certified under the Sarbanes-Oxley Act, which requires mutual funds and other public companies to affirm that, to the best of their knowledge, the information in their financial reports is fairly and accurately stated in all material respects.
Manager’s Letter
T. Rowe Price Institutional Emerging Markets Bond Fund
Dear Investor
Emerging markets bonds generated strong gains for the year ended December 31, 2012. Investor interest in riskier assets was high through most of the year, and our asset class benefited amid signs of stabilization in the eurozone, modest growth in the U.S., and incremental improvements in China and other key emerging markets. Accommodative monetary policy from many of the world’s central banks and heightened investor appetite for higher-yielding assets also helped to support emerging markets debt. The Institutional Emerging Markets Bond Fund performed well in this environment and outperformed the J.P. Morgan Emerging Markets Bond Index Global Diversified.
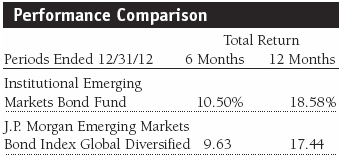
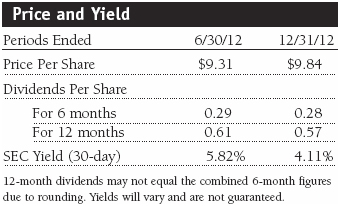
As shown in the Performance Comparison table, the portfolio gained 10.50% and 18.58% for the 6- and 12-month periods ended December 31, 2012, respectively. Security selection in locally denominated Mexican sovereign bonds and allocations to corporate bonds, which are not included in the J.P. Morgan index, were the biggest contributors for the year. Our exposure to the Brazilian real weighed on returns as the currency weakened against the U.S. dollar.
Market Environment
Buoyed by positive economic and political developments, investor sentiment was decidedly upbeat, and emerging markets bonds performed well through the first three months of 2012. The U.S. economic recovery was progressing nicely amid unexpected strength in manufacturing and employment, the European Central Bank’s two long-term refinancing operations signaled progress on the eurozone debt crisis, and China’s economy seemed to be cooling in an orderly manner to more sustainable growth. Risk aversion returned in the spring, however, as signs of a weakening global economy sapped investor confidence. Much of Europe was mired in recession, and election results in Greece and France revealed widespread discontent over fiscal austerity measures. Mixed economic data in the U.S., including persistently high unemployment, indicated that the previously resilient recovery was starting to falter, and the Chinese economic slowdown was sharper than expected.
Risk sentiment improved markedly over the summer as central banks around the world took action to stimulate economic growth. In July, the European Central Bank pledged to do “whatever it takes” to save the euro, followed by a plan to purchase short-term government debt from troubled eurozone members. Key emerging markets—including China, South Africa, and Brazil—cut interest rates, and the U.S. Federal Reserve announced a third round of quantitative easing, bolstering demand for higher-yielding assets such as emerging markets debt. Optimism persisted over the year’s closing months amid stabilization in the eurozone, a continuation of accommodative monetary policies from the world’s central banks, and incremental improvements in key emerging economies. New issuance of emerging markets debt increased considerably later in the year as multiple sovereign and corporate borrowers, including several debut issuers, came to the market. However, support for the asset class remained firm as the increase in supply was met with strong investor demand.
Faced with low nominal yields and, in many cases, negative real yields (nominal yields adjusted for inflation) on bonds in many developed markets, investors increasingly turned to the attractive yields available in emerging markets debt. In addition, money flows into the asset class continue to benefit from a long-term, structural transition as investors diversify their portfolios into the expanding emerging markets debt universe, which is rapidly improving in size, scope, and quality. When all was said and done, emerging markets debt significantly outpaced bonds in the U.S. and other developed markets for the year. U.S. dollar-denominated debt marginally outperformed bonds denominated in local currencies, and emerging markets corporate debt lagged with smaller, though still strong, gains.
Portfolio Review and Positioning
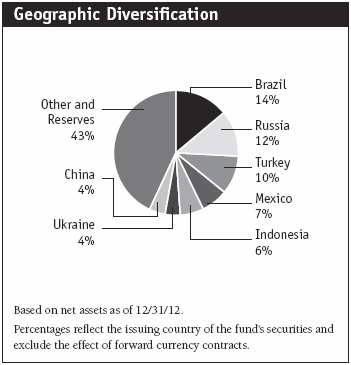
Security selection in Mexico was the largest contributor to the portfolio’s outperformance versus our benchmark for the year. We avoided richly valued sovereign debt in favor of locally denominated government and corporate debt, which we believe hold better relative value than the currently low-yielding dollar-denominated sovereign debt. Following the election of a new president, reform prospects, particularly within the energy sector, support an optimistic outlook for some oil-related credits, while solidifying economic and housing data in the U.S. bode well for industrial companies that are linked to the U.S. economic cycle. Locally denominated government debt is also attractive, aided by a relatively benign inflation forecast.
Corporate debt, which is not included in the benchmark J.P. Morgan index, also aided annual results. In China, the high-yielding property market has been a top-performing sector over the year given limited financing needs, continued trends toward urbanization, and resumption of sales activity. We favor the highest quality names within this space, such as KWG Property Holding and Country Garden Holdings, with a focus on large, liquid issuers with credible management teams and strong presales figures. While economic news from China was inconsistent at times in 2012, recent data showed incremental improvement in manufacturing activity, reinforcing the view that the economy is gaining traction. (Please refer to the fund’s portfolio of investments for a complete list of holdings and the amount each represents in the portfolio.)
It is important to note that the choice to invest in local debt and the respective currency in which the debt is issued are two distinct decisions. The portfolio’s exposure to the Brazilian real was the biggest drag on performance. Deteriorating growth conditions prompted Brazil’s central bank into an unprecedented series of interest rate cuts, causing the currency to depreciate relative to the U.S. dollar. We reduced our exposure during the year, and despite the sell-off earlier in the year, we expect the currency to remain range-bound in the coming months.
Corporate bonds and locally denominated debt continue to be a focus going into 2013. The portfolio’s outperformance over the past year was largely a function of our exposure to these sectors, which are not represented in the index, especially as higher-yielding emerging corporates outperformed over the year. Emerging market corporates are supported by strong GDP growth, as well as the rise of the middle class in emerging economies. We are also looking to initiate positions or add to existing positions in high conviction currencies where we are not expecting intervention from central banks.
Outlook
The stabilization of European economic data, a resolution of the U.S. fiscal cliff, and better-than-expected data out of China—the bellwether for emerging economies—have helped to calm the markets and provided support to emerging debt. We continue to focus on corporate debt as a compelling way to gain exposure to the strong growth potential of many emerging economies. Corporations that are strategically positioned to serve the growing middle classes found across many developing markets are particularly attractive. Emerging markets local debt also holds compelling investment potential as we expect aggregate inflation to remain stable and emerging markets central banks to keep interest rates steady through most of the year. We remain cognizant, however, that governments in many emerging countries may become increasingly interventionist in monetary policies, which has caused us to remain selective within our exposures.
There are several near-term concerns that could affect investor risk tolerance. Last-minute legislation averted a fiscal cliff disaster in the U.S., but a long-term resolution to deficit reduction issues has yet to be found, and a debt ceiling battle looms early in 2013. European policymakers have stabilized the debt crisis and the danger of a disorderly breakup of the eurozone has receded substantially, but a long-term resolution of the continent’s profound fiscal imbalances has yet to be forged. A sudden rise in U.S. Treasury yields or a significant increase in equity market inflows represent additional potential headwinds.
Over the long term, however, we remain optimistic about the prospects for emerging markets debt. In contrast to the challenges faced by developed economies, emerging markets sovereign and corporate debt remains relatively well supported from both fundamental and technical standpoints. In addition to higher growth expectations and lower debt burdens than the average developed country, emerging markets benefit from a much broader variety of policy tools than many developed markets. Overall, we are encouraged that credit fundamentals and economic growth potential in emerging markets countries are generally favorable relative to many highly indebted developed countries. We believe this will continue to drive secular capital flows into emerging debt markets in the long term and support bond prices.
Effective security selection is becoming increasingly important as the international bond market grows in size, complexity, and maturity. We believe that the extended reach of T. Rowe Price’s global credit and equity research platforms, combined with an emphasis on cross-functional collaboration, gives us a critical edge in evaluating opportunities and risks in the global bond market.
Respectfully submitted,

Michael J. Conelius
Portfolio manager and chairman of the fund’s Investment
Advisory Committee
January 24, 2013
The committee chairman has day-to-day responsibility for the portfolio and works with committee members in developing and executing the fund’s investment program.
| Risk of International Bond Investing |
Funds that invest overseas generally carry more risk than funds that invest strictly in U.S. assets including unpredictable changes in currency values. Investments in emerging markets are subject to abrupt and severe price declines, and should be regarded as speculative. The economic and political structures of developing nations, in most cases, do not compare favorably with the U.S. or other developed countries in terms of wealth and stability, and their financial markets often lack liquidity. Some countries also have legacies of hyperinflation, currency devaluations, and governmental interference in markets.
International investments are subject to currency risk, a decline in the value of a foreign currency versus the U.S. dollar, which reduces the dollar value of securities denominated in that currency. The overall impact on a fund’s holdings can be significant and long-lasting depending on the currencies represented in the portfolio, how each one appreciates or depreciates in relation to the U.S. dollar, and whether currency positions are hedged. Further, exchange rate movements are unpredictable, and it is not possible to effectively hedge the currency risks of many developing countries.
Bonds are also subject to interest rate risk, the decline in bond prices that usually accompanies a rise in interest rates, and credit risk, the chance that any fund holding could have its credit rating downgraded or that a bond issuer will default (fail to make timely payments of interest or principal), potentially reducing the fund’s income level and share price.
| Glossary |
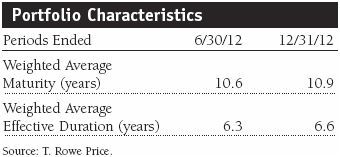
Duration: A measure of a bond or bond portfolio’s sensitivity to changes in interest rates. For example, a portfolio with a duration of six years would fall about 6% in response to a one-percentage-point rise in rates, and vice versa.
J.P. Morgan Emerging Markets Bond Index Global Diversified: A capitalization-weighted index tracking emerging market government bonds denominated in local currencies.
Weighted average effective duration (years): A measure of a portfolio’s price sensitivity to changes in interest rates. Portfolios with longer weighted-average effective durations are more sensitive to changes in interest rates than securities of shorter durations.
Weighted average maturity: A measure of a portfolio’s sensitivity to interest rates. In general, the longer the average maturity, the greater the portfolio’s sensitivity to interest rate changes. The weighted average maturity may take into account the interest rate readjustment dates for certain securities. Money funds must maintain a weighted average maturity of less than 60 days.
Portfolio Highlights
Performance and Expenses
T. Rowe Price Institutional Emerging Markets Bond Fund
| Performance Comparison |
This chart shows the value of a hypothetical $1 million investment in the fund over the past 10 fiscal year periods or since inception (for funds lacking 10-year records). The result is compared with benchmarks, which may include a broad-based market index and a peer group average or index. Market indexes do not include expenses, which are deducted from fund returns as well as mutual fund averages and indexes.
Fund Expense Example
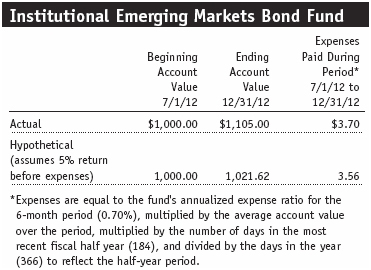
As a mutual fund shareholder, you may incur two types of costs: (1) transaction costs, such as redemption fees or sales loads, and (2) ongoing costs, including management fees, distribution and service (12b-1) fees, and other fund expenses. The following example is intended to help you understand your ongoing costs (in dollars) of investing in the fund and to compare these costs with the ongoing costs of investing in other mutual funds. The example is based on an investment of $1,000 invested at the beginning of the most recent six-month period and held for the entire period.
Actual Expenses
The first line of the following table (Actual) provides information about actual account values and actual expenses. You may use the information on this line, together with your account balance, to estimate the expenses that you paid over the period. Simply divide your account value by $1,000 (for example, an $8,600 account value divided by $1,000 = 8.6), then multiply the result by the number on the first line under the heading “Expenses Paid During Period” to estimate the expenses you paid on your account during this period.
Hypothetical Example for Comparison Purposes
The information on the second line of the table (Hypothetical) is based on hypothetical account values and expenses derived from the fund’s actual expense ratio and an assumed 5% per year rate of return before expenses (not the fund’s actual return). You may compare the ongoing costs of investing in the fund with other funds by contrasting this 5% hypothetical example and the 5% hypothetical examples that appear in the shareholder reports of the other funds. The hypothetical account values and expenses may not be used to estimate the actual ending account balance or expenses you paid for the period.
You should also be aware that the expenses shown in the table highlight only your ongoing costs and do not reflect any transaction costs, such as redemption fees or sales loads. Therefore, the second line of the table is useful in comparing ongoing costs only and will not help you determine the relative total costs of owning different funds. To the extent a fund charges transaction costs, however, the total cost of owning that fund is higher.
Financial Highlights
T. Rowe Price Institutional Emerging Markets Bond Fund
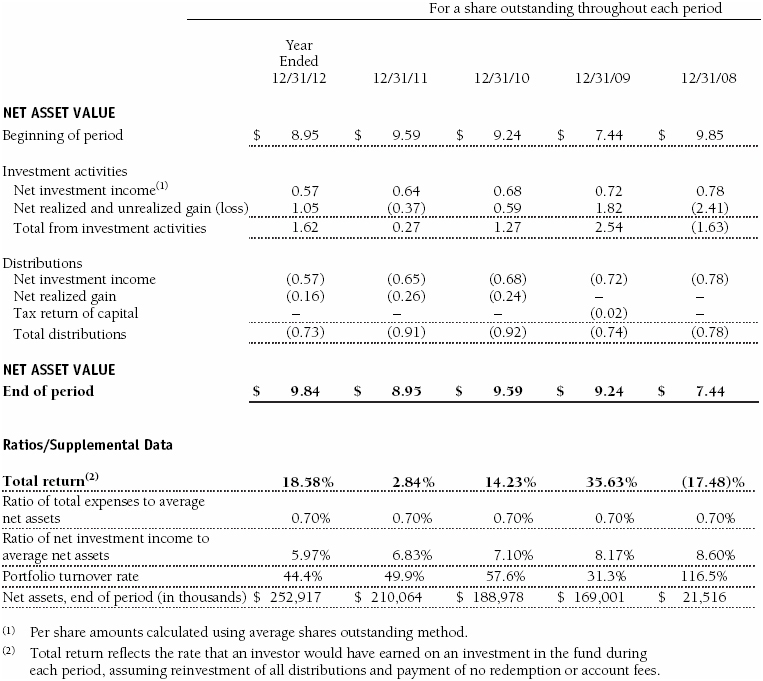
The accompanying notes are an integral part of these financial statements.
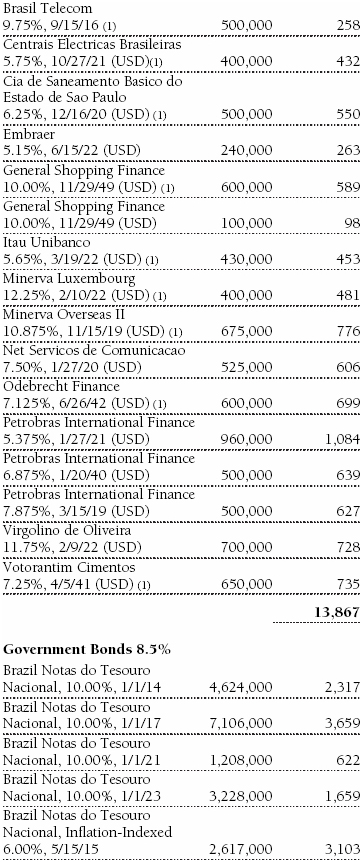
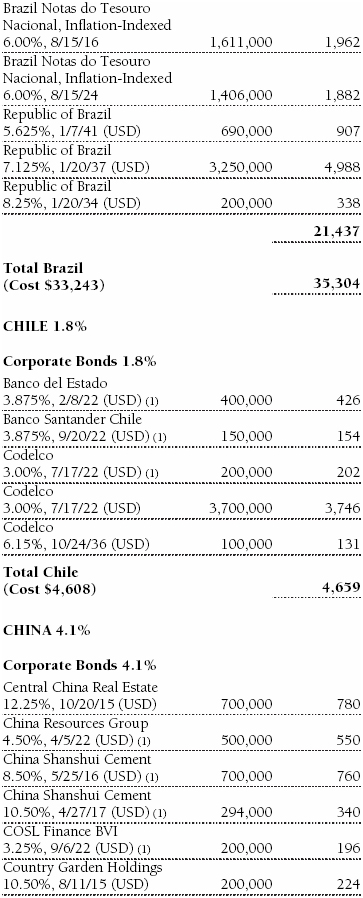
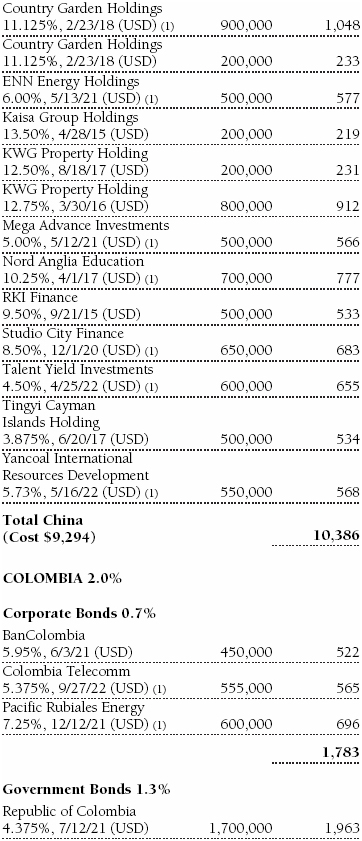
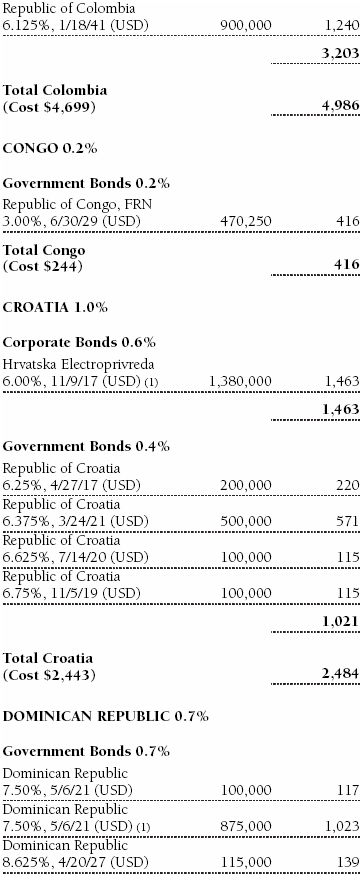
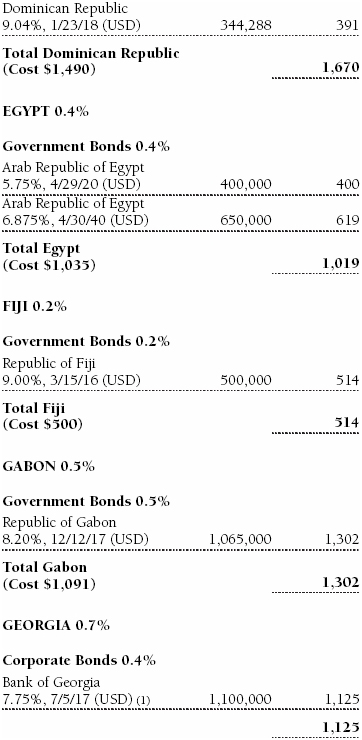
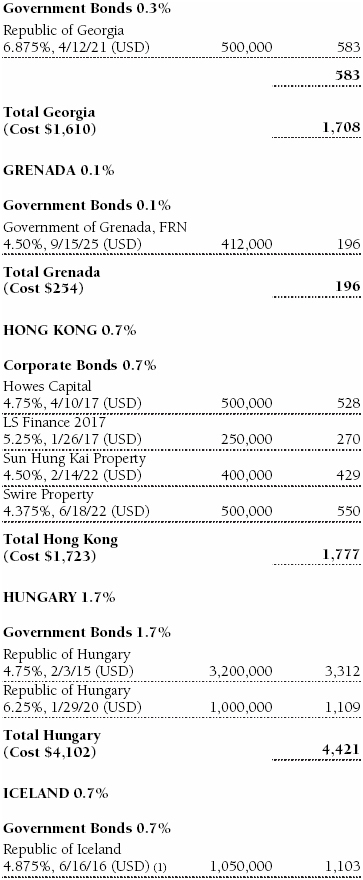
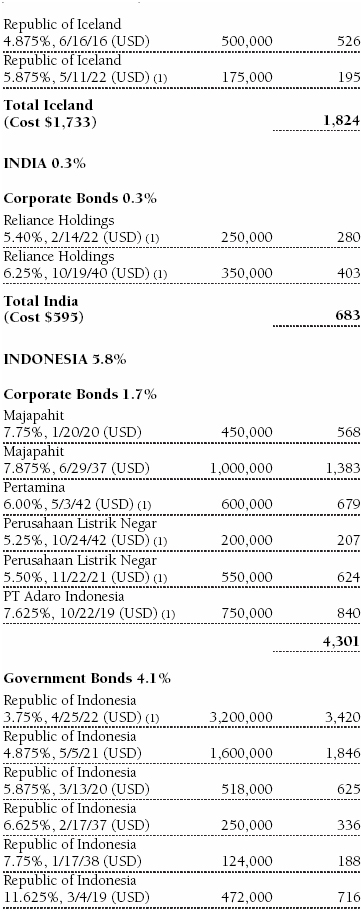
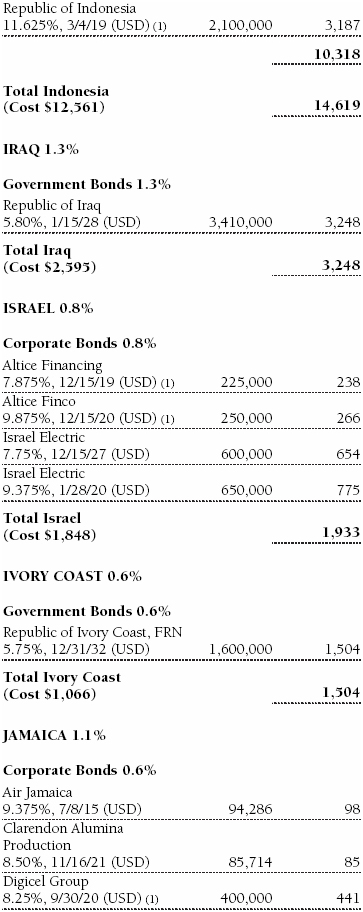
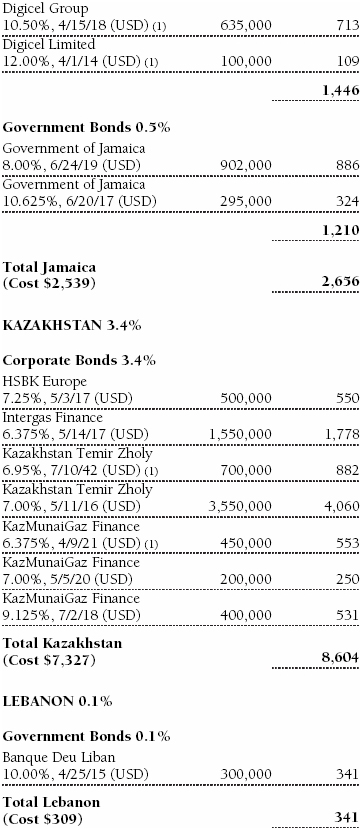
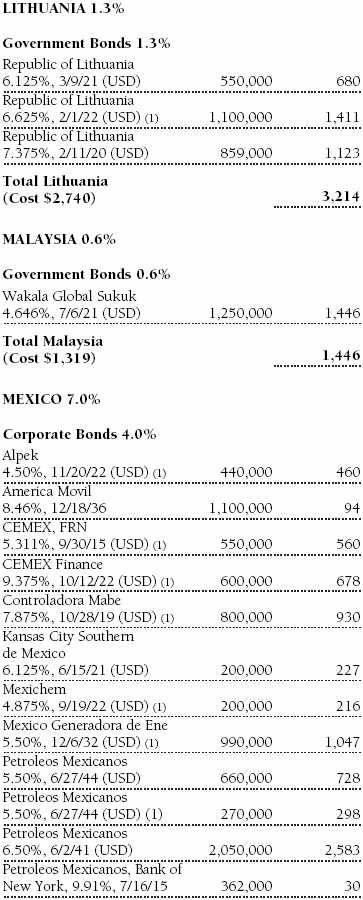
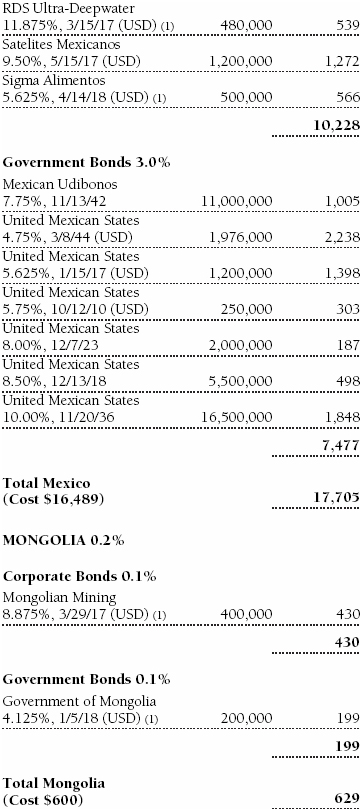
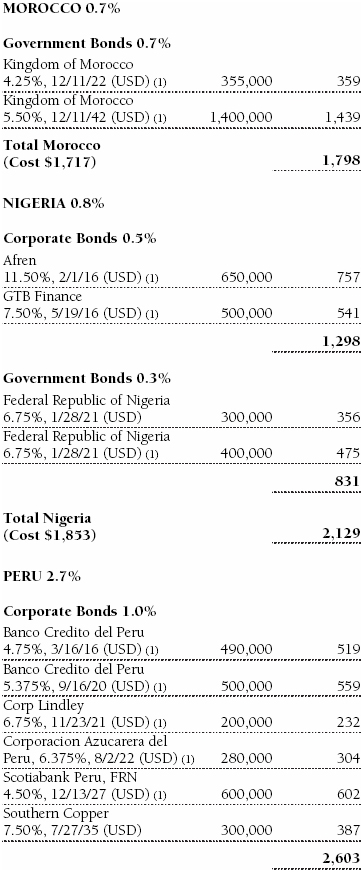
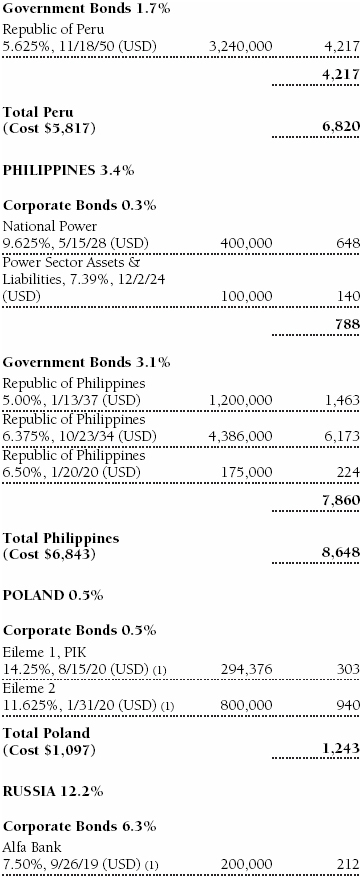
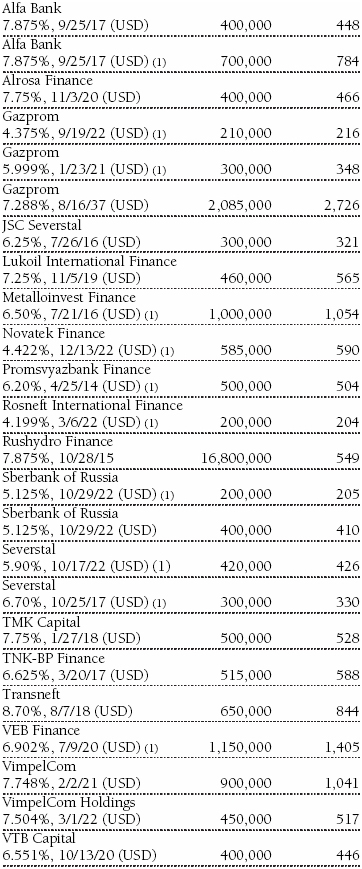
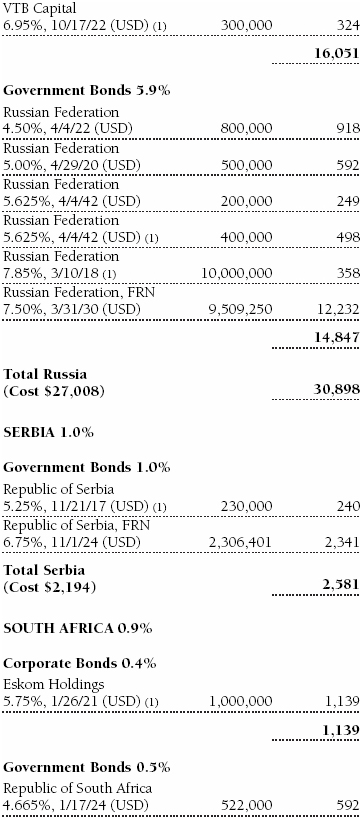
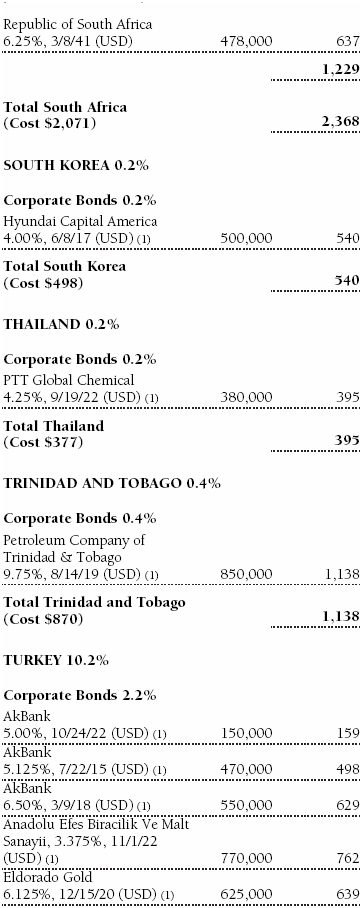
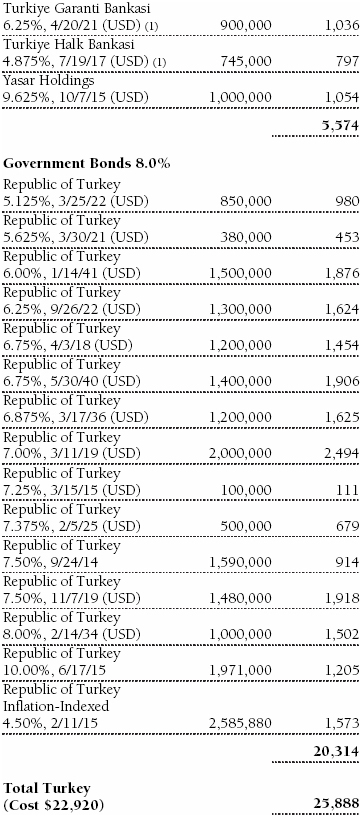
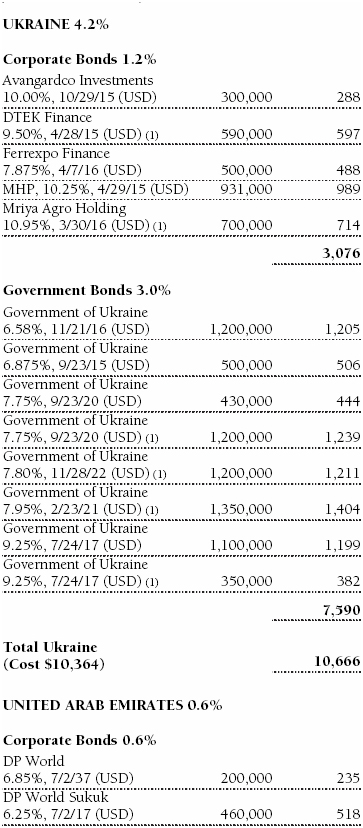
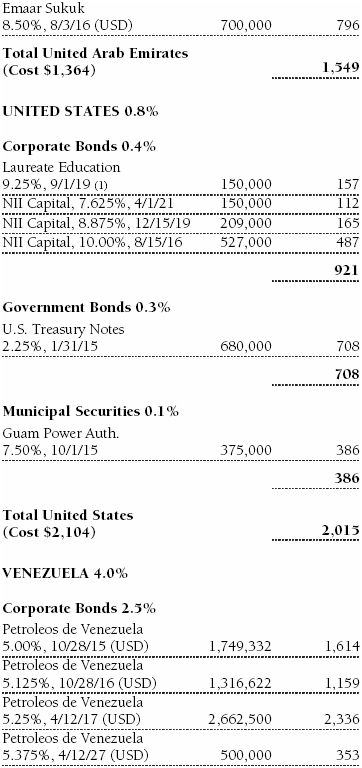
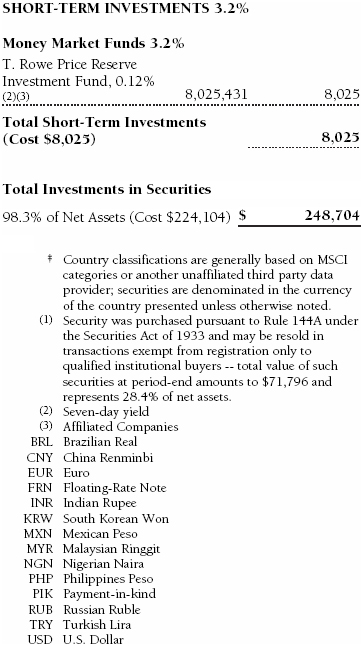
Portfolio of Investments‡
T. Rowe Price Institutional Emerging Markets Bond Fund
December 31, 2012
The accompanying notes are an integral part of these financial statements.
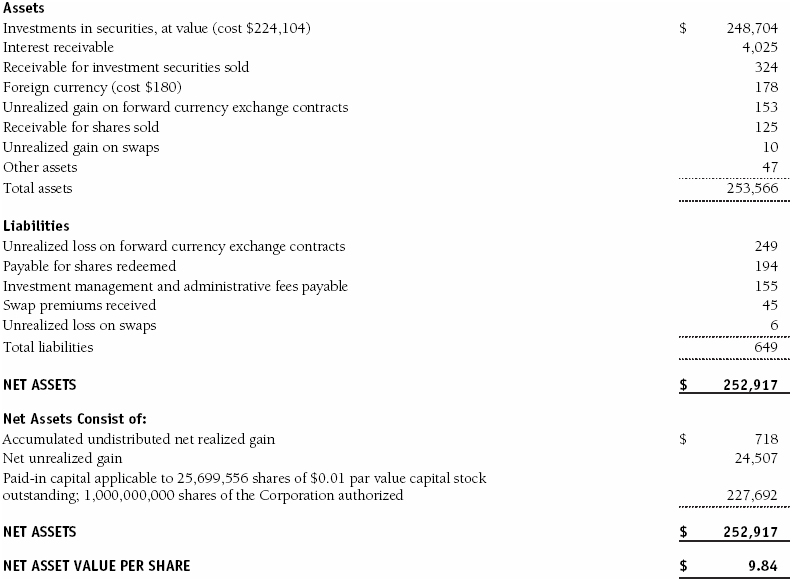
Statement of Assets and Liabilities
T. Rowe Price Institutional Emerging Markets Bond Fund
December 31, 2012
($000s, except shares and per share amounts)
The accompanying notes are an integral part of these financial statements.
Statement of Operations
T. Rowe Price Institutional Emerging Markets Bond Fund
($000s)
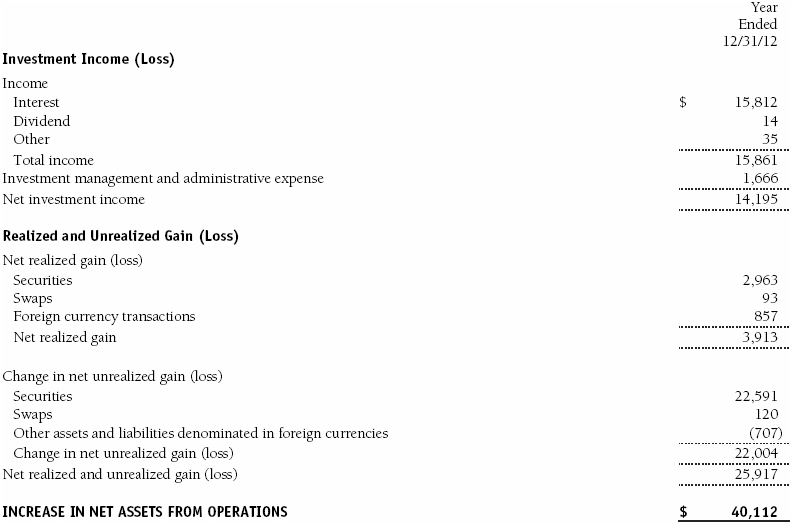
The accompanying notes are an integral part of these financial statements.
Statement of Changes in Net Assets
T. Rowe Price Institutional Emerging Markets Bond Fund
($000s)
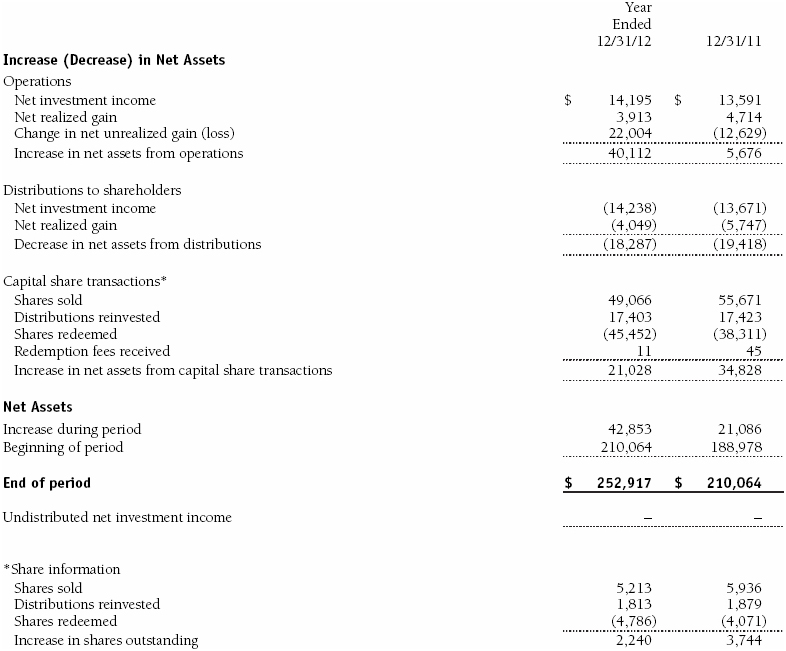
The accompanying notes are an integral part of these financial statements.
Notes to Financial Statements
T. Rowe Price Institutional Emerging Markets Bond Fund
December 31, 2012
T. Rowe Price Institutional International Funds, Inc. (the corporation), is registered under the Investment Company Act of 1940 (the 1940 Act). The Institutional Emerging Markets Bond Fund (the fund) is a nondiversified, open-end management investment company established by the corporation. The fund commenced operations on November 30, 2006. The fund seeks to provide high income and capital appreciation.
NOTE 1 - SIGNIFICANT ACCOUNTING POLICIES
Basis of Preparation The accompanying financial statements were prepared in accordance with accounting principles generally accepted in the United States of America (GAAP), which require the use of estimates made by management. Management believes that estimates and valuations are appropriate; however, actual results may differ from those estimates, and the valuations reflected in the accompanying financial statements may differ from the value ultimately realized upon sale or maturity.
Investment Transactions, Investment Income, and Distributions Income and expenses are recorded on the accrual basis. Premiums and discounts on debt securities are amortized for financial reporting purposes. Paydown gains and losses are recorded as an adjustment to interest income. Inflation adjustments to the principal amount of inflation-indexed bonds are reflected as interest income. Dividends received from mutual fund investments are reflected as dividend income; capital gain distributions are reflected as realized gain/loss. Dividend income and capital gain distributions are recorded on the ex-dividend date. Income tax-related interest and penalties, if incurred, would be recorded as income tax expense. Investment transactions are accounted for on the trade date. Realized gains and losses are reported on the identified cost basis. Distributions to shareholders are recorded on the ex-dividend date. Income distributions are declared daily and paid monthly. Capital gain distributions, if any, are generally declared and paid by the fund annually.
Currency Translation Assets, including investments, and liabilities denominated in foreign currencies are translated into U.S. dollar values each day at the prevailing exchange rate, using the mean of the bid and asked prices of such currencies against U.S. dollars as quoted by a major bank. Purchases and sales of securities, income, and expenses are translated into U.S. dollars at the prevailing exchange rate on the date of the transaction. The effect of changes in foreign currency exchange rates on realized and unrealized security gains and losses is reflected as a component of security gains and losses.
Credits Credits are earned on the fund’s temporarily uninvested cash balances held at the custodian and such credits reduce the amount paid by the manager for custody of the fund’s assets. In order to pass the benefit of custody credits to the fund, the manager has voluntarily reduced its investment management and administrative expense in the accompanying financial statements.
Redemption Fees A 2% fee is assessed on redemptions of fund shares held for 90 days or less to deter short-term trading and to protect the interests of long-term shareholders. Redemption fees are withheld from proceeds that shareholders receive from the sale or exchange of fund shares. The fees are paid to the fund and are recorded as an increase to paid-in capital. The fees may cause the redemption price per share to differ from the net asset value per share.
New Accounting Pronouncements In December 2011, the FASB issued amended guidance to enhance disclosure for offsetting assets and liabilities. The guidance is effective for fiscal years and interim periods beginning on or after January 1, 2013. Adoption will have no effect on the fund’s net assets or results of operations.
NOTE 2 - VALUATION
The fund’s financial instruments are reported at fair value as defined by GAAP. The fund determines the values of its assets and liabilities and computes its net asset value per share at the close of the New York Stock Exchange (NYSE), normally 4 p.m. ET, each day that the NYSE is open for business.
Valuation Methods Debt securities are generally traded in the over-the-counter (OTC) market. Securities with remaining maturities of one year or more at the time of acquisition are valued at prices furnished by dealers who make markets in such securities or by an independent pricing service, which considers the yield or price of bonds of comparable quality, coupon, maturity, and type, as well as prices quoted by dealers who make markets in such securities. Securities with remaining maturities of less than one year at the time of acquisition generally use amortized cost in local currency to approximate fair value. However, if amortized cost is deemed not to reflect fair value or the fund holds a significant amount of such securities with remaining maturities of more than 60 days, the securities are valued at prices furnished by dealers who make markets in such securities or by an independent pricing service.
Investments in mutual funds are valued at the mutual fund’s closing net asset value per share on the day of valuation. Forward currency exchange contracts are valued using the prevailing forward exchange rate. Swaps are valued at prices furnished by independent swap dealers or by an independent pricing service.
Other investments, including restricted securities and private placements, and those financial instruments for which the above valuation procedures are inappropriate or are deemed not to reflect fair value, are stated at fair value as determined in good faith by the T. Rowe Price Valuation Committee, established by the fund’s Board of Directors (the Board). Subject to oversight by the Board, the Valuation Committee develops pricing-related policies and procedures and approves all fair-value determinations. The Valuation Committee regularly makes good faith judgments, using a wide variety of sources and information, to establish and adjust valuations of certain securities as events occur and circumstances warrant. For instance, in determining the fair value of private-equity instruments, the Valuation Committee considers a variety of factors, including the company’s business prospects, its financial performance, strategic events impacting the company, relevant valuations of similar companies, new rounds of financing, and any negotiated transactions of significant size between other investors in the company. Because any fair-value determination involves a significant amount of judgment, there is a degree of subjectivity inherent in such pricing decisions.
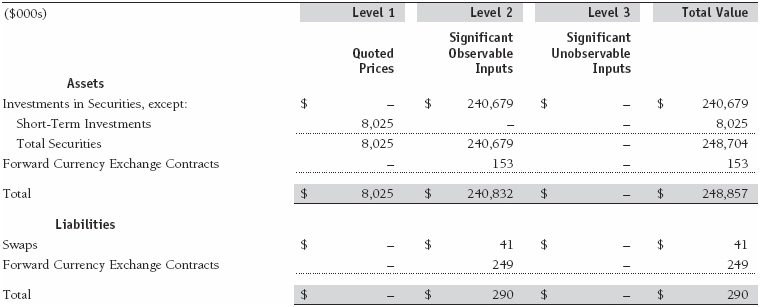
Valuation Inputs Various inputs are used to determine the value of the fund’s financial instruments. These inputs are summarized in the three broad levels listed below:
Level 1 – quoted prices in active markets for identical financial instruments
Level 2 – observable inputs other than Level 1 quoted prices (including, but not limited to, quoted prices for similar financial instruments, interest rates, prepayment speeds, and credit risk)
Level 3 – unobservable inputs
Observable inputs are those based on market data obtained from sources independent of the fund, and unobservable inputs reflect the fund’s own assumptions based on the best information available. The input levels are not necessarily an indication of the risk or liquidity associated with financial instruments at that level. The following table summarizes the fund’s financial instruments, based on the inputs used to determine their values on December 31, 2012:
NOTE 3 - DERIVATIVE INSTRUMENTS
During the year ended December 31, 2012, the fund invested in derivative instruments. As defined by GAAP, a derivative is a financial instrument whose value is derived from an underlying security price, foreign exchange rate, interest rate, index of prices or rates, or other variable; it requires little or no initial investment and permits or requires net settlement. The fund invests in derivatives only if the expected risks and rewards are consistent with its investment objectives, policies, and overall risk profile, as described in its prospectus and Statement of Additional Information. The fund may use derivatives for a variety of purposes, such as seeking to hedge against declines in principal value, increase yield, invest in an asset with greater efficiency and at a lower cost than is possible through direct investment, or to adjust portfolio duration and credit exposure. The risks associated with the use of derivatives are different from, and potentially much greater than, the risks associated with investing directly in the instruments on which the derivatives are based. Investments in derivatives can magnify returns positively or negatively; however, the fund at all times maintains sufficient cash reserves, liquid assets, or other SEC-permitted asset types to cover the settlement obligations under its open derivative contracts.
The fund values its derivatives at fair value, as described below and in Note 2, and recognizes changes in fair value currently in its results of operations. Accordingly, the fund does not follow hedge accounting, even for derivatives employed as economic hedges. The fund does not offset the fair value of derivative instruments against the right to reclaim or obligation to return collateral. The following table summarizes the fair value of the fund’s derivative instruments held as of December 31, 2012, and the related location on the accompanying Statement of Assets and Liabilities, presented by primary underlying risk exposure:
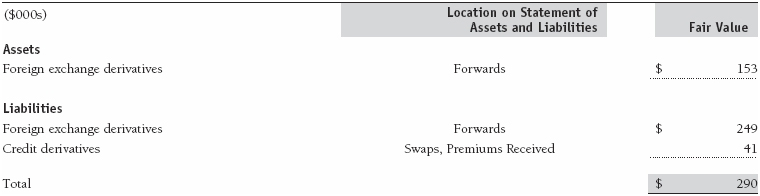
Additionally, the amount of gains and losses on derivative instruments recognized in fund earnings during the year ended December 31, 2012, and the related location on the accompanying Statement of Operations is summarized in the following table by primary underlying risk exposure:
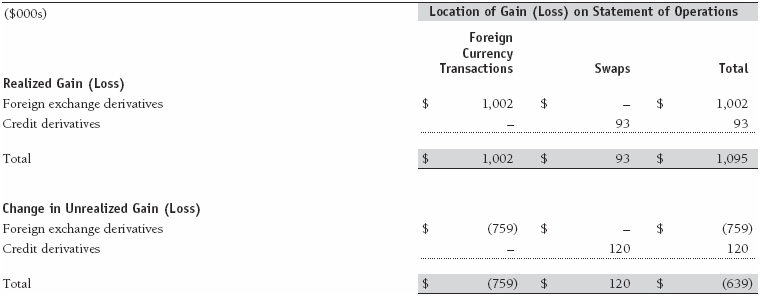
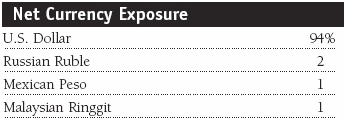
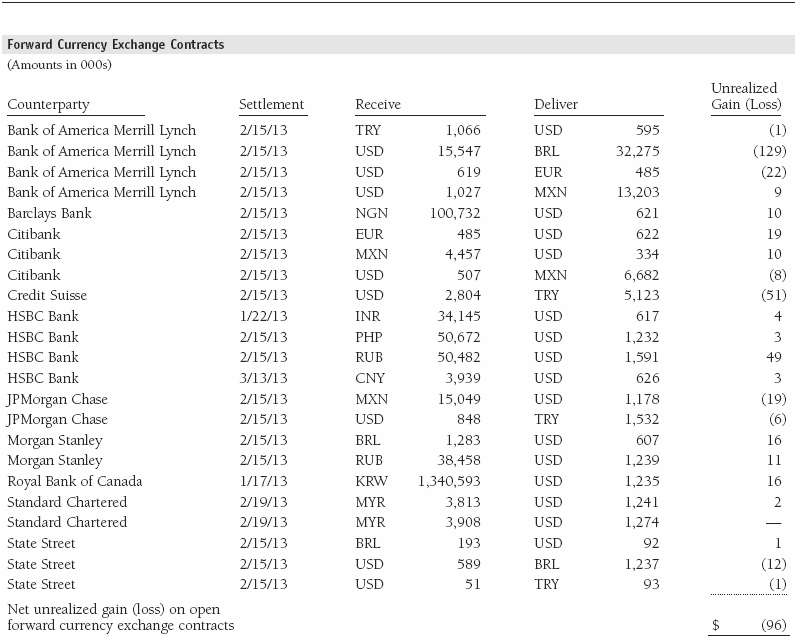
Forward Currency Exchange Contracts The fund is subject to foreign currency exchange rate risk in the normal course of pursuing its investment objectives. It uses forward currency exchange contracts (forwards) primarily to protect its non-U.S. dollar-denominated securities from adverse currency movements and to gain exposure to currencies for the purposes of risk management or enhanced return. A forward involves an obligation to purchase or sell a fixed amount of a specific currency on a future date at a price set at the time of the contract. Although certain forwards may be settled by exchanging only the net gain or loss on the contract, most forwards are settled with the exchange of the underlying currencies in accordance with the specified terms. Forwards are valued at the unrealized gain or loss on the contract, which reflects the net amount the fund either is entitled to receive or obligated to deliver, as measured by the difference between the forward exchange rates at the date of entry into the contract and the forward rates at the reporting date. Appreciated forwards are reflected as assets, and depreciated forwards are reflected as liabilities on the accompanying Statement of Assets and Liabilities. Risks related to the use of forwards include the possible failure of counterparties to meet the terms of the agreements; that anticipated currency movements will not occur, thereby reducing the fund’s total return; and the potential for losses in excess of the fund’s initial investment. During the year ended December 31, 2012, the fund’s exposure to forwards, based on underlying notional amounts, was generally between 8% and 12% of net assets.
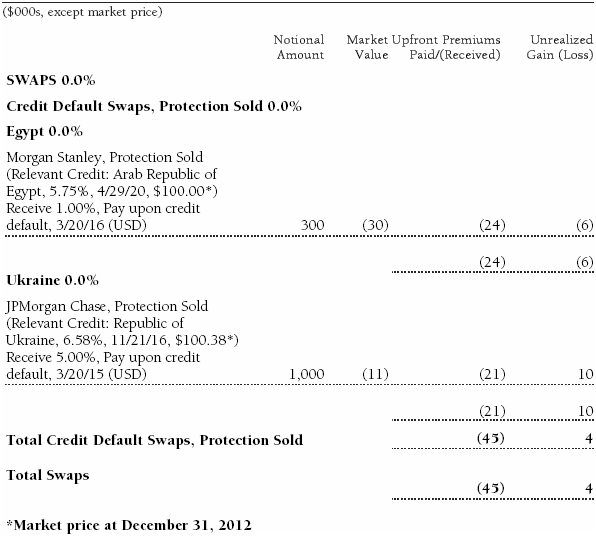
Credit Default Swaps The fund is subject to credit risk in the normal course of pursuing its investment objectives and uses swap contracts to help manage such risk. The fund may use swaps in an effort to manage exposure to changes in interest rates, inflation rates, and credit quality; to adjust overall exposure to certain markets; to enhance total return or protect the value of portfolio securities; to serve as a cash management tool; and/or to adjust portfolio duration or credit exposure. Credit default swaps are agreements where one party (the protection buyer) agrees to make periodic payments to another party (the protection seller) in exchange for protection against specified credit events, such as certain defaults and bankruptcies related to an underlying credit instrument, or issuer or index of such instruments. Upon occurrence of a specified credit event, the protection seller is required to pay the buyer the difference between the notional amount of the swap and the value of the underlying credit, either in the form of a net cash settlement or by paying the gross notional amount and accepting delivery of the relevant underlying credit. For credit default swaps where the underlying credit is an index, a specified credit event may affect all or individual underlying securities included in the index and will be settled based upon the relative weighting of the affected underlying security(s) within the index. Generally, the payment risk for the seller of protection is inversely related to the current market price and/or credit rating of the underlying credit, both of which are indicators of market valuations of credit quality. Therefore, payment risk increases as the price of the relevant underlying credit and/or credit rating declines. Generally payment risk increases as the market value of a swap contract declines in relation to the notional amount. As of December 31, 2012, the notional amount of protection sold by the fund totaled $1,300,000 (0.5% of net assets), which reflects the maximum potential amount the fund could be required to pay under such contracts. The value of a swap included in net assets is the unrealized gain or loss on the contract plus or minus any unamortized premiums paid or received, respectively. Appreciated swaps and premiums paid are reflected as assets, and depreciated swaps and premiums received are reflected as liabilities on the accompanying Statement of Assets and Liabilities. Net periodic receipts or payments required by swaps are accrued daily and are recorded as realized gain or loss for financial reporting purposes when settled; fluctuations in the fair value of swaps are reflected in the change in net unrealized gain or loss and are reclassified to realized gain or loss upon termination prior to maturity or cash settlement. Risks related to the use of credit default swaps include the possible inability of the fund to accurately assess the current and future creditworthiness of underlying issuers, the possible failure of a counterparty to perform in accordance with the terms of the swap agreements, potential government regulation that could adversely affect the fund’s swap investments, and potential losses in excess of the fund’s initial investment. During the year ended December 31, 2012, the fund’s exposure to swaps, based on underlying notional amounts, was generally less than 1% of net assets.
NOTE 4 - OTHER INVESTMENT TRANSACTIONS
Consistent with its investment objective, the fund engages in the following practices to manage exposure to certain risks and/or to enhance performance. The investment objective, policies, program, and risk factors of the fund are described more fully in the fund’s prospectus and Statement of Additional Information.
Emerging Markets At December 31, 2012, approximately 93% of the fund’s net assets were invested, either directly or through investments in T. Rowe Price institutional funds, in securities of companies located in emerging markets, securities issued by governments of emerging market countries, and/or securities denominated in or linked to the currencies of emerging market countries. Emerging market securities are often subject to greater price volatility, less liquidity, and higher rates of inflation than U.S. securities. In addition, emerging markets may be subject to greater political, economic, and social uncertainty, and differing regulatory environments that may potentially impact the fund’s ability to buy or sell certain securities or repatriate proceeds to U.S. dollars.
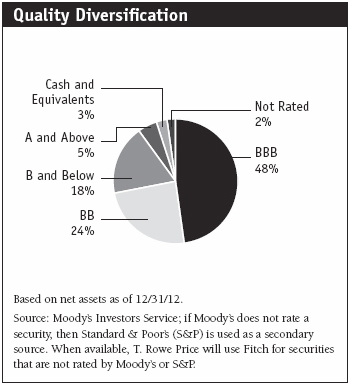
Noninvestment-Grade Debt Securities At December 31, 2012, approximately 37% of the fund’s net assets were invested, either directly or through its investment in T. Rowe Price institutional funds, in noninvestment-grade debt securities, commonly referred to as “high yield” or “junk” bonds. The noninvestment-grade bond market may experience sudden and sharp price swings due to a variety of factors, including changes in economic forecasts, stock market activity, large sustained sales by major investors, a high-profile default, or a change in market psychology. These events may decrease the ability of issuers to make principal and interest payments and adversely affect the liquidity or value, or both, of such securities.
Restricted Securities The fund may invest in securities that are subject to legal or contractual restrictions on resale. Prompt sale of such securities at an acceptable price may be difficult and may involve substantial delays and additional costs.
Counterparty Risk and Collateral The fund has entered into collateral agreements with certain counterparties to mitigate counterparty risk associated with certain over-the-counter (OTC) financial instruments, including swaps, forward currency exchange contracts, TBA purchase commitments, and OTC options (collectively, covered OTC instruments). Subject to certain minimum exposure requirements (which typically range from $100,000 to $500,000), collateral requirements generally are determined and transfers made based on the net aggregate unrealized gain or loss on all OTC instruments covered by a particular collateral agreement with a specified counterparty. At any point in time, the fund’s risk of loss from counterparty credit risk on covered OTC instruments is the aggregate unrealized gain on appreciated covered OTC instruments in excess of collateral, if any, pledged by the counterparty to the fund. Further, in accordance with the terms of the relevant agreements, counterparties to certain OTC instruments may be able to terminate the contracts prior to maturity upon the occurrence of certain stated events, such as a decline in net assets above a certain percentage or a failure by the fund to perform its obligations under the contract. Upon termination, all transactions would typically be liquidated and a net amount would be owed by or payable to the fund.
Collateral can be in the form of cash or debt securities issued by the U.S. government or related agencies. Collateral both pledged by the fund to a counterparty and pledged by a counterparty to the fund, is held in a segregated account by a third-party agent. Cash posted by the fund as collateral is reflected as restricted cash in the accompanying financial statements and securities posted by the fund are so noted in the accompanying Portfolio of Investments; both remain in the fund’s assets. Collateral pledged by counterparties is not included in the fund’s assets because the fund does not obtain effective control over those assets. As of December 31, 2012, no collateral was pledged by either the fund or counterparties for covered OTC instruments.
Other Purchases and sales of portfolio securities other than short-term securities aggregated $116,709,000 and $98,315,000, respectively, for the year ended December 31, 2012.
NOTE 5 - FEDERAL INCOME TAXES
No provision for federal income taxes is required since the fund intends to continue to qualify as a regulated investment company under Subchapter M of the Internal Revenue Code and distribute to shareholders all of its taxable income and gains. Distributions determined in accordance with federal income tax regulations may differ in amount or character from net investment income and realized gains for financial reporting purposes. Financial reporting records are adjusted for permanent book/tax differences to reflect tax character but are not adjusted for temporary differences.
The fund files U.S. federal, state, and local tax returns as required. The fund’s tax returns are subject to examination by the relevant tax authorities until expiration of the applicable statute of limitations, which is generally three years after the filing of the tax return but which can be extended to six years in certain circumstances. Tax returns for open years have incorporated no uncertain tax positions that require a provision for income taxes.
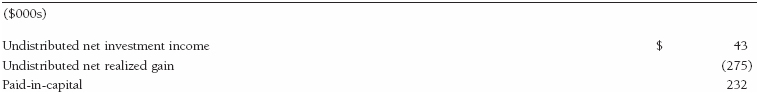
Reclassifications to paid-in capital relate primarily to a tax practice that treats a portion of the proceeds from each redemption of capital shares as a distribution of taxable net investment income and/or realized capital gain. Reclassifications between income and gain relate primarily to the character of premium payments and unrealized gains and losses on swaps. For the year ended December 31, 2012, the following reclassifications were recorded to reflect tax character (there was no impact on results of operations or net assets):
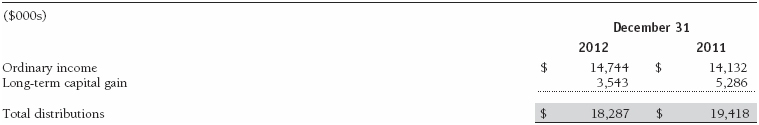
Distributions during the years ended December 31, 2012 and December 31, 2011, were characterized for tax purposes as follows:
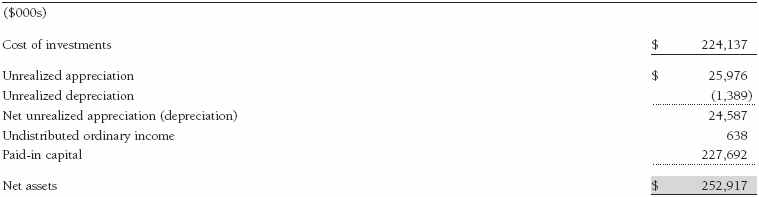
At December 31, 2012, the tax-basis cost of investments and components of net assets were as follows:
NOTE 6 - RELATED PARTY TRANSACTIONS
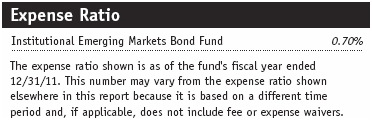
The fund is managed by T. Rowe Price Associates, Inc. (Price Associates), a wholly owned subsidiary of T. Rowe Price Group, Inc. (Price Group). The investment management and administrative agreement between the fund and Price Associates provides for an all-inclusive annual fee equal to 0.70% of the fund’s average daily net assets. The fee is computed daily and paid monthly. The all-inclusive fee covers investment management, shareholder servicing, transfer agency, accounting, and custody services provided to the fund, as well as fund directors’ fees and expenses. Interest, taxes, brokerage commissions, and extraordinary expenses are paid directly by the fund.
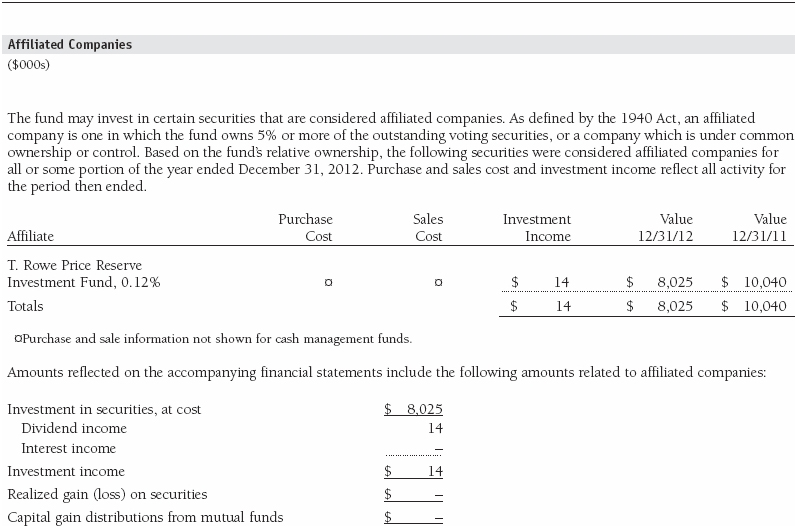
The fund may invest in the T. Rowe Price Reserve Investment Fund and the T. Rowe Price Government Reserve Investment Fund (collectively, the T. Rowe Price Reserve Investment Funds), open-end management investment companies managed by Price Associates and considered affiliates of the fund. The T. Rowe Price Reserve Investment Funds are offered as cash management options to mutual funds, trusts, and other accounts managed by Price Associates and/or its affiliates and are not available for direct purchase by members of the public. The T. Rowe Price Reserve Investment Funds pay no investment management fees.
Mutual funds and other accounts managed by T. Rowe Price and its affiliates (collectively, T. Rowe Price funds) may invest in the fund; however, no T. Rowe Price fund may invest for the purpose of exercising management or control over the fund. At December 31, 2012, approximately 74% of the outstanding shares were held by T. Rowe Price funds.
Report of Independent Registered Public Accounting Firm
To the Board of Directors of T. Rowe Price Institutional International Funds, Inc. and
Shareholders of T. Rowe Price Institutional Emerging Markets Bond Fund
In our opinion, the accompanying statement of assets and liabilities, including the portfolio of investments, and the related statements of operations and of changes in net assets and the financial highlights present fairly, in all material respects, the financial position of T. Rowe Price Institutional Emerging Markets Bond Fund (one of the portfolios comprising T. Rowe Price Institutional International Funds, Inc., hereafter referred to as the “Fund”) at December 31, 2012, and the results of its operations, the changes in its net assets and the financial highlights for each of the periods indicated therein, in conformity with accounting principles generally accepted in the United States of America. These financial statements and financial highlights (hereafter referred to as “financial statements”) are the responsibility of the Fund's management; our responsibility is to express an opinion on these financial statements based on our audits. We conducted our audits of these financial statements in accordance with the standards of the Public Company Accounting Oversight Board (United States). Those standards require that we plan and perform the audit to obtain reasonable assurance about whether the financial statements are free of material misstatement. An audit includes examining, on a test basis, evidence supporting the amounts and disclosures in the financial statements, assessing the accounting principles used and significant estimates made by management, and evaluating the overall financial statement presentation. We believe that our audits, which included confirmation of securities at December 31, 2012 by correspondence with the custodian, and confirmation of the underlying funds by correspondence with the transfer agent, provide a reasonable basis for our opinion.
PricewaterhouseCoopers LLP
Baltimore, Maryland
February 15, 2013
| Tax Information (Unaudited) for the Tax Year Ended 12/31/12 |
We are providing this information as required by the Internal Revenue Code. The amounts shown may differ from those elsewhere in this report because of differences between tax and financial reporting requirements.
The fund’s distributions to shareholders included:
$774,000 from short-term capital gains,
$3,549,000 from long-term capital gains, subject to the 15% rate gains category.
| Information on Proxy Voting Policies, Procedures, and Records |
A description of the policies and procedures used by T. Rowe Price funds and portfolios to determine how to vote proxies relating to portfolio securities is available in each fund’s Statement of Additional Information, which you may request by calling 1-800-225-5132 or by accessing the SEC’s website, sec.gov. The description of our proxy voting policies and procedures is also available on our website, troweprice.com. To access it, click on the words “Our Company” at the top of our corporate homepage. Then, when the next page appears, click on the words “Proxy Voting Policies” on the left side of the page.
Each fund’s most recent annual proxy voting record is available on our website and through the SEC’s website. To access it through our website, follow the directions above, then click on the words “Proxy Voting Records” on the right side of the Proxy Voting Policies page.
| How to Obtain Quarterly Portfolio Holdings |
The fund files a complete schedule of portfolio holdings with the Securities and Exchange Commission for the first and third quarters of each fiscal year on Form N-Q. The fund’s Form N-Q is available electronically on the SEC’s website (sec.gov); hard copies may be reviewed and copied at the SEC’s Public Reference Room, 100 F St. N.E., Washington, DC 20549. For more information on the Public Reference Room, call 1-800-SEC-0330.
| About the Fund’s Directors and Officers |
Your fund is overseen by a Board of Directors (Board) that meets regularly to review a wide variety of matters affecting the fund, including performance, investment programs, compliance matters, advisory fees and expenses, service providers, and other business affairs. The Board elects the fund’s officers, who are listed in the final table. At least 75% of the Board’s members are independent of T. Rowe Price Associates, Inc. (T. Rowe Price), and its affiliates; “inside” or “interested” directors are employees or officers of T. Rowe Price. The business address of each director and officer is 100 East Pratt Street, Baltimore, Maryland 21202. The Statement of Additional Information includes additional information about the fund directors and is available without charge by calling a T. Rowe Price representative at 1-800-638-5660.
| Independent Directors | ||
| Name (Year of Birth) Year Elected* [Number of T. Rowe Price Portfolios Overseen] | Principal Occupation(s) and Directorships of Public Companies and Other Investment Companies During the Past Five Years | |
| William R. Brody (1944) 2009 [142] | President and Trustee, Salk Institute for Biological Studies (2009 to present); Director, Novartis, Inc. (2009 to present); Director, IBM (2007 to present); President and Trustee, Johns Hopkins University (1996 to 2009); Chairman of Executive Committee and Trustee, Johns Hopkins Health System (1996 to 2009) | |
| Anthony W. Deering (1945) 1991 [142] | Chairman, Exeter Capital, LLC, a private investment firm (2004 to present); Director, Under Armour (2008 to present); Director, Vornado Real Estate Investment Trust (2004 to present); Director and Member of the Advisory Board, Deutsche Bank North America (2004 to present); Director, Mercantile Bankshares (2002 to 2007) | |
| Donald W. Dick, Jr. (1943) 1989 [142] | Principal, EuroCapital Partners, LLC, an acquisition and management advisory firm (1995 to present) | |
| Robert J. Gerrard, Jr. (1952) 2012 [90] | Chairman of Compensation Committee and Director, Syniverse Holdings, Inc. (2008 to 2011); Executive Vice President and General Counsel, Scripps Networks, LLC (1997 to 2009); Advisory Board Member, Pipeline Crisis/Winning Strategies (1997 to present) | |
| Karen N. Horn (1943) 2003 [142] | Senior Managing Director, Brock Capital Group, an advisory and investment banking firm (2004 to present); Director, Eli Lilly and Company (1987 to present); Director, Simon Property Group (2004 to present); Director, Norfolk Southern (2008 to present); Director, Fannie Mae (2006 to 2008) | |
| Theo C. Rodgers (1941) 2006 [142] | President, A&R Development Corporation (1977 to present) | |
| Cecilia E. Rouse, Ph.D. (1963) 2012 [90] | Professor and Researcher, Princeton University (1992 to present); Director, MDRC (2011 to present); Member, National Academy of Education (2010 to present); Research Associate, National Bureau of Economic Research’s Labor Studies Program (1998 to 2009 and 2011 to present); Member, President’s Council of Economic Advisors (2009 to 2011); Member, The MacArthur Foundation Network on the Transition to Adulthood and Public Policy (2000 to 2008); Member, National Advisory Committee for the Robert Wood Johnson Foundation’s Scholars in Health Policy Research Program (2008); Director and Member, National Economic Association (2006 to 2008); Member, Association of Public Policy Analysis and Management Policy Council (2006 to 2008); Member, Hamilton Project’s Advisory Board at The Brookings Institute (2006 to 2008); Chair of Committee on the Status of Minority Groups in the Economic Profession, American Economic Association (2006 to 2008) | |
| John G. Schreiber (1946) 2001 [142] | Owner/President, Centaur Capital Partners, Inc., a real estate investment company (1991 to present); Cofounder and Partner, Blackstone Real Estate Advisors, L.P. (1992 to present); Director, General Growth Properties, Inc. (2010 to present) | |
| Mark R. Tercek (1957) 2009 [142] | President and Chief Executive Officer, The Nature Conservancy (2008 to present); Managing Director, The Goldman Sachs Group, Inc. (1984 to 2008) | |
| *Each independent director serves until retirement, resignation, or election of a successor. | ||
| Inside Directors | ||
| Name (Year of Birth) Year Elected* [Number of T. Rowe Price Portfolios Overseen] | Principal Occupation(s) and Directorships of Public Companies and Other Investment Companies During the Past Five Years | |
| Edward C. Bernard (1956) 2006 [142] | Director and Vice President, T. Rowe Price; Vice Chairman of the Board, Director, and Vice President, T. Rowe Price Group, Inc.; Chairman of the Board, Director, and President, T. Rowe Price Investment Services, Inc.; Chairman of the Board and Director, T. Rowe Price Retirement Plan Services, Inc., T. Rowe Price Savings Bank, and T. Rowe Price Services, Inc.; Chairman of the Board, Chief Executive Officer, and Director, T. Rowe Price International; Chief Executive Officer, Chairman of the Board, Director, and President, T. Rowe Price Trust Company; Chairman of the Board, all funds | |
| Brian C. Rogers, CFA, CIC (1955) 2006 [75] | Chief Investment Officer, Director, and Vice President, T. Rowe Price; Chairman of the Board, Chief Investment Officer, Director, and Vice President, T. Rowe Price Group, Inc.; Vice President, T. Rowe Price Trust Company | |
| *Each inside director serves until retirement, resignation, or election of a successor. | ||
| Officers | ||
| Name (Year of Birth) Position Held With Institutional International Funds | Principal Occupation(s) | |
| Ulle Adamson, CFA (1979) Vice President | Vice President, T. Rowe Price Group, Inc., and T. Rowe Price International, Inc. | |
| Roy H. Adkins (1970) Vice President | Vice President, T. Rowe Price and T. Rowe Price Group, Inc.; formerly employee, African Development Bank (to 2008) | |
| Christopher D. Alderson (1962) President | Director and President–International Equity, T. Rowe Price International; Company’s Representative, Director, and Vice President, Price Hong Kong; Director and Vice President, Price Singapore; Vice President, T. Rowe Price Group, Inc. | |
| Paulina Amieva (1981) Vice President | Vice President, T. Rowe Price Group, Inc., and T. Rowe Price International; formerly student, Harvard Business School (to 2008) | |
| Oliver D.M. Bell, IMC (1969) Executive Vice President | Vice President, T. Rowe Price Group, Inc., and T. Rowe Price International; formerly Head of Global Emerging Markets Research, Pictet Asset Management Ltd. (to 2011), and Portfolio Manager of Africa and Middle East portfolios and other emerging markets strategies, Pictet Asset Management Ltd. (to 2009) | |
| R. Scott Berg, CFA (1972) Executive Vice President | Vice President, T. Rowe Price and T. Rowe Price Group, Inc. | |
Carolyn Hoi Che Chu (1974) | Vice President, Price Hong Kong and T. Rowe Price Group, Inc.; formerly Director, Bank of America Merrill Lynch and Co-head of credit and convertibles research team in Hong Kong (to 2010) | |
| Archibald Ciganer Albeniz, CFA (1976) Vice President | Vice President, T. Rowe Price Group, Inc., and T. Rowe Price International | |
| Richard N. Clattenburg, CFA (1979) Executive Vice President | Vice President, Price Singapore, T. Rowe Price, T. Rowe Price Group, Inc., and T. Rowe Price International | |
| Michael J. Conelius, CFA (1964) Executive Vice President | Vice President, T. Rowe Price, T. Rowe Price Group, Inc., T. Rowe Price International, and T. Rowe Price Trust Company | |
| Jose Costa Buck (1972) Vice President | Vice President, T. Rowe Price Group, Inc., and T. Rowe Price International | |
| Richard de los Reyes (1975) Vice President | Vice President, T. Rowe Price and T. Rowe Price Group, Inc. | |
| Michael Della Vedova (1969) Vice President | Vice President, T. Rowe Price Group, Inc., and T. Rowe Price International; formerly Cofounder and Partner, Four Quarter Capital (to 2009) | |
| Bridget A. Ebner (1970) Vice President | Vice President, T. Rowe Price and T. Rowe Price Group, Inc. | |
| Mark J.T. Edwards (1957) Executive Vice President | Vice President, T. Rowe Price Group, Inc., and T. Rowe Price International | |
| David J. Eiswert, CFA (1972) Executive Vice President | Vice President, T. Rowe Price, T. Rowe Price Group, Inc., and T. Rowe Price International | |
| Roger L. Fiery III, CPA (1959) Vice President | Vice President, Price Hong Kong, Price Singapore, T. Rowe Price, T. Rowe Price Group, Inc., T. Rowe Price International, and T. Rowe Price Trust Company | |
| Mark S. Finn, CFA, CPA (1963) Vice President | Vice President, T. Rowe Price, T. Rowe Price Group, Inc., and T. Rowe Price Trust Company | |
| Robert N. Gensler (1957) Executive Vice President | Vice President, T. Rowe Price, T. Rowe Price Group, Inc., and T. Rowe Price International | |
| John R. Gilner (1961) Chief Compliance Officer | Chief Compliance Officer and Vice President, T. Rowe Price; Vice President, T. Rowe Price Group, Inc., and T. Rowe Price Investment Services, Inc. | |
| Gregory S. Golczewski (1966) Vice President | Vice President, T. Rowe Price and T. Rowe Price Trust Company | |
| M. Campbell Gunn (1956) Vice President | Vice President, T. Rowe Price Group, Inc., and T. Rowe Price International | |
| Gregory K. Hinkle, CPA (1958) Treasurer | Vice President, T. Rowe Price, T. Rowe Price Group, Inc., and T. Rowe Price Trust Company | |
| Leigh Innes, CFA (1976) Vice President | Vice President, T. Rowe Price Group, Inc., and T. Rowe Price International | |
| Randal S. Jenneke (1971) Vice President | Vice President, T. Rowe Price Group, Inc., and T. Rowe Price International; formerly Senior Portfolio Manager, Australian Equities (to 2010) | |
| Kris H. Jenner, M.D., D.Phil. (1962) Vice President | Vice President, T. Rowe Price, T. Rowe Price Group, Inc., and T. Rowe Price International | |
| Yoichiro Kai (1973) Vice President | Vice President, T. Rowe Price Group, Inc., and T. Rowe Price International; formerly Japanese Financial/Real Estate Sector Analyst/Portfolio Manager, Citadel Investment Group, Asia Limited (to 2009) | |
| Andrew J. Keirle (1974) Executive Vice President | Vice President, T. Rowe Price Group, Inc., and T. Rowe Price International | |
| Ian D. Kelson (1956) Executive Vice President | President–International Fixed Income, T. Rowe Price International; Vice President, T. Rowe Price and T. Rowe Price Group, Inc. | |
| Christopher J. Kushlis, CFA (1976) Vice President | Vice President, T. Rowe Price Group, Inc., and T. Rowe Price International | |
| Mark J. Lawrence (1970) Vice President | Vice President, T. Rowe Price Group, Inc., and T. Rowe Price International; formerly Equity Fund Manager, Citi (London) (to 2008) | |
| David M. Lee, CFA (1962) Vice President | Vice President, T. Rowe Price and T. Rowe Price Group, Inc. | |
| Patricia B. Lippert (1953) Secretary | Assistant Vice President, T. Rowe Price and T. Rowe Price Investment Services, Inc. | |
| Christopher C. Loop, CFA (1966) Vice President | Vice President, T. Rowe Price, T. Rowe Price Group, Inc., T. Rowe Price International | |
| Anh Lu (1968) Vice President | Vice President, Price Hong Kong and T. Rowe Price Group, Inc. | |
| Sebastien Mallet (1974) Executive Vice President | Vice President, T. Rowe Price Group, Inc., and T. Rowe Price International | |
| Daniel Martino, CFA (1974) Vice President | Vice President, T. Rowe Price and T. Rowe Price Group, Inc. | |
| Jonathan H.W. Matthews, CFA (1975) Vice President | Vice President, T. Rowe Price Group, Inc., and T. Rowe Price International; formerly Analyst, Pioneer Investments (to 2008) | |
| Susanta Mazumdar (1968) Vice President | Vice President, Price Singapore and T. Rowe Price Group, Inc. | |
| Raymond A. Mills, Ph.D., CFA (1960) Executive Vice President | Vice President, T. Rowe Price, T. Rowe Price Group, Inc., T. Rowe Price International, and T. Rowe Price Trust Company | |
| Sudhir Nanda, Ph.D., CFA (1959) Vice President | Vice President, T. Rowe Price and T. Rowe Price Group, Inc. | |
| Joshua Nelson (1977) Executive Vice President | Vice President, T. Rowe Price and T. Rowe Price Group, Inc. | |
| Jason Nogueira, CFA (1974) Executive Vice President | Vice President, T. Rowe Price and T. Rowe Price Group, Inc. | |
| David Oestreicher (1967) Vice President | Director, Vice President, and Secretary, T. Rowe Price Investment Services, Inc., T. Rowe Price Retirement Plan Services, Inc., T. Rowe Price Services, Inc., and T. Rowe Price Trust Company; Vice President and Secretary, T. Rowe Price, T. Rowe Price Group, Inc., and T. Rowe Price International; Vice President, Price Hong Kong and Price Singapore | |
| Michael D. Oh, 1974 (CFA) Vice President | Vice President, T. Rowe Price and T. Rowe Price Group, Inc. | |
| Kenneth A. Orchard (1975) Vice President | Vice President, T. Rowe Price Group, Inc., and T. Rowe Price International; formerly, Vice President, Moody’s Investors Service (to 2010) | |
| Gonzalo Pángaro, CFA (1968) Executive Vice President | Vice President, T. Rowe Price Group, Inc., and T. Rowe Price International | |
| Timothy E. Parker, CFA (1974) Vice President | Vice President, T. Rowe Price and T. Rowe Price Group, Inc. | |
| Craig J. Pennington, CFA (1971) Vice President | Vice President, T. Rowe Price Group, Inc., and T. Rowe Price International; formerly, Global Energy Analyst, Insight Investment (to 2010); Senior Trader, Brevan Howard (to 2008) | |
| Frederick A. Rizzo (1969) Vice President | Vice President, T. Rowe Price Group, Inc., and T. Rowe Price International | |
| Christopher J. Rothery (1963) Executive Vice President | Vice President, T. Rowe Price Group, Inc., and T. Rowe Price International | |
| Federico Santilli, CFA (1974) Executive Vice President | Vice President, T. Rowe Price Group, Inc., and T. Rowe Price International | |
| Sebastian Schrott (1977) Vice President | Vice President, T. Rowe Price Group, Inc., and T. Rowe Price International | |
| Deborah D. Seidel (1962) Vice President | Vice President, T. Rowe Price, T. Rowe Price Group, Inc., T. Rowe Price Investment Services, Inc., and T. Rowe Price Services, Inc. | |
| Robert W. Sharps, CFA, CPA (1971) Vice President | Vice President, T. Rowe Price, T. Rowe Price Group, Inc., and T. Rowe Price Trust Company | |
| Robert W. Smith (1961) Executive Vice President | Vice President, T. Rowe Price, T. Rowe Price Group, Inc., and T. Rowe Price Trust Company | |
| Joshua K. Spencer, CFA (1973) Vice President | Vice President, T. Rowe Price and T. Rowe Price Group, Inc. | |
| David A. Stanley (1963) Vice President | Vice President, T. Rowe Price Group, Inc., and T. Rowe Price International | |
| Jonty Starbuck, Ph.D. (1975) Vice President | Vice President, T. Rowe Price Group, Inc., and T. Rowe Price International | |
| Ju Yen Tan (1972) Vice President | Vice President, T. Rowe Price Group, Inc. and T. Rowe Price International | |
| Dean Tenerelli (1964) Vice President | Vice President, T. Rowe Price Group, Inc., and T. Rowe Price International | |
| Eric L. Veiel, CFA (1972) Vice President | Vice President, T. Rowe Price and T. Rowe Price Group, Inc. | |
| Julie L. Waples (1970) Vice President | Vice President, T. Rowe Price | |
| Christopher S. Whitehouse (1972) Vice President | Vice President, T. Rowe Price Group, Inc., and T. Rowe Price International | |
| J. Howard Woodward, CFA (1974) Vice President | Vice President, T. Rowe Price Group, Inc., and T. Rowe Price International | |
| Ernest C. Yeung (1979) | Vice President, Price Hong Kong and T. Rowe Price Group, Inc. | |
| Vice President | ||
| Unless otherwise noted, officers have been employees of T. Rowe Price or T. Rowe Price International for at least 5 years. | ||
Item 2. Code of Ethics.
The registrant has adopted a code of ethics, as defined in Item 2 of Form N-CSR, applicable to its principal executive officer, principal financial officer, principal accounting officer or controller, or persons performing similar functions. A copy of this code of ethics is filed as an exhibit to this Form N-CSR. No substantive amendments were approved or waivers were granted to this code of ethics during the period covered by this report.
Item 3. Audit Committee Financial Expert.
The registrant’s Board of Directors/Trustees has determined that Mr. Anthony W. Deering qualifies as an audit committee financial expert, as defined in Item 3 of Form N-CSR. Mr. Deering is considered independent for purposes of Item 3 of Form N-CSR.
Item 4. Principal Accountant Fees and Services.
(a) – (d) Aggregate fees billed for the last two fiscal years for professional services rendered to, or on behalf of, the registrant by the registrant’s principal accountant were as follows:
Audit fees include amounts related to the audit of the registrant’s annual financial statements and services normally provided by the accountant in connection with statutory and regulatory filings. Audit-related fees include amounts reasonably related to the performance of the audit of the registrant’s financial statements and specifically include the issuance of a report on internal controls and, if applicable, agreed-upon procedures related to fund acquisitions. Tax fees include amounts related to services for tax compliance, tax planning, and tax advice. The nature of these services specifically includes the review of distribution calculations and the preparation of Federal, state, and excise tax returns. All other fees include the registrant’s pro-rata share of amounts for agreed-upon procedures in conjunction with service contract approvals by the registrant’s Board of Directors/Trustees.
(e)(1) The registrant’s audit committee has adopted a policy whereby audit and non-audit services performed by the registrant’s principal accountant for the registrant, its investment adviser, and any entity controlling, controlled by, or under common control with the investment adviser that provides ongoing services to the registrant require pre-approval in advance at regularly scheduled audit committee meetings. If such a service is required between regularly scheduled audit committee meetings, pre-approval may be authorized by one audit committee member with ratification at the next scheduled audit committee meeting. Waiver of pre-approval for audit or non-audit services requiring fees of a de minimis amount is not permitted.
(2) No services included in (b) – (d) above were approved pursuant to paragraph (c)(7)(i)(C) of Rule 2-01 of Regulation S-X.
(f) Less than 50 percent of the hours expended on the principal accountant’s engagement to audit the registrant’s financial statements for the most recent fiscal year were attributed to work performed by persons other than the principal accountant’s full-time, permanent employees.
(g) The aggregate fees billed for the most recent fiscal year and the preceding fiscal year by the registrant’s principal accountant for non-audit services rendered to the registrant, its investment adviser, and any entity controlling, controlled by, or under common control with the investment adviser that provides ongoing services to the registrant were $1,802,000 and $1,764,000, respectively.
(h) All non-audit services rendered in (g) above were pre-approved by the registrant’s audit committee. Accordingly, these services were considered by the registrant’s audit committee in maintaining the principal accountant’s independence.
Item 5. Audit Committee of Listed Registrants.
Not applicable.
Item 6. Investments.
(a) Not applicable. The complete schedule of investments is included in Item 1 of this Form N-CSR.
(b) Not applicable.
Item 7. Disclosure of Proxy Voting Policies and Procedures for Closed-End Management Investment Companies.
Not applicable.
Item 8. Portfolio Managers of Closed-End Management Investment Companies.
Not applicable.
Item 9. Purchases of Equity Securities by Closed-End Management Investment Company and Affiliated Purchasers.
Not applicable.
Item 10. Submission of Matters to a Vote of Security Holders.
Not applicable.
Item 11. Controls and Procedures.
(a) The registrant’s principal executive officer and principal financial officer have evaluated the registrant’s disclosure controls and procedures within 90 days of this filing and have concluded that the registrant’s disclosure controls and procedures were effective, as of that date, in ensuring that information required to be disclosed by the registrant in this Form N-CSR was recorded, processed, summarized, and reported timely.
(b) The registrant’s principal executive officer and principal financial officer are aware of no change in the registrant’s internal control over financial reporting that occurred during the registrant’s second fiscal quarter covered by this report that has materially affected, or is reasonably likely to materially affect, the registrant’s internal control over financial reporting.
Item 12. Exhibits.
(a)(1) The registrant’s code of ethics pursuant to Item 2 of Form N-CSR is attached.
(2) Separate certifications by the registrant's principal executive officer and principal financial officer, pursuant to Section 302 of the Sarbanes-Oxley Act of 2002 and required by Rule 30a-2(a) under the Investment Company Act of 1940, are attached.
(3) Written solicitation to repurchase securities issued by closed-end companies: not applicable.
(b) A certification by the registrant's principal executive officer and principal financial officer, pursuant to Section 906 of the Sarbanes-Oxley Act of 2002 and required by Rule 30a-2(b) under the Investment Company Act of 1940, is attached.
SIGNATURES
Pursuant to the requirements of the Securities Exchange Act of 1934 and the Investment Company Act of 1940, the registrant has duly caused this report to be signed on its behalf by the undersigned, thereunto duly authorized.
T. Rowe Price Institutional International Funds, Inc.
| By | /s/ Edward C. Bernard | |
| Edward C. Bernard | ||
| Principal Executive Officer | ||
| Date February 15, 2013 | ||
Pursuant to the requirements of the Securities Exchange Act of 1934 and the Investment Company Act of 1940, this report has been signed below by the following persons on behalf of the registrant and in the capacities and on the dates indicated.
| By | /s/ Edward C. Bernard | |
| Edward C. Bernard | ||
| Principal Executive Officer | ||
| Date February 15, 2013 | ||
| By | /s/ Gregory K. Hinkle | |
| Gregory K. Hinkle | ||
| Principal Financial Officer | ||
| Date February 15, 2013 | ||