EXHIBIT (c)(xi)
The Queensland Treasury Corporation
2005-2006 Annual Report
2005-2006
Annual Report
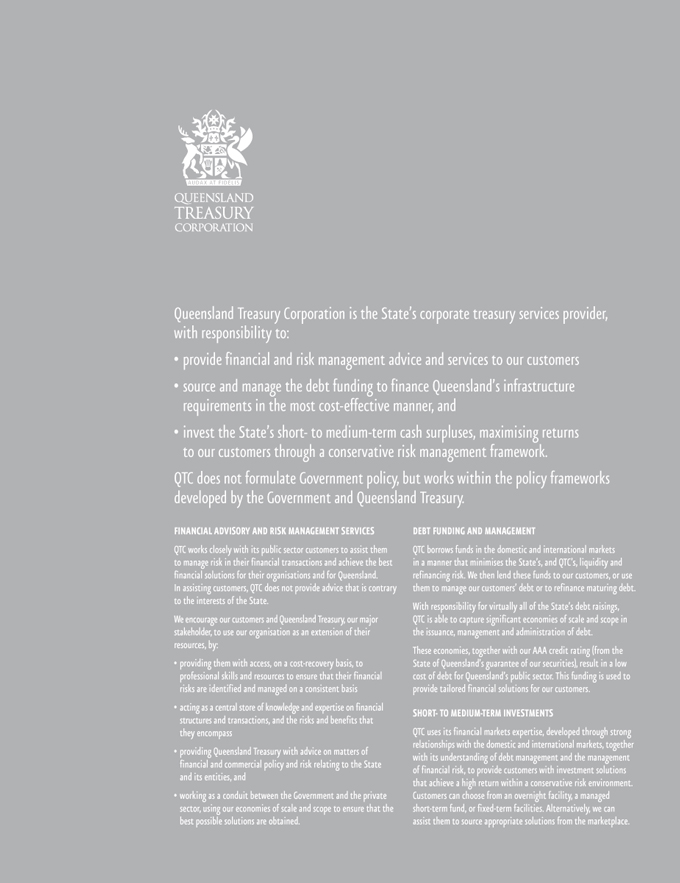
Queensland Treasury Corporation is the State’s corporate treasury services provider, with responsibility to:
provide financial and risk management advice and services to our customers
source and manage the debt funding to finance Queensland’s infrastructure requirements in the most cost-effective manner, and
invest the State’s short- to medium-term cash surpluses, maximising returns to our customers through a conservative risk management framework.
QTC does not formulate Government policy, but works within the policy frameworks developed by the Government and Queensland Treasury.
Financial advisory and risk management services
QTC works closely with its public sector customers to assist them to manage risk in their financial transactions and achieve the best financial solutions for their organisations and for Queensland.
In assisting customers, QTC does not provide advice that is contrary to the interests of the State.
We encourage our customers and Queensland Treasury, our major stakeholder, to use our organisation as an extension of their resources, by:
• providing them with access, on a cost-recovery basis, to professional skills and resources to ensure that their financial risks are identified and managed on a consistent basis
• acting as a central store of knowledge and expertise on financial structures and transactions, and the risks and benefits that they encompass
• providing Queensland Treasury with advice on matters of financial and commercial policy and risk relating to the State and its entities, and
• working as a conduit between the Government and the private sector, using our economies of scale and scope to ensure that the best possible solutions are obtained.
DEBT FUNDING AND MANAGEMENT
QTC borrows funds in the domestic and international markets in a manner that minimises the State’s, and QTC’s, liquidity and refinancing risk. We then lend these funds to our customers, or use them to manage our customers’ debt or to refinance maturing debt.
With responsibility for virtually all of the State’s debt raisings, QTC is able to capture significant economies of scale and scope in the issuance, management and administration of debt.
These economies, together with our AAA credit rating (from the State of Queensland’s guarantee of our securities), result in a low cost of debt for Queensland’s public sector. This funding is used to provide tailored financial solutions for our customers.
SHORT- TO MEDIUM-TERM INVESTMENTS
QTC uses its financial markets expertise, developed through strong relationships with the domestic and international markets, together with its understanding of debt management and the management of financial risk, to provide customers with investment solutions that achieve a high return within a conservative risk environment. Customers can choose from an overnight facility, a managed short-term fund, or fixed-term facilities. Alternatively, we can assist them to source appropriate solutions from the marketplace.
Vision
Efficient and effective financial risk management practices across our customers and the State.
Mission
To provide corporate treasury services to our customers and the State, by striving to understand our customers’ current and future needs and delivering solutions to meet those needs.
Values
Open communication, respect for the individual, integrity and honesty in all our dealings, good corporate citizenship, strong commitment, and valuable contributions.
Stakeholder
Queensland Treasury Corporation (QTC) was established by the Queensland Treasury Corporation Act 1988, as a Corporation Sole, constituted by the Under Treasurer of Queensland. QTC has delegated its powers to the QTC Capital Markets Board. QTC and the Board have agreed the terms and administrative arrangements that govern the exercise of those powers and the reports by the Board to QTC.
Customers
QTC provides financial advice and financial risk management services, debt funding, and short- to medium-term investment options to Queensland’s public sector organisations—the State Government, its departments and agencies, statutory authorities and government owned corporations, and local governments and their entities.
2005-2006
Annual Report
| | |
HIGHLIGHTS | | 3 |
| |
FIVE YEAR BUSINESS SUMMARY | | 4 |
| |
CHAIRMAN’S AND CHIEF EXECUTIVE’S REPORT | | 7 |
| |
CUSTOMER REPORT | | 11 |
| |
INVESTOR REPORT | | 19 |
| |
CORPORATE REPORT | | 24 |
| |
ECONOMIC AND FISCAL REPORT | | 31 |
| |
CONCISE FINANCIAL STATEMENTS | | 35 |
| |
APPENDIX A: LOANS TO CUSTOMERS | | A1 |
| |
APPENDIX B: PARTNERS IN FINANCIAL MARKETS | | B1 |
| |
APPENDIX C: STATUTORY DISCLOSURE STATEMENTS | | C1 |
| |
APPENDIX D: CORPORATE DIRECTORY | | D1 |
www.qtc.qld.gov.au
2005 - 2006 ANNUAL REPORT 1
Queensland Motorways Limited:
Gateway Bridge duplication
QTC is funding Queensland Motorway’s $1.6 billion Gateway Upgrade Project that will duplicate the Gateway Bridge and upgrade 20 kilometres of associated motorway. QTC also provided a seconded employee to the Gateway Upgrade Project Team and advised on interest rate risk management and future borrowing requirements. With more than 100,000 vehicles travelling across the existing Gateway Bridge each day and many more vehicles using the associated motorway, the duplication project will help ensure QML can meet the growing demands of Queensland’s motorists.
Image supplied by Queensland Motorways Limited.
2 QUEENSLAND TREASURY CORPORATION
Highlights
Investor
| • | | As the premier Australian semi-government bond issuer, QTC issued $4.7 billion of Australian dollar denominated benchmark bonds—$2.6 billion ‘domestics’ and $2.1 billion interest withholding tax exempt ‘globals’—maintaining our targeted minimum outstandings in each of our six benchmark bond lines. |
| • | | QTC’s AAA credit rating, for local and foreign currency borrowings, was reaffirmed by Moody’s Investor Services and Standard and Poor’s. |
| • | | The launch of QTC’s capital indexed bond was met by strong demand from investors seeking inflation-linked investment returns. It was the first significant inflation-linked bond issue by an Australian semi-Government authority in several years and, with an August 2030 maturity, was the longest dated government inflation-linked bond in the market. |
Customer
| • | | QTC achieved total savings for customers, from portfolio management and borrowing margins, of almost $121 million, increasing its cumulative savings for customers since 1991 to approximately $1.466 billion. |
| • | | In partnership with the Local Government Association of Queensland (LGAQ), QTC established the ‘LG Infrastructure Services’ corporation, enabling local governments to achieve economies of scale and access to improved services to assist in the delivery of local government infrastructure. |
| • | | For Queensland Treasury, we completed credit reviews of Queensland’s major investment and procurement projects and Government Owned Corporations. |
| • | | To support the achievement of the joint Government and LGAQ ‘Size, Shape and Sustainability’ initiative, we began the financial sustainability reviews of more than 100 Queensland local governments. |
| • | | On behalf of our customers, QTC locked-in more than $2.0 billion of future borrowings at favourable interest rates, providing them with certainty in relation to their future borrowing costs. |
Corporate
| • | | 26 employees were seconded to work within our stakeholder’s and customers’ businesses, on projects or to fill key positions. These secondments further strengthened QTC’s relationships and understanding of our customers and their unique challenges. |
| • | | QTC achieved an operating surplus of $62.3 million, before payment to the State of tax equivalents. |
| • | | Our excellence in transactional risk management was highlighted by QTC’s back office minimising the dollar cost of errors to just $1,598 on a financial markets transaction turnover of $208.8 billion. |
2005 - 2006 ANNUAL REPORT 3
Five year business summary
| | | | | | | | | | | | |
| | | FINANCIAL
YEAR
2001–02 | | FINANCIAL
YEAR
2002–03 | | | FINANCIAL
YEAR
2003–04 | | FINANCIAL
YEAR
2004–05 | | | FINANCIAL
YEAR
2005–06 |
FINANCIAL | | | | | | | | | | | | |
| | | | | |
OPERATING STATEMENT ($000) | | | | | | | | | | | | |
| | | | | |
Interest from onlendings | | 1 092 077 | | 1 826 847 | | | 371 737 | | 1 442 995 | | | 572 306 |
Management fees | | 21 970 | | 24 318 | | | 22 144 | | 22 993 | | | 22 698 |
Interest on borrowings | | 1 295 279 | | 2 157 121 | | | 468 243 | | 1 849 012 | | | 857 281 |
Income distribution | | 149 264 | | 166 529 | | | 239 933 | | 262 307 | | | 302 987 |
Operating surplus before payment in lieu of income tax | | 42 610 | | 60 098 | | | 35 830 | | 57 735 | | | 62 310 |
Payment in lieu of income tax | | 13 694 | | 13 176 | | | 12 553 | | 11 647 | | | 12 741 |
Operating surplus after payment in lieu of income tax | | 28 916 | | 46 922 | | | 23 277 | | 46 088 | | | 49 569 |
| | | | | |
BALANCE SHEET ($000) | | | | | | | | | | | | |
| | | | | |
Total assets | | 26 039 139 | | 26 866 311 | | | 26 809 429 | | 30 345 228 | | | 33 492 178 |
Total liabilities | | 25 844 495 | | 26 657 745 | | | 26 577 586 | | 30 067 297 | | | 33 164 678 |
Net assets | | 194 644 | | 208 566 | | | 231 843 | | 277 931 | | | 327 500 |
| | | | | |
CUSTOMER | | | | | | | | | | | | |
| | | | | |
SAVINGS FOR CUSTOMERS ($M) | | | | | | | | | | | | |
| | | | | |
Savings due to portfolio management | | 17.9 | | 13.6 | | | 54.6 | | (9.1 | ) | | 46.5 |
Savings due to borrowing margin | | 53.3 | | 56.1 | | | 63.1 | | 55.8 | | | 74.4 |
Total savings for customers | | 71.2 | | 69.7 | | | 117.7 | | 46.7 | | | 120.9 |
Cumulative savings for customers | | 1 111.4 | | 1 181.1 | | | 1 298.8 | | 1 345.5 | | | 1 466.4 |
| | | | | |
LOANS TO CUSTOMERS | | | | | | | | | | | | |
| | | | | |
Loans ($000) | | 18 419 899 | | 19 670 526 | | | 17 714 737 | | 18 905 621 | | | 19 831 582 |
Number of onlending customers | | 383 | | 363 | | | 308 | | 292 | | | 321 |
Outperformance of benchmark (% pa semi-annual) | | | | | | | | | | | | |
Floating Rate Debt Pool | | 0.46 | | 0.14 | | | 0.18 | | 0.16 | | | 0.19 |
3 Year Debt Pool | | 0.20 | | (0.02 | ) | | 0.22 | | (0.02 | ) | | 0.27 |
6 Year Debt Pool | | 0.04 | | 0.00 | | | 0.28 | | (0.07 | ) | | 0.23 |
9 Year Debt Pool | | 0.00 | | 0.06 | | | 0.28 | | (0.14 | ) | | 0.20 |
12 Year Debt Pool | | 0.01 | | 0.07 | | | 0.34 | | (0.13 | ) | | 0.24 |
15 Year Debt Pool | | 0.02 | | 0.05 | | | 0.36 | | (0.15 | ) | | 0.23 |
4 QUEENSLAND TREASURY CORPORATION
| | | | | | | | | | | | |
| | | FINANCIAL
YEAR
2001–02 | | FINANCIAL
YEAR
2002–03 | | FINANCIAL
YEAR
2003–04 | | FINANCIAL
YEAR
2004–05 | | FINANCIAL
YEAR
2005–06 | | QTC’s AAA credit rating, for local and foreign currency borrowings, was reaffirmed by Moody’s Investor Services and Standard and Poor’s. |
MANAGED FUNDS | | | | | | | | | | | |
Deposits ($000) | | 3 171 913 | | 4 148 083 | | 4 476 280 | | 5 220 644 | | 5 329 329 | |
Number of depositors | | 215 | | 223 | | 258 | | 270 | | 253 | |
Outperformance of benchmark (% pa semi-annual) | | | | | | | | | | | |
Cash Fund | | 0.17 | | 0.18 | | 0.18 | | 0.17 | | 0.16 | |
FINANCIAL MARKETS | | | | | | | | | | | |
Debt outstanding ($000) | | 22 025 716 | | 22 219 443 | | 21 702 155 | | 24 582 052 | | 27 519 577 | |
QTC bond rates (% at 30 June) | | | | | | | | | | | |
May 2003 | | 5.25 | | - | | - | | - | | - | |
June 2005 | | 5.81 | | 4.51 | | 5.45 | | - | | - | |
September 2007 | | 6.03 | | 4.78 | | 5.70 | | 5.31 | | 6.00 | |
July 2009 | | 6.18 | | 4.98 | | 5.87 | | 5.31 | | 5.99 | |
May 2010 | | - | | - | | - | | 5.34 | | 6.00 | |
June 2011 | | 6.29 | | 5.13 | | 5.98 | | 5.35 | | 6.01 | |
August 2013 | | 6.38 | | 5.24 | | 6.07 | | 5.36 | | 6.00 | |
October 2015 | | 6.42 | | 5.30 | | 6.12 | | 5.37 | | 6.02 | |
June 2021 | | 6.47 | | 5.38 | | 6.18 | | 5.40 | | 6.02 | |
QTC Capital-Indexed Bond rates (% at 30 June) | | | | | | | | | | | |
August 2030 | | - | | - | | - | | - | | 2.51 | |
Basis point margin over Commonwealth bonds | | 24.3 | | 16.7 | | 19.3 | | 22.5 | | 21.8 | |
Basis point margin under NSW TCorp bonds | | 3.3 | | 2.1 | | 3.1 | | 2.5 | | 3.9 | |
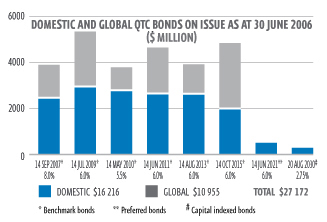
QTC global and domestic bonds on issue at face value | | 19 148 | | 18 406 | | 20 486 | | 22 186 | | 26 903 | |
| | | | | | | | | | | |
CORPORATE | | | | | | | | | | | |
Number of employees | | 121 | | 129 | | 130 | | 122 | | 139 | |
Administration expenses ($000) | | 23 716 | | 24 555 | | 28 403 | | 30 021 | | 30 249 | | |
2005 - 2006 ANNUAL REPORT 5
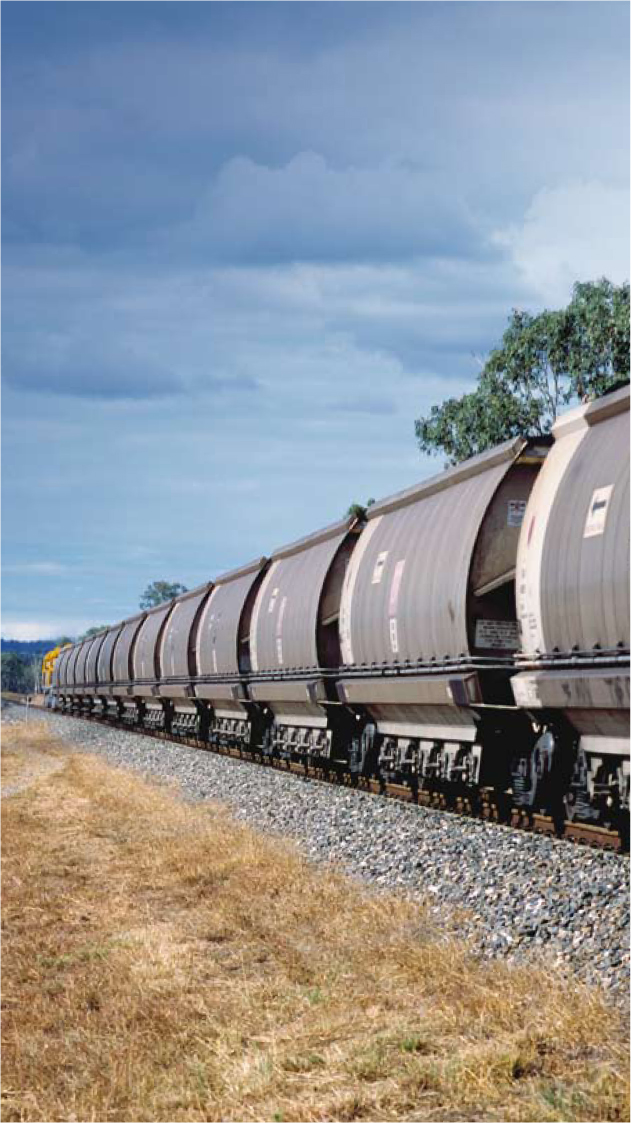
Queensland Rail:
Government Owned Corporation Lending Terms and Conditions
QTC worked closely with Queensland Rail (QR) on the approval, establishment and implementation of the State’s new Government Owned Corporation Lending Terms and Conditions. Under the new terms and conditions, QTC provided debt funding for QR’s multi-million dollar acquisition of Australian Railroad Group’s rail assets, further positioning QR as a major player in the national transport industry.
Image supplied by Queensland Rail.
6 QUEENSLAND TREASURY CORPORATION
Chairman’s and Chief Executive’s Report
While the first half of the 2005-06 financial year was relatively steady in the world’s economies and financial markets, the second half was characterised by increased economic uncertainties and financial market volatility. Through these changing trends, Queensland Treasury Corporation (QTC) maintained its position as the foremost Australian semi-government issuer of Australian dollar denominated bonds in both the domestic and offshore markets.
With the backdrop of ongoing demand for attractively priced Australian dollar assets, QTC successfully issued $4.7 billion of benchmark bonds, sourcing $2.6 billion domestically and $2.1 billion through global issuance.
We continued to fund the Queensland public sector’s borrowings, with total loans outstanding of $19.8 billion. Our borrowing program was substantial with more than $5.1 billion of funding for refinancing and new capital works being raised in the 2005–06 financial year.
On behalf of our customers, we have invested more than $5.3 billion of funds in competitively priced and strongly performing portfolios for short-to medium-term investments.
We achieved total savings for customers, from portfolio management and borrowing margins, of $120.9 million, bringing cumulative savings since 1991 to almost $1.5 billion. QTC itself also performed well, achieving an operating surplus of $62.3 million before payment of tax equivalents to the State.
Global economy:
providing a favourable backdrop
The world economy has performed strongly in the year under review, despite the largest sustained increase in oil prices since the oil shocks of the mid-to late-1970s. This resilience was underpinned by supportive monetary and fiscal policies across the developed world, coupled with strong corporate investment and balance sheets. Over the course of the financial year, the pattern of growth across countries became more broad-based, as a number of economies, including India, Russia and China, posted higher than projected outcomes. This pattern led the International Monetary Fund to forecast that the global economy is likely to grow by 5% in 2006 and by 4.75% in 2007.
On the back of this widespread economic growth, central banks around the world are lifting their official interest rates from the unusually low levels of earlier in this decade. The Reserve Bank of Australia, in direct response to a combination of strong global economic trends and firmer domestic data, raised its official cash rate once, by 0.25 percentage points, to 5.75% during the year.
Against this favourable global backdrop, the Australian economy is estimated to have grown by 2.5% in 2005-06. This is below its 10-year average growth rate of 3.7%, below the 10-year average of Australia’s major trading partners (3.5%) and below the 10-year average of the countries of the OECD (2.7%). Underpinning growth in 2005-06 was a shift in the ‘balance of growth’, where slower household consumption was offset by strengthening business investment. In addition, our exports have improved on the back of strong global demand, narrowing the gap between imports and exports. This shift in the balance of growth is expected to consolidate in 2006-07, largely due to continued strong export growth, household consumption remaining below average, and business investment growth slowing.
Queensland’s economy:
keeping the nation buoyant
Queensland’s economy is estimated to have grown by 3.5% in 2005-06, which is below our long-term average, but still well above the national growth rate of 2.5%. The composition of domestic investment activity is expected to have changed in the past year, as investments in additional productive capacity resulted in the business and public sectors largely replacing the household sector as the main driver of the State’s economy. However, the level of consumer and business spending remained high and saw growth in imports continue to exceed that of exports. Consequently, foreign trade is expected to detract from overall growth for the fifth consecutive year.
2005 - 2006 ANNUAL REPORT 7
Chairman’s and Chief Executive’s Report (continued)
As Queensland’s strong economic outcomes continue to place growing demands on existing infrastructure, the Government’s program of increasing capital expenditure will ensure QTC’s borrowing requirements will be maintained into the foreseeable future.
After surging to a ten-year high of 5.6% in 2004-05, employment growth is estimated to have been 3% in 2005-06, and forecast to be 2.5% in 2006-07. This moderation reflects economic activity shifting away from the labour-intensive retail and construction industries towards the more capital-intensive sectors, such as mining. With jobs growth forecast to ease to the same rate as labour force growth, the unemployment rate in both 2005-06 and 2006-07 is expected to remain largely unchanged at 5%.
Queensland Treasury estimates that Queensland’s economy is likely to expand by 4.25% in 2006-07, which is slightly below its long-term average of 4.5%. If achieved, this would make it the eleventh consecutive year that Queensland’s economic growth will have exceeded that of the nation. This is expected to be underpinned largely by an anticipated strengthening in exports growth as greater transport capacity and higher global growth benefit coal and other mineral exports.
QTC’s borrowing requirements:
a whole-of-State focus
Queensland’s funding requirement for 2005-06 was $5.1 billion, which was $1.6 billion more than originally estimated in our borrowing program. With the Queensland economy expanding at a rate greater than the national average, coupled with supportive monetary policy settings, both at home and abroad, Queensland Government entities locked in funding costs for future capital expenditure at attractive interest rates.
Strong domestic and international investor interest in QTC’s A$ denominated benchmark bonds continued throughout the year and provided the bulk of our funding. In addition to our A$ benchmark bonds, we also successfully launched an August 2030 Capital Indexed Bond, which was met by strong demand from investors seeking inflation-linked investment returns. This was the first significant inflation-linked bond issue by an Australian semi-Government authority in several years, with the funds raised used to meet the borrowing requirements of select Queensland Government entities.
QTC’s Borrowing Program for the 2006-07 financial year includes estimates for new raisings for capital works in excess of $5 billion, against total State capital expenditure of more than $10 billion. As Queensland’s strong economic outcomes continue to place growing demands on existing infrastructure, the Government’s program of increasing capital expenditure through the South East Queensland Infrastructure Plan will ensure QTC’s borrowing requirements will be maintained into the foreseeable future.
Maintaining transparency in our
Financial Markets relationships
QTC continues to benefit from its proactive investor relationship program, maintaining regular contact with distribution group members, major global institutional investors and Asian central banks.
In September 2005, Queensland’s Premier and Treasurer, the Hon Peter Beattie, joined QTC and Queensland Treasury department representatives in a comprehensive series of meetings, in Hong Kong, China, Japan, Europe, United Kingdom and North America, which were extremely well received. In October, we hosted our biennial conference for our Fixed Interest Distribution Group members, with several representatives from London, Hong Kong and New York in attendance.
In January 2006, the Premier appointed the Hon Anna Bligh as Treasurer. The new Treasurer joined us in June to present the State’s 2006-07 budget in QTC’s annual post- Budget meetings with distribution group members and investors in Sydney and Melbourne.
We acknowledge the ongoing support of the member banks of QTC’s Fixed Interest Distribution Group, especially their willingness, over the past year, to work more closely with our customers. This support has been critical to QTC’s ongoing ability to add real value to Queensland, and we look forward to further enhancing our relationships in the years to come.
8 QUEENSLAND TREASURY CORPORATION

Building customer franchise to add real value to the State
We have strived to add additional value to our customers’ businesses over the past year through a significant increase in financial advisory and modelling assignments, as well as the successful implementation of a range of strategic customer initiatives that have further strengthened our relationships with our stakeholder and customers.
Our customer secondment program has been particularly successful, with QTC employees completing 26 secondment assignments in the past 12 months. Seven employees continue to work with LG Infrastructure Services, a joint initiative between QTC and the Local Government Association of Queensland, that is enabling local governments to achieve economies of scale and access to improved advisory services to assist with the delivery of their infrastructure.
Looking ahead:
opportunities and challenges
With work on the Government’s accelerated South East Queensland Infrastructure Plan well underway, we expect to see continued growth in the volume and scope of our customer advisory work. In particular, we anticipate our services will be required to assist with the financial evaluations and modelling of projects, risks assessments, and the provision of employees by way of secondment to work on these projects. We also look forward to an increased involvement in assisting the Government with its assessment of alternative and innovative approaches for the accelerated delivery of this infrastructure.
In addition to our customer advisory work, we will assist the State to achieve its infrastructure development objectives by delivering financing solutions that best meet the needs of customers and their projects. When opportunities arise, we will also seek to lock in funding, in advance of requirement.
As volatility in financial markets continues, due to the uncertainty in the political scene worldwide, the continued rise in oil prices and the expected slowing of the current growth cycle in the major economies, we are confident that QTC is well placed, and has the necessary resources, systems and processes to ensure we continue to add value to our customers.
In May, QTC responded positively to a request from the Government to second our Chief Executive to the role of Chief Executive of Energex’s retail arm, Sun Retail, in preparation for its sale in late 2006. During this time, Stephen has maintained a strategic involvement with QTC and will resume his fulltime role with QTC at the conclusion of the sale process.
Acknowledgements
On behalf of the Board and the management team, we thank our colleagues, QTC’s employees, for their ongoing commitment to delivering financial services and solutions that meet or exceed our customers’ expectations and maintain the financial integrity of Queensland. It is their professionalism, commitment and vision that have enabled QTC to record another successful year in terms of benefits and services provided to customers, and we look forward to working together to meet the challenges of the year ahead.
|
 |
|
| Sir Leo Hielscher AC |
Chairman |
|
 |
|
| Stephen Rochester |
Chief Executive |
2005 - 2006 ANNUAL REPORT 9
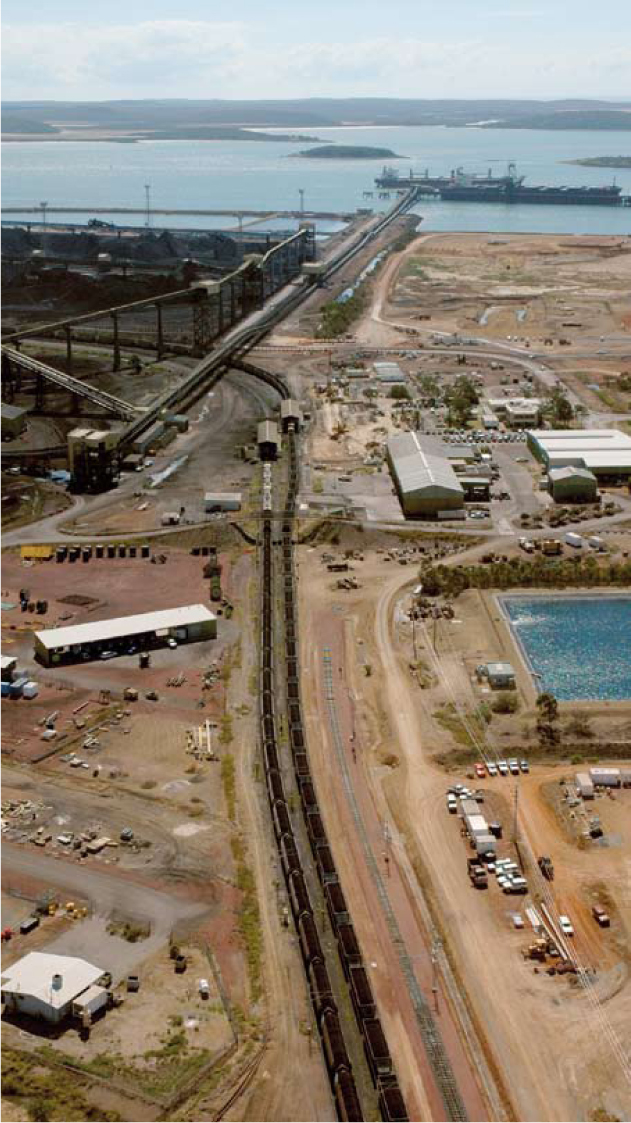
Central Queensland PortsAuthority:
Gladstone port expansion
In addition to providing funding for the RG Tanna Coal Terminal Expansion Project, QTC assisted in determining an appropriate risk framework for Central Queensland Ports Authority’s debt requirement and a capital structure review, resulting in a Government equity injection of $300 million. The new terminal will position Gladstone as one of the world’s largest coal export ports, increasing its total coal exporting capacity from 45 to 70 million tonnes per annum by the fourth quarter of 2007.
Image supplied by Central Queensland Ports Authority.
10 QUEENSLAND TREASURY CORPORATION
Customer Report
Adding real value
Queensland Treasury Corporation (QTC) added more than $180 million in quantifiable benefits to customers in the year under review: $112 million from issuing and managing debt; $19 million from managing customers’ liquidity and refinancing risk; and $9 million from managing surplus cash balances. Our financial advisory services and strategic interest rate risk management advice also generated customer savings in the order of $40 million.
In addition to these quantifiable savings, QTC was involved in the transaction-based working groups on most of the public sector’s major projects, which has provided us with the opportunity to generate further savings for Queensland. While the dollar value of our direct contribution to these working groups is difficult to quantify, the size of transactions in which we were involved this year exceeds several billion dollars.
QTC’s debt funding facilities continued to provide highly liquid and cost effective funding, enabling us to provide our customers with the financial solutions to meet their needs.
With the State’s significant commitment to future capital works, QTC has been proactive in identifying market opportunities for customers to hedge their interest rates for future borrowings, with customers locking in an additional $2.0 billion of their future funding requirements at advantageous interest rates. This was particularly relevant for a number of our regulated customers, as well as those undertaking major infrastructure projects; the viability of such being enhanced by funding at relatively low costs of funds.
With an increasing focus on commodity and foreign exchange risk management, we have worked closely with our customers to identify their exposures and, where appropriate, establish customised hedging solutions. As a consequence, QTC saw a threefold increase in the dollar value of customer transactions in this financial year, when compared to the previous financial year. Through using the services of QTC’s Fixed Interest Distribution Group, our customers have benefited from the ability to transact at highly competitive market rates.
More and varied customer assignments
QTC’s organisation-wide commitment to enhancing its understanding of customers’ businesses has been reflected in the continued strengthening of customer relationships. Through the achievement of a number of key strategic business initiatives, QTC fostered closer ties with partner organisations, including Queensland Treasury Department branches, the Department of Local Government, Planning, Sport and Recreation, and the Local Government Association of Queensland.
We experienced an increase in both the volume and scope of customer assignments, as customers sought our early involvement and advice in their proposed projects, debt and hedging transactions and, to a lesser extent, investments.
Through partnering with member banks of our Distribution Group, we extended our financial risk management services to our customers, thereby increasing the value added to their businesses.
Queensland Treasury
QTC provided Queensland Treasury with financial risk management services and advice, including lengthening the term of its debt to take advantage of favourable interest rates, managing whole-of-Government cash and liquidity, and assisting them with managing a broad range of day-to-day issues.
To assist on critical Government projects and to fill key positions, QTC seconded a number of employees to Queensland Treasury. We also entered into an agreement with Queensland Treasury to provide them with ongoing financial modelling support, through secondment arrangements, that will ensure Government access to skilled modellers that understand their needs. This followed a range of key assignments where we developed models for major procurement options and the costing of service provision on their behalf.
2005-2006 ANNUAL REPORT 11
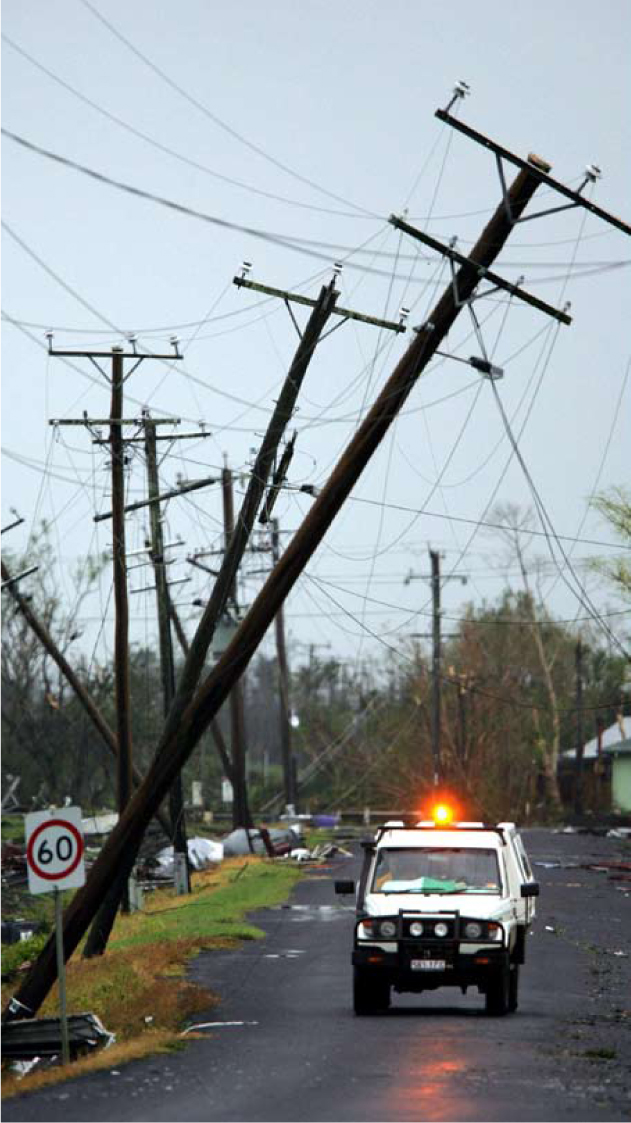
Ergon Energy:
Ongoing funding and related advice
QTC works closely with Ergon Energy, providing advice on managing interest rate, commodity and foreign exchange risk, as well as ongoing debt funding. In March 2006, Ergon Energy faced a substantial challenge when Cyclone Larry created havoc in north Queensland. Within days, Ergon Energy deployed more than 400 field staff in its massive restoration effort to rebuild the cyclone-damaged electricity network and restore power to more than 135,000 people.
In the wake of Cyclone Larry, an Ergon Energy truck inspects damaged power poles at Mourilyan (22 March 2006).
Photography by Bruce Long from The Courier-Mail.
12 QUEENSLAND TREASURY CORPORATION
Customer Report (continued)
Local Government
For Queensland’s local governments, QTC provided financial risk management advice on cost of capital, capital structuring for business units, pricing of goods and services, analysis of investment products and/or fund managers, procurement options for the provision of infrastructure services, and developed financial models to assist with their decision-making.
To improve State-wide financial forecasting, and support the achievement of the Local Government Association of Queensland’s (LGAQ) Size, Shape and Sustainability initiative, QTC developed a 10-year financial forecasting model, and began a major project to review the financial sustainability of more than 100 Queensland councils, with the reviews due for completion by 30 June 2007.
QTC also placed its first secondee into a local government to lead a review of its treasury operation and make recommendations and implement appropriate improvements.
Our joint initiative with the LGAQ—LG Infrastructure Services—produced significant benefits in the delivery of local government infrastructure, being awarded 15 individual assignments and three significant regional assignments which will lead to significant economy of scale outcomes for local government.
Government Departments and Agencies
During the year, Queensland’s Government departments and agencies sought QTC’s involvement in analysing matters of financial and commercial risk in a variety of procurement projects and other assignments. In these assignments, we advised on the financial aspects of their business cases for major investments; assisted with the development of water pricing models; undertook assignments to more accurately price the provision of services; assisted with the review of credit issues associated with major procurements; evaluated major leasing proposals; and provided advice and assistance to hedge their exposure to foreign exchange risks.
QTC also developed numerous customer-specific models for key projects, and reviewed and quality-assured customers’ existing models. In many cases, the scope of the engagement and/or model development increased as our customers’ awareness of our financial modelling expertise increased.
Government Owned Corporations
We continued to build on the core debt-related services QTC provides to Government Owned Corporation (GOC) customers and, over the past year, have experienced an increase in financial risk advisory assignments, both in terms of the breadth of the assignments and the number of GOCs seeking assistance.
During the year, Queensland’s GOCs sought our expertise and advice on capital structure and cost of capital reviews. We also identified and developed frameworks to manage foreign exchange and commodity price risk; developed and quality assured financial models; and project managed commercial advisory assignments, on behalf of our GOC customers.
A number of QTC employees were seconded to work with our GOC customers, with more secondments already agreed for the coming year.
Major projects
QTC provided advice on matters of financial or commercial risk on all of Queensland’s major procurement projects, including:
| • | | establishing financial and commercial arrangements for the Gateway Bridge duplication project |
| • | | developing long-dated contract management processes for the Southbank Institute redevelopment project |
| • | | assisting with the management of financial and commercial arrangements associated with the Tennyson Riverside Development Project |
| • | | analysing the impact on the financial position of SunWater in relation to the Burdekin Pipeline and the purchase of Burnett Dam |
| • | | providing modelling, cost of capital, capital structure and other financial advisory advice around the restructuring of arrangements between Queensland and New South Wales, with respect to water access issues associated with the various rivers on the states’ borders, and |
| • | | developing financial models to assist the State’s decision-makers to determine the pricing of the various water infrastructure options. |
We experienced an increase in both the volume and scope of customer assignments, as customers sought our early involvement and advice in their proposed projects, debt and hedging transactions and, to a lesser extent, investments.
2005-2006 ANNUAL REPORT 13
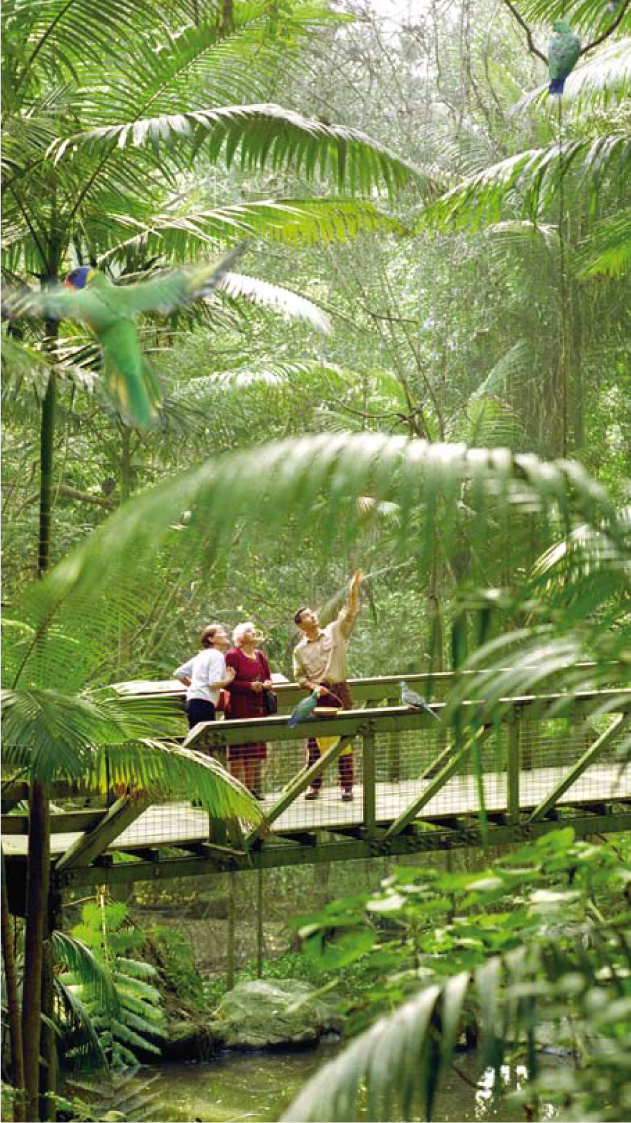
Currumbin Wildlife Sanctuary
QTC built a detailed business model for Currumbin Wildlife Sanctuary, which is managed by the National Trust of Queensland, to assist them to forecast future cash flows and adjust key variables. This model is a valuable business management tool for assessing the strategic business options of one of Australia’s favourite holiday destinations—a wildlife sanctuary for rare native animals, and research and conservation facility.
Image supplied by Currumbin Wildlife Sanctuary.
14 QUEENSLAND TREASURY CORPORATION
Customer Report (continued)
Credit reviews
In the year under review, the debt of Queensland’s GOCs increased by almost $1.9 billion, an increase of approximately 20% when compared to the past financial year (see Appendix A). To assist the Government in its approval process for the GOCs annual borrowings, QTC completed credit reviews of each corporation to determine their individual capacities to service their existing and proposed debt, and provided Treasury with specific recommendations based on the findings of those reviews.
Some of these recommendations included deferring all or part of the requested borrowing program until such time as the shareholding ministers’ have approved the project, based on Treasury’s review of the business case, from an investment perspective, and QTC’s credit review of the project and its effect on the risk profile of the corporation.
To enhance the ongoing monitoring of GOCs from a credit perspective, QTC, in conjunction with Treasury, established the GOC Lending Terms and Conditions framework and implemented the new terms and conditions with three GOCs. The implementation into all of the State’s GOCs is scheduled for completion within the next year.
Risk management
QTC partnered with some of its key customers—including Queensland Rail, QFleet, Energex Retail, Department of Housing and Brisbane City Council—to manage their financial risks, either by participating as a member of their risk committees, or by attending meetings by request.
For our energy sector customers, we focused on identifying and developing an overall risk management framework for the management of their foreign exchange and commodity risks.
Building on QTC’s experience in managing the State’s long-term cross border leases, we began work to adapt this knowledge to assist in establishing appropriate arrangements to manage the risks associated with the State’s first public-private partnership long-term contract, awarded for the redevelopment of the Southbank Institute. This ongoing project encompasses the implementation of a contract management framework and system that can be used for any of the State’s future long-term contracts.
We developed models to assist our customers to better understand and manage the interest rate risks of infrastructure transactions that occur between the selection of preferred suppliers and the financial close of the transaction. In addition, we assisted customers to ensure that pricing achieved at financial close was consistent with market prices on that day.
Secondments with customers
QTC seconded 26 employees into core strategic or operating roles within our stakeholder’s and customers’ organisations during the year. While the key benefit of our secondment program is the ability to provide specialist assistance when and where our customers need it, the additional benefits of improving our customer relationships, and developing our own knowledge and skills, are substantial. Our secondment program continued to receive positive customer and employee feedback.
Customer training and support
We demonstrated our continued corporate commitment to knowledge and information sharing, hosting a range of courses for customers, including:
| • | | QTC’s Corporate Financial Management Course, with 18 participants from our local government, Treasury and GOC customers |
| • | | two Cost of Capital courses, tailored to meet the identified needs of our GOC customers |
| • | | regular economic updates for customers, with the senior economists from the member banks of our Fixed Interest Distribution Group, as well as QTC’s team of economists, and |
| • | | local government customer-specific presentations on managing surplus cash and workshops on managing financial risks. |
QTC seconded 26 employees into core strategic or operating roles within our stakeholder’s and customers’ organisations during the year.
2005 -2006 ANNUAL REPORT 15
LG Infrastructure Services
LG Infrastructure Services provides access to centralised skills, resources and solutions that would otherwise not be available to individual local governments, at a fraction of the cost of other alternatives.
A strategic QTC and LGAQ initiative
During the year, QTC joined with the Local Government Association of Queensland to establish a corporation —LG Infrastructure Services—to assist Queensland’s local governments with a range of services for infrastructure projects.
LG Infrastructure Services provides access to centralised skills, resources and solutions that would otherwise not be available to individual local governments, at a fraction of the cost of other alternatives.
Services for infrastructure projects
LG Infrastructure Services assists councils with support at each stage of a potential project’s life cycle, including:
| • | | business case development |
| • | | procurement strategy determination |
| • | | tendering and contracting |
| • | | project monitoring (and, if necessary, renegotiation and restructuring). |
LG Infrastructure Services endeavours to achieve reduced costs, increased negotiating and purchasing power, and greater efficiencies for local governments by providing a comprehensive range of project support services at each project stage, including:
| • | | reviewing infrastructure procurement plans and strategies |
| • | | undertaking risk assessments |
| • | | managing advisers and other skilled professionals |
| • | | reviewing approaches to funding and applying for subsidies |
| • | | assisting in discussions with administering departments |
| • | | helping local governments to work collectively to achieve better outcomes |
| • | | facilitating project delivery, and |
| • | | providing independent advice. |
LG Infrastructure Services also undertakes Project Assurance Reviews, which help a council ensure they have asked the right questions in undertaking a project.
Major projects
Since its launch by the Premier on 31 August 2005, LG Infrastructure Services has been awarded numerous assignments to provide advice or other services to local governments for projects such as refurbishments of council chambers, delivery of sewerage and waste water treatment plants, negotiations with mining companies in relation to water supply, property development, and the upgrade of airports.
LG Infrastructure Services has also been awarded a series of significant regional and State-wide projects for the delivery of local government infrastructure, including the:
| • | | $90 million South East Queensland (SEQ) water leakage and pressure management project, which is being undertaken on behalf of 18 SEQ councils and the State. This is the largest project of its kind to be undertaken in Australia and is a key element in the SEQ regional drought strategy. LG Infrastructure Services is managing a regional project collaboration office to deliver centralised procurement of key program components for participating councils. The State’s $32 million contribution to this project has been invested with QTC. |
| • | | $23 million Home WaterWise Service, which is being delivered for the State and 21 SEQ councils. This project is using a similar funding model to, and being delivered from, the same project office as the SEQ leakage and pressure management project. |
| • | | $1 billion local government sewerage treatment plant upgrade program, where a study of this State-wide capital works program was completed for the Department of Local Government, Planning, Sport and Recreation (DLGPSR), identifying opportunities for regional collaboration and scale-based procurement that have the potential to generate savings of around 20% to 30% of the total program cost (around $200 to $300 million of savings to councils and the State). |
In its first 10 months of operation, LG Infrastructure Services has advised on projects worth more than $1.5 billion, and is now evaluating local government infrastructure projects worth a further $1 billion or more.
16 QUEENSLAND TREASURY CORPORATION
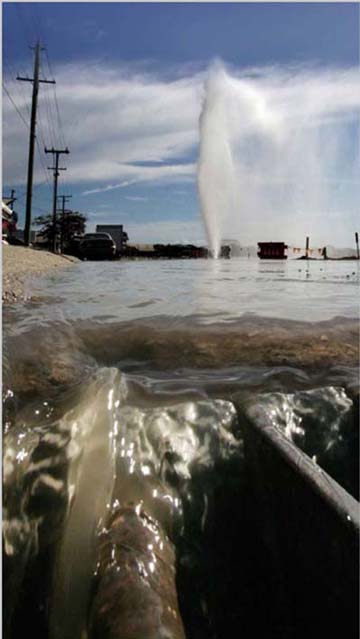
South East Queensland
councils: Leakage and Pressure Management
LG Infrastructure Services is working with 18 South East Queensland councils on a leakage and pressure management project, taking on the role of Regional Project Coordinator to ensure a joint approach to overall project planning and implementation. This project is one of the largest joint infrastructure delivery initiatives ever undertaken in Australia, and will reduce the incidence of water main breaks by more than 70%. This project’s implementation will save 60 olympic-sized pools of water each day.
A broken pipe sprays water high into the air in Northgate, Brisbane.
Photography by Jamie Hanson from The Sunday Mail.
2005 - 2006 ANNUAL REPORT 17
CS Energy Limited:
Kogan Creek Power Project
QTC has continued its work with CS Energy Limited on the Kogan Creek Power Project, providing ongoing debt funding and other related advice on minimising interest costs and managing foreign exchange risk. In addition, QTC assisted with the review of CS Energy’s capital structure that led to an equity injection by the government of $250 million. This $1.2 billion project is the most recent large-scale coal fired generation project to be developed in Queensland under the State Government’s Clean Energy Policy, and will generate 750 megawatts of electricity—the largest single generating unit in Australia.
Image supplied by CS Energy Limited.
18 QUEENSLAND TREASURY CORPORATION
Investor Report
Without the ongoing support of its investors, QTC could not meet the State’s funding requirements in such an efficient and effective manner. QTC strives to be fair and transparent in all of its dealings, keeping investors fully informed on all funding and related activities.
The Treasurer of Queensland, on behalf of the State Government, guarantees all of QTC’s debt obligations. The Queensland Government’s AAA credit rating is underpinned by the State’s strong fiscal management and economic performance. Investors also benefit from QTC’s commitment to maintaining a supply of bonds, in keeping with our overall strategy of providing benchmark lines with minimum outstandings and maturities spread along the yield curve.
Our funding activities are primarily driven by two factors: firstly, the extent of our public sector customers’ capital works, and the Government’s ongoing commitment to growing the capital base of our State; and, secondly, QTC’s ongoing commitment to ensuring that there are sufficient outstandings in each of our benchmark bond lines, so as to support market trading activities facilitated through our strong global Fixed Interest Distribution Group.
QTC ensures the Queensland public sector always has sufficient funds to meet its debt financing requirements as, and when, they are needed, and at the cheapest possible cost within a prudential risk management framework. In 2006-07, we estimate that our borrowing program will be almost $5.6 billion. This is half a billion more than our actual borrowings of $5.1 billion for 2005-06, and is primarily due to the Queensland Government’s ongoing commitment to boosting capital investment in the State and, also, funding for the maturity of our September 2007 benchmark bond line ($1.5 billion).
We continue to work in partnership with the members of our Fixed Interest Distribution Group, which provide QTC with invaluable support in our issuance and risk management activities. The strength of these relationships reflects the professionalism and integrity of the people we deal with and is highly valued by QTC. During the year, we independently surveyed our distribution group members to identify possible areas for future improvement. Feedback received indicated that QTC is very well regarded by their organisations. The survey results also confirmed support for our strategic approach to draw on their expertise, as we work to deliver a broader range of financial solutions for our customers.
Highlights
| • | | Our ongoing issuance of both domestic and global benchmark bonds demonstrates our commitment to ensuring suitable supply for investors. This financial year, we issued $4.7 billion of benchmark bonds, with $2.6 billion sourced domestically and $2.1 billion sourced through global issuance. |
| • | | QTC launched a domestic inflation-linked Capital Indexed Bond maturing in 2030, adding much needed supply to the inflation-linked bond market. |
| • | | Our AAA credit rating, for local and foreign currency borrowings, was reaffirmed by Moody’s Investor Services and Standard and Poor’s. |
| • | | In conjunction with the Premier and Treasurer of Queensland, QTC conducted domestic and international roadshows throughout the year. We believe that providing investors with access to Queensland’s key decision-makers and timely information is critical to our efforts in supporting our investors and keeping the market informed of the State’s activities. |
| • | | We hosted our biennial conference for our Global Fixed Interest Distribution Group members, with the primary objective of enhancing our mutual understanding of the opportunities to add additional value to our Queensland customers. We were joined on the conference by a number of offshore representatives from our Fixed Interest Distribution Group, whose contributions greatly enhanced our understanding of the changing global market in which we operate. |
| • | | We also managed more than $5.3 billion, on average, of short term cash surpluses for QTC customers throughout the year. These funds were principally held in our Cash Fund, or in term deposits, for those customers requiring certainty in their investment returns. |
2005 - 2006 ANNUAL REPORT 19
| | | | | | | | |
| | | | Investor Report (continued) |
| | |
| | | | Credit ratings |
| | | | |
Queensland’s AAA credit rating is underpinned by the State’s strong fiscal management and economic performance. | | | | | | LONG-
TERM | | SHORT-
TERM |
| | | | LOCAL CURRENCY (A$) | | | | |
| | | | MOODY’S INVESTOR SERVICES | | Aaa | | P1 |
| | | | STANDARD & POOR’S | | AAA | | A-1+ |
| | | | FOREIGN CURRENCY | | | | |
| | | | MOODY’S INVESTOR SERVICES | | Aaa | | P1 |
| | | | STANDARD & POOR’S | | AAA | | A-1+ |
| | Review of 2005-06 funding activity During the course of the year, QTC borrowed more than originally anticipated due to a number of large customers who have significant forward funding requirements requiring certainty with regard to their future borrowing costs, and taking the opportunity to lock in their funding requirements at favourable interest rates. This funding was facilitated by the continuing strong investor demand for QTC’s A$ Benchmark Bonds. In the year under review, QTC also issued a Capital Indexed Bond, which will mature in August 2030. Certain of our customers recognised the potential benefits of including inflation-linked bonds in their debt portfolios and, at the same time, QTC was able to meet investor demand for inflation-linked investment returns. This was the first significant inflation-linked bond issue by a semi-Government authority in Australia in some time. Strong offshore investor interest for QTC’s A$ Global Benchmark Bonds continued throughout the year and provided cost effective funding. This contributed to commercial paper outstandings falling to A$111 million at 30 June 2006, less than the levels originally forecast. |
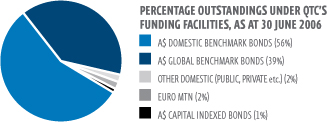
Over the past financial year, funding was primarily sourced from:
| | |
DOMESTIC A $ BENCHMARK BONDS | | $2,620 MILLION |
GLOBAL A$ BENCHMARK BONDS | | $2,097 MILLION |
A$ INFLATION LINKED BONDS | | $ 268 MILLION |
EURO MTNS, PUBLIC/PRIVATE BONDS | | $33 MILLION |
COMMERCIAL PAPER | | $ 111 MILLION |
TOTAL | | $ 5,129 million |
Funding facilities
A$ bonds—domestic and global
QTC currently offers investors domestic and global benchmark bonds maturing in 2007, 2009, 2010, 2011, 2013 and 2015, and a preferred domestic bond maturing in 2021.
In the year under review, we issued $268 million of inflation-linked capital indexed bonds, under QTC’s Domestic A$ Bond Facility, with a coupon of 2.75% pa payable quarterly, and a maturity date of 20 August 2030.
A$ Benchmark Bonds are our core source of funds, comprising in excess of 90% of borrowings as at 30 June 2006.
20 QUEENSLAND TREASURY CORPORATION
Facility details as at 30 June 2006
| | | | | | | | | | | | |
FACILITY | | SIZE $ M | | GOVERNING
LAW | | MATURITIES | | CURRENCIES | | AMOUNT ON ISSUE
$M (FV) | | PLACEMENT |
DOMESTIC A$ BOND | | UNLIMITED | | QUEENSLAND | | 6 BENCHMARK LINES MATURING 2007–2015 | | A$ | | $15,460 | | BY TAP OR TENDER THROUGH THE FIXED INCOME DISTRIBUTION GROUP |
| | | | | | |
| | | | | | PREFERRED BOND MATURING 2021 | | A$ | | $488 | | REVERSE ENQUIRY THROUGH THE FIXED INCOME DISTRIBUTION GROUP |
| | | | | | |
| | | | | | CAPITAL INDEXED BOND 2030 | | A$ | | $268 | | BY TAP OR TENDER THROUGH THE FIXED INCOME DISTRIBUTION GROUP |
| | | | | | |
| GLOBAL A$ BOND | | A$15,000 | | NEW YORK
AND
QUEENSLAND | | 6 BENCHMARK LINES 2007–2015 | | A$ | | $10,955 | | CONTINUOUSLY OFFERED THROUGH THE FIXED INCOME DISTRIBUTION GROUP |
Treasury Notes, Commercial Paper and Medium-Term Notes
QTC supplements its domestic and global bond facilities with various short- and medium-term note facilities.
The QTC Treasury Note (TNote) facility is an electronic issuance facility and is our chief source of short-term domestic funds. QTC’s main offshore programs are the multicurrency Commercial Paper (CP) and Medium-Term Note (MTN) facilities in both the Euro and the US markets.
Facility details as at 30 June 2006
| | | | | | | | | | | | |
FACILITY | | SIZE $ M | | GOVERNING
LAW | | MATURITIES | | CURRENCIES | | AMOUNT ON ISSUE
$M (FV) | | PLACEMENT |
| | | | | | |
| DOMESTIC TNOTE | | UNLIMITED | | QUEENSLAND | | 7–365 DAYS | | A$ | | $0 | | BY TAP OR TENDER THROUGH DEALER PANEL |
| | | | | | |
| EURO CP | | US$ 3,000 | | ENGLISH
AND
QUEENSLAND | | 7–365 DAYS | | MULTICURRENCY | | US$ 11 | | BY TAP THROUGH DEALER PANEL |
| | | | | | |
| US CP | | US$ 1,500 | | NEW YORK
AND
QUEENSLAND | | 1–270 DAYS | | MULTICURRENCY | | US$ 68 | | BY TAP THROUGH DEALER PANEL |
| | | | | | |
| EURO MTN | | US$ 3,000 | | ENGLISH
AND
QUEENSLAND | | SUBJECT TO
MARKET
REGULATIONS | | MULTICURRENCY | | US$ 322 | | REVERSE ENQUIRY THROUGH DEALER PANEL |
| | | | | | |
| US MTN | | US$ 500 | | NEW YORK
AND
QUEENSLAND | | 9 MONTHS TO
30 YEARS | | MULTICURRENCY | | US $ 0 | | REVERSE ENQUIRY THROUGH DEALER PANEL |
| | |
 | | QTC’s funding facilities are supplemented with public issues and private placements. [Appendix B lists the various distribution groups for QTC’s funding facilities at 30 June 2006. Additional information on QTC’s funding facilities and outstanding debts is available on QTC’s website at www.qtc.qld.gov.au, or on request from QTC’s Financial Markets Team (see Appendix D for contact details)]. |
2005 - 2006 ANNUAL REPORT 21
Investor Report (Continued)
Borrowing program
QTC reviews its borrowing requirements on 30 June and 31 December each year to provide a funding estimate for the following year.
QTC’s indicative borrowing program for 2005–06 and 2006–07
| | | | | | |
| | | 2005-06 $M | | | 2006-07 $M | |
REFINANCING OF MATURITIES: | | | | | | |
| | |
TERM DEBT | | | | | | |
- A$ BENCHMARK BONDS | | 0 | | | 0 | |
- NON-BENCHMARK DOMESTIC BONDS | | 126 | | | 90 | |
- FOREIGN CURRENCY LOANS AND MTNS | | 66 | | | 281 | |
COMMERCIAL PAPER | | | | | | |
TNOTES, ECP, USCP 1 | | 773 | | | 109 | |
| | |
SUBTOTAL (FOR REFINANCINGS) | | 965 | | | 480 | |
NEW RAISINGS: | | | | | | |
CAPITAL WORKS | | 3,550 | | | 5,200 | |
PRE-REDEMPTION OF SEP 2007 BENCHMARK BOND | | 0 | | | 1,500 | |
ADJUSTMENTS: | | | | | | |
PRE-FUNDING | | (430 | ) | | (1,000 | ) |
PRINCIPAL REPAYMENTS FROM QTC CUSTOMERS | | (600 | ) | | (600 | ) |
TOTAL | | 3,485 | | | 5,580 | |
1. Estimated commercial paper outstanding as at 30 June 2006.
QTC estimates its borrowing requirement for the next financial year will be $5,580 million.
This is approximately $450 million more than our actual borrowings of $5,129 million for 2005-06 (originally estimated at $3,485 million), and is primarily due to the Queensland Government’s ongoing commitment to boosting capital investment in the State and funding for the maturity of the September 2007 benchmark bond line ($1,500 million).
The 2006-07 borrowing estimate is expected to be funded as follows:
Funding source
| | | | | | |
| | | EXPECTED RAISINGS
2006-07 |
| | | RANGE
% | | LOW $M | | HIGH
$M |
TERM RAISINGS | | | | | | |
A$ BONDS 2 | | 60 – 70 | | 3,350 | | 3,910 |
MULTICURRENCY LOANS AND MTNS | | 5 - 10 | | 280 | | 560 |
| | | |
COMMERCIAL PAPER RAISINGS | | | | | | |
NOTES, ECP, USCP | | 25 – 30 | | 1,400 | | 1,670 |
2. Includes benchmark A$ domestic and global benchmark bonds, capital indexed bonds and other term issuance.
It is anticipated that approximately 65% of the 2006-07 program ($3,630 million) will be funded principally through the issuance of Australian dollar denominated domestic and global benchmark bonds, with the balance funded through commercial paper and medium term note issuance.
Actual financial market activity and funding requirements may vary depending upon customer requirements and financial market conditions.
22 QUEENSLAND TREASURY CORPORATION
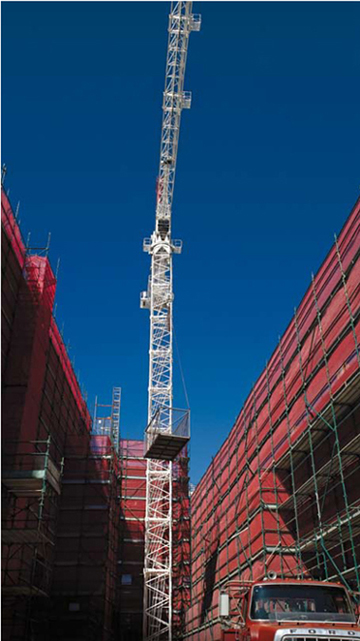
Southbank Institute of Technology:
Long-term contract Management
Building on our experience in managing the State’s long-term cross border leases, QTC is working closely with the Southbank Institute of Technology to establish a management framework for the risks associated with the long-term contract for their major redevelopment project, which is the State’s first public private partnership. The $550 million redevelopment will further enhance Queensland’s reputation as an international leader in technology training.
Photography by Bruce Peebles.
2005 - 2006 ANNUAL REPORT 23
Corporate Report
Our teams work in an integrated and collaborative way to implement the three core processes of the customer loyalty operating model—developing and maintaining relationships, designing and developing customer-specific solutions, and delivering tailored solutions that meet our customers’ needs.
Risk management
QTC manages risks within an enterprise-wide risk management framework. In the year under review, no significant issues or deficiencies were identified through our risk management monitoring and reporting processes. We are currently reviewing our enterprise-wide risk management framework to ensure that it continues to meet the objectives of QTC’s risk management policy.
QTC’s audit and compliance processes ensure our business processes are appropriate, continuously improving, and do not expose us to unnecessary risk. Our compliance program, based on Australian Standard 3806, operationalises compliance as an integrated part of our business, and delegates responsibility for compliance to all employees. In all critical and non-critical audit areas, we rated either highly or acceptably against benchmark rating targets and there were no issues of significant non-compliance within our internal or external audits. In preparation for our new internal auditors, KPMG, we have recently developed a new internal audit plan for the next three years, ensuring audits are aligned to QTC’s significant risks.
The risks associated with the processing and administration of financial markets and customer transactions (loans, investments and leases) were managed prudently throughout the year. Of the 91,931 transactions—8,213 financial markets transactions, 83,244 customer loan and investment transactions and 474 leasing transactions—managed by QTC, only 48 transactions were affected by some form of error on our part, with a dollar cost $47,177, on an annual turnover of $849.4 billion. While we strive to achieve no errors in our work, we believe that this outcome reflects the high quality of the risk management capability, systems and processes of our financial markets, settlement and customer support functions.
Information management
As our strategic approach to managing corporate information has evolved, we have established a governance framework with policies to guide the management of corporate information, and ensure employee, customer and stakeholder access to quality information.
Under the IT Strategic Plan, we are establishing a technology suite that will support our business, with a number of key projects underway, including the creation of a corporate intranet, integration of data and improved reporting capability across systems, and the redevelopment of our customer onlendings and investments management application.
In the past year, we have also upgraded our IT capability to meet strategic business needs, such as the LG Infrastructure Services initiative and the issuance of our first inflation-linked bond. We have also successfully deployed project rooms via QTC’s website to enable employees, customers, and stakeholders to securely access information relating to projects and key initiatives, and established online account statement access for customers.
Human resources
Consistent with broader market trends, we have experienced an increase in employee turnover rates in the past two years, which has led to a healthy introduction of new staff with new ideas, skills and experiences, to supplement QTC’s established base of skills and competencies.
With an enviable mandate and scope of work, and employment terms and conditions that are conservative relative to market practice, we continue to enjoy a strong reputation in the market. Notwithstanding the prevailing tight labour market conditions, we have not encountered significant difficulties in sourcing suitably qualified and experienced candidates.
Secondments and team work
Our corporate commitment to the organisational and individual benefits of secondments has again been demonstrated, with 17 employees working within our stakeholder’s and customers’ businesses, and another nine employees completing LG Infrastructure Services assignments during the year. In addition to meeting customers’ needs, these secondments provided our employees with new challenges and learning opportunities.
Corporately, we have enhanced our ability to adapt to sudden changes in staff availability, and techniques such as cross skilling have become commonplace across our teams.
24 QUEENSLAND TREASURY CORPORATION
This, combined with our strong commitment to learning and development, supports our teams’ abilities to cope with sudden staffing variations.
Teamwork is central to our commitment to meeting our customers’ needs and optimising the intellectual capacity of our organisation. In a year characterised by strong demand for our human resources, our employees have embraced teamwork and collaboration, enhanced the corporate knowledge base and improved our corporate workload management capability.
Learning and development
QTC’s Learning and Development Program was launched during the year, following a comprehensive team-based analysis of teams’ current skills and development needs, as well as those skills required to meet future commitments. Numerous in-house training courses have been run, and many employees have also benefited from industry-based training in a variety of key areas, including risk management techniques and financial product development. We have also experienced a significant amount of on-the-job learning, not only for new starters, but also for teams responding to the broadening scope and increasing amount of customer work.
Our in-house graduate recruitment program was completed, with each of our graduates accepting a permanent position with QTC. We also facilitated work experience for university students who have shown a keen interest in the corporate advisory, financial markets and information technology areas of our business.
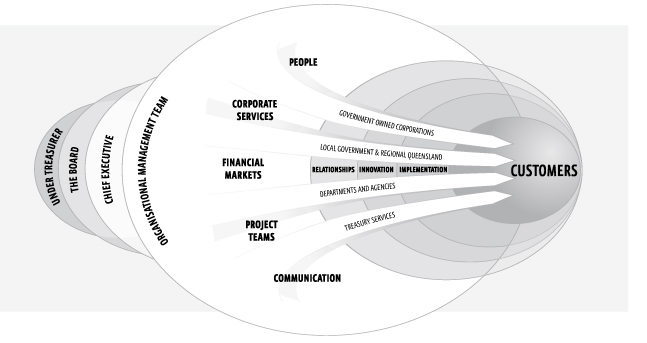
Operational structure
QTC is structured to reflect our overarching value-delivering strategy of customer loyalty, recognising that we achieve our corporate goals through the efforts of our teams. This diagram depicts our organisational structure, showing how all teams work together to deliver value to our customers.
Our teams work in an integrated and collaborative way to implement the three core processes of the customer loyalty operating model—developing and maintaining relationships, designing and developing customer-specific solutions, and delivering tailored solutions that meet our customers’ needs. The diagram demonstrates that, through these processes and supporting teams, our customer-focused teams work directly with customers to assist them to maximise their outcomes and appropriately manage their risks for their organisations and Queensland.
2005 - 2006 ANNUAL REPORT 25
Corporate Report (continued)
Corporate Governance
QTC was established by the Queensland Treasury Corporation Act 1988 (QTC Act), as a Corporation Sole (ie, a corporation that consists solely of a nominated office holder). The Under Treasurer of Queensland is QTC’s nominated office holder. QTC is accountable to the Deputy Premier and Treasurer of Queensland, through the Under Treasurer.
QTC has delegated its powers to the Queensland Treasury Corporation Capital Markets Board (the Board). QTC and the Board have agreed the terms and administrative arrangements that govern the exercise or performance of those powers and the reports by the Board to QTC.
Board composition
The Board comprises seven directors who are appointed by the Governor-in Council, pursuant to section 10(2) of the QTC Act, with consideration given to each person’s qualifications, experience, skills, strategic ability, and commitment to contribute to QTC’s performance and achievement of its corporate objectives.
QTC’s Chairman is a non-executive director and the Board is entirely constituted of non-executive directors.
Board responsibilities
The Board operates in accordance with its charter, which sets out its commitment to various corporate governance principles and standards, the roles and responsibilities of the Board and its members, and the conduct of meetings. Within this scope, the roles and functions of the Board include:
| • | | overseeing QTC’s operations, including its control and accountability systems |
| • | | developing and monitoring QTC’s strategic and corporate plans, operational policy and yearly budget |
| • | | monitoring and measuring financial and operational performance |
| • | | monitoring and measuring organizational and staff performance |
| • | | monitoring key risks and risk management processes, and |
| • | | ensuring that QTC’s compliance is appropriate for an organisation of its type. |
Board Committees
The Board has established three committees, each with its own terms of reference, to assist the Board to oversee and control various QTC activities. The committees and their key responsibilities are:
| • | | Accounts and Audit Committee responsibilities: |
| | - | compliance with laws, regulations and QTC’s own policies and procedures in relation to key financial and operational controls and processes, and |
| • | | Risk Management Committee responsibilities: |
| | - | the adequacy and implementation of QTC’s enterprise-wide risk management policy, framework and plans for the management of QTC’s significant corporate risks |
| | - | QTC’s organisation-wide risk profile and exposure to significant risks, and |
| | - | the adequacy of risk management policies in relation to QTC’s significant risks. |
| • | | Human Resources Committee responsibilities: |
| | - | the appropriateness of any new or amended human resources policy |
| | - | the framework for, and review of, employee remuneration and performance, and |
| | - | employment terms and conditions. |
26 QUEENSLAND TREASURY CORPORATION
Attendance at Board Meetings
The following table details the Board Directors’ attendance at Board and committee meetings:
| | | | | | | | |
| | | BOARD
MEET- INGS | | RISK
MANAG- EMENT
COMMI-
TTEE | | ACC- OUNTS AND AUDIT
COMMI- TTEE | | HUMAN
RESO- URCES
COMMI- TTEE |
MEETINGS HELD | | 11 | | 11 | | 5 | | 4 |
SIR LEO HIELSCHER | | 10 | | 10 | | | | 4 |
GERARD BRADLEY | | 11 | | 11 | | 5 | | 4 |
GILLIAN BROWN | | 11 | | 11 | | | | |
DAVID COE | | 9 | | 9 | | | | |
MARIAN MICALIZZI | | 11 | | 11 | | 5 | | |
BILL SHIELDS | | 11 | | 11 | | 5 | | |
SHAUNA TOMKINS | | 10 | | 10 | | | | 4 |
Commitment to corporate governance
The QTC Board and management team endorse and are committed to achieving high standards of corporate governance, accountability, compliance and ethical behaviour. The Board guides this commitment, which is critical for maintaining QTC’s strong market reputation, as well as the ability to achieve success as Queensland’s corporate treasury services provider.
QTC benchmarks its corporate governance practices, so far as they are relevant and appropriate to QTC, against the Australian Stock Exchange (ASX) Corporate Governance Council Principles of Good Corporate Governance and Best Practice Recommendations, and the Australian Standard 8000/2003–Good Governance Principles. While the ASX governance principles are not mandatory for QTC, our corporate governance practices are continually reviewed and updated, as part of a rolling system of appraisal, to reflect industry guidelines and standards.
QTC also maintains a commitment to a continuous disclosure regime with our key stakeholders, a code of conduct that applies to all staff and includes procedures about disclosing conflicts of interest and a compliance program that drives a compliance culture consistent with QTC’s approved mandate, legal and ethical obligations.
Auditors
In accordance with the provisions of the Financial Administration and Audit Act 1977, the Queensland Audit Office is the external auditor for QTC. The Queensland Audit Office has the responsibility for providing Queensland’s Parliament with assurances as to the adequacy of QTC’s discharge of its financial and administrative obligations.
PricewaterhouseCoopers was QTC’s internal auditor from 1 July 2002 to 30 June 2006. KPMG have been appointed QTC’s internal auditor for the three years beginning 1 July 2006.
Ethical standards
QTC’s corporate governance policies and practices ensure that QTC acts ethically, within appropriate law, policy and convention, and addresses the systems and processes necessary for the proper direction and the management of QTC’s business and affairs.
We are committed to observing high standards of integrity and fair dealing in the conduct of our business and to acting with due care, diligence and skill. QTC’s compliance policy requires that QTC and all employees comply with the letter and the spirit of all relevant laws and regulations, industry standards, relevant government policies, and QTC’s own policies and procedures.
Further information
The information in this Annual Report is intended to be only a summary of QTC’s corporate governance practices. More detailed compliance disclosures are contained in Appendix C and more comprehensive information is available on QTC’s website at www.qtc.qld.gov.au.
The QTC Board and management team endorse and are committed to achieving high standards of corporate governance, accountability, compliance and ethical behaviour.
2005 - 2006 ANNUAL REPORT 27
Queensland Treasury Corporation’s Board

SIR LEO HIELSCHER AC
BComm, D Univ Griffith (Hon), AAUQ, AASA, FAIM, FCPA, FFTP (Hon)
CHAIRMAN
CHAIRMAN, RISK MANAGEMENT COMMITTEE
CHAIRMAN, HUMAN RESOURCES COMMITTEE
APPOINTED 1991. TENURE 30 JUNE 2007.
Sir Leo Hielscher has more than fifty years’ experience in the areas of Government, the banking and finance industry, domestic and global financial markets, superannuation industry and as an independent company director. He was the Under Treasurer of Queensland for 14 years (1974 to 1988) before his appointment as Chairman of the Queensland Treasury Corporation Advisory Board in 1988. In 1991, the Advisory Board became the Queensland Treasury Corporation Board and Sir Leo was appointed as its inaugural Chairman. Sir Leo is also Chairman of Austsafe Ltd, Independent Superannuation Preservation Fund and the Queensland Health Reform Advisory Panel. As a company director, Sir Leo has considerable experience at board level and has been associated with a number of public and private sector boards. Sir Leo was awarded an Eisenhower Fellowship in 1973, a Knight Bachelor in 1987, an Honorary Doctorate of Griffith University in 1993, and a Companion of the Order of Australia (AC) in the General Division in 2004.

GERARD BRADLEY
BComm, Dip Adv Acc, CPA, FAICD, FAIM
DEPUTY CHAIRMAN
MEMBER, ACCOUNTS AND AUDIT COMMITTEE
MEMBER, RISK MANAGEMENT COMMITTEE
MEMBER, HUMAN RESOURCES COMMITTEE
APPOINTED JULY 2000. TENURE 30 JUNE 2007.
Gerard Bradley is the Under Treasurer and Under Secretary of Queensland Treasury Department, a position he has held since 1998, and has extensive experience in public sector finance gained in both the Queensland and South Australian treasury departments. He was Under Treasurer for the South Australian Department of Treasury and Finance from 1996 to 1998, and of Queensland Treasury from 1995 to 1996. Mr Bradley held various positions in Queensland Treasury from 1976 to 1995, with responsibility for the preparation and management of the State Budget and the fiscal and economic development of Queensland. He holds directorships with Queensland Treasury Holdings Pty Ltd and related companies, and is the Chair of the QSuper Board of Trustees.

GILLIAN BROWN
LLB (Hons), Grad Dip Applied Finance and Investment, SIA
MEMBER, RISK MANAGEMENT COMMITTEE
APPOINTED JULY 2004. TENURE 30 JUNE 2007.
Gillian Brown has more than 17 years’ experience as a specialist finance lawyer and has gained extensive corporate, financing and major project experience. She is a Partner of Minter Ellison Lawyers (admitted as Partner 1994) and heads the Finance practice in Queensland.Ms Brown’s principal areas of practice include corporate finance, investment and financial services, financial markets, project/infrastructure finance, and property finance. Ms Brown has advised government bodies on a number of project and transactional arrangements and has a working knowledge of the mechanics of government and its objectives. Ms Brown is also a Director of DBCT (Dalrymple Bay Coal Terminal) Holdings Pty Ltd, and a Committee member of the Law Council of Australia.
28 QUEENSLAND TREASURY CORPORATION

DAVID COE
BA (Hons), LLB
MEMBER, RISK MANAGEMENT COMMITTEE APPOINTED JULY 2004. TENURE 30 JUNE 2007.
David Coe is Chairman and Managing Director of Allco Finance Group Limited, an Australian company which provides sophisticated financing services in both the domestic and international markets. Mr Coe is a former partner of law firm Mallesons Stephen Jacques and specialised in international financing and leasing, before leaving the law to pursue commercial business interests. He has a diverse blend of specialist legal, corporate and financing knowledge, and extensive experience as a company director of a number of public and private companies. Mr Coe is Chairman (and cofounder) of Sports and Entertainment Ltd, and Sydney’s Museum of Contemporary Art; a Director of Rubicon Holdings (Aust) Pty Limited; and, a Board Member of the National Gallery of Australia Foundation and the Sydney Children’s Hospital Foundation.

MARIAN MICALIZZI
BBus, FCA, SIA (Associate)
CHAIRMAN, ACCOUNTS AND AUDIT COMMITTEE MEMBER, RISK MANAGEMENT COMMITTEE APPOINTED JULY 2000. TENURE 30 JUNE 2007.
Marian Micalizzi is a chartered accountant with more than 20 years’ experience, a company director and a consultant in both the public and private sector. Ms Micalizzi is a former partner of PricewaterhouseCoopers (until 2000), having been admitted as a partner of the predecessor firm in 1986. Ms Micalizzi brings considerable expertise and knowledge of specialist corporate financial and advisory services, financial institutions’ regulation and prudential supervision, and valuation related assessments. She is a also a Director of Queensland Investment Corporation, Mincom Limited, Opera Queensland, Australian Reinsurance Pool Corporation; a Member of the Corporations and Markets Advisory Committee, the Takeovers Panel, Independent Investment Committee of Queensland Development Fund, the Queensland Government’s Service Delivery and Performance Commission, and the SunSuper Audit Committee; and a Councillor of the Australian Institute of Company Directors (Qld Div.).

BILL SHIELDS
B Econ (Hons), MEc
MEMBER, ACCOUNTS AND AUDIT COMMITTEE MEMBER, RISK MANAGEMENT COMMITTEE APPOINTED JULY 2004. TENURE 30 JUNE 2007.
Mr Shields has considerable experience in the banking and finance industry as well as government policy advice, specialising in economics. His career responsibilities included economic and financial market research in Australia and overseas, and providing analytical and strategic advice on the Australian financial system and monetary policy, Australia’s exchange rate arrangements and international financial developments. Mr Shields was previously Chief Economist and Executive Director, Macquarie Bank Limited (1987-2001). In addition to Macquarie Bank, he has held positions with the Reserve Bank of Australia (1983-1985), the International Monetary Fund (1973-75 and 1977-83) and the Commonwealth Treasury. Mr Shields is a Visiting Professor of Macquarie Graduate School of Management, Macquarie University; a Director of (and Chair, Audit and Compliance Committee)M-co International Limited and the Energy Market Company PTE Ltd; and, Chairman of the Australia Korea Business Council, and the Australian Pacific Economic Cooperation Committee.

SHAUNA TOMKINS
BSc, MBA
MEMBER, RISK MANAGEMENT COMMITTEE MEMBER, HUMAN RESOURCES COMMITTEE APPOINTED JULY 2000. TENURE 30 JUNE 2007.
Shauna Tomkins is a principal of the Promontory Financial Group Australasia who works internationally in the development and implementation of regulatory frameworks for prudential supervision and corporate regulation of deposit taking, funds management, insurance and lending institutions. Ms Tomkins has a thorough understanding of Australia’s financial system, risk management analysis, prudential supervision and corporate and structured finance. She also has a strong background in long-term policy and strategic management and planning and has a working familiarity with Government objectives and processes. Ms Tomkins is a Member of the Advisory Committee to Queensland’s Motor Accident Insurance Commission.
2005 - 2006 ANNUAL REPORT 29
SunWater: Burdekin to Moranbah pipeline
QTC provided SunWater with debt structuring advice and has undertaken financial model reviews, including the pricing model for the Burdekin to Moranbah pipeline project. SunWater has commenced construction of its 220km pipeline from the Burdekin Falls Dam, in the water-rich Burdekin Basin. This pipeline will provide the significant water inflows essential for the coal mine developments in the northern Bowen Basin.
Image of Burdekin Falls Dam supplied by SunWater.
30 QUEENSLAND TREASURY CORPORATION
Economic and Fiscal Report
Queensland’s economic outlook
Economic growth
| • | | State economic growth is forecast to strengthen to 4 1/4% in 2006-07, above the national forecast of 3 1/4%. Queensland’s rebalancing in growth is expected to continue, with growth in the domestic sector easing and net exports improving. Growth in consumer spending is anticipated to remain at its long-term average rate of 4 1/2%, while dwelling investment is forecast to remain largely unchanged at an historically high level. Business investment is predicted to increase by 8% to surpass $25 billion in the next financial year, while public final demand is anticipated to grow 7 1/2%, reflecting the government’s significant capital infrastructure program. |
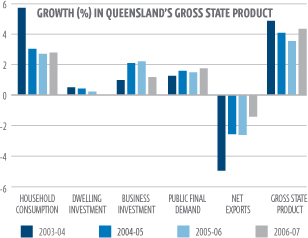
Notes: Contributions for 2005-06 represent estimated
actuals while contributions for 2006-07 represent forecasts.
Source: Queensland Treasury
Trade sector
| • | | The performance of the trade sector is forecast to improve in 2006-07, with net exports anticipated to detract only 1 1/2% from growth. Export growth is forecast to strengthen to a six-year high of 4 3/4%, driven by strong growth in resource exports and a rebound in interstate tourism exports. |
| • | | Imports growth is expected to moderate only slightly to 6 3/4% in 2006-07, reflecting ongoing solid rates of growth in consumer and business spending. |
Inflation
| • | | Inflation is forecast to ease slightly to 2 3/4% in 2006-07. Slightly higher interest rates should place downward pressure on consumer price inflation in 2006-07, while ongoing global competition should maintain stable prices on many imported retail and consumer items next year. |
Employment
| • | | The State’s employment growth is forecast to moderate to 2 1/2% in 2006-07, with growth in economic activity shifting further toward the more capital-intensive trade sector. |
2005-06 economic highlights
| • | | The Queensland economy is estimated to grow by 3 1/2% in 2005-06, well above the national growth of 2 1/2% and representing the tenth consecutive year that the State has outperformed economic growth in the rest of Australia. |
| • | | Total employment growth in Queensland is estimated to ease to 3% in 2005-06, slightly above the average rate of growth over the past ten years. |
| • | | This represents an employment increase of around 55,000 people during the year, with the number of people employed in Queensland estimated to have surpassed two million in 2005-06. |
| • | | The year-average State unemployment rate is estimated to remain around a 30-year low of 5%, slightly below the national estimate of 5 1/4%. |
2005 - 2006 ANNUAL REPORT 31
Economic and Fiscal Report (continued)
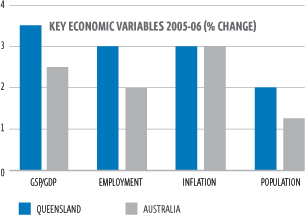
Notes: All figures represent estimated actuals.
Source: Queensland Treasury and Commonwealth Treasury
Queensland’s fiscal environment
2006-07 budgeted result
| • | | On an accrual basis, the Queensland State Budget provided for a General Government net operating surplus of $245 million in 2006-07. The General Government forward estimates project continuing surpluses over the State Budget forecast horizon, consistent with the fiscal principles outlined in the Charter of Social and Fiscal Responsibility. |
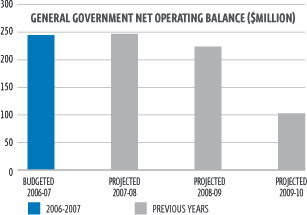
Source: 2006-07 Queensland Government Budget Papers
| • | | The 2006-07 Budget also provided for a cash deficit of $796 million in the General Government sector on a GFS (Government Financial Statistics) basis. |
2005-06 estimated actual result
| • | | The estimated actual General Government net operating result, on a GFS basis for 2005-06, is a $2.853 billion surplus. |
| • | | The estimated 2005-06 surplus reflects the continuing strength of the economy flowing through to taxation and related revenues and investment returns above the long-term assumed rate of return. |
Key financial aggregates (GFS basis)
| | | | | | | | | | |
| | | 2005-06
EST. ACTUAL
$ MILLION | | 2006-07
BUDGET
$ MILLION | | 2007-08
PROJECTED
$ MILLION | | 2008-09
PROJECTED
$ MILLION | | 2009-10
PROJECTED
$ MILLION |
GENERAL GOVERNMENT SECTOR: | | | | | | | | | | |
REVENUE | | 29,586 | | 29,070 | | 30,271 | | 31,242 | | 32,456 |
EXPENSES | | 26,733 | | 28,825 | | 30,024 | | 31,019 | | 32,354 |
NET OPERATING BALANCE | | 2,853 | | 245 | | 247 | | 224 | | 102 |
CASH SURPLUS/(DEFICIT) | | 3,381 | | (796) | | (786) | | (809) | | (1,169) |
CAPITAL PURCHASES | | 2,914 | | 3,958 | | 4,016 | | 3,961 | | 4,152 |
NET WORTH | | 96,388 | | 99,032 | | 101,720 | | 104,516 | | 107,361 |
Source: 2006-07 Queensland Government Budget Papers
32 QUEENSLAND TREASURY CORPORATION
| • | | Investment market volatility impacts more on the Queensland Budget than it does for other states. This is, in part, due to differences in the way Queensland’s public sector superannuation arrangements are structured—Queensland is the only Australian government to fully fund its superannuation obligations—with investment returns impacting directly on the operating result as an increase or decrease in revenue associated with the investment of financial assets held to meet future liabilities. If Queensland’s superannuation arrangements were structured on the same basis as that which generally applies in other states, the General Government sector underlying operating result for 2005 06 would be a surplus of $1.721 billion. |
Balance sheet
| • | | Queensland continues to maintain a strong balance sheet compared with the other states. At 30 June 2007, Queensland’s estimated net debt in the General Government sector is negative, implying a strong net asset position. Queensland’s negative net debt of $5,155 per capita compares to the average net debt of $111 per capita in the other states. |
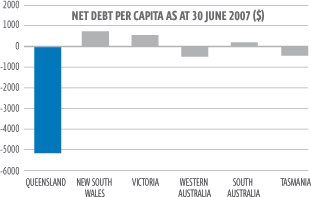
Source: 2006-07 Queensland Government Budget Papers
| • | | The State’s net financial asset position remains extremely sound. Based on current projections, the General Government sector will continue to meet the commitment in the Government’s Charter to ensure that financial assets cover all accruing and expected future liabilities in all years through to 30 June 2010. |
| • | | Queensland has consistently pursued sound long-term fiscal policies such as the full funding of employee superannuation entitlements. The strong balance sheet and high levels of liquidity in the General Government sector clearly demonstrate the success of these policies. |
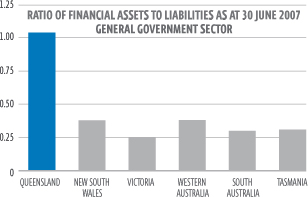
Source: 2006-07 Queensland Government Budget Papers
Competitive tax environment
| • | | One of the Queensland Government’s key fiscal objectives is to maintain a competitive tax environment while raising sufficient revenue to meet the infrastructure and government service delivery needs of the people of Queensland. |
| • | | In 2006-07, state tax collections per capita in Queensland are expected to be $1,927, which compares to an estimated average state tax collection of $2,272 for the other states and territories. Queensland’s per capita taxation for 2006-07 is 15% lower than the average tax per capita of the other states. |
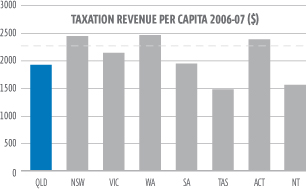
Source: 2006-07 Queensland Government Budget Papers
2005 - 2006 ANNUAL REPORT 33
Emerald Shire Council: Financial Sustainability Reviews
QTC is working closely with Emerald Shire Council to complete their Financial Sustainability Review as part of the Local Government Association of Queensland’s Size, Shape and Sustainability initiative. Emerald Shire Council is one of the first of more than 100 Queensland local governments that will be reviewed by QTC in the next 12 months.
Image of Emerald’s railway station, which is classified by the National Trust, supplied by Emerald City Council.
34 QUEENSLAND TREASURY CORPORATION
Financial Statements
for the year ended 30 June 2006
| | |
CONTENTS | | PAGE |
Income Statement | | 36 |
Balance Sheet | | 37 |
Statement of Changes in Equity | | 38 |
Statement of Cash Flows | | 39 |
Certificate of the Queensland Treasury Corporation | | 71 |
Independent Audit Report | | 72 |
2005 - 2006 ANNUAL REPORT 35
Income Statement
for the year ended 30 June 2006
| | | | | | | |
| | | NOTE | | 30 JUNE 2006 $000 | | | 30 JUNE 2005 $000 |
INCOME | | | | | | | |
REVENUE | | | | | | | |
Interest income | | 3 | | 1 220 884 | | | 2 162 680 |
Fees - management | | 4 | | 22 698 | | | 22 993 |
- professional | | | | 217 | | | 192 |
- other | | | | 231 | | | 381 |
Amortisation of cross border lease deferred income | | | | 8 763 | | | 8 763 |
Bad debts recovered – co-operative housing societies | | | | - | | | 2 059 |
Other revenue | | | | 1 | | | 77 |
| | | |
GAINS | | | | | | | |
Gain on sale of property, plant and equipment | | | | - | | | 2 702 |
| | | | | | | |
TOTAL INCOME | | | | 1 252 794 | | | 2 199 847 |
| | | | | | | |
| | | |
EXPENSES | | | | | | | |
Interest expense | | 3 | | 1 160 268 | | | 2 111 319 |
Administration expenses | | 5 | | 30 249 | | | 30 021 |
Provisions – co-operative housing societies | | 11 | | (6 | ) | | 51 |
Realised loan losses – co-operative housing societies | | | | - | | | 721 |
Loss on sale of property, plant and equipment | | | | 58 | | | - |
| | | | | | | |
| | | |
TOTAL EXPENSES | | | | 1 190 569 | | | 2 142 112 |
Share of profits of investments accounted for using the equity method | | 29 | | 85 | | | - |
| | | | | | | |
Operating surplus before payment in lieu of income tax | | | | 62 310 | | | 57 735 |
Payment in lieu of income tax | | 7 | | 12 741 | | | 11 647 |
| | | | | | | |
Operating surplus after payment in lieu of income tax | | | | 49 569 | | | 46 088 |
| | | | | | | |
The accompanying notes form part of these financial statements.
36 QUEENSLAND TREASURY CORPORATION
Balance Sheet
as at 30 June 2006
| | | | | | |
| | | NOTE | | 30 JUNE 2006
$000 | | 30 JUNE 2005 $000 |
ASSETS | | | | | | |
Cash assets | | 8 | | 124 | | 56 |
Receivables | | 9 | | 2 278 | | 2 234 |
Prepayments | | | | 283 | | 271 |
Onlendings | | 10 | | 19 831 582 | | 18 905 621 |
Derivative financial assets | | 13 | | 66 747 | | 117 899 |
Financial assets at fair value through profit or loss | | 14 | | 13 557 724 | | 11 278 643 |
Property, plant and equipment | | 15 | | 31 259 | | 39 155 |
Investments accounted for using the equity method | | 29 | | 185 | | - |
Intangible assets | | 16 | | 310 | | 111 |
Deferred income tax asset | | 7 | | 1 686 | | 1 238 |
| | | | | | |
TOTAL ASSETS | | | | 33 492 178 | | 30 345 228 |
| | | | | | |
| | | |
LIABILITIES | | | | | | |
Payables | | 17 | | 198 105 | | 201 497 |
Tax liabilities | | 7 | | 13 509 | | 11 897 |
Derivative financial liabilities | | 18 | | 104 158 | | 51 207 |
Financial liabilities at fair value through profit or loss | | 19 | | 32 848 906 | | 29 802 696 |
| | | | | | |
TOTAL LIABILITIES | | | | 33 164 678 | | 30 067 297 |
| | | | | | |
NET ASSETS | | | | 327 500 | | 277 931 |
| | | | | | |
EQUITY | | | | | | |
Reserves | | 20 | | 74 403 | | 68 906 |
Retained surplus | | | | 253 097 | | 209 025 |
| | | | | | |
TOTAL EQUITY | | | | 327 500 | | 277 931 |
| | | | | | |
The accompanying notes form part of these financial statements.
2005 - 2006 ANNUAL REPORT 37
Statement of Changes in Equity
for the year ended 30 June 2006
| | | | | | | | | | | | | | |
| | | NOTE | | GENERAL
RESERVE
$000 | | CREDIT
RISK
RESERVE
$000 | | BASIS
RISK
RESERVE
$000 | | | RETAINED
SURPLUS
$000 | | | TOTAL
EQUITY
$000 |
Balance at 1 July 2004 | | | | 39 082 | | 8 857 | | 15 000 | | | 168 904 | | | 231 843 |
Operating surplus from continuing operations | | | | - | | - | | - | | | 46 088 | | | 46 088 |
Transfer from/(to) retained surplus | | 20 | | - | | 7 967 | | (2 000 | ) | | (5 967 | ) | | - |
| | | | | | | | | | | | | | |
BALANCE AT 30 JUNE 2005 | | | | 39 082 | | 16 824 | | 13 000 | | | 209 025 | | | 277 931 |
| | | | | | | | | | | | | | |
Balance at 1 July 2005 | | | | 39 082 | | 16 824 | | 13 000 | | | 209 025 | | | 277 931 |
Operating surplus from continuing operations | | | | - | | - | | - | | | 49 569 | | | 49 569 |
Transfer from/(to) retained surplus | | 20 | | - | | 4 497 | | 1 000 | | | (5 497 | ) | | - |
| | | | | | | | | | | | | | |
BALANCE AT 30 JUNE 2006 | | | | 39 082 | | 21 321 | | 14 000 | | | 253 097 | | | 327 500 |
| | | | | | | | | | | | | | |
The accompanying notes form part of these financial statements.
38 QUEENSLAND TREASURY CORPORATION
Statement of Cash Flows
for the year ended 30 June 2006
| | | | | | | | |
| | | NOTE | | 30 JUNE 2006
$000 | | | 30 JUNE 2005 $000 | |
CASH FLOWS FROM OPERATING ACTIVITIES | | | | | | | | |
Interest income - onlendings | | | | 702 773 | | | 1 387 276 | |
Investment income - financial assets | | | | 689 842 | | | 773 333 | |
- other | | | | 7 882 | | | 9 503 | |
Fees - management | | | | 22 745 | | | 22 816 | |
- professional | | | | 330 | | | 447 | |
- arrangement | | | | 2 | | | 30 617 | |
- other | | | | 232 | | | 402 | |
GST paid to suppliers | | | | (591 | ) | | (1 270 | ) |
GST refunds from ATO | | | | 520 | | | 1 689 | |
GST paid to ATO | | | | (2 101 | ) | | (2 425 | ) |
GST received from customers | | | | 1 937 | | | 11 513 | |
Interest on interest-bearing liabilities | | | | (1 483 226 | ) | | (1 320 568 | ) |
Income distribution to depositors | | | | (301 747 | ) | | (262 372 | ) |
Administration expenses | | | | (22 619 | ) | | (19 279 | ) |
Payment in lieu of income tax | | | | (11 577 | ) | | (10 927 | ) |
| | | | | | | | |
NET CASH PROVIDED BY (USED IN) OPERATING ACTIVITIES | | 21 | | (395 598 | ) | | 620 755 | |
| | | | | | | | |
CASH FLOWS FROM INVESTING ACTIVITIES | | | | | | | | |
Proceeds from sale of other financial assets | | | | 66 103 745 | | | 56 101 765 | |
Payments for other financial assets | | | | (68 402 894 | ) | | (58 435 786 | ) |
Net onlendings | | | | (1 056 423 | ) | | (1 135 506 | ) |
Payments for property, plant and equipment | | | | (247 | ) | | (87 885 | ) |
Payments for intangibles | | | | (351 | ) | | (83 | ) |
Investment in Local Government Infrastructure Services Pty Ltd | | | | (100 | ) | | - | |
Proceeds from sale of property, plant and equipment | | | | 1 027 | | | 91 545 | |
| | | | | | | | |
NET CASH PROVIDED BY (USED IN) INVESTING ACTIVITIES | | | | (3 355 243 | ) | | (3 465 950 | ) |
| | | |
CASH FLOWS FROM FINANCING ACTIVITIES | | | | | | | | |
Net proceeds from interest bearing liabilities | | | | 10 748 626 | | | 15 059 312 | |
Repayment of interest bearing liabilities | | | | (7 091 711 | ) | | (12 742 523 | ) |
Net deposits | | | | 94 010 | | | 528 268 | |
Fees collected on behalf of the Consolidated Fund | | | | (16 | ) | | 26 | |
| | | | | | | | |
NET CASH PROVIDED BY (USED IN) FINANCING ACTIVITIES | | | | 3 750 909 | | | 2 845 083 | |
| | | | | | | | |
NET INCREASE (DECREASE) IN CASH HELD | | | | 68 | | | (112 | ) |
Cash at 1 July | | | | 56 | | | 168 | |
| | | | | | | | |
Cash at 30 June | | 8 | | 124 | | | 56 | |
| | | | | | | | |
The accompanying notes form part of these financial statements.
2005 - 2006 ANNUAL REPORT 39
Notes to and forming part of the Financial Statements
for the year ended 30 June 2006
CONTENTS
| | | | |
NOTE | | | | PAGE |
1. | | General Information | | 41 |
| | |
2. | | Summary of Significant Accounting Policies | | 41 |
| | |
3. | | Interest Income and Interest Expense | | 45 |
| | |
4. | | Management Fees | | 47 |
| | |
5. | | Administration Expenses | | 47 |
| | |
6. | | Average Financial Assets’ and Liabilities’ Balance and Related Interest | | 48 |
| | |
7. | | Payment in Lieu of Income Tax | | 50 |
| | |
8. | | Cash Assets | | 50 |
| | |
9. | | Receivables | | 51 |
| | |
10. | | Onlendings | | 51 |
| | |
11. | | Provisions for Impaired Loans | | 51 |
| | |
12. | | Asset Quality | | 51 |
| | |
13. | | Derivative Financial Assets | | 52 |
| | |
14. | | Financial Assets at Fair Value through Profit or Loss | | 52 |
| | |
15. | | Property, Plant and Equipment | | 53 |
| | |
16. | | Intangibles | | 54 |
| | |
17. | | Payables | | 54 |
| | |
18. | | Derivative Financial Liabilities | | 54 |
| | |
19. | | Financial Liabilities at Fair Value through Profit or Loss | | 55 |
| | |
20. | | Reserves | | 57 |
| | |
21. | | Notes to the Statement of Cash Flows | | 58 |
| | |
22. | | Maturity Analysis of Monetary Assets and Liabilities | | 59 |
| | |
23. | | Financial Risk Management | | 60 |
| | |
24. | | Concentrations of Borrowings and Deposits | | 65 |
| | |
25. | | Contingent Liabilities | | 65 |
| | |
26. | | Commitments | | 66 |
| | |
27. | | Stock Lending | | 66 |
| | |
28. | | Related Party Transactions | | 67 |
| | |
29. | | Investments accounted for using the equity method | | 67 |
| | |
30. | | Investments in Companies | | 68 |
| | |
31. | | Segment Information | | 68 |
| | |
32. | | Funding Facilities | | 68 |
| | |
33. | | Remuneration of Officers | | 69 |
| | |
34. | | Other Director and Executive Disclosures | | 70 |
40 QUEENSLAND TREASURY CORPORATION
1. GENERAL INFORMATION
Queensland Treasury Corporation is constituted under the Queensland Treasury Corporation Act 1988 (the “Act”), with the Under Treasurer designated as the corporation sole under section 5 (2) of the Act.
QTC is the State’s central financing authority and corporate treasury services provider, with responsibility for providing debt funding, liability management, cash management and financial risk management advice to public sector customers. These services are undertaken on a cost recovery basis with QTC lending at an interest rate based on its cost of funds and with the benefits/costs of liability and asset management being passed on to its customers being Queensland public sector entities.
The majority of QTC’s profits are generated as a result of interest earned from the investment of QTC’s equity.
QTC ensures that in undertaking its activities it has adequate capital to manage its risks.
2. SUMMARY OF SIGNIFICANT ACCOUNTING POLICIES
(a) BASIS OF PREPARATION
These general purpose financial statements for the year ended 30 June 2006 have been prepared in accordance with the requirements of the Financial Management Standard 1997 issued pursuant to the Financial Administration and Audit Act 1977, and other mandatory professional reporting requirements. They comply with Australian Accounting Standards, which include Australian equivalents to International Financial Reporting Standards (AeIFRS) and have been prepared in accordance with those International Financial Reporting Standards (IFRS) issued and effective as at the time of preparing these statements. Compliance with AeIFRS ensures that the financial report, comprising the financial statements and notes thereto, complies with International Financial Reporting Standards (IFRS).
The adoption of AeIFRS did not require any changes to accounting policies or result in any material adjustments to the Income Statement, Balance Sheet or Statement of Cash Flows. However, financial instruments have been reclassified in the financial statements into the following categories (refer note 2 (E)).
| | |
PREVIOUS CLASSIFICATION | | CLASSIFICATION OF FINANCIAL
INSTRUMENTS UNDER AeIFRS |
| Other financial assets | | Financial assets at fair value through profit or loss Derivative financial assets |
| |
| Deposits | | Financial liabilities at fair value through profit or loss |
| |
| Interest bearing liabilities | | Financial liabilities at fair value through profit or loss Derivative financial liabilities |
Where necessary, comparative figures have been adjusted to conform with changes in presentation in the current period.
The financial statements have been prepared under the historical cost convention, as modified by the revaluation of financial assets and financial liabilities held at fair value through profit or loss and all derivative contracts.
(B) INVESTMENT IN JOINT VENTURE ENTITY
QTC’s investment in Local Government Infrastructure Services Pty Ltd is accounted for using the equity method in the financial statements. Under the equity method, the share of the profits or losses of the joint venture is recognised in the Income Statement, and the share of movements in reserves is recognised in reserves in the Balance Sheet. Investments in joint venture entities are carried at the lower of the equity accounted amount and recoverable amount.
(C) INVESTMENTS IN OTHER COMPANIES
Investments in other companies are accounted for at cost (refer note 30). The principal activity of Queensland Treasury Holdings Pty Ltd (QTH) is to act as a corporate vehicle through which the Queensland Government invests in assets of strategic importance to the State.
Queensland Treasury holds a 60% beneficial interest in QTH. The remaining 40% is held by QTC for and on behalf of the Under Treasurer as Corporation Sole of QTC.
QTC does not have significant influence over the financial and operating policies of QTH and therefore does not apply the equity method of accounting to the investment.
(D) FOREIGN CURRENCY
Foreign currency transactions are initially translated into Australian dollars at the rate of exchange applying at the date of the transaction. At balance date, amounts payable to and by QTC in foreign currencies have been valued using current exchange rates after taking into account interest rates and accrued interest.
Exchange gains/losses are brought to account in the Income Statement.
(E) FINANCIAL ASSETS AND FINANCIAL LIABILITIES
RECOGNITION AND DERECOGNITION
Financial assets and financial liabilities are recognised on the Balance Sheet when QTC becomes party to the contractual provisions of the financial instrument.
A financial asset is derecognised when the contractual rights to the cash flows from the financial assets expire or are transferred and no longer controlled by QTC.
A financial liability is removed from the Balance Sheet when the obligation specified in the contract is discharged, cancelled or expires.
2005 - 2006 ANNUAL REPORT 41
Notes to and forming part of the Financial Statements
for the year ended 30 June 2006 (Continued)
2. SUMMARY OF SIGNIFICANT ACCOUNTING POLICIES (Continued)
(E) FINANCIAL ASSETS AND FINANCIAL LIABILITIES (CONTINUED)
MEASUREMENT
Financial assets and liabilities at fair value through profit or loss are measured at fair value by reference to quoted market prices when available. If quoted market prices are not available, then fair values are estimated on the basis of pricing models, or other recognised valuation techniques.
Fair value is the amount for which an asset could be exchanged, or liability settled between knowledgeable, willing parties in an arm’s length transaction.
QTC uses mid market rates as a basis for establishing fair values of quoted financial instruments with offsetting risk positions. In general, the risk characteristics of funds borrowed together with the financial derivatives used to manage interest rate and foreign currency risks closely match those of funds on lent. In all other cases, the bid-offer spread is applied where material.
CLASSIFICATION
Management classifies its financial instruments on initial recognition
into the following categories:
| • | | Derivative financial instruments; |
| • | | Financial assets at fair value through profit or loss; and |
| • | | Financial liabilities at fair value through profit or loss. |
QTC’s accounting policies for significant financial assets and financial liabilities are listed below.
ONLENDINGS
Onlendings, with the exception of loans to cooperative housing societies, are included in the Balance Sheet at their redemption value which is representative of market value. Loans to cooperative housing societies are based on the balance of each housing society’s loans to its members adjusted where necessary for a specific provision for impairment (refer note 2 (Q)).
DERIVATIVE FINANCIAL INSTRUMENTS
QTC uses derivative financial instruments to hedge its exposure to interest rate, foreign currency and credit risks as part of asset and liability management activities. In addition they may be used, to deliver long term floating rate or long term fixed rate exposure. In accordance with its treasury policy, QTC does not hold or issue derivative financial instruments for trading purposes.
All derivatives are carried as assets when fair value is positive and as liabilities when fair value is negative.
FINANCIAL ASSETS AT FAIR VALUE THROUGH PROFIT OR LOSS
Financial assets consist of all other investments including money market deposits, discount securities, semi-government bonds and floating rate notes. Unrealised gains and losses are brought to account in the Income Statement.
FINANCIAL LIABILITIES AT FAIR VALUE THROUGH PROFIT OR LOSS
Financial liabilities at fair value through profit or loss include interest bearing liabilities and deposits. Unrealised gains and losses are brought to account in the Income Statement.
INTEREST-BEARING LIABILITIES AT FAIR VALUE THROUGH PROFIT OR LOSS
Interest-bearing liabilities mainly consist of Australian and overseas bonds. Australian bonds include QTC’s domestic, capital indexed and public bonds. Overseas bonds include global bonds and Eurobonds. Global bonds are Australian dollar denominated bonds issued overseas.
DEPOSITS AT FAIR VALUE THROUGH PROFIT OR LOSS
Deposits are accepted to either the Working Capital Facility (11AM Fund) or the Cash Fund for portfolio management. Income derived from the investment of these deposits accrues to depositors daily. The amount shown in the Balance Sheet represents the market value of deposits held at balance date.
Securities which are sold under agreements to repurchase at an agreed price remain as an investment whilst the obligation to repurchase is disclosed as a deposit.
(F) SETTLEMENT DATE ACCOUNTING
Purchases and sales of financial assets and liabilities at fair value through profit or loss are recognised on settlement date. QTC accounts for any change in the fair value of the asset to be received during the period between the trade date and settlement date in the same way as it accounts for the acquired asset.
(G) LEASE ARRANGEMENTS
Leases in which a significant portion of the risks and rewards of ownership are retained by the lessor are classified as operating leases (note 26). Operating leases, in which QTC is the lessee, are expensed on a straight line basis over the term of the lease.
(H) INTEREST INCOME AND INTEREST EXPENSE
The recognition of investment income and borrowing costs includes net realised gains/losses from the sale of investments (interest income) and the preredemption of borrowings (interest expense) together with the net unrealised gains/losses arising from holding investments and certain onlendings (interest income) and net unrealised gains/losses from borrowings (interest expense). These unrealised gains/losses are a result of revaluing to market daily.
The majority of onlendings are provided to customers on a pooled basis. Interest costs are allocated to customers based on the daily movement in the market value of the pool.
42 QUEENSLAND TREASURY CORPORATION
2. SUMMARY OF SIGNIFICANT ACCOUNTING
POLICIES (Continued)
(I) FEE INCOME
Management and professional fee income represents income earned from the management of QTC’s onlendings and deposits and is recognised on an accrual basis when the service has been provided. Asset and liability management fee income integral to the yield of an originated financial instrument are recognised proportionately over the period the product is provided.
(J) PROFITS/LOSSES
Unless otherwise determined by the Governor in Council, the Queensland Treasury Corporation Act 1988 requires that all profits shall accrue to the benefit of Consolidated Fund and all losses shall be the responsibility of Consolidated Fund.
(K) INCOME RECOGNITION – CROSS BORDER LEASES
The portion of the cross border lease income received which is regarded as an advisory fee for the transaction is recognised on receipt. The balance of income received is deferred and amortised over the term of each lease.
(L) LEASE INCOME
Lease income from operating leases is recognised as income on a straight line basis over the lease term.
(M) PROPERTY, PLANT AND EQUIPMENT
Property, plant and equipment are included at cost from the date of acquisition. Items of property, plant and equipment with a cost or other value equal to or in excess of the following thresholds are recognised for financial reporting purposes in the year of acquisition:
| | | |
ASSET CLASS | | THRESHOLD |
Information technology equipment | | $ | 5,000 |
Furniture and fittings | | $ | 5,000 |
Plant and machinery | | $ | 5,000 |
Items with a lesser value are expensed in the year of acquisition.
Depreciation is calculated on a straight line basis over the estimated useful life of the assets. Depreciation rates for each class of asset are as follows:
| | | |
ASSET CLASS | | DEPRECIATION
RATE | |
Information technology equipment | | 6 – 40 | % |
Furniture, fittings and office equipment | | 8 – 33 | % |
Plant and machinery | | 10 | % |
The assets’ residual value, useful lives and depreciation methods are reviewed and adjusted, if appropriate, at each financial year end.
DERECOGNITION
An item of property, plant and equipment is derecognised upon disposal or when no further future economic benefits are expected from its use or subsequent disposal. Any gain or loss arising on derecognition of the asset (calculated as the difference between the net disposal proceeds and the carrying amount of the asset) is included in the Income Statement in the year the asset is derecognised.
IMPAIRMENT
The carrying amounts of QTC’s assets are reviewed at each balance sheet date to determine whether there is any indication of impairment. If any such indication exists, the asset’s recoverable amount is estimated. An assessment of impairment has been made and no adjustment was required.
(N) INTANGIBLE ASSETS
SOFTWARE
Acquired computer software licences are capitalised on the basis of the costs incurred to acquire and bring to use the specific software. These costs are amortised over their estimated useful lives (three to five years).
Costs associated with the development of computer software exceeding a threshold of $100,000 are recognised as intangible assets if the product is technically and commercially feasible and it is likely to generate future economic benefits exceeding costs beyond one year. The expenditure capitalised comprises all directly attributable costs including labour costs. All other costs associated with the development of software are expensed as incurred.
Computer software development costs recognised as assets are amortised on a straight line basis over the period of expected benefit which varies from five to ten years.
(O) PAYMENT IN LIEU OF INCOME TAX
QTC is exempt from the payment of income tax under section 50-25 of the Income Tax Assessment Act 1997 (as amended).
QTC makes a payment in lieu of income tax to the Queensland Government’s Consolidated Fund. The calculation of the income tax liability is based on the income of certain activities controlled by QTC.
In calculating the payment in lieu of income tax expense, tax effect accounting principles are adopted for income received and expenses paid in relation to the management and administration of clients’ borrowings and deposits as well as for advisory services and structured finance transactions. For all other QTC operations on which a payment in lieu of income tax is made, tax effect accounting principles are not applied.
QTC’s controlled and jointly controlled entities are defined as State and Territory bodies under section 24AO of the Income Tax Assessment Act 1936 and as a consequence are exempt from Commonwealth tax under section 24AM of this Act.
2005 - 2006 ANNUAL REPORT 43
Notes to and forming part of the Financial Statements
for the year ended 30 June 2006 (continued)
2. SUMMARY OF SIGNIFICANT ACCOUNTING
POLICIES (Continued)
(O) PAYMENT IN LIEU OF INCOME TAX (CONTINUED)
Deferred income tax is provided in full, using the liability method, on all temporary differences arising between the tax bases of assets and liabilities and their carrying amounts in the financial statements.
Deferred income tax liabilities are recognised for all taxable temporary differences arising from prepayments of expenditure of QTC. Deferred income tax assets are recognised for deductible temporary differences arising from accruals of expenditure, employee benefits and depreciation charged on property, plant and equipment.
Deferred tax assets are recognised where it is probable that future taxable income will be available against which the temporary differences can be utilised.
(P) EMPLOYEE BENEFITS
WAGES, SALARIES, RECREATION LEAVE, LONG SERVICE LEAVE AND SICK LEAVE
Wages, salaries, annual and long service leave due but unpaid at reporting date are recognised in other creditors at the remuneration rates expected to apply at the time of settlement and include related on-costs such as payroll tax, workers compensation premiums and employer superannuation contributions.
For unpaid entitlements expected to be paid within 12 months, the liabilities are recognised at their undiscounted values. For those entitlements not expected to be paid within 12 months, the liabilities are recognised at their present value, calculated using Commonwealth Government bond yields of similar maturity.
Prior history indicates that on average, sick leave taken each reporting period is less than the entitlement accrued. This is expected to continue in future periods. Accordingly, it is unlikely that existing accumulated entitlements will be used by employees and no liability for unused sick leave entitlements is recognised.
As sick leave is non-vesting, an expense is recognised for this leave as it is taken.
RETIREMENT BENEFITS
Contributions made by QTC to employee contributory superannuation funds (to provide benefits for employees and their dependants on retirement, disability or death) are charged to the Income Statement. QTC is not responsible for any shortfalls.
(Q) PROVISIONS FOR IMPAIRED LOANS
In recent years QTC has, at the direction of the Queensland Government, acquired loans provided to a number of co-operative housing societies at a cost equivalent to book value. At the time of acquisition, there were a number of non performing loans. Specific provisions have been made where full recovery of principal and interest is considered doubtful based on the net realisable value of the underlying security. Such loans are treated as impaired assets and categorised as non accrual loans as set out and explained in note 12.
(R) ROUNDING
Amounts have been rounded to the nearest thousand dollars except for note 32 which is rounded to the nearest million dollars and note 33 which is in whole dollars.
(S) COMPARATIVE FIGURES
Where necessary, comparative figures have been adjusted to conform with changes in presentation in the current year.
(T) IMPACT OF ADOPTING NEW ACCOUNTING STANDARDS
The following standards and amendments are not mandatory for 30 June 2006 reporting periods, but were available for early adoption.
| • | | AASB 7 Financial Instruments: Disclosure (August 2005) replacing the disclosure requirements of financial instruments in AASB 132. AASB 7 is applicable for annual reporting periods beginning on or after 1 January 2007. |
| • | | AASB 2005-10 Amendments to Australian Accounting Standards (September 2005) makes consequential amendments to AASB 132, AASB 101, AASB 114, AASB 117, AASB 133, AASB 139, AASB 1, AASB4, AASB 1023 and AASB 1038. AASB 2005-10 is applicable for annual reporting periods beginning on or after 1 January 2007. |
QTC has not adopted these standards early. Application of the standards in the financial year ending 30 June 2008 will not affect any of the amounts recognised in the financial statements, but will impact the type of information disclosed in relation to QTC’s financial instruments.
44 QUEENSLAND TREASURY CORPORATION
3. INTEREST INCOME AND INTEREST EXPENSE
| | | | | | | | | | | |
| | | FOR THE YEAR ENDED 30 JUNE 2006 | |
| | | INTEREST
$ 000 | | NET
UNREALISED
GAIN/LOSS $ 000 | | | NET
REALISED
GAIN/LOSS $ 000 | | | TOTAL
INTEREST
$ 000 | |
INTEREST INCOME | | | | | | | | | | | |
AUSTRALIA | | | | | | | | | | | |
Money market deposits | | 61 317 | | (8 | ) | | - | | | 61 309 | |
Discount securities | | 344 783 | | (1 374 | ) | | 126 | | | 343 535 | |
Commonwealth and semi-government securities | | 93 348 | | (42 418 | ) | | 14 607 | | | 65 537 | |
Floating rate notes | | 149 452 | | (221 | ) | | 353 | | | 149 584 | |
Other investments | | 69 054 | | (15 848 | ) | | 1 710 | | | 54 916 | |
Forward rate agreements | | - | | (27 164 | ) | | - | | | (27 164 | ) |
Onlendings * | | 648 327 | | (76 021 | ) | | - | | | 572 306 | |
| | | | |
OVERSEAS | | | | | | | | | | | |
Credit derivatives | | 559 | | 301 | | | 1 | | | 861 | |
| | | | | | | | | | | |
| | 1 366 840 | | (162 753 | ) | | 16 797 | | | 1 220 884 | |
| | | | | | | | | | | |
INTEREST EXPENSE | | | | | | | | | | | |
| | | | |
AUSTRALIA | | | | | | | | | | | |
Deposits | | 302 970 | | 17 | | | - | | | 302 987 | |
Treasury notes | | 23 389 | | (776 | ) | | - | | | 22 613 | |
Bonds | | 795 738 | | (398 254 | ) | | 7 012 | | | 404 496 | |
Floating rate notes | | - | | - | | | - | | | - | |
Credit foncier loans | | 350 | | (226 | ) | | - | | | 124 | |
Interest rate swaps | | 9 044 | | 101 526 | | | - | | | 110 570 | |
Forward rate agreements | | - | | 369 | | | (409 | ) | | (40 | ) |
Futures | | - | | 4 440 | | | 15 283 | | | 19 723 | |
| | | | |
OVERSEAS | | | | | | | | | | | |
Commercial paper | | 5 493 | | 4 663 | | | - | | | 10 156 | |
Bonds | | 582 494 | | (320 590 | ) | | 3 031 | | | 264 935 | |
Medium term notes | | 26 559 | | (1 115 | ) | | (918 | ) | | 24 526 | |
Private placement | | - | | - | | | - | | | - | |
Cross currency swaps | | 453 | | (558 | ) | | - | | | (105 | ) |
Forward exchange contracts | | 11 | | 3 254 | | | (6320 | ) | | (3 055 | ) |
| | | | |
OTHER | | | | | | | | | | | |
Registration and Issue costs | | 1 993 | | - | | | - | | | 1 993 | |
Commissions on futures | | 1 345 | | - | | | - | | | 1 345 | |
| | | | | | | | | | | |
| | 1 749 839 | | (607 250 | ) | | 17 679 | | | 1 160 268 | |
| | | | | | | | | | | |
| * | The majority of onlendings are provided to customers on a pooled fund basis. Interest costs are allocated to customers based on the daily movement in the market value of the pooled fund. Except for fixed rate loans, the interest from onlendings figure includes unrealised gains and losses which reflects the amount charged to clients. |
In periods of rising interest rates, the market value of the funding pool will decrease leading to lower interest income from onlendings. During the year ended 30 June 2006, interest rates rose in comparison to the previous year when rates fell, leading to a substantial decrease in interest income for the period.
2005 - 2006 ANNUAL REPORT 45
Notes to and forming part of the Financial Statements
for the year ended 30 June 2006 (continued)
3. INTEREST INCOME AND INTEREST EXPENSE
| | | | | | | | | | | | |
| | | FOR THE YEAR ENDED 30 JUNE 2005 | |
| | | INTEREST
$ 000 | | | NET
UNREALISED
GAIN/LOSS $ 000 | | | NET
REALISED
GAIN/LOSS $ 000 | | | TOTAL
INTEREST
$ 000 | |
INTEREST INCOME | | | | | | | | | | | | |
| | | | |
AUSTRALIA | | | | | | | | | | | | |
Money market deposits | | 51 059 | | | 1 | | | - | | | 51 060 | |
Discount securities | | 267 935 | | | 1 125 | | | (202 | ) | | 268 858 | |
Commonwealth and State securities | | 155 183 | | | 51 845 | | | 48 706 | | | 255 734 | |
Floating rate notes | | 93 345 | | | 9 | | | 426 | | | 93 780 | |
Other investments | | 31 914 | | | 10 326 | | | 1 908 | | | 44 148 | |
Interest rate swaps | | (610 | ) | | (5 571 | ) | | - | | | (6 181 | ) |
Forward rate agreements | | - | | | 11 690 | | | - | | | 11 690 | |
Onlendings * | | 1 385 925 | | | 57 070 | | | - | | | 1 442 995 | |
Collateralised Debt Obligation | | 113 | | | - | | | 152 | | | 265 | |
| | | | |
OVERSEAS | | | | | | | | | | | | |
Credit derivatives | | 239 | | | 92 | | | - | | | 331 | |
| | | | | | | | | | | | |
| | 1 985 103 | | | 126 587 | | | 50 990 | | | 2 162 680 | |
| | | | | | | | | | | | |
INTEREST EXPENSE | | | | | | | | | | | | |
| | | | |
AUSTRALIA | | | | | | | | | | | | |
Deposits | | 262 307 | | | - | | | - | | | 262 307 | |
Treasury notes | | 11 105 | | | 775 | | | - | | | 11 880 | |
Bonds | | 764 498 | | | 346 102 | | | (7 105 | ) | | 1 103 495 | |
Floating rate notes | | 1 780 | | | (12 | ) | | - | | | 1 768 | |
Credit foncier loans | | 87 | | | 234 | | | - | | | 321 | |
State debt to the Commonwealth | | 2 658 | | | (9 | ) | | - | | | 2 649 | |
Interest rate swaps | | 28 604 | | | (60 066 | ) | | - | | | (31 462 | ) |
Forward rate agreements | | - | | | 192 | | | (3 729 | ) | | (3 537 | ) |
Futures | | - | | | (57 | ) | | 31 355 | | | 31 298 | |
| | | | |
OVERSEAS | | | | | | | | | | | | |
Commercial paper | | 10 427 | | | (46 288 | ) | | - | | | (35 861 | ) |
Bonds | | 492 146 | | | 145 191 | | | 32 178 | | | 669 515 | |
Medium term notes | | 33 387 | | | 9 487 | | | (2 280 | ) | | 40 594 | |
Private placement | | (24 | ) | | (603 | ) | | 369 | | | (258 | ) |
Cross currency swaps | | 6 969 | | | (5 199 | ) | | - | | | 1 770 | |
Forward exchange contracts | | 7 | | | 32 623 | | | 20 834 | | | 53 464 | |
| | | | |
OTHER | | | | | | | | | | | | |
Registration and Issue costs | | 2 084 | | | - | | | - | | | 2 084 | |
Commissions on futures | | 1 292 | | | - | | | - | | | 1 292 | |
| | | | | | | | | | | | |
| | 1 617 327 | | | 422 370 | | | 71 622 | | | 2 111 319 | |
| | | | | | | | | | | | |
| * | The majority of onlendings are provided to customers on a pooled fund basis. Interest costs are allocated to customers based on the daily movement in the market value of the pooled fund. Except for fixed rate loans, the interest from onlendings figure includes unrealised gains and losses which reflects the amount charged to clients. |
In periods of rising interest rates, the market value of the funding pool will decrease leading to lower interest income from onlendings. During the year ended 30 June 2006, interest rates rose in comparison to the previous year when rates fell, leading to a substantial decrease in interest income for the period.
46 QUEENSLAND TREASURY CORPORATION
4. MANAGEMENT FEES
Management fees represent income earned from the management of QTC’s onlendings and deposits. A further amount of $6.842 million (2005 $6.972 million) derived from interest rate margins on certain managed funds and pools has been included under interest income.
5. ADMINISTRATION EXPENSES
| | | | |
| | | 30 JUNE 2006
$ 000 | | 30 JUNE 2005
$ 000 |
Salaries and related costs | | 12 914 | | 11 967 |
Superannuation contributions | | 1 268 | | 1 234 |
Consultant fees (i) | | 2 643 | | 2 575 |
Outsourced fees (ii) | | 1 016 | | 1 176 |
Depreciation on property, plant and equipment | | 7 056 | | 8 157 |
Amortisation on intangibles | | 152 | | 189 |
Computer and maintenance charges | | 1 257 | | 818 |
Property charges including rental | | 1 274 | | 1 228 |
External audit fees (iii) | | 297 | | 291 |
Internal audit fees | | 300 | | 347 |
Staff training and development | | 205 | | 229 |
Investor and market relations program | | 375 | | 399 |
Other administration expenses | | 1 492 | | 1 411 |
| | | | |
| | 30 249 | | 30 021 |
| | | | |
(i) CONSULTANTS’ FEES | | | | |
Legal costs professional/technical | | 934 | | 1 036 |
Information technology | | 306 | | 556 |
Contractors/secondment | | 767 | | 409 |
Finance/accounting | | 229 | | 193 |
Human resource management | | 100 | | 119 |
Management | | 103 | | - |
Communications | | 104 | | 88 |
Other | | 100 | | 174 |
| | | | |
| | 2 643 | | 2 575 |
| | | | |
(ii) OUTSOURCED SERVICES | | | | |
Information services | | 585 | | 708 |
Registry charges | | 68 | | 92 |
Economic services | | 93 | | 110 |
Domestic and international clearing charges | | 173 | | 178 |
Bank charges | | 44 | | 36 |
Other | | 53 | | 52 |
| | | | |
| | 1 016 | | 1 176 |
| | | | |
(iii) EXTERNAL AUDIT FEES | | | | |
The external auditors (Queensland Audit Office) do not provide any consulting services to QTC. |
2005 - 2006 ANNUAL REPORT 47
Notes to and forming part of the Financial Statements
for the year ended 30 June 2006 (continued)
6. AVERAGE FINANCIAL ASSETS’ AND LIABILITIES’ BALANCE AND RELATED INTEREST
The following tables show the average balance for each of the major categories of interest earning assets and interest bearing liabilities, the amount of interest revenue or expense and the average interest rate. Averages are based on monthly balances which are representative of QTC’s operations during the relevant period. In relation to onlendings, except for fixed rate loans, total interest includes unrealised gains and losses which reflects the amount charged to clients (refer note 3).
| | | | | | |
| | | 30 JUNE 2006 |
| | | TOTAL
INTEREST
$ 000 | | AVERAGE
BALANCE
$ 000 | | AVERAGE
RATE % |
AVERAGE ASSETS AND INTEREST INCOME | | | | | | |
| | | |
AUSTRALIA | | | | | | |
Money market deposits | | 61 317 | | 1 198 223 | | 5.12 |
Discount securities | | 344 783 | | 6 183 527 | | 5.58 |
Commonwealth and semi-government securities | | 93 348 | | 1 655 543 | | 5.64 |
Floating rate notes | | 149 452 | | 2 554 154 | | 5.85 |
Other investments | | 69 054 | | 1 080 732 | | 6.39 |
Interest rate swaps | | - | | # | | # |
Onlendings | | 648 327 | | 19 277 998 | | 3.36 |
Collateralised debt obligation | | - | | # | | # |
| | | |
OVERSEAS | | | | | | |
Floating rate notes | | - | | - | | - |
Cross currency swaps | | - | | # | | # |
Credit derivatives | | 559 | | # | | # |
| | | | | | |
| | 1 366 840 | | | | |
| | | | | | |
AVERAGE LIABILITIES AND INTEREST EXPENSE | | | | | | |
| | | |
AUSTRALIA | | | | | | |
Deposits | | 302 970 | | 5 541 650 | | 5.47 |
Treasury notes | | 23 389 | | 418 982 | | 5.58 |
Bonds | | 795 738 | | 14 203 889 | | 5.60 |
Floating rate notes | | - | | # | | # |
Credit foncier loans | | 351 | | 5 082 | | 6.91 |
State debt to the Commonwealth | | - | | # | | # |
Interest rate swaps | | 9 044 | | # | | # |
| | | |
OVERSEAS | | | | | | |
Commercial paper | | 5 493 | | 151 987 | | (1) 3.61 |
Bonds | | 582 494 | | 10 624 208 | | 5.48 |
Medium term notes | | 26 558 | | 545 052 | | (1) 4.87 |
Private placement | | - | | # | | # |
Cross currency swaps | | 453 | | # | | # |
Forward contracts | | 11 | | # | | # |
| | | |
OTHER | | | | | | |
Registration and issue costs | | 1 993 | | # | | # |
Commissions on futures | | 1 345 | | # | | # |
| | | | | | |
| | 1 749 839 | | | | |
| | | | | | |
| * | Includes net foreign exchange loss of $0.011 million. |
| (1) | A substantial proportion of these instruments is sourced in foreign currencies. All foreign currency exposure is hedged though the use of cross currency swaps and forward exchange contracts. The net exposure to foreign currencies is detailed in note 23 (A). The average interest for these instruments should be read in conjunction with interest on cross currency swaps and forward exchange contracts. |
48 QUEENSLAND TREASURY CORPORATION
6. AVERAGE FINANCIAL ASSETS’ AND LIABILITIES’ BALANCE AND RELATED INTEREST (continued)
| | | | | | |
| | | 30 JUNE 2005 |
| | | TOTAL
INTEREST
$ 000 | | AVERAGE
BALANCE
$ 000 | | AVERAGE
RATE % |
AVERAGE ASSETS AND INTEREST INCOME | | | | | | |
| | | |
AUSTRALIA | | | | | | |
Money market deposits | | 51 059 | | 986 039 | | 5.18 |
Discount securities | | 267 935 | | 4 898 993 | | 5.47 |
Commonwealth and semi-government securities | | 155 183 | | 2 667 389 | | 5.82 |
Floating rate notes | | 93 345 | | 1 622 132 | | 5.75 |
Other investments | | 31 914 | | 459 091 | | 6.95 |
Interest rate swaps | | (610) | | # | | # |
Onlendings | | 1 385 925 | | 18 109 797 | | 7.65 |
Collateralised debt obligation | | 113 | | # | | # |
OVERSEAS | | | | | | |
Floating rate notes | | - | | - | | - |
Cross currency swaps | | - | | # | | # |
Credit derivatives | | 239 | | # | | # |
| | | | | | |
| | 1 985 103 | | | | |
| | | | | | |
AVERAGE LIABILITIES AND INTEREST EXPENSE | | | | | | |
| | | |
AUSTRALIA | | | | | | |
Deposits | | 262 307 | | 4 868 449 | | 5.39 |
Treasury notes | | 11 105 | | 205 498 | | 5.40 |
Bonds | | 764 498 | | 13 442 005 | | 5.69 |
Floating rate notes | | 1 780 | | 29 329 | | 6.07 |
Credit foncier loans | | 87 | | 4 600 | | 1.89 |
State debt to the Commonwealth | | 2 658 | | 53 806 | | 4.94 |
Interest rate swaps | | 28 604 | | # | | # |
| | | |
OVERSEAS | | | | | | |
Commercial paper | | 10 427 | | 401 209 | | (1)2.60 |
Bonds | | 492 146 | | 8 833 848 | | 5.57 |
Medium term notes | | 33 387 | | 671 591 | | (1)4.97 |
Private placement | | (24) | | # | | # |
Cross currency swaps | | 6 969 | | # | | # |
Forward contracts* | | 7 | | # | | # |
| | | |
OTHER | | | | | | |
Registration and issue costs | | 2 084 | | # | | # |
Commissions on futures | | 1 292 | | # | | # |
| | | | | | |
| | 1 617 327 | | | | |
| | | | | | |
| * | Includes net foreign exchange loss of $0.007 million. |
| (1) | A substantial proportion of these instruments is sourced in foreign currencies. All foreign currency exposure is hedged though the use of cross currency swaps and forward exchange contracts. The net exposure to foreign currencies is detailed in note 23 (A). The average interest for these instruments should be read in conjunction with interest on cross currency swaps and forward exchange contracts. |
2005 - 2006 ANNUAL REPORT 49
Notes to and forming part of the Financial Statements
for the year ended 30 June 2006 (continued)
7. PAYMENT IN LIEU OF INCOME TAX
| | | | | | |
| | | 30 JUNE 2006
$ 000 | | | 30 JUNE 2005
$ 000 | |
INCOME TAX EXPENSE | | | | | | |
Current tax | | 13 162 | | | 11 577 | |
Deferred tax | | (421 | ) | | 70 | |
| | | |
| | 12 741 | | | 11 647 | |
| | | |
Deferred income tax (revenue) expense included in income tax expense comprises: | | | | | | |
(Increase) decrease in deferred tax assets | | (448 | ) | | 142 | |
Increase (decrease) in deferred tax liabilities | | 27 | | | (72 | ) |
| | | | | | |
| | (421 | ) | | 70 | |
| | | |
NUMERICAL RECONCILIATION OF INCOME TAX EXPENSE TO PRIMA FACIE TAX PAYABLE | | | | | | |
Operating surplus from continuing operations before income tax expense | | 62 310 | | | 57 735 | |
Tax at the Australian tax rate of 30% (2005 – 30%) | | 18 693 | | | 17 321 | |
Tax effect of amounts which are not deductible (taxable) in calculating taxable income: | | | | | | |
Non-taxable pools | | (5 966 | ) | | (5 706 | ) |
Share of net profit of jointly controlled entities | | (26 | ) | | - | |
Other | | 40 | | | 32 | |
| | | |
INCOME TAX EXPENSE | | 12 741 | | | 11 647 | |
| | | |
Deferred income tax at 30 June relates to the following: | | | | | | |
DEFERRED TAX LIABILITIES | | | | | | |
Prepayments | | 347 | | | 320 | |
| | | |
DEFERRED TAX ASSETS | | | | | | |
Accelerated depreciation for accounting purposes | | 23 | | | 44 | |
Accruals | | 750 | | | 389 | |
Employee benefits | | 913 | | | 805 | |
| | | |
| | 1 686 | | | 1 238 | |
| | | |
CURRENT TAX LIABILITY | | 13 162 | | | 11 577 | |
DEFERRED TAX LIABILITY | | 347 | | | 320 | |
| | | |
TAX LIABILITIES | | 13 509 | | | 11 897 | |
| | | |
8. CASH ASSETS
Cash assets includes only those funds held at bank and does not include money market deposits.
50 QUEENSLAND TREASURY CORPORATION
9.RECEIVABLES
| | | | |
| | | 30 JUNE 2006
$ 000 | | 30 JUNE 2005
$ 000 |
GST receivable | | 48 | | - |
Operating leases | | 1 410 | | 1 467 |
Sundry debtors | | 820 | | 767 |
| | |
| | 2 278 | | 2 234 |
| | |
10. ONLENDINGS
| | | | | | | | |
| | | NOTE | | 30 JUNE 2006
$ 000 | | | 30 JUNE 2005
$ 000 | |
Government departments and agencies | | | | 1 923 668 | | | 2 769 630 | |
Government owned corporations | | | | 12 903 933 | | | 11 020 349 | |
Local government | | | | 2 718 928 | | | 2 781 219 | |
Tollway companies | | | | 932 371 | | | 982 521 | |
QTC related entities(1) | | | | 372 896 | | | 413 832 | |
Statutory bodies | | | | 758 701 | | | 705 015 | |
Co-operative housing society loans | | | | 8 475 | | | 15 016 | |
Provisions for impaired loans | | 11 & 12 | | (130 | ) | | (136 | ) |
Other bodies | | | | 212 740 | | | 218 175 | |
| | | | | |
| | | | 19 831 582 | | | 18 905 621 | |
| | | | | |
| (1) | Included in the above figure is an onlending to DBCT Holdings Pty Ltd to fund the purchase and lease of operating rights to the Dalrymple Bay Coal Terminal (refer note 19 and note 30). The onlending is offset by a deposit of $373 million (2005 $414 million) held by QTC on behalf of the lessee of the terminal (refer note 19). |
11. PROVISIONS FOR IMPAIRED LOANS
| | | | | |
| | | 30 JUNE 2006
$ 000 | | | 30 JUNE 2005
$ 000 |
Opening balance | | 136 | | | 85 |
Charge against profit | | (6 | ) | | 51 |
| | |
Closing balance | | 130 | | | 136 |
| | |
12. ASSET QUALITY
Impaired assets consist of non accrual loans and restructured loans in respect of co-operative housing societies. Non accrual loans are loans for which there is reasonable doubt about the recovery of principal and interest and therefore provisions for impairment are recognised. Restructured loans consist of loans where the original contractual terms have been modified as a concession to the borrowers and revised terms are not comparable with those for new loans of similar risk.
Past due loans are loans where principal and or interest are at least 90 days in arrears but full recovery of principal and interest is expected.
The following table provides an analysis of QTC’s impaired assets and related disclosures mentioned above.
There were no restructured loans at 30 June 2006.
| | | | |
| | | 30 JUNE 2006
$000 | | 30 JUNE 2005
$000 |
NON ACCRUAL LOANS | | | | |
With specific provisions | | 579 | | 674 |
Less specific provisions for impaired loans | | 130 | | 136 |
| | |
NET NON ACCRUAL LOANS | | 449 | | 538 |
| | |
PAST DUE LOANS | | 884 | | 1 227 |
| | |
2005 - 2006 ANNUAL REPORT 51
Notes to and forming part of the Financial Statements
for the year ended 30 June 2006 (continued)
13. DERIVATIVE FINANCIAL ASSETS
| | | | |
| | | 30 JUNE 2006
$ 000 | | 30 JUNE 2005
$ 000 |
AUSTRALIA | | | | |
Forward rate agreements | | 2 126 | | 21 952 |
Interest rate swaps | | 63 915 | | 94 286 |
| | |
OVERSEAS | | | | |
Forward exchange contracts | | 116 | | 653 |
Cross currency swaps | | - | | 736 |
Credit derivatives | | 590 | | 272 |
| | |
| | 66 747 | | 117 899 |
| | |
14. FINANCIAL ASSETS AT FAIR VALUE THROUGH PROFIT OR LOSS
| | | | |
| | | 30 JUNE 2006
$ 000 | | 30 JUNE 2005
$ 000 |
AUSTRALIA | | | | |
Money market deposits | | 1 543 324 | | 458 927 |
Discount securities | | 5 661 421 | | 6 188 411 |
Commonwealth and semi-government securities * | | 2 491 860 | | 1 616 313 |
Floating rate notes | | 2 775 491 | | 1 951 922 |
Other investments | | 1 085 628 | | 1 063 070 |
| | |
| | 13 557 724 | | 11 278 643 |
| | |
The total includes investments made to manage
| • | | deposits of $5 324.945 million (2005 $5 220.644 million), |
| • | | surpluses and reserves of $327.500 million (2005 $277.931 million), |
| • | | cross border lease deferred income of $136.007 million (2005 $144.770 million). |
The remaining investments are used to facilitate management of interest rate risk or result from QTC borrowing in advance of requirements.
| • | | QTC maintains holdings of its own stocks. These holdings have been excluded from Financial Assets and Financial Liabilities at Fair Value through Profit or Loss (refer note 19). |
52 QUEENSLAND TREASURY CORPORATION
15. PROPERTY, PLANT AND EQUIPMENT
| | | | |
| | | 30 JUNE 2006
$ 000 | | 30 JUNE 2005
$ 000 |
GROSS PROPERTY, PLANT AND EQUIPMENT | | 49 660 | | 54 085 |
Less accumulated depreciation | | 18 401 | | 14 930 |
| | |
NET PROPERTY, PLANT AND EQUIPMENT | | 31 259 | | 39 155 |
| | |
REPRESENTED BY | | | | |
Information technology equipment | | 6 134 | | 10 618 |
Less accumulated depreciation | | 4 445 | | 6 265 |
| | |
| | 1 689 | | 4 353 |
| | |
Furniture, fittings and office equipment | | 29 057 | | 29 714 |
Less accumulated depreciation | | 11 047 | | 7 151 |
| | |
| | 18 010 | | 22 563 |
| | |
Plant and machinery | | 14 469 | | 13 753 |
Less accumulated depreciation | | 2 909 | | 1 514 |
| | |
| | 11 560 | | 12 239 |
| | |
| | 31 259 | | 39 155 |
| | |
Reconciliations of the carrying amounts for each class of property, plant and equipment are set out below:
| | | | | | | | | | | | |
| DESCRIPTION | | INFORMATION
TECHNOLOGY
EQUIPMENT $ 000 | | | FURNITURE,
FITTINGS
AND OFFICE
EQUIPMENT
$ 000 | | | PLANT AND
MACHINERY
$ 000 | | | TOTAL $ 000 | |
Carrying amount at 1/7/2004 | | 6 668 | | | 27 714 | | | 13 889 | | | 48 271 | |
Acquisitions | | 675 | | | 147 | | | - | | | 822 | |
Disposals | | (244 | ) | | (1 193 | ) | | (344 | ) | | (1 781 | ) |
Depreciation | | (2 746 | ) | | (4 105 | ) | | (1 306 | ) | | (8 157 | ) |
| | | |
| | | | |
CARRYING AMOUNT AT 30/6/2005 | | 4 353 | | | 22 563 | | | 12 239 | | | 39 155 | |
| | | |
| | | | |
Carrying amount at 1/7/2005 | | 4 353 | | | 22 563 | | | 12 239 | | | 39 155 | |
Acquisitions | | 115 | | | 131 | | | 612 | | | 858 | |
Disposals | | (1 119 | ) | | (579 | ) | | - | | | (1 698 | ) |
Depreciation | | (1 660 | ) | | (4 105 | ) | | (1 291 | ) | | (7 056 | ) |
| | | |
| | | | |
CARRYING AMOUNT AT 30/6/2006 | | 1 689 | | | 18 010 | | | 11 560 | | | 31 259 | |
| | | |
2005 - 2006 ANNUAL REPORT 53
Notes to and forming part of the Financial Statements
for the year ended 30 June 2006 (continued)
16. INTANGIBLES
| | | | | | |
| | | 30 JUNE 2006
$ 000 | | | 30 JUNE 2005
$ 000 | |
SOFTWARE, AT COST | | 2 292 | | | 1 940 | |
Less accumulated amortisation | | (1 982 | ) | | (1 829 | ) |
| | | |
| | 310 | | | 111 | |
| | | |
CARRYING AMOUNT AT 1/7/2005 | | 111 | | | 217 | |
Acquisitions | | 351 | | | 83 | |
Amortisation | | (152 | ) | | (189 | ) |
| | | |
CARRYING AMOUNT AT 30/6/2006 | | 310 | | | 111 | |
| | | |
| | |
| 17. PAYABLES | | | | | | |
| | | 30 JUNE 2006
$ 000 | | | 30 JUNE 2005
$ 000 | |
Cross border lease deferred income | | 136 007 | | | 144 770 | |
GST payable | | - | | | 9 256 | |
Whole of Government Debt Pool net position | | 55 786 | | | 41 790 | |
Administration expenses | | 2 501 | | | 2 384 | |
Employee benefits | | 3 045 | | | 2 682 | |
Unearned revenue | | 492 | | | 271 | |
Other creditors | | 274 | | | 344 | |
| | | |
| | 198 105 | | | 201 497 | |
| | | |
| | |
| 18. DERIVATIVE FINANCIAL LIABILITIES | | | | | | |
| | | 30 JUNE 2006
$ 000 | | | 30 JUNE 2005
$ 000 | |
AUSTRALIA | | | | | | |
Interest rate swaps | | 84 606 | | | 39 887 | |
Forward rate agreements | | 16 809 | | | 11 302 | |
| | |
OVERSEAS | | | | | | |
Credit derivatives | | 27 | | | 18 | |
Forward exchange contracts | | 2 716 | | | - | |
| | | |
| | 104 158 | | | 51 207 | |
| | | |
54 QUEENSLAND TREASURY CORPORATION
19 . FINANCIAL LIABILITIES AT FAIR VALUE THROUGH PROFIT OR LOSS
| | | | |
| | | 30 JUNE 2006
$ 000 | | 30 JUNE 2005
$ 000 |
DEPOSITS AT FAIR VALUE THROUGH PROFIT OR LOSS | | | | |
Government departments and agencies | | 1 107 209 | | 2 362 397 |
Government owned corporations | | 1 011 146 | | 498 920 |
Local governments | | 1 320 131 | | 1 209 733 |
Tollway companies | | 14 719 | | - |
Statutory bodies | | 561 331 | | 450 646 |
QTC related entities | | 48 158 | | 10 874 |
Other depositors (1) | | 536 903 | | 541 784 |
| | |
| | 4 599 597 | | 5 074 354 |
Stock lending | | 358 459 | | 109 250 |
Repurchase agreements | | 371 273 | | 37 040 |
| | |
| | 5 329 329 | | 5 220 644 |
| | |
| (1) | Includes a security deposit of $ 373 million (30 June 2005 $414 million) held on behalf of the lessee of the Dalrymple Bay Coal Terminal. |
INTEREST-BEARING LIABILITIES AT FAIR VALUE THROUGH PROFIT OR LOSS
| | | | |
AUSTRALIA | | | | |
Treasury notes | | - | | 612 803 |
Bonds | | 15 784 949 | | 13 876 402 |
Credit foncier loans | | 4 660 | | 5 319 |
| | |
| | 15 789 609 | | 14 494 524 |
| | |
OVERSEAS | | | | |
Commercial paper (a) | | 108 322 | | 141 603 |
Bonds (b) | | 11 150 801 | | 9 342 787 |
Medium term notes (c) | | 470 845 | | 603 138 |
| | |
| | 11 729 968 | | 10 087 528 |
| | |
| | 27 519 577 | | 24 582 052 |
| | |
TOTAL | | 32 848 906 | | 29 802 696 |
| | |
| (a) | Includes nil (2005 $10.885 million) of commercial paper borrowed in the Euro Australian dollar commercial paper markets. |
| (b) | Consists of $11 150.8 million (2005 $9 342.787 million) of global bonds which are borrowed in the United States’ domestic and Euro bond markets in Australian dollars. |
| (c) | Includes $470.845 million (2005 $585.022 million) borrowed in the Euro medium term note markets in Australian dollars. |
2005 - 2006 ANNUAL REPORT 55
Notes to and forming part
of the Financial Statements
for the year ended 30 June 2006 (continued)
19. FINANCIAL LIABILITIES AT FAIR VALUE THROUGH PROFIT OR LOSS (continued)
The offshore sourced debt results in net exposure to the following currencies after accounting for derivatives. Details of QTC’s exposure to foreign currencies and the derivatives used to hedge this exposure are disclosed in note 23 (A).
| | | | |
| | | 30 JUNE 2006
$000 | | 30 JUNE 2005
$000 |
Australian dollars | | 11 732 568 | | 10 086 140 |
| | |
QTC borrowings are guaranteed by the Queensland Government under the Queensland Treasury Corporation Act 1988. Other debt for which QTC has assumed debt service responsibility has been guaranteed under the appropriate Act which covered each borrowing at the time the loan was raised.
The difference between the carrying amount of financial liabilities and the amount contractually required to be paid at maturity to the holder of the obligation is set out in the following table.
| | | | | | | |
| INTEREST-BEARING LIABILITIES | | 30 JUNE 2006 | |
| | | FAIR VALUE
$ 000 | | REPAYMENT
AT MATURITY
$ 000 | | DIFFERENCE
$ 000 | |
AUSTRALIA | | | | | | | |
Bonds | | 15 784 949 | | 15 618 983 | | 165 966 | |
Credit foncier loans | | 4 660 | | 3 815 | | 845 | |
| | | |
| | 15 789 609 | | 15 622 798 | | 166 811 | |
| | | |
OVERSEAS | | | | | | | |
Commercial paper | | 108 322 | | 108 785 | | (463 | ) |
Bonds | | 11 150 801 | | 10 954 996 | | 195 805 | |
Medium term notes | | 470 845 | | 458 859 | | 11 986 | |
| | | |
| | 11 729 968 | | 11 522 640 | | 207 328 | |
| | | |
| | 27 519 577 | | 27 145 438 | | 374 139 | |
| | | |
| |
| INTEREST-BEARING LIABILITIES | | 30 JUNE 2005 | |
| | | FAIR VALUE
$ 000 | | REPAYMENT
AT MATURITY
$ 000 | | DIFFERENCE
$ 000 | |
AUSTRALIA | | | | | | | |
Treasury notes | | 612 803 | | 635 000 | | (22 197 | ) |
Bonds | | 13 876 402 | | 13 273 943 | | 602 459 | |
Credit foncier loans | | 5 319 | | 4 218 | | 1 101 | |
| | | |
| | 14 494 524 | | 13 913 161 | | 581 363 | |
| | | |
OVERSEAS | | | | | | | |
Commercial paper | | 141 603 | | 141 894 | | (291 | ) |
Bonds | | 9 342 787 | | 8 845 848 | | 496 939 | |
Medium term notes | | 603 138 | | 587 723 | | 15 415 | |
| | | |
| | 10 087 528 | | 9 575 465 | | 512 063 | |
| | | |
| | 24 582 052 | | 23 488 626 | | 1 093 426 | |
| | | |
56 QUEENSLAND TREASURY CORPORATION
20. RESERVES
| | | | | |
| | | 30 JUNE 2006
$ 000 | | 30 JUNE 2005
$ 000 | |
GENERAL RESERVE | | | | | |
Opening balance | | 39 082 | | 39 082 | |
| | | |
Closing balance | | 39 082 | | 39 082 | |
| | | |
| | |
CREDIT RISK RESERVE (1) | | | | | |
Opening balance | | 16 824 | | 8 857 | |
Transfer from Retained Surplus | | 4 497 | | 7 967 | |
| | | |
Closing balance | | 21 321 | | 16 824 | |
| | | |
| | |
BASIS RISK RESERVE (2) | | | | | |
Opening balance | | 13 000 | | 15 000 | |
Transfer from (to) Retained Surplus | | 1 000 | | (2 000 | ) |
| | | |
Closing balance | | 14 000 | | 13 000 | |
| | | |
| | |
TOTAL RESERVES | | 74 403 | | 68 906 | |
| | | |
| | |
MOVEMENTS DURING THE YEAR | | | | | |
Credit Risk Reserve | | 4 497 | | 7 967 | |
Basis Risk Reserve | | 1 000 | | (2 000 | ) |
| | | |
| | 5 497 | | 5 967 | |
| | | |
| (1) | QTC’s Cash Fund is capital guaranteed. To reduce the impact of a credit failure on its retained earnings, QTC sets aside a certain portion of its fees earned from the Cash Fund to the Credit Risk Reserve together with interest accumulated on the reserves. The Reserve will be utilised if a credit event results in there being a shortfall between the guaranteed capital and the investments of the fund. |
| (2) | The Basis Risk Reserve has been created to provide for the probability of loss as a result of basis risk where QTC has borrowed in excess of its loans to clients. The excess borrowings are needed to enable QTC to manage its customer debt portfolios and liquidity, and are hedged through the purchase of assets. Gains/losses may occur due to interest yields on borrowings not moving in exactly the same manner as interest yields on the asset hedges. Basis risk has been measured using value at risk methodology. QTC is confident at the 99% level that the accumulated losses as a result of basis risk on surplus fixed rate funding over a 10 business day period will be no greater than the value of the reserve for surplus fixed rate funding. Further at 99% confidence, the accumulated loss as a result of basis risk on surplus floating rate funding over a 20 business day period will be no greater than the value of the reserve for surplus floating rate funding. |
The remaining reserves are maintained for general purposes.
2005 - 2006 ANNUAL REPORT 57
Notes to and forming part of
the Financial Statements
for the year ended 30 June 2006 (continued)
21. NOTES TO THE STATEMENT OF CASH FLOWS
| | | | | | |
(A) RECONCILIATION OF OPERATING SURPLUS AFTER PAYMENT IN LIEU OF INCOME TAX TO NET CASH INFLOW FROM OPERATING ACTIVITIES | | 30 JUNE 2006 $ 000 | | | 30 JUNE 2005 $ 000 | |
Operating surplus after payment in lieu of income tax | | 49 569 | | | 46 088 | |
| | |
NON-CASH FLOWS IN OPERATING SURPLUS | | | | | | |
Share of profits of investments accounted for using the equity method | | (85 | ) | | - | |
Interest bearing liabilities net unrealised (gain) loss | | (611 703 | ) | | 427 736 | |
Interest bearing liabilities net unrealised exchange (gain) loss | | (4 302 | ) | | 46 577 | |
Onlendings net unrealised loss (gain) | | 128 487 | | | (58 013 | ) |
Financial assets at fair value through profit or loss net unrealised loss (gain) | | 84 586 | | | (68 781 | ) |
Financial assets at fair value through profit or loss net unrealised exchange (gain) loss | | (13 | ) | | (5 | ) |
Deposits net unrealised (gain) loss | | (23 | ) | | - | |
Depreciation of property, plant and equipment | | 7 056 | | | 8 157 | |
Net gain on sale of property, plant and equipment | | 58 | | | (2 701 | ) |
Amortisation of intangibles | | 152 | | | 189 | |
Realised loan losses co-operative housing societies | | - | | | 721 | |
Doubtful debts expense co-operative housing societies | | (6 | ) | | 51 | |
| | |
CHANGES IN ASSETS AND LIABILITIES | | | | | | |
Increase (decrease) in Interest bearing liabilities-net accrued interest | | 61 477 | | | 30 102 | |
(Decrease) increase in Interest bearing liabilities-net discount/premium | | (85 415 | ) | | (5 245 | ) |
Onlendings net accrued interest | | 1 980 | | | 1 575 | |
(Increase) decrease in financial assets at fair value through profit or loss-net accrued interest | | (55 474 | ) | | 62 357 | |
Decrease (increase) in financial assets at fair value through profit or loss-net discount/premium | | 20 031 | | | 65 978 | |
Deposits net accrued interest | | 1 222 | | | (66 | ) |
(Increase) decrease in receivables | | (65 | ) | | 35 496 | |
(Increase) decrease in prepayments | | (12 | ) | | 186 | |
Increase (decrease) in payables | | 5 716 | | | 29 639 | |
Increase (decrease) in income tax equivalent payable | | 1 585 | | | 651 | |
Increase (decrease) in deferred tax liability | | 27 | | | (72 | ) |
Increase (decrease) in other liabilities | | 2 | | | (7 | ) |
(Increase) decrease in deferred tax asset | | (448 | ) | | 142 | |
| | | |
| | |
Net cash (outflow) inflow from operating activities | | (395 598 | ) | | 620 755 | |
| | | |
(B) CASH FLOWS PRESENTED ON A NET BASIS
Cash flows arising from the following activities are presented on a net basis in the Statement of Cash Flows:
| • | | loan advances to and redemptions from borrowing authorities |
| • | | receipt and withdrawal of client deposits |
| • | | money market and other deposits |
58 QUEENSLAND TREASURY CORPORATION
22 . MATURITY ANALYSIS OF MONETARY ASSETS AND LIABILITIES
With the exception of pooled onlendings and deposits, the maturity analysis below has been calculated based on cash flows relating to the repayment of the principal (face value) amount outstanding at balance date and contractual terms. Pooled onlendings are based on cash flows relating to the payment of market value. Deposits on account of the Cash Fund and Working Capital Facility (11AM Fund) are repayable at call whilst deposits held as security for stock lending and repurchase agreements are repayable when the security is lodged with QTC.
| | | | | | | | | | | | |
| | | MATURITY PERIOD AT 30 JUNE 2006 |
| | | AT CALL $ 000 | | 0 TO 3
MONTHS $ 000 | | 3 TO 12
MONTHS $ 000 | | 1 TO 5
YEARS $ 000 | | OVER 5
YEARS $ 000 | | TOTAL $ 000 |
ASSETS | | | | | | | | | | | | |
Other financial assets | | 1 562 747 | | 8 339 957 | | 306 000 | | 2 129 320 | | 1 142 000 | | 13 480 024 |
Onlendings | | - | | (1)724674 | | 480 144 | | 7 302 885 | | 12 773 227 | | 19 831 582 |
| | |
Total monetary assets | | 1 562 747 | | 7 615 283 | | 786 144 | | 9 432 205 | | 13 915 227 | | 33 311 606 |
| | |
| | | | | | |
LIABILITIES | | | | | | | | | | | | |
Deposits | | 4 969 782 | | 357 404 | | - | | - | | - | | 5 327 185 |
Interest-bearing liabilities | | - | | 192 710 | | 485 151 | | 17 905 604 | | 8 561 973 | | 27 145 438 |
| | |
Total monetary liabilities | | 4 969 782 | | 550 114 | | 485 151 | | 17 905 604 | | 8 561 973 | | 32 472 622 |
| | |
| |
| | | MATURITY PERIOD AT 30 JUNE 2005 |
| | | AT CALL $ 000 | | 0 TO 3
MONTHS $ 000 | | 3 TO 12
MONTHS $ 000 | | 1 TO 5
YEARS $ 000 | | OVER 5
YEARS $ 000 | | TOTAL $ 000 |
ASSETS | | | | | | | | | | | | |
Other financial assets | | 485 202 | | 5 574 399 | | 700 000 | | 2 753 137 | | 1 693 715 | | 11 206 453 |
Onlendings | | | | 56 244 | | 710 725 | | 6 383 072 | | 11 755 580 | | 18 905 621 |
| | |
Total monetary assets | | 485 202 | | 5 630 643 | | 1 140 725 | | 9 136 209 | | 13 449 295 | | 30 112 074 |
| | |
| | | | | | |
LIABILITIES | | | | | | | | | | | | |
Deposits | | 5 111 082 | | 108 667 | | - | | - | | - | | 5 219 749 |
Interest-bearing liabilities | | - | | 341 034 | | 905 638 | | 11 822 197 | | 10 419 757 | | 23 488 626 |
| | |
Total monetary liabilities | | 5111 082 | | 449 701 | | 905 638 | | 11 822 197 | | 10 419 757 | | 28 708 375 |
| | |
| (1) | The balance of client offset deposits held exceeds the debt outstanding in the 0-3 months maturity group. |
2005 - 2006 ANNUAL REPORT 59
Notes to and forming part of the Financial Statements
for the year ended 30 June 2006 (continued)
23. FINANCIAL RISK MANAGEMENT
QTC’s activities expose it to a variety of financial risks; market risk (including currency risk, interest rate risk and price risk), credit risk and liquidity risk. QTC’s overall financial risk management program focuses on managing the unpredictability of financial markets and seeks to minimise potential adverse effects on the financial performance of QTC and its clients. QTC uses derivative financial instruments such as foreign exchange contracts, interest rate swaps and futures contracts to hedge certain risk exposures.
All portfolio management activities are conducted within Board approved policy. The Board approves written policies for overall risk management, as well as specific areas such as mitigating foreign exchange, interest rate and credit risks, the use of derivative financial instruments and investing excess liquidity.
Robust systems are in place for the management of risk. Compliance is monitored closely. The financial risk management process, including credit reviews of counterparties and total credit exposure, is performed by teams separate from the teams transacting and is subject to review by the Risk Management Team (comprising management representatives) and the Risk Management Committee. The Risk Management Committee was established during 2002 and comprises the entire QTC Board. Members of QTC’s Risk Management Team are invited to attend Risk Management Committee meetings as required.
(A) FOREIGN EXCHANGE RISK
QTC has facilities that allow for borrowing in foreign currencies. All foreign currency borrowings are either hedged to Australian dollars to ensure no currency risk or utilised to invest in a foreign currency financial asset, effectively eliminating any foreign currency exposure.
QTC enters into both forward exchange contracts and cross currency swaps to manage the exposure of foreign currency borrowings and offshore investments to fluctuations in exchange rates.
The following table summarizes the hedging effect that cross currency swaps and forward exchange contracts have had on face value offshore borrowings and investments stated in Australian dollars.
| | | | | | | | | | | | | | | | | | | | | | | | | | |
| | | BORROWINGS | | | OFFSHORE
INVESTMENTS | | CROSS
CURRENCY SWAPS | | | FORWARD EXCHANGE
CONTRACTS | | | NET EXPOSURE | |
| | | 2006 $000 | | | 2005 $000 | | | 2006 $000 | | 2005 $000 | | 2006 $000 | | 2005 $000 | | | 2006 $000 | | 2005 $000 | | | 2006 $000 | | | 2005 $000 | |
USD | | (108 785 | ) | | (130 924 | ) | | 2 411 | | 1 837 | | - | | - | | | 106 374 | | 129 087 | | | - | | | - | |
YEN | | - | | | - | | | - | | - | | - | | - | | | - | | - | | | - | | | - | |
GBP | | - | | | - | | | - | | - | | - | | - | | | - | | - | | | - | | | - | |
EUR | | - | | | - | | | - | | - | | - | | - | | | - | | - | | | - | | | - | |
NZD | | - | | | (18 104 | ) | | - | | - | | - | | 18 104 | | | - | | - | | | - | | | - | |
AUD | | (11 553 855 | ) | | (9 426 437 | ) | | - | | - | | - | | (17 224 | ) | | 114 075 | | (128 479 | ) | | (11 439 780 | ) | | (9 572 141 | ) |
| | |
60 QUEENSLAND TREASURY CORPORATION
23. FINANCIAL RISK MANAGEMENT (continued)
(B) INTEREST RATE RISK
QTC is a portfolio manager and manages its portfolios based on a duration benchmark. Duration is a direct measure of the interest rate sensitivity of a financial instrument and quantifies the change in value of a financial instrument due to interest rate movements. To manage the risk of non parallel yield curve movements, QTC allocates portfolio cash flows to a series of time periods and calculates the duration for each of these time periods against the benchmark duration for each of these periods.
QTC enters into interest rate swaps, forward rate agreements and futures contracts to assist in the management of interest rate risk.
In most instances, interest rate swaps are utilised to change the interest rate profiles of medium to long term fixed rate borrowings to floating rate borrowings at rates that are lower than those available to QTC if short term borrowings were utilised. This also results in a source of medium to long term floating rate funding. At times, floating to fixed swaps are undertaken to generate a fixed rate term funding profile. Under interest rate swaps, QTC agrees with other parties to exchange at specified intervals the difference between fixed rate and floating rate interest amounts calculated by reference to an agreed notional principal amount.
Forward rate agreements are used by QTC to lock-in a guaranteed return on known cash flows as and when they fall due or to manage the duration of a particular pool or fund.
Futures contracts are used primarily for the same purpose as forward rate agreements. These contracts have limited credit risk as organised exchanges are the counterparties.
QTC’s exposure as at 30 June 2006 to interest rate risk and the effective interest rates of financial assets and financial liabilities are shown in the following table. All assets and liabilities are shown by the earlier of maturity or contractual repricing dates and at face value except for derivatives which are shown at notional amount and debt pool onlendings which are based on cash flows relating to the repayment of market value onlendings outstanding. Notional principal amounts of derivatives represent the contract or face value of these derivatives. The notional amounts do not represent amounts exchanged by parties. The amounts to be exchanged are calculated with reference to the notional principal and other terms of the derivatives including interest rates, exchange rates and securities’ prices.
The weighted average effective interest rate is the rate effective as at 30 June.
2005 - 2006 ANNUAL REPORT 61
Notes to and forming part of the Financial Statements
for the year ended 30 June 2006 (continued)
23. FINANCIAL RISK MANAGEMENT (continued)
INTEREST RATE RISK AS AT 30 JUNE 2006
CONTRACTUAL REPRICING/MATURING DATE
| | | | | | | | | | | | | | | | | | | |
| | | FIXED INTEREST MATURING | | FLOATING INTEREST $ 000 | | NON INTEREST BEARING $ 000 | | TOTAL $ 000 | | WEIGHTED AVERAGE RATE % | |
| | | 0 TO 3
MONTHS $ 000 | | 3 TO 6 MONTHS $ 000 | | 6 TO 12 MONTHS $ 000 | | 1 TO 5 YEARS $ 000 | | OVER 5 YEARS $ 000 | | | | |
| FINANCIAL INSTRUMENTS | | | | | | | | | |
FINANCIAL ASSETS | | | | | | | | | | | | | | | | | | | |
AUSTRALIA | | | | | | | | | | | | | | | | | | | |
Cash | | - | | - | | - | | - | | - | | 124 | | - | | 124 | | 4.54 | |
Money market deposits | | - | | - | | - | | - | | - | | 1 536 400 | | - | | 1 536 400 | | 5.83 | |
Discount securities | | 5 598 006 | | 66 000 | | 30 000 | | - | | - | | - | | - | | 5 694 006 | | 5.94 | |
Commonwealth -and semi-government securities | | - | | - | | - | | 1 299 320 | | 1 142 000 | | - | | - | | 2 441 320 | | 6.02 | |
Floating rate notes | | | | | | | | | | | | 2 756 952 | | | | 2 756 952 | | 6.15 | |
Other investments | | 34 347 | | 145 500 | | 41 500 | | 830 000 | | - | | - | | - | | 1 051 347 | | 6.19 | |
Receivables | | - | | - | | - | | - | | - | | - | | 2 278 | | 2 278 | | # | |
Onlendings | | (1)724 674 | | 163 251 | | 316 892 | | 7 302 885 | | 12 773 228 | | - | | - | | 19 831 582 | | 6.11 | |
| | | |
Total financial assets | | 4 907 679 | | 374 751 | | 388 392 | | 9 432 205 | | 13 915 228 | | 4 293 476 | | 2 278 | | 33 314 009 | | | |
| | | |
| | | | | | | | | |
FINANCIAL LIABILITIES | | | | | | | | | | | | | | | | | | | |
AUSTRALIA | | | | | | | | | | | | | | | | | | | |
Deposits | | - | | - | | - | | - | | - | | (5 327 185) | | - | | (5 327 185) | | 5.91 | |
Payables | | - | | - | | - | | - | | - | | - | | (61 606) | | (61 606) | | # | |
Tax liabilities | | - | | - | | - | | - | | - | | - | | (13 162) | | (13 162) | | # | |
Bonds | | (98 735) | | (24 489) | | (160 868) | | (11 036 267) | | (4 298 623) | | - | | - | | (15 618 982) | | 5.94 | |
Credit foncier loans | | - | | - | | (25) | | (697) | | (3 093) | | - | | - | | (3 815) | | 6.00 | |
OVERSEAS | | | | | | | | | | | | | | | | | | | |
Commercial paper | | (93 975) | | (14 810) | | - | | - | | - | | - | | - | | (108 785) | | 5.51 | * |
Bonds | | - | | - | | - | | (6 739 740) | | (4 215 256) | | - | | - | | (10 954 996) | | 6.00 | |
Medium term notes | | - | | (200 359) | | (84 600) | | (128 900) | | (45 000) | | - | | - | | (458 859) | | 6.12 | * |
Total financial liabilities | | (192 710) | | (239 658) | | (245 493) | | (17 905 604) | | (8 561 972) | | (5 327 185) | | (74 768) | | (32 547 390) | | | |
DERIVATIVES | | | | | | | | | | | | | | | | | | | |
Futures | | (8 246 500) | | 6 800 000 | | 500 000 | | 1 009 200 | | (62 700) | | - | | - | | - | | # | |
Interest rate swaps | | (8 920 447) | | 675 000 | | 536 300 | | 7 614 212 | | 148 332 | | - | | - | | 53 398 | | # | |
Forward rate agreements | | 100 000 | | 200 000 | | (300 000) | | - | | - | | - | | - | | - | | # | |
Forward exchange contracts | | (2 275) | | (436) | | 26 | | 92 | | - | | - | | - | | (2 594) | | # | |
Cross currency swaps | | - | | - | | - | | - | | | | | | | | - | | - | |
| | | |
Total derivatives | | (17 069 222) | | 7 674 564 | | 736 326 | | 8 623 504 | | 85 632 | | - | | - | | 50 804 | | | |
| | | |
NET MISMATCH | | (12 354 253) | | 7 809 657 | | 879 225 | | 150 105 | | 5 437 809 | | 1 033 709 | | (72 490) | | 817 422 | | | |
| | | |
CUMULATIVE MISMATCH | | (12 354 253) | | (4 544 596) | | (3 515 266) | | (3 515 266) | | 1 923 621 | | 889 912 | | 817 422 | | | | | |
| | | |
| (1) | The balance of client offset deposits held exceeds the debt outstanding in the 0-3 months maturity group. |
| * | The weighted average rate for foreign currency denominated securities is the closing 30 June foreign currency interest rate for the particular security. All foreign currency borrowings and investments are hedged to Australian dollars through the use of forward exchange contracts and cross currency swaps resulting in a rate close to that achieved for similar instruments denominated in Australian dollars. |
62 QUEENSLAND TREASURY CORPORATION
23. FINANCIAL RISK MANAGEMENT (continued)
INTEREST RATE RISK AS AT 30 JUNE 2005
CONTRACTUAL REPRICING/MATURING DATE
| | | | | | | | | | | | | | | | | | | | | | | | | | | |
| | | FIXED INTEREST MATURING | | | FLOATING
INTEREST $ 000 | | | NON INTEREST
BEARING $
000 | | | TOTAL $ 000 | | | WEIGHTED AVERAGE
RATE % | |
| FINANCIAL INSTRUMENTS | | 0 TO 3
MONTHS $ 000 | | | 3 TO 6
MONTHS $ 000 | | | 6 TO 12
MONTHS $ 000 | | | 1 TO 5 YEARS $ 000 | | | OVER 5
YEARS $ 000 | | | | | |
FINANCIAL ASSETS | | | | | | | | | | | | | | | | | | | | | | | | | | | |
AUSTRALIA | | | | | | | | | | | | | | | | | | | | | | | | | | | |
Cash | | - | | | - | | | - | | | - | | | - | | | 56 | | | - | | | 56 | | | 5.39 | |
Money market deposits | | - | | | - | | | - | | | - | | | - | | | 454 137 | | | - | | | 454 137 | | | 5.61 | |
Discount securities | | 5 559 817 | | | 222 000 | | | 403 000 | | | 66 000 | | | - | | | - | | | - | | | 6 250 817 | | | 5.68 | |
Commonwealth and semi-government securities | | - | | | - | | | - | | | 404 229 | | | 1 110 505 | | | - | | | - | | | 1 514 734 | | | 5.36 | |
Floating rate notes | | - | | | - | | | - | | | - | | | - | | | 1 940 118 | | | - | | | 1 940 118 | | | 5.92 | |
Other investments | | 35 646 | | | - | | | 15 000 | | | 996 000 | | | - | | | - | | | - | | | 1 046 646 | | | 5.51 | |
Receivables | | - | | | - | | | - | | | - | | | - | | | - | | | 2 234 | | | 2 234 | | | # | |
Onlendings | | 56 244 | | | 211 894 | | | 498 831 | | | 6 383 072 | | | 11 755 580 | | | - | | | - | | | 18 905 621 | | | 5.61 | |
| | | |
Total financial assets | | 5 651 707 | | | 433 894 | | | 916 831 | | | 7 849 301 | | | 12 866 085 | | | 2 394 311 | | | 2 234 | | | 30 114 363 | | | | |
| | | |
| | | | | | | | | |
FINANCIAL LIABILITIES | | | | | | | | | | | | | | | | | | | | | | | | | | | |
AUSTRALIA | | | | | | | | | | | | | | | | | | | | | | | | | | | |
Deposits | | - | | | - | | | - | | | - | | | - | | | (5 219 749 | ) | | - | | | (5 219 749 | ) | | 5.64 | |
Payables | | - | | | - | | | - | | | - | | | - | | | - | | | (56 455 | ) | | (56 455 | ) | | # | |
Tax liabilities | | - | | | - | | | - | | | - | | | - | | | - | | | (11 577 | ) | | (11 577 | ) | | # | |
Floating rate notes | | - | | | - | | | - | | | - | | | - | | | - | | | - | | | - | | | - | |
Treasury notes | | (15 000 | ) | | (210 000 | ) | | (410 000 | ) | | - | | | - | | | - | | | - | | | (635 000 | ) | | 5.49 | |
Bonds | | (184 133 | ) | | (106 963 | ) | | (112 448 | ) | | (6 815 782 | ) | | (6 054 617 | ) | | - | | | - | | | (13 273 943 | ) | | 5.34 | |
Credit foncier loans | | (6 | ) | | - | | | (23 | ) | | (505 | ) | | (3 684 | ) | | - | | | - | | | (4 218 | ) | | 5.35 | |
OVERSEAS | | | | | | | | | | | | | | | | | | | | | | | | | | | |
Commercial paper | | (141 894 | ) | | - | | | - | | | - | | | - | | | - | | | - | | | (141 894 | ) | | 3.57 | * |
Bonds | | - | | | - | | | - | | | (4 529 391 | ) | | (4 316 457 | ) | | - | | | - | | | (8 845 848 | ) | | 5.33 | |
Medium term notes | | - | | | (66 204 | ) | | - | | | (476 519 | ) | | (45 000 | ) | | - | | | - | | | (587 723 | ) | | 5.61 | * |
| | | |
Total financial liabilities | | (341 033 | ) | | (383 167 | ) | | (522 471 | ) | | (11 822 197 | ) | | (10 419 758 | ) | | (5 219 749 | ) | | (68 032 | ) | | (28 776 407 | ) | | | |
| | | |
| | | | | | | | | |
DERIVATIVES | | | | | | | | | | | | | | | | | | | | | | | | | | | |
Futures | | (708 100 | ) | | (173 000 | ) | | 935 000 | | | (145 700 | ) | | 91 800 | | | - | | | - | | | - | | | # | |
Interest rate swaps | | (7 079 854 | ) | | (154 000 | ) | | 35 000 | | | 5 795 000 | | | 1 466 925 | | | - | | | - | | | 63 071 | | | # | |
Forward rate agreements | | - | | | - | | | - | | | - | | | - | | | - | | | - | | | - | | | # | |
Forward exchange contracts | | 393 | | | 15 | | | 30 | | | 166 | | | 4 | | | - | | | - | | | 608 | | | # | |
Cross currency swaps | | (17 224 | ) | | 18 104 | | | - | | | - | | | - | | | - | | | - | | | 880 | | | # | |
| | | |
Total derivatives | | (7 804 785 | ) | | (308 881 | ) | | 970 030 | | | 5 649 466 | | | 1 558 729 | | | - | | | - | | | 64 559 | | | | |
| | | |
NET MISMATCH | | (2 494 111 | ) | | (258 154 | ) | | 1 364 390 | | | 1 676 570 | | | 4 005 056 | | | (2 825 438 | ) | | (65 798 | ) | | 1 402 515 | | | | |
| | | |
CUMULATIVE MISMATCH | | (2 494 111 | ) | | (2 752 265 | ) | | (1 387 875 | ) | | 288 695 | | | 4 293 751 | | | 1 468 313 | | | 1 402 515 | | | | | | | |
| | | |
| * | The weighted average rate for foreign currency denominated securities is the closing 30 June foreign currency interest rate for the particular security. All foreign currency borrowings and investments are hedged to Australian dollars through the use of forward exchange contracts and cross currency swaps resulting in a rate close to that achieved for similar instruments denominated in Australian dollars. |
2005 - 2006 ANNUAL REPORT 63
Notes to and forming part of the Financial Statements
for the year ended 30 June 2006 (continued)
23. FINANCIAL RISK MANAGEMENT (continued)
(C) LIQUIDITY RISK
QTC maintains its domestic and global benchmark bonds as its core medium and long-term funding facilities and its euro-commercial paper facility and domestic treasury note facility as its core short-term funding facilities. QTC’s short-term investment facilities are structured to ensure maximum flexibility, ease of use and liquidity. QTC has an extensive range of funding facilities in place to prevent the possibility of not settling a transaction on the due date (refer note 32).
In addition, QTC borrows in advance of requirements
| | • | | to reduce the risk of refinancing maturing loans; and |
| | • | | to ensure Queensland public sector entities have ready access to funding when required. |
QTC also maintains sufficient liquidity to manage the duration of its debt portfolios.
(D) CREDIT RISK
QTC is exposed to credit risk. Impairment provisions are provided for losses that have been incurred at balance sheet date. Credit risk is constantly assessed, measured and managed in strict accordance with QTC’s Credit risk policies. Exposure to credit risk is managed through regular analysis of the ability of borrowers, potential borrowers, and financial market counterparties with respect to derivative instruments to meet interest and capital repayment obligations and by changing lending limits where appropriate.
Whilst QTC’s capital is not subject to regulatory oversight, QTC utilises a capital adequacy approach based on Basel II: International Convergence of Capital Measurements and Capital Standards to calculate and advise the Board of the amount of capital required to cover its credit risk.
Credit exposure is QTC’s estimate of its potential loss at balance date in relation to derivative contracts and investments in the event of non - performance by all counterparties. The credit exposure for derivative contracts is calculated utilising the value at risk methodology which takes into account the current market value, duration, term to maturity and interest rate and/or exchange rate volatility.
Excluding derivatives, the maximum credit risk exposure for each class of financial asset is represented by the carrying amounts of each class of asset (equal to the market value of investments at balance date, as disclosed in note 14). Credit risk exposures related to derivative financial instruments are listed below.
| | | | |
| | | CREDIT EXPOSURE |
| | | 2006 $000 | | 2005 $000 |
Interest rate swaps | | 284 382 | | 592 471 |
Forward rate agreements | | 700 | | 2 575 |
Forward exchange contracts | | 2 337 | | 23 917 |
Cross currency swaps | | - | | 3 219 |
Credit derivatives | | 5 034 | | 9 939 |
QTC has a significant concentration of credit risk within the finance and investment industry. This is unavoidable given the size of QTC’s investment portfolio and the requirement to invest with counterparties rated A- or better and to invest in highly liquid securities.
Counterparties for onlendings with the exception of very small exposures to Suncorp-Metway Limited, co-operative housing societies and primary producer co-operatives are principally Queensland Government sector entities and in some cases an explicit Government guarantee exists. There is a specific Queensland Government guarantee in place for the Suncorp-Metway Ltd loans. As a consequence, these exposures are not included in QTC’s total credit exposure.
QTC adopts a conservative approach to the management of credit risk with a strong bias to high quality counterparties. QTC maintains a ratings based approach in determining maximum credit exposures to counterparties. The country of domicile, the size of the balance sheet of the counterparty and the size of its fund raising programs are also taken into account when determining limits. Counterparty exposure by rating for all derivatives and investments is listed below.
| | | | |
| | | CREDIT EXPOSURE |
| RATING | | 2006 % | | 2005 % |
AAA | | 40 | | 47 |
AA+ | | 8 | | 8 |
AA | | 6 | | 3 |
AA- | | 36 | | 32 |
A+ | | 7 | | 6 |
A | | 3 | | 3 |
A- | | 0 | | 1 |
64 QUEENSLAND TREASURY CORPORATION
24. CONCENTRATIONS OF BORROWINGS AND DEPOSITS
There are no material concentrations of borrowings as these funds are raised from diversified sources through various facilities disclosed under funding facilities in note 32. Managed fund depositors are principally Queensland Government sector entities. These deposits are invested in either QTC’s Cash Fund or Working Capital Facility (11AM Fund) which have a large core of liquid investments. Deposits for Stock Lending and Repurchase Agreements are invested in the Working Capital Facility (11AM Fund) which can be liquidated daily at no cost.
25. CONTINGENT LIABILITIES
The following contingent liabilities existed at balance date:
| | • | | A total of $666 million (2005 $597 million) of Queensland Treasury Corporation inscribed stock was lent to various financial institutions. QTC lends stock on the basis that there is a simultaneous commitment by the other party to return the stock on an agreed date. These loans are made to support the liquidity of QTC bonds in the financial markets and form part of QTC’s total exposure to these financial institutions. Historically, the likelihood of a loss being incurred through default by a counterparty has been remote (refer note 27). |
| | • | | With regard to certain cross border lease transactions, QTC has assumed responsibility for a significant portion of the transaction risk. If certain events occur, QTC could be liable to make additional payments under the transactions. However external advice and history to date indicate the likelihood of these events occurring is remote. In addition, QTC has provided certain guarantees and indemnities to various participants in the cross border lease transactions. Expert external advisors consider, that unless exceptional and extreme circumstances arise, QTC will not be required to make a significant payment under these guarantees and indemnities. |
| | • | | To facilitate the merger of the former State owned financial institutions, Suncorp and QIDC with Metway Bank Ltd, QTC provided guarantees relating to certain obligations of the Queensland Government and Suncorp General Insurance Ltd. These guarantees are supported by counter indemnities from the Treasurer on behalf of the State of Queensland. |
| | • | | QTC has provided guarantees relating to the trading activities of Ergon Energy, Energex and CS Energy, Queensland Government owned corporations, and their subsidiaries, in the National Electricity Market to the value of $342.9 million (2005 $276.9 million) which are supported by counter indemnities from these Queensland Government owned corporations. |
| | • | | QTC has provided guarantees to the value of $123.4 million (2005 $72.6 million) to support the commercial activities of various Queensland public sector entities. In each case, a counter indemnity has been obtained by QTC from the appropriate public sector entity. |
| | • | | To provide support in relation to the sale by Tarong Energy Corporation Ltd of a 50% share in the Tarong North Power Station, QTC provided a guarantee of certain payment obligations of Tarong Energy Corporation Ltd under the transaction together with providing an irrevocable put option for 50% of the power station exercisable by the option holder under certain circumstances. This guarantee and put option are supported by an indemnity from Tarong Energy Corporation Ltd and an indemnity from the Treasurer for and on behalf of the State of Queensland. |
2005 - 2006 ANNUAL REPORT 65
Notes to and forming part
of the Financial Statements
for the year ended 30 June 2006 (continued)
26. COMMITMENTS
OPERATING LEASE COMMITMENTS – QTC AS LESSEE
QTC has entered into a commercial lease for the tenancy of 61 Mary Street, Brisbane for an initial term of ten years from 1 January 2003 to 31 December 2012, with an option to renew the lease after that date. Lease payments are increased to reflect market rentals.
QTC has entered into various motor vehicle lease agreements expiring within one to three years.
The future minimum rentals payable under non-cancellable operating leases are as follows:
| | | | |
| | | 30 JUNE 2006
$ 000 | | 30 JUNE 2005
$ 000 |
PAYABLE | | | | |
Not longer than 1 year | | 1 060 | | 1 034 |
Longer than 1 year but not longer than 5 years | | 3 776 | | 3 499 |
Longer than 5 years | | 1 407 | | 2 129 |
| | |
| | 6 243 | | 6 662 |
OPERATING LEASES – QTC AS LESSOR | | | | |
QTC has entered into operating leases as lessor under a whole of government lease facility which include information technology equipment, yellow goods and furniture and fittings. These non-cancellable leases have remaining terms of between 1 and 12 years. | | | | |
|
Future minimum rentals receivable under non-cancellable operating leases as at 30 June are as follows: |
RECEIVABLE | | | | |
Not longer than 1 year | | 7 303 | | 7 677 |
Longer than 1 year but not longer than 5 years | | 17 915 | | 23 391 |
Longer than 5 years | | 364 | | 2 200 |
| | |
| | 25 582 | | 33 268 |
FORWARD STARTING FIXED RATE LOANS | | | | |
| QTC has entered into fixed rate loan agreements with certain customers to lock in interest rates on all or part of future borrowing requirements. QTC’s future borrowing commitments and the period in which funds are to be on lent are as follows. | | | | |
Not longer than 1 year | | 891 798 | | 354 682 |
Longer than 1 year but not longer than 5 years | | 1 053 434 | | 631 049 |
Longer than 5 years | | - | | - |
| | |
| | 1 945 232 | | 985 731 |
| | |
OTHER OBLIGATIONS
At 30 June 2006, at the direction of the State Government, QTC holds a deposit of $32.131 million for the ultimate benefit of 18 local authorities in relation to the South East Queensland Regional Water Leakage and Pressure Management Project. In accordance with the arrangements, the funds are to be disbursed to these local authorities upon certain conditions being met. During the year the deposit earned interest of $162,754. In accordance with the arrangements for this Project, $160,140 has been paid to Local Government Infrastructure Services Pty Ltd (50% owned by QTC) for services provided and costs incurred with respect to the project.
27. STOCK LENDING
In support of an active trading and pricing market for QTC stock, QTC lends stock to various financial institutions. QTC’s stock lending policy ensures that all such transactions are covered by appropriate credit arrangements, credit limits, cash securities or the lodgement of collateral securities.
Stock lent which forms part of QTC’s exposure to a financial institution is reported as a contingent liability (refer note 25). In situations where the financial institution does not have an approved exposure or the limit of the exposure has been reached, the financial institution must either pledge stock which has a market value 10% greater than QTC stock, or deposit cash equivalent to the market value of QTC stock lent.
At 30 June 2006, there was no stock lent (2005 nil) in return for pledged stock whilst $352 million (2005 $102 million) of QTC stock was lent with cash held as security. Cash held was $358.459 million (2005 $109.250 million).
66 QUEENSLAND TREASURY CORPORATION
28. RELATED PARTY TRANSACTIONS
(A) ULTIMATE CONTROLLING ENTITY
The immediate controlling entity and ultimate Australian controlling entity during the year was the Under Treasurer of Queensland as the corporation sole of QTC. The next most senior parent entity which produces financial reports available for use is the State of Queensland.
(B) DIRECTORS AND SPECIFIED EXECUTIVES
Disclosures relating to directors and specified executives are set out in note 34.
29. INVESTMENTS ACCOUNTED FOR USING THE EQUITY METHOD
On 26 August 2005, QTC in conjunction with Local Government Association of Queensland formed Local Government Infrastructure Services Pty Ltd, each holding 50% of the share capital of the company.
| | | | | | | | | | | | |
| | | PRINCIPAL ACTIVITIES | | ORDINARY SHARE
OWNERSHIP INTEREST | | INVESTMENT
CARRYING AMOUNT |
| | | | | 2006 | | | 2005 | | 2006 | | | 2005 |
| Local Government | | Provides assistance to Queensland | | | | | | | | | | |
| Infrastructure Services Pty Ltd | | local governments in relation to infrastructure procurement | | 50 | % | | - | | 50 | % | | - |
| | | | | |
| RESULTS OF JOINT VENTURE ENTITY | | | | | | | | | | | | |
Summarised financial information of jointly controlled entity: | | | | | | | | | | |
| | | | | | | | | | 30 June 2006
$ 000 | | | 30 JUNE 2005
$ 000 |
INCOME STATEMENT | | | | | | | | | | | | |
Revenues | | | | | | | | | 547 | | | - |
Expenses | | | | | | | | | 374 | | | - |
Profit before income tax expense | | | | | | | | | 173 | | | - |
Income tax expense | | | | | | | | | - | | | - |
| | | | | | | | | |
NET PROFIT | | | | | | | | | 173 | | | - |
| | | | | | | | | |
| | | | | |
BALANCE SHEET | | | | | | | | | | | | |
Current assets | | | | | | | | | 33 031 | | | - |
Non-current assets | | | | | | | | | - | | | - |
| | | | | | | | | |
TOTAL ASSETS | | | | | | | | | 33 031 | | | - |
| | | | | | | | | |
Current liabilities | | | | | | | | | 358 | | | - |
Non-current liabilities | | | | | | | | | 32 300 | | | - |
| | | | | | | | | |
TOTAL LIABILITIES | | | | | | | | | 32 658 | | | - |
| | | | | | | | | |
NET ASSETS | | | | | | | | | 373 | | | - |
| | | | | | | | | |
| QTC’s share of the joint venture entity’s result and retained profits for the period ended 30 June 2006 , including movements in carrying amount of investment consists of: | | | | | | | | | | |
| | | | |
| SHARE OF POST-ACQUISITION RETAINED PROFITS | | | | | | | | | | |
Share of retained profits at beginning of period | | | | | | | - | | | - |
Share of net result | | | | | | | 85 | | | - |
Share of retained profits at end of period | | | | | | | 85 | | | - |
| | | | | | | | | |
| | | | |
MOVEMENTS IN CARRYING AMOUNT OF INVESTMENT | | | | | | | | | | |
Carrying amount at beginning of period | | | | | | | - | | | - |
Investments acquired during the period | | | | | | | 100 | | | - |
Share of net result | | | | | | | 85 | | | - |
| | | | | | | | | |
Carrying amount at end of period | | | | | | | 185 | | | - |
| | | | | | | | | |
2005 - 2006 ANNUAL REPORT 67
Notes to and forming part
of the Financial Statements
for the year ended 30 June 2006 (continued)
30. INVESTMENTS IN COMPANIES
Investments in the following companies are held at cost:
| | | | | | | | | | |
| NAME | | PRINCIPAL ACTIVITIES | | BENEFICIAL
INTEREST
2006 % | | VOTING
RIGHTS
2006 % | | BENEFICIAL
INTEREST
2005 % | | VOTING
RIGHTS
2005 % |
| Queensland Treasury | | Holding company for a number | | 40 | | 24 | | 40 | | 24 |
| Holdings Pty Ltd | | of subsidiaries and investments | | | | | | | | |
| DBCT Holdings Pty Ltd(1) | | Owns & leases bulk coal port facilities in North Queensland | | 20 | | 12 | | 20 | | 12 |
| South East Queensland Water | | Owns & operates bulk water storage | | 8 | | 4.8 | | 8 | | 4.8 |
| Corporation Limited(1) | | facility in South East Queensland | | | | | | | | |
| Sunshine Locos Pty Ltd | | Dormant | | 100 | | 100 | | 100 | | 100 |
| Sucette Pty Ltd(2) | | Deregistered | | 0 | | 0 | | 100 | | 100 |
| (1) | Beneficial interest and voting rights in the company are held indirectly through QTC’s holdings in Queensland Treasury Holdings Pty Ltd. |
| (2) | Sucette Pty Limited was deregistered on 31 March 2006. |
31. SEGMENT INFORMATION
QTC operates predominantly in the finance and investment industry through liability and fund management activities. Liability management activities relate to the borrowing of funds principally to finance the capital works programs of the State and the management of these borrowings so as to achieve the lowest cost to borrowers. The fund management activities of QTC relate to the investment of the short term surpluses of these bodies in order to achieve the highest possible return for a given level of risk.
QTC operates in Queensland, Australia.
32. FUNDING FACILITIES
| | | | | | |
| FACILITY | | LIMIT | | FACE VALUE ON ISSUE 30 JUNE 2006 $ M | | FACE
VALUE ON ISSUE 30 JUNE
2005 $ M |
Domestic Treasury Note | | UNLIMITED | | - | | A$635 |
Domestic A$ Bond | | UNLIMITED | | A$15 793 | | A$13 328 |
Global A$ Bond | | A$ 15 000M | | A$11 095 | | A$8 846 |
Multicurrency US Commercial Paper | | US$1 500M | | US $ 70 | | US$ 50 |
Multicurrency Euro Commercial Paper | | US$3 000M | | US $ 11 | | US$ 59 |
Multicurrency Euro Medium-Term Note | | US$3 000M | | US$ 459 | | US $ 360 |
Multicurrency US Medium-Term Note | | US $500M | | - | | - |
68 QUEENSLAND TREASURY CORPORATION
33. REMUNERATION OF OFFICERS
(A) REMUNERATION OF BOARD AND COMMITTEE MEMBERS
Details of the nature and amount of each major element of the remuneration of the Board Members are:
| | | | | | | | | | | | |
| | | SALARY & FEES | | OTHER BENEFITS | | TOTAL |
| | | 2006 | | 2005 | | 2006 | | 2005 | | 2006 | | 2005 |
Sir Leo Hielscher | | 88 106 | | 85 302 | | 9 480 | | 8 064 | | 97 586 | | 93 366 |
Gerard Bradley* | | 36 048 | | 34 900 | | - | | - | | 36 048 | | 34 900 |
Marian Micalizzi | | 36 027 | | 34 881 | | - | | - | | 36 027 | | 34 881 |
Shauna Tomkins | | 34 676 | | 33 573 | | - | | - | | 34 676 | | 33 573 |
Bill Shields | | 31 813 | | 30 800 | | - | | - | | 31 813 | | 30 800 |
Gillian Brown | | 30 060 | | 29 104 | | - | | - | | 30 060 | | 29 104 |
David Coe | | 30 060 | | 29 104 | | - | | - | | 30 060 | | 29 104 |
Other benefits include reimbursement of telephone expenses and the provision of a car park. The Chairman also has access to an office and secretarial support.
| * | Remuneration is paid to Queensland Treasury and remitted to the Consolidated Fund. |
(B) REMUNERATION OF EXECUTIVE OFFICERS
Executive Officers are those officers who are members of the Organisation Management Team involved in the strategic direction, general management or control of the business at an organisational level.
Details of the nature and amount of each major element of the remuneration of the Executive Officers are:
| | | | | | | | | | | | |
| | | SALARY & FEES | | OTHER BENEFITS | | TOTAL |
| | | 2006 | | 2005 | | 2006 | | 2005 | | 2006 | | 2005 |
Chief Executive | | 467 125 | | 445 534 | | 12 007 | | 9 010 | | 479 132 | | 454 544 |
General Manager – Financial Markets | | 315 120 | | 298 604 | | 4 505 | | 5 767 | | 319 625 | | 304 371 |
General Manager | | 240 380 | | 228 223 | | 7 663 | | 6 832 | | 248 043 | | 235 055 |
General Manager | | 237 350 | | 227 521 | | 8 299 | | 7 338 | | 245 649 | | 234 859 |
General Manager | | 194 930 | | 186 767 | | 7 096 | | 7 565 | | 202 026 | | 194 332 |
Executive Officers’ salary and fees include salary, superannuation and salary sacrificed benefits but exclude any at-risk performance payments for which they may be eligible and changes in annual leave entitlements. Other benefits include reimbursement of telephone expenses and motor vehicle costs.
(C) AGGREGATE AT-RISK PERFORMANCE INCENTIVE REMUNERATION
| | | | |
| | | YEAR OF ASSESSMENT |
| | | 2006 | | 2005 |
Aggregate at-risk performance incentive remuneration | | 1 515 247 | | 1 425 132 |
| | |
Aggregate remuneration (including at-risk performance incentive remuneration) paid to employees to whom a performance payment was paid | | 12 258 335 | | 11 790 269 |
| | |
Number of employees to whom a performance payment was paid | | 115 | | 118 |
2005 - 2006 ANNUAL REPORT 69
Notes to and forming part of the Financial Statements
for the year ended 30 June 2006 (continued)
34. OTHER DIRECTOR AND EXECUTIVE DISCLOSURES
TRANSACTIONS
Directors and executives held directorships with the following entities with which QTC conducted commercial transactions during the year. These transactions included the provision of investment, advisory, banking and company secretarial services and were in the normal course of business and on commercial terms and conditions.
| • | | Queensland Health of which Sir Leo Hielscher is Chairman of the Queensland Health Reform Advisory Panel |
| • | | Queensland Treasury of which Gerard Bradley is Under Treasurer |
| • | | QSuper of which Gerard Bradley is Chairman of the Board of Trustees |
| • | | Queensland Investment Corporation of which Marian Micalizzi is a Director |
| • | | Enertrade of which Marian Micalizzi was a Director |
| • | | Allco Finance Group Limited of which David Coe is Executive Chairman |
| • | | Minter Ellison of which Gillian Brown is a Partner |
| • | | DBCT Holdings Pty Ltd of which Gillian Brown is a Director |
| • | | Queensland Treasury Holdings Pty Ltd, an entity in which QTC has an investment interest, of which Gerard Bradley, Stephen Rochester, QTC’s Chief Executive, and Neil Castles, General Manager Credit and Procurement Risk, are Directors |
| • | | Sunshine Locos Pty Ltd, a controlled entity of QTC, of which Stephen Rochester is a Director |
| • | | Sucette Pty Ltd, a controlled entity of QTC, of which Stephen Rochester, Neil Castles and Graeme Garrett, General Manager Corporate Services are Directors |
| • | | SGH Ltd of which Gerard Bradley, Stephen Rochester and Neil Castles are Directors |
| • | | Sun Retail Pty Ltd to which Stephen Rochester is seconded (from QTC) as Chief Executive until the sale of Sun Retail Pty Ltd is concluded |
| • | | Local Government Infrastructure Services Pty Ltd of which Stephen Rochester is a Director and Neil Castles is the alternate |
| • | | Islander Board of Industry and Service of which Neil Castles is a Director |
70 QUEENSLAND TREASURY CORPORATION
Certificate of the Queensland Treasury Corporation
The foregoing general purpose financial statements have been prepared pursuant to the provisions of the Financial Administration and Audit Act 1977 and other prescribed requirements.
We certify that in our opinion:
| | (i) | the prescribed requirements for establishing and keeping the accounts have been complied with in all material respects, and |
| | (ii) | the foregoing annual financial statements have been drawn up so as to present a true and fair view, in accordance with prescribed accounting standards, of the transactions of the Queensland Treasury Corporation for the period 1 July 2005 to 30 June 2006 and of the financial position as at the close of that year. |
| | |
 | |  |
| |
G P BRADLEY Queensland Treasury Corporation | | S R ROCHESTER Chief Executive |
Brisbane
10 August 2006
2005 - 2006 ANNUAL REPORT 71
Independent Audit Report to Queensland Treasury Corporation
SCOPE
THE FINANCIAL REPORT
The financial report of Queensland Treasury Corporation consists of the income statement, balance sheet, statement of changes in equity, statement of cash flows, notes to and forming part of the financial statements and certificates given by the Under Treasurer-Queensland Treasury as the corporation sole, and Chief Executive for the year ended 30 June 2006.
THE CORPORATION SOLE’S RESPONSIBILITY
The corporation sole is responsible for the preparation and true and fair presentation of the financial report, the maintenance of adequate accounting records and internal controls that are designed to prevent and detect fraud and error, and for the accounting policies and accounting estimates inherent in the financial report.
AUDIT APPROACH
As required by law, an independent audit was conducted in accordance with QAO Auditing Standards to enable me to provide an independent opinion whether in all material respects the financial report is presented fairly, in accordance with the prescribed requirements, including any mandatory financial reporting requirements as approved by the Treasurer for application in Queensland.
Audit procedures included;
| • | | examining information on a test/sample basis to provide evidence supporting the amounts and disclosures in the financial report; |
| • | | assessing the appropriateness of the accounting policies and disclosures used and the reasonableness of significant accounting estimates made by the Corporation; |
| • | | obtaining written confirmation regarding the material representations made in conjunction with the audit; and |
| • | | reviewing the overall presentation of information in the financial report. |
INDEPENDENCE
The Financial Administration and Audit Act 1977 promotes the independence of the Auditor-General and QAO authorised auditors.
The Auditor-General is the auditor of all public sector entities and can only be removed by Parliament.
The Auditor-General may conduct an audit in any way considered appropriate and is not subject to direction by any person about the way in which powers are to be exercised.
The Auditor-General has for the purposes of conducting an audit, access to all documents and property and can report to Parliament matters which in the Auditor-General’s opinion are significant.
AUDIT OPINION
In accordance with section 46G of the Financial Administration and Audit Act 1977
| (a) | I have received all the information and explanations which I have required; and |
| | (i) | the prescribed requirements in respect of the establishment and keeping of accounts have been complied with in all material respects; and |
| | (ii) | the statements have been drawn up so as to present a true and fair view, in accordance with the prescribed accounting standards of the transactions of the Queensland Treasury Corporation for the financial year 1 July 2005 to 30 June 2006 and of the financial position as at the end of that year. |
| | |
 | | |
G G POOLE, FCPA Auditor General of Queensland | | QUEENSLAND AUDIT OFFICE |
72 QUEENSLAND TREASURY CORPORATION
Appendix A: QTC loans to customers
| | | | | | | | |
| LOANS TO CUSTOMERS | | TOTAL DEBT
OUTSTANDING
(MARKET VALUE)
30 JUNE 2005 $ 000 | | TOTAL DEBT
OUTSTANDING
(MARKET VALUE)
30 JUNE 2006 $ 000 | | AVERAGE
EXPECTED
TERM (YRS)*
30 JUNE 2005 | | AVERAGE
EXPECTED
TERM (YRS)*
30 JUNE 2006 |
BODIES WITHIN THE PUBLIC ACCOUNTS | | | | | | | | |
| | | | |
Arts Queensland | | 10,414 | | 9,543 | | 5.29 | | N/A |
CITEC | | 5,924 | | 4,930 | | 2.28 | | N/A |
Corptech | | 987 | | 354 | | 1.58 | | 0.96 |
Department of Aboriginal & Torres Strait Islander Policy | | 136 | | 69 | | 1.96 | | 0.96 |
Department of Education and the Arts | | 110,966 | | 91,770 | | 6.42 | | 5.61 |
Department of Emergency Services | | 5,779 | | 4,591 | | 4.69 | | 3.84 |
Department of Employment and Training | | 5,603 | | 3,191 | | 2.32 | | 1.40 |
Department of Justice and Attorney General | | 124,068 | | 94,010 | | N/A | | N/A |
Department of Main Roads | | 938,281 | | 862,694 | | 10.35 | | 9.41 |
Department of Primary Industries - Forestry | | 82,238 | | 79,094 | | N/A | | N/A |
Department of Public Works - Administrative Services | | 226,673 | | 207,604 | | N/A | | N/A |
Department of Public Works - GoPrint | | 2,328 | | 2,251 | | N/A | | N/A |
Department of Public Works - Q-Fleet | | 299,647 | | 274,870 | | N/A | | N/A |
Department of State Development and Innovation | | 354,264 | | 158,916 | | N/A | | 8.34 |
Department of the Premier and Cabinet | | 12,044 | | 28,727 | | 3.63 | | N/A |
Monte Carlo Caravan Park Pty Ltd | | 816 | | 655 | | 4.75 | | 3.75 |
Queensland Ambulance Service | | 4,156 | | 3,191 | | 4.04 | | 3.04 |
Queensland Audit Office | | 427 | | 242 | | 2.21 | | 1.21 |
Queensland Fire and Rescue Authority | | 6,404 | | 4,879 | | 7.42 | | 7.74 |
Queensland Health | | 493,323 | | 26,953 | | 10.94 | | N/A |
Queensland Transport | | 84,727 | | 64,996 | | 7.22 | | 7.19 |
Sales and Distribution Services | | 426 | | 139 | | 1.44 | | 0.43 |
TOTAL | | 2,769,630 | | 1,923,668 | | | | |
| | | | |
COOPERATIVE HOUSING SOCIETIES | | | | | | | | |
Cooperative Housing Societies | | 14,880 | | 8,346 | | N/A | | N/A |
TOTAL | | 14,880 | | 8,346 | | | | |
| | | | |
GOVERNMENT OWNED CORPORATIONS | | | | | | | | |
CS Energy Mica Creek Pty Ltd | | 116,926 | | - | | 6.85 | | - |
Cairns Port Authority | | 80,315 | | 109,365 | | N/A | | N/A |
Central Queensland Port Authority | | 144,347 | | 204,966 | | N/A | | N/A |
CS Energy Ltd | | 369,117 | | 586,107 | | N/A | | N/A |
Energex Limited | | 2,060,798 | | 2,564,875 | | N/A | | N/A |
Ergon Energy Corporation Limited | | 1,774,029 | | 2,143,440 | | N/A | | N/A |
Eungella Water Pipeline Pty Ltd | | - | | 2,980 | | - | | N/A |
Gateway Investments Corporation Pty Ltd | | 315,875 | | 304,222 | | N/A | | N/A |
Port of Brisbane Corporation | | 179,375 | | 274,226 | | N/A | | N/A |
Queensland Electricity Transmission Corporation Ltd | | 1,476,259 | | 1,642,072 | | N/A | | N/A |
(Powerlink) | | | | | | | | |
Queensland Rail | | 4,015,537 | | 4,587,232 | | N/A | | N/A |
Stanwell Corporation Limited | | 208,819 | | 117,759 | | N/A | | N/A |
SunWater | | 7,688 | | 87,891 | | 5.99 | | N/A |
Tarong Energy Corporation Limited | | 255,419 | | 265,488 | | 10.96 | | 9.93 |
Townsville Port Authority | | 15,844 | | 13,309 | | 6.06 | | 5.03 |
TOTAL | | 11,020,349 | | 12,903,933 | | | | |
2005 - 2006 ANNUAL REPORT A1
Appendix A: QTC loans to customers (continued)
| | | | | | | | |
| LOANS TO CUSTOMERS | | TOTAL DEBT
OUTSTANDING
(MARKET VALUE)
30 JUNE 2005 $ 000 | | TOTAL DEBT
OUTSTANDING
(MARKET VALUE)
30 JUNE 2006 $ 000 | | AVERAGE
EXPECTED
TERM (YRS)*
30 JUNE 2005 | | AVERAGE
EXPECTED
TERM (YRS)*
30 JUNE 2006 |
LOCAL GOVERNMENTS | | | | | | | | |
Aramac Shire Council | | 46 | | 38 | | 5.43 | | 4.41 |
Atherton Shire Council | | 1,349 | | 1,031 | | 4.90 | | 4.33 |
Balonne Shire Council | | 4,030 | | 3,481 | | 10.76 | | 10.07 |
Banana Shire Council | | 2,673 | | 2,144 | | 6.53 | | 5.87 |
Barcaldine Shire Council | | 836 | | 739 | | 9.53 | | 8.54 |
Barcoo Shire Council | | 166 | | 647 | | 9.91 | | 3.08 |
Bauhinia Shire Council | | 340 | | 310 | | 12.68 | | 11.63 |
Beaudesert Shire Council | | 9,248 | | 13,851 | | 8.88 | | 8.47 |
Blackall Shire Council | | 1,420 | | 1,147 | | 9.79 | | 8.36 |
Boonah Shire Council | | 2,742 | | 3,426 | | 14.67 | | 15.75 |
Bowen Shire Council | | 10,531 | | 8,563 | | 6.31 | | 5.56 |
Brisbane City Council | | 1,021,948 | | 938,448 | | 13.95 | | 13.96 |
Bulloo Shire Council | | 693 | | 478 | | 3.11 | | 2.11 |
Bundaberg City Council | | 13,385 | | 14,747 | | 2.23 | | 3.83 |
Bungil Shire Council | | 1,914 | | 2,304 | | 9.23 | | 7.18 |
Burdekin Shire Council | | 14,487 | | 11,889 | | 6.97 | | 6.23 |
Burnett Shire Council | | 18,988 | | 15,777 | | 12.20 | | 12.31 |
Caboolture Shire Council | | 21,960 | | 19,117 | | 8.34 | | 7.47 |
Cairns City Council | | 78,602 | | 71,921 | | 4.69 | | 5.96 |
Calliope Shire Council | | 4,366 | | 3,995 | | 13.74 | | 12.71 |
Caloundra City Council | | 91,124 | | 95,396 | | 12.34 | | 11.82 |
Caloundra/Maroochy Water Supply Board | | 22,631 | | 32,468 | | 15.70 | | 17.51 |
Cambooya Shire Council | | 191 | | 131 | | 3.15 | | 2.19 |
Cardwell Shire Council | | 12,289 | | 10,863 | | 11.89 | | 12.89 |
Carpentaria Shire Council | | 1,988 | | 1,730 | | 11.12 | | 10.48 |
Chinchilla Shire Council | | 2,872 | | 2,628 | | 13.89 | | 12.86 |
Clifton Shire Council | | 254 | | 230 | | 13.28 | | 12.24 |
Cloncurry Shire Council | | 7,300 | | 4,078 | | 4.00 | | 4.60 |
Cook Shire Council | | 2,759 | | 3,736 | | 18.11 | | 18.08 |
Cooloola Shire Council | | 6,484 | | 5,440 | | 7.71 | | 6.96 |
Crows Nest Shire Council | | 4,100 | | 3,528 | | 8.54 | | 7.65 |
Dalby Wambo Library Board | | 30 | | 24 | | 5.00 | | 3.99 |
Dalby Wambo Salesyard Board | | 249 | | 231 | | 18.23 | | 17.36 |
Dalrymple Shire Council | | 1,372 | | 1,077 | | 7.10 | | 6.81 |
Diamantina Shire Council | | 470 | | 1,194 | | 17.30 | | 12.03 |
Douglas Shire Council | | 9,051 | | 6,245 | | 3.18 | | 2.21 |
Duaringa Shire Council | | 1,548 | | 1,300 | | 6.11 | | 5.11 |
Eacham Shire Council | | 1,725 | | 1,704 | | 9.80 | | 9.07 |
Emerald Shire Council | | 1,284 | | 2,538 | | 5.90 | | 7.95 |
Emerald/Peak Downs Saleyards Board | | 218 | | 191 | | 8.07 | | 7.05 |
Esk Shire Council | | 4,570 | | 3,586 | | 5.35 | | 4.57 |
Esk, Gatton & Laidley Water Board | | 3 | | - | | 0.08 | | - |
Etheridge Shire Council | | 440 | | 546 | | 13.66 | | 14.40 |
Fitzroy Shire Council | | 3,572 | | 2,649 | | 7.54 | | 7.76 |
Gatton Shire Council | | 4,951 | | 4,000 | | 6.78 | | 6.14 |
Gayndah Shire Council | | 516 | | 363 | | 6.67 | | 6.99 |
A2 QUEENSLAND TREASURY CORPORATION
Appendix A: QTC loans to customers (continued)
| | | | | | | | |
| LOANS TO CUSTOMERS | | TOTAL DEBT
OUTSTANDING
(MARKET VALUE)
30 JUNE 2005 $000 | | TOTAL DEBT
OUTSTANDING
(MARKET VALUE)
30 JUNE 2006
$000 | | AVERAGE
EXPECTED
TERM (YRS)*
30 JUNE 2005 | | AVERAGE
EXPECTED
TERM (YRS)*
30 JUNE 2006 |
Gladstone Calliope Aerodrome Board | | 891 | | 698 | | 4.52 | | 3.55 |
Gladstone City Council | | 19,276 | | 18,544 | | 8.95 | | 9.97 |
Gold Coast City Council | | 392,964 | | 404,014 | | 8.39 | | 9.19 |
Goondiwindi Town Council | | 2,620 | | 1,985 | | 4.94 | | 4.24 |
Herberton Shire Council | | 189 | | 127 | | 2.90 | | 1.89 |
Hervey Bay City Council | | 56,201 | | 57,053 | | 14.31 | | 14.26 |
Hinchinbrook Shire Council | | 365 | | - | | 0.18 | | - |
Inglewood Shire Council | | 114 | | 95 | | 6.48 | | 5.56 |
Ipswich City Council | | 103,857 | | 97,409 | | N/A | | N/A |
Isis Shire Council | | 9,827 | | 9,056 | | 18.78 | | 17.87 |
Jericho Shire Council | | 294 | | 105 | | 2.19 | | 1.32 |
Johnstone Shire Council | | 15,148 | | 13,561 | | 8.11 | | 8.04 |
Jondaryan Shire Council | | 5,333 | | 6,377 | | 12.99 | | 14.50 |
Kilcoy Shire Council | | 627 | | 487 | | 11.13 | | 11.92 |
Kingaroy Shire Council | | 4,567 | | 5,364 | | 13.21 | | 13.70 |
Kolan Shire Council | | 1,529 | | 1,359 | | 10.52 | | 9.91 |
Laidley Shire Council | | 4,678 | | 4,839 | | 5.84 | | 11.44 |
Livingstone Shire Council | | 22,325 | | 28,703 | | 12.72 | | 12.90 |
Logan City Council | | 90,867 | | 85,068 | | 7.90 | | 8.57 |
Longreach Shire Council | | 1,743 | | 1,510 | | 15.46 | | 15.55 |
Mackay City Council | | 57,526 | | 56,813 | | 13.34 | | 12.77 |
Mareeba Shire Council | | 10,798 | | 9,008 | | 8.07 | | 7.44 |
Maroochy Shire Council | | 150,740 | | 150,546 | | 6.27 | | 5.71 |
Maryborough City Council | | 14,428 | | 16,409 | | 8.85 | | 13.62 |
McKinlay Shire Council | | 739 | | 667 | | 12.03 | | 11.02 |
Mirani Shire Council | | 3,485 | | 3,076 | | 13.10 | | 12.47 |
Miriam Vale Shire Council | | 4,265 | | 3,542 | | 12.32 | | 12.42 |
Monto Shire Council | | 311 | | 1,056 | | 4.17 | | 11.41 |
Mount Morgan Shire Council | | 789 | | 715 | | 15.29 | | 14.65 |
Mount Isa City Council | | 4,761 | | 3,851 | | 4.96 | | 3.95 |
Mundubbera Shire Council | | 68 | | 25 | | 1.52 | | 0.52 |
Murgon Shire Council | | 90 | | 59 | | 2.84 | | 1.83 |
Murweh Shire Council | | 2,991 | | 2,728 | | 13.80 | | 12.80 |
Nanango Shire Council | | 1,507 | | 1,387 | | 16.48 | | 15.67 |
Noosa Shire Council | | 38,276 | | 41,170 | | N/A | | 11.00 |
Paroo Shire Council | | 1,707 | | 2,717 | | 16.46 | | 17.90 |
Pine Rivers Shire Council | | 79,122 | | 65,861 | | 6.69 | | 5.80 |
Pittsworth Shire Council | | - | | 802 | | - | | 19.88 |
Redcliffe City Council | | 14,431 | | 14,449 | | 6.71 | | 6.25 |
Redland Shire Council | | 115,530 | | 121,320 | | 9.25 | | 9.96 |
Richmond Shire Council | | 11 | | 13 | | 3.73 | | 2.81 |
Rockhampton City Council | | 48,102 | | 48,662 | | 11.75 | | 11.50 |
Rockhampton District Saleyards Board | | 2,180 | | 1,964 | | 16.32 | | 15.79 |
Roma Town Council | | 2,340 | | 3,147 | | 7.18 | | 9.15 |
Roma-Bungil Showgrounds & Saleyards Board | | 479 | | 405 | | 6.35 | | 5.33 |
Rosalie Shire Council | | 4,087 | | 6,308 | | 15.01 | | 15.93 |
Sarina Shire Council | | 8,360 | | 6,826 | | 5.44 | | 4.39 |
Seisa Island Council | | 657 | | 553 | | 6.09 | | 5.06 |
2005 - 2006 ANNUAL REPORT A3
Appendix A: QTC loans to customers (continued)
| | | | | | | | |
| LOANS TO CUSTOMERS | | TOTAL DEBT
OUTSTANDING
(MARKET VALUE)
30 JUNE 2005 $ 000 | | TOTAL DEBT
OUTSTANDING
(MARKET VALUE)
30 JUNE 2006 $ 000 | | AVERAGE
EXPECTED
TERM (YRS)*
30 JUNE 2005 | | AVERAGE
EXPECTED
TERM (YRS)*
30 JUNE 2006 |
Stanthorpe Shire Council | | 1,918 | | 1,680 | | 13.42 | | 12.96 |
Tiaro Shire Council | | 269 | | 206 | | 5.78 | | 5.24 |
Toowoomba City Council | | 50,586 | | 67,550 | | 12.38 | | 14.22 |
Torres Shire Council | | 2,524 | | 2,272 | | 11.03 | | 9.81 |
Townsville City Council | | 6,565 | | 10,744 | | 8.09 | | 7.47 |
Warwick Shire Council | | 6,340 | | 7,029 | | 13.60 | | 14.05 |
Whitsunday Shire Council | | 17,226 | | 24,585 | | 6.78 | | 7.04 |
Winton Shire Council | | 759 | | 2,525 | | 7.06 | | 16.91 |
Wondai Shire Council | | 2,118 | | 1,976 | | 8.82 | | 7.94 |
TOTAL | | 2,781,219 | | 2,718,928 | | | | |
| | | | |
STATUTORY BODIES | | | | | | | | |
DRAINAGE BOARDS | | | | | | | | |
East Deeral Drainage Board | | 42 | | 34 | | 5.02 | | 4.01 |
Eugun Bore Water Authority | | 323 | | 280 | | 7.46 | | 6.45 |
Matthews Road Drainage Board | | 46 | | 41 | | 10.20 | | 9.18 |
South Maroochy Drainage Board | | 10 | | - | | 3.48 | | - |
GRAMMAR SCHOOLS | | | | | | | | |
Brisbane Girls Grammar School | | 5,143 | | 26,652 | | 5.17 | | 12.78 |
Brisbane Grammar School | | 13,647 | | 11,434 | | 6.23 | | 5.30 |
Ipswich Girls Grammar School | | 1,713 | | 1,544 | | 10.47 | | 9.47 |
Ipswich Grammar School | | 4,418 | | 3,901 | | 8.72 | | 7.68 |
Rockhampton Girls Grammar School | | 4,420 | | 4,096 | | 17.83 | | 16.93 |
Rockhampton Grammar School | | 4,894 | | 4,215 | | 10.97 | | 10.39 |
Toowoomba Grammar School | | 2,448 | | 1,774 | | 4.60 | | 3.68 |
Townsville Grammar School | | 12,969 | | 11,705 | | 14.10 | | 13.41 |
RIVER IMPROVEMENT TRUSTS | | | | | | | | |
Pioneer River Improvement Trust | | 723 | | 634 | | 8.26 | | 7.23 |
UNIVERSITIES | | | | | | | | |
Griffith University | | 71,776 | | 82,449 | | 8.30 | | 7.99 |
James Cook University | | 15,596 | | 18,556 | | 16.29 | | 14.97 |
Sunshine Coast University | | 5,850 | | 28,891 | | 5.69 | | 14.51 |
WATER BOARDS | | | | | | | | |
Avondale Water Board | | 753 | | 662 | | 8.36 | | 7.32 |
Crowley Vale Water Board | | 13 | | - | | 0.27 | | - |
Gladstone Area Water Board | | 125,059 | | 113,180 | | N/A | | N/A |
Glamorgan Vale Water Board | | 90 | | 127 | | 4.91 | | 8.67 |
Grevillea Water Board | | 11 | | 6 | | 1.98 | | 0.98 |
Kelsey Creek Water Board | | 1,848 | | 1,656 | | 9.89 | | 8.87 |
Merlwood Water Board | | 94 | | 62 | | 2.83 | | 1.82 |
North Burdekin Water Board | | 1,035 | | 647 | | 2.89 | | 2.07 |
Pioneer Valley Water Board | | 5,527 | | 4,914 | | 9.54 | | 8.50 |
Riversdale Murray Valley Water Management Board | | 1,102 | | 1,002 | | 12.53 | | 11.47 |
Six Mile Creek Water Board | | 84 | | 64 | | 4.11 | | 3.11 |
A4 QUEENSLAND TREASURY CORPORATION
Appendix A: QTC loans to customers (continued)
| | | | | | | | |
| LOANS TO CUSTOMERS | | TOTAL DEBT
OUTSTANDING
(MARKET VALUE)
30 JUNE 2005 $ 000 | | TOTAL DEBT
OUTSTANDING
(MARKET VALUE)
30 JUNE 2006 $ 000 | | AVERAGE
EXPECTED
TERM (YRS)*
30 JUNE
2005 | | AVERAGE
EXPECTED
TERM
(YRS)* 30
JUNE
2006 |
WATER SUPPLY BOARDS | | | | | | | | |
Bollon South Water Authority | | 951 | | 873 | | 14.47 | | 13.47 |
Bollon West Water Authority | | - | | 235 | | - | | 14.69 |
Callandoon Water Supply Board | | 151 | | - | | 0.78 | | - |
Ingie Water Authority | | - | | 450 | | - | | 14.47 |
Kaywanna Bore Water Supply Board | | 16 | | - | | 0.46 | | - |
Townsville Thuringowa Water Supply Board | | 79,855 | | 84,549 | | N/A | | 15.83 |
OTHER STATUTORY BODIES | | | | | | | | |
Agricultural Colleges | | 5,185 | | 3,949 | | 4.32 | | 3.41 |
Cherbourg Aboriginal Council | | 525 | | 383 | | 3.54 | | 2.53 |
Island Coordinating Council | | 838 | | 752 | | 14.68 | | 14.00 |
Major Sports Facilities Authority | | 291,666 | | 304,103 | | N/A | | N/A |
Mt Gravatt Showgrounds Trust | | 72 | | 58 | | 4.68 | | 3.68 |
Queensland Art Gallery | | 177 | | 35 | | 1.19 | | 0.34 |
Queensland Rural Adjustments Authority | | 6,760 | | 5,764 | | 6.57 | | 5.55 |
Queensland Studies Authority | | 1,594 | | 3,900 | | 9.74 | | 9.44 |
Queensland Tourist and Travel Corporation | | 378 | | - | | 0.86 | | - |
South Bank Corporation | | 36,683 | | 34,718 | | N/A | | N/A |
State Library of Queensland | | 533 | | 404 | | 3.92 | | 2.91 |
TOTAL | | 705,015 | | 758,701 | | | | |
| | | | |
SOUTH EAST QUEENSLAND WATER CORPORATION | | | | | | | | |
SEQWater Facility | | 206,496 | | 198,361 | | N/A | | N/A |
TOTAL | | 206,496 | | 198,361 | | | | |
| | | | |
SUNCORP-METWAY LTD | | | | | | | | |
Suncorp Metway Facility | | 3,719 | | 3,199 | | 9.24 | | 8.55 |
TOTAL | | 3,719 | | 3,199 | | | | |
| | | | |
TOLLWAY COMPANY | | | | | | | | |
Queensland Motorways Limited | | 982,521 | | 932,371 | | N/A | | N/A |
TOTAL | | 982,521 | | 932,371 | | | | |
| | | | |
QTC RELATED ENTITIES | | | | | | | | |
DBCT Holdings Pty Ltd | | 413,832 | | 372,896 | | N/A | | N/A |
TOTAL | | 413,832 | | 372,896 | | | | |
| | | | |
OTHER BODIES | | | | | | | | |
Agricultural Cooperative Societies | | 508 | | 402 | | 2.00 | | 1.00 |
Aviation Australia Pty Ltd | | - | | 3,004 | | - | | N/A |
Department of Education and the Arts - State Schools | | 120 | | 255 | | 1.31 | | 2.57 |
Parents and Citizens Associations | | 7,333 | | 7,520 | | 6.79 | | 6.41 |
TOTAL | | 7,961 | | 11,180 | | | | |
GRAND TOTAL | | 18,905,621 | | 19,831,583 | | | | |
Total Debt Outstanding includes Fixed Rate Loans, Operating Leases and Debenture Assets held by QTC (previously recorded as Investments).
The balance of customers’ offset deposits held in various pools is offset against customers’ debt outstanding.
Working Capital Accounts and unsettled Operating Leases are not included.
| * | Average Expected Term - only includes standard principal and interest accounts |
| | - ignores temporary funding and debt offset facility |
| | - is not applicable for any non-standard principal and interest accounts |
2005 - 2006 ANNUAL REPORT A5
Appendix B: Partners in Financial Markets 30 June 2006
Actual dealer entities may vary depending on the facility and location of the dealer.
Fixed Interest Distribution Group
| | |
| |
AUSTRALIA AND NEW ZEALAND BANKING
GROUP LTD | | TELEPHONE |
Domestic (Australia) | | +61 2 9226 6706 |
Global (London) | | +44 207 378 2378 |
| |
| ABN AMRO BANK NV | | TELEPHONE |
Domestic (Australia) | | +61 2 8259 2200 |
Global (London) | | +44 207 678 3565 |
| |
| CITIGROUP GLOBAL MARKETS AUSTRALIA LTD | | TELEPHONE |
Domestic (Australia) | | +61 2 8225 6046 |
Global (London) | | +44 207 986 9070 |
| |
| COMMONWEALTH BANK OF AUSTRALIA | | TELEPHONE |
Domestic (Australia) | | +61 2 9235 0122 |
Global (London) | | +44 207 329 6444 |
| |
| DEUTSCHE CAPITAL MARKETS AUSTRALIA1 | | TELEPHONE |
Domestic (Australia) | | +61 2 9258 1444 |
Global (London) | | +44 207 547 1931 |
| |
| MACQUARIE BANK LTD | | TELEPHONE |
Domestic (Australia) | | +61 2 8232 3333 |
Global (London) | | +44 207 065 2100 |
| |
| NATIONAL AUSTRALIA BANK LTD | | TELEPHONE |
Domestic (Australia) | | +61 2 9295 1133 |
Global (London) | | +44 207 710 2916 |
| |
| ROYAL BANK OF CANADA | | TELEPHONE |
Domestic (Australia) | | +61 2 9033 3222 |
Global (London) | | +44 207 653 4000 |
| |
| TORONTO DOMINION BANK | | TELEPHONE |
Domestic (Australia) | | +61 2 9619 8866 |
Global (London) | | +44 207 628 4334 |
| |
| UBS AG2 | | TELEPHONE |
Domestic (Australia) | | +61 2 9324 2222 |
Global (London) | | +44 207 567 3080 |
| |
| WESTPAC BANKING CORPORATION | | TELEPHONE |
Domestic (Australia) | | +61 2 9283 4100 |
Global (London) | | +44 207 621 7620 |
| |
1 Lead Manager – Europe | | |
2 Lead Manager – United States | | |
| | |
Domestic Treasury Note Facility Dealer Panel |
| |
| PANEL MEMBERS | | TELEPHONE |
Australia and New Zealand Banking Group Ltd | | +61 7 3228 3034 |
Commonwealth Bank of Australia Ltd (Sydney) | | +61 2 9221 4099 |
Deutsche Bank AG (Sydney) | | +61 2 9258 3615 |
Macquarie Bank Ltd(Sydney) | | +61 2 8232 3333 |
National Australia Bank Ltd (Sydney) | | +61 2 9295 1133 |
Westpac Banking Corporation Ltd (Sydney) | | +61 2 9283 4133 |
| |
Multicurrency US Commercial Paper Facility Dealer Panel | | |
| |
| PANEL MEMBERS | | TELEPHONE |
Citigroup Global Markets Inc (New York) | | +1 212 723 6252 |
Credit Suisse First Boston LLC (New York) | | +1 212 909 3358 |
Deutsche Bank Securities (New York) | | +1 212 250 7179 |
| |
Multicurrency Euro Commercial Paper Facility Dealer Panel | | |
| |
| PANEL MEMBERS | | TELEPHONE |
Barclays Bank Plc (London) | | +44 207 623 2323 |
Citigroup International Plc (Hong Kong)3 | | +852 2501 2690 |
Deutsche Bank AG (London) | | +65 6 883 0808 |
Macquarie Asia Ltd | | +61 2 9391 3711 |
Macquarie Bank Ltd | | +61 2 9391 3711 |
National Australia Bank Limited (Hong Kong & London) | | +852 2526 5891 |
UBS Ltd (London) | | +44 207 567 2477 |
3 Lead Arranger | | |
| |
Multicurrency Euro Medium-Term Note Facility Dealer Panel4 | | |
| |
| PANEL MEMBERS | | TELEPHONE |
Includes all Fixed Interest Distribution Group5, and Nomura International Plc (London) | | +44 207 521 2000 |
4 Reverse inquiry also permitted | | |
5 Lead Arranger – UBS Ltd (London) | | |
| |
Multicurrency US Medium-Term Note Facility Dealer Panel6 | | |
| |
| PANEL MEMBERS | | TELEPHONE |
ABN AMRO Incorporated (London) | | +44 207 588 4079 |
Citigroup (New York) | | +1 212 723 6175 |
Deutsche Bank Securities Inc (New York)7 | | +1 212 469 7500 |
RBC Capital Markets (New York) | | +1 212 858 7380 |
6 Reverse inquiry also permitted | | |
7 Lead Arranger | | |
B1 QUEENSLAND TREASURY CORPORATION
Appendix B: Partners in Financial Markets (continued)
Issuing and Paying Agents for QTC
| | | | | | |
| | | CONTACT | | TELEPHONE | | FACSIMILE |
AUSTRALIAN TREASURY NOTES Austraclear Services Ltd Sydney | | Help Desk | | 1300 362 257 | | +61 2 9256 0456 |
AUSTRALIAN DOMESTIC BONDS Computershare Investor Services Ltd | | Markings/Transfers | | +61 3 9415 5000 (ext 5672) | | +61 3 9473 2590 |
AUSTRALIAN GLOBAL BONDS Deutsche Bank Trust Company Americas | | Client Services | | +1 615 835 2729 | | +1 615 835 2727 |
EURO COMMERCIAL PAPER Deutsche Bank AG, London | | Client Services | | +44 207 547 7608 | | +44 207 547 3665 |
US COMMERCIAL PAPER Deutsche Bank Trust Company Americas | | Client Services | | +1 908 608 3153 | | +1 732 578 4635 |
EURO MEDIUM-TERM NOTES Deutsche Bank AG, London | | Client Services | | +44 207 547 7608 | | +44 207 547 3665 |
US MEDIUM-TERM NOTES Deutsche Bank Trust Company Americas | | Client Services | | +1 908 608 3153 | | +1 732 578 4635 |
2005 - 2006 ANNUAL REPORT B2
Appendix C: Statutory Disclosure Statements
Overseas travel
QTC raises its capital requirements in offshore financial markets. From time to time, these markets are visited by Board directors and officers to transact business on behalf of QTC. All overseas travel is undertaken in accordance with the Overseas Travel Guidelines endorsed by _Queensland Cabinet.
In the year under review, international travel included:
| | | | | | |
| OFFICER | | COUNTRY/S VISITED | | PERIOD | | PURPOSE OF VISIT |
| CEO,LG Infrastructure Services (& General Manager, Procurement Projects, QTC), and Senior Financial Analyst | | UK | | 6 July – 15 July 2005 | | Meetings with the UK Local Government Association, 4 Ps and other associations in the UK that are involved in infrastructure provision, to study the their business models, experiences and critical success criteria, and translate acquired knowledge and learnings into the establishment of the LGIS business model. |
| Portfolio Manager, Financial Markets | | Hong Kong,
Germany, UK,
USA | | 1 September –
9 September 2005 | | Participate in Deutsche Bank’s Annual International Investors’ Mission involving a program of a series of meetings/direct access with offshore central banks and policy authorities. |
| Premier and Treasurer, Premier’s Deputy Chief of Staff, Under Treasurer, Chairman, Chief Executive, General Manager, Financial Markets | | Hong Kong, China,
Japan, UK,
Switzerland, UAE,
Germany, USA | | 12 September – 27
September 2005 | | Institutional Investor and QTC’s Global A $ Fixed Interest Distribution Group Roadshow Program. Program involved meetings with prime global financial institutions and QTC’s A$ Global Distribution Group. |
| General Manager, Financial Markets | | Japan, Singapore | | 11 November – 18
November 2005 | | Participate in Daiwa Securities SMBC Co Capital Markets Seminar, which included representation from all of Australia’s semi-government authorities and sovereign bond issuers from both Australia and other jurisdictions. |
| General Manager, Financial Markets and Team Leader, Credit | | Hong Kong,
Bangkok,
Singapore | | 22 January – 28
January 2006 | | Annual performance and activities review of QTC’s Euro Commercial Paper Panel, and participation in the Citigroup Asia Pacific Fixed Income Investor Conference. |
| General Manager, Financial Markets | | China, Hong Kong,
Korea, Singapore,
Taiwan | | 26 February – 4
March 2006 | | Asian Central Banks Roadshow Program. Undertake a series of meetings with Asian central banks and prime financial institutions to re-establish a market presence in the Asian region and canvass funding opportunities and demand for A$ investments. |
| General Manager, Financial Markets, and Economist | | Japan, UK, USA | | 23 April – 8 May 2006 | | Performance and activities review of QTC’s Global Fixed Interest Distribution Group, and participation in the Nomura Central Bankers Seminar. |
| CEO, LG Infrastructure Services (& General Manager, Procurement Projects, QTC) | | UK | | 7 May – 13 May 2006 | | Conduct meetings with the UK LGA, the 4 Ps, Essex City Council, Office of Government Commerce and other UK associations that are involved in infrastructure provision, to renew relationships that were forged during the 2005 visit and garner further insights about emerging trends and issues that may be translated to the LGIS business strategy. |
C1 QUEENSLAND TREASURY CORPORATION
Appendix C: Statutory Disclosure Statements (continued)
Public Sector Ethics Act Implementation Statement
QTC provides the following information pursuant to obligations under section 23 of the Public Sector Ethics Act 1994 (Qld) to report on action taken to comply with certain sections of the Act.
QTC employees are required to comply with QTC’s Code of Conduct for employees (which sets out the ethics principles and obligations under the Public Sector Ethics Act) as well the Code of Conduct established by the Australian Financial Markets Association, of which QTC is a member. Both codes are available electronically to employees through QTC’s in-house information management system. Copies of these codes can be inspected by contacting QTC’s Human Resources Team (see Appendix D for contact details).
Training is provided for new employees on ethical obligations as part of QTC’s induction process. We have commenced training for staff about the importance of an ethical culture.
Public Records Act Implementation Statement
During the year, we also progressed compliance with the provisions of the Public Records Act 2002 and on the implementation of Information Standard 40: Recordkeeping. In this regard we have established a Record Keeping Steering Committee and conducted a preliminary review of record handling procedures across business teams. Although we are not required to be compliant with the Act until 2007, we expect our early compliance to provide additional business benefit, through the efficient and effective management of corporate records.
Whistleblowers Protection Act 1994
Section 30(1) of the Whistleblowers Protection Act 1994 requires QTC to disclose, in its Annual Report, statistical information for the report period in respect of each type of information received about the number of disclosures received and the number of disclosures substantially verified.
During the year under review, QTC has not received, nor had to substantially verify, any disclosures.
2005 - 2006 ANNUAL REPORT C2
Appendix D: Corporate Directory
Queensland Treasury Corporation
Level 14, 61 Mary Street
Brisbane Queensland Australia
GPO Box 1096
Brisbane Queensland Australia 4001
Telephone: +61 7 3842 4600
Facsimile: +61 7 3221 4122
Internet: www.qtc.qld.gov.au
Queensland Treasury Corporation’s annual and half-yearly reports are available on QTC’s website: www.qtc.qld.gov.au. If you would like a report posted to you, please call 61 7 3842 4600. If you would like to comment on our Annual Report, please visit our website and complete the feedback form, which can be downloaded from the home page.
| | |
| EXECUTIVE | | |
Telephone: +61 7 3842 4611 | | Facsimile: +61 7 3210 0262 |
| |
| TEAMS | | |
| |
| FINANCIAL MARKETS | | |
Telephone: +61 7 3842 4789 | | Facsimile: +61 7 3221 2410 |
| |
| MARKET SUPPORT (SETTLEMENTS) | | |
Telephone: +61 7 3842 4644 | | Facsimile: +61 7 3221 2486 |
| |
STOCK REGISTRY SERVICES
(COMPUTERSHARE) | | |
Telephone: 1800 777 166 | | Facsimile: +61 3 9670 6373 |
| |
GOVERNMENT DEPARTMENTS AND
AGENCIES | | |
Telephone: +61 7 3842 4715 | | Facsimile: +61 7 3211 3629 |
| |
| GOVERNMENT OWNED CORPORATIONS | | |
Telephone: +61 7 3842 4715 | | Facsimile: +61 7 3211 3629 |
| |
| TREASURY SERVICES | | |
Telephone: +61 7 3842 4715 | | Facsimile: +61 7 3211 3629 |
| |
LOCAL GOVERNMENT AND REGIONAL
QUEENSLAND | | |
Telephone: +61 7 3842 4715 | | Facsimile: +61 7 3842 4958 |
| |
| LG INFRASTRUCTURE SERVICES | | |
Telephone: +61 7 3842 4700 | | Facsimile: +61 7 3211 3629 |
| |
| CUSTOMER SUPPORT (TRANSACTIONS) | | |
Telephone: +61 7 3842 4650 | | Facsimile: +61 7 3221 2486 |
| |
| LEASING | | |
Telephone: +61 7 3842 4648 | | Facsimile: +61 7 3842 4927 |
| |
| CORPORATE SERVICES | | |
Telephone: +61 7 3842 4872 | | Facsimile: +61 7 3221 4122 |
| |
| CORPORATE ACCOUNTING | | |
Telephone: +61 7 3842 4630 | | Facsimile: +61 7 3221 4122 |
| |
| LEGAL AND COMPLIANCE | | |
Telephone: +61 7 3842 4704 | | Facsimile: +61 7 3236 9031 |
| |
| INFORMATION TECHNOLOGY | | |
Telephone: +61 7 3842 4641 | | Facsimile: +61 7 3210 1198 |
| |
| HUMAN RESOURCES | | |
Telephone: +61 7 3842 4615 | | Facsimile: +61 7 3210 2358 |
| |
| CORPORATE COMMUNICATION | | |
Telephone: +61 7 3842 4685 | | Facsimile: +61 7 3211 3629 |
D1 QUEENSLAND TREASURY CORPORATION