EXHIBIT (c)(xii)
The 2005-2006 Annual Economic Report
of the Queensland Economy

Queensland Treasury 2006
Excerpts from this publication may be reproduced, with appropriate acknowledgement,
As permitted under the Copyright Act
Annual Economic Report 200-06: The Queensland Economy
ISBNo: 07345 397 6
This publication is intended only to provide a summary of the subject matter covered and without assuming a duty of care. Although the information, including commentary, herein has been derived from sources believed to be reliable, Queensland Treasury does not guarantee or make any representations as to its accuracy or completeness or accept responsibility for any loss or damage occurring as a result of its use.

Annual Economic Report
2005-06
The Queensland Economy
| | | | |
Contents | | |
| | |
| | Foreword | | ii |
| | |
1 | | Overview | | 1 |
| | |
2 | | External environment | | 2 |
| | |
| | International conditions | | |
| | Australian economy | | |
| | |
3 | | Components of Queensland’s economic growth | | 5 |
| | |
| | Overview | | |
| | Household final consumption | | |
| | Dwelling investment | | |
| | Business investment | | |
| | Public final demand | | |
| | |
4 | | Queensland’s trade sector | | 10 |
| | |
| | Net exports | | |
| | Overseas merchandise exports | | |
| | |
5 | | Labour market | | 13 |
| | |
| | Employment | | |
| | Unemployment | | |
| | Labour force | | |
| | Participation rate | | |
| | |
6 | | Prices and wages | | 17 |
| | |
| | Consumer prices | | |
| | Wages | | |
Foreword
This 2005-06 Annual Economic Report highlights Queensland’s ongoing superior economic performance compared with the nation as a whole. The report also documents the strength of the Queensland economy and the exceptional employment outcomes achieved in 2005-06.
The Queensland economy expanded by 3.8% in 2005-06, exceeding economic growth in the rest of the nation (2.4%) for the tenth consecutive year.
Solid economic growth created significant job opportunities in 2005-06. Employment rose by 57,000 persons, representing one quarter of jobs created nationally. As a result, the level of employment in Queensland in 2005-06 surpassed two million persons for the first time.
Queensland’s unemployment rate remained low at 5.0% in 2005-06, in line with the 30-year low of 4.9% reached in the previous year.
Both strong domestic demand and positive external conditions underpinned overall economic growth in Queensland in 2005-06.
Despite higher petrol prices and interest rates, consumer spending benefited from exceptional labour market conditions and strong growth in wages. Higher world prices for Queensland’s commodity exports also benefited wages in trade-related sectors of the economy and more generally supported household wealth and spending through stock market gains.
While a strong world economy supported overseas mineral exports, growth in total export volumes was subdued due to the impact of adverse weather conditions on rural exports and higher fuel prices on interstate tourism exports.
Meanwhile, business investment surged 20.1% in 2005-06, with global demand for the State’s resources boosting profitability and investment in the mining sector and strong domestic demand encouraging investment in the broader service sector of the economy.
The State government’s capital program also contributed to economic growth in 2005-06, with public investment rising significantly to meet the transport, water, health and energy infrastructure demands from strong population growth.
The Annual Economic Report is a part of the State Government’s performance accountability framework and is one of many resources produced by Queensland Treasury that detail the State’s economic performance, including the Queensland Economic Review. This publication and other information on the Queensland economy can be viewed at www.oesr.qld.gov.au.
ANNA BLIGH MP
DEPUTY PREMIER, TREASURER
AND MINISTER FOR INFRASTRUCTRE
ii Annual Economic Report 2005-06
1 Overview
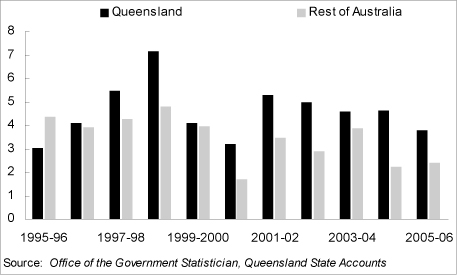
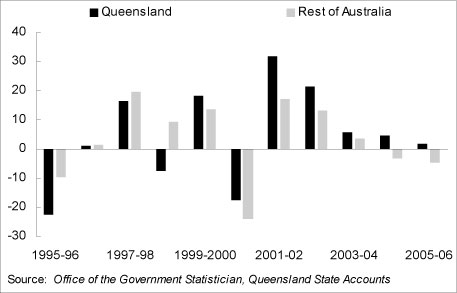
As has been the case historically, the Queensland economy continued to expand at a faster pace than that nationally in 2005-06. Favourable domestic conditions, as well as the positive flow-on effects from a strong global economy, resulted in economic growth of 3.8% in Queensland, compared with 2.4% in the rest of Australia (see Figure 1a).
Consumer spending continued to grow at a faster rate than nationally, with exceptional labour market conditions and strong growth in incomes offsetting higher petrol prices and interest rates. Higher world commodity prices also benefited wages in trade-related sectors and more generally supported household wealth through stock market gains.
Investment in infrastructure became the major driver of overall economic growth in Queensland in 2005-06, with business investment surging by 20.1% over the year. High rates of interstate and overseas migration as well as strong growth in domestic demand encouraged investment in the services sector, while global demand for the State’s resources boosted profitability and investment in mining-related sectors. Similarly, State and local government investment rose by 23.6% in real terms in 2005-06, reflecting a significant capital works program to support population growth and build on transport and energy infrastructure.
Ongoing strength in Queensland’s major trading partners supported overseas mineral exports in 2005-06. Despite this, the impact of adverse weather conditions on rural exports and higher fuel prices on interstate tourism combined to subdue growth in total export volumes. Reflecting high rates of consumer and business spending, imports continued to grow strongly and exceeded exports growth. As a result, the trade sector (net exports) detracted from growth for the fifth year in a row in 2005-06.
The strength of the Queensland economy translated into favourable labour market outcomes in 2005-06. Employment rose by 57,000 persons, representing one quarter of jobs created nationally. This rate of job creation maintained a low year-average unemployment rate in Queensland of 5.0% in 2005-06, following the 30-year low of 4.9% reached in the previous year. In addition, the State’s participation rate climbed to an historic high of 66.3%, as strong domestic conditions encouraged more persons to enter the labour force.
Figure 1a
Overall Economic Growth
(annual % change, CVM)
Annual Economic Report 2005-06 1
2 External environment
International conditions
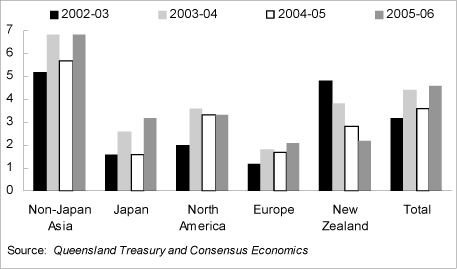
Queensland’s major trading partner growth strengthened to 4.6% in 2005-06, higher than the 3.6% growth recorded in 2004-05 and surpassing a recent peak in 2003-04 (see Figure 2a). Stronger growth reflected continued economic recovery in Japan and ongoing strength in the rest of Asia, in particular China and India. However, solid global growth also coincided with a less accommodative monetary policy stance across major central banks. Most significantly, the US Federal Reserve raised the target Fed Funds rate by an accumulated 200 basis points and the Bank of Japan ended its ‘quantitative easing’ regime in 2005-06.
Figure 2a
Economic Growth in Queensland’s Major Trading Partners
(annual % change)
The US economy continued to perform strongly in 2005-06. The strength of the economy was evident from higher capacity utilisation and a recovery in corporate profits. Labour conditions in the US also improved substantially, with the unemployment rate falling from an average of 5.3% in 2004-05 to 4.8% in 2005-06. Despite some acceleration in core inflation since late 2005-06, a further tightening in monetary policy resulted in medium-term inflation expectations remaining around 2.5% per annum in 2005-06, similar to that in 2004-05.
Following the recession in the early 1990s, the Japanese economy underwent several cyclical upswings and downturns. However, the expansion in 2005-06 proved more sustainable than previous ones, with corporate profits continuing to improve and the lending attitude of private banks becoming less conservative. The improved business environment was conducive to higher employment, which in turn led to a recovery in consumer spending. Another positive development since late 2005 was the end of consumer price deflation. Core consumer prices (the price index excluding fresh food) ceased to decline in annual terms in early 2006, after falling consistently over the previous six years. As a result, the Bank of Japan (BoJ) stated in March 2006 that it would revert back to an official interest rate for its monetary target and reduce its excess reserves held by the financial sector. This announcement officially ended the BoJ’s ‘quantitative easing’ era, during which the BoJ provided ample supply of liquidity to financial institutions to enable them to restructure their balance sheets and reduce the size of non-performing debts. With conditions in the Japanese economy and financial sector continuing to improve in late 2005-06, the BoJ accelerated the process of normalising its monetary policy by abolishing the zero interest rate policy in July 2006.
2 Annual Economic Report 2005-06
Defying speculation that the Chinese economy would undergo a cyclical downturn, economic growth in China accelerated to 10.3% in 2005-06. The economy continued to grow rapidly despite the People’s Bank of China raising interest rates in late April 2006 and increasing reserve requirements in early June 2006. More importantly, driven by a rising trade surplus, foreign exchange reserves in China increased rapidly to reach $US941.1 billion in June 2006, 32.4% larger than that of a year ago. This put upward pressure on the value of the Chinese Yuan, with the currency appreciating a further 1.5% by the end of June 2006, following a 2% revaluation on 21 July 2005.
However, given that the profit margin of the export sector in China would likely be squeezed further if the Yuan rose substantially, the Chinese government was reluctant to submit to pressure for any significant revaluation of the Yuan during the financial year. Instead the Chinese State Administration of Foreign exchange announced on 6 June 2006 that it would remove the foreign currency quota on Chinese firms investing abroad in an attempt to encourage outflows of Chinese capital, in order to ease upward pressure on the Yuan.
Economic growth in the Euro-zone continued to improve throughout 2005-06. After rising a modest 1.4% in 2004-05, the combined gross domestic product of the EU-12 countries rose 2.1% in 2005-06. This turnaround was led by an economic recovery in Germany, which recorded growth of 1.8% in 2005-06, 1.3 percentage points higher than in the previous year. The strength of the German economy was also reflected in a surge in business confidence, with the IFO Business Climate Index rising 14.5% over the year, to a 15-year high of 106.8 points in June 2006. A more positive outlook for the Euro-zone, along with concerns over inflationary pressures and excessive credit growth, resulted in the European Central Bank raising interest rates three times in 2005-06.
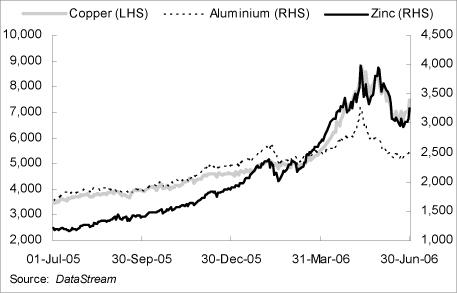
Apart from monetary tightening across many major central banks, another key feature of the global economy in 2005-06 was a continuation in the rise of energy and base metal prices. Specifically, oil prices surged a further 31.9% in 2005-06, following a 44.4% rise in 2004-05. International prices of aluminium, copper and zinc also recorded strong gains over the year, rising 24.1%, 60.5% and 81.1% respectively (see Figure 2b). Given Australia is a net exporter of energy and mineral products, the continued rise in world resource prices benefited Australia through strong growth in the terms of trade (export prices relative to import prices).
Figure 2b
Base Metal Prices
($ US per metric tonne)
Annual Economic Report 2005-06 3
Australian economy
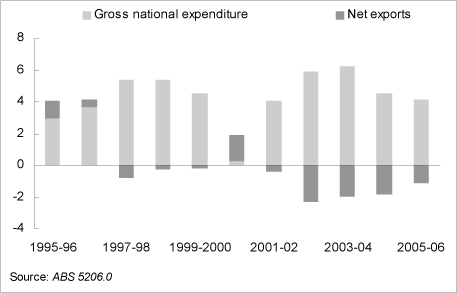
The Australian economy continued to benefit from the global commodity price boom in 2005-06. With the terms of trade rising a further 11.0% over the year, gross domestic income (gross domestic product adjusted for the terms of trade) in Australia increased by 4.7%, following 4.4% growth in the previous year. However, with growing signs that the domestic economy was reaching full capacity, the rise in domestic demand induced by higher incomes was partly fulfilled by imports. As a result, strong growth in incomes did not translate into faster growth in national domestic production. Gross domestic product in Australia increased by only 2.7% in 2005-06, with net exports detracting 1.1 percentage points from overall economic growth over the year.
Higher domestic incomes, as well as increasing demand for mineral products, saw business investment in Australia increase by 17.2% in 2005-06, the fourth consecutive year of double-digit growth. Investment in non-dwelling construction and machinery and equipment increased by 19.6% and 15.5% respectively over the year. In contrast, growth in household consumption moderated in 2005-06, with evidence that consumers began to consolidate household budgets due to an increase in household debt following the housing boom.
Figure 2c
Contribution to Growth by Gross National Expenditure and Net Exports, Australia
(annual % point contribution)
A strong domestic economy also translated into solid jobs growth during the year, albeit at a more moderate rate than in 2004-05. The number of persons employed in Australia rose by 2.2% in 2005-06, compared with 3.0% growth in 2004-05. However, with employment growing faster than the labour force, the year-average unemployment rate fell a further 0.2 percentage point, to 5.1% in 2005-06.
4 Annual Economic Report 2005-06
3 Components of Queensland’s economic growth
Overview
Overall economic growth in Queensland outperformed that nationally for the tenth year in succession in 2005-06, with the State economy expanding by 3.8%, compared with growth of 2.4% in the rest of Australia (see Table 3a). Favourable domestic conditions and a strong global economy supported economic growth in Queensland during the year.
Despite higher petrol prices and interest rates, consumer spending in Queensland grew at more than double the rate in the rest of Australia, benefiting from exceptional labour market conditions and stronger growth in wages. Higher world prices for Queensland’s commodity exports also benefited wages in trade-related sectors of the economy and more generally supported household wealth and spending through stock market gains.
Investment became the major driver of economic growth in 2005-06. Business investment surged 20.1% in 2005-06, with global demand for the State’s resources boosting profitability and investment in mining and domestic demand driving investment in the broader services sector. Public final demand rose 8.9%, reflecting the State government’s significant capital program to support both transport and energy infrastructure and strong population growth.
Solid growth in the State’s major trading partners underpinned growth in some commodity and mineral exports in 2005-06. However, the impact of adverse seasonal conditions on rural exports and higher fuel prices on interstate tourism exports led to subdued growth in overall export volumes. Imports continued to rise, driven by growth in consumer and business spending. As a result, net exports detracted from growth for the fifth year in a row.
Table 3a
Components of Economic Growth1
| | | | | | | | | | | | | | | | |
| | | Queensland | | Rest of Australia |
| | | Annual growth % | | Contribution to
growth2 % points | | Annual growth % | | Contribution to
growth2 % points |
| | | 2004-05 | | 2005-06 | | 2004-05 | | 2005-06 | | 2004-05 | | 2005-06 | | 2004-05 | | 2005-06 |
Household consumption | | 5.2 | | 4.6 | | 3.1 | | 2.7 | | 4.3 | | 2.2 | | 2.4 | | 1.3 |
Private investment3 | | 8.6 | | 10.9 | | 2.1 | | 2.7 | | 5.0 | | 8.3 | | 1.0 | | 1.7 |
Dwellings | | 4.7 | | 1.9 | | 0.4 | | 0.2 | | -3.4 | | -4.6 | | -0.2 | | -0.3 |
Business investment3 | | 17.6 | | 20.1 | | 2.0 | | 2.5 | | 12.7 | | 16.4 | | 1.3 | | 1.9 |
Other buildings and structures3 | | 9.6 | | 22.6 | | 0.4 | | 1.1 | | 7.5 | | 18.7 | | 0.3 | | 0.9 |
Machinery and equipment3 | | 23.3 | | 18.5 | | 1.5 | | 1.4 | | 16.6 | | 14.8 | | 1.0 | | 1.0 |
Private final demand3 | | 6.2 | | 6.4 | | 5.2 | | 5.4 | | 4.5 | | 3.8 | | 3.5 | | 3.0 |
Public final demand3 | | 7.5 | | 8.9 | | 1.6 | | 2.0 | | 3.5 | | 2.9 | | 0.8 | | 0.6 |
Gross state expenditure | | 6.1 | | 6.4 | | 6.4 | | 6.8 | | 4.1 | | 3.0 | | 4.1 | | 3.1 |
Exports of goods and services4 | | 3.6 | | 0.0 | | 1.1 | | 0.0 | | 1.9 | | 3.4 | | 0.4 | | 0.7 |
Imports of goods and services4 | | 8.1 | | 8.2 | | -2.9 | | -3.0 | | 10.2 | | 6.0 | | -2.3 | | -1.4 |
Net exports | | n/a | | n/a | | -1.8 | | -3.1 | | n/a | | n/a | | -1.9 | | -0.7 |
Gross state product | | 4.6 | | 3.8 | | 4.6 | | 3.8 | | 2.2 | | 2.4 | | 2.2 | | 2.4 |
1. | Chain volume measure, 2004-05 reference year. |
2. | Sum of component contributions to growth may not add to totals due to rounding. |
3. | For Queensland and Australia, excludes private sector net purchases of second-hand public sector assets in Queensland. |
4. | For Queensland, exports and imports reflect overseas trade and interstate trade with the rest of Australia. For the rest of Australia, exports and imports reflect overseas trade and trade with Queensland. |
Source: Office of the Government Statistician, Queensland State Accounts
Annual Economic Report 2005-06 5
Household final consumption
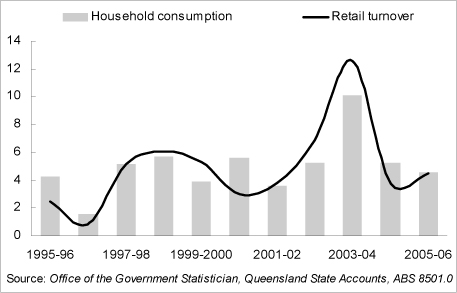
Household consumption continued to be a major driver of economic growth in Queensland in 2005-06, growing by 4.6% during the year. While growth in consumer spending has eased in recent years following the passing of the housing boom, the rate of growth in 2005-06 still remained in line with the long-run average rate of growth for the State.
Consumption expenditure was predominantly driven by favourable labour market conditions and strong population growth. Relatively strong annual growth in average weekly earnings and modest growth in house prices supported household incomes and wealth. These factors helped sustain high levels of consumer sentiment and consumer expenditure. Higher world commodity prices also benefited wages in trade-related sectors and more generally supported household wealth through stock market gains. In addition, a high $A and strong global competition maintained attractive prices on imported goods, supporting spending on consumer durables during the year.
Growth in Queensland’s household consumption was more than double the growth of 2.2% recorded in the rest of Australia, reflecting the State’s faster population, employment and wages growth, as well as a relatively stronger housing sector during the year. Employment in Queensland increased 2.9% in 2005-06, more than the 2.1% rise in the rest of Australia. Household wealth in Queensland was also supported by house prices in Brisbane continuing to rise during the year, whereas house prices in Sydney declined in 2005-06.
In terms of components of consumption, spending continued to grow on discretionary items in 2005-06, such as hotels, cafes and restaurants (up 8.6%), furnishings and household equipment (up 7.9%) and clothing and footwear (up 7.5%). However, growth in most components displayed a moderation in growth relative to 2004-05, partly reflecting the passing of housing boom and slightly higher interest rates. Most importantly, higher petrol prices impacted on certain components of consumer spending, with spending on the purchase and operation of motor vehicles and transport services falling 2.7% in real terms in 2005-06.
Figure 3a
Private Household Consumption
(annual % change, CVM)
6 Annual Economic Report 2005-06
Dwelling investment
Dwelling investment in Queensland continued to defy a downward national trend, rising by 1.9% in 2005-06, compared with a decline of 4.6% in the rest of Australia. This follows what has been impressive growth over the past five years, with dwelling investment in Queensland rising by more than 80% over the period. The growth in overall dwelling investment in 2005-06 was mainly driven by growth in alteration and additions activity (up 5.9%), which more than offset a fall in investment of new and used dwellings (down 1.0%) over the year.
The State’s strong population growth supported relatively high levels of owner-occupied home construction activity in 2005-06, with a net inflow of 19,420 interstate and 18,262 overseas migrants settling in Queensland over the first three quarters of 2005-06. While official interest rates rose by 25 basis points in May 2006, average mortgage rates in 2005-06 remained low by historical standards. Further, homebuyers’ interest seemed to be reignited in 2005-06, with the number of finance commitments for construction or purchase of new dwellings rising by 9.8% over the year, after declining by 10.9% in 2004-05. In particular, there were signs that first-home buyers had started to re-enter the market over the last year or so, with the number of finance approvals by first-home buyers rising 34.2% over the year.
Interest in investment properties also appeared to pick-up somewhat in 2005-06. Following a decline of 16.1% in 2004-05, the value of fixed commercial loans for the construction or purchase of dwellings for rent or resale by individuals increased modestly by 3.6% during the year.
In comparison, renovation activity recorded solid growth in 2005-06, supported by increases in house prices and a large backlog of approved construction work yet to be done. Homeowners also continued to draw on their increased equity to renovate their properties. Renovation activity now accounts for 43.8% of total dwelling investment in 2005-06, compared with 32.2% fifteen years earlier.
Figure 3b
Dwelling Investment
(annual % change, CVM)
Annual Economic Report 2005-06 7
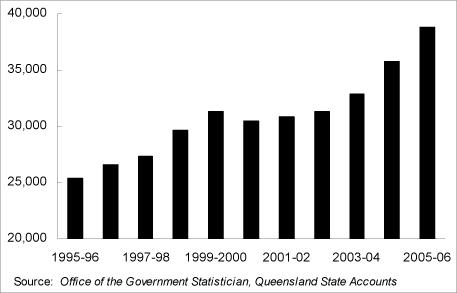
Business investment
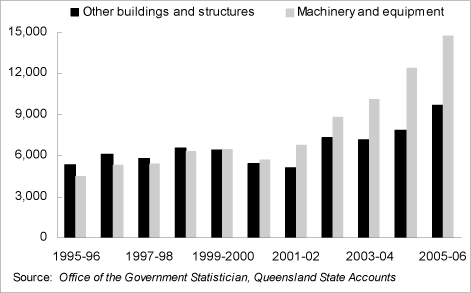
Business investment in Queensland entered its fifth consecutive year of expansion in 2005-06, surging by 20.1% over the year. The current business investment cycle has been supported by generally strong domestic and global economic conditions, relatively low borrowing costs and rising rates of capacity utilisation.
Non-dwelling construction increased 22.6% in 2005-06, after rising 9.6% in the previous year. Strong global demand for Queensland’s resource exports and high world commodity prices boosted corporate profitability and encouraged strong growth in engineering construction related to mining and other trade related industries. Further, solid growth in the domestic economy, household incomes and a rapidly increasing population have encouraged growth in construction of commercial and industrial property related to sectors such as education, business, retail and transport and storage.
Machinery and equipment investment, which accounts for the largest part of business investment, recorded double-digit growth for the fifth consecutive year in 2005-06, rising 18.5% over the year. In particular, solid domestic demand and a relatively high $A exchange rate encouraged business spending on imported capital items.
Other indicators of business investment also remained very strong over the year, with business conditions in Queensland, as measured by the National Australia Bank business survey, remaining well above their historic and national average. Similarly, the June quarter 2006 Investment Monitor published by Delta Electricity and Access Economics, indicated that the value of known investment projects (including those committed, under construction, under consideration or possible) in Queensland surged to a record high of $86.8 billion in June quarter 2006.
Figure 3c
Business Investment
($m 2004-05, CVM)
8 Annual Economic Report 2005-06
Public final demand
Following strong growth of 7.5% in 2004-05, growth in the total volume of public final demand in Queensland strengthened to 8.9% in 2005-06, its highest rate of growth in the twenty-year history of the Queensland State Accounts. Public final demand is a measure of consumption and investment expenditure by the general government sector and public trading enterprise sector.
State Government capital investment was the major driver of record growth in public final demand in 2005-06. State and local investment by the general government and public trading enterprise sector grew by 23.6%, to surpass $8 billion for the first time in 2005-06. Growth in State and local government consumption spending was also strong at 5.7% during the year, ensuring appropriate service provision for a fast growing population.
Strong growth in the volume of public investment spending during the financial year partly reflected initial infrastructure spending initiatives associated with the State Government’s South-East Queensland Infrastructure Plan and Program (SEQIPP), which aims to provide the necessary infrastructure to manage an expected increase in South-East Queensland’s population of more than one million persons over the next 20 years. Investment was spread across key Government priorities such as transport, water and energy infrastructure, as well as education, training and health.
Queensland’s government-owned corporations also significantly increased their capital programs in response to growing demands on the State’s infrastructure base, both from world demand for the State’s commodity exports and strong population growth.
Figure 3d
Public Final Demand
($m 2004-05, CVM)
Annual Economic Report 2005-06 9
4 Queensland’s trade sector
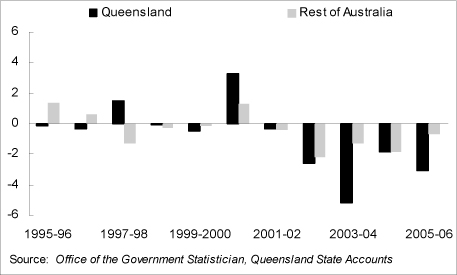
Net exports
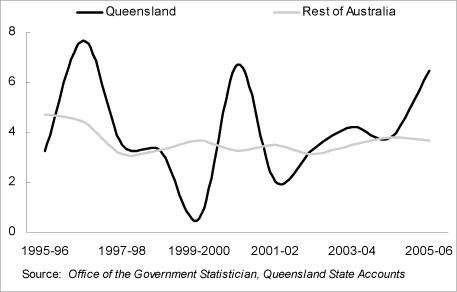
With growth in imports continuing to exceed exports growth, the trade sector detracted from overall economic growth for the fifth consecutive year in 2005-06. Net exports detracted 3.1 percentage points from economic growth during the year.
The overall volume of exports of goods and services in 2005-06 remained largely unchanged from the historically high level reached in the previous year, with growth in overseas exports being offset by a decline in interstate exports in 2005-06.
Overseas export volumes rose by 1.9% in 2005-06. Strong growth in the world economy and global incomes benefited growth in overseas exports of base metals (such as aluminium, copper and zinc). In contrast, growth in coal export volumes was subdued. This partly reflected the fact that coal exports had already surged to a record high in 2004-05, as well as transitory factors affecting coal in 2005-06. These included a disruption to capacity at one of the State’s major ports and a reliance on stocks by some overseas customers in anticipation of lower negotiated prices late in the financial year. Rainfall during harvesting season also negatively affected sugar exports in 2005-06.
Interstate exports declined by 4.4% during the year, with several factors adversely affecting interstate tourism in 2005-06. The Commonwealth Games in Victoria coincided with a decline in interstate visitors in March quarter 2006. Similarly, the greater impact of higher petrol prices on car travel relative to air travel, combined with a relatively high $A exchange rate, saw residents in the rest of Australia substitute interstate holidays with overseas travel.
In contrast to exports, imports grew strongly by 8.2% in 2005-06. High rates of consumer and business spending supported growth in imported consumer durables and capital items. Further, a high exchange rate and growth in incomes encouraged Queenslanders to travel overseas, increasing imports of overseas tourism services.
Figure 4a
Net Exports Contribution to Growth in GSP
(annual % point contribution)
10 Annual Economic Report 2005-06
Overseas merchandise exports
While the volume of overseas exports of goods rose modestly by 1.1% in 2005-06, the trade sector benefited from a surge in the value of overseas goods exports of 34.2% (or $9.0 billion), to total $35.4 billion in 2005-06. This follows growth in the value of goods exports of 31.0% in the previous year. The continuation of the commodity boom over the year saw a substantial rise in base metal prices, most notably zinc, (up 81.1%), copper (up 60.5%) and aluminium (up 24.1%). Hard coking coal prices benefited from further improvement in global industrial production, rising 67.3% in $A terms in 2005-06.
Detailed commodity information relating to overseas merchandise exports in 2005-06 is presented in Table 4a, with the key features discussed below:
• | | In 2005-06, the nominal value of Queensland’s rural exports increased by 2.1% to total $5.5 billion. A 41.2% increase in exports of textile fibres more than offset a 1.2% decline in meat exports and a 17.9% decline in fish exports. Herd rebuilding hindered growth in the volume of red meat production, with the level of beef and veal production remaining largely unchanged in 2005-06. Unfavourable weather conditions also saw the nominal value of cereal exports fall 2.7% over the year, despite a 10.7% increase in wheat prices. |
• | | The value of Queensland’s crude mineral exports rose a further 51.7% in 2005-06, to total $18.2 billion, following a 53.8% increase in 2004-05. A surge in hard coking coal prices was the main reason for the strong gain in the nominal value of crude mineral exports over the year. In contrast, the total volume of coal exports (including coking and thermal coal) declined 3.3% in 2005-06. |
• | | Strong gains in base metal prices resulted in the nominal value of processed minerals and metals exports rising by 31.6% in 2005-06, to $3.2 billion. On the other hand, the nominal value of other manufactured goods exports rose a relatively modest 14.0%, or $281.2 million, in 2005-06. This growth was mainly supported by a $121.8 million increase in machinery and a $68.9 million increase in leather and rubber products. |
The importance of Asian markets to Queensland continues to grow, with Japan, South Korea, India, China and Taiwan being the top five destinations of Queensland’s merchandise exports in 2005-06. Further, North Asia accounted for more than half of the total value of Queensland’s overseas merchandise exports over the year.
Strong demand for Queensland minerals and metals saw a 50.6% increase in the nominal value of merchandise exports to China in 2005-06. As a whole, the value of merchandise exports to the North Asian region excluding Japan increased 39.7% over the year. A further improvement in the Japanese economy also saw the nominal value of merchandise exports to Japan increase 30.7% in 2005-06.
Exports to South East Asian markets also recorded strong growth in 2005-06, rising 34.2% over the year, following an 8.7% increase in 2004-05. Indonesia, Malaysia, Singapore and Thailand continued to be Queensland’s top destinations for exports of goods in the region.
Annual Economic Report 2005-06 11
The increasing importance of Asian markets resulted in North America’s share of the value of Queensland’s merchandise exports continuing to decline in 2005-06, from 10.6% in 2000-01 to 4.5% in 2005-06. The value of merchandise exports to the United States increased a mere 1.5% over year, while the value of merchandise exports to Canada declined by 28.9%.
Europe’s proportion of Queensland’s merchandise exports remained relatively unchanged in 2005-06 (at 14.7%), supported mainly by a rise in the value of coal exports to the region. Queensland’s most significant export markets in the European Union (in value terms) in 2005-06 were the Netherlands, United Kingdom, Italy, France and Spain.
Table 4a
Overseas Exports of Queensland Goods and Services
(current prices)
| | | | | | | | |
Export Categories | | 2004-05 $m | | 2005-06 $m | | Annual Growth $m % |
Rural (b) | | | | | | | | |
Meat | | 3,344.3 | | 3,304.7 | | -39.6 | | -1.2 |
Cereals | | 250.6 | | 243.9 | | -6.7 | | -2.7 |
Textile fibres | | 498.2 | | 703.7 | | 205.5 | | 41.2 |
Fish | | 236.9 | | 194.4 | | -42.5 | | -17.9 |
Vegetables and fruit | | 234.3 | | 238.5 | | 4.2 | | 1.8 |
Other rural | | 842.3 | | 832.7 | | -9.6 | | -1.1 |
Total | | 5,406.7 | | 5,517.9 | | 111.2 | | 2.1 |
Crude minerals | | | | | | | | |
Coal (c) | | 9,695.4 | | 14,514.1 | | 4,818.7 | | 49.7 |
Other crude minerals | | 2,275.7 | | 3,648.4 | | 1,372.7 | | 60.3 |
Total | | 11,971.1 | | 18,162.5 | | 6,191.4 | | 51.7 |
Manufactures | | | | | | | | |
Processed minerals and metals | | | | | | | | |
Non-ferrous metals | | 2,140.6 | | 2,863.1 | | 722.5 | | 33.8 |
Other processed minerals and metals | | 255.4 | | 290.0 | | 34.6 | | 13.5 |
Total | | 2,396.0 | | 3,153.1 | | 757.1 | | 31.6 |
Other manufactures | | | | | | | | |
Chemicals | | 443.3 | | 423.6 | | -19.7 | | -4.4 |
Leather, rubber, etc. | | 185.5 | | 254.4 | | 68.9 | | 37.1 |
Machinery | | 796.2 | | 918.0 | | 121.8 | | 15.3 |
Transport equipment | | 308.6 | | 372.1 | | 63.5 | | 20.6 |
Miscellaneous manufactures | | 256.1 | | 299.9 | | 43.8 | | 17.1 |
Other manufactures - other | | 22.3 | | 25.2 | | 2.9 | | 13.0 |
Total | | 2,012.0 | | 2,293.2 | | 281.2 | | 14.0 |
Total manufactures (d) | | 4,408.0 | | 5,446.2 | | 1,038.2 | | 23.6 |
Confidential and special (e) | | 4,582.7 | | 6,254.6 | | 1,671.9 | | 36.5 |
Total overseas exports of goods | | 26,368.5 | | 35,381.3 | | 9,012.8 | | 34.2 |
(a) | Based on the Standard International Trade Classification (SITC2). |
(b) | Due to ABS reclassification, raw cane sugar exports are now included in the ‘Confidential’ export category rather than the ‘Rural’ export category. |
(c) | Due to ABS reclassification, some coal exports, such as pulverised coal injection (PCI) coal, are now included in the ‘Confidential’ export category rather than the ‘Crude Materials’ export category. |
(d) | Sum of processed minerals and metals and other manufactures. (e) The value of raw cane sugar exports is included in this category. |
Source: ABS unpublished foreign trade data, August 2006
12 Annual Economic Report 2005-06
5 Labour market
Employment
Following a 10-year high of 5.6% in 2004-05, the State recorded solid employment growth of 2.9% in 2005-06, above the average growth rate over the past decade (2.8%). This was much stronger than the 2.1% growth recorded in the rest of Australia and represented the fifth consecutive year that jobs growth in Queensland exceeded national growth (see Figure 5a).
The State’s solid jobs growth saw the number of people employed in Queensland in 2005-06 surpass two million for the first time. Employment rose by 57,000 persons in 2005-06 and accounted for more than one quarter of the rise in national employment (up 221,100 persons). Full-time employment accounted for the majority of jobs growth in Queensland, rising by 35,900 persons and contributing to more than a quarter (25.9%) of national full-time jobs growth (up 138,600 persons). Part-time employment also contributed to the State’s jobs growth in 2005-06, increasing by 21,100 persons over the year.
Figure 5a
Employment Growth
(annual % change)
The services sector continued to drive employment growth in 2005-06, with job creation being broad-based across the sector. Drier than normal conditions in recent years saw employment in agriculture and related food manufacturing decline in 2005-06, while strong global demand for the State’s resource exports increased employment levels in mining.
Employment growth in the services sector in 2005-06 was mainly supported by strong population growth as well as high levels of business and housing activity during the year. This generated significant job gains in the construction sector, finance and insurance services as well as property and business services, with employment in these industries collectively increasing by 33,900 persons over the year (see Table 5a). Industries which recorded the largest number of job gains in 2005-06 include property and business services (up 7.8% or 16,300 persons), construction (up 7.4% or 13,800 persons), health and community services (up 5.4% or 10,000 persons), government administration and defence (up 10.7% or 9,100
Annual Economic Report 2005-06 13
persons) and personal and other services (up 11.3% or 8,400 persons). In terms of rates of employment growth, the electricity, gas and water industry recorded the strongest growth rate in 2005-06 (up 40.0% or 5,600 persons), partly reflecting the significant increase in capital and labour investment by Queensland’s Government-owned corporations.
Following an employment increase of 3.2% in 2004-05, the primary and secondary sector slightly detracted (down 3.0%) from jobs growth in 2005-06. Strong employment gains in the mining industry were more than offset by job losses in the agriculture, forestry and fishing and manufacturing industries. Employment in agriculture, forestry and fishing fell 9.1% (down 7,200 persons) and in manufacturing fell by 7.2% (down 14,400 persons) in 2005-06, mainly due to the ongoing adverse effects from the drought. In contrast, the mining industry recorded strong employment growth of 50.2% (up 12,400 persons) in 2005-06, reflecting solid global industrial production and resource demand.
Table 5a
Employment by Industry, Queensland
| | | | | | | | | | | | |
| | | 2005-06 | | Change (‘000 persons) | | Annual Growth (%) |
Industry/Sector | | (‘000
persons) | | (% of
total) | | 2005-06 | | 10 year
average | | 2005-06 | | 10 year
average |
Primary and Secondary | | 292.4 | | 14.6 | | -9.1 | | 0.6 | | -3.0 | | 0.2 |
Agriculture forestry and fishing | | 71.4 | | 3.6 | | -7.2 | | -1.6 | | -9.1 | | -2.0 |
Mining | | 37.2 | | 1.9 | | 12.4 | | 1.9 | | 50.2 | | 7.3 |
Manufacturing | | 183.8 | | 9.2 | | -14.4 | | 0.3 | | -7.2 | | 0.2 |
Services | | 1706.1 | | 85.4 | | 68.8 | | 48.3 | | 4.2 | | 3.4 |
Electricity, gas and water | | 19.7 | | 1.0 | | 5.6 | | 0.6 | | 40.0 | | 3.5 |
Construction | | 200.7 | | 10.0 | | 13.8 | | 7.4 | | 7.4 | | 4.7 |
Wholesale trade | | 77.8 | | 3.9 | | -6.2 | | -0.7 | | -7.4 | | -0.8 |
Retail trade | | 318.3 | | 15.9 | | 0.9 | | 8.6 | | 0.3 | | 3.2 |
Accommodation, cafes and restaurants | | 104.7 | | 5.2 | | -3.5 | | 2.9 | | -3.2 | | 3.3 |
Transport and storage | | 104.1 | | 5.2 | | 6.4 | | 2.1 | | 6.6 | | 2.3 |
Communication services | | 27.4 | | 1.4 | | -4.1 | | 0.3 | | -13.1 | | 1.3 |
Finance and insurance | | 55.1 | | 2.8 | | 3.8 | | 1.1 | | 7.4 | | 2.3 |
Property and business services | | 225.3 | | 11.3 | | 16.3 | | 8.2 | | 7.8 | | 4.6 |
Govt administration and defence | | 94.6 | | 4.7 | | 9.1 | | 2.7 | | 10.7 | | 3.4 |
Education | | 149.5 | | 7.5 | | 6.1 | | 4.1 | | 4.2 | | 3.3 |
Health and community services | | 194.0 | | 9.7 | | 10.0 | | 6.1 | | 5.4 | | 3.9 |
Cultural and recreational services | | 52.6 | | 2.6 | | 2.3 | | 1.8 | | 4.5 | | 4.4 |
Personal and other services | | 82.4 | | 4.1 | | 8.4 | | 3.0 | | 11.3 | | 4.7 |
All Industries 1,2 | | 1998.5 | | 100.0 | | 59.7 | | 48.9 | | 3.1 | | 2.8 |
1. | Industry estimates of employment are compiled on the mid-month of each quarter. Therefore, the level and growth of total industry employment does not match aggregate estimates of employed persons derived from monthly data. |
2. | The sum of individual industries may not add to total due to rounding. |
Source: ABS 6291.0.55.001
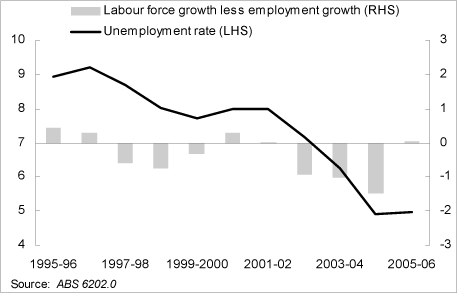
Unemployment
With labour force growth (3.0%) slightly exceeding jobs growth (2.9%), the year-average unemployment rate rose marginally by 0.1 percentage point to 5.0% in 2005-06 (see Figure 5b). However, the unemployment rate of 5.0% remains around a 30-year low and has been achieved despite the labour force participation rising to an historic high of 66.3% in 2005-06.
In contrast, the unemployment rate in the rest of Australia fell by 0.2 percentage point, to 5.1% in 2005-06, but remained above that of Queensland for the second year since 1994-95.
Queensland recorded a further decline in long-term unemployment (those unemployed for one year or more) in 2005-06, indicating that the most disadvantaged unemployed continued to benefit from strong labour market conditions during the year. Long term unemployment in Queensland has halved over the past five years, to represent 13.6% of total unemployment in 2005-06, compared with 18.9% in the rest of Australia.
14 Annual Economic Report 2005-06
Figure 5b
Queensland’s Unemployment Rate
(percent, year-average)
Labour force
The size of the labour force rose 3.0% in 2005-06, well above the average annual growth rate over the past decade (2.4%) and exceeding 1.8% growth in the rest of Australia (see Figure 5c). This represents the 18th consecutive year that Queensland’s labour force growth has equalled or exceeded the growth recorded in the rest of Australia, with the annual differential averaging 1.4 percentage points over this period. As a result, the State has contributed to more than 30% of national labour force growth over the past 18 years.
Figure 5c
Labour Force
(annual % change)
Queensland’s faster labour force growth relative to the rest of Australia has been underpinned by two main factors: stronger population growth and the rapid increase in the labour force participation rate. The State’s stronger population growth has been mainly driven by higher levels of net interstate migration relative to the other states. This is partly due to the State’s
Annual Economic Report 2005-06 15
stronger economic growth, which has encouraged interstate migrants to move to Queensland in search of job opportunities. In addition, a generally lower cost of living (including housing costs), competitive tax environment, and a more attractive climate and lifestyle are some of the other factors which have led to higher levels of interstate migration in Queensland.
The more rapid increase in Queensland’s participation rate relative to the rest of Australia has also driven Queensland’s stronger labour force growth over the past two decades.
Participation rate
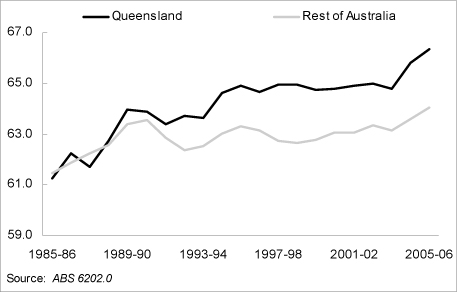
The State’s labour force participation rate reached an historic peak in 2005-06, rising 0.5 percentage point to 66.3%. The participation rate in the rest of Australia rose 0.5 percentage point to 64.1%, but remained below that of Queensland for the 18th year in a row. Further, the difference between Queensland and the rest of Australia’s participation rates has widened over this period, from 0.2 percentage point in 1988-89 to 2.3 percentage points in 2005-06.
A higher State participation rate in 2005-06 was driven by a rise in the female participation rate (up 0.7 percentage point to 59.4%) and male rate (up 0.3% percentage point to 73.4%).
The increase in the State’s participation rate in 2005-06 was partly related to the strength in the domestic economy and signs of higher living costs (such as petrol prices and rent), which together encouraged people to enter the labour force. Further, underlying factors such as the continued shift in economic activity towards the service industries and a rise in female higher education participation have continued to contribute to an increasing participation rate.
Labour force participation has been growing faster in Queensland relative to the rest of Australia, partly due to a faster rise in female participation and higher levels of net interstate migration. The female participation rate in Queensland rose 13.2 percentage points to 59.4% over the 20 years to 2005-06, much stronger than a 9.0 percentage point rise in the rest of Australia (to 56.6%). In addition, as interstate migrants tend to have higher participation rates relative to existing residents, high levels of interstate migration have also contributed to the faster increase in the participation rate in Queensland.
Figure 5d
Participation Rate
(percent, year-average)
16 Annual Economic Report 2005-06
6 Prices and wages
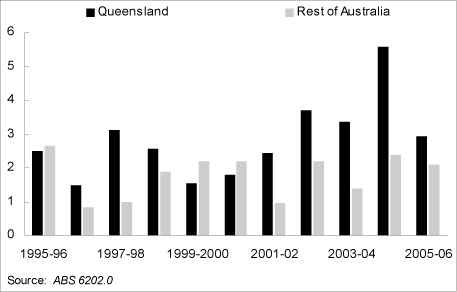
Consumer prices
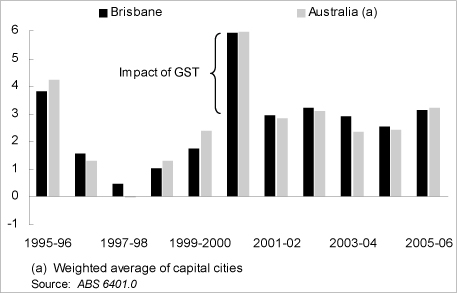
Consumer price inflation in Queensland strengthened in 2005-06, with the Brisbane consumer price index (CPI) increasing 3.1%, compared with 2.6% growth in 2004-05. Both domestic and international factors contributed to higher prices in Queensland in 2005-06.
In terms of domestic factors, food and housing costs contributed to more than half of the increase in the Brisbane CPI in 2005-06. Food prices were the largest contributor to inflation in 2005-06, accounting for almost one third of the overall price growth. In particular, the price of fruit increased significantly due to the destruction of fruit supplies caused by Cyclone Larry in North Queensland. Increases in housing-related costs largely reflected higher rents over the year and contributed to more than one fifth of total price inflation. In contrast, despite solid labour market conditions, unit labour costs remained contained in 2005-06, placing limited upward pressure on inflation.
The main external influence placing upward pressure on consumer prices in 2005-06 continued to be fuel prices, which rose sharply in the financial year. Overall, higher transport costs contributed to one quarter of total CPI growth in 2005-06. In contrast, strong global competition continued to see price declines on many retail items during the year, such as clothing and footwear.
Nationally, average prices across Australian capital cities rose 3.2% in 2005-06, following the 2.4% growth recorded in the previous year. As in Queensland, increases in food and petrol prices were the major contributors to national inflation.
Figure 6a
Consumer Price Index
(annual % change)
Annual Economic Report 2005-06 17
Wages
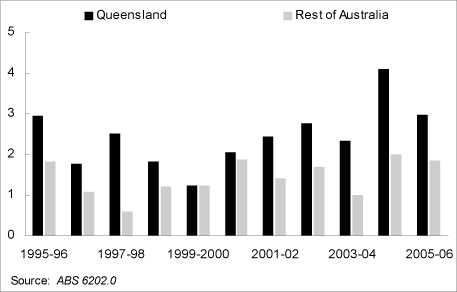
Wages growth strengthened in 2005-06, partly reflecting strong labour market conditions during the year, characterised by solid jobs growth and a near-record low unemployment rate.
Strong global demand and higher world prices for Queensland’s resource exports benefited wages in trade-related sectors of the economy, while higher levels of business and public sector investment spending also benefited wages growth in construction-related industries.
The total wage bill in Queensland, as measured by compensation of employees, rose 10.9% in 2005-06 (rest of Australia 6.4%), representing the strongest growth in aggregate wages since 1989-90. Queensland’s favourable labour market conditions in 2005-06 were reflected in the number of wage and salary earners in the State rising 4.2%, significantly higher than the 2.6% growth recorded in the rest of Australia.
The average wage per employee rose by 6.5% in Queensland in 2005-06, strengthening from the 3.8% growth recorded in the previous year and substantially higher than the 3.7% growth in the rest of Australia in 2005-06.
The ABS Wage Price Index (WPI) is an alternative indicator of wages growth, which removes the increase in wages due to measurable productivity improvements, giving a more accurate measure of growth in actual wage costs. The ABS WPI index in Queensland rose by 4.4% (4.1% nationally) in 2005-06, strengthening from 3.8% (also 3.8% nationally) in the previous year and in line with the continued growth in average earnings in 2005-06.
Figure 6b
Average Compensation of Employees
(annual % change)
18 Annual Economic Report 2005-06