EXHIBIT (c)(iv)
Queensland State Accounts for the Quarter Ended September 30, 2006
For further information
| | | | |
| CONTACT | | ENQUIRIES | | TELEPHONE |
Martin Pavelka | | Concepts and Interpretation | | (07) 3224 5321 |
Sylvia Sivo | | Data and Compilation | | (07) 3224 4201 |
| | |
| | EMAIL | | |
| | qsa@treasury.qld.gov.au | | |
Websites
www.oesr.qld.gov.au
or
www.treasury.qld.gov.au
| | | | |
| | Electronic Subscription Information: | | Rinie Klein |
| | | | Office of the Government Statistician |
| | | | Level 8 |
| | | | 33 Charlotte Street |
| | | | Brisbane Q 4000 |
| | |
| | | | Telephone: (07) 3224 5326 |
| | | | Facsimile: (07) 3220 0831 |
| | | | E-mail qsa@treasury.qld.gov.au |
© The State of Queensland (Queensland Treasury)
2007
Copyright protects this publication. Except for purposes permitted
under the Copyright Act, reproduction by whatever means is prohibited without
the prior written permission of the Under Treasurer
ISSN 1321-2338
| | |
 | | Queensland State Accounts, September Quarter 2006 |
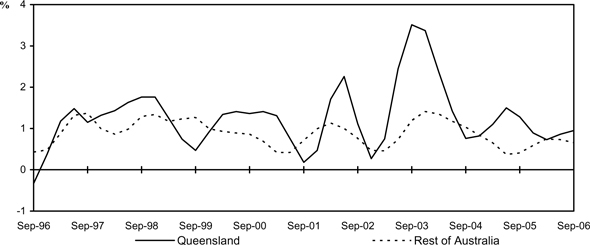
Chart 1
Gross State Product
(quarterly % change, CVM, trend)
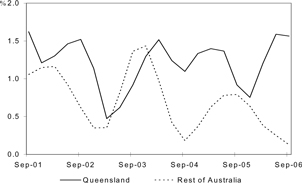
Table I
Percentage Change in Gross State/Domestic Product
Chain volume measures (reference year 2004-05)
| | | | | | |
| | | Queensland(a) | | Rest of Australia (a) | | Australia (b) |
TREND | | | | | | |
Jun qtr 06 to Sep qtr 06 | | 1.6 | | 0.1 | | 0.4 |
Sep qtr 05 to Sep qtr 06 | | 5.2 | | 1.4 | | 2.1 |
ORIGINAL | | | | | | |
Year-average (c) | | 4.5 | | 2.3 | | 2.7 |
| (a) | Source Office of the Government Statistician, Queensland State Accounts |
| (c) | Reference quarter and the three preceding quarters compared with the same period a year earlier |
September Quarter 2006 – Main Features
Quarterly Results
| n | Queensland’s gross state product (GSP) recorded real trend growth of 1.6 per cent in September quarter 2006 following similar growth in June Quarter 2006. |
| n | Domestic economic activity continued to support growth in GSP, mainly driven by the combination of private gross fixed capital formation and household final consumption expenditure. |
| n | Private gross fixed capital formation increased by 2.2 per cent in the quarter and contributed 0.6 percentage point to growth in GSP. This was underpinned by continued growth in investment in dwellings and other buildings and structures. Household final consumption expenditure rose 1.0 per cent and contributed 0.6 percentage point to GSP growth. |
| n | Public final demand rose 2.8 per cent in September quarter 2006, with public consumption and public investment increasing 1.4 per cent and 6.6 per cent respectively. Strong growth in public investment over the quarter was driven by both higher general government (up 6.8 per cent) and public trading enterprises capital formation (up 6.4 per cent). |
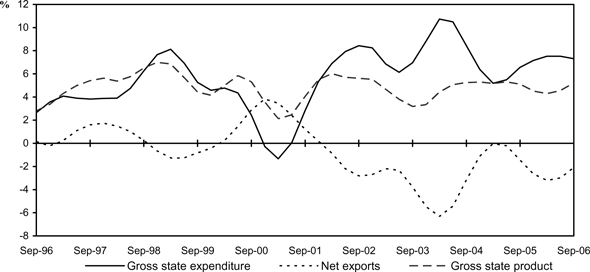
| n | Gross state expenditure increased 1.6 per cent in the quarter and contributed 1.7 percentage points to economic growth. Net exports detracted 0.1 percentage point from GSP growth, with weaker exports more than offsetting lower imports. |
Notes
The reader should be aware that this September quarter 2006 edition of the Queensland State Accounts incorporates the ABS annual benchmarks for the income components of GSP data for 2005-06, which were not available and hence not incorporated in the June quarter 2006 edition. These benchmarks, apart from compensation of employees and gross operating surplus and mixed income for 2005-06, have been incorporated in this September quarter edition of Queensland State Accounts (see Methodological Issues in the Explanatory Notes, on page 12, for the derivation of compensation of employees and gross operating surplus and mixed income). As a result, Queensland’s GSP growth has been revised to 4.4 per cent for 2005-06, from the preliminary growth estimate of 3.8 per cent published in the June quarter edition.
| | |
| | Queensland State Accounts, September Quarter 2006 |
Annual Results
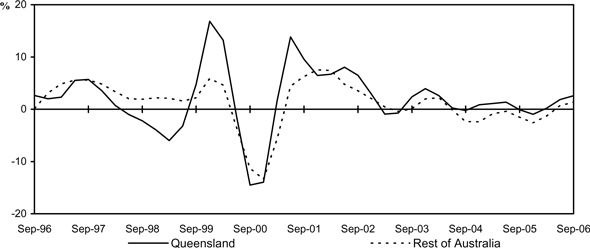
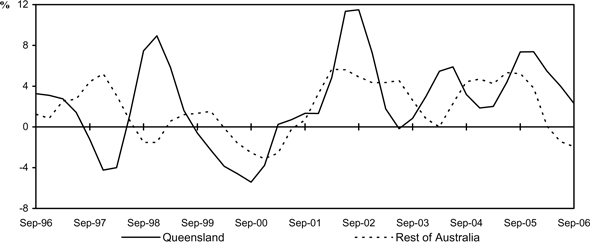
| n | The Queensland economy grew by 5.2 per cent in real trend terms over the year to September quarter 2006, compared with only 1.4 per cent growth in the Rest of Australia. |
| n | Household final consumption expenditure in Queensland increased by 3.5 per cent over the year to September quarter 2006 and contributed 2.1 percentage points to economic growth. |
| n | Private gross fixed capital formation increased 13.2 per cent and was the largest contributor (3.4 percentage points) to GSP growth in Queensland, underpinned by rises in the three major components of private gross fixed capital formation. Investment growth was strong in other buildings and structures (up 20.8 per cent) and machinery and equipment (up 20.3 per cent), with private dwellings recording more moderate growth (3.7 per cent). |
| n | Exports of goods and services were unchanged in volume terms, while imports of goods and services grew by 5.8 per cent, largely due to continued strong growth in Queensland’s domestic demand. |
Chart 2: Gross State/Rest of Australia Product
(annual % change, CVM, trend)
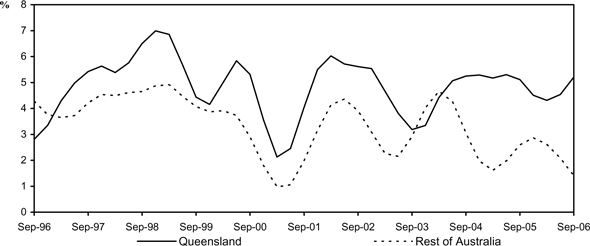
Chart 3: Contribution to Growth, Queensland
(annual % point contribution, CVM, trend)
ii
| | |
| | Queensland State Accounts, September Quarter 2006 |
Expenditure on GSP – Key Points
Household Final Consumption Expenditure
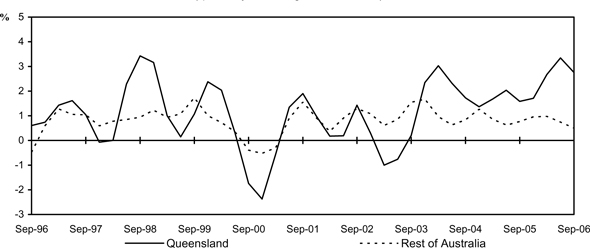
| n | Queensland household final consumption expenditure rose 1.0 per cent in real trend terms in September quarter 2006, above the quarterly growth of 0.7 per cent in the Rest of Australia. |
Chart 4: Household Final Consumption Expenditure
(quarterly % change, CVM, trend)
Dwelling Investment
| n | Queensland’s dwelling investment increased by 2.6 per cent in the September quarter (Rest of Australia up 1.4 percent). |
Chart 5: Dwelling Investment
(quarterly % change, CVM, trend)
iii
| | |
| | Queensland State Accounts, September Quarter 2006 |
Business Investment
| n | Queensland business investment (defined as other buildings and structures and machinery and equipment) rose 2.3 per cent in the September quarter. Both components of business investment remain strong, with investment in machinery and equipment rising 0.9 per cent (up 20.3 per cent over the year), and other buildings and structures increasing 4.5 per cent in the quarter (up 20.8 over the year). In contrast, business investment in the Rest of Australia declined 1.9 per cent in September quarter 2006. |
Chart 6: Business Investment
(quarterly % change, CVM, trend)
Public Final Demand
| n | Public final demand continued to rise during the September quarter (up 2.8 per cent) as a result of higher public investment (up 6.6 per cent) and a moderate rise in public consumption (up 1.4 per cent). |
| n | Sustained growth in public investment reflects strong increases in both general government gross fixed capital formation (up 6.8 per cent) and public trading enterprise gross fixed capital formation (up 6.4 per cent). |
Chart 7: Public Final Demand
(quarterly % change, CVM, trend)
iv
| | |
| | Queensland State Accounts, September Quarter 2006 |
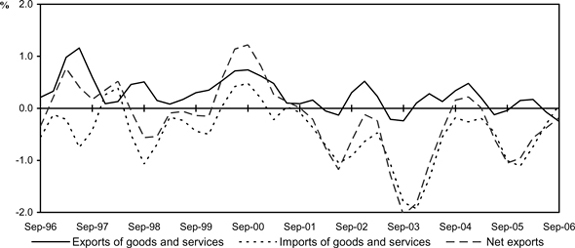
Net Exports
| n | Net exports of goods and services detracted 0.1 percentage point from Queensland’s GSP growth in September quarter 2006, with weaker exports more than offsetting a decline in imports. For the Rest of Australia, however, net exports contributed 0.1 percentage point to growth in the September quarter. |
| n | The volume of Queensland’s goods and services exports overseas fell by 0.8 per cent in the September quarter. Lower exports of sugar (down 12.2 per cent) and non-ferrous metals (down 7.1 per cent) more than offset higher exports of coal (up 0.9 per cent) and meat (1.4 per cent). Exports of goods and services interstate declined by 1.1 per cent in the quarter. |
| n | In the September quarter, imports of overseas goods and services fell 0.4 per cent, driven by a decline in overseas goods imports (down 1.4 per cent). Lower imports of mineral fuels and lubricants (down 4.3 per cent), and other machinery and transport equipment (down 3.7 per cent), more than outweighed higher imports of food, beverages and tobacco (up 3.9 per cent), machinery and transport equipment (up 1.2 per cent) and chemicals (up 0.3 per cent). Imports of goods and services from interstate were unchanged in the September quarter from the previous quarter. |
| n | In annual terms, net exports detracted 2.1 percentage points from GSP growth. This reflected growth in imports (up 5.8 per cent) as exports were unchanged over the year. Import growth was mainly driven by overseas imports of other machinery and equipment, reflecting strong private and public investment spending. In comparison, net exports detracted 0.2 percentage point from economic growth in the Rest of Australia over the year. |
Chart 8: Exports, Imports and Net Exports, Contribution to Growth, Queensland
(quarterly % point contribution, CVM, trend)
v
| | |
| | Queensland State Accounts, September Quarter 2006 |
Growth Composition
Chart 9: Contribution to Growth, Queensland
(quarterly % point contribution, CVM, trend)
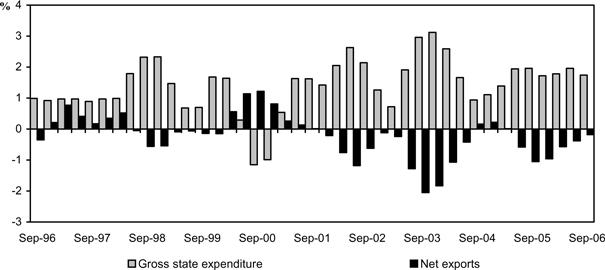
| n | Chart 9 shows that gross state expenditure contributed 1.7 percentage points to Queensland economic growth in September quarter 2006 while net exports detracted 0.1 percentage point. |
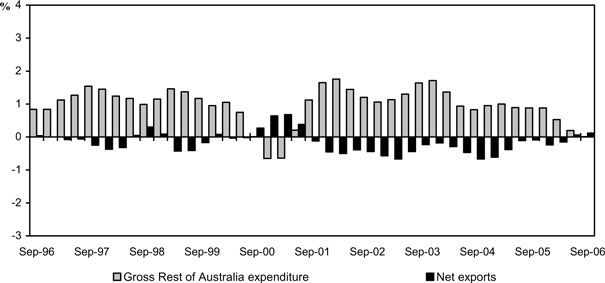
| n | Gross Rest of Australia expenditure was unchanged in September quarter 2006 while net exports contributed 0.1 percentage point to the Rest of Australia’s economic growth, resulting in 0.1 per cent growth in Gross Rest of Australia product (see Chart 10). |
Chart 10: Contribution to Growth, Rest of Australia
(quarterly % point contribution, CVM, trend)
vi
| | |
| | Queensland State Accounts, September Quarter 2006 |
Summary Tables
Table II
Changes and Contribution to Growth, Quarterly, Trend, Chain Volume Measures (a)
| | | | | | | | |
| | | Queensland | | Rest of Australia (b) |
| | | Quarterly % change Jun-06 to Sep-06 | | % point contribution to growth in GSP Jun-06 to Sep-06 | | Quarterly % change Jun-06 to Sep-06 | | % point contribution to growth in GSP Jun-06 to Sep-06 |
Final consumption expenditure | | | | | | | | |
Households | | 1.0 | | 0.6 | | 0.7 | | 0.4 |
General government | | 1.4 | | 0.2 | | 1.1 | | 0.2 |
Gross fixed capital formation | | | | | | | | |
Private | | 2.2 | | 0.6 | | -0.7 | | -0.2 |
Dwellings | | 2.6 | | 0.2 | | 1.4 | | 0.1 |
Other buildings and structures | | 4.5 | | 0.3 | | 0.2 | | 0.0 |
Machinery and equipment | | 0.9 | | 0.1 | | -3.5 | | -0.3 |
Public enterprises | | 6.4 | | 0.2 | | -2.4 | | 0.0 |
General government | | 6.8 | | 0.2 | | -2.8 | | -0.1 |
Changes in inventories | | n.a. | | -0.2 | | n.a. | | -0.5 |
Gross state expenditure | | 1.6 | | 1.7 | | 0.0 | | 0.0 |
Exports of goods and services overseas | | -0.8 | | -0.2 | | 1.6 | | 0.3 |
Exports of goods and services interstate | | -1.1 | | -0.1 | | 0.0 | | 0.0 |
less Imports of goods and services overseas | | -0.4 | | -0.1 | | 0.9 | | 0.2 |
less Imports of goods and services interstate | | 0.0 | | 0.0 | | -1.1 | | 0.0 |
Gross state product | | 1.6 | | 1.6 | | 0.1 | | 0.1 |
| (a) | Chain volume measure reference year 2004-05. |
| (b) | Due to the ABS methodology of estimating trend estimates in aggregate, rather than as the sum of the trend estimates of their components, the Rest of Australia contributions to growth are not additive. |
With respect to the real trend quarterly changes and contributions to growth in the September quarter:
| n | Household final consumption expenditure in Queensland rose 1.0 per cent and contributed 0.6 percentage point to overall growth, compared with lower growth of 0.7 per cent in the Rest of Australia. |
| n | General government final consumption expenditure in Queensland increased by 1.4 per cent. The Rest of Australia recorded slightly weaker growth of 1.1 per cent. |
| n | Growth in private gross fixed capital formation eased to 2.2 per cent following 3.1 per cent growth in the June quarter. All three major components of private gross fixed capital formation increased: investment in other buildings and structures (up 4.5 per cent), dwelling investment (2.6 per cent), and machinery and equipment investment (up 0.9 per cent). |
| n | Public investment increased in September quarter 2006, reflecting higher investment by both general government (up 6.8 per cent) and public enterprises (up 6.4 per cent). |
| n | Queensland’s exports of goods and services overseas (down by 0.8 per cent) declined for the second consecutive quarter. Imports of overseas goods and services also fell (down 0.4 per cent) after rising 1.4 per cent and 0.4 per cent in the March and June quarters of 2006 respectively. |
vii
| | |
| | Queensland State Accounts, September Quarter 2006 |
Table III
Changes and Contribution to Growth, Annual, Trend, Chain Volume Measures (a)
| | | | | | | | |
| | | Queensland | | Rest of Australia (b) |
| | | Annual % change Sep-05 to Sep-06 | | % point contribution to growth in GSP Sep-05 to Sep-06 | | Annual % change
Sep-05 to Sep-06 | | % point contribution to growth in GSP Sep-05 to Sep-06 |
Final consumption expenditure | | | | | | | | |
Households | | 3.5 | | 2.1 | | 2.8 | | 1.6 |
General government | | 7.1 | | 1.2 | | 4.2 | | 0.8 |
Gross fixed capital formation | | | | | | | | |
Private | | 13.2 | | 3.4 | | 0.8 | | 0.2 |
Dwellings | | 3.7 | | 0.3 | | -1.9 | | -0.1 |
Other buildings and structures | | 20.8 | | 1.2 | | 7.0 | | 0.4 |
Machinery and equipment | | 20.3 | | 1.7 | | -4.2 | | -0.3 |
Public enterprises | | 38.8 | | 0.9 | | 3.7 | | 0.1 |
General government | | 9.7 | | 0.3 | | -6.1 | | -0.1 |
Changes in inventories | | n.a. | | -0.7 | | n.a. | | -1.2 |
Gross state expenditure | | 6.8 | | 7.3 | | 1.6 | | 1.6 |
Exports of goods and services overseas | | 0.5 | | 0.1 | | 5.7 | | 1.0 |
Exports of goods and services interstate | | -1.1 | | -0.1 | | 7.5 | | 0.3 |
less Imports of goods and services overseas | | 3.9 | | 0.7 | | 7.0 | | 1.6 |
less Imports of goods and services interstate | | 7.5 | | 1.4 | | -1.1 | | 0.0 |
Gross state product | | 5.2 | | 5.2 | | 1.4 | | 1.4 |
| (a) | Chain volume measure reference year 2004-05. |
| (b) | Due to the ABS methodology of estimating trend estimates in aggregate, rather than as the sum of the trend estimates of their components, the Rest of Australia contributions to growth are not additive. |
With respect to the real trend annual changes and contributions to growth over the year to the September quarter:
| n | Household final consumption expenditure increased 3.5 per cent, compared with 2.8 per cent growth recorded in the Rest of Australia. |
| n | Private gross fixed capital formation increased 13.2 per cent, making it the largest contributor to annual economic growth with 3.4 percentage points. Strong growth was recorded in other buildings and structures (up 20.8 per cent), and machinery and equipment investment (up 20.3 per cent) together with modest growth in dwelling investment of 3.7 per cent. In comparison, private investment in the Rest of Australia increased by only 0.8 per cent over the year with higher investment in other buildings and structures (up 7.0 per cent) more than offsetting lower investment in machinery and equipment (down 4.2 per cent) and dwellings (down 1.9 per cent). |
| n | Public final demand rose strongly (up 10.9 per cent), the highest on record. This was largely underpinned by public investment with public enterprises capital formation rising 38.8 per cent and investment by general government increasing 9.7 per cent over the year. Additionally, general government final public consumption increased by 7.1 per cent over the year to September quarter 2006. |
| n | Net exports detracted 2.1 percentage points from Queensland’s economic growth, reflecting the continued growth in imports of goods and services from overseas and interstate of 5.8 per cent as exports were unchanged over the year to September quarter 2006. |
viii
| | |
| | Queensland State Accounts, September Quarter 2006 |
Table IV
Changes and Contribution to Growth, Quarterly, Trend, Current Prices
| | | | | | | | |
| | | Queensland | | Rest of Australia (a) |
| | | Quarterly % change Sep-06 to Dec-06 | | % point contribution to growth in GSP Sep-06 to Dec-06 | | Quarterly % change Sep-06 to Dec-06 | | % point contribution to growth in GSP Sep-06 to Dec-06 |
Compensation of employees | | 2.3 | | 1.0 | | 1.8 | | 0.9 |
Gross operating surplus and mixed income | | 1.2 | | 0.5 | | 1.6 | | 0.7 |
Gross state product at factor cost | | 1.7 | | 1.5 | | 1.8 | | 1.6 |
Taxes less subsidies on production and imports | | 3.0 | | 0.3 | | 0.8 | | 0.1 |
Gross state product | | 2.0 | | 2.0 | | 1.8 | | 1.8 |
| | | | |
Final consumption expenditure | | | | | | | | |
Households | | 0.9 | | 0.5 | | 1.5 | | 0.8 |
General government | | 0.3 | | 0.1 | | 1.9 | | 0.3 |
| | | | |
Gross fixed capital formation | | | | | | | | |
Private | | 1.9 | | 0.5 | | 0.6 | | 0.1 |
Dwellings | | 2.5 | | 0.2 | | 2.5 | | 0.1 |
Other buildings and structures | | 8.5 | | 0.6 | | 2.9 | | 0.2 |
Machinery and equipment | | -3.6 | | -0.3 | | -2.4 | | -0.2 |
| | | | |
Public enterprise | | 3.7 | | 0.1 | | 3.6 | | 0.1 |
General government | | 8.5 | | 0.3 | | 5.9 | | 0.1 |
| | | | |
Changes in inventories | | n.a. | | 0.2 | | n.a. | | 0.2 |
| | | | |
Gross state expenditure | | 1.9 | | 1.9 | | 1.9 | | 1.9 |
Exports of goods and services overseas | | -0.8 | | -0.2 | | 1.9 | | 0.4 |
Exports of goods and services interstate | | 0.7 | | 0.1 | | -2.5 | | -0.1 |
less Imports of goods and services overseas | | 1.4 | | 0.2 | | 1.5 | | 0.3 |
less Imports of goods and services interstate | | -2.5 | | -0.4 | | 0.7 | | 0.0 |
| | | | |
Gross state product | | 2.0 | | 2.0 | | 1.8 | | 1.8 |
| (a) | Due to the ABS methodology of estimating trend estimates in aggregate, rather than as the sum of the trend estimates of their components, the Rest of Australia contributions to growth are not additive. |
With respect to the current price trend quarterly changes and contributions to growth in the September quarter:
| n | Compensation of employees increased 1.8 per cent in Queensland, slightly above the growth of 1.7 per cent in the Rest of Australia. |
| n | Gross operating surplus and mixed income increased 2.2 per cent in Queensland, compared with lower growth of 1.0 per cent in the Rest of Australia. |
| n | Exports of goods and services overseas declined 0.8 per cent in the quarter. The goods component of overseas exports fell 1.7 per cent with mixed outcomes in the major categories of goods exports. The nominal value of sugar and coal exports fell by 9.2 per cent and 4.4 pert cent respectively, more than offsetting higher exports of non-ferrous metals (up 2.8 per cent) and meat (up 0.6 per cent). While the fall in the nominal value of sugar exports reflected lower sugar volumes, the decline in the nominal value of coal exports was driven by weaker coal prices (down 5.2 per cent) in the quarter. |
| n | Imports of goods and services overseas increased 0.4 per cent in the quarter with the tourism component of services imports rising by 4.8 per cent and outweighing the decline in the goods component of imports overseas (down 0.2 per cent). Imports of other machinery and transport equipment fell by 4.3 per cent and imports of mineral fuels and lubricants declined by 0.3 per cent. |
ix
| | |
| | Queensland State Accounts, September Quarter 2006 |
Table V
Changes and Contribution to Growth, Annual, Trend, Current Prices
| | | | | | | | |
| | | Queensland | | Rest of Australia (a) |
| | | Annual %
change Sep-05
to Sep-06 | | % point contribution to growth in GSP Sep-05 to Sep-06 | | Annual % change Sep-05 to Sep-06 | | % point contribution to growth in GSP Sep-05 to Sep-06 |
Compensation of employees | | 9.7 | | 4.5 | | 6.3 | | 3.0 |
Gross operating surplus and mixed income | | 11.0 | | 4.8 | | 5.2 | | 2.1 |
Gross state product at factor cost | | 10.3 | | 9.3 | | 5.8 | | 5.2 |
Taxes less subsidies on production and imports | | 9.9 | | 1.0 | | 5.2 | | 0.6 |
Gross state product | | 10.5 | | 10.5 | | 5.9 | | 5.9 |
| | | | |
Final consumption expenditure | | | | | | | | |
Households | | 7.4 | | 4.2 | | 5.6 | | 3.2 |
General government | | 15.9 | | 2.6 | | 8.8 | | 1.6 |
| | | | |
Gross fixed capital formation | | | | | | | | |
Private | | 16.4 | | 4.1 | | 3.3 | | 0.7 |
Dwellings | | 6.9 | | 0.6 | | 2.0 | | 0.1 |
Other buildings and structures | | 31.1 | | 1.7 | | 12.6 | | 0.7 |
Machinery and equipment | | 18.1 | | 1.4 | | -5.6 | | -0.4 |
| | | | |
Public enterprise | | 64.3 | | 1.4 | | 4.6 | | 0.1 |
General government | | 14.8 | | 0.5 | | -5.4 | | -0.1 |
| | | | |
Changes in inventories | | n.a. | | -0.8 | | n.a. | | -1.1 |
| | | | |
Gross state expenditure | | 11.2 | | 11.6 | | 4.8 | | 4.8 |
| | | | |
Exports of goods and services overseas | | 10.5 | | 2.4 | | 17.7 | | 3.3 |
Exports of goods and services interstate | | 6.2 | | 0.5 | | 12.8 | | 0.5 |
less Imports of goods and services overseas | | 10.2 | | 1.8 | | 11.8 | | 2.6 |
less Imports of goods and services interstate | | 12.8 | | 2.3 | | 6.2 | | 0.1 |
| | | | |
Gross state product | | 10.5 | | 10.5 | | 5.9 | | 5.9 |
| (a) | Due to the ABS methodology of estimating trend estimates in aggregate, rather than as the sum of the trend estimates of their components, the Rest of Australia contributions to growth are not additive. |
With respect to the current price annual changes and contributions to growth over the year to the September quarter:
| n | Queensland recorded growth in nominal GSP of 10.5 per cent. This was 4.6 percentage points higher than the 5.9 per cent current price growth in the Rest of Australia. |
| n | Compensation of employees rose 9.7 per cent in Queensland compared with lower growth of 6.3 per cent in the Rest of Australia. |
| n | Queensland gross operating surplus and mixed income rose 11.0 per cent compared with 5.2 per cent growth in the Rest of Australia. |
| n | Queensland exports of goods and services overseas increased 10.5 per cent in annual terms. This reflected growth in both overseas tourism services exports (up 16.2 per cent) and overseas goods exports (up 9.4 per cent). There were mixed outcomes in the major categories of overseas goods exports with higher exports of sugar (up 47.8 per cent), non-ferrous metals (up 38.4 per cent) and meat (up 3.0 per cent) and lower exports of coal (down 3.7 per cent). |
x
| | |
| | Queensland State Accounts, September Quarter 2006 |
Performance of the Queensland Economy in 2005-06
Information made available since the release of the June Quarter 2006 edition of Queensland State Accounts has resulted in the preliminary estimate of Queensland’s GSP growth of 3.8 per cent for 2005-06 being revised to 4.4 per cent. This year-average growth of 4.4 per cent in 2005-06 followed revised growth of 5.2 per cent in 2004-05 and 4.4 per cent in 2003-04.
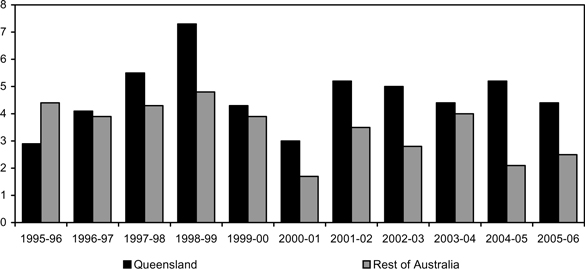
Economic growth in Queensland has been above that in the Rest of Australia for the past 10 years. The average annual growth rate in Queensland GSP for the past 10 years is 4.9 per cent compared with 3.3 per cent for the Rest of Australia (see Chart 11).
Chart 11 Economic Growth
(year-average % change, CVM, 2004-05 prices)
The growth of the Queensland economy in 2005-06 was driven by growth in domestic final demand (as measured by gross state expenditure, up 6.6 per cent) and this more than offset the detraction from growth by net exports of 2.6 percentage points.
Household final consumption expenditure grew by 4.6 per cent in 2005-06, easing from growth of 5.3 per cent in 2004-05, and contributed 2.7 percentage points to GSP in 2005-06.
Private gross fixed capital formation grew by 12.3 per cent in 2005-06 and contributed 3.0 percentage points to Queensland’s GSP growth in 2005-06. The largest contributors to growth in private capital formation were other buildings and structures (up 30.1 per cent), and machinery and equipment (up 17.8 per cent), with dwellings increasing only slightly (up 1.6 per cent).
Public final demand grew by 7.3 per cent in 2005-06, driven by solid growth in government final consumption expenditure (up 4.4 per cent) and growth in the State and local component of public enterprise gross fixed capital formation. Public enterprise gross fixed capital formation grew by 36.5 per cent and contributed 0.8 percentage point to Queensland’s economic growth over 2005-06, largely due to strong growth in State and local public enterprises investment.
As outlined above, net exports detracted 2.6 percentage points from growth in 2005-06 due to the increase in imports of goods and services from interstate and overseas (up 7.4 per cent and 7.1 per cent respectively). The high growth in import volumes resulted from the continued strength of domestic
xi
| | |
| | Queensland State Accounts, September Quarter 2006 |
economic activity, particularly business investment. Exports of goods and services interstate fell by 4.1 per cent, offsetting a 2.0 per cent rise in exports of goods and services overseas. As a result, total exports from Queensland remained unchanged over the year
The pattern of economic activity was more subdued in the Rest of Australia compared with Queensland. Gross Rest of Australia product increased 2.5 per cent in 2005-06, some 1.9 percentage points lower than Queensland. The Rest of Australia’s imports of goods and services from overseas recorded solid growth over the year (up 7.3 per cent), reflecting the strength of domestic economic activity in the region.
In the Rest of Australia, household consumption and private investment grew strongly (2.2 per cent and 8.4 per cent respectively). Further, public final demand in the Rest of Australia recorded growth of 3.3 per cent and contributed 0.7 percentage point to overall economic growth in 2005-06.
Table VII
Changes and Contribution to Growth, 2005-06, Chain Volume Measures (a)
| | | | | | | | |
| | | Queensland | | Rest of Australia |
| | | Year-average % change 2004-05 to 2005-06 | | % point contribution to growth in GSP 2004-05 to 2005-06 | | Year-average % change 2004-05 to 2005-06 | | % point contribution to growth in GSP 2004-05 to 2005-06 |
Final consumption expenditure | | | | | | | | |
Households | | 4.6 | | 2.7 | | 2.2 | | 1.2 |
General government | | 4.4 | | 0.7 | | 3.1 | | 0.6 |
| | | | |
Gross fixed capital formation | | | | | | | | |
Private (b) | | 12.1 | | 3.0 | | 8.4 | | 1.8 |
Dwellings | | 1.6 | | 0.1 | | -5.6 | | -0.3 |
Other buildings and structures (b) | | 28.6 | | 1.4 | | 21.2 | | 1.0 |
Machinery and equipment (b) | | 17.8 | | 1.4 | | 13.5 | | 1.0 |
| | | | |
Public enterprises (b) | | 34.5 | | 0.7 | | 13.0 | | 0.2 |
General government (b) | | 7.0 | | 0.2 | | -1.7 | | 0.0 |
| | | | |
Changes in inventories | | n.a. | | -0.3 | | n.a. | | -0.3 |
| | | | |
Gross state expenditure | | 6.6 | | 7.0 | | 3.3 | | 3.3 |
| | | | |
Exports of goods and services overseas | | 2.0 | | 0.4 | | 2.3 | | 0.4 |
Exports of goods and services interstate | | -4.1 | | -0.4 | | 7.4 | | 0.3 |
less Imports of goods and services overseas | | 7.1 | | 1.2 | | 7.3 | | 1.6 |
less Imports of goods and services interstate | | 7.4 | | 1.4 | | -4.1 | | -0.1 |
Gross state product | | 4.4 | | 4.4 | | 2.5 | | 2.5 |
| (a) | Chain volume measure reference year 2004-05. |
| (b) | Queensland data adjusted for net purchases of second hand public sector assets. |
xii
| | |
| | Queensland State Accounts, September Quarter 2006 |
Queensland State Accounts – Tables
| | | | |
Table | | | | Page |
| | Domestic Production Accounts – Queensland | | |
1 | | Trend, chain volume measures, $m | | 1 |
2 | | Trend, chain volume measures, quarterly % change | | 3 |
3 | | Trend, chain volume measures, quarterly contribution to growth, % point | | 5 |
4 | | Trend, chain volume measures, annual % change – quarterly | | 7 |
5 | | Trend, chain volume measures, annual contribution to growth - quarterly, % point | | 9 |
| | Explanatory Notes | | 11 |
| | |
| | Additional tables available on the Internet | | |
| | |
| | URL: http://www.oesr.qld.gov.au/releases/qsatables/ | | |
| | |
| | Domestic Production Accounts – Queensland | | |
6 | | Seasonally adjusted, chain volume measures, $m | | |
7 | | Seasonally adjusted, chain volume measures, quarterly % change | | |
8 | | Seasonally adjusted, chain volume measures, annual % change - quarterly | | |
9 | | Original, chain volume measures, $m | | |
10 | | Original, chain volume measures, annual % change - quarterly | | |
11 | | Trend, current prices, $m | | |
12 | | Trend, current prices, quarterly % change | | |
13 | | Trend, current prices, quarterly contribution to growth, % point | | |
14 | | Seasonally adjusted, current prices, $m | | |
15 | | Seasonally adjusted, current prices, quarterly % change | | |
16 | | Seasonally adjusted, current prices, quarterly contribution to growth, % point | | |
17 | | Original, current prices, $m | | |
18 | | Original, current prices, annual % change – quarterly | | |
19 | | Trend, implicit price deflators, 2004-05 = 100 | | |
20 | | Original, implicit price deflators, 2004-05 = 100 | | |
| | |
| | Domestic Production Accounts - Rest of Australia | | |
21 | | Trend, chain volume measures, $m | | |
22 | | Trend, chain volume measures, quarterly % change | | |
23 | | Seasonally adjusted, chain volume measures, $m | | |
24 | | Original, chain volume measures, $m | | |
25 | | Trend, current prices, $m | | |
26 | | Original, current prices, $m | | |
27 | | Trend, implicit price deflators, 2004-05 = 100 | | |
The Queensland State Accounts, including previous issues, additional tables and the complete time series for Queensland and the Rest of Australia, are available through the Office of Economic and Statistical Research website, at: http://www.oesr.qld.gov.au/releases/qsatables/.
xiii
| | |
| DOMESTIC PRODUCTION ACCOUNT - QUEENSLAND | | TABLE 1 |
(Trend, chain volume measure, $m)
| | | | | | | | | | | | | | | | | | | | | | | | | | |
| | | 2003-04 | | 2004-05 | | 2005-06 | | 2006-07 |
| | | Sep | | Dec | | Mar | | Jun | | Sep | | Dec | | Mar | | Jun | | Sep | | Dec | | Mar | | Jun | | Sep |
Household final consumption expenditure | | 21,840 | | 22,576 | | 23,111 | | 23,439 | | 23,617 | | 23,810 | | 24,072 | | 24,432 | | 24,744 | | 24,963 | | 25,146 | | 25,363 | | 25,605 |
Internal consumption expenditure | | 20,958 | | 21,630 | | 22,135 | | 22,478 | | 22,673 | | 22,857 | | 23,101 | | 23,461 | | 23,789 | | 24,003 | | 24,132 | | 24,290 | | 24,478 |
Non-tourism | | 20,084 | | 20,759 | | 21,268 | | 21,626 | | 21,811 | | 21,992 | | 22,257 | | 22,649 | | 23,005 | | 23,210 | | 23,324 | | 23,509 | | 23,738 |
Tourism | | 874 | | 871 | | 867 | | 852 | | 862 | | 865 | | 844 | | 812 | | 784 | | 793 | | 808 | | 781 | | 740 |
External consumption expenditure | | 882 | | 946 | | 976 | | 961 | | 944 | | 953 | | 971 | | 971 | | 955 | | 960 | | 1,014 | | 1,073 | | 1,127 |
Imports of tourism services, overseas | | 281 | | 324 | | 361 | | 385 | | 402 | | 415 | | 426 | | 427 | | 423 | | 423 | | 438 | | 461 | | 485 |
Imports of tourism services, interstate | | 601 | | 622 | | 615 | | 576 | | 542 | | 538 | | 545 | | 544 | | 532 | | 537 | | 576 | | 612 | | 642 |
| | | | | | | | | | | | | |
General government final consumption expenditure | | 6,523 | | 6,569 | | 6,618 | | 6,694 | | 6,796 | | 6,869 | | 6,906 | | 6,937 | | 6,986 | | 7,092 | | 7,242 | | 7,383 | | 7,485 |
National | | 2,288 | | 2,291 | | 2,291 | | 2,323 | | 2,383 | | 2,430 | | 2,447 | | 2,449 | | 2,455 | | 2,476 | | 2,524 | | 2,583 | | 2,635 |
State and local | | 4,235 | | 4,278 | | 4,327 | | 4,371 | | 4,413 | | 4,439 | | 4,459 | | 4,488 | | 4,531 | | 4,616 | | 4,718 | | 4,800 | | 4,850 |
| | | | | | | | | | | | | |
Private gross fixed capital formation | | 9,009 | | 9,315 | | 9,591 | | 9,762 | | 9,829 | | 9,933 | | 10,087 | | 10,362 | | 10,752 | | 11,159 | | 11,546 | | 11,907 | | 12,174 |
Dwellings | | 3,379 | | 3,512 | | 3,604 | | 3,613 | | 3,604 | | 3,635 | | 3,675 | | 3,725 | | 3,722 | | 3,686 | | 3,694 | | 3,762 | | 3,859 |
Other buildings and structures | | 1,649 | | 1,702 | | 1,782 | | 1,831 | | 1,862 | | 1,898 | | 1,959 | | 2,121 | | 2,317 | | 2,472 | | 2,571 | | 2,678 | | 2,799 |
Machinery and equipment | | 2,512 | | 2,584 | | 2,738 | | 2,955 | | 3,076 | | 3,132 | | 3,172 | | 3,234 | | 3,432 | | 3,701 | | 3,939 | | 4,092 | | 4,127 |
Livestock | | 179 | | 216 | | 224 | | 218 | | 221 | | 222 | | 223 | | 224 | | 225 | | 227 | | 227 | | 225 | | 223 |
Intangible fixed assets | | 270 | | 277 | | 282 | | 287 | | 292 | | 299 | | 305 | | 309 | | 316 | | 328 | | 342 | | 353 | | 360 |
Ownership transfer costs | | 1,020 | | 1,024 | | 961 | | 858 | | 774 | | 747 | | 753 | | 749 | | 740 | | 745 | | 773 | | 797 | | 806 |
| | | | | | | | | | | | | |
Public enterprises gross fixed capital formation | | 396 | | 457 | | 609 | | 729 | | 796 | | 835 | | 882 | | 956 | | 998 | | 1,072 | | 1,182 | | 1,302 | | 1,385 |
Commonwealth | | 125 | | 121 | | 137 | | 159 | | 173 | | 172 | | 162 | | 160 | | 172 | | 196 | | 214 | | 218 | | 209 |
State and local | | 271 | | 336 | | 472 | | 570 | | 623 | | 663 | | 720 | | 796 | | 826 | | 876 | | 968 | | 1,084 | | 1,176 |
| | | | | | | | | | | | | |
General government gross fixed capital formation | | 1,019 | | 1,098 | | 1,143 | | 1,141 | | 1,120 | | 1,127 | | 1,191 | | 1,269 | | 1,323 | | 1,302 | | 1,295 | | 1,359 | | 1,451 |
National | | 149 | | 167 | | 173 | | 162 | | 145 | | 136 | | 140 | | 145 | | 143 | | 137 | | 134 | | 135 | | 138 |
State and local | | 870 | | 931 | | 970 | | 979 | | 975 | | 991 | | 1,051 | | 1,124 | | 1,180 | | 1,165 | | 1,161 | | 1,224 | | 1,313 |
| | | | | | | | | | | | | |
Change in inventories | | 334 | | 266 | | 179 | | 110 | | 90 | | 132 | | 184 | | 207 | | 197 | | 131 | | 48 | | -36 | | -107 |
Statistical discrepancy (E) | | -4 | | 19 | | 44 | | 67 | | 63 | | 48 | | -5 | | -51 | | -72 | | -71 | | -61 | | -41 | | -2 |
| | | | | | | | | | | | | |
Gross state expenditure | | 39,117 | | 40,300 | | 41,295 | | 41,942 | | 42,311 | | 42,754 | | 43,317 | | 44,112 | | 44,928 | | 45,648 | | 46,398 | | 47,237 | | 47,991 |
| | | | | | | | | | | | | |
Exports of goods and services | | 11,697 | | 11,735 | | 11,841 | | 11,891 | | 12,025 | | 12,216 | | 12,295 | | 12,247 | | 12,230 | | 12,293 | | 12,365 | | 12,336 | | 12,229 |
| | | | | | | | | | | | | |
Exports of goods and services, overseas | | 7,804 | | 7,884 | | 8,060 | | 8,156 | | 8,278 | | 8,441 | | 8,540 | | 8,563 | | 8,584 | | 8,655 | | 8,714 | | 8,691 | | 8,624 |
Exports of goods, overseas | | 6,234 | | 6,273 | | 6,411 | | 6,489 | | 6,579 | | 6,730 | | 6,823 | | 6,836 | | 6,850 | | 6,883 | | 6,881 | | 6,801 | | 6,687 |
Exports of services, less tourism services, overseas | | 985 | | 1,007 | | 1,027 | | 1,029 | | 1,030 | | 1,021 | | 1,025 | | 1,052 | | 1,082 | | 1,117 | | 1,152 | | 1,183 | | 1,209 |
Exports of tourism services, overseas | | 585 | | 604 | | 622 | | 638 | | 669 | | 690 | | 692 | | 675 | | 652 | | 655 | | 681 | | 707 | | 728 |
Exports of goods and services, interstate | | 3,893 | | 3,851 | | 3,781 | | 3,735 | | 3,747 | | 3,775 | | 3,755 | | 3,684 | | 3,646 | | 3,638 | | 3,651 | | 3,645 | | 3,605 |
Exports of goods, interstate | | 2,611 | | 2,624 | | 2,544 | | 2,445 | | 2,412 | | 2,449 | | 2,495 | | 2,505 | | 2,517 | | 2,507 | | 2,487 | | 2,474 | | 2,468 |
Exports of services, less tourism services, interstate | | — | | — | | — | | — | | — | | — | | — | | — | | — | | — | | — | | — | | — |
Exports of tourism services, interstate | | 1,282 | | 1,227 | | 1,237 | | 1,290 | | 1,335 | | 1,326 | | 1,260 | | 1,179 | | 1,129 | | 1,131 | | 1,164 | | 1,171 | | 1,137 |
less Imports of goods and services | | 12,931 | | 13,661 | | 14,180 | | 14,394 | | 14,464 | | 14,566 | | 14,643 | | 14,830 | | 15,248 | | 15,715 | | 16,028 | | 16,159 | | 16,127 |
| | | | | | | | | | | | | |
less Imports of goods and services, overseas | | 5,682 | | 6,027 | | 6,385 | | 6,714 | | 6,937 | | 7,100 | | 7,229 | | 7,324 | | 7,494 | | 7,683 | | 7,787 | | 7,819 | | 7,788 |
less Imports of goods, overseas | | 4,218 | | 4,443 | | 4,715 | | 5,008 | | 5,201 | | 5,323 | | 5,413 | | 5,494 | | 5,661 | | 5,837 | | 5,902 | | 5,885 | | 5,805 |
less Imports of services, less tourism services, overseas | | 1,183 | | 1,260 | | 1,309 | | 1,321 | | 1,334 | | 1,362 | | 1,390 | | 1,403 | | 1,410 | | 1,423 | | 1,447 | | 1,473 | | 1,498 |
less Imports of tourism services, overseas | | 281 | | 324 | | 361 | | 385 | | 402 | | 415 | | 426 | | 427 | | 423 | | 423 | | 438 | | 461 | | 485 |
| | | | | | | | | | | | | |
less Imports of goods and services, interstate | | 7,249 | | 7,634 | | 7,795 | | 7,680 | | 7,527 | | 7,466 | | 7,414 | | 7,506 | | 7,754 | | 8,032 | | 8,241 | | 8,340 | | 8,339 |
less Imports of goods, interstate | | 6,648 | | 7,012 | | 7,180 | | 7,104 | | 6,985 | | 6,928 | | 6,869 | | 6,962 | | 7,222 | | 7,495 | | 7,665 | | 7,728 | | 7,697 |
less Imports of services, less tourism services, interstate | | — | | — | | — | | — | | — | | — | | — | | — | | — | | — | | — | | — | | — |
less Imports of tourism services, interstate | | 601 | | 622 | | 615 | | 576 | | 542 | | 538 | | 545 | | 544 | | 532 | | 537 | | 576 | | 612 | | 642 |
| | | | | | | | | | | | | |
Expenditure on gross state product | | 37,883 | | 38,374 | | 38,956 | | 39,439 | | 39,872 | | 40,404 | | 40,969 | | 41,529 | | 41,910 | | 42,226 | | 42,735 | | 43,414 | | 44,093 |
Chain volume measure reference year 2004-05
1
| | |
| DOMESTIC PRODUCTION ACCOUNT - QUEENSLAND | | TABLE 2 |
(Trend, chain volume measure, quarterly percentage change, %)
| | | | | | | | | | | | | | | | | | | | | | | | | | |
| | | 2003-04 | | 2004-05 | | 2005-06 | | 2006-07 |
| | Sep | | Dec | | Mar | | Jun | | Sep | | Dec | | Mar | | Jun | | Sep | | Dec | | Mar | | Jun | | Sep |
Household final consumption expenditure | | 3.5 | | 3.4 | | 2.4 | | 1.4 | | 0.8 | | 0.8 | | 1.1 | | 1.5 | | 1.3 | | 0.9 | | 0.7 | | 0.9 | | 1.0 |
Internal consumption expenditure | | 3.2 | | 3.2 | | 2.3 | | 1.5 | | 0.9 | | 0.8 | | 1.1 | | 1.6 | | 1.4 | | 0.9 | | 0.5 | | 0.7 | | 0.8 |
Non-tourism | | 3.3 | | 3.4 | | 2.5 | | 1.7 | | 0.9 | | 0.8 | | 1.2 | | 1.8 | | 1.6 | | 0.9 | | 0.5 | | 0.8 | | 1.0 |
Tourism | | 2.2 | | -0.3 | | -0.5 | | -1.7 | | 1.2 | | 0.3 | | -2.4 | | -3.8 | | -3.4 | | 1.1 | | 1.9 | | -3.3 | | -5.2 |
External consumption expenditure | | 10.9 | | 7.3 | | 3.2 | | -1.5 | | -1.8 | | 1.0 | | 1.9 | | 0.0 | | -1.6 | | 0.5 | | 5.6 | | 5.8 | | 5.0 |
Imports of tourism services, overseas | | 12.0 | | 15.3 | | 11.4 | | 6.6 | | 4.4 | | 3.2 | | 2.7 | | 0.2 | | -0.9 | | 0.0 | | 3.5 | | 5.3 | | 5.2 |
Imports of tourism services, interstate | | 10.5 | | 3.5 | | -1.1 | | -6.3 | | -5.9 | | -0.7 | | 1.3 | | -0.2 | | -2.2 | | 0.9 | | 7.3 | | 6.2 | | 4.9 |
| | | | | | | | | | | | | |
General government final consumption expenditure | | 1.1 | | 0.7 | | 0.7 | | 1.1 | | 1.5 | | 1.1 | | 0.5 | | 0.4 | | 0.7 | | 1.5 | | 2.1 | | 1.9 | | 1.4 |
National | | 1.5 | | 0.1 | | 0.0 | | 1.4 | | 2.6 | | 2.0 | | 0.7 | | 0.1 | | 0.2 | | 0.9 | | 1.9 | | 2.3 | | 2.0 |
State and local | | 0.9 | | 1.0 | | 1.1 | | 1.0 | | 1.0 | | 0.6 | | 0.5 | | 0.7 | | 1.0 | | 1.9 | | 2.2 | | 1.7 | | 1.0 |
| | | | | | | | | | | | | |
Private gross fixed capital formation | | 2.6 | | 3.4 | | 3.0 | | 1.8 | | 0.7 | | 1.1 | | 1.6 | | 2.7 | | 3.8 | | 3.8 | | 3.5 | | 3.1 | | 2.2 |
Dwellings | | 2.4 | | 3.9 | | 2.6 | | 0.2 | | -0.2 | | 0.9 | | 1.1 | | 1.4 | | -0.1 | | -1.0 | | 0.2 | | 1.8 | | 2.6 |
Other buildings and structures | | -0.1 | | 3.2 | | 4.7 | | 2.7 | | 1.7 | | 1.9 | | 3.2 | | 8.3 | | 9.2 | | 6.7 | | 4.0 | | 4.2 | | 4.5 |
Machinery and equipment | | 1.5 | | 2.9 | | 6.0 | | 7.9 | | 4.1 | | 1.8 | | 1.3 | | 2.0 | | 6.1 | | 7.8 | | 6.4 | | 3.9 | | 0.9 |
Livestock | | 42.1 | | 20.7 | | 3.7 | | -2.7 | | 1.4 | | 0.5 | | 0.5 | | 0.4 | | 0.4 | | 0.9 | | 0.0 | | -0.9 | | -0.9 |
Intangible fixed assets | | 1.5 | | 2.6 | | 1.8 | | 1.8 | | 1.7 | | 2.4 | | 2.0 | | 1.3 | | 2.3 | | 3.8 | | 4.3 | | 3.2 | | 2.0 |
Ownership transfer costs | | 5.8 | | 0.4 | | -6.2 | | -10.7 | | -9.8 | | -3.5 | | 0.8 | | -0.5 | | -1.2 | | 0.7 | | 3.8 | | 3.1 | | 1.1 |
| | | | | | | | | | | | | |
Public enterprises gross fixed capital formation | | -19.2 | | 15.4 | | 33.3 | | 19.7 | | 9.2 | | 4.9 | | 5.6 | | 8.4 | | 4.4 | | 7.4 | | 10.3 | | 10.2 | | 6.4 |
Commonwealth | | -5.3 | | -3.2 | | 13.2 | | 16.1 | | 8.8 | | -0.6 | | -5.8 | | -1.2 | | 7.5 | | 14.0 | | 9.2 | | 1.9 | | -4.1 |
State and local | | -24.3 | | 24.0 | | 40.5 | | 20.8 | | 9.3 | | 6.4 | | 8.6 | | 10.6 | | 3.8 | | 6.1 | | 10.5 | | 12.0 | | 8.5 |
| | | | | | | | | | | | | |
General government gross fixed capital formation | | 4.1 | | 7.8 | | 4.1 | | -0.2 | | -1.8 | | 0.6 | | 5.7 | | 6.5 | | 4.3 | | -1.6 | | -0.5 | | 4.9 | | 6.8 |
National | | 9.6 | | 12.1 | | 3.6 | | -6.4 | | -10.5 | | -6.2 | | 2.9 | | 3.6 | | -1.4 | | -4.2 | | -2.2 | | 0.7 | | 2.2 |
State and local | | 3.2 | | 7.0 | | 4.2 | | 0.9 | | -0.4 | | 1.6 | | 6.1 | | 6.9 | | 5.0 | | -1.3 | | -0.3 | | 5.4 | | 7.3 |
| | | | | | | | | | | | | |
Gross state expenditure | | 2.9 | | 3.0 | | 2.5 | | 1.6 | | 0.9 | | 1.0 | | 1.3 | | 1.8 | | 1.8 | | 1.6 | | 1.6 | | 1.8 | | 1.6 |
| | | | | | | | | | | | | |
Exports of goods and services | | -0.8 | | 0.3 | | 0.9 | | 0.4 | | 1.1 | | 1.6 | | 0.6 | | -0.4 | | -0.1 | | 0.5 | | 0.6 | | -0.2 | | -0.9 |
| | | | | | | | | | | | | |
Exports of goods and services, overseas | | -1.4 | | 1.0 | | 2.2 | | 1.2 | | 1.5 | | 2.0 | | 1.2 | | 0.3 | | 0.2 | | 0.8 | | 0.7 | | -0.3 | | -0.8 |
Exports of goods, overseas | | -1.8 | | 0.6 | | 2.2 | | 1.2 | | 1.4 | | 2.3 | | 1.4 | | 0.2 | | 0.2 | | 0.5 | | 0.0 | | -1.2 | | -1.7 |
Exports of services, less tourism services, overseas | | -0.4 | | 2.2 | | 2.0 | | 0.2 | | 0.1 | | -0.9 | | 0.4 | | 2.6 | | 2.9 | | 3.2 | | 3.1 | | 2.7 | | 2.2 |
Exports of tourism services, overseas | | 1.2 | | 3.2 | | 3.0 | | 2.6 | | 4.9 | | 3.1 | | 0.3 | | -2.5 | | -3.4 | | 0.5 | | 4.0 | | 3.8 | | 3.0 |
| | | | | | | | | | | | | |
Exports of goods and services, interstate | | 0.5 | | -1.1 | | -1.8 | | -1.2 | | 0.3 | | 0.7 | | -0.5 | | -1.9 | | -1.0 | | -0.2 | | 0.4 | | -0.2 | | -1.1 |
Exports of goods, interstate | | 3.1 | | 0.5 | | -3.0 | | -3.9 | | -1.3 | | 1.5 | | 1.9 | | 0.4 | | 0.5 | | -0.4 | | -0.8 | | -0.5 | | -0.2 |
Exports of services, less tourism services, interstate | | — | | — | | — | | — | | — | | — | | — | | — | | — | | — | | — | | — | | — |
Exports of tourism services, interstate | | -4.3 | | -4.3 | | 0.8 | | 4.3 | | 3.5 | | -0.7 | | -5.0 | | -6.4 | | -4.2 | | 0.2 | | 2.9 | | 0.6 | | -2.9 |
less Imports of goods and services | | 5.6 | | 5.6 | | 3.8 | | 1.5 | | 0.5 | | 0.7 | | 0.5 | | 1.3 | | 2.8 | | 3.1 | | 2.0 | | 0.8 | | -0.2 |
| | | | | | | | | | | | | |
less Imports of goods and services, overseas | | 4.4 | | 6.1 | | 5.9 | | 5.2 | | 3.3 | | 2.3 | | 1.8 | | 1.3 | | 2.3 | | 2.5 | | 1.4 | | 0.4 | | -0.4 |
less Imports of goods, overseas | | 3.7 | | 5.3 | | 6.1 | | 6.2 | | 3.9 | | 2.3 | | 1.7 | | 1.5 | | 3.0 | | 3.1 | | 1.1 | | -0.3 | | -1.4 |
less Imports of services, less tourism services, overseas | | 5.5 | | 6.5 | | 3.9 | | 0.9 | | 1.0 | | 2.1 | | 2.1 | | 0.9 | | 0.5 | | 0.9 | | 1.7 | | 1.8 | | 1.7 |
less Imports of tourism services, overseas | | 12.0 | | 15.3 | | 11.4 | | 6.6 | | 4.4 | | 3.2 | | 2.7 | | 0.2 | | -0.9 | | 0.0 | | 3.5 | | 5.3 | | 5.2 |
| | | | | | | | | | | | | |
less Imports of goods and services, interstate | | 6.4 | | 5.3 | | 2.1 | | -1.5 | | -2.0 | | -0.8 | | -0.7 | | 1.2 | | 3.3 | | 3.6 | | 2.6 | | 1.2 | | 0.0 |
less Imports of goods, interstate | | 6.1 | | 5.5 | | 2.4 | | -1.1 | | -1.7 | | -0.8 | | -0.9 | | 1.4 | | 3.7 | | 3.8 | | 2.3 | | 0.8 | | -0.4 |
less Imports of services, less tourism services, interstate | | — | | — | | — | | — | | — | | — | | — | | — | | — | | — | | — | | — | | — |
less Imports of tourism services, interstate | | 10.5 | | 3.5 | | -1.1 | | -6.3 | | -5.9 | | -0.7 | | 1.3 | | -0.2 | | -2.2 | | 0.9 | | 7.3 | | 6.2 | | 4.9 |
| | | | | | | | | | | | | |
Expenditure on gross state product | | 0.9 | | 1.3 | | 1.5 | | 1.2 | | 1.1 | | 1.3 | | 1.4 | | 1.4 | | 0.9 | | 0.8 | | 1.2 | | 1.6 | | 1.6 |
Chain volume measure reference year 2004-05
2
| | |
| DOMESTIC PRODUCTION ACCOUNT - QUEENSLAND | | TABLE 3 |
(Trend, chain volume measure, quarterly contributions to growth, %)
| | | | | | | | | | | | | | | | | | | | | | | | | | |
| | | 2003-04 | | 2004-05 | | 2005-06 | | 2006-07 |
| | Sep | | Dec | | Mar | | Jun | | Sep | | Dec | | Mar | | Jun | | Sep | | Dec | | Mar | | Jun | | Sep |
Household final consumption expenditure | | 2.0 | | 1.9 | | 1.4 | | 0.8 | | 0.5 | | 0.5 | | 0.6 | | 0.9 | | 0.8 | | 0.5 | | 0.4 | | 0.5 | | 0.6 |
Internal consumption expenditure | | 1.7 | | 1.8 | | 1.3 | | 0.9 | | 0.5 | | 0.5 | | 0.6 | | 0.9 | | 0.8 | | 0.5 | | 0.3 | | 0.4 | | 0.4 |
Non-tourism | | 1.7 | | 1.8 | | 1.3 | | 0.9 | | 0.5 | | 0.5 | | 0.7 | | 1.0 | | 0.9 | | 0.5 | | 0.3 | | 0.4 | | 0.5 |
Tourism | | 0.1 | | 0.0 | | 0.0 | | 0.0 | | 0.0 | | 0.0 | | -0.1 | | -0.1 | | -0.1 | | 0.0 | | 0.0 | | -0.1 | | -0.1 |
External consumption expenditure | | 0.2 | | 0.2 | | 0.1 | | 0.0 | | 0.0 | | 0.0 | | 0.0 | | 0.0 | | 0.0 | | 0.0 | | 0.1 | | 0.1 | | 0.1 |
Imports of tourism services, overseas | | 0.1 | | 0.1 | | 0.1 | | 0.1 | | 0.0 | | 0.0 | | 0.0 | | 0.0 | | 0.0 | | 0.0 | | 0.0 | | 0.1 | | 0.1 |
Imports of tourism services, interstate | | 0.2 | | 0.1 | | 0.0 | | -0.1 | | -0.1 | | 0.0 | | 0.0 | | 0.0 | | 0.0 | | 0.0 | | 0.1 | | 0.1 | | 0.1 |
| | | | | | | | | | | | | |
General government final consumption expenditure | | 0.2 | | 0.1 | | 0.1 | | 0.2 | | 0.3 | | 0.2 | | 0.1 | | 0.1 | | 0.1 | | 0.3 | | 0.4 | | 0.3 | | 0.2 |
National | | 0.1 | | 0.0 | | 0.0 | | 0.1 | | 0.2 | | 0.1 | | 0.0 | | 0.0 | | 0.0 | | 0.1 | | 0.1 | | 0.1 | | 0.1 |
State and local | | 0.1 | | 0.1 | | 0.1 | | 0.1 | | 0.1 | | 0.1 | | 0.0 | | 0.1 | | 0.1 | | 0.2 | | 0.2 | | 0.2 | | 0.1 |
| | | | | | | | | | | | | |
Private gross fixed capital formation | | 0.6 | | 0.8 | | 0.7 | | 0.4 | | 0.2 | | 0.3 | | 0.4 | | 0.7 | | 0.9 | | 1.0 | | 0.9 | | 0.8 | | 0.6 |
Dwellings | | 0.2 | | 0.4 | | 0.2 | | 0.0 | | 0.0 | | 0.1 | | 0.1 | | 0.1 | | 0.0 | | -0.1 | | 0.0 | | 0.2 | | 0.2 |
Other buildings and structures | | 0.0 | | 0.1 | | 0.2 | | 0.1 | | 0.1 | | 0.1 | | 0.2 | | 0.4 | | 0.5 | | 0.4 | | 0.2 | | 0.3 | | 0.3 |
Machinery and equipment | | 0.1 | | 0.2 | | 0.4 | | 0.6 | | 0.3 | | 0.1 | | 0.1 | | 0.2 | | 0.5 | | 0.6 | | 0.6 | | 0.4 | | 0.1 |
Livestock | | 0.1 | | 0.1 | | 0.0 | | 0.0 | | 0.0 | | 0.0 | | 0.0 | | 0.0 | | 0.0 | | 0.0 | | 0.0 | | 0.0 | | 0.0 |
Intangible fixed assets | | 0.0 | | 0.0 | | 0.0 | | 0.0 | | 0.0 | | 0.0 | | 0.0 | | 0.0 | | 0.0 | | 0.0 | | 0.0 | | 0.0 | | 0.0 |
Ownership transfer costs | | 0.1 | | 0.0 | | -0.2 | | -0.3 | | -0.2 | | -0.1 | | 0.0 | | 0.0 | | 0.0 | | 0.0 | | 0.1 | | 0.1 | | 0.0 |
| | | | | | | | | | | | | |
Public enterprises gross fixed capital formation | | -0.3 | | 0.2 | | 0.4 | | 0.3 | | 0.2 | | 0.1 | | 0.1 | | 0.2 | | 0.1 | | 0.2 | | 0.3 | | 0.3 | | 0.2 |
Commonwealth | | 0.0 | | 0.0 | | 0.0 | | 0.1 | | 0.0 | | 0.0 | | 0.0 | | 0.0 | | 0.0 | | 0.1 | | 0.0 | | 0.0 | | 0.0 |
State and local | | -0.2 | | 0.2 | | 0.4 | | 0.3 | | 0.1 | | 0.1 | | 0.1 | | 0.2 | | 0.1 | | 0.1 | | 0.2 | | 0.3 | | 0.2 |
| | | | | | | | | | | | | |
General government gross fixed capital formation | | 0.1 | | 0.2 | | 0.1 | | 0.0 | | -0.1 | | 0.0 | | 0.2 | | 0.2 | | 0.1 | | -0.1 | | 0.0 | | 0.1 | | 0.2 |
National | | 0.0 | | 0.0 | | 0.0 | | 0.0 | | 0.0 | | 0.0 | | 0.0 | | 0.0 | | 0.0 | | 0.0 | | 0.0 | | 0.0 | | 0.0 |
State and local | | 0.1 | | 0.2 | | 0.1 | | 0.0 | | 0.0 | | 0.0 | | 0.1 | | 0.2 | | 0.1 | | 0.0 | | 0.0 | | 0.1 | | 0.2 |
| | | | | | | | | | | | | |
Change in inventories | | 0.2 | | -0.2 | | -0.2 | | -0.2 | | -0.1 | | 0.1 | | 0.1 | | 0.1 | | 0.0 | | -0.2 | | -0.2 | | -0.2 | | -0.2 |
Statistical discrepancy (E) | | 0.1 | | 0.1 | | 0.1 | | 0.1 | | 0.0 | | 0.0 | | -0.1 | | -0.1 | | -0.1 | | 0.0 | | 0.0 | | 0.0 | | 0.1 |
| | | | | | | | | | | | | |
Gross state expenditure | | 3.0 | | 3.1 | | 2.6 | | 1.7 | | 0.9 | | 1.1 | | 1.4 | | 1.9 | | 2.0 | | 1.7 | | 1.8 | | 2.0 | | 1.7 |
| | | | | | | | | | | | | |
Exports of goods and services | | -0.2 | | 0.1 | | 0.3 | | 0.1 | | 0.3 | | 0.5 | | 0.2 | | -0.1 | | 0.0 | | 0.2 | | 0.2 | | -0.1 | | -0.2 |
Exports of goods and services, overseas | | -0.3 | | 0.2 | | 0.5 | | 0.2 | | 0.3 | | 0.4 | | 0.2 | | 0.1 | | 0.1 | | 0.2 | | 0.1 | | -0.1 | | -0.2 |
Exports of goods, overseas | | -0.3 | | 0.1 | | 0.4 | | 0.2 | | 0.2 | | 0.4 | | 0.2 | | 0.0 | | 0.0 | | 0.1 | | 0.0 | | -0.2 | | -0.3 |
Exports of services, less tourism services, overseas | | 0.0 | | 0.1 | | 0.1 | | 0.0 | | 0.0 | | 0.0 | | 0.0 | | 0.1 | | 0.1 | | 0.1 | | 0.1 | | 0.1 | | 0.1 |
Exports of tourism services, overseas | | 0.0 | | 0.1 | | 0.0 | | 0.0 | | 0.1 | | 0.1 | | 0.0 | | 0.0 | | -0.1 | | 0.0 | | 0.1 | | 0.1 | | 0.0 |
| | | | | | | | | | | | | |
Exports of goods and services, interstate | | 0.1 | | -0.1 | | -0.2 | | -0.1 | | 0.0 | | 0.1 | | 0.0 | | -0.2 | | -0.1 | | 0.0 | | 0.0 | | 0.0 | | -0.1 |
Exports of goods, interstate | | 0.2 | | 0.0 | | -0.2 | | -0.3 | | -0.1 | | 0.1 | | 0.1 | | 0.0 | | 0.0 | | 0.0 | | 0.0 | | 0.0 | | 0.0 |
Exports of services, less tourism services, interstate | | — | | — | | — | | — | | — | | — | | — | | — | | — | | — | | — | | — | | — |
Exports of tourism services, interstate | | -0.2 | | -0.1 | | 0.0 | | 0.1 | | 0.1 | | 0.0 | | -0.2 | | -0.2 | | -0.1 | | 0.0 | | 0.1 | | 0.0 | | -0.1 |
less Imports of goods and services | | 1.8 | | 1.9 | | 1.4 | | 0.5 | | 0.2 | | 0.3 | | 0.2 | | 0.5 | | 1.0 | | 1.1 | | 0.7 | | 0.3 | | -0.1 |
| | | | | | | | | | | | | |
less Imports of goods and services, overseas | | 0.6 | | 0.9 | | 0.9 | | 0.8 | | 0.6 | | 0.4 | | 0.3 | | 0.2 | | 0.4 | | 0.5 | | 0.2 | | 0.1 | | -0.1 |
less Imports of goods, overseas | | 0.4 | | 0.6 | | 0.7 | | 0.8 | | 0.5 | | 0.3 | | 0.2 | | 0.2 | | 0.4 | | 0.4 | | 0.2 | | 0.0 | | -0.2 |
less Imports of services, less tourism services, overseas | | 0.2 | | 0.2 | | 0.1 | | 0.0 | | 0.0 | | 0.1 | | 0.1 | | 0.0 | | 0.0 | | 0.0 | | 0.1 | | 0.1 | | 0.1 |
less Imports of tourism services, overseas | | 0.1 | | 0.1 | | 0.1 | | 0.1 | | 0.0 | | 0.0 | | 0.0 | | 0.0 | | 0.0 | | 0.0 | | 0.0 | | 0.1 | | 0.1 |
| | | | | | | | | | | | | |
less Imports of goods and services, interstate | | 1.2 | | 1.0 | | 0.4 | | -0.3 | | -0.4 | | -0.2 | | -0.1 | | 0.2 | | 0.6 | | 0.7 | | 0.5 | | 0.2 | | 0.0 |
less Imports of goods, interstate | | 1.0 | | 1.0 | | 0.4 | | -0.2 | | -0.3 | | -0.1 | | -0.1 | | 0.2 | | 0.6 | | 0.7 | | 0.4 | | 0.1 | | -0.1 |
less Imports of services, less tourism services, interstate | | — | | — | | — | | — | | — | | — | | — | | — | | — | | — | | — | | — | | — |
less Imports of tourism services, interstate | | 0.2 | | 0.1 | | 0.0 | | -0.1 | | -0.1 | | 0.0 | | 0.0 | | 0.0 | | 0.0 | | 0.0 | | 0.1 | | 0.1 | | 0.1 |
| | | | | | | | | | | | | |
Expenditure on gross state product | | 0.9 | | 1.3 | | 1.5 | | 1.2 | | 1.1 | | 1.3 | | 1.4 | | 1.4 | | 0.9 | | 0.8 | | 1.2 | | 1.6 | | 1.6 |
Chain volume measure reference year 2004-05
3
| | |
| DOMESTIC PRODUCTION ACCOUNT - QUEENSLAND | | TABLE 4 |
(Trend, chain volume measure, annual percentage change - quarterly, %)
| | | | | | | | | | | | | | | | | | | | | | | | | | |
| | | 2003-04 | | 2004-05 | | 2005-06 | | 2006-07 |
| | Sep | | Dec | | Mar | | Jun | | Sep | | Dec | | Mar | | Jun | | Sep | | Dec | | Mar | | Jun | | Sep |
Household final consumption expenditure | | 7.1 | | 10.4 | | 12.2 | | 11.1 | | 8.1 | | 5.5 | | 4.2 | | 4.2 | | 4.8 | | 4.8 | | 4.5 | | 3.8 | | 3.5 |
Internal consumption expenditure | | 6.6 | | 9.7 | | 11.4 | | 10.7 | | 8.2 | | 5.7 | | 4.4 | | 4.4 | | 4.9 | | 5.0 | | 4.5 | | 3.5 | | 2.9 |
Non-tourism | | 6.8 | | 10.1 | | 11.9 | | 11.2 | | 8.6 | | 5.9 | | 4.7 | | 4.7 | | 5.5 | | 5.5 | | 4.8 | | 3.8 | | 3.2 |
Tourism | | 2.2 | | 0.5 | | 0.9 | | -0.4 | | -1.4 | | -0.7 | | -2.7 | | -4.7 | | -9.0 | | -8.3 | | -4.3 | | -3.8 | | -5.6 |
External consumption expenditure | | 21.2 | | 31.6 | | 33.0 | | 20.9 | | 7.0 | | 0.7 | | -0.5 | | 1.0 | | 1.2 | | 0.7 | | 4.4 | | 10.5 | | 18.0 |
Imports of tourism services, overseas | | 18.1 | | 35.6 | | 50.4 | | 53.4 | | 43.1 | | 28.1 | | 18.0 | | 10.9 | | 5.2 | | 1.9 | | 2.8 | | 8.0 | | 14.7 |
Imports of tourism services, interstate | | 22.7 | | 29.6 | | 24.5 | | 5.9 | | -9.8 | | -13.5 | | -11.4 | | -5.6 | | -1.8 | | -0.2 | | 5.7 | | 12.5 | | 20.7 |
| | | | | | | | | | | | | |
General government final consumption expenditure | | 6.3 | | 5.6 | | 4.4 | | 3.7 | | 4.2 | | 4.6 | | 4.4 | | 3.6 | | 2.8 | | 3.2 | | 4.9 | | 6.4 | | 7.1 |
National | | 9.2 | | 7.7 | | 4.8 | | 3.1 | | 4.2 | | 6.1 | | 6.8 | | 5.4 | | 3.0 | | 1.9 | | 3.1 | | 5.5 | | 7.3 |
State and local | | 4.8 | | 4.6 | | 4.2 | | 4.1 | �� | 4.2 | | 3.8 | | 3.1 | | 2.7 | | 2.7 | | 4.0 | | 5.8 | | 7.0 | | 7.0 |
| | | | | | | | | | | | | |
Private gross fixed capital formation | | 8.8 | | 7.9 | | 10.1 | | 11.1 | | 9.1 | | 6.6 | | 5.2 | | 6.1 | | 9.4 | | 12.3 | | 14.5 | | 14.9 | | 13.2 |
Dwellings | | 3.6 | | 4.6 | | 8.4 | | 9.5 | | 6.7 | | 3.5 | | 2.0 | | 3.1 | | 3.3 | | 1.4 | | 0.5 | | 1.0 | | 3.7 |
Other buildings and structures | | -3.9 | | -4.4 | | 4.2 | | 11.0 | | 12.9 | | 11.5 | | 9.9 | | 15.8 | | 24.4 | | 30.2 | | 31.2 | | 26.3 | | 20.8 |
Machinery and equipment | | 21.4 | | 13.3 | | 13.0 | | 19.3 | | 22.5 | | 21.2 | | 15.9 | | 9.4 | | 11.6 | | 18.2 | | 24.2 | | 26.5 | | 20.3 |
Livestock | | 47.9 | | 166.7 | | 173.2 | | 73.0 | | 23.5 | | 2.8 | | -0.4 | | 2.8 | | 1.8 | | 2.3 | | 1.8 | | 0.4 | | -0.9 |
Intangible fixed assets | | 4.7 | | 4.9 | | 6.0 | | 7.9 | | 8.1 | | 7.9 | | 8.2 | | 7.7 | | 8.2 | | 9.7 | | 12.1 | | 14.2 | | 13.9 |
Ownership transfer costs | | 18.9 | | 17.3 | | 6.2 | | -11.0 | | -24.1 | | -27.1 | | -21.6 | | -12.7 | | -4.4 | | -0.3 | | 2.7 | | 6.4 | | 8.9 |
| | | | | | | | | | | | | |
Public enterprises gross fixed capital formation | | -48.5 | | -39.6 | | -3.0 | | 48.8 | | 101.0 | | 82.7 | | 44.8 | | 31.1 | | 25.4 | | 28.4 | | 34.0 | | 36.2 | | 38.8 |
Commonwealth | | 13.6 | | 4.3 | | 6.2 | | 20.5 | | 38.4 | | 42.1 | | 18.2 | | 0.6 | | -0.6 | | 14.0 | | 32.1 | | 36.2 | | 21.5 |
State and local | | -58.9 | | -47.5 | | -5.4 | | 59.2 | | 129.9 | | 97.3 | | 52.5 | | 39.6 | | 32.6 | | 32.1 | | 34.4 | | 36.2 | | 42.4 |
| | | | | | | | | | | | | |
General government gross fixed capital formation | | -10.2 | | 0.7 | | 12.4 | | 16.5 | | 9.9 | | 2.6 | | 4.2 | | 11.2 | | 18.1 | | 15.5 | | 8.7 | | 7.1 | | 9.7 |
National | | 16.4 | | 23.7 | | 29.1 | | 19.1 | | -2.7 | | -18.6 | | -19.1 | | -10.5 | | -1.4 | | 0.7 | | -4.3 | | -6.9 | | -3.5 |
State and local | | -13.6 | | -2.5 | | 9.9 | | 16.1 | | 12.1 | | 6.4 | | 8.4 | | 14.8 | | 21.0 | | 17.6 | | 10.5 | | 8.9 | | 11.3 |
| | | | | | | | | | | | | |
Gross state expenditure | | 7.0 | | 8.8 | | 10.7 | | 10.4 | | 8.2 | | 6.1 | | 4.9 | | 5.2 | | 6.2 | | 6.8 | | 7.1 | | 7.1 | | 6.8 |
| | | | | | | | | | | | | |
Exports of goods and services | | 0.9 | | -0.4 | | -0.2 | | 0.9 | | 2.8 | | 4.1 | | 3.8 | | 3.0 | | 1.7 | | 0.6 | | 0.6 | | 0.7 | | 0.0 |
| | | | | | | | | | | | | |
Exports of goods and services, overseas | | -0.4 | | -1.6 | | 0.0 | | 3.1 | | 6.1 | | 7.1 | | 6.0 | | 5.0 | | 3.7 | | 2.5 | | 2.0 | | 1.5 | | 0.5 |
Exports of goods, overseas | | -0.7 | | -2.4 | | -0.9 | | 2.3 | | 5.5 | | 7.3 | | 6.4 | | 5.3 | | 4.1 | | 2.3 | | 0.9 | | -0.5 | | -2.4 |
Exports of services, less tourism services, overseas | | 0.5 | | 0.4 | | 2.4 | | 4.0 | | 4.6 | | 1.4 | | -0.2 | | 2.2 | | 5.0 | | 9.4 | | 12.4 | | 12.5 | | 11.7 |
Exports of tourism services, overseas | | 0.7 | | 2.5 | | 6.3 | | 10.4 | | 14.4 | | 14.2 | | 11.3 | | 5.8 | | -2.5 | | -5.1 | | -1.6 | | 4.7 | | 11.7 |
| | | | | | | | | | | | | |
Exports of goods and services, interstate | | 3.7 | | 2.3 | | -0.7 | | -3.6 | | -3.8 | | -2.0 | | -0.7 | | -1.4 | | -2.7 | | -3.6 | | -2.8 | | -1.1 | | -1.1 |
Exports of goods, interstate | | 3.6 | | 6.8 | | 3.9 | | -3.5 | | -7.6 | | -6.7 | | -1.9 | | 2.5 | | 4.4 | | 2.4 | | -0.3 | | -1.2 | | -1.9 |
Exports of services, less tourism services, interstate | | — | | — | | — | | — | | — | | — | | — | | — | | — | | — | | — | | — | | — |
Exports of tourism services, interstate | | 3.9 | | -6.2 | | -9.0 | | -3.7 | | 4.1 | | 8.1 | | 1.9 | | -8.6 | | -15.4 | | -14.7 | | -7.6 | | -0.7 | | 0.7 |
less Imports of goods and services | | 13.1 | | 17.0 | | 19.7 | | 17.5 | | 11.9 | | 6.6 | | 3.3 | | 3.0 | | 5.4 | | 7.9 | | 9.5 | | 9.0 | | 5.8 |
| | | | | | | | | | | | | |
less Imports of goods and services, overseas | | 13.2 | | 16.6 | | 20.4 | | 23.4 | | 22.1 | | 17.8 | | 13.2 | | 9.1 | | 8.0 | | 8.2 | | 7.7 | | 6.8 | | 3.9 |
less Imports of goods, overseas | | 13.6 | | 15.3 | | 18.6 | | 23.1 | | 23.3 | | 19.8 | | 14.8 | | 9.7 | | 8.8 | | 9.7 | | 9.0 | | 7.1 | | 2.5 |
less Imports of services, less tourism services, overseas | | 10.8 | | 16.8 | | 20.3 | | 17.8 | | 12.8 | | 8.1 | | 6.2 | | 6.2 | | 5.7 | | 4.5 | | 4.1 | | 5.0 | | 6.2 |
less Imports of tourism services, overseas | | 18.1 | | 35.6 | | 50.4 | | 53.4 | | 43.1 | | 28.1 | | 18.0 | | 10.9 | | 5.2 | | 1.9 | | 2.8 | | 8.0 | | 14.7 |
| | | | | | | | | | | | | |
less Imports of goods and services, interstate | | 12.9 | | 17.4 | | 19.1 | | 12.8 | | 3.8 | | -2.2 | | -4.9 | | -2.3 | | 3.0 | | 7.6 | | 11.2 | | 11.1 | | 7.5 |
less Imports of goods, interstate | | 12.1 | | 16.4 | | 18.6 | | 13.4 | | 5.1 | | -1.2 | | -4.3 | | -2.0 | | 3.4 | | 8.2 | | 11.6 | | 11.0 | | 6.6 |
less Imports of services, less tourism services, interstate | | — | | — | | — | | — | | — | | — | | — | | — | | — | | — | | — | | — | | — |
less Imports of tourism services, interstate | | 22.7 | | 29.6 | | 24.5 | | 5.9 | | -9.8 | | -13.5 | | -11.4 | | -5.6 | | -1.8 | | -0.2 | | 5.7 | | 12.5 | | 20.7 |
| | | | | | | | | | | | | |
Expenditure on gross state product | | 3.2 | | 3.3 | | 4.4 | | 5.1 | | 5.3 | | 5.3 | | 5.2 | | 5.3 | | 5.1 | | 4.5 | | 4.3 | | 4.5 | | 5.2 |
Chain volume measure reference year 2004-05
4
| | |
| DOMESTIC PRODUCTION ACCOUNT - QUEENSLAND | | TABLE 5 |
(Trend, chain volume measure, annual contribution to growths - quarterly, %)
| | | | | | | | | | | | | | | | | | | | | | | | | | | |
| | | 2003-04 | | 2004-05 | | 2005-06 | | | 2006-07 |
| | Sep | | Dec | | Mar | | Jun | | Sep | | Dec | | Mar | | Jun | | Sep | | Dec | | Mar | | Jun | | | Sep |
Household final consumption expenditure | | 4.0 | | 5.7 | | 6.7 | | 6.2 | | 4.7 | | 3.2 | | 2.5 | | 2.5 | | 2.8 | | 2.9 | | 2.6 | | 2.2 | | | 2.1 |
Internal consumption expenditure | | 3.5 | | 5.1 | | 6.1 | | 5.8 | | 4.5 | | 3.2 | | 2.5 | | 2.5 | | 2.8 | | 2.8 | | 2.5 | | 2.0 | | | 1.6 |
Non-tourism | | 3.5 | | 5.1 | | 6.1 | | 5.8 | | 4.6 | | 3.2 | | 2.5 | | 2.6 | | 3.0 | | 3.0 | | 2.6 | | 2.1 | | | 1.7 |
Tourism | | 0.1 | | 0.0 | | 0.0 | | 0.0 | | 0.0 | | 0.0 | | -0.1 | | -0.1 | | -0.2 | | -0.2 | | -0.1 | | -0.1 | | | -0.1 |
External consumption expenditure | | 0.4 | | 0.6 | | 0.6 | | 0.4 | | 0.2 | | 0.0 | | 0.0 | | 0.0 | | 0.0 | | 0.0 | | 0.1 | | 0.2 | | | 0.4 |
Imports of tourism services, overseas | | 0.1 | | 0.2 | | 0.3 | | 0.4 | | 0.3 | | 0.2 | | 0.2 | | 0.1 | | 0.1 | | 0.0 | | 0.0 | | 0.1 | | | 0.1 |
Imports of tourism services, interstate | | 0.3 | | 0.4 | | 0.3 | | 0.1 | | -0.2 | | -0.2 | | -0.2 | | -0.1 | | 0.0 | | 0.0 | | 0.1 | | 0.2 | | | 0.3 |
| | | | | | | | | | | | | |
General government final consumption expenditure | | 1.1 | | 0.9 | | 0.8 | | 0.6 | | 0.7 | | 0.8 | | 0.7 | | 0.6 | | 0.5 | | 0.6 | | 0.8 | | 1.1 | | | 1.2 |
National | | 0.5 | | 0.4 | | 0.3 | | 0.2 | | 0.3 | | 0.4 | | 0.4 | | 0.3 | | 0.2 | | 0.1 | | 0.2 | | 0.3 | | | 0.4 |
State and local | | 0.5 | | 0.5 | | 0.5 | | 0.5 | | 0.5 | | 0.4 | | 0.3 | | 0.3 | | 0.3 | | 0.4 | | 0.6 | | 0.8 | | | 0.8 |
| | | | | | | | | | | | | |
Private gross fixed capital formation | | 2.0 | | 1.8 | | 2.4 | | 2.6 | | 2.2 | | 1.6 | | 1.3 | | 1.5 | | 2.3 | | 3.0 | | 3.6 | | 3.7 | | | 3.4 |
Dwellings | | 0.3 | | 0.4 | | 0.7 | | 0.8 | | 0.6 | | 0.3 | | 0.2 | | 0.3 | | 0.3 | | 0.1 | | 0.0 | | 0.1 | | | 0.3 |
Other buildings and structures | | -0.2 | | -0.2 | | 0.2 | | 0.5 | | 0.6 | | 0.5 | | 0.5 | | 0.7 | | 1.1 | | 1.4 | | 1.5 | | 1.3 | | | 1.2 |
Machinery and equipment | | 1.2 | | 0.8 | | 0.8 | | 1.3 | | 1.5 | | 1.4 | | 1.1 | | 0.7 | | 0.9 | | 1.4 | | 1.9 | | 2.1 | | | 1.7 |
Livestock | | 0.2 | | 0.4 | | 0.4 | | 0.2 | | 0.1 | | 0.0 | | 0.0 | | 0.0 | | 0.0 | | 0.0 | | 0.0 | | 0.0 | | | 0.0 |
Intangible fixed assets | | 0.0 | | 0.0 | | 0.0 | | 0.1 | | 0.1 | | 0.1 | | 0.1 | | 0.1 | | 0.1 | | 0.1 | | 0.1 | | 0.1 | | | 0.1 |
Ownership transfer costs | | 0.4 | | 0.4 | | 0.2 | | -0.3 | | -0.6 | | -0.7 | | -0.5 | | -0.3 | | -0.1 | | 0.0 | | 0.0 | | 0.1 | | | 0.2 |
| | | | | | | | | | | | | |
Public enterprises gross fixed capital formation | | -1.0 | | -0.8 | | -0.1 | | 0.6 | | 1.1 | | 1.0 | | 0.7 | | 0.6 | | 0.5 | | 0.6 | | 0.7 | | 0.8 | | | 0.9 |
Commonwealth | | 0.0 | | 0.0 | | 0.0 | | 0.1 | | 0.1 | | 0.1 | | 0.1 | | 0.0 | | 0.0 | | 0.1 | | 0.1 | | 0.1 | | | 0.1 |
State and local | | -1.1 | | -0.8 | | -0.1 | | 0.6 | | 0.9 | | 0.9 | | 0.6 | | 0.6 | | 0.5 | | 0.5 | | 0.6 | | 0.7 | | | 0.8 |
| | | | | | | | | | | | | |
General government gross fixed capital formation | | -0.3 | | 0.0 | | 0.3 | | 0.4 | | 0.3 | | 0.1 | | 0.1 | | 0.3 | | 0.5 | | 0.4 | | 0.3 | | 0.2 | | | 0.3 |
National | | 0.1 | | 0.1 | | 0.1 | | 0.1 | | 0.0 | | -0.1 | | -0.1 | | 0.0 | | 0.0 | | 0.0 | | 0.0 | | 0.0 | | | 0.0 |
State and local | | -0.4 | | -0.1 | | 0.2 | | 0.4 | | 0.3 | | 0.2 | | 0.2 | | 0.4 | | 0.5 | | 0.4 | | 0.3 | | 0.2 | | | 0.3 |
Change in inventories | | 1.2 | | 1.0 | | 0.3 | | -0.4 | | -0.6 | | -0.3 | | 0.0 | | 0.2 | | 0.3 | | 0.0 | | -0.3 | | -0.6 | | | -0.7 |
Statistical discrepancy (E) | | 0.1 | | 0.1 | | 0.3 | | 0.3 | | 0.2 | | 0.1 | | -0.1 | | -0.3 | | -0.3 | | -0.3 | | -0.1 | | 0.0 | | | 0.2 |
| | | | | | | | | | | | | |
Gross state expenditure | | 7.0 | | 8.8 | | 10.7 | | 10.5 | | 8.4 | | 6.4 | | 5.2 | | 5.5 | | 6.6 | | 7.2 | | 7.5 | | 7.5 | | | 7.3 |
| | | | | | | | | | | | | |
Exports of goods and services | | 0.3 | | -0.1 | | -0.1 | | 0.3 | | 0.9 | | 1.3 | | 1.2 | | 0.9 | | 0.5 | | 0.2 | | 0.2 | | 0.2 | | | 0.0 |
| | | | | | | | | | | | | |
Exports of goods and services, overseas | | -0.1 | | -0.4 | | 0.0 | | 0.6 | | 1.3 | | 1.5 | | 1.2 | | 1.0 | | 0.8 | | 0.5 | | 0.4 | | 0.3 | | | 0.1 |
Exports of goods, overseas | | -0.1 | | -0.4 | | -0.2 | | 0.4 | | 0.9 | | 1.2 | | 1.1 | | 0.9 | | 0.7 | | 0.4 | | 0.1 | | -0.1 | | | -0.4 |
Exports of services, less tourism services, overseas | | 0.0 | | 0.0 | | 0.1 | | 0.1 | | 0.1 | | 0.0 | | 0.0 | | 0.1 | | 0.1 | | 0.2 | | 0.3 | | 0.3 | | | 0.3 |
Exports of tourism services, overseas | | 0.0 | | 0.0 | | 0.1 | | 0.2 | | 0.2 | | 0.2 | | 0.2 | | 0.1 | | 0.0 | | -0.1 | | 0.0 | | 0.1 | | | 0.2 |
| | | | | | | | | | | | | |
Exports of goods and services, interstate | | 0.4 | | 0.2 | | -0.1 | | -0.4 | | -0.4 | | -0.2 | | -0.1 | | -0.1 | | -0.3 | | -0.3 | | -0.3 | | -0.1 | | | -0.1 |
Exports of goods, interstate | | } 0.2 | | 0.4 | | 0.3 | | -0.2 | | -0.5 | | -0.5 | | -0.1 | | 0.2 | | 0.3 | | 0.1 | | 0.0 | | -0.1 | } | | -0.1 |
Exports of services, less tourism services, interstate | | } — | | — | | — | | — | | — | | — | | — | | — | | — | | — | | — | | — | } | | — |
Exports of tourism services, interstate | | 0.1 | | -0.2 | | -0.3 | | -0.1 | | 0.1 | | 0.3 | | 0.1 | | -0.3 | | -0.5 | | -0.5 | | -0.2 | | 0.0 | | | 0.0 |
less Imports of goods and services | | 4.1 | | 5.4 | | 6.2 | | 5.7 | | 4.0 | | 2.4 | | 1.2 | | 1.1 | | 2.0 | | 2.8 | | 3.4 | | 3.2 | | | 2.1 |
less Imports of goods and services, overseas | | 1.8 | | 2.3 | | 2.9 | | 3.4 | | 3.3 | | 2.8 | | 2.2 | | 1.5 | | 1.4 | | 1.4 | | 1.4 | | 1.2 | | | 0.7 |
less Imports of goods, overseas | | 1.4 | | 1.6 | | 2.0 | | 2.5 | | 2.6 | | 2.3 | | 1.8 | | 1.2 | | 1.2 | | 1.3 | | 1.2 | | 0.9 | | | 0.3 |
less Imports of services, less tourism services, overseas | | 0.3 | | 0.5 | | 0.6 | | 0.5 | | 0.4 | | 0.3 | | 0.2 | | 0.2 | | 0.2 | | 0.2 | | 0.1 | | 0.2 | | | 0.2 |
less Imports of tourism services, overseas | | 0.1 | | 0.2 | | 0.3 | | 0.4 | | 0.3 | | 0.2 | | 0.2 | | 0.1 | | 0.1 | | 0.0 | | 0.0 | | 0.1 | | | 0.1 |
less Imports of goods and services, interstate | | 2.3 | | 3.0 | | 3.3 | | 2.3 | | 0.7 | | -0.4 | | -1.0 | | -0.4 | | 0.6 | | 1.4 | | 2.0 | | 2.0 | | | 1.4 |
less Imports of goods, interstate | | } 2.0 | | 2.7 | | 3.0 | | 2.2 | | 0.9 | | -0.2 | | -0.8 | | -0.4 | | 0.6 | | 1.4 | | 1.9 | | 1.8 | } | | 1.1 |
less Imports of services, less tourism services, interstate | | } — | | — | | — | | — | | — | | — | | — | | — | | — | | — | | — | | — | } | | — |
less Imports of tourism services, interstate | | 0.3 | | 0.4 | | 0.3 | | 0.1 | | -0.2 | | -0.2 | | -0.2 | | -0.1 | | 0.0 | | 0.0 | | 0.1 | | 0.2 | | | 0.3 |
| | | | | | | | | | | | | |
Expenditure on gross state product | | 3.2 | | 3.3 | | 4.4 | | 5.1 | | 5.3 | | 5.3 | | 5.2 | | 5.3 | | 5.1 | | 4.5 | | 4.3 | | 4.5 | | | 5.2 |
Chain volume measure reference year 2004-05
5
| | |
| | Queensland State Accounts, September Quarter 2006 |
EXPLANATORY NOTES
Overview
The Queensland State Accounts are compiled in accordance with the international standards contained in the System of National Accounts 1993 (SNA93).
Readers interested in more detailed information on the changes to national and state accounts are referred to the following Australian Bureau of Statistics (ABS) information papers:
| • | | Australian System of National Accounts: Concepts, Sources and Methods (ABS 5216.0); |
| • | | Upgraded Australian National Accounts (ABS 5253.0); |
| • | | Implementation of Revised International Standards in the Australian National Accounts (ABS 5251.0); and |
| • | | Introduction of Chain Volume Measure in the Australian National Accounts (ABS 5248.0). |
The broad structure of the Queensland State Accounts is that of a social accounting matrix comprising two regions: Queensland and the Rest of Australia. This enables the appropriate comparison to be made of the performance of Queensland with respect to the performance of the rest of the nation, rather than with Australia as a whole.
For both regions, four fundamental accounts have been specified: domestic (or State) production account, state consumption account, state accumulation account and the external account. The state consumption and accumulation accounts have been further disaggregated into sectoral accounts. These sectoral accounts include household, State and local general government, Commonwealth general government and private and public trading and financial enterprises. This publication reports only on the domestic production accounts of these two regions.
The Queensland State Accounts are designed to allow consolidation of the two regions into the single region of Australia. The Australian National Accounts, produced by the ABS, form a clear national framework and set of estimates, with which the Queensland State Accounts is congruent.
The ABS also produces the Australian National Accounts, National Income, Expenditure and Product. The Queensland State Accounts uses as much Queensland information contained in this ABS publication as is appropriate and relevant. However, since the purpose of the Queensland State Accounts is to measure the structure and performance of the Queensland economy as accurately and comprehensively as possible, it significantly extends the information contained in the Australian National Accounts, National Income, Expenditure and Product series. Since this extension is feasible in the case of a single State, especially one with the statistical resources of Queensland, the Queensland State Accounts is not necessarily bound to agree exactly with any ABS estimates. Nevertheless, the quality of the Australian National Accounts is such that the Queensland State Accounts estimates are generally and routinely benchmarked to them. In all cases, the ABS estimates are taken into strong initial consideration.
The major extension of the domestic production accounts in the Queensland State Accounts system is the addition of estimates of interstate trade in goods and trade in services, including tourism transactions. This enables the system to derive quarterly estimates of gross state product in volume terms. As well, this provides a more comprehensive understanding of Queensland’s overall trade performance, and replaces the more limited understanding provided by the common misperception of overseas State trade as total State trade.
6
| | |
| | Queensland State Accounts, September Quarter 2006 |
Methodological issues
As noted below in Definitions and source notes, the estimates in the Queensland State Accounts generally agree with those of the ABS Australian National Accounts, National Income, Expenditure and Product when available, except in cases where the Office of the Government Statistician has improved on, or corrected, ABS estimates.
Differences between the Queensland estimates in the Australian National Accounts, National Income, Expenditure and Product and those in the Queensland State Accounts reflect corrections and improvements in data construction made by the Office of the Government Statistician. These corrections generally arise from data confrontation exercises which involve alternative sources of evidence or information, and which often involve the input of further primary information.
Compensation of employees
The OGS estimate of Compensation of employees (COE) differs from that published by the ABS in Australian National Accounts: National Income, Expenditure and Product (ABS 5206.0). As reported in the September quarter 1994 issue of the Queensland State Accounts, the Office of the Government Statistician (OGS) is of the opinion that the compensation of employees (COE) series published in the ABS 5206.0 substantially under-recorded COE from the period commencing September quarter 1993. As a result, in the period starting with September quarter 1993 and ending December quarter 2001, the average of the quarterly movements in average weekly earnings, and survey of employment and earnings is combined with the number of wage and salary earners to derive the COE series published in the Queensland State Accounts. From March 2002 onwards, the OGS COE series is extrapolated using the quarterly movements in the compensation of employees series published in ABS 5206.0.
Further analysis by the OGS indicates that the June quarter 2005 quarter estimate of COE published in ABS 5206.0 has been underestimated. The movement in implied average earnings is contrary to other measures of earnings in Queensland. The OGS has adjusted the COE estimate for June quarter 2005 to reflect the movement in the wage price index for Queensland.
Gross operating surplus and gross mixed income
The OGS estimate of gross operating surplus and gross mixed income (GOS/GMI) differs from that published by the ABS in Australian National Accounts, State Accounts, 2005-06 (ABS 5220.0) for 2005-06. This difference reflects the OGS using a different methodology to the ABS to allocate the Australian estimate of mining GOS/GMI between Queensland and the Rest of Australia in 2005-06.
Public final demand
In some instances, there are differences between the Queensland State Accounts estimate of Queensland public final demand and those published by the ABS Australian National Accounts: National Income, Expenditure and Product (ABS 5206.0). In these cases, additional information has become available after the release of ABS estimates. The OGS has incorporated this additional information into its estimate of Queensland public final demand. No adjustments have been made to Rest of Australia. As a result, the OGS estimate of public final demand for Rest of Australia is consistent with ABS State Details (ABS 5206.0).
Input-output tables
The Queensland State Accounts and Queensland’s State and regional input-output tables, which are also produced by the Office of the Government Statistician, have been developed in close association, so that these two components of the overall system of State accounts are congruent. An intention is to use the input-output tables to assist in the future reconciliation of the income and expenditure estimates of domestic production in the State, as well as the production based estimates when available.
7
| | |
| | Queensland State Accounts, September Quarter 2006 |
Seasonally adjusted and trend estimates
In interpreting movements in quarterly time series, it is useful to recognise and take account of changes due to seasonal and other types of calendar influences. Seasonal effects usually reflect the influences of the seasons themselves, either directly (e.g. farm production) or indirectly, through activity related to them, such as social conventions (e.g. the incidence of holidays), or administrative practices (e.g. the timing of wage and salary payments). Other types of calendar variations may occur as a result of influences such as the number and composition of days in a calendar period, the accounting or the recording procedures adopted, or the incidence of moveable holidays such as Easter. For example, Easter can fall either in the March quarter, the June quarter, or in both quarters.
Movements in a time series can be due to a complex interaction of up to six notional influences. These influences are:
| • | | the seasonal pattern which reflects the systematically recurring rise (fall) of the quarters; |
| • | | the “trading day” pattern which reflects how the series systematically varies with changes in the composition of the quarters; |
| • | | moving holiday impacts; |
| • | | other systematic calendar related effects; |
| • | | the trend which reflects the fundamental and long-term direction of the series; and |
| • | | the residual/irregular influences which reflect the short-term erratic factors in the series. |
Statistical techniques may be used to evaluate the effects on normal and calendar influences operating on a series and to produce seasonally adjusted estimates by the removal of these influences. One of the most widely used seasonal adjustment methods is the X-11 variant of the Census Method 11 Seasonal Adjustment Program and its companion program X-11Q developed by the U.S. Bureau of the Census.
The X-11Q procedure uses an iterative system of moving averages and linear regression techniques to obtain seasonal and other systematic calendar effects. For quarterly series, prior adjustments can be incorporated for moving holidays and trading day adjustments. However, in accordance with the methodology used by the ABS to adjust the Australian National Accounts, it was assumed that the trading day effects on quarterly State Accounts series are likely to be insignificant except in the case of private final consumption expenditure. At each estimation stage, the adverse effects of “extreme” movements are reduced to minimise distortion of extremes. Final estimates of the seasonal effects are combined and divided into the original data series to produce a seasonally adjusted series.
Seasonal adjustment removes the estimated effects of seasonal and other types of calendar variations from the statistical series, so that the effects of other influences can be analysed. However, if a movement is due to short-term irregular factors and not the underlying trend, then the seasonally adjusted estimate may be deficient in estimating reliably the timing, level and turning points in economic activity. Whether a seasonally adjusted series is a good proxy of the trend or not, will depend on the relative contribution of the irregular component to the quarterly movements, compared with the trend contribution. The irregular nature of seasonally adjusted data is not a deficiency of the seasonal adjustment process, but simply reflects the irregular/residual influences present in the original data, as well as the trend component.
Trend estimates may be produced by smoothing out these residual/irregular components of the seasonally adjusted series. The procedure used in the Queensland State Accounts is similar to that used by the ABS and outlined in their publication Information Paper: A Guide to Smoothing Time Series - Estimates of Trends. It is designed to minimise the distortion to trend level, turning point and timing, and is based on the seven term Henderson moving average in the case of quarterly series.
The Henderson procedure is a symmetric moving average that is centred on a point in time. Consequently, there is no phase shift in the resulting smoothed series. However, there are insufficient observations available for the calculation of the last three quarters of a series, when using such a seven quarter moving average. To overcome this end-point problem, a surrogate moving average that approximates the desired symmetric moving average is used.
8
| | |
| | Queensland State Accounts, September Quarter 2006 |
Furthermore, in addition to the irregular phenomena of the real world, the effects of measurement errors contribute to the residual/irregular influences. For example, estimates produced from sample surveys can be affected by sampling error. Non-sampling errors may also be associated with series due to deficiencies or errors in reporting, processing and estimation. These measurement errors can also impact on the seasonal and trading day patterns. A smoothed seasonally adjusted or trend estimate will smooth these measurement errors and provide a better estimate of the fundamental trend. Another advantage of the Henderson moving average procedure is that if the seasonal process used has some deficiencies, such that there does remain some residual seasonality, for example some trading-day or some moving holiday variation in the adjusted data, then the trend smoothing process will also dampen their presence.
On the other hand, moving averages used to derive trend estimates cannot distinguish between measurement error and actual irregular occurrences, and both types of irregular movements are smoothed. Thus, the effects of the airline pilot’s dispute on the Queensland economy, which was largely concentrated on tourism activity (both imports and exports, as well as consumption expenditure) in December quarter 1989, is spread over a number of adjacent quarters in the trend estimate of gross state product.
To produce smoothed seasonally adjusted estimates for the Queensland State Accounts seasonal factors are obtained using the X-11Q procedure. In line with the ABS procedure for the adjustments of corresponding Australian series, no prior adjustments for trading day and moving holiday effects are incorporated into the X-11Q procedure. Separate current and chain volume measure seasonal factors are calculated for interstate and foreign imports and exports of tourism services, reflecting the seasonality in the implicit price deflators of these series.
The Queensland State Accounts estimates are compiled by applying a seven term Henderson moving average, using the individual tailored end-weights based on the importance of the irregular variations relative to the movements in the trend of the corresponding Queensland components of the domestic production account. Rest of Australia estimates are derived by deconsolidation. The weights reflect the irregularity of the series being trended.
Differences in the estimates and in assumptions and judgments made in the filtering procedure will result in the seasonally adjusted and trend estimates in the Queensland State Accounts being different to those produced and published by the Australian Bureau of Statistics.
Treatment of tourism activity
It is useful to define and distinguish between the concepts of domestic and national economic transactions, and to consider the nature of a tourist agent. Put simply, the concept of domestic relates to transactions occurring within the confines of a domestic territory (that is, within political frontiers) regardless of who is involved in the transaction, whereas national relates to transactions undertaken by resident economic agents wherever these transactions occur. Thus a national concept may be more appropriate for a country which has a number of residents living and working abroad, or which owns and receives a substantial volume of income from investments in foreign countries.
Given this, tourism transactions may be classified and defined. The World Tourist Organisation in The Determination of the Importance of Tourism as an Economic Activity within the Framework of the National Accounting System defines three concepts of tourism as follows:
| • | | International tourism: tourism in the country’s domestic territory by non-resident tourism agents and in the rest of the world by resident tourism agents. International tourism as defined by the World Tourist Organisation includes two sub-categories: foreign tourism, i.e. tourism within the country’s domestic territory by non-resident agents; and tourism abroad, i.e. tourism in the rest of the world by resident tourism agents. |
| • | | Domestic tourism: tourism within the country’s domestic territory by resident and non-resident tourism agents. |
| • | | National tourism: tourism in the country’s domestic territory and the rest of the world by resident tourism agents. |
9
| | |
| | Queensland State Accounts, September Quarter 2006 |
The World Tourist Organisation also defines the type and nature of tourism agents (ignoring short-term tourists or excursionists) as follows:
| • | | Foreign visitors or visitors from outside the country: |
Characteristically, visitors from outside the country:
1) are non-resident agents in the country visited; and
2) do not receive remuneration in the country visited.
Such visitors are defined as,
Persons not residing in the country, irrespective of nationality, who enter the country for purposes other than to earn remuneration in the country visited.
Such persons are defined as:
Persons residing in the country, irrespective of nationality, who travel to a place situated within the country but other than their usual place of residence, for a period of at least twenty-four hours, or who spend at least one night there, for purposes other than to earn remuneration in the place visited. (In Australia, it is usual to include in this definition a requirement that a journey of at least 40km takes place.)
| • | | National visitors abroad |
The two essential characteristics of such persons are that they:
1) are resident agents travelling outside the domestic territory of their country of residence; and
2) receive no remuneration in the country visited.
They are defined as follows:
Persons resident in the country, irrespective of nationality, travelling to one or more other countries for reasons other than earning remuneration in the country or countries visited.
A critical point to note from these definitions is that tourist agents do not engage in activity outside their domestic territory (or in the case of excursionists, outside their neighbourhood), which could result in remuneration being earned. This means that they do not engage in productive activity nor do they engage in accumulation, in the sense that they purchase capital goods for use in the country they are visiting, except possibly for the purchase of real estate (although this is more likely to be an investment transaction, rather than one relating to tourism). Tourism agents clearly are engaged in a consumption form of activity. That is, they purchase goods and services, such as clothing, souvenirs and minor household durables, which are consumed immediately and cannot be accumulated or used again in a subsequent time period.
Accumulation transactions are defined by the World Tourist Organisation to be tourism gross fixed capital formation, and do not represent direct selling to tourists, but rather represent investment expenditure on physical assets which are used to provide facilities or infrastructure for tourists. However, these transactions can also be classified, more appropriately, by industries of sale or purchase (e.g. construction or recreation). If such expenditures are to be classified as tourism transactions, care must be taken to ensure that they are not double counted as investment expenditure by standard industries.
The essential characteristics of tourism transactions are that they are both consumption transactions and balance of payments transactions (i.e. when tourism transactions involve foreigners or agents from outside the domestic territory where the transactions take place). There are three basic types of tourism transaction: tourism exports, or sales to non-resident tourists within a domestic territory; tourism imports, or sales to resident tourists outside the domestic territory; internal tourism consumption expenditures, or sales to resident tourists within the domestic territory.
10
| | |
| | Queensland State Accounts, September Quarter 2006 |
Notes on formulae used
Changes
Last quarter
Change in a variable from one quarter to the next, e.g. the change from June quarter 2006 to September quarter 2006. This is only appropriate in the cases of seasonally adjusted and trend estimates. In the tables, this item is referred to as “quarterly percentage change”.
Same quarter last year
Change in a variable from one quarter to the same quarter in the following year, e.g. the change from September quarter 2005 to September quarter 2006. This provides a measure of annual change. In the tables, this item is referred to as “annual percentage change - quarterly”.
Year-average
Change in a variable from one set of four continuous quarters to the same four quarters in the following year, e.g. the change from the sum or average of December quarter 2004, March quarter 2005, June quarter 2005 and September quarter 2005 to the sum or average of December quarter 2005, March quarter 2006, June quarter 2006 and September quarter 2006. This also provides a measure of annual change. This item is only contained in the summary tables.
Contribution to growth
The contribution of a component of an aggregate series to change in the aggregate from one period to another is give by the formula:
where Ci,t is the percentage point contribution to the change in the aggregate series  from time period t-1 to time period t, caused by the change in the ith component of the aggregate series. Series calculated this way are referred to as “quarterly contribution to growth”.
It should be noted that contributions are also calculated for the change from time period t-4 to time period t. Series calculated this way are referred to as “annual contribution to growth - quarterly”.
11
| | |
| | Queensland State Accounts, September Quarter 2006 |
Definitions and source notes
These definitions and notes have been constructed from the point of view of the Queensland State Accounts, rather than the Australian National Accounts; that is, they relate to the case of Queensland or to the Rest of Australia, rather than the nation as a whole.
Chain Volume Measures
The chain volume measures appearing in this issue are annually reweighted chained Laspeyres indexes referenced to the current price in a reference year, currently 2004-05. Chained Laspeyres volume measures are compiled by linking together (compounding) movements in volumes, calculated by using the average prices of the previous financial year, and applying the compounded movements to the current price estimates of the reference year. Quarterly chain volume estimates are benchmarked to annual chain volume estimates, so that the quarterly estimates for a financial year sum to the corresponding annual estimate.
Chain volume measures are not generally additive. They do not sum in total, in the way original current price components do. To minimise this impact, the ABS uses the year preceding the last full financial year as the reference year. This approach means that the chain volume measures are additive in the reference year (2004-05) and the quarters following the reference year. However, the chain volume measures are not additive in the quarters preceding the reference year.
Compensation of employees
This term replaces the term “wages, salaries and supplements”. Compensation of employees is the total remuneration, in cash or in kind, payable by an enterprise to an employee in return for work done by the latter during the accounting period.
Gross operating surplus and gross mixed income
Gross operating surplus is a measure of the surplus accruing to owners from processes of production before deducting any explicit or implicit interest charges, rent or other property income payable on financial assets required to carry on the production and before deducting consumption of fixed capital.
Mixed income is the term reserved for the surplus accruing to owners of unincorporated enterprises from the process of production (as defined for gross operating surplus). It was previously described as gross operating surplus – unincorporated enterprises.
The Office of the Government Statistician uses indicators of activity to estimate Queensland’s share of the five components of Australia’s gross operating surplus and mixed income. Since March quarter 2001, State data from the ABS publication Business Indicators: Australia has been used to estimate these shares. These estimates are benchmarked to the annual ABS estimates contained in Australian National Accounts, State Accounts (ABS 5220.0), apart from 2005-06.
Gross State product at factor cost
The sum of compensation of employees, gross operating surplus and gross mixed income.
12
| | |
| | Queensland State Accounts, September Quarter 2006 |
Taxes less subsidies on production and imports
This term replaces the term “indirect taxes less subsidies”. It consists of ‘taxes less subsidies on products’ and ‘other’ taxes/subsidies on production. Taxes/subsidies on products are payable on goods and services when they are produced or sold by their producers and include taxes/subsidies and duties/subsidies on imports. Other taxes on production consist mainly of taxes on the ownership or use of land, building or other assets used in production, or labour employed or compensation of employees paid.
The Queensland State Accounts estimate is compiled using data on State and local government taxes and subsidies on production and imports and an estimate of Commonwealth taxes and subsidies on production and imports levied in Queensland.
Statistical discrepancy (I) and (E)
In line with the ABS practice, an explicit statistical discrepancy has been retained in the Queensland State Accounts. This discrepancy is allocated between the income and expenditure estimates to provide a unique measure of quarterly current gross state product. This is pro-rated from the national estimates to Queensland using gross state product. However, in the Queensland State Accounts the statistical discrepancy (E) has been recorded as a component of gross State expenditure and gross Rest of Australia expenditure.
Gross State product
The estimates of gross state product (GSP) are produced by summing the income components of gross state product: compensation of employees, gross operating surplus, gross mixed income, and taxes less subsidies on production and imports. The expenditure estimate of GSP comprises the summation of household and government consumption, as well capital formation, change in inventories and exports less imports, which in turn is balanced against the income components of GSP (i.e. the expenditure approach).
The method used to obtain the chain volume estimate of GSP could be best described as ‘indirect’ as the only current price estimate of GSP available is obtained by aggregating the incomes accruing from production (i.e. the income approach). It is not possible to satisfactorily deflate such incomes to produce chain volume estimates because they do not comprise readily identifiable price and quantity elements. Consequently, the chain volume estimate of GSP is derived using the expenditure approach.
Household final consumption expenditure
The sum of internal and external consumption expenditure.
Differences between the Australian National Accounts, National Income, Expenditure and Product and the Queensland State Accounts are due primarily to differences in the estimates of net interstate and overseas expenditure by tourists.
Internal consumption expenditure
Outlays, by State resident households and State resident producers of private non-profit services to households, on new durable and non-durable goods and services, less net sales of second-hand goods, within the domestic territory of the State.
This is largely based on the ABS estimate in the Australian National Accounts, National Income, Expenditure and Product.
13
| | |
| | Queensland State Accounts, September Quarter 2006 |
External consumption expenditure
Outlays, by State resident households on new durable and non-durable goods and services outside the domestic territory of the State. These are expenditures by Queensland resident households engaged in tourism activity interstate or overseas.
These estimates are formed from data contained in the Bureau of Tourism Research National Visitor Survey and the ABS Balance of Payments.
Private gross fixed capital formation
The total value of private sector producers’ acquisitions, less disposals of fixed assets during the accounting period plus certain additions to the value of non-produced assets realised by the production activity of institutional units.
This is formed by the addition of the components of private investment: dwellings construction, other buildings and structures construction, machinery and equipment, livestock, intangible fixed assets and ownership transfer costs. Definitions of these components may be found in ABS Information Paper, Implementation of Revised International Standards in the Australian National Accounts.
Estimates of these components are generally taken from the ABS estimates in the Australian National Accounts, National Income, Expenditure and Product.
General government final consumption expenditure
Net expenditure on goods and services by government authorities, except those classified as public enterprises, which does not result in the creation of fixed assets or inventories or in the acquisition of land and existing buildings or second-hand assets. Expenditure on defence assets that are used in a similar fashion to civilian assets is now classified as gross fixed capital formation. Expenditure on weapons of destruction and weapon delivery systems is still classified as final consumption expenditure.
Estimates of these components are generally taken from the ABS estimates in the Australian National Accounts, National Income, Expenditure and Product apart from 1999-2000 due to, the Office of the Government Statistician treating differently from the ABS the $1.1 billion abnormal return on QSuper trust assets in the current price estimate of government final consumption expenditure.
General government gross fixed capital formation
Expenditure on new fixed assets plus net expenditure on second-hand assets whether for additions or replacements (other than weapons of destruction and weapon delivery systems).
Estimates of these components are generally taken from the ABS estimates in the Australian National Accounts, National Income, Expenditure and Product, apart from the past four quarters where revised data for State government capital formation were used.
Public enterprises gross fixed capital formation
Expenditure on new fixed assets plus net expenditure on second-hand fixed assets and including both additions and replacements.
Estimates of these components are generally taken from the ABS estimates in the Australian National Accounts, National Income, Expenditure and Product, apart for the past four quarters. This reflects revised data on capital formation by State public enterprises.
14
| | |
| | Queensland State Accounts, September Quarter 2006 |
Changes in inventories
This term replaces the existing term “stocks”. Inventories consist of materials and supplies, work-in-progress, finished goods and goods for resale, and includes all inventories held by government.
Estimates of these components are made by allocating the national inventory activity identified in the ABS estimates in the Australian National Accounts, National Income, Expenditure and Product to Queensland.
Gross state expenditure
The sum of household final consumption expenditure, general government final consumption expenditure, private gross fixed capital formation, public enterprises gross fixed capital formation, general government gross fixed capital formation, change in inventories and the statistical discrepancy (E).
Exports of goods and services, overseas
Sum of exports of goods overseas and exports of services overseas.
Exports of goods, overseas
All transfers of ownership of goods from Queensland residents to residents of overseas countries.
Exports of services, less tourism services, overseas
Sales of services provided by Queensland resident producers to residents of overseas countries, excluding sales to overseas residents visiting Queensland for tourism purposes.
This is estimated for Queensland by calculating its share from the ABS Balance of Payments.
Exports of tourism services, overseas
Sales of services provided by Queensland resident producers to residents of overseas countries visiting Queensland for the purpose of holiday or visiting friends or relatives.
This is estimated using data from the BTR International Visitor Survey and ABS Overseas Arrivals and Departures 3401.0.
Exports of goods and services, interstate
Sum of exports of goods interstate and exports of services interstate.
Exports of goods and services, less tourism services, interstate
The sum of the transfers of ownership of goods from Queensland residents to residents of other States, and the sales of services provided by Queensland resident producers to residents of other States, excluding sales to residents of other States visiting Queensland for tourism purposes.
This is estimated from the ABS Interstate Trade Survey. Exports of goods are estimated by broad commodity group.
15
| | |
| | Queensland State Accounts, September Quarter 2006 |
Exports of tourism services, interstate
Sales of services provided by Queensland resident producers to residents of other States visiting Queensland for the purpose of holiday or visiting friends and relatives.
This is estimated using a combination of results from the BTR National Visitor Survey, and BTR Domestic Tourism Monitor, expenditure figures derived using a combination of the Domestic Tourism Expenditure Surveys (1982, 1992), and Queensland Travel and Tourism Corporation’s Queensland Visitors Survey.
Imports of goods and services, overseas
Sum of imports of goods overseas and imports of services overseas.
Imports of goods, overseas
All transfers of ownership of goods from residents of overseas countries to Queensland residents.
Prior to September quarter 1988, estimates in current prices were obtained from the ABS by broad commodity group. The chain volume measures are calculated by deflating the commodity group using national implicit price deflators. From September quarter 1988, the State current price series are obtained from the ABS Foreign Trade by two digit SITC. The chain volume measure is estimated using the national two-digit SITC implicit price deflator. Adjustments to imports of goods, overseas have been also made to Queensland civil aircraft imports to match the corresponding investment series produced by the ABS.
Imports of services, less tourism services, overseas
Sales of services provided by residents of overseas countries to Queensland residents, excluding sales to Queensland residents visiting overseas countries for tourism purposes.
This is estimated for Queensland by calculating its share from the ABS Balance of Payments.
Imports of tourism services, overseas
Sales of services provided by residents of overseas countries to Queensland residents, visiting overseas countries for tourism purposes.
This is estimated for Queensland by calculating its share from the ABS Balance of Payments.
Imports of goods and services, interstate
Sum of imports of goods interstate and imports of services interstate.
Imports of goods and services, less tourism services, interstate
The sum of the transfers of ownership of goods from residents of other states to Queensland residents, and the sales of services provided by residents of other states to Queensland residents, excluding sales to Queensland residents visiting those other states for tourism purposes. This is estimated from the ABS Interstate Trade Survey. The imports of goods are estimated by broad commodity groups.
16
| | |
| | Queensland State Accounts, September Quarter 2006 |
Imports of tourism services, interstate
Sales of services provided by resident producers of other states to Queensland residents visiting those other states for tourism purposes.
This is estimated using a combination of results from the Bureau of Tourism Research’s National Visitor’s Survey and expenditure figures derived using a combination of the Domestic Tourism Expenditure Surveys (1982, 1992) and the former Queensland Travel and Tourism Corporation’s Queensland Visitor Survey.
Expenditure on gross state product
The sum of gross state expenditure and exports of goods and services, less imports of goods and services.
17