EXHIBIT (c)(vi)
Queensland Government State Budget Papers for 2007-08

Queensland
Government
STATE BUDGET
2007-08
BUDGET STRATEGY AND
OUTLOOK
Budget Paper No. 2
TABLE OF CONTENTS
| | | | |
1. | | Budget Strategy, Performance and Outlook | | 1 |
| | |
| | Summary of Key Financial Aggregates | | 1 |
| | Budget Outcomes 2006-07 | | 2 |
| | Budget 2007-08 and Outyear Projections | | 6 |
| | Reconciliation of Operating Balance | | 8 |
| | Fiscal Strategy | | 8 |
| | Indicators of Fiscal Condition | | 13 |
| | |
2. | | Economic Performance and Outlook | | 14 |
| | |
| | Introduction | | 14 |
| | External Environment | | 15 |
| | The Queensland Economy | | 17 |
| | |
3. | | Economic Strategy | | 30 |
| | |
| | Economic and Productivity Growth | | 30 |
| | Framework for Economic and Productivity Growth | | 33 |
| | Responsible Economic and Fiscal Management | | 34 |
| | Microeconomic Reform | | 35 |
| | Infrastructure Investment | | 41 |
| | Skills and Innovation | | 45 |
| | |
4. | | Budget Priorities and Initiatives | | 49 |
| | |
| | Introduction | | 49 |
| | Improving Health Care and Strengthening Services to the Community | | 51 |
| | Growing a Diverse Economy and Creating Jobs | | 60 |
| | Realising the Smart State Through Education, Skills and Innovation | | 62 |
| | Managing Urban Growth and Building Queensland’s Regions | | 65 |
| | Protecting Our Children and Enhancing Community Safety | | 71 |
| | Protecting the Environment for a Sustainable Future | | 76 |
| | | | |
| | |
5. | | Revenue | | 83 |
| | |
| | Introduction | | 83 |
| | Revenue by Operating Statement Category | | 85 |
| | Taxation Revenue | | 86 |
| | Queensland’s Competitive Tax Status | | 96 |
| | Grants and Subsidies | | 99 |
| | Sales of Goods and Services | | 103 |
| | Interest Income | | 105 |
| | Other Revenue | | 106 |
| | |
6. | | Expenses | | 110 |
| | |
| | Introduction | | 110 |
| | Expenses by Operating Statement Category | | 111 |
| | Details of Expenses | | 113 |
| | Operating Expenses by Purpose | | 116 |
| | Departmental Expenses | | 120 |
| | |
7. | | Balance Sheet and Cash Flows | | 124 |
| | |
| | Introduction | | 124 |
| | Balance Sheet | | 124 |
| | Cash Flows | | 132 |
| | Reconciliation of Operating Cash Flows to the Operating Statement | | 139 |
| | |
8. | | Intergovernmental Financial Relations | | 140 |
| | |
| | Commonwealth-State Financial Arrangements | | 141 |
| | Distribution of GST Funds | | 146 |
| | Impact of the Intergovernmental Agreement | | 151 |
| | Specific Purpose Payments | | 153 |
| | State-Local Government Financial Relations | | 153 |
| | Australian Loan Council | | 155 |
| | | | |
| | |
9. | | Government Finance Statistics | | 157 |
| | |
| | Introduction | | 157 |
| | General Government Sector | | 157 |
| | Public Non-Financial Corporations Sector | | 157 |
| | Uniform Presentation Framework Financial Information | | 160 |
| | Reconciliation of GFS Net Operating Balance to Accounting Surplus | | 170 |
| | General Government Time Series | | 171 |
| | Other General Government GFS Data | | 172 |
| | Background and Interpretation of Government Finance Statistics | | 176 |
| | Sector Classification | | 177 |
| | Reporting Entities | | 178 |
| | |
| | Appendix A – Tax Expenditure Statement | | 181 |
| | |
| | Appendix B – Concessions Statement | | 188 |
| | |
| | Appendix C – Statement of Risks and Sensitivity Analysis | | 194 |
| 1. | BUDGET STRATEGY, PERFORMANCE AND OUTLOOK |
FEATURES
| • | | In 2006-07, the General Government sector is forecast to have a net operating surplus of $2.393 billion and a cash surplus of $1.722 billion. |
| • | | The 2007-08 budgeted operating surplus for the General Government sector is $268 million and a cash deficit of $892 million. |
| • | | The State’s capital program is an estimated $14.029 billion, a 15.6% increase on 2006-07 estimated outlays. The capital outlays of Government-owned corporations constitute approximately 51% of total outlays in 2007-08. The 2006-07 estimated capital outlays are 19.7% higher than budgeted, primarily due to increased spending on water infrastructure. |
| • | | The State’s net worth is forecast to increase to $119.799 billion in 2007-08 and rise to $130.941 billion by 2010-11. |
This chapter discusses:
| • | | the summary of financial aggregates for the 2007-08 Budget |
| • | | the Government’s fiscal strategy as outlined in the Charter of Social and Fiscal Responsibility. |
SUMMARY OF KEY FINANCIAL AGGREGATES
Table 1.1 provides aggregate actual outcome information for 2005-06, estimated actual outcome information for 2006-07, forecasts for 2007-08 and projections for the outyears.
Table 1.1
General Government sector – key financial aggregates1
| | | | | | | | | | | | | | | | | |
| | | 2005-06 Actual $ million | | | 2006-07 Est. Act. $ million | | 2007-08 Budget $ million | | | 2008-09 Projection $ million | | | 2009-10 Projection $ million | | | 2010-11 Projection $ million | |
Revenue | | 30,084 | | | 32,557 | | 32,551 | | | 33,307 | | | 34,605 | | | 35,979 | |
Expenses | | 26,370 | | | 30,164 | | 32,282 | | | 33,056 | | | 34,364 | | | 35,766 | |
Net operating balance | | 3,714 | | | 2,393 | | 268 | | | 251 | | | 241 | | | 213 | |
Cash surplus/(deficit) | | 4,648 | | | 1,722 | | (892 | ) | | (2,248 | ) | | (2,298 | ) | | (2,045 | ) |
Capital purchases | | 3,186 | | | 4,137 | | 5,463 | | | 5,839 | | | 5,899 | | | 5,947 | |
Borrowings | | (750 | ) | | 743 | | 3,569 | | | 4,275 | | | 4,193 | | | 4,021 | |
Net worth | | 105,035 | | | 114,466 | | 119,799 | | | 123,302 | | | 127,072 | | | 130,941 | |
Notes:
| 1. | Numbers may not add due to rounding. |
| | | | | | |
| | Budget Strategy and Outlook 2007-08 | | 1 |
BUDGET OUTCOMES 2006-07
Key financial aggregates
Table 1.2
General Government sector – key financial aggregates1
| | | | | | | | |
| | | 2006-07 Budget $ million | | | 2006-07 MYFER $ million | | | 2006-07 Est. Act. $ million |
Revenue | | 29,070 | | | 29,568 | | | 32,557 |
Expenses | | 28,825 | | | 29,342 | | | 30,164 |
Net operating balance | | 245 | | | 226 | | | 2,393 |
Cash surplus/(deficit) | | (796 | ) | | (66 | ) | | 1,722 |
Capital purchases | | 3,958 | | | 4,329 | | | 4,137 |
Borrowings | | 1,800 | | | 1,449 | | | 743 |
Net worth | | 99,032 | | | 107,755 | | | 114,466 |
Notes:
| 1. | Numbers may not add due to rounding. |
Operating balance
The operating balance expected for 2006-07 is a surplus of $2.393 billion. The estimated 2006-07 surplus reflects the continuing strength of the economy flowing through to taxation and related revenues and investment returns above the long-term assumed rate of return. Significantly higher than anticipated tax equivalent payments arising from the sale of ENERGEX’s electricity and gas businesses, the Allgas distribution network and the competitive parts of Ergon Energy’s electricity retail business including Powerdirect have also contributed to the higher than forecast operating surplus in 2006-07.
With over $26 billion in funds invested in a portfolio of equities, property, cash and fixed interest, the performance of international financial markets has a major influence on the Budget result. While Budget and Mid Year Fiscal and Economic Review estimates for investment returns were based on the expected long-term average result for the portfolio of 7.5%, the 2006-07 estimated actual is now based on an estimated rate of return of 14%.
| | | | | | |
| 2 | | Budget Strategy and Outlook 2007-08 | | |
The underlying operating balance
Investment market volatility impacts on the Queensland Budget in 2006-07 more in Government Finance Statistics (GFS) terms than it does for other states. This is in part due to differences in the way Queensland’s public sector superannuation arrangements are structured. Queensland’s financial assets set aside to meet future employer superannuation liabilities are held as General Government sector assets and associated superannuation liabilities are similarly recorded as General Government sector financial liabilities. In contrast, other jurisdictions generally have structures whereby all investments are held in superannuation funds and only the net superannuation liability is recorded in the General Government balance sheet.
With the introduction of internationally harmonised accounting standards in 2005-06, the GFS methodology for calculating the Government’s defined benefit obligations and associated costs has been revised. With this change in accounting standards the Government is seen to bear the interest risk associated with defined benefit obligations regardless of whether or not superannuation assets and liabilities are included in the General Government sector. As a result, the General Government sector includes interest on its superannuation fund surpluses/deficits.
This has eliminated the significant differences that previously existed between the states in accounting for superannuation. There is now a consistent approach across the states with the impact of investment market volatility in Queensland being contained to the current year and representing the difference between the actuary’s assumptions on investment returns and actual returns achieved during the year.
If Queensland’s superannuation arrangements were structured on the same basis as generally applied in other states, the General Government sector underlying operating balance for 2006-07 would be a surplus of approximately $1.307 billion. The Budget and outyear results are outlined in Table 1.3 and are calculated on a consistent basis with that used in the other states. This table illustrates Queensland expects to report underlying operating surpluses in the Budget year and each of the outyears that are the same as the reported operating balance.
| | | | | | |
| | Budget Strategy and Outlook 2007-08 | | 3 |
Table 1.3
Calculation of underlying operating balance
| | | | | | | | | | |
| | | 2006-07 Est. Act. $ million | | 2007-08 Budget $ million | | 2008-09 Projection $ million | | 2009-10 Projection $ million | | 2010-11 Projection $ million |
Operating Balance | | 2,393 | | 268 | | 251 | | 241 | | 213 |
Less Investment Earnings in excess of long term rate1 | | 1,086 | | — | | — | | — | | — |
Underlying Balance | | 1,307 | | 268 | | 251 | | 241 | | 213 |
Notes:
| 1. | Represents investment earnings, in excess of the long-term rate of 7.5%, on financial assets held to meet future defined benefit superannuation liabilities that would be foregone if those assets were transferred to the superannuation fund. |
Cash surplus
The General Government sector is estimated to achieve a cash surplus in 2006-07 of $1.722 billion.
At the time of the Mid Year Fiscal and Economic Review, a cash deficit of $66 million was expected in 2006-07 for the General Government sector. Factors contributing to the improved estimated position include the cash impact of the upward revision to investment returns from 7.5% to 14% and higher than expected levels of receipts from taxation revenues.
Cash in the General Government sector is also higher than expected as a result of proceeds from the sale of ENERGEX’s electricity and gas retail businesses, the Allgas distribution network, the competitive parts of Ergon Energy’s electricity retail business including Powerdirect and from the partnership between Golden Casket Lottery Corporation and Tattersall’s. Proceeds from the sale of the energy assets have been quarantined for use on Queensland Future Growth Fund projects.
Capital purchases
General Government investment in capital (purchases of non-financial assets) in 2006-07 is estimated to be $4.137 billion. The estimated 2006-07 capital spend is below Mid Year Fiscal and Economic Review estimates, reflecting capacity constraints in the construction and civil engineering sector resulting in a modest level of capital deferrals. However, capital spending in 2006-07 is expected to be higher than forecast at the time of the 2006-07 Budget. This increase reflects the implementation of Government’s election commitments and additional funding for a range of projects including critical health infrastructure.
| | | | | | |
| 4 | | Budget Strategy and Outlook 2007-08 | | |
Capital spending in the Public Non-financial Corporations sector has been higher than expected at the time of the 2006-07 Budget and Mid Year Fiscal and Economic Review, mainly due to the Government’s water infrastructure projects.
The total capital program for 2006-07, including capital grants, is expected to be $12.135 billion, $1.999 billion higher than expected at the time of the 2006-07 Budget. For further details see Budget Paper No. 3 – Capital Statement.
Borrowing
Despite estimated capital acquisitions of $4.137 billion in 2006-07, the strong cash position has meant the General Government sector is forecast to borrow only $743 million, $706 million less than forecast at the time of the Mid Year Fiscal and Economic Review and $1.057 billion less than forecast at the 2006-07 Budget. This will be the first time since 2000-01 that Treasury has borrowed to support the State’s capital program.
Net worth
The net worth, or equity, of the State is the amount by which the State’s assets exceed its liabilities. This is the value of the investment held on behalf of the people of Queensland by public sector instrumentalities. The net worth of the General Government sector at 30 June 2007 is estimated at $114.466 billion. This is $6.711 billion higher than the net worth forecast at the time of the Mid Year Fiscal and Economic Review, reflecting an improved operating position and higher projected revaluations of non-financial assets.
| | | | | | |
| | Budget Strategy and Outlook 2007-08 | | 5 |
BUDGET 2007-08 AND OUTYEAR PROJECTIONS
Key financial aggregates
Table 1.4
General Government sector – key financial aggregates1
| | | | | | | | | | | | |
| | | 2007-08 Budget $ million | | | 2008-09 Projection $ million | | | 2009-10 Projection $ million | | | 2010-11 Projection $ million | |
Revenue | | 32,551 | | | 33,307 | | | 34,605 | | | 35,979 | |
Expenses | | 32,282 | | | 33,056 | | | 34,364 | | | 35,766 | |
Net operating balance | | 268 | | | 251 | | | 241 | | | 213 | |
Cash surplus/(deficit) | | (892 | ) | | (2,248 | ) | | (2,298 | ) | | (2,045 | ) |
Capital purchases | | 5,463 | | | 5,839 | | | 5,899 | | | 5,947 | |
Borrowings | | 3,569 | | | 4,275 | | | 4,193 | | | 4,021 | |
Net worth | | 119,799 | | | 123,302 | | | 127,072 | | | 130,941 | |
Note:
| 1. | Numbers may not add due to rounding. |
Operating balance
The budgeted position for the General Government sector is for an operating surplus of $268 million in 2007-08. The forecast budget surpluses are expected to moderate slightly across the forward estimates.
The increase in expenditure relative to 2006-07 primarily relates to moderate increases in wages, the implementation of election commitments and other service enhancements across key service delivery agencies and recurrent expenditure in support of the capital program.
Taxation revenue is forecast to continue to grow over the forward estimates.
Further details on revenue and expenditure projections are contained in Chapters 5 and 6 respectively.
Cash surplus and capital purchases
A cash deficit of $892 million is expected in 2007-08 for the General Government sector. The cash deficit is forecast to increase to over $2 billion in 2008-09 and remain around this level in 2009-10 and 2010-11.
| | | | | | |
| 6 | | Budget Strategy and Outlook 2007-08 | | |
Apart from the cash impact of smaller recurrent operating surpluses relative to 2006-07, the major factor contributing to lower cash results is the significant planned capital expansion. Despite this cash deficit, the Government will have cash invested with Queensland Treasury Corporation which has been quarantined for use on Queensland Future Growth Fund projects.
Total General Government capital purchases of $5.463 billion are budgeted for 2007-08, reflecting a range of infrastructure initiatives including those announced in the South East Queensland Infrastructure Plan and Program. Budget Paper No. 3 – Capital Statement provides details, by portfolio, of budgeted 2007-08 capital outlays.
Over the period 2007-08 to 2010-11, purchases of non-financial assets (capital purchases) in the General Government sector of $23.148 billion are planned.
Borrowing
Borrowing for capital purposes is consistent with the Government’s fiscal principles. Net borrowings of $3.569 billion are budgeted for 2007-08 in support of $5.463 billion in purchases of non-financial assets.
The remainder of the General Government capital program will continue to be financed through the operating cash flow.
Over the Budget and forward estimates period, total General Government borrowings and advances of $16.014 billion are planned. Of this amount, some $1.9 billion (including $860 million in 2007-08) is to fund equity injections to Queensland’s Government-owned corporations to support expansion of the State’s rail and energy infrastructure.
Net worth
State net worth is projected to increase from the 2006-07 estimated actual by $5.333 billion to $119.799 billion at 30 June 2008. Net worth is also expected to increase in all outyears. More information on the State’s net worth, assets and liabilities is provided in Chapter 7.
| | | | | | |
| | Budget Strategy and Outlook 2007-08 | | 7 |
RECONCILIATION OF OPERATING BALANCE
Table 1.5 provides a reconciliation of the current General Government sector operating balances for 2006-07 and 2007-08 to the Mid Year Fiscal and Economic Review estimates.
Table 1.5
Reconciliation of 2006-07 and 2007-08 operating balance to MYFER estimates1
| | | | | | |
| | | 2006-07 Est. Act. $ million | | | 2007-08 Budget $ million | |
MYFER Operating Balance | | 226 | | | 210 | |
Expenditure Policy Decisions2 | | (277 | ) | | (750 | ) |
Revenue Policy Decisions3 | | .. | | | 30 | |
Other Significant Variations Impacting on Operating Balance | | | | | | |
—Investment Returns and Interest Earnings4 | | 1,406 | | | 205 | |
—General Revenue Grants from the Australian Government5 | | 84 | | | 266 | |
—Taxation, Royalty and GOC Revisions6 | | 960 | | | 210 | |
—Other Parameter Adjustments7 | | (5 | ) | | 98 | |
2007-08 Budget | | 2,393 | | | 268 | |
Notes:
| 1. | Denotes impact on Operating Balance. Numbers may not add due to rounding. |
| 2. | Reflects expenditure policy decisions taken during 2006-07 and in the Budget context. Major initiatives in 2006-07 relate primarily to election commitments and funding for the Redress Scheme in the Department of Communities. For details relating to key decisions made in the context of the 2007-08 Budget, see Chapter 4. |
| 3. | Reflects reductions in land tax and changes to motor vehicle duty. Does not include reduction in mortgage duty. See Chapter 5. |
| 4. | Reflects revisions of estimated rate of return on investments from 7.5% to 14% in 2006-07 and earnings on cash balances. Includes earnings on all investments, not only those held for employee liabilities. |
| 5. | Includes outcomes of Commonwealth Grants Commission 2007 Update, population changes and most recent estimates of GST revenue included in the 2007-08 Australian Government Budget as well as changes to Specific Purpose Payments. |
| 6. | Includes adjustments to Government-owned corporations net flows. |
| 7. | Refers to adjustments of a non-policy nature such as movements in expenditure and revenue relating to economic and technical parameters and expenditure lapses in 2006-07. |
FISCAL STRATEGY
The Charter of Social and Fiscal Responsibility outlines the Government’s fiscal principles and is an integral part of the Government’s commitment to the community. The fiscal principles, detailed in Box 1.1, have been framed to meet a number of objectives, with the overriding requirement to maintain the integrity of the State’s finances.
| | | | | | |
| 8 | | Budget Strategy and Outlook 2007-08 | | |
The fiscal principles establish the basis for sustainability of the Government’s policies. They require services provided by Government be funded from tax and other revenue sources over the long term. The principles are supported by an accrual budgeting framework, which recognises future liabilities of the State and highlights the full cost of sustaining the Government’s operations on an ongoing basis.
The fiscal principles recognise the importance of a strong financial position for the State. A state government, because of its more limited tax base, does not have the same capacity as a national government to cushion economic and financial shocks. At the same time, state governments have a responsibility to provide continuity of services, such as health, police and education. A strong financial position, as indicated by a AAA credit rating, enables lower borrowing costs and is an indication of the soundness of the financial position and policies of the Government, rather than a goal in itself.
The success of Queensland’s financial and economic management has been consistently affirmed by international ratings agencies. These agencies have cited Queensland’s strong balance sheet and dynamic economic base as reasons underpinning the State’s AAA credit rating.
| | | | | | |
| | Budget Strategy and Outlook 2007-08 | | 9 |
| | | | |
Box 1.1 The fiscal principles of the Queensland Government |
| | | |
| Principle | | Achievement
Budgeted for
2007-08 | | Indicator |
Competitive tax environment The Government will ensure that State taxes and charges remain competitive with the other states and territories in order to maintain a competitive tax environment for business development and jobs growth. | | ü | | Taxation revenue per capita: Queensland: $2,226 Average of other states and territories: $2,357 |
| | | |
Affordable service provision The Government will ensure that its level of service provision is sustainable by maintaining an overall General Government operating surplus, as measured in Government Finance Statistics terms. | | ü | | GFS operating surplus: $268 million |
| | | |
Sustainable borrowings for capital investment Borrowings or other financial arrangements will only be undertaken for capital investments and only where these can be serviced within the operating surplus, consistent with maintaining a AAA credit rating. | | ü | | General Government borrowings: $3.569 billion General Government total purchases of non-financial assets: $5.463 billion AAA credit rating confirmed by Moody’s and Standard and Poor’s (highest rating available) |
| | | |
Prudent management of financial risk The Government will ensure that the State’s financial assets cover all accruing and expected future liabilities of the General Government sector. | | ü | | General Government net financial worth: $25.073 billion |
| | | |
Building the State’s net worth The Government will maintain and seek to increase total State net worth. | | ü | | Net worth to increase to $119.799 billion |
Competitive tax environment
One of the Queensland Government’s key social and fiscal objectives is to maintain a competitive tax environment that raises sufficient revenue to meet the infrastructure and government service delivery needs of the people of Queensland, while at the same time providing a low-cost environment for business to promote economic development and jobs growth.
| | | | | | |
| 10 | | Budget Strategy and Outlook 2007-08 | | |
The competitiveness of a state’s tax system is usually assessed by using one of the following measures:
| • | | taxation revenue on a per capita basis |
| • | | taxation relativities based on the Commonwealth Grants Commission methodology |
| • | | taxation revenue expressed as a percentage of gross state product (GSP). |
Queensland’s competitive tax position is confirmed by all three measures.
| • | | Per capita tax collections in Queensland in 2007-08 are estimated at $2,226, compared with an estimated $2,357 for the average of the other states. |
| • | | Commonwealth Grants Commission data indicates that Queensland’s taxation effort ratio is 85.2% compared with the standard (100%). |
| • | | Latest Australian Bureau of Statistics data shows Queensland’s tax collections are 4.06% of GSP compared to 4.7% for the average of the other states. |
The 2007-08 Budget includes changes to the land tax tax-free threshold for resident individuals as well as for companies, trusts and absentees and a 50% cap on the increase in land values on which land tax applies. The Budget also includes changes to the basis on which motor vehicle transfer duty is applied. Details of these changes and other revenue items are provided in Chapter 5.
Affordable service provision
The objective of maintaining affordable service provision requires the maintenance of a budget operating surplus, to ensure recurrent services can be funded from recurrent sources.
The 2007-08 Budget and forward estimates provide funding for the implementation of the Government’s election commitments as well as significant increases in expenditure in the areas of health, mental health and disability and emergency services.
More information on these initiatives is provided in Chapter 4.
Queensland is already one of the more efficient providers of government services among the states. Nevertheless, further improving the efficiency and effectiveness of government services is an essential element of delivering on these key policy priorities in a way that is both affordable and sustainable.
Sustainable borrowings for capital investment
The provision of adequate levels of infrastructure is an ongoing challenge for a state such as Queensland which continues to experience high levels of economic and population growth. In meeting this challenge, the Government provides capital expenditure per capita well above the average of the other states and territories.
| | | | | | |
| | Budget Strategy and Outlook 2007-08 | | 11 |
Investment in core infrastructure is a key feature of the 2007-08 Budget with a record capital program of $14.029 billion. This represents an increase of 15.6% over the estimated 2006-07 outlays. The capital outlays of Government-owned corporations constitute approximately 51% of total outlays in 2007-08.
In recognition of Queensland’s capital requirements, the Charter of Social and Fiscal Responsibility allows borrowing for capital where the costs of the borrowing can be serviced within the context of an overall operating surplus.
Queensland’s 2007-08 capital program will be funded from a mix of recurrent sources, cash balances and borrowings. Details of the State capital program for 2007-08 and sources of funds are provided in Budget Paper No. 3 – Capital Statement.
Prudent management of financial risk
Queensland has a long-standing policy of setting aside funds to accumulate financial assets sufficient to meet future liabilities, the largest being for future employee entitlements, most notably superannuation.
In this respect, Queensland is far better placed than any of the other state or territory governments to fund future accruing liabilities as most other jurisdictions have substantial unfunded superannuation liabilities.
The State’s policy of setting aside funds to meet future liabilities and reinvesting all earnings provides the capacity to manage cycles in investment markets without impacting on the Government’s ability to fund ongoing services to the community.
Building the State’s net worth
The Charter of Social and Fiscal Responsibility policy of building the State’s net worth is intended to ensure infrastructure and other assets are not run down to the detriment of future citizens and taxpayers. It is an important element in ensuring intergenerational equity.
Queensland’s net worth is forecast to grow over the forward estimates. Queensland’s per capita net worth is expected to be 55% greater in 2007-08 than the average per capita net worth of the other states.
Further information on State net worth and other balance sheet aggregates can be found in Chapter 7.
| | | | | | |
| 12 | | Budget Strategy and Outlook 2007-08 | | |
INDICATORS OF FISCAL CONDITION
Table 1.6 provides information on the Government’s service delivery capacity, financial sustainability and financial capacity.
Service delivery capacity
This financial data provides an indication of the non-financial capital resources of the General Government sector. These resources generally relate to capital infrastructure and therefore indicate the capacity of the Government to provide services to the community. The data, showing increasing levels and additions of non-financial assets, reflect the State’s heightened commitment to infrastructure provision in recent years.
Financial sustainability
These ratios provide an indication of the sustainability of current policy settings – including the size of the operating surplus (relative to expenses) and the level of debt servicing costs (relative to revenue). A large operating balance and stable low debt servicing costs indicate that current policies are sustainable.
Financial capacity
These ratios provide an indication of the State’s capacity to respond to unexpected events or opportunities. Low levels of borrowing and taxation and large negative net debt provide the State with the capacity for additional resources to be called upon if required.
Table 1.6
Indicators of fiscal condition – General Government sector
| | | | | | | | |
| | | 2005-06
Actual | | 2006-07
Est. Act. | | 2007-08
Budget | | Other
States1 2007-08 |
Service Delivery Capacity | | | | | | | | |
Non-financial assets/population ($) | | 20,335 | | 21,416 | | 22,738 | | 14,341 |
Purchases of non-financial assets/non-financial assets (%) | | 3.9 | | 4.7 | | 5.8 | | 4.7 |
Financial Sustainability | | | | | | | | |
Operating balance/total expenses (%) | | 14.1 | | 7.9 | | 0.8 | | 1.8 |
Debt servicing cost/total revenue (%) | | 0.6 | | 0.7 | | 1.2 | | 1.9 |
Financial Capacity | | | | | | | | |
Total borrowings/total assets (%) | | 1.6 | | 2.3 | | 4.3 | | 6.6 |
Total liabilities/total assets (%) | | 20.7 | | 20.9 | | 22.5 | | 26.6 |
Net worth/population ($) | | 26,153 | | 27,987 | | 28,757 | | 18,555 |
Net debt/GSP (%) | | -12.7 | | -13.3 | | -11.5 | | 0.8 |
Taxation/GSP (%) | | 4.1 | | 4.2 | | 4.4 | | 4.6 |
| 1. | Weighted average of all states and territories, excluding Queensland. |
| Source: | QLD, VIC, WA, NT State Budgets, NSW, SA, TAS, ACT Mid-Year Reviews/Budget Updates. |
| | | | | | |
| | Budget Strategy and Outlook 2007-08 | | 13 |
| 2. | ECONOMIC PERFORMANCE AND OUTLOOK |
FEATURES
| | • | | Growth in the Queensland economy is estimated to strengthen to an above-average rate of 5 1/2% in 2006-07 and exceed growth nationally for the 11th successive year. |
| | • | | Investment is expected to be the main driver of growth in domestic demand in 2006-07. Business investment is estimated to rise 18% and be broad-based across the trade, property and service sectors, while public investment in water, transport and energy infrastructure is also expected to grow strongly. |
| | • | | A rebound in coal and tourism exports is estimated to increase total exports by 2 1/4% in 2006-07. However, strong domestic demand is expected to result in faster growth in imports (5 1/4%) relative to exports, causing the trade sector to detract from overall economic growth. |
| | • | | The Queensland economy is forecast to grow by 5% in 2007-08 and again exceed growth nationally. Investment by the business and public sector combined is forecast to reach 25% of gross state product, compared with 15% five years earlier, adding significantly to the State’s productive capacity. |
| | • | | However, a slight rebalancing in overall economic growth is anticipated, reflecting some easing in investment growth, albeit from very high rates, and a forecast strengthening in exports growth to a seven-year high of 3 3/4%. |
| | • | | Households are anticipated to return as the principal driver of growth in domestic demand in 2007-08, with higher consumer spending reflecting strong growth in employment and wages, as well as a pick-up in housing investment. |
| | • | | Employment is estimated to grow at an above-average rate of 4 3/4% in 2006-07, before returning to its long-run average of 3% growth in 2007-08, representing the creation of more than 150,000 jobs over the two years. |
| | • | | The State’s year-average unemployment rate is estimated to fall to a 33-year low of 4% in 2006-07 and remain steady in 2007-08, representing a rate well below that nationally. |
INTRODUCTION
This chapter presents the economic framework within which the 2007-08 Budget has been prepared. It provides an overview of recent developments in Queensland’s external economic environment, examines the performance and outlook for the Queensland economy, and highlights risks and opportunities to economic growth during the forecast horizon. The chapter details estimated actuals and forecasts for the major components of state economic activity for both 2006-07 and 2007-08 (see Table 2.1) and projections for key economic variables over the medium-term to 2010-11 (see Table 2.2).
| | | | | | |
| 14 | | Budget Strategy and Outlook 2007-08 | | |
EXTERNAL ENVIRONMENT
International conditions
Queensland’s major trading partner growth is expected to ease slightly to 4 1/4% in 2006-07, mainly as a result of slower growth in the Asian region (see Chart 2.1). While the outlook for the rapidly developing economies of China and India is robust, growth in the export-oriented industrialised Asian economies is expected to be adversely affected by a softening in overseas demand, especially from the United States (US). Economic activity in the US has moderated in the first three quarters of 2006-07 due to a decline in housing construction and, to a lesser extent, business investment. However, there has been little evidence of US weakness spilling over to Europe. In fact, a broad-based improvement in European economic growth in 2006-07 coincided with a boost in spending due to the 2006 FIFA World Cup.
The US economy is predicted to begin a recovery during 2007-08, as the temporary slowdown in investment and housing construction unwinds. This is forecast in turn to support growth in Asian economies, such as Korea and Taiwan, offsetting a mild policy-led moderation in growth in China and India. In contrast, European economic growth is forecast to moderate to around the long-run average in 2007-08, in response to monetary and fiscal policy tightening. As a whole, major trading partner growth is forecast to remain steady at around 4 1/4% in 2007-08, which would represent the third consecutive year of above-average growth for Queensland’s major trading partners.
Chart 2.1
Economic growth in Queensland’s major trading partners1
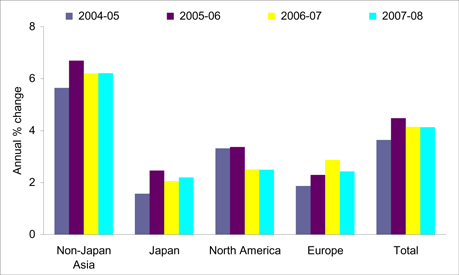
Note:
| | 1. | 2006-07 is an estimate, 2007-08 is a forecast. |
Sources: Queensland Treasury and Consensus Economics.
| | | | | | |
| | Budget Strategy and Outlook 2007-08 | | 15 |
A key theme affecting the global economic outlook is an apparent divergence in global monetary policy settings. While the US Fed funds rate has remained unchanged since June 2006, other major economies have engaged in monetary tightening. With the US alone currently absorbing around three-quarters of global savings, this divergence in monetary policy settings should reduce the pace of capital flow into the US and therefore assist in the orderly unwinding of current global financial imbalances.
Australian economy
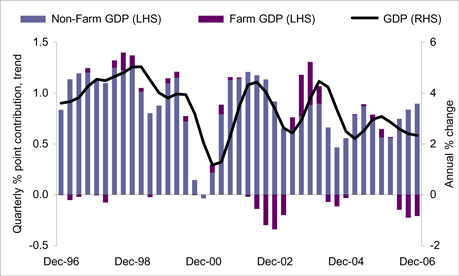
National economic growth in 2006-07 is expected to be limited by severe drought conditions, despite the non-rural economy benefiting from strong overseas demand for Australia’s energy and mineral products. Specifically, farm output is estimated to fall by 20% in 2006-07, leading to a decline in rural exports and investment by the agricultural sector. In contrast, the household sector is expected to recover in 2006-07, due to strong employment and wages growth as well as increased immigration. Stronger growth in household spending is expected to result in higher growth in imports, particularly with a high Australian dollar (A$) subduing prices of imported goods. As a whole, Australian Treasury expects economic growth to ease from 2.9% in 2005-06 to 2 1/2% in 2006-07.
An assumed unwinding of drought conditions and an increase in mining production are anticipated to boost economic growth in 2007-08. The assumed return to average seasonal conditions is forecast to add 1/2 percentage point to gross domestic product (GDP) growth, while expanded capacity in the mining sector is anticipated to strengthen growth in exports. These factors, combined with a rebound in machinery and equipment investment, are forecast to accelerate overall economic growth to 3 3/4% in 2007-08.
Chart 2.2
Gross domestic product, farm and non-farm GDP, Australia
| | | | | | |
| 16 | | Budget Strategy and Outlook 2007-08 | | |
The Australian Treasury’s view is that, despite a forecast improvement in economic growth, employment growth nationally is anticipated to ease from an estimated 2 1/2% in 2006-07 to 1 1/2% in 2007-08. Further, the year-average unemployment rate is anticipated to rise 1/4 percentage point, to 5% in 2007-08, as new entrants into the labour force take time to find jobs.
THE QUEENSLAND ECONOMY
External forecast assumptions
As a small open economy, Queensland’s economic growth forecasts are based on assumptions about the national economy, trading partners and financial markets.
| | • | | Queensland’s major trading partner economies are expected to grow at an above-average rate of 4 1/4% in 2006-07 and 2007-08. |
| | • | | While the A$ in April 2007 reached its highest level against the US$ since 1990, an anticipated peaking in commodity prices is forecast to result in some depreciation in the A$ during 2007-08. |
| | • | | The Australian Government’s economic forecasts and projections, as outlined in the Australian Budget delivered on 8 May 2007, have been adopted as the basis for national economic performance over the forecast period. |
| | • | | Forecasts of rural production and exports are based on an assumption of a return to average seasonal conditions in Queensland in 2007-08. |
| | • | | The Australian official cash rate is assumed to remain largely unchanged, with the Reserve Bank of Australia (RBA) forecasting underlying inflation to remain within its 2-3% target band. |
A discussion of the risks and opportunities associated with these assumptions is contained later in this chapter.
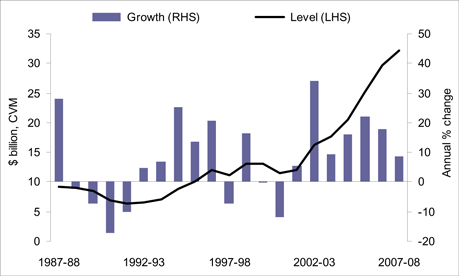
Overall economic growth
Growth in the Queensland economy is estimated to strengthen to an above-average rate of 5 1/2% in 2006-07, driven by strong domestic demand and a recovery in exports. This will represent a growth rate more than double the 2 1/2% estimated nationally, and the 11th successive year that Queensland’s economic growth has exceeded that nationally.
Following an expansion lasting a decade and a half, the State economy has operated near full capacity in recent years. In response to this, investment is expected to be the main driver of domestic demand growth, rather than consumption, in 2006-07 (see Chart 2.3). Business investment is estimated to rise a further 18% and be broad-based across trade related sectors, commercial property and services. Public investment is also expected to continue to grow strongly, reflecting transport, energy and water infrastructure spending.
| | | | | | |
| | Budget Strategy and Outlook 2007-08 | | 17 |
In comparison, growth in consumer spending is expected to ease due to higher interest rates and the continued effects of a moderation in the housing cycle in previous years. Housing investment, however, is expected to regain momentum through 2006-07, as higher returns encourage investor activity and population growth supports owner-occupied housing construction.
A rebound in coal and tourism exports is expected to offset a fall in base metal and rural exports in 2006-07, resulting in total exports rising an estimated 2 1/4%. However, with strong domestic demand expected to result in higher growth in imports (5 1/4%) relative to exports, the trade sector is estimated to detract from overall growth.
The Queensland economy is forecast to grow by 5% in 2007-08 and again exceed growth nationally. Investment by the business and public sector combined is forecast to reach 25% of gross state product, compared with 15% five years ago, and boost the productive capacity of the economy. However, a slight rebalancing in growth is forecast in 2007-08, with some easing in investment growth, albeit from very high rates, leading to a moderation in growth in domestic demand, while export growth is forecast to strengthen to a seven-year high of 3 3/4%. In particular, a rebound in rural and base metal exports is forecast to complement continued growth in coal exports due to strong global demand.
Households are anticipated to return as the principal driver of domestic demand in 2007-08. Consumer spending is forecast to strengthen to 4 3/4%, reflecting exceptional labour market conditions characterised by strong growth in employment and wages, a more stable interest rate outlook and a pick-up in housing construction activity.
Chart 2.3
Contribution to growth in Queensland’s gross state product1
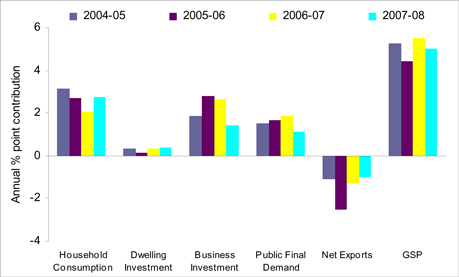
Note:
| | 1. | Chain Volume Measure (CVM), 2004-05 reference year. 2006-07 is an estimated actual, 2007-08 is a forecast. |
Source: Queensland Treasury.
| | | | | | |
| 18 | | Budget Strategy and Outlook 2007-08 | | |
Table 2.1
State and National Economic Forecasts1
| | | | | | | | |
| | | Outcomes | | Est. Actual | | Forecast |
| | | 2004-05
% | | 2005-06
% | | 2006-07 % | | 2007-08
% |
Queensland forecasts2 | | | | | | | | |
Domestic production | | | | | | | | |
Household consumption | | 5.4 | | 4.6 | | 3 1/2 | | 4 3/4 |
Private investment3,4 | | 7.6 | | 12.2 | | 11 1/4 | | 7 3/4 |
Dwellings | | 3.8 | | 1.6 | | 3 3/4 | | 4 1/4 |
Business investment4, 5 | | 16.1 | | 22.2 | | 18 | | 8 3/4 |
Other buildings and structures4 | | 10.6 | | 29.5 | | 28 3/4 | | 9 1/4 |
Machinery and equipment4 | | 19.8 | | 17.8 | | 10 3/4 | | 8 1/4 |
Private final demand4 | | 6.0 | | 6.9 | | 6 | | 5 3/4 |
Public final demand4 | | 7.0 | | 7.6 | | 8 1/4 | | 4 3/4 |
Gross state expenditure6 | | 6.1 | | 6.6 | | 6 1/2 | | 5 3/4 |
Exports of goods and services | | 3.6 | | 0.0 | | 2 1/4 | | 3 3/4 |
Imports of goods and services | | 6.2 | | 7.1 | | 5 1/4 | | 5 1/2 |
Net exports7 | | -1.1 | | -2.5 | | -1 1/4 | | -1 |
Gross state product | | 5.3 | | 4.4 | | 5 1/2 | | 5 |
| | | | |
Other state economic measures | | | | | | | | |
Population | | 2.2 | | 2.1 | | 2 | | 2 |
Inflation | | 2.6 | | 3.1 | | 3 | | 2 3/4 |
Wage Price Index | | 3.8 | | 4.4 | | 4 1/2 | | 4 1/4 |
Employment (labour force survey) | | 5.6 | | 2.9 | | 4 3/4 | | 3 |
Unemployment rate (%, year-average) | | 4.9 | | 5.0 | | 4 | | 4 |
Labour force | | 4.1 | | 3.0 | | 3 3/4 | | 3 |
Participation rate | | 65.8 | | 66.3 | | 67 1/4 | | 67 1/2 |
| | | | |
National forecasts2 | | | | | | | | |
Domestic production | | | | | | | | |
Household consumption | | 4.3 | | 2.6 | | 3 1/2 | | 3 1/2 |
Private investment | | na | | na | | na | | na |
Dwellings | | -1.5 | | -3.9 | | 2 1/2 | | 2 1/2 |
Business investment4,5 | | na | | 16.2 | | 4 | | 7 1/2 |
Other buildings and structures4 | | na | | 21.6 | | 12 | | 7 |
Machinery and equipment4 | | na | | 14.5 | | -1 1/2 | | 6 1/2 |
Private final demand4 | | na | | 4.4 | | 3 1/2 | | 4 1/4 |
Public final demand4 | | na | | 4.3 | | 4 | | 3 3/4 |
Gross national expenditure6 | | 4.5 | | 4.1 | | 3 1/2 | | 4 1/4 |
Exports of goods and services | | 3.1 | | 2.2 | | 3 | | 5 |
Imports of goods and services | | 12.1 | | 7.2 | | 8 1/2 | | 6 1/2 |
Net exports7 | | -1.8 | | -1.1 | | -1 1/4 | | - 1/2 |
Gross domestic product | | 2.7 | | 2.9 | | 2 1/2 | | 3 3/4 |
| | | | |
Other national economic measures | | | | | | | | |
Population | | 1.2 | | 1.3 | | 1 1/4 | | 1 1/4 |
Inflation | | 2.4 | | 3.2 | | 2 3/4 | | 2 1/2 |
Wage Price Index | | 3.8 | | 4.1 | | 4 1/4 | | 4 1/4 |
Employment (labour force survey) | | 3.0 | | 2.2 | | 2 1/2 | | 1 1/2 |
Unemployment rate (%, year-average) | | 5.3 | | 5.1 | | 4 3/4 | | 5 |
Labour force | | 2.4 | | 2.1 | | 2 1/4 | | 1 3/4 |
Participation rate | | 64.0 | | 64.5 | | 64 3/4 | | 65 |
| 1. | Unless otherwise stated, all figures are annual % changes. Decimal point figures indicate an actual outcome. na—Indicates not available. |
| 2. | CVM, 2004-05 reference year. |
| 3. | Private investment includes livestock, intangible fixed assets and ownership transfer costs. |
| 4. | Excluding private sector net purchases of second-hand public sector assets and incorporating changes to the allocation of investment due to the full privatisation of Telstra. |
| 5. | National calculations of business investment include investment in livestock and intangible fixed assets, which are not included in the Queensland calculations. |
| 6. | Includes statistical discrepancy and change in inventories. |
| 7. | Percentage point contribution to growth in gross state or domestic product. |
| Sources: | Queensland Treasury, Australian Treasury and ABS 5206.0. |
| | | | | | |
| | Budget Strategy and Outlook 2007-08 | | 19 |
Household consumption
Growth in household consumption is expected to moderate for a third consecutive year, to 3 1/2% in 2006-07, representing a trough in the consumption cycle. A number of factors have dampened consumer spending in 2006-07, despite above-average growth in employment, wages and share prices boosting incomes and wealth during the year. One dampening factor on consumer spending has been the lagged impact of the moderation in housing investment, which initially supported spending on household items as well as wealth-related spending due to strong house price growth (see Chart 2.4). Further, three interest rate rises in 2006 have seen growth moderate in discretionary areas of spending, while higher petrol prices in late 2005-06 have resulted in reduced spending on transport into 2006-07.
Growth in household consumption is forecast to strengthen to 4 3/4% in 2007-08, underpinned by strong growth in incomes, wealth and employment, as well as some stabilisation in interest rates and petrol prices. The strength of the domestic economy as well as the high level of Queensland’s terms of trade (export prices relative to import prices) are anticipated to support income growth. Renewed strength in the housing sector is forecast to result in stronger real growth in spending related to household services and furnishings in 2007-08, while the recent strengthening in Queensland house price growth should also support increases in household wealth and, hence, consumption.
Chart 2.4
Household consumption1 and housing finance commitments2, Queensland

Notes:
| | 1. | CVM, 2004-05 reference year. 2006-07 is an estimated actual, 2007-08 is a forecast. |
Sources: Queensland Treasury and ABS 5609.0.
| | | | | | |
| 20 | | Budget Strategy and Outlook 2007-08 | | |
Dwelling investment
Following modest growth in 2005-06, growth in dwelling investment in Queensland is expected to strengthen to 3 3/4% in 2006-07 and 4 1/4% in 2007-08, driven by ongoing growth in renovation activity as well as a turnaround in new home construction activity.
In contrast to the peak years of the latest housing cycle, renovation activity has been the primary driver of growth in housing investment in recent years. Alterations and additions activity has been supported by strong growth in incomes and excellent labour market conditions. Continued growth in property prices across the State has also provided owner-occupiers with increased home equity to finance renovations, as well as making it more cost effective at the margin to renovate rather than purchase a new home. These factors driving renovation activity are expected to continue into 2006-07 and 2007-08.
After declining in 2005-06, new construction activity has recovered in the first half of 2006-07, with forward indicators and a build up of construction work yet to be done suggesting this should continue for the remainder of the fiscal year (see Chart 2.5). Despite recent increases in interest rates, strong population growth is forecast to maintain growth in demand for owner-occupied housing in 2007-08, while low rental vacancy rates and higher rental yields across much of the State should support investor activity in the housing market.
Chart 2.5
Dwelling construction1,2 and turnover3, Queensland
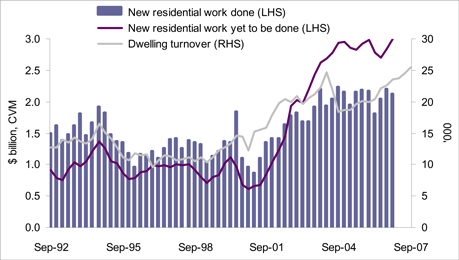
Notes:
| | 1. | CVM, 2004-05 reference year. |
| | 2. | Residential work yet to be done deflated using ABS 6416.0 House Price Index: Project Homes: Brisbane. |
| | 3. | Finance approvals for purchase of established dwellings, excluding refinancing. Advanced two quarters. |
Sources: ABS 5609.0, 6416.0 and 8752.0.
| | | | | | |
| | Budget Strategy and Outlook 2007-08 | | 21 |
Business investment
The rapid growth in business investment in Queensland has continued into 2006-07, with the volume of investment estimated to surge a further 18% (see Chart 2.6). Continued buoyant economic conditions, both domestically and in the State’s major trading partners, as well as high rates of corporate profitability and capacity utilisation, have added considerable momentum to the current cycle.
Investment in other buildings and structures is estimated to rise by 28 3/4% in 2006-07. Growth has been broad-based, with rising household incomes and population growth encouraging non-residential construction in sectors such as education, retail, office property as well as entertainment and recreation. Sustained high prices and strong global demand for the State’s mineral exports have also boosted profitability and encouraged engineering construction related to mining and other export industries. Strong growth in domestic demand is estimated to lead to a 10 3/4% rise in machinery and equipment investment, with a high A$ also encouraging spending on imported capital goods.
Ongoing strong growth in global demand and continued high levels of capacity utilisation domestically are anticipated to see business investment rise a further 8 3/4% in 2007-08. Despite moderating from the very high rates of previous years, this forecast growth should see the overall volume of business investment surpass $32 billion in real terms next financial year, with non-dwelling construction forecast to increase a further 9 1/4% and machinery and equipment investment by 8 1/4% in 2007-08.
Chart 2.6
Business investment, Queensland1
Note:
| | 1. | CVM, 2004-05 reference year. 2006-07 is an estimated actual, 2007-08 is a forecast. Excluding private sector net purchases of second-hand public sector assets and incorporating changes to the allocation of investment due to the full privatisation of Telstra. |
Source: Queensland Treasury.
| | | | | | |
| 22 | | Budget Strategy and Outlook 2007-08 | | |
Public final demand
With further increases in spending on water, transport, energy and social infrastructure, public final demand is estimated to grow at a strong rate of 8 1/4% in 2006-07 and 4 3/4% in 2007-08. This forecast growth takes into account the full privatisation of Telstra, which will result in this corporation’s investment being treated as private, rather than public, investment from March quarter 2007 onwards.
Net exports
Despite an expected recovery in exports, strong growth in domestic demand is estimated to result in comparatively higher imports growth. As a result, net exports are estimated to detract 1 1/4 percentage points from economic growth in 2006-07.
After remaining almost unchanged in 2005-06, the volume of exports is expected to recover to record growth of 2 1/4% in 2006-07, largely reflecting a rebound in coal and tourism exports. Coal exports rose strongly in the first three quarters of 2006-07, driven by continued increases in Asia’s energy demands, growth in global steel production, and capacity expansions in coal production and transport infrastructure, with the latter having temporarily disrupted exports in 2005-06.
In contrast, exports of other goods overseas are estimated to fall in 2006-07. Transitory factors, including mine expansion and maintenance, as well as disruptions in processing, are expected to lower base metal exports (such as aluminium, copper and zinc), while a high A$ has coincided with a fall in exports of manufactures in the first three quarters of 2006-07.
Continued drought conditions across the majority of the State will subdue rural exports in 2006-07. The impact of Cyclone Larry and poor harvest conditions are expected to lower sugar exports. However, this decline is likely to be largely offset by higher meat exports, as producers reduce stock levels due to drought conditions and improved access to key Asian markets following a ban on North American beef imports between 2004 and 2006.
While growth in export volumes has been mixed across commodities and other goods, exporters continue to benefit from high world commodity prices, with Queensland’s terms of trade remaining near historic highs in the first half of 2006-07. In particular, prices for selected base metals, such as aluminium, lead and zinc, have continued to increase, providing a boost to profitability, investment and employment in this sector.
Import growth is estimated to remain solid at 5 1/4% in 2006-07. Strong growth in incomes and corporate profitability, combined with a high A$, has encouraged household and business spending on imported consumer durables and capital items.
| | | | | | |
| | Budget Strategy and Outlook 2007-08 | | 23 |
Net exports are forecast to improve slightly in 2007-08, detracting one percentage point from economic growth. Exports growth is forecast to strengthen further to a seven-year high of 3 3/4%, with Queensland’s major trading partner economies predicted to continue to grow at an above-average rate. Further growth in coal exports and a recovery in base metal and sugar exports are forecast to drive commodity exports growth in 2007-08. Exports of manufactures and tourism services are also anticipated to contribute to the recovery. In comparison, imports growth is forecast to edge higher to 5 1/2% in 2007-08, with an anticipated strengthening in growth in imports by the household sector more than offsetting more moderate growth in imports of machinery and equipment.
Chart 2.7
Exports and imports, Queensland1
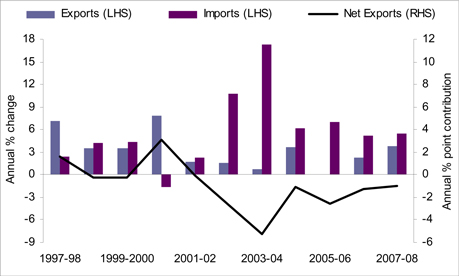
Note:
| | 1. | CVM, 2004-05 reference year. 2006-07 is an estimated actual, 2007-08 is a forecast. |
Source: Queensland Treasury.
Labour Market
Employment growth is estimated to strengthen to an above-average rate of 4 3/4% in 2006-07, representing the creation of more than 90,000 jobs over the year. Record levels of business and public infrastructure spending, together with solid housing activity, have driven job gains in construction as well as property and business services during the year. Queensland Government initiatives have also contributed to employment growth in health and community services. Further, prices for outputs (particularly for exports) have continued to rise faster than wages in recent years. This improvement in profitability and fall in unit labour costs (wages paid as a share of income earned) has encouraged labour demand, and subsequently jobs growth, in 2006-07.
| | | | | | |
| 24 | | Budget Strategy and Outlook 2007-08 | | |
The year-average labour force participation rate is estimated to reach a new high of 67 1/4% in 2006-07, as strong growth in domestic demand and wages encourage mature-age persons, in particular, to re-enter the workforce. This rise in the participation rate, combined with solid population growth, is estimated to increase the size of the labour force by 3 3/4% in 2006-07. However, with employment growth expected to exceed labour force growth, the State’s year-average unemployment rate is estimated to fall to a 33-year low of 4% in 2006-07.
Chart 2.8
Employment growth, labour force growth and unemployment rate, Queensland1,2
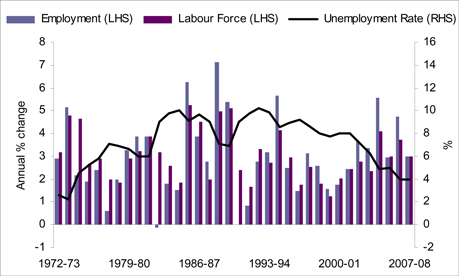
Notes:
| | 1. | Year-average, 2006-07 is an estimated actual, 2007-08 is a forecast. |
| | 2. | Revisions to ABS labour force data and estimation methods are due in June 2007. |
Sources: Queensland Treasury and ABS 6202.0.
Reflecting some moderation in growth in overall domestic activity, employment growth is forecast to return to the long-run average rate of 3% in 2007-08, representing the creation of a further 60,000 jobs next financial year. The labour force participation rate is forecast to rise further to 67 1/2% in 2007-08, as tight labour market conditions encourage more persons into the labour force. This, along with solid population growth, is forecast to result in labour force growth of 3% in 2007-08. With employment and the labour force forecast to grow at a similar rate, the year-average unemployment rate in 2007-08 is anticipated to remain at around the 33-year low of 4% expected in 2006-07.
| | | | | | |
| | Budget Strategy and Outlook 2007-08 | | 25 |
Population
After surpassing four million persons in December 2005, Queensland’s population is forecast to continue to grow at a solid rate of 2% per annum in 2006-07 and 2007-08. This would translate into a net addition of 150,000 persons, or nearly 1,500 persons per week, over the two years. Traditional factors such as the State’s stronger economic growth (see Chart 2.9), lower cost of living and preferable lifestyle, are expected to maintain high levels of net interstate migration. As a result, population growth in Queensland is forecast to remain around double that in the rest of Australia.
Chart 2.9
Domestic economic growth differential and migration, Queensland1
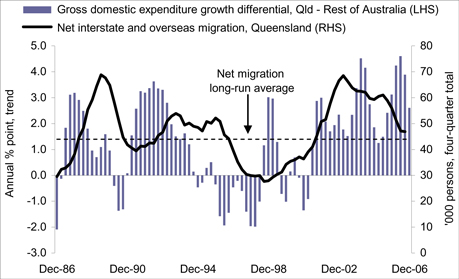
Note:
| | 1. | Revisions to ABS population data and estimation methods are due in June 2007. |
Sources: ABS 3101.0 and 5206.0.
Wages
Queensland is expected to continue to record strong wages growth in 2006-07, with the Wage Price Index (WPI) estimated to grow by 4 1/2%. Tight labour market conditions, as well as a strong terms of trade, have allowed above-average wages growth for employees in resource, trade and construction related sectors. Sustained demand for labour is forecast to see growth in the WPI remain solid at 4 1/4% in 2007-08, supported by an anticipated pick-up in labour productivity growth and ongoing high profitability.
With wages growth forecast to remain above inflation in both 2006-07 and 2007-08, employed persons in Queensland are expected to continue to benefit from rising real wages over the forecast period.
| | | | | | |
| 26 | | Budget Strategy and Outlook 2007-08 | | |
Inflation
Consumer price inflation (as measured by movements in the Brisbane consumer price index) is estimated to be 3% in 2006-07, similar to the 3.1% recorded in 2005-06. Domestically, tight housing market conditions have driven rents and housing purchase costs higher in 2006-07. Banana prices have returned to more normal levels, after reaching a temporary high in 2006 due to the effects of Cyclone Larry. However, ongoing drought conditions have seen higher food prices (excluding fruit) over the first three quarters of 2006-07 (see Chart 2.10). External factors are expected to moderate overall inflation, with fuel prices averaging lower in the first three quarters of the current financial year compared with the same period in 2005-06.
Inflation is forecast to ease to 2 3/4% in 2007-08, following an assumed return to normal seasonal conditions, which should dampen food price inflation next year, while a pick-up in labour productivity growth is expected to restrain growth in production costs.
Chart 2.10
Components of consumer price inflation, Brisbane
(% of total change in CPI, three quarters to March quarter 2007)
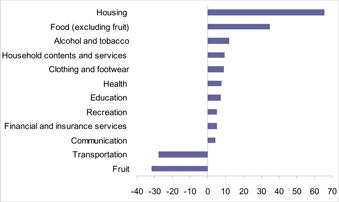
Source: ABS 6401.0.
Risks and opportunities
The world economy continues to provide both opportunities and risks to economic growth in Queensland. Despite some global tightening in interest rates, the performance of Queensland’s major trading partners has consistently exceeded market expectations. If growth prospects in the State’s major trading partners continue to improve, exports growth in Queensland may be stronger than currently forecast.
| | | | | | |
| | Budget Strategy and Outlook 2007-08 | | 27 |
However, the recent downturn in the US economy represents a risk to global economic activity. In particular, given the US represents the major destination for exports from China and Japan, softer growth in the US economy will have flow-on effects for Queensland exports, given China and Japan also represent major export destinations for Queensland commodities.
Despite widespread speculation of an easing in metal prices, stronger than expected world growth has seen prices generally maintain historic high levels. If global economic growth continues to exceed expectations, any fall in commodity prices may be further postponed, supporting domestic income and spending in Queensland. Conversely, in the case that the turnaround in commodity prices is earlier and deeper than currently predicted, growth in business and consumer spending may be adversely affected.
In line with market expectations, forecasts presented above assume that the A$ will depreciate slightly over the forecast period. If the A$ remains at its current high level or strengthens further, growth in non-commodity exports, such as tourism and manufactures, may be affected in 2007-08. On the other hand, any larger than expected depreciation in the A$ should benefit non-commodity overseas exports.
Current high rates of capacity utilisation in the trade sector mean that any reoccurrence of transitory factors that affected the supply of some commodities in recent years, such as mine maintenance and temporary disruptions due to capacity expansions, is more likely to affect export performance than in previous years.
The labour force participation rate is expected to rise further in 2007-08, both nationally and in Queensland, supporting labour supply growth. However, this partly reflects Australian Government policy changes promoting workforce participation among groups not previously attached to the workforce. As a result, this process of labour market adjustment has the potential to increase the unemployment rate, as these new entrants take time to transition into employment.
Despite leaving interest rates unchanged since November 2006, the RBA continues to closely monitor inflationary pressures from a strong world economy, strong demand growth and limited spare capacity. In the case that interest rates rise further, household consumption and, to a lesser degree, private investment may be adversely affected in 2007-08. Specifically, given elevated household debt levels following the housing boom, the impact of interest rates rises on consumption may be greater than in the past.
With recent indicators suggesting that El-Niño conditions have declined markedly since early 2007, an assumed improvement in weather conditions underpins a forecast recovery in rural exports. However, if rainfall does not improve sufficiently in 2007-08, water storage levels will remain low. If this eventuates, rural exports and food prices may be adversely affected.
| | | | | | |
| 28 | | Budget Strategy and Outlook 2007-08 | | |
Medium-term outlook
Queensland Treasury provides projections for key economic parameters for the three years following the immediate forecast period in the annual Budget. The projections for the years 2008-09 to 2010-11, shown in Table 2.2, provide a broad indication of the likely path of economic conditions in the State and nationally over the medium-term, rather than point estimates of actual growth for this period. The projections assume a continuation of the longer-term Australian Government policy framework of a stable budget position and monetary policy consistent with a low inflation environment.
Economic growth in Queensland is projected to return towards its average growth rate over the longer-term. Growth in domestic activity, driven by the current surge in both business investment and public sector infrastructure spending, is expected to ease. Partly offsetting this, the resulting increase in capacity, combined with sustained strong global demand, is expected to improve trade sector performance. Overall, economic growth of around 4 1/2% per annum is projected for the period 2008-09 to 2010-11. Jobs growth of 2 1 /2% per annum is projected to outpace population growth of 1 3/4 % per annum. This implies a moderate increase in labour force participation and the current low unemployment rate to be maintained over the medium-term.
| | | | | | | | |
Table 2.2 Economic parameters/projections1 (annual % change) |
| | | | |
| | | Outcome
2005-06 | | Est. Act.
2006-07 | | Forecast
2007-08 | | Projections2
2008-09 to
2010-11 |
Queensland | | | | | | | | |
Gross state product3 | | 4.4 | | 5 1/2 | | 5 | | 4 1/2 |
Employment | | 2.9 | | 4 3/4 | | 3 | | 2 1/2 |
Inflation | | 3.1 | | 3 | | 2 3/4 | | 2 1/2 |
Wage Price Index | | 4.4 | | 4 1/2 | | 4 1/4 | | 4 |
Population | | 2.1 | | 2 | | 2 | | 1 3/4 |
Australia | | | | | | | | |
Gross domestic product3 | | 2.9 | | 2 1/2 | | 3 3/4 | | 3 |
Employment | | 2.2 | | 2 1/2 | | 1 1/2 | | 1 1/4 |
Inflation | | 3.2 | | 2 3/4 | | 2 1/2 | | 2 1/2 |
Wage Price Index | | 4.1 | | 4 1/4 | | 4 1/4 | | 4 |
Population | | 1.3 | | 1 1/4 | | 1 1/4 | | 1 1/4 |
Notes:
| 1. | Decimal point figures indicate an actual outcome. |
| 2. | Average annual percentage change over the period. |
| 3. | CVM, 2004-05 reference year. |
Sources: Queensland Treasury and Australian Treasury.
| | | | | | |
| | Budget Strategy and Outlook 2007-08 | | 29 |
FEATURES
| • | | Queensland’s strategy for continued economic growth and prosperity focuses on productivity growth, driven by the maintenance of sound fiscal and economic settings, microeconomic reform, infrastructure investment and investments in skills and innovation. |
| • | | Queensland is maintaining strong policy fundamentals through the Charter of Social and Fiscal Responsibility. |
| • | | The Government is implementing a program of microeconomic reform to improve the efficiency of Queensland’s economy and industry. |
| • | | Infrastructure investment is at a record level and continues to be the largest capital investment program per capita in Australia by a sizable margin. A special focus is the development of water infrastructure and water reform, particularly in the South East Queensland region. |
| • | | Continued emphasis is being placed on skills development in order to increase labour productivity and employment. Key plans are the Queensland Skills Plan, the Skilling Queensland for Work program and Education and Training Reforms for the Future. |
| • | | The Smart State Strategy and other innovation measures are a further area of attention. Queensland’s innovation performance has improved significantly in the last five years. |
ECONOMIC AND PRODUCTIVITY GROWTH
This chapter discusses the Queensland Government’s economic policies and framework, especially those policies which are designed to maintain the State’s strong economic and productivity growth.
Productivity
Productivity growth plays a key role in improving the State’s economy and is the single most important determinant of economic growth in the longer term and a key influence on improving living standards.
Over the past 10 years, Queensland has generated an average annual growth rate of 4.9% per annum, compared with 3.3% for the rest of Australia. Labour productivity growth accounts for around half of this growth. Chart 3.1 shows the levels of productivity growth and long-term economic growth over the last decade.
| | | | | | |
| 30 | | Budget Strategy and Outlook 2007-08 | | |
Chart 3.1
Employed labour, labour productivity and real output, 1995-96 to 2005-06
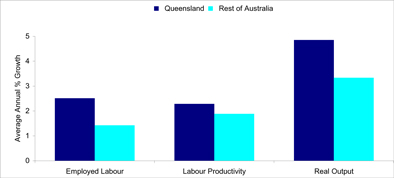
Source: Queensland State Accounts, ABS 6202.0 unpublished data.
Participation
As well as productivity growth, Queensland’s rate of future economic growth depends on the rate at which the workforce will grow. This in turn depends on population growth and labour force participation.
Queensland’s population growth has averaged 2.0% over the past decade, compared with an Australian average of 1.2% per annum, and is projected to average 1.7% over the next decade. Chart 3.2 shows Queensland’s labour force participation rate has also grown strongly over the last decade, reaching record levels and being significantly higher than the rest of Australia. This growth in participation has been accompanied by sustained growth in employment and the achievement of the lowest unemployment rate in 33 years.
| | | | | | |
| | Budget Strategy and Outlook 2007-08 | | 31 |
Chart 3.2
Labour force participation rate1 and employment rate2
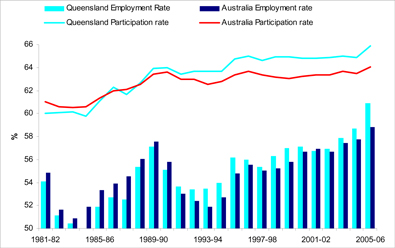
Notes:
| | 1. | Labour force as a percentage of civilian population aged 15 and over. |
| | 2. | Employment as a percentage of civilian population aged 15 and over. |
Source: ABS 6202.0, Queensland Treasury, Australian Treasury.
Over the longer term, demographic forces including an ageing population structure and decreased fertility rates, are likely to increase pressure to achieve higher participation rates. Without policy intervention and continued increases in productivity, lower rates of labour force growth would put downward pressure on economic growth and make the State’s fiscal policies harder to maintain.
The key influences on people’s decisions whether to participate in the labour market include: age, tax and social security arrangements, family situation, child care, educational status and retirement arrangements. These factors lie mainly within the Australian Government’s responsibilities. However, one of the areas – education and training – is a key State responsibility. Organisation for Economic Co-operation and Development (OECD) research indicates that the workforce participation rate is strongly and positively linked to educational achievement. The State’s education and training policies are discussed later in this chapter and in Chapter 4.
| | | | | | |
| 32 | | Budget Strategy and Outlook 2007-08 | | |
FRAMEWORK FOR ECONOMIC AND PRODUCTIVITY GROWTH
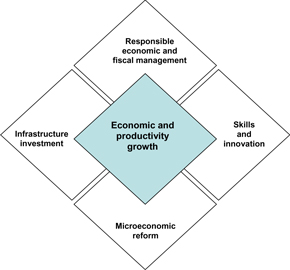
To maintain and increase the State’s economic and productivity growth the Government focuses on four policy settings, namely:
| • | | responsible economic and fiscal management – to provide a stable economic and fiscal environment to support growth |
| • | | microeconomic reform – to improve the efficiency and competitiveness of Queensland’s economy and industries |
| • | | infrastructure investment – to service Queensland’s continued population and industry growth |
| • | | skills and innovation – to drive increases in labour and capital productivity. |
Figure 3.1
Framework for economic and productivity growth
| | | | | | |
| | Budget Strategy and Outlook 2007-08 | | 33 |
RESPONSIBLE ECONOMIC AND FISCAL MANAGEMENT
The Charter of Social and Fiscal Responsibility sets out the Government’s commitment to building and maintaining a strong diversified economy, and to deliver high quality services to improve the quality of life for Queenslanders. Key strategies include:
| • | | expanding market access, export and trade opportunities |
| • | | creating additional job opportunities |
| • | | maintaining a competitive tax environment for business development and jobs growth |
| • | | diversifying and strengthening the economy through value adding, productivity growth and the development of future growth industries. |
More detail about the Government’s fiscal objectives and performance is in Chapter 1. The State’s economic performance is detailed in Chapter 2.
Taxation reform
The Government has a commitment to the ongoing reform of the State tax system in order to minimise the burden on Queensland taxpayers while still raising sufficient revenue for the funding of high quality State services and infrastructure. Further details on tax policy are provided in Chapter 5.
Payroll tax harmonisation
The Queensland Government recognises the importance to business of increased harmonisation across jurisdictions and has been working with other states and territories to increase consistency in their application of payroll tax.
The Queensland Government will further increase consistency across jurisdictions by aligning in a number of areas Queensland’s payroll tax system with those of other states, including the harmonised system announced by the Victorian and New South Wales governments in January 2007.
Land tax reform
The Government recognises that a vibrant property market can result in sharply rising land valuations and short-term financial pressure on land owners through large increases in land tax liabilities.
Building on land tax reforms announced in recent Budgets, the Government is providing further assistance through a package that:
| • | | caps the increase in annual average land values at 50% each year for three years for the purposes of calculating land tax liabilities, commencing 1 July 2007 |
| | | | | | |
| 34 | | Budget Strategy and Outlook 2007-08 | | |
| • | | increases the tax-free threshold for resident individual land tax payers from $500,000 to $600,000 from 2007-08 |
| • | | increases the tax-free threshold for company, trustee and absentee land tax payers from $300,000 to $350,000 from 2007-08. |
Stamp duty abolitions
The Government is committed to a schedule of stamp duty abolitions that balances a range of community priorities, including the maintenance of the State’s tax competitiveness while funding the delivery of essential community services and the provision of critical new infrastructure.
The schedule includes the abolition of nine stamp duties. To date, seven have been abolished, yielding savings to taxpayers of $345 million in 2006-07.
The remaining two stamp duties will be abolished by 2011.
| • | | Mortgage duty will be halved from 1 January 2008 and fully abolished from 1 January 2009. |
| • | | Duty on the transfer of core business assets will be halved from 1 January 2010 and fully abolished from 1 January 2011. |
MICROECONOMIC REFORM
The Government is implementing a program of microeconomic reform to improve the efficiency and competitiveness of the Queensland economy and industry.
Full Retail Competition
The Government is introducing Full Retail Competition (FRC) into the Queensland electricity market from 1 July 2007. This means households and small businesses will be able to choose from which retailer they purchase their electricity.
FRC will encourage the energy sector in Queensland to become more competitive and be more responsive to customer needs.
No customer will be made worse off as a result of the introduction of FRC because they will have the choice of remaining on State-wide regulated tariffs.
The FRC reform will also be a catalyst for long-term investment in electricity generation in Queensland. Major integrated energy companies with retail customers will have an incentive to invest in generation.
| | | | | | |
| | Budget Strategy and Outlook 2007-08 | | 35 |
From 1 July 2007 FRC will also be introduced for gas. Introducing this reform to coincide with electricity FRC will enable retailers to enter the market in Queensland to offer customers the opportunity to supply both gas and electricity. This will have the effect of expanding the gas market in Queensland, which by interstate standards is comparatively small.
It also provides the basis for greater competition in gas wholesale supplies and further impetus for pipeline development in this State.
More gas supplies and increased pipeline developments will mean better outcomes for customers both in respect of price and choice and, when coupled with electricity deregulation, will allow Queensland to meet growing energy demand.
Reform of economic regulation framework
Queensland is finalising a review of the regulation framework which will improve the system of economic regulation in the State.
The Queensland Competition Authority Act 1997 provides the legislative framework for the State’s third-party access regime. It establishes a legal right for competing firms to share certain significant infrastructure services, such as rail and ports in Queensland, through the independent pricing and access advice provided by the Queensland Competition Authority (QCA). The proposed changes to the framework will enhance the ability of the QCA to provide quality targeted advice to parties operating under the regulatory regime in Queensland. The reforms will also forge a consistent national approach to the regulation of these infrastructure services and increase certainty for parties operating in the regulatory regime in Queensland. This will encourage investment in infrastructure in Queensland, enhance competition and benefit Queensland consumers.
A number of the proposed changes will comply with the requirements of the new Competition and Infrastructure Reform Agreement (Agreement) signed by the Council of Australian Governments (COAG) in February 2006. These changes include the introduction of nationally consistent objects clauses and pricing principles, in addition to binding six month time limits on decisions by regulators.
Asset sales and the Queensland Future Growth Fund
The energy retail asset sales will contribute to the future economic prosperity of Queensland by encouraging greater competition in the new fully contestable energy retail market, which is scheduled to commence from 1 July 2007.
Robust competition will help ensure customers get the best possible deals from the energy retailers. Queensland is a booming economy, with strong growth in energy demand driven by the economy.
| | | | | | |
| 36 | | Budget Strategy and Outlook 2007-08 | | |
It was considered that, given the expected level of intensity in competition with full retail contestability, it was no longer appropriate for public resources to be allocated through ENERGEX and Ergon Energy to a service function which will be able to be fully met in an economic and efficient way by the private sector.
This decision has enabled ENERGEX and Ergon Energy to more fully devote their resources to the large network upgrade programs they are required to deliver. In 2007-08, for example, the combined capital program of the two energy distributors will be a record $1.738 billion.
Ergon Energy also will retain responsibility for managing those customers who choose to remain on the energy franchise, and not enter the contestable market. It is expected that about 600,000 customers in rural and regional locations will choose to remain on the franchise and remain with Ergon Energy.
The Queensland Future Growth Fund is financed from the proceeds of energy asset sales – ENERGEX’s electricity and gas retail business, the Allgas distribution network and the competitive parts of Ergon Energy’s electricity retail business including Ergon Energy’s subsidiary, Powerdirect. The sale processes were very competitive and delivered positive outcomes for the State. The prices received for the businesses compare favourably with previous retail asset sales in Australia and reflect the growth opportunities available in South East Queensland.
The proceeds have been transferred into the Queensland Future Growth Fund and are being used across a range of infrastructure projects. Details of these initiatives are outlined in Chapter 4.
Climate change – ClimateSmart 2050
Climate change represents a major global challenge that requires short, medium and long-term policies that provide for a transition to a low carbon emissions future. Building on a range of actions already taken to address climate change, including the banning of broadscale clearing of vegetation, a commitment to participate in a National Emissions Trading Scheme and investment in clean coal technology (including $300 million from the Queensland Future Growth Fund), ClimateSmart 2050 is Queensland’s climate change strategy.
ClimateSmart 2050 involves policy and program initiatives that will facilitate the transition to a low carbon future including:
| • | | increasing the 13% target for electricity from gas-fired generation to 18% by 2020 |
| • | | setting a renewable and low emissions energy target of 10% by 2020 |
| • | | $100 million from the Queensland Future Growth Fund for a program of initiatives involving renewable energy research and development and programs to achieve industry and household energy savings. |
| | | | | | |
| | Budget Strategy and Outlook 2007-08 | | 37 |
A new $300 million Queensland Climate Change Fund has also been established to support future investments in climate change initiatives.
Ports review
The Queensland Government is undertaking a review of port operations and commercial business practices at the significant ports in Queensland. The review aims to ensure that these ports:
| • | | are managed efficiently and, where appropriate, allow for competition in the provision of port and related infrastructure |
| • | | maximise the opportunity for competition in upstream and downstream markets, and do not misuse market power |
| • | | are only subject to economic regulation where there is a clear need. |
The review is expected to be completed by the end of 2007.
Reform of the legal profession
This year, the Government enacted the final tranche of legislation to implement a national model for reform of the legal profession. The national model is aimed at improving the efficiency of the legal profession and further developing the national market in legal services.
The reforms have simplified and streamlined legislation governing the legal profession, promoted competitive practices by eliminating unnecessary regulation and reducing cross-border compliance costs, and enhanced overall accountability of the legal profession and professional bodies in regulating their members.
Tort law reform and Compulsory Third Party motor vehicle insurance
The Government’s implementation of tort law reform has made the insurance environment more sustainable, with benefits progressively flowing to the consumer in all facets of liability insurance.
One consequence has been greater competition in the market for compulsory third party motor vehicle insurance (CTP). Actuarial advice indicates strong evidence of a continued reduction in claim frequency across all claims in the CTP scheme. For example, motorists are now saving up to 12.7% or $37.40 on their previous 12 monthly Class 1 (sedans and station wagons) renewal. This recent reduction in premiums is on the back of reductions over the preceding year in the order of 9%.
| | | | | | |
| 38 | | Budget Strategy and Outlook 2007-08 | | |
WorkCover premiums
Queensland has maintained the lowest average workers’ compensation rate of any state in Australia for the last seven years. In 2005-06, significant increases in wages growth combined with stronger than expected investment returns enabled WorkCover Queensland to maintain a fully funded position while allowing for an appropriate balance between workers’ benefits and employer premiums.
An independent review of Queensland’s workers’ compensation system was undertaken in February 2007. Following the Report of the Review, the Government announced a further reduction in premiums from $1.20 per $100 in wages to $1.15 per $100 in wages for the next three years. This reduction in premium will take effect from 1 July 2007 and will result in the average premium rate having fallen by over 19% since 1 July 2005.
Regulatory efficiency
The Queensland Government’s Review of Hot Spots for Regulatory Reform and Review of Legislative/Regulatory Reform Initiatives in the Queensland Government were completed in 2006.
The Review of Hot Spots for Regulatory Reform, conducted in parallel with three industry specific reviews of the impact of regulation on the manufacturing (including food production and processing), retail and tourism industries, identified regulatory issues adversely affecting business in Queensland. The Review provided business and the community with an opportunity to provide input into Queensland’s regulatory reform agenda.
The Review of Legislative/Regulatory Reform Initiatives in the Queensland Government – Phase 1 was undertaken by the Service Delivery and Performance Commission to examine and identify improvements in regulatory reform initiatives in Queensland.
In addition to State-based regulatory reforms, Queensland is committed to the COAG led regulatory reforms, as part of the COAG National Reform Agenda announced in February 2006. Building on these commitments, COAG recently agreed to the following actions to address various regulatory ‘hotspots’, including:
| • | | implementing national rail safety legislation and a nationally consistent rail safety regulatory framework |
| • | | developing a timetable to achieve national occupational health and safety (OHS) standards and harmonise elements in primary OHS legislation |
| • | | developing a proposal for more consistent and efficient system of environmental assessment and approval |
| | | | | | |
| | Budget Strategy and Outlook 2007-08 | | 39 |
| • | | ensuring best practice regulation making and review processes apply to the Building Code of Australia (BCA) and removing unnecessary State-based variations to the BCA |
| • | | developing a process to deliver a single online registration system for Australian Business Numbers and business names, including trademark searching. |
COAG human capital reforms
As well as Queensland-specific skills measures, Queensland is participating in a set of human capital reforms being implemented through COAG. At its April 2007 meeting COAG announced a specific series of reforms designed to cover Type 2 diabetes, vocational education and training, literacy and numeracy, and early childhood and child care. These reforms aim to improve labour force participation and skills.
COAG will implement a $200 million cost-shared package to counteract the spread of diabetes, with the development by mid 2008 of nationally agreed risk assessment tools, program standards and accreditation arrangements for prevention programs and providers.
A $40 million cost-shared package over four years will be provided to assist Indigenous adults in regional and remote communities access further education and training opportunities, in support of the Work Skills Vouchers program.
To improve literacy and numeracy, states and the Australian Government will develop:
| • | | a core set of nationally consistent teacher standards for literacy and numeracy by the end of 2007 |
| • | | accredited university teacher education courses, and register or accredit teachers to meet these standards by 2009 |
| • | | diagnostic assessments for children upon entry to primary school by 2010 |
| • | | a core set of nationally agreed skills, knowledge and attributes for school principals by the end of 2007. |
Additionally, states will work with the Australian Government to develop an intergovernmental agreement by 2008 on a national approach to quality assurance and regulations for early childhood education and care. The agreement aims to improve standards in early childhood services, remove overlaps and duplication between state and Australian Government regulations and reduce red tape for service providers.
| | | | | | |
| 40 | | Budget Strategy and Outlook 2007-08 | | |
Service Delivery and Performance Commission (SDPC) reviews
The SDPC is undertaking a program of reviews to improve public service performance, service delivery and accountability. The Commission has recently completed or is currently reviewing:
| • | | purchasing and logistics in the Queensland Government |
| • | | shared service initiative |
| • | | whole-of-Government performance management reforms |
| • | | performance management review - Department of Communities, Disability Services Queensland and Aboriginal and Torres Strait Islander Policy |
| • | | performance management review - Department of Local Government, Planning, Sport and Recreation |
| • | | performance management review - Department of Tourism, Fair Trading, Wine and Industry Development. |
Most of these reviews will be completed by mid 2007, with the Government then developing an appropriate response.
Local Government reforms
The Government has recently commenced a local government reform initiative that seeks to establish a modern, contemporary system of local government in Queensland. The key drivers for reform include the financial sustainability of councils, the ability of councils to deliver and fund efficient infrastructure and services and the need for a regional approach to planning and service delivery.
A Local Government Reform Commission has been established to determine boundaries and electoral arrangements for new councils and is to provide its recommendations in August 2007. It is envisaged that Local Transitional Committees will be formed for those councils that are amalgamated, leading to the next local government elections in 2008.
INFRASTRUCTURE INVESTMENT
The Government is committed to increasing Queensland’s infrastructure base. This is reflected in the scale of its capital program. For the General Government sector, purchases of non-financial assets are estimated to be $5.463 billion in 2007-08.
| | | | | | |
| | Budget Strategy and Outlook 2007-08 | | 41 |
Chart 3.3
General Government purchases of non-financial assets $ per capita
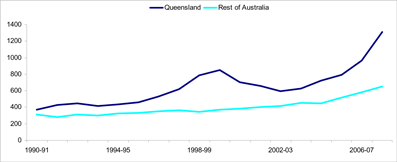
Sources: Unpublished ABS 5512.0 and 3101.0; various State Budget papers and State Budget Mid Year Reviews/ Budget Updates; population estimates from Australian Government Budget Paper No.3, 2007-08.
Charts 3.3 and 3.4 show Queensland’s per capita capital investment has been higher than the rest of Australia for many years and will continue to be the largest of any State in 2007-08 – this is related to continued strong population growth and to support of industry expansion in the State.
Chart 3.4
General Government purchases of non-financial assets $ per capita – 2007-08
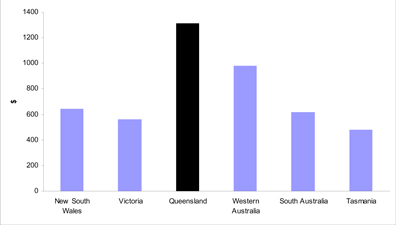
Sources: QLD, VIC, WA State Budgets, NSW, SA, TAS Mid Year Reviews/Budget Updates.
| | | | | | |
| 42 | | Budget Strategy and Outlook 2007-08 | | |
Water
Water is a key focus of the capital program.
Water infrastructure development
The Queensland Government is making significant investments in water infrastructure throughout the State, particularly in South East Queensland (SEQ), to help alleviate the impacts of the current drought and ensure security of supply for current and future domestic, commercial, industrial and rural users.
The Government’s approach to water infrastructure development is to undertake a considered needs-based assessment of new infrastructure proposals to ensure that the infrastructure is economically and environmentally sustainable. This is consistent with the Government’s Guidelines for Financial and Economic Evaluation of New Water Infrastructure in Queensland and is a key element in the preparation of the Regional Water Supply Strategies.
State and local governments’ planned major investments in new water infrastructure in SEQ, including long-term projects beyond the forward estimates period, are estimated at $9 billion. Specific projects include:
| • | | a desalination plant being built at Tugun on the Gold Coast, which will supply desalinated water into the SEQ water grid |
| • | | a two-way flow pipeline to transfer water between the Gold Coast and Brisbane (including water from the desalination plant) via the Southern Regional Water Pipeline |
| • | | undertaking the Western Corridor Recycled Water project to recycle treated waste water from sewerage treatment plants together with associated pipelines to deliver this water to power stations and SEQ urban water storages (partially funded by the Commonwealth) |
| • | | northern and eastern inter-connector pipelines to supply water into the SEQ water grid from north of Brisbane and North Stradbroke Island |
| • | | the Traveston Crossing and Wyaralong Dams and associated works (including the Cedar Grove Weir and Bromelton Off Stream Storage). Initial works and environmental impact studies are being undertaken in relation to these longer term projects. |
In addition to the projects in SEQ, investigations are continuing into a range of projects, such as the Nathan, Connors River and Nullinga Dams in regional Queensland, which were previously announced as part of the State Water Policy. This policy outlined a range of possible infrastructure projects for investigation to meet the expected increased demand associated with continued urban, industrial and rural development.
| | | | | | |
| | Budget Strategy and Outlook 2007-08 | | 43 |
Institutional reform
The Government has also committed to reforming the institutional arrangements in relation to the planning, control and management of water in SEQ. This is being undertaken primarily through the Queensland Water Commission (QWC).
The QWC is also tasked with controlling and overseeing the water restriction regime in SEQ to ensure that a regional approach is taken to the use of this scarce resource.
The QWC’s role in the management of water in SEQ includes:
| • | | planning for the best use of current infrastructure and appropriate augmentation options |
| • | | identifying the current and future demand for water and the current and potential supply sources to meet that demand |
| • | | providing advice in relation to the institutional arrangements review and the cost recovery and pricing framework for SEQ. |
In February 2007, the QWC prepared two draft reports to the Government on institutional and pricing arrangements for water supply in SEQ, which were released for a period of public consultation.
Subsequently, the scope of the Commission’s reference for the report was widened to include an examination of existing asset ownership arrangements.
In May 2007, the QWC provided the Government with its Final Report on Urban Water Supply Arrangements in SEQ. This report contained recommendations for substantial reform of the institutional arrangements governing the provision of water in SEQ, aimed at providing long-term benefits to the Queensland community in relation to water security and customer services.
The QWC’s recommendations include the State taking control over the region’s bulk water supply assets and the local governments focussing on reform and rationalisation of their retail and distribution businesses.
The State Government has committed to establishing a Water Grid for SEQ, together with appropriate planning, operating and cost recovery regimes, for both new and existing infrastructure.
The Government has also committed to providing the Councils with fair compensation for any council-owned water assets transferred to the State in implementing the reforms.
The amount, form and timing of any compensation will be determined following a due diligence process, which will examine issues such as valuation methodology, condition of the assets, current financials associated with those assets and timelines for payments.
| | | | | | |
| 44 | | Budget Strategy and Outlook 2007-08 | | |
The State Government will also create a new statutory authority as the SEQ Water Grid Manager, which will be responsible for the equitable distribution of water across the region.
The 2007-08 Budget does not contain any funding commitment in relation to the transaction costs of implementing the proposed reforms or compensating councils for the transfer of assets, due to a range of factors, including:
| • | | consultation on the QWC Final Report and Government consideration of the specific recommendations is yet to be finalised |
| • | | a thorough due diligence process will need to be completed to determine estimated costs and potential compensation payments |
| • | | the planned transfer date is 1 July 2008. |
SKILLS AND INNOVATION
Skills and innovation are central influences on economic and productivity growth. Skill improvements directly lead to increases in labour productivity. Innovation drives productivity growth across the board.
The Government is implementing three key policy plans to build Queensland’s skills base. These are the Queensland Skills Plan, Skilling Queenslanders for Work and Education and Training Reforms for the Future.
Queensland Skills Plan
The Government has allocated around $118 million in 2007-08 to continue implementing the Queensland Skills Plan. Launched in March 2006, this plan identifies actions that will transform and modernise the vocational education and training system.
The Government will continue to work with the community, industry, business and all levels of government to progress implementation of the plan, which includes:
| • | | initiatives to increase the number and capacity of quality training providers and a new State-wide SkillsTech Australia (formally the Trade and Technician Skills Institute) |
| • | | a major capital works program to upgrade and enhance Technical and Further Education (TAFE) institutes (part of a total capital commitment exceeding $300 million over six years) |
| • | | three additional Centres of Excellence to promote skills development, and new Skills Formation Strategies to ensure a collaborative approach to meeting the skills needs of industry |
| • | | improvements to Queensland’s apprenticeship system and an additional 17,000 trades training places available in each year by 2010 |
| | | | | | |
| | Budget Strategy and Outlook 2007-08 | | 45 |
| • | | an increase in the number of Certificate IV and above training places, with 14,000 additional places available each year by 2010. |
Skilling Queenslanders for Work has replaced the Government’s former Breaking the Unemployment Cycle program. Skilling Queenslanders for Work especially focuses on helping young people, disadvantaged people, people with disabilities and people living in regional areas to develop their skills and so become more employable. It includes a range of project-based assistance and other financial support for skills development.
Education and Training Reforms for the Future (ETRF) is a Government reform package for education and training. ETRF has been implemented progressively since 2003. During 2007-08, the Government will fully implement the ETRF initiatives, including:
| • | | providing an estimated $50 million to ensure that all Queensland children who have reached the age of five years by 30 June 2008 have the opportunity to access the full-time Preparatory Year in that year |
| • | | implementing the ‘learning and earning’ reforms, with students who commence Year 12 in 2008 being eligible for the new Queensland Certificate of Education. |
Innovation
Innovation generates greater output from a given level of resources, and is a primary source of productivity growth and improvements in living standards.
The Government facilitates and encourages innovation by supporting research and development, offering incentives for potential innovators, by providing infrastructure and skill development to enhance the capacity of the innovation system and by generating a general culture of innovation in the community.
From the Queensland Future Growth Fund, $100 million will be directed towards Smart State projects, specifically the Innovation Building Fund. This will provide an opportunity to capitalise on previous investment in research and development infrastructure and further develop the State’s capacity in this area.
The Queensland Government has invested more then $1.4 billion in research, science and innovation related infrastructure and facilities since 1998. Some recent investments in world leading infrastructure and facilities include:
| • | | The University of Queensland’s Institute for Molecular Bioscience |
| • | | Queensland University of Technology’s Institute for Health and Biomedical Innovation |
| • | | James Cook University’s Tropical Science and Innovation Precinct |
| • | | the Queensland Brain Institute at The University of Queensland |
| • | | Griffith University’s Eskitis Institute for Cellular and Molecular Therapies |
| | | | | | |
| 46 | | Budget Strategy and Outlook 2007-08 | | |
| • | | The University of Queensland’s Institute for Cancer, Immunology and Metabolic Medicine based at Princess Alexandra Hospital |
| • | | The University of Queensland’s Australian Institute for Bioengineering and Nanotechnology |
| • | | Griffith University’s Institute for Glycomics |
| • | | the Centre of Excellence in Engineered Fibre Composites at the University of Southern Queensland |
| • | | the Millennium Arts Project at the Queensland Cultural Centre, South Bank |
| • | | Queensland University of Technology’s Creative Sciences Precinct |
| • | | the Centre for Low Emissions Technology Centre. |
Smart State Strategy 2005-2015
The Smart State Strategy has been an integral part of the Queensland Government’s focus on economic development. Smart Queensland: Smart State Strategy 2005-2015 is the second stage of the Smart State Strategy, which began in 1998.
Key initiatives of Smart Queensland include:
| • | | $200 million over four years for three new funds to build research centres and support innovation across a broad range of fields, including health and medicine, the environment, agriculture and mining |
| • | | $100 million to establish the Smart Therapies Research Centre at the Princess Alexandra Hospital, investigating improved treatments and cures for cervical cancer, breast cancer, melanoma, liver and kidney disease, HIV, malaria, obesity, arthritis, diabetes, bone and pregnancy-related metabolic disorders. The Australian Government has announced an additional $100 million contribution towards the establishment of the Centre, which will involve a number of partners including The University of Queensland, Queensland University of Technology and CSIRO |
| • | | $46 million over four years to establish two new state schools of excellence for senior school students in creative arts and science, maths and technology. In 2008, a third academy promoting health and allied health professionals will be established on the Gold Coast, in partnership with the newly established medical, dental and allied health facility at Griffith University Gold Coast |
| • | | $56 million over four years in new school technology, including opportunities for students, their parents and teachers to more readily access school material. |
| | | | | | |
| | Budget Strategy and Outlook 2007-08 | | 47 |
Innovation Performance
The innovation performance of Queensland businesses has grown stronger in recent years. In 2002 and 2003, the share of Queensland businesses innovating was 27.2% (below the Australian average of 29.6%). However, in 2004 and 2005 the Queensland share of businesses innovating had increased to 33.6% (slightly above the Australian average of 33.5%).
To illustrate Queensland’s improved performance, Chart 3.5 shows in more detail changes in the innovation performance of Queensland and Australian businesses. There has been strong growth in all of the measures since 2002 and 2003.
Chart 3.5
Change in innovative practices
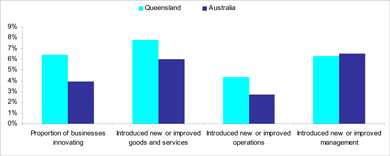
Note: The survey compared results for the calendar years 2004 and 2005 with 2002 and 2003. Source: ABS Catalogue 8158.0
The State’s economic and fiscal management framework has provided a stable and supportive environment for this improvement in innovation performance. A further key influence has been the Smart State Strategy’s work to establish a culture of innovation in Queensland. Since the Smart State Strategy’s inception, Queensland has exceeded the national performance in facilitating the application of new knowledge to private business.
| | | | | | |
| 48 | | Budget Strategy and Outlook 2007-08 | | |
| 4. | BUDGET PRIORITIES AND INITIATIVES |
FEATURES
| • | | The key areas for service enhancements in the 2007-08 Budget include health, disability services, housing, child safety, education and training, police and water, road and transport infrastructure. |
| • | | Queensland Health’s Budget in 2007-08 is estimated at $7.151 billion, a 12% increase on the 2006-07 comparable Budget. |
| • | | The 2007-08 Budget provides an additional $237.4 million in recurrent funding and $136.7 million in capital funding over four years to enhance the delivery of disability services in Queensland. |
| • | | A housing assistance package of $719.3 million is provided in the 2007-08 Budget, underpinning a range of social housing solutions. |
| • | | In the 2007-08 Budget , the Department of Child Safety has been provided with $58.7 million in recurrent and $36.4 million in capital funding over four years to fund the expansion of existing programs and implement a new initiative aimed at providing Queensland’s most vulnerable children, babies and toddlers, with their one chance at childhood. |
| • | | An education and training capital works program of $562.8 million is budgeted in 2007-08 to provide high quality Queensland state school and TAFE learning environments. |
| • | | Funding of $57.4 million over four years is allocated for the construction of a Joint Contact Centre at Zillmere to accommodate officers from the Queensland Police Service and Smart Service Queensland. |
| • | | The Budget also provides significant funding for the development of new water infrastructure and a range of water saving initiatives. Funding of $100.8 million has been provided in 2007-08 for WaterWise Rebate Schemes. |
| • | | An additional $70 million over four years is provided for public transport services to address overcrowding and to improve levels of service in key growth corridors. |
INTRODUCTION
This chapter details:
| • | | the Government’s identified outcomes and priorities which underpin the 2007-08 Budget |
| • | | service delivery initiatives and developments for each of the Government’s key priorities. |
| | | | | | |
| | Budget Strategy and Outlook 2007-08 | | 49 |
As part of its commitment to ensuring a better quality of life for all Queenslanders, the Government has identified eight outcomes that it is working to achieve for the people of Queensland. These outcomes are outlined in the Charter of Social and Fiscal Responsibility and include economic development, community wellbeing and environmental sustainability. All government services contribute to one or more of these outcomes for the community.
To support the achievement of these outcomes, the Government has a clear policy agenda, currently targeting seven priority areas in which the Government will concentrate efforts to improve performance and respond to changing community needs and expectations.
These priorities are:
| • | | improving health care and strengthening services to the community |
| • | | growing a diverse economy and creating jobs |
| • | | realising the Smart State through education, skills and innovation |
| • | | managing urban growth and building Queensland’s regions |
| • | | protecting our children and enhancing community safety |
| • | | protecting the environment for a sustainable future |
| • | | delivering responsive government. |
The 2007-08 Budget provides for a range of specific initiatives and service developments that will assist in achieving these key policy priorities. The major revenue initiatives to achieve the Government’s priorities in the 2007-08 Budget relate to State taxation, including payroll tax, land tax and vehicle registration duty. A full discussion of the revenue initiatives and issues is provided in Chapter 5.
Spending to achieve these priorities falls into two categories, recurrent and capital. Recurrent expenses are the costs incurred in providing services and running and maintaining assets and are addressed in detail in Chapter 6. Capital expenditure relates almost exclusively to the purchase and construction of assets that are used to support service delivery, such as hospitals, schools, courthouses, police stations, fire and ambulance stations and roads. Capital expenditure is discussed in Budget Paper No. 3 – Capital Statement.
Details of some of the service delivery initiatives in the 2007-08 Budget that support the achievement of the Government’s priorities are described below. While highlights of the Budget are described in terms of their primary impact on the community, many assist the Government in pursuing more than one key priority.
More detailed information on service delivery initiatives can be found in individual Ministerial Portfolio Statements.
| | | | | | |
| 50 | | Budget Strategy and Outlook 2007-08 | | |
IMPROVING HEALTH CARE AND STRENGTHENING SERVICES TO THE COMMUNITY
Improving hospital and health services as well as other services to the community is a continuing priority for the Government. Major service developments and initiatives relating to this priority are detailed below.
Health initiatives
Clinical education and training, prevocational and vocational training
Recurrent funding of $145 million over four years ($25 million in 2007-08) is provided for clinical education and training, and prevocational and vocational training initiatives for medical, nursing and allied health staff. This funding will be used to further enhance the clinical education and training provided to our current and future health workforce.
e-Health
The Budget provides $140.9 million in recurrent funding and a total of $149.4 million in equity funding (including an additional $102.2 million) over four years for e-Health. Funding will go towards implementing a multi-use electronic record for patients and client areas to provide a patient-centric focus to health care delivery across a networked model of care.
Patient transport reforms
Recurrent funding of $101.8 million over four years ($25.4 million in 2007-08) is provided for patient transport reforms, including additional funding for services provided by the Queensland Ambulance Service, and further funding support for the Royal Flying Doctor Service and the Careflight Medical Service.
Mental health services
The total investment in mental health will increase by $895 million in just over five years to 2010-11. The Budget provides an additional $52.8 million in recurrent funding over four years ($12.3 million in 2007-08) to enable the full implementation of the recommendations of the Review of the Mental Health Act 2000 (Butler Review). This funding will assist the Government in enhancing the provision of support, information and assistance to victims of crime in matters where an offender has a mental illness. Additional details about this reform and mental health services are outlined in Box 4.1.
| | | | | | |
| | Budget Strategy and Outlook 2007-08 | | 51 |
Health infrastructure investment
Additional funding of $157.1 million over four years in recurrent funding ($18.6 million in 2007-08) and $122.6 million over four years in capital funding ($64.6 million in 2007-08) is provided for a number of critical health infrastructure projects, including Health Precincts at North Lakes and Browns Plains, and the Thursday Island Chronic Disease Prevention and Management Centre.
Capital funding of $87.6 million over four years ($27.6 million in 2007-08) has been provided to assist Queensland Health in responding to health infrastructure needs across Queensland, including renal services.
Proceeds from the long-term arrangement entered into between the Golden Casket Lottery Corporation and Tattersall’s are being used for the construction of the new Children’s Hospital. More details are provided in Box 4.2.
Other health services
The Government is allocating:
| • | | a funding package of an additional $95 million in recurrent funding over four years ($20 million in 2007-08) to address a number of critical health priorities including the implementation of a State-wide Trauma Plan, initiatives to prevent youth substance misuse including ‘Ice’, and improved blood safety and quality |
| • | | additional recurrent funding of $80 million over four years ($20 million in 2007-08) for enhancements to outpatient service delivery across Queensland. |
Services for people with disabilities
The 2007-08 Budget provides an additional $237.4 million in recurrent funding and $136.7 million in capital funding over four years to enhance disability services in Queensland. This includes $33.4 million in recurrent funding and $29.0 million in capital funding in 2007-08, building on the $128 million over four years provided for disability services in the 2006-07 Budget. Key elements of this funding are outlined below.
Contemporary service delivery approach
Funding of $23.5 million recurrent over four years is provided to implement system reform in response to public consultation on the document Have your say: On improving disability services in Queensland. Disability Services Queensland will develop a conceptual framework to provide a rigorous system of assessing, prioritising, planning, matching, monitoring and reviewing service support needs. The new system approach will result in the provision of fairer and more transparent access to specialist disability services funded by the Government.
| | | | | | |
| 52 | | Budget Strategy and Outlook 2007-08 | | |
As part of these directions, the Budget provides new recurrent funding across Government of $88.9 million over four years and capital funding of $24.4 million over four years to provide a targeted service response based on advice by Honourable WJ Carter QC around challenging behaviour and disability. Disability Services Queensland will develop a service response that will include:
| • | | establishing a centre for best practice in positive behaviour support |
| • | | positive behaviour support services |
| • | | developing a positive behaviour support system |
| • | | purpose built accommodation and support models |
| • | | enhanced support staff training and development |
| • | | legislative changes and support. |
The Budget also provides new recurrent funding of $22.4 million over four years and capital funding of $40 million over four years to support clients with a psychiatric disability/severe mental illness and moderate to high support needs to relocate from mental health facilities to community settings. The capital funding associated with this program is provided to the Department of Housing to provide community-based accommodation.
Expansion of existing programs and initiatives
The Budget provides new funding for additional support packages within existing programs and initiatives as follows:
| • | | $20 million over four years to establish new and/or enhanced accommodation and day programs to be provided by Disability Services Queensland or non-government organisations, for people with a disability or for families living with a family member with a disability |
| • | | $8 million over four years for the Post Schools Services – Adult Lifestyle Support Program, which assists young people with high and complex disability support needs who do not have work or further education options when leaving school |
| • | | $10 million over four years to enable people with an acquired spinal cord injury to continue their care and support upon discharge from the Spinal Injuries Unit in Brisbane and to resume their lives upon their return to the community |
| • | | $8 million over four years to enable young people with a disability to continue to receive support when they exit the care of the State on turning 18 years of age |
| • | | $20 million over four years to provide increased support to meet the needs of accommodation support and respite service clients with challenging and/or complex behaviour and increasing health and mobility needs of ageing clients. |
| | | | | | |
| | Budget Strategy and Outlook 2007-08 | | 53 |
Home and Community Care program
In 2007-08, the Home and Community Care program is estimated to be $348.5 million, an increase of $35.6 million or over 11%. The Home and Community Care program is a joint Commonwealth and State funded program that provides basic support and maintenance services to assist older, frail and younger people with a disability to remain in their own homes.
|
Box 4.1 Mental health services |
| |
The Budget provides for additional funding of $90.7 million ($528.8 million over four years) to improve hospital and community based mental health services in Queensland. This amount includes $41.9 million in capital funding in 2007-08 ($198.3 million over four years) and is additional to the $366.2 million allocated in just over five years which commenced in 2006-07. With this allocation the total commitment of new funding to mental health, including funding from the Health Action Plan, is $895 million to 2010-11. The funding will further support the implementation of the Council of Australian Governments National Action Plan on Mental Health 2006-2011. The new funding commitment of $528.8 million has been allocated to a range of Government agencies to enhance inpatient and community mental health services. In 2007-08, $2.6 million (totalling $23.8 million over four years) will be allocated to increase the capacity of the non-government sector to provide support for mental health consumers in the community through Disability Services Queensland. Queensland Health will invest $45.5 million, including capital funding of $18.1 million in 2007-08 to: • recruit and accommodate additional community mental health staff • develop and expand inpatient bed capacity • implement initiatives to develop the mental health workforce and improve service quality and safety in government and non-government sectors • improve mental health promotion, illness prevention and early intervention capacity. The funding will also enable the implementation of the recommendations of the Review of the Mental Health Act 2000, including enhancing victim support systems, forensic mental health legal processes, risk management strategies and community awareness initiatives. |
| | | | | | |
| 54 | | Budget Strategy and Outlook 2007-08 | | |
Initiatives to address housing need
The Department of Housing’s 2007-08 housing assistance package of $719.3 million underpins the provision of a range of social housing solutions. This expenditure includes $60 million over four years for improved housing provision for rural and remote Aboriginal and Torres Strait Islander communities. Funding of $85 million for 2007-08 is also provided from an injection of additional funding of $500 million over five years from the Queensland Future Growth Fund.
Major components of the $719.3 million package will include:
| • | | $27.9 million in capital funding and $3 million in recurrent funding in 2007-08 to continue the Responding to Homelessness initiative to deliver a range of accommodation initiatives. This includes the continued redevelopment of the Lady Bowen Complex to further expand the housing options for people at risk of homelessness in inner-Brisbane as well as further allocations to the Crisis Accommodation and Community-managed Housing—Studio Units |
| • | | $297.8 million for the Public Housing and Aboriginal and Torres Strait Islander Housing rental programs and the Long Term Community Housing Program to purchase or commence construction of 544 dwellings, complete construction of 410 dwellings, upgrade existing dwellings, and purchase and develop land to facilitate future construction of social housing dwellings |
| • | | $42.9 million for Community-managed Housing—Studio Units to purchase or commence 164 units of accommodation, complete construction of 126 units, and purchase and develop land to facilitate future construction |
| • | | $24.8 million for the Crisis Accommodation Program to commence construction of three shelters, complete construction of one shelter and one dwelling, purchase two hostels and nine dwellings, upgrade one shelter, purchase and develop land to facilitate future construction and provide current grants to assist in responding to homelessness |
| • | | $86.3 million for maintenance, upgrades and new construction in the 34 Indigenous communities. This includes providing $7 million for factory-built homes to increase social housing assets on smaller communities. |
| | | | | | |
| | Budget Strategy and Outlook 2007-08 | | 55 |
Other community services
Redress scheme
Building on the Government’s response to the Forde inquiry, a redress scheme of up to $100 million will be implemented for former child residents who experienced abuse and neglect in institutional care. Eligible people will be supported through ex-gratia payments, legal and financial services, and assistance during the application phase.
Increased youth detention centre demand
Following capital funding provided in the 2006-07 Mid Year Fiscal and Economic Review to increase Youth Detention Centre accommodation capacity, increased funding of $18.9 million over four years ($5.2 million in 2007-08) has been provided to meet the demand for accommodation and services for detained young people at Brisbane and Cleveland Youth Detention Centres. The funding will provide increased staffing levels to provide services to detained young people. In addition, $27.9 million in recurrent funding and $35.4 million capital over four years will provide new youth detention infrastructure and improve service capacity at existing youth detention centres.
Youth justice
The Budget provides increased recurrent funding of $22.5 million ($4 million in 2007-08) and capital funding of $1.3 million over four years to expand youth justice services, including increased capacity of the youth justice conferencing program, particularly enhancing Indigenous participation, addressing factors that lead to young people committing offences (including extending a bail support program) and the creation of a Young Offender Community Response Service to reduce the risk of re-offending.
Indigenous justice initiatives
The Supporting Indigenous Justice in Remote Communities project addresses community safety at the local level by building confidence in the justice system and improving access to justice services. Recurrent funding of $10.4 million over four years ($2.8 million in 2007-08) and capital funding of $0.54 million in 2007-08 has been provided to support a range of Indigenous justice initiatives, as part of the Government’s ongoing commitment to reducing Indigenous incarceration. Funding has been provided to establish a State-wide community justice reference group, provide an additional magistrate to conduct more frequent circuit courts in the Gulf, Cape York and Torres Strait as well as an additional Legal Aid Queensland officer to represent defendants in these regions.
| | | | | | |
| 56 | | Budget Strategy and Outlook 2007-08 | | |
Helping Queenslanders access legal services
In 2007-08, additional funding of $12.5 million is allocated to Legal Aid Queensland from the Legal Practitioners Interest on Trust Account Fund to provide improved legal services and representation to those in need.
Torres Strait Major Infrastructure program
Continued funding is provided for the Torres Strait Major Infrastructure program of $14 million per year for four years from 2007-08 for infrastructure and $0.5 million per year for an ongoing maintenance program, subject to matching Australian Government funding. Since 1998, the Queensland and Australian Governments have jointly funded the program which provides essential environmental health infrastructure to significantly improve health outcomes in Indigenous communities.
Protecting vulnerable adults
The Government is committed to providing better services and protection to vulnerable adults with impaired decision making capacity including adults with dementia, intellectual disability, psychiatric disability and acquired brain injury.
To provide advice and support for the decision making processes concerning the health care, residential services and financial matters of persons with impaired capacity through the Guardian and Administration Tribunal, the Office of the Adult Guardian, the Community Visitors Program and the Office of the Public Advocate, $7 million is allocated over four years.
To implement the Government’s response to the Service Response to Challenging Behaviours (the Carter Report), recurrent funding of $4.2 million over four years and capital funding of $0.08 million in 2007-08 has been provided for the Guardianship and Administration Tribunal, the Office of the Adult Guardian and the Community Visitor Program.
Enhanced child care regulation
Over the next four years, the Budget provides increased funding of $8 million ($2 million in 2007-08) for staffing to meet growing demand for child care statutory services across the State. An additional 10.5 officers will be employed to undertake licensing and monitoring functions across the State as well as three officers to provide training to address increasing licence complexity and to assist staff with complex legislative issues.
| | | | | | |
| | Budget Strategy and Outlook 2007-08 | | 57 |
Integrated client management system
The Budget provides an additional $11 million of recurrent funding and capital funding of $9 million in 2007-08 for the continued implementation of case management systems, including child protection modules, for the Department of Child Safety and Department of Communities.
Early Years Strategy
Funds from the Best Start election commitment will purchase selected decommissioned preschool sites to provide community based early childhood education and care services and family support services across the State. Increased recurrent funding of $8.6 million over four years will upgrade and maintain the facilities.
Grants Management System
In 2007-08, additional funding of $3.8 million and capital funding of $3.1 million is provided to improve the Department of Communities’ Grants Management System. This will enhance service delivery through more efficient funding allocations to non-government organisations.
Arts Initiatives
Queensland Government Public Arts Policy (formerly Arts Built-in)
Over the next three years, the Government will invest $12 million ($4 million in 2007-08) in art to enliven public spaces. A centralised fund will allow the commissioning of larger works of art and ensure the quality and artistic merit of works enjoyed by Queenslanders and visitors to the State.
Visual Arts and Crafts Strategy
The Government will invest $4.6 million over four years (with $1.1 million allocated in 2007-08) to deliver Queensland’s contribution to the national Visual Arts and Craft Strategy. Funding will be invested in Indigenous arts infrastructure, supporting individual artists and boosting Queensland’s visual arts and craft industry. The funding extends the State’s commitment to the bilateral agreement with the Australian Government.
Pacific Film and Television Commission investment
The Pacific Film and Television Commission’s highly successful Revolving Film Finance Fund has been increased by 33%. This loan facility will make available a total of $20 million to assist the local film and television industry and to attract more interstate and overseas investment in productions in Queensland.
| | | | | | |
| 58 | | Budget Strategy and Outlook 2007-08 | | |
The Edge—State Library of Queensland auditorium refurbishment
As part of a $7.9 million allocation over two years, $2.3 million will be provided in 2007-08 to transform the existing auditorium into a creative ideas and technology centre for children and young people. The Edge will be shared by the State’s major cultural organisations and offer dynamic, experimental arts opportunities for young Queenslanders. The Edge is a cornerstone in the Government’s Arts and Culture Strategy for Children and Young People.
|
Box 4.2 Golden Casket Lottery Corporation-Tattersall’s arrangement |
| |
On 16 April 2007, the Government announced that it will enter into a long-term arrangement for Tattersall’s, through Golden Casket, to operate lotteries in Queensland under the State’s Lottery Licence, and will transfer the State’s shareholding in Golden Casket to Tattersall’s. The State will receive proceeds of $530 million, giving Tattersall’s the right to operate the lottery business in Queensland (on an exclusive basis until 2016) and the sole rights to the use of the Golden Casket brands and trademarks until 2072. The State will retain ownership of the key Golden Casket brands and trademarks and the Queensland Lottery Licence and, significantly, Tattersall’s will establish the national and international headquarters of its lottery business in Queensland. Tattersall’s has also agreed to donate $10 million over three years towards the Royal Children’s Hospital Foundation, the Mater Foundation and the Starlight Children’s Foundation. The new arrangements will also release to the Government around $140 million in surplus cash currently held by Golden Casket. The total proceeds will substantially fund construction of the State’s new 400-bed Children’s Hospital. The hospital will now be funded from this arrangement rather than from borrowings, freeing up funds for other Government services. The State will continue to receive lottery taxes from Golden Casket and the Government will continue to contribute to community initiatives through the Community Investment Fund. The Government will also continue to regulate the conduct of lottery games through the Queensland Office of Gaming Regulation. |
| | | | | | |
| | Budget Strategy and Outlook 2007-08 | | 59 |
GROWING A DIVERSE ECONOMY AND CREATING JOBS
Building on Queensland’s strong economic base benefits all Queenslanders through job creation and an enhanced quality of life. The Government will continue to stimulate economic development throughout Queensland with initiatives designed to expand export and trade opportunities, develop new and emerging industries and create jobs. Major service developments and initiatives to stimulate economic development throughout Queensland are detailed below.
Chapter 3 provides further details on the Queensland Government’s strategies to achieve this priority.
Industry initiatives
Smart mining
Increased funding of $22.2 million is provided over the next three years ($8.3 million in 2007-08) for the Queensland Exploration Development initiative. This includes geophysical data collection, funding for specialist staff to assist with access arrangements for land subject to native title, grants for the mobilisation of drilling and geophysical equipment and initiatives that assist mineral exploration companies to better define exploration targets. Increased funding of $1.8 million in 2007-08 ($4.4 million over the next two years) is also provided for geological data acquisition, mapping and conversion under the Smart Exploration Program. Both initiatives are intended to stimulate further exploration investment in Queensland.
Queensland Mines Inspectorate review implementation
Additional funding in 2007-08 of $0.83 million is provided to finalise the implementation of recommendations from the Review of the Queensland Mines Inspectorate. These include a range of reforms to mining health and safety services such as qualification requirements and remuneration for mines inspectors and upgraded database integrity.
Queensland Tourism Strategy: A 10-year vision for sustainable tourism
In December 2006, the Government released the Queensland Tourism Strategy, which provides a $48 million package over four years. Consistent with the Strategy, the Government will allocate funding of $12.8 million in 2007-08. The Strategy is a partnership between the Queensland Government and the Queensland tourism industry to capitalise on the growth opportunities of the industry. The Strategy adopts a strategic approach to achieving industry sustainability through preserving existing markets, increasing visitor expenditure and enhancing product and industry development opportunities.
| | | | | | |
| 60 | | Budget Strategy and Outlook 2007-08 | | |
Western Hardwoods Plan
Funding of $31.8 million has been allocated towards implementing the Western Hardwoods Plan over three years and operating the State-wide Forest Process over two years.
Development of Clean Coal Technology
The Queensland Government has committed equity funding of $300 million to support advanced clean coal technology in Queensland utilising integrated gasification and carbon capture and storage techniques. Subject to considering issues of scale and technical configuration $56.8 million has been allocated in 2007-08 (of potential total funding of $102.5 million) to continuing the feasibility study into the ZeroGen project.
Ministerial Council on Energy activities
Additional funding of $4.2 million is allocated in 2007-08 for Queensland’s contribution to the Australian Energy Market Commission and other national energy market reforms being progressed by the Ministerial Council on Energy, in which Queensland participates as part of the Council of Australian Governments.
Other initiatives
Innovation Building Fund
Funding of $100 million from the Queensland Future Growth Fund has been provided to extend the existing Innovation Building Fund which funds infrastructure for strategic research and development throughout the State.
QBuild community service obligations
Total funding of $9.2 million is allocated in 2007-08 to allow QBuild to continue its community service obligation programs. The funds will allow QBuild to continue to employ and train a significant number of apprentices over and above industry standards throughout Queensland, and assist Indigenous apprentices obtain qualifications within their chosen trades. This funding continues the Government’s ongoing commitment to creating additional job opportunities and breaking the unemployment cycle.
| | | | | | |
| | Budget Strategy and Outlook 2007-08 | | 61 |
REALISING THE SMART STATE THROUGH EDUCATION, SKILLS AND INNOVATION
In recent years, the Government has laid the foundation for establishing Queensland as the Smart State. Initiatives have focused on education and training reforms and facilities and improving workforce skills for current and future needs by focusing on lifelong learning.
Major service developments and initiatives to support the Smart State priority are detailed below.
Education and training initiatives
In 2007-08, funding for up to 192 additional teachers and teacher aides will be provided in state schools to meet enrolment growth.
Building new and better facilities
The Government’s education and training capital works program of $562.8 million in 2007-08 helps to provide high quality environments in which Queensland state school and Technical and Further Education (TAFE) students can learn.
Approximately $189 million of the capital works program is earmarked in 2007-08 for the construction of initial stages at two new primary schools (West Pacific Pines and Northern Coomera), staged works at 11 schools and to provide new classrooms at existing schools to accommodate Queensland’s growing student population.
The Government is also budgeting approximately $86.9 million to refurbish and construct TAFE training facilities. This includes:
| | • | | SkillsTech Australia Acacia Ridge campus construction and to continue developing specialist trade centres in Mackay and Townsville |
| | • | | facilities refurbishment at the Tropical North Queensland Institute of TAFE Cairns Campus ($2 million) |
| | • | | continuing the Southbank Education and Training Precinct redevelopment ($13.7 million). |
In addition, $143.6 million will be invested in 2007-08 to improve existing infrastructure in schools, including special education facilities.
Around $77.5 million of the 2007-08 capital works program is allocated for ongoing school maintenance. This includes an estimated $20.6 million to finalise the replacement of roofs in state schools as part of the Accelerated Asbestos Roof Replacement Program and $5 million for the continued installation of electrical safety switches in at least 100 state schools.
| | | | | | |
| 62 | | Budget Strategy and Outlook 2007-08 | | |
In 2007-08, $80.5 million has been allocated under the Tomorrow’s Schools program to commence planning and establish pilot projects as well as funding $31.1 million to progress the development of a new Queensland Academy for Health Sciences (part of a total capital commitment of $35 million, excluding land, over two years) to open in 2008.
The new Queensland Academy for Health Sciences will involve a partnership with Griffith University to allow students to specialise in the health industry and follows the opening, in 2007, of the Queensland Academy for Science, Mathematics and Technology at Toowong, and the Queensland Academy for Creative Industries at Kelvin Grove. A further $35.6 million has been allocated for these existing academies to support the first cohort of students entering Year 12 in 2008.
Improving outcomes for Indigenous students
The Budget includes additional funding of $10 million over four years ($2.5 million in 2007-08) to improve education outcomes for Indigenous students by trialling professional support teachers and learning support teams in targeted schools.
The 2007-08 Budget also includes $4.3 million in recurrent funding and $1.8 million in capital funding to continue implementing the Bound for Success initiative to improve the education, training and career opportunities for Aboriginal and Torres Strait Islander children and young people. This funding forms part of the four year commitment of $19.4 million in recurrent funding and $9.2 million in capital funding announced in the 2006-07 Budget.
Increased funding for students with disabilities
The Budget provides an additional $30 million over four years ($5.3 million in 2007-08) to support the phasing out of signed English and adoption of Australian Signed Language (Auslan) as the language of instruction for deaf/hearing impaired students. The Budget also provides approximately $2.5 million in increased funding for students with disabilities in 2007-08, increasing to around $5 million per year in subsequent years.
Prep Year implementation
The 2007-08 Budget allocates approximately $50 million to support full implementation of the Prep Year in 2008, when all 4 1/2 to 5 1/2 year old Queensland children have the opportunity to access the full-time Prep Year. This funding will employ more Prep teachers, provide professional development for school staff and includes $5.5 million in grants to schools for curriculum resources including books, art and craft materials and indoor play equipment.
| | | | | | |
| | Budget Strategy and Outlook 2007-08 | | 63 |
Computers for teachers
The Government will invest $70 million over four years to provide computers to teachers in state schools and TAFE institutes State-wide. Funding commences with $10 million in 2007-08 and increases to $20 million per year thereafter to provide all permanent teachers working more than two days per week with a computer and necessary associated professional development.
Queensland Skills Plan
The Government is continuing to implement the Queensland Skill Plan (launched March 2006) to achieve significant reforms to the State’s vocational education and training system.
In 2007-08, around $118 million is budgeted (as part of approximately $800 million over four years from 2006-07) to continue to transform and modernise the vocational education and training system and to better match the supply of skilled labour to the needs of industry and the demands of the Queensland economy.
Major Queensland Skills Plan initiatives for 2007-08 include:
| | • | | $17.1 million to create 4,250 additional trade training places for emerging and high-growth industries. By 2010, this will increase to 17,000 extra places each year |
| | • | | $13.4 million for training and career information services at 17 existing Skilling Solutions Queensland centres |
| | • | | $4.5 million to further industry’s engagement in vocational education and training through Centres of Excellence. |
The Government will also continue its capital program to modernise the State’s network of TAFE institutes across the State (part of a total capital commitment exceeding $300 million over six years from 2006-07).
Employment initiatives
Skilling Queenslanders for Work
The Skilling Queenslanders for Work initiative announced in 2006-07 commences on 1 July 2007. This initiative will assist approximately 17,000 Queenslanders during 2007-08. During the first year of the initiative, $81.8 million will be spent to provide more intensive case-management approaches to support people who are most vulnerable in the labour market to gain sustainable job ready skills and employment outcomes.
| | | | | | |
| 64 | | Budget Strategy and Outlook 2007-08 | | |
MANAGING URBAN GROWTH AND BUILDING QUEENSLAND’S REGIONS
Queensland’s strong population growth, particularly in South East Queensland region, presents challenges for transport systems and other infrastructure, services and the environment.
Major service developments and initiatives to support this priority are detailed below.
Transport initiatives
In addition to the transport service developments and initiatives set out below, Box 4.3 outlines a range of solutions which the Government has introduced to alleviate congestion.
South East Queensland Infrastructure Plan and Program (SEQIPP)
In the 2007-08 Budget, the Government continues to progress the implementation of the SEQIPP. Some major projects included in SEQIPP are:
| | • | | $129 million to complete the construction of the Inner Northern Busway sections one and two. This project has a total estimated cost of $333 million and will link the Queen Street Bus Station to the already completed stages of the Inner Northern Busway near Roma Street |
| | • | | $5 million to complete the construction on the Normanby Cycle connection. This cycleway will link Normanby to the Roma Street Parklands |
| | • | | $17.4 million towards the construction of cycle links to enhance the cycle network in SEQ, made up of $2.8 million towards the construction of State-owned cycle links and $14.6 million in grants to be provided to local authorities |
| | • | | $13.8 million towards the construction of the Robina Transport Hub and to continue the planning and design of projects as part of the TransLink Station Upgrade Program |
| | • | | $85.8 million towards the construction of a Eastern Busway corridor connection from the Eleanor Schonell Bridge to Ipswich Road with stations at Princess Alexandra Hospital and Park Road |
| | • | | $50 million towards the construction of the Eastern Busway: Princess Alexandra Hospital to Buranda. Construction will include an elevated busway station within the Princess Alexandra Hospital and will be a key link in the regional busway network |
| | • | | $46.7 million towards the construction of the Eastern Busway connection between Buranda and Capalaba |
| | • | | $103.3 million towards the construction of the Northern Busway between the Royal Children’s Hospital and Kedron. |
| | | | | | |
| | Budget Strategy and Outlook 2007-08 | | 65 |
New Queensland driver licence
The Budget provides $27.1 million to continue developing a New Queensland driver licence. The new licence will meet community demand for a secure licensing system that improves protection against fraud and identity theft.
Public transport service improvements
The Government will inject an additional $70 million over the next four years for additional public transport services. This additional funding will address overcrowding due to growth in passenger demand and provide improved levels of services in key growth corridors.
Integrated Ticketing System
The 2007-08 Budget provides $16 million towards the new Integrated Ticketing System. The new Integrated Ticketing System includes the use of smartcard technology as part of a wider program by TransLink to introduce a new fare collection system. The new system will make it easier and quicker for customers to pay fares and travel across SEQ.
Palm Island entrance channel dredging and associated works
Funding of $5 million is provided in 2007-08 for Palm Island maritime works, including $3.5 million in additional funding for the dredging of the entrance channel to Palm Island barge ramp and jetty. The dredging will provide safe, all tide access for the existing ferry and barge services.
Additional transport inspectors
The Budget provides increased funding of $1 million in 2007-08 and $2 million per year ongoing from 2008-09 to engage additional transport inspectors to deliver enhanced safety related outcomes in both the heavy vehicle and passenger transport areas through an increased capacity for enforcement, education and auditing.
Road projects
Key roadworks that are being progressed in 2007-08 include:
| | • | | $691.2 million to continue Queensland’s largest single road project to construct a second Gateway Bridge river crossing and to increase capacity on the Gateway Motorway between Mt Gravatt-Capalaba Road and Nudgee Road, at a total estimated cost of $1.88 billion, with scheduled completion by mid 2011 |
| | | | | | |
| 66 | | Budget Strategy and Outlook 2007-08 | | |
| | • | | $179.7 million towards the continuation of construction of the $543 million ($423 million, State; $120 million, Australian Government) four-lane bypass on the Pacific Motorway between Tugun and Tweed Heads, with scheduled completion in mid 2008 |
| | • | | $134.4 million towards the construction of the South West Arterial (Springfield – Ripley – Yamanto extension) at a total estimated cost of $366 million to service new growth areas in Ipswich City, with scheduled completion by mid 2009 |
| | • | | $163.5 million towards the federally-funded upgrade of the Ipswich Motorway between Wacol and Darra, $121 million towards the continuation of works to upgrade the Ipswich/Logan Motorway interchange, and $100 million towards the federally funded $2.3 billion six-lane Goodna Bypass from Dinmore to the Logan Motorway at Gailes, which was announced by the Australian Government in March 2007 |
| | • | | $133.7 million to duplicate the Sunshine Motorway between Sippy Downs and Pacific Paradise, including the second Maroochy River bridge and major interchanges at Mooloolaba and Maroochydore Road and Pacific Paradise, at a total estimated cost of $290 million |
| | • | | $98.7 million towards widening the federally funded Bruce Highway to six lanes between Uhlmann Road and Caboolture, at a total estimated cost of $183 million |
| | • | | $12.3 million towards widening and upgrading the Roma-Taroom Road to support oil and gas development and improve regional community access at a total estimated cost of $29.7 million |
| | • | | $9.9 million towards the construction of the Bundaberg Ring Road to provide an alternative route from the Isis Highway to the industrial areas and the port to the east of Bundaberg City at a total estimated cost of $92 million |
| | • | | $36.1 million towards the Accelerated Road Rehabilitation Program to rehabilitate and widen 71 kilometres of the Dawson Highway in Central Queensland between Calliope and Banana, and replace 11 timber bridges, at a total cost of $78.9 million |
| | • | | $15.2 million towards the duplication of the Forgan Bridge in Mackay at a total estimated cost of $70.9 million and $15.4 million towards the construction of Hospital Bridge at a total estimated cost of $33.6 million |
| | • | | $58.3 million towards Stages 2 and 3 of the Townsville Ring Road Stages 2 and 3, on the Bruce Highway, at a total cost of $119.3 million ($39.8 million, State; $79.5 million, Australian Government) |
| | • | | $40.3 million to improve flood immunity on the federally funded Bruce Highway between Corduroy Creek and Banyan Creek, south of Tully, at a total estimated cost of $172.8 million |
| | | | | | |
| | Budget Strategy and Outlook 2007-08 | | 67 |
| | • | | $17.8 million towards the duplication of North Ward Road in Townsville – between William Street and Ingham Road and between Walker Street and Heatley Parade – at a total estimated cost of $33.8 million |
| | • | | $9.3 million towards widening the existing narrow formation sections of the Kennedy Highway south of Mt Garnet, to provide a minimum eight metre wide sealed pavement, at a total estimated cost of $14 million |
| | • | | $9 million towards widening the single-lane bitumen sections of the Burke Developmental Road to provide a minimum seal width of eight metres, widening or removing narrow grids and improving visibility through sections of poor alignment, at a total estimated cost of $28 million |
| | • | | $5.6 million towards widening Mulgrave Road in Cairns – between Ray Jones Drive (Woree) and the Captain Cook Highway, Sheridan Street – from four to six lanes, at a total estimated cost of $16 million. |
Water infrastructure initiatives
Water infrastructure
New water infrastructure, particularly in SEQ, is a key priority for the Government. These water infrastructure projects are being delivered through a series of companies either fully-owned by the State or in conjunction with the relevant local government. Further details about these projects are included in Chapter 3.
Queensland Water Commission
Additional funding of $25 million over two years is provided for the Queensland Water Commission to continue its role in managing water in SEQ through planning and identifying water sources as well as providing advice to the Government on institutional arrangements.
Other initiatives
Reforming local government
The Government has committed $12 million to implement the first stage of the Local Government Reform Program. This is the most historic reform of local government in the last 100 years and will deliver a more sustainable, efficient and financially stable system of local government for all Queensland communities.
| | | | | | |
| 68 | | Budget Strategy and Outlook 2007-08 | | |
Queensland Rural Adjustment Authority administration funding
The Queensland Rural Adjustment Authority has deployed additional regionally based Client Liaison Officers and extended the level of administrative support and systems at an additional cost of $9.5 million over four years ($2.5 million in 2007-08) to meet high levels of demand and ensure delivery standards for programs such as Tropical Cyclones Larry and Monica, new Government drought schemes and other assistance programs.
Transit Oriented Development Coordination Unit
New funding of $8.9 million over two years is provided to establish the Transit Oriented Development Coordination Unit within the Office of Urban Management. A Transit Oriented Development is a development that involves mixed-use residential and commercial areas which are designed to maximise the efficient use of land through high levels of access to public transport. The Unit will coordinate Transit Oriented Development policies and projects across State agencies, including progressing the delivery of demonstration projects.
Native Title Support Program extension
Funding of $2.3 million over three years is provided for the continued employment of capacity development officers who will assist native title representative bodies and native title parties to implement expedited Native Title Protection Conditions procedures negotiated with the Queensland Resources Council and the Queensland Indigenous Working Group.
Improved future land practices—Palm Island
Additional funding of $2.3 million is provided over three years to develop land use plans, policies and procedures to address obstacles that impede ready access to Palm Island land. This will streamline and enhance decision making on land use and leasing, rationalise existing tenures, and address boundary irregularities through the development of a survey network.
| | | | | | |
| | Budget Strategy and Outlook 2007-08 | | 69 |
|
Box 4.3 Transport solutions for alleviating congestion |
| |
The Queensland Government is taking comprehensive action to address urban congestion and is investing heavily in infrastructure and services. The South East Queensland Infrastructure Plan and Program details the Government’s commitment to providing new infrastructure. The road infrastructure focus is to improve levels of service to motorists and reduce delays and costs to industry. Public transport infrastructure and services are focussed on reducing vehicle kilometres travelled in congested areas. A major component of the infrastructure program is the road network. In order to address congestion, a number of road infrastructure projects are being undertaken that focus on moving traffic more effectively in and around urban centres such as the Brisbane Central Business District. Projects include the construction of a second Gateway Bridge river crossing and increasing capacity on the Gateway Motorway between Mt Gravatt-Capalaba Road and Nudgee Road. A major focus for the Government is to encourage people to travel in alternative, non-car modes of transport. Public transport patronage in South East Queensland (SEQ) increased by approximately 12% in 2005-06 from the previous year, six times the growth rate prior to the introduction of TransLink. Patronage across the TransLink network in SEQ continues to grow strongly; in 2005-06 estimated patronage was 151 million and in 2006-07 estimated patronage is 161 million. The rail network in SEQ provides the backbone for the region’s integrated public transport network supporting commuter travel between the major regional urban centres of the Gold Coast, Sunshine Coast, Western Corridor/Ipswich and Brisbane. The rail network provides fast inter-urban services to cater for local commuting, with more than 50 million passengers travelling on Citytrain services each year. It also provides for freight transport in and out of SEQ, thus reducing road congestion. The rail network is complemented by a growing bus network, including busways and bus lanes, that deliver high quality connections between the region’s key activity centres and provides services in areas not serviced by rail. This integrated network encourages Queenslanders to use public transport and thereby reduce congestion. Brisbane’s busway network is part of a balanced transport solution that will make sure our capital city keeps moving. The network helps fill the gaps between existing rail lines to complete Brisbane’s major public transport network. The Government also addresses congestion by encouraging walking and cycling, with $220 million (2005 dollars) being invested in the SEQ regional cycle network between 2005 and 2026. |
| | | | | | |
| 70 | | Budget Strategy and Outlook 2007-08 | | |
PROTECTING OUR CHILDREN AND ENHANCING COMMUNITY SAFETY
The Government has attached a high priority to implementing strategies which protect our children and contribute to safe communities. Major service developments and initiatives to support this priority are detailed below.
Child protection initiatives
One Chance at Childhood
The Budget provides $40 million over four years for a range of initiatives, including One Chance at Childhood. Major aspects of this funding include:
| | • | | funding of $12 million over four years ($3 million in 2007-08), which is aimed at keeping babies and toddlers safe. These funds will allow the Department of Child Safety to commence initiatives to provide Queensland’s most vulnerable children with their one chance at childhood by building greater expertise at the major risk points of the child, namely, working with high risk babies, deciding if it is safe to reunify a child in care with their parents, and providing a child with an alternative permanent family |
| | • | | funding of $21 million over four years ($5.3 million in 2007-08) to provide for an extra 13 Child Safety Officers, 16 Court Coordinators, 29 Child Safety Support Officers and an upgrading of Suspected Child Abuse and Neglect Coordinator positions to further the reforms achieved since the release of the CMC report Protecting Children: An Inquiry into Abuse of Children in Foster Care and the subsequent Government Blueprint and to address increased demand in Child Safety Service Centres around Queensland. |
Responding to child protection needs in Indigenous Communities
Recurrent funding of $18.7 million over four years and $12.4 million in capital funding over three years has been provided for an initiative aimed at responding to child protection needs in Indigenous communities. The Department of Child Safety has also allocated additional internal funding for this initiative, bringing total recurrent funding to $19.1 million ($2.1 million in 2007-08) and total capital funding to $15.5 million ($7.6 million in 2007-08).
| | | | | | |
| | Budget Strategy and Outlook 2007-08 | | 71 |
This funding will establish a number of residential care facilities in Pormpuraaw, Kowanyama, Aurukun, Weipa/Napranum, and Doomadgee. Additionally, a first placement house will also be established on Palm Island as part of the Queensland Government’s five point plan for Palm Island. These facilities will provide a safe place for Indigenous children and young people to be placed for initial assessments and reduce the need to remove them from their community, as well as provide for longer term residential care.
This funding will also be used to establish employee housing and office accommodation facilities for Child Safety Officers delivering services from branch offices located in Weipa, Cooktown and Thursday Island.
Policing initiatives
Joint Contact Centre
Total funding of $57.4 million over four years has been allocated for the construction of a Joint Contact Centre at Zillmere. The centre will accommodate officers from Smart Service Queensland and Queensland Police Service, and provides opportunities to improve reliability and quality of customer services. It will provide for business continuity and essential 24/7 disaster recovery for agencies.
This new contact centre will allow members of the public to easily contact the Queensland Police Service. A central phone number will provide contact with police from anywhere in the State. The call centre will also be responsible for assisting with 000 emergency calls and providing the public with important information and advice on personal and home security matters. The contact centre will have the capability of delivering a standard of service that will meet or exceed public expectations. By employing civilians, this initiative will create efficiencies by redirecting the efforts of sworn officers back into frontline policing duties.
Support for police
In accordance with announcements made in the 2006 Election, the Queensland Police Service’s sworn growth will be increased to 9,928 by October 2008 through the creation of 200 new police positions. This growth in police numbers will support the Government’s commitment to maintain police numbers above the national average of the police to population ratio.
Supporting policing in Indigenous communities
An additional $2.6 million in capital as well as $2.3 million in recurrent funding is provided over four years for the acquisition and ongoing operation of an additional aircraft to enhance the provision of justice services throughout the Torres Strait.
| | | | | | |
| 72 | | Budget Strategy and Outlook 2007-08 | | |
Enhancing police information and communications technology
The Government has committed an additional $3 million in capital as well as $3.1 million in recurrent funding over the next four years to upgrade and enhance police communications equipment across the State. The Government is also contributing $1.2 million in capital as well as $1.5 million in recurrent funding over four years towards the establishment of a national system to facilitate the exchange of police operational information.
Criminal justice initiatives
Piloting alternative service delivery in the Magistrates Courts - judicial registrars
The Government will trial an innovative response at a cost of $2.4 million over three years ($0.66 million in 2007-08) to the growing workload of Queensland magistrates by appointing judicial registrars in the Magistrates Courts to enable Queensland’s busiest courts to hear more matters. The two year pilot program, to begin on 1 January 2008 at the Brisbane Magistrates Court, Beenleigh Magistrates Court and Southport Magistrates Court, will involve judicial registrars hearing some minor matters that currently require the determination of magistrates, such as small claims and minor debt claims.
New Queensland courts case management system
Funding has been provided for a foundation phase for a case management system to better manage information sources and statistics. Over the next three years, recurrent funding of $4.6 million and capital funding of $2.4 million will be used to review business practices of the Courts and Tribunals to determine one common technology framework.
Correctional centres
Capital funding of $228 million has been allocated in 2007-08 to support the continuation of major capital projects at Townsville Men’s and Women’s, Arthur Gorrie and the former Sir David Longland correctional centres.
To provide facilities for the expected growth in prisoner numbers, funding of $3.5 million is allocated to develop a business case for the establishment of a prison precinct in the Gatton district. Further capital funding of $3 million is allocated for planning and design for the expansion of Lotus Glen Correctional Centre.
Additional capital funding of $10 million is provided over two years ($7 million in 2007-08) to continue the upgrade of perimeter security at secure correctional centres, bringing total funding for the project to $40 million over five years from 2004-05.
| | | | | | |
| | Budget Strategy and Outlook 2007-08 | | 73 |
The Budget also provides $0.8 million in 2007-08 and $2 million ongoing from 2008-09 for increased costs of minor building work at correctional centres and setting up, or upgrading, district offices.
Managing dangerous offenders in the community
Additional recurrent funding of $9.2 million over four years ($1.9 million in 2007-08) is provided for specialised assessment, surveillance, supervision and treatment of offenders released into the community who are subject to the provisions of the Dangerous Prisoners (Sexual Offenders) Act 2003.
Probation and parole in Indigenous communities
To reduce the number of Indigenous people held in Queensland’s correctional centres, additional recurrent funding of $4.2 million over four years ($0.5 million in 2007-08) and capital funding of $1.5 million over two years ($0.5 million in 2007-08) has been allocated to establish probation and parole centres in Indigenous communities. In 2007-08 services will be established at Weipa to service the Weipa, Napranum, Mapoon, Lockhart and Aurukun areas, and in the northern peninsula region, servicing Seisia, Umagico, Injinoo, Bamaga and New Mapoon. Existing facilities on Palm Island will be upgraded.
Prisoner through-care and support services
The Budget provides additional funding of $18.3 million over four years ($2 million in 2007-08) for a range of initiatives to improve intervention and rehabilitation services. Initiatives include increasing prison industry operations to provide greater skills development opportunities for prisoners, increased provision of support services by external providers, extension of rehabilitation programs to offenders in the community, and improved coordination of employment and training.
Emergency Services Initiatives
Integrated communication and State emergency operations centre
The Budget contains capital funding of $41.7 million (as part of an allocation of $70.4 million over two years) to build a new state-of-the-art integrated communication and State emergency operations centre to replace the fire and ambulance communications facilities at Brisbane and the South East Region. This will also involve the upgrading and replacing radio and information and communications technology infrastructure within the communications centre to enable more effective management of large scale emergencies and disasters in Queensland.
| | | | | | |
| 74 | | Budget Strategy and Outlook 2007-08 | | |
Queensland Ambulance Service
Increased recurrent funding of almost $50 million has been provided for the Queensland Ambulance Service to meet growing demand for services. This includes funding for an additional 250 ambulance officers across the State which is the single biggest increase in the number of ambulance officers in any one year and is on top of the more than 220 extra staff employed in 2006-07. The new 250 ambulance officer positions comprise:
| • | | 208 ambulance officers including paramedics, communications officers, clinical and support staff to assist the Queensland Ambulance Service to manage demand for services driven by a growing and ageing population and the community’s increasing use of emergency health services |
| • | | 42 ambulance officers to complete the program of an additional 144 ambulance officers over two years to include the implementation of a 38 hour week from October 2007. These additional positions will contribute to the long-term occupational health and well-being of Queensland Ambulance Service paramedics, patient transport officers and communications officers. |
Future staffing enhancements will take into account the State’s growing and ageing population and the community’s increasing usage of emergency health services.
Aeromedical and air rescue capability
Capital funding of $48.3 million over three years ($26.6 million in 2007-08) is allocated for three state-of-the-art AgustaWestland 139 helicopters. These rescue helicopters have improved capacity, safety and equipment standards, and are faster, more economical and have a larger cabin than the current Bell 412 helicopters. This investment will greatly enhance the level of service for aero-medical, search and rescue operations, and counter disaster capabilities across Queensland.
Counter terrorism response capability
The Budget provides recurrent funding of $13.4 million over five years ($4.7 million in 2007-08) to enhance the Department of Emergency Service’s counter terrorism preparedness and response capability through additional resources and training for the strike team based at the Special Operations Complex, Cannon Hill.
| | | | | | |
| | Budget Strategy and Outlook 2007-08 | | 75 |
PROTECTING THE ENVIRONMENT FOR A SUSTAINABLE FUTURE
The sustainable use of natural resources and the maintenance of biodiversity are key priorities of the Government. The Government will continue to promote sustainable development through responsible use of the State’s natural resources.
Major service developments and initiatives to support this priority are detailed below.
Climate change initiatives
ClimateSmart 2050
The Queensland Future Growth Fund is providing funds of $100 million to respond to the challenges generated by climate change. Funding of $50 million is provided to the Queensland Renewable Energy Fund to support projects involving leading edge renewable energy technologies. The first project provided for under this new fund will be the CSIRO solar thermal demonstration project. This project is a great opportunity to develop solar technologies which have real potential to reduce Queensland’s future level of carbon emissions.
A further $64.25 million has been set aside to fund a broader program of climate change initiatives, including an Energy Savings Fund. This Fund will support Queensland companies which invest in energy efficient products. A ClimateSmart Living campaign to raise awareness of climate change and highlight actions Queenslanders can take to reduce their greenhouse gas emissions is also supported.
Climate Change Centre of Excellence
Operational funding of $2.5 million per annum from 2007-08, together with one-off 2007-08 capital funding of $1.5 million, is provided to establish the Queensland Climate Change Centre of Excellence. The Centre will bring a strategic whole-of-Government focus to climate change and aims to help Queenslanders better understand and prepare for the inevitable consequences of climate change.
Energy efficiency
Increased funding of $2.5 million over the next three years ($1.2 million in 2007-08) is allocated for a Gas Installation Rebate to provide up to $500 for eligible residential customers who purchase gas appliances. This will promote increased use of gas as a clean, efficient energy source and support the further development of gas reticulation systems.
Increased funding of $1.7 million in 2007-08 ($5 million over three years) is allocated for the EnergyWise program to encourage Queenslanders to adopt more energy-efficient practices. Initiatives include the home EnergyWise service and toolbox, information about switching to off-peak energy use and an energy-efficient street lighting trial.
| | | | | | |
| 76 | | Budget Strategy and Outlook 2007-08 | | |
|
Box 4.4 ClimateSmart 2050 |
| |
ClimateSmart 2050 represents the Queensland Government’s contribution to not only the Australian but also the global effort to tackle climate change. Queensland has been proactive in addressing climate change, introducing initiatives including: • the 13% gas scheme • banning of broadscale clearing of vegetation across the State • building the South East Queensland Water Grid to provide water security • developing Queensland’s Adaptation Action Plan. ClimateSmart 2050 maintains this high level of commitment providing $414.25 million in new funding to respond to the challenges generated by climate change. Funding of $50 million has been provided to establish the Queensland Renewable Energy Fund to support projects involving leading edge renewable energy technologies. The first project provided for under this new fund will be the CSIRO solar thermal demonstration project. This project is a great opportunity to develop solar technologies which have real potential to reduce Queensland’s future level of carbon emissions. Opportunities are also being explored to invest in geothermal ‘hot rocks’. A further $64.25 million has been set aside to fund a broader program of climate change initiatives, including an Energy Savings Fund. This Fund will support Queensland companies which invest in energy efficient products. There will also be a ClimateSmart Living campaign aimed at raising the community’s awareness of climate change and highlighting actions Queenslanders can take to reduce their greenhouse gas emissions. This Government recognises that tackling climate change is a long term agenda which will not stop with this Budget. Over coming years, Queensland will continue to play its part in meeting a national greenhouse gas emissions reduction target of 60% below 2000 levels by 2050. Through investing the net proceeds arising from the sale of certain Government-owned energy assets, Queensland will establish a $300 million Queensland Climate Change Fund. Interest earned on the fund will provide an ongoing funding source of approximately $20 million each year for future climate change initiatives. |
Water initiatives
WaterWise Rebate Schemes
Funding of up to $100.8 million is provided in 2007-08 for the estimated cost of WaterWise Rebate Schemes. The schemes are designed to assist Queensland householders make their homes and gardens more water efficient. They include the South East Queensland and State-wide Home WaterWise Rebate Schemes, the Home Garden WaterWise Rebate Scheme, grants to not-for-profit organisations for water saving initiatives and a gardening education program.
| | | | | | |
| | Budget Strategy and Outlook 2007-08 | | 77 |
Drought assistance – rebates on Part A water charges
Funding of up to $10 million is provided for rebates to irrigators during the period 1 July 2006 to 30 June 2008 as a result of the current drought circumstances. In areas of low water availability, rural irrigators may be eligible to receive a rebate on the payment of their fixed water charges.
Delivering water security
Additional funding of $18 million over four years is provided to supplement the 2005-06 Budget initiative Water Reform: Continuity of Supply. Outcomes to be delivered with the combined funding include completion and implementation of the water planning program, development of regional water supply strategies, improved groundwater management, policy development for urban demand management, ongoing development and implementation of water reform, enhanced water resource assessments, water efficiency incentives and upgrade of water management systems.
Accelerated use of recycled water
Funding of $10 million over four years, commencing 2007-08, is provided for the Queensland Water Recycling Strategy. The recycled water sources to be covered by the strategy include treated sewage effluent, greywater, stormwater, industrial and commercial recycled water, and water derived as a by-product from coal seam methane gas extraction. Recycled water applications to be investigated include residential usage, public open space irrigation, crop irrigation, commercial and industrial usage.
Government buildings water conservation program
The Budget contains $5 million in funding over two years to continue the development of water conservation initiatives for the Government’s built estate and grounds, and to collate water consumption and baseline data for all Government agencies. This initiative continues the Government’s ongoing commitment to promoting sustainable development through responsible use of the State’s natural resources.
Groundwater usage
Funding of $6.5 million over four years, commencing 2007-08, is provided to identify potential sources of groundwater, and to undertake studies to determine available resources and suitable extraction regimes.
| | | | | | |
| 78 | | Budget Strategy and Outlook 2007-08 | | |
Other initiatives
Ongoing implementation of the new Vegetation Management Framework
Additional funding of $26 million over four years is provided from 2007-08 for the continued implementation of the Vegetation Management Framework. The framework provides for policy development and its implementation, and improvements to vegetation management assessment activities.
Healthy waterways
Additional funding of $20 million over four years is provided from 2007-08 to contribute to the South East Queensland Healthy Waterways Strategy. The Strategy will build on actions implemented under the South East Queensland Regional Water Quality Management Strategy 2001 to improve the quality of South East Queensland waterways.
Rainforest/green land acquisition
Funding of $18 million is provided in 2007-08, including new funding of $10 million, as part of the $30 million three year election commitment to purchase more land that will be kept in pristine environmental condition for future generations to enjoy. This follows the acquisition of land of high conservation value in the Gold Coast Hinterland during 2006-07.
Sugarcane smut: management and economic recovery strategy
As part of the Government’s $15.6 million, four year commitment towards the sugarcane smut response program, funding of $6 million over three years, commencing 2007-08, is provided to address the recommendations of the Watson Report. Strategies include accelerated breeding and propagation of smut resistant varieties, the development and extension of farmer decision making tools, extension of farming system practices which enhance soil health and reduce farm inputs, and extension of education tools for on-farm surveillance, epidemiology and farming systems practices.
Maintenance of Environmental Protection Authority estate infrastructure
Additional funding of $5 million is provided in 2007-08 to improve the condition of facilities on the Environmental Protection Authority estate including roads, fire-lines, walking tracks, camping areas, day-use facilities, administrative buildings and workshops.
Cloud seeding
Funding of $7.6 million over four years, commencing 2007-08, is provided to evaluate the effectiveness of cloud seeding as a means of increasing rainfall in Queensland.
| | | | | | |
| | Budget Strategy and Outlook 2007-08 | | 79 |
More Great Walks in Queensland
Funding of $6.5 million over four years is provided for the More Great Walks of Queensland initiative to create an additional four walks, presently in the concept design stage (Whitsundays, Noosa/Cooloola, Carnarvon, and Conondale). This program will build on the $10 million five year Great Walks of Queensland initiative, commenced in 2001-02, that created a world class network of walking tracks across Queensland.
Enhanced compliance program for Environmentally Relevant Activities
Funding of $5 million is provided in 2007-08 to enhance compliance activities on Level 1 Environmentally Relevant Activities, including increasing the number of inspections of sites and the provision of an enhanced advisory service to business and industry for compliance related issues.
Land Tenure Ledger replacement
Capital funding of $3.8 million over two years is provided for extensive modifications to the Land Tenure Ledger to facilitate the introduction of an enhanced rental system which will establish more targeted and equitable arrangements for dealing with large movements in land values and drought hardship relief.
Abandoned mines major works
Additional capital funding of $3 million and $1.8 million in recurrent funding is provided in 2007-08 ($3 million capital and $8.2 million of recurrent funding over four years) to commence mine rehabilitation work at abandoned mine sites at Mount Morgan and Croydon. A twin train lime dosing water treatment plant at Mount Morgan will progressively reduce pit water levels to improve water quality at downstream creeks and to prepare for further rehabilitation works. In Croydon, an annual water treatment work program will commence and a scoping study to define further rehabilitation requirements will be undertaken to address risks associated with soil and groundwater contamination and acid rock drainage.
Ongoing protection of Queensland’s natural heritage: pest and fire management
Additional funding of $2 million is provided on an ongoing basis from 2007-08 to continue proactive pest and fire management within the protected estates. This program will build on the three year Pest and Fire Initiative previously announced as a 2004 election commitment with activities concentrating on eradicating local pest occurrences and targeting priority hazard reduction burns and fire trail maintenance.
| | | | | | |
| 80 | | Budget Strategy and Outlook 2007-08 | | |
|
Box 4.5 Queensland Future Growth Fund |
|
The Queensland Future Growth Fund was established by investing the proceeds from the sale of Sun Retail, Sun Gas, Powerdirect Australia and the Allgas network. The sale processes were very competitive and delivered positive outcomes for the State with the proceeds amounting to over $3 billion. The prices received for the businesses compare favourably with previous retail asset sales in Australia and reflect the growth opportunities available in South East Queensland. The funds will be used to secure the State’s future economic growth as well as its environmental sustainability through a raft of new infrastructure projects. Table 1 Allocation of Queensland Future Growth Funding |
| | | | | | |
Initiative | | Total Allocation $ million | | 2006-07 Est. Act. $ million | | 2007-08 Budget $ million |
Water and transport infrastructure | | 1,500.0 | | — | | 156.0 |
Clean coal technology | | 300.0 | | 29.6 | | 56.8 |
Smart State projects | | 100.0 | | — | | 15.0 |
Climate change projects | | 100.0 | | — | | 20.0 |
Commercial infrastructure including Government-owned corporations | | 600.0 | | 400.0 | | — |
Social housing stock | | 500.0 | | — | | 85.0 |
Total | | 3,100.0 | | 429.6 | | 332.8 |
|
Over the coming years, the Fund will focus on key priorities, which include: • committing funds to the construction and acceleration of vital infrastructure projects in the areas of water and transport. As the sales proceeds were greater than forecast, it is now possible to allocate $1.5 billion to the areas of water and transport. The Department of Transport is allocated $500 million towards advancing planning and construction of high priority public transport projects • $300 million for Clean Coal technology that will make a proactive and positive contribution to the science and technology of reducing greenhouse gas emissions • a further $100 million on projects to combat the effects of climate change including an investment of $50 million in the Queensland Renewable Energy Fund to support projects involving leading edge renewable energy technologies. Funding is also available for a broader program of climate change initiatives, including an Energy Savings Fund which will support Queensland companies investing in energy efficient products and a ClimateSmart Living campaign to raise awareness of climate change and highlight actions Queenslanders can take to reduce their greenhouse gas emissions • $100 million towards Smart State projects, specifically the Innovation Building Fund. This will provide an opportunity to capitalise on previous investment in research and development infrastructure and to develop further in areas of comparative advantage |
| | | | | | |
| | Budget Strategy and Outlook 2007-08 | | 81 |
|
• $600 million for commercial infrastructure, including funding for ENERGEX and Ergon Energy to improve their distribution networks. Funding will also be provided to other economically significant projects outside of South East Queensland, with details on projects to be determined by future priorities and commercial negotiations. Investment in these projects will reimburse the Government for income lost through the sale of the energy assets • an injection of $500 million to the Department of Housing to fund a major expansion of the State’s social housing stock. This will enhance the department’s capacity to commence new purchases and constructions in the areas of Public Rental Housing, Aboriginal and Torres Strait Islander Housing and Community Housing, thereby ensuring that the future needs of the community are satisfied. The Fund will also benefit from the reinjection of interest earnings on Fund balances. |
| | | | | | |
| 82 | | Budget Strategy and Outlook 2007-08 | | |
FEATURES
| • | | Total General Government sector revenue is estimated to be $32.551 billion in 2007-08, in line with 2006-07 estimated actual revenue. Increases in taxation revenue, grants and sales of goods are services are expected to be offset by reduced tax equivalent payments and investment returns moderating to the assumed long-term average earnings rate of 7.5%. |
| • | | A land tax relief package worth $50 million in 2007-08 will be introduced to alleviate the impact of recent land valuations on land tax liabilities. |
| | - | A 50% cap on the annual increase in land values used for the purposes of calculating land tax liability, will be introduced for three years from 1 July 2007. |
| | - | The tax-free threshold for resident individual land tax payers will be increased from $500,000 to $600,000 from 2007-08. |
| | - | The tax-free threshold for company, trustee and absentee land tax payers will be increased from $300,000 to $350,000 from 2007-08. |
| • | | A payroll tax harmonisation package will be introduced from 1 July 2008 to improve consistency between jurisdictions, simplifying payroll tax requirements for businesses. |
| • | | Duty on the registration or transfer of registration of motor vehicles will change from a flat rate of 2% to a rate dependent on the number of cylinders (or rotors) of the vehicle. From 1 January 2008, the rate will be 3% for four cylinder vehicles, 3.5% for six cylinder vehicles and 4% for vehicles with eight or more cylinders. The current rate of 2% will continue to apply for hybrid and electric vehicles. |
| • | | Mortgage duty will be halved from 1 January 2008, with full abolition from 1 January 2009. |
| • | | Overall, the tax changes above will result in a net tax reduction of $49.1 million in 2007-08. |
| • | | Queensland will retain its competitive tax status, with per capita state tax estimated at $2,226 in 2007-08 compared to an average of $2,357 for the other states and territories. |
INTRODUCTION
This chapter provides an overview of General Government sector revenue for the 2006-07 estimated actual outcome, forecasts for the 2007-08 Budget year and projections for 2008-09 to 2010-11.
| | | | | | |
| | Budget Strategy and Outlook 2007-08 | | 83 |
Table 5.1
General Government revenue1
| | | | | | | | | | | | |
| | | 2006-07
Budget
$ million | | 2006-07
Est. Act.
$ million | | 2007-08
Budget
$ million | | 2008-09
Projected
$ million | | 2009-10
Projected
$ million | | 2010-11
Projected
$ million |
Revenue | | | | | | | | | | | | |
Taxation revenue | | 7,871 | | 8,375 | | 9,272 | | 10,067 | | 10,749 | | 11,568 |
Current grants and subsidies | | 13,143 | | 13,384 | | 13,726 | | 13,726 | | 14,084 | | 14,539 |
Capital grants | | 683 | | 811 | | 1,428 | | 1,096 | | 855 | | 897 |
Sales of goods and services | | 2,693 | | 2,937 | | 3,005 | | 3,094 | | 3,188 | | 3,282 |
Interest income | | 1,802 | | 3,268 | | 2,190 | | 2,325 | | 2,440 | | 2,562 |
Other | | 2,879 | | 3,781 | | 2,931 | | 2,999 | | 3,289 | | 3,131 |
Total Revenue | | 29,070 | | 32,557 | | 32,551 | | 33,307 | | 34,605 | | 35,979 |
Note:
| 1. | Numbers may not add due to rounding. |
Forward estimates are based on the economic projections outlined in Chapter 2 and are formulated on a no policy change basis.
General Government revenue in 2006-07 is estimated to be $32.557 billion or 12% more than the 2006-07 Budget estimate.
Significant variations include higher:
| • | | interest income, reflecting the strong performance of investment markets, which has significantly improved the returns from the State’s financial assets, including those held to meet future employee entitlements. Excluding the higher revenue from interest income reduces estimated actual revenue to 7.4% higher than budgeted |
| • | | taxation revenue, primarily due to higher revenue from duty on property transfer transactions resulting from stronger than expected market activity, as well as higher payroll tax from strong employment and wage growth outcomes |
| • | | tax equivalent payments associated with the sale of ENERGEX’s electricity and gas retail businesses, the Allgas distribution network and the competitive parts of Ergon Energy’s electricity retail business including its subsidiary, Powerdirect. |
General Government revenue in 2007-08 is estimated to be $32.551 billion, marginally less than the 2006-07 estimated actual revenue of $32.557 billion. This is largely due to:
| • | | reduced interest income, reflecting the return of investment returns to the assumed long-term average earnings rate of 7.5% |
| • | | reduced revenue from tax equivalent payments. |
These revenue reductions are almost entirely offset by forecast increases in Commonwealth grants and tax revenue.
| | | | | | |
| 84 | | Budget Strategy and Outlook 2007-08 | | |
REVENUE BY OPERATING STATEMENT CATEGORY
Major sources of General Government revenue in 2007-08 are current grants and subsidies (42.2% of revenue) and taxation revenue (28.5%). Chart 5.1 illustrates the composition of General Government revenue.
Chart 5.1
Revenue by operating statement category 2007-08
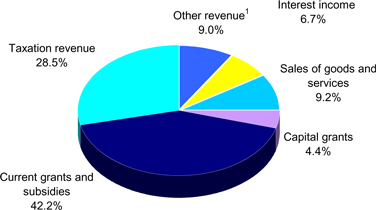
Note:
| 1. | The major components of ‘other revenue’ are royalties and land rents (4.4%) and dividends (2.8%). |
Chart 5.2 compares 2007-08 estimates with 2006-07 estimated actuals. The overall result primarily reflects anticipated decreases in interest income and other revenue being almost entirely offset by increases in current grants and subsidies and taxation revenue.
Chart 5.2
Revenue by operating statement category for 2006-07 and 2007-08
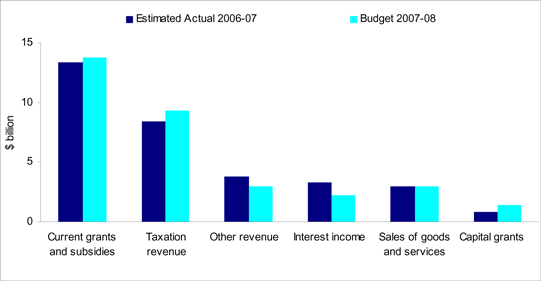
| | | | | | |
| | Budget Strategy and Outlook 2007-08 | | 85 |
TAXATION REVENUE
One of the Queensland Government’s key social and fiscal objectives is to maintain a competitive tax environment while raising sufficient revenue to meet the infrastructure and Government service delivery needs of the people of Queensland.
Total revenue from taxation is expected to increase by 10.7% in 2007-08. This reflects the expected impact of continued strength of the property market on duty revenue as well as employment and wage growth on payroll tax revenue.
Table 5.2
Taxation revenue1
| | | | | | |
| | | 2005-06
Actual $ million | | 2006-07 Est. Act. $ million | | 2007-08 Budget $ million |
Payroll tax | | 1,917 | | 2,175 | | 2,411 |
Duties | | | | | | |
Transfer2 | | 1,963 | | 2,450 | | 2,842 |
Vehicle registration | | 269 | | 285 | | 385 |
Insurance3 | | 328 | | 366 | | 393 |
Mortgage | | 297 | | 345 | | 300 |
Other duties4 | | 73 | | 25 | | 14 |
Total Duties | | 2,930 | | 3,471 | | 3,935 |
| | | |
Gambling taxes and levies5 | | | | | | |
Gaming machine tax and levies6 | | 551 | | 520 | | 548 |
Lotteries taxes | | 183 | | 198 | | 208 |
Wagering taxes | | 34 | | 35 | | 37 |
Casino taxes and levies | | 59 | | 58 | | 61 |
Keno tax | | 14 | | 15 | | 15 |
Total Gambling taxes and levies | | 841 | | 826 | | 868 |
| | | |
Other taxes | | | | | | |
Land tax | | 404 | | 523 | | 622 |
Motor vehicle registration | | 819 | | 865 | | 900 |
Fire levy | | 239 | | 252 | | 264 |
Community Ambulance Cover | | 118 | | 123 | | 128 |
Guarantee fees | | 70 | | 80 | | 83 |
Other taxes | | 57 | | 60 | | 61 |
| | | |
Total Taxation | | 7,396 | | 8,375 | | 9,272 |
Notes:
| 1. | Numbers may not add due to rounding. |
| 2. | Includes marketable securities duty in 2005-06 and 2006-07. |
| 3. | Includes duty on accident insurance premiums. |
| 4. | Includes duty on leases, rental arrangements, credit business in the years prior to abolition and life insurance premiums in all years. |
| 5. | Includes community benefit levies. |
| 6. | Includes the Major Facilities Levy (2005-06), Health Services Levy (2006-07 onwards). |
| | | | | | |
| 86 | | Budget Strategy and Outlook 2007-08 | | |
Budget tax initiatives
Land tax relief package
Queensland has experienced strong growth in land values for a number of years. Although the taxation consequences have been somewhat mitigated by the application of three-year averaging of land valuations for assessments, the Government has also taken substantial steps to moderate the increase in the numbers of landowners liable for land tax and growth in land tax liabilities for landowners already in the system.
This Budget recognises the recent significant increase in land valuations and seeks to further mitigate the impact of increased land values by capping the increase in averaged land values at 50% each year for three years for the purposes of calculating land tax liabilities. This cap will commence from 1 July 2007. Based on valuations for the 2007-08 land tax year, it is expected that the cap will provide a benefit to over 4,500 resident individuals and over 6,300 companies, trustees and absentees.
This Budget delivers further land tax relief by also increasing the tax free threshold for resident individuals from the current $500,000 to $600,000. This means resident individuals will not be subject to land tax until the taxable value of their landholdings, excluding their principal place of residence, amounts to $600,000. Compared to the current schedule, the increased threshold will reduce by over 6,000 the number of resident individuals in the land tax system in 2007-08. No taxpayer will be worse off as a result of the change. The new land tax schedule for resident individuals is presented in Table 5.3.
Table 5.3
Land tax schedules for 2007-08 – resident individuals1
| | | | | | |
Unimproved Land Value | | Current | | Unimproved Land Value | | New |
| | | |
| $500,000—$749,999 | | $500 + rate of 0.70% | | $600,000 - $749,999 | | $1,200 + rate of 0.70% |
| | | |
| $750,000—$1,249,999 | | $2,250 + rate of 1.45% | | $750,000 - $1,249,999 | | $2,250 + rate of 1.45% |
| | | |
| $1,250,000—$1,999,999 | | $9,500 + rate of 1.50% | | $1,250,000 - $1,999,999 | | $9,500 + rate of 1.50% |
| | | |
| $2,000,000—$2,999,999 | | $20,750 + rate 1.675% | | $2,000,000 - $2,999,999 | | $20,750 + rate 1.675% |
| | | |
| $3,000,000 and above | | 1.25% on full value | | $3,000,000 and above | | 1.25% on full value |
Note:
| 1. | Rates are marginal rates unless otherwise specified. |
| | | | | | |
| | Budget Strategy and Outlook 2007-08 | | 87 |
This Budget also provides land tax relief for companies, trustees and absentees by increasing the tax free threshold from the current $300,000 to $350,000. Compared to the current schedule, the increased threshold will reduce by over 4,000 the number of companies, trustees and absentees in the land tax system in 2007-08. No taxpayer will be worse off as a result of the change. The new land tax schedule for companies, trustees and absentees is presented in Table 5.4.
Table 5.4
Land tax schedules for 2007-08 – companies, trustees and absentees1
| | | | | | |
Unimproved Land Value | | Current | | Unimproved Land Value | | New |
| | | |
| $300,000—$749,999 | | $1,500 + rate of 1.50% | | $350,000 - $749,999 | | $2,250 + rate of 1.50% |
| | | |
| $750,000—$1,249,999 | | $8,250 + rate of 1.65% | | $750,000 - $1,249,999 | | $8,250 + rate of 1.65% |
| | | |
| $1,250,000—$1,999,999 | | $16,500 + rate 1.80% | | $1,250,000 - $1,999,999 | | $16,500 + rate 1.80% |
| | | |
| $2,000,000 and above | | 1.50% on full value | | $2,000,000 and above | | 1.50% on full value |
Note:
| 1. | Rates are marginal rates unless otherwise specified. |
The changes to the land tax thresholds will take effect for the 2007-08 financial year.
As a package, the introduction of the 50% cap on the land tax value increases and the increased thresholds are estimated to provide $50 million in land tax relief in 2007-08.
This package continues the land tax reforms introduced by the Queensland Government in the past three Budgets, which include threshold increases and rate reductions. In addition, it is estimated that the revenue foregone as a result of three-year averaging is approximately $202 million in 2007-08.
Payroll tax harmonisation package
All states and territories have been working together to increase consistency in their application of payroll tax, to minimise cross-border business costs, through an inter-jurisdictional consistency project (ICP).
The Queensland Government recognises the importance to business of increased harmonisation across jurisdictions and intends to implement the measures recommended by the ICP from 1 July 2008.
In addition to the changes supported by the ICP, the Queensland Government will take action to further increase consistency across jurisdictions by aligning a number of areas of Queensland’s payroll tax legislation with other jurisdictions, including the harmonised legislation announced by the Victorian and New South Wales governments in January 2007.
| | | | | | |
| 88 | | Budget Strategy and Outlook 2007-08 | | |
These additional measures will also take effect from 1 July 2008, to allow time for the passage of the necessary legislative amendments and for the Office of State Revenue to assist employers to prepare for the changes ahead.
A number of the payroll tax consistency measures to be implemented on 1 July 2008 will reduce the payroll tax base, while other changes will broaden it. Overall, the changes to the payroll tax system are expected to be revenue neutral.
Queensland’s tax rates and thresholds, which are among the most competitive in Australia, will not be affected by the moves towards increased consistency.
Vehicle registration duty increase
Vehicle registration duty is payable on the initial registration or transfer of registration of a vehicle. The current rate of duty is 2% of the dutiable value of the vehicle. From 1 January 2008, the rate will change. The new rates for vehicles with cylinders or rotors are set out in Table 5.5. The current 2% rate of duty will continue to apply for hybrid or electric vehicles, as will the current $25 flat rate of duty for conditionally registered vehicles.
Table 5.5
Vehicle registration duty rates – from 1 January 2008
| | |
Vehicle type | | Duty rate |
| Up to and including 4 cylinders or 2 rotors | | 3% |
| 5 or 6 cylinders or 3 rotors | | 3.5% |
| 7 or more cylinders | | 4% |
| Hybrids, electric | | 2% |
| Conditionally registered vehicles | | $25 flat fee |
Queensland’s duty rates will be either lower than, or equal to, the majority of states and territories for vehicles with four cylinders or less, which represent over 60% of motor vehicles purchased in Queensland.
The increase in vehicle registration duty rates is expected to provide an additional $80 million in 2007-08, increasing to $205 million in 2008-09, the first full year of implementation.
| | | | | | |
| | Budget Strategy and Outlook 2007-08 | | 89 |
Abolition of state taxes
The Intergovernmental Agreement on the Reform of Commonwealth-State Financial Relations (IGA), agreed to by the Australian Government and all state and territory governments in 1999, required the abolition and review of a number of state taxes.
In accordance with the requirements of the IGA, transfer duty on quoted marketable securities and debits tax were abolished in 2001 and 2005 respectively.
In 2005, Queensland participated in a multijurisdictional review into the need to retain a number of state duties, as required by the IGA. A timetable for the abolition of the majority of these duties was announced in the 2005-06 Budget and agreed to by the Australian Government in the Ministerial Council Meeting of March 2006.
Table 5.6 presents the full schedule of tax abolitions under the IGA.
Table 5.6
Abolition of state taxes under the IGA
| | | | | | |
Tax | | Description | | Abolition | | Full year cost1 $ million |
| Marketable securities duty (quoted) | | Payable on the transfer of marketable securities listed on the Australian Stock Exchange or another recognised stock exchange. | | Ö
July 2001 | | 35 |
| | | |
Credit card duty2 | | Payable on credit card transactions. | | Ö
August 2004 | | 20 |
| | | |
Debits tax | | Payable on debits to accounts with cheque drawing facility. | | Ö
July 2005 | | 190 |
| | | |
Lease duty | | Payable on the lease of land or premises in Queensland. Residential leases exempted. | | Ö
January 2006 | | 27 |
| | | |
Credit business duty | | Payable on the amount of credit provided under a loan, a discount transaction or a credit arrangement. | | Ö
January 2006 | | 19 |
| | | |
Hire duty | | Payable on the hiring charges of the hire of goods. | | Ö
January 2007 | | 19 |
| | | |
Marketable securities duty (unquoted) | | Payable on the transfer of marketable securities not listed on the Australian Stock Exchange or another recognised stock exchange. | | Ö
January 2007 | | 17 |
| | | |
Mortgage duty | | Payable on entering into a mortgage over property in Queensland. | | 50% 1 Jan 2008
100% 1 Jan 2009 | | 435 |
| | | |
Duty on transfer of core business assets | | Payable on the transfer of non-realty business assets. | | 50% 1 Jan 2010
100% 1 Jan 2011 | | 219 |
Notes:
| 1. | Estimated revenue foregone in financial year following full abolition. |
| 2. | Credit card duty was abolished prior to its review under the IGA. |
| | | | | | |
| 90 | | Budget Strategy and Outlook 2007-08 | | |
The timing of the duty abolitions balances a range of community priorities, including the maintenance of the State’s tax competitiveness while funding the delivery of essential community services and the provision of critical new infrastructure.
The Government has completed a number of duty abolitions announced in the 2005-06 Budget, with the removal of credit business and lease duties from 1 January 2006 and hire duty and marketable securities duty (unquoted) from 1 January 2007.
Two further taxes are scheduled to be abolished, with mortgage duty and duty on the transfer of core business assets to be abolished by 2011. The rate of mortgage duty will be halved from 0.4% to 0.2% from 1 January 2008 with full abolition on 1 January 2009.
The savings to Queenslanders from the abolition of these nine taxes has already risen from $290 million in 2005-06 to $465 million in 2007-08 and will rise to almost $1.2 billion per year by 2011-12. The cost to revenue from the abolition of these taxes will be almost $5 billion over this seven year period.
The Australian Government is also seeking the abolition of duty on the transfer of non-residential real property. The Queensland Government has not made a commitment to abolishing this duty. Abolishing this duty would result in a significant reduction in budget capacity at a time when the Queensland Government is committed to increasing the level of services provided to Queenslanders, particularly in areas such as health, disability services and child safety, and is also undertaking a record capital works program to provide the water and transport infrastructure required to support Queensland’s growing population. Further, the Queensland Government is concerned the abolition of duty on non-residential property transfers would be inequitable to purchasers of residential property at a time when home purchasers are facing significant affordability constraints.
| | | | | | |
| | Budget Strategy and Outlook 2007-08 | | 91 |
Estimates of state revenue
Chart 5.3 indicates the composition of estimated state tax revenue for the 2007-08 year.
Chart 5.3
Taxation by tax category
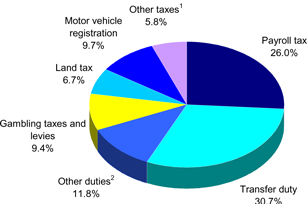
Note:
| 1. | ‘Other taxes’ includes the fire levy, community ambulance cover, guarantee fees and other minor taxes. |
| 2. | ‘Other duties’ includes vehicle registration duty, insurance duty, mortgage duty and other minor duties. |
The largest sources of taxation revenue are payroll tax and transfer duty, which together represent over half of the State’s total taxation revenue in 2007-08.
Payroll tax (26% of total tax revenue in 2007-08) has a solid base with relatively stable growth driven by the underlying strength in the state economy. In contrast, revenue growth from transfer duty (representing 30.7% of tax revenue) can vary significantly from year to year with its base being subject to the volatile movements of the property market.
Other duties, including vehicle registration duty, insurance duty, mortgage duty and other smaller duties, represent 11.8% of total tax revenue. This proportion will decline as duties are abolished in accordance with the Government’s schedule of tax abolitions.
Land tax represents 6.7% of total revenue in 2007-08. While also subject to the volatility of price movements in the property market, this impact is moderated by a relatively stable base and the effect of three-year averaging of land values for assessments.
Gambling taxes and levies represent 9.4% of tax revenues in 2007-08. Motor vehicle registration, which is classified as a tax for budget purposes, represents 9.7% of total tax revenue.
Payroll tax
Payroll tax is chargeable at a rate of 4.75% when the total yearly Australian taxable wages of an employer, or those of a group of related employers, exceed the exemption threshold of $1 million.
| | | | | | |
| 92 | | Budget Strategy and Outlook 2007-08 | | |
Payroll tax collections are estimated to increase by 10.9% in 2007-08, reflecting general growth in employment and wages, with particular strength in key industries, such as construction, mining and property and business services.
The payroll tax rate has been reduced in recent years from 5% to its current level of 4.75%, making Queensland’s payroll tax rate overall the lowest of any state. Further, an employer paying annual taxable wages of less than $1 million from 2006-07 is not liable for payroll tax – this is amongst the highest thresholds in Australia.
Duties
Duties are levied on a range of financial and property transactions. Overall, revenue from duties is forecast to increase by 13.4% in 2007-08. This is largely driven by increased revenues from transfer and mortgage duty arising from the continued strength in housing and non-residential property transactions. This growth will be partially offset by the phased abolition of mortgage duty, with a 50% rate reduction from 1 January 2008.
The major duties include transfer, mortgage, vehicle registration and insurance duties.
| • | | Transfer duty is charged at various rates on the transfer of real and business property. The Queensland Government offers extensive concessions for the transfer of land where the property is purchased as a first or subsequent home. |
Revenue from transfer duty is expected to grow by 16% in 2007-08 as a result of the continued strength of the Queensland property market. Recent years have seen a shift in the composition of the base from owner-occupiers to residential investment and commercial property purchases, as a result of the substantial concessions provided to those buying their own home. A tight rental market, for both commercial and residential property, is expected to continue to support the growth in these segments of the revenue base.
| • | | Mortgage duty is currently levied at a rate of 0.4% of the total amount secured by the mortgage and will reduce to 0.2% from 1 January 2008. |
Revenue from mortgage duty is estimated to fall by 13% in 2007-08, with the rate reduction during the year more than offsetting the strong underlying growth, driven by continued strength in the property market. Mortgage duty will be fully abolished from 1 January 2009.
| • | | Vehicle registration duty is currently charged at the rate of 2% of the dutiable value of a motor vehicle on the transfer or initial registration of the motor vehicle. As set out above, the rate of duty will increase from 1 January 2008. |
Revenue from vehicle registration duty is expected to experience underlying growth of 7% in 2007-08. Combined with the additional revenue from increased duty rates, total growth is expected to be 35.1%.
| | | | | | |
| | Budget Strategy and Outlook 2007-08 | | 93 |
| • | | Insurance duty is charged on contracts of general, life insurance and accident insurance. The base rate for most general insurance products is 7.5%, with certain general insurance products, life insurance and accident insurance charged at the rate of 5%. |
Revenue from insurance duty is expected to grow by 7.4% in 2007-08, reflecting growth in the number of insurance policies and the value of insured items.
Gambling taxes and levies
A range of gambling activities are subject to State taxes and levies. Total gambling tax and levy collections are estimated to increase by 5.1% in 2007-08. Gaming machine taxes and levies are estimated to increase by 5.4%, lotteries taxes by 5.1%, wagering taxes by 5.7% and other gambling taxes by 4.1%. Gaming machine taxes and levies in 2006-07 were impacted by the complete ban on smoking in venues, which took effect from 1 July 2006, with collections 5.6% lower in 2006-07 than in 2005-06.
Land tax
Land tax is levied on the unimproved value of the landowner’s aggregated holdings of freehold land owned in Queensland as at midnight on 30 June each year. The principal place of residence is deducted from this value.
A 50% cap on the annual increase in land values used for the purposes of calculating land tax liabilities will commence from 1 July 2007 and will be in place for three years.
Resident individuals are generally liable for land tax if the total unimproved value of the freehold land owned by that person as at 30 June is equal to or greater than $500,000, which is to be increased to $600,000 from 1 July 2007. Companies, trustees and absentees are generally liable for land tax if the total unimproved value of the freehold land owned as at 30 June is equal to or greater than $300,000, which is to be increased to $350,000 from 1 July 2007.
Land tax is estimated to grow by 18.9% in 2007-08, with underlying growth of 28.3% being partially offset by the introduction of capping and the increased thresholds.
The application of three-year averaging for assessments, whereby the land value is determined by averaging the unimproved property values for the current and preceding two years rather than simply using the current year valuation, moderates and delays the impact of valuation increases. It is estimated that the revenue foregone as a result of three-year averaging will be approximately $202 million in 2007-08. Queensland was the first state to apply three-year averaging to land tax, with New South Wales also introducing averaging recently.
| | | | | | |
| 94 | | Budget Strategy and Outlook 2007-08 | | |
Motor vehicle registration fees
Motor vehicle registration fees are expected to grow by 4% in 2007-08, reflecting the growth of the vehicle fleet and fee adjustments related to the consumer price index (CPI).
Fire levy
Fire levy revenue, which is used to fund the Queensland Fire and Rescue Authority, is expected to increase in line with the growth of the number of contributors and CPI.
Community Ambulance Cover
The Community Ambulance Cover Scheme was introduced in 2003-04 to replace the Ambulance Subscription Scheme and to provide a sustainable funding base for the Queensland Ambulance Service. It is collected through a payment on non-exempt electricity accounts.
To minimise the impact of the levy, a range of exemptions are provided, including for pensioners, certain farm sheds and water pumps, religious bodies and other institutions and government. Additional exemptions were provided in November 2003 for certain common and multiple accounts for commercial and residential buildings, security lighting and public parks, hot water systems and electricity accounts relating to a medical condition.
Growth in 2007-08 reflects CPI adjustment and growth in the number of non-exempt electricity accounts.
Guarantee fees
Guarantee fees are revenues collected by Queensland Treasury Corporation (QTC) on behalf of the State and comprise performance dividends, competitive neutrality fees and credit margin fees. These fees promote competitive neutrality between public sector agencies and those in the private sector and ensure that the benefits accruing from the financial backing and superior borrowing performance of the State (through QTC) are shared between the borrower and the State.
Other taxes
Revenue from other taxes includes the Statutory Insurance Scheme Levy, the Nominal Defendant Levy and other sundry taxes.
| | | | | | |
| | Budget Strategy and Outlook 2007-08 | | 95 |
Tax expenditures
Taxation expenditures are reductions in tax revenue that result from the use of the taxation system as a policy tool to deliver Government policy objectives. Taxation expenditures are provided through a range of concessions, including tax exemptions, reduced tax rates, tax rebates, tax deductions and provisions which defer payment of a tax liability to a future period. Appendix A provides details of tax expenditure arrangements set in place by the Queensland Government.
QUEENSLAND’S COMPETITIVE TAX STATUS
Taxation can impact on business decisions regarding investment and employment and household investment and home ownership. Maintaining the competitiveness of Queensland’s tax system provides a competitive advantage to business and moderates the tax burden for its citizens and is therefore fundamental to the Government’s commitment to job creation and economic development.
Recent tax changes have sought to improve the efficiency and equity of the State’s tax system, increase consistency with other jurisdictions, strengthen the funding base of essential services and reduce or eliminate taxes to the benefit of taxpayers.
In pursuit of these objectives over recent years, the Government has:
| • | | rationalised the payroll tax system by reducing the rate from 5% to 4.75%, offset by a broadening of the tax base |
| • | | increased the payroll tax threshold from $850,000 to $1,000,000 |
| • | | provided land tax exemptions to moveable dwelling parks and expanded the principal place of residence exemption |
| • | | introduced the Community Ambulance Cover to secure the funding base for the Queensland Ambulance Service, while minimising the impact through a range of exemptions |
| • | | extended the transfer duty concession for purchases of first homes from $80,000 (with the concession phasing out at $160,000) to $320,000 (with the concession phasing out at $500,000) |
| • | | extended the mortgage duty exemption threshold for first home buyers from $100,000 to $250,000 |
| • | | provided a transfer duty concession for first home buyers purchasing vacant land valued at up to $150,000 (with the concession phasing out at $300,000) on which to build their first home |
| • | | extended the transfer duty home concession from $250,000 to $320,000 |
| • | | reduced the base insurance duty rate from 8.5% to 7.5% |
| | | | | | |
| 96 | | Budget Strategy and Outlook 2007-08 | | |
| • | | increased some transfer duty rates to assist the funding of the Health Action Plan |
| • | | abolished transfer duty on quoted marketable securities, credit card duty, debits tax, lease duty, credit business duty, hire duty and unquoted marketable securities duty. |
Consistent with this commitment to ongoing tax reform, the Government has announced in this Budget:
| • | | land tax relief, via increased thresholds and the introduction of a 50% cap on the annual increase in the value of land for the purposes of calculating land tax liability. The cap will apply for three years from 1 July 2007 |
| • | | a payroll tax harmonisation package to ensure greater consistency between jurisdictions, which will be implemented from 1 July 2008 |
| • | | a continued commitment to abolish mortgage duty and duty on the transfer of core business assets |
| • | | changes to vehicle registration duty rates. |
The Charter of Social and Fiscal Responsibility commits the Government to maintaining competitive tax levels in relation to other states. Table 5.7 demonstrates that this commitment is being met, with various measures of tax competitiveness all indicating the Queensland state tax system remains amongst the most competitive in Australia.
Table 5.7
Queensland’s tax competitiveness
| | | | | | | | | | | | | | | | | | |
| | | QLD | | NSW | | VIC | | WA | | SA | | TAS4 | | ACT | | NT4 | | Avg5 |
Taxation per capita1 ($) | | 2,226 | | 2,510 | | 2,229 | | 2,614 | | 2,037 | | 1,559 | | 2,640 | | 1,735 | | 2,357 |
Taxation effort2 (%) | | 85.2 | | 102.8 | | 101.9 | | 104.5 | | 114.0 | | 96.9 | | 105.9 | | 102.7 | | n/a |
Taxation % of GSP3 (%) | | 4.06 | | 4.98 | | 4.67 | | 4.36 | | 4.74 | | 4.09 | | 4.01 | | 3.08 | | 4.70 |
Notes:
| 1. | 2007-08 data. Sources: QLD, VIC, WA, NT State Budgets, NSW, SA, TAS, ACT Mid Year Reviews/Budget Updates. |
| 2. | 2005-06 data. Source: Commonwealth Grants Commission: 2007 Update. |
Revenue raising effort ratios, assessed by the Commonwealth Grants Commission, isolate policy impacts from revenue capacity impacts and are an indicator of the extent to which the governments burden their revenue bases. Queensland’s tax revenue raising effort is well below the Australian policy standard (equal to 100%).
| 3. | 2005-06 data. Sources: ABS 5506.0 and ABS 5220.0. |
| 4. | Low taxation per capita reflects the lower revenue raising capacity of those jurisdictions. |
| 5. | Weighted average of states and territories, excluding Queensland. |
| | | | | | |
| | Budget Strategy and Outlook 2007-08 | | 97 |
As Table 5.7 shows, taxation per capita in Queensland is lower than the average taxation per capita in the other states. However, the gap has narrowed in recent years as strong economic growth in Queensland has resulted in significant increases in employment, leading to growth in payroll tax, and property values and volumes, leading to growth in transfer duty, land tax and mortgage duty.
Other measures of competitiveness, such as taxation effort and taxation as a share of GSP, provide a clearer view of the level of taxation imposed on the Queensland economy, highlighting the fact that Queensland’s tax rates are highly competitive with other states.
Chart 5.4 provides further evidence that increases in taxation per capita are the result of strong economic growth, rather than changes to taxation policy. The chart shows that, since 1999-2000, there have been six years in which taxes were cut, with the most significant of these being the land tax reforms of 2005-06. There were two years in which taxes were increased (the Community Ambulance Cover levy was introduced in 2003-04 and transfer duty rates were increased in 2006-07 to help fund the Health Action Plan) and a further two years in which there were no net changes to taxes.
Chart 5.4
Revenue impact of recent tax initiatives
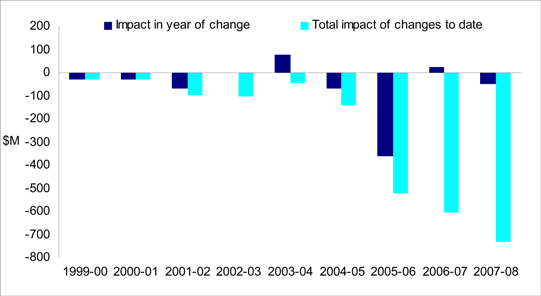
The net impact of these changes is that the level of taxation in 2007-08 is $732 million, or $176 per capita, lower than it would have otherwise been.
| | | | | | |
| 98 | | Budget Strategy and Outlook 2007-08 | | |
GRANTS AND SUBSIDIES
Current grants and subsidies comprise revenues from the Australian Government, grants from the community and industry and other miscellaneous grants. The growth rate of 6.8% in 2007-08 is primarily due to an increase in Australian Government capital grants, particularly one-off grants for road and water projects.
Table 5.8
Grants and subsidies1
| | | | | | |
| | | 2005-06
Actual $ million | | 2006-07 Est. Act. $ million | | 2007-08 Budget $ million |
Current grants and subsidies | | | | | | |
Australian Government grants | | 12,364 | | 12,980 | | 13,314 |
Other grants and contributions | | 591 | | 404 | | 412 |
Total current grants and subsidies | | 12,955 | | 13,384 | | 13,726 |
| | | |
Capital grants and subsidies | | | | | | |
Australian Government grants | | 627 | | 802 | | 1,418 |
Other grants and contributions | | — | | 9 | | 10 |
Total capital grants and subsidies | | 627 | | 811 | | 1,428 |
| | | |
Total grants and subsidies | | 13,582 | | 14,195 | | 15,154 |
Note:
| 1. | Numbers may not add due to rounding. |
Australian Government payments
Australian Government payments to Queensland comprise:
| • | | general purpose payments, comprised of GST revenue grants and associated payments. National Competition Policy payments were also provided by the Australian Government up to 2005-06. General purpose payments are ‘untied’ and are used for both recurrent and capital purposes |
| • | | specific purpose payments (SPPs), including grants for health, education and transport, which are used to meet Australian Government and shared policy objectives. |
Australian Government payments to Queensland in 2007-08 are expected to total $14.7 billion, an increase of $950 million or 6.9% over payments in 2006-07. Chapter 8 provides more detailed background on Commonwealth-state financial arrangements.
| | | | | | |
| | Budget Strategy and Outlook 2007-08 | | 99 |
Table 5.9
Australian Government payments1
| | | | | | |
| | | 2005-06
Actual $ million | | 2006-07 Est. Act. $ million | | 2007-08 Budget $ million |
General Purpose Payments | | | | | | |
GST Revenue Grants and associated payments2 | | 7,773 | | 8,053 | | 8,384 |
National Competition Policy Payments | | 179 | | — | | — |
Total General Purpose Payments | | 7,952 | | 8,053 | | 8,384 |
| | | |
Specific Purpose Payments3, 4 | | | | | | |
Health | | 1,838 | | 1,969 | | 2,044 |
Education, Training and the Arts | | 1,757 | | 2,000 | | 1,986 |
Local Government, Planning, Sport and Recreation | | 315 | | 330 | | 319 |
Housing | | 188 | | 194 | | 196 |
Treasury | | 126 | | 199 | | 99 |
Disability Services Queensland | | 293 | | 323 | | 349 |
Main Roads | | 275 | | 455 | | 703 |
Other5 | | 249 | | 259 | | 653 |
Total Specific Purpose Payments | | 5,039 | | 5,729 | | 6,348 |
| | | |
Total Australian Government Payments | | 12,991 | | 13,782 | | 14,732 |
Notes:
| 1. | Numbers may not add due to rounding. |
| 2. | Includes compensation for GST deferral relating to the Australian Government’s small business measures in 2005-06 and 2006-07 and a residual adjustment amount in 2005-06. |
| 3. | SPPs are shown below by relevant Queensland Government department. Figures for 2005-06 and 2006-07 have been backcast to reflect current departmental responsibilities. |
| 4. | Differences between SPPs in this chapter and Australian Government Budget estimates can arise and generally reflect the outcome of agency-to-agency discussions or the absence of state level information. |
| 5. | Includes one-off funding of $408 million towards the Western Corridor Recycled Water project in 2007-08. |
General purpose payments
GST revenue grants
GST revenue grants and associated payments to Queensland in 2007-08 are expected to be $8.384 billion, which represents an increase of $331 million (or 4.1%) on 2006-07. This reflects 4.2% growth in GST payments, partly offset by the expectation that compensation for GST deferral relating to the Australian Government’s small business measures will not be required.
GST revenue projections are based on expected growth in economic parameters, such as household consumption and dwelling investment, which have a strong link to the GST base. The distribution of GST revenues is based on the recommendations of the Commonwealth Grants Commission in accordance with the application of horizontal fiscal equalisation principles.
| | | | | | |
| 100 | | Budget Strategy and Outlook 2007-08 | | |
The 4.2% growth in GST payments to Queensland in 2007-08 compares with 6.2% average growth in GST payments to the other states and territories. The below-average growth in GST funding to Queensland takes into account the above-average growth in Queensland’s economy and the associated growth in own-source revenue.
Specific purpose payments
SPPs for Queensland in 2007-08 are estimated at $6.348 billion, an increase of 10.8% from 2006-07.
Queensland Health
Queensland receives funding for public hospitals and other health services from the Australian Government under the Australian Health Care Agreement (AHCA). The AHCA provides the majority of Queensland Health’s Australian Government funding and is adjusted annually for population growth, increases in cost and utilisation of hospitals. The 2003-2008 AHCA commenced on 1 July 2003. Queensland will receive almost $1.8 billion in 2007-08 in Health Care Grants under the current Agreement.
Queensland Health will also receive tied funding of $165 million in 2007-08 for a range of programs including Highly Specialised Drugs, Essential Vaccines and National Public Health. Queensland will also receive $59 million for nursing home benefits.
Department of Education, Training and the Arts
SPPs for education purposes comprise recurrent and capital grants for distribution to state and non-state schools and other organisations. A slight decrease in Australian Government grants in 2007-08 reflects a decline in funding for capital projects resulting from the conclusion of the Investing In Our Schools program, and is partially offset by increased recurrent grants, which recognise cost indexation and enrolment growth.
The Australian Government also provides funding for a range of specific vocational education and training programs. In 2007-08, the Department expects to receive around $220 million in vocational education and training funding, consistent with 2006-07.
Department of Main Roads
Funding is received from the Australian Government for infrastructure and maintenance works on the National Network and for Black Spot Road Safety projects. The 2007-08 allocation reflects road works programmed under the Australian Government’s AusLink program.
Disability Services Queensland
The current Commonwealth-State and Territory Disability Agreement is set to expire on 30 June 2007. A new agreement is in the process of being negotiated between the Australian and state and territory governments.
| | | | | | |
| | Budget Strategy and Outlook 2007-08 | | 101 |
Disability Services Queensland will also receive funding from the Australian Government for the Home and Community Care (HACC) program, with the State Government recently accepting a new agreement. The HACC Review Agreement coupled with projected growth funding ensures the program is a key part of the community care system and will continue to assist frail older people and those with disabilities to live as independently as possible in their own homes.
Department of Local Government, Planning, Sport and Recreation
SPPs to the Department of Local Government, Planning, Sport and Recreation primarily relate to Financial Assistance Grants provided to local government in Queensland.
Department of Housing
In 2007-08, the Department of Housing will receive $196 million in SPPs including $195 million under the current Commonwealth-State Housing Agreement covering the period 2003-2008. The Budget estimate for 2007-08 represents a slight increase against estimated payments in 2006-07 reflecting growth funding built into the 2003-2008 Agreement. This funding will be used for the continued development of a core social housing sector to assist people unable to access alternative suitable housing options through the delivery of affordable, appropriate, flexible and diverse housing assistance responses that provide people with choice and are tailored to their needs, local conditions and opportunities.
Queensland Treasury
Treasury receives payments from the Australian Government for joint Commonwealth-state natural disaster relief measures, concessions for pensioner concession card holders and compensation for foregone revenue on the establishment of the Australian Securities Commission.
Other
The increase in other SPPs in 2007-08 reflects the Australian Government’s commitment to provide $408 million towards the Western Corridor Recycled Water project.
Other grants and contributions
Other grants and contributions are funds received from other state and local government agencies, other bodies and individuals where there is no direct benefit to the provider. Contributions exclude Australian Government grants and user charges. The main sources of contributions are:
| • | | those received from private enterprise and community groups to fund research projects and community services, including the contributions of parents and citizens associations to state schools |
| • | | contributed assets and goods and services received for a nominal amount. |
| | | | | | |
| 102 | | Budget Strategy and Outlook 2007-08 | | |
Table 5.10
Other grants and contributions
| | | | | | |
| | | 2005-06
Actual $ million | | 2006-07 Est. Act. $ million | | 2007-08 Budget $ million |
Other grants and contributions | | 591 | | 413 | | 421 |
Revenues will vary from year to year based on the number and size of research projects, assets transferred between the Government and the private sector and contributed assets and services.
SALES OF GOODS AND SERVICES
Sales of goods and services revenue comprises cost recoveries from the provision of goods or services. Revenue from this source is expected to increase by 2.3% in 2007-08.
Table 5.11
Sales of goods and services1
| | | | | | |
| | | 2005-06 Actual $ million | | 2006-07 Est. Act. $ million | | 2007-08 Budget $ million |
Fee for service activities | | 1,022 | | 1,208 | | 1,185 |
TransLink | | 200 | | 222 | | 235 |
Rent revenue | | 293 | | 315 | | 375 |
Sale of land inventory | | 69 | | 73 | | 93 |
Hospital fees | | 227 | | 259 | | 263 |
Transport and traffic fees | | 202 | | 202 | | 193 |
Other sales of goods and services | | 573 | | 659 | | 661 |
Total sales of goods and services | | 2,586 | | 2,937 | | 3,005 |
Note:
| 1. | Numbers may not add due to rounding. |
Fee for service activities
Major items of fee for service activities across the General Government sector include:
| • | | recoverable works carried out by both the Department of Main Roads and the commercialised arm of the department |
| • | | fees charged by Technical and Further Education (TAFE) colleges |
| • | | fees charged by CITEC for information and telecommunications services to the private sector. |
| | | | | | |
| | Budget Strategy and Outlook 2007-08 | | 103 |
The Government provides concessions in the form of discounts, rebates and subsidies to improve access to and the affordability of a range of services for individuals or families based on eligibility criteria relating to factors such as age, income and special needs or disadvantage. Appendix B provides details of the concession arrangements set in place by the Queensland Government.
TransLink
Revenues arise from the arrangements associated with TransLink integrated ticketing and public transport arrangements, which commenced in July 2004. Instead of subsidising public transport operators for the gap between operating costs and revenues, the TransLink entity collects revenues from the operation of public transport services in South East Queensland to fund public transport services in the region. These revenues are estimated at $235 million in 2007-08.
Rent revenue
Rent revenue is earned on the rent or lease of Government buildings, housing, plant and equipment, motor vehicles and car parks. Major items under this category include public housing rentals and rents charged for Government buildings.
Sale of land inventory
Sale of land inventory comprises land sales undertaken by agencies, where the buying and selling of land is a core business activity of the agency, such as the Property Services Group under the Department of Infrastructure. As such, it is distinct from property disposals undertaken by most Government agencies.
Hospital fees
Hospital fees are collected by public hospitals for a range of hospital services. Fees include those received from private patients and other third party payers, as well as payments received from the Australian Government Department of Veterans’ Affairs for the treatment of veterans.
Transport and traffic fees
This category comprises state transport fees, the Traffic Improvement Fee, drivers’ licence fees and various marine licence and registration fees.
Other sales of goods and services
Other sales of goods and services includes items such as Title Registration Fees, recreational ship registrations and other licences and permits.
| | | | | | |
| 104 | | Budget Strategy and Outlook 2007-08 | | |
INTEREST INCOME
Interest income primarily comprises interest earned on the Treasurer’s Cash Balances, Queensland Future Growth Fund balances and investments held to finance future employee entitlements, for example superannuation and long service leave.
Table 5.12
Interest income
| | | | | | |
| | | 2005-06
Actual $ million | | 2006-07 Est. Act. $ million | | 2007-08 Budget $ million |
Interest income | | 3,414 | | 3,268 | | 2,190 |
Queensland Treasury Corporation manages the State’s short-term investments, such as the Treasurer’s Cash Balances, while Queensland Investment Corporation manages the State’s long-term investments, primarily employee entitlement provisions (including assets held to meet employer superannuation liabilities). The State’s investment portfolio includes a diversified holding of equities, property and fixed interest.
Chart 5.5 shows investment return rates achieved over time.
Chart 5.5
Investment returns (% per annum)1,2
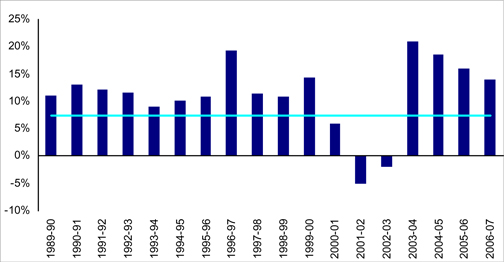
Note:
| 1. | Line represents actuarial assumed long term average. |
| 2. | 2006-07 is an estimate. |
Source: 1989-90 to 2006-07: Queensland Investment Corporation
With respect to investments held to meet employer superannuation liabilities, the State has, during the course of 2006-07, continued to effect an orderly reduction in its equity holdings (from 80% to 60% of the strategic asset allocation) and further diversified its portfolio.
| | | | | | |
| | Budget Strategy and Outlook 2007-08 | | 105 |
While the previous asset allocation was appropriate in the context of managing very long term liabilities, the introduction of the Accumulation Scheme option for State employees and the actuarial surplus in the superannuation fund resulting from the strong performance of equity markets has presented an opportunity to alter the asset allocation.
The strong performance of domestic and international equity markets positively impacted interest income in 2006-07, with an estimated rate of return of 14%. This estimate is based on actual year-to-date investment returns at the time of the finalisation of the Budget. Interest income in 2007-08 is based on investment returns achieving the assumed long term average earnings rate of 7.5%.
OTHER REVENUE
Other revenue comprises dividends, tax equivalent payments, royalties, fines and forfeitures and other sundry revenues. Other revenue is expected to decrease in 2007-08, largely due to an expected reduction in tax equivalent payments. Tax equivalent payments were abnormally high in 2006-07 as a result of the sale of ENERGEX’s electricity and gas retail businesses, the Allgas distribution network and the competitive parts of Ergon Energy’s electricity retail business including Ergon Energy’s subsidiary, Powerdirect.
Table 5.13
Other revenue1
| | | | | | |
| | | 2005-06 Actual $ million | | 2006-07 Est. Act. $ million | | 2007-08 Budget $ million |
Dividends | | 642 | | 742 | | 915 |
Tax equivalents | | 415 | | 1,120 | | 201 |
Royalties and land rents | | 1,532 | | 1,410 | | 1,436 |
Fines and forfeitures | | 185 | | 210 | | 212 |
Revenue nec | | 331 | | 300 | | 167 |
Total Other Revenue | | 3,105 | | 3,781 | | 2,931 |
Note:
| 1. | Numbers may not add due to rounding. |
Dividends
Dividends are received from the State’s equity in Public Non-financial Corporations and Public Financial Corporations, for example, the Queensland electricity supply industry, Queensland Investment Corporation, port authorities and Queensland Rail.
Dividends are expected to increase by 23.3% in 2007-08, driven by increases in both the energy and transport sectors.
| | | | | | |
| 106 | | Budget Strategy and Outlook 2007-08 | | |
Table 5.14
Dividends1
| | | | | | |
| | | 2005-06 Actual $ million | | 2006-07 Est. Act. $ million | | 2007-08 Budget $ million |
Energy sector | | 462 | | 393 | | 517 |
Transport sector (rail and ports) | | 136 | | 186 | | 366 |
Other2 | | 45 | | 163 | | 32 |
Total Dividends | | 642 | | 742 | | 915 |
Notes:
| 1. | Numbers may not add due to rounding. |
| 2. | Includes dividends from Forestry Plantations Queensland, Golden Casket Corporation, Queensland Investment Corporation, Queensland Lotteries Corporation and SunWater. |
Dividend revenue from public enterprises is a function of both net operating profits and dividend payout ratios.
The dividend payout ratio recommended by the boards of Government-owned corporations does not impact on the capacity and requirement of these entities to carry out necessary maintenance and repairs and asset replacement (via provision for depreciation). Dividends are paid after providing for such costs. The dividend payout ratio for 2006-07 and the assumption on which the 2007-08 Budget and forward estimates are based, for those Government-owned corporations that pay dividends, is generally 80% of net operating profit after tax. Shareholding Ministers also consider the circumstances of individual Government-owned corporations and the advice of their boards before arriving at a final determination.
In total, dividends account for 2.8% of total General Government revenue in 2007-08.
Tax equivalent payments
Tax equivalent payments comprise payments by Government-owned corporations in lieu of state and Australian Government taxes and levies from which they are exempt. These payments arise from an agreement reached between the Australian Government and state governments in 1994 to establish a process for achieving tax uniformity and competitive neutrality between public sector and private sector trading activities.
Tax equivalent payments in 2006-07 are significantly impacted by the tax equivalence implications of the sale of ENERGEX’s electricity and gas retail businesses, the Allgas distribution network and the competitive parts of Ergon Energy’s electricity retail business including its subsidiary, Powerdirect.
| | | | | | |
| | Budget Strategy and Outlook 2007-08 | | 107 |
Table 5.15
Tax equivalent payments1
| | | | | | |
| | | 2005-06 Actual $ million | | 2006-07 Est. Act. $ million | | 2007-08 Budget $ million |
Energy sector | | 120 | | 1,033 | | 120 |
Transport sector (rail and ports) | | 23 | | 44 | | 49 |
Other | | 272 | | 42 | | 32 |
Total Tax Equivalent Payments | | 415 | | 1,120 | | 201 |
Notes:
| 1. | Numbers may not add due to rounding. |
Royalties and land rents
The State earns royalties from the extraction of coal, base and precious metals, bauxite, petroleum, mineral sands and other minerals and land rents from pastoral holdings, mining and other leases. Royalties return some of the proceeds for the extraction of non-renewable resources to the community.
Coal royalties make up the bulk of royalty and land rent revenue, having increased significantly in recent years as a result of substantial increases in the value of coal produced in Queensland. Royalties from base and precious metals have also increased significantly, with strong global demand for commodities also causing substantial increases in the value of metals such as copper and zinc.
Estimates of mining royalties are based predominantly on forecasts of production compiled by the Department of Mines and Energy, using information provided by mining companies. Price estimates are broadly consistent with those published by the Australian Bureau of Agricultural and Resource Economics.
Royalty revenue is expected to remain at high levels in 2007-08 due to growth in the volume of coal exports to meet strong overseas demand, despite reductions in contract prices for coking coal.
There is a significant degree of uncertainty associated with estimates of commodity prices and Australian dollar-US dollar exchange rates, both of which have significant impacts on royalty revenue. Further discussion of the risks associated with the royalty estimates, including a sensitivity analysis, is provided in Appendix C.
| | | | | | |
| 108 | | Budget Strategy and Outlook 2007-08 | | |
Table 5.16
Royalties and land rents1
| | | | | | |
| | | 2005-06 Actual $ million | | 2006-07 Est. Act. $ million | | 2007-08 Budget $ million |
Coal | | 1,161 | | 1,000 | | 1,020 |
Other royalties2 | | 332 | | 368 | | 368 |
Land rents | | 40 | | 42 | | 48 |
Total royalties and land rents | | 1,532 | | 1,410 | | 1,436 |
Notes:
| 1. | Numbers may not add due to rounding. |
| 2. | Includes base and precious metal, petroleum and other minerals royalties. |
Fines and forfeitures
The major fines included in this category are traffic and court fines. There is an expected increase of 1% in collections of fines and forfeitures in 2007-08.
Revenue nec
Revenue nec includes other revenues not elsewhere classified. The decrease in 2007-08 primarily reflects an expected decline in asset transfers from non-Queensland Government entities.
| | | | | | |
| | Budget Strategy and Outlook 2007-08 | | 109 |
FEATURES
| • | | Total General Government sector expenses are expected to increase by $2.118 billion (or 7%) over the estimated actual for 2006-07, to $32.282 billion in 2007-08. |
| • | | Growth in expenses includes a range of service developments and initiatives with a particular focus on the areas of health, disability services, housing, child safety and education and training. |
| • | | The major areas of expenditure are health and education, which together constitute approximately 47% of General Government sector expenses. |
INTRODUCTION
This chapter provides an overview of General Government sector expenses for the estimated actual outcome for 2006-07, forecasts for the 2007-08 Budget year and projections for 2008-09 to 2010-11. The forward estimates are based on the economic projections outlined in Chapter 2 and are formulated on a no policy change basis.
The Ministerial Portfolio Statements provide details of expenditure for individual departments.
Table 6.1
General Government sector expenses1
| | | | | | | | | | | | |
| | | 2006-07 Budget
$ million | | 2006-07 Est. Act.
$ million | | 2007-08 Budget
$ million | | 2008-09 Projection
$ million | | 2009-10 Projection
$ million | | 2010-11 Projection
$ million |
Expenses | | | | | | | | | | | | |
Gross operating expenses | | | | | | | | | | | | |
Employee expenses | | 13,324 | | 13,229 | | 14,271 | | 15,281 | | 16,190 | | 16,983 |
Other operating expenses | | 5,844 | | 6,587 | | 6,424 | | 6,348 | | 6,399 | | 6,571 |
Depreciation | | 1,754 | | 1,780 | | 2,015 | | 2,244 | | 2,264 | | 2,377 |
Superannuation interest | | 563 | | 716 | | 745 | | 781 | | 813 | | 842 |
Other interest | | 222 | | 218 | | 390 | | 660 | | 958 | | 1,145 |
Current transfers | | 6,094 | | 6,477 | | 6,761 | | 6,980 | | 6,977 | | 7,130 |
Capital transfers | | 1,024 | | 1,157 | | 1,676 | | 762 | | 763 | | 718 |
Total Expenses | | 28,825 | | 30,164 | | 32,282 | | 33,056 | | 34,364 | | 35,766 |
Note:
| 1. | Numbers may not add due to rounding. |
| | | | | | |
| 110 | | Budget Strategy and Outlook 2007-08 | | |
General Government expenses in 2006-07 are estimated to be $30.164 billion, an increase of $1.339 billion over the 2006-07 Budget forecast of $28.825 billion. This increase is primarily due to:
| • | | expensing of Tugun Bypass construction costs related to that part of work being undertaken in New South Wales |
| • | | increased Vegetation Management program expenditure and additional drought assistance provided to primary producers |
| • | | implementation of a Redress Scheme for former child residents of institutions |
| • | | additional expenditure on the Government’s WaterWise rebate schemes |
| • | | actuarial revisions to superannuation |
| • | | additional expenditure to match increases in specific purpose grants from the Australian Government and other own source revenues. |
The General Government operating statement provides for aggregate expenses of $32.282 billion in 2007-08, representing an increase of $2.118 billion (or 7%) over the 2006-07 estimated actual. Factors influencing the growth in expenses include the implementation of service enhancements and initiatives outlined in Chapter 4.
EXPENSES BY OPERATING STATEMENT CATEGORY
This section provides a breakdown of General Government expenses in 2007-08 by category and discusses the significant variances between 2006-07 estimated actual and 2007-08 Budget by expense category.
Chart 6.1 indicates that the single largest expense category in the General Government sector is employee expenses (44.2%), reflecting the direct service provision nature of Government activities, followed by current transfers (20.9%) that include community service obligation payments to Government-owned corporations (GOCs) and the fuel subsidy scheme.
| | | | | | |
| | Budget Strategy and Outlook 2007-08 | | 111 |
Chart 6.1
Expenses by operating statement category, 2007-08
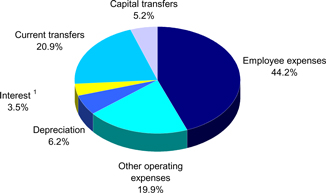
Note:
| 1. | Includes superannuation interest expense. |
Chart 6.2 compares the 2006-07 estimated actual expenses for each operating statement category with the 2007-08 Budget.
Chart 6.2
Expenses by operating statement category
2006-07 and 2007-08

Note:
| 1. | Includes superannuation interest expense. |
| | | | | | |
| 112 | | Budget Strategy and Outlook 2007-08 | | |
DETAILS OF EXPENSES
Employee expenses
Employee expenses include salaries and wages, annual leave, long service leave and superannuation expense. Superannuation expense represents the current service cost or the increase in the present value of the State’s defined benefit obligation resulting from employee service in the current period.
Employee expenses are forecast to increase by $1.042 billion or 7.9% to $14.271 billion in 2007-08. The increase reflects a combination of wage increases related to recent enterprise bargaining agreements and other services’ growth and enhancements.
The additional staffing provided in the 2007-08 Budget is predominantly in key service delivery areas, including 192 additional teachers and teacher aides to meet enrolment growth in Queensland state schools and to support students with disabilities, 250 additional ambulance officers across the State and 200 additional sworn police positions by October 2008. In addition, as part of the Health Action Plan, the Government committed to recruiting an additional 300 doctors, 500 nurses and 400 allied health professionals. As at 6 May 2007 an additional 1,036 doctors, 3,157 nurses and 1,126 allied health professionals and scientists have been recruited.
Other operating expenses
Other operating expenses comprise the non-labour costs of providing goods and services, repairs and maintenance, consultancies, contractors, electricity, communications and marketing.
Other operating expenses are expected to decline moderately to $6.424 billion in 2007-08, reflecting various one-off outlays in 2006-07, including additional expenditure under Natural Disaster Relief Arrangements as a result of Cyclone Larry and the implementation of the Redress Scheme for former child residents of institutions.
Depreciation
Depreciation expense is an estimate of the progressive consumption of the State’s assets through normal usage, wear and tear and obsolescence. Growth in this expense category primarily reflects asset revaluations and additions to the asset base.
Queensland’s depreciation expense as a percentage of fixed assets is generally higher than that of other states, reflecting a more conservative provision for asset replacement. Although this results in lower operating surpluses, over time it will lead to a younger asset base. It is also more sustainable by making available larger amounts of funding from recurrent sources to finance capital expenditure.
| | | | | | |
| | Budget Strategy and Outlook 2007-08 | | 113 |
Current and capital transfers
Current transfers include grants and subsidies to the community (such as schools, hospitals, benevolent institutions and local governments) and personal benefit payments. Current transfers to non-government recipients represent grants to non-government organisations and householders. Funding includes support for non-government health care providers, organisations servicing the community in partnership with government in the family support, disability, youth and childcare sectors. Community service obligations (CSOs) are provided where GOCs are required to provide non-commercial services or services at non-commercial prices for the benefit of the community.
Increases in CSO payments to GOCs are a contributing factor to an estimated increase in current transfer payments of $284 million or 4.4% in 2007-08 (see Table 6.2).
Higher CSO payments reflect funding to Queensland Rail for additional track and rollingstock throughout Queensland as part of the South East Queensland Infrastructure Plan and Program (SEQIPP). They are also the result of expected increases in the cost of electricity due to drought-related water supply constraints restricting the electricity generation capacity and increases in network charges flowing from significant network capital expenditure across the State to strengthen and improve the distribution network.
Capital transfers represent grants to GOCs, local governments, non-profit institutions and other non-government entities, such as households and businesses for capital purposes.
Capital transfer payments to GOCs in 2007-08 represents funding for the Western Corridor Recycled Water Project in south east Queensland. The Western Corridor Recycled Water Project involves the construction of pipelines from six wastewater treatment plants in Brisbane and Ipswich to three advanced water treatment plants for treatment and transfer of purified recycled water to end users.
| | | | | | |
| 114 | | Budget Strategy and Outlook 2007-08 | | |
Table 6.2 indicates the composition of transfer payments by recipient.
Table 6.2
Current and capital transfers1
| | | | |
| | | 2006-07 Est. Act. $ million | | 2007-08 Budget $ million |
Current | | | | |
Fuel Subsidy Scheme | | 525 | | 541 |
Grants to local government | | 480 | | 424 |
Grants to non-government schools | | 1,459 | | 1,563 |
Grants to non-profit organisations | | 868 | | 954 |
Grants to other non-government recipients | | 1,666 | | 1,593 |
Payments to GOCs | | 1,479 | | 1,686 |
Total current transfers | | 6,477 | | 6,761 |
| | |
Capital | | | | |
First Home Owner Grant Scheme | | 221 | | 243 |
Grants to local government | | 525 | | 582 |
Grants to non-profit organisations | | 31 | | 70 |
Grants to other non-government recipients | | 381 | | 373 |
Payments to GOCs | | — | | 408 |
Total capital transfers | | 1,157 | | 1,676 |
| | |
Total current and capital transfers | | 7,634 | | 8,437 |
Note:
| 1. | Numbers may not add due to rounding. |
Interest
The superannuation interest expense represents the imputed interest on the Government’s accruing defined benefit superannuation liability. In determining the State’s defined benefit superannuation liabilities, AASB119 Employee Benefits requires the discounting of future benefit obligations using yield rates on government bonds net of investment tax, estimated at 5.6%.
The other interest expense includes interest paid on borrowings to acquire capital assets and infrastructure such as roads and government buildings. The growth in this expense over the forward estimates reflects growth in borrowings for capital asset acquisitions, including new infrastructure investment as part of SEQIPP. However, interest expense will only rise to 3.2% of total operating expenses by the end of the forward estimates period.
| | | | | | |
| | Budget Strategy and Outlook 2007-08 | | 115 |
OPERATING EXPENSES BY PURPOSE
Chart 6.3
General Government expenses by purpose, 2007-08
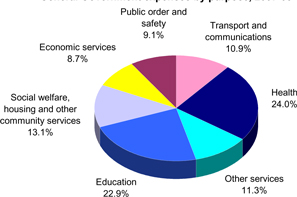
Chart 6.3 indicates the proportion of expenditure by major purpose classification for the 2007-08 Budget. Health accounts for the largest share of expenses (24%) followed by Education (23%) and Social welfare, housing and other community services (13%).
In 2007-08, expenditure on Social welfare, housing and other community services has increased in comparison to other major purpose classifications as a result of grants for the Western Corridor Recycled Water Project and significant additional funding for disability services, housing and child safety.
Chart 6.4
General Government expenses by purpose
2006-07 and 2007-08
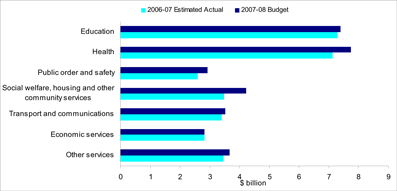
| | | | | | |
| 116 | | Budget Strategy and Outlook 2007-08 | | |
As evidenced in the chart above, expenditure increases in all key service delivery areas from 2006-07 estimated actual to 2007-08 Budget.
The Government’s Charter of Social and Fiscal Responsibility sets out the Government’s priorities for delivering high quality services and improving the quality of life for Queenslanders. The Government has consistently had a clear focus on improving key service areas such as education, health, public order and safety and community services. The Queensland Government’s focus on these areas since 1998-99 can be seen in the following chart.
Chart 6.5
General Government expenses by purpose
Growth from 1998-99 to 2007-08
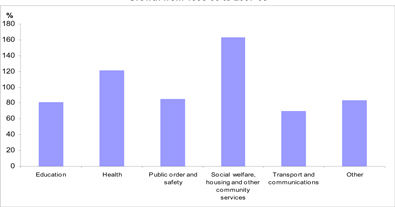
Source: Queensland Treasury’s data supplied to ABS.
Education
The State’s investment in education has been steadily growing since 1998. This investment has improved the individual opportunities for students and benefited the State as a whole by supporting productivity growth.
In order to provide a framework for investing in skills and innovation, in 1998 the Government developed the Smart State Strategy. This strategy is now in its second phase and continues to drive economic growth by improving the quality of, and access, to education and training across the State.
| | | | | | |
| | Budget Strategy and Outlook 2007-08 | | 117 |
The 81.3% ($3.320 billion) growth delivered in this area since 1998 encompasses primary, secondary and tertiary education and technical and further education. Specifically, initiatives are delivering a reduction in class sizes, secondary pathways reforms and improvements in opportunities for Aboriginal and Torres Strait Islander students. Early years of schooling have also been reformed with the introduction of the Prep Year, first introduced on a trial basis and then implemented State-wide in 2007.
The three-year SmartVET initiative and the more recent Queensland Skills Plan have set out the Government’s strategy for learning programs to support the high skills needs of growth industries, professionals and new technologies. The Government, in partnership with industry and employers, has worked to modernise the apprenticeship system, ensure the VET system is better targeted to economic needs and provide more flexible training options. The Queensland Skills Plan aims to provide an additional 17,000 trade training places each year and an additional 14,000 higher level training places each year by 2010.
Other initiatives that have contributed to the growth in education expenditure include:
| • | | the introduction of Queensland Academies, giving senior students the opportunity to excel in science, maths, technology and the creative arts |
| • | | the Tomorrow’s Schools package, which provides funding for projects to modernise and refurbish Queensland schools |
| • | | investment in TAFE infrastructure to modernise and provide new facilities across the State. |
Health
Since 1998, the total growth in the health function within the Queensland Government has been 121.5% ($4.249 billion). Spending by Queensland Health now amounts to $7.151 billion in 2007-08 and is expected to grow to $8.207 billion by 2010-11.
The Government’s Health Action Plan, first released in 2005, has provided a blueprint for reform of the health system. The initial package included a total investment of $6.367 billion over five years. This investment has now increased to $11.4 billion, and has focused on:
| • | | increasing the number of medical professionals by providing additional places for medical students, employing more interns and attracting qualified medical staff to Queensland. As at 6 May 2007, 1,036 extra doctors and 3,157 extra nurses were appointed, well above respective targets of 300 and 500 |
| • | | improving rural health services by recruiting and retaining further medical professionals for remote areas |
| • | | the provision of new services and maintenance to emergency departments to deal with increasing presentation rates |
| | | | | | |
| 118 | | Budget Strategy and Outlook 2007-08 | | |
| • | | ensuring adequate and targeted investment in health services infrastructure, such as hospital refurbishments and community health centres |
| • | | increasing transparency and accountability through the Health Quality and Complaints Commission |
| • | | improving quality of and access to mental health services throughout the State |
| • | | the development of an enhanced capacity to plan for future service delivery. |
The Queensland Health 2007-08 Budget continues to drive health reform in Queensland through initiatives including the provision of enhanced clinical education and training for the health workforce, the implementation of an e-Health strategy, patient transport reforms and enhanced outpatient service delivery.
Public order and safety
Public order and safety includes funding to police, legal services and law courts, fire protection, prisons and corrective services. Contributing to the 85.6% ($1.348 billion) growth in public order spending since 1998 have been consistent increases in police numbers that have maintained the police to population ratio at or above the national average, as well as additional allocations relating to infrastructure. Funding has been provided for the planning and construction of new courthouse facilities, and for the expansion and redevelopment of prison infrastructure such as Townsville Correctional Centre.
In addition, law enforcement services have benefited from the implementation of new information and communications technologies, such as:
| • | | the Public Safety Network, which establishes a common ICT network for the Departments of Police, Corrective Services and Justice and Attorney-General |
| • | | QPRIME, which provides a means to effectively manage the increasing volume of information used by operational police. |
Social welfare, housing and other community services
The continuously strong growth in Social welfare, housing and community services expenditure is a reflection of a range of policy initiatives designed to respond to issues relating to child safety, community support and housing shortages. Over the last few years, several essential reforms to child protection have been instigated, including upgrades to therapeutic and alternative care, suspected child abuse and neglect teams, and the accelerated increase of frontline staffing.
A number of initiatives have been implemented to address the social housing needs, including the purchase and construction of additional dwellings for the Public Housing and Aboriginal and Torres Strait Islander Housing rental programs, and the construction of new shelters under the Crisis Accommodation program. Since 1998-99, housing assistance has increased by 95%.
| | | | | | |
| | Budget Strategy and Outlook 2007-08 | | 119 |
Since 1998-99, the investment in disability services has grown by over 200%. This expenditure has been directed towards enhancing respite services for carers, reducing the number of young people living in nursing homes, implementing the Disability Services Act 2006 and strengthening the capacity of non-government organisations to provide disability services.
This function also includes expenditure relating to families, communities and the environment, all of which have benefited from being part of key budget priorities in recent years. In total, the area of Social welfare, housing and community services has experienced a 163% ($2.612 billion) growth in expenditure since 1998.
Transport and communications
The Government is taking action to address urban congestion and is investing heavily in infrastructure and services. The South East Queensland Infrastructure Plan and Program details the Government’s commitment to providing new infrastructure. Chapter 4 outlines current transport and road initiatives funded in the 2007-08 Budget.
Spending in this area has experienced a total growth of 70.1% ($1.451 billion) since 1998. This funding has supported the development of transport and road projects including provision of funding to Queensland Rail to provide Citytrain services, freight transport in and out of South East Queensland and high-quality connections between the region’s key activity centres. A major focus for the Government is to encourage people to travel in alternative, non-car modes of transport. Public transport patronage in South East Queensland increased by approximately 12% in 2005-06 from the previous year, six times the growth rate prior to the introduction of TransLink. Other initiatives to reduce congestion include the implementation of fare equalisation for all regional urban bus services, higher frequency services, the upgrade of bus stops, the introduction of wheelchair accessible taxis into small rural and regional communities and disability compliant bus and ferry infrastructure across regional centres.
Road safety issues have also been addressed, with the development of an action plan based on the recommendations of the Queensland Road Safety Summit of February 2006. This includes changes to driver licence requirements and the investigation of further speed enforcement technologies.
Details of 2007-08 initiatives and service developments are provided in Chapter 4.
DEPARTMENTAL EXPENSES
Data presented in Tables 6.3 and 6.4 provide a summary drawn from financial statements contained in the Ministerial Portfolio Statements reports. Further information on the composition of expenses, outputs delivered and factors influencing the movement in expenses can be obtained from individual Ministerial Portfolio Statements.
| | | | | | |
| 120 | | Budget Strategy and Outlook 2007-08 | | |
Table 6.3
Departmental Controlled Expense 1,2
| | | | |
| | | 2006-07 Est.
Actual $’000 | | 2007-08
Estimate $’000 |
Aboriginal and Torres Strait Islander Policy (ceased 13 September 2006) | | 12,077 | | — |
Child Safety | | 496,720 | | 551,260 |
Communities | | 514,181 | | 596,915 |
Corrective Services | | 423,818 | | 487,018 |
Disability Services Queensland | | 624,781 | | 1,081,758 |
Education, Training and the Arts | | 5,549,458 | | 6,021,884 |
Electoral Commission of Queensland | | 22,926 | | 11,819 |
Emergency Services | | 770,615 | | 849,349 |
Employment and Industrial Relations | | 187,446 | | 205,715 |
Employment and Training (ceased 13 September 2006) | | 231,647 | | — |
Environmental Protection Agency | | 311,934 | | 332,239 |
Forestry Plantations Queensland Office | | 34,572 | | 37,655 |
Health | | 6,814,658 | | 7,151,142 |
Housing | | 580,651 | | 675,820 |
Infrastructure (formerly The Coordinator-General) | | 83,765 | | 57,767 |
Justice and Attorney-General | | 271,749 | | 302,409 |
Legislative Assembly | | 65,969 | | 67,131 |
Local Government, Planning, Sport and Recreation | | 585,046 | | 629,603 |
Main Roads | | 1,592,382 | | 1,495,475 |
Mines and Energy | | 89,615 | | 96,226 |
Natural Resources and Water | | 813,594 | | 608,546 |
Office of the Governor | | 4,548 | | 4,443 |
Office of the Ombudsman | | 6,075 | | 6,194 |
Office of the Public Service Commissioner | | 10,155 | | 12,480 |
Police | | 1,296,260 | | 1,437,088 |
Premier and Cabinet | | 114,010 | | 128,876 |
Primary Industries and Fisheries | | 365,610 | | 332,515 |
Public Works | | 377,422 | | 431,212 |
Queensland Audit Office | | 31,021 | | 30,821 |
State Development | | 203,964 | | 230,886 |
The Public Trustee of Queensland | | 56,425 | | 61,461 |
Tourism, Fair Trading and Wine Industry Development | | 62,933 | | 67,992 |
Transport | | 2,118,209 | | 2,335,181 |
Treasury | | 220,351 | | 152,190 |
Total Expenses | | 24,944,587 | | 26,491,070 |
Notes:
| 1. | Total expenses by department does not equate to total general government expenses in Government Finance Statistics (GFS) terms reported elsewhere in the Budget Papers as GFS General Government expenses include a wider range of entities including State Government statutory authorities and also transactions eliminated between entities within the General Government sector (for example payroll tax payments) are excluded in the preparation of whole-of-Government GFS financial statements. |
| 2. | Explanation of variations in departmental controlled expenses can be found in individual agency Ministerial Portfolio Statement documents. |
| | | | | | |
| | Budget Strategy and Outlook 2007-08 | | 121 |
Table 6.4
Departmental Administered Expense 1,2
| | | | |
| | | 2006-07 Est. Actual $’000 | | 2007-08 Estimate
$’000 |
Communities | | 154,487 | | 149,354 |
Education, Training and the Arts | | 1,784,650 | | 1,814,099 |
Health | | 11,040 | | 16,209 |
Housing | | 1,500 | | .. |
Infrastructure (formerly The Coordinator-General) | | 16,166 | | 15,619 |
Justice and Attorney-General | | 148,462 | | 151,807 |
Local Government, Planning, Sport and Recreation | | 347,098 | | 328,792 |
Mines and Energy | | 386,530 | | 488,153 |
Natural Resources and Water | | 12,488 | | 14,851 |
Police | | 744 | | 405 |
Premier and Cabinet | | 112,501 | | 110,167 |
Primary Industries and Fisheries | | 22,706 | | 29,589 |
Public Works | | 20,196 | | 20,262 |
State Development | | 1,882 | | 1,915 |
The Public Trustee of Queensland | | 1,694 | | 1,745 |
Tourism, Fair Trading and Wine Industry Development | | 51,857 | | 49,823 |
Transport | | 1,720 | | 750 |
Treasury 3 | | 1,576,319 | | 2,553,550 |
Total Expenses | | 4,652,040 | | 5,747,090 |
Notes:
| 1. | Total expenses by department does not equate to total general government expenses in Government Finance Statistics (GFS) terms reported elsewhere in the Budget Papers as GFS General Government expenses include a wider range of entities including State Government statutory authorities and also transactions eliminated between entities within the General Government sector (for example payroll tax payments) are excluded in the preparation of whole-of-Government GFS financial statements. |
| 2. | Explanation of variations in departmental administered expenses can be found in individual agency Ministerial Portfolio Statement documents. |
| 3. | In its capacity as manager of the State’s finances, Treasury borrows on behalf of the Government. The increase in the 2007-08 estimate represents interest on additional funds borrowed during 2007-08 to support the expansion of the State’s capital program and the State’s share of superannuation beneficiary payments as per the most recent actuarial investigation. |
| | | | | | |
| 122 | | Budget Strategy and Outlook 2007-08 | | |
Table 6.5
Reconciliation of Departmental to GFS Expenses 1
| | | | | | | | |
| | | | | 2006-07
Est. Actual $ million | | | 2007-08 Estimate $ million | |
Departmental expenditure per MPS | | - Controlled (Table 6.3) | | 24,945 | | | 26,491 | |
| | - Administered (Table 6.4) | | 4,652 | | | 5,747 | |
| | |
Non-GFS departmental expenses 2 | | 466 | | | (119 | ) |
| | |
Other General Government entities (e.g. CBUs, SSPs, Statutory Bodies) | | 3,266 | | | 3,110 | |
| | |
| | 33,328 | | | 35,229 | |
| | |
Superannuation Interest expense | | 716 | | | 745 | |
| | |
Eliminations and Other whole-of-Government adjustments | | | | | | |
Elimination of payments to CBUs and SSPs | | (2,757 | ) | | (2,765 | ) |
Payroll Tax elimination | | (424 | ) | | (446 | ) |
Other eliminations and adjustments | | (701 | ) | | (481 | ) |
| | |
Total General Government GFS Expenses | | 30,164 | | | 32,282 | |
| 1. | Numbers may not add due to rounding. |
| 2. | Certain expenses such as asset valuation changes are excluded from GFS reporting. In addition, this item removes the effect of cash payments for whole-of-Government schemes such as the State’s share of superannuation beneficiary payments reported in Treasury Administered’s expenses. Costs associated with these schemes are accrued annually. |
| | | | | | |
| | Budget Strategy and Outlook 2007-08 | | 123 |
| 7. | BALANCE SHEET AND CASH FLOWS |
FEATURES
| • | | The Queensland Government’s strong financial position is expected to strengthen further in 2007-08. State net worth is projected to rise by $5.333 billion through the year to $119.799 billion. |
| • | | Net worth is also forecast to increase each year over the forward estimates period, meeting the Government’s commitment in its Charter of Social and Fiscal Responsibility to maintain and seek to increase total State net worth. |
| • | | The General Government sector is well placed to meet all its present and future liabilities. Financial assets are projected to exceed liabilities by $25.073 billion in the General Government sector at 30 June 2008, consistent with the Government’s Charter principles. |
| • | | The General Government sector is estimated to record a cash deficit of $892 million in 2007-08, after allowing for $5.132 billion in net asset purchases. |
INTRODUCTION
The 2007-08 balance sheet shows the projected assets, liabilities and net worth of the General Government sector as at 30 June 2008. It is important for the Government to maintain a strong balance sheet to provide it with the stability, flexibility and capacity to deal with any emerging financial and economic pressures.
The assets and liabilities in the balance sheet are defined according to the Australian Bureau of Statistics Government Finance Statistics (GFS) standard.
Detailed balance sheet and cashflow information for the General Government sector and the rest of the public sector is contained in Chapter 9.
BALANCE SHEET
Table 7.1 provides a summary of the key balance sheet measures for the General Government sector.
| | | | | | |
| 124 | | Budget Strategy and Outlook 2007-08 | | |
Table 7.1
General Government sector: Summary of budgeted balance sheet1
| | | | | | | | | | | | | | | | | | |
| | | 2006-07 Budget2 $ million | | | 2006-07 Est. Act. $ million | | | 2007-08 Projection $ million | | | 2008-09 Projection $ million | | | 2009-10 Projection $ million | | | 2010-11 Projection $ million | |
Financial assets | | 48,801 | | | 57,072 | | | 59,857 | | | 62,895 | | | 66,107 | | | 69,340 | |
Non-financial assets | | 80,543 | | | 87,592 | | | 94,726 | | | 100,725 | | | 106,852 | | | 112,888 | |
Total Assets3 | | 129,344 | | | 144,665 | | | 154,583 | | | 163,620 | | | 172,959 | | | 182,228 | |
Borrowings and advances | | 4,419 | | | 3,742 | | | 7,158 | | | 11,499 | | | 15,769 | | | 19,844 | |
Superannuation liability | | 19,369 | | | 19,194 | | | 20,368 | | | 21,518 | | | 22,605 | | | 23,696 | |
Other provisions and liabilities | | 6,524 | | | 7,263 | | | 7,257 | | | 7,301 | | | 7,513 | | | 7,747 | |
Total Liabilities | | 30,312 | | | 30,198 | | | 34,784 | | | 40,318 | | | 45,887 | | | 51,287 | |
Net Worth | | 99,032 | | | 114,466 | | | 119,799 | | | 123,302 | | | 127,072 | | | 130,941 | |
Net Financial Assets | | 18,489 | | | 26,874 | | | 25,073 | | | 22,577 | | | 20,220 | | | 18,054 | |
Net Debt | | (21,014 | ) | | (26,423 | ) | | (24,709 | ) | | (21,889 | ) | | (19,372 | ) | | (17,234 | ) |
Notes:
| 1. | Numbers may not add due to rounding. |
| 2. | Numbers have been restated where subsequent changes in classification have occurred. |
| 3. | For GFS purposes, the State’s assets are classed as either financial or non-financial assets. |
Financial assets
The General Government sector holds the full equity of the State’s public enterprises, principally its shareholding in Government-owned corporations, in much the same manner as the parent or holding company in a group of companies. The estimated net investment in public enterprises ($25.179 billion at 30 June 2008) is included in the General Government sector’s financial assets1.
In the year to 30 June 2008, financial assets are projected to increase by $2.785 billion, attributable principally to increased investment in assets set aside to meet future employee liabilities and higher investment in the State’s public enterprises. This is partially offset by a decline in the tax equivalent receivables resulting from the sale of ENERGEX’s electricity and gas retail business, the Allgas distribution network and the competitive parts of Ergon Energy’s electricity retail business including Powerdirect.
1 | Some credit rating agencies and analysts set aside the equity investment in public enterprises in assessing net financial assets. Their view is that as these investments are held for policy purposes and are not readily realisable they cannot, in practice, be used to offset liabilities. |
| | | | | | |
| | Budget Strategy and Outlook 2007-08 | | 125 |
Financial assets of $57.072 billion are forecast for 2006-07, or $8.271 billion higher than originally budgeted, reflecting the impact of stronger earnings on investments during the year. At the time of the 2006-07 Budget, investment earnings were based on the long-term rate of return of 7.5 %. Strong performance in investments in 2006-07 has resulted in an upward revision of investment returns to 14%. Investment earnings in 2007-08 and the outyears are based on long-term rate of return assumptions.
Chart 7.1 shows projected General Government sector financial assets by category at 30 June 2008. Investments held to meet future liabilities for superannuation and long service leave comprise the major part of the State’s financial assets.
Chart 7.1
Projected General Government financial assets by category at 30 June 2008
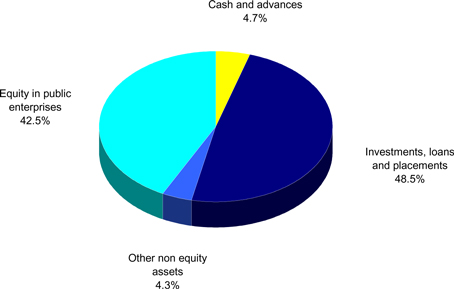
Non-financial assets
General Government non-financial assets are projected to total $94.726 billion at 30 June 2008. The majority of these non-financial assets are roads, schools, hospitals and other infrastructure used to provide services to Queenslanders. Other non-financial assets held by the State include intangibles (mainly computer software and licences), inventories and land.
| | | | | | |
| 126 | | Budget Strategy and Outlook 2007-08 | | |
Changes in non-financial assets occur for a number of reasons including:
| • | | construction and purchase of assets, either to replace existing assets or provide additional capacity for the State to deliver services |
| • | | revaluations of infrastructure assets required under accounting standards |
| • | | depreciation and disposals of assets. |
Non-financial assets in the year ending 30 June 2008 are expected to grow by $7.134 billion. Of this increase, $3.045 billion represents the net acquisition of non-financial assets as part of the Government’s capital program.
The Government has traditionally funded new infrastructure at levels well beyond that of the other states. General Government purchases of non-financial assets per capita have far exceeded the average of the other states and territories for well over a decade (see Chart 3.3 of Chapter 3).
Liabilities
The largest accruing liability in the General Government sector is employee entitlements (principally superannuation and long service leave) which are projected to total $25.311 billion at 30 June 2008. Other liabilities include borrowings and advances received.
Liabilities are budgeted to increase by $4.586 billion in 2007-08, largely on account of increased borrowing to support the State’s capital program and growth in the General Government superannuation liability.
State public sector superannuation liabilities include defined benefit liabilities for current employees and the balance of former scheme members (retirement, resignation etc) who choose to retain their funds within QSuper.
The proportion of the State’s total superannuation liability relating to former scheme members is expected to increase over the forward estimates period as these investment balances grow and new public sector employees join the accumulation fund, as opposed to the defined benefit fund.
As a result of the planned capital program, Treasury is expected to borrow for the first time since 2000-01. While borrowings have been budgeted for several years, the strong cash position of the State has meant borrowings have not been required.
Over the Budget and forward estimates period, total additional General Government borrowings and advances of $16.014 billion are planned. Of this amount, some $1.95 billion (including $885 million in 2007-08) is to fund equity injections to Queensland’s Government-owned corporations to support expansion of the State’s energy and rail infrastructure, with the remainder required to fund infrastructure projects in the General Government sector.
| | | | | | |
| | Budget Strategy and Outlook 2007-08 | | 127 |
Other non-equity liabilities include payables, unearned revenue and other liabilities excluding borrowings and provisions.
The composition of the General Government sector’s liabilities is illustrated in Chart 7.2.
Chart 7.2
Projected General Government liabilities by category at 30 June 2008
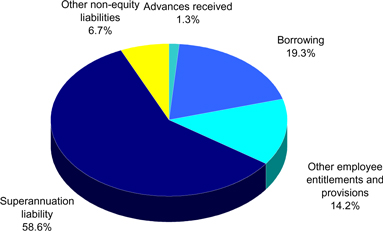
Net financial assets
The net financial assets (net financial worth) measure is an indicator of financial strength. Net financial assets are defined as financial assets less all existing and accruing liabilities. Financial assets include cash and deposits, advances, financial investments, loans, receivables and equity in public enterprises.
The net financial assets measure is broader than the alternative measure, net debt, which measures only cash, advances and investments on the assets side and borrowings and advances on the liabilities side. As it is more comprehensive, the net financial assets measure is more appropriate in an accrual accounting framework.
The net financial assets of the General Government sector for 2007-08 are forecast at $25.073 billion, indicating that the State is well able to meet all its current and recognised future obligations, without recourse to material adjustments in fiscal policy settings.
This position is consistent with the principle in the Government’s Charter of Social and Fiscal Responsibility that the State’s financial assets cover all accruing and expected future liabilities of the General Government sector.
| | | | | | |
| 128 | | Budget Strategy and Outlook 2007-08 | | |
Based on current projections, the General Government sector will continue to meet the commitment in the Government’s Charter to ensure that financial assets cover all accruing and expected future liabilities in all years through to 30 June 2011. The level of net financial assets reduces in future years reflecting the State’s increased borrowings to fund the purchase of infrastructure assets (which are not included in the calculation of net financial assets).
Queensland has consistently pursued sound long term fiscal policies such as the full funding of employee superannuation entitlements. The strong balance sheet and high levels of liquidity in the General Government sector clearly demonstrate the success of these policies.
Queensland’s level of liquidity is well in excess of other states as illustrated in Chart 7.3.
Chart 7.3
Projected ratio of financial assets to liabilities
(excluding investments in public enterprises) at 30 June 2008
General Government sector
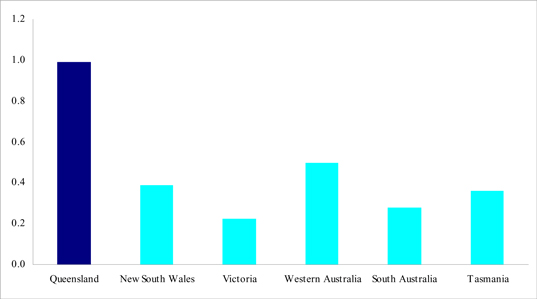
Source: State Budget Papers for QLD, VIC and WA. Mid Year Reviews/Budget Updates for NSW, SA and TAS.
| | | | | | |
| | Budget Strategy and Outlook 2007-08 | | 129 |
Net worth
The Charter of Social and Fiscal Responsibility specifically requires the Government to maintain and seek to increase total State net worth.
The net worth, or equity, of the State is the amount by which the State’s assets exceed its liabilities (which is equivalent to General Government net worth). This is the value of the investment held on behalf of the people of Queensland by public sector instrumentalities.
Changes in the State’s net worth occur for a number of reasons including:
| • | | operating surpluses (deficits) that increase (decrease) the Government’s equity |
| • | | revaluation of assets and liabilities as required by accounting standards. Some financial liabilities are revalued on a regular basis. For example, the Government’s accruing liabilities for employee superannuation and long service leave are determined by actuarial assessments |
| • | | movements in the net worth of the State’s investments in the Public Non-financial Corporations and Public Financial Corporations sectors |
| • | | gains or losses on disposal of assets. Government agencies routinely buy and sell assets. Where the selling price of an asset is greater (less) than its value in an agency’s accounts, the resultant profit (loss) affects net worth. |
Net worth of the General Government sector in 2006-07 of $114.466 billion is forecast. This exceeds growth forecasts in the 2006-07 Budget by $15.434 billion primarily as a result of the flow through of significantly higher net worth in the 2005-06 outcome ($8.647 billion) and greater than anticipated increases in assets as a result of revaluations of major assets in 2006-07.
Net worth is forecast to grow by $5.333 billion to $119.799 billion in 2007-08. This is due to the General Government’s operating surplus and increases in assets as a result of revaluations of major assets as part of the State’s asset revaluation cycle. During the year the Departments of Main Roads, Natural Resources and Water, and Housing will carry out major revaluations.
Chart 7.4 shows the State’s strong net worth compared with the other states and territories. Queensland’s per capita net worth is 55% greater than the average per capita net worth of the other states.
| | | | | | |
| 130 | | Budget Strategy and Outlook 2007-08 | | |
Chart 7.4
Interjurisdictional comparison of projected per capita net worth at 30 June 2008
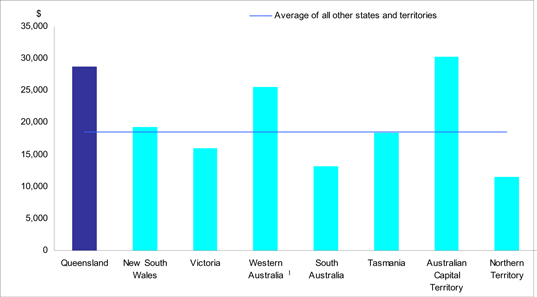
Note:
| 1. | Western Australia values land under roads as part of its overall asset base. This has been adjusted to allow comparison with other jurisdictions which do not value land under roads. |
Source: State Budget Papers for QLD, VIC, WA and NT. Mid Year Reviews/Budget Updates for NSW, SA, TAS and ACT. Population data from Australian Government Budget Paper No.3, 2007-08.
Net debt
Net debt is the difference between gross debt and financial assets (less equity in public enterprises and non-equity assets). The extent of accumulated net debt is currently the most common measure used to judge the overall strength of a jurisdiction’s fiscal position. High levels of net debt impose a call on future revenue flows to service that debt and meeting these payments can limit Government flexibility to adjust outlays. Excessive net debt can call into question the ability of Government to service that debt.
As shown in Table 7.2, the Queensland General Government sector has negative net debt, that is, a surplus of financial assets over financial liabilities, in comparison to other states. This indicates the strength of Queensland’s financial position relative to the other states.
Queensland’s negative net debt of $5,931 per capita, compares to the weighted average net debt of $517 per capita in the other states. Queensland has had negative net debt in the General Government sector for many years.
| | | | | | |
| | Budget Strategy and Outlook 2007-08 | | 131 |
Table 7.2
Projected net debt per capita at 30 June 2008
| | | | | | | | | | | | | | | |
| | | QLD | | | NSW | | VIC | | WA | | | SA | | TAS | |
Net debt per capita ($) | | (5,931 | ) | | 834 | | 864 | | (900 | ) | | 274 | | (744 | ) |
Source: State Budget Papers for QLD, VIC and WA. Mid Year Reviews/Budget Updates for NSW, SA and TAS.
Population data from Australian Government Budget Paper No.3, 2007-08.
CASH FLOWS
The cash flow statement provides information on the Government’s estimated cash flows from its operating, financing and investing activities.
The cash flow statement records estimated cash payments and cash receipts and hence differs from accrued revenue and expenditure recorded in the operating statement. In particular, the operating statement often records revenues and expenses that do not have an associated cash flow (for example, depreciation expense). The timing of recognition of accrued revenue or expense in the operating statement may differ from the actual cash disbursement or receipt (for example, tax equivalents). A reconciliation between the cash flows from operations and the operating statement is provided later in this chapter.
The cash flow statement also records cash flows associated with investing and financing activities that are otherwise reflected in the balance sheet. For example, purchases of capital equipment are recorded in the cash flow statement and impact on the balance sheet through an increase in physical assets.
The cash flow statement provides the cash surplus (deficit) measure which is comprised of the net cash flow from operating activities plus the net cash flow from investment in non-financial assets (or physical capital). This measure is also used to derive the Loan Council Allocation nomination, provided in Chapter 9.
A cash surplus of $1.722 billion is forecast in 2006-07 for the General Government sector, a revision of $2.518 billion from the 2006-07 Budget. The upward revision is primarily the result of improved net flows from operating activities and offset to some extent by increased expenditure on the capital program.
The cash result is forecast to move into deficit in 2007-08 and the outyears. The cash deficit for 2007-08 is $892 million.
Apart from the cash impact of smaller recurrent operating surpluses relative to 2006-07, the major factor contributing to lower cash results is the planned capital expansion. Total General Government capital purchases of $5.463 billion are budgeted for 2007-08.
| | | | | | |
| 132 | | Budget Strategy and Outlook 2007-08 | | |
Over the period 2007-08 to 2010-11, net additions (i.e. after deducting depreciation and asset sales) to the General Government capital stock of close to $13.196 billion are planned. This substantial investment in additional capital will impact on the GFS cash result.
Table 7.3 provides summary cash flow information for the General Government sector for 2006-07, 2007-08 and the outyears. Detailed cash flow tables are included in Chapter 9.
Table 7.3
General Government sector: Summary of budgeted cash flows1
| | | | | | | | | | | | | | | | | | |
| | | 2006-07 Budget $ million | | | 2006-07 Est. Actual $ million | | | 2007-08 Budget $ million | | | 2008-09 Projection $ million | | | 2009-10 Projection $ million | | | 2010-11 Projection $ million | |
Cash receipts from operating activities | | 29,890 | | | 32,603 | | | 34,057 | | | 33,884 | | | 35,161 | | | 36,666 | |
| | | | | | |
Cash payments for operating activities | | (27,030 | ) | | (27,034 | ) | | (29,817 | ) | | (30,584 | ) | | (31,808 | ) | | (33,036 | ) |
| | | | | | |
Net cash flow from operating activities | | 2,860 | | | 5,569 | | | 4,240 | | | 3,300 | | | 3,352 | | | 3,630 | |
| | | | | | |
Net cash flows from investing activities | | (5,246 | ) | | (6,055 | ) | | (7,600 | ) | | (7,792 | ) | | (7,696 | ) | | (7,661 | ) |
| | | | | | |
Net cash flows from financing activities | | 1,785 | | | 729 | | | 3,555 | | | 4,259 | | | 4,186 | | | 4,014 | |
| | | | | | |
Net increase/(decrease) in cash held | | (602 | ) | | 242 | | | 195 | | | (234 | ) | | (159 | ) | | (17 | ) |
| | | | | | |
Derivation of GFS cash surplus (deficit) | | | | | | | | | | | | | | | | | | |
| | | | | | |
Net cash flow from operating activities | | 2,860 | | | 5,569 | | | 4,240 | | | 3,300 | | | 3,352 | | | 3,630 | |
| | | | | | |
Payments for investments in non-financial assets | | (3,656 | ) | | (3,847 | ) | | (5,132 | ) | | (5,548 | ) | | (5,650 | ) | | (5,675 | ) |
| | | | | | |
Equals GFS cash surplus (deficit) | | (796 | ) | | 1,722 | | | (892 | ) | | (2,248 | ) | | (2,298 | ) | | (2,045 | ) |
Note:
| 1. | Numbers may not add due to rounding. |
| | | | | | |
| | Budget Strategy and Outlook 2007-08 | | 133 |
Cash flows from operating activities
Table 7.4 provides a disaggregation of operating cash flows.
Table 7.4
General Government sector: Cash flows from operating activities1
| | | | | | | | | |
| | | 2006-07
Budget $ million | | | 2006-07
Est. Act.
$ million | | | 2007-08
Budget $ million | |
| Receipts from operating activities | | | | | | | | | |
| | | |
Taxes received | | 7,870 | | | 8,374 | | | 9,271 | |
Grants and subsidies received | | 13,768 | | | 14,171 | | | 15,029 | |
Sales of goods and services | | 2,993 | | | 3,238 | | | 3,347 | |
Other receipts | | 5,259 | | | 6,820 | | | 6,410 | |
| | | |
Total receipts from operating activities | | 29,890 | | | 32,603 | | | 34,057 | |
| | | |
| Payments for operating activities | | | | | | | | | |
| | | |
Payments for goods and services | | (19,161 | ) | | (18,710 | ) | | (20,448 | ) |
Grants and subsidies | | (7,036 | ) | | (7,352 | ) | | (8,141 | ) |
Interest | | (223 | ) | | (218 | ) | | (391 | ) |
Other payments | | (609 | ) | | (755 | ) | | (838 | ) |
| | | |
Total payments for operating activities | | (27,030 | ) | | (27,034 | ) | | (29,817 | ) |
| | | |
Net cash inflows from operating activities | | 2,860 | | | 5,569 | | | 4,240 | |
Note:
| 1. | Numbers may not add due to rounding. |
Cash inflows from operating activities include receipts from taxes, grants from the Australian Government, fees and charges levied on the provision of goods and services, interest receipts from investments and dividend and tax receipts from Public Non-financial and Financial Corporations.
Taxes received by the General Government sector are forecast at $9.271 billion in 2007-08, an increase of 10.7% or $897 million on the 2006-07 estimated actual of $8.374 billion. This reflects the continued effect of property market activity on transfer duty and land tax revenue, as well as employment and wage growth on payroll tax revenue.
Grants and subsidies receipts are forecast at $15.029 billion in 2007-08, an increase of $858 million or 6% on the 2006-07 estimated actual of $14.171 billion, partly due to funding of $408 million from the Australian Government for the Western Corridor Recycled Water Project in South East Queensland.
| | | | | | |
| 134 | | Budget Strategy and Outlook 2007(08 | | |
Other receipts include investment earnings, dividends and tax equivalents received from Government-owned corporations (GOCs) and royalties. Other receipts are expected to decrease in 2007-08 by $410 million to $6.410 billion. This largely reflects a return to the long-term average earnings rate of 7.5% on investments. Strong performance in equities markets resulted in an upward revision to investment return to 14% in 2006-07. Investment earnings in 2007-08 and the outyears are based on long-term rate of return assumptions. Partially offsetting this decline is an increase in tax equivalent receipts from GOCs.
Cash outflows represent payment for goods and services, wages and salaries, finance costs and grants and subsidies paid to households, businesses and other Government agencies. In 2007-08 the largest cash disbursement is employee expenses at $13.924 billion or 46.7% of total cash payments from operating activities.
In 2007-08, payments for goods and services, including wages and salaries, are expected to increase 9.3% to $20.448 billion. This increase reflects payments pertaining to employer superannuation (accumulation scheme) contributions and State share of superannuation beneficiary payments and increased employee entitlements in line with enterprise bargaining agreements.
Cash payments for grants and subsidies are expected to increase by $789 million or 10.7% in 2007-08 to $8.141 billion. This item includes a $408 million capital grant provided by the Australian Government through the State to assist in the construction of the Western Corridor Recycled Water Project. It further includes recurrent grants paid by the Australian Government through the State to non-state schools, grants paid to industry and grants to non-profit institutions. This item also includes community service obligation payments to the energy sector and Queensland Rail and capital grants which are largely paid to local government authorities to fund capital works.
Other payments mainly comprise personal benefit payments and other transfer payments. This item is estimated to increase by 11% in 2007-08 to $838 million. This is primarily attributable to the implementation of a Redress Scheme for former child residents of State institutions.
| | | | | | |
| | Budget Strategy and Outlook 2007-08 | | 135 |
Cash flows from investments
Cash flows from investments include both financial and non-financial assets. Table 7.5 provides a disaggregation of investment cash flows into the different types.
Table 7.5
General Government sector: Cash Flows from investing activities
| | | | | | | | | |
| | | 2006-07
Budget $ million | | | 2006-07 Est. Act. $ million | | | 2007-08 Budget $ million | |
Net payments for investments in non-financial assets | | (3,656 | ) | | (3,847 | ) | | (5,132 | ) |
| | | |
Net cash flows from investing activities in financial assets for policy purposes | | (318 | ) | | 1,409 | | | (885 | ) |
| | | |
Net cash flows from investing activities in financial assets for liquidity purposes | | (1,272 | ) | | (3,617 | ) | | (1,583 | ) |
| | | | | | | | | |
| | | |
Net increase/(decrease) in cash held from investing activities | | (5,246 | ) | | (6,055 | ) | | (7,600 | ) |
The largest cash disbursement for the Government, outside of recurrent operations, is for investments in non-financial assets. This represents the Government’s capital works program which provides for infrastructure such as schools, hospitals and roads.
Cash outflows from investing in non-financial assets are expected to increase to $5.132 billion in 2007-08 from $3.847 billion in 2006-07, an increase of 33.4%.
The cash expenditure on investment in non-financial assets differs from the estimates of capital works expenditure in Budget Paper No. 3 – Capital Statement. The estimates contained in that paper are on a gross basis and incorporate both departmental agencies and Government-owned corporations. In addition, Budget Paper No. 3 only includes capital expenditure, including capital grants, within Queensland and does not offset proceeds from asset sales.
Apart from investing in new capital expenditure, governments also manage financial assets in order to finance overall expenditures. In addition, Queensland manages financial assets set aside to provide for future employee benefits (for example, superannuation and long service leave). The Government manages its financial assets through a combination of borrowing or investing funds and reducing or increasing equity in government or private sector entities. Investments in financial assets include activities relating to both policy and liquidity.
| | | | | | |
| 136 | | Budget Strategy and Outlook 2007-08 | | |
Investments for policy purposes include net equity injections into Government and other business enterprises and the net cash flow from disposal or return of equity in Government business enterprises.
Cash inflows from investments for policy purposes for 2006-07 of $1.409 billion reflect equity transactions by the General Government sector with Public Non-financial and Financial Corporations. In 2006-07, this includes a $1.7 billion inflow relating to the sale of ENERGEX’s electricity and gas retail business, the Allgas distribution network and the competitive parts of Ergon Energy’s electricity retail business, including Powerdirect. A further inflow resulted from the transfer of Golden Casket Lottery Corporation to Tattersall’s. These inflows were offset to some extent by an injection to Queensland Rail for the South East Queensland Infrastructure Plan and Program, a dividend reinvestment to ENERGEX, funding for the South East Queensland (Gold Coast) Desalination Plant and injections to Tarong Energy Corporation Ltd to support the scale back of power station operating profiles under the Generation Profile Plan (GPP) Mk2.
Cash outflows from investments for policy purposes for 2007-08 of $885 million also reflect equity transactions with public enterprises, in particular additional equity injections to Queensland Rail for the South East Queensland Infrastructure Plan and Program and to Tarong Energy Corporation Ltd for GPP Mk2.
Cash flows from investments for liquidity purposes represent net investment in financial assets such as to cover superannuation and other employee entitlements.
The 2006-07 estimated cash outflows from investments in financial assets for liquidity purposes of $3.617 billion is substantially higher than forecast in the 2006-07 Budget and primarily reflects the increase in interest earnings on investments from 7.5% to 14% and a lower State share of superannuation beneficiary payments. In 2006-07, the State’s share of superannuation beneficiary payments was reduced in line with the funding recommendation outlined in the most recent actuarial investigation.
The reinvestment of interest earnings, investment of contributions set aside for the Government’s defined benefit superannuation scheme and employee entitlements resulted in higher cash outflows for 2006-07. These outflows are partially offset by payments for employee entitlements during the year.
Cash outflows from investments in financial assets for liquidity purposes are estimated to be $1.583 billion in 2007-08. The decline from 2006-07 reflects reinvestment of interest earnings based on the long-term rate of return of 7.5% and a higher State share of superannuation beneficiary payments.
| | | | | | |
| | Budget Strategy and Outlook 2007-08 | | 137 |
Cash flows from financing activities
Cash flows generated from financing activities are outlined in Table 7.6 below.
Table 7.6
General Government sector: Cash flows from financing activities1
| | | | | | | | | |
| | | 2006-07 Budget $ million | | | 2006-07 Est. Act. $ million | | | 2007-08 Budget $ million | |
| | | |
Net cash flows from advances | | (15 | ) | | (15 | ) | | (14 | ) |
| | | |
Net cash flows from borrowing (net) | | 1,800 | | | 743 | | | 3,569 | |
| | | |
Net increase/(decrease) in cash held from financing activities | | 1,785 | | | 729 | | | 3,555 | |
Note:
| 1. | Numbers may not add due to rounding. |
Cash flows from financing activities include cash flows from net borrowing (increase in borrowing less redemption), net advances (gross investment in new loans less redemption of loans issued) and other financing.
In 2006-07 net cash inflows from financing activities are estimated at $729 million. This represents borrowings to increase the State’s capital program.
Cash inflows from financing activities for 2007-08 are estimated at $3.555 billion, reflecting borrowings to partially fund the General Government’s capital program of $5.463 billion.
| | | | | | |
| 138 | | Budget Strategy and Outlook 2007-08 | | |
RECONCILIATION OF OPERATING CASH FLOWS TO THE OPERATING STATEMENT
Table 7.7 provides a reconciliation of the cash flows from operating activities to the operating result for the General Government sector.
Table 7.7
General Government sector: Reconciliation of cash flows
from operating activities to accrual operating activities
| | | | | | | | | |
| | | 2006-07 Budget $ million | | | 2006-07 Est. Act. $ million | | | 2007-08 Budget $ million | |
| GFS accrual revenue | | 29,070 | | | 32,557 | | | 32,551 | |
Plus/(less) movement in tax equivalent and dividend receivables | | 99 | | | (669 | ) | | 742 | |
Plus GST receipts | | 907 | | | 929 | | | 939 | |
Plus/(less) movement in other receivables | | (186 | ) | | (214 | ) | | (175 | ) |
Equals GFS cash receipts | | 29,890 | | | 32,603 | | | 34,057 | |
| | | |
GFS accrual expense | | 28,825 | | | 30,164 | | | 32,282 | |
(Less) non-cash items | | | | | | | | | |
Depreciation and amortisation expense | | (1,754 | ) | | (1,780 | ) | | (2,015 | ) |
Accrued superannuation expense | | (1,586 | ) | | (1,728 | ) | | (1,738 | ) |
Accrued employee entitlements | | (328 | ) | | (334 | ) | | (352 | ) |
Other accrued costs | | (241 | ) | | (600 | ) | | (413 | ) |
Plus Superannuation benefits paid – defined benefit | | 430 | | | 40 | | | 407 | |
Plus/(less) movement in employee entitlement provisions | | 203 | | | 195 | | | 170 | |
Plus/(less) GST paid | | 936 | | | 934 | | | 963 | |
Plus/(less) movement in other provisions and payables | | 545 | | | 143 | | | 513 | |
Equals GFS cash expenditure | | 27,030 | | | 27,034 | | | 29,817 | |
The main difference between the accrual operating statement and the cash flow relates to the timing of cash payments and receipts and their recognition in accrual terms and the inclusion of non-cash expenses and revenues. The largest difference is on the expenses (expenditure) side, with large non-cash expenses associated with depreciation and superannuation. Differences due to the timing of receipt or payment of amounts are recorded as either a receivable or payable in the balance sheet.
| | | | | | |
| | Budget Strategy and Outlook 2007-08 | | 139 |
| 8. | INTERGOVERNMENTAL FINANCIAL RELATIONS |
FEATURES
| • | | Queensland’s share of GST revenue in 2007-08 will be reduced by $166 million because of a downward revision to the State’s assessed relativity. The Commonwealth Grants Commission’s 2007 Update Report recommended the reduction in Queensland’s underlying share of GST largely on account of strong growth in Queensland’s relative capacity to raise transfer duty on property conveyances. |
| • | | The Commonwealth Grants Commission’s latest relativity assessments imply a reduction in Queensland’s share of GST over the next few years, continuing losses in recent years. It is anticipated that by 2010 Queensland will have experienced a cumulative loss in GST funding of more than $1 billion since the 2004 Review of Methodology. |
| • | | Revenue reductions for Queensland from the abolition of business taxes will be $465 million in 2007-08, increasing to nearly $1.2 billion in 2011-12. |
| • | | The abolition of business taxes has contributed to Queensland becoming increasingly reliant on Australian Government funding. Approximately 44% of Queensland’s revenue will be sourced from the Australian Government in 2007-08. |
| • | | While Queensland’s revenue from GST will continue to grow at an annual average rate of 3.1% from 2007-08 to 2010-11, Queensland’s available GST revenue per capita, adjusted for tax reform costs, will decline on average by 1.0% per annum over the same period. This limits the Government’s ability to fund the infrastructure and services required to meet the needs of Queensland’s strong population growth. |
| • | | The Queensland Government provides strong fiscal support to the local government sector. In 2007-08, the Queensland Government will provide $788 million in grants to Queensland local government authorities, comprising 63.4% of grant funding for local government in Queensland. |
| | | | | | |
| 140 | | Budget Strategy and Outlook 2007-08 | | |
COMMONWEALTH-STATE FINANCIAL ARRANGEMENTS
The framework for Commonwealth-state1 financial arrangements includes:
| • | | Intergovernmental Agreement on the Reform of Commonwealth-State Financial Relations (IGA) |
| • | | the Ministerial Council for the Reform of Commonwealth-State Financial Relations (Ministerial Council) |
| • | | the Commonwealth Grants Commission |
| • | | the Australian Loan Council. |
The IGA, Ministerial Council and Commonwealth Grants Commission provide the framework and mechanism for distribution of GST funding to the states, as discussed in Box 8.1.
|
| |
Box 8.1 Framework for Commonwealth-state financial arrangements Intergovernmental Agreement All Australian states signed the Intergovernmental Agreement on the Reform of Commonwealth-State Financial Relations (IGA) in June 1999. The IGA outlines the basis for distributing GST funds to the states and territories, and the Commonwealth Government’s commitments to maintaining Specific Purpose Payments in real terms. Ministerial Council The Ministerial Council for the Reform of Commonwealth-State Financial Relations (Ministerial Council) comprises the Australian Government and state government treasurers and was established in June 1999 to oversee the operation of the IGA. The Ministerial Council meets annually to consider: • recommendations of the Commonwealth Grants Commission, Heads of Treasuries and the Australian Treasurer’s advice regarding estimated payments to states • taxation issues relevant to Commonwealth-state financial relations • Specific Purpose Payments to the states • competition and economic reform matters. Commonwealth Grants Commission The Commonwealth Grants Commission (CGC) advises the Australian Government on the distribution of GST revenue among the states and each year updates the financial, economic and demographic data that underpin its recommendations. Australian Loan Council The Australian Loan Council, which comprises the Australian Government Treasurer and state treasurers, meets annually to endorse Loan Council Allocations put forward by the Australian and state governments. |
1 | In this chapter, the term ‘state’ refers to Australian states and territories |
| | | | | | |
| | Budget Strategy and Outlook 2007-08 | | 141 |
Australian Government funding to states
Commonwealth-state financial relations are characterised by a disparity between the revenue-raising capacity and the expenditure responsibilities of the Australian and state governments respectively. This mismatch is known as vertical fiscal imbalance. The Australian Government collects the major share of taxation revenues and states must rely on grants from the Australian Government to meet their expenditure requirements.
Since the introduction of the Australian Government’s national tax reforms in 2000, states have become more and more dependent on Australian Government funding. Chart 8.1 shows all states’ funding sources for 1999-2000 and 2007-08. In 1999-2000 the states received 35% of their revenues from the Australian Government. This is estimated to increase to 47% in 2007-08. In contrast, the proportion of the states’ revenues from state taxes has declined from 40% in 1999-2000 to an estimated 32% in 2007-08.
Chart 8.1
Revenue sources, all states, 1999-2000 and 2007-081
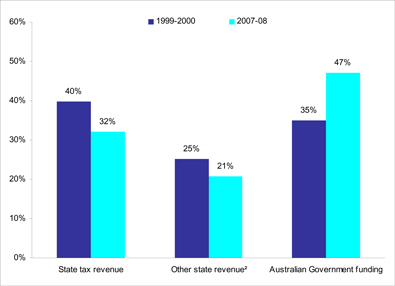
Notes:
| 1. | 2007-08 data are estimates. |
| 2. | Includes user charges, interest earnings, contributions from trading enterprises and mining revenue. |
Source: ABS Government Finance Statistics Cat No. 5512.0 and state and Australian Government Budget Papers.
| | | | | | |
| 142 | | Budget Strategy and Outlook 2007-08 | | |
Table 8.1 shows that Australian Government payments to the states in 2007-08 are expected to total $72.067 billion, an increase of $4.645 billion or 6.9% compared with 2006-07.
Table 8.1
Estimated Australian Government payments to the states, 2006-07 and 2007-081
| | | | | | | | | | |
| | | 2006-07 $ million | | 2007-08 $ million | | Change Nominal Terms % | | Change Real2 Terms % | | Change Real2 Per Capita % |
GST Revenue | | 39,552 | | 41,850 | | 5.8 | | 2.2 | | 0.7 |
Specific Purpose Payments | | | | | | | | | | |
SPPs ‘to’ the States | | 20,627 | | 22,367 | | 8.4 | | 4.8 | | 3.2 |
SPPs ‘through’ the States | | 7,243 | | 7,850 | | 8.4 | | 4.7 | | 3.2 |
Total Specific Purpose Payments | | 27,870 | | 30,217 | | 8.4 | | 4.8 | | 3.2 |
| | | | | |
Total Payments | | 67,422 | | 72,067 | | 6.9 | | 3.3 | | 1.7 |
Notes:
| 1. | Numbers may not add due to rounding. |
| 2. | Deflated by the 2006-07 year average national inflation forecast of 3.5% and Australian population growth of 1.5%. |
Source: Australian Government Budget Paper No.3, 2007-08.
GST revenue from the Australian Government is expected to increase from $39.552 billion in 2006-07 to $41.850 billion in 2007-08, an increase of 5.8% in nominal terms. In real per capita terms, GST is expected to increase by 0.7%.
Total SPPs in 2007-08 are expected to be $30.217 billion. This represents an increase of $2.347 billion, or 8.4% in nominal terms, over 2006-07. Payments to the states will increase by 8.4% in nominal terms, compared with an increase of 8.4% in Specific Purpose Payments (SPPs) “through” the states.
State shares of Australian Government funding
Table 8.2 shows the expected shares of total Australian Government payments to each state for 2007-08 compared with each state’s population share. Queensland’s expected share of total Australian Government funding of 19.9% is marginally more than its population share of 19.8%.
| | | | | | |
| | Budget Strategy and Outlook 2007-08 | | 143 |
Table 8.2
Relative shares of payments to the states, 2007-081
| | | | | | |
| | | Share of
payments % | | Share of
population % | | Relative share2 % |
New South Wales | | 30.0 | | 33.0 | | 91.0 |
Victoria | | 22.2 | | 24.7 | | 89.8 |
Queensland | | 19.9 | | 19.8 | | 100.6 |
Western Australia | | 10.5 | | 10.1 | | 104.5 |
South Australia | | 8.6 | | 7.5 | | 115.0 |
Tasmania | | 3.3 | | 2.3 | | 141.1 |
Australian Capital Territory | | 1.8 | | 1.6 | | 114.4 |
Northern Territory | | 3.6 | | 1.0 | | 357.9 |
Notes:
| 1. | Numbers may not add due to rounding. |
| 2. | A state’s relative share is measured as its funding share as a percentage of its population share. |
Source: Australian Government Budget Paper No.3, 2007-08.
Queensland’s share of Australian Government funding
Table 8.3 details Queensland’s share of estimated Australian Government payments in 2007-08 and the difference from its population share. Queensland expects to receive $90.0 million more than a per capita share of GST revenue. This is offset by the $10.6 million less than a per capita share of total SPP funding Queensland is expected to receive. In terms of total Australian Government funding, Queensland expects to receive $79.4 million more than a per capita share in 2007-08.
Table 8.3
Queensland’s share of estimated Australian Government payments
2007-08
| | | | |
| | | Queensland’s
Share % | | Difference from
Population
Share $ million |
GST Revenues | | 20.0 | | 90.0 |
Specific Purpose Payments | | | | |
SPPs ‘to’ the State | | 19.9 | | 21.0 |
SPPs ‘through’ the State | | 19.4 | | -31.6 |
Total Specific Purpose Payments | | 19.8 | | -10.6 |
Total Australian Government Payments | | 19.9 | | 79.4 |
Source: Australian Government Budget Paper No.3, 2007-08.
| | | | | | |
| 144 | | Budget Strategy and Outlook 2007-08 | | |
Queensland’s reliance on Australian Government funding
Queensland’s reliance on Australian Government funding, as shown in Chart 8.2, is consistent with the national trend, with the share of total funding sourced from the Australian Government rising from 35% in 1999-2000 to an estimated 44% in 2007-08. Meanwhile Queensland’s own-source revenue has fallen from 65% in 1999-2000 to 55% in 2007-08.
Chart 8.2
Revenue sources, Queensland, 1999-2000 and 2007-081
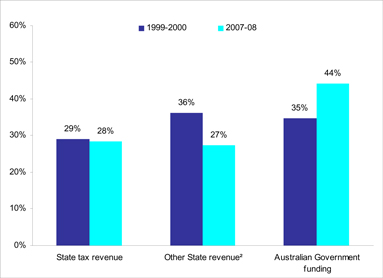
Notes:
| 1. | 2007-08 data are estimates. |
| 2. | Includes user charges, interest earnings, contributions from trading enterprises and mining revenue. |
Source: ABS Government Finance Statistics Cat No. 5512.0 and Queensland Budget estimates.
Queensland’s reliance on Australian Government funding is expected to further increase as planned stamp duty reforms are implemented.
| | | | | | |
| | Budget Strategy and Outlook 2007-08 | | 145 |
DISTRIBUTION OF GST FUNDS
Commonwealth Grants Commission
The Commonwealth Grants Commission (CGC) advises the Australian Government on the distribution of GST revenue among the states. Under its terms of reference the CGC is required to determine its recommendations on the basis of horizontal fiscal equalisation, as detailed in Box 8.2.
|
Box 8.2 Horizontal fiscal equalisation and distribution of GST |
| |
Commonwealth Grants Commission The Commonwealth Grants Commission (CGC) advises the Australian Government on the distribution of GST revenue among the states and each year updates the financial, economic and demographic data that underpin its recommendations. Horizontal Fiscal Equalisation The Australian Government distributes GST revenue to states based on the principle of horizontal fiscal equalisation (HFE), using per capita relativities recommended by the CGC. Queensland supports the principle of HFE and the role of the independent CGC in determining each state’s share of GST revenue. The principle of HFE is that state governments should receive funding from the Australian Government such that, if each made the same effort to raise revenue from its own sources and operated at the same level of efficiency of service delivery, each would have the capacity to provide services to the same standard. A distribution based on HFE principles recognises the different financial capacities of the states, particularly that some states have inherently greater capacity to raise revenue and that some states have inherently greater costs to meet in providing services to an Australian standard. If the distribution of the GST to the states were on any basis other than HFE, some taxpayers would be forced to accept either a lower standard of state services or a higher level of state taxation than other taxpayers in similar circumstances. Complaints about Equalisation New South Wales and Victoria have complained about the distribution of GST because they do not receive the GST revenue they claim has been paid by their taxpayers. Aside from the absence of data required to determine how much of the GST is attributable to one state or another, it would not be fair to distribute a tax on the basis of where it was collected. The GST is a nationally based tax and to suggest that it should be distributed back to the states on the basis of where it was raised is akin to saying that the Australian Government income tax should be spent in the states where it was collected. If wealthy states retained all the national taxes that they contribute it would be inequitable and unfair and contrary to the national interest. More information on HFE and GST distribution can be accessed through the Queensland Government Treasury website: www.treasury.qld.gov.au/gst-factsheets or the Commonwealth Grants Commission website: www.cgc.gov.au. |
| | | | | | |
| 146 | | Budget Strategy and Outlook 2007-08 | | |
2007 Update of Relativities
At the 2007 Treasurer’s Conference, the Australian Government accepted the CGC’s 2007 Update Report on State Revenue Sharing Relativities (2007 Update Report) as the basis for the distribution of the GST revenue to the states in 2007-08.
In the 2007 Update Report, the CGC recommended an underlying decrease in Queensland’s share of GST revenue of $166.4 million in 2007-08, as shown in Table 8.4. New South Wales has gained significantly from the 2007 Update with an increase of $277 million.
Table 8.4
Components of underlying change in states share of GST revenue
2006-07 to 2007-081
| | | | | | | | | | | | | | | | |
| | | NSW $ million | | VIC $ million | | QLD $ million | | WA $ million | | SA $ million | | TAS $ million | | ACT $ million | | NT $ million |
Revenue | | 360.8 | | 92.1 | | -248.5 | | -220.2 | | 18.7 | | -10.5 | | 15.0 | | -7.4 |
Expenditure | | -60.7 | | -29.7 | | 74.7 | | -43.3 | | 38.2 | | 1.5 | | -6.2 | | 25.4 |
SPPs | | -23.1 | | 1.7 | | 7.4 | | -8.0 | | 12.4 | | 3.8 | | 4.2 | | 1.5 |
Total | | 277.0 | | 64.0 | | -166.4 | | -271.6 | | 69.3 | | -5.1 | | 13.1 | | 19.7 |
Note:
| 1. | Numbers may not add due to interactions between Expenditure and SPP assessments. |
Source: Commonwealth Grant Commission 2007 Update Report on State Revenue Sharing Relativities.
The decrease in Queensland’s GST revenue share follows reductions in its share of GST funding of $174 million in 2006 and $93 million in 2005. It is expected that Queensland will experience a further loss of GST share following the 2008 Update, which is likely to result in Queensland receiving a less than per capita share of GST funding in 2008-09.
It is anticipated that by 2010 Queensland will have experienced a cumulative loss in GST funding of more than $1 billion since the 2004 Review of Methodology.
Queensland’s declining share of GST revenue reflects the state’s increased fiscal capacity, particularly from strong performances in the property market and mining sector (see Box 8.3 for more details). The change in Queensland’s GST share over the last three years demonstrates the responsiveness of the CGC’s methodology to changes in states’ revenue earning capacities and expenditure needs.
| | | | | | |
| | Budget Strategy and Outlook 2007-08 | | 147 |
|
Box 8.3 Queensland’s declining share of GST revenue |
The CGC uses the latest available data in its assessments, which reflect the relative economic circumstances of the states. For example, in the 2007 Update Report, the CGC found that Queensland had a relatively greater capacity to raise revenue from mining revenue and stamp duty on conveyances. This greater revenue raising capacity, amongst other things, is reducing Queensland’s share of GST funding. The removal of some state taxes from the CGC’s assessment also reduced Queensland’s share of GST funding. In 2007-08 Queensland is expected to receive a share of GST marginally above its per capita share, but the state’s share of GST revenue is expected to decline over the next few years with a less than per capita share anticipated in 2008-09. The declining share of GST revenue may impact the State’s capacity to provide additional services, or enhance existing services. However, Queensland recognises that it is fair for a state that has increased capacity to raise revenue from its own sources to have that capacity recognised when GST revenue is distributed. States which experience higher than average economic growth should expect, other things being equal, to see their share of GST revenue fall. This is an intended consequence of the current GST distribution process and is a key aspect of maintaining equity between the states. In respect of mining revenue, the 2007 Update Report shows that New South Wales and Victoria will benefit by $1.2 billion being redistributed to them, mostly from Queensland and Western Australia. In the absence of the CGC’s process for smoothing changes in state shares, the current strong performance of the Queensland and Western Australian economies would result in larger changes in redistributions between the states. In particular New South Wales and Victoria would have received an even greater benefit from the 2007 Update. The current process for smoothing changes in state shares of GST acts as a mechanism to provide greater stability in GST funding to states and therefore budgets. The Commission’s latest outcomes demonstrate that the grant distribution process is responsive and reflects changes in states’ circumstances. |
Relationship between GST distribution and economic performance
A key feature of recent Updates has been the convergence of the fast growing economies of Queensland and Western Australia with the more established economies of New South Wales and Victoria.
There has been some criticism of the GST distribution process on the basis that it does not adequately take into account the rapid growth in the Queensland and Western Australian economies. Chart 8.3 shows that Queensland’s GSP per capita has been converging with those of both New South Wales and Victoria over the period from 2000-01 to 2005-06.
| | | | | | |
| 148 | | Budget Strategy and Outlook 2007-08 | | |
Chart 8.3
Convergence between larger states – GSP per capita relativities
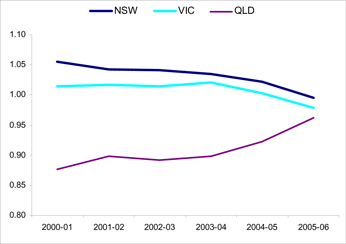
Source: Commonwealth Grants Commission Relative Fiscal Capacities of the States 2007.
Over these six years, GSP per capita for New South Wales has declined from 6% above the Australian average, while Queensland’s GSP per capita has risen substantially towards the national average.
At the same time, New South Wales’ assessed GST single year relativity, which is a key determinant of its share of the GST pool, has risen from 0.88 to 0.96. Over the same period Queensland’s GST relativity has fallen from 1.05 to 0.93 as shown in Chart 8.4.
| | | | | | |
| | Budget Strategy and Outlook 2007-08 | | 149 |
Chart 8.4
Convergence between larger states – single year GST relativities
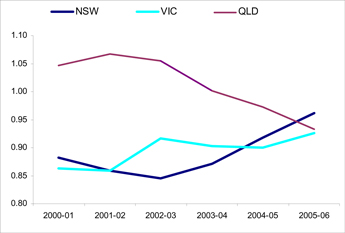
Source: Commonwealth Grants Commission Report on State Revenue Sharing Relativities 2007 Update.
It is clear that as the relative economic strength of a state changes, so too does its assessed share of GST funding.
The CGC’s 2007 Update data shows that for the first time ever, Queensland’s assessed GST relativity is lower than that for New South Wales, and only marginally higher than that for Victoria. This means that, based on 2005-06 data, Queensland has been assessed as requiring less per capita from the GST pool than New South Wales, and only marginally more than Victoria.
2010 Review of state revenue sharing relativities - progress report
The CGC undertakes a substantive review of its methodology every five years, with the next review due to be completed in 2010. The terms of reference for the 2010 Review of Methodology direct the CGC to simplify its processes and introduce a more streamlined approach to HFE, based on a simplified methodology and better quality data as discussed in Box 8.4. The 2010 review is different to previous reviews and can be viewed as an overhaul of the way the CGC structures its assessments.
| | | | | | |
| 150 | | Budget Strategy and Outlook 2007-08 | | |
|
Box 8.4 The 2010 Review |
| |
Some states have raised concerns about the GST distribution process, including suggestions that GST should be distributed on the basis of which state it is raised in, and that grant distribution processes inhibit states from introducing efficiency reforms. Some states have raised concerns that the current process is complex and should be simplified. An overhaul of how the Commission determines the distribution of the GST The CGC is currently conducting a review, due in 2010, of the processes used to determine the distribution of the GST revenue. The CGC has indicated that it intends to vigorously pursue both equalisation and simplification for the 2010 Review, and has adopted a strategy that: • starts with a clean-slate when it comes to devising assessment methods • adopts a top-down approach, only disaggregating assessment categories if doing so materially improves equalisation and it can be done reliably • works toward improving the quality of data used in the assessments • establishes new assessment guidelines with stronger reliability and materiality criteria. Using this strategy, the CGC believes that simplification will improve the reliability and robustness of the processes and acceptability of the outcomes. The CGC is providing all states with the opportunity to put forward arguments about the distribution process. To date no substantive body of evidence has been put forward to support claims that there is anything conceptually wrong with the current principle of fiscal equalisation. Queensland agrees that the strategy adopted by the CGC should make the process simpler, more transparent and ensure that the data used in the assessments is more accurate, consistent and comparable across states. Progress reports on the 2010 Review process were provided to the Ministerial Council for Commonwealth-State Financial Relations in March 2006 and 2007. These reports are available on the CGC’s web site: www.cgc.gov.au. |
IMPACT OF THE INTERGOVERNMENTAL AGREEMENT
Revenue reductions for Queensland associated with the abolition of business taxes covered by the IGA of 1999 will be $465 million in 2007-08, increasing to nearly $1.2 billion in 2011-12. Details of Queensland’s schedule for the abolition of these state taxes can be found in Chapter 5.
It is often claimed that Queensland receives the greatest benefit from GST revenue on the basis that it receives the largest amount of GST revenue in excess of the Guaranteed Minimum Amount (GMA). The GMA is a measure of the amount of revenue which the states would have received if the GST had not been introduced. Comparing GST revenue in excess of the GMA is an oversimplified way of looking at the impact of IGA reforms, as it does not account for the differences in tax regimes prior to the abolition of state taxes. For example, Queensland did not impose financial institutions duty or bed taxes, which other states were required to abolish, prior to the IGA reforms.
| | | | | | |
| | Budget Strategy and Outlook 2007-08 | | 151 |
When Queensland’s low tax regime is taken into account, residents in all other states except Western Australia have benefited more from tax reform.
Queensland’s available GST revenue
The amount of GST revenue reported in the Budget is not the full amount available to be spent in Queensland as can be seen in Chart 8.5. The Queensland Government has to meet a number of costs associated with its commitments under the IGA: First Home Owners Grant Scheme, GST administration costs payable to the Australian Tax Office, and the cost of taxes abolished as part of the IGA.
It is anticipated that Queensland’s total share of GST will continue to grow at an annual average rate of 3.1% from 2007-08 to 2010-11. However, Chart 8.5 shows that after taking the costs listed above, as well as the State’s relatively rapid population growth into consideration, Queensland’s GST revenue per capita is estimated to decline on average by 1.0% per annum over the same period.
The impact of the costs associated with Queensland’s commitments under the IGA coupled with the declining share of GST revenue implied by the Commonwealth Grants Commission’s latest relativity assessment indicate limited capacity to further reduce State taxes while continuing to meet the service needs of a fast-growing population.
Chart 8.5
Queensland GST revenue per capita, 2006-07 to 2010-11
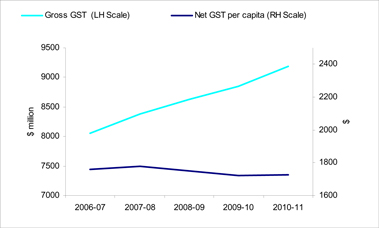
Note:
| 1. | Net GST revenue per capita represents net available revenue after meeting First Home Owners Grant Scheme costs, GST administration costs and the cost of taxes abolished under the IGA. |
Source: Australian Government Budget Paper No.3, 2007-08 and Queensland Treasury.
| | | | | | |
| 152 | | Budget Strategy and Outlook 2007-08 | | |
Queensland is committed to a program for abolishing the majority of duties listed in the IGA over an agreed timeframe. Queensland has fulfilled its obligations under the IGA.
SPECIFIC PURPOSE PAYMENTS
Specific Purpose Payments (SPPs) are payments made by the Australian Government to the states for policy purposes related to activities that are the constitutional responsibility of the states. SPPs must be used for the particular policy purpose set out in individual SPP agreements. Separate agreements are negotiated for each SPP, with the agreements covering both funding and policy issues.
In some cases the structure of SPP funding arrangements can be inflexible and produce sub-optimal outcomes. They can impact on state budget flexibility and ability to respond effectively to changing circumstances.
To try and minimise any adverse impacts of SPP funding arrangements state treasuries work with the Australian Treasury through a SPP Working Group (SPPWG) to provide feedback on ways to improve the structure of SPPs to promote better management.
During 2006-07 states provided feedback on the Commonwealth-State Housing Agreement, the Natural Heritage Trust and National Action Plan for Salinity and Water Quality Agreements, and the Australian Health Care Agreement (AHCA).
During 2007-08 the SPPWG will review and provide feedback on Skilling Australia’s Workforce Agreement, the Quadrennial Agreement for Government Schools and further work will be undertaken on the AHCA.
STATE—LOCAL GOVERNMENT FINANCIAL RELATIONS
In 2007-08, a total of $1,243.3 million in grants will be provided to Queensland’s local governments (up from $1,104.8 million in 2006-07), with 63.4% of this amount provided by the Queensland Government and the balance provided by the Australian Government.
Table 8.5 details Queensland Government and Australian Government grants to local government in Queensland.
The overall increase in Queensland Government grants to local government authorities in 2007-08 reflects the expansion of some existing programs or the introduction of new initiatives by some Queensland Government agencies, including:
| • | | Indigenous Housing Planned Maintenance (Department of Housing) |
| • | | Mackay Convention Precinct (Department of Public Works) |
• | | 150th Anniversary Legacy Infrastructure Program—to celebrate Queensland’s 150th anniversary since separation from NSW (Department of Local Government, Planning, Sports and Recreation). |
| | | | | | |
| | Budget Strategy and Outlook 2007-08 | | 153 |
Table 8.5
Grants to Local Government in Queensland1,2,3
| | | | | | |
| | | 2005-06 Actual $ million | | 2006-07 Est. Act. $ million | | 2007-08 Budget $ million |
Queensland Grants | | | | | | |
Communities | | 52.6 | | 53.7 | | 56.8 |
—including Pensioner Rates Rebate | | 44.9 | | 45.5 | | 47.9 |
Disability Services5 | | 0.5 | | 0.6 | | 13.5 |
Education, Training and the Arts | | 17.9 | | 18.7 | | 20.0 |
Emergency Services | | 2.6 | | 9.8 | | 8.2 |
Employment and Industrial Relations4 | | 28.7 | | 25.2 | | 4.4 |
Environmental Protection Agency | | 0.7 | | 2.3 | | 2.0 |
Health5 | | 12.2 | | 12.4 | | — |
Housing | | 45.3 | | 62.0 | | 98.9 |
Local Government, Planning, Sport and Recreation | | 259.9 | | 364.5 | | 407.1 |
Main Roads | | 100.9 | | 78.6 | | 84.2 |
Natural Resources and Water | | 18.0 | | 53.5 | | 30.9 |
Public Works | | 0.2 | | 2.0 | | 33.5 |
Transport | | 10.0 | | 14.2 | | 28.1 |
Other | | 2.1 | | 4.8 | | 0.4 |
Total State Grants | | 551.5 | | 702.3 | | 788.1 |
| | | |
Australian Government Grants | | | | | | |
Australian Government “through” | | 311.0 | | 326.5 | | 337.8 |
Australian Government “direct” | | 83.6 | | 76.1 | | 117.3 |
| | | |
Total Commonwealth Grants | | 394.6 | | 402.5 | | 455.2 |
Total Grants to Local Government Authorities and Aboriginal and Islander Councils | | 946.1 | | 1,104.8 | | 1,243.3 |
Notes:
| 1. | For current and capital purposes to local government authorities and Aboriginal and Islander councils. |
| 2. | Numbers yet to be confirmed and may be subject to revision. |
| 3. | Numbers may not add due to rounding. |
| 4. | This estimate may be revised upward depending on demand for services during the financial year. |
| 5. | From 2007-08, Disability Services Queensland will provide some services to aged and disabled persons that were previously provided by Queensland Health. |
Source: Queensland Treasury, Australian Government Final Budget Outcome 2005-06, Australian Government Budget Paper No.3 2007-08.
Grant purposes
The majority of grants to local government are for capital purposes. In 2007-08 capital grants will comprise 78.9% of Queensland Government grants to local government (up from 74.2% in 2006-07).
| | | | | | |
| 154 | | Budget Strategy and Outlook 2007-08 | | |
Grants for Housing and Community Amenities comprise the largest component of Queensland Government grants. Other significant grant purposes include:
| • | | general public services (including contribution to the costs of providing local government services where councils are unable to levy land rates) |
| • | | the provision of rate subsidies to eligible pensioners |
| • | | capital works subsidies provided towards the costs of local public infrastructure |
| • | | road subsidies for local roads, networks and drainage. |
Chart 8.7 highlights the broad range of purposes for which local government grants were provided by the Queensland Government in 2006-07.
Chart 8.7
State grants to local government in Queensland by purpose 2006-07
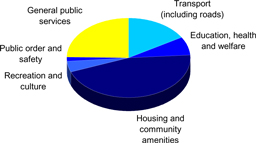
AUSTRALIAN LOAN COUNCIL
The Australian Loan Council, which comprises the Australian Government Treasurer and state treasurers, meets annually immediately after the Ministerial Council meeting. Nominations for Loan Council Allocations (LCAs) for 2007-08 put forward by the Australian and state governments reflect current best estimates of non-financial public sector deficits or surpluses. For 2007-08, the Loan Council endorsed total LCA nominations of $4.315 billion (a projected public sector surplus). This amount reflects a surplus of $17.163 billion for the Australian Government and a net deficit of $12.848 billion collectively for the states.
Queensland’s nominated LCA deficit for 2007-08 is estimated at $5.765 billion, as shown in Table 8.6. This reflects the funding requirements for capital projects of approximately $7 billion in areas such as water, energy and transport.
| | | | | | |
| | Budget Strategy and Outlook 2007-08 | | 155 |
Table 8.6
Loan Council Allocations ($ million)
2006-07 and 2007-08 Nominations
| | | | | | | | | | | | | | | | | | |
| | | NSW | | VIC | | QLD | | WA | | SA | | TAS | | ACT | | NT | | C’wlth |
2006-07 | | 5,118 | | 2,168 | | 4,610 | | -42 | | -15 | | 43 | | 166 | | 112 | | -19,673 |
2007-08 | | 4,729 | | 2,357 | | 5,765 | | -149 | | -14 | | 87 | | 29 | | 44 | | -17,163 |
Source: Heads of Treasuries Report on Nominated Loan Council Allocations for 2007-08.
| | | | | | |
| 156 | | Budget Strategy and Outlook 2007-08 | | |
| 9. | GOVERNMENT FINANCE STATISTICS |
INTRODUCTION
Government Finance Statistics (GFS) data is used extensively in the presentation of financial statement information in the Budget Papers.
This chapter contains detailed financial statements for the Queensland Public Sector based on Australian Bureau of Statistics (ABS) GFS standards. These tables provide financial information prepared under the Uniform Presentation Framework of reporting as required under the Australian Loan Council arrangements. In line with these requirements, budgeted financial information for the Public Financial Corporations sector is not included.
In addition, the chapter provides:
| • | | reconciliation of the General Government sector GFS net operating balance to the accounting surplus |
| • | | a GFS time series for the General Government sector |
| • | | data on General Government expenses and purchases of non-financial assets by function |
| • | | details of taxation revenue collected by the General Government sector |
| • | | the State’s revised Loan Council Budget allocation |
| • | | background information on GFS, including the conceptual basis, sector definitions and a list of reporting entities. |
GENERAL GOVERNMENT SECTOR
For a detailed analysis of the General Government sector, readers should refer to Chapter 5 – Revenue, Chapter 6 – Expenses and Chapter 7 – Balance Sheet and Cash Flows.
PUBLIC NON-FINANCIAL CORPORATIONS SECTOR
The Public Non-financial Corporations (PNFC) sector comprises entities operating in a range of industries. These entities are mainly engaged in the production and sale of goods and services to the market.
In Queensland, a significant part of the PNFC sector is comprised of the State’s Government-owned corporations (GOCs), operating in a number of key industries including energy, rail, ports and water delivery services. GOCs operate as commercially focussed entities and their activities are targeted at meeting needs identified within the market sectors they service.
| | | | | | |
| | Budget Strategy and Outlook 2007-08 | | 157 |
PNFC operating statement
The majority of revenue generated in the PNFC sector is received through the sale of goods and services, and the receipt of current grants and subsidies.
For GOCs, the majority of sales of goods and services are to customer markets. These revenues are therefore heavily linked to the performance of the Queensland economy and the ability of GOCs to compete in increasingly competitive markets.
The major components of GOC sector revenues include rail freight charges, electricity sales, electricity network and distribution charges, port charges and agricultural and industrial water delivery. Key determinants of GOC revenue growth in 2007-08 will be energy demands, driving electricity pool prices, and continued growth in the Queensland export markets, in particular coal exports, which generate demand for rail and port services.
Across the PNFC sector, it is anticipated that sales of goods and services will generate revenues of $6.57 billion in 2007-08, with total revenues forecast at $9.192 billion. Total revenues generated by the sector are forecast to grow to $10.376 billion in 2010-11, an increase of 12.9% across the period 2007-08 to 2010-11. Again, major drivers include continued demand for GOC services and supplies in the electricity, rail and port sectors.
GOC revenues are also derived from Community Service Obligation (CSO) payments. CSOs are provided by the State where GOCs are required to provide non-commercial services or services at non-commercial prices for the benefit of the community. Major CSOs include the uniform electricity tariff and QR passenger rail services.
GOCs distribute dividends to the State as shareholder. Dividends from the GOC sector are a function of net profits and the dividend payout ratio. In general, the dividend payout ratio for the 2007-08 Budget is based on 80% of net profit after tax. In some cases, forecast net profit after tax will be adjusted to exclude any unrealised (i.e. non-cash) forecast gains or losses, for example, from upward revaluation of non-current assets or impacts on profit arising from the application of recent changes to financial reporting standards.
The dividend payout ratio does not affect a GOC’s capacity to carry out necessary maintenance and repairs, as dividends are paid after GOCs have met their commitments to operating and maintenance expenses. Shareholding Ministers consider the circumstances of individual GOCs and advice from their boards before arriving at a final determination of dividend payments.
The PNFC sector reflects positive performance with the forecast GFS net operating balance for the 2007-08 year of $360 million, after allowing for dividends of $902 million.
| | | | | | |
| 158 | | Budget Strategy and Outlook 2007-08 | | |
PNFC balance sheet and cash flow statement
The ability of GOCs to efficiently and effectively service their customers is reliant upon the investment in and maintenance of underlying infrastructure.
In 2007-08, the PNFC sector is expected to invest approximately $7.919 billion in capital projects. Significant levels of investment are expected to continue across the forward estimates period.
GOCs undertake infrastructure investment on a commercial basis and in response to the needs of the market sectors they service.
Given continued demand for electricity, significant expenditure continues to be undertaken to ensure adequate generation capacity and network reliability across the energy sector.
In 2007-08, $118 million is budgeted for completion of the $1.162 billion Kogan Creek Power project, reflecting the continued commitment to generation capacity. Capital works programs for 2007-08 will also contribute to the improved level of reliability of electricity distribution, with a focus on service quality, reliability, availability and capacity improvements. The combined capital network expenditure of Ergon Energy and ENERGEX in 2007-08 totals $1.738 billion.
As one of the State’s largest industries, the coal industry continues to be a key economic driver. Proposed rail and port expansion programs reflect ongoing capital investment in coal supply chains, including the Central Queensland Ports Authority’s forecast 2007-08 expenditure of $103 million on the further expansion of the RG Tanna Coal Terminal, QR’s forecast $187.6 million for track works on the coal network in Central Queensland, and the Ports Corporation of Queensland’s $28 million expenditure in 2007-08 for the Abbot Point Coal Terminal Stage 2 (X21) expansion.
Financing of capital projects will differ according to the individual circumstances of the relevant GOC and the specific nature of the project. There are a number of ways in which GOCs fund these investments, including utilising cash flows from their business, borrowings, and equity injections from shareholding Ministers. The Queensland Government is committed to GOCs being at all times able to fund viable projects whilst at the same time retaining a sound financial position, by ensuring that all GOCs remain sufficiently well capitalised to ensure an investment grade credit rating as determined by independent credit ratings agencies.
Reflecting the level of support for capital investment within a sound financial framework, an estimated $1.9 billion in net equity support is budgeted to be provided to the PNFC sector for the forward estimates period 2007-08 to 2010-11.
| | | | | | |
| | Budget Strategy and Outlook 2007-08 | | 159 |
UNIFORM PRESENTATION FRAMEWORK FINANCIAL INFORMATION
The tables on the following pages present operating statements, balance sheets and cash flow statements prepared on an accrual GFS basis for the General Government, Public Non-financial Corporations and Non-financial Public sectors.
| | | | | | |
| 160 | | Budget Strategy and Outlook 2007-08 | | |
| | | | | | | | | | | | | | | | | | | | |
Table 9.1 General Government sector operating statement 1 | |
| | | | | 2006-07
Budget
$ million | | | 2006-07
Est.Actual
$ million | | | 2007-08
Budget
$ million | | | 2008-09
Projection
$ million | | | 2009-10
Projection
$ million | | | 2010-11
Projection
$ million | |
| | GFS Revenue | | | | | | | | | | | | | | | | | | |
| | Taxation revenue | | 7,871 | | | 8,375 | | | 9,272 | | | 10,067 | | | 10,749 | | | 11,568 | |
| | Current grants and subsidies | | 13,143 | | | 13,384 | | | 13,726 | | | 13,726 | | | 14,084 | | | 14,539 | |
| | Capital grants | | 683 | | | 811 | | | 1,428 | | | 1,096 | | | 855 | | | 897 | |
| | Sales of goods and services | | 2,693 | | | 2,937 | | | 3,005 | | | 3,094 | | | 3,188 | | | 3,282 | |
| | Interest income | | 1,802 | | | 3,268 | | | 2,190 | | | 2,325 | | | 2,440 | | | 2,562 | |
| | Other | | 2,879 | | | 3,781 | | | 2,931 | | | 2,999 | | | 3,289 | | | 3,131 | |
| | Total Revenue | | 29,070 | | | 32,557 | | | 32,551 | | | 33,307 | | | 34,605 | | | 35,979 | |
| | | | | | | |
Less | | GFS Expenses | | | | | | | | | | | | | | | | | | |
| | Gross operating expenses | | | | | | | | | | | | | | | | | | |
| | Employee expenses | | 13,324 | | | 13,229 | | | 14,271 | | | 15,281 | | | 16,190 | | | 16,983 | |
| | Other operating expenses | | 5,844 | | | 6,587 | | | 6,424 | | | 6,348 | | | 6,399 | | | 6,571 | |
| | Depreciation | | 1,754 | | | 1,780 | | | 2,015 | | | 2,244 | | | 2,264 | | | 2,377 | |
| | Superannuation interest expense | | 563 | | | 716 | | | 745 | | | 781 | | | 813 | | | 842 | |
| | Other interest expense | | 222 | | | 218 | | | 390 | | | 660 | | | 958 | | | 1,145 | |
| | Current transfers | | 6,094 | | | 6,477 | | | 6,761 | | | 6,980 | | | 6,977 | | | 7,130 | |
| | Capital transfers | | 1,024 | | | 1,157 | | | 1,676 | | | 762 | | | 763 | | | 718 | |
| | Total Expenses | | 28,825 | | | 30,164 | | | 32,282 | | | 33,056 | | | 34,364 | | | 35,766 | |
| | | | | | | |
Equals | | GFS net operating balance | | 245 | | | 2,393 | | | 268 | | | 251 | | | 241 | | | 213 | |
| | | | | | | |
Less | | Net acquisition of non-financial assets | | | | | | | | | | | | | | | | | | |
| | Purchases of non-financial assets | | 3,958 | | | 4,137 | | | 5,463 | | | 5,839 | | | 5,899 | | | 5,947 | |
| | Sales of non-financial assets | | (302 | ) | | (290 | ) | | (331 | ) | | (291 | ) | | (249 | ) | | (272 | ) |
| | Less Depreciation | | 1,754 | | | 1,780 | | | 2,015 | | | 2,244 | | | 2,264 | | | 2,377 | |
| | Plus Change in inventories | | 75 | | | 23 | | | 62 | | | 86 | | | 40 | | | (8 | ) |
| | Plus Other movements in non-financial assets | | 15 | | | (95 | ) | | (134 | ) | | 15 | | | 15 | | | 15 | |
| | Equals Total net acquisition of non-financial assets | | 1,992 | | | 1,996 | | | 3,045 | | | 3,405 | | | 3,441 | | | 3,305 | |
| | | | | | | |
Equals | | GFS Net lending / (borrowing) | | | | | | | | | | | | | | | | | | |
| | (Fiscal Balance) | | (1,747 | ) | | 397 | | | (2,777 | ) | | (3,154 | ) | | (3,200 | ) | | (3,092 | ) |
Note:
| 1. | Numbers may not add due to rounding. |
| | | | | | |
| | Budget Strategy and Outlook 2007-08 | | 161 |
| | | | | | | | | | | | | | | | | | | | |
Table 9.2 Public Non-financial Corporations sector operating statement 1 | |
| | | | | 2006-07
Budget
$ million | | | 2006-07
Est.Actual
$ million | | | 2007-08
Budget
$ million | | | 2008-09
Projection
$ million | | | 2009-10
Projection
$ million | | | 2010-11
Projection
$ million | |
| | GFS Revenue | | | | | | | | | | | | | | | | | | |
| | Current grants and subsidies | | 1,443 | | | 1,487 | | | 1,699 | | | 1,604 | | | 1,621 | | | 1,659 | |
| | Capital grants | | 18 | | | 9 | | | 417 | | | 9 | | | 9 | | | 9 | |
| | Sales of goods and services | | 8,155 | | | 7,341 | | | 6,570 | | | 7,257 | | | 7,836 | | | 8,301 | |
| | Interest income | | 80 | | | 140 | | | 78 | | | 76 | | | 81 | | | 89 | |
| | Other | | 500 | | | 433 | | | 428 | | | 385 | | | 345 | | | 318 | |
| | Total Revenue | | 10,195 | | | 9,412 | | | 9,192 | | | 9,332 | | | 9,892 | | | 10,376 | |
| | | | | | | |
Less | | GFS Expenses | | | | | | | | | | | | | | | | | | |
| | Gross operating expenses | | | | | | | | | | | | | | | | | | |
| | Employee expenses | | 2,002 | | | 2,275 | | | 2,199 | | | 2,264 | | | 2,377 | | | 2,479 | |
| | Other operating expenses | | 4,472 | | | 3,269 | | | 2,559 | | | 2,580 | | | 2,590 | | | 2,644 | |
| | Depreciation | | 1,532 | | | 1,597 | | | 1,726 | | | 1,907 | | | 2,050 | | | 2,179 | |
| | Other interest expense | | 951 | | | 964 | | | 1,240 | | | 1,468 | | | 1,444 | | | 1,595 | |
| | Other property expenses | | 967 | | | 1,831 | | | 1,084 | | | 1,149 | | | 1,287 | | | 1,338 | |
| | Current transfers | | 181 | | | 51 | | | 12 | | | — | | | — | | | — | |
| | Capital transfers | | 12 | | | 28 | | | 12 | | | — | | | — | | | — | |
| | Total Expenses | | 10,118 | | | 10,015 | | | 8,832 | | | 9,368 | | | 9,748 | | | 10,237 | |
| | | | | | | |
Equals | | GFS net operating balance | | 78 | | | (604 | ) | | 360 | | | (36 | ) | | 144 | | | 139 | |
| | | | | | | |
Less | | Net acquisition of non-financial assets | | | | | | | | | | | | | | | | | | |
| | Purchases of non-financial assets | | 5,603 | | | 7,436 | | | 7,919 | | | 6,423 | | | 5,382 | | | 4,772 | |
| | Sales of non-financial assets | | (49 | ) | | (191 | ) | | (84 | ) | | (148 | ) | | (144 | ) | | (117 | ) |
| | Less Depreciation | | 1,532 | | | 1,597 | | | 1,726 | | | 1,907 | | | 2,050 | | | 2,179 | |
| | Plus Change in inventories | | — | | | 23 | | | 29 | | | 21 | | | 18 | | | 10 | |
| | Plus Other movements in non-financial assets | | (12 | ) | | (28 | ) | | (12 | ) | | — | | | — | | | — | |
| | Equals Total net acquisition of non-financial assets | | 4,010 | | | 5,643 | | | 6,126 | | | 4,390 | | | 3,206 | | | 2,487 | |
| | | | | | | |
Equals | | GFS Net lending / (borrowing) | | | | | | | | | | | | | | | | | | |
| | (Fiscal Balance) | | (3,932 | ) | | (6,246 | ) | | (5,767 | ) | | (4,426 | ) | | (3,062 | ) | | (2,347 | ) |
Note:
| 1. | Numbers may not add due to rounding. |
| | | | | | |
| 162 | | Budget Strategy and Outlook 2007-08 | | |
Table 9.3
Non-financial Public sector operating statement 1
| | | | | | | | | | | | | | | | | | | | | | |
| | | | | 2006-07
Budget
$ million | | | 2006-07
Est.Actual
$ million | | | 2007-08
Budget
$ million | | | 2008-09
Projection
$ million | | | 2009-10
Projection
$ million | | | 2010-11
Projection
$ million | |
| | GFS Revenue | | | | | | | | | | | | | | | | | | |
| | Taxation revenue | | 7,518 | | | 8,034 | | | 9,126 | | | 9,909 | | | 10,583 | | | 11,392 | |
| | Current grants and subsidies | | 13,002 | | | 13,356 | | | 13,742 | | | 13,729 | | | 14,085 | | | 14,540 | |
| | Capital grants | | 683 | | | 808 | | | 1,422 | | | 1,094 | | | 852 | | | 894 | |
| | Sales of goods and services | | 10,693 | | | 10,069 | | | 9,401 | | | 10,177 | | | 10,857 | | | 11,423 | |
| | Interest income | | 1,881 | | | 3,409 | | | 2,267 | | | 2,401 | | | 2,522 | | | 2,651 | |
| | Other | | 2,406 | | | 2,381 | | | 2,272 | | | 2,232 | | | 2,344 | | | 2,108 | |
| | Total Revenue | | 36,183 | | | 38,057 | | | 38,230 | | | 39,541 | | | 41,243 | | | 43,008 | |
| | | | | | | |
Less | | GFS Expenses | | | | | | | | | | | | | | | | | | |
| | Gross operating expenses | | | | | | | | | | | | | | | | | | |
| | Employee expenses | | 15,326 | | | 15,504 | | | 16,471 | | | 17,545 | | | 18,567 | | | 19,462 | |
| | Other operating expenses | | 9,795 | | | 9,303 | | | 8,661 | | | 8,593 | | | 8,654 | | | 8,876 | |
| | Depreciation | | 3,286 | | | 3,377 | | | 3,741 | | | 4,150 | | | 4,314 | | | 4,557 | |
| | Superannuation interest expense | | 563 | | | 716 | | | 745 | | | 781 | | | 813 | | | 842 | |
| | Other interest expense | | 1,173 | | | 1,182 | | | 1,630 | | | 2,128 | | | 2,403 | | | 2,740 | |
| | Current transfers | | 4,698 | | | 5,010 | | | 5,087 | | | 5,376 | | | 5,355 | | | 5,470 | |
| | Capital transfers | | 1,021 | | | 1,175 | | | 1,267 | | | 753 | | | 753 | | | 709 | |
| | Total Expenses | | 35,861 | | | 36,267 | | | 37,602 | | | 39,326 | | | 40,858 | | | 42,656 | |
| | | | | | | |
Equals | | GFS net operating balance | | 322 | | | 1,790 | | | 628 | | | 215 | | | 385 | | | 352 | |
| | | | | | | |
Less | | Net acquisition of non-financial assets | | | | | | | | | | | | | | | | | | |
| | Purchases of non-financial assets | | 9,561 | | | 11,573 | | | 13,383 | | | 12,262 | | | 11,281 | | | 10,719 | |
| | Sales of non-financial assets | | (351 | ) | | (481 | ) | | (415 | ) | | (439 | ) | | (393 | ) | | (388 | ) |
| | Less | | Depreciation | | 3,286 | | | 3,377 | | | 3,741 | | | 4,150 | | | 4,314 | | | 4,557 | |
| | Plus | | Change in inventories | | 75 | | | 46 | | | 91 | | | 107 | | | 58 | | | 2 | |
| | Plus | | Other movements in non-financial assets | | 3 | | | (123 | ) | | (146 | ) | | 15 | | | 15 | | | 15 | |
| | Equals | | Total net acquisition of non-financial assets | | 6,003 | | | 7,639 | | | 9,172 | | | 7,795 | | | 6,647 | | | 5,792 | |
| | | | | | | |
Equals | | GFS Net lending / (borrowing) (Fiscal Balance) | | (5,680 | ) | | (5,849 | ) | | (8,543 | ) | | (7,579 | ) | | (6,262 | ) | | (5,439 | ) |
Note:
| 1. | Numbers may not add due to rounding. |
| | | | | | |
| | Budget Strategy and Outlook 2007-08 | | 163 |
Table 9.4
General Government sector balance sheet 1
| | | | | | | | | | | | | | | | | | |
| | | 2006-07
Budget2 $ million | | | 2006-07
Est.Actual
$ million | | | 2007-08
Budget $ million | | | 2008-09
Projection
$ million | | | 2009-10
Projection
$ million | | | 2010-11
Projection
$ million | |
Assets | | | | | | | | | | | | | | | | | | |
Financial Assets | | | | | | | | | | | | | | | | | | |
Cash and deposits | | 181 | | | 1,873 | | | 2,069 | | | 1,835 | | | 1,677 | | | 1,661 | |
Advances paid | | 597 | | | 887 | | | 753 | | | 836 | | | 923 | | | 987 | |
Investments, loans and placements | | 24,655 | | | 27,404 | | | 29,046 | | | 30,716 | | | 32,541 | | | 34,431 | |
Other non-equity assets | | 2,314 | | | 3,394 | | | 2,551 | | | 2,600 | | | 2,741 | | | 2,756 | |
Equity | | 21,053 | | | 23,514 | | | 25,438 | | | 26,908 | | | 28,224 | | | 29,506 | |
Total Financial Assets | | 48,801 | | | 57,072 | | | 59,857 | | | 62,895 | | | 66,107 | | | 69,340 | |
| | | | | | |
Non-Financial Assets | | 80,543 | | | 87,592 | | | 94,726 | | | 100,725 | | | 106,852 | | | 112,888 | |
| | | | | | |
Total Assets | | 129,344 | | | 144,665 | | | 154,583 | | | 163,620 | | | 172,959 | | | 182,228 | |
| | | | | | |
Liabilities | | | | | | | | | | | | | | | | | | |
Advances received | | 455 | | | 460 | | | 447 | | | 436 | | | 431 | | | 427 | |
Borrowing | | 3,964 | | | 3,282 | | | 6,711 | | | 11,063 | | | 15,338 | | | 19,417 | |
Superannuation liability | | 19,369 | | | 19,194 | | | 20,368 | | | 21,518 | | | 22,605 | | | 23,696 | |
Other employee entitlements and provisions | | 4,553 | | | 4,784 | | | 4,943 | | | 5,107 | | | 5,359 | | | 5,637 | |
Other non-equity liabilities | | 1,971 | | | 2,479 | | | 2,314 | | | 2,194 | | | 2,154 | | | 2,110 | |
Total Liabilities | | 30,312 | | | 30,198 | | | 34,784 | | | 40,318 | | | 45,887 | | | 51,287 | |
| | | | | | |
Net Worth | | 99,032 | | | 114,466 | | | 119,799 | | | 123,302 | | | 127,072 | | | 130,941 | |
Net Financial Worth | | 18,489 | | | 26,874 | | | 25,073 | | | 22,577 | | | 20,220 | | | 18,054 | |
Net Debt | | (21,014 | ) | | (26,423 | ) | | (24,709 | ) | | (21,889 | ) | | (19,372 | ) | | (17,234 | ) |
Notes:
| 1. | Numbers may not add due to rounding. |
| 2. | Numbers have been restated where subsequent changes in classification have occurred. |
| | | | | | |
| 164 | | Budget Strategy and Outlook 2007-08 | | |
Table 9.5
Public Non-financial Corporations sector balance sheet 1
| | | | | | | | | | | | | | | | | | |
| | | 2006-07
Budget2
$ million | | | 2006-07
Est.Actual
$ million | | | 2007-08
Budget $ million | | | 2008-09
Projection
$ million | | | 2009-10
Projection
$ million | | | 2010-11
Projection
$ million | |
Assets | | | | | | | | | | | | | | | | | | |
Financial Assets | | | | | | | | | | | | | | | | | | |
Cash and deposits | | 837 | | | 2,435 | | | 1,497 | | | 1,294 | | | 1,377 | | | 1,448 | |
Advances paid | | 210 | | | 335 | | | 294 | | | 258 | | | 229 | | | 204 | |
Investments, loans and placements | | 502 | | | 1,141 | | | 1,152 | | | 1,153 | | | 1,151 | | | 1,154 | |
Other non-equity assets | | 1,719 | | | 1,351 | | | 1,271 | | | 1,423 | | | 1,463 | | | 1,520 | |
Equity | | 206 | | | 185 | | | 199 | | | 213 | | | 227 | | | 242 | |
Total Financial Assets | | 3,473 | | | 5,447 | | | 4,414 | | | 4,341 | | | 4,448 | | | 4,568 | |
| | | | | | |
Non-Financial Assets | | 38,563 | | | 39,974 | | | 46,624 | | | 51,662 | | | 55,597 | | | 58,898 | |
| | | | | | |
Total Assets | | 42,036 | | | 45,421 | | | 51,038 | | | 56,004 | | | 60,044 | | | 63,466 | |
| | | | | | |
Liabilities | | | | | | | | | | | | | | | | | | |
Deposits held | | 74 | | | 69 | | | 66 | | | 66 | | | 67 | | | 68 | |
Borrowing | | 17,822 | | | 19,616 | | | 24,163 | | | 27,638 | | | 30,251 | | | 32,383 | |
Superannuation liability | | 12 | | | — | | | — | | | — | | | 1 | | | 1 | |
Other employee entitlements and provisions | | 1,386 | | | 1,210 | | | 1,225 | | | 1,237 | | | 1,259 | | | 1,275 | |
Other non-equity liabilities | | 2,771 | | | 3,010 | | | 2,168 | | | 2,176 | | | 2,265 | | | 2,255 | |
Total Liabilities | | 22,065 | | | 23,905 | | | 27,622 | | | 31,118 | | | 33,842 | | | 35,982 | |
| | | | | | |
Net Worth | | 19,970 | | | 21,516 | | | 23,416 | | | 24,886 | | | 26,202 | | | 27,484 | |
Net Financial Worth | | (18,592 | ) | | (18,458 | ) | | (23,208 | ) | | (26,776 | ) | | (29,394 | ) | | (31,414 | ) |
Net Debt | | 16,347 | | | 15,774 | | | 21,285 | | | 24,999 | | | 27,561 | | | 29,646 | |
Notes:
| 1. | Numbers may not add due to rounding. |
| 2. | Numbers have been restated where subsequent changes in classification have occurred. |
| | | | | | |
| | Budget Strategy and Outlook 2007-08 | | 165 |
Table 9.6
Non-financial Public sector balance sheet 1
| | | | | | | | | | | | | | | | | | |
| | | 2006-07
Budget2 $ million | | | 2006-07
Est.Actual
$ million | | | 2007-08
Budget $ million | | | 2008-09
Projection
$ million | | | 2009-10
Projection
$ million | | | 2010-11
Projection
$ million | |
Assets | | | | | | | | | | | | | | | | | | |
Financial Assets | | | | | | | | | | | | | | | | | | |
Cash and deposits | | 1,018 | | | 4,308 | | | 3,566 | | | 3,130 | | | 3,054 | | | 3,109 | |
Advances paid | | 770 | | | 851 | | | 990 | | | 1,031 | | | 1,082 | | | 1,114 | |
Investments, loans and placements | | 25,156 | | | 28,545 | | | 30,198 | | | 31,869 | | | 33,693 | | | 35,585 | |
Other non-equity assets | | 2,831 | | | 3,001 | | | 2,739 | | | 2,785 | | | 2,724 | | | 2,682 | |
Equity | | 1,323 | | | 2,215 | | | 2,255 | | | 2,269 | | | 2,283 | | | 2,299 | |
Total Financial Assets | | 31,097 | | | 38,920 | | | 39,748 | | | 41,083 | | | 42,836 | | | 44,788 | |
| | | | | | |
Non-Financial Assets | | 119,072 | | | 127,532 | | | 141,316 | | | 152,353 | | | 162,415 | | | 171,752 | |
| | | | | | |
Total Assets | | 150,169 | | | 166,452 | | | 181,064 | | | 193,436 | | | 205,252 | | | 216,540 | |
| | | | | | |
Liabilities | | | | | | | | | | | | | | | | | | |
Deposits held | | 75 | | | 68 | | | 66 | | | 66 | | | 67 | | | 67 | |
Advances received | | 455 | | | 460 | | | 448 | | | 436 | | | 432 | | | 427 | |
Borrowing | | 21,748 | | | 22,527 | | | 30,817 | | | 38,637 | | | 45,519 | | | 51,725 | |
Superannuation liability | | 19,381 | | | 19,195 | | | 20,369 | | | 21,519 | | | 22,605 | | | 23,697 | |
Other employee entitlements and provisions | | 5,218 | | | 5,962 | | | 6,129 | | | 6,297 | | | 6,563 | | | 6,850 | |
Other non-equity liabilities | | 4,259 | | | 3,775 | | | 3,438 | | | 3,178 | | | 2,994 | | | 2,833 | |
Total Liabilities | | 51,137 | | | 51,986 | | | 61,265 | | | 70,133 | | | 78,180 | | | 85,599 | |
| | | | | | |
Net Worth | | 99,032 | | | 114,466 | | | 119,799 | | | 123,302 | | | 127,072 | | | 130,941 | |
Net Financial Worth | | (20,040 | ) | | (13,066 | ) | | (21,517 | ) | | (29,051 | ) | | (35,344 | ) | | (40,811 | ) |
Net Debt | | (4,666 | ) | | (10,650 | ) | | (3,424 | ) | | 3,110 | | | 8,189 | | | 12,411 | |
Notes:
| 1. | Numbers may not add due to rounding. |
| 2. | Numbers have been restated where subsequent changes in classification have occurred. |
| | | | | | |
| 166 | | Budget Strategy and Outlook 2007-08 | | |
Table 9.7
General Government sector cash flow statement 1
| | | | | | | | | | | | | | | | | | |
| | | 2006-07
Budget $ million | | | 2006-07
Est.Actual
$ million | | | 2007-08
Budget $ million | | | 2008-09
Projection
$ million | | | 2009-10
Projection
$ million | | | 2010-11
Projection
$ million | |
Receipts from operating activities | | | | | | | | | | | | | | | | | | |
Taxes received | | 7,870 | | | 8,374 | | | 9,271 | | | 10,066 | | | 10,748 | | | 11,567 | |
Grants and subsidies received | | 13,768 | | | 14,171 | | | 15,029 | | | 14,726 | | | 14,910 | | | 15,407 | |
Sales of goods and services | | 2,993 | | | 3,238 | | | 3,347 | | | 3,354 | | | 3,432 | | | 3,533 | |
Other receipts | | 5,259 | | | 6,820 | | | 6,410 | | | 5,739 | | | 6,071 | | | 6,160 | |
Total | | 29,890 | | | 32,603 | | | 34,057 | | | 33,884 | | | 35,161 | | | 36,666 | |
| | | | | | |
Payments for operating activities | | | | | | | | | | | | | | | | | | |
Payments for goods and services | | (19,161 | ) | | (18,710 | ) | | (20,448 | ) | | (21,573 | ) | | (22,562 | ) | | (23,478 | ) |
Grants and subsidies | | (7,036 | ) | | (7,352 | ) | | (8,141 | ) | | (7,612 | ) | | (7,607 | ) | | (7,708 | ) |
Interest | | (223 | ) | | (218 | ) | | (391 | ) | | (662 | ) | | (960 | ) | | (1,146 | ) |
Other payments | | (609 | ) | | (755 | ) | | (838 | ) | | (738 | ) | | (679 | ) | | (703 | ) |
Total | | (27,030 | ) | | (27,034 | ) | | (29,817 | ) | | (30,584 | ) | | (31,808 | ) | | (33,036 | ) |
| | | | | | |
Net cash inflows from operating activities | | 2,860 | | | 5,569 | | | 4,240 | | | 3,300 | | | 3,352 | | | 3,630 | |
| | | | | | |
Payments for investments in non-financial assets | | | | | | | | | | | | | | | | | | |
Purchases of non-financial assets | | (3,958 | ) | | (4,137 | ) | | (5,463 | ) | | (5,839 | ) | | (5,899 | ) | | (5,947 | ) |
Sales of non-financial assets | | 302 | | | 290 | | | 331 | | | 291 | | | 249 | | | 272 | |
Total | | (3,656 | ) | | (3,847 | ) | | (5,132 | ) | | (5,548 | ) | | (5,650 | ) | | (5,675 | ) |
| | | | | | |
Payments for investments in financial assets for policy purposes | | (318 | ) | | 1,409 | | | (885 | ) | | (625 | ) | | (282 | ) | | (158 | ) |
| | | | | | |
Payments for investments in financial assets for liquidity purposes | | (1,272 | ) | | (3,617 | ) | | (1,583 | ) | | (1,619 | ) | | (1,764 | ) | | (1,828 | ) |
| | | | | | |
Receipts from financing activities | | | | | | | | | | | | | | | | | | |
Advances received (net) | | (15 | ) | | (15 | ) | | (14 | ) | | (15 | ) | | (7 | ) | | (7 | ) |
Borrowing (net) | | 1,800 | | | 743 | | | 3,569 | | | 4,275 | | | 4,193 | | | 4,021 | |
Other financing (net) | | — | | | — | | | — | | | (1 | ) | | — | | | — | |
Total | | 1,785 | | | 729 | | | 3,555 | | | 4,259 | | | 4,186 | | | 4,014 | |
| | | | | | |
Net increase/(decrease) in cash held | | (602 | ) | | 242 | | | 195 | | | (234 | ) | | (159 | ) | | (17 | ) |
| | | | | | |
Net cash from operating activities and investments in non-financial assets | | (796 | ) | | 1,722 | | | (892 | ) | | (2,248 | ) | | (2,298 | ) | | (2,045 | ) |
GFS Surplus/(deficit) | | (796 | ) | | 1,722 | | | (892 | ) | | (2,248 | ) | | (2,298 | ) | | (2,045 | ) |
Note:
| 1. | Numbers may not add due to rounding. |
| | | | | | |
| | Budget Strategy and Outlook 2007-08 | | 167 |
Table 9.8
Public Non-financial Corporations sector cash flow statement 1
| | | | | | | | | | | | | | | | | | |
| | | 2006-07
Budget
$ million | | | 2006-07
Est.Actual
$ million | | | 2007-08
Budget
$ million | | | 2008-09
Projection
$ million | | | 2009-10
Projection
$ million | | | 2010-11
Projection
$ million | |
Receipts from operating activities | | | | | | | | | | | | | | | | | | |
Grants and subsidies received | | 1,577 | | | 1,624 | | | 2,242 | | | 1,704 | | | 1,727 | | | 1,770 | |
Sales of goods and services | | 9,143 | | | 8,768 | | | 7,395 | | | 7,951 | | | 8,645 | | | 9,136 | |
Other receipts | | 1,116 | | | 1,061 | | | 1,089 | | | 1,001 | | | 953 | | | 885 | |
Total | | 11,837 | | | 11,454 | | | 10,726 | | | 10,656 | | | 11,325 | | | 11,791 | |
| | | | | | |
Payments for operating activities | | | | | | | | | | | | | | | | | | |
Payments for goods and services | | (6,568 | ) | | (5,990 | ) | | (5,161 | ) | | (5,233 | ) | | (5,326 | ) | | (5,403 | ) |
Grants and subsidies | | (180 | ) | | (51 | ) | | (32 | ) | | .. | | | .. | | | .. | |
Interest | | (879 | ) | | (909 | ) | | (1,075 | ) | | (1,200 | ) | | (1,320 | ) | | (1,429 | ) |
Other payments | | (1,144 | ) | | (1,254 | ) | | (1,007 | ) | | (1,061 | ) | | (1,105 | ) | | (1,146 | ) |
Total | | (8,771 | ) | | (8,203 | ) | | (7,275 | ) | | (7,495 | ) | | (7,751 | ) | | (7,979 | ) |
| | | | | | |
Net cash inflows from operating activities | | 3,065 | | | 3,251 | | | 3,451 | | | 3,161 | | | 3,573 | | | 3,812 | |
| | | | | | |
Payments for investments in non-financial assets | | | | | | | | | | | | | | | | | | |
Purchases of non-financial assets | | (5,603 | ) | | (7,436 | ) | | (7,919 | ) | | (6,423 | ) | | (5,382 | ) | | (4,772 | ) |
Sales of non-financial assets | | 49 | | | 191 | | | 84 | | | 148 | | | 144 | | | 117 | |
Total | | (5,554 | ) | | (7,245 | ) | | (7,836 | ) | | (6,275 | ) | | (5,238 | ) | | (4,656 | ) |
| | | | | | |
Payments for investments in financial assets for policy purposes | | — | | | 2,982 | | | — | | | — | | | — | | | — | |
| | | | | | |
Payments for investments in financial assets for liquidity purposes | | (43 | ) | | 187 | | | (11 | ) | | — | | | — | | | — | |
| | | | | | |
Receipts from financing activities | | | | | | | | | | | | | | | | | | |
Borrowing (net) | | 2,786 | | | 3,761 | | | 4,433 | | | 3,287 | | | 2,524 | | | 1,990 | |
Deposits received (net) | | — | | | 20 | | | (3 | ) | | 1 | | | 1 | | | 1 | |
Distributions paid | | (816 | ) | | (929 | ) | | (1,833 | ) | | (1,002 | ) | | (1,060 | ) | | (1,235 | ) |
Other financing (net) | | 318 | | | (1,086 | ) | | 860 | | | 625 | | | 282 | | | 158 | |
Total | | 2,289 | | | 1,766 | | | 3,458 | | | 2,911 | | | 1,747 | | | 915 | |
| | | | | | |
Net increase/(decrease) in cash held | | (243 | ) | | 940 | | | (938 | ) | | (203 | ) | | 83 | | | 71 | |
| | | | | | |
Net cash from operating activities and investments in non-financial assets | | (2,489 | ) | | (3,995 | ) | | (4,385 | ) | | (3,114 | ) | | (1,665 | ) | | (844 | ) |
Distributions paid | | (816 | ) | | (929 | ) | | (1,833 | ) | | (1,002 | ) | | (1,060 | ) | | (1,235 | ) |
GFS Surplus/(deficit) | | (3,305 | ) | | (4,924 | ) | | (6,218 | ) | | (4,116 | ) | | (2,725 | ) | | (2,078 | ) |
Note:
| 1. | Numbers may not add due to rounding. |
| | | | | | |
| 168 | | Budget Strategy and Outlook 2007-08 | | |
Table 9.9
Non-financial Public sector cash flow statement 1
| | | | | | | | | | | | | | | | | | |
| | | 2006-07
Budget $ million | | | 2006-07
Est.Actual
$ million | | | 2007-08
Budget $ million | | | 2008-09
Projection
$ million | | | 2009-10
Projection
$ million | | | 2010-11
Projection
$ million | |
Receipts from operating activities | | | | | | | | | | | | | | | | | | |
Taxes received | | 7,517 | | | 8,034 | | | 9,125 | | | 9,908 | | | 10,582 | | | 11,391 | |
Grants and subsidies received | | 13,743 | | | 14,267 | | | 15,165 | | | 14,816 | | | 15,005 | | | 15,507 | |
Sales of goods and services | | 11,980 | | | 11,797 | | | 10,568 | | | 11,129 | | | 11,910 | | | 12,507 | |
Other receipts | | 5,560 | | | 6,959 | | | 5,670 | | | 5,742 | | | 5,967 | | | 5,813 | |
Total | | 38,801 | | | 41,056 | | | 40,528 | | | 41,595 | | | 43,463 | | | 45,219 | |
| | | | | | |
Payments for operating activities | | | | | | | | | | | | | | | | | | |
Payments for goods and services | | (25,573 | ) | | (24,514 | ) | | (25,456 | ) | | (26,653 | ) | | (27,742 | ) | | (28,741 | ) |
Grants and subsidies | | (5,615 | ) | | (5,875 | ) | | (6,067 | ) | | (5,999 | ) | | (5,976 | ) | | (6,038 | ) |
Interest | | (1,102 | ) | | (1,127 | ) | | (1,466 | ) | | (1,862 | ) | | (2,280 | ) | | (2,576 | ) |
Other payments | | (1,400 | ) | | (1,650 | ) | | (1,682 | ) | | (1,623 | ) | | (1,600 | ) | | (1,656 | ) |
Total | | (33,691 | ) | | (33,166 | ) | | (34,670 | ) | | (36,137 | ) | | (37,598 | ) | | (39,011 | ) |
| | | | | | |
Net cash inflows from operating activities | | 5,110 | | | 7,890 | | | 5,858 | | | 5,459 | | | 5,865 | | | 6,208 | |
| | | | | | |
Payments for investments in non-financial assets | | | | | | | | | | | | | | | | | | |
Purchases of non-financial assets | | (9,561 | ) | | (11,573 | ) | | (13,383 | ) | | (12,262 | ) | | (11,281 | ) | | (10,719 | ) |
Sales of non-financial assets | | 351 | | | 481 | | | 415 | | | 439 | | | 393 | | | 388 | |
Total | | (9,211 | ) | | (11,092 | ) | | (12,968 | ) | | (11,823 | ) | | (10,888 | ) | | (10,331 | ) |
| | | | | | |
Payments for investments in financial assets for policy purposes | | — | | | 3,223 | | | (25 | ) | | — | | | — | | | — | |
| | | | | | |
Payments for investments in financial assets for liquidity purposes | | (1,315 | ) | | (3,430 | ) | | (1,594 | ) | | (1,619 | ) | | (1,764 | ) | | (1,827 | ) |
| | | | | | |
Receipts from financing activities | | | | | | | | | | | | | | | | | | |
Advances received (net) | | (15 | ) | | (15 | ) | | (14 | ) | | (15 | ) | | (7 | ) | | (7 | ) |
Borrowing (net) | | 4,586 | | | 4,505 | | | 8,002 | | | 7,562 | | | 6,717 | | | 6,011 | |
Deposits received (net) | | — | | | 21 | | | (2 | ) | | 1 | | | 1 | | | 1 | |
Other financing (net) | | — | | | 82 | | | — | | | (1 | ) | | — | | | — | |
Total | | 4,572 | | | 4,592 | | | 7,987 | | | 7,547 | | | 6,711 | | | 6,005 | |
| | | | | | |
Net increase/(decrease) in cash held | | (844 | ) | | 1,183 | | | (742 | ) | | (437 | ) | | (76 | ) | | 55 | |
Net cash from operating activities and investments in non-financial assets | | (4,101 | ) | | (3,202 | ) | | (7,110 | ) | | (6,364 | ) | | (5,023 | ) | | (4,123 | ) |
GFS Surplus/(deficit) | | (4,101 | ) | | (3,202 | ) | | (7,110 | ) | | (6,364 | ) | | (5,023 | ) | | (4,123 | ) |
Note:
| 1. | Numbers may not add due to rounding. |
| | | | | | |
| | Budget Strategy and Outlook 2007-08 | | 169 |
RECONCILIATION OF GFS NET OPERATING BALANCE TO ACCOUNTING SURPLUS
The primary difference between GFS net operating balance and the accounting surplus calculated under Australian Accounting Standards (AAS) is that valuation adjustments are excluded from the GFS net operating balance.
Data presented in Table 9.10 provides a reconciliation of the General Government sector GFS net operating balance to the accounting surplus.
Table 9.10
Reconciliation of GFS net operating balance to accounting surplus1
| | | | | | | | | |
| | | 2006-07
Budget
$ million | | | 2006-07
Est.Act.
$ million | | | 2007-08
Budget
$ million | |
GFS net operating balance General Government sector | | 245 | | | 2,393 | | | 268 | |
| | | |
Remeasurement/valuation adjustments | | | | | | | | | |
Bad debts and amortisation | | (43 | ) | | (43 | ) | | (40 | ) |
Deferred tax equivalents | | — | | | 123 | | | 210 | |
Dividends received on Energy retail privatisation | | — | | | 1,118 | | | — | |
Gain on transfer of Golden Casket shares to Tattersall’s | | — | | | 395 | | | — | |
Market value adjustments investments/loans | | 9 | | | 55 | | | 30 | |
Revaluation of provisions | | (36 | ) | | 58 | | | (18 | ) |
Decommissioned infrastructure assets and land under roads | | (145 | ) | | (145 | ) | | (143 | ) |
Gain/(loss) on assets sold/written off | | — | | | 22 | | | 11 | |
| | | |
AAS net surplus General Government sector | | 30 | | | 3,976 | | | 318 | |
Note:
| 1. | Numbers may not add due to rounding. |
| | | | | | |
| 170 | | Budget Strategy and Outlook 2007-08 | | |
GENERAL GOVERNMENT TIME SERIES
Data presented in Table 9.11 provides a time series from 1999-2000 for the General Government sector on the key GFS indicators used by the Government to measure financial performance.
Table 9.11
General Government sector 1
| | | | | | | | | | | | | | | | | | | | | | | |
| | | | | 1999-00
Actual $ million | | | 2000-01
Actual $ million | | | 2001-02
Actual $ million | | | 2002-03
Actual $ million | | | 2003-04
Actual $ million | | | 2004-05
Actual $ million | | | 2005-06
Actual $ million | |
OPERATING STATEMENT | | | | | | | | | | | | | | | | | | | | | |
| | GFS Revenue | | | | | | | | | | | | | | | | | | | | | |
| | Taxation revenue | | 5,051 | | | 4,255 | | | 4,815 | | | 5,598 | | | 6,676 | | | 6,952 | | | 7,396 | |
| | Current grants and subsidies | | 6,203 | | | 8,539 | | | 9,520 | | | 10,175 | | | 10,992 | | | 12,255 | | | 12,955 | |
| | Capital grants | | 448 | | | 483 | | | 696 | | | 510 | | | 553 | | | 491 | | | 627 | |
| | Sales of goods and services | | 1,695 | | | 1,747 | | | 1,837 | | | 1,964 | | | 2,105 | | | 2,381 | | | 2,586 | |
| | Interest income | | 1,773 | | | 852 | | | (464 | ) | | (128 | ) | | 2,723 | | | 2,972 | | | 3,414 | |
| | Other | | 2,222 | | | 2,382 | | | 2,453 | | | 2,138 | | | 2,165 | | | 2,558 | | | 3,106 | |
| | Total Revenue | | 17,392 | | | 18,258 | | | 18,857 | | | 20,257 | | | 25,214 | | | 27,609 | | | 30,084 | |
| | | | | | | | |
Less | | GFS Expenses | | | | | | | | | | | | | | | | | | | | | |
| | Gross operating expenses | | 11,060 | | | 12,844 | | | 13,733 | | | 14,562 | | | 15,709 | | | 17,018 | | | 19,195 | |
| | Superannuation interest expense | | 710 | | | 467 | | | 626 | | | 630 | | | 750 | | | 752 | | | 526 | |
| | Other interest expense | | 283 | | | 339 | | | 223 | | | 220 | | | 211 | | | 207 | | | 173 | |
| | Current transfers | | 3,511 | | | 4,413 | | | 4,713 | | | 4,271 | | | 4,500 | | | 4,915 | | | 5,546 | |
| | Capital transfers | | 766 | | | 1,052 | | | 456 | | | 558 | | | 704 | | | 791 | | | 930 | |
| | Total Expenses | | 16,330 | | | 19,115 | | | 19,751 | | | 20,241 | | | 21,874 | | | 23,683 | | | 26,370 | |
| | | | | | | | |
Equals | | GFS net operating balance | | 1,062 | | | (857 | ) | | (894 | ) | | 16 | | | 3,340 | | | 3,926 | | | 3,714 | |
| | | | | | | |
OTHER KEY AGGREGATES | | | | | | | | | | | | | | | | | | | | | |
Purchases of non-financial assets | | 2,992 | | | 2,520 | | | 2,416 | | | 2,232 | | | 2,415 | | | 2,843 | | | 3,186 | |
Net acquisition of non-financial assets | | 1,166 | | | 813 | | | 708 | | | 155 | | | 503 | | | 1,053 | | | 1,236 | |
GFS Net lending / (borrowing) (Fiscal Balance) | | (104 | ) | | (1,671 | ) | | (1,602 | ) | | (140 | ) | | 2,838 | | | 2,873 | | | 2,478 | |
| | | | | | | |
Net Worth | | 57,293 | | | 57,623 | | | 58,093 | | | 64,894 | | | 77,723 | | | 96,433 | | | 105,035 | |
| | | | | | | |
Net Debt | | (10,122 | ) | | (10,671 | ) | | (11,612 | ) | | (11,843 | ) | | (14,851 | ) | | (19,446 | ) | | (23,243 | ) |
| | | | | | | |
Cash Surplus/Deficit | | (1,281 | ) | | 534 | | | 188 | | | 645 | | | 3,490 | | | 4,640 | | | 4,648 | |
Note:
| 1. | Numbers may not add due to rounding. |
Source: Budget Papers and Outcomes Reports for Queensland 1999-2000 to 2005-06. (Numbers have been restated where subsequent changes in classification have occurred.)
| | | | | | |
| | Budget Strategy and Outlook 2007-08 | | 171 |
OTHER GENERAL GOVERNMENT GFS DATA
Data presented in the following tables are presented in accordance with GFS and Uniform Presentation Framework guidelines which present data on a consolidated basis.
Expenses by function
Data presented in Table 9.12 provides details of General Government sector expenses by function.
Table 9.12
General Government sector expenses by function1
| | | | | | | | | | | | |
| | | 2006-07
Budget
$ million | | 2006-07
Est. Act.
$ million | | 2007-08
Budget
$ million | | 2008-09
Projection
$ million | | 2009-10
Projection
$ million | | 2010-11
Projection
$ million |
General public services | | 1,593 | | 1,813 | | 1,744 | | 1,738 | | 1,720 | | 1,891 |
Public order and safety | | 2,728 | | 2,592 | | 2,924 | | 3,109 | | 3,242 | | 3,360 |
Education | | 6,947 | | 7,298 | | 7,403 | | 7,734 | | 8,018 | | 8,378 |
Health | | 6,851 | | 7,120 | | 7,745 | | 8,607 | | 9,118 | | 9,519 |
Social security and welfare | | 1,591 | | 1,746 | | 1,917 | | 1,950 | | 1,976 | | 2,057 |
Housing and community amenities | | 1,166 | | 1,016 | | 1,511 | | 1,065 | | 1,102 | | 1,110 |
Recreation and culture | | 683 | | 711 | | 787 | | 766 | | 734 | | 748 |
Fuel and energy | | 958 | | 925 | | 1,048 | | 952 | | 990 | | 1,060 |
Agriculture, forestry, fishing and hunting | | 824 | | 1,131 | | 886 | | 668 | | 662 | | 686 |
Mining, manufacturing and construction | | 124 | | 129 | | 131 | | 135 | | 136 | | 135 |
Transport and communications | | 3,070 | | 3,407 | | 3,521 | | 3,566 | | 3,576 | | 3,638 |
Other economic affairs | | 765 | | 632 | | 753 | | 731 | | 785 | | 727 |
Other purposes | | 1,526 | | 1,644 | | 1,912 | | 2,034 | | 2,305 | | 2,457 |
| | | | | | |
Total Expenses | | 28,825 | | 30,164 | | 32,282 | | 33,056 | | 34,364 | | 35,766 |
Note:
| 1. | Numbers may not add due to rounding. |
| | | | | | |
| 172 | | Budget Strategy and Outlook 2007-08 | | |
Purchases of non-financial assets by function
Data presented in Table 9.13 provides details of General Government sector purchases of non-financial assets by function.
Table 9.13
General Government sector purchases of non-financial assets by function 1
| | | | | | |
| | | 2006-07
Budget
$ million | | 2006-07
Est. Act.
$ million | | 2007-08
Budget
$ million |
General public services | | 313 | | 330 | | 349 |
Public order and safety | | 507 | | 388 | | 725 |
Education | | 373 | | 441 | | 439 |
Health | | 515 | | 510 | | 556 |
Social security and welfare | | 79 | | 59 | | 170 |
Housing and community amenities | | 332 | | 315 | | 368 |
Recreation and culture | | 124 | | 131 | | 94 |
Agriculture, forestry, fishing and hunting | | 103 | | 190 | | 51 |
Mining, manufacturing and construction | | 4 | | 3 | | 7 |
Transport and communications | | 1,564 | | 1,742 | | 2,648 |
Other economic affairs | | 43 | | 29 | | 55 |
Other purposes | | 1 | | — | | — |
| | | |
Total Purchases | | 3,958 | | 4,137 | | 5,463 |
Note:
| 1. | Numbers may not add due to rounding. |
| | | | | | |
| | Budget Strategy and Outlook 2007-08 | | 173 |
Taxes
Data presented in Table 9.14 provides details of taxation revenue collected by the General Government sector.
Table 9.14
General Government sector taxes 1
| | | | |
| | | 2006-07
Est.Actual
$ million | | 2007-08
Budget
$ million |
Taxes on employers’ payroll and labour force | | 2,175 | | 2,411 |
| | |
Taxes on property | | | | |
Land taxes | | 523 | | 622 |
Stamp duties on financial and capital transactions | | 2,795 | | 3,142 |
Other | | 357 | | 362 |
| | |
Taxes on the provision of goods and services | | | | |
Taxes on gambling | | 826 | | 868 |
Taxes on insurance | | 426 | | 454 |
| | |
Taxes on use of goods and performance of activities | | | | |
Motor vehicle taxes | | 1,150 | | 1,285 |
Other | | 123 | | 128 |
| | |
Total Taxation Revenue | | 8,375 | | 9,272 |
Note:
| 1. | Numbers may not add due to rounding. |
| | | | | | |
| 174 | | Budget Strategy and Outlook 2007-08 | | |
Loan Council Allocation
The Australian Loan Council requires all jurisdictions to prepare Loan Council Allocations (LCA) to provide an indication of each government’s probable call on financial markets over the forthcoming financial year.
Table 9.15 presents the State’s revised LCA Budget allocation and the Loan Council endorsed LCA for 2007-08.
Table 9.15
Loan Council Allocation 1
| | | | | | | |
| | | | | 2007-08
Nomination
$ million | | 2007-08
Budget $ million | |
| | General Government sector cash deficit/(surplus) 2 | | 995 | | 892 | |
| | PNFC sector cash deficit/(surplus) 2 | | 4,694 | | 6,218 | |
| | | |
| | Non-financial Public Sector cash deficit/(surplus) 2 | | 5,688 | | 7,110 | |
| | | |
| Less | | Net cash flows from investments in financial assets for policy purposes | | — | | (25 | ) |
| | | |
| Plus | | Memorandum items 3 | | 77 | | 77 | |
| | | |
| | Loan Council Allocation | | 5,765 | | 7,212 | |
Notes:
| 1. | Numbers may not add due to rounding. |
| 2. | Figures in brackets represent surpluses. |
| 3. | Memorandum items include operating leases and local government borrowings. |
The State’s Budget LCA allocation is a deficit of $7.212 billion. This compares to the LCA nomination in March 2007 of $5.765 billion.
A tolerance limit of two per cent of Non-financial Public sector receipts applies between the LCA nomination and the Budget allocation. For 2007-08, the LCA Budget allocation exceeds the LCA nomination by more than the two per cent tolerance limit.
The increased deficit is largely due to higher net borrowing requirements as a result of increased spending on capital infrastructure in the PNFC sector.
| | | | | | |
| | Budget Strategy and Outlook 2007-08 | | 175 |
BACKGROUND AND INTERPRETATION OF GOVERNMENT FINANCE STATISTICS
Accrual GFS framework
The GFS reporting framework, developed by the Australian Bureau of Statistics (ABS), is based on international statistical standards (the International Monetary Fund Manual on Government Finance Statistics and the United Nations System of National Accounts). This allows comprehensive assessments to be made of the economic impact of government.
Nature of the GFS framework
The accrual GFS framework is based on an integrated recording of stocks and flows. Stocks refer to a unit’s holdings of assets, liabilities and net worth at a point in time, whilst flows represent the movement in the stock of assets and liabilities between two points in time. Flows comprise two separate types, transactions and other economic flows. Transactions come about as a result of mutually agreed interactions between units or within a single unit. Other economic flows would include revaluations and destruction or discovery of assets that do not result from a transaction. In GFS operating statements, other economic flows, being outside of the control of government, are excluded and do not affect the net operating result.
The GFS statements reported in the Budget are the operating statement, balance sheet and cash flow statement.
Operating statement
This statement is designed to capture the details of transaction flows of GFS revenue and GFS expense items as well as net acquisitions of non-financial assets for an accounting period. Unlike operating statements prepared on Australian Accounting Standard principles, a GFS operating statement reports two major fiscal measures – the GFS net operating balance and GFS net lending/borrowing.
Net operating balance is represented by GFS revenues less GFS expenses and excludes any other economic flows such as revaluations, gains or losses on asset disposals and allowances for doubtful debts.
Net lending is the net operating balance less net acquisition of non-financial assets. It is also referred to as the fiscal balance. It measures, in accrual terms, the gap between Government savings plus net capital transfers and investment in non-financial assets. A surplus indicates that the State Government is placing financial resources at the disposal of other sectors of the economy, whilst a deficit reflects the State utilising the financial resources of other sectors.
| | | | | | |
| 176 | | Budget Strategy and Outlook 2007-08 | | |
Balance sheet
The balance sheet shows stocks of financial and non-financial assets and liabilities. Key indicators in the balance sheet are net debt and net worth.
Net debt is represented by the sum of selected financial liabilities (such as deposits held, advances received and borrowings) minus the sum of selected financial assets (cash and deposits, loans and placements). It provides an indication of the strength of a government’s financial position.
Net worth, also known as net assets, is defined as total assets less total liabilities. It provides a more comprehensive picture of a government’s position as all assets and liabilities are taken into account.
Net financial worth, on the other hand, is calculated as financial assets minus total liabilities. It measures a government’s net holdings of financial assets.
Cash flow statement
Cash means cash on hand (notes and coins held and deposits held at call with a bank or financial institution) and cash equivalents (highly liquid investments readily convertible to cash and overdrafts considered integral to the cash management functions). The cash flow statement demonstrates how cash is generated and applied in a single accounting period.
The GFS surplus/deficit is the cash counterpart of the fiscal balance as disclosed in the GFS operating statement. A surplus reflects the availability of cash to increase the State’s financial assets or decrease its liabilities, whilst a deficit reflects the requirement for cash either by running down the State’s financial assets or by drawing on the cash reserves of other sectors of the economy. It comprises net cash received/paid from operating activities, from sales and purchases of non-financial assets and from financing activities.
SECTOR CLASSIFICATION
GFS data is presented by institutional sector, distinguishing between the General Government sector and the Public Non-financial Corporations (PNFC) sector.
Budget reporting focuses on the General Government sector, which provides regulatory services and goods and services of a non-market nature that are provided at less than cost or at no cost. These services are largely financed by general revenue (Australian Government grants and state taxation). This sector comprises government departments, their commercialised business units/shared service providers and certain statutory bodies.
| | | | | | |
| | Budget Strategy and Outlook 2007-08 | | 177 |
The PNFC sector comprises bodies that provide mainly market goods and services that are of a non-regulatory and non-financial nature. PNFCs are financed through sales to consumers of their goods and services and may be supplemented by explicit government subsidy to satisfy community service obligations. In general, PNFCs are legally distinguishable from the governments that own them. Examples of PNFCs include Queensland Rail and the energy entities.
Together, the General Government sector and the PNFC sector comprise the Non-financial Public sector.
Further discussion of the GFS framework of reporting, including definitions of GFS terms, can be obtained from the webpage of the Australian Bureau of Statistics at www.abs.gov.au.
REPORTING ENTITIES
The reporting entities included in the General Government and PNFC sectors are provided below.
General Government
Departments
|
Child Safety |
Communities |
Corrective Services |
Disability Services Queensland |
Education, Training and the Arts |
Electoral Commission of Queensland |
Emergency Services |
Employment and Industrial Relations |
Environmental Protection Agency |
Forestry Plantations Queensland Office |
Health |
Housing |
Infrastructure |
Justice and Attorney-General |
Legislative Assembly |
Local Government, Planning, Sport and Recreation |
Main Roads |
Mines and Energy |
Natural Resources and Water |
Office of the Governor |
Office of the Ombudsman |
Office of the Public Service Commissioner |
Police |
Premier and Cabinet |
Primary Industries and Fisheries |
Public Works |
Queensland Audit Office |
State Development |
The Public Trustee of Queensland |
Tourism, Fair Trading and Wine Industry Development |
Transport |
Treasury |
| | | | | | |
| 178 | | Budget Strategy and Outlook 2007-08 | | |
Statutory Authorities
|
Airport Link |
Anti-Discrimination Commission Queensland |
Australian Agricultural College Corporation |
Board of the Queensland Museum |
Commission for Children and Young People and Child Guardian |
Crime and Misconduct Commission |
Health Quality and Complaints Commission |
Legal Aid Queensland |
Library Board of Queensland |
Motor Accident Insurance Commission |
Nominal Defendant |
Prostitution Licensing Authority |
Queensland Art Gallery Board of Trustees |
Queensland Building Services Authority |
Queensland Events Corporation Pty Ltd |
Queensland Future Growth Corporation |
Queensland Institute of Medical Research |
Queensland Performing Arts Trust |
Queensland Studies Authority |
Queensland Treasury Holdings Pty Ltd |
Queensland Rural Adjustment Authority (QRAA) |
Residential Tenancies Authority |
Service Delivery and Performance Commission |
SGH Ltd |
South Bank Corporation |
The Office of the Information Commissioner |
Tourism Queensland |
Workers Compensation Regulatory |
Authority (Q-Comp) |
Commercialised Business Units
|
CITEC |
GoPrint |
Main Roads – RoadTek |
Project Services |
Property Services Group |
Q-Build |
Q-Fleet |
Sales and Distribution Services |
Shared Service Providers
|
Corporate Administration Agency |
Corporate and Professional Services |
CorpTech |
Queensland Health Shared Service Provider |
Shared Service Agency |
| | | | | | |
| | Budget Strategy and Outlook 2007-08 | | 179 |
Public Non-financial Corporations
|
Betty Rees Group Pty Ltd (CRT) |
Bundaberg Port Authority |
Burnett Water Pty Ltd |
Cairns Port Authority |
Central Queensland Port Authority |
CS Energy Ltd |
DBCT Holdings Pty Ltd |
ENERGEX Ltd |
Ergon Energy Corporation Ltd |
Eungella Water Pipeline Pty Ltd |
Forestry Plantations Queensland |
Gladstone Area Water Board |
Gold Coast Events Co Pty Ltd |
Golden Casket Lottery Corporation Ltd |
Heritage Train Company Pty Ltd |
Mackay Port Authority |
Major Sports Facilities Authority |
Mount Isa Water Board |
National Logistics Alliance Pty Ltd |
North West Queensland Water Pipeline Pty Ltd |
On Track Insurance Pty Ltd |
Port of Brisbane Corporation |
Ports Corporation of Queensland |
Powerlink Queensland |
Queensland Lotteries Corporation |
Queensland Motorways Ltd |
Queensland Power Trading Corporation (Enertrade) |
Queensland Rail (QR) |
Interail Australia Pty Ltd |
Queensland Water Infrastructure |
Stanwell Corporation Ltd |
SunWater |
Tarong Energy Corporation Ltd |
The Trustees of Parklands Gold Coast |
Townsville Port Authority |
ZeroGen Pty Ltd |
| | | | | | |
| 180 | | Budget Strategy and Outlook 2007-08 | | |
APPENDIX A – TAX EXPENDITURE STATEMENT
OVERVIEW
Governments employ a range of policy tools to achieve social and economic objectives. These include the use of direct budgetary outlays, regulatory mechanisms and taxation. As required by the Charter of Social and Fiscal Responsibility, this Tax Expenditure Statement (TES) details revenue foregone as a result of Government decisions relating to the provision of tax concessions. The TES is designed to improve transparency in the use of tax expenditures and increase public understanding of the fiscal process.
Tax expenditures are reductions in tax revenue that result from the use of the taxation system as a policy tool to deliver Government policy objectives. Tax expenditures are provided through a range of concessions, including:
| • | | the application of reduced tax rates to certain groups or sectors of the community |
| • | | provisions which defer payment of a tax liability to a future period. |
Labelling an exemption or concession as a tax expenditure does not necessarily imply any judgement as to its appropriateness. It merely makes the amount of the exemption or concession explicit and thereby facilitates its scrutiny as part of the annual Budget process.
Methodology
Revenue foregone approach
The method used almost exclusively by governments to quantify the value of their tax expenditures is the revenue foregone approach. This method estimates the revenue foregone through use of the concession by applying the benchmark rate of taxation to the volume of activities or assets affected by the concession. One of the deficiencies of the revenue foregone approach is that the effect on taxpayer behaviour resulting from the removal of the particular tax expenditure is not factored into the estimate. Consequently, the aggregation of costings for individual tax expenditure items presented in the TES will not necessarily provide an accurate estimate of the total level of assistance provided through tax expenditures.
| | | | | | |
| | Budget Strategy and Outlook 2007-08 | | 181 |
Measuring tax expenditures requires the identification of:
| • | | concessionally taxed components of the benchmark tax base such as a specific activity or class of taxpayer |
| • | | a benchmark tax rate to apply to the concessionally taxed components of the tax base. |
Defining the tax benchmark
The most important step in the preparation of a TES is the establishment of a benchmark for each tax included in the statement. The benchmark provides a basis against which each tax concession can be evaluated. The aim of the benchmark is to determine which concessions are tax expenditures as opposed to structural elements of the tax. The key features of a tax benchmark are:
| • | | any specific accounting conventions applicable to the tax |
| • | | the deductibility of compulsory payments |
| • | | any provisions to facilitate administration |
| • | | provisions relating to any fiscal obligations. |
By definition, tax expenditures are those tax concessions not included as part of the tax benchmark.
Identification of benchmark revenue bases and rates requires a degree of judgement and is not definitive. Furthermore, data limitations mean that the tax expenditures are approximations and are not exhaustive. This statement does not include estimates of revenue foregone from exemptions or concessions provided to Government agencies. Very small exemptions or concessions are also excluded.
THE TAX EXPENDITURE STATEMENT
This year’s statement includes 2005-06 and 2006-07 estimates of tax expenditures for payroll tax, land tax, duties, the community ambulance cover and gambling taxes. A summary of the major tax expenditures valued on the basis of revenue foregone is presented in Table A.1. Not all expenditures can be quantified at this time. Accordingly, the total value of tax expenditures should be considered as indicative only.
| | | | | | |
| 182 | | Budget Strategy and Outlook 2007-08 | | |
Table A.1
Tax expenditure summary1
| | | | |
| | | 2005-062 $ million | | 2006-07 $ million |
Payroll Tax | | | | |
Exemption threshold3 | | 722 | | 882 |
Deduction scheme4 | | 147 | | 209 |
Section 14 exemptions | | | | |
Local Government | | 77 | | 87 |
Education | | 123 | | 140 |
Hospitals | | 189 | | 215 |
| | |
Total Payroll Tax | | 1,258 | | 1,533 |
| | |
Land Tax | | | | |
Liability thresholds5 | | 283 | | 293 |
Graduated land tax scale | | 121 | | 143 |
Primary production deduction | | 45 | | 58 |
Section 13 exemptions not included elsewhere6 | | 40 | | 46 |
Land developers’ concession | | 19 | | 16 |
| | |
Total Land Tax | | 508 | | 556 |
| | |
Duties | | | | |
Transfer duty on residential property | | | | |
Home concession | | 371 | | 398 |
First home concession | | 155 | | 180 |
First home vacant land concession | | .. | | 1 |
Insurance duty on general insurance | | | | |
Non-life insurance | | 107 | | 120 |
Workcover | | 23 | | 23 |
Health insurance | | 112 | | 120 |
| | |
Total Duties | | 768 | | 842 |
| | |
Community Ambulance Cover | | | | |
Concession to pensioners and seniors7 | | 40 | | 42 |
| | |
Taxes on Gambling | | | | |
Gaming machine taxes | | 122 | | 113 |
Casino taxes | | 10 | | 7 |
| | |
Total Gambling Tax | | 132 | | 120 |
Notes:
| 1. | Numbers may not add due to rounding. |
| 2. | 2005-06 estimates may have been revised since last year’s Budget. |
| 3. | Exemption threshold of $1 million applies in 2006-07. In 2005-06, the threshold was $850,000. |
| 4. | Deduction of $1 million, which reduces by $1 for every $3 above $1 million, is applicable to employers with an annual payroll between $1 million and $4 million in 2006-07. In 2005-06, the deduction was $850,000 and was applicable to employers with an annual payroll between $850,000 and $3.4 million. |
| 5. | Land tax is payable only on the value of taxable land above a threshold which depends on the ownership structure. |
| 6. | Applicable, but not limited, to religious bodies, public benevolent institutions and other exempt charitable institutions. |
| 7. | Estimates are based on the revenue foregone through the use of the levy exemption by pensioners and senior citizens. The estimated cost of providing the service to pensioners and senior citizens exempted from the levy is significantly higher, estimated at $145 million in 2005-06 and $173 million in 2006-07. |
| | | | | | |
| | Budget Strategy and Outlook 2007-08 | | 183 |
DISCUSSION OF INDIVIDUAL TAXES
Payroll tax
The benchmark tax base for payroll tax is assumed to be all wages, salaries and supplements (including employer superannuation contributions) paid in Queensland, as defined in the Pay-roll Tax Act 1971. The benchmark tax rate for payroll tax is assumed to be the statutory rate applying in each financial year.
Payroll tax exemption threshold
Employers who employ in Queensland with an annual Australian payroll of $1 million or less are exempt from payroll tax. On the basis of average weekly earnings, this threshold corresponds to approximately 24 full-time equivalent employees. This concession is designed to assist small and medium sized businesses. Prior to 1 July 2006, the threshold was $850,000.
Deduction scheme
Employers who employ in Queensland with Australian payrolls between $1 million and $4 million benefit from a deduction of $1 million, which reduces by $1 for every $3 by which the annual payroll exceeds $1 million. There is no deduction for employers or groups with an annual payroll in excess of $4 million. Prior to 1 July 2006, the threshold was $850,000, with a deduction for employers or groups with payrolls up to $3.4 million.
Section 14 exemptions
A number of organisations are provided with exemptions from payroll tax under Section 14 of the Pay-roll Tax Act 1971. The activities for which estimates have been calculated are wages paid by public hospitals, non-tertiary private educational institutions and local governments (excluding commercial activities).
Land tax
The benchmark tax base is assumed to be all freehold land within Queensland, excluding residential land used as a principal place of residence and land owned by individuals with a value for that year below the threshold. The benchmark tax rate for land tax is assumed to be the top rate of land tax applicable in Queensland in each financial year.
Liability thresholds
Land tax is payable on the value of taxable land above a threshold which depends on the land’s ownership. In 2005-06, the thresholds were $300,000 for companies, absentees and trusts and $450,000 for resident individuals. In 2006-07, the threshold for resident individuals was increased to $500,000.
| | | | | | |
| 184 | | Budget Strategy and Outlook 2007-08 | | |
Residential land owned by resident individuals as their principal place of residence is excluded from the estimate. The exemption from paying below a minimum amount ($400 in 2005-06 and $500 in 2006-07) is not included as a tax expenditure as it is regarded as the application of an administration threshold.
Graduated land tax scale
A graduated (concessional) scale of land tax rates is applicable to land with a taxable value of less than $3 million for resident individuals and $2 million for companies, trustees and absentees.
Primary production deduction
The taxable value of land owned by a resident individual, trustee or some absentees and companies does not include all or part of their land that is used for the business of agriculture, pasturage or dairy farming.
Section 13 exemptions (not elsewhere included)
A number of land tax exemptions are granted under Section 13 of the Land Tax Act 1915 to eligible organisations. These include, but are not limited to, public benevolent institutions, religious institutions and other exempt charitable institutions, retirement villages, trade unions and showgrounds.
Land developers’ concession
From 1 July 1998, land developers have been charged land tax on 60% of the unimproved value of (undeveloped) land subdivided in the previous financial year and which remains unsold at 30 June of that year. This concession is outlined in Section 3CA of the Land Tax Act 1915.
Transfer duty concession on residential property
The benchmark tax base is assumed to be all sales of residential property within Queensland. The benchmark tax scale is assumed to be the scale that actually applied in each financial year.
Home concession
A concessional rate of duty applies to purchases of a principal place of residence. Until 30 June 2006, a concessional rate of 1% applied on dutiable values up to $300,000 compared to the normal schedule of rates between 1.5% and 3.5%. For properties valued over $300,000, the scheduled rates of transfer duty applied on the excess.
From 1 July 2006, the concessional rate of 1% has applied to the purchase of a principal place of residence valued up to $320,000.
| | | | | | |
| | Budget Strategy and Outlook 2007-08 | | 185 |
First home concession
Where a purchaser has not previously owned a residence in Queensland or elsewhere, the purchaser of a home receives a more generous concession on duty. This concession comprises a rebate in addition to the home concession on properties (this concession may not be applicable if the purchase price is less than the full market value of the property). The size of the rebate depends on the value of the property. Duty relief is provided to purchases of a first principal place of residence valued up to $500,000.
First home vacant land concession
From 1 January 2007, a new first home concession was provided for the purchase of certain vacant land up to the value of $300,000.
Insurance duty
The benchmark tax base is assumed to be all premiums for general insurance policies (except for life insurance). The benchmark tax scale is assumed to be the scale that actually applied in each financial year.
The rate of duty applicable to most types of general insurance is 7.5%. Concessional rates apply to some other general insurance types (5% for motor vehicle insurance other than compulsory third party (CTP), workers’ compensation and professional indemnity insurance and 10c on a premium for CTP insurance). Data limitations mean that these insurance types are categorised into non-life insurance cover and WorkCover. An exemption from duty is also provided for private health insurance.
Duty on mortgages – home concessions and first home concessions
The benchmark tax base is assumed to be all mortgages and loans taken out in Queensland. The benchmark tax scale is assumed to be the scale that actually applied in each financial year.
A concession from duty is allowed where a home mortgage secures an advance attributable to the purchase or construction of the borrower’s home.
The data required to estimate the revenue foregone is not available.
Community Ambulance Cover
Concession to pensioners and seniors
Pensioners and senior card holders are exempt from paying the Community Ambulance Cover charge levied quarterly on electricity accounts.
| | | | | | |
| 186 | | Budget Strategy and Outlook 2007-08 | | |
Gambling taxes
Gaming machine tax concessions for licensed clubs
The benchmark tax base is assumed to be all gaming machines operated by licensed clubs and hotels in Queensland. The benchmark tax rate is assumed to be the highest marginal tax rate (as is applied to hotels) that actually applied in each financial year.
A concessional graduated tax rate scale applies to gaming machines operated by licensed clubs. The tax rate is calculated on the gaming machine monthly metered win and the top tax rate is only applied to the portion of gaming machine revenue where the monthly metered win exceeds $1.4 million for any licensed club.
Casino tax concessions
The benchmark tax base is assumed to be all casinos operating in Queensland. The benchmark tax rate is assumed to be the highest tax rate that is actually applied in each financial year.
A tax rate of 20% of gross revenue applies for standard transactions in the Brisbane and Gold Coast casinos. A concessional tax rate of 10% applies for gross revenue from standard transactions in the Cairns and Townsville casinos. In addition concessional rates also apply for revenue from high rollers in all casinos. High roller revenue is taxed at 10% in the Brisbane and Gold Coast casinos and 8% for the Cairns and Townsville Casinos. A GST credit is provided to casinos that approximates a reduction in the above tax rates of 9.09%.
| | | | | | |
| | Budget Strategy and Outlook 2007-08 | | 187 |
APPENDIX B – CONCESSIONS STATEMENT
INTRODUCTION
The Government provides concessions in the form of discounts, rebates and subsidies to improve access to and the affordability of a range of services for individuals or families based on eligibility criteria relating to factors such as age, income and special needs or disadvantage.
This statement serves to highlight the cost and nature of concessions covering both concessions which are reflected as outlays in the Budget (for example, direct subsidy payments) and revenue foregone through fees and charges which are set at a rate lower than that applying to the wider community.
Varying methods have been used to estimate the cost of concessions depending on the nature of the concession, including:
| • | | direct Budget outlay cost (for example, direct subsidy or rebate payments) |
| • | | revenue foregone (for example, concessional fees and charges) |
| • | | cost of goods and services provided. |
Table B.1 sets out the cost of concessions by agency. The total value of concessions is estimated at $906.6 million in 2007-08.
| | | | | | |
| 188 | | Budget Strategy and Outlook 2007-08 | | |
Table B.1
Concessions by agency1
| | | | |
Agency | | 2006-07 Est.Act. $ million | | 2007-08 Estimate $ million |
Department of Communities | | | | |
Electricity Rebate Scheme | | 63.2 | | 66.8 |
Electricity Life Support Scheme | | 0.6 | | 0.6 |
Pensioner Rate Subsidy Scheme | | 45.5 | | 47.9 |
Rail Concession Scheme | | 33.2 | | 34.1 |
| | |
Department of Education, Training and the Arts | | | | |
Arts Concessional Entry Fees | | 0.4 | | 0.4 |
Living Away from Home Allowances Scheme | | 5.9 | | 6.1 |
School Transport Assistance for Students with Disabilities | | 28.6 | | 28.6 |
Non-State School Transport Assistance Scheme | | 4.1 | | 4.4 |
Venue Hire Discount – Queensland Performing Arts Trust | | 0.4 | | 0.4 |
Venue Hire and Lease Discount – Judith Wright Centre of Contemporary Art | | 0.4 | | 0.4 |
TAFE Concessions | | 13.9 | | 14.2 |
| | |
Department of Emergency Services | | | | |
Urban Fire Levy Concession | | 5.5 | | 5.8 |
| | |
Environmental Protection Agency | | | | |
Environmental Licence Fee Waiver | | 0.3 | | 0.3 |
Concessions Entry and Tour Fees | | 0.1 | | 0.1 |
| | |
Queensland Health | | | | |
Spectacles Supply Scheme | | 5.0 | | 5.9 |
Medical Aids Subsidy Scheme | | 19.9 | | 20.8 |
Patient Travel Subsidy Scheme2 | | 31.0 | | 34.0 |
Oral Health Scheme | | 94.1 | | 99.2 |
| | |
Department of Housing | | | | |
Aboriginal and Torres Strait Islander Housing Rental Rebate | | 11.3 | | 14.2 |
Public Rental Housing Rebate3 | | 200.0 | | 245.0 |
| | |
Department of Justice and Attorney-General | | | | |
Public Trustee of Queensland – Rebates of Fees | | 17.6 | | 18.3 |
| | |
Department of Local Government, Planning, Sport and Recreation | | | | |
Active Recreation Centres – Concessional Usage Rates | | 0.1 | | 0.1 |
| | |
Department of Natural Resources and Water | | | | |
Rebates on Part A Water Charges | | 3.0 | | 7.0 |
| | |
Department of the Premier and Cabinet | | | | |
South Bank Corporation – Venue Hire Discounts | | 0.3 | | 0.2 |
| | | | | | |
| | Budget Strategy and Outlook 2007-08 | | 189 |
Table B.1 (continued)
Concessions by agency1
| | | | |
Agency | | 2006-07 Est.Act. $ million | | 2007-08 Estimate $ million |
Department of Primary Industries and Fisheries | | | | |
Drought Rate Rebate Scheme | | 7.0 | | 9.0 |
| | |
Department of Transport | | | | |
Transport Concessions incl. Taxi Subsidies | | 61.5 | | 64.6 |
Motor Vehicle Registration Concession | | 51.1 | | 52.4 |
Recreational Ship Registration Concession | | 0.8 | | 0.8 |
School Transport Assistance Scheme | | 122.5 | | 125.1 |
| | |
Total | | 827.4 | | 906.6 |
Notes:
| 1. | Numbers may not add due to rounding. |
| 2. | In previous years, Queensland Health has only reported a component of subsidies under this scheme for assistance provided to concession card holders. The figures reported above represent total travel and accommodation assistance paid for eligible Queensland patients under this scheme. |
| 3. | Increases in markets rents have resulted in an increased estimated level of rental rebate for 2007-08. |
Department of Communities
The Department of Communities has responsibility for the Queensland Government Electricity Rebate Scheme and reimburses the electricity retail corporations for electricity rebates provided. The scheme provides a rebate on the cost of domestic electricity supply to eligible holders of a Pensioner Concession Card, Queensland Seniors Card or a Repatriation Health Card for All Conditions (Gold Card) who receive a War Widow or Special Rate Totally and Permanently Incapacitated pension.
The Electricity Life Support Concession Scheme is aimed at assisting seriously ill people who use home-based life support systems such as oxygen concentrators and kidney dialysis machines.
The Pensioner Rate Subsidy Scheme alleviates the impact of local government rates and charges on pensioners, thereby assisting them to continue to live in their own homes.
The Queensland Rail Concessions Scheme assists pensioners, veterans and seniors to reduce the cost of public transport and to maintain an active and healthy lifestyle.
| | | | | | |
| 190 | | Budget Strategy and Outlook 2007-08 | | |
Department of Education, Training and the Arts
The Department of Education, Training and the Arts provides a living away from home allowance to students in Years 1 to 12 in state and non-state schools whose homes are geographically isolated from local schools. The allowances offset the costs associated with boarding away from home to attend school on a daily basis and include tuition and travel costs.
The Department also offers assistance to students with disabilities to access school programs to meet their educational needs. Assistance is in the form of the provision of taxis or specialised contracted minibuses, payment of fares on regular buses or trains, or an allowance for parents who drive their children to school.
The Non-State School Transport Assistance Scheme assists families of students attending non-state schools outside Brisbane whose bus fare is over a weekly threshold amount. The program also assists families of students with disabilities who attend a non-state school.
Discounts apply to venue rental fees charged to arts and community organisation hirers ($0.15 million) and rent reductions apply to lease amounts for resident cultural organisation tenants ($0.25 million) at the Judith Wright Centre of Contemporary Art.
Concessional ticket entry fees apply to a variety of concession card holders, students, children and families for special exhibitions at the Queensland Art Gallery and the Queensland Museum.
Queensland Performing Arts Trust offers discounts on venue rental fees charged to government funded organisations, primarily Opera Queensland, Queensland Ballet, Queensland Orchestra and Queensland Theatre Company.
Concessions on TAFE tuition fees for government-funded training are offered to a range of concession card holders, students of Aboriginal and Torres Strait Islander descent and students who can demonstrate extreme financial hardship.
Department of Emergency Services
Pensioners are eligible for a 20% discount on the Urban Fire Levy payable on prescribed properties of which they are the owner or part-owner.
Environmental Protection Agency
A fee waiver may be granted on environmental licences on the grounds of financial hardship or if there is a small or insignificant environmental risk. The Department also offers concessional entry fees for specified protected areas including St Helena Island, David Fleay Wildlife Park and Mon Repos Conservation Park.
| | | | | | |
| | Budget Strategy and Outlook 2007-08 | | 191 |
Queensland Health
The Spectacles Supply Scheme assists eligible Queensland residents by providing a comprehensive range of free basic prescription spectacles. Queensland Health administers the Scheme through its network of public hospitals and community health services.
The Medical Aids Subsidy Scheme provides eligible Queensland residents with permanent and stabilised conditions or disabilities with access to subsidy funding assistance for the provision of a range of aids and equipment. Aids and equipment are provided primarily to assist people to live at home thus avoiding premature or inappropriate residential care or hospitalisation.
Queensland Health’s Patient Travel Subsidy Scheme provides financial assistance to patients who need to access specialist medical services which are not available within their local area. The Scheme provides a subsidy towards the cost of travel and accommodation for patients and, in some cases, an escort. While in previous years the Scheme has reported only those subsidies provided to concession card holders, the reported cost of the Scheme this year includes all subsidies provided to eligible patients.
The Oral Health Scheme provides free dental care to eligible clients and their dependents who possess a current Health Care Card, Pensioner Concession Card, Queensland Seniors Card or Commonwealth Seniors Card. In rural and remote areas where no private dental practitioner exists, access to dental care for the general public is provided at a concessional rate.
Department of Housing
The Aboriginal and Torres Strait Islander Housing Rental Rebate targets low income Indigenous families and individuals and represents the difference between the rents that would be payable in the private market and the rent that is charged based on the household’s income.
The Public Rental Housing Rebate targets low income families and individuals and represents the difference between the rent that would be payable in the private market and the rent that is charged based on the household’s income. Increasing market rents result in an increasing level of rental rebate.
Department of Justice and Attorney-General
The Public Trustee offers fee rebates (full or partial) for clients who, because of financial circumstances, cannot pay the full amount of fees that have been levied.
| | | | | | |
| 192 | | Budget Strategy and Outlook 2007-08 | | |
Department of Local Government, Planning, Sport and Recreation
Concessional rates are offered to school groups for the use of a number of Active Recreation Centres, such as those at Currimundi and Tallebudgera.
Department of Natural Resources and Water
A rebate on fixed water supply charges (Part A charges) is provided for rural irrigation users in areas where there is low water availability. Rebates provide up to 100% of the fixed water charge, up to a maximum of $10,000 per user per year, on water bills issued for the period from July 2006 to 30 June 2008.
Department of the Premier and Cabinet
Community groups and charities are given discounted charges for the hire of venues within the South Bank parklands, such as the Suncorp Piazza.
Department of Primary Industries and Fisheries
To assist primary producers who have been detrimentally affected by drought leading to financial difficulty, assistance is provided in the form of a rebate of local government rates. A rebate of 50% is available to eligible applicants.
Department of Transport
Transport concessions are provided by the Government in a variety of forms and across a range of activities to ensure access and mobility for Queenslanders who are transport disadvantaged. Eligible categories to receive a concession include Pensioner Concession Card holders, Seniors Card holders, children and secondary and tertiary students. Members of the Taxi Subsidy Scheme also receive concessions on taxi travel. The provision of these concessions is in the form of a subsidy payment to transport operators.
Motor vehicle and boat registration concessions are provided to holders of the Pensioner Concession Card, Queensland Seniors Card and to those receiving a Totally or Permanently Incapacitated Ex-serviceperson Pension. The concession is aimed at improving the access to travel of pensioners and seniors.
The School Transport Assistance Scheme is a program for students whose access to school is disadvantaged by distance or who are from defined low income groups. Assistance is provided towards the cost of travel on bus, rail and/or ferry with allowances for private vehicle transport.
| | | | | | |
| | Budget Strategy and Outlook 2007-08 | | 193 |
APPENDIX C – STATEMENT OF RISKS AND SENSITIVITY ANALYSIS
INTRODUCTION
The Queensland State Budget, like those of other states, is based in part on assumptions made about future elements of uncertainty both internal and external to the State which can impact directly on economic and fiscal forecasts. Operating results achieved in recent years reflect the fact that the actual fiscal result achieved depends on the direction of such variables.
Consistent with the Charter of Social and Fiscal Responsibility, this section analyses the sensitivity of the estimates to changes in the economic and other assumptions used in developing the Budget and forward estimates. This analysis is provided, as required under the Charter, to enhance the level of transparency and accountability of the Government.
Notwithstanding the risks associated with the Budget, Queensland is well placed to manage adverse impacts. Queensland’s strong balance sheet and low tax status means it has substantial capacity to withstand the risks normally associated with any state or territory budget.
The forward estimates in the Budget are framed on a no policy change basis. That is, the expenditure and revenue policies in place at the time of the Budget (including those announced in the Budget) are applied consistently throughout the forward estimates period.
The following discussion provides details of some of the key assumptions and risks associated with revenue and expenditure forecasts and, where a direct link can be established, the indicative impact on forecasts resulting from a movement in those variables.
IMPACT OF DROUGHT
The 2007-08 Budget and forward estimates assume a return to average seasonal conditions and a partial recovery from drought. However, if rainfall does not improve sufficiently in 2007-08, water storage levels will remain low. If this eventuates, rural exports and food prices may be adversely affected.
A continuation of drought conditions would have a negative impact on both revenue and expenditure items. For example, reduced levels of rural employment associated with drought would be expected to result in reduced payroll tax revenues, while expenditures on drought assistance programs would be expected to increase.
| | | | | | |
| 194 | | Budget Strategy and Outlook 2007-08 | | |
SENSITIVITY OF EXPENDITURE ESTIMATES AND EXPENDITURE RISKS
Public sector wage costs
Salaries and wages form a large proportion of General Government operating expenses. Increases in salaries and wages are negotiated through enterprise bargaining agreements.
All of the major enterprise bargaining agreements across the General Government sector, including the agreement for the core public sector, have now been finalised, with sworn police officers and allied health agreements currently under negotiation.
The 2007-08 Budget and forward estimates include funding for wage increases as per the most recent round of enterprise bargaining, with a provision for approximately 4% per annum wage increases thereafter.
For agreements yet to be reached, funding provisions are consistent with an outcome of approximately 4% per annum.
Interest rates
The General Government sector has a very moderate level of debt with a total debt servicing cost forecast at $390 million in 2007-08.
The current average duration of General Government debt is approximately three years. Accordingly, a one percentage point variation in interest rates would lead to a very modest change in debt servicing costs in 2007-08.
Actuarial estimates of superannuation and long service leave
Liabilities for superannuation and long service leave are estimated by the State Actuary with reference to, among other things, assumed rates of investment returns, salary growth and inflation. These liabilities are therefore subject to changes in these parameters. Similarly, the long service leave liabilities are subject to the risk that the actual rates of employee retention will vary from those assumed in the liability calculation.
While these impacts have been estimated and allowances made in the Budget and forward estimates to accommodate them, the actual outcome may differ from the estimates calculated for the Budget.
Demographic and demand based risks
Unforeseen changes in the size, location and composition of Queensland’s population can impact on the demand for goods and services and therefore on the cost of maintaining existing policies. This is particularly evident in the health, education, community services and criminal justice sectors.
| | | | | | |
| | Budget Strategy and Outlook 2007-08 | | 195 |
State Government expenditure is often more closely associated with socio-demographic factors, such as the number of school age children or the number of elderly residents, than with economic activity. However, such changes are unlikely to impact significantly in the short term.
For this reason, the composition, size and location of the State’s population are more significant in projecting the State’s expenditure needs across the forward estimates period than for the current or budget year.
Unforeseen events
Events will occur during the financial year which will require additional expenditure but could not be foreseen or quantified at the time of the Budget.
Contingency funding for such events is provided in the Budget through the Treasurer’s Advance. The Treasurer’s Advance is an amount of appropriation within Treasury’s Administered Budget as a whole-of-Government provision for potentially emergent costs.
In 2007-08, the Treasurer’s Advance allocation is $50 million.
SENSITIVITY OF REVENUE ESTIMATES AND REVENUE RISKS
The rate of growth in tax revenues is dependent on a range of factors that are linked to the rate of growth in economic activity in the State. Some taxes are closely related to activity in specific sectors of the economy, whilst others are broadly related to the general rate of economic growth, employment, inflation and wages. A change in the level of economic activity, resulting from economic growth differing from forecast levels, would impact upon a broad range of taxation receipts.
Other revenue items are influenced by external variables such as the exchange rate or the performance of financial markets.
Performance of financial markets – investment returns
Investment earnings are based on the assumption of long-term average market returns for an acceptable level of risk. These investments principally cover the superannuation investment funds. The Government’s financial investments are held in a portfolio comprising property, domestic and offshore equities and fixed interest.
The assumed long-term rate of return used in Budget estimates is 7.5%. Actual returns will depend on the performance of sectors which comprise the portfolio.
Given Queensland’s large holding of financial assets, actual revenues are highly sensitive to small variations from the assumed long run rate of return.
| | | | | | |
| 196 | | Budget Strategy and Outlook 2007-08 | | |
In 2007-08, a one percentage point variation in investment earnings on assets held to meet future employee entitlements would lead to a change in net investment revenue of approximately $190 million.
Exchange rate and commodity prices and volumes – royalties estimates
Estimates of mining royalties are sensitive to movements in the Australian dollar-US dollar exchange rate and commodity prices and volumes.
Contracts for the supply of commodities are generally written in US dollars. Accordingly, a change in the exchange rate impacts on the Australian dollar price of commodities and therefore expected royalties collections.
A one cent variation in the Australian dollar-US dollar exchange rate would lead to a change in royalty revenue of approximately $16 million in 2007-08.
Also impacting on royalty estimates are volume effects. A large component of Queensland’s royalty collections is derived from coal. A 1% variation in export coking and thermal coal volumes would lead to a change in royalty revenue of approximately $10 million.
The 2007-08 Budget assumptions for export coal prices are derived by taking into account various price forecasts made by coal companies. A 1% variation in the price of export coal would lead to a change in royalty revenue of approximately $10 million.
Property values and volumes – transfer duty estimates
Over recent years, high levels of activity in the property market have resulted in strong growth in revenue collections through transfer duty receipts. The increase in duty receipts flowing from the property market activity has a number of elements. The key elements are the value of properties changing hands and the volume of properties changing hands.
For 2007-08, a slight moderation of the recent strong growth in the property market is forecast. The underlying assumption is for growth in both property prices and volumes, although at a slower rate than in 2006-07.
A 1% variation in the average value of property transactions would change transfer duty collections by approximately $39 million in 2007-08.
A 1% variation in the volume of transactions would change transfer duty revenues by approximately $28 million in 2007-08.
| | | | | | |
| | Budget Strategy and Outlook 2007-08 | | 197 |
Wages and employment growth – payroll tax collections
Wages and employment growth have a direct impact on payroll tax collections. The Budget assumptions are for an increase in the Wage Price Index of 4 1/4% and employment growth of 3% in 2007-08.
A one percentage point variation in wages growth would change payroll tax collections by approximately $23 million. Similarly, a one percentage point variation in employment growth would change payroll tax collections by $23 million.
Parameters influencing Australian Government GST payments to Queensland
Estimates of Australian Government GST revenue grants to states and territories are dependent on total GST revenue collected, which tends to be closely correlated with the general level of economic activity. The Australian Government has provided estimates of total GST collections in its Budget Papers. In 2007-08, Queensland’s Budget will bear the risks of fluctuations in GST revenues and the other components of the package, such as the First Home Owner Grant Scheme, administrative costs associated with the GST and taxes foregone.
The Australian Government’s estimate of GST revenue in 2007-08 is based on its forecast of national non-farm GDP growth of 3 1/2%, household consumption growth of 3 1/ 2%, and a 2 1/2% rate of inflation. However, as the GST is imposed on some goods and services but not others, there is no precise link between these parameters and the GST base. As with all other tax estimates, there is a risk of lower collections than estimated by the Australian Government if economic growth and consumption is weaker than expected.
Relative to other states, Queensland has been assessed as having an increasing capacity to raise revenue from stamp duty on conveyances and mining revenue in recent years. As a result, Queensland’s share of GST funding (relativity) has declined. As Queensland continues to raise relatively more revenue because of strong resource and property sectors, it is expected that Queensland’s relativity and therefore share of GST funding will decline further and will soon be lower than its population share.
Due to the complexities associated with the GST base, the information provided in the Australian Government Budget Papers is not sufficient to prepare indicative forecasts of the sensitivity of GST estimates to key variables.
| | | | | | |
| 198 | | Budget Strategy and Outlook 2007-08 | | |
Australian Government grants (Specific Purpose Payments)
Specific Purpose Payments (SPPs) are payments made by the Australian Government to promote its policy objectives. The majority of SPPs are remitted directly to state governments, with a proportion of these passed through to other bodies, while some SPPs are remitted directly to local government authorities.
Indexation arrangements and distributions between the states vary for each SPP. The Australian Government reviews the payments each year and has guaranteed that it will not reduce the overall, aggregate level of SPPs to states.
CONTINGENT LIABILITIES
Contingent liabilities represent items that are not included in the Budget as significant uncertainty exists as to whether the Government would sacrifice future economic benefits in respect of these items. Nevertheless, such contingencies need to be recognised and managed wherever possible in terms of their potential impact on the Government’s financial position in the future.
The State’s quantifiable and non-quantifiable contingent liabilities are detailed in the 2005-06 Report on State Finances – Consolidated Financial Statements (Note 46).
A summary of the State’s quantifiable contingent liabilities as at 30 June 2006 is provided below.
Table C.1
Contingent liabilities
| | |
| | | 2006
$ million |
Nature of contingent liability | | |
| |
Guarantees and indemnities | | 6,083 |
QTC – stock loans | | 666 |
Other | | 54 |
| |
Total | | 6,803 |
| | | | | | |
| | Budget Strategy and Outlook 2007-08 | | 199 |
2007-08 State Budget Papers
1. Budget Speech
2. Budget Strategy and Outlook
3. Capital Statement
Budget Highlights
Appropriation Bills
Ministerial Portfolio Statements
Queensland the Smart State – Water for the Future
The Budget Papers are available online at www.budget.qld.gov.au
or they can be purchased through The Government Bookshop,
individually or as a set. Please phone (07) 3118 6900.
© Crown copyright
All rights reserved
Queensland Government 2007
Excerpts from this publication may be reproduced, with appropriate acknowledgement,
as permitted under the Copyright Act.
Budget Paper No. 3 – Capital Statement
ISSN 1445-4890 (Print)
ISSN 1445-4904 (Online)
Queensland
Government
STATE BUDGET
2007-08
CAPITAL STATEMENT
Budget Paper No. 3
TABLE OF CONTENTS
| | | | |
1. | | Overview | | |
| | |
| | Introduction | | 1 |
| | Employment Generation | | 5 |
| | Capital Grants to Local Government Authorities | | 5 |
| | Funding the State Capital Program | | 6 |
| | |
| 2. | | State Capital Program - Planning and Priorities | | |
| | |
| | Introduction | | 10 |
| | Capital Planning and Priorities | | 10 |
| | 2007-08 Highlights | | 11 |
| | Queensland Future Growth Fund | | 19 |
| | |
| 3. | | Private Sector Contribution to the Delivery of Public Infrastructure | | |
| | |
| | Introduction | | 21 |
| | Current Projects | | 21 |
| | |
| 4. | | Capital Outlays by Entity | | |
| | |
| | Child Safety | | 25 |
| | Communities | | 27 |
| | Corrective Services | | 31 |
| | Disability Services Queensland | | 33 |
| | Education, Training and the Arts | | 36 |
| | Electoral Commission of Queensland | | 47 |
| | Emergency Services | | 48 |
| | Employment and Industrial Relations | | 54 |
| | Environmental Protection Agency | | 55 |
| | Health | | 58 |
| | Housing | | 66 |
| | Infrastructure | | 73 |
| | Justice and Attorney-General | | 78 |
| | | | |
| | Legislative Assembly of Queensland | | 82 |
| | Local Government, Planning, Sport and Recreation | | 83 |
| | Main Roads | | 85 |
| | Mines and Energy | | 98 |
| | Natural Resources and Water | | 107 |
| | Office of the Governor | | 111 |
| | Office of the Ombudsman | | 112 |
| | Office of the Public Service Commissioner | | 113 |
| | Police | | 114 |
| | Premier and Cabinet | | 118 |
| | Primary Industries and Fisheries | | 121 |
| | Public Works | | 124 |
| | Queensland Audit Office | | 129 |
| | State Development | | 130 |
| | Tourism, Fair Trading, Wine Industry Development and Women | | 132 |
| | Transport | | 134 |
| | Treasury | | 149 |
| | |
| | Appendix A – Entities included in Capital Outlays 2007-08 | | 152 |
| | |
| | Appendix B – Smart State Building Fund | | 154 |
| | |
| | Appendix C – Key Concepts and Coverage | | 155 |
KEY POINTS
| • | | Capital outlays in 2007-08 are estimated to be $14.029 billion, an increase of 15.6% or $1.894 billion on estimated actual 2006-07 capital outlays. |
| • | | The 2006-07 estimated capital outlays are 19.7% ($1.999 billion) higher than forecast in the 2006-07 Budget. Spending on water projects accounts for the majority of this increase with additional capital outlays on roads and transport, including Queensland Rail, also contributing. |
| • | | Capital outlays will support some 101,000 full-time jobs in Queensland in 2007-08. |
| • | | Capital outlays in 2007-08 reflect the Queensland Government’s ongoing commitment to regional and rural Queensland, with over 50% of capital expenditure occurring outside the Brisbane Statistical Division. Regional investment in 2007-08 includes $19.3 million for improvements to Rockhampton Hospital, $120.8 million for redevelopment and expansion of Cairns Airport Domestic and International Terminals and $163.8 million for continuing work on two correctional centres in Townsville. |
| • | | In 2007-08 there will be capital outlays of $5.767 billion for transport and main roads, including Airport Link, $619.1 million for education, training and the arts, $635 million for health and $487.3 million for housing. |
| • | | The capital outlays of Government-owned corporations constitute approximately 51% of total outlays in 2007-08, including $2.76 billion in the energy sector. |
| • | | The Government will also invest $2.5 billion in 2007-08 in water infrastructure, including $1.183 billion for the Western Corridor Recycled Water Project, $465 million for the Southern Regional Water Pipeline and $354.9 million to progress development of two new dams in South East Queensland. |
INTRODUCTION
This Capital Statement presents an overview of proposed capital outlays by the Queensland Government in 2007-08, as well as a summary of the State Government’s approach to infrastructure provision. Capital outlays in 2007-08 are estimated to be $14.029 billion, net of a capital contingency reserve of $950 million.
This represents an increase of 15.6% on estimated actual outlays in 2006-07, and provides for significant investment in water infrastructure and the continuation of the South East Queensland Infrastructure Plan and Program (SEQIPP), as well as a number of other new capital investments
| | | | | | |
| | Capital Statement 2007-08 | | 1 |
Each year a major part of the Queensland Government’s capital program is undertaken through Government-owned corporations (GOCs). For 2007-08, the capital outlays of Queensland’s GOCs will constitute 51% of total outlays, reflecting major investments in water, electricity, rail and ports infrastructure.
Expenditure in 2007-08 is highest in the Brisbane Statistical Division – the most populated and one of the fastest growing areas of the State – planned at $7.236 billion. However, consistent with the Government’s commitment to building Queensland’s regions, over 50% of capital expenditure is expected to occur outside the Brisbane Statistical Division.
Capital outlays by purpose in 2007-08 are shown in Chart 1.1 below. Capital outlays by State Government entity are listed in Table 1.1.
Chart 1.1
Capital Outlays by Purpose, 2007-08
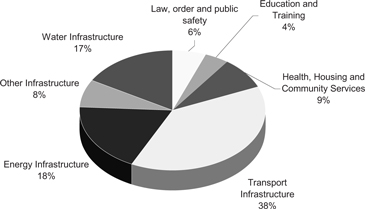
| | | | | | |
| 2 | | Capital Statement 2007-08 | | |
| | | | |
| Table 1.1 |
| Capital Outlays by Entity1 |
Entity | | 2006-07 Est. Act. $’000 | | 2007-08 Budget $’000 |
Child Safety | | 31,665 | | 36,382 |
Communities | | 43,110 | | 106,986 |
Corrective Services | | 207,446 | | 254,619 |
Disability Services Queensland | | 29,152 | | 64,710 |
Education, Training and the Arts | | 731,854 | | 619,112 |
Emergency Services | | 97,281 | | 206,859 |
Environmental Protection Agency | | 56,216 | | 55,671 |
Health | | 597,154 | | 634,951 |
Housing | | 425,804 | | 487,317 |
Infrastructure Portfolio | | | | |
Infrastructure | | 21,527 | | 7,745 |
Property Services Group | | 42,512 | | 88,798 |
Infrastructure Projects | | 1,299,016 | | 2,456,384 |
Justice and Attorney-General | | 42,092 | | 125,498 |
Legislative Assembly of Queensland | | 3,189 | | 5,435 |
Local Government, Planning, Sport and Recreation | | 384,163 | | 474,502 |
Main Roads Portfolio | | | | |
Main Roads | | 1,677,375 | | 2,277,851 |
RoadTek & Queensland Motorways Limited | | 603,403 | | 771,464 |
Mines and Energy Portfolio | | | | |
Mines and Energy | | 4,271 | | 6,379 |
Energy GOCs | | 2,986,349 | | 2,760,470 |
Natural Resources and Water Portfolio | | | | |
Natural Resources and Water | | 245,264 | | 54,353 |
Water Boards | | 5,496 | | 44,430 |
SunWater, including Burnett Water | | 222,202 | | 14,920 |
Police | | 155,763 | | 258,021 |
Premier and Cabinet Portfolio | | | | |
Premier and Cabinet | | 20,064 | | 14,375 |
Major Sports Facilities Authority | | 139,139 | | 79,844 |
Primary Industries and Fisheries | | 39,185 | | 53,339 |
Public Works Portfolio | | | | |
Public Works | | 76,912 | | 237,165 |
QFleet | | 148,898 | | 134,246 |
Other Commercialised Business Units | | 7,437 | | 33,422 |
State Development | | 5,989 | | 47,148 |
Tourism, Fair Trading, Wine Industry Development and Women | | 1,857 | | 2,760 |
| | | | | | |
| | Capital Statement 2007-08 | | 3 |
| | | | | | |
| Table 1.1 (continued) | |
| Capital Outlays by Entity1 | |
Entity | | 2006-07 Est. Act. $’000 | | | 2007-08 Budget $’000 | |
Transport Portfolio | | | | | | |
Queensland Transport | | 401,406 | | | 645,176 | |
Queensland Rail | | 1,248,422 | | | 1,277,619 | |
Port GOCs | | 839,947 | | | 558,140 | |
Treasury Portfolio | | | | | | |
Treasury | | 17,053 | | | 17,770 | |
CorpTech and Shared Service Agency | | 74,977 | | | 61,887 | |
Other Agencies2 | | 1,397 | | | 2,872 | |
Anticipated Capital Contingency Reserve3 | | (800,000 | ) | | (950,000 | ) |
Total Capital Outlays | | 12,134,987 | | | 14,028,620 | |
Notes:
| 1. | Includes associated statutory bodies. |
| 2. | Includes the Department of Employment and Industrial Relations, Electoral Commission of Queensland, Office of the Governor, Office of the Ombudsman, Office of the Public Service Commissioner and Queensland Audit Office. |
| 3. | Contingency recognises that individual agencies may budget to fully expend their capital works allocations, however on a whole-of-Government basis, there is likely to be under spending, resulting in a carryover of capital allocations. The amount for 2007-08 has been revised upwards from 2006-07 to reflect large increases in the capital program and in anticipation of industry capacity constraints in some areas. |
| 4. | Capital works outside of Queensland are not included in the capital program. |
| 5. | Numbers may not add due to rounding. |
| | | | | | |
| 4 | | Capital Statement 2007-08 | | |
EMPLOYMENT GENERATION
The 2007-08 capital program will have a significant effect on employment, supporting some 101,000 full time jobs, either directly or indirectly. Estimated employment generation from budgeted capital expenditure in 2007-08 significantly exceeds the forecast in the 2006-07 Capital Statement. This increased employment is spread across the range of Government services. Employment generating capital does not include expenditure on land purchases, and plant and equipment.
CAPITAL GRANTS TO LOCAL GOVERNMENT AUTHORITIES
As highlighted in Budget Paper 2 – Budget Strategy and Outlook, the Queensland Government provides capital grants to local government authorities, ranging from capital works subsidies towards the costs of local public infrastructure to road subsidies for local roads, networks and drainage.
In 2006-07, approximately 74.2% ($482.2 million) of total Queensland Government grants made to local government authorities were for capital purposes. Capital grants to local governments are expected to account for $551 million, or 78.9% of total Queensland Government grants in 2007-08. The capital grant funding can be used for a range of purposes including roads and drainage, water and environment, and housing.
Chart 1.2
Queensland Government Capital Grants to Local Government Authorities,
by Purpose, 2007-08
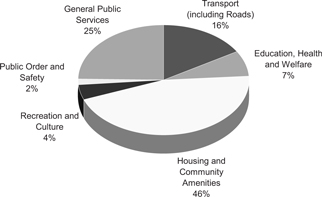
| | | | | | |
| | Capital Statement 2007-08 | | 5 |
FUNDING THE STATE CAPITAL PROGRAM
The State’s capital program is implemented across both the General Government sector and the GOCs.
While the capital program undertaken across the GOCs contributes significantly towards meeting the Government’s priorities for Queensland, the process through which this capital program is developed and funded is different from the General Government sector.
GOCs operate as commercial business entities, generally within competitive markets, and as such progress their capital programs on the basis of needs identified within the market sectors they service. There are a number of ways in which the GOC capital expenditure program can be funded. These options include using cash flow from their business, borrowings, and, in certain situations, requesting a dividend reinvestment or equity injection from shareholding Ministers.
Table 1.2 outlines the major sources of funding for the State capital program.
In 2007-08, net borrowings and advances of $7.988 billion are estimated in support of the capital program, of which $3.555 billion is budgeted for the General Government sector. The expected borrowing and advances requirement of the State’s Government-owned corporations for 2007-08 is $4.433 billion. In total, borrowings and advances are projected to fund around 60% of new infrastructure in 2007-08. Borrowing for capital purposes is entirely consistent with the Government’s fiscal principles outlined in the Government’s Charter of Social and Fiscal Responsibility and is necessary to support expansion of the State’s capital base.
After allowing for the reinvestment of earnings on the State’s superannuation investments, free cash flow of $4.264 billion is expected to be available for investment in capital in 2007-08.
| | | | | | |
| 6 | | Capital Statement 2007-08 | | |
| | | | |
| Table 1.2 |
| Sources of Funding for Capital1 |
| | | 2006-07 Est. Act. $ million | | 2007-08 Budget $ million |
Total Capital Expenditure | | 12,135 | | 14,029 |
Less Capital Grants (Funded from Operating Revenue) | | 726 | | 876 |
Net State Capital Funding Task | | 11,409 | | 13,153 |
Funding Sources | | | | |
Cash Flows from Operating Activities | | 7,890 | | 5,858 |
Less Reinvestments2 | | 3,430 | | 1,594 |
Equals Net Cash Flow for Capital Acquisitions | | 4,460 | | 4,264 |
| | |
Asset Sales | | 481 | | 415 |
Borrowings and Advances | | 4,490 | | 7,988 |
Cash Balances and Other Financing Sources | | 1,978 | | 486 |
| | |
Total Funding Sources | | 11,409 | | 13,153 |
Note:
| 1. | Numbers may not add due to rounding. |
| 2. | Primarily reflects reinvestment of General Government investment earnings relating to accruing entitlements. |
| | | | | | |
| | Capital Statement 2007-08 | | 7 |
| | | | | | | | | | | | | | | | | | | | | | | | | |
| Table 1.3 | |
| Total Capital Outlays by Entity within Statistical Division for 2007-081 | |
Entity2 | | 05
Brisbane
$’000 | | 10 Moreton
$’000 | | 15 W/Bay
$’000 | | 20 D/Downs
$’000 | | 25 S/West
$’000 | | 30
Fitzroy
$’000 | | 35 C/West
$’000 | | 40
Mackay
$’000 | | 45 Northern
$’000 | | 50 F/North $’000 | | 55 N/West
$’000 | | Totals $’000 | |
Child Safety | | 13,902 | | 4,460 | | 1,058 | | 1,895 | | 1,039 | | 547 | | 34 | | 1,640 | | 3,056 | | 7,594 | | 1,158 | | 36,382 | |
Communities | | 45,994 | | 21,566 | | 4,608 | | 6,349 | | 414 | | 3,383 | | 188 | | 5,132 | | 10,466 | | 8,351 | | 537 | | 106,986 | |
Corrective Services | | 72,178 | | 5,458 | | 472 | | 911 | | 46 | | 940 | | 21 | | 274 | | 169,011 | | 4,972 | | 334 | | 254,619 | |
Disability Services Queensland | | 32,498 | | 8,799 | | 6,740 | | 5,770 | | 267 | | 2,653 | | 121 | | 1,573 | | 3,464 | | 2,478 | | 346 | | 64,710 | |
Education, Training and the Arts | | 275,035 | | 164,962 | | 18,530 | | 16,695 | | 2,281 | | 16,376 | | 3,799 | | 25,264 | | 25,590 | | 63,818 | | 6,763 | | 619,112 | |
Emergency Services | | 124,983 | | 27,629 | | 8,415 | | 8,274 | | 3,695 | | 5,441 | | 908 | | 5,667 | | 10,175 | | 10,076 | | 1,596 | | 206,859 | |
Environmental Protection Agency | | 12,187 | | 8,486 | | 6,000 | | 465 | | 761 | | 3,443 | | 751 | | 3,078 | | 3,293 | | 16,813 | | 394 | | 55,671 | |
Health | | 273,988 | | 109,601 | | 26,346 | | 33,817 | | 8,066 | | 55,312 | | 1,615 | | 22,146 | | 24,455 | | 77,508 | | 2,098 | | 634,951 | |
Housing | | 226,707 | | 80,921 | | 23,372 | | 19,719 | | 2,965 | | 20,057 | | 1,047 | | 16,736 | | 25,482 | | 60,550 | | 9,761 | | 487,317 | |
Infrastructure | | 1,678,756 | | 567,077 | | 270,850 | | 6,879 | | | | 2,185 | | | | 11,580 | | 8,524 | | 7,076 | | | | 2,552,927 | |
Justice and Attorney-General | | 110,606 | | 3,886 | | 2,610 | | 944 | | 109 | | 801 | | 50 | | 644 | | 884 | | 4,822 | | 142 | | 125,498 | |
Legislative Assembly of Queensland | | 5,435 | | | | | | | | | | | | | | | | | | | | | | 5,435 | |
Local Government, Planning, Sport and Recreation | | 132,523 | | 89,773 | | 31,777 | | 18,287 | | 5,841 | | 27,501 | | 27,069 | | 58,330 | | 17,504 | | 63,456 | | 2,440 | | 474,502 | |
Main Roads | | 1,647,494 | | 563,217 | | 68,833 | | 103,473 | | 45,148 | | 97,626 | | 28,718 | | 102,201 | | 157,882 | | 155,845 | | 78,880 | | 3,049,315 | |
Mines and Energy | | 698,603 | | 395,232 | | 383,314 | | 255,728 | | 66,442 | | 201,087 | | 66,779 | | 270,270 | | 161,695 | | 191,022 | | 76,677 | | 2,766,849 | |
Natural Resources and Water | | 20,069 | | 5,926 | | 9,583 | | 1,978 | | 1,691 | | 30,796 | | 1,608 | | 3,116 | | 17,588 | | 2,476 | | 18,872 | | 113,703 | |
Police | | 114,749 | | 47,772 | | 11,534 | | 9,473 | | 2,596 | | 13,234 | | 2,110 | | 16,958 | | 19,743 | | 14,131 | | 5,722 | | 258,021 | |
Premier and Cabinet | | 35,288 | | 53,744 | | | | | | | | 132 | | | | 535 | | 4,520 | | | | | | 94,219 | |
Primary Industries and Fisheries | | 29,435 | | 8,755 | | 1,961 | | 5,668 | | 193 | | 1,415 | | 87 | | 1,137 | | 2,111 | | 2,327 | | 250 | | 53,339 | |
Public Works | | 237,318 | | 59,924 | | 9,287 | | 7,883 | | 950 | | 7,356 | | 426 | | 38,717 | | 21,059 | | 20,741 | | 1,172 | | 404,833 | |
State Development | | 44,498 | | 299 | | 107 | | 103 | | 83 | | 99 | | 82 | | 112 | | 658 | | 1,023 | | 84 | | 47,148 | |
Tourism, Fair Trading, Wine Industry
Development and Women | | 2,760 | | | | | | | | | | | | | | | | | | | | | | 2,760 | |
Transport | | 1,318,560 | | 302,554 | | 153,356 | | 7,454 | | 1,349 | | 279,411 | | 1,040 | | 175,700 | | 58,825 | | 161,747 | | 20,939 | | 2,480,935 | |
Treasury | | 79,657 | | | | | | | | | | | | | | | | | | | | | | 79,657 | |
Other3 | | 2,634 | | 92 | | 28 | | 24 | | 3 | | 21 | | 1 | | 17 | | 23 | | 26 | | 4 | | 2,872 | |
Anticipated Capital Contingency Reserve | | | | | | | | | | | | | | | | | | | | | | | | (950,000 | ) |
| | | | | | | | | | | | | | | | | | | | | | | | | |
Funds Allocated | | 7,235,857 | | 2,530,133 | | 1,038,781 | | 511,789 | | 143,939 | | 769,816 | | 136,454 | | 760,827 | | 746,008 | | 876,852 | | 228,169 | | 14,028,620 | |
| | | | | | | | | | | | | | | | | | | | | | | | | |
Notes
| 1. | Numbers may not add due to rounding. Where an entity does not have capital expenditure in a particular statistical division, no dollar figures are shown in the table. |
| 2. | Includes associated statutory bodies. Capital works outside of Queensland are not included in the 2007-08 capital program. |
| 3. | Includes the Departments of Employment and Industrial Relations, Electoral Commission of Queensland, Office of the Governor, Office of the Ombudsman, Office of the Public Service Commissioner and Queensland Audit Office. |
| | | | | | |
| 8 | | Capital Statement 2007-08 | | |
| | | | | | |
| | Capital Statement 2007-08 | | 9 |
| 2. | STATE CAPITAL PROGRAM - PLANNING AND PRIORITIES |
INTRODUCTION
The Queensland Government is committed to creating the infrastructure necessary to support the economic and social development of the State. It does so:
| • | | by providing infrastructure in support of core service delivery priorities – General Government sector investment |
| • | | through investments made by Government-owned corporations (GOCs) – Public Non-Financial Corporations sector investment |
| • | | where appropriate, by fostering private sector investment. |
This chapter outlines key capital planning and expenditure priorities for the 2007-08 Budget.
Further details on the current status of projects with private sector involvement are provided in Chapter 3 of this Budget Paper.
A list of Smart State Building Fund allocations by portfolio is outlined in Appendix B, providing updated details on the $1.4 billion Fund, which was announced in 2003.
CAPITAL PLANNING AND PRIORITIES
Capital investment decisions are predominantly driven by the policy priorities of Government and factors such as demographic changes and planning requirements which affect service delivery needs.
The Government has several mechanisms available to deliver the capital needed to support its priorities. These include funding and constructing its own infrastructure and providing capital grants to local government, the private sector and profit and not-for-profit organisations to build capital and provide services on behalf of the Government. As well, investments made by GOCs contribute significantly to the State capital program. The Government also examines private sector involvement in public infrastructure delivery either through joint ventures or stand-alone projects.
Determining which of these mechanisms represents the best value-for-money outcome for taxpayers forms part of the planning phase of infrastructure investment and is carefully analysed on a case-by-case basis by the Government.
| | | | | | |
| 10 | | Capital Statement 2007-08 | | |
2007-08 HIGHLIGHTS
The Queensland Government is committed to broadening Queensland’s infrastructure base. Highlights of capital spending in 2007-08 are outlined in this section.
Water
The Queensland Government is addressing the unprecedented demand placed on water supplies as a result of a growing population and the worst drought on record in South East Queensland through the development of a range of major water infrastructure projects. These projects will increase the supply of water and improve use of existing water resources to ensure a safe and sustainable water supply for the region well into the future. In 2007-08, the Government will invest $2.5 billion for water infrastructure across the State.
South East Queensland
The Government is constructing a water grid to connect water storages throughout South East Queensland allowing water to be moved around the region to meet demand in the highest area of need. The 2007-08 capital works program includes $465 million for design and construction of the Southern Regional Water Pipeline between Brisbane and the Gold Coast. Funding of $175 million is allocated in 2007-08 to complete corridor assessment surveys and a range of studies to support preliminary engineering design work for the Northern and Eastern Pipeline Interconnectors ahead of commencement of construction works in 2007-08.
Funding of $354.9 million (including $4.9 million for strategic land purchases) is allocated to progress development of two new dams in South East Queensland. The Wyaralong Dam on Teviot Brook, which is scheduled for completion in 2011, is the centrepiece of water storage initiatives on the Logan-Albert River catchment. The Wyaralong Dam and the Cedar Grove Weir will yield 21,000 megalitres per annum for South East Queensland. The first stage of the Traveston Crossing Dam on the Mary River, which is scheduled for completion in 2011, involves the construction of a 153,000 megalitre dam which will deliver up to 70,000 megalitres per annum.
The Western Corridor Recycled Water Scheme, the largest recycled water project in the southern hemisphere, is due for completion in 2008. The 2007-08 capital program includes funding of $1.183 billion for continuation of design and construction of the project including water treatment plants and 200 kilometres of pipeline.
The Government has also committed total equity of $188.4 million, including $46.6 million in 2007-08, towards the construction of the $1.2 billion South East Queensland (Gold Coast) Desalination Plant at Tugun which is expected to be completed in 2008 and will deliver up to 125 megalitres per day. This project is being jointly developed with the Gold Coast City Council.
| | | | | | |
| | Capital Statement 2007-08 | | 11 |
State-wide
The 2007-08 capital program includes several major regional water projects, including funding of $15.1 million to complete the upgrade of the Ross River Dam, $12.7 million for the upgrade of the Mount Isa Terminal Reservoir Pump Station and $19.6 million for preliminary works for a new pipeline from the Fitzroy River to Gladstone. As well, to maintain and improve the supply of water to Queensland, SunWater will spend $14.6 million in 2007-08 on refurbishing and enhancing existing schemes and other minor works.
Further information on the Government’s commitments to water infrastructure can be found in the 2007-08 Budget Related Paper, Queensland the Smart State - Water for the Future.
Transport and Roads Infrastructure
In 2007-08, capital funding of $5.767 billion is provided for transport and roads infrastructure, including Queensland Transport, the Department of Main Roads, Queensland Rail, the port authorities, RoadTek, Queensland Motorways Limited and Airport Link.
Transport
In 2007-08, capital funding of $2.481 billion is provided through the Transport portfolio. This includes $645.2 million for Queensland Transport.
Highlights of the 2007-08 Queensland Transport capital program include:
| • | | $129 million in 2007-08 to complete the construction of the Inner Northern Busway linking the Queen Street Bus Station to the already completed stages of the Busway near Roma Street |
| • | | $285.8 million towards construction of the Eastern and Northern Busways, including $85.8 million for an Eastern Busway corridor connection from the Eleanor Schonell Bridge to Ipswich Road |
| • | | $17.4 million towards the construction of cycle links to enhance the cycle network in South East Queensland and $5 million to complete construction of the Normanby Cycle connection to the Roma Street Parklands. |
Rail and Ports
The introduction of competitive reforms in the transport industry has seen a nationally integrated transport market emerge, with the aim of combining all transport modes (roads, rail and ports) to improve efficiencies in transport logistics. An efficient, integrated transport process maximises the efficiency of the flow of goods, increases returns to the State of Queensland and makes our importers and exporters more competitive in the world market.
| | | | | | |
| 12 | | Capital Statement 2007-08 | | |
Queensland rail and port GOCs perform a vital role in ensuring an efficient transport chain underpins industry development. Exports are a key driver for the Queensland economy, and the 2007-08 rail and port GOC capital program sees significant investment in export-related infrastructure to further increase the State’s competitive position in global markets.
Coal remains the single most important mineral commodity export, with exports fueled by growth in overseas demand for steel and electricity, particularly in Asia. Forecasts of coal exports for the next five years remain strong, particularly to markets in China, South-East Asia, India, Japan and Brazil. To ensure Queensland remains responsive to this demand, GOCs will play a significant role in enabling expansion of the coal supply chain. In particular, Queensland Rail, the Ports Corporation of Queensland and the Central Queensland Ports Authority will invest in coal-related infrastructure projects in 2007-08 to facilitate and expand the State’s coal export capacity. Funding is also provided for major investments in ports infrastructure to meet expected demand for other Queensland export and import trades.
In addition to bulk commodity and containerised trade facilitated by rail and seaports, Queensland transport GOCs also deliver services in passenger rail.
Growth in domestic tourism and the introduction of low-cost carriers in the Australian airline industry has generated sustained capital growth in domestic passenger numbers through Queensland’s airports, necessitating increased investment.
In 2007-08, the capital programs for Queensland Rail and the port authorities are $1.278 billion and $558.1 million respectively.
Highlights of the 2007-08 rail and ports capital program include:
| • | | Coal Network Upgrades – $187.6 million to be spent by Queensland Rail for track works on the coal network in Central Queensland to allow for additional haulage of coal |
| • | | Coal Rollingstock – $163.4 million to be spent by Queensland Rail towards new and upgraded locomotives and wagons to support the increased haulage of coal in Central Queensland |
| • | | Citytrain Track Infrastructure Upgrades – $274.8 million to be spent by Queensland Rail for Citytrain track upgrades (Beenleigh to Gold Coast corridor upgrade, Caboolture to Beerburrum duplication, Mitchelton to Keperra duplication) |
| • | | Citytrain Rollingstock – $104.6 million to be spent by Queensland Rail for additional rollingstock for Citytrain service enhancements |
| | | | | | |
| | Capital Statement 2007-08 | | 13 |
| • | | Expansion of the RG Tanna Coal Terminal – $103 million to be spent by Central Queensland Ports Authority for further expansion of the RG Tanna Coal Terminal, including construction of stockpiles 19, 20 and 21 and a third outloading stream |
| • | | Expansion of the Abbot Point Coal Terminal – $28 million to be spent by Ports Corporation of Queensland as part of its Stage 2 (X21) expansion of the Abbot Point Coal Terminal |
| • | | Cairns Airport Domestic Terminal Building – $52 million to be spent by Cairns Port Authority as part of the redevelopment of the Domestic Terminal Building at the Cairns Airport |
| • | | Cairns Airport International Terminal Building – $30.1 million to be spent by Cairns Port Authority at the International Terminal Building, including redevelopment of the retail areas and expansion of the baggage reclaim hall |
• | | Port of Brisbane Berths – $34 million to be spent by the Port of Brisbane Corporation on construction of a general purpose berth and $16.6 million will be spent on construction of a 10th berth and wharf at Fisherman Islands |
| • | | Hamilton Site Redevelopment – $27.9 million to be spent by the Port of Brisbane Corporation on the continuation of the Hamilton Site Redevelopment program. |
Roads
In 2007-08, capital funding of $3.049 billion is provided through the Main Roads portfolio.
Highlights of the 2007-08 roads capital program include:
| • | | $691.2 million to construct a second Gateway Bridge river crossing and to increase capacity on the Gateway Motorway between Mt Gravatt-Capalaba Road and Nudgee Road |
| • | | $163.5 million to the federally-funded upgrade of the Ipswich Motorway between Wacol and Darra, $121 million towards upgrading the Ipswich/Logan Motorway interchange and $100 million towards the federally-funded $2.3 billion six-lane Goodna Bypass |
| • | | $179.7 million towards construction of the $543 million ($423 million – State; $120 million Australian Government) four-lane bypass on the Pacific Motorway between Tugun and Tweed Heads, scheduled for completion in mid 2008 |
| • | | $58.3 million towards Stages 2 and 3 of the Townsville Ring Road to be constructed at a total estimated cost of $119.3 million ($39.8 million – State; $79.5 million – Australian Government) |
| | | | | | |
| 14 | | Capital Statement 2007-08 | | |
| • | | $36.1 million to continue the Accelerated Road Rehabilitation Program to rehabilitate and widen 71 kilometres of the Dawson Highway in Central Queensland and replace 11 timber bridges |
| • | | $55 million towards the construction of the new Houghton Highway bridge between Brighton and Redcliffe |
| • | | $47 million ($235 million over five years) for road safety programs as part of the Safer Roads Sooner initiative which aims to reduce road trauma and its social consequences through road safety improvements. |
Energy
Electricity demand in Queensland has grown rapidly in recent years, and this trend is expected to continue. Average growth rates over the next three years are forecast at 4.7%, 3.7% and 3.4% per annum respectively.
Electricity demand growth continues to be evident in South East Queensland due to increases in Queensland’s population growth, as well as a steady increase in energy usage per householder through increasing use of air conditioners, computers and swimming pool filters. Growth in average demand in South East Queensland over the next 10 years is likely to average around 4.5% per annum without the implementation of demand management programs. The current resources boom also continues to drive demand across the rest of the State, with forecast demand growth outside of South East Queensland over the next 10 years approaching 2% per annum.
Peak demand drives the investment in electricity capital programs. These growth forecasts will see the continued need for increased expenditure in generation assets as well as the augmentation of the State’s transmission and distribution networks. The GOC network businesses, Powerlink, ENERGEX and Ergon Energy, will spend approximately $2.315 billion in 2007-08 to strengthen the networks around Queensland.
Capital investment undertaken in recent years ensures that current generation capacity in Queensland remains adequate, with sufficient generation capacity to meet the increased demand through to 2010-11. New generation plant, such as the Kogan Creek Power Project, is forecast for completion in 2007-08, while improvements to the efficiency of existing generation assets will also be undertaken. New generation plant is also being developed by the private sector. Continued capital programs targeting service quality, reliability, availability and capacity improvements in the network will also ensure ongoing network reliability.
The Government’s commitment to implementing the recommendations of the independent Electricity Distribution and Service Delivery review for the 21st century is also a key driver of capital expenditure in the energy sector.
| | | | | | |
| | Capital Statement 2007-08 | | 15 |
In the 2007-08 year, the combined capital network expenditure of Ergon Energy and ENERGEX totals $1.738 billion. This expenditure continues to focus on improving the quality and reliability of Queensland’s electricity distribution network assets to meet the increasing demands associated with the State’s strong economic and population growth. The Queensland Competition Authority has also recognised these capital requirements in its current regulatory determination, providing the revenue support the distributors need to implement these plans.
Highlights of the 2007-08 electricity capital program include:
| • | | Regional and Rural Queensland Electricity Network – During 2007-08 a significant portion of Ergon’s capital program will underpin a range of initiatives for network reinforcement and modernisation that will target significant improvements in network service quality, reliability, availability and capacity. Forecast expenditure for reinforcement of network supply across regional Queensland in 2007-08 totals $401.8 million |
| • | | Kogan Creek Power Project – The new Kogan Creek Power Station, currently under construction, is due to be commissioned in September 2007. CS Energy is forecasting capital expenditure of $118.3 million to complete the construction of this power station in 2007-08. When commissioned, the Kogan Creek power station will be one of the most efficient, low-cost, coal-fired power stations in the National Electricity Market and will contribute to maintaining the supply of reliable, low-cost electricity to Queensland |
| • | | Broadsound to Nebo Transmission Line – $55.8 million will be spent by Powerlink in 2007-08 to complete a 275kV transmission line between Broadsound and Nebo. This is the first stage of a three stage reinforcement of electricity supply into North Queensland |
| • | | Nebo to Strathmore Transmission Line – $63.6 million will be spent by Powerlink Queensland in 2007-08 to construct a 275kV transmission line between Nebo and Strathmore substations. This is the second stage of a three-stage solution to reinforce electricity supply to North Queensland |
| • | | North Queensland Electricity Transmission – $41.4 million will be spent by Powerlink in 2007-08 to complete the replacement of the existing Kareeya to Innisfail transmission line and a new line between Tully and Innisfail |
| • | | South East Queensland Electricity Supply – Further reinforcement of the electricity supply to South East Queensland major load centres will be achieved through the completion in 2007-08 of the new Middle Ridge to Greenbank 275kV double circuit transmission line. Powerlink will spend $40.1 million in 2007-08 to complete this project. |
| | | | | | |
| 16 | | Capital Statement 2007-08 | | |
Health
The Queensland Government continues its significant investment in Queensland Health infrastructure with a portfolio capital program of $635 million in 2007-08, including $2.2 million for the Queensland Institute of Medical Research. The focus of the capital program for 2007-08 includes investment in new hospitals, hospital redevelopments, the development of community and mental health infrastructure, health technology replacement, development of new information technology infrastructure and further investment in staff accommodation. The capital program includes South East Queensland Infrastructure Plan and Program projects such as Health Precincts at Browns Plains and North Lakes and the redevelopment of The Prince Charles Hospital.
Total information technology expenditure in the 2007-08 capital works program includes an additional $21.9 million (as part of a five-year program) for e-Health initiatives to contribute to the delivery of an integrated and comprehensive patient information system.
Housing
In 2007-08, $85 million from the Queensland Future Growth Fund will boost the $487.3 million capital program for the Department of Housing to accelerate the expansion of Queensland’s social housing asset base, which is one of the State’s largest assets valued at approximately $10.361 billion.
Expansion of the department’s housing portfolio will help address the growing need for affordable and appropriate accommodation. The capital program will assist the department to re-align the mix of dwelling types in the portfolio to provide housing support for those clients with special needs and to match the changing demographics of the State.
In 2007-08, the Government is providing $53.9 million for a range of strategies to respond to the housing needs of people who require particular assistance from Government. The funds include providing appropriate housing responses to people being discharged from the Spinal Injuries Unit of the Princess Alexandra Hospital, people with mental illness, homeless people and Indigenous people living in remote locations.
| | | | | | |
| | Capital Statement 2007-08 | | 17 |
Education and Training
The 2007-08 Budget provides a substantial investment in educational facilities with a schools capital works program of $445.5 million (including a $65.9 million expensed component). Capital works expenditure of $117.4 million is provided for vocational education and training initiatives (including a $20.6 million expensed component).
Constructing new schools, classrooms and acquiring land in growth areas throughout the State will attract $188.9 million in funding. The Government has allocated $31.8 million to continue delivering facilities for the new Preparatory Year of schooling to support the increased cohort of Prep students commencing in 2008.
Included in the 2007-08 capital works program is $80.5 million (including capital and recurrent funding) as part of the five-year $1 billion Tomorrow’s Schools program to modernise learning environments for students across Queensland. As part of this funding, $31.1 million has been allocated to continue the establishment of the new Queensland Academy for Health Sciences at Southport. Funding is also provided for two other Queensland Academies – one in science, maths and technology at Toowong and one in creative industries within the Kelvin Grove Urban Village.
In March 2006, the Government launched the Queensland Skills Plan, which contains a range of actions to transform and modernise the State’s vocational education and training system. As part of the Plan, the Government has committed to a six-year infrastructure reform package exceeding $300 million, which is designed to enhance vocational education and training facilities around the State.
Capital works expenditure (including capital and recurrent funding) in vocational education and training in 2007-08 includes $93.1 million in new and refurbished TAFE facilities across the State, including $39.9 million to continue construction of the SkillsTech Australia Acacia Ridge and Eagle Farm campuses and $17.3 million to commence construction of two more SkillsTech Australia specialist training centres in Mackay and Townsville.
Non-traditional procurement methods of capital program delivery will continue to be developed during 2007-08. Consideration of the feasibility of funding the provision of new schools through a public-private partnership is to be assessed through a business case review. Funding is to be provided to continue the establishment of the Southbank Education and Training Precinct, a public-private partnership project at the South Brisbane campus of the Southbank Institute of Technology.
| | | | | | |
| 18 | | Capital Statement 2007-08 | | |
QUEENSLAND FUTURE GROWTH FUND
The Queensland Future Growth Fund was established by investing the proceeds from the sale of Sun Retail, Sun Gas, Powerdirect Australia and the Allgas network. The sale processes were very competitive and delivered positive outcomes for the State with the proceeds amounting to over $3 billion. The prices received for the businesses compare favourably with previous retail asset sales in Australia and reflect the growth opportunities available in South East Queensland.
The funds will be used to secure the State’s future economic growth as well as its environmental sustainability through a raft of new infrastructure projects.
Over the coming years, the Fund will focus on key priorities, which include:
| • | | committing funds to the construction and acceleration of vital infrastructure projects in the areas of water and transport. As the sales proceeds were greater than forecast, it is now possible to allocate $1.5 billion to the areas of water and transport. The Department of Transport is allocated $500 million towards advancing planning and construction of high priority public transport projects |
| • | | $300 million for Clean Coal technology that will make a proactive and positive contribution to the science and technology of reducing greenhouse gas emissions |
| • | | a further $100 million on projects to combat the effects of climate change including an investment of $50 million in the Queensland Renewable Energy Fund to support demonstration projects involving leading edge renewable energy technologies. Funding is also available for a broader program of climate change initiatives, including an Energy Savings Fund which will support Queensland companies investing in energy efficient products and a ClimateSmart Living campaign to raise awareness of climate change and highlight actions Queenslanders can take to reduce their greenhouse gas emissions |
| • | | $100 million towards Smart State projects, specifically the Innovation Building Fund. This will provide an opportunity to capitalise on previous investment in research and development infrastructure and to develop further in areas of comparative advantage |
| • | | $600 million for commercial infrastructure, including funding for Energex and Ergon to improve their distribution networks. Funding will also be provided to other economically significant projects outside of South East Queensland, with details on projects to be determined by future priorities and commercial negotiations. Investment in these projects will reimburse the Government for income lost through the sale of the energy assets |
| | | | | | |
| | Capital Statement 2007-08 | | 19 |
| • | | an injection of $500 million to the Department of Housing to fund a major expansion of the State’s social housing stock. This will enhance the department’s capacity to commence new purchases and constructions in the areas of Public Rental Housing, Aboriginal and Torres Strait Islander Housing and Community Housing, thereby ensuring that the future needs of the community are satisfied. |
The Fund will also benefit from the reinjection of interest earnings on Fund balances.
Table 2.1
Queensland Future Growth Fund Projects
| | | | | | |
| | | Total
Allocation
$ million | | 2006-07
Est. Act.
$ million | | 2007-08
Budget
$ million |
Water and transport infrastructure | | 1,500.0 | | — | | 156.0 |
| | | |
Clean coal technology | | 300.0 | | 29.6 | | 56.8 |
| | | |
Smart State projects | | 100.0 | | — | | 15.0 |
| | | |
Climate change projects | | 100.0 | | — | | 20.0 |
| | | |
Commercial infrastructure including Government-owned corporations | | 600.0 | | 400.0 | | — |
| | | |
Social housing stock | | 500.0 | | — | | 85.0 |
| | | | | | |
Total | | 3,100.0 | | 429.6 | | 332.8 |
| | | | | | |
Further details on projects can be found in the portfolio sections of Chapter 4 of this Budget Paper.
| | | | | | |
| 20 | | Capital Statement 2007-08 | | |
| 3. | PRIVATE SECTOR CONTRIBUTION TO THE DELIVERY OF PUBLIC INFRASTRUCTURE |
INTRODUCTION
The Queensland Government believes that private sector participation in the provision of public infrastructure can assist the timely delivery of efficient and effective infrastructure to the Queensland community.
Currently, the Queensland Government is considering several infrastructure projects as potential Public Private Partnerships (PPP) under the Government’s Value for Money Framework. In addition to those projects being assessed under the Value for Money Framework, other major infrastructure projects with private sector involvement are also being progressed through partnering with the private sector as well as through more traditional delivery methods.
CURRENT PROJECTS
Airport Link and Northern Busway
In October 2006, the Queensland Government approved the business cases for the Airport Link and Northern Busway projects and approved the joint procurement of Airport Link, as a PPP, and Northern Busway (Windsor to Kedron), via traditional delivery.
Airport Link is proposed to be a mainly underground toll road that connects the North South Bypass Tunnel, Inner City Bypass and local road network at Bowen Hills to the northern arterials of Gympie Road and Stafford Road at Kedron and Sandgate Road and the East-West Arterial in the north-east. The Northern Busway is a two-lane, two-way dedicated busway proposed to connect the existing Inner Northern Busway at Royal Children’s Hospital Herston to Bracken Ridge.
Four expressions of interest to deliver the projects were received in April 2007. It is anticipated that a preferred bidder will be selected in mid 2008. Construction of the projects will commence in 2008-09 and it is anticipated that the projects will be operational in 2012.
Toowoomba Bypass
The Queensland Government is currently undertaking a Business Case Development Study for the Toowoomba Bypass project, with the assistance of the Australian Government.
The proposed bypass will provide a safer and faster range crossing, removing the majority of heavy vehicles from city streets and the existing range road. The business case is expected to be completed in 2007.
| | | | | | |
| | Capital Statement 2007-08 | | 21 |
Gold Coast Rapid Transit Project
A quality public transport system from Helensvale to Broadbeach and through to Coolangatta is identified in the South East Queensland Infrastructure Plan and Program (SEQIPP). The Queensland Government is currently developing a business case for stage one of this project (Helensvale to Broadbeach). Depending on the mode of transport chosen, it may be possible to achieve better value for money through a PPP arrangement by optimising the allocation of construction, operation, maintenance and financing risks. The various transport options and project delivery methods are being investigated in the business case, which is expected to be completed in September 2007.
Eastern Busway: Buranda to Capalaba
SEQIPP identifies the need for an Eastern Busway from Buranda to Capalaba. Consultation has been undertaken with the local community in relation to construction of the busway and a business case is currently being finalised.
South East Queensland Schools
SEQIPP identifies new school requirements for the region. The procurement of new schools scheduled to be opened in 2009 to 2011 in the Western Corridor and Sunshine Coast sub-regions is being assessed under the Government’s Value for Money Framework. The business case is expected to be completed by mid 2007.
Townsville Ocean Terminal
The Townsville Ocean Terminal is a key component in the implementation of the Queensland Cruise Shipping Plan and supports the potential economic benefits to the State and the Townsville region associated with the increased visits from both cruise vessels and Australian and foreign military vessels on rest and recreation visits.
Under a development agreement between the State and developer, City Pacific Limited, the project will provide Townsville with:
| • | | a dedicated cruise terminal and wharf to attract cruise ships and naval vessels, located on the Western Breakwater, adjacent to the Port of Townsville |
| • | | an integrated residential and tourism development for the land surrounding the casino |
| • | | a landscaped residential development, providing public access to the Breakwater and future green areas. |
It is anticipated that construction of the terminal will commence in late 2007 and be completed by 2009.
| | | | | | |
| 22 | | Capital Statement 2007-08 | | |
Gold Coast Marine Development Project
In August 2006, in response to preliminary findings of an Environmental Impact Statement, the Government announced that it was not economically feasible to develop a cruise ship terminal as an element of the Gold Coast Marine Development Project. However, the Government determined that other elements of the Project, such as a superyacht facility, an upgrade of Doug Jennings Park and a preservation and protection program for Federation Walk, would continue to be considered and that a new competitive process would be undertaken.
The Queensland Government’s vision for The Spit is an integrated development that is compatible with the existing natural and built environment, consolidates and complements the existing marine infrastructure and creates new and exciting recreational and tourism experiences while enhancing the public recreation experience on The Spit.
A competitive process for the redefined project is expected to commence in mid 2007.
Aurukun Project
The Aurukun Bauxite Resource is situated in a parcel of land in western Cape York, south of Weipa. As part of an international competitive bidding process for the granting of development rights over the Aurukun Bauxite Resource, the Queensland Government selected the Aluminum Corporation of China Limited (CHALCO) to develop the Aurukun Project, including a mine and wash plant at Aurukun and an alumina refinery on the east coast of Queensland, at a cost of approximately $2.92 billion. The Government is seeking to optimise the economic, social and financial outcomes for the State and the local region from the development of the bauxite resource and investment in downstream processing.
North Bank
The proposed North Bank development, spanning the two kilometre stretch of Brisbane CBD waterfront from the Goodwill Bridge to the William Jolly Bridge, will include a mixture of public use, commercial, retail and residential spaces. The aim of the North Bank project is to complement the existing Southbank development and further enhance Brisbane’s reputation as the ‘River City’.
The Queensland Government has commenced negotiations with Multiplex, the preferred developer for Stage One of the North Bank project (extending from Victoria Bridge to Alice Street).
| | | | | | |
| | Capital Statement 2007-08 | | 23 |
Surat Basin Railway
In December 2006, the Queensland Government granted a Conditional Exclusive Mandate under its Value for Money Framework to a joint venture consortium to investigate the development of the Surat Basin Railway, which would link the towns of Wandoan and Banana to the Port of Gladstone and would assist in the development of the Surat Basin coalfields. The consortium, comprising ATEC, Industry Funds Management, Queensland Rail, Xstrata and Anglo Coal, is expected to progress its investigations with a view to achieving financial close for the development of the railway by 2009-10.
New Queensland Driver Licence
The Queensland Government is replacing the current Queensland Driver Licence with a Smartcard containing a digital certificate. The New Queensland Driver Licence (NQDL) will meet the increasing demand for more sophisticated identity management and community demands for improved protection against fraud and identity theft.
In May 2006, Government approved the NQDL project to proceed to the procurement phase as a partial PPP with remaining components of the NQDL project being delivered through a traditional procurement process. Expressions of Interest were called in August 2006, resulting in the State short listing proponents considered to have the capacity to design, install, commission and maintain software and hardware needed to introduce the new driver licence based on Smartcard technology.
The procurement process is currently progressing through the Binding Bid stage of the Government’s Value for Money Framework, with project delivery scheduled to commence in November 2007.
State Tennis Centre – Tennyson Riverside Development
Following a competitive bidding process, the Queensland Government selected Mirvac Queensland as the preferred developer for the delivery of an international-standard State Tennis Centre and residential development at Tennyson. The development will include a state-of-the-art tennis and residential complex which integrates with the surrounding area. The State Tennis Centre is scheduled for completion at the end of 2008.
Southbank Education and Training Precinct Project
The Queensland Government’s first PPP under the Government’s Value for Money Framework involves construction of 11 new buildings and renovation of another four buildings at the Southbank Institute of TAFE in two stages.
The first stage of the project was completed within the scheduled timeframe. Stage two of the project has now commenced.
| | | | | | |
| 24 | | Capital Statement 2007-08 | | |
| 4. | CAPITAL OUTLAYS BY ENTITY |
CHILD SAFETY
The 2007-08 Budget provides for $36.4 million in capital expenditure for the Department of Child Safety. The capital program includes investment to enhance Indigenous service delivery, the progression of therapeutic residential facilities, continued investment in enhancing the coverage of the Integrated Client Management System (ICMS), progression of office accommodation solutions to meet service delivery requirements, and the development of residential care facilities.
Program Highlights
| • | | Funding of $15.5 million over four years ($7.6 million in 2007-08) to strengthen child protection services in Indigenous Communities, including establishing residential care facilities in Pormpuraaw, Kowanyama, Aurukun, Weipa/Napranum and Doomadgee. Additionally, a first placement house will also be established on Palm Island as part of the Queensland Government’s five point plan for Palm Island. These facilities will provide a safe place for Indigenous children and young people to be placed for initial assessments and reduce the need to remove them from their community, as well as provide for longer term residential care. This funding will also be used to establish employee housing and office accommodation facilities for Child Safety Officers delivering services from branch offices located in Weipa, Cooktown and Thursday Island. |
| • | | $ 6.4 million is allocated to progress the establishment of therapeutic residential facilities in Cairns, Townsville and South East Queensland. These facilities will extend the department’s capacity to respond to children in the care of the State with complex behaviours and mental health issues. |
| • | | Expenditure of $6.7 million is planned in relation to the ongoing investment in ICMS and other information management systems. |
| • | | $ 9.6 million will be invested to progress office accommodation initiatives to support departmental staff located across the State. |
| • | | $ 3.6 million will be invested in the development of residential care facilities to address placement needs in locations experiencing property rental constraints. |
| | | | | | |
| | Capital Statement 2007-08 | | 25 |
Child Safety
| | | | | | | | | | |
Project | | Statistical Division | | Total
Estimated
Cost
$’000 | | Expenditure
to 30-06-07
$’000 | | Budget
2007-08 $’000 | | Post
2007-08 $’000 |
DEPARTMENT OF CHILD SAFETY | | | | | | | | | | |
| | | | | |
Property, Plant and Equipment | | | | | | | | | | |
Office accommodation | | Various | | | | | | 9,601 | | Ongoing |
Residential care facilities | | Various | | 3,600 | | | | 3,600 | | |
Therapeutic residential care facilities | | Various | | 6,400 | | | | 6,400 | | |
Services for Indigenous Communities | | Various | | 15,460 | | | | 7,560 | | 7,900 |
Minor works and other plant and equipment | | Various | | | | | | 2,560 | | Ongoing |
Total Property, Plant and Equipment | | | | | | | | | | |
Other Capital Expenditure | | | | | | | | 29,721 | | |
| | | | | | | | | | |
Information management systems | | Various | | | | | | 6,099 | | Ongoing |
Minor information systems | | Various | | | | | | 562 | | Ongoing |
| | | | | | | | | | |
Total Other Capital Expenditure | | | | | | | | 6,661 | | |
| | | | | | | | | | |
TOTAL DEPARTMENT OF CHILD SAFETY | | | | | | | | 36,382 | | |
| | | | | | | | | | |
| | | | | | |
| 26 | | Capital Statement 2007-08 | | |
COMMUNITIES
Program Highlights
The department’s capital expenditure program for 2007-08, including capital grants, is $107 million. This investment will continue to foster strong communities where all people are safe, valued and empowered, wherever they live, whatever their circumstances. These capital funds are being applied towards a range of strategies including:
| • | | $ 12.2 million for the purchase and refurbishment of decommissioned preschools into early childhood education and care services |
| • | | $ 10.6 million to early years service centres, with sites commencing at Nerang and Caboolture. The early years centres will provide high quality universal early childhood education, health and child care services with some targeted services for vulnerable families |
| • | | $ 9.8 million to complete the next stage of the Brisbane Youth Detention Centre refurbishment |
| • | | improvement of the learning and development areas, physical security and accommodation at the Cleveland Youth Detention Centre in Townsville at a projected cost of $14.5 million over the next three years. Similarly, the capacity of the Brisbane Youth Detention Centre will be upgraded at a cost of $8.7 million over the next two years |
| • | | $ 4.2 million over the next four years for improvement of Youth Justice Services infrastructure development including youth conferencing, youth support services, enhanced program delivery, services to reduce re-offending and a Detention Centre Operational Information System |
| • | | $ 2.2 million towards capital upgrades at the Brisbane Children’s Court |
| • | | $ 3.6 million for the refurbishment of retail stores at Lockhart River and Palm Island, fuel facilities at Kowanyama and the procurement of plant and equipment |
| • | | $ 2.3 million to complete the establishment of three Multi-Tenant Service Centres in Toowoomba, Mackay and Caboolture as part of the Strengthening Non-Government Organisations initiative |
| • | | $ 2.2 million to complete the construction of neighbourhood centres at Kuranda, Bohlevale and Innisfail |
| • | | $ 2.1 million to finalise the Regional Accommodation Program in 2007-08, which will enable the department to deliver new and expanded services from 10 youth service centres, eight regional service centres and over 20 local service centres |
| | | | | | |
| | Capital Statement 2007-08 | | 27 |
| • | | $ 2.1 million for community and neighbourhood centre upgrades which covers disability access, air-conditioning and safety issues |
| • | | $ 8.2 million to further the development of the Information Renewal Initiative, primarily the Integrated Client Management System |
| • | | $ 4 million to Smart Service Queensland initiatives to continue the development of key whole-of-Government systems across multiple agencies, to standardise and streamline Queensland Government services to further enhance access and service delivery for the community as a whole |
| • | | $ 3.1 million of additional funding for the development of a new Grants Management System to better manage the interface between the department and Non-Government Organisations |
| • | | $ 10.6 million in capital grants as part of the early years Best Start Strategy |
| • | | $ 2 million in Child Care capital grants to enable services to meet the requirements of Queensland’s child care legislation. Ongoing funding of $1 million will be provided to school aged care services to continue upgrading facilities and a further $1 million to community-based child care services in remote Indigenous communities to upgrade equipment and facilities |
| • | | $ 1.5 million in capital grants for a community centre in Maleny. |
Communities
| | | | | | | | | | |
Project | | Statistical
Division | | Total
Estimated
Cost
$’000 | | Expenditure
to
30-06-07
$’000 | | Budget
2007-08 $’000 | | Post
2007-08 $’000 |
DEPARTMENT OF COMMUNITIES | | | | | | | | | | |
| | | | | |
Property, Plant and Equipment | | | | | | | | | | |
Children’s Court renovation | | 05 | | 2,200 | | | | 2,200 | | |
Department ICT replacement program | | Various | | | | | | 652 | | Ongoing |
Office fitouts | | Various | | 5,610 | | | | 1,725 | | 3,885 |
Neighbourhood Centre and Child Care Centre Program | | Various | | 10,390 | | | | 2,275 | | 8,115 |
Child Care enhancements | | Various | | 285 | | | | 285 | | |
Early Years education centres | | Various | | 15,643 | | 3,403 | | 12,240 | | |
Early Years service centres | | Various | | 12,295 | | 1,695 | | 10,600 | | |
Strengthening Non-Government Organisations | | Various | | 4,751 | | 2,440 | | 2,311 | | |
| | | | | | |
| 28 | | Capital Statement 2007-08 | | |
Communities
| | | | | | | | | | |
Project | | Statistical
Division | | Total
Estimated
Cost
$’000 | | Expenditure
to
30-06-07
$’000 | | Budget
2007-08
$’000 | | Post
2007-08 $’000 |
Aboriginal and Torres Strait Islanders diversionary centre and fitouts | | Various | | 1,107 | | | | 1,107 | | |
Retail Store undertakings | | Various | | 3,619 | | | | 3,619 | | |
Property, plant and equipment replacement program | | Various | | 2,667 | | | | 2,667 | | |
Neighbourhood Centre upgrades and air conditioning | | Various | | 400 | | | | 400 | | |
Neighbourhood Centre disability access | | Various | | 2,425 | | 50 | | 1,125 | | 1,250 |
Neighbourhood Centre security and safety | | Various | | 325 | | | | 175 | | 150 |
Neighbourhood Centre upgrades | | Various | | 800 | | | | 400 | | 400 |
Grants Management System hardware | | Various | | 838 | | | | 838 | | |
Shared Information Solutions ICT replacement program | | Various | | | | | | 6,345 | | Ongoing |
Smart Service Queensland | | Various | | 12,180 | | 8,576 | | 3,604 | | |
Regional Accommodation Program | | Various | | 18,842 | | 16,713 | | 2,129 | | |
Brisbane Youth Detention Centre refurbishment | | 05 | | 13,916 | | 4,142 | | 9,774 | | |
Brisbane Youth Detention Centre enhancements | | 05 | | 8,674 | | | | 2,713 | | 5,961 |
Cleveland Youth Detention Centre enhancements | | 45 | | 14,462 | | | | 1,921 | | 12,541 |
Youth Justice fitout and project management | | Various | | 2,172 | | | | 1,446 | | 726 |
Brisbane Youth Detention Centre additional beds | | 05 | | 776 | | 247 | | 529 | | |
Mareeba Transition Centre | | 50 | | 1,000 | | 923 | | 77 | | |
Kuranda Neighbourhood Centre | | 50 | | 1,435 | | 1,184 | | 251 | | |
Innisfail Community Centre | | 50 | | 1,899 | | 415 | | 1,484 | | |
Bohlevale District Community Centre | | 45 | | 1,500 | | 1,031 | | 469 | | |
Minor capital works | | Various | | 500 | | 1 50 | | 200 | | 150 |
Other capital works | | Various | | 4,679 | | | | 4,679 | | |
| | | | | | | | | | |
Total Property, Plant and Equipment | | | | | | | | 78,240 | | |
| | | | | | | | | | |
Other Capital Expenditure | | | | | | | | | | |
Information Renewal Initiative | | Various | | 19,216 | | 11,055 | | 8,161 | | |
Software development | | Various | | | | | | 1,500 | | Ongoing |
Grants Management System | | Various | | 2,259 | | | | 2,259 | | |
Smart Service Queensland software | | Various | | 349 | | | | 349 | | |
| | | | | | |
| | Capital Statement 2007-08 | | 29 |
Communities
| | | | | | | | | | |
Project | | Statistical
Division | | Total
Estimated
Cost
$’000 | | Expenditure
to 30-06-07
$’000 | | Budget
2007-08 $’000 | | Post
22007-08 $’000 |
Detention centre operational information system | | Various | | 2,040 | | | | 1,780 | | 260 |
| | | | | | | | | | |
Total Other Capital Expenditure | | | | | | | | 14,049 | | |
| | | | | | | | | | |
Capital Grants | | | | | | | | | | |
Child Care grants | | Various | | | | | | 2,030 | | Ongoing |
Early Years Best Start capital grants | | Various | | 10,707 | | 140 | | 10,567 | | |
Maleny Community Centre grant | | 10 | | 1,500 | | | | 1,500 | | |
Multi Purpose Community Centres | | Various | | 600 | | | | 600 | | |
| | | | | | | | | | |
Total Capital Grants | | | | | | | | 14,697 | | |
| | | | | | | | | | |
TOTAL DEPARTMENT OF COMMUNITIES | | | | | | | | 106,986 | | |
| | | | | | | | | | |
| | | | | | |
| 30 | | Capital Statement 2007-08 | | |
CORRECTIVE SERVICES
The department’s capital expenditure program for 2007-08 is $254.6 million and mainly funds the expansion of prison infrastructure to meet the immediate and short-term accommodation needs of prisoners, and upgrades to existing prison infrastructure.
Program Highlights
| • | | $114.6 million is provided for the completion in 2007-08 of three major projects: the new women’s correctional centre at Townsville, the redevelopment of Sir David Longland Correctional Centre that will be reopened as the Brisbane Correctional Centre, and the expansion of Arthur Gorrie Correctional Centre. |
| • | | $113.3 million is provided in 2007-08 for the continuation of construction work on the expansion of the Townsville Correctional Centre, which is due for completion in 2008-09. |
| • | | The master planning for the proposed new prison precinct at Gatton will continue with an allocation of $3.5 million in 2007-08. |
| • | | Planning for the expansion of Lotus Glen Correctional Centre by 300 beds will commence in 2007-08 at a cost of $3 million. |
| • | | The upgrading and enhancement of correctional infrastructure continues in 2007-08 with an allocation of $7.7 million to continue the perimeter security systems upgrades, $1.7 million for the completion of the videoconferencing installation at Arthur Gorrie Correctional Centre, and $0.42 million for completion of the lightning protection at Townsville Correctional Centre, which is being undertaken in conjunction with the current expansion of that facility. |
| • | | $2.6 million is provided for the ongoing program of providing appropriate accommodation for Probation and Parole offices in 2007-08. Also, $0.5 million is provided for accommodation for new services on Cape York. |
| | | | | | |
| | Capital Statement 2007-08 | | 31 |
Corrective Services
| | | | | | | | | | |
Project | | Statistical
Division | | Total
Estimated
Cost $’000 | | Expenditure to 30-06-07
$’000 | | Budget
2007-08 $’000 | | Post
2007-08 $’000 |
QUEENSLAND CORRECTIVE SERVICES | | | | | | | | | | |
| | | | | |
Property, Plant and Equipment | | | | | | | | | | |
Women’s Correctional Centre (CC) at Townsville | | 45 | | 130,000 | | 79,554 | | 50,446 | | |
Redevelopment of Sir David Longland CC | | 05 | | 110,000 | | 65,723 | | 44,277 | | |
Expansion of Arthur Gorrie CC | | 05 | | 55,000 | | 35,099 | | 19,901 | | |
Expansion of Townsville CC | | 45 | | 142,500 | | 24,175 | | 113,325 | | 5,000 |
Gatton Precinct planning | | 10 | | 4,500 | | 1 ,048 | | 3,452 | | |
Lotus Glen CC planning | | 50 | | 3,000 | | | | 3,000 | | |
Perimeter security systems | | Various | | 40,000 | | 23,284 | | 7,716 | | 9,000 |
Establishment of new Probation and Parole service | | Various | | 3,920 | | 1,318 | | 2,602 | | |
Probation and Parole in Indigenous Communities | | Various | | 1,500 | | | | 500 | | 1,000 |
Videoconferencing to external locations | | 05 | | 2,667 | | 950 | | 1,717 | | |
Correctional Centre Lightning Protection | | 45 | | 3,600 | | 3,176 | | 424 | | |
Other acquisitions of property, plant and equipment | | Various | | | | | | 7,259 | | Ongoing |
| | | | | | | | | | |
Total Property, Plant and Equipment | | | | | | | | 254,619 | | |
| | | | | | | | | | |
TOTAL QUEENSLAND CORRECTIVE SERVICES | | | | | | 254,619 | | |
| | | | | | | | | | |
| | | | | | |
| 32 | | Capital Statement 2007-08 | | |
DISABILITY SERVICES QUEENSLAND
Investment in capital infrastructure forms a vital part of delivering specialist disability services. As a human services provider and funder, Disability Services Queensland invests in capital infrastructure where it is required for government service provision. Capital infrastructure is also utilised to accommodate and support departmental staff and in tailored accommodation infrastructure for people with an intellectual disability and respite centres. The major portion of non-government service delivery utilises existing community sector capital infrastructure.
Program Highlights
The department’s capital expenditure program for 2007-08, including capital grants, is $64.7 million.
The 2007-08 Budget commits $53.9 million to capital works, equipment purchases and software development, of which $18.9 million is additional capital funding to enhance disability services delivered within the government and non-government sectors. These funds are being applied towards a range of strategies including:
| • | | a forward capital upgrade program for the department’s owned properties at a cost of $3.5 million, and new office accommodation projects with $6.4 million committed for 2007-08 |
| • | | expenditure of $3.3 million on a range of office accommodation projects at various locations across the State |
| • | | completing upgrades to residences owned by the department and the Department of Housing under the Smart State Land and Buildings Program |
| • | | continuing to progress the tailored accommodation initiative at $9.5 million and respite service replacement projects in the amount of $4.5 million |
| • | | $5.8 million additional funding in 2007-08 to design and construct purpose built accommodation and support models, as part of a targeted response, for people with severely challenging behaviours with total project funding being $24.3 million |
| • | | $2.8 million (including $2.5 million additional funding in 2007-08) for enhancements to the Disability Information System (DISQIS) to support disability systems reform with total project funding being $25.1 million |
| • | | $3 million in 2007-08 to provide alternative accommodation models to reduce the incidence of young people with a disability living in or at risk of entering aged care facilities with total project funding of $6 million |
| | | | | | |
| | Capital Statement 2007-08 | | 33 |
| • | | $3.5 million additional funding in 2007-08 to provide infrastructure to support non-government organisations to provide services for people with a mental illness with total project funding being $11.8 million. This funding is provided as a component of the Queensland Mental Health Strategic Plan 2007-17. |
In addition, $10.8 million has been committed to capital grants, including:
| • | | $4.9 million in capital grants to develop all abilities playgrounds in partnership with local councils which will provide safe and enjoyable recreational equipment and activities for all children including those with a disability |
| • | | $3.7 million in capital grants to assist non-government service providers maintain, upgrade or replace high use equipment and assets |
| • | | $1.5 million in capital grants to the non-government sector to reduce the number of younger people with a disability living in or at risk of entering residential aged care. |
Disability Services Queensland
| | | | | | | | | | |
Project | | Statistical
Division | | Total
Estimated
Cost $‘000 | | Expenditure
to 30-06-07 $’000 | | Budget
2007-08 $’000 | | Post
2007-08
$’000 |
DISABILITY SERVICES QUEENSLAND | | | | | | | | | | |
| | | | | |
Property, Plant and Equipment | | | | | | | | | | |
Respite Services | | | | | | | | | | |
Ipswich* | | 05 | | 3,147 | | 471 | | 2,676 | | |
Nerang | | 10 | | 128 | | 91 | | 37 | | |
Toowoomba | | 20 | | 2,034 | | 258 | | 1,776 | | |
Innovative Housing | | | | | | | | | | |
Loganlea | | 05 | | 1,362 | | 328 | | 1,034 | | |
Maryborough West | | 15 | | 3,202 | | 574 | | 2,628 | | |
Toowoomba | | 20 | | 1,697 | | 10 | | 1,687 | | |
Smart State Building Fund | | | | | | | | | | |
Smart State land and buildings* | | Various | | 2,088 | | 35 | | 2,053 | | |
Playground equipment* | | Various | | 450 | | | | 450 | | |
Tailored Accommodation | | | | | | | | | | |
Cluster housing | | Various | | 14,012 | | | | 5,250 | | 8,762 |
Deception Bay* | | 05 | | 3,917 | | 609 | | 1,308 | | 2,000 |
Wacol | | 05 | | 3,100 | | 158 | | 2,942 | | |
Other Property, Plant and Equipment | | | | | | | | | | |
Aspley—house | | 05 | | 600 | | | | 600 | | |
Brisbane West/Wacol area office | | 05 | | 500 | | 338 | | 162 | | |
Caboolture area office | | 05 | | 704 | | 14 | | 690 | | |
| | | | | | |
| 34 | | Capital Statement 2007-08 | | |
Disability Services Queensland
| | | | | | | | | | |
Project | | Statistical
Division | | Total Estimated
Cost $’000 | | Expenditure to 30-06-07 $’000 | | Budget 2007-08 $’000 | | Post 2007-08 $’000 |
Forward capital program | | Various | | 60,020 | | | | 9,951 | | 50,069 |
Ipswich area office | | 05 | | 3,600 | | | | 100 | | 3,500 |
Queensland Mental Health Strategic Plan 2007-17 | | Various | | 11,840 | | | | 3,500 | | 8,340 |
Plant and equipment replacement | | Various | | 1,169 | | | | 542 | | 627 |
Rockhampton area office | | 30 | | 1,376 | | 680 | | 696 | | |
System reform | | Various | | 596 | | | | 596 | | |
Targeted Response to Severely Challenging Behaviour | | Various | | 24,269 | | | | 5,838 | | 18,431 |
Townsville area office | | 45 | | 1,435 | | 132 | | 1,303 | | |
Waterford West—house | | 05 | | 500 | | 403 | | 97 | | |
Young People in Nursing Homes | | Various | | 6,000 | | | | 3,000 | | 3,000 |
Other property | | Various | | 1,391 | | 207 | | 1,184 | | |
| | | | | | | | | | |
Total Property, Plant and Equipment | | | | | | | | 50,100 | | |
| | | | | | | | | | |
Other Capital Expenditure | | | | | | | | | | |
Information System (DISQIS) | | Various | | 25,101 | | 13,173 | | 2,775 | | 9,153 |
Systems* | | Various | | 2,258 | | 1,184 | | 1,074 | | |
| | | | | | | | | | |
Total Other Capital Expenditure | | | | | | | | 3,849 | | |
| | | | | | | | | | |
| | | | | |
Capital Grants | | | | | | | | | | |
All Abilities Playgrounds, Young People In Residential Aged Care and Strengthening NGOs | | Various | | 37,274 | | 14,299 | | 10,761 | | 12,214 |
Total Capital Grants | | | | | | | | 10,761 | | |
| | | | | | | | | | |
TOTAL DISABILITY SERVICES QUEENSLAND | | | | | | | | 64,710 | | |
| | | | | | | | | | |
| * | Funded fully or in part under the Smart State Building Fund |
| | | | | | |
| | Capital Statement 2007-08 | | 35 |
EDUCATION, TRAINING AND THE ARTS
Total capital expenditure for the Education, Training and the Arts portfolio (including related entities) for 2007-08 is $619.1 million.
Education and Training
A substantial capital works program of $562.8 million, incorporating both capital and recurrent expenditure, will be undertaken in 2007-08. This comprises an Education capital works program of $445.5 million (including an expense component of $65.9 million) and $117.4 million dedicated to Training (including an expense component of $20.6 million) of which $86.9 million is for the construction and refurbishment of TAFE training facilities (see footnote 4 of table).
The planning for capital meets the Government’s priorities and needs by considering population growth, changes in education standards and delivery methods and addressing high priority needs such as student and staff health and safety.
As part of its commitment to providing outstanding learning infrastructure, the department will continue to improve and add to learning facilities through the Schools Capital Works Program, the Queensland Skills Plan and renewal and regeneration projects.
Program Highlights
Funding for the following projects incorporates both capital and recurrent expenditure.
| • | | $188.9 million to construct two new schools at Northern Coomera and West Pacific Pines, undertake staged work at 11 schools, make land acquisitions and provide additional classrooms at existing schools in growth areas throughout the State. |
| • | | $78.2 million to replace and enhance facilities at existing schools, and to provide additional and replacement toilet facilities. |
| • | | $80.5 million for the Tomorrow’s Schools program, including $31.1 million for the Queensland Academy for Health Sciences on the Gold Coast. |
| • | | $33.6 million to construct the Queensland Academy for Creative Industries. |
| • | | $31.8 million to complete construction work for the Preparatory Year. |
| • | | $12.4 million to acquire new employee accommodation and refurbish existing housing stock. |
| • | | $39.9 million for continuing the SkillsTech Australia major trade and technician skills campuses at Acacia Ridge and Eagle Farm in Brisbane. |
| | | | | | |
| 36 | | Capital Statement 2007-08 | | |
| • | | $17.3 million will be used to continue detailed planning and construction of the SkillsTech Australia major trade and technician skills institute campuses in Townsville and Mackay. |
| • | | $27.5 million is to be invested directly in information and communication technology for vocational education and training. |
| • | | Continuing investment in the establishment of the Southbank Education and Training Precinct, a Public Private Partnership project at the South Brisbane campus of the Southbank Institute of Technology. |
Arts
Capital expenditure in 2007-08 will adapt the Auditorium at the Cultural Centre into a creative ideas and technology centre for children and is the final phase in the redevelopment of the centre. The adaptation involves refurbishment of the building, upgrading of finishes and services to modern standards and development of flexible spaces to provide a special place for children to interact, learn and enjoy the Cultural Centre.
Library Board of Queensland
The State Library of Queensland will continue to invest in collection assets for its General Reference and Heritage Collections. With the completion of the Millennium Library Project, investment in furniture and fittings as well as computer, audio-visual and office equipment will complete the fit-out of the redeveloped building.
Queensland Art Gallery
The Gallery’s $1.3 million property, plant and equipment expenditure program for 2007-08 principally comprises purchases of works of art and operational plant and equipment for both the Queensland Art Gallery and the Gallery of Modern Art.
Queensland Museum
Planning and design has commenced on two major exhibitions at the Museum of Tropical Queensland in Townsville, with both due for completion in 2007-08. The majority of construction funds have been secured via corporate sponsorship and fundraising, with Queensland Museum providing intellectual property and collections.
| | | | | | |
| | Capital Statement 2007-08 | | 37 |
Education, Training and the Arts1,2,3,4,5
| | | | | | | | | | |
Project | | Statistical
Division | | Total Estimated
Cost $’000 | | Expenditure to 30-06-07 $’000 | | Budget
2007-08 $’000 | | Post
2007-08 $’000 |
EDUCATION | | | | | | | | | | |
KEY TO ABBREVIATIONS | | | | | | | | | | |
GLAB—General Learning Area Block | | | | | | | | | | |
Property, Plant and Equipment | | | | | | | | | | |
Aviation High, development of Aviation High | | 05 | | 5,394 | | | | 1,798 | | 3,596 |
Balaclava State School, replacement amenities | | 50 | | 1,218 | | | | 1,218 | | |
Bellevue Park State School, Performing Arts Hall | | 10 | | 500 | | 1 | | 499 | | |
Bremer State High School, additional amenities | | 05 | | 956 | | | | 304 | | 652 |
Brisbane State High School, redevelopment works | | 05 | | 17,600 | | 7,179 | | 3,025 | | 7,396 |
Bundaberg State High School, replacement amenities | | 15 | | 957 | | | | 435 | | 522 |
Burpengary Meadows State School, new school for 2007* | | 05 | | 12,338 | | 11,590 | | 748 | | |
Burpengary Meadows State School, Stage 2—planning | | 05 | | 880 | | | | 880 | | |
Bwgcolman Community School, replacement amenities | | 45 | | 1,305 | | | | 870 | | 435 |
Calliope State School, library block | | 30 | | 616 | | | | 616 | | |
Chancellor State College, Stage 3C—Performing Arts | | 10 | | 4,400 | | | | 4,400 | | |
Craigslea State School, amenities upgrade | | 05 | | 484 | | | | 484 | | |
Currimundi Special School, GLAB—4 spaces | | 10 | | 2,640 | | 238 | | 2,402 | | |
Disability Services Support Unit, relocation | | 05 | | 2,816 | | 502 | | 2,314 | | |
Doomadgee State School, replacement amenities | | 55 | | 696 | | 52 | | 644 | | |
Earnshaw State College, Indoor Sports Facility—planning | | 05 | | 440 | | | | 440 | | |
Edge Hill State School, additional amenities | | 50 | | 522 | | 261 | | 261 | | |
Fernvale State School, GLAB—4 spaces | | 10 | | 1,597 | | 238 | | 1,359 | | |
| | | | | | |
| 38 | | Capital Statement 2007-08 | | |
Education, Training and the Arts1,2,3,4,5
| | | | | | | | | | |
Project | | Statistical
Division | | Total
Estimated
Cost $’000 | | Expenditure
to 30-06-07 $’000 | | Budget
2007-08
$’000 | | Post 2007-08
$’000 |
Forest Lake State School, oval development | | 05 | | 1,320 | | 379 | | 941 | | |
Hambledon State School, GLAB—8 spaces and amenities and covered area | | 50 | | 4,306 | | 135 | | 4,171 | | |
Harris Fields State School, replacement administration Block | | 05 | | 1,200 | | | | 600 | | 600 |
Homebush State School, additional amenities | | 40 | | 784 | | | | 305 | | 479 |
Innisfail East State School, stabilisation of river bank | | 50 | | 774 | | 419 | | 355 | | |
Isabella State School, Stage 2 | | 50 | | 1,760 | | | | 1,760 | | |
Jimboomba State School, GLAB—2 storey—4 spaces | | 05 | | 1,760 | | | | 1,760 | | |
Kenmore State High School, classroom accommodation—planning | | 05 | | 440 | | | | 440 | | |
Kuraby State School, GLAB—2 spaces | | 05 | | 528 | | | | 528 | | |
Leichhardt State School, replacement amenities | | 05 | | 784 | | | | 479 | | 305 |
Lockyer District State High School, 8 space specialist block and amenities | | 10 | | 5,597 | | 185 | | 5,412 | | |
Mackay North State School, replacement amenities | | 40 | | 958 | | | | 479 | | 479 |
Mareeba State School, oval rectification | | 50 | | 300 | | | | 300 | | |
Meridan State College, Stage 2 | | 10 | | 17,303 | | 4,772 | | 12,531 | | |
Milpera State High School, additional amenities | | 05 | | 435 | | | | 435 | | |
Minden State School, additional amenities | | 10 | | 523 | | | | 392 | | 131 |
Moggill State School, Multi-Purpose Hall | | 05 | | 432 | | 1 | | 431 | | |
Moggill State School, additional classroom accommodation | | 05 | | 1,760 | | | | 1,760 | | |
Montville State School, additional amenities | | 10 | | 1,044 | | | | 348 | | 696 |
| | | | | | |
| | Capital Statement 2007-08 | | 39 |
Education, Training and the Arts1,2,3,4,5
| | | | | | | | | | |
Project | | Statistical
Division | | Total
Estimated
Cost
$’000 | | Expenditure
to 30-06-07 $’000 | | Budget
2007-08 $’000 | | Post
2007-08 $’000 |
Moorooka State School, Multi-Purpose Facility | | 05 | | 485 | | 1 | | 484 | | |
Mount Cotton State School, additional amenities | | 05 | | 673 | | 154 | | 519 | | |
Muttaburra State School, replacement amenities | | 35 | | 348 | | | | 348 | | |
Narangba Valley State School, Stage 3 | | 05 | | 2,277 | | 744 | | 1,533 | | |
North Lakes State College, conversion for Special Education Unit | | 05 | | 660 | | | | 660 | | |
North Lakes State College, Stage 6 | | 05 | | 3,961 | | 659 | | 3,302 | | |
Northern Coomera State School, new school | | 10 | | 9,680 | | 1 ,459 | | 8,221 | | |
Northern Coomera State School, Stage 1B—planning | | 10 | | 2,640 | | | | 2,640 | | |
Nundah State School, library upgrade | | 05 | | 792 | | | | 792 | | |
Ormiston State School, rectify amenities | | 05 | | 300 | | | | 300 | | |
Pacific Pines State High School, Stage 5 | | 10 | | 3,212 | | | | 3,212 | | |
Pallara State School, additional amenities | | 05 | | 957 | | | | 435 | | 522 |
Palm Island, Senior Phase of Learning facilities | | 45 | | 1 ,320 | | 392 | | 928 | | |
Pine Rivers Special School, administration block and relocate Special Education Developmental Unit | | 05 | | 1 ,043 | | 262 | | 781 | | |
Pioneer State High School, Hall | | 40 | | 570 | | | | 400 | | 170 |
Queensland Academy for Creative Industries, Creative Industries Academy | | 05 | | 38,138 | | 8,594 | | 29,544 | | |
Queensland Academy for Health Sciences, Health Sciences Academy | | 10 | | 31,164 | | 3,474 | | 27,690 | | |
Queensland Academy for Science Mathematics and Technology, Science Mathematics and Technology Academy | | 05 | | 17,600 | | 15,831 | | 1,769 | | |
| | | | | | |
| 40 | | Capital Statement 2007-08 | | |
Education, Training and the Arts1,2,3,4,5
| | | | | | | | | | |
Project | | Statistical
Division | | Total
Estimated
Cost $’000 | | Expenditure
to 30-06-07
$’000 | | Budget
2007-08 $’000 | | Post
2007-08 $’000 |
Redcliffe State High School, overpass contribution | | 05 | | 1,848 | | | | 1,848 | | |
Redland Bay State School, Library Upgrade—planning | | 05 | | 264 | | | | 264 | | |
Redlynch State College, Stage 2 | | 50 | | 5,358 | | 870 | | 4,488 | | |
Redlynch State College, Stage 3—planning | | 50 | | 3,960 | | | | 3,960 | | |
Rochedale State School, sewerage disposal system | | 05 | | 367 | | 64 | | 303 | | |
Rochedale State School, administration upgrade* | | 05 | | 1,320 | | | | 1,320 | | |
Rochedale State School, oval and associated works | | 05 | | 792 | | 396 | | 396 | | |
Southport State High School, Home Economics block | | 10 | | 2,200 | | | | 2,200 | | |
Spinifex State College—Mount Isa—Senior Campus, Major upgrade to support multi-media initiatives* | | 55 | | 1,437 | | 122 | | 1,315 | | |
Springfield Lakes State School, Stage 2 | | 05 | | 8,207 | | 2,141 | | 6,066 | | |
Stretton State College, Primary—Stage 3 | | 05 | | 2,323 | | 533 | | 1,790 | | |
Stretton State College, Secondary—Stage 2—planning | | 05 | | 1,848 | | | | 1,848 | | |
Tagai State College—Malu Kiwai Campus, rectification work | | 50 | | 300 | | | | 300 | | |
Toowoomba West Special School, replacement amenities | | 20 | | 523 | | | | 305 | | 218 |
Trinity Bay State High School, Community Hall augmentation | | 50 | | 560 | | 210 | | 350 | | |
Tully State High School, additional amenities | | 50 | | 508 | | 4 | | 504 | | |
Tully State High School, Indoor Multi-Purpose Centre | | 50 | | 600 | | | | 600 | | |
West Pacific Pines State School, new school | | 10 | | 15,102 | | 2,662 | | 12,440 | | |
Western Cape College—Weipa, Stage 2 | | 50 | | 5,393 | | 1,469 | | 3,924 | | |
Whitfield State School, GLAB—2 spaces and music | | 50 | | 1,760 | | 22 | | 1,738 | | |
| | | | | | |
| | Capital Statement 2007-08 | | 41 |
Education, Training and the Arts1,2,3,4,5
| | | | | | | | | | |
Project | | Statistical
Division | | Total
Estimated
Cost
$’000 | | Expenditure
to 30-06-07 $’000 | | Budget
2007-08
$’000 | | Post
2007-08 $’000 |
Wilston State School, additional classroom accommodation | | 05 | | 3,696 | | | | 3,256 | | 440 |
Additional accommodation | | Various | | | | | | 15,932 | | Ongoing |
General works | | Various | | | | | | 86,377 | | Ongoing |
Land acquisition | | Various | | | | | | 38,829 | | Ongoing |
Tomorrow’s Schools | | Various | | 733,938 | | 47,826 | | 42,571 | | 643,541 |
Plant and equipment | | Various | | | | | | 34,945 | | Ongoing |
Minor works | | Various | | | | | | 6,919 | | Ongoing |
| | | | | | | | | | |
Total Property, Plant and Equipment | | | | | | | | 414,470 | | |
| | | | | | | | | | |
Capital Grants | | | | | | | | | | |
Capital grants | | Various | | 72,931 | | | | 72,931 | | |
| | | | | | | | | | |
Total Capital Grants | | | | | | | | 72,931 | | |
| | | | | | | | | | |
TOTAL EDUCATION | | | | | | | | 487,401 | | |
| | | | | | | | | | |
| | | | | |
TRAINING | | | | | | | | | | |
| | | | | |
Property, Plant and Equipment | | | | | | | | | | |
Barrier Reef Institute of TAFE—Townsville (Pimlico) | | 45 | | 14,963 | | | | 748 | | 14,215 |
Gold Coast Institute of TAFE—Coomera Education Precinct* | | 10 | | 31,700 | | 1,087 | | 12,000 | | 18,613 |
Metropolitan South Institute of TAFE—Chelmer | | 05 | | 2,908 | | | | 145 | | 2,763 |
Metropolitan South Institute of TAFE—Loganlea | | 05 | | 5,987 | | | | 299 | | 5,688 |
Metropolitan South Institute of TAFE—Mt Gravatt Redevelopment Stage I | | 05 | | 20,330 | | 15,610 | | 3,020 | | 1,700 |
Metropolitan South Institute of TAFE—Mt Gravatt Redevelopment Stage II | | 05 | | 9,269 | | | | 649 | | 8,620 |
Skilling Solutions Queensland6 | | Various | | 4,161 | | 2,412 | | 1,749 | | 3,122 |
SkillsTech Australia—Acacia Ridge7 Stage I | | 05 | | 22,328 | | 9,603 | | 9,603 | | |
SkillsTech Australia—Acacia Ridge7 Stage II | | 05 | | 48,530 | | 26,297 | | 19,412 | | 2,821 |
| | | | | | |
| 42 | | Capital Statement 2007-08 | | |
Education, Training and the Arts1,2,3,4,5
| | | | | | | | | | |
Project | | Statistical
Division | | Total
Estimated Cost $’000 | | Expenditure
to 30-06-07 $’000 | | Budget
2007-08 $’000 | | Post
2007-08 $’000 |
SkillsTech Australia—Eagle Farm7 campus | | 05 | | 47,987 | | 2,399 | | 5,998 | | 39,590 |
SkillsTech Australia—Mackay7 campus | | 40 | | 34,074 | | 5,872 | | 9,361 | | 18,841 |
SkillsTech Australia—Townsville7 campus | | 45 | | 24,125 | | 5,956 | | 7,391 | | 10,778 |
Southbank Institute of Technology—8 PPP | | 05 | | 139,000 | | | | 13,650 | | 125,350 |
Southern Queensland Institute of TAFE—Toowoomba Automotive | | 20 | | 2,645 | | 2,195 | | 450 | | |
Sunshine Coast Institute of TAFE—Mooloolaba | | 10 | | 4,285 | | | | 536 | | 3,749 |
Sunshine Coast Institute of TAFE—Nambour Trades | | 10 | | 10,695 | | 535 | | 1,337 | | 8,823 |
Sunshine Coast Institute of TAFE—Quad Park | | 10 | | 7,125 | | 214 | | 356 | | 6,555 |
Tropical North Queensland Institute of TAFE—Cairns Campus | | 50 | | 26,088 | | | | 1,957 | | 24,131 |
Infrastructure equipment | | Various | | | | | | 2,567 | | Ongoing |
ICT modernisation—TAFE | | Various | | 7,000 | | 1,400 | | 1,400 | | 4,200 |
Information and communication technology | | Various | | | | | | 6,371 | | Ongoing |
Minor equipment and facility upgrades | | Various | | 4,225 | | 1,000 | | 1,000 | | 2,225 |
Minor capital works | | Various | | | | | | 3,500 | | Ongoing |
Other plant and equipment | | Various | | | | | | 2,449 | | Ongoing |
| | | | | | | | | | |
Total Property, Plant and Equipment | | | | | | | | 105,948 | | |
| | | | | | | | | | |
Other Capital Expenditure | | | | | | | | | | |
ICT software development | | Various | | 17,555 | | 6,804 | | 6,580 | | 4,171 |
| | | | | | | | | | |
Total Other Capital Expenditure | | | | | | | | 6,580 | | |
| | | | | | | | | | |
Capital Grants | | | | | | | | | | |
Australian Agricultural College Corporation | | Various | | | | | | 1,000 | | Ongoing |
Skill Centre Program | | Various | | | | | | 5,000 | | Ongoing |
| | | | | | | | | | |
Total Capital Grants | | | | | | | | 6,000 | | |
| | | | | | | | | | |
TOTAL TRAINING | | | | | | | | 118,528 | | |
| | | | | | | | | | |
| | | | | | |
| | Capital Statement 2007-08 | | 43 |
Education, Training and the Arts1,2,3,4,5
| | | | | | | | | | |
Project | | Statistical
Division | | Total
Estimated
Cost $’000 | | Expenditure to 30-06-07
$’000 | | Budget
2007-08 $’000 | | Post
2007-08 $’000 |
ARTS | | | | | | | | | | |
| | | | | |
Property, Plant and Equipment | | | | | | | | | | |
Auditorium—Cultural Centre | | 05 | | 7,900 | | | | 2,250 | | 5,650 |
Cairns Centre of Contemporary Arts* | | 50 | | 1,000 | | 200 | | 800 | | |
| | | | | | | | | | |
Total Property, Plant and Equipment | | | | | | | | 3,050 | | |
| | | | | | | | | | |
| | | | | |
Capital Grants | | | | | | | | | | |
Hinkler Hall of Aviation | | 15 | | 1,985 | | 485 | | 1,500 | | |
| | | | | | | | | | |
Total Capital Grants | | | | | | | | 1,500 | | |
| | | | | | | | | | |
TOTAL ARTS | | | | | | | | 4,550 | | |
| | | | | | | | | | |
| | | | | |
AUSTRALIAN AGRICULTURAL COLLEGE CORPORATION | | | | | | | | | | |
| | | | | |
Property, Plant and Equipment | | | | | | | | | | |
Other plant and equipment | | Various | | | | | | 2,066 | | Ongoing |
| | | | | | | | | | |
Total Property, Plant and Equipment | | | | | | | | 2,066 | | |
| | | | | | | | | | |
| | | | | |
Other Capital Expenditure | | | | | | | | | | |
Other capital acquisitions | | Various | | | | | | 212 | | Ongoing |
| | | | | | | | | | |
Total Other Capital Expenditure | | | | | | | | 212 | | |
| | | | | | | | | | |
TOTAL AUSTRALIAN AGRICULTURAL COLLEGE CORPORATION | | | | | | | | 2,278 | | |
| | | | | | | | | | |
| | | | | |
LIBRARY BOARD OF QUEENSLAND | | | | | | | | | | |
| | | | | |
Property, Plant and Equipment | | | | | | | | | | |
Plant and equipment—general | | 05 | | | | | | 713 | | Ongoing |
Library Collections expenditure | | 05 | | | | | | 1,250 | | Ongoing |
| | | | | | | | | | |
Total Property, Plant and Equipment | | | | | | | | 1,963 | | |
| | | | | | | | | | |
TOTAL LIBRARY BOARD OF QUEENSLAND | | | | | | | | 1,963 | | |
| | | | | | | | | | |
| | | | | |
QUEENSLAND ART GALLERY | | | | | | | | | | |
Property, Plant and Equipment | | | | | | | | | | |
Property, plant and equipment | | 05 | | | | | | 1,300 | | Ongoing |
| | | | | | | | | | |
Total Property, Plant and Equipment | | | | | | | | 1,300 | | |
| | | | | | | | | | |
TOTAL QUEENSLAND ART GALLERY | | | | | | | | 1,300 | | |
| | | | | | | | | | |
| | | | | | |
| 44 | | Capital Statement 2007-08 | | |
Education, Training and the Arts1,2,3,4,5
| | | | | | | | | | |
Project | | Statistical
Division | | Total
Estimated
Cost $’000 | | Expenditure to 30-06-07
$’000 | | Budget
2007-08 $’000 | | Post 2007-08 $’000 |
QUEENSLAND MUSEUM | | | | | | | | | | |
| | | | | |
Property, Plant and Equipment | | | | | | | | | | |
Collection Database | | Various | | 759 | | 649 | | 110 | | |
Enchanted Rainforest Exhibition— Museum of Tropical Queensland | | 45 | | 473 | | 155 | | 318 | | |
Shipwreck Exhibition—Museum of Tropical Queensland | | 45 | | 162 | | | | 162 | | |
Property, plant and equipment—other | | Various | | | | | | 175 | | Ongoing |
| | | | | | | | | | |
Total Property, Plant and Equipment | | | | | | | | 765 | | |
| | | | | | | | | | |
TOTAL QUEENSLAND MUSEUM | | | | | | | | 765 | | |
| | | | | | | | | | |
| | | | | |
QUEENSLAND PERFORMING ARTS TRUST | | | | | | | | | | |
| | | | | |
Property, Plant and Equipment | | | | | | | | | | |
Property, plant and equipment | | 05 | | | | | | 820 | | Ongoing |
| | | | | | | | | | |
Total Property, Plant and Equipment | | | | | | | | 820 | | |
| | | | | | | | | | |
TOTAL QUEENSLAND PERFORMING ARTS TRUST | | | | | | | | 820 | | |
| | | | | | | | | | |
| | | | | |
QUEENSLAND STUDIES AUTHORITY | | | | | | | | | | |
| | | | | |
Property, Plant and Equipment | | | | | | | | | | |
Other plant and equipment | | 05 | | | | | | 200 | | Ongoing |
| | | | | | | | | | |
Total Property, Plant and Equipment | | | | | | | | 200 | | |
| | | | | | | | | | |
Other Capital Expenditure | | | | | | | | | | |
Senior Learning Information Management System | | 05 | | 4,907 | | 3,805 | | 1,102 | | |
| | | | | | | | | | |
Total Other Capital Expenditure | | | | | | | | 1,102 | | |
| | | | | | | | | | |
TOTAL QUEENSLAND STUDIES AUTHORITY | | | | | | | | 1,302 | | |
| | | | | | | | | | |
| | | | | | |
| | Capital Statement 2007-08 | | 45 |
Education, Training and the Arts1,2,3,4,5
| | | | | | | | | | |
Project | | Statistical Division | | Total Estimated Cost
$’000 | | Expenditure to 30-06-07
$’000 | | Budget
2007-08 $’000 | | Post 2007-08 $’000 |
CORPORATE AND PROFESSIONAL SERVICES | | | | | | | | | | |
| | | | | |
Property, Plant and Equipment | | | | | | | | | | |
Property, plant and equipment | | 05 | | | | | | 205 | | Ongoing |
| | | | | | | | | | |
Total Property, Plant and Equipment | | | | | | | | 205 | | |
| | | | | | | | | | |
TOTAL CORPORATE AND PROFESSIONAL SERVICES | | | | | | | | 205 | | |
| | | | | | | | | | |
TOTAL EDUCATION, TRAINING AND THE ARTS | | | | | | | | 619,112 | | |
| | | | | | | | | | |
Notes:
| 1. | Capital grants are distributed by non-state entities throughout Queensland’s statistical divisions. |
| 2. | Project budgets listed in the table are in some cases indicative and are subject to refinement as projects are further developed. |
| 3. | Projects contained in the table have been included on the basis of projected enrolments. If projected enrolments do not eventuate, then listed projects may be deferred or stopped, or new projects added during the course of the financial year. |
| 4. | The amounts quoted in the above table reflect the estimated portion of project costs that will be capitalised. The amounts quoted in the program highlights (and in the Ministerial Portfolio Statements) are the full financial costs of the projects (i.e. they include some expensed items). |
| 5. | The Australian Government may also contribute funding for these projects. |
| 6. | Funding for this initiative in 2007-08 is subject to further evaluation. |
| 7. | The Trades and Technician Skills Institute has changed its name to SkillsTech Australia. |
| 8. | Figures are subject to change as a result of accounting issues to be resolved. |
| * | Funded fully or in part under the Smart State Building Fund |
| | | | | | |
| 46 | | Capital Statement 2007-08 | | |
ELECTORAL COMMISSION OF QUEENSLAND
An amount of $0.04 million is allocated towards the replacement of plant and equipment in 2007-08 to provide for the ongoing operational requirements associated with the efficient and effective provision of electoral services for the State of Queensland.
Electoral Commission of Queensland
| | | | | | | | | | |
Project | | Statistical
Division | | Total Estimated Cost $’000 | | Expenditure to 30-06-07 $’000 | | Budget 2007-08 $’000 | | Post 2007-08 $’000 |
ELECTORAL COMMISSION OF QUEENSLAND | | | | | | | | | | |
| | | | | |
Property, Plant and Equipment | | | | | | | | | | |
Plant and equipment | | 05 | | | | | | 40 | | Ongoing |
| | | | | | | | | | |
Total Property, Plant and Equipment | | | | | | | | 40 | | |
| | | | | | | | | | |
TOTAL ELECTORAL COMMISSION OF QUEENSLAND | | | | | | | | 40 | | |
| | | | | | | | | | |
| | | | | | |
| | Capital Statement 2007-08 | | 47 |
EMERGENCY SERVICES
The Department of Emergency Services’ 2007-08 capital program will invest a record $206.9 million in capital acquisitions and grants.
The capital acquisition program provides for essential infrastructure, equipment and information technology investment to support operations, and to achieve economic and operational effectiveness through contemporary asset management strategies. The program supports the Government’s ongoing commitment to the provision of essential emergency services to ensure that Queenslanders live in safe and secure communities.
A major feature of this Budget is the investment of $41.7 million (as part of an allocation of $70.4 million over two years) to build a new state of the art integrated communication and state emergency operations centre to replace communication facilities at Brisbane and South East Region. This will also involve the upgrading and replacement of radio and information and communications technology (ICT) infrastructure within the communications centre to enable more effective management of large scale emergencies and disasters in Queensland. The new Emergency Services Computer Aided Dispatch system will be provided to eleven communications centres and provide essential state-wide dispatch and strategic management of fire and ambulance resources.
Emergency Management Queensland
Capital investment of $26.6 million will enhance Emergency Management Queensland’s helicopter rescue fleet with three state-of-the-art AgustaWestland 139 helicopters. These rescue helicopters will improve capacity, safety and equipment standards, and are faster, more economical and bigger than the current Bell 412 helicopter units. This investment will greatly enhance the level of service for aero-medical, search and rescue operations, and emergency management capability across Queensland.
Queensland Ambulance Service
Capital investments by the Queensland Ambulance Service in 2007-08 provide for outlays of $65.4 million for ambulance facilities, vehicles, information technology and communication infrastructure projects.
Program Highlights
| • | | Three new ambulance stations, 17 replacement/redeveloped stations, one residence and one plant room redevelopment will be commenced or completed during 2007-08. A further $1.7 million has been provided for minor works projects. |
| | | | | | |
| 48 | | Capital Statement 2007-08 | | |
| • | | $4.3 million has been provided for strategic land purchases. |
| • | | $15.7 million will be invested in commissioning over 140 new ambulance vehicles as part of its vehicle replacement program. This increased investment will not only replace older vehicles and ensure an efficient fleet, but will also provide additional vehicles for the extra ambulance officers commencing service during the financial year. |
| • | | $6.8 million will be invested in continued improvement in operational and communications equipment across the state. |
Queensland Fire and Rescue Service
Capital investments by the Queensland Fire and Rescue Service in 2007-08 provide for outlays of $43.6 million for fire facilities, urban and rural fire appliances, information technology and communication infrastructure projects.
Program Highlights
| • | | One new fire and rescue station and 14 replacement/redeveloped stations will be commenced or completed during 2007-08. Additionally, a replacement office building will be constructed, and two other facilities will be refurbished. A further $1.4 million has been provided for minor works projects. |
| • | | $1.1 million has been provided for strategic land purchases. |
| • | | $14.3 million will be invested in new or replacement urban vehicles as part of the fleet replacement program to meet enhanced service delivery requirements. A further $3.9 million will be invested in rural vehicles. |
| • | | $10.7 million will be invested in continued improvement of ICT and operational equipment. |
Joint Emergency Services Facilities
During 2007-08 the Queensland Ambulance Service and the Queensland Fire and Rescue Service will also invest $18 million (as part of an allocation of $20 million over three years) to undertake a major expansion of the Queensland Combined Emergency Services Academy as an operational, multi-service and multi-agency training centre of excellence for emergency management and community safety. An additional investment of $4.3 million will be spent to upgrade existing facilities at the academy.
The department will invest $2.3 million to complete a replacement joint facility at Palm Island.
| | | | | | |
| | Capital Statement 2007-08 | | 49 |
Emergency Services
| | | | | | | | | | |
Project | | Statistical
Division | | Total
Estimated
Cost
$’000 | | Expenditure
to 30-06-07
$’000 | | Budget
2007-08 $’000 | | Post 2007-08 $’000 |
DEPARTMENT OF EMERGENCY SERVICES | | | | | | | | | | |
| | | | | |
Property, Plant and Equipment | | | | | | | | | | |
QUEENSLAND AMBULANCE SERVICE | | | | | | | | | | |
Building/General Works | | | | | | | | | | |
Aramac replacement station | | 35 | | 978 | | 339 | | 639 | | |
Ashgrove/The Gap new station | | 05 | | 2,400 | | | | 2,400 | | |
Balmoral replacement station | | 05 | | 2,601 | | 394 | | 2,207 | | |
Birkdale new station | | 05 | | 1,339 | | 331 | | 1,008 | | |
Carina new station and land | | 05 | | 2,150 | | 324 | | 1,826 | | |
Carmila replacement station | | 40 | | 1,038 | | 342 | | 696 | | |
Clermont replacement station | | 40 | | 1,400 | | 50 | | 1,350 | | |
Coolum replacement station | | 10 | | 1,700 | | 326 | | 1,374 | | |
Gemfields/Sapphire replacement station and residence | | 30 | | 1,421 | | 457 | | 964 | | |
Ipswich replacement station | | 05 | | 3,413 | | 159 | | 3,254 | | |
Julia Creek replacement station | | 55 | | 1,054 | | 243 | | 811 | | |
Mitchell plant room | | 25 | | 690 | | | | 690 | | |
Mount Tamborine replacement station | | 10 | | 1,875 | | | | 1,875 | | |
Murgon replacement station and land | | 15 | | 2,097 | | 247 | | 1,850 | | |
Oakey replacement station | | 20 | | 1,450 | | 50 | | 1,400 | | |
Roma replacement station | | 25 | | 2,051 | | 253 | | 1,798 | | |
Spring Hill replacement station | | 05 | | 1,750 | | 3 | | 1,747 | | |
Townsville redevelopment projects | | 45 | | 4,299 | | 1,341 | | 2,958 | | |
Warwick replacement station | | 20 | | 2,006 | | 1,848 | | 158 | | |
Weipa replacement station | | 50 | | 2,076 | | 204 | | 1,872 | | |
Yarrabah replacement station | | 50 | | 1,599 | | 245 | | 1,354 | | |
Minor works | | Various | | | | | | 1,676 | | Ongoing |
Land | | | | | | | | | | |
Land acquisitions | | Various | | | | | | 4,250 | | Ongoing |
Other Plant and Equipment | | | | | | | | | | |
Ambulance vehicle purchases | | Various | | | | | | 15,650 | | Ongoing |
Operational and communications equipment | | Various | | | | | | 6,779 | | Ongoing |
| | | | | | | | | | |
Sub-total QUEENSLAND AMBULANCE SERVICE | | | | 60,586 | | |
| | | | | | | | | | |
| | | | | | |
| 50 | | Capital Statement 2007-08 | | |
Emergency Services
| | | | | | | | | | |
Project | | Statistical
Division | | Total
Estimated
Cost
$’000 | | Expenditure
to 30-06-07
$’000 | | Budget
2007-08 $’000 | | Post
2007-08 $’000 |
QUEENSLAND FIRE AND RESCUE SERVICE | | | | | | | | | | |
Building/General Works | | | | | | | | | | |
Alexandra Hills replacement station and land | | 05 | | 3,750 | | 350 | | 500 | | 2,900 |
Beenleigh replacement community safety unit | | 05 | | 500 | | 100 | | 400 | | |
Bollon replacement auxiliary station | | 25 | | 600 | | | | 600 | | |
Burpengary new station | | 05 | | 3,252 | | 152 | | 2,320 | | 780 |
Eatons Hill station redevelopment | | 05 | | 747 | | 549 | | 198 | | |
Goondiwindi replacement auxiliary station | | 20 | | 600 | | 50 | | 550 | | |
Highfields replacement auxiliary station and land | | 20 | | 815 | | 415 | | 400 | | |
Hollywell station redevelopment | | 10 | | 530 | | 405 | | 125 | | |
Lowood replacement auxiliary station | | 10 | | 479 | | 368 | | 111 | | |
Malanda replacement auxiliary station | | 50 | | 600 | | | | 600 | | |
Nambour replacement station | | 10 | | 3,650 | | | | 750 | | 2,900 |
QFRS Kedron/Lutwyche unit consolidation | | 05 | | 600 | | | | 600 | | |
Redland Bay replacement station and land | | 05 | | 3,750 | | 350 | | 500 | | 2,900 |
Southport station redevelopment | | 10 | | 2,605 | | 52 | | 2,553 | | |
Spring Hill Firecom refurbishment | | 05 | | 750 | | 200 | | 550 | | |
Tin Can Bay replacement auxiliary station | | 15 | | 450 | | 50 | | 400 | | |
Toowoomba station redevelopment | | 20 | | 2,000 | | | | 500 | | 1,500 |
Yungaburra replacement auxiliary station | | 50 | | 620 | | 19 | | 601 | | |
Minor works | | Various | | | | | | 1,428 | | Ongoing |
Land | | | | | | | | | | |
Rural Operations land purchase | | Various | | | | | | 100 | | Ongoing |
Sunshine Coast hinterland | | 10 | | 1,000 | | | | 1,000 | | |
| | | | | | |
| | Capital Statement 2007-08 | | 51 |
Emergency Services
| | | | | | | | | | |
Project | | Statistical
Division | | Total
Estimated
Cost
$’000 | | Expenditure
to 30-06-07
$’000 | | Budget
2007-08 $’000 | | Post
2007-08 $’000 |
Other Plant and Equipment | | | | | | | | | | |
Operational and communications equipment | | Various | | | | | | 6,904 | | Ongoing |
Rural Fire appliances | | Various | | | | | | 3,900 | | Ongoing |
Urban Fire appliances | | Various | | | | | | 14,260 | | Ongoing |
| | | | | | | | | | |
Sub-total QUEENSLAND FIRE AND RESCUE SERVICE | | | | | | | | 39,850 | | |
| | | | | | | | | | |
EMERGENCY MANAGEMENT QUEENSLAND | | | | | | | | | | |
Replacement of EMQ Helicopter Rescue Fleet | | Various | | 48,339 | | 19,435 | | 26,586 | | 2,318 |
Plant and equipment | | Various | | | | | | 1,248 | | Ongoing |
Minor works | | Various | | | | | | 59 | | Ongoing |
| | | | | | | | | | |
Sub-total EMERGENCY MANAGEMENT | | | | | | | | 27,893 | | |
| | | | | | | | | | |
JOINT EMERGENCY SERVICE FACILITIES | | | | | | | | | | |
Integrated Communication and State Emergency Operations Centre | | 05 | | 70,350 | | | | 41,650 | | 28,700 |
Palm Island replacement joint facility | | 45 | | 2,312 | | 29 | | 2,283 | | |
Queensland Combined Emergency Services Academy - air emission control | | 05 | | 3,934 | | 1,107 | | 2,827 | | |
Queensland Combined Emergency Services Academy - complex improvements | | 05 | | | | | | 1,493 | | Ongoing |
Queensland Combined Emergency Services Academy - Strategic Development Project | | 05 | | 20,000 | | 2,000 | | 18,000 | | |
| | | | | | | | | | |
Sub-total JOINT EMERGENCY SERVICE | | | | | | | | 66,253 | | |
| | | | | | | | | | |
OTHER DEPARTMENTAL | | | | | | | | | | |
Information technology infrastructure | | Various | | | | | | 1,420 | | Ongoing |
Plant and equipment | | Various | | | | | | 520 | | Ongoing |
Minor works | | 05 | | | | | | 200 | | Ongoing |
| | | | | | | | | | |
Sub-total OTHER DEPARTMENTAL | | | | | | | | 2,140 | | |
| | | | | | | | | | |
Total Property, Plant and Equipment | | | | | | | | 196,722 | | |
| | | | | | | | | | |
| | | | | | |
| 52 | | Capital Statement 2007-08 | | |
Emergency Services
| | | | | | | | | | |
Project | | Statistical
Division | | Total
Estimated
Cost
$’000 | | Expenditure
to 30-06-07
$’000 | | Budget
2007-08 $’000 | | Post
2007-08 $’000 |
Other Capital Expenditure | | | | | | | | | | |
QUEENSLAND AMBULANCE SERVICE | | | | | | | | | | |
Strategic Information Management Initiative | | Various | | 9,993 | | 9,284 | | 709 | | |
Information systems development | | Various | | | | | | 4,089 | | Ongoing |
QUEENSLAND FIRE AND RESCUE SERVICE | | | | | | | | | | |
Fire Information Management System | | Various | | 10,276 | | 7,173 | | 3,103 | | |
Information systems development | | Various | | | | | | 656 | | Ongoing |
OTHER DEPARTMENTAL | | | | | | | | | | |
Emergency Services CAD | | Various | | 7,132 | | 6,802 | | 330 | | |
Corporate information systems development | | Various | | | | | | 768 | | Ongoing |
| | | | | | | | | | |
Total Other Capital Expenditure | | | | | | | | 9,655 | | |
| | | | | | | | | | |
Capital Grants | | | | | | | | | | |
Rural Fire Brigades | | Various | | | | | | 150 | | Ongoing |
State Emergency Service units | | Various | | | | | | 332 | | Ongoing |
| | | | | | | | | | |
Total Capital Grants | | | | | | | | 482 | | |
| | | | | | | | | | |
TOTAL DEPARTMENT OF EMERGENCY SERVICES | | | | | | | | 206,859 | | |
| | | | | | | | | | |
| | | | | | |
| | Capital Statement 2007-08 | | 53 |
EMPLOYMENT AND INDUSTRIAL RELATIONS
Program Highlights
| • | | Expenditure on capital items will total $1.9 million in 2007-08. The department will be investing $0.77 million in an information technology system for the Renewable and Photographic Licensing for Prescribed Occupations as required under the National Standard for the Licensing of Persons Performing High Risk Work. This system will support photographic and renewable licensing in 2007-08 and progressively transfer existing licences to the new system over the next five years. |
| • | | Other key areas of expenditure will be focused mainly on ICT systems, replacement of operational equipment and new accommodation fit-outs. |
Employment and Industrial Relations
| | | | | | | | | | |
Project | | Statistical
Division | | Total
Estimated
Cost
$’000 | | Expenditure
to 30-06-07
$’000 | | Budget
2007-08 $’000 | | Post
2007-08 $’000 |
DEPARTMENT OF EMPLOYMENT AND INDUSTRIAL RELATIONS | | | | | | | | | | |
| | | | | |
Property, Plant and Equipment | | | | | | | | | | |
Plant and equipment | | Various | | | | | | 188 | | Ongoing |
Leasehold improvements | | Various | | | | | | 250 | | Ongoing |
| | | | | | | | | | |
Total Property, Plant and Equipment | | | | | | | | 438 | | |
| | | | | | | | | | |
Other Capital Expenditure | | | | | | | | | | |
Renewable and Photographic Licensing for Prescribed Occupations | | 05 | | 770 | | | | 770 | | |
Information technology systems | | 05 | | 460 | | | | 460 | | |
Employment Information System | | 05 | | 250 | | | | 250 | | |
| | | | | | | | | | |
Total Other Capital Expenditure | | | | | | | | 1,480 | | |
| | | | | | | | | | |
TOTAL DEPARTMENT OF EMPLOYMENT AND INDUSTRIAL RELATIONS | | | | | | | | 1,918 | | |
| | | | | | | | | | |
| | | | | | |
| 54 | | Capital Statement 2007-08 | | |
ENVIRONMENTAL PROTECTION AGENCY
The 2007-08 capital program for the Environmental Protection Agency (EPA) is $55.7 million and provides for the continuing protection of Queensland’s natural and cultural heritage through the ongoing replacement and construction of new infrastructure as well as funding significant land acquisitions. Such significant investment demonstrates the Government’s commitment to its priority of protecting the environment for a sustainable future.
Program Highlights
| • | | $ 18.7 million for capital works on parks, forests and administrative building works provides for the construction of infrastructure on the EPA estate. Of this amount $16.8 million relates to capital works on parks and forests which now includes funds previously provided under the Land Management for Expanded QPWS Estate initiative. As funding under this initiative is ongoing it has now been rolled into the agency’s general capital works program. Another $1.9 million relates to the administrative building works program. |
| • | | Funding of $9.6 million has been allocated for the construction of the Ma:Mu Canopy Walk which is due to commence construction in 2007-08 at a total cost of $10 million. |
| • | | $ 22.3 million has been provided in 2007-08 for land acquisitions. Of this amount $18 million relates to a 2006 election commitment for the purchase of rainforest and green land. This election commitment allocates an additional $30 million over three years. The agency’s general land acquisition fund has $1.5 million allocated in 2007-08. |
| | | | | | |
| | Capital Statement 2007-08 | | 55 |
Environmental Protection Agency
| | | | | | | | | | |
Project | | Statistical
Division | | Total
Estimated
Cost
$’000 | | Expenditure
to 30-06-07
$’000 | | Budget
2007-08 $’000 | | Post
2007-08 $’000 |
ENVIRONMENTAL PROTECTION AGENCY | | | | | | | | | | |
| | | | | |
Property, Plant and Equipment | | | | | | | | | | |
Plant and equipment | | Various | | | | | | 2,438 | | Ongoing |
Capital Works - Parks and Forests | | | | | | | | | | |
Gold Coast Hinterland Great Walk extended | | 10 | | 1,100 | | 350 | | 750 | | |
Great Sandy Marine Park vessels | | 15 | | 790 | | 125 | | 665 | | |
Waste Treatment System Dundubara Base | | 15 | | 728 | | 158 | | 570 | | |
Lake Eacham day use area redevelopment | | 50 | | 1,052 | | 490 | | 562 | | |
Eungella National Park - office accommodation redevelopment | | 40 | | 445 | | 50 | | 395 | | |
Taroom Management Base | | 25 | | 480 | | 120 | | 360 | | |
Mundubbera management unit facility | | 15 | | 783 | | | | 283 | | 500 |
Boardwalk Eli Creek Fraser Island | | 15 | | 516 | | 266 | | 250 | | |
Mimosa Recreation Area - redevelopment | | 30 | | 555 | | 305 | | 250 | | |
Redevelopment Fleays Wildlife Park | | 10 | | 1,675 | | 925 | | 250 | | 500 |
Minor works - parks and forests | | Various | | | | | | 12,467 | | Ongoing |
| | | | | | | | | | |
Sub-total Capital Works - Parks and Forests | | | | | | | | 16,802 | | |
| | | | | | | | | | |
Capital Works - Administrative Building Works | | | | | | | | | | |
Rockhampton Regional Office | | 30 | | 919 | | 60 | | 859 | | |
Administration building -Townsville | | 45 | | 600 | | 43 | | 557 | | |
Minor works - administrative building works | | Various | | | | | | 444 | | Ongoing |
| | | | | | | | | | |
Sub-total Capital Works - Administrative Building Works | | | | | | | | 1,860 | | |
| | | | | | | | | | |
More Great Walks | | Various | | 3,400 | | 10 | | 1,350 | | 2,040 |
Ma:Mu Canopy Walk* | | 50 | | 10,000 | | 450 | | 9,550 | | |
East Trinity Property Management | | 50 | | 1,588 | | 388 | | 700 | | 500 |
| | | | | | |
| 56 | | Capital Statement 2007-08 | | |
Environmental Protection Agency
| | | | | | | | | | |
Project | | Statistical
Division | | Total
Estimated
Cost
$’000 | | Expenditure
to 30-06-07
$’000 | | Budget
2007-08 $’000 | | Post
2007-08 $’000 |
Land Acquisitions | | | | | | | | | | |
Acquisition of lands with biodiversity values* | | Various | | 2,500 | | 1,750 | | 750 | | |
General land acquisitions | | Various | | 1,500 | | | | 1,500 | | |
Cape York/Daintree land acquisitions | | 50 | | 17,068 | | 15,068 | | 2,000 | | |
Rainforest/Green Land acquisition | | Various | | 30,000 | | 2,000 | | 18,000 | | 10,000 |
| | | | | | | | | | |
Sub-total Land Acquisitions | | | | | | | | 22,250 | | |
| | | | | | | | | | |
Total Property, Plant and Equipment | | | | | | | | 54,950 | | |
| | | | | | | | | | |
Other Capital Expenditure | | | | | | | | | | |
Various system enhancements | | 05 | | 401 | | | | 401 | | |
Integrated Searches and Licensing | | 05 | | 2,006 | | 1,686 | | 320 | | |
| | | | | | | | | | |
Total Other Capital Expenditure | | | | | | | | 721 | | |
| | | | | | | | | | |
TOTAL ENVIRONMENTAL PROTECTION AGENCY | | | | | | | | 55,671 | | |
| | | | | | | | | | |
| * | Funded fully or in part under the Smart State Building Fund |
| | | | | | |
| | Capital Statement 2007-08 | | 57 |
HEALTH
The total capital program for Queensland Health will see $635 million invested in new capital acquisitions in 2007-08, which includes the Queensland Institute of Medical Research funding of $2.2 million.
The Queensland Health capital works program is a major input into the delivery of health services and outputs that underpin the Government’s priorities of improving health care and strengthening services to the community and managing urban growth and building Queensland’s regions. The program also supports Queensland Health’s commitment to creating dependable health care and better health for all Queenslanders.
In 2007-08, Queensland Health will continue its capital investment across a broad range of health care settings including community health centres, hospitals, health technology, pathology and scientific services, renal, mental health, residential care, staff accommodation, and information and communication technologies. This program will ensure that health infrastructure and assets support the delivery of health services and contribute to improved health outcomes.
Program Highlights
| • | | Queensland Health will invest a total of $2.85 billion over a number of years to establish new tertiary hospitals at the Gold Coast and Sunshine Coast and a new Queensland Children’s Hospital. |
| • | | $ 194.9 million will be invested in 2007-08 on major hospital projects including redevelopments at Ingham, Innisfail, The Prince Charles and Yeppoon Hospitals and Emergency Department upgrades at Rockhampton, Dalby, Gold Coast, Gympie, Logan, Redcliffe, Redland and Robina Hospitals. Of this amount, $32 million will be spent to commence the development of the new tertiary hospitals and the Queensland Children’s Hospital. |
| • | | A further $554.9 million will be invested over the next four years to increase bed capacity and expand health services at Bundaberg, Cairns, Rockhampton, Robina, Townsville, Sunshine Coast and Princess Alexandra Hospitals. |
| • | | A further $30 million will be invested over the next four years to establish an Elective Surgery Centre at the QEII Hospital. |
| • | | In 2007-08, $91.9 million will be invested in continuing community based projects including a new Chronic Disease and Prevention Management Centre on Thursday Island, community health services at Cairns, Gladstone and Nundah, SEQIPP initiatives at Browns Plains, North Lakes and redevelopment of Miles and Weipa Hospitals. |
| | | | | | |
| 58 | | Capital Statement 2007-08 | | |
| • | | In 2007-08, $34.7 million has been allocated to continue the construction of new primary health care centres at Erub (Darnley) Island, Warraber Island, Gin Gin, Hope Vale, Wondai, and Yarrabah. |
| • | | In 2007-08, $53 million will fund the provision of new health technology equipment. |
| • | | The enhancement of Renal Services in Queensland will continue in 2007-08 with $3.9 million invested in renal projects at Cooktown, Sunshine Coast, Princess Alexandra Hospital, Redland Hospital and planning of services for Kingaroy, Sunshine Coast and Logan. |
| • | | $ 19 million will be invested in the redevelopment of Mental Health Services including Rockhampton Child and Youth Mental Health Service and implementation of the Queensland Mental Health Plan currently being finalised. |
| • | | $ 42.3 million will be invested in 2007-08 towards projects to upgrade staff accommodation including $23.9 million for the Regional Accommodation program. Additionally, staff accommodation projects will continue at Cape York, Rockhampton, Roma, Emerald, Injune and Springsure. |
A total of $150.3 million, consisting of $105.6 million capital and $44.7 million recurrent expenditure, will be invested in information and communication technology projects in 2007-08. This includes an additional funding injection of $40 million (capital and recurrent funding) to commence a multi-year investment in e-Health initiatives. Key highlights of this investment continuing in 2007-08 include:
| • | | $ 17.6 million in clinical information solutions including |
| | - | | the further rollout of the Emergency Department Information System to an additional 10 sites |
| | - | | further development of School Oral Health Information System to improve appointment scheduling and improved care through having oral health records available online |
| | - | | commencing rollout of a new Radiology Information System to enable faster results reporting through centralised access to images improving patient safety |
| • | | $ 29.7 million on other information and communication technology projects to enable improved secured system access, data capacity management and State-wide service capability |
| • | | $ 36.4 million for information and communication technology equipment to replace, upgrade and provide future capacity/capability to support e-Health capability and enterprise clinical and administrative systems including telephone system replacements, network and server upgrades |
| | | | | | |
| | Capital Statement 2007-08 | | 59 |
| • | | $ 21.9 million in additional capital funds for the e-Health initiatives to deliver assets that contribute to integrated and comprehensive patient information, consolidated information to support decision making, optimising scheduling of resources around patient need and supporting the delivery of location-independent health services. Key highlights include: |
| | - | | developing and implementing an enterprise data repository, user portals and systems integration work to underpin e-Health initiatives |
| | - | | commencing implementation of an Enterprise Discharge Summary to provide a more accurate care record to consumers and improve communication to General Practitioners |
| | - | | the development of a Population Health Information and Clinical Services Solution to improve the sharing of information between General Practitioners and Queensland Health specialists on patients with communicable diseases. |
The Council of the Queensland institute of Medical Research (QIMR)
QIMR has successfully completed the 2006-07 capital development program which included the upgrading and extension of the small animal facility, proteomics facility and records management system.
The 2007-08 capital program will total $2.2 million, including $1.2 million for the purchase of new or replacement equipment including computer software upgrades. A further $1 million has been allocated for state of the art scientific equipment.
Health
| | | | | | | | | | |
Project | | Statistical
Division | | Total
Estimated
Cost
$’000 | | Expenditure
to 30-06-07
$’000 | | Budget
2007-08 $’000 | | Post
2007-08 $’000 |
| QUEENSLAND HEALTH | | | | | | | | | | |
| | | | | |
| Property, Plant and Equipment | | | | | | | | | | |
Community Health Centres (CHC) | | | | | | | | | | |
Browns Plains Health Precinct* | | 05 | | 24,000 | | 6,849 | | 10,163 | | 6,988 |
Cairns Central CHC * | | 50 | | 12,674 | | 6,417 | | 500 | | 5,757 |
Gladstone Community, Mental and Oral Health consolidation* | | 30 | | 14,750 | | 7,850 | | 5,400 | | 1,500 |
Health Precinct Planning | | Various | | 1,500 | | | | 1,500 | | |
Home Hill Hospital rehabilitation | | 45 | | 320 | | | | 320 | | |
Mackay Community Based Rehabilitation/Transition Service | | 40 | | 2,673 | | | | 2,673 | | |
Miles Hospital redevelopment * | | 20 | | 11,696 | | 1,182 | | 10,293 | | 221 |
| | | | | | |
| 60 | | Capital Statement 2007-08 | | |
Health
| | | | | | | | | | |
Project | | Statistical
Division | | Total
Estimated
Cost
$’000 | | Expenditure
to 30-06-07
$’000 | | Budget
2007-08 $’000 | | Post
2007-08 $’000 |
North Lakes Health Precinct* | | 05 | | 52,085 | | 6,721 | | 14,500 | | 30,864 |
Nundah CHC | | 05 | | 15,041 | | 2,845 | | 12,196 | | |
Rockhampton Oral Health upgrade* | | 30 | | 7,165 | | 2,798 | | 4,367 | | |
Thursday Island Chronic Disease Centre | | 50 | | 39,345 | | 853 | | 5,941 | | 32,551 |
Townsville CHC - North Ward additional works | | 45 | | 250 | | | | 250 | | |
Weipa Hospital redevelopment* | | 50 | | 45,288 | | 3,633 | | 21,598 | | 20,057 |
Blackall Private Practice Clinic | | 35 | | 1,000 | | 118 | | 882 | | |
Moura Private Practice Clinic | | 30 | | 1,500 | | 185 | | 1,315 | | |
| | | | | | | | | | |
Sub-total Community Health Centres (CHC) | | | | | | | | 91,898 | | |
| | | | | | | | | | |
Multi-Purpose Health Service (MPHS) Collinsville Health Service * | | 40 | | 10,507 | | 762 | | 9,445 | | 300 |
| | | | | | | | | | |
Sub-total Multi-Purpose Health Service (MPHS) | | | | | | | | 9,445 | | |
| | | | | | | | | | |
Primary Health Care Centres (PHCC) | | | | | | | | | | |
Erub (Darnley) Island | | 50 | | 6,835 | | 702 | | 6,133 | | |
Gin Gin Health Service* | | 15 | | 8,572 | | 1,296 | | 6,334 | | 942 |
Hope Vale PHCC * | | 50 | | 13,369 | | 2,101 | | 11,106 | | 162 |
Warraber Island | | 50 | | 4,777 | | 711 | | 4,066 | | |
Wondai PHCC * | | 15 | | 2,603 | | 2,203 | | 400 | | |
Yarrabah PHCC * | | 50 | | 15,774 | | 1,084 | | 6,637 | | 8,053 |
| | | | | | | | | | |
Sub-total Primary Health Care Centres (PHCC) | | | | | | | | 34,676 | | |
| | | | | | | | | | |
Hospitals | | | | | | | | | | |
Dalby Hospital Outpatients, Emergency Department and Maternity* | | 20 | | 10,897 | | 2,494 | | 7,206 | | 1,197 |
Ingham Hospital redevelopment* | | 45 | | 44,984 | | 1,694 | | 9,013 | | 34,277 |
Innisfail Hospital redevelopment | | 50 | | 41,785 | | 38,218 | | 3,567 | | |
Mackay Annex | | 40 | | 1,700 | | 1,200 | | 500 | | |
Mareeba (Tableland) Hospital refurbishment | | 50 | | 800 | | 753 | | 47 | | |
Nambour Hospital Carpark (land acquisition) | | 10 | | 2,500 | | | | 2,500 | | |
Princess Alexandra Hospital Emergency Department upgrade preparatory works | | 05 | | 18,300 | | | | 17,800 | | 500 |
Princess Alexandra Hospital staff amenities | | 05 | | 8,000 | | 6,575 | | 1,425 | | |
| | | | | | |
| | Capital Statement 2007-08 | | 61 |
Health
| | | | | | | | | | |
Project | | Statistical
Division | | Total
Estimated
Cost $’000 | | Expenditure
to 30-06-07
$’000 | | Budget
2007-08 $’000 | | Post
2007-08 $’000 |
The Royal Brisbane and Women’s Hospital staff amenities | | 05 | | 8,860 | | 7,240 | | 1,620 | | |
Riverton relocation * | | 05 | | 9,900 | | 9,873 | | 27 | | |
The Prince Charles Hospital upgrade | | 05 | | 134,400 | | 72,619 | | 38,000 | | 23,781 |
Toowoomba medical ward | | 20 | | 2,700 | | 358 | | 2,342 | | |
Yeppoon Hospital redevelopment | | 30 | | 18,600 | | 888 | | 6,250 | | 11 ,462 |
Sunshine Coast Health Services District additional bed capacity | | 10 | | 79,060 | | 319 | | 3,000 | | 75,741 |
Bundaberg Hospital expansion | | 15 | | 41,100 | | | | 2,300 | | 38,800 |
Cairns Hospital additional bed capacity | | 50 | | 11,100 | | | | 1,000 | | 10,100 |
Gold Coast University Hospital | | 10 | | 1,230,000 | | 500 | | 14,500 | | 1,215,000 |
Princess Alexandra Hospital additional bed capacity | | 05 | | 50,000 | | | | 400 | | 49,600 |
Robina Hospital expansion | | 10 | | 220,000 | | 250 | | 5,000 | | 214,750 |
Queensland Children’s Hospital | | 05 | | 694,400 | | 10,500 | | 6,000 | | 677,900 |
Rockhampton Hospital improvement | | 30 | | 74,000 | | 3,767 | | 19,265 | | 50,968 |
Sunshine Coast Hospital | | 10 | | 925,762 | | 580 | | 11,500 | | 913,682 |
Townsville General Hospital Birthing Centre | | 45 | | 1,000 | | | | 780 | | 220 |
Townsville General Hospital expansion | | 45 | | 84,000 | | | | 1,000 | | 83,000 |
Elective Surgery | | | | | | | | | | |
Queen Elizabeth II Hospital Elective Surgery expansion | | 05 | | 30,000 | | | | 3,500 | | 26,500 |
Logan Elective Surgery Emergency Department Upgrades | | 05 | | 3,400 | | | | 100 | | 3,300 |
Gold Coast Hospital Emergency Department upgrade | | 10 | | 8,200 | | 2,802 | | 5,128 | | 270 |
Gympie Hospital Emergency Department upgrade* | | 15 | | 6,704 | | 5,858 | | 846 | | |
Logan Hospital Emergency Department upgrade* | | 05 | | 7,298 | | 6,960 | | 338 | | |
Redcliffe Hospital Emergency Department upgrade* | | 05 | | 27,515 | | 11,027 | | 16,277 | | 211 |
Redland Hospital Emergency Department upgrade* | | 05 | | 13,951 | | 11,142 | | 2,809 | | |
| | | | | | |
| 62 | | Capital Statement 2007-08 | | |
Health
| | | | | | | | | | |
Project | | Statistical
Division | | Total
Estimated
Cost
$’000 | | Expenditure
to 30-06-07
$’000 | | Budget
2007-08 $’000 | | Post
2007-08 $’000 |
Robina Hospital Emergency Department and Intensive Care Unit* | | 10 | | 40,119 | | 30,949 | | 9,170 | | |
Master planning studies | | Various | | | | | | 850 | | Ongoing |
Building works capital project management | | Various | | | | | | 850 | | Ongoing |
| | | | | | | | | | |
Sub-total Hospitals | | | | | | | | 194,910 | | |
| | | | | | | | | | |
Health Technology Replacement | | | | | | | | | | |
Health Technology equipment | | Various | | | | | | 50,000 | | Ongoing |
Program management | | Various | | | | | | 1,045 | | Ongoing |
Healthy Hearing* | | Various | | 2,825 | | 2,325 | | 500 | | |
Radiation Oncology equipment | | Various | | 1,500 | | | | 1,500 | | |
| | | | | | | | | | |
Sub-total Health Technology Replacement | | | | | | | | 53,045 | | |
| | | | | | | | | | |
Renal Services | | | | | | | | | | |
Cooktown Satellite Renal Service | | 50 | | 3,636 | | 3,556 | | 80 | | |
Princess Alexandra Hospital Renal (8 Chairs) | | 05 | | 600 | | | | 600 | | |
Redland Hospital Renal (3 Chairs) | | 05 | | 200 | | | | 200 | | |
Sunshine Coast Renal Dialysis Service | | 10 | | 1,160 | | 122 | | 1,038 | | |
Sunshine/Logan/Kingaroy planning services | | Various | | 2,000 | | | | 2,000 | | |
| | | | | | | | | | |
Sub-total Renal Services | | | | | | | | 3,918 | | |
| | | | | | | | | | |
Mental Health Services | | | | | | | | | | |
Rockhampton Child and Youth MHS relocation | | 30 | | 1,567 | | 1,512 | | 55 | | |
Queensland Mental Health Plan | | Various | | 131,660 | | | | 18,100 | | 113,560 |
The Park—Centre for Mental Health | | 05 | | 2,000 | | 1,139 | | 861 | | |
| | | | | | | | | | |
Sub-total Mental Health Services | | | | | | | | 19,016 | | |
| | | | | | | | | | |
Pathology and Scientific Services | | | | | | | | | | |
Queensland Health Scientific Services | | 05 | | 20,616 | | 16,106 | | 4,510 | | |
| | | | | | | | | | |
Sub-total Pathology and Scientific Services | | | | | | | | 4,510 | | |
| | | | | | | | | | |
Residential Aged Care Facilities Program Nambour Residential Aged Care Facility | | 10 | | 10,021 | | 240 | | 2,390 | | 7,391 |
| | | | | | |
| | Capital Statement 2007-08 | | 63 |
Health
| | | | | | | | | | |
Project | | Statistical
Division | | Total
Estimated
Cost
$’000 | | Expenditure
to 30-06-07
$’000 | | Budget
2007-08 $’000 | | Post
2007-08 $’000 |
Nambour Residential Aged Care Facility (Land Acquisition) | | 10 | | 2,300 | | | | 2,300 | | |
Wondai Residential Aged Care Facility | | 15 | | 13,401 | | 13,363 | | 38 | | |
| | | | | | | | | | |
Sub-total Residential Aged Care Facilities Program | | | | | | | | 4,728 | | |
| | | | | | | | | | |
Staff Accommodation Program | | | | | | | | | | |
Cape York staff accommodation-Lockhart River, Kowanyama | | 50 | | 2,586 | | 766 | | 1,820 | | |
Rockhampton staff accommodation * | | 30 | | 10,000 | | 1,877 | | 6,807 | | 1,316 |
Roma Nurses Quarters | | 25 | | 10,500 | | 588 | | 6,448 | | 3,464 |
Housing stock upgrade | | Various | | | | | | 1,000 | | Ongoing |
Regional accommodation program | | Various | | 87,500 | | 63,649 | | 23,851 | | |
Other staff accommodation (various locations)* | | Various | | 12,280 | | 9,921 | | 2,359 | | |
| | | | | | | | | | |
Sub-total Staff Accommodation Program | | | | | | | | 42,285 | | |
| | | | | | | | | | |
Other Acquisitions of Property, Plant and Equipment | | | | | | | | | | |
Health Contact Centre | | Various | | 8,762 | | 6,762 | | 2,000 | | |
Queensland Bone Bank redevelopment | | 05 | | 11,943 | | 11,936 | | 7 | | |
Emergent works program | | Various | | | | | | 20,000 | | Ongoing |
Princess Alexandra Hospital Power upgrade | | 05 | | 8,500 | | 3,000 | | 5,500 | | |
Urgent infrastructure initiatives | | Various | | 8,800 | | 6,750 | | 2,050 | | |
Water conservation initiatives | | Various | | 2,000 | | 17 | | 1,983 | | |
Minor capital projects and1 acquisitions | | Various | | | | | | 15,987 | | Ongoing |
| | | | | | | | | | |
Sub-total Other Acquisitions of Property, Plant and Equipment | | | | | | | | 47,527 | | |
| | | | | | | | | | |
Information Technology Equipment | | | | | | | | | | |
Information Technology equipment acquisition | | Various | | | | | | 45,464 | | Ongoing |
| | | | | | | | | | |
Sub-total Information Technology Equipment | | | | | | | | 45,464 | | |
| | | | | | | | | | |
Total Property, Plant and Equipment | | | | | | | | 551,422 | | |
| | | | | | | | | | |
Other Capital Expenditure | | | | | | | | | | |
Information and Communication Technology2 e-Health Program | | Various | | 12,853 | | | | 12,853 | | |
| | | | | | |
| 64 | | Capital Statement 2007-08 | | |
Health
| | | | | | | | | | |
Project | | Statistical
Division | | Total
Estimated
Cost
$’000 | | Expenditure
to 30-06-07
$’000 | | Budget
2007-08 $’000 | | Post
2007-08 $’000 |
Hospital and Community Health Care System* | | Various | | 82,600 | | 5,571 | | 17,612 | | 59,417 |
Resource Management Enablement | | Various | | 1,327 | | 361 | | 966 | | |
Decision Support Program | | Various | | 2,657 | | 470 | | 1,067 | | 1,120 |
ICT Infrastructure | | | | | | | | | | |
e-Health Infrastructure | | Various | | 21,618 | | | | 7,426 | | 14,192 |
Security | | Various | | 8,916 | | 5,232 | | 2,784 | | 900 |
Telecommunications and connectivity | | Various | | | | | | 3,353 | | Ongoing |
Processing and storage | | Various | | 12,278 | | | | 12,278 | | |
Other IT projects | | Various | | 1,546 | | | | 1,546 | | |
IT contingency and emergent needs | | Various | | | | | | 291 | | Ongoing |
| | | | | | | | | | |
Sub-total Information and Communication Technology | | | | | | | | 60,176 | | |
| | | | | | | | | | |
Inventory movement | | Various | | | | | | 1,521 | | Ongoing |
| | | | | | | | | | |
Total Other Capital Expenditure | | | | | | | | 61,697 | | |
| | | | | | | | | | |
Capital Grants | | | | | | | | | | |
Mater interim paediatric cardiac strategy | | 05 | | 28,600 | | 9,000 | | 19,600 | | |
| | | | | | | | | | |
Total Capital Grants | | | | | | | | 19,600 | | |
| | | | | | | | | | |
TOTAL QUEENSLAND HEALTH | | | | | | | | 632,719 | | |
| | | | | | | | | | |
| | | | | |
THE COUNCIL OF THE QUEENSLAND INSTITUTE OF MEDICAL RESEARCH | | | | | | | | | | |
Property, Plant and Equipment | | | | | | | | | | |
Other scientific equipment | | 05 | | | | | | 2,232 | | Ongoing |
| | | | | | | | | | |
Total Property, Plant and Equipment | | | | | | | | 2,232 | | |
| | | | | | | | | | |
TOTAL THE COUNCIL OF THE QUEENSLAND INSTITUTE OF MEDICAL RESEARCH | | | | | | | | 2,232 | | |
| | | | | | | | | | |
TOTAL HEALTH | | | | | | | | 634,951 | | |
| | | | | | | | | | |
Notes:
| 1. | Amount is net of $23.5 million non-capital component of project expenditure. |
| 2. | Information and Communication Technology projects are net of $44.7 million in 2007-08 representing changes in classification of expenditure due to application of the Australian Equivalents to International Financial Reporting Standards. |
| * | Funded fully or in part under the Smart State Building Fund |
| | | | | | |
| | Capital Statement 2007-08 | | 65 |
HOUSING
The department’s 2007-08 capital program of $487.3 million underpins the provision of a range of social housing solutions across the department’s outputs. This expenditure includes $85 million from an injection of $500 million over five years from the Queensland Future Growth Fund.
The department will deliver housing assistance in Queensland through one social housing system ensuring that the different types of housing assistance funded or subsidised by Government are better integrated and that clients have improved access to the full range of available social housing options. The department will also continue to explore opportunities for increasing the supply of affordable housing and to assist people to find and maintain a private rental home or buy their own home.
In 2007-08, year three of the Queensland Government’s Responding to Homelessness initiative provides $27.9 million in capital funding for the department to deliver a range of accommodation initiatives, including continued redevelopment of the Lady Bowen Complex to further expand the housing options for at risk people in inner-Brisbane together with further allocations to the Crisis Accommodation and Community-managed Housing—Studio Units.
In 2007-08, $11 million of a four-year $38.5 million program for the Government’s Spinal Injuries Initiative will fund the commencement of 20 dwellings and the completion of 23 dwellings across Queensland. This cross-agency initiative will provide housing and support to assist patients with spinal injuries to leave hospital when they no longer require hospital care.
As part of the Queensland contribution to the Council of Australian Governments National Mental Health Plan to provide housing with support to clients with severe mental illness and moderate to high support needs, an allocation of $40 million has been provided over four years to provide suitable housing through purchase or construction of accommodation.
Program Highlights
The department will expand the supply and improve the amenity of social housing dwellings through capital investment and grant funding including:
| • | | $ 297.8 million in funding for the Public Housing and Aboriginal and Torres Strait Islander Housing rental programs and the Long Term Community Housing Program to: |
| | - | | purchase or commence construction of 544 dwellings, complete construction of 410 dwellings commenced in previous years, and purchase and develop land to facilitate future construction of social housing dwellings |
| | | | | | |
| 66 | | Capital Statement 2007-08 | | |
| | - | | enhance the condition of existing social housing dwellings through general upgrades, including the continuation of Urban Renewal projects |
| • | | $ 48.3 million in capital grants allocated for upgrades to existing properties, new and replacement dwellings on the 34 Aboriginal and Torres Strait Islander communities. Construction will be completed on 43 new dwellings, 44 dwellings will be replaced, 367 dwellings will be upgraded and 12 dwellings purchased outside the Indigenous communities. In addition, construction will commence on 16 new dwellings and eight replacement dwellings and upgrade work will commence on 60 dwellings |
| • | | $ 42.9 million in funding for Community-managed Housing—Studio Units to purchase or commence 164 units of accommodation, complete construction of 126 units commenced in 2007-08 or in previous years, and purchase and develop land to facilitate future construction of accommodation |
| • | | $ 22 million in funding for the Crisis Accommodation Program to commence construction of three shelters, complete construction of one shelter and one dwelling, purchase two hostels and nine dwellings, upgrade one shelter and purchase and develop land to facilitate future construction |
| • | | $ 10.5 million to continue redevelopment of the Lady Bowen Complex to provide housing options for people at risk of homelessness in inner-Brisbane |
| • | | $ 5 million in capital grants to the Brisbane Housing Company that, combined with allocations from previous years, will provide approximately 300 dwellings to low-income households throughout the year |
| • | | $ 10.2 million in capital grants for the Gold Coast Housing Company over two years, including $7.2 million in 2007-08, to provide affordable housing to low-income households on the Gold Coast |
| • | | $ 16 million in capital grants to commence construction of up to 99 dwellings for affordable housing on the Gold Coast and Sunshine Coast. |
The department will continue to create better opportunities and outcomes in renewal communities through the allocation of $4.5 million towards improving community facilities and neighbourhood amenities in targeted areas of Queensland under the Community Renewal program.
An estimated 1,202 FTE jobs will be directly sustained in the residential construction sector and a further 1,236 FTE jobs in related supply sectors, based on construction related capital investment of $253.4 million and capital grants expenditure of $100 million.
| | | | | | |
| | Capital Statement 2007-08 | | 67 |
Housing
| | | | | | | | | | |
Project | | Statistical
Division | | Total
Estimated
Cost
$’000 | | Expenditure
to 30-06-07
$’000 | | Budget
2007-08 $’000 | | Post
2007-08 $’000 |
DEPARTMENT OF HOUSING | | | | | | | | | | |
Property, Plant and Equipment | | | | | | | | | | |
PUBLIC RENTAL HOUSING | | | | | | | | | | |
New Construction | | | | | | | | | | |
Brisbane | | | | | | | | | | |
Detached Houses | | 05 | | | | | | 6,753 | | Ongoing |
Medium Density | | 05 | | | | | | 42,295 | | Ongoing |
Seniors’ Units | | 05 | | | | | | 11,350 | | Ongoing |
Moreton | | | | | | | | | | |
Detached Houses | | 10 | | | | | | 927 | | Ongoing |
Medium Density | | 10 | | | | | | 13,430 | | Ongoing |
Seniors’ Units | | 10 | | | | | | 1,020 | | Ongoing |
Wide Bay-Burnett | | | | | | | | | | |
Detached Houses | | 15 | | | | | | 620 | | Ongoing |
Medium Density | | 15 | | | | | | 6,610 | | Ongoing |
Seniors’ Units | | 15 | | | | | | 1,050 | | Ongoing |
Darling Downs | | | | | | | | | | |
Detached Houses | | 20 | | | | | | 1,469 | | Ongoing |
Medium Density | | 20 | | | | | | 4,450 | | Ongoing |
Fitzroy | | | | | | | | | | |
Detached Houses | | 30 | | | | | | 188 | | Ongoing |
Medium Density | | 30 | | | | | | 670 | | Ongoing |
Mackay | | | | | | | | | | |
Detached Houses | | 40 | | | | | | 974 | | Ongoing |
Medium Density | | 40 | | | | | | 2,575 | | Ongoing |
Seniors’ Units | | 40 | | | | | | 795 | | Ongoing |
Northern | | | | | | | | | | |
Detached Houses | | 45 | | | | | | 1,130 | | Ongoing |
Medium Density | | 45 | | | | | | 1,894 | | Ongoing |
Far North | | | | | | | | | | |
Detached Houses | | 50 | | | | | | 2,075 | | Ongoing |
Medium Density | | 50 | | | | | | 4,350 | | Ongoing |
North West | | | | | | | | | | |
Medium Density | | 55 | | | | | | 475 | | Ongoing |
| | | | | | | | | | |
Sub-total New Construction | | | | | | | | 105,100 | | |
| | | | | | | | | | |
Capital Works on Existing Dwellings | | | | | | | | | | |
Brisbane | | 05 | | | | | | 62,826 | | Ongoing |
Moreton | | 10 | | | | | | 6,550 | | Ongoing |
Wide Bay-Burnett | | 15 | | | | | | 1,605 | | Ongoing |
| | | | | | |
| 68 | | Capital Statement 2007-08 | | |
Housing
| | | | | | | | | | |
Project | | Statistical
Division | | Total
Estimated
Cost
$’000 | | Expenditure
to 30-06-07
$’000 | | Budget
2007-08 $’000 | | Post
2007-08 $’000 |
Darling Downs | | 20 | | | | | | 2,034 | | Ongoing |
Fitzroy | | 30 | | | | | | 3,035 | | Ongoing |
Mackay | | 40 | | | | | | 3,804 | | Ongoing |
Northern | | 45 | | | | | | 4,154 | | Ongoing |
Far North | | 50 | | | | | | 1,865 | | Ongoing |
North West | | 55 | | | | | | 763 | | Ongoing |
Various | | Various | | | | | | 360 | | Ongoing |
| | | | | | | | | | |
Sub-total Capital Works on Existing Dwellings | | | | | | | | 86,996 | | |
| | | | | | | | | | |
Land purchases and improvement | | Various | | | | | | 15,000 | | Ongoing |
Purchase of existing properties | | Various | | | | | | 43,500 | | Ongoing |
| | | | | | | | | | |
Sub-total PUBLIC RENTAL HOUSING | | | | | | | | 250,596 | | |
| | | | | | | | | | |
ABORIGINAL AND TORRES STRAIT ISLANDER HOUSING | | | | | | | | | | |
New Construction | | | | | | | | | | |
Brisbane | | 05 | | | | | | 365 | | Ongoing |
Fitzroy | | 30 | | | | | | 977 | | Ongoing |
Mackay | | 40 | | | | | | 260 | | Ongoing |
Northern | | 45 | | | | | | 1,038 | | Ongoing |
North West | | 55 | | | | | | 660 | | Ongoing |
Various | | Various | | | | | | 2,000 | | Ongoing |
| | | | | | | | | | |
Sub-total New Construction | | | | | | | | 5,300 | | |
| | | | | | | | | | |
Capital Works on Existing Dwellings | | | | | | | | | | |
Brisbane | | 05 | | | | | | 571 | | Ongoing |
Moreton | | 10 | | | | | | 18 | | Ongoing |
Wide Bay-Burnett | | 15 | | | | | | 428 | | Ongoing |
Darling Downs | | 20 | | | | | | 799 | | Ongoing |
Fitzroy | | 30 | | | | | | 381 | | Ongoing |
Mackay | | 40 | | | | | | 1,094 | | Ongoing |
Northern | | 45 | | | | | | 670 | | Ongoing |
Far North | | 50 | | | | | | 2,808 | | Ongoing |
North West | | 55 | | | | | | 2,231 | | Ongoing |
Various | | Various | | | | | | 2,000 | | Ongoing |
| | | | | | | | | | |
Sub-total Capital Works on Existing Dwellings | | | | | | | | 11,000 | | |
| | | | | | | | | | |
Land purchases and improvement | | Various | | | | | | 2,100 | | Ongoing |
Purchase of existing properties | | Various | | | | | | 13,000 | | Ongoing |
| | | | | | | | | | |
Sub-total ABORIGINAL AND TORRES STRAIT ISLANDER HOUSING | | | | | | | | 31,400 | | |
| | | | | | | | | | |
| | | | | | |
| | Capital Statement 2007-08 | | 69 |
Housing
| | | | | | | | | | |
Project | | Statistical
Division | | Total
Estimated
Cost
$’000 | | Expenditure
to 30-06-07
$’000 | | Budget
2007-08 $’000 | | Post
2007-08 $’000 |
COMMUNITY HOUSING | | | | | | | | | | |
New Construction | | | | | | | | | | |
Brisbane* | | 05 | | | | | | 12,228 | | Ongoing |
Moreton | | 10 | | | | | | 4,356 | | Ongoing |
Wide Bay-Burnett | | 15 | | | | | | 500 | | Ongoing |
Darling Downs | | 20 | | | | | | 1,853 | | Ongoing |
South West | | 25 | | | | | | 1,114 | | Ongoing |
Fitzroy | | 30 | | | | | | 4,810 | | Ongoing |
Mackay | | 40 | | | | | | 116 | | Ongoing |
Far North | | 50 | | | | | | 4,903 | | Ongoing |
| | | | | | | | | | |
Sub-total New Construction | | | | | | | | 29,880 | | |
| | | | | | | | | | |
Capital Works on Existing Dwellings | | | | | | | | | | |
Brisbane | | 05 | | | | | | 10,500 | | Ongoing |
Northern* | | 45 | | | | | | 1,500 | | Ongoing |
Various | | Various | | | | | | 2,500 | | Ongoing |
| | | | | | | | | | |
Sub-total Capital Works on Existing Dwellings | | | | | | | | 14,500 | | |
| | | | | | | | | | |
Land Purchases and Improvement | | | | | | | | | | |
Brisbane | | 05 | | | | | | 600 | | Ongoing |
Various | | Various | | | | | | 6,800 | | Ongoing |
| | | | | | | | | | |
Sub-total Land Purchases and Improvement | | | | | | | | 7,400 | | |
| | | | | | | | | | |
Purchase of existing properties | | Various | | | | | | 22,900 | | Ongoing |
| | | | | | | | | | |
Sub-total COMMUNITY HOUSING | | | | | | | | 74,680 | | |
| | | | | | | | | | |
COMMUNITY RENEWAL | | | | | | | | | | |
New Construction | | | | | | | | | | |
Northern | | 45 | | | | | | 661 | | Ongoing |
| | | | | | | | | | |
Sub-total New Construction | | | | | | | | 661 | | |
| | | | | | | | | | |
Sub-total COMMUNITY RENEWAL | | | | | | | | 661 | | |
| | | | | | | | | | |
HOME PURCHASE ASSISTANCE | | | | | | | | | | |
Investment | | Various | | | | | | 300 | | Ongoing |
| | | | | | | | | | |
Sub-total HOME PURCHASE ASSISTANCE | | | | | | | | 300 | | |
| | | | | | | | | | |
PRIVATE HOUSING | | | | | | | | | | |
Purchase of existing properties | | Various | | | | | | 21,200 | | Ongoing |
| | | | | | | | | | |
Sub-total PRIVATE HOUSING | | | | | | | | 21,200 | | |
| | | | | | | | | | |
| | | | | | |
| 70 | | Capital Statement 2007-08 | | |
Housing
| | | | | | | | | | |
Project | | Statistical
Division | | Total
Estimated
Cost
$’000 | | Expenditure
to 30-06-07
$’000 | | Budget
2007-08 $’000 | | Post
2007-08 $’000 |
PLANT & EQUIPMENT | | | | | | | | | | |
Property, plant & equipment | | Various | | | | | | 463 | | Ongoing |
| | | | | | | | | | |
Sub-total PLANT & EQUIPMENT | | | | | | | | 463 | | |
| | | | | | | | | | |
Total Property, Plant and Equipment | | | | | | | | 379,300 | | |
| | | | | | | | | | |
Other Capital Expenditure | | | | | | | | | | |
Intangibles | | Various | | | | | | 8,037 | | Ongoing |
| | | | | | | | | | |
Total Other Capital Expenditure | | | | | | | | 8,037 | | |
| | | | | | | | | | |
Capital Grants | | | | | | | | | | |
ABORIGINAL AND TORRES STRAIT ISLANDER HOUSING | | | | | | | | | | |
Wide Bay-Burnett | | 15 | | | | | | 2,118 | | Ongoing |
Fitzroy | | 30 | | | | | | 1,680 | | Ongoing |
Northern | | 45 | | | | | | 5,678 | | Ongoing |
Far North | | 50 | | | | | | 34,641 | | Ongoing |
North West | | 55 | | | | | | 4,150 | | Ongoing |
| | | | | | | | | | |
Sub-total ABORIGINAL AND TORRES STRAIT ISLANDER HOUSING | | | | | | | | 48,267 | | |
| | | | | | | | | | |
COMMUNITY HOUSING | | | | | | | | | | |
Brisbane | | 05 | | | | | | 3,023 | | Ongoing |
Moreton | | 10 | | | | | | 36 | | Ongoing |
Wide Bay-Burnett | | 15 | | | | | | 780 | | Ongoing |
Darling Downs | | 20 | | | | | | 894 | | Ongoing |
South West | | 25 | | | | | | 900 | | Ongoing |
Fitzroy | | 30 | | | | | | 1,345 | | Ongoing |
Central West | | 35 | | | | | | 616 | | Ongoing |
Mackay | | 40 | | | | | | 1,514 | | Ongoing |
Northern | | 45 | | | | | | 1,008 | | Ongoing |
Far North | | 50 | | | | | | 859 | | Ongoing |
North West | | 55 | | | | | | 248 | | Ongoing |
Various | | Various | | | | | | 6,777 | | Ongoing |
| | | | | | | | | | |
Sub-total COMMUNITY HOUSING | | | | | | | | 18,000 | | |
| | | | | | | | | | |
COMMUNITY RENEWAL | | | | | | | | | | |
Brisbane | | 05 | | | | | | 3,373 | | Ongoing |
Moreton | | 10 | | | | | | 150 | | Ongoing |
Northern | | 45 | | | | | | 50 | | Ongoing |
Far North | | 50 | | | | | | 220 | | Ongoing |
| | | | | | | | | | |
Sub-total COMMUNITY RENEWAL | | | | | | | | 3,793 | | |
| | | | | | | | | | |
| | | | | | |
| | Capital Statement 2007-08 | | 71 |
Housing
| | | | | | | | | | |
Project | | Statistical
Division | | Total
Estimated
Cost
$’000 | | Expenditure
to 30-06-07
$’000 | | Budget
2007-08 $’000 | | Post
2007-08 $’000 |
PRIVATE HOUSING | | | | | | | | | | |
Brisbane Housing Company | | 05 | | | | | | 5,000 | | Ongoing |
Moreton | | 10 | | | | | | 23,220 | | Ongoing |
Residential Service Industry and Budget Accommodation Grant | | Various | | | | | | 1,700 | | Ongoing |
| | | | | | | | | | |
Sub-total PRIVATE HOUSING | | | | | | | | 29,920 | | |
| | | | | | | | | | |
| | | | | |
Total Capital Grants | | | | | | | | 99,980 | | |
| | | | | | | | | | |
| | | | | |
TOTAL DEPARTMENT OF HOUSING | | | | | | | | 487,317 | | |
| | | | | | | | | | |
| * | Funded fully or in part under the Smart State Building Fund |
| | | | | | |
| 72 | | Capital Statement 2007-08 | | |
INFRASTRUCTURE
The 2007-08 capital expenditure budget for Infrastructure, including Property Services Group, Water Infrastructure Projects and Airport Link, is $2.553 billion.
The department’s role is to guide major resource and infrastructure projects to fruition and to ensure the timely delivery of both social and economic infrastructure in a way which is not only sustainable but which also delivers benefits to all Queenslanders.
The Government has established a number of special purpose vehicles to provide rigorous governance, management and delivery of major infrastructure including the Western Corridor Recycled Water Project, Southern Regional Water Pipeline, South East Queensland (Gold Coast) Desalination Plant, other key water infrastructure projects and the Airport Link toll road.
The Property Services Group delivers the property services component of the Industry Location Scheme. Key functions of the group include the acquisition, planning and development of land for business and industry locating to or expanding in Queensland.
Program Highlights
| • | | Western Corridor Recycled Water Project - design, construction and operation of the largest recycled water project in the southern hemisphere will continue, including development of advanced water treatment plants and approximately 200km of pipeline as part of the Government’s solutions to secure South East Queensland’s water supply future. |
| • | | Southern Regional Water Pipeline - design and construction of the 130 megalitres per day two-way $901 million Southern Regional Water Pipeline between Brisbane and the Gold Coast will be substantially completed, including laying approximately 96km of pipeline and construction of ancillary work. |
| • | | South East Queensland (Gold Coast) Desalination Plant - construction of the 125 megalitres per day desalination plant at Tugun will continue. The project, which will be delivered by a company owned jointly by the State and the Gold Coast City Council, has an estimated total cost of $1.2 billion, of which $600 million is projected to be spent in 2007-08, and demonstrates the Government’s commitment to providing vital rainfall independent water infrastructure in South East Queensland and is on schedule to commence operations in November 2008. |
| • | | Northern and Eastern Pipeline Interconnectors - once corridor assessment surveys, environmental and cultural heritage studies and geotechnical investigations to support preliminary engineering design work are complete, construction work will commence in 2007-08. |
| | | | | | |
| | Capital Statement 2007-08 | | 73 |
| • | | Traveston Crossing and other Water Storage Projects - a draft environmental impact statement for the first stage of Traveston Crossing Dam will be completed in 2007-08 - a critical stage in facilitating completion of the project by the end of 2011. Stage one involves the construction of a 153,000 megalitre storage delivering up to 70,000 megalitres per annum. The department will further progress work on the Wyaralong Dam, the Cedar Grove Weir and the Bromelton off-stream storage, to meet expected water demands of the South East Queensland region. The proposed Wyaralong Dam and Cedar Grove Weir will yield 21,000 megalitres per annum, and Bromelton off-stream storage will have the capacity to deliver an additional yield of 5000 megalitres per annum. |
| • | | Airport Link - tenders for the 6.7km Airport Link toll road including sections of the Northern Busway will be evaluated in 2007-08. |
Property Services Group
The group’s capital acquisition plan has a total budget of $88.8 million in 2007-08.
Development approvals are in place and construction of the following projects is planned for 2007-08:
| • | | $2.9 million to complete construction of the Nandroya Industrial Estate |
| • | | $29.2 million to complete construction of Stage 1 of the Sunshine Coast Industrial Park (formerly the Caloundra Regional Business and Industry Park) |
| • | | $1.9 million to commence construction of Stages 2 and 3 of the Woree Business and Industry Park |
| • | | $5 million to complete construction of the Yandina Industrial Estate. |
Construction of the following projects is expected to proceed in 2007-08 once development approvals are obtained:
| • | | $6.8 million to construct external infrastructure for the Charlton North Industrial Estate |
| • | | $2.1 million to commence construction of Stage 4 of the Bohle Industrial Estate |
| • | | $5 million for infrastructure charges for the Coolum Industrial Estate |
| • | | $4.3 million to commence construction of Stage 6 of the Crestmead Industrial Estate |
| • | | $4 million to commence construction of the South Mackay Industrial Estate. |
The following land acquisitions are planned for 2007-08, subject to negotiations:
| • | | $2 million for the acquisition of additional land for the Amberley Aerospace Park |
| | | | | | |
| 74 | | Capital Statement 2007-08 | | |
| • | | $5 million for the acquisition of land for the future development of industrial estates in Far North Queensland |
| • | | $6 million for the acquisition of land for the future development of industrial estates in the Mackay region |
| • | | $7.5 million for continued acquisitions within South East Queensland for the future development of industrial estates. |
Financial assistance of $1.5 million will be provided for the development of infrastructure associated with the Port of Airlie Marina Development.
Infrastructure
| | | | | | | | | | |
Project | | Statistical
Division | | Total
Estimated
Cost
$’000 | | Expenditure
to 30-06-07
$’000 | | Budget
2007-08 $’000 | | Post
2007-08 $’000 |
DEPARTMENT OF INFRASTRUCTURE | | | | | | | | | | |
| | | | | |
Property, Plant and Equipment | | | | | | | | | | |
Townsville State Development Area | | 45 | | 7,500 | | 1,200 | | 6,300 | | |
Other capital expenditure | | 05 | | | | | | 45 | | Ongoing |
| | | | | | | | | | |
Total Property, Plant and Equipment | | | | | | | | 6,345 | | |
| | | | | | | | | | |
Capital Grants | | | | | | | | | | |
South East Queensland Regional Recreational Trails | | 10 | | 7,700 | | | | 1,400 | | 6,300 |
| | | | | | | | | | |
Total Capital Grants | | | | | | | | 1,400 | | |
| | | | | | | | | | |
| | | | | |
TOTAL DEPARTMENT OF INFRASTRUCTURE | | | | | | | | 7,745 | | |
| | | | | | | | | | |
| | | | | |
PROPERTY SERVICES GROUP | | | | | | | | | | |
| | | | | |
Property, Plant and Equipment | | | | | | | | | | |
Asset replacement program | | Various | | | | | | 156 | | Ongoing |
| | | | | | | | | | |
Total Property, Plant and Equipment | | | | | | | | 156 | | |
| | | | | | | | | | |
Other Capital Expenditure | | | | | | | | | | |
| | | | | |
Land Development | | | | | | | | | | |
| | | | | |
Amberley Aerospace Park | | 05 | | 30,550 | | 244 | | 1,000 | | 29,306 |
Bohle Industrial Estate Stage 4 | | 45 | | 7,250 | | 126 | | 2,124 | | 5,000 |
Brisbane Innovation Park | | 05 | | 5,000 | | 100 | | 400 | | 4,500 |
Clinton Industrial Park - Blain Drive | | 30 | | 3,000 | | | | 1,500 | | 1,500 |
Charlton North Industrial Estate | | 20 | | 17,840 | | 1,061 | | 6,779 | | 10,000 |
Coolum Industrial Estate | | 10 | | 30,297 | | 659 | | 5,000 | | 24,638 |
Coomera Government Precinct | | 10 | | 2,750 | | | | 250 | | 2,500 |
| | | | | | |
| | Capital Statement 2007-08 | | 75 |
Infrastructure
| | | | | | | | | | |
Project | | Statistical
Division | | Total Estimated
Cost $’000 | | Expenditure
to 30-06-07
$’000 | | Budget
2007-08
$’000 | | Post
2007-08 $’000 |
Crestmead Industrial Estate - Stage 6 | | 05 | | 4,400 | | 79 | | 4,321 | | |
Ebenezer Industrial Precinct | | 05 | | 10,850 | | | | 350 | | 10,500 |
Gladstone State Development Area - service infrastructure | | 30 | | 25,500 | | | | 500 | | 25,000 |
Nandroya Industrial Estate | | 10 | | 5,000 | | 2,063 | | 2,937 | | |
Narangba Industrial Estate | | 05 | | 5,750 | | | | 250 | | 5,500 |
South Mackay Industrial Estate | | 40 | | 8,008 | | 209 | | 4,000 | | 3,799 |
Sunshine Coast Industrial Park (formerly Caloundra Regional Business and Industry Park) | | 10 | | 52,002 | | 22,756 | | 29,246 | | |
Woree Business and Industry Park Stages 2 and 3 | | 50 | | 6,135 | | 190 | | 1,945 | | 4,000 |
Yandina Industrial Estate | | 10 | | 6,300 | | 1,270 | | 5,030 | | |
Minor works | | Various | | | | | | 500 | | Ongoing |
| | | | | | | | | | |
Sub-total Land Development | | | | | | | | 66,132 | | |
| | | | | | | | | | |
Land Purchases | | | | | | | | | | |
Amberley Aerospace Park | | 05 | | 5,428 | | 3,428 | | 2,000 | | |
Far North Queensland Strategic Land (formerly Edmonton Industrial Estate) | | 50 | | 5,000 | | | | 5,000 | | |
Mackay Region Industrial Land | | 40 | | 6,000 | | | | 6,000 | | |
South East Queensland Strategic Land | | 05 | | 30,000 | | 12,470 | | 7,530 | | 10,000 |
Minor land acquisitions | | Various | | | | | | 500 | | Ongoing |
| | | | | | | | | | |
Sub-total Land Purchases | | | | | | | | 21,030 | | |
| | | | | | | | | | |
Total Other Capital Expenditure | | | | | | | | 87,162 | | |
| | | | | | | | | | |
Capital Grants | | | | | | | | | | |
Port of Airlie Marina Development | | 40 | | 1,480 | | | | 1,480 | | |
| | | | | | | | | | |
Total Capital Grants | | | | | | | | 1,480 | | |
| | | | | | | | | | |
TOTAL PROPERTY SERVICES GROUP | | | | | | | | 88,798 | | |
| | | | | | | | | | |
| | | | | |
WATER INFRASTRUCTURE PROJECTS | | | | | | | | | | |
Property, Plant and Equipment | | | | | | | | | | |
Eastern Pipeline Interconnectors | | Various | | 40,000 | | 2,000 | | 15,000 | | 23,000 |
Western Corridor Recycled Water Project | | Various | | 1,700,000 | | 420,000 | | 1,183,000 | | 97,000 |
| | | | | | |
| 76 | | Capital Statement 2007-08 | | |
Infrastructure
| | | | | | | | | | |
Project | | Statistical
Division | | Total
Estimated
Cost $’000 | | Expenditure
to 30-06-07
$’000 | | Budget
2007-08
$’000 | | Post
2007-08 $’000 |
Southern Regional Water Pipeline | | Various | | 901,000 | | 330,000 | | 465,000 | | 106,000 |
Northern Pipeline Interconnectors | | Various | | 300,000 | | 10,200 | | 160,000 | | 129,800 |
Wyaralong Dam and associated infrastructure | | Various | | 595,000 | | 18,000 | | 65,000 | | 512,000 |
Traveston Crossing Dam | | Various | | 1,700,000 | | 380,000 | | 285,000 | | 1,035,000 |
South East Queensland (Gold Coast)1 Desalination Plant | | 10 | | 188,400 | | 141,786 | | 46,614 | | |
Total Property, Plant and Equipment | | | | | | | | 2,219,614 | | |
| | | | | | | | | | |
TOTAL WATER INFRASTRUCTURE PROJECTS | | | | | | | | 2,219,614 | | |
| | | | | | | | | | |
AIRPORT LINK | | | | | | | | | | |
Property, Plant and Equipment | | | | | | | | | | |
Airport Link 2 | | 05 | | 305,000 | | 7,230 | | 236,770 | | 61,000 |
Total Property, Plant and Equipment | | | | | | | | 236,770 | | |
| | | | | | | | | | |
TOTAL AIRPORT LINK | | | | | | | | 236,770 | | |
| | | | | | | | | | |
TOTAL INFRASTRUCTURE | | | | | | | | 2,552,927 | | |
| | | | | | | | | | |
Notes:
| 1. | The total estimated cost represents the equity injection to be made by the State into a company which is jointly owned with the Gold Coast City Council. The project is estimated to cost approximately $1.2 billion. |
| 2. | The total estimated cost included is for the initiation of the project and associated works. |
| | | | | | |
| | Capital Statement 2007-08 | | 77 |
JUSTICE AND ATTORNEY-GENERAL
The 2007-08 capital expenditure program for Justice and Attorney-General (Department of Justice and Attorney-General, Public Trust Office, Legal Aid Queensland, Crime and Misconduct Commission and the Anti-Discrimination Commission Queensland) is $125.5 million.
The Department of Justice and Attorney-General’s capital expenditure program for 2007-08 is $101.8 million. The department’s capital program focuses on designing, constructing and managing facilities and assets to ensure the services in the justice system are effective, accessible and safe.
Program Highlights
| • | | $40.4 million is provided for the construction of a new courthouse at Ipswich to cope with the growing population in this area. This is part of a combined facility including a watchhouse and a police station. |
| • | | $11 million is provided in 2007-08 together with $5 million in 2008-09 to move the Supreme and District Court redevelopment project from the design competition phase to the fully detailed design and costed construction proposal stage. |
| • | | $7.6 million is provided for the completion of the construction of a new courthouse in Strathpine (Pine Rivers Project). The new courthouse will service the growing communities in Brisbane’s northern corridor and be constructed in conjunction with a new police watchhouse. |
| • | | $3.8 million is provided to construct a courthouse at Mareeba. The courthouse, featuring a high-tech courtroom, prisoner holding cells and facilities for victims of crime and vulnerable witnesses, will form part of a project with a new police station and watchhouse. |
| • | | $3 million is provided for the fitting out of floor four of the new Brisbane Magistrates Court to create office and courtroom space. This floor was not fitted out at the time of construction. |
| • | | $4.8 million is provided to further develop the Integrated Justice Information Strategy which will deliver improved information sharing and operational efficiencies across the criminal justice system. |
The Public Trust Office will invest $6.1 million in capital projects in 2007-08, including just over $2 million in a new office to continue delivery of services in areas of greatest need in South East Queensland, $1.7 million on an office refurbishment program and $2.3 million on upgrading its information technology infrastructure.
| | | | | | |
| 78 | | Capital Statement 2007-08 | | |
Legal Aid Queensland will invest $2 million in capital projects in 2007-08, including $0.65 million on the head office building minor works program.
The Crime and Misconduct Commission will invest $15.1 million in capital projects in 2007-08 including $13.9 million being invested in the fitout costs associated with the Commission’s relocation in 2008.
Justice and Attorney-General
| | | | | | | | | | |
Project | | Statistical
Division | | Total
Estimated
Cost
$’000 | | Expenditure
to 30-06-07
$’000 | | Budget
2007-08 $’000 | | Post
2007-08 $’000 |
DEPARTMENT OF JUSTICE AND ATTORNEY-GENERAL | | | | | | | | | | |
Property, Plant and Equipment | | | | | | | | | | |
Ipswich, land purchase and new courthouse | | 05 | | 91,510 | | 3,706 | | 40,388 | | 47,416 |
Brisbane Supreme and District Courts redevelopment | | 05 | | 16,250 | | 250 | | 11,000 | | 5,000 |
Pine Rivers, land purchase and new courthouse* | | 05 | | 11,000 | | 3,375 | | 7,625 | | |
Mareeba Courthouse | | 50 | | 5,308 | | 1,500 | | 3,808 | | |
Brisbane Magistrate Court fitout | | 05 | | 4,300 | | | | 3,000 | | 1,300 |
Sandgate, new courthouse | | 05 | | 4,700 | | 2,863 | | 1,837 | | |
Maryborough Courthouse | | 15 | | 2,000 | | 500 | | 1,500 | | |
Videoconferencing to external locations | | 05 | | 1,525 | | 800 | | 725 | | |
Southport, courthouse upgrade | | 10 | | 1,300 | | 1,000 | | 300 | | |
Buildings, programmed renewal | | Various | | | | | | 7,620 | | Ongoing |
Minor capital works | | Various | | | | | | 1,630 | | Ongoing |
Other acquisitions of property, plant and equipment | | Various | | | | | | 6,225 | | Ongoing |
Total Property, Plant and Equipment | | | | | | | | 85,658 | | |
| | | | | | | | | | |
Other Capital Expenditure | | | | | | | | | | |
Integrated Justice Information Strategy | | 05 | | 22,504 | | 9,420 | | 4,811 | | 8,273 |
Prosecutions Case Management Information System | | 05 | | 2,699 | | 395 | | 2,304 | | |
Crown Law - CLO System | | 05 | | 1,883 | | 50 | | 1,833 | | |
Queensland Wide Integrated Courts System (QWIC) Renewal | | 05 | | 2,175 | | 140 | | 1,515 | | 520 |
Corporate Performance Management System | | 05 | | 842 | | 14 | | 828 | | |
| | | | | | |
| | Capital Statement 2007-08 | | 79 |
Justice and Attorney-General
| | | | | | | | | | |
Project | | Statistical
Division | | Total
Estimated
Cost
$’000 | | Expenditure
to 30-06-07
$’000 | | Budget
2007-08 $’000 | | Post
2007-08 $’000 |
New Queensland Courts Case Management System | | 05 | | 2,436 | | | | 607 | | 1,829 |
Crown Law - VISUALFILES System | | 05 | | 2,040 | | 1,065 | | 525 | | 450 |
Crown Law - eDRMS | | 05 | | 523 | | 54 | | 469 | | |
State Reporting Bureau - state of the art evidence transcription and reporting system | | 05 | | 4,239 | | 4,048 | | 191 | | |
Minor capital works - software | | 05 | | | | | | 1,501 | | Ongoing |
Other capital | | Various | | | | | | 1,600 | | Ongoing |
| | | | | | | | | | |
Total Other Capital Expenditure | | | | | | | | 16,184 | | |
| | | | | | | | | | |
TOTAL DEPARTMENT OF JUSTICE AND ATTORNEY-GENERAL | | | | | | | | 101,842 | | |
| | | | | | | | | | |
PUBLIC TRUST OFFICE | | | | | | | | | | |
Property, Plant and Equipment | | | | | | | | | | |
Property, plant and equipment | | 05 | | | | | | 3,364 | | Ongoing |
Establishment of additional office | | 05 | | 2,150 | | | | 2,150 | | |
| | | | | | | | | | |
Total Property, Plant and Equipment | | | | | | | | 5,514 | | |
| | | | | | | | | | |
Other Capital Expenditure | | | | | | | | | | |
Computer software | | 05 | | | | | | 630 | | Ongoing |
| | | | | | | | | | |
Total Other Capital Expenditure | | | | | | | | 630 | | |
| | | | | | | | | | |
TOTAL PUBLIC TRUST OFFICE | | | | | | | | 6,144 | | |
| | | | | | | | | | |
LEGAL AID QUEENSLAND | | | | | | | | | | |
| | | | | |
Property, Plant and Equipment | | | | | | | | | | |
Leasehold improvements | | 05 | | | | | | 26 | | Ongoing |
Brisbane building - minor works | | 05 | | | | | | 652 | | Ongoing |
Office equipment | | 05 | | | | | | 376 | | Ongoing |
Vehicle replacement | | 05 | | | | | | 381 | | Ongoing |
| | | | | | | | | | |
Total Property, Plant and Equipment | | | | | | | | 1,435 | | |
| | | | | | | | | | |
Other Capital Expenditure | | | | | | | | | | |
Core Business System technical redevelopment | | 05 | | | | | | 585 | | Ongoing |
Total Other Capital Expenditure | | | | | | | | 585 | | |
| | | | | | | | | | |
TOTAL LEGAL AID QUEENSLAND | | | | | | | | 2,020 | | |
| | | | | | | | | | |
| | | | | | |
| 80 | | Capital Statement 2007-08 | | |
Justice and Attorney-General
| | | | | | | | | | |
Project | | Statistical
Division | | Total
Estimated
Cost
$’000 | | Expenditure
to 30-06-07
$’000 | | Budget
2007-08 $’000 | | Post
2007-08 $’000 |
CRIME AND MISCONDUCT COMMISSION | | | | | | | | | | |
Property, Plant and Equipment | | | | | | | | | | |
Green Square fitout costs | | 05 | | 13,877 | | | | 13,877 | | |
Vehicle replacements | | 05 | | | | | | 505 | | Ongoing |
Computer and other equipment | | 05 | | | | | | 678 | | Ongoing |
| | | | | | | | | | |
Total Property, Plant and Equipment | | | | | | | | 15,060 | | |
| | | | | | | | | | |
TOTAL CRIME AND MISCONDUCT COMMISSION | | | | | | | | 15,060 | | |
| | | | | | | | | | |
ANTI-DISCRIMINATION COMMISSION | | | | | | | | | | |
Property, Plant and Equipment | | | | | | | | | | |
Property, plant and equipment | | 05 | | | | | | 46 | | Ongoing |
| | | | | | | | | | |
Total Property, Plant and Equipment | | | | | | | | 46 | | |
| | | | | | | | | | |
Other Capital Expenditure | | | | | | | | | | |
Case Management software system | | 05 | | 386 | | | | 386 | | |
| | | | | | | | | | |
Total Other Capital Expenditure | | | | | | | | 386 | | |
| | | | | | | | | | |
TOTAL ANTI-DISCRIMINATION COMMISSION | | | | | | | | 432 | | |
| | | | | | | | | | |
TOTAL JUSTICE AND ATTORNEY-GENERAL | | | | | | | | 125,498 | | |
| | | | | | | | | | |
| * | Funded fully or in part under the Smart State Building Fund |
| | | | | | |
| | Capital Statement 2007-08 | | 81 |
LEGISLATIVE ASSEMBLY OF QUEENSLAND
Capital outlays in property, plant and equipment are critical to the delivery of the Legislative Assembly and Parliamentary Service output. The 2007-08 capital program of $5.4 million is principally allocated to the upgrade of kitchen facilities within the Parliamentary Precinct, the replacement of major office equipment within Electorate Offices and the upgrade and replacement of air-conditioning plant within the Parliamentary Precinct. Funding is also directed to the ongoing Parliament House Stonework Restoration Program and a range of minor capital works projects designed to improve the functionality and performance of existing building infrastructure.
Legislative Assembly of Queensland
| | | | | | | | | | |
Project | | Statistical
Division | | Total
Estimated
Cost
$’000 | | Expenditure
to 30-06-07
$’000 | | Budget
2007-08 $’000 | | Post
2007-08 $’000 |
LEGISLATIVE ASSEMBLY OF QUEENSLAND | | | | | | | | | | |
| | | | | |
Property, Plant and Equipment | | | | | | | | | | |
Parliament House Stonework Restoration Program | | 05 | | 12,384 | | 3,904 | | 100 | | 8,380 |
Parliamentary Catering Services - kitchen upgrade | | 05 | | 3,360 | | | | 3,360 | | |
Electorate Office - office equipment replacement | | 05 | | 1,103 | | | | 1,103 | | |
Air-conditioning - upgrade and replacement | | 05 | | 450 | | | | 450 | | |
Minor capital works - plant and equipment | | 05 | | 422 | | | | 422 | | |
Total Property, Plant and Equipment | | | | | | | | 5,435 | | |
| | | | | | | | | | |
TOTAL LEGISLATIVE ASSEMBLY OF QUEENSLAND | | | | | | | | 5,435 | | |
| | | | | | | | | | |
| | | | | | |
| 82 | | Capital Statement 2007-08 | | |
LOCAL GOVERNMENT, PLANNING, SPORT AND RECREATION
The Department of Local Government, Planning, Sport and Recreation capital grant and subsidy programs will provide $474.5 million in 2007-08 to assist local governments, community sport and recreation organisations, Indigenous organisations and schools to build vibrant, more sustainable communities.
The majority of capital expenditure incurred by the department relates to capital grants and subsidies to assist with the:
| • | | creation or upgrading of a range of essential community infrastructure such as water supply, sewerage works, roads and drainage works. |
| • | | building or upgrading of other community facilities which enhance the opportunities for Queenslanders to participate in an active, healthy lifestyle. |
Other capital expenditure by the department is associated with supporting the delivery of the State Tennis Centre, improving the quality and accessibility of facilities at a number of the State’s Active Recreation Centres, and to ensure the ongoing maintenance and provision of an appropriate level of office equipment and information technology hardware at each of the department’s 30 sites across Queensland.
Program Highlights
| • | | $41 million in 2007-08 for projects to mark the 150th anniversary of Queensland’s separation as a colony from New South Wales by creating lasting tributes that reflect history, people, places, and future. |
| • | | $13.5 million to support the development of an international standard State Tennis Centre at Tennyson. The State Tennis Centre is due to be completed in December 2008. |
| • | | $14 million per year for four years, subject to matching Australian Government funding, under the Indigenous Environmental Health and Infrastructure Program to provide essential community infrastructure in the Torres Strait region, as part of the Local Government Infrastructure other works program. |
| • | | $5.1 million for the re-establishment of the Oakey Bore field to allow the town of Oakey to meet current demand for water, and provide relief for the Toowoomba Water Supply. |
| • | | $6.2 million in 2007-08 to undertake capital works at a number of Active Recreation Centres to improve facilities and support the delivery of activity programs. |
| | | | | | |
| | Capital Statement 2007-08 | | 83 |
Local Government, Planning, Sport and Recreation
| | | | | | | | | | |
Project | | Statistical
Division | | Total
Estimated
Cost
$’000 | | Expenditure
to 30-06-07
$’000 | | Budget
2007-08 $’000 | | Post
2007-08 $’000 |
DEPARTMENT OF LOCAL GOVERNMENT, PLANNING, SPORT AND RECREATION | | | | | | | | | | |
| | | | | |
Property, Plant and Equipment | | | | | | | | | | |
Tennyson Riverside redevelopment | | 05 | | 32,762 | | 6,937 | | 13,450 | | 12,375 |
Buildings | | | | | | | | | | |
Townsville Sport and Recreation Precinct | | 45 | | | | | | 955 | | Ongoing |
Active Recreation Centres | | Various | | | | | | 6,189 | | Ongoing |
Plant and equipment | | 05 | | | | | | 520 | | Ongoing |
| | | | | | | | | | |
Total Property, Plant and Equipment | | | | | | | | 21,114 | | |
| | | | | | | | | | |
Capital Grants | | | | | | | | | | |
Sport Infrastructure | | | | | | | | | | |
Local sport and recreation program | | Various | | | | | | 4,686 | | Ongoing |
Major facilities | | Various | | | | | | 28,950 | | Ongoing |
Minor facilities | | Various | | | | | | 7,500 | | Ongoing |
Local Government Infrastructure | | | | | | | | | | |
Queensland’s 150th Anniversary - Legacy Infrastructure project | | Various | | 100,000 | | 9,000 | | 41,000 | | 50,000 |
Roads and drainage | | Various | | | | | | 25,000 | | Ongoing |
Water and sewerage | | Various | | | | | | 189,047 | | Ongoing |
Other works | | Various | | | | | | 157,205 | | Ongoing |
| | | | | | | | | | |
Total Capital Grants | | | | | | | | 453,388 | | |
| | | | | | | | | | |
TOTAL DEPARTMENT OF LOCAL GOVERNMENT, PLANNING, SPORT AND RECREATION | | | | | | | | 474,502 | | |
| | | | | | | | | | |
| | | | | | |
| 84 | | Capital Statement 2007-08 | | |
MAIN ROADS
The $3.049 billion Main Roads 2007-08 capital expenditure program (which includes Queensland Motorways Limited and RoadTek) represents a 54% increase on the 2006-07 Budget. Main Roads strategically manages, plans, develops, operates and maintains the State-controlled road network, while recognising and taking into account the wider transport task, community and industry needs and the environment.
Capital investment in the road network results in improvements to the road system, generating significant long-term benefits to the people of Queensland in terms of:
| • | | strong and diversified economy through efficient and effective transport |
| • | | safe and secure communities through safer roads |
| • | | a fair, socially cohesive and culturally vibrant community through fair access and amenity |
| • | | a clean, liveable and healthy environment. |
Main Roads is responsible for some 33,500 km of roads and more than 6,500 bridges and major culverts. Roadworks are a long-term investment which deliver safer, more efficient and more convenient transport - for both industry and the community in general. The department is now directing greater levels of funding towards preservation and renewal of the state’s road network.
As part of the State’s Safer Roads Sooner initiative, the 2007-08 Budget allocates $47 million towards road safety capital programs, with $235 million to be allocated over the next five years across the State’s road network. This initiative aims to reduce road trauma and its social consequences by targeting low cost, high benefit road safety improvements - such as the installation of crash barriers, the provision of new rest stops and vegetation clearing, together with the installation of 1,000km of audio-tactile lines. Capital outlays for the Safer Roads Sooner initiative form part of $329.6 million outlays for Other State-controlled Roads, other construction.
Program Highlights
| • | | $691.2 million is provided to continue Queensland’s largest single road project to construct a second Gateway Bridge river crossing and to increase capacity on the Gateway Motorway, between Mt Gravatt-Capalaba Road and Nudgee Road, at a total estimated cost of $1.88 billion, with scheduled completion by mid 2011. |
| • | | $179.7 million is provided towards continuation of construction of the $543 million ($423 million - State; $120 million - Australian Government) four-lane bypass on the Pacific Motorway between Tugun and Tweed Heads, with scheduled completion in mid 2008. |
| | | | | | |
| | Capital Statement 2007-08 | | 85 |
| • | | $163.5 million is provided towards the federally-funded Ipswich Motorway upgrade between Wacol and Darra, $121 million to continue upgrading the Ipswich/Logan Motorway interchange and $100 million towards the federally-funded $2.3 billion Goodna Bypass from Dinmore to the Logan Motorway at Gailes, announced by the Australian Government in March 2007. |
| • | | $134.4 million is provided towards the construction of the South West Arterial (Springfield - Ripley - Yamanto extension) at a total estimated cost of $366 million to service new growth areas in Ipswich City, with scheduled completion by mid 2009. |
| • | | $133.7 million is provided for duplication of the Sunshine Motorway between Sippy Downs and Pacific Paradise, including the second Maroochy River bridge and major interchanges at Mooloolaba and Maroochydore Road and Pacific Paradise, at a total estimated cost of $290 million. |
| • | | $98.7 million is provided towards widening the federally-funded Bruce Highway to six lanes between Uhlmann Road and Caboolture, at a total estimated cost of $183 million. |
| • | | $58.2 million is provided to continue construction of the $109.9 million grade-separation of the Mt Lindesay Arterial and the rail line at Acacia Ridge ($85 million - - State; $25 million - Australian Government). |
| • | | $57.2 million is provided for planning and early works for the Western Arterial (Centenary Highway) as part of the Darra to Springfield Transport Corridor. |
| • | | $55 million is provided towards the construction of the new Houghton Highway bridge between Brighton and Redcliffe, at a total cost of $315 million. |
| • | | $36.3 million is provided to construct 5km of the new Caloundra - Mooloolaba Road between Caloundra Road and Creekside Boulevard, at a total cost of $75 million. |
| • | | $35 million is provided to continue construction on the $90.2 million project to duplicate the Mt Lindesay Highway from Green/Fedrick Streets to Rosia Road. |
| • | | $18 million is provided for the provision of four lanes on the New England Highway through Highfields, north of Toowoomba, in conjunction with a program of widening, overtaking lanes and intersection improvements north to Crows Nest, at a total estimated cost of $27.3 million. |
| • | | $12.3 million is provided towards widening and upgrading of Roma - Taroom Road to support oil and gas development and improve regional community access at a total estimated cost of $29.7 million. |
| | | | | | |
| 86 | | Capital Statement 2007-08 | | |
| • | | $10.6 million is provided towards route lighting for traffic and pedestrian safety, signal upgrades, intersection improvements and four-laning of various short sections of Ruthven Street in Toowoomba. |
| • | | $9.9 million is provided towards construction of the Bundaberg Ring Road to provide an alternative route from the Isis Highway to the industrial areas and the port to the east of Bundaberg City at a total estimated cost of $92 million. |
| • | | $2.4 million is provided to continue replacing the single lane Ward River Bridge and the two-span, single-lane bridge over Woolshed Gully, on the Diamantina Developmental Road west of Charleville at a total estimated cost of $11 million. |
| • | | $36.1 million is provided towards the Accelerated Road Rehabilitation Program to rehabilitate and widen 71 kilometres of the Dawson Highway in Central Queensland between Calliope and Banana, and replace 11 timber bridges, at a total cost of $78.9 million. |
| • | | In Mackay, $15.2 million is provided towards the duplication of the Forgan Bridge at a total estimated cost of $70.9 million, and $15.4 million towards construction of Hospital Bridge at a total estimated cost of $33.6 million. |
| • | | $6.5 million is provided towards the replacement of Sandy Creek Bridge on Homebush Road in Mackay at a total cost of $8 million. |
| • | | $5.4 million is provided towards rehabilitation and widening of the Capricorn Highway (Duaringa - Emerald), west of Yamala at a total cost of $8.9 million. |
| • | | $58.3 million is provided towards Stages 2 and 3 of the Townsville Ring Road at a total estimated cost of $119.3 million ($39.8 million State; $79.5 million - Australian Government). |
| • | | $40.3 million is provided to improve flood immunity on the federally-funded Bruce Highway between Corduroy Creek and Banyan Creek south of Tully at a total estimated cost of $172.8 million. |
| • | | $17.8 million is provided towards duplication of North Ward Road in Townsville, between William Street and Ingham Road and between Walker Street and Heatley Parade at a total estimated cost of $33.8 million. |
| • | | $9.3 million is provided towards widening the existing narrow formation sections of the Kennedy Highway, south of Mt Garnet, to provide a minimum eight-metre wide sealed pavement at a total estimated cost of $14 million. |
| • | | $9 million is provided towards widening the single-lane bitumen sections of the Burke Developmental Road between Cloncurry and Normanton, to provide a minimum seal width of eight metres, widening or removing narrow grids and improving visibility, at a total estimated cost of $28 million. |
| | | | | | |
| | Capital Statement 2007-08 | | 87 |
| • | | $5.6 million is provided towards widening Mulgrave Road in Cairns - between Ray Jones Drive (Woree) and the Captain Cook Highway, Sheridan Street, from four to six lanes - at a total estimated cost of $16 million. |
Main Roads
| | | | | | | | | | |
Project | | Statistical
Division | | Total
Estimated
Cost
$’000 | | Expenditure
to 30-06-07
$’000 | | Budget
2007-08 $’000 | | Post
2007-08 $’000 |
DEPARTMENT OF MAIN ROADS | | | | | | | | | | |
Property, Plant and Equipment | | | | | | | | | | |
Corporate Buildings | | | | | | | | | | |
Cloncurry, staff housing accommodation | | 55 | | 800 | | | | 800 | | |
Deagon, depot office accommodation | | 05 | | 1,900 | | 150 | | 1,750 | | |
Maroochydore, traffic management centre | | 10 | | 2,400 | | 25 | | 2,375 | | |
Coombabah, depot office accommodation | | 10 | | 1,400 | | 50 | | 600 | | 750 |
Roma, singles quarters | | 25 | | 1,500 | | 300 | | 1,200 | | |
Other works | | Various | | | | | | 5,275 | | Ongoing |
| | | | | | | | | | |
Sub-total Corporate Buildings | | | | | | | | 12,000 | | |
| | | | | | | | | | |
AusLink National Road Network | | | | | | | | | | |
Bruce Highway | | | | | | | | | | |
Corduroy Creek - Banyan Creek, Tully, realign 2 lanes | | 50 | | 172,800 | | 13,694 | | 40,311 | | 118,795 |
Gympie urban section, duplicate 2 to 4 lanes | | 15 | | 70,800 | | 13,884 | | 25,000 | | 31,916 |
Saunders Creek - Althaus Creek, north of Townsville, construct overtaking lane | | 45 | | 1,500 | | 54 | | 1,446 | | |
South of Gympie, construct overtaking lanes | | 15 | | 4,500 | | 1,363 | | 3,137 | | |
Surveyors Creek - Balgal Beach turnoff, Thuringowa City, construct overtaking lane | | 45 | | 2,000 | | 98 | | 1,902 | | |
Tokalon Road - Lannercost Street, Ingham - regrade and eliminate floodways | | 45 | | 25,000 | | 1,321 | | 12,000 | | 11,679 |
| | | | | | |
| 88 | | Capital Statement 2007-08 | | |
Main Roads
| | | | | | | | | | |
Project | | Statistical
Division | | Total
Estimated
Cost $’000 | | Expenditure
to 30-06-07
$’000 | | Budget
2007-08 $’000 | | Post
2007-08 $’000 |
Townsville Ring Road (Stages 2 and 3), Upper Ross River Road - Shaw Road, construct to new sealed 2 lane standard | | 45 | | 119,255 | | 33,990 | | 58,324 | | 26,941 |
Uhlmann Road - Caboolture, widen 4 to 6 lanes | | 05 | | 183,000 | | 34,667 | | 98,688 | | 49,645 |
Cunningham Arterial/Highway (Ipswich Motorway) | | | | | | | | | | |
Goodna Bypass, construct 6-lane bypass | | 05 | | 2,300,000 | | | | 100,000 | | 2,200,000 |
Logan Motorway interchange, construct interchange | | 05 | | 255,000 | | 65,068 | | 121,043 | | 68,889 |
Wacol - Darra, widen 4 to 6 lanes | | 05 | | 320,000 | | 59,492 | | 163,508 | | 97,000 |
Cunningham Highway | | | | | | | | | | |
Eight Mile intersection, at-grade intersection improvement | | 20 | | 4,927 | | 1,058 | | 3,869 | | |
Fisher Park - Maryvale, (Fisher Park West section), Warwick, widen and overlay | | 20 | | 6,900 | | 2,959 | | 3,941 | | |
Flinders Highway | | | | | | | | | | |
Jardine Valley (214.0 - 226.1km), Charters Towers - Hughenden, rehabilitate and widen | | 55 | | 6,230 | | 335 | | 5,895 | | |
Julia Creek - Cloncurry (20.2 - 29.7 km), rehabilitate and widen | | 55 | | 4,259 | | 244 | | 2,946 | | 1,069 |
Pacific Motorway | | 10 | | 543,000 | | 334.665 | | 179,696 | | 28,639 |
Tugun - Tweed Heads, construct 4-lane bypass | | | | | | | | | | |
Warrego Highway | | 25 | | 5,531 | | 1,153 | | 4,378 | | |
Mitchell Township, reconstruction | | | | | | | | | | |
Toowoomba Bypass, planning and PPP business case development | | 20 | | 10,000 | | 4,571 | | 5,429 | | |
Other construction | | Various | | 159,487 | | | | 159,487 | | |
| | | | | | | | | | |
Sub-total AusLink National Road Network | | | | | | | | 991,000 | | |
| | | | | | | | | | |
| | | | | | |
| | Capital Statement 2007-08 | | 89 |
Main Roads
| | | | | | | | | | |
Project | | Statistical
Division | | Total
Estimated
Cost
$’000 | | Expenditure
to 30-06-07
$’000 | | Budget
2007-08 $’000 | | Post
2007-08 $’000 |
Other State-controlled Roads | | | | | | | | | | |
Brighton - Redcliffe Road | | | | | | | | | | |
Houghton Highway, construct bridge and approaches | | 05 | | 315,000 | | 13,290 | | 55,000 | | 246,710 |
Bundaberg Ring Road, construct to new sealed 2 lane standard | | 15 | | 92,000 | | 8,110 | | 9,890 | | 74,000 |
Burke Developmental Road | | | | | | | | | | |
Cloncurry - Normanton, 263.0 - 269.58km, rehabilitate and widen | | 55 | | 2,680 | | 75 | | 2,605 | | |
Cloncurry - Normanton, Sections: 2.7 - 183.0km, widen existing pavement | | 55 | | 28,000 | | 19,014 | | 8,986 | | |
Normanton - Dimbulah, construct Gilbert River bridge and approaches | | 55 | | 10,000 | | 451 | | 4,049 | | 5,500 |
Caloundra - Mooloolaba Road, construct to new sealed 2 lane standard, Section: 0 - 5km | | 10 | | 75,000 | | 38,698 | | 36,302 | | |
Caloundra Road Bruce Highway - Pierce Avenue, duplicate 2 to 4 lanes | | 10 | | 80,000 | | 24,318 | | 29,000 | | 26,682 |
Capricorn Highway West of Yamala, rehabilitate and widen | | 30 | | 8,870 | | 3,489 | | 5,381 | | |
Captain Cook Highway Cairns - Mossman, Cairns Western Arterial Roundabout, construct additional lane | | 50 | | 4,582 | | 1,333 | | 2,300 | | 949 |
Dawson Highway | | | | | | | | | | |
Accelerated Road Rehabilitation Project, rehabilitate and widen, and replace bridges, on a 71km section between Calliope and Banana | | 30 | | 78,912 | | 42,825 | | 36,087 | | |
Diamantina Developmental Road | | | | | | | | | | |
Ward River and Woolshed Gully, replace bridge and approaches | | 25 | | 11,000 | | 647 | | 2,373 | | 7,980 |
| | | | | | |
| 90 | | Capital Statement 2007-08 | | |
Main Roads
| | | | | | | | | | |
Project | | Statistical
Division | | Total
Estimated
Cost
$’000 | | Expenditure
to 30-06-07
$’000 | | Budget
2007-08 $’000 | | Post
2007-08 $’000 |
Gold Coast Highway | | | | | | | | | | |
Helensvale - Southport, Robert - Stevens Street, widen to 4 lanes | | 10 | | 21,632 | | 10,170 | | 11,462 | | |
Gregory Developmental Road | | | | | | | | | | |
Charters Towers - The Lynd, 1km south of Airport Road - 8km north of East Paddy Creek, widen existing pavement | | 45 | | 6,734 | | 1,170 | | 5,564 | | |
Charters Towers - The Lynd, 2.7km north of One Mile Gin Creek - 300m south of Ryans Creek, widen existing pavement | | 45 | | 7,493 | | 40 | | 2,327 | | 5,126 |
Herveys Range Developmental Road | | | | | | | | | | |
Townsville - Battery, Blackhawk Boulevard - Bohle River, duplicate 2 to 4 lanes | | 45 | | 15,000 | | 1,875 | | 10,000 | | 3,125 |
Homebush Road, Mackay | | | | | | | | | | |
Sandy Creek, replace bridge | | 40 | | 7,989 | | 933 | | 6,511 | | 545 |
Hope Island Road | | | | | | | | | | |
Oxenford - Santa Barbara Road, duplicate 2 to 4 lanes | | 10 | | 13,900 | | 4,000 | | 9,900 | | |
Santa Barbara Road - Lae Drive, duplicate 2 to 4 lanes | | 10 | | 99,100 | | 9,169 | | 17,931 | | 72,000 |
Kennedy Highway | | | | | | | | | | |
Mt Garnet - The Lynd, widen and seal various sections | | 50 | | 13,959 | | 3,168 | | 9,291 | | 1,500 |
Leichhardt Highway | | | | | | | | | | |
Westwood - Taroom, Dawson River - Twelve Mile Creek, widen existing pavement | | 30 | | 6,001 | | 1,724 | | 4,277 | | |
Westwood - Taroom, north of Dawson Park Road, widen existing pavement | | 30 | | 6,554 | | 141 | | 2,048 | | 4,365 |
Mackay Bypass | | | | | | | | | | |
Hospital Bridge, construct bridge and approaches | | 40 | | 33,618 | | 5,615 | | 15,400 | | 12,603 |
| | | | | | |
| | Capital Statement 2007-08 | | 91 |
Main Roads
| | | | | | | | | | |
Project | | Statistical
Division | | Total
Estimated
Cost
$’000 | | Expenditure
to 30-06-07
$’000 | | Budget
2007-08 $’000 | | Post
2007-08 $’000 |
Mackay - Slade Point Road | | | | | | | | | | |
Forgan Bridge, construct bridge and approaches | | 40 | | 70,926 | | 4,200 | | 15,180 | | 51,546 |
Maroochydore Road | | | | | | | | | | |
Bruce Highway - Pike Street / Hobbs Road, duplicate 2 to 4 lanes | | 10 | | 90,000 | | 47,412 | | 25,000 | | 17,588 |
Maryborough - Hervey Bay Road | | | | | | | | | | |
Torbanlea turnoff - McNally Street, duplicate 2 to 4 lanes | | 15 | | 25,597 | | 2,416 | | 14,249 | | 8,932 |
Millmerran - Inglewood Road | | | | | | | | | | |
Millmerran - Inglewood (0 - 68.68km), widen and overlay | | 20 | | 14,000 | | 3,540 | | 5,493 | | 4,967 |
Moggill Sub-Arterial Road | | | | | | | | | | |
Kilkivan Avenue - Pullenvale Road, duplicate 2 to 4 lanes | | 05 | | 32,788 | | 18,587 | | 14,201 | | |
Mount Lindesay Arterial | | | | | | | | | | |
Acacia Ridge railway crossing, grade separation (road/rail) | | 05 | | 109,862 | | 10,120 | | 58,200 | | 41,542 |
Mount Lindesay Highway | | | | | | | | | | |
Brisbane - Beaudesert, Green Road/Fedrick Street - Rosia Road, duplicate 2 to 4 lanes | | 05 | | 90,185 | | 21,995 | | 35,000 | | 33,190 |
Mulgrave Road, Cairns | | | | | | | | | | |
Ray Jones Drive - Captain Cook Highway, construct additional lanes | | 50 | | 16,000 | | 3,727 | | 5,623 | | 6,650 |
New England Highway | | | | | | | | | | |
Ruthven Street, intersection improvements and widening to 4 lanes of various short sections | | 20 | | 27,095 | | 6,189 | | 10,586 | | 10,320 |
Yarraman - Toowoomba, various widening, sealing and duplication works from Highfields to Crows Nest | | 20 | | 27,256 | | 4,306 | | 17,951 | | 4,999 |
North Ward Road, Townsville | | | | | | | | | | |
Gregory Street - Heatley Parade and William Street - Ingham Road, duplicate 2 to 4 lanes | | 45 | | 33,800 | | 8,468 | | 17,802 | | 7,530 |
| | | | | | |
| 92 | | Capital Statement 2007-08 | | |
Main Roads
| | | | | | | | | | |
Project | | Statistical
Division | | Total
Estimated
Cost
$’000 | | Expenditure
to 30-06-07
$’000 | | Budget
2007-08 $’000 | | Post
2007-08 $’000 |
Peninsula Developmental Road | | | | | | | | | | |
Coen - Weipa, construct to sealed standard on various sections | | 50 | | 10,463 | | 1,766 | | 8,697 | | |
Rockleigh - North Mackay Road | | | | | | | | | | |
Sams Road - Barnes Creek Road, widen to 4 lanes | | 40 | | 14,171 | | 981 | | 6,270 | | 6,920 |
Roma - Taroom Road | | | | | | | | | | |
Sections: 0 - 64.9km, widen, pave and seal | | 25 | | 12,163 | | 1,567 | | 5,748 | | 4,848 |
Sections: 64.9 - 149.4km, widen, pave and seal | | 20 | | 17,500 | | 3,500 | | 6,598 | | 7,402 |
Smith Street Connection Road | | | | | | | | | | |
Pacific Motorway - High Street (in sections), widen to 6 lanes | | 10 | | 68,000 | | 770 | | 9,000 | | 58,230 |
South West Arterial Road | | | | | | | | | | |
Springfield - Yamanto, construct to new sealed 2 lane standard | | 05 | | 366,000 | | 132,865 | | 134,435 | | 98,700 |
Sunshine Motorway | | | | | | | | | | |
Maroochydore Road - Pacific Paradise, duplicate 2 to 4 lanes | | 10 | | 119,000 | | 28,363 | | 60,000 | | 30,637 |
Mooloolaba Road/ Maroochydore Road, interchange improvements | | 10 | | 35,000 | | 26,468 | | 2,000 | | 6,532 |
Pacific Paradise interchange and access to David Low Way | | 10 | | 70,000 | | 14,022 | | 30,000 | | 25,978 |
Sippy Downs - Kawana Arterial (Military Road) | | 10 | | 66,000 | | 24,319 | | 41,681 | | |
Western Arterial (Centenary Highway) | | | | | | | | | | |
Springfield - Ipswich Motorway, planning and early works | | 05 | | 77,498 | | 20,266 | | 57,232 | | |
Other construction | | Various | | | | | | 329,562 | | Ongoing |
| | | | | | | | | | |
Sub-total Other State-controlled Roads | | | | | | | | 1,197,192 | | |
| | | | | | | | | | |
Plant and equipment | | Various | | | | | | 4,000 | | Ongoing |
| | | | | | | | | | |
Total Property, Plant and Equipment | | | | | | | | 2,204,192 | | |
| | | | | | | | | | |
| | | | | | |
| | Capital Statement 2007-08 | | 93 |
Main Roads
| | | | | | | | | | |
Project | | Statistical
Division | | Total
Estimated
Cost
$’000 | | Expenditure
to 30-06-07
$’000 | | Budget
2007-08 $’000 | | Post
2007-08 $’000 |
Other Capital Expenditure | | | | | | | | | | |
Information technology | | Various | | | | | | 6,500 | | Ongoing |
| | | | | | | | | | |
Total Other Capital Expenditure | | | | | | | | 6,500 | | |
| | | | | | | | | | |
Capital Grants | | | | | | | | | | |
Transport Infrastructure Development Scheme - Capital Grants | | | | | | | | | | |
Armstrong Beach Road, East of Sarina, widen and reconstruct | | 40 | | 205 | | | | 205 | | |
Aspley State High School, construct indented bus bay | | 05 | | 165 | | | | 165 | | |
Bayswater Road, Dalrymple Road - Duckworth Street, Townsville, upgrade | | 45 | | 710 | | 450 | | 260 | | |
Blackall - Emmet Road, 0 - 8.0km, pave and seal | | 35 | | 1,650 | | | | 1,215 | | 435 |
Bloomfield Road, Cook Shire Granite Creek Section, new bridge crossing | | 50 | | 2,445 | | 1,083 | | 1,362 | | |
Boreen Point - Tin Can Bay Road, East of Gympie, construct to 2 lane sealed standard | | 15 | | 174 | | | | 174 | | |
Boundary Road, Kelliher Road - Garden Road, Brisbane City, construction of 2 lane underpass | | 05 | | 32,804 | | 20,346 | | 12,458 | | |
Bruce Highway overpass (near Gayndah Road), Maryborough, construction of bikeway/footpath | | 15 | | 450 | | 351 | | 99 | | |
Bundaberg Port Access Road, Burnett Heads, construct new road | | 15 | | 1,000 | | 75 | | 925 | | |
Bundamba State School, construct bus set-down and improve parking | | 05 | | 188 | | | | 188 | | |
Chrystal Street open level crossing, Roma Town, construct to 2 lane sealed standard | | 25 | | 150 | | | | 150 | | |
Clermont - Rubyvale Road, Peaks Down Shire, Sections: 63.35 - 69.85km, pave and seal | | 30 | | 207 | | | | 207 | | |
| | | | | | |
| 94 | | Capital Statement 2007-08 | | |
Main Roads
| | | | | | | | | | |
Project | | Statistical
Division | | Total
Estimated
Cost
$’000 | | Expenditure
to 30-06-07
$’000 | | Budget
2007-08 $’000 | | Post
2007-08 |
Cullendore Road, Warwick Shire, Murrays Bridge, rehabilitate and widen | | 20 | | 200 | | | | 200 | | |
Herries Street, Toowoomba Clifford Street - Hume Street, West Creek, replace Bridge | | 05 | | 257 | | 34 | | 223 | | |
Highams Bridge, Mirani, reconstruct | | 40 | | 970 | | 16 | | 954 | | |
Iffley - Taldora Road, Mount Isa City, seal gravelled sections | | 55 | | 1,120 | | | | 475 | | 645 |
Kern Brothers Drive (Stage 2), Thuringowa City, upgrade | | 45 | | 2,900 | | 721 | | 372 | | 1,807 |
Kubin - St Pauls Access Road, 13.60 - 14.50km, Form, pave and seal | | 50 | | 1,600 | | 1,291 | | 309 | | |
Lockhart River Access Road, upgrade drainage, form and gravel | | 50 | | 1,450 | | 900 | | 550 | | |
Main Street, Hervey Bay City, Sections: 1.28 - 2.50 km, realignment | | 15 | | 372 | | | | 250 | | 122 |
Mt Fox Road (Stage 2), Hinchinbrook Shire, bitumen seal | | 45 | | 1,265 | | 120 | | 240 | | 905 |
Mt Stuart - Bedford Weir Road, Broadsound Shire, 6.1 - 13.1km, pave and seal | | 40 | | 219 | | | | 219 | | |
Munbilla Road, Boonah Shire, 3.72 - 5.88km, widen and overlay | | 10 | | 250 | | | | 250 | | |
Multi-modal facility access road, Livingstone Shire, construct access road | | 30 | | 1,750 | | | | 1,750 | | |
Ormeau State School, Gold Coast City, Mirambeena Drive, car parking | | 05 | | 280 | | | | 140 | | 140 |
Pacific Motorway, Logan Road - Logan River, construction of sections of bikeway | | 05 | | 8,000 | | 2,294 | | 2,733 | | 2,973 |
| | | | | | |
| | Capital Statement 2007-08 | | 95 |
Main Roads
| | | | | | | | | | |
Project | | Statistical Division | | Total
Estimated
Cost
$’000 | | Expenditure
to 30-06-07
$’000 | | Budget
2007-08 $’000 | | Post
2007-08 $’000 |
Parkhurst State School, Rockhampton City, construct bus and car set-down area | | 30 | | 280 | | 60 | | 220 | | |
Petrie Creek Road, Dusty Rhodes Bridge, Maroochy Shire, construct new bridge and approaches | | 10 | | 478 | | | | 478 | | |
Pimpama State School, Gold Coast City, Hotham Creek Road, bus set-down and parking improvements | | 10 | | 100 | | | | 100 | | |
Pormpuraaw Access Road, Various sections: 110.0 - 205km, road and drainage upgrading works | | 50 | | 1,605 | | | | 355 | | 1,250 |
Pumicestone Road, Caboolture Shire, construct to 2 lane sealed standard | | 10 | | 800 | | | | 400 | | 400 |
Razorback Road, Montville, construct to 2 lane sealed standard | | 10 | | 451 | | 151 | | 300 | | |
Red Hill Road, Belyando Shire, 14.5 - 16.5km, pave and seal | | 40 | | 223 | | | | 223 | | |
Riversleigh Road, Mount Isa City, improve access | | 55 | | 770 | | | | 430 | | 340 |
Sayers Road, Ayr, bitumen seal | | 45 | | 210 | | 10 | | 200 | | |
Teviot Road, Beaudesert Shire, Hives Road - Olsen Road, reconstruction | | 10 | | 316 | | | | 316 | | |
Townsville Community Learning Centre, car parking | | 45 | | 80 | | | | 80 | | |
Woodlands Road, Laidley Shire, 7.3 - 9.2km, rehabilitate and widen | | 10 | | 220 | | | | 220 | | |
Yaraka - Emmet Road, Isisford Shire, pave and seal | | 35 | | 1,175 | | | | 1,175 | | |
Yaraka - Retreat Road, Barcoo Shire, pave and seal | | 35 | | 2,860 | | | | 2,860 | | |
Yeppoon and Emu Park townships, Livingstone Shire, bikeways | | 30 | | 1,000 | | | | 1,000 | | |
| | | | | | |
| 96 | | Capital Statement 2007-08 | | |
Main Roads
| | | | | | | | | | |
Project | | Statistical
Division | | Total
Estimated
Cost $’000 | | Expenditure
to 30-06-07
$’000 | | Budget
2007-08 $’000 | | Post
2007-08 $’000 |
Yuleba - Taroom Road, Bendemere Shire, 28.70 - 33.70km, construct to single lane sealed standard | | 25 | | 246 | | | | 246 | | |
Other capital grants | | Various | | | | | | 23,308 | | Ongoing |
| | | | | | | | | | |
Sub-total Transport Infrastructure Development Scheme - Capital Grants | | | | | | | | 58,236 | | |
| | | | | | | | | | |
Federal Black Spot | | Various | | | | | | 8,923 | | Ongoing |
| | | | | | | | | | |
Total Capital Grants | | | | | | | | 67,159 | | |
| | | | | | | | | | |
TOTAL DEPARTMENT OF MAIN ROADS | | | | | | | | 2,277,851 | | |
| | | | | | | | | | |
ROADTEK | | | | | | | | | | |
Property, Plant and Equipment | | | | | | | | | | |
Hire plant | | Various | | | | | | 35,049 | | Ongoing |
| | | | | | | | | | |
Total Property, Plant and Equipment | | | | | | | | 35,049 | | |
| | | | | | | | | | |
Other Capital Expenditure | | | | | | | | | | |
Information technology | | Various | | | | | | 85 | | Ongoing |
| | | | | | | | | | |
Total Other Capital Expenditure | | | | | | | | 85 | | |
| | | | | | | | | | |
TOTAL ROADTEK | | | | | | | | 35,134 | | |
| | | | | | | | | | |
QUEENSLAND MOTORWAYS LIMITED | | | | | | | | | | |
Property, Plant and Equipment | | | | | | | | | | |
Gateway Motorway, Gateway Upgrade Project | | 05 | | 1,883,000 | | 619,774 | | 691,166 | | 572,060 |
Logan Motorway, Paradise Road interchange | | 05 | | 36,000 | | 34,500 | | 1,500 | | |
Other | | 05 | | | | | | 12,799 | | Ongoing |
Rehabilitation projects | | 05 | | | | | | 9,050 | | Ongoing |
Sundry roadworks | | 05 | | | | | | 16,700 | | Ongoing |
Toll equipment | | 05 | | | | | | 5,115 | | Ongoing |
| | | | | | | | | | |
Total Property, Plant and Equipment | | | | | | | | 736,330 | | |
| | | | | | | | | | |
TOTAL QUEENSLAND MOTORWAYS LIMITED | | | | | | | | 736,330 | | |
| | | | | | | | | | |
TOTAL MAIN ROADS | | | | | | | | 3,049,315 | | |
| | | | | | | | | | |
| | | | | | |
| | Capital Statement 2007-08 | | 97 |
MINES AND ENERGY
The department’s 2007-08 capital acquisition program of $6.4 million comprises expenditure to support the continuing development of the State’s mining and energy industries including $3 million for construction of the lime dosing water treatment plant for the rehabilitation of the abandoned mine site at Mount Morgan.
CS Energy Limited
A $164.6 million capital expenditure program is planned for 2007-08. This reflects the continued commitment to the ongoing reliability and efficiency of the plant and electricity supply and includes:
| • | | $118.3 million for the completion of the construction of Kogan Creek power station |
| • | | $26 million for improvements to the Callide power station including overhauls |
| • | | $12.2 million for improvements to the Mica Creek power station |
| • | | $8.1 million in the Greater Brisbane region primarily for improvements to the Swanbank power station including overhauls. |
ENERGEX Limited
The regulated electricity capital expenditure program for 2007-08 is $914.3 million. This includes $494.3 million on the sub transmission system, and $340 million augmenting the distribution network. The capital program will match the high growth in electricity usage being driven by a strong Queensland economy and increased use of lifestyle enhancing appliances, such as air conditioners.
The capital works program for 2007-08 will contribute to the improved level of reliability of electricity distribution. Key sub transmission projects include:
| • | | $17.6 million to establish a substation at Myrtletown to ensure a reliable electricity supply to the water recycling plant, Brisbane Airport and significant commercial infrastructure in the area, scheduled for commissioning in December 2008 |
| • | | $10.6 million to install two new underground cables between Crestmead and Browns Plains substation, scheduled for commissioning in March 2008 |
| • | | $8.1 million to install two underground cables between Brendale and Albany Creek substations, scheduled to be commissioned in December 2007 |
| • | | $22.5 million to install two underground cables between Burleigh Heads and Currumbin substations. The work is part of an accelerated program to upgrade supply to the Gold Coast desalination plant |
| | | | | | |
| 98 | | Capital Statement 2007-08 | | |
| • | | $7.9 million to establish a new bulk supply substation at Mudgeeraba, scheduled for commissioning in November 2008. |
Stanwell Corporation Limited
Stanwell Corporation Limited’s expected capital expenditure program for 2007-08 is $69.5 million. This relates to improving the efficiency of existing generation assets at Stanwell, Barron and Kareeya and investment towards new generation. Projects include:
| • | | major overhauls and efficiency upgrades at Stanwell Power Station |
| • | | ongoing capital works at the Kareeya and Barron Gorge Hydro Power Stations |
| • | | investment in the upgrade of information system and infrastructure. |
Tarong Energy Corporation Limited
Tarong Energy’s capital expenditure program (in Queensland) for 2007-08 of $209.3 million relates to securing a long term fuel supply for Tarong Power Station and Tarong North, and maintaining operations at the Tarong Power Station, Tarong North and Wivenhoe Power Stations. Projects include:
| • | | $13.9 million for overhaul expenditure, including one minor overhaul at Tarong Power Station and a major overhaul at both the Tarong North and Wivenhoe Power Stations |
| • | | $10.7 million in relation to the long term ash disposal method project at the Tarong Power Station |
| • | | $9 million for the installation of low NOx burners at the Tarong Power Station to reduce NOx emissions |
| • | | $8.1 million in relation to the control systems replacement project at the Tarong Power Station. |
Powerlink Queensland
Powerlink Queensland is the high voltage electricity transmission entity for Queensland. Powerlink Queensland’s capital expenditure for 2007-08 is $577.4 million and includes:
| • | | $55.8 million to complete a 275kV transmission line between Broadsound and Nebo. This is the first stage of a three-stage solution to reinforce electricity supply to North Queensland |
| • | | $40.1 million for completion of a new 275kV double circuit transmission line between Middle Ridge Substation and Greenbank Substation to help reinforce electricity supply to the major load centres in South East Queensland |
| | | | | | |
| | Capital Statement 2007-08 | | 99 |
| • | | $41.4 million to complete replacement of the existing Kareeya to Innisfail transmission line with a new line between Tully and Innisfail |
| • | | $9.4 million to complete a second 132kV transmission line between Lilyvale and Blackwater. The new line will help meet increasing electricity demand due to the significant expansion of coal mining in the region |
| • | | $63.6 million to construct a 275kV transmission line between Nebo and Strathmore Substations, to be completed summer 2008-09, the second stage of a three-stage solution to reinforce electricity supply to North Queensland. |
Ergon Energy Corporation Limited
Ergon Energy is undertaking large capital expansion, reinforcement, and maintenance and modernisation programs within a long term strategic plan which targets significant service quality, reliability, availability and capacity improvements. A particular focus will be given to delivery of priority projects and improving the cycle times for customer initiated capital works. During 2007-08, Ergon Energy has a budgeted capital expenditure of $823.6 million, including:
| • | | $27.5 million for the reinforcement of supply to Cairns North |
| • | | $20.7 million to reinforce the 132kV supply to Maryborough and Hervey Bay |
| • | | $14.5 million for customer initiated works at Dalrymple Bay/Hay Point coal terminals |
| • | | $16.2 million for the reinforcement of supply to Agnes Waters |
| • | | $17.9 million for reinforcement of supply to North Mackay |
| • | | $13.9 million for the reinforcement of supply to Dalby Transmission Substation |
| • | | $11.9 million for the reinforcement of supply to Warwick 110 kV line works |
| • | | $9.7 million for the reinforcement of supply to Bundaberg |
| • | | $10.2 million for the reinforcement of supply to North Rockhampton |
| • | $8.6 million for customer initiated work for Monto Minerals |
| • | | $19.6 million for the reinforcement of supply to Townsville. |
| | | | | | |
| 100 | | Capital Statement 2007-08 | | |
Mines and Energy
| | | | | | | | | | |
Project | | Statistical
Division | | Total
Estimated
Cost $’000 | | Expenditure
to 30-06-07
$’000 | | Budget
2007-08 $’000 | | Post
2007-08 $’000 |
DEPARTMENT OF MINES AND ENERGY | | | | | | | | | | |
| | | | | |
Property, Plant and Equipment | | | | | | | | | | |
Non commercial water assets | | Various | | 259 | | | | 259 | | |
Stage 2 Lime Dosing Plant | | 30 | | 3,000 | | | | 3,000 | | |
Building and Accommodation upgrades | | | | | | | | | | |
Explosives Reserves upgrade | | 20 | | 2,934 | | 2,648 | | 286 | | |
Minor works | | Various | | | | | | 1,387 | | Ongoing |
Plant and equipment - general | | Various | | | | | | 992 | | Ongoing |
| | | | | | | | | | |
| | | | | |
Total Property, Plant and Equipment | | | | | | | | 5,924 | | |
| | | | | | | | | | |
| | | | | |
Other Capital Expenditure | | | | | | | | | | |
Systems developments | | 05 | | | | | | 455 | | Ongoing |
| | | | | | | | | | |
| | | | | |
Total Other Capital Expenditure | | | | | | | | 455 | | |
| | | | | | | | | | |
| | | | | |
TOTAL DEPARTMENT OF MINES AND ENERGY | | | | | | | | 6,379 | | |
| | | | | | | | | | |
| | | | | |
CS ENERGY LIMITED | | | | | | | | | | |
| | | | | |
Property, Plant and Equipment | | | | | | | | | | |
Callide Power Station | | 30 | | | | | | 26,025 | | Ongoing |
Swanbank Power Station | | 05 | | | | | | 7,585 | | Ongoing |
Mica Creek Power Station | | 55 | | | | | | 12,172 | | Ongoing |
Kogan Creek Power Project | | 20 | | 1,162,192 | | 1,043,859 | | 118,333 | | |
Business development/other | | 05 | | | | | | 501 | | Ongoing |
| | | | | | | | | | |
| | | | | |
Total Property, Plant and Equipment | | | | | | | | 164,616 | | |
| | | | | | | | | | |
| | | | | |
TOTAL CS ENERGY LIMITED | | | | | | | | 164,616 | | |
| | | | | | | | | | |
| | | | | |
ENERGEX LIMITED | | | | | | | | | | |
| | | | | |
Property, Plant and Equipment | | | | | | | | | | |
Distribution augmentation | | | | | | | | | | |
Brisbane | | 05 | | | | | | 152,678 | | Ongoing |
Moreton | | 10 | | | | | | 178,520 | | Ongoing |
Wide Bay Burnett | | 15 | | | | | | 8,841 | | Ongoing |
| | | | | | | | | | |
Sub-total Distribution augmentation | | | | | | | | 340,039 | | |
| | | | | | | | | | |
| | | | | | |
| | Capital Statement 2007-08 | | 101 |
Mines and Energy
| | | | | | | | | | |
Project | | Statistical
Division | | Total
Estimated
Cost
$’000 | | Expenditure
to 30-06-07
$’000 | | Budget
2007-08 $’000 | | Post
2007-08 $’000 |
Sub transmission program | | | | | | | | | | |
Underground cables between Burleigh Heads and Currumbin substations | | 10 | | 25,891 | | 3,059 | | 22,509 | | 323 |
Upgrade Gaven substation | | 10 | | 16,878 | | 431 | | 14,082 | | 2,365 |
New bulk supply substation at Mudgeeraba | | 10 | | 9,201 | | 405 | | 7,905 | | 891 |
New substation at Perigean | | 10 | | 4,994 | | 2,261 | | 2,732 | | 1 |
Replace underground cables between Annerley and Tennyson | | 05 | | 9,886 | | 469 | | 8,199 | | 1,218 |
Underground cables between Crestmead and Browns Plains substations | | 05 | | 11,481 | | 854 | | 10,561 | | 66 |
New underground cables between Brendale and Albany Creek substations | | 05 | | 8,755 | | 655 | | 8,100 | | |
New bulk supply substation at Myrtletown | | 05 | | 19,466 | | 928 | | 17,634 | | 904 |
Other sub transmission works | | Various | | | | | | 402,534 | | Ongoing |
| | | | | | | | | | |
Sub-total Sub transmission program | | | | | | | | 494,256 | | |
| | | | | | | | | | |
Non system | | | | | | | | | | |
Fleet | | 05 | | | | | | 31,816 | | Ongoing |
Other | | 05 | | | | | | 48,211 | | Ongoing |
| | | | | | | | | | |
Sub-total Non system | | | | | | | | 80,027 | | |
| | | | | | | | | | |
Total Property, Plant and Equipment | | | | | | | | 914,322 | | |
| | | | | | | | | | |
TOTAL ENERGEX LIMITED | | | | | | | | 914,322 | | |
| | | | | | | | | | |
STANWELL CORPORATION LIMITED | | | | | | | | | | |
| | | | | |
Property, Plant and Equipment | | | | | | | | | | |
Windy Hill minor works | | 50 | | 82 | | | | 5 | | 77 |
Wivenhoe Hydro minor works | | 20 | | 35 | | | | 35 | | |
Koombooloomba minor works | | 50 | | 115 | | | | 115 | | |
Mackay Gas Turbine minor works | | 40 | | 90 | | | | 90 | | |
Corporate | | Various | | | | | | 15,962 | | Ongoing |
Kareeya | | | | | | | | | | |
Capital works and modifications | | 50 | | 8,192 | | 242 | | 7,950 | | |
Minor works | | 50 | | | | | | 566 | | Ongoing |
| | | | | | |
| 102 | | Capital Statement 2007-08 | | |
Mines and Energy
| | | | | | | | | | |
Project | | Statistical
Division | | Total
Estimated
Cost
$’000 | | Expenditure
to 30-06-07
$’000 | | Budget
2007-08 $’000 | | Post
2007-08 $’000 |
Barron Gorge | | | | | | | | | | |
Capital works and modifications | | 50 | | 6,772 | | 25 | | 1,115 | | 5,632 |
Minor works | | 50 | | | | | | 593 | | Ongoing |
Stanwell Power Station | | | | | | | | | | |
Capital works and modifications | | 30 | | | | | | 35,739 | | Ongoing |
Stanwell Power Station minor works | | 30 | | | | | | 7,363 | | Ongoing |
| | | | | | | | | | |
Total Property, Plant and Equipment | | | | | | | | 69,533 | | |
| | | | | | | | | | |
TOTAL STANWELL CORPORATION LIMITED | | | | | | | | 69,533 | | |
| | | | | | | | | | |
TARONG ENERGY CORPORATION LIMITED | | | | | | | | | | |
| | | | | |
Property, Plant and Equipment | | | | | | | | | | |
Tarong Power Station | | | | | | | | | | |
Above ground ash emplacement on adjacent TPS land | | 15 | | 17,688 | | 4,155 | | 10,746 | | 2,787 |
Operations project initiatives | | 15 | | | | | | 2,520 | | Ongoing |
Overhaul - Tarong Power Station | | 15 | | | | | | 4,739 | | Ongoing |
Control System refit | | 15 | | 48,982 | | 703 | | 8,143 | | 40,136 |
Low Nox Burners | | 15 | | 34,333 | | 1,194 | | 9,043 | | 24,096 |
Optimise dense phase ash production and storage | | 15 | | 3,984 | | 1,216 | | 2,768 | | |
TPS modification for fuel resource | | 15 | | 55,587 | | 3,119 | | 1,990 | | 50,478 |
Coal Plant operational improvements | | 15 | | 2,298 | | 111 | | 1,907 | | 280 |
Tarong Field Device upgrade | | 15 | | 4,509 | | 1,560 | | 1,362 | | 1,587 |
Replace Unit 2 generator | | 15 | | 22,171 | | 18,235 | | 3,936 | | |
Spare generator rotor refurbishment | | 15 | | 2,301 | | 11 | | 2,290 | | |
Minor capital works | | 15 | | | | | | 3,473 | | Ongoing |
Other capital works | | 15 | | 37,704 | | 4,739 | | 7,288 | | 25,677 |
| | | | | | | | | | |
Sub-total Tarong Power Station | | | | | | | | 60,205 | | |
| | | | | | | | | | |
Wivenhoe Power Station | | | | | | | | | | |
New Wivenhoe generator transformer | | 20 | | 10,096 | | 3,689 | | 4,802 | | 1,605 |
Overhaul - Wivenhoe Power Station | | 20 | | | | | | 2,739 | | Ongoing |
| | | | | | |
| | Capital Statement 2007-08 | | 103 |
Mines and Energy
| | | | | | | | | | |
Project | | Statistical
Division | | Total
Estimated
Cost
$’000 | | Expenditure
to 30-06-07
$’000 | | Budget
2007-08 $’000 | | Post
2007-08 $’000 |
Wivenhoe Main Transformer environment risk mitigation | | 20 | | 912 | | 1 | | 595 | | 316 |
Minor capital works - Wivenhoe Power Station | | 20 | | | | | | 752 | | Ongoing |
| | | | | | | | | | |
Sub-total Wivenhoe Power Station | | | | | | | | 8,888 | | |
| | | | | | | | | | |
Tarong North Power Station | | | | | | | | | | |
Tarong North overhaul | | 15 | | | | | | 6,420 | | Ongoing |
Minor capital works - Tarong North | | 15 | | | | | | 1,816 | | Ongoing |
| | | | | | | | | | |
Sub-total Tarong North Power Station | | | | | | | | 8,236 | | |
| | | | | | | | | | |
Fuel Strategy - Coal Supply | | 15 | | 825,617 | | 234,378 | | 125,771 | | 465,468 |
Corporate projects and minor works | | Various | | | | | | 6,164 | | Ongoing |
| | | | | | | | | | |
Total Property, Plant and Equipment | | | | | | | | 209,264 | | |
| | | | | | | | | | |
TOTAL TARONG ENERGY CORPORATION LIMITED | | | | | | | | 209,264 | | |
| | | | | | | | | | |
POWERLINK QUEENSLAND | | | | | | | | | | |
| | | | | |
Property, Plant and Equipment | | | | | | | | | | |
Greenbank Static VAR compensator | | 05 | | 35,300 | | 200 | | 10,000 | | 25,100 |
SVC 132kV Rail Secondary System refurbishment | | Various | | 35,000 | | 19,237 | | 13,700 | | 2,063 |
Ross - Townsville South 132kV reinforcement | | 45 | | 19,000 | | 9,600 | | 9,400 | | |
Bohle River to Townsville GT 132kV line | | 45 | | 23,400 | | 16,900 | | 6,500 | | |
Nebo to Strathmore | | 40 | | 145,400 | | 3,547 | | 63,600 | | 78,253 |
Nebo to Pioneer Valley | | 40 | | 51,400 | | 37,100 | | 14,300 | | |
Tully - Innisfail 132kV transmission line | | 50 | | 68,000 | | 26,600 | | 41,400 | | |
South Pine 110kV Substation refurbishment - Stage 1 | | 05 | | 53,000 | | 3,062 | | 7,400 | | 42,538 |
Ross to Yabulu South | | 45 | | 46,500 | | 2,064 | | 31,200 | | 13,236 |
Middle Ridge - Greenbank | | Various | | 131,000 | | 90,900 | | 40,100 | | |
Townsville East Substation establishment | | 45 | | 26,800 | | 13,100 | | 13,700 | | |
West Darra Switchyard rebuild | | 05 | | 27,299 | | 10,682 | | 10,400 | | 6,217 |
Innisfail - Edmonton Line replacement | | 50 | | 83,200 | | 24 | | 20,000 | | 63,176 |
| | | | | | |
| 104 | | Capital Statement 2007-08 | | |
Mines and Energy
| | | | | | | | | | |
Project | | Statistical
Division | | Total
Estimated
Cost
$’000 | | Expenditure
to 30-06-07
$’000 | | Budget
2007-08 $’000 | | Post
2007-08 $’000 |
Belmont 110kV Substation refurbishment | | 05 | | 46,500 | | 1,363 | | 9,200 | | 35,937 |
Broadsound to Nebo | | 40 | | 100,300 | | 44,500 | | 55,800 | | |
Teebar Creek Substation establishment | | 15 | | 41,300 | | 26,700 | | 14,600 | | |
Lilyvale - Blackwater 132kV transmission line | | Various | | 33,300 | | 23,900 | | 9,400 | | |
Bouldercombe to Pandoin | | 30 | | 44,100 | | 22 | | 7,000 | | 37,078 |
Abermain 275kV Substation establishment | | 05 | | 23,300 | | 7,522 | | 13,300 | | 2,478 |
Tarong 275kV Substation refurbishment | | 15 | | 24,900 | | 15,800 | | 9,100 | | |
Strathmore 275kV SVC | | 40 | | 50,500 | | 23,100 | | 27,400 | | |
Woolooga SVC | | 15 | | 38,500 | | | | 10,000 | | 28,500 |
Other projects | | Various | | 139,900 | | | | 139,900 | | |
| | | | | | | | | | |
Total Property, Plant and Equipment | | | | | | | | 577,400 | | |
| | | | | | | | | | |
TOTAL POWERLINK QUEENSLAND | | | | | | | | 577,400 | | |
| | | | | | | | | | |
ENERTRADE | | | | | | | | | | |
Property, Plant and Equipment | | | | | | | | | | |
Minor works1 | | 05 | | 1,242 | | | | 1,242 | | |
| | | | | | | | | | |
Total Property, Plant and Equipment | | | | | | | | 1,242 | | |
| | | | | | | | | | |
Other Capital Expenditure | | | | | | | | | | |
Minor works - software1 | | 05 | | 462 | | | | 462 | | |
| | | | | | | | | | |
Total Other Capital Expenditure | | | | | | | | 462 | | |
| | | | | | | | | | |
TOTAL ENERTRADE | | | | | | | | 1,704 | | |
| | | | | | | | | | |
ERGON ENERGY CORPORATION LIMITED | | | | | | | | | | |
| | | | | |
Property, Plant and Equipment | | | | | | | | | | |
System Related | | | | | | | | | | |
Corporation Initiated Works | | | | | | | | | | |
Reinforcement of supply | | | | | | | | | | |
Cairns North | | 50 | | 32,800 | | 5,298 | | 27,502 | | |
Townsville | | 45 | | 35,930 | | 560 | | 19,561 | | 15,809 |
North Mackay | | Various | | 40,600 | | 417 | | 17,925 | | 22,258 |
| | | | | | |
| | Capital Statement 2007-08 | | 105 |
| | | | | | | | | | |
Mines and Energy |
Project | | Statistical Division | | Total Estimated Cost $’000 | | Expenditure to 30-06-07 $’000 | | Budget 2007-08 $’000 | | Post 2007-08 $’000 |
Agnes Water | | 30 | | 48,000 | | 20,890 | | 16,208 | | 10,902 |
North Rockhampton | | 30 | | 18,500 | | 2,078 | | 10,150 | | 6,272 |
Yeppoon | | 30 | | 15,500 | | 214 | | 4,136 | | 11,150 |
Maryborough/Hervey Bay | | 15 | | 45,000 | | 18,599 | | 20,701 | | 5,700 |
Bundaberg | | 15 | | 21,500 | | 298 | | 9,681 | | 11,521 |
Toowoomba | | 20 | | 37,000 | | 10,496 | | 8,064 | | 18,440 |
Dalby | | 20 | | 32,400 | | 1,058 | | 13,942 | | 17,400 |
Warwick | | 20 | | 27,600 | | 44 | | 11,924 | | 15,632 |
Other Corporation initiated works | | Various | | | | | | 242,009 | | Ongoing |
| | | | | | | | | | |
Sub-total Corporation Initiated Works | | | | | | | | 401,803 | | |
| | | | | | | | | | |
Customer initiated works | | | | | | | | | | |
Major Customer | | | | | | | | | | |
QGC | | Various | | 14,000 | | 113 | | 4,652 | | 9,235 |
Monto Minerals | | 15 | | 8,650 | | 50 | | 8,600 | | |
Dalrymple Bay/Hay Point | | 40 | | 28,500 | | 211 | | 14,500 | | 13,789 |
Other customer initiated works | | Various | | | | | | 191,948 | | Ongoing |
Isolated Systems | | | | | | | | | | |
Powerstations development | | 50 | | 25,100 | | 13,350 | | 10,105 | | 1,645 |
Other isolated systems | | Various | | | | | | 14,896 | | Ongoing |
| | | | | | | | | | |
Sub-total Isolated Systems | | | | | | | | 25,001 | | |
| | | | | | | | | | |
Sub-total System Related | | | | | | | | 646,504 | | |
| | | | | | | | | | |
Other Regulated Asset Additions Sundry other regulated | | Various | | | | | | 176,344 | | Ongoing |
| | | | | | | | | | |
Sub-total Other Regulated Asset Additions | | | | | | | | 176,344 | | |
| | | | | | | | | | |
Non-Regulated Asset Additions Sundry non-regulated asset additions | | Various | | | | | | 783 | | Ongoing |
| | | | | | | | | | |
Sub-total Non-Regulated Asset Additions | | | | | | | | 783 | | |
| | | | | | | | | | |
Total Property, Plant and Equipment | | | | | | | | 823,631 | | |
| | | | | | | | | | |
TOTAL ERGON ENERGY CORPORATION LIMITED | | | | | | | | 823,631 | | |
| | | | | | | | | | |
TOTAL MINES AND ENERGY | | | | | | | | 2,766,849 | | |
| | | | | | | | | | |
Note:
| 1. | Enertrade will cease operating by 30 September 2007. Details of the allocation of Enertrade’s assets and capital expenditure to other Government-owned corporations are yet to be determined. |
| | | | | | |
| 106 | | Capital Statement 2007-08 | | |
NATURAL RESOURCES AND WATER
Capital acquisitions for the Natural Resources and Water portfolio (including the department, SunWater and various water boards) in 2007-08 is $83.4 million. A further $30.3 million is budgeted for departmental capital grant payments in relation to dam upgrades. The department’s 2007-08 capital acquisition program of $24.1 million principally comprises expenditure to support the planning and management of the State’s land, water and native vegetation resources.
Program Highlights
| • | | Water security, particularly in South East Queensland, is a critical issue. The acquisitions of land for future water infrastructure projects will continue with $4.9 million set aside in 2007-08 for strategic land purchases. |
| • | | The program of dam upgrades will continue in 2007-08 with $15.1 million provided for the upgrade of the Ross River Dam and $15.2 million for other dam spillway upgrades. |
| • | | Capital funding of $3.5 million is provided in 2007-08 for extensive modifications to the Land Tenure Ledger to facilitate the introduction of an enhanced rental system which will establish more targeted and equitable arrangements for dealing with large movements in land values and drought hardship relief. |
| • | | For Queensland, the possible impacts of climate change are significant and could potentially have serious consequences for the State’s economy, communities and environment. In 2007-08 the Queensland Climate Change Centre of Excellence will be established to bring a strategic whole-of-Government focus to climate change. Included in the funding to establish the Centre is $ 1.5 million for the acquisition of scientific computer equipment. |
The Gladstone Area Water Board’s capital budget is $27.2 million for 2007-08. Major projects include preliminary works for a new pipeline from the Fitzroy River to the Gladstone region ($19.6 million), upgrade of Yarwun Water Treatment Plant ($1.8 million), and upgrade of pipelines ($1.1 million).
In 2007-08 the Mount Isa Water Board’s capital budget is $17.2 million. Major projects include the Mount Isa Terminal Reservoir Pump Station upgrade ($12.7 million) and Lake Moondarra pipeline upgrade ($1.7 million).
SunWater’s capital budget of $14.6 million for 2007-08 is primarily focused on refurbishment and enhancement of existing assets. Projects include spillway upgrades to the Bjelke-Petersen Dam (Barker Barambah Scheme) and the Borumba Dam (Mary Valley Scheme) costing $2.6 million and $2.2 million respectively.
| | | | | | |
| | Capital Statement 2007-08 | | 107 |
| | | | | | | | | | |
Natural Resources and Water |
Project | | Statistical Division | | Total Estimated Cost $’000 | | Expenditure to 30-06-07 $’000 | | Budget 2007-08 $’000 | | Post 2007-08 $’000 |
DEPARTMENT OF NATURAL RESOURCES AND WATER | | | | | | | | | | |
| | | | | |
Property, Plant and Equipment | | | | | | | | | | |
Land Acquisitions | | | | | | | | | | |
New dams on Logan and Mary Rivers | | Various | | | | | | 4,900 | | Ongoing |
Land development and GLMS | | 05 | | | | | | 2,100 | | Ongoing |
Building and accommodation upgrades | | Various | | | | | | 3,091 | | Ongoing |
Non-commercial water assets | | Various | | | | | | 925 | | Ongoing |
Plant and Equipment | | | | | | | | | | |
Climate Change Centre of Excellence - capacity building | | 05 | | 1,500 | | | | 1,500 | | |
Water Reform - continuity of supply | | 05 | | | | | | 1,000 | | Ongoing |
Other plant and equipment | | Various | | | | | | 2,028 | | Ongoing |
| | | | | | | | | | |
Total Property, Plant and Equipment | | | | | | | | 15,544 | | |
| | | | | | | | | | |
| | | | | |
Other Capital Expenditure | | | | | | | | | | |
Land Tenure Ledger replacement project | | 05 | | 3,800 | | | | 3,500 | | 300 |
Integrated Urban Water Management Policy and Regulatory Framework | | 05 | | | | | | 500 | | Ongoing |
Other systems development | | 05 | | | | | | 4,545 | | Ongoing |
| | | | | | | | | | |
Total Other Capital Expenditure | | | | | | | | 8,545 | | |
| | | | | | | | | | |
| | | | | |
Capital Grants | | | | | | | | | | |
Ross River Dam modernisation | | 45 | | 80,204 | | 65,112 | | 15,092 | | |
Dam spillway upgrades | | Various | | 84,252 | | 33,040 | | 15,172 | | 36,040 |
| | | | | | | | | | |
Total Capital Grants | | | | | | | | 30,264 | | |
| | | | | | | | | | |
TOTAL DEPARTMENT OF NATURAL RESOURCES AND WATER | | 54,353 | | |
| | | | | | | | | | |
| | | | | |
GLADSTONE AREA WATER BOARD | | | | | | | | | | |
| | | | | |
Property, Plant and Equipment | | | | | | | | | | |
Fitzroy Pipeline project | | 30 | | 350,000 | | | | 19,600 | | 330,400 |
Yarwun Water Treatment Plant upgrade | | 30 | | 1,750 | | | | 1,750 | | |
Awoonga Dam projects | | 30 | | 502 | | | | 502 | | |
Awoonga Dam Power Supply upgrade | | 30 | | 575 | | | | 575 | | |
| | | | | | |
| 108 | | Capital Statement 2007-08 | | |
| | | | | | | | | | |
Natural Resources and Water |
Project | | Statistical Division | | Total Estimated Cost $’000 | | Expenditure to 30-06-07 $’000 | | Budget 2007-08 $’000 | | Post 2007-08 $’000 |
Gladstone Water Treatment Plant upgrade | | 30 | | 771 | | | | 771 | | |
Above ground asset replacement | | 30 | | | | | | 100 | | Ongoing |
Control Systems upgrade | | 30 | | | | | | 340 | | Ongoing |
Telemetry System upgrade | | 30 | | 470 | | | | 470 | | |
Pipelines upgrade | | 30 | | 1,110 | | | | 1,110 | | |
Toolooa to Boyne Island Pipelines - relocation | | 30 | | 4,600 | | | | 250 | | 4,350 |
Other minor works | | 30 | | | | | | 1,761 | | Ongoing |
| | | | | | | | | | |
Total Property, Plant and Equipment | | | | | | | | 27,229 | | |
| | | | | | | | | | |
TOTAL GLADSTONE AREA WATER | | | | | | | | 27,229 | | |
| | | | | | | | | | |
| | | | | |
MOUNT ISA WATER BOARD | | | | | | | | | | |
| | | | | |
Property, Plant and Equipment | | | | | | | | | | |
Mount Isa Terminal Reservoir Pump Station upgrade | | 55 | | 16,700 | | 4,003 | | 12,697 | | |
Recreation Reserve R48 facilities upgrade | | 55 | | | | | | 300 | | Ongoing |
Control system upgrade | | 55 | | | | | | 250 | | Ongoing |
Lake Julius power distribution lines upgrade | | 55 | | | | | | 225 | | Ongoing |
Lake Moondarra Pipeline (Stages 1, 1A & 2) | | 55 | | 2,685 | | 940 | | 1,745 | | |
Bottled water plant | | 55 | | 474 | | 24 | | 450 | | |
Pipeline land easements | | 55 | | 554 | | 434 | | 120 | | |
Minor acquisitions | | 55 | | | | | | 150 | | Ongoing |
Other minor works | | 55 | | 2,229 | | 965 | | 1,264 | | |
| | | | | | | | | | |
Total Property, Plant and Equipment | | | | | | | | 17,201 | | |
| | | | | | | | | | |
TOTAL MOUNT ISA WATER BOARD | | | | | | | | 17,201 | | |
| | | | | | | | | | |
| | | | | |
SUNWATER | | | | | | | | | | |
| | | | | |
Property, Plant and Equipment | | | | | | | | | | |
Refurbishment and Enhancement (water supply schemes) | | | | | | | | | | |
Pioneer River | | 40 | | | | | | 580 | | Ongoing |
Eton | | 40 | | | | | | 263 | | Ongoing |
| | | | | | |
| | Capital Statement 2007-08 | | 109 |
| | | | | | | | | | |
Natural Resources and Water |
Project | | Statistical Division | | Total Estimated Cost $’000 | | Expenditure to 30-06-07 $’000 | | Budget 2007-08 $’000 | | Post 2007-08 $’000 |
Awoonga Callide | | 30 | | | | | | 522 | | Ongoing |
Bowen Broken | | 40 | | | | | | 353 | | Ongoing |
Barker Barambah | | 15 | | | | | | 2,575 | | Ongoing |
Bundaberg | | 15 | | | | | | 903 | | Ongoing |
Burdekin Haughton | | Various | | | | | | 578 | | Ongoing |
Mareeba Dimbulah | | 50 | | | | | | 798 | | Ongoing |
Mary Valley | | 15 | | | | | | 2,223 | | Ongoing |
Nogoa Mackenzie | | 30 | | | | | | 400 | | Ongoing |
Other schemes < $250K | | Various | | | | | | 1,225 | | Ongoing |
| | | | | | | | | | |
Sub-total Refurbishment and Enhancement (water supply schemes) | | 10,420 | | |
| | | | | | | | | | |
Minor Works | | | | | | | | | | |
Hardware and software development | | 05 | | | | | | 2,097 | | Ongoing |
Non-scheme < $250K | | Various | | | | | | 1,043 | | Ongoing |
Software development (water mgt) | | 05 | | | | | | 1,010 | | Ongoing |
| | | | | | | | | | |
Sub-total Minor Works | | | | | | | | 4,150 | | |
| | | | | | | | | | |
Total Property, Plant and Equipment | | | | | | | | 14,570 | | |
| | | | | | | | | | |
TOTAL SUNWATER | | | | | | | | 14,570 | | |
| | | | | | | | | | |
| | | | | |
BURNETT WATER | | | | | | | | | | |
| | | | | |
Property, Plant and Equipment | | | | | | | | | | |
Refurbishment and enhancement | | 15 | | | | | | 350 | | Ongoing |
| | | | | | | | | | |
Total Property, Plant and Equipment | | | | | | | | 350 | | |
| | | | | | | | | | |
TOTAL BURNETT WATER | | | | | | | | 350 | | |
| | | | | | | | | | |
TOTAL NATURAL RESOURCES AND WATER | | | | | | | | 113,703 | | |
| | | | | | | | | | |
| | | | | | |
| 110 | | Capital Statement 2007-08 | | |
OFFICE OF THE GOVERNOR
During 2007-08 the Office of the Governor will expend $0.035 million towards capital replacements including vehicles and office equipment.
Ongoing replacement of capital items enables the Governor to undertake the full range of duties expected of the Head of State, including those that promote and support whole-of-Government priorities.
Office of the Governor
| | | | | | | | | | |
Project | | Statistical Division | | Total Estimated Cost $’000 | | Expenditure to 30-06-07 $’000 | | Budget 2007-08 $’000 | | Post 2007-08 $’000 |
OFFICE OF THE GOVERNOR | | | | | | | | | | |
| | | | | |
Property, Plant and Equipment | | | | | | | | | | |
Asset replacement | | 05 | | | | | | 35 | | Ongoing |
| | | | | | | | | | |
Total Property, Plant and Equipment | | | | | | | | 35 | | |
| | | | | | | | | | |
TOTAL OFFICE OF THE GOVERNOR | | | | | | | | 35 | | |
| | | | | | | | | | |
| | | | | | |
| | Capital Statement 2007-08 | | 111 |
OFFICE OF THE OMBUDSMAN
Capital funding of $0.08 million is provided in 2007-08 for the provision of office and information technology tools to enable investigative staff to review complaints.
Office of the Ombudsman
| | | | | | | | | | |
Project | | Statistical Division | | Total Estimated Cost $’000 | | Expenditure to 30-06-07 $’000 | | Budget 2007-08 $’000 | | Post 2007-08 $’000 |
OFFICE OF THE OMBUDSMAN | | | | | | | | | | |
| | | | | |
Property, Plant and Equipment | | | | | | | | | | |
Computer equipment | | 05 | | | | | | 60 | | Ongoing |
Office equipment | | 05 | | | | | | 20 | | Ongoing |
| | | | | | | | | | |
Total Property, Plant and Equipment | | | | | | | | 80 | | |
| | | | | | | | | | |
TOTAL OFFICE OF THE OMBUDSMAN | | | | | | | | 80 | | |
| | | | | | | | | | |
| | | | | | |
| 112 | | Capital Statement 2007-08 | | |
OFFICE OF THE PUBLIC SERVICE COMMISSIONER
In 2007-08 the Office will focus on the challenges, opportunities and future directions of the Queensland Public Service. A key focus will be on developing a culture and regulatory environment which increases the attractiveness of the Queensland Public Service as an employer.
The Office will continue to work in partnership with agencies to deliver strategies and activities that support individual, organisational and whole-of-Government capability.
Accordingly, the Office’s capital acquisition plan, amounting to $0.014 million in 2007-08, focuses on the replacement of computer and office equipment required to efficiently provide these results.
Office of the Public Service Commissioner
| | | | | | | | | | |
Project | | Statistical Division | | Total Estimated Cost $’000 | | Expenditure to 30-06-07 $’000 | | Budget 2007-08 $’000 | | Post 2007-08 $’000 |
OFFICE OF THE PUBLIC SERVICE COMMISSIONER | | | | | | | | | | |
| | | | | |
Property, Plant and Equipment | | | | | | | | | | |
Asset replacement program | | 05 | | | | | | 14 | | Ongoing |
| | | | | | | | | | |
Total Property, Plant and Equipment | | | | | | | | 14 | | |
| | | | | | | | | | |
TOTAL OFFICE OF THE PUBLIC SERVICE COMMISSIONER | | 14 | | |
| | | | | | | | | | |
| | | | | | |
| | Capital Statement 2007-08 | | 113 |
POLICE
The delivery of effective policing services to the community of Queensland requires the establishment and maintenance of appropriate infrastructure. The Queensland Police Service capital program encompasses a strategic approach that focuses on designing, constructing and maintaining facilities, information technology and other equipment needs. An allocation of $258 million in 2007-08 will enable the Service to progress the following key projects.
Program Highlights
| • | | $102.3 million is provided to construct new and replacement facilities and to plan for future facilities identified in the Queensland Police Service Ten-Year Capital Investment Strategic Plan. |
| • | | $69.2 million is provided for information management and relates to projects identified in the Information Strategic Plan 2001-10, including the Public Safety Network (PSN) and Queensland Police Records and Information Management Exchange (QPR1ME). |
| • | | $6.6 million is provided for vessel purchases, upgrades, and outfitting. The ongoing water vessels program provides the facilities to meet enhanced service delivery requirements. |
| • | | $79.9 million is provided to support the purchase of other plant and equipment including motor vehicles, communications, and resource support for growth in police numbers. |
Police
| | | | | | | | | | |
Project | | Statistical Division | | Total Estimated Cost $’000 | | Expenditure to 30-06-07 $’000 | | Budget 2007-08 $’000 | | Post 2007-08 $’000 |
QUEENSLAND POLICE SERVICE | | | | | | | | | | |
| | | | | |
Property, Plant and Equipment | | | | | | | | | | |
Major Capital* | | | | | | | | | | |
Ayr - replacement police station and watchhouse | | 45 | | 7,787 | | 817 | | 6,885 | | 85 |
Beenleigh - police station refurbishment | | 10 | | 2,600 | | 100 | | 2,300 | | 200 |
Bribie Island - police station upgrade | | 10 | | 2,000 | | 150 | | 1,700 | | 150 |
Brisbane West - replacement district headquarters | | 05 | | 1,300 | | 1,000 | | 300 | | |
| | | | | | |
| 114 | | Capital Statement 2007-08 | | |
Police
| | | | | | | | | | |
Project | | Statistical Division | | Total Estimated Cost $’000 | | Expenditure to 30-06-07 $’000 | | Budget 2007-08 $’000 | | Post 2007-08 $’000 |
Caboolture - district headquarters | | 05 | | 9,500 | | 350 | | 2,500 | | 6,650 |
Caboolture - police station and watchhouse extensions | | 05 | | 1,917 | | 717 | | 1,200 | | |
Camp Hill - replacement police station | | 05 | | 2,500 | | | | 2,500 | | |
Carseldine - new police station | | 05 | | 8,400 | | 50 | | 2,150 | | 6,200 |
Charleville - replacement district headquarters and watchhouse | | 25 | | 5,000 | | 150 | | 1,500 | | 3,350 |
Cloncurry - replacement police station | | 55 | | 4,972 | | 1,122 | | 3,850 | | |
Coomera - district office | | 10 | | 10,700 | | 50 | | 3,650 | | 7,000 |
Crestmead/Marsden - new police station | | 05 | | 4,600 | | | | 100 | | 4,500 |
Fortitude Valley - replacement police station | | 05 | | 16,886 | | 1,589 | | 12,887 | | 2,410 |
Holland Park - replacement police station | | 05 | | 6,900 | | 500 | | 1,600 | | 4,800 |
Ipswich - replacement police station | | 05 | | 18,970 | | 2,096 | | 6,700 | | 10,174 |
Kawana - replacement Water Police facility | | 10 | | 3,000 | | | | 500 | | 2,500 |
Kirwan - police station upgrade | | 45 | | 1,818 | | 1,708 | | 110 | | |
Longreach - police station refurbishment | | 35 | | 1,163 | | 50 | | 1,113 | | |
Macleay Island - new police station | | 05 | | 750 | | 350 | | 400 | | |
Mango Hill (Northlakes) - new police station | | 05 | | 5,500 | | 500 | | 800 | | 4,200 |
Mareeba - replacement police station and watchhouse | | 50 | | 10,237 | | 507 | | 700 | | 9,030 |
Mudgeeraba - police station upgrade | | 10 | | 1,500 | | 150 | | 750 | | 600 |
Murgon - replacement police station/watchhouse | | 15 | | 3,500 | | | | 400 | | 3,100 |
Port Douglas - replacement police station | | 50 | | 3,000 | | 150 | | 1,000 | | 1,850 |
Reedy Creek - new police station | | 10 | | 4,000 | | | | 100 | | 3,900 |
Sippy Downs - new police station | | 10 | | 5,502 | | 502 | | 600 | | 4,400 |
Smithfield - police station upgrade | | 50 | | 1,500 | | 100 | | 700 | | 700 |
Springfield - new police station | | 05 | | 5,400 | | | | 1,000 | | 4,400 |
Strathpine - new watchhouse | | 05 | | 6,698 | | 4,098 | | 1,300 | | 1,300 |
Stuart - replacement police station | | 45 | | 5,363 | | 763 | | 2,400 | | 2,200 |
| | | | | | |
| | Capital Statement 2007-08 | | 115 |
Police
| | | | | | | | | | |
Project | | Statistical Division | | Total Estimated Cost $’000 | | Expenditure to 30-06-07 $’000 | | Budget 2007-08 $’000 | | Post 2007-08 $’000 |
Surfers Paradise - new police station | | 10 | | 4,000 | | 500 | | 2,200 | | 1,300 |
The Gap - replacement police station | | 05 | | 1,000 | | | | 100 | | 900 |
Townsville - police station upgrade | | 45 | | 3,070 | | 1,595 | | 1,475 | | |
Upper Mt Gravatt - refurbishment | | 05 | | 3,033 | | 183 | | 2,850 | | |
Whitsunday - replacement police station and watchhouse | | 40 | | 11,529 | | 829 | | 10,500 | | 200 |
Yeppoon - replacement police station | | 30 | | 7,042 | | 542 | | 4,100 | | 2,400 |
Other major capital | | Various | | | | | | 300 | | Ongoing |
| | | | | | | | | | |
Sub-total Major Capital* | | | | | | | | 83,220 | | |
| | | | | | | | | | |
Sub-Programs | | | | | | | | | | |
Upgrade of establishment | | Various | | | | | | 3,400 | | Ongoing |
Land acquisition program | | Various | | | | | | 1,100 | | Ongoing |
Police Beats | | Various | | | | | | 1,428 | | Ongoing |
Small Station Program | | | | | | | | | | |
Mt Morgan - police station upgrade | | 30 | | 1,287 | | 187 | | 1,100 | | |
Woodford - replacement police station | | 05 | | 1,000 | | 800 | | 200 | | |
Wujal Wujal - new police station and watchhouse | | 50 | | 2,752 | | 1,452 | | 1,300 | | |
Watchhouse upgrade program | | Various | | | | | | 500 | | Ongoing |
| | | | | | | | | | |
Sub-total Sub-Programs | | | | | | | | 9,028 | | |
| | | | | | | | | | |
Housing Program | | | | | | | | | | |
Cloncurry - new residence | | 55 | | 800 | | 350 | | 450 | | |
Cooktown - new twin dwelling unit | | 50 | | 646 | | 640 | | 6 | | |
Horn Island - pilot house | | 50 | | 500 | | | | 250 | | 250 |
Longreach - replacement duplex 1 and 2 | | 35 | | 1,200 | | 700 | | 500 | | |
Policing Indigenous Communities | | Various | | 2,800 | | | | 2,800 | | |
State Housing Program | | Various | | | | | | 2,950 | | Ongoing |
| | | | | | | | | | |
Sub-total Housing Program | | | | | | | | 6,956 | | |
| | | | | | | | | | |
Information Management Strategic Plan | | Various | | | | | | 49,769 | | Ongoing |
Vessels | | Various | | | | | | 6,596 | | Ongoing |
Other plant and equipment (includes motor vehicles) | | Various | | | | | | 79,932 | | Ongoing |
| | | | | | |
| 116 | | Capital Statement 2007-08 | | |
Police
| | | | | | | | | | |
Project | | Statistical Division | | Total Estimated Cost $’000 | | Expenditure to 30-06-07 $’000 | | Budget 2007-08 $’000 | | Post 2007-08 $’000 |
Minor works | | Various | | | | | | 3,100 | | Ongoing |
| | | | | | | | | | |
Total Property, Plant and Equipment | | | | | | | | 238,601 | | |
| | | | | | | | | | |
Other Capital Expenditure | | | | | | | | | | |
Information Management Strategic Plan | | Various | | | | | | 19,420 | | Ongoing |
| | | | | | | | | | |
Total Other Capital Expenditure | | | | | | | | 19,420 | | |
| | | | | | | | | | |
TOTAL QUEENSLAND POLICE SERVICE | | | | | | 258,021 | | |
| | | | | | | | | | |
| | | | | | |
| | Capital Statement 2007-08 | | 117 |
PREMIER AND CABINET
Capital expenditure for the Department of the Premier and Cabinet including all associated entities is $94.2 million.
Department of the Premier and Cabinet
The department’s capital budget in 2007-08 of $2.7 million provides $1.8 million for the replacement of office and information systems required for the efficient delivery of the department’s outputs, $0.12 million for the completion of the Cabinet Information System which will enhance and improve Cabinet processes, and capital grants of $0.8 million to the Great Barrier Reef Marine Park Authority to maintain, replace and enhance infrastructure and marine transport on the Great Barrier Reef.
Commission for Children and Young People and Child Guardian
The 2007-08 capital program of $0.15 million for the Commission for Children and Young People and Child Guardian will see the continuation of the enhancement and replacement of existing assets to efficiently deliver the Commission’s outputs.
South Bank Corporation
The 2007-08 capital works program of $11.5 million for South Bank Corporation is directed at enhancing the experience of visitors to the parklands and the precinct generally, and to the ongoing operational requirements of South Bank Parklands and the Brisbane Convention and Exhibition Centre.
Major Sports Facilities Authority
The capital program for the Major Sports Facilities Authority reflects the investment required to develop and maintain the State’s major sports facilities to a standard appropriate for the conduct of national and international events. The capital program will provide $79.8 million in 2007-08 and includes the construction of the 25,000 seat Skilled Park Stadium located at Robina on the Gold Coast. It is anticipated the Stadium will be operational in 2008 and be the home ground of the new Gold Coast Titans National Rugby League team. The program also provides for the development of a state-of-the-art hydrotherapy recovery and rehabilitation centre at the Queensland Sport and Athletics Centre which is expected to be completed in late 2007.
| | | | | | |
| 118 | | Capital Statement 2007-08 | | |
Premier and Cabinet
| | | | | | | | | | |
Project | | Statistical Division | | Total Estimated Cost $’000 | | Expenditure to 30-06-07 $’000 | | Budget 2007-08 $’000 | | Post 2007-08 $’000 |
DEPARTMENT OF THE PREMIER AND CABINET | | | | | | | | | | |
| | | | | |
Property, Plant and Equipment | | | | | | | | | | |
Asset replacement program | | 05 | | | | | | 1,808 | | Ongoing |
| | | | | | | | | | |
Total Property, Plant and Equipment | | | | | | | | 1,808 | | |
| | | | | | | | | | |
| | | | | |
Other Capital Expenditure | | | | | | | | | | |
Cabinet Information System | | 05 | | 1,892 | | 1,771 | | 121 | | |
| | | | | | | | | | |
Total Other Capital Expenditure | | | | | | | | 121 | | |
| | | | | | | | | | |
| | | | | |
Capital Grants | | | | | | | | | | |
Great Barrier Reef Marine Park | | | | | | | | | | |
Whitsunday package | | 40 | | 1,200 | | 400 | | 400 | | 400 |
Island facilities | | Various | | | | | | 250 | | Ongoing |
General plant and equipment | | Various | | | | | | 50 | | Ongoing |
Vessel replacement | | Various | | | | | | 100 | | Ongoing |
| | | | | | | | | | |
Sub-total Great Barrier Reef Marine Park | | | | | | | | 800 | | |
| | | | | | | | | | |
Total Capital Grants | | | | | | | | 800 | | |
| | | | | | | | | | |
TOTAL DEPARTMENT OF THE PREMIER AND CABINET | | | | 2,729 | | |
| | | | | | | | | | |
| |
COMMISSION FOR CHILDREN AND YOUNG PEOPLE AND CHILD GUARDIAN | | |
| | | | | |
Property, Plant and Equipment | | | | | | | | | | |
Asset replacement program | | 05 | | | | | | 150 | | Ongoing |
| | | | | | | | | | |
Total Property, Plant and Equipment | | | | | | | | 150 | | |
| | | | | | | | | | |
TOTAL COMMISSION FOR CHILDREN AND YOUNG PEOPLE AND CHILD GUARDIAN | | 150 | | |
| | | | | | | | | | |
| | | | | |
SOUTH BANK CORPORATION | | | | | | | | | | |
| | | | | |
Property, Plant and Equipment | | | | | | | | | | |
South Bank Parklands enhancements | | 05 | | | | | | 5,768 | | Ongoing |
South Bank Precinct enhancements | | 05 | | | | | | 2,115 | | Ongoing |
Brisbane Convention & Exhibition Centre enhancements | | 05 | | | | | | 3,313 | | Ongoing |
Land development | | 05 | | | | | | 300 | | Ongoing |
| | | | | | | | | | |
Total Property, Plant and Equipment | | | | | | | | 11,496 | | |
| | | | | | | | | | |
TOTAL SOUTH BANK CORPORATION | | | | | | 11,496 | | |
| | | | | | | | | | |
| | | | | | |
| | Capital Statement 2007-08 | | 119 |
Premier and Cabinet
| | | | | | | | | | |
Project | | Statistical Division | | Total Estimated Cost $’000 | | Expenditure to 30-06-07 $’000 | | Budget 2007-08 $’000 | | Post 2007-08 $’000 |
MAJOR SPORTS FACILITIES AUTHORITY | | | | | | | | | | |
| | | | | |
Property, Plant and Equipment | | | | | | | | | | |
Skilled Park Stadium | | 10 | | 160,000 | | 106,256 | | 53,744 | | |
QSAC Rehabilitation Centre | | 05 | | 10,000 | | 3,624 | | 6,376 | | |
Dairy Farmers Stadium | | 45 | | 2,850 | | 850 | | 2,000 | | |
Suncorp Stadium | | 05 | | 6,708 | | | | 6,708 | | |
Water initiatives | | 05 | | 1,950 | | | | 1,950 | | |
Capital maintenance and equipment | | Various | | | | | | 9,066 | | Ongoing |
| | | | | | | | | | |
Total Property, Plant and Equipment | | | | | | | | 79,844 | | |
| | | | | | | | | | |
TOTAL MAJOR SPORTS FACILITIES AUTHORITY | | 79,844 | | |
| | | | | | | | | | |
TOTAL PREMIER AND CABINET | | | | | | | | 94,219 | | |
| | | | | | | | | | |
| | | | | | |
| 120 | | Capital Statement 2007-08 | | |
PRIMARY INDUSTRIES AND FISHERIES
The Department of Primary Industries and Fisheries’ (DPIF) capital expenditure program for 2007-08 is $33.7 million, which is primarily focused on developing world-class research facilities to deliver excellent science outcomes for primary industries and fisheries. DPIF has numerous facilities located throughout rural and regional Queensland. These require a significant level of minor works, mechanical items and other plant and equipment upgrades to keep them operating effectively.
Program Highlights
| • | | $4.9 million has been allocated to continue the Queensland Crop Development Facility (QCDF) which is a strategic collaboration between DPIF, Queensland University of Technology and the University of Queensland. QCDF will provide world-class high-security glasshouses and in-vitro growth facilities for plant science research. Some glasshouse space will be available for private sector research groups to lease, fostering a higher level of collaboration. |
| • | | $0.94 million has been allocated to assist sustainable fisheries research staff to relocate to the Bribie Island Aquaculture Research Centre. This will provide a world-class facility for combined fisheries and aquaculture research. The project includes more efficient and integrated infrastructure including new seawater tank facilities. |
| • | | $2.4 million has been allocated to relocate the Nambour Regional Office to the Maroochy Research Station. The co-location of staff will allow for better provision of DPIF services locally and in the region. |
| • | | $0.55 million has been allocated to develop a new veterinary laboratory in Oonoonba to maintain the high level of accreditation of laboratories in Northern Queensland. |
| • | | Additional funding of $0.54 million has been allocated to replace the Coen Information Centre. This centre was significantly damaged by Cyclone Monica and is a vital facility for providing surveillance against pests that may arrive in Australia from countries to the north. |
| • | | Additional funding of $4 million ($5 million over two years) has been provided to relocate the Tick Fever Centre specific pathogen free breeder herd from Wacol. |
| • | | A further $8 million capital grant will be provided to assist the RSPCA relocate from the current Fairfield site to Redbank Plains. |
| | | | | | |
| | Capital Statement 2007-08 | | 121 |
Forestry Plantations Queensland
The capital expenditure program for 2007-08 is $19 million. This includes $13 million for the purchase of freehold land for plantation establishment, $3.5 million for the replacement of heavy plant and motor vehicles, $1 million for computer equipment, $1.1 million for other plant and equipment and $0.4 million to construct buildings.
QRAA
The capital expenditure program of $0.6 million in 2007-08 includes investment in information technology systems to assist with the administration and delivery of financial assistance to the Queensland rural sector.
Primary Industries and Fisheries
| | | | | | | | | | |
Project | | Statistical Division | | Total Estimated Cost $’000 | | Expenditure to 30-06-07 $’000 | | Budget 2007-08 $’000 | | Post 2007-08 $’000 |
DEPARTMENT OF PRIMARY INDUSTRIES AND FISHERIES | | | | | | | | | | |
| | | | | |
Property, Plant and Equipment | | | | | | | | | | |
Bribie Island Aquaculture Research Centre-extension* | | 05 | | 5,000 | | 161 | | 940 | | 3,899 |
Coen Information Centre | | 50 | | 535 | | | | 535 | | |
Oonoonba Veterinary Laboratory-PC3 Laboratory | | 45 | | 678 | | 50 | | 548 | | 80 |
Queensland Crop Development Facility-Redlands | | 05 | | 8,622 | | 2,614 | | 4,930 | | 1,078 |
Relocation of Tick Fever Herd | | 20 | | 5,000 | | | | 4,000 | | 1,000 |
Regional Office Complex-Nambour | | 10 | | 2,670 | | 200 | | 2,420 | | 50 |
Relocation and refurbishment | | Various | | | | | | 1,000 | | Ongoing |
Research facilities development | | Various | | | | | | 600 | | Ongoing |
Vessel replacement | | Various | | | | | | 1,100 | | Ongoing |
Heavy plant and equipment | | Various | | | | | | 500 | | Ongoing |
Minor works | | Various | | | | | | 800 | | Ongoing |
Other plant and equipment | | Various | | | | | | 6,703 | | Ongoing |
| | | | | | | | | | |
Total Property, Plant and Equipment | | | | | | | | 24,076 | | |
| | | | | | | | | | |
| | | | | |
Other Capital Expenditure | | | | | | | | | | |
Intangible assets | | 05 | | | | | | 1,201 | | Ongoing |
Other projects | | Various | | | | | | 450 | | Ongoing |
| | | | | | | | | | |
Total Other Capital Expenditure | | | | | | | | 1,651 | | |
| | | | | | | | | | |
| | | | | | |
| 122 | | Capital Statement 2007-08 | | |
Primary Industries and Fisheries
| | | | | | | | | | |
Project | | Statistical
Division | | Total
Estimated
Cost
$’000 | | Expenditure
to 30-06-07
$’000 | | Budget
2007-08 $’000 | | Post
2007-08 $’000 |
Capital Grants | | | | | | | | | | |
| | | | | |
RSPCA facility | | 05 | | 10,000 | | 2,000 | | 8,000 | | |
| | | | | | | | | | |
Total Capital Grants | | | | | | | | 8,000 | | |
| | | | | | | | | | |
TOTAL DEPARTMENT OF PRIMARY INDUSTRIES AND FISHERIES | | | | | | | | 33,727 | | |
| | | | | | | | | | |
| | | | | |
FORESTRY PLANTATIONS QUEENSLAND | | | | | | | | | | |
| | | | | |
Property, Plant and Equipment | | | | | | | | | | |
Buildings | | Various | | | | | | 433 | | Ongoing |
Land | | Various | | | | | | 13,000 | | Ongoing |
Heavy plant and motor vehicles | | Various | | | | | | 3,453 | | Ongoing |
Computer equipment | | Various | | | | | | 1,049 | | Ongoing |
Other plant and equipment | | Various | | | | | | 1,077 | | Ongoing |
| | | | | | | | | | |
Total Property, Plant and Equipment | | | | | | | | 19,012 | | |
| | | | | | | | | | |
TOTAL FORESTRY PLANTATIONS QUEENSLAND | | | | | | | | 19,012 | | |
| | | | | | | | | | |
| | | | | |
QRAA | | | | | | | | | | |
| | | | | |
Property, Plant and Equipment | | | | | | | | | | |
Computer equipment | | 05 | | | | | | 500 | | Ongoing |
Office furniture and fixtures | | 05 | | | | | | 100 | | Ongoing |
| | | | | | | | | | |
Total Property, Plant and Equipment | | | | | | | | 600 | | |
| | | | | | | | | | |
TOTAL QRAA | | | | | | | | 600 | | |
| | | | | | | | | | |
TOTAL PRIMARY INDUSTRIES AND FISHERIES | | | | | | | | 53,339 | | |
| | | | | | | | | | |
| * | Funded fully or in part under the Smart State Building Fund |
| | | | | | |
| | Capital Statement 2007-08 | | 123 |
PUBLIC WORKS
The Department’s capital expenditure program for 2007-08, including commercialised business units (CBUs) is $404.8 million. Capital expenditure by the department, excluding CBUs, is $237.2 million.
Program Highlights
| • | | QFleet will purchase motor vehicles totalling $129 million. The vehicles will be leased to clients to facilitate the delivery of government services across Queensland. The vehicle purchases and associated ongoing maintenance provide support for local Queensland firms. |
| • | | $35 million is provided in 2007-08 for a major expansion of the Queensland State Archives facilities at Runcorn, Brisbane. The expansion will provide an additional 52 linear kilometres of storage which is expected to satisfy the known archival storage requirements of the Queensland Government for the next 10 to 15 years. The project will also provide support facilities such as sorting rooms. Funding is based on a total project cost of $52 million. |
| • | | $33.9 million is allocated in 2007-08 as part of a $63.3 million project to construct a new footbridge from Tank Street to the new Queensland Gallery of Modern Art at the Queensland Cultural Centre. |
| • | | $33.5 million is provided in 2007-08 as part of a $36.1 million capital grant to the Mackay City Council for the construction of the Mackay Convention Precinct. |
| • | | $20.3 million is provided in 2007-08 to refurbish and integrate the disused former Health and Welfare Building at 63 George Street and the adjoining David Longland Building. The total project cost of $45.3 million will deliver 10,600 square metres of refurbished office space. The project is expected to be completed in 2008-09. |
| • | | $17.6 million is provided in 2007-08 for the Boggo Road Precinct redevelopment. The redevelopment will contribute significantly to the Smart State initiatives with the first stage of the proposed knowledge based research and business component providing approximately 60,000 square metres of office and laboratory space for scientific research into eco-science. |
| • | | $14.9 million is provided in 2007-08 for the construction of Stage 2 (Extension) of the Gold Coast Convention and Exhibition Centre. The extension will provide the Gold Coast with a world class convention and exhibition centre with seating for up to 6,000 patrons by doubling the space in the exhibition hall and allowing the centre to host larger national and international events. Provision for the extension was made during original construction of the centre. |
| | | | | | |
| 124 | | Capital Statement 2007-08 | | |
| • | | $14.1 million is allocated in 2007-08 to complete design and commence construction of a Joint Contact Centre at Zillmere in Brisbane. The building will accommodate an estimated 320 work points from Smart Service Queensland and Queensland Police Service. The Department of Public Works has been allocated a total capital budget of $57.4 million for this project. |
| • | | $13.5 million is provided in 2007-08 to complete design and commence construction of a new government office building at Maroochydore. The building will provide 9,650 square metres of net lettable area on a development site in the Maroochydore Central Business District. The total project cost is estimated at $84.5 million. |
| • | | $10.7 million is allocated in 2007-08 for the construction and upgrade of Government employee housing in rural and remote areas, including Weipa and Palm Island, to support the delivery of government services in these locations. |
| • | | $10 million is provided in 2007-08 to complete design and commence construction of a new government office building on Palm Island in order to meet the accommodation needs of Queensland government agencies. The total project cost is estimated at $12.9 million. |
| • | | $7 million is provided in 2007-08 to complete design and commence construction of a new government office building in Cairns. The building will provide 10,000 square metres of net lettable area as Stage 2 of William McCormack Place in Hartley Street, Cairns. The total project cost is estimated at $79.5 million. |
| • | | $5 million is allocated in 2007-08 for the construction of a government office building on Thursday Island. The building will provide 1,000 square metres of net lettable area to improve the efficiency of government owned and leased accommodation. The total project cost is estimated at $13.5 million. |
| | | | | | |
| | Capital Statement 2007-08 | | 125 |
Public Works
| | | | | | | | | | |
Project | | Statistical
Division | | Total Estimated
Cost
$’000 | | Expenditure to 30-06-07
$’000 | | Budget
2007-08 $’000 | | Post
2007-08 $’000 |
DEPARTMENT OF PUBLIC WORKS | | | | | | | | | | |
| | | | | |
Property, Plant and Equipment | | | | | | | | | | |
Brisbane—Old Museum building | | 05 | | 8,177 | | 6,422 | | 1,755 | | |
Brisbane—63 George Street refurbishment | | 05 | | 45,300 | | 20,009 | | 20,291 | | 5,000 |
Brisbane—Boggo Road Precinct redevelopment | | 05 | | 45,476 | | 6,719 | | 17,576 | | 21,181 |
Brisbane—Queensland State Archives stage 2 | | 05 | | 52,000 | | 9,575 | | 35,000 | | 7,425 |
Brisbane—Tank Street—new pedestrian/cycle bridge | | 05 | | 63,300 | | 3,828 | | 33,910 | | 25,562 |
Palm Island—office building | | 45 | | 12,870 | | 251 | | 10,000 | | 2,619 |
Rockhampton—Riverbank project | | 30 | | 9,500 | | 9,000 | | 500 | | |
Brisbane—CITEC Data Centre upgrade | | 05 | | 6,620 | | 5,058 | | 1,562 | | |
Carpet replacement program | | Various | | | | | | 800 | | Ongoing |
Anti Discrimination Program | | Various | | | | | | 300 | | Ongoing |
Workplace Health and Safety | | Various | | | | | | 900 | | Ongoing |
Gold Coast Convention Centre—Stage 2 Extension | | 10 | | 40,000 | | 1,065 | | 14,944 | | 23,991 |
Cairns—new office building | | 50 | | 79,500 | | | | 7,000 | | 72,500 |
Maroochydore—new office building | | 10 | | 84,500 | | | | 13,500 | | 71,000 |
Thursday Island—new office building | | 50 | | 13,500 | | | | 5,000 | | 8,500 |
Office Refurbishment in Garbutt | | 45 | | 3,500 | | | | 3,000 | | 500 |
Joint Contact Centre | | 05 | | 57,400 | | | | 14,100 | | 43,300 |
Government Employee Housing | | Various | | | | | | 10,702 | | Ongoing |
Other plant and equipment | | 05 | | | | | | 8,987 | | Ongoing |
| | | | | | | | | | |
Total Property, Plant and Equipment | | | | | | | | 199,827 | | |
| | | | | | | | | | |
Other Capital Expenditure | | | | | | | | | | |
Whole of Government ICT initiatives | | 05 | | | | | | 3,157 | | Ongoing |
Travel Management System | | 05 | | 2,670 | | 1,952 | | 718 | | |
| | | | | | | | | | |
Total Other Capital Expenditure | | | | | | | | 3,875 | | |
| | | | | | | | | | |
Capital Grants | | | | | | | | | | |
Mackay Convention Precinct1 | | 40 | | 36,140 | | 2,677 | | 33,463 | | |
| | | | | | | | | | |
Total Capital Grants | | | | | | | | 33,463 | | |
| | | | | | | | | | |
TOTAL DEPARTMENT OF PUBLIC WORKS | | | | | | | | 237,165 | | |
| | | | | | | | | | |
| | | | | | |
| 126 | | Capital Statement 2007-08 | | |
Public Works
| | | | | | | | | | |
Project | | Statistical
Division | | Total
Estimated
Cost
$’000 | | Expenditure
to 30-06-07
$’000 | | Budget
2007-08 $’000 | | Post
2007-08 $’000 |
QBUILD | | | | | | | | | | |
| | | | | |
Property, Plant and Equipment | | | | | | | | | | |
Plant and equipment | | Various | | | | | | 3,555 | | Ongoing |
| | | | | | | | | | |
Total Property, Plant and Equipment | | | | | | | | 3,555 | | |
| | | | | | | | | | |
| | | | | |
Other Capital Expenditure | | | | | | | | | | |
Business systems—work in progress | | 05 | | 27,508 | | | | 13,577 | | 13,931 |
| | | | | | | | | | |
Total Other Capital Expenditure | | | | | | | | 13,577 | | |
| | | | | | | | | | |
TOTAL QBUILD | | | | | | | | 17,132 | | |
| | | | | | | | | | |
| | | | | |
QFLEET | | | | | | | | | | |
| | | | | |
Property, Plant and Equipment | | | | | | | | | | |
Motor vehicles | | Various | | | | | | 128,967 | | Ongoing |
Other plant and equipment | | 05 | | | | | | 601 | | Ongoing |
| | | | | | | | | | |
Total Property, Plant and Equipment | | | | | | | | 129,568 | | |
| | | | | | | | | | |
| | | | | |
Other Capital Expenditure | | | | | | | | | | |
Information systems | | 05 | | | | | | 4,678 | | Ongoing |
| | | | | | | | | | |
Total Other Capital Expenditure | | | | | | | | 4,678 | | |
| | | | | | | | | | |
TOTAL QFLEET | | | | | | | | 134,246 | | |
| | | | | | | | | | |
| | | | | |
PROJECT SERVICES | | | | | | | | | | |
| | | | | |
Property, Plant and Equipment | | | | | | | | | | |
Plant and equipment | | Various | | | | | | 840 | | Ongoing |
| | | | | | | | | | |
Total Property, Plant and Equipment | | | | | | | | 840 | | |
| | | | | | | | | | |
| | | | | |
Other Capital Expenditure | | | | | | | | | | |
Business systems software | | 05 | | | | | | 6,200 | | Ongoing |
| | | | | | | | | | |
Total Other Capital Expenditure | | | | | | | | 6,200 | | |
| | | | | | | | | | |
TOTAL PROJECT SERVICES | | | | | | | | 7,040 | | |
| | | | | | | | | | |
| | | | | | |
| | Capital Statement 2007-08 | | 127 |
Public Works
| | | | | | | | | | |
Project | | Statistical
Division | | Total
Estimated
Cost
$’000 | | Expenditure
to 30-06-07
$’000 | | Budget
2007-08 $’000 | | Post
2007-08 $’000 |
SDS (SALES AND DISTRIBUTION SERVICES) | | | | | | | | | | |
| | | | | |
Property, Plant and Equipment | | | | | | | | | | |
Warehouse equipment | | 05 | | | | | | 250 | | Ongoing |
| | | | | | | | | | |
Total Property, Plant and Equipment | | | | | | | | 250 | | |
| | | | | | | | | | |
TOTAL SDS (SALES AND DISTRIBUTION SERVICES) | | | | | | | | 250 | | |
| | | | | | | | | | |
| | | | | |
CITEC | | | | | | | | | | |
| | | | | |
Property, Plant and Equipment | | | | | | | | | | |
Plant and equipment | | 05 | | | | | | 5,000 | | Ongoing |
| | | | | | | | | | |
Total Property, Plant and Equipment | | | | | | | | 5,000 | | |
| | | | | | | | | | |
Other Capital Expenditure | | | | | | | | | | |
Internally developed software and systems | | 05 | | | | | | 4,000 | | Ongoing |
| | | | | | | | | | |
Total Other Capital Expenditure | | | | | | | | 4,000 | | |
| | | | | | | | | | |
TOTAL CITEC | | | | | | | | 9,000 | | |
| | | | | | | | | | |
TOTAL PUBLIC WORKS | | | | | | | | 404,833 | | |
| | | | | | | | | | |
| 1. | The total cost of this project is $38 million of which the Mackay City Council will receive a capital grant of $36.14 million and the remaining $1.86 million expenditure will be incurred by the Department. |
| | | | | | |
| 128 | | Capital Statement 2007-08 | | |
QUEENSLAND AUDIT OFFICE
Information Standard 40 requires the implementation of an electronic document record management solution to appropriately manage all types of records. Queensland Audit Office (QAO) will be utilising the Queensland Government approved standard product for electronic file management. The total estimated cost of this project is $0.35 million. QAO is also replacing the current Business Management system at a total cost of $0.5 million during 2006-07 and 2007-08. Minor works expenditure of $0.16 million is to maintain and replace current office equipment.
Queensland Audit Office
| | | | | | | | | | |
Project | | Statistical
Division | | Total
Estimated
Cost
$’000 | | Expenditure
to 30-06-07
$’000 | | Budget
2007-08 $’000 | | Post
2007-08 $’000 |
QUEENSLAND AUDIT OFFICE | | | | | | | | | | |
| | | | | |
Property, Plant and Equipment | | | | | | | | | | |
Minor works | | 05 | | | | | | 162 | | Ongoing |
| | | | | | | | | | |
Total Property, Plant and Equipment | | | | | | | | 162 | | |
| | | | | | | | | | |
| | | | | |
Other Capital Expenditure | | | | | | | | | | |
Operational Recordkeeping | | 05 | | 347 | | 28 | | 319 | | |
Business Management System Replacement | | 05 | | 504 | | 200 | | 304 | | |
| | | | | | | | | | |
Total Other Capital Expenditure | | | | | | | | 623 | | |
| | | | | | | | | | |
TOTAL QUEENSLAND AUDIT OFFICE | | | | | | | | 785 | | |
| | | | | | | | | | |
| | | | | | |
| | Capital Statement 2007-08 | | 129 |
STATE DEVELOPMENT
Capital expenditure of the Department of State Development in 2007-08 is $47.1 million.
The capital program is designed to provide innovation, direction and leadership in industry and small business.
Program Highlights
| • | | Detailed planning will continue for the future construction of the Ecosciences Precinct at Boggo Road, the Health and Food Sciences Precinct at Coopers Plains and related ancillary infrastructure. The future development of the precincts will facilitate the co-location of research activities of the Department of Primary Industries and Fisheries, Department of Natural Resources and Water, Department of Mines and Energy and the Environmental Protection Agency and, in the future, with the Commonwealth Scientific and Industrial Research Organisation (CSIRO). During 2007-08 the department will progress the design development and appoint a managing contractor for the precincts and ancillary infrastructure. The construction of the precincts is proposed to commence in early 2008 for completion in 2010. |
| • | | $1.5 million in capital grants will be spent on Ethanol Conversion Initiatives, assisting companies across Queensland with E10 fuel site conversions. |
| • | | $0.71 million in capital grants will be provided to assist Queensland Sugar Industry participants to adopt innovative systems and technologies. |
State Development
| | | | | | | | | | |
Project | | Statistical
Division | | Total
Estimated
Cost
$’000 | | Expenditure
to 30-06-07
$’000 | | Budget
2007-08 $’000 | | Post
2007-08 $’000 |
DEPARTMENT OF STATE DEVELOPMENT | | | | | | | | | | |
| | | | | |
Property, Plant and Equipment | | | | | | | | | | |
Computer equipment | | Various | | | | | | 327 | | Ongoing |
Other acquisitions of property, plant and equipment | | Various | | | | | | 88 | | Ongoing |
Ecosciences Precinct at Boggo Road and the Health and Food Sciences Precinct at Coopers Plains | | 05 | | 290,000 | | 3,720 | | 43,880 | | 242,400 |
| | | | | | | | | | |
Total Property, Plant and Equipment | | | | | | | | 44,295 | | |
| | | | | | | | | | |
| | | | | | |
| 130 | | Capital Statement 2007-08 | | |
State Development
| | | | | | | | | | |
Project | | Statistical
Division | | Total
Estimated
Cost
$’000 | | Expenditure
to 30-06-07
$’000 | | Budget
2007-08 $’000 | | Post
2007-08 $’000 |
Capital Grants | | | | | | | | | | |
| | | | | |
Queensland Ethanol Conversion initiative | | Various | | 1,844 | | 339 | | 1,505 | | |
Sugar Industry | | Various | | 1,004 | | 293 | | 711 | | |
Other capital grants | | 50 | | 950 | | 113 | | 637 | | 200 |
| | | | | | | | | | |
Total Capital Grants | | | | | | | | 2,853 | | |
| | | | | | | | | | |
TOTAL DEPARTMENT OF STATE DEVELOPMENT | | | | | | | | 47,148 | | |
| | | | | | | | | | |
| | | | | | |
| | Capital Statement 2007-08 | | 131 |
TOURISM, FAIR TRADING, WINE INDUSTRY DEVELOPMENT AND WOMEN
In 2007-08, the portfolio of Tourism, Fair Trading, Wine Industry Development and Women has a total capital program of $2.8 million. This capital program will continue the work commenced in 2006-07 to improve information systems to provide more accessible and reliable information to ensure an improved client service to the people of Queensland.
Program Highlights
| • | | $0.47 million is provided for the purchase, modification and functionality development of a trade measurement compliance computer system to ensure the department’s database system can support trade measurement activities. Any changes to the system will be carefully designed to dovetail with a recent Council of Australian Governments decision to transfer responsibility for trade measurement to the Australian Government from 2010. |
| • | | $0.36 million is provided to continue systems and internet development to enable external clients and whole-of-Government service providers to access departmental services proposed for integration with Smart Service Queensland. |
| • | | $0.3 million is provided for computer systems development to support increased licensing and compliance requirements resulting from amendments to the Security Providers Act 1993. |
| • | | $0.22 million is provided for the upgrade of Tourism Queensland’s financial management system, Finance One, to maintain software support and deploy web functionality enabling use by international offices. |
| • | | $0.2 million is provided for the implementation of an enterprise-wide contact management system for Tourism Queensland to provide one point of update for contacts, efficient event subscription management, visitor information centre and modernisation of the Famil system. |
| • | | $0.11 million is provided for access for Tourism Queensland international offices to Tourism Queensland’s Head Office’s in-house systems. |
| • | | $0.09 million is provided for the implementation of an Electronic Documents and Records Management System (eDRMS) for Tourism Queensland to comply with information standards IS40 and IS41 for the management of documents and records. |
| • | | $0.07 million is provided for the replacement of five computer servers at Tourism Queensland Head Office. |
| | | | | | |
| 132 | | Capital Statement 2007-08 | | |
Tourism, Fair Trading, Wine Industry Development and Women
| | | | | | | | | | |
Project | | Statistical
Division | | Total
Estimated
Cost
$’000 | | Expenditure
to 30-06-07
$’000 | | Budget
2007-08 $’000 | | Post
2007-08 $’000 |
DEPARTMENT OF TOURISM, FAIR TRADING AND WINE INDUSTRY DEVELOPMENT |
| | | | | |
Property, Plant and Equipment | | | | | | | | | | |
Plant and equipment | | 05 | | | | | | 943 | | Ongoing |
| | | | | | | | | | |
Total Property, Plant and Equipment | | | | | | | | 943 | | |
| | | | | | | | | | |
| | | | | |
Other Capital Expenditure | | | | | | | | | | |
SSQ Systems Integration project | | 05 | | 1,009 | | 652 | | 357 | | |
Trade Measurement Compliance System | | 05 | | 470 | | | | 470 | | |
Stage 1 Security Providers Act amendments | | 05 | | 300 | | | | 300 | | |
| | | | | | | | | | |
Total Other Capital Expenditure | | | | | | | | 1,127 | | |
| | | | | | | | | | |
TOTAL DEPARTMENT OF TOURISM, FAIR TRADING AND WINE INDUSTRY DEVELOPMENT | | 2,070 | | |
| | | | | | | | | | |
| | | | | |
TOURISM QUEENSLAND | | | | | | | | | | |
| | | | | |
Property, Plant and Equipment | | | | | | | | | | |
Interconnectivity of international offices | | 05 | | 163 | | 50 | | 113 | | |
Servers | | 05 | | 70 | | | | 70 | | |
| | | | | | | | | | |
Total Property, Plant and Equipment | | | | | | | | 183 | | |
| | | | | | | | | | |
| | | | | |
Other Capital Expenditure | | | | | | | | | | |
Financial System upgrade (Finance One—Release 11) | | 05 | | 221 | | | | 221 | | |
Electronic Documents and Records Management System | | 05 | | 161 | | 75 | | 86 | | |
Enterprise-wide contact management system and modernisation of the Famil system | | 05 | | 250 | | 50 | | 200 | | |
| | | | | | | | | | |
Total Other Capital Expenditure | | | | | | | | 507 | | |
| | | | | | | | | | |
TOTAL TOURISM QUEENSLAND | | | | | | | | 690 | | |
| | | | | | | | | | |
TOTAL TOURISM, FAIR TRADING, WINE INDUSTRY DEVELOPMENT AND WOMEN | | 2,760 | | |
| | | | | | | | | | |
| | | | | | |
| | Capital Statement 2007-08 | | 133 |
TRANSPORT
Total capital outlays for the Transport portfolio in 2007-08 will be $2.481 billion representing a 24.4% increase in capital expenditure compared with the 2006-07 Budget. The portfolio consists of Queensland Transport, Queensland Rail and the port authorities.
Queensland Transport
Queensland Transport’s capital expenditure program for 2007-08 totals $645.2 million and predominantly comprises investment in public transport infrastructure and systems.
Program Highlights
| • | | $ 16 million towards the new Integrated Ticketing System is provided for in the 2007-08 Budget. The new Integrated Ticketing System includes the use of smart card technology as part of a wider program by TransLink to introduce a new fare collection system. The new system will make it easier and quicker for customers to pay fares and travel across South East Queensland. |
| • | | $5 million for Palm Island maritime works, including $3.5 million in additional funding for the dredging of the entrance channel to Palm Island barge ramp and jetty. The dredging will provide safe, all tide access for the existing ferry and barge services. |
| • | | The Budget provides $27.1 million to continue the development of a New Queensland Drivers Licence to meet community demand for a secure licensing system that improves protection against fraud and identity theft. |
In the 2007-08 Budget, the Government continues to progress the implementation of the SEQ1PP. Some major projects included in SEQ1PP are:
| • | | $129 million to complete the construction of the Inner Northern Busway sections one and two. This project has a total estimated cost of $333 million and will link the Queen Street Bus Station to the already completed stages of the Inner Northern Busway near Roma Street |
| • | | $5 million to complete construction on the Normanby Cycle connection. This cycleway will link Normanby to the Roma Street Parklands |
| • | | $17.4 million towards the construction of cycle links to enhance the cycle network in South East Queensland. This is made up of $2.8 million towards the construction of stated-owned cycle links and $14.6 million in grants to be provided to local authorities |
| | | | | | |
| 134 | | Capital Statement 2007-08 | | |
| • | | $13.8 million towards construction of the Robina Transport Hub and to continue the planning and design of projects as part of the TransLink Station Upgrade Program |
| • | | $85.8 million towards construction of an Eastern Busway corridor connection from the Eleanor Schonell Bridge to Ipswich Road with stations at Park Road and the Princess Alexandra Hospital |
| • | | $50 million towards construction of the Eastern Busway: Princess Alexandra Hospital to Buranda. Construction will include an elevated busway station within the Princess Alexandra Hospital and will be a key link in the regional busway network |
| • | | $46.7 million towards the construction of the 17km Eastern Busway connection between Buranda and Capalaba including 11 bus stations |
| • | | $103.3 million towards construction of the Northern Busway between the Royal Children’s Hospital and Kedron. |
Queensland Rail
QR is allocating $1.278 billion for capital outlays in 2007-08 in Queensland.
Program Highlights
| • | | $502 million is provided to upgrade infrastructure and rollingstock on the Citytrain network as part of the SEQ1PP initiative: |
| | - | | Beenleigh to Gold Coast Corridor Upgrade, Caboolture to Beerburrum Duplication, Mitchelton to Keperra Duplication, $274.8 million |
| | - | | Metropolitan Freight Capacity Enhancement, $ 15 million |
| | - | | Robina to Varsity Lakes, $107.6 million |
| | - | | Additional rollingstock (44 x 3 car units) to deliver substantial service enhancements between the Gold Coast, Brisbane and the Sunshine Coast, $104.6 million. |
| • | | $163.4 million is provided in 2007-08 towards new and upgraded locomotives and wagons to support the increased haulage of coal in Central Queensland. |
| • | | $ 187.6 million is provided in 2007-08 for track works on the coal network in Central Queensland to allow for additional haulage of coal. |
| • | | $33.1 million is provided for rail and pedestrian bridge replacements. |
| • | | $22.4 million is provided for the enhancement of Brunswick Street Station. |
| | | | | | |
| | Capital Statement 2007-08 | | 135 |
| • | | $29 million is provided to modify and improve QR facilities and infrastructure for rail travel for disabled persons as prescribed by the Disability Discrimination Act 1992 and to modify the Electric Multiple Unit fleet to meet disability standards for Accessible Public Transport 2007 compliance requirements. |
| • | | $18.5 million is provided for maintaining and upgrading the track on the Mount Isa line. |
| • | | $9.4 million is provided to design and construct improvements to facilities used by passengers to access Citytrain services (including additional or improved carpark and the upgrading of bus-train interchanges), and also to design and construct improvements to Citytrain station facilities (including additional or improved shelters; refurbished and new station buildings; and increased levels of lighting). |
Port of Brisbane Corporation
In 2007-08, the Port of Brisbane Corporation has allocated $212.6 million for the continuing development of the port, driven particularly by the Hamilton Site Redevelopment Program and construction of additional berths at Fisherman Islands in order to accommodate the strong growth across a range of commodity areas. Projects include:
| • | | $34 million for the construction of a general purpose berth at Fisherman Islands to provide port users with the capacity to load and unload a diverse range of cargo |
| • | | $27.9 million for the continuation of the Hamilton Site Redevelopment Program |
| • | | $16.6 million for the construction of a 10th berth and wharf at Fisherman Islands to better enable the port’s stevedores to handle the growing number and size of container ships visiting the port |
| • | | $3 million for the development of Port Central, a service and retail precinct at Fisherman Islands to cater for the business and community needs of the growing workforce at the port. |
Cairns Port Authority
In 2007-08, the Cairns Port Authority has allocated $134.7 million towards new and continuing airport and seaport development. Some of these projects include:
| • | | $52 million for the redevelopment of the Domestic Terminal Building at Cairns Airport |
| • | | $17.3 million for the redevelopment of the retail area at the International Terminal Building |
| | | | | | |
| 136 | | Capital Statement 2007-08 | | |
| • | | $12.8 million for the expansion of the baggage reclaim hall and provision of new baggage carousels within the International Terminal Building |
| • | | $7.3 million for the provision of a new facility for the Australian Quarantine and Inspection Service in the Cairns area |
| • | | $10.2 million for the continued development of Cairns Cityport, including $7.1 million for the development of Precinct 12A. |
Central Queensland Ports Authority
In 2007-08, the Central Queensland Ports Authority has allocated $149.9 million towards the ongoing expansion of the ports at Gladstone and Rockhampton. This includes:
| • | | $103 million for the further expansion of the RG Tanna Coal Terminal including construction of stockpiles 19, 20 and 21, and a third outloading stream. This is part of a continuing expansion of works to take the terminal towards its ultimate capacity of 68 million tonnes per annum |
| • | | $12.6 million for minor plant and equipment and various other miscellaneous infrastructure developments throughout the Port of Gladstone. |
Mackay Port Authority
In 2007-08, the Mackay Port Authority has allocated $15.6 million for the development and continued upgrading of port and airport infrastructure. This includes:
| • | | $1.5 million to develop the Mackay Harbour Quarantine Facility |
| • | | $2.5 million to carry out land subdivision and works. |
Ports Corporation of Queensland
In 2007-08, the Ports Corporation of Queensland has allocated $37.4 million for various port development projects including:
| • | | $28 million for the Abbot Point Coal Terminal Stage 2 (X21) expansion |
| • | $1.9 million for the development of the Quintell Beach Barge Ramp |
| • | | $1 million for the development of a Customs Wharf at the Port of Thursday Island |
| • | | $3.9 million for a number of minor projects and the purchases of plant and equipment for various ports administered by the Ports Corporation of Queensland throughout the State. |
| | | | | | |
| | Capital Statement 2007-08 | | 137 |
Townsville Port Authority
The Townsville Port Authority has allocated $6.9 million towards the acquisition of infrastructure and improvements to the port during 2007-08. This includes:
| • | | $2.4 million for minor asset replacements and acquisitions and minor infrastructure works around the port |
| • | | $2 million to be spent on undertaking an Environmental Impact Statement into possible future Port Expansion in the Outer Harbour |
| • | | $1.3 million for the upgrade of the existing high voltage network. |
Transport
| | | | | | | | | | |
Project | | Statistical
Division | | Total
Estimated
Cost
$’000 | | Expenditure
to 30-06-07 $’000 | | Budget
2007-08 $’000 | | Post
2007-08 $’000 |
QUEENSLAND TRANSPORT | | | | | | | | | | |
| | | | | |
Property, Plant and Equipment | | | | | | | | | | |
Public Transport Infrastructure | | | | | | | | | | |
Transport Corridor Acquisitions — SEQ | | Various | | | | | | 12,650 | | Ongoing |
South East Queensland Cycle Network | | Various | | | | | | 2,814 | | Ongoing |
Normanby Cycleway Connection* | | 05 | | 15,071 | | 10,045 | | 5,026 | | |
Bus Infrastructure Rolling Program in SEQ | | Various | | 60,000 | | 41,000 | | 19,000 | | |
Gold Coast Bus Priority/High Occupancy Vehicle Program | | 10 | | 83,572 | | 1,600 | | 12,650 | | 69,322 |
Sunshine Coast Bus Priority/High Occupancy Vehicle Program | | 10 | | 53,831 | | 52 | | 8,207 | | 45,572 |
TransLink Station Upgrade Program | | Various | | 248,543 | | 7,880 | | 13,824 | | 226,839 |
Gold Coast Rapid Transit System (Helensvale/Parkwood to Broadbeach) | | 10 | | 901,921 | | 4,078 | | 28,300 | | 869,543 |
Caloundra to Maroochydore quality bus corridor and public transport stations | | 10 | | 307,735 | | 750 | | 633 | | 306,352 |
CAMCOS Rail (Beerwah to Maroochydore) | | 10 | | | | | | 3,000 | | Ongoing |
| | | | | | | | | | |
Sub-total Public Transport Infrastructure | | | | | | | | 106,104 | | |
| | | | | | | | | | |
| | | | | | |
| 138 | | Capital Statement 2007-08 | | |
Transport
| | | | | | | | | | |
Project | | Statistical
Division | | Total
Estimated
Cost $’000 | | Expenditure
to 30-06-07
$’000 | | Budget 2007-08 $’000 | | Post
2007-08 $’000 |
Busways | | | | | | | | | | |
Inner Northern Busway: Sections 1 and 2 | | 05 | | 333,000 | | 204,000 | | 129,000 | | |
Northern Busway: Section 1-4 and 5 | | 05 | | 777,000 | | 11,000 | | 103,306 | | 662,694 |
Eastern Busway: Eleanor Schonell Bridge to Princess Alexandra Hospital | | 05 | | 218,508 | | 72,424 | | 85,764 | | 60,320 |
Eastern Busway: Princess Alexandra Hospital to Buranda | | 05 | | 137,800 | | | | 50,000 | | 87,800 |
Eastern Busway: Buranda to Capalaba | | 05 | | 1,340,465 | | 3,700 | | 46,700 | | 1,290,065 |
| | | | | | | | | | |
Sub-total Busways | | | | | | | | 414,770 | | |
| | | | | | | | | | |
TransLink | | | | | | | | | | |
Integrated Ticketing System | | 05 | | 41,292 | | 34,235 | | 7,057 | | |
| | | | | | | | | | |
Sub-total TransLink | | | | | | | | 7,057 | | |
| | | | | | | | | | |
Maritime Infrastructure | | | | | | | | | | |
Vessel Traffic System (VHF) communication upgrade | | 30 | | 1,856 | | 1,456 | | 150 | | 250 |
Hay Point VTS Radar upgrade | | 40 | | 300 | | | | 300 | | |
Gladstone VTS Radar upgrade | | 30 | | 550 | | | | 150 | | 400 |
Maritime vessels | | 50 | | 2,000 | | | | 2,000 | | |
Marine Safety minor works | | Various | | | | | | 1,948 | | Ongoing |
Palm Island maritime works | | 50 | | 6,750 | | 1,775 | | 4,975 | | |
Port Douglas Boat Harbour new dredged material disposal area* | | 50 | | 4,286 | | 2,742 | | 1,544 | | |
Brampton Island -jetty* | | 40 | | 1,429 | | 434 | | 995 | | |
Lindeman Island -jetty upgrade* | | 40 | | 1,658 | | 229 | | 1,429 | | |
Daintree River boat ramp widening* | | 50 | | 550 | | 20 | | 530 | | |
Recreational Marine Facilities minor works* | | Various | | | | | | 9,702 | | Ongoing |
Boating Infrastructure minor works | | Various | | | | | | 3,577 | | Ongoing |
| | | | | | | | | | |
Sub-total Maritime Infrastructure | | | | | | | | 27,300 | | |
| | | | | | | | | | |
Other Property, Plant and Equipment | | | | | | | | | | |
Corporate Property minor works | | Various | | | | | | 950 | | Ongoing |
CBD refurbishments | | 05 | | | | | | 790 | | Ongoing |
Emerald office complex | | 30 | | 600 | | | | 600 | | |
| | | | | | |
| | Capital Statement 2007-08 | | 139 |
Transport
| | | | | | | | | | |
Project | | Statistical Division | | Total Estimated Cost $’000 | | Expenditure
to 30-06-07
$’000 | | Budget
2007-08
$’000 | | Post
2007-08 $’000 |
Infrastructure Replacement—upgrades | | 05 | | | | | | 6,808 | | Ongoing |
Plant and equipment | | Various | | | | | | 897 | | Ongoing |
| | | | | | | | | | |
Sub-total Other Property, Plant and Equipment | | | | | | | | 10,045 | | |
| | | | | | | | | | |
Total Property, Plant and Equipment | | | | | | | | 565,276 | | |
| | | | | | | | | | |
| | | | | |
Other Capital Expenditure | | | | | | | | | | |
METIS | | 05 | | 3,130 | | 435 | | 395 | | 2,300 |
Integrated Ticketing System (development and software) | | 05 | | 58,534 | | 53,534 | | 5,000 | | |
Integrated Ticketing System (School Transport software enhancement) | | 05 | | 5,700 | | 1,800 | | 3,900 | | |
New Queensland Drivers’ Licence (Stage 1 implementation) | | 05 | | 47,086 | | 13,151 | | 27,065 | | 6,870 |
| | | | | | | | | | |
Total Other Capital Expenditure | | | | | | | | 36,360 | | |
| | | | | | | | | | |
| | | | | |
Capital Grants | | | | | | | | | | |
SchoolBUS Upgrade Scheme | | Various | | | | | | 6,650 | | Ongoing |
SchoolBUS—Steep Roads Program | | Various | | 12,000 | | 3,700 | | 4,600 | | 3,700 |
Rural and Remote Airstrips | | Various | | | | | | 3,470 | | Ongoing |
Public Transport Infrastructure | | Various | | | | | | 600 | | Ongoing |
Accessible Buses | | Various | | | | | | 3,000 | | Ongoing |
Security Cameras in Taxis | | Various | | 9,450 | | 8,350 | | 800 | | 300 |
Safe School Travel | | Various | | | | | | 200 | | Ongoing |
Safe Walking and Pedalling | | Various | | | | | | 168 | | Ongoing |
Network Plan—public transport infrastructure | | Various | | | | | | 3,000 | | Ongoing |
South East Queensland Cycle Network | | Various | | | | | | 14,637 | | Ongoing |
Public Transport Infrastructure—compliance with disability standards | | Various | | | | | | 3,815 | | Ongoing |
Accessible Taxis | | Various | | 4,000 | | 200 | | 2,600 | | 1,200 |
| | | | | | | | | | |
Total Capital Grants | | | | | | | | 43,540 | | |
| | | | | | | | | | |
TOTAL QUEENSLAND TRANSPORT | | | | | | | | 645,176 | | |
| | | | | | | | | | |
| | | | | |
QUEENSLAND RAIL | | | | | | | | | | |
| | | | | |
Property, Plant and Equipment | | | | | | | | | | |
Network Access | | | | | | | | | | |
Bluff—Blackwater duplications | | 30 | | 58,500 | | 49,201 | | 9,299 | | |
| | | | | | |
| 140 | | Capital Statement 2007-08 | | |
Transport
| | | | | | | | | | |
Project | | Statistical
Division | | Total
Estimated
Cost
$’000 | | Expenditure
to 30-06-07
$’000 | | Budget
2007-08 $’000 | | Post
2007-08 $’000 |
RG Tanna Coal Terminal 3rd loop | | 30 | | 16,068 | | 15,568 | | 500 | | |
Westwood to Wycarbah duplication | | 30 | | 32,000 | | 15,019 | | 16,981 | | |
Aroona to Duaringa duplication | | 30 | | 34,500 | | 27,569 | | 6,931 | | |
Blackwater to Burngrove duplication | | 30 | | 43,000 | | 16,088 | | 26,912 | | |
Yan Yan passing loop | | 30 | | 11,470 | | 6,320 | | 5,150 | | |
Goonyella System: rail upgrade | | 40 | | 11,450 | | 10,173 | | 1,277 | | |
Mindi electrical substation | | 40 | | 15,700 | | 9,063 | | 6,637 | | |
Dalrymple Bay Coal Terminal: 3rd loop | | 40 | | 107,600 | | 71,344 | | 29,756 | | 6,500 |
Coppabella yard upgrade | | 40 | | 31,825 | | 1,772 | | 23,000 | | 7,053 |
Broadlea—Mallawa—Wotonga duplication | | 40 | | 77,000 | | 6,649 | | 42,000 | | 28,351 |
Moura Line passing loops | | 30 | | 30,085 | | 21,856 | | 8,229 | | |
Northern Missing Link study (Newlands—North Goonyella Link) | | 40 | | 19,000 | | 5,283 | | 5,000 | | 8,717 |
Sonoma balloon loop | | 40 | | 11,300 | | 385 | | 10,915 | | |
Mount Isa Line: concrete relay, rerail and associated works | | 55 | | 63,390 | | 44,876 | | 18,514 | | |
North Coast Line re-railing (Nambour to Parana) | | Various | | 10,700 | | 1,319 | | 935 | | 8,446 |
Roma Street, Normanby & Mayne re-signalling | | 05 | | 15,377 | | 13,769 | | 500 | | 1,108 |
Citytrain Station Conduit Upgrade various projects | | Various | | 34,692 | | 9,276 | | 3,714 | | 21,702 |
Minimum Maintenance Track -Metro | | Various | | 51,450 | | 9,008 | | 10,900 | | 31,542 |
Electrification Infrastructure Renewal Strategy | | Various | | 25,050 | | 1,460 | | 3,590 | | 20,000 |
Electrification Capacity Upgrade Strategy | | 05 | | 18,410 | | 407 | | 4,003 | | 14,000 |
Citytrain MetTRIP track infrastructure upgrades—Stages 1 and 2* | | Various | | 702,575 | | 271,385 | | 274,782 | | 156,408 |
Corinda to Darra: Third Track (planning and design) | | 05 | | 37,030 | | 12,030 | | 25,000 | | |
Springfield Line (design and early works) | | 05 | | 132,560 | | 33,560 | | 77,000 | | 22,000 |
| | | | | | |
| | Capital Statement 2007-08 | | 141 |
Transport
| | | | | | | | | | |
Project | | Statistical
Division | | Total Estimated
Cost
$’000 | | Expenditure
to 30-06-07
$’000 | | Budget
2007-08 $’000 | | Post
2007-08 $’000 |
Metropolitan Freight capacity enhancements | | Various | | 97,576 | | 5,639 | | 15,000 | | 76,937 |
Robina to Varsity Lakes | | 10 | | 348,103 | | | | 107,553 | | 240,550 |
Varsity Lakes to Tallebudgera (planning) | | 10 | | 6,000 | | | | 6,000 | | |
Landsborough to Nambour (planning and acquisitions) | | 10 | | 37,719 | | 2,200 | | 1,000 | | 34,519 |
Beerburrum to Landsborough (planning and design) | | 10 | | 18,500 | | 3,500 | | 15,000 | | |
Kuraby to Kingston (planning and design) | | 05 | | 4,000 | | | | 4,000 | | |
Telecommunications Infrastructure Renewal—Metro | | Various | | 18,730 | | 170 | | 1,730 | | 16,830 |
Telecommunications backbone network strategy | | Various | | 11,210 | | 1,470 | | 2,046 | | 7,694 |
Noise Amelioration—Metro | | Various | | 20,539 | | 19,341 | | 1,198 | | |
ATP TBS Migration: feasibility study | | Various | | 29,457 | | 2,284 | | 6,500 | | 20,673 |
UTC disaster recovery | | Various | | 11,830 | | 1,119 | | 2,011 | | 8,700 |
Timber Bridge Replacement Stage 3 | | Various | | 62,995 | | 10,895 | | 33,069 | | 19,031 |
Turnout and crossover refurbishment | | Various | | 28,500 | | 1,387 | | 4,000 | | 23,113 |
Corridor Integrity Strategy | | Various | | 11,055 | | 1,770 | | 2,100 | | 7,185 |
Noise Amelioration: statewide strategy | | Various | | 11,000 | | 2,585 | | 7,000 | | 1,415 |
Network Access—general | | Various | | | | | | 30,997 | | Ongoing |
| | | | | | | | | | |
Sub-total Network Access | | | | | | | | 850,729 | | |
| | | | | | | | | | |
| | | | | |
QR National | | | | | | | | | | |
Coal Electric Loco Fleet upgrade—Stages 1 & 2 | | Various | | 183,000 | | 142,863 | | 16,800 | | 23,337 |
Upgrade 24 Locos to 2250 Class | | 05 | | 55,740 | | 54,405 | | 1,335 | | |
15 x 4000 Class Locomotives | | Various | | 93,574 | | 51,570 | | 40,304 | | 1,700 |
Additional VCA Coal Wagons | | Various | | 150,000 | | 96,757 | | 52,743 | | 500 |
Electric Loco Upgrade Programme | | 30 | | 141,058 | | 52,681 | | 30,000 | | 58,377 |
VNQ Coal Wagon Overhauls | | 30 | | 21,188 | | 8,268 | | 6,450 | | 6,470 |
12 & 16 Cylinder Loco Overhauls | | Various | | 80,396 | | 14,420 | | 15,750 | | 50,226 |
Coal Revenue Protection System | | Various | | 12,031 | | 2,786 | | 9,245 | | |
QR National—General | | 30 | | | | | | 5,551 | | Ongoing |
| | | | | | | | | | |
Sub-total QR National | | | | | | | | 178,178 | | |
| | | | | | | | | | |
| | | | | | |
| 142 | | Capital Statement 2007-08 | | |
Transport
| | | | | | | | | | |
Project | | Statistical
Division | | Total
Estimated
Cost
$’000 | | Expenditure
to 30-06-07
$’000 | | Budget
2007-08 $’000 | | Post
2007-08 $’000 |
Passenger Services | | | | | | | | | | |
Citytrain EMU re-engineering and overhaul | | 05 | | 68,000 | | 57,686 | | 7,705 | | 2,609 |
Citytrain Disabled Access Compliance | | Various | | 43,730 | | 42,744 | | 986 | | |
Citytrain Disability Standards 2007 Compliance: infrastructure | | Various | | 70,779 | | 16,490 | | 18,000 | | 36,289 |
Citytrain Disability Standards 2007 Compliance: rollingstock | | Various | | 48,364 | | 2,576 | | 10,000 | | 35,788 |
MetTRIP—Citytrain intermodal works* | | Various | | 26,794 | | 13,782 | | 7,398 | | 5,614 |
MetTRIP—Citytrain station upgrades* | | Various | | 10,712 | | 5,948 | | 2,000 | | 2,764 |
MetTRIP—additional Citytrain rollingstock | | 15 | | 289,456 | | 164,582 | | 89,550 | | 35,324 |
Additional Citytrain rollingstock | | 15 | | 294,690 | | 3,143 | | 15,047 | | 276,500 |
Passenger Services—general* | | 05 | | | | | | 23,988 | | Ongoing |
Brunswick Street upgrade | | 05 | | 38,500 | | 2,996 | | 22,400 | | 13,104 |
| | | | | | | | | | |
Sub-total Passenger Services | | | | | | | | 197,074 | | |
| | | | | | | | | | |
Across QR | | | | | | | | | | |
Motor vehicle acquisitions | | 05 | | 34,000 | | | | 34,000 | | |
Major property disposals | | Various | | 19,252 | | 6,824 | | 7,276 | | 5,152 |
Across QR—general | | Various | | | | | | 10,362 | | Ongoing |
| | | | | | | | | | |
Sub-total Across QR | | | | | | | | 51,638 | | |
| | | | | | | | | | |
Total Property, Plant and Equipment | | | | | | | | 1,277,619 | | |
| | | | | | | | | | |
TOTAL QUEENSLAND RAIL | | | | | | | | 1,277,619 | | |
| | | | | | | | | | |
| | | | | |
PORT OF BRISBANE CORPORATION | | | | | | | | | | |
| | | | | |
Property, Plant and Equipment | | | | | | | | | | |
Terminals 1—6 | | 05 | | 17,800 | | 5,800 | | 7,000 | | 5,000 |
Wharf 10—Fisherman Islands | | 05 | | 59,978 | | 41,634 | | 16,600 | | 1,744 |
Hamilton Site redevelopment | | 05 | | 65,300 | | 4,000 | | 27,900 | | 33,400 |
Upgrades of major roads | | 05 | | | | | | 8,000 | | Ongoing |
Lessee terminals or wharves | | 05 | | | | | | 3,000 | | Ongoing |
General Purpose Berth—Fisherman Islands | | 05 | | 45,900 | | 6,500 | | 34,000 | | 5,400 |
Layup Berth | | 05 | | 1,500 | | | | 1,500 | | |
Grain Wharf Extension and Grain Terminal | | 05 | | 12,100 | | 8,600 | | 3,500 | | |
| | | | | | |
| | Capital Statement 2007-08 | | 143 |
Transport
| | | | | | | | | | |
Project | | Statistical
Division | | Total
Estimated
Cost
$’000 | | Expenditure
to 30-06-07
$’000 | | Budget
2007-08 $’000 | | Post
2007-08 $’000 |
Electrical and communication upgrades | | 05 | | | | | | 1,000 | | Ongoing |
Building and landscaping upgrades | | 05 | | | | | | 200 | | Ongoing |
Subdivisional roadworks—Fisherman Islands Business Park | | 05 | | 3,500 | | | | 3,500 | | |
Port Drive—truck parking and associated works | | 05 | | 3,000 | | | | 3,000 | | |
Reclamation and earthworks—The Brisbane | | 05 | | | | | | 8,500 | | Ongoing |
Reclamation and earthworks—external dredger | | 05 | | 6,000 | | | | 6,000 | | |
Land sourced fill | | 05 | | 4,500 | | | | 4,500 | | |
Ground improvement Fisherman Islands—T11, T12 and S3 | | 05 | | 21,300 | | | | 21,300 | | |
Whyte Island road and services network | | 05 | | 1,500 | | | | 1,500 | | |
Port West—filling | | 05 | | | | | | 10,000 | | Ongoing |
Warehouses and container facilities—Port of Brisbane | | 05 | | | | | | 2,500 | | Ongoing |
Port Central—Fisherman Islands | | 05 | | | | | | 3,000 | | Ongoing |
Portgate property developments | | 05 | | 3,000 | | | | 3,000 | | |
Eagle Farm Estate | | 05 | | | | | | 14,000 | | Ongoing |
Colmslie Estate | | 05 | | | | | | 8,700 | | Ongoing |
Brisbane Multi-modal Terminal pavement extensions | | 05 | | 3,500 | | | | 3,500 | | |
EPA Office—Manly | | 05 | | 2,900 | | 1,000 | | 1,900 | | |
Minor plant and equipment | | 05 | | | | | | 15,000 | | Ongoing |
| | | | | | | | | | |
Total Property, Plant and Equipment | | | | | | | | 212,600 | | |
| | | | | | | | | | |
TOTAL PORT OF BRISBANE CORPORATION | | | | | | | | 212,600 | | |
| | | | | | | | | | |
| | | | | |
BUNDABERG PORT AUTHORITY | | | | | | | | | | |
| | | | | |
Property, Plant and Equipment | | | | | | | | | | |
Dual purpose pilot vessel | | 15 | | 750 | | | | 750 | | |
Minor plant and equipment | | 15 | | | | | | 213 | | Ongoing |
| | | | | | | | | | |
Total Property, Plant and Equipment | | | | | | | | 963 | | |
| | | | | | | | | | |
TOTAL BUNDABERG PORT AUTHORITY | | | | | | | | 963 | | |
| | | | | | | | | | |
| | | | | | |
| 144 | | Capital Statement 2007-08 | | |
Transport
| | | | | | | | | | |
Project | | Statistical
Division | | Total
Estimated
Cost
$’000 | | Expenditure
to 30-06-07
$’000 | | Budget
2007-08 $’000 | | Post
2007-08 $’000 |
CAIRNS PORT AUTHORITY | | | | | | | | | | |
| | | | | |
Property, Plant and Equipment | | | | | | | | | | |
Cairns Airport | | | | | | | | | | |
International Terminal Building Baggage make-up and checked bag screening supplementary works | | 50 | | 90 | | | | 90 | | |
International Terminal Building baggage reclaim hall expansion | | 50 | | 18,609 | | 1,709 | | 12,791 | | 4,109 |
Interim Terminal Works—CPA project management | | 50 | | | | | | 440 | | Ongoing |
Electrical infrastructure | | 50 | | 3,383 | | 59 | | 944 | | 2,380 |
Drainage improvements | | 50 | | | | | | 1,200 | | Ongoing |
Runway 15/33 overlay | | 50 | | 9,178 | | 3,058 | | 3,090 | | 3,030 |
Australian Quarantine Inspection Service office building | | 50 | | 7,700 | | 380 | | 7,320 | | |
Replace Flight Information Display Systems mounting | | 50 | | 1,050 | | | | 675 | | 375 |
Business Park development | | 50 | | | | | | 2,942 | | Ongoing |
International Terminal Building departures retail, duty free walkthrough, specialty retail and landside retail | | 50 | | 23,522 | | 2,031 | | 17,305 | | 4,186 |
South Major Aircraft Maintenance Facility—amended scope | | 50 | | 193 | | 169 | | 24 | | |
Air Freight Facility feasibility study | | 50 | | 60 | | 10 | | 50 | | |
Airside works | | 50 | | | | | | 9,134 | | Ongoing |
Landside works | | 50 | | | | | | 6,748 | | Ongoing |
General aviation works | | 50 | | 10,737 | | 1,113 | | 3,374 | | 6,250 |
Domestic Terminal redevelopment project | | 50 | | 139,600 | | 21,877 | | 52,004 | | 65,719 |
Airport minor plant and equipment | | 50 | | | | | | 2,628 | | Ongoing |
| | | | | | | | | | |
Sub-total Cairns Airport | | | | | | | | 120,759 | | |
| | | | | | | | | | |
Cairns Seaport | | | | | | | | | | |
Tingira St Subdivision development | | 50 | | 10,800 | | 233 | | 1,738 | | 8,829 |
General cargo consolidation | | 50 | | 4,060 | | | | 360 | | 3,700 |
| | | | | | |
| | Capital Statement 2007-08 | | 145 |
Transport
| | | | | | | | | | |
Project | | Statistical
Division | | Total
Estimated
Cost
$’000 | | Expenditure
to 30-06-07
$’000 | | Budget
2007-08 $’000 | | Post
2007-08 $’000 |
Lease acquisitions | | 50 | | 250 | | | | 250 | | |
Seaport minor capital | | 50 | | | | | | 470 | | Ongoing |
| | | | | | | | | | |
Sub-total Cairns Seaport | | | | | | | | 2,818 | | |
| | | | | | | | | | |
Cairns Cityport | | | | | | | | | | |
Precinct 12A development | | 50 | | 9,104 | | 2,048 | | 7,056 | | |
Marina Bilge and Sullage System | | 50 | | 220 | | | | 20 | | 200 |
Foreshore Development | | 50 | | 12,106 | | 345 | | 2,034 | | 9,727 |
Demolition and Site Remediation | | 50 | | 2,382 | | 1,037 | | 400 | | 945 |
Cityport commercial allowance | | 50 | | | | | | 735 | | Ongoing |
| | | | | | | | | | |
Sub-total Cairns Cityport | | | | | | | | 10,245 | | |
| | | | | | | | | | |
Corporate minor plant and equipment | | 50 | | | | | | 868 | | Ongoing |
| | | | | | | | | | |
Total Property, Plant and Equipment | | | | | | | | 134,690 | | |
| | | | | | | | | | |
TOTAL CAIRNS PORT AUTHORITY | | | | | | | | 134,690 | | |
| | | | | | | | | | |
| | | | | |
CENTRAL QUEENSLAND PORTS AUTHORITY | | | | | | | | | | |
| | | | | |
Property, Plant and Equipment | | | | | | | | | | |
Port of Gladstone | | | | | | | | | | |
RG Tanna Coal Terminal expansion | | 30 | | 773,516 | | 670,514 | | 103,002 | | |
RG Tanna Coal Terminal projects | | 30 | | 102,610 | | 15,829 | | 18,977 | | 67,804 |
Wiggins Island feasibility study and engineering works | | 30 | | 11,190 | | 9,189 | | 2,001 | | |
Fisherman’s Landing expansion | | 30 | | 17,495 | | 9,858 | | 5,501 | | 2,136 |
Port Central | | 30 | | 23,883 | | 7,790 | | 5,645 | | 10,448 |
Commercial buildings | | 30 | | 500 | | 185 | | 315 | | |
Marina works | | 30 | | 11,800 | | | | 1,801 | | 9,999 |
Minor plant and equipment | | 30 | | 48,156 | | 16,505 | | 12,586 | | 19,065 |
| | | | | | | | | | |
Sub-total Port of Gladstone | | | | | | | | 149,828 | | |
| | | | | | | | | | |
Port of Rockhampton | | | | | | | | | | |
Minor plant and equipment | | 30 | | 450 | | 10 | | 80 | | 360 |
| | | | | | | | | | |
Sub-total Port of Rockhampton | | | | | | | | 80 | | |
| | | | | | | | | | |
Total Property, Plant and Equipment | | | | | | | | 149,908 | | |
| | | | | | | | | | |
TOTAL CENTRAL QUEENSLAND PORTS AUTHORITY | | | | | | | | 149,908 | | |
| | | | | | | | | | |
| | | | | | |
| 146 | | Capital Statement 2007-08 | | |
Transport
| | | | | | | | | | |
Project | | Statistical
Division | | Total
Estimated
Cost
$’000 | | Expenditure
to 30-06-07
$’000 | | Budget
2007-08 $’000 | | Post
2007-08 $’000 |
MACKAY PORT AUTHORITY | | | | | | | | | | |
| | | | | |
Property, Plant and Equipment | | | | | | | | | | |
Mackay Seaport | | | | | | | | | | |
Central land acquisition | | 40 | | 1,500 | | | | 1,500 | | |
Pile Yard improvements | | 40 | | 420 | | | | 420 | | |
Presto Avenue Stormwater—Stage 2 | | 40 | | 270 | | 150 | | 120 | | |
Mackay Harbour security enhancements | | 40 | | 1,175 | | | | 1,175 | | |
Mackay Harbour Quarantine Facility | | 40 | | 1,500 | | | | 1,500 | | |
Stormwater infrastructure | | 40 | | 300 | | | | 100 | | 200 |
Slade Point Road Access—Roundabout | | 40 | | 2,100 | | | | 100 | | 2,000 |
Conservation Area fencing | | 40 | | 100 | | | | 100 | | |
Land subdivision and works | | 40 | | 2,559 | | 109 | | 2,450 | | |
| | | | | | | | | | |
Sub-total Mackay Seaport | | | | | | | | 7,465 | | |
| | | | | | | | | | |
Mackay Airport | | | | | | | | | | |
Airport commercial landside lease area | | 40 | | 1,900 | | | | 1,900 | | |
Plant and equipment replacement | | 40 | | 440 | | | | 440 | | |
Public Safety Area | | 40 | | 1,750 | | | | 250 | | 1,500 |
Terminal expansion/renovation | | 40 | | 2,250 | | | | 500 | | 1,750 |
Long Term overflow carpark | | 40 | | 1,200 | | | | 1,200 | | |
Stormwater infrastructure | | 40 | | 300 | | | | 100 | | 200 |
Covered Walkways—drop off area | | 40 | | 1,000 | | | | 100 | | 900 |
Western General Aviation Airside Apron | | 40 | | 1,100 | | | | 1,100 | | |
| | | | | | | | | | |
Sub-total Mackay Airport | | | | | | | | 5,590 | | |
| | | | | | | | | | |
Corporate Minor Plant and Equipment | | | | | | | | | | |
Financial Management System | | 40 | | 350 | | | | 350 | | |
Maintenance Facilities—consolidation | | 40 | | 1,000 | | | | 1,000 | | |
Plant and equipment replacement | | 40 | | 843 | | | | 843 | | |
Computer network replacement | | 40 | | 400 | | | | 400 | | |
| | | | | | | | | | |
Total Property, Plant and Equipment | | | | | | | | 15,648 | | |
| | | | | | | | | | |
TOTAL MACKAY PORT AUTHORITY | | | | | | | | 15,648 | | |
| | | | | | | | | | |
| | | | | | |
| | Capital Statement 2007-08 | | 147 |
Transport
| | | | | | | | | | |
Project | | Statistical
Division | | Total
Estimated
Cost
$’000 | | Expenditure
to 30-06-07
$’000 | | Budget
2007-08 $’000 | | Post
2007-08 $’000 |
PORTS CORPORATION OF QUEENSLAND | | | | | | | | | | |
| | | | | |
Property, Plant and Equipment | | | | | | | | | | |
Mourilyan Wharf and Dolphins | | 50 | | 1,000 | | | | 1,000 | | |
Thursday Island Customs Wharf | | 50 | | 1,000 | | | | 1,000 | | |
Quintell Beach Barge Ramp development | | 50 | | 1,900 | | | | 1,900 | | |
Head Office miscellaneous plant and equipment (including Cooktown and Cape Flattery) | | 05 | | | | | | 472 | | Ongoing |
Louisa Creek land acquisitions | | 40 | | 10,000 | | 4,959 | | 1,200 | | 3,841 |
Abbot Point Expansion Stage 2—X21 | | 40 | | 116,000 | | 88,000 | | 28,000 | | |
Port Development | | | | | | | | | | |
Lucinda port development | | 45 | | | | | | 6 | | Ongoing |
Mourilyan port development | | 50 | | | | | | 305 | | Ongoing |
Weipa port development | | 50 | | | | | | 24 | | Ongoing |
Thursday Island port development | | 50 | | | | | | 231 | | Ongoing |
Hay Point port development | | 40 | | | | | | 379 | | Ongoing |
Abbot Point port development | | 40 | | | | | | 2,905 | | Ongoing |
Karumba port development | | 55 | | | | | | 6 | | Ongoing |
| | | | | | | | | | |
Total Property, Plant and Equipment | | | | | | | | 37,428 | | |
| | | | | | | | | | |
TOTAL PORTS CORPORATION OF QUEENSLAND | | | | | | | | 37,428 | | |
| | | | | | | | | | |
| | | | | |
TOWNSVILLE PORT AUTHORITY | | | | | | | | | | |
| | | | | |
Property, Plant and Equipment | | | | | | | | | | |
Port Expansion—environmental impact statement | | 45 | | 5,000 | | | | 2,000 | | 3,000 |
High Voltage Power Reticulation Upgrade Port Wide Stages 2 & 3 | | 45 | | 2,195 | | 881 | | 1,314 | | |
Sewerage Pump Station | | 45 | | 635 | | | | 635 | | |
Berth 2,3,4 High Density | | 45 | | 543 | | | | 543 | | |
Polyethylene Firewater Line Upgrade | | | | | | | | | | |
Minor plant and equipment | | 45 | | | | | | 2,411 | | Ongoing |
| | | | | | | | | | |
Total Property, Plant and Equipment | | | | | | | | 6,903 | | |
| | | | | | | | | | |
TOTAL TOWNSVILLE PORT AUTHORITY | | | | | | | | 6,903 | | |
| | | | | | | | | | |
TOTAL TRANSPORT | | | | | | | | 2,480,935 | | |
| | | | | | | | | | |
| * | Funded fully or in part under the Smart State Building Fund |
| | | | | | |
| 148 | | Capital Statement 2007-08 | | |
TREASURY
The total capital expenditure program for the Treasury portfolio in 2007-08 will be $79.7 million. The portfolio consists of Treasury Department, the Shared Service Agency and CorpTech.
Treasury Department
Funding of $13.8 million is provided for the further implementation and development of the Revenue Management System within the Office of State Revenue. The system employs contemporary technology to provide revenue and information management and e-business capability to better service the Government and people of Queensland in collecting and administering State tax revenue streams.
CorpTech
CorpTech is the technology centre of skill established under the Shared Service Initiative.
CorpTech has a capital expenditure program in 2007-08 of $57.9 million. This program will provide innovative whole-of-Government corporate applications and infrastructure solutions for the shared service providers and to the agencies within Government.
Shared Service Agency
Property, plant and equipment expenditure of $4 million will be allocated towards the ongoing operational requirements of the Shared Service Agency, including $1.4 million towards the consolidation of Shared Service Agency information and communication technology services into one service provision model. This will allow all Shared Service Agency staff to utilise an information and communication technology environment that encompasses standardised business applications and common software products and technologies.
| | | | | | |
| | Capital Statement 2007-08 | | 149 |
Treasury
| | | | | | | | | | |
Project | | Statistical
Division | | Total
Estimated
Cost $’000 | | Expenditure
to 30-06-07
$’000 | | Budget
2007-08 $’000 | | Post
2007-08 $’000 |
TREASURY DEPARTMENT | | | | | | | | | | |
| | | | | |
Property, Plant and Equipment | | | | | | | | | | |
Asset replacement | | 05 | | | | | | 2,618 | | Ongoing |
Documents & Records Management Improvement Project (eDRMS) | | 05 | | | | | | 92 | | Ongoing |
OSR—Revenue Management System | | 05 | | 4,614 | | 2,028 | | 1,071 | | 1,515 |
| | | | | | | | | | |
Total Property, Plant and Equipment | | | | | | | | 3,781 | | |
| | | | | | | | | | |
Other Capital Expenditure | | | | | | | | | | |
Asset replacement | | 05 | | | | | | 60 | | Ongoing |
eDRMS | | 05 | | 1,653 | | 1,116 | | 537 | | |
OSR—Revenue Management System | | 05 | | 49,088 | | 31,136 | | 12,692 | | 5,260 |
QOGR—Corporate Office of Gaming System (enhancement) | | 05 | | 700 | | | | 700 | | |
| | | | | | | | | | |
Total Other Capital Expenditure | | | | | | | | 13,989 | | |
| | | | | | | | | | |
TOTAL TREASURY DEPARTMENT | | | | | | | | 17,770 | | |
| | | | | | | | | | |
| | | | | |
CORPTECH | | | | | | | | | | |
| | | | | |
Property, Plant and Equipment | | | | | | | | | | |
Asset replacement | | 05 | | | | | | 500 | | Ongoing |
Other | | 05 | | | | | | 150 | | Ongoing |
| | | | | | | | | | |
Total Property, Plant and Equipment | | | | | | | | 650 | | |
| | | | | | | | | | |
Other Capital Expenditure | | | | | | | | | | |
Shared Service Solutions (SSS) program | | 05 | | 193,783 | | 126,996 | | 57,276 | | 9,511 |
| | | | | | | | | | |
Total Other Capital Expenditure | | | | | | | | 57,276 | | |
| | | | | | | | | | |
TOTAL CORPTECH | | | | | | | | 57,926 | | |
| | | | | | | | | | |
| | | | | | |
| 150 | | Capital Statement 2007-08 | | |
Treasury
| | | | | | | | | | |
Project | | Statistical
Division | | Total
Estimated
Cost
$’000 | | Expenditure
to 30-06-07
$’000 | | Budget
2007-08 $’000 | | Post
2007-08 $’000 |
SHARED SERVICE AGENCY | | | | | | | | | | |
| | | | | |
Property, Plant and Equipment | | | | | | | | | | |
ICT project | | 05 | | 1,780 | | 400 | | 1,380 | | |
Asset replacement | | 05 | | | | | | 2,581 | | Ongoing |
| | | | | | | | | | |
Total Property, Plant and Equipment | | | | | | | | 3,961 | | |
| | | | | | | | | | |
TOTAL SHARED SERVICE AGENCY | | | | | | | | 3,961 | | |
| | | | | | | | | | |
TOTAL TREASURY | | | | | | | | 79,657 | | |
| | | | | | | | | | |
| | | | | | |
| | Capital Statement 2007-08 | | 151 |
APPENDIX A -
ENTITIES INCLUDED IN CAPITAL OUTLAYS 2007-08
Department of Child Safety
Department of Communities
Queensland Corrective Services
Disability Services Queensland
Education, Training and the Arts
Australian Agricultural College Corporation
Library Board of Queensland
Queensland Art Gallery
Queensland Museum
Queensland Performing Arts Trust
Queensland Studies Authority
Corporate and Professional Services
Electoral Commission of Queensland
Department of Emergency Services
Department of Employment and Industrial Relations
Environmental Protection Agency
Queensland Health
The Council of the Queensland Institute of Medical Research
Department of Housing
Department of Infrastructure
Property Services Group
Water Infrastructure Projects
Airport Link
Department of Justice and Attorney-General
Public Trust Office
Legal Aid Queensland
Crime and Misconduct Commission
Anti-Discrimination Commission
Legislative Assembly of Queensland
Department of Local Government, Planning, Sport and Recreation
Department of Main Roads
RoadTek
Queensland Motorways Limited
Department of Mines and Energy
CS Energy Limited
ENERGEX Limited
Stanwell Corporation Limited
Tarong Energy Corporation Limited
Powerlink Queensland
Enertrade (until 30 September 2007)
Ergon Energy Corporation Limited
| | | | | | |
| 152 | | Capital Statement 2007-08 | | |
Department of Natural Resources and Water
Gladstone Area Water Board
Mount Isa Water Board
SunWater
Burnett Water
Office of the Governor
Office of the Ombudsman
Office of the Public Service Commissioner
Queensland Police Service
Department of the Premier and Cabinet
Commission for Children and Young People and Child Guardian
South Bank Corporation
Major Sports Facilities Authority
Department of Primary Industries and Fisheries
Forestry Plantations Queensland
QRAA
Department of Public Works
QBuild
QFleet
Project Services
SDS (Sales and Distribution Services)
CITEC
Queensland Audit Office
Department of State Development
Department of Tourism, Fair Trading and Wine Industry Development
Tourism Queensland
Queensland Transport
Queensland Rail
Port of Brisbane Corporation
Bundaberg Port Authority
Cairns Port Authority
Central Queensland Ports Authority
Mackay Port Authority
Ports Corporation of Queensland
Townsville Port Authority
Treasury Department
CorpTech
Shared Service Agency
| | | | | | |
| | Capital Statement 2007-08 | | 153 |
APPENDIX B - SMART STATE BUILDING FUND
ALLOCATIONS BY PORTFOLIO
The $1.4 billion Smart State Building Fund was announced in late 2003 and detailed in the 2004-05 Budget. Projects funded through the Smart State Building Fund are highlighted in the individual portfolio tables in Chapter 4 by an asterisk (*).
The 2007-08 Budget represents the final year of operations of the Smart State Building Fund, with $48 million of residual funding incorporated into individual agency budgets post-2007-08. This remaining funding is allocated towards road and rail projects, health projects and the Gold Coast Institute of TAFE, Coomera.
Smart State Building Fund1
| | | | | | | | |
Department | | 2004-05
Actual
$’000 | | 2005-06
Actual
$’000 | | 2006-07
Est.Act.
$’000 | | 2007-08
Budget
$’000 |
Communities2 | | 271 | | 1,128 | | 51 | | 250 |
Disability Services Queensland | | 592 | | 4,227 | | 5,246 | | 4,935 |
Education, Training and the Arts3 | | 43,529 | | 146,489 | | 159,998 | | 14,071 |
Emergency Services | | 2,210 | | 4,790 | | 3,000 | | — |
Environmental Protection Agency4 | | 3,645 | | 3,492 | | 3,680 | | 4,405 |
Health | | 9,710 | | 36,473 | | 72,689 | | 71,146 |
Housing | | 7,712 | | 13,252 | | 8,642 | | 1,894 |
Justice and Attorney-General | | 315 | | 1,989 | | 2,571 | | 6,125 |
Main Roads | | 41,315 | | 66,230 | | 60,624 | | 11,019 |
Mines and Energy5 | | 696 | | 938 | | 2,216 | | — |
Natural Resources and Water6 | | 1,099 | | 1,079 | | 2,749 | | — |
Police | | 6,300 | | 10,952 | | 12,748 | | — |
Primary Industries and Fisheries | | — | | 46 | | 115 | | 940 |
Public Works | | 2,050 | | 1,811 | | 1,390 | | 7,249 |
State Development7 | | — | | — | | — | | — |
Transport | | 10,435 | | 25,860 | | 21,450 | | 6,000 |
Sub-Total Departments | | 129,879 | | 318,756 | | 357,169 | | 128,034 |
Queensland Rail | | 9,506 | | 86,330 | | 218,951 | | 70,036 |
Total | | 139,385 | | 405,086 | | 576,120 | | 198,070 |
Notes
| 1. | Numbers may not add due to rounding. |
| 2. | Projects previously reported under the former Department of Aboriginal and Torres Strait Islander Policy. |
| 3. | Includes project previously reported under the former Department of Employment and Training. |
| 4. | Includes a component of a project previously reported under the former Department of Natural Resources, Mines and Water. |
| 5. | Project previously reported under the former Department of Natural Resources, Mines and Water. |
| 6. | Excludes projects now reported under other agencies (see above) and a component of funding now classified as an expense. |
| 7. | $20m allocated for the Brain Institute reclassified as a loan, reflecting the funding agreement with the University of Queensland. |
| | | | | | |
| 154 | | Capital Statement 2007-08 | | |
APPENDIX C -
KEY CONCEPTS AND COVERAGE
COVERAGE OF THE CAPITAL STATEMENT
Under accrual output budgeting, capital is the stock of assets including property, plant and equipment, intangible assets and inventories that an agency owns and/or controls and uses in the delivery of services, as well as capital grants made to other entities. For the purpose of this Budget Paper, capital outlays refer to the gross acquisition of these assets. The following definitions are applicable throughout this document:
| • | | total capital outlays—property, plant and equipment outlays, other capital expenditure and capital grants |
| • | | property, plant and equipment outlays—property, plant and equipment outlays as per the financial statements excluding asset sales, depreciation and revaluations |
| • | | other capital expenditure—intangibles, such as software development, and self-generating and regenerating assets |
| • | | capital grants—capital grants to other entities (excluding grants to other Government departments, statutory bodies and individuals under the First Home Owners Grant scheme). |
Capital outlays include information for all bodies defined as reporting entities for the purpose of whole-of-Government financial reporting requirements, excluding Public Financial Corporations. Projects without a recorded total estimated cost are ongoing. The entities included in scope for the Capital Statement are listed in Appendix A.
The Capital Statement only provides details of projects being undertaken within Queensland.
CAPITAL CONTINGENCY
Consistent with the approach adopted in previous years, a capital contingency reserve has been included. This reserve recognises that while agencies budget to fully use their capital works allocation, circumstances such as project lead-in times, project management constraints, unexpected weather conditions and capacity constraints such as the supply of labour and materials may prevent full usage. On a whole-of-Government basis, there is likely to be underspending, resulting in a carryover of capital allocations.
| | | | | | |
| | Capital Statement 2007-08 | | 155 |
By authority: R. J. Hunt, Government Printer, Queensland-2007
State Budget 2007-08
Capital Statement
Budget Paper No.3
www.budget.qld.gov.au


Appropriation Bill 2007

Appropriation Bill 2007
Contents
| | | | |
| | | | | Page |
| 1 | | Short title | | 4 |
| | |
2 | | Appropriation for 2007–2008 | | 4 |
| | |
3 | | Supply for 2008–2009 | | 4 |
| | |
4 | | Repeals | | 5 |
| | |
Schedule 1 | | Appropriation summary for 2007–2008 | | 6 |
| | |
Schedule 2 | | Appropriation for 2007–2008 | | 8 |
2007
A Bill
for
An Act authorising the Treasurer to pay amounts from the
consolidated fund for departments for the financial years
starting 1 July 2007 and 1 July 2008
Appropriation Bill 2007
The Parliament of Queensland enacts—
This Act may be cited as the Appropriation Act 2007.
Note—
Under the Financial Administration and Audit Act 1977, section 22, words used in this Act that are defined in the Financial Administration and Audit Act 1977 have the same meaning the words have in that Act, subject to a contrary intention in this Act.
| 2 | Appropriation for 2007–2008 |
| | (1) | The Treasurer is authorised to pay $30 155 840 000 from the consolidated fund for departments as itemised in schedule 1 for the financial year starting 1 July 2007. |
| | (2) | For each department, the vote amount mentioned for the department in schedule 2— |
| | (a) | is appropriated for the financial year for the department for application to its departmental outputs, equity adjustment and administered items as stated in schedule 2; and |
| | (b) | includes amounts for departmental outputs, equity adjustment and administered items delivered by the department in the financial year starting 1 July 2006 but for which the department has not been paid in that financial year. |
| | (3) | The amount mentioned in subsection (1) includes the amount already authorised by the Appropriation Act 2006, section 3, to be paid for the financial year starting 1 July 2007. |
The Treasurer is authorised to pay $15 000 000 000 from the consolidated fund for departments for the financial year starting 1 July 2008.
4
Appropriation Bill 2007
The following Acts are repealed—
| | • | | Appropriation Act 2004 No. 17 |
| | • | | Appropriation (Supplementary 2003-4) Act 2005 No. 1. |
5
Appropriation Bill 2007
Schedule 1 Appropriation summary for 2007–2008
section 2(1)
| | | | | | | |
Department | | Budget
2006–2007
$’000 | | Est. Actual
2006–2007
$’000 | | Vote 2007–2008
$’000 | |
Department of Aboriginal and Torres Strait Islander Policy | | 70 586 | | 9 450 | | — | |
Department of Child Safety | | 532 670 | | 515 127 | | 572 889 | |
Department of Communities | | 527 501 | | 576 714 | | 689 713 | |
Department of Corrective Services | | 597 599 | | 573 583 | | 675 097 | |
Department of Education, Training and the Arts | | 6 007 794 | | 6 570 902 | | 6 856 437 | |
Department of Emergency Services | | 414 383 | | 434 284 | | 576 638 | |
Department of Employment and Industrial Relations | | 52 935 | | 130 546 | | 144 365 | |
Department of Employment and Training | | 686 208 | | 167 569 | | — | |
Department of Health | | 4 463 650 | | 4 484 848 | | 4 858 882 | |
Department of Housing | | 205 609 | | 214 337 | | 286 872 | |
Department of Infrastructure (formerly The Coordinator-General) | | 136 078 | | 653 306 | | (67 413 | ) |
Department of Justice and Attorney-General | | 417 942 | | 394 141 | | 481 123 | |
Department of Local Government, Planning, Sport and Recreation | | 876 802 | | 919 877 | | 933 908 | |
Department of Main Roads | | 1 742 312 | | 1 858 551 | | 2 531 255 | |
Department of Mines and Energy | | 405 989 | | 692 963 | | 718 943 | |
Department of Natural Resources and Water | | 591 588 | | 844 901 | | 505 184 | |
Department of Police | | 1385 052 | | 1 320 044 | | 1 546 471 | |
Department of the Premier and Cabinet | | 170 705 | | 249 393 | | 284 535 | |
Department of Primary Industries and Fisheries | | 255 990 | | 305 357 | | 292 264 | |
Department of Public Works | | 247 426 | | 179 844 | | 326 533 | |
Department of State Development | | 279 340 | | 251 495 | | 360 440 | |
Department of Tourism, Fair Trading and Wine Industry Development | | 92 120 | | 101 039 | | 115 990 | |
Department of Transport | | 2 265 973 | | 2 604 003 | | 3 110 746 | |
6
Appropriation Bill 2007
Schedule 1 (continued)
| | | | | | |
Department | | Budget 2006–2007
$’000 | | Est. Actual
2006–2007
$’000 | | Vote 2007–2008
$’000 |
Disability Services Queensland | | 540 525 | | 505 727 | | 766 113 |
Electoral Commission of Queensland | | 23 818 | | 22 561 | | 11 505 |
Environmental Protection Agency | | 265 062 | | 276 399 | | 292 072 |
Office of the Governor | | 4 226 | | 4 545 | | 4 443 |
Office of the Ombudsman | | 5 259 | | 5 795 | | 5 983 |
Office of the Public Service Commissioner | | 6 756 | | 8 390 | | 7 055 |
Queensland Audit Office | | 4 838 | | 4 846 | | 5 268 |
Treasury Department | | 703 608 | | 1 881 932 | | 3 262 529 |
TOTAL | | 23 980 344 | | 26 762 469 | | 30 155 840 |
| | | | | | |
7
Appropriation Bill 2007
Schedule 2 Appropriation for 2007–2008
section 2(2)
| | | | | | | | | |
Minister/Organisational Unit | | Budget
2006–2007
$’000 | | | Est. Actual
2006–2007
$’000 | | | Budget
2007–2008
$’000 | |
Estimates Committee A | | | | | | | | | |
| | | |
PREMIER AND MINISTER FOR TRADE | | | | | | | | | |
| | | |
Office of the Governor | | | | | | | | | |
Controlled Items | | | | | | | | | |
Departmental Outputs | | 4 226 | | | 4 545 | | | 4 443 | |
Equity Adjustment | | — | | | — | | | — | |
Administered Items | | — | | | — | | | — | |
| | | | | | | | | |
Vote | | 4 226 | | | 4 545 | | | 4 443 | |
| | | | | | | | | |
Queensland Audit Office | | | | | | | | | |
Controlled Items | | | | | | | | | |
Departmental Outputs | | 4 930 | | | 4 938 | | | 5 360 | |
Equity Adjustment | | (92 | ) | | (92 | ) | | (92 | ) |
Administered Items | | — | | | — | | | — | |
| | | | | | | | | |
Vote | | 4 838 | | | 4 846 | | | 5 268 | |
| | | | | | | | | |
Office of the Public Service Commissioner | | | | | | | | | |
Controlled Items | | | | | | | | | |
Departmental Outputs | | 6 756 | | | 8 390 | | | 7 055 | |
Equity Adjustment | | — | | | — | | | — | |
Administered Items | | — | | | — | | | — | |
| | | | | | | | | |
Vote | | 6 756 | | | 8 390 | | | 7 055 | |
| | | | | | | | | |
8
Appropriation Bill 2007
Schedule 2 (continued)
| | | | | | | |
Minister/Organisational Unit | | Budget
2006–2007
$’000 | | Est. Actual
2006–2007
$’000 | | Budget
2007–2008
$’000 | |
Department of the Premier and Cabinet | | | | | | | |
Controlled Items | | | | | | | |
Departmental Outputs | | 80 076 | | 104 540 | | 118 322 | |
Equity Adjustment | | 13 | | 31 426 | | 56 046 | |
Administered Items | | 90 616 | | 113 427 | | 110 167 | |
| | | | | | | |
Vote | | 170 705 | | 249 393 | | 284 535 | |
| | | | | | | |
| | | |
DEPUTY PREMIER, TREASURER AND MINISTER FOR INFRASTRUCTURE | | | | | | | |
| | | |
Treasury Department | | | | | | | |
Controlled Items | | | | | | | |
Departmental Outputs | | 103 290 | | 105 213 | | 113 245 | |
Equity Adjustment | | 3 125 | | 4 388 | | (15 539 | ) |
Administered Items | | 597 193 | | 1 772 331 | | 3 164 823 | |
| | | | | | | |
Vote | | 703 608 | | 1 881 932 | | 3 262 529 | |
| | | | | | | |
| | | |
Department of Infrastructure (formerly The Coordinator-General) | | | | | | | |
| | | |
Controlled Items | | | | | | | |
Departmental Outputs | | 36 078 | | 70 139 | | 49 784 | |
Equity Adjustment | | 100 000 | | 566 251 | | (133 816 | ) |
Administered Items | | — | | 16 916 | | 16 619 | |
| | | | | | | |
Vote | | 136 078 | | 653 306 | | (67 413 | ) |
| | | | | | | |
9
Appropriation Bill 2007
Schedule 2 (continued)
| | | | | | |
Minister/Organisational Unit | | Budget
2006–2007
$’000 | | Est. Actual
2006–2007
$’000 | | Budget
2007–2008
$’000 |
| MINISTER FOR PUBLIC WORKS, HOUSING AND INFORMATION AND COMMUNICATION TECHNOLOGY | | | | | | |
| | | |
Department of Public Works | | | | | | |
Controlled Items | | | | | | |
Departmental Outputs | | 59 501 | | 76 764 | | 93 762 |
Equity Adjustment | | 168 573 | | 81 724 | | 187 237 |
Administered Items | | 19 352 | | 21 356 | | 45 534 |
| | | | | | |
Vote | | 247 426 | | 179 844 | | 326 533 |
| | | | | | |
Department of Housing | | | | | | |
Controlled Items | | | | | | |
Departmental Outputs | | 127 804 | | 127 691 | | 122 237 |
Equity Adjustment | | 77 805 | | 85 146 | | 164 635 |
Administered Items | | — | | 1 500 | | — |
| | | | | | |
Vote | | 205 609 | | 214337 | | 286 872 |
| | | | | | |
Estimates Committee B | | | | | | |
| | | |
MINISTER FOR CHILD SAFETY | | | | | | |
| | | |
Department of Child Safety | | | | | | |
Controlled Items | | | | | | |
Departmental Outputs | | 498 797 | | 488 856 | | 548 044 |
Equity Adjustment | | 33 873 | | 26 271 | | 24 845 |
Administered Items | | — | | — | | — |
| | | | | | |
Vote | | 532 670 | | 515 127 | | 572 889 |
| | | | | | |
10
Appropriation Bill 2007
Schedule 2 (continued)
| | | | | | |
Minister/Organisational Unit | | Budget
2006–2007
$’000 | | Est. Actual
2006–2007
$’000 | | Budget
2007–2008
$’000 |
MINISTER FOR HEALTH | | | | | | |
| | | |
Department of Health | | | | | | |
Controlled Items | | | | | | |
Departmental Outputs | | 4 171 238 | | 4 219 847 | | 4 621 881 |
Equity Adjustment | | 289 192 | | 252 541 | | 222 226 |
Administered Items | | 3 220 | | 12 460 | | 14 775 |
| | | | | | |
Vote | | 4 463 650 | | 4 484 848 | | 4 858 882 |
| | | | | | |
| | | |
MINISTER FOR POLICE AND CORRECTIVE SERVICES | | | | | | |
| | | |
Department of Police | | | | | | |
Controlled Items | | | | | | |
Departmental Outputs | | 1 263 166 | | 1 244 105 | | 1 387 907 |
Equity Adjustment | | 121 495 | | 75 195 | | 158 159 |
Administered Items | | 391 | | 744 | | 405 |
| | | | | | |
Vote | | 1 385 052 | | 1 320 044 | | 1 546 471 |
| | | | | | |
Department of Corrective Services | | | | | | |
Controlled Items | | | | | | |
Departmental Outputs | | 402 226 | | 408 243 | | 472 615 |
Equity Adjustment | | 195 373 | | 165 340 | | 202 482 |
Administered Items | | — | | — | | — |
| | | | | | |
Vote | | 597 599 | | 573 583 | | 675 097 |
| | | | | | |
11
Appropriation Bill 2007
Schedule 2 (continued)
| | | | | | |
Minister/Organisational Unit | | Budget
2006–2007
$’000 | | Est. Actual
2006–2007
$’000 | | Budget
2007–2008
$’000 |
Estimates Committee C | | | | | | |
| | | |
MINISTER FOR TRANSPORT AND MAIN ROADS | | | | | | |
| | | |
Department of Transport | | | | | | |
Controlled Items | | | | | | |
Departmental Outputs | | 1 734 489 | | 1 823 039 | | 1 965 764 |
Equity Adjustment | | 233 074 | | 358 583 | | 550 904 |
Administered Items | | 298 410 | | 422 381 | | 594 078 |
| | | | | | |
Vote | | 2 265 973 | | 2 604 003 | | 3 110 746 |
| | | | | | |
Department of Main Roads | | | | | | |
Controlled Items | | | | | | |
Departmental Outputs | | 1 137 303 | | 1 195 614 | | 1 170 633 |
Equity Adjustment | | 605 009 | | 662 937 | | 1 360 622 |
Administered Items | | — | | — | | — |
| | | | | | |
Vote | | 1 742 312 | | 1 858 551 | | 2 531 255 |
| | | | | | |
| MINISTER FOR STATE DEVELOPMENT, EMPLOYMENT AND INDUSTRIAL RELATIONS | | | | | | |
| | | |
Department of State Development | | | | | | |
Controlled Items | | | | | | |
Departmental Outputs | | 222 571 | | 197 339 | | 218 871 |
Equity Adjustment | | 22 454 | | 9 874 | | 78 645 |
Administered Items | | 34 315 | | 44 282 | | 62 924 |
| | | | | | |
Vote | | 279 340 | | 251 495 | | 360 440 |
| | | | | | |
12
Appropriation Bill 2007
Schedule 2 (continued)
| | | | | | | | |
Minister/Organisational Unit | | Budget
2006–2007
$’000 | | | Est. Actual
2006–2007
$’000 | | | Budget
2007–2008
$’000 |
Department of Employment and Industrial Relations | | | | | | | | |
Controlled Items | | | | | | | | |
Departmental Outputs | | 54 086 | | | 131 697 | | | 144 018 |
Equity Adjustment | | (1 151 | ) | | (1 151 | ) | | 347 |
Administered Items | | — | | | — | | | — |
| | | | | | | | |
Vote | | 52 935 | | | 130 546 | | | 144 365 |
| | | | | | | | |
| MINISTER FOR NATURAL RESOURCES AND WATER AND MINISTER ASSISTING THE PREMIER IN NORTH QUEENSLAND | | | | | | | | |
| | | |
Department of Natural Resources and Water | | | | | | | | |
Controlled Items | | | | | | | | |
Departmental Outputs | | 509 836 | | | 660 319 | | | 487 709 |
Equity Adjustment | | 6 380 | | | 5 025 | | | 104 |
Administered Items | | 75 372 | | | 179 557 | | | 17 371 |
| | | | | | | | |
Vote | | 591 588 | | | 844 901 | | | 505 184 |
| | | | | | | | |
Estimates Committee D | | | | | | | | |
| | | |
MINISTER FOR MINES AND ENERGY | | | | | | | | |
| | | |
Department of Mines and Energy | | | | | | | | |
Controlled Items | | | | | | | | |
Departmental Outputs | | 18 289 | | | 81 006 | | | 87 946 |
Equity Adjustment | | — | | | 1 778 | | | 2 705 |
Administered Items | | 387 700 | | | 610 179 | | | 628 292 |
| | | | | | | | |
Vote | | 405 989 | | | 692 963 | | | 718 943 |
| | | | | | | | |
13
Appropriation Bill 2007
Schedule 2 (continued)
| | | | | | |
Minister/Organisational Unit | | Budget
2006–2007
$’000 | | Est. Actual
2006–2007
$’000 | | Budget
2007–2008
$’000 |
MINISTER FOR EMERGENCY SERVICES |
| | | |
Department of Emergency Services | | | | | | |
Controlled Items | | | | | | |
Departmental Outputs | | 395 658 | | 418 679 | | 479 303 |
Equity Adjustment | | 18 725 | | 15 605 | | 97 335 |
Administered Items | | — | | — | | — |
| | | | | | |
Vote | | 414 383 | | 434 284 | | 576 638 |
| | | | | | |
| Estimates Committee E | | | | | | |
| | | |
MINISTER FOR EDUCATION AND TRAINING MINISTER FOR THE ARTS | | | | | | |
| | | |
Department of Education, Training and the Arts | | | | | | |
Controlled Items | | | | | | |
Departmental Outputs | | 3 998 527 | | 4 447 923 | | 4 823 163 |
Equity Adjustment | | 298 858 | | 334 242 | | 219 626 |
Administered Items | | 1 710 409 | | 1 788 737 | | 1 813 648 |
| | | | | | |
Vote | | 6 007 794 | | 6 570 902 | | 6 856 437 |
| | | | | | |
14
Appropriation Bill 2007
Schedule 2 (continued)
| | | | | | | | | |
Minister/Organisational Unit | | Budget
2006–2007
$’000 | | | Est. Actual
2006–2007
$’000 | | | Budget
2007–2008
$’000 | |
MINISTER FOR LOCAL GOVERNMENT, PLANNING AND SPORT | | | | | | | | | |
| | | |
Department of Local Government, Planning, Sport and Recreation | | | | | | | | | |
Controlled Items | | | | | | | | | |
Departmental Outputs | | 536 974 | | | 566 449 | | | 606 681 | |
Equity Adjustment | | 7 510 | | | 4 970 | | | (1 537 | ) |
Administered Items | | 332 318 | | | 348 458 | | | 328 764 | |
| | | | | | | | | |
Vote | | 876 802 | | | 919 877 | | | 933 908 | |
| | | | | | | | | |
| Estimates Committee F | | | | | | | | | |
| | | |
| MINISTER FOR TOURISM, FAIR TRADING, WINE INDUSTRY DEVELOPMENT AND WOMEN | | | | | | | | | |
| | | |
Department of Tourism, Fair Trading and Wine Industry Development | | | | | | | | | |
Controlled Items | | | | | | | | | |
Departmental Outputs | | 45 114 | | | 49 642 | | | 65 464 | |
Equity Adjustment | | (68 | ) | | (425 | ) | | 738 | |
Administered Items | | 47 074 | | | 51 822 | | | 49 788 | |
| | | | | | | | | |
Vote | | 92 120 | | | 101 039 | | | 115 990 | |
| | | | | | | | | |
15
Appropriation Bill 2007
Schedule 2 (continued)
| | | | | | | | | |
Minister/Organisational Unit | | Budget
2006–2007
$’000 | | | Est. Actual
2006–2007
$’000 | | | Budget
2007–2008
$’000 | |
| ATTORNEY-GENERAL AND MINISTER FOR JUSTICE AND MINISTER ASSISTING THE PREMIER IN WESTERN QUEENSLAND | | | | | | | | | |
| | | |
Department of Justice and Attorney-General | | | | | | | | | |
Controlled Items | | | | | | | | | |
Departmental Outputs | | 232 653 | | | 238 616 | | | 261 389 | |
Equity Adjustment | | 56 808 | | | 22 761 | | | 73 794 | |
Administered Items | | 128 481 | | | 132 764 | | | 145 940 | |
| | | | | | | | | |
Vote | | 417 942 | | | 394 141 | | | 481 123 | |
| | | | | | | | | |
Electoral Commission of Queensland | | | | | | | | | |
Controlled Items | | | | | | | | | |
Departmental Outputs | | 23 894 | | | 22 577 | | | 11 613 | |
Equity Adjustment | | (76 | ) | | (16 | ) | | (108 | ) |
Administered Items | | — | | | — | | | — | |
| | | | | | | | | |
Vote | | 23 818 | | | 22 561 | | | 11 505 | |
| | | | | | | | | |
Office of the Ombudsman | | | | | | | | | |
Controlled Items | | | | | | | | | |
Departmental Outputs | | 5 381 | | | 5 915 | | | 6 034 | |
Equity Adjustment | | (122 | ) | | (120 | ) | | (51 | ) |
Administered Items | | — | | | — | | | — | |
| | | | | | | | | |
Vote | | 5 259 | | | 5 795 | | | 5 983 | |
| | | | | | | | | |
16
Appropriation Bill 2007
Schedule 2 (continued)
| | | | | | |
Minister/Organisational Unit | | Budget
2006–2007
$’000 | | Est. Actual
2006–2007
$’000 | | Budget
2007–2008
$’000 |
MINISTER FOR ENVIRONMENT AND MULTICULTURALISM |
| | | |
Environmental Protection Agency | | | | | | |
Controlled Items | | | | | | |
Departmental Outputs | | 258 406 | | 269 978 | | 290 395 |
Equity Adjustment | | 6 656 | | 6 421 | | 1 677 |
Administered Items | | — | | — | | — |
| | | | | | |
Vote | | 265 062 | | 276 399 | | 292 072 |
| | | | | | |
| Estimates Committee G | | | | | | |
| | | |
MINISTER FOR PRIMARY INDUSTRIES AND FISHERIES | | | | | | |
| | | |
Department of Primary Industries and Fisheries | | | | | | |
Controlled Items | | | | | | |
Departmental Outputs | | 227 813 | | 269 107 | | 248 306 |
Equity Adjustment | | 11 821 | | 7 544 | | 14 369 |
Administered Items | | 16 356 | | 28 706 | | 29 589 |
| | | | | | |
Vote | | 255 990 | | 305 357 | | 292 264 |
| | | | | | |
17
Appropriation Bill 2007
Schedule 2 (continued)
| | | | | | |
Minister/Organisational Unit | | Budget
2006–2007
$’000 | | Est. Actual
2006–2007
$’000 | | Budget
2007–2008
$’000 |
| MINISTER FOR COMMUNITIES, MINISTER FOR DISABILITY SERVICES QUEENSLAND, MINISTER FOR ABORIGINAL AND TORRES STRAIT ISLANDER PARTNERSHIPS, MINISTER FOR SENIORS AND YOUTH |
| | | |
Department of Communities | | | | | | |
Controlled Items | | | | | | |
Departmental Outputs | | 359 671 | | 367 628 | | 468 628 |
Equity Adjustment | | 15 446 | | 61 799 | | 71 244 |
Administered Items | | 152 384 | | 147 287 | | 149 841 |
| | | | | | |
Vote | | 527 501 | | 576 714 | | 689 713 |
| | | | | | |
Disability Services Queensland | | | | | | |
Controlled Items | | | | | | |
Departmental Outputs | | 498 509 | | 485 330 | | 726 942 |
Equity Adjustment | | 42 016 | | 20 397 | | 39 171 |
Administered Items | | — | | — | | — |
| | | | | | |
Vote | | 540 525 | | 505 727 | | 766 113 |
| | | | | | |
| Ceased Entities | | | | | | |
| | | |
Department of Aboriginal and Torres Strait Islander Policy | | | | | | |
Controlled Items | | | | | | |
Departmental Outputs | | 36 943 | | 9 309 | | — |
Equity Adjustment | | 33 178 | | 14 | | — |
Administered Items | | 465 | | 127 | | — |
| | | | | | |
Vote | | 70 586 | | 9 450 | | — |
| | | | | | |
18
Appropriation Bill 2007
Schedule 2 (continued)
| | | | | | |
Minister/Organisational Unit | | Budget
2006–2007
$’000 | | Est. Actual
2006–2007
$’000 | | Budget
2007–2008
$’000 |
Department of Employment and Training | | | | | | |
Controlled Items | | | | | | |
Departmental Outputs | | 640 291 | | 163 944 | | — |
Equity Adjustment | | 45 917 | | 3 625 | | — |
Administered Items | | — | | — | | — |
| | | | | | |
Vote | | 686 208 | | 167 569 | | — |
| | | | | | |
Total Appropriation: | | 23 980 344 | | 26 762 469 | | 30 155 840 |
| | | | | | |
© State of Queensland 2007
19

Appropriation (Parliament) Bill 2007

Appropriation (Parliament) Bill 2007
Contents
| | | | |
| | | | | Page |
| 1 | | Short title | | 4 |
| | |
| 2 | | Appropriation for 2007–2008 | | 4 |
| | |
| 3 | | Supply for 2008–2009 | | 4 |
| | |
| 4 | | Repeals | | 5 |
| | |
| Schedule | | Appropriation for 2007–2008 | | 6 |
2007
A Bill
for
An Act authorising the Treasurer to pay amounts from the consolidated fund for the Legislative Assembly and parliamentary service for the financial years starting 1 July 2007 and 1 July 2008
Appropriation (Parliament) Bill 2007
The Parliament of Queensland enacts—
This Act may be cited as the Appropriation (Parliament) Act 2007.
Note—
Under the Financial Administration and Audit Act 1977, section 22, words used in this Act that are defined in the Financial Administration and Audit Act 1977 have the same meaning the words have in that Act, subject to a contrary intention in this Act.
| 2 | Appropriation for 2007–2008 |
| | (1) | The Treasurer is authorised to pay $64 270 000 from the consolidated fund for the Legislative Assembly and parliamentary service for the financial year starting 1 July 2007. |
| | (2) | The amount mentioned in subsection (1)— |
| | (a) | is appropriated for the financial year for the Legislative Assembly and parliamentary service for application to its departmental outputs, equity adjustment and administered items as stated in the schedule; and |
| | (b) | includes amounts for departmental outputs, equity adjustment and administered items delivered by the Legislative Assembly and parliamentary service in the financial year starting 1 July 2006 but for which it has not been paid in that financial year. |
| | (3) | The amount mentioned in subsection (1) includes the amount already authorised by the Appropriation (Parliament) Act 2006, section 3, to be paid for the financial year starting 1 July 2007. |
The Treasurer is authorised to pay $32 000 000 from the consolidated fund for the Legislative Assembly and parliamentary service for the financial year starting 1 July 2008.
4
Appropriation (Parliament) Bill 2007
The following Acts are repealed—
| | • | | Appropriation (Parliament) Act 2004 No. 16 |
| | • | | Appropriation (Parliament) (Supplementary 2003-4) Act 2005 No. 2. |
5
Appropriation (Parliament) Bill 2007
Schedule Appropriation for 2007–2008
section 2(2)
| | | | | | | | | |
| | | Budget
2006–2007 $ | | | Est. Actual
2006–2007 $ | | | Budget
2007–2008 $ | |
Controlled Items | | | | | | | | | |
Departmental Outputs | | 61 542 000 | | | 64 150 000 | | | 65 230 000 | |
Equity Adjustments | | (3 365 000 | ) | | (3 695 000 | ) | | (960 000 | ) |
Administered Items | | — | | | — | | | — | |
| | | | | | | | | |
Vote | | 58 177 000 | | | 60 455 000 | | | 64 270 000 | |
| | | | | | | | | |
© State of Queensland 2007
6