EXHIBIT (c)(i)
Consolidated Financial Statements of the Registrant
Queensland Treasury Corporation
Our Role
QTC is the Queensland Government’s central financing authority and corporate treasury services provider, with responsibility to:
| • | | provide financial and risk management advice and services to the Queensland Government and our Queensland public sector customers |
| • | | source and manage the debt funding to finance Queensland’s infrastructure requirements in the most cost-effective manner, and |
| • | | invest the State’s short- to medium-term cash surpluses, maximising returns to our customers through a conservative risk management framework. |
QTC does not formulate Government policy, but works within the policy frameworks developed by the Government and Queensland Treasury. QTC’s role is not to take direct equity in projects, however, we may, at the direction of the Government, invest equity in special purpose vehicles established to achieve a specific outcome for the State.
Financial advisory and risk management services
QTC works closely with its public sector customers to assist them to manage risk in their financial transactions and achieve the best financial solutions for their organisations and for Queensland. In assisting customers, QTC does not provide advice that is contrary to the interests of the State.
We encourage our customers and Queensland Treasury, our major stakeholder, to use our organisation as an extension of their resources, by:
| • | | providing them with access, on a cost-recovery basis, to professional skills and resources to ensure that their financial risks are identified and managed on a consistent basis |
| • | | acting as a central store of knowledge and expertise on financial structures and transactions, and the risks and benefits that they encompass |
| • | | providing Queensland Treasury with advice on matters of financial and commercial policy and risk relating to the State and its entities, and |
| • | | working as a conduit between the Government and the private sector, using our economies of scale and scope to ensure that the best possible solutions are obtained. |
Debt funding and management
QTC borrows funds in the domestic and international markets in a manner that minimises the State’s, and QTC’s, liquidity and refinancing risk. We then lend these funds to our customers, or use them to manage our customers’ debt or to refinance maturing debt.
With responsibility for all of the State’s debt raisings, QTC is able to capture significant economies of scale and scope in the issuance, management and administration of debt.
These economies, together with our AAA credit rating, result in a low cost of debt for Queensland’s public sector.
Short- to medium-term investments
QTC uses its financial markets expertise, developed through strong relationships with the domestic and international markets, together with its understanding of debt management and the management of financial risk, to provide customers with investment solutions that achieve a high return within a conservative risk environment.
Customers can choose from an overnight facility, a managed short-term fund, or fixed-term facilities. Alternatively, we can assist them to source appropriate solutions from the marketplace.
2006-2007 ANNUAL REPORT 1

Chairman’s and Chief Executive’s report
In a challenging year that placed considerable demands on our resources, QTC’s teams delivered unprecedented value to customers. We maintained our position as the foremost semi-government issuer of Australian dollar denominated bonds both in Australia and overseas, and issued $ 5.2 billion of benchmark bonds, sourcing$4.5 billion domestically and $0.7 billion offshore.
We achieved total savings for customers, from portfolio management and borrowings margins, of $69.0 million, increasing our cumulative savings for customers since our inception in 1991 to approximately $1.54 billion. QTC also achieved an operating surplus after tax of around $45.8 million.
Sustainability and the need to position Queensland for strong expected population and economic growth were the defining themes of 2006-07. QTC played a pivotal role in a number of key State Government initiatives, and we are proud of the flexible, positive and supportive way in which our employees responded to the challenges presented by their greatly expanded workloads.
The focus on sustainability extended to Queensland’s local governments during the year with the financial sustainability reviews of 105 local governments completed by May 2007. As one of QTC’s most significant customer projects, the reviews required substantial resources from not only QTC, but also local governments across the State.
At the same time, LG Infrastructure Services Pty Ltd, a joint initiative between QTC and the Local Government Association of Queensland, advised on infrastructure projects worth more than $3 billion, helping to ensure the innovative and cost-effective delivery of essential infrastructure projects across the State.
To support the State’s accelerated development, almost a fifth of QTC’s employees lent their expertise to a range of key Government initiatives with 28 secondments during the year. Members of QTC’s teams worked on projects to secure the State’s long-term water supply, upgrade our transport routes to facilitate economic growth, and improve our health and education services. In addition to the nine-month secondment of our Chief Executive to Energex’s retail arm, Sun Retail, we also seconded senior employees to Queensland Treasury and Ergon Energy in preparation for the successful sale of the State’s retail energy assets.
Global economy: perception of risk rises despite solid growth
Worldwide economic growth was solid, increasing by 5.4% in 2006, after expanding by 4.9% in 2005. A period of broad-based prosperity has continued, with real global gross domestic product (GDP) growth maintaining levels that are among the highest recorded in the post-war period. Inflation levels remained moderate, notwithstanding the rapid growth in global GDP, and despite significant upward movements in global commodity prices amid tight capacity utilisation rates around the globe.
While the real interest rates and risk premiums in general have remained remarkably low around the world, the perception of risk has risen.
These risks, including those of higher inflation, interest and credit margins, and the potential for slower economic growth, can be attributed to a number of factors, including the lack of issuance of Australian Commonwealth Government bonds, and market perceptions around states’ increasing debt levels to fund various infrastructure developments. In particular, credit margins have risen in the past year to levels not seen since 2004, and the QTC bond spread to the Commonwealth rose to its highest level since 2001.
In Australia, the Reserve Bank of Australia increased its official cash rate target to 6.25%, citing inflationary concerns due to high domestic capacity use, falling unemployment and continued strength in domestic consumption and national income growth, the latter brought about by a 40% increase in Australia’s terms of trade over the past four years. The Australian dollar appreciated by around 8% in trade-weighted terms in 2006-07, reflecting robust economic activity and higher prices for our largest export commodities in particular.
Against this favourable global economic backdrop, the Australian economy is estimated to have grown by only about 2 1/2% in 2006-07. This is below its 10-year average annual growth rate (3 1/2%), below the 10-year average growth rate of our major trading partners (3 3/4%), and below the turnover 10-year average growth rate of the OECD economies (2 3 /4%). Underpinning domestic economic activity in 2006-07 were high business investment levels despite some slowing in company profit growth, firm household
2006-2007 ANNUAL REPORT 5
Chairman’s and Chief Executive’s report (continued)
consumption growth owing to solid income and employment growth, and a modest pick-up in dwelling investment. Offsetting these positive influences were a significant curtailment in farm production owing to the severe drought which swept over much of Australia, and the continued detraction of net exports as import growth once again outstripped export growth in the period in review.
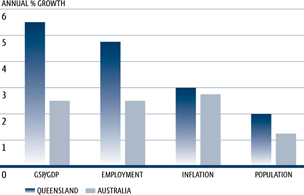
Queensland’s economy: continuing to out-perform the nation
The Queensland economy is estimated to have strengthened by an above-trend rate of 5 1/2% in 2006-07, driven by continued strength in private and public investment spending. Housing investment is expected to remain near its historic high in the period ahead, while the State’s strong capital spending program should continue to increase Queensland’s productive capacity. Export growth is estimated to have improved to a six-year high in 2006-07, although relatively higher import growth owing to strong domestic demand means that net exports, will likely detract from overall economic growth for the sixth year in a row.
Strong employment growth in 2006-07 lowered the State’s unemployment rate to a 33-year low of 4%. The unemployment rate is expected to remain steady over 2007-08, while the State’s workforce participation rate, which rose to a record high in 2006-07, is expected to rise further in 2007-08.
In 2007-08, Queensland Treasury estimates that the Queensland economy will expand by 5%, which is above its long-term average of 4 1/2% and twice the 2 1/2% growth rate forecast for the national economy. This is expected to be underpinned largely by continued strength in exports growth, owing to improved transport capacity within the State and above-trend global economic conditions. If achieved, this would be the twelfth successive year that the growth rate of the Queensland economy has exceeded that of the nation.
Preparing for Queensland’s prosperous future
In June 2007, QTC announced its borrowing program for 2007-08, increased primarily to fund Queensland’s extensive commitment to develop essential infrastructure that will assist in securing the State’s future growth and prosperity. QTC’s actual borrowings for 2006-07 totalled $5.9 billion, compared to $4.9 billion in 2005-06, preserving significant outstandings in each of our liquid benchmark bond lines. In addition, our forward funding task has grown rapidly with an additional $3.2 billion issued for Queensland public sector entities requiring certainty in their borrowing costs to fund planned capital works projects.
Our commitment to openness and transparency in our dealings with investors continued to generate strong support for our bonds. Going forward, we aim to enhance our already strong relationships with our Fixed Interest Distribution Group by identifying opportunities for us to work with them to develop effective financial solutions that meet our customers’ needs.
Funding essential infrastructure
The scale of Queensland’s planned investment in new essential infrastructure underlines the critical importance of QTC’s role in sourcing cost-effective debt funding and managing risk for the State. Superannuation funds and private sector investors are a potential source of funding for projects such as ports, rail services, electricity or water, for which users pay, and which generate a commercial return. But where the cost of providing the service is largely met by government, the return on the asset—if there is one— is generally well below the level sought by these investors.
For a superannuation fund to invest in such assets, government would need to underwrite the rate of return to a commercial level and the cost of underwriting the return would have to be met by the government. Without compensating action (such as increased prices) the resulting cost to the government could threaten its very ability to provide the service at all—a situation that was experienced by some governments in the 1980s.
This issue is further complicated by the question of risk. Where infrastructure is commercial, the risk is carried by the owner (whether that owner be government or a superannuation fund or other investor) and the owner bears the benefit or cost of that risk in the returns achieved. For government to underwrite the return or a proportion of a return (so that a superannuation fund will invest) the link between return and risk may be broken. Effectively, this may mean that government is using its budget to underwrite a rate of return to the super fund rather than using its budget to provide community services.
6 QUEENSLAND TREASURY CORPORATION

Government does not have an unlimited capacity to provide non-commercial infrastructure and services. Nor does it have an unlimited capacity to use its budget to underwrite commercial rates of return for superannuation funds. Where the situation is appropriate, it is more cost-effective and socially equitable for QTC to secure low-cost funding on the State’s behalf.
Looking ahead in a changing environment
In an environment heavily influenced by increased supply from semi-government issuers, an ongoing challenge for QTC will be to balance the supply of its benchmark bonds to the market, while it seeks diversified funding sources to provide cost-effective funding to meet the State’s significant borrowing requirements to deliver its increasing infrastructure program.
Since our reporting date, developments in the United States sub-prime market have resulted in disruptions to financial markets both in terms of funding and liquidity and, in some cases, losses on investments. In QTC’s case, our strategy of maintaining prudent levels of liquidity has meant that we have the capacity to continue to fund government loan requirements. In relation to investments, it is not expected that QTC will be exposed to any loss as a consequence of current events given our strict credit guidelines (QTC policy does not allow investments in collateralised debt obligations irrespective of rating).
As the State’s ambitious infrastructure program continues, we will build on the achievements of the past year to further increase QTC’s relevance to customers, working with them to meet their changing business needs and goals. QTC’s strengths—our ability to understand, develop and deliver tailored customers solutions—will remain central to our success.
Looking ahead, we have many opportunities to deliver value to our customers. Achieving our strategic objectives is made easier by the dedication of our employees in delivering professional financial services and solutions that exceed our customers’ expectations. Our proactiveness, as well as our expertise and willingness, will continue to move QTC forward in the coming year.
Recognising a job well done
In this context, we recognise the leadership, strategic advice and astute counsel provided by our Board members and thank them for their contribution to QTC’s strong performance. On behalf of the Board and the management team, we thank Gerard Bradley, who retired from the Board at 30 June 2007, for his dedication to and support of QTC and its objectives. At the same time, we welcome Tim Spencer as Deputy Chairman, who is taking up the challenge from 1 July 2007.
The Board is pleased with the progress QTC has made toward meeting its strategic and operational objectives, including the financial and non-financial results achieved during 2006-07.
To QTC’s employees, who have demonstrated the flexibility and willingness to take on a higher workload and demanding responsibilities throughout the year, we recognise your efforts and thank you for your contribution and hard work. It is your continued efforts and professional approach that has seen QTC through another successful year.
We would like to acknowledge the service of two of our executives, Neil Castles and Richard Jackson, who assumed expanded executive and managerial responsibilities during the period of the Chief Executive’s secondment to Sun Retail, and successfully maintained the financial integrity, operating standards and the delivery of financial services and solutions to meet our customers’ needs and expectations.
We look forward to working with the whole QTC team to meet the challenges of the year ahead.
|
 |
|
| Sir Leo Hielscher AC |
| Chairman |
|
 |
| Stephen Rochester |
| Chief Executive |
2006-2007 ANNUAL REPORT 7
Five-year business summary
| | | | | | | | | | | | | |
| | | FINANCIAL YEAR 2002-03 | | | FINANCIAL YEAR 2003-04 | | FINANCIAL YEAR 2004-05 | | | FINANCIAL YEAR 2005-06 | | FINANCIAL YEAR 2006-07 | |
FINANCIAL | | | | | | | | | | | | | |
OPERATING STATEMENT (A$000) | | | | | | | | | | | | | |
INTEREST FROM ONLENDINGS | | 1 826 847 | | | 371 737 | | 1 442 995 | | | 572 306 | | 768 624 | |
MANAGEMENT FEES | | 24 318 | | | 22 144 | | 22 993 | | | 22 698 | | 24 820 | |
INTEREST ON BORROWINGS | | 2 157 121 | | | 468 243 | | 1 849 012 | | | 857 281 | | 1 144 884 | |
INTEREST AS DEPOSITS | | 166 529 | | | 239 933 | | 262 307 | | | 302 987 | | 316 880 | |
OPERATING SURPLUS BEFORE PAYMENT IN LIEU OF INCOME TAX | | 60 098 | | | 35 830 | | 57 735 | | | 62 310 | | 59 589 | |
PAYMENT IN LIEU OF INCOME TAX | | 13 176 | | | 12 553 | | 11647 | | | 12 741 | | 13 740 | |
OPERATING SURPLUS AFTER PAYMENT IN LIEU OF INCOME TAX | | 46 922 | | | 23 277 | | 46088 | | | 49569 | | 45 849 | |
BALANCE SHEET (A$000) | | | | | | | | | | | | | |
TOTAL ASSETS | | 26 866 311 | | | 26 809 429 | | 30 345 228 | | | 33 492 178 | | 40 612 318 | |
| | | | | | | | | | | | | |
TOTAL LIABILITIES | | 26 657 745 | | | 26 577 586 | | 30 067 297 | | | 33 164 678 | | 40 238 969 | |
| | | | | | | | | | | | | |
NET ASSETS | | 208 566 | | | 2 318 43 | | 277 931 | | | 327 500 | | 373 349 | |
CUSTOMER | | | | | | | | | | | | | |
SAVINGS FOR CUSTOMERS (A$M) | | | | | | | | | | | | | |
SAVINGS DUE TO PORTFOLIO MANAGEMENT | | 13.6 | | | 54.6 | | (9.1 | ) | | 46.5 | | (13.1 | ) |
SAVINGS DUE TO BORROWING MARGIN | | 56.1 | | | 63.1 | | 55.8 | | | 74.4 | | 82.1 | |
TOTAL SAVINGS FOR CUSTOMERS | | 69.7 | | | 117.7 | | 46.7 | | | 120.9 | | 69.0 | |
CUMULATIVE SAVINGS FOR CUSTOMERS | | 1 181.1 | | | 1 298.8 | | 1 345.5 | | | 1 466.4 | | 1 535.4 | |
LOANS TO CUSTOMERS | | | | | | | | | | | | | |
LOANS (A$000) | | 19 670 526 | | | 17 714 737 | | 18 905 621 | | | 19 831 582 | | 24 268 854 | |
NUMBER OF ONLENDING CUSTOMERS | | 363 | | | 308 | | 292 | | | 321 | | 313 | |
OUTPERFORMANCE OF BENCHMARK (% PER ANNUM SEMI-ANNUAL) | | | | | | | | | | | | | |
FLOATING RATE DEBT POOL | | 0.14 | | | 0.18 | | 0.16 | | | 0.19 | | 0.21 | |
3 YEAR DEBT POOL | | (0.02 | ) | | 0.22 | | (0.02 | ) | | 0.27 | | 0.00 | |
6 YEAR DEBT POOL | | 0.00 | | | 0.28 | | (0.07 | ) | | 0.23 | | (0.06 | ) |
9 YEAR DEBT POOL | | 0.06 | | | 0.28 | | (0.14 | ) | | 0.20 | | (0.18 | ) |
12 YEAR DEBT POOL | | 0.07 | | | 0.34 | | (0.13 | ) | | 0.24 | | (0.22 | ) |
15 YEAR DEBT POOL | | 0.05 | | | 0.36 | | (0.15 | ) | | 0.23 | | (0.12 | ) |
8 QUEENSLAND TREASURY CORPORATION
| | | | | | | | | | |
| | | FINANCIAL YEAR
2002-03 | | FINANCIAL YEAR
2003-04 | | FINANCIAL YEAR
2004-05 | | FINANCIAL YEAR
2005-06 | | FINANCIAL YEAR
2006-07 |
MANAGED FUNDS | | | | | | | | | | |
DEPOSITS (A$000) | | 4 148 083 | | 4 476 280 | | 5 220 644 | | 5 329 329 | | 7 352 204 |
NUMBER OF DEPOSITORS | | 223 | | 258 | | 270 | | 253 | | 254 |
OUTPERFORMANCE OF BENCHMARK (% PER ANNUM SEMI-ANNUAL) | | | | | | | | | | |
CASH FUND | | 0.18 | | 0.18 | | 0.17 | | 0.16 | | 0.17 |
FINANCIAL MARKETS | | | | | | | | | | |
DEBT OUTSTANDING (A$000) | | 22 219 443 | | 21 702 155 | | 24 582 052 | | 27 519 577 | | 32 420 748 |
QTC BOND RATES (% AT 30 JUNE) | | | | | | | | | | |
MAY 2003 | | — | | — | | — | | — | | — |
JUNE 2005 | | 4.51 | | 5.45 | | — | | — | | — |
SEPTEMBER 2007 | | 4.78 | | 5.70 | | 5.31 | | 6.00 | | 6.37 |
JULY 2009 | | 4.98 | | 5.87 | | 5.31 | | 5.99 | | 6.68 |
MAY 2010 | | — | | — | | 5.34 | | 6.00 | | 6.72 |
JUNE 2011 | | 5.13 | | 5.98 | | 5.35 | | 6.01 | | 6.74 |
AUGUST 2013 | | 5.24 | | 6.07 | | 5.36 | | 6.00 | | 6.69 |
OCTOBER 2015 | | 5.30 | | 6.12 | | 5.37 | | 6.02 | | 6.66 |
SEPTEMBER 2017 | | — | | — | | — | | — | | 6.64 |
JUNE 2021 | | 5.38 | | 6.18 | | 5.40 | | 6.02 | | 6.58 |
QTC CAPITAL-INDEXED BOND RATES (% AT 30JUNE) | | | | | | | | | | |
AUGUST 2030 | | — | | — | | — | | 2.51 | | 2.79 |
BASIS POINT MARGIN OVER COMMONWEALTH BONDS | | 16.7 | | 19.3 | | 22.5 | | 21.8 | | 33.1 |
BASIS POINT MARGIN UNDER NSW TCORP BONDS | | 2.1 | | 3.1 | | 2.5 | | 3.9 | | 1.8 |
QTC GLOBAL AND DOMESTIC BONDS ON ISSUE AT FACE VALUE (A$000) | | 18 406 259 | | 20 496 653 | | 22 186 715 | | 26 903 063 | | 32 126 897 |
CORPORATE | | | | | | | | | | |
NUMBER OF EMPLOYEES | | 129 | | 130 | | 122 | | 132 | | 148 |
ADMINISTRATION EXPENSES (A$000) | | 24 555 | | 28 403 | | 30 021 | | 30 249 | | 32 958 |
2006-2007 ANNUAL REPORT 9

Customer report
In 2006-07 QTC added $ 122.3 million in quantifiable benefits to customers, including $60.2 million from issuing and managing debt, $20.6 million from managing customer liquidity and refinancing risk, and $8.8 million from managing surplus cash balances. Our financial advisory services and strategic interest rate risk management advice also generated savings of around $32.7 million for customers.
While Queensland’s current and forecast population growth underpins the State’s ongoing economic growth, the efficient and timely provision of adequate transport, water, power, health, educational and other social infrastructure to meet increased demand presents a major challenge for the State.
As Queensland’s financial risk management advisor, QTC strives to ensure the most efficient and effective delivery of customer and stakeholder initiatives across the State.
Two major initiatives during 2006-07—the financial sustainability reviews for local government, and LG Infrastructure Services’ work with local government— directly achieved this aim.
In May 2007, QTC completed the financial sustainability review project, as part of the State’s Size, Shape and Sustainability initiative. The reviews assessed the long-term financial sustainability of 105 local governments across the State, with substantial input from both QTC and local government.
LG Infrastructure Services, a joint venture with the Local Government Association of Queensland, continues to grow, delivering projects with a capital value in excess of $ 100 million, and providing advice on strategic approaches to procurement of projects with a capital value of more than $3 billion.
These initiatives are highlighted further on pages 14 and 16.
Funding the State
Proactivity in our financial market activities has enabled us to generate significant savings and create value for our customers through interest cost savings and tailored financial risk management solutions. QTC’s market awareness and financial risk management advice also added value, establishing and actively monitoring forward starting loans for customers seeking certainty with regard to their future interest costs.
By expanding the breadth and depth of relationships with our financial market partners, we have developed a greater understanding of a wider range of markets relevant to QTC’s customers. One example is the commodities markets where we have been able to advise our customers on the management of a broader suite of financial risks.
QTC’s long-established funding facilities have ensured that funding is available for the State’s key projects, and that the interest rate risk is appropriate and there are no significant financial risks.
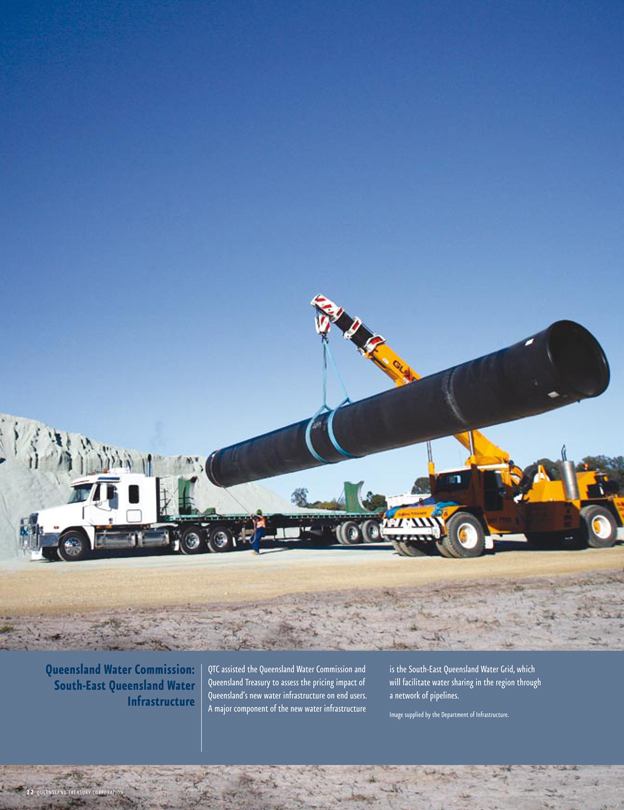
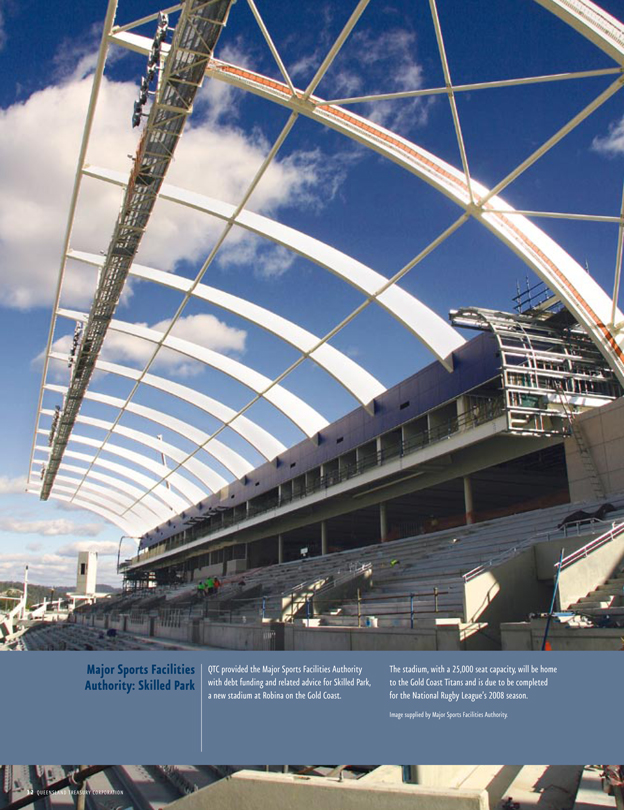
Water for the future
In the year under review, QTC assisted the State and customers with the financial and risk assessment of key water infrastructure projects planned for Queensland. These included the Gold Coast Desalination Project (see case study on page 2), Southern Regional Water Pipeline and Western Corridor Recycled Water projects, and the Wyaralong and Traveston Crossing dams.
The management and delivery of these key projects came into sharp focus in 2006-07 when the State Government announced that it would take over responsibility for the South-East Queensland Water Grid, as part of an overarching strategy to ensure a sustainable long-term water supply for the region.
QTC also provided strategic advice to the Queensland Water Commission and Queensland Treasury, in relation to the purchase of bulk water and treatment assets of the South-East Queensland local governments, and the implications for funding and delivery of infrastructure assets, management of risk and water pricing.
2006-2007 ANNUAL REPORT 11
Customer report (continued)
Power for a growing population
On behalf of Queensland Treasury, QTC fulfilled a number of key roles in the sale of retail energy assets by the State in 2006-07, in the lead-up to the deregulation of the Queensland electricity and gas markets from 1 July 2007.
These sales represented a major investment in Queensland’s future energy needs and contributed more than $3 billion to the Queensland Future Growth Fund for investment in new water infrastructure, transport, clean coal technology and renewable energy initiatives in preparation for continued population and economic growth in the State.
QTC’s Chief Executive was seconded to Energex’s retail arm, Sun Retail Pty Ltd, from May 2006 to February 2007 to prepare that organisation for sale. An additional four QTC employees assisted Treasury with the sale process.
Greater involvement in customer projects
QTC continued to add substantial value for customers through its secondment program, with 28 employees filling key strategic and operational roles with customers during the year. In addition to the secondment work on the electricity and gas assets sales, our employees were seconded to the Department of Main Roads, Ergon Energy, CS Energy, Public Trustee of Queensland, Queensland Water Commission, Local Government Reform Commission, the Golden Casket Lottery Corporation Project, and the Strategic Asset Management and Office of Government Owned Corporations branches of Queensland Treasury. A further ten employees were seconded to LG Infrastructure Services to assist with its growing workload.
Other notable projects to benefit from the expertise of our employees during the year were Queensland Motorways Limited’s Gateway Upgrade Project, Southbank Education Training Precinct, and the North Lakes and Surrounds Health Partnership Precinct.
More and varied customer assignments
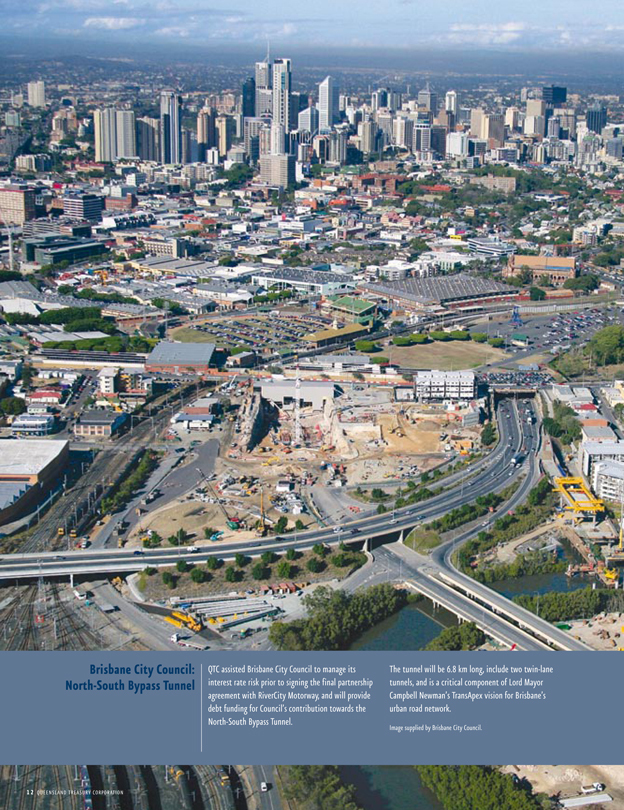
We continued to identify opportunities and promote innovative solutions with an objective to minimise costs and ensure an appropriate level of risk transfer in the Government’s delivery of its critical infrastructure program. We assisted on the following key projects:
| • | | Stanwell gas-fired power station |
| • | | Proposed extension of the Brisbane Convention Centre |
| • | | Gold Coast Desalination Project, and |
| • | | North-South Bypass Tunnel. |
We also provided advice to the Treasurer regarding infrastructure charges and housing affordability.
In addition, QTC provided key resources and advice to Government on significant whole-of-State issues, including:
| • | | the reform of local government boundaries |
| • | | the reform of structural arrangements for South-East Queensland water assets |
| • | | the impact on water prices of drought relief projects |
| • | | the Tarong Power Station’s drought-related financial support package and the evaluation of the fuel supply options, and |
| • | | the appointment of Ergon Energy as the energy manager for the State’s franchise load. |
We continued to develop our relationships with key government owned corporation decision makers due to the growing appreciation of the role of credit and credit monitoring and the greater proactivity of our teams with respect to prefunding and debt management.
2006-2007 ANNUAL REPORT 13
Financial Sustainability Reviews
In 2006-07, QTC completed financial sustainability reviews of 105 local governments participating in the Local Government Association of Queensland’s Size, Shape and Sustainability initiative. This project was one of the most significant projects ever undertaken by QTC, further strengthening our role of providing financial and risk management advice and services to our customers.
Each financial sustainability review assessed a local government’s capacity to meet its financial commitments in the short-, medium- and long-term, and provided insight into the financial health of each local government now and over a 10-year horizon. The results and QTC’s recommendations were made available for individual local governments to use to identify business opportunities and risks, and develop appropriate business strategies.
Managing this significant project
While QTC has extensive experience in undertaking credit reviews for government owned corporations, the scale of this task presented many new challenges. Completing 105 reviews in less than 12 months required considerable organisation-wide support, as well as thorough planning, processes and systems.
The successful delivery of this important project demonstrates QTC’s culture of teamwork and responsiveness. To complete the reviews, the Local Government and Regional Queensland Team was expanded from six to 35 people at the height of activity, all while maintaining their commitment to completing their usual advisory services. The reviews required substantial resources from not only QTC, but also local governments across the State.
Crucial to the success of this project was both QTC’s and the local governments’ commitment to sharing information. Members of the QTC team met with every participating local government and, in almost all instances, travelled to the local government’s region, to ensure understanding of the issues involved.
Financial modelling
As part of these reviews, QTC developed a 10 year financial forecasting model that enabled a detailed assessment of a local government’s future revenue and expenditure requirements and financial position. This high-level forecasting tool, developed by QTC’s Financial Modelling Team, used profit and loss, balance sheet, and cash flow data. The model has proved to be sound, robust and easy-to-use, and its value has now moved beyond the reviews, as many local governments have committed to its use in the future, with some even customising it for their specific business requirements.
Local government reform
In April 2007, at the request of the Minister for Local Government, Planning and Sport, QTC provided an interim report on the overall ratings from these reviews (at that time 94 local governments had been reviewed).
The Government subsequently announced the establishment of the Local Government Reform Commission to consider the State’s current local government boundaries, and develop new local government arrangements for Queensland. Highlighting the significance of our skills and expertise, the Commission requested QTC’s assistance and seconded two senior QTC employees.
The Local Government Reform Commission reported back to the State Government on proposed boundary changes and amalgamations in July 2007.
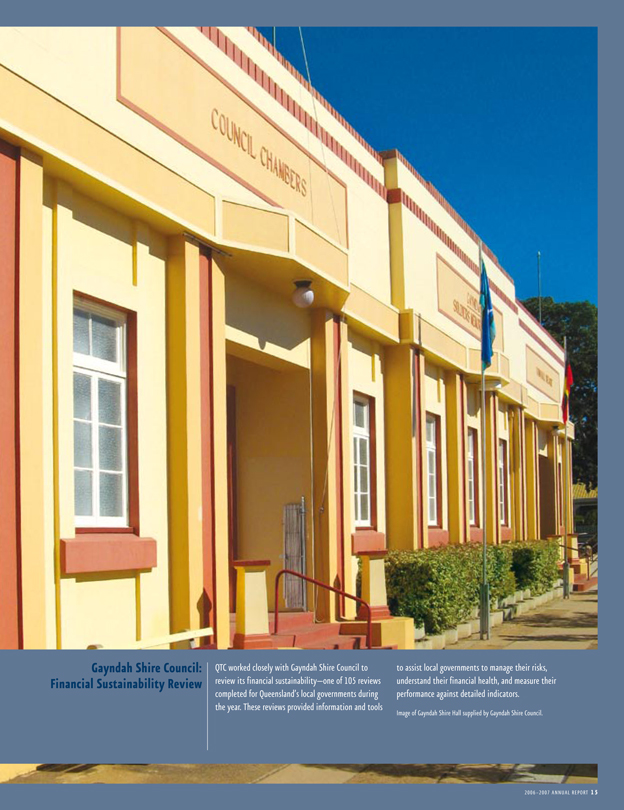
Value added for our customers and the State
While the financial sustainability review project greatly enhanced QTC’s knowledge and understanding of the issues facing our local government customers, it also gave local governments tools to better manage risk, understand their financial health and measure their performance against detailed indicators.
This project exemplifies our mandate and dual role—to provide tailored advice for our customers, and assist the State to achieve its best financial outcomes.
14 QUEENSLAND TREASURY CORPORATION
LG Infrastructure Services
Launched on 31 August 2005, LG Infrastructure Services is an entity jointly owned by Queensland Treasury Corporation and the Local Government Association of Queensland.
Exceeding expectations
In its second year of operation, LG Infrastructure Services exceeded its business expectations and strengthened its position as the partner of choice for infrastructure procurement and delivery of local government infrastructure across the State. With 2006-07 dominated by Queensland’s emerging needs from population growth and drought, LG Infrastructure Services has played an integral role in the preparation and management of infrastructure throughout Queensland.
Highlights
LG Infrastructure Services measures success by the value created for Queensland’s local governments and the State, while maintaining profitability. In 2006-07, this value was derived through advisory work for more than 50 local governments on projects worth in excess of $3 billion. In addition, LG Infrastructure Services is delivering a number of major regional infrastructure projects in response to the drought—namely, the $90 million South-East Queensland Pressure and Leakage Management project and the $32 million Home WaterWise project.
The South-East Queensland Pressure and Leakage Management project, undertaken on behalf of 18 local governments and the State, forms an integral part of Queensland’s drought management strategy. This project has helped maintain South-East Queensland’s water supply by delivering immediate water savings.
In 2006-07, the Home WaterWise project successfully outperformed its regulatory target, retrofitting and installing water efficiency devices in more than 75,000 homes in South-East Queensland. This project is operating well ahead of the target contained in the Water Amendment Regulation (2006) and has been expanded to enable more than 200,000 homes to be retrofitted by June 2008.
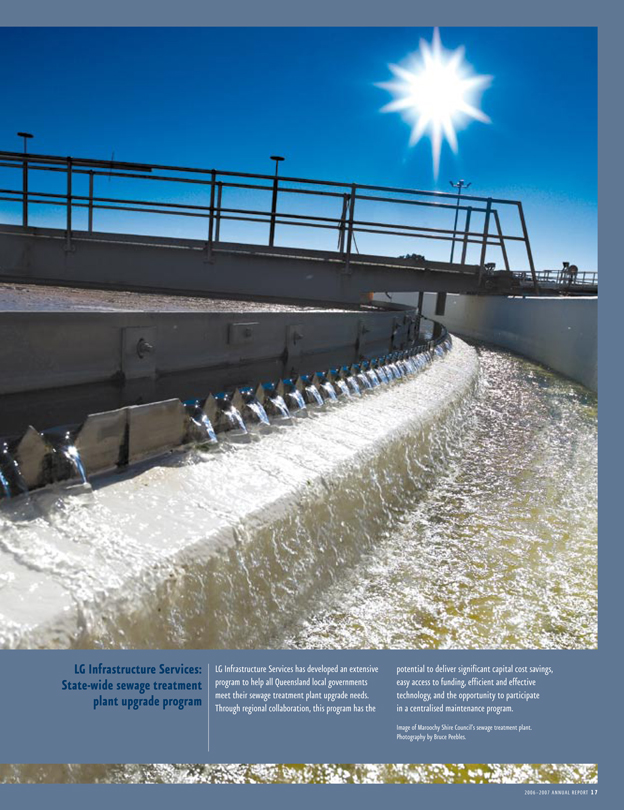
Importantly, these projects have demonstrated the considerable value that LG Infrastructure Services can achieve through its highly effective regional collaboration approach. By coordinating the collaboration of local governments to procure infrastructure together, LG Infrastructure Services captures substantial economies of scale and scope that were previously unable to be achieved. Through regional collaboration, LG Infrastructure Services is now working on the implementation stage of the Statewide sewage treatment plant upgrade program—with 152 plants identified for upgrade over the next five years, at an estimated capital value of $1.1 billion.
In 2006-07, waste management and roads have also emerged as major areas of opportunity to generate savings and value. LG Infrastructure Services is currently working with two groups of local governments to develop efficient regional waste management solutions.
Growth strategy
After achieving its three-year business plan within the first fifteen weeks of operation, the business has again undergone substantial growth in the 2006-07 financial year.
In response to the rapid growth in demand for its services, the LG Infrastructure Services operating model has evolved, and now includes five core business streams: water, roads, waste management, commercial advisory, and remote community support. Each business stream has a highly specific plan and business owner. This approach allows LG Infrastructure Services to pursue growth and meet local government needs, while ensuring common approaches to solution delivery and quality, and better risk management.
In 2006-07, the LG Infrastructure Services team expanded to meet increasing customer demands. The strategy to meet these demands has been to keep the core team as small as possible (now 10 permanent staff), but expand to meet project needs through the creation of a series of project-based teams that are staffed predominantly by contractors. The business also uses a wide range of contractors and collaboration partners to deliver programs and services (eg, the Home WaterWise project has a service agreement in place with a logistics contractor that has engaged more than 100 plumbers).
Looking ahead
LG Infrastructure Services will continue to work with local governments to develop innovative, cost-effective solutions to meet their future infrastructure requirements.
Queensland’s growing population will continue to put pressure on local government resources for at least the next decade and, in addition to water requirements, effective and sustainable waste and transport solutions, will be critical to the State’s ability to accommodate growth and prosperity without compromising environment, health and quality of life.
The challenge of delivering essential infrastructure in a timely manner will be further compounded by the reforms announced for water management and local government boundaries. In the coming year, LG Infrastructure Services will work closely with the State’s local governments to help them achieve their goals and provide infrastructure solutions for their regions.
16 QUEENSLAND TREASURY CORPORATION
Investor report
QTC’s primary responsibility is to provide long-term access to competitively priced funds. In 2006-07 we continued to strengthen our relationships with our Distribution Group members and investors to ensure that Queensland has on-going access to the funds required to secure its growth and prosperity.
Acknowledging the importance of these relationships, our key funding principles demonstrate our commitment to our investors and partners in financial markets.
Key funding principles
TRANSPARENCY
QTC recognises the importance of providing the market with the information it needs to price our bonds as efficiently as possible. Throughout the year, we continued to regularly meet with our current and prospective investors, and financial markets’ participants around the world.
We strive to be open and transparent in our communication with our investors and Distribution Group members about our funding requirements and proposed funding sources, and seek market feedback wherever possible.
LONGEVITY
For almost two decades, QTC’s benchmark bonds have remained our principal source of funds, with domestic and global tranches on issue in each benchmark line.
We remain committed to ensuring that a minimum of A$2 billion is on issue in each benchmark line, with a current average of A$4 billion on issue in most lines.
To complement our regular benchmark bond issuance, we also consider alternate funding sources based on investor demand and diversification opportunities.
QTC’s access to competitively priced funds across a diverse range of facilities is one of the key factors underpinning our AAA/Aaa credit rating.
CONSERVATIVE
Maintaining the highest possible credit quality is a key funding principle underpinning all of QTC’s financial markets activities.
QTC’s AAA/Aaa credit rating is underpinned by the following criteria:
| • | | the explicit guarantee on all QTC bonds provided by the State of Queensland |
| • | | our significant holding of liquid, financial assets, and |
| • | | our conservative risk management practices. |
Our guarantor, the State of Queensland, also continues to be rated AAA/Aaa by both Standard & Poor’s and Moody’s, based on its strong economic and fiscal position.
QTC’s key funding principles provide the basis from which we provide low cost funding and access to liquidity for the State of Queensland and its public sector entities. With more than A$33 billion currently on issue, our funding task is expected to grow in line with Queensland’s expansive capital works program.
Investor highlights
| • | | QTC’s debt on issue reached more than A$33 billion during 2006-07 and we maintained our position as the foremost issuer of Australian semi-government bonds. |
| • | | QTC increased its debt issuance program to facilitate the growing borrowing requirement for Queensland’s infrastructure projects. Actual borrowings for 2006-07 totalled $5.9 billion, compared to $4.9 billion in 2005-06, preserving significant outstandings in each of our liquid benchmark bond lines. |
| • | | With Queensland’s public sector entities seeking interest expense certainty in their funding costs for their planned major capital works projects, QTC undertook an additional $3.2 billion in forward funding. |
‘Queensland’s balance sheet is the strongest of all the Australian States...’
Standard & Poor’s, 4 August 2006
2006-2007 ANNUAL REPORT 19

Investor report (continued)
| • | | During 2006-07, both Standard and Poor’s, and Moody’s Investor Services rating agencies affirmed Queensland’s and QTC’s AAA/Aaa credit rating, based on the State’s continued strong fiscal performance, steady population growth and economic growth forecasts (which are higher than the national average). |
| • | | Together with the State’s Treasurer and Under Treasurer, our Chairman, Chief Executive and General Manager of Financial Markets travelled to Hong Kong, Tokyo, New York, London and European cities to meet with representatives from our Global A$ Fixed Interest Distribution Group and various international financial institutions that are either current or prospective investors in our bonds and/or other securities. |
| • | | QTC issued its 2017 benchmark bond this year, with almost $3 billion currently on issue across both the domestic and global tranches, which is further evidence of our commitment to maintaining significant outstandings in our benchmark bond lines. |
| • | | We also managed more than $7 billion, on average, of short-term cash surpluses for QTC customers throughout the year. These funds were predominantly held in our Capital Guaranteed Cash Fund or in Fixed Rate Deposits. |
Credit ratings
| | | | |
| | | LONG-TERM | | SHORT-TERM |
LOCAL CURRENCY (A$) | | | | |
MOODY’S INVESTOR SERVICES | | AAA | | P1 |
STANDARD& POOR’S | | AAA | | A-1+ |
FOREIGN CURRENCY | | | | |
MOODY’S INVESTOR SERVICES | | AAA | | P1 |
STANDARD& POOR’S | | AAA | | A-1+ |
Review of 2006-07 funding activity
QTC’s actual borrowings during 2006-07 totalled $5,909 million, against an original estimate of $5,580 million.
QTC’s 2006-07 funding task was impacted by the State’s strong operating surplus for the year, and the funding demands of Queensland Government entities seeking certainty in their funding costs by borrowing in advance of planned future capital expenditures.
In November 2006, QTC launched a new A$ Benchmark Bond, maturing in September 2017. The launch of the domestic tranche was closely followed by the launch of the global tranche in December. Investor demand was strong, with total bid volumes tendered significantly greater than the amount allotted. Outstandings in this benchmark bond line now total $2,900 million.
Onshore and offshore investor demand for QTC’s A$ benchmark bonds once again provided QTC with the majority of its funding. QTC’s commercial paper issuance remained at relatively low volumes, as more cost-effective floating rate funding was generated via the swapping of fixed rate liabilities.
The following table details the change in outstandings in QTC’s principal funding sources over the year:
| | | | | | | |
FUNDING SOURCE | | 30 JUNE 06 | | 30 JUNE 07 | | NET CHANGE | |
| | | A$M | | A$M | | A$M | |
DOMESTIC BENCHMARK BONDS | | 15,948 | | 20,468 | | 4,520 | |
GLOBAL BENCHMARK BONDS | | 10,955 | | 11,659 | | 704 | |
CAPITAL INDEXED BONDS | | 268 | | 268 | | 0 | |
OTHER DOMESTIC BONDS | | 584 | | 598 | | 14 | |
EURO MEDIUM-TERM NOTES | | 459 | | 159 | | (300 | ) |
COMMERCIAL PAPER | | 111 | | 602 | | 491 | |
TOTAL | | 28,325 | | 33,754 | | 5,429 | * |
| * | Does not include $480 million raised for refinancings. |
2006-2007 ANNUAL REPORT 21
Investor report (continued)
| | |
Funding facilities | | 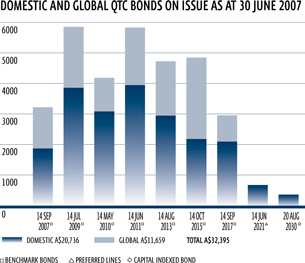 |
A$ BENCHMARK BONDS—DOMESTIC AND GLOBAL | |
QTC currently offers investors domestic and global benchmark bonds maturing in 2007, 2009, 2010, 2011, 2013, 2015 and 2017, and a preferred domestic bond line maturing in 2021. These benchmark bonds are our core source of funds, comprising in excess of 95% of borrowings as at 30 June 2007. In addition, QTC has $268 million of Capital-Indexed linked bonds issued under its A$ domestic benchmark bond program to meet customer demand for inflation-linked debt. | |
Facility details as at 30 June 2007
| | | | | | | | | | | | |
FACILITY | | SIZE A$M | | GOVERNING LAW | | MATURITIES | | CURRENCIES | | AMOUNT
ON ISSUE A$M | | PLACEMENT |
DOMESTIC A$ BOND | | UNLIMITED | | QUEENSLAND | | 7 BENCHMARK BOND LINES MATURING 2007-2017 | | A$ | | $19,877 | | BY TAP OR TENDER THROUGH THE FIXED INTEREST DISTRIBUTION GROUP |
| | | | | | PREFERRED LINE MATURING 2021 | | A$ | | $590 | | BY REVERSE ENQUIRY THROUGH THE FIXED INTEREST DISTRIBUTION GROUP |
| | | | | | CAPITAL INDEXED BOND 2030 | | A$ | | $268 | | BY TAP OR TENDER THROUGH THE FIXED INTEREST DISTRIBUTION GROUP |
GLOBAL A$ BOND | | $15,000 | | NEW YORK AND
QUEENSLAND | | 7 BENCHMARK BOND LINES 2007-2017 | | A$ | | $11,659 | | CONTINUOUSLY OFFERED THROUGH THE FIXED INTEREST DISTRIBUTION GROUP |
2006-2007 ANNUAL REPORT 23
Investor report (continued)
Treasury Notes, Commercial Paper and Medium-Term Notes
QTC supplements its domestic and global bond facilities with various short- and medium-term note facilities.
The QTC Treasury Note (TNote) facility is an electronic issuance facility and is the chief source of short-term domestic A$ funds. QTC’s main offshore programs are the multicurrency Commercial Paper (CP) and Medium-Term Note (MTN) facilities in both the Euro and the US markets.
Facility details as at 30 June 2007
| | | | | | | | | | | | |
FACILITY | | SIZE $M | | GOVERNING
LAW | | MATURITIES | | CURRENCIES | | AMOUNT ON ISSUE
$M EQUIV | | PLACEMENT |
DOMESTIC TNOTE | | UNLIMITED | | QUEENSLAND | | 7-365 DAYS | | A$ | | A$380 | | BY TAP OR TENDER THROUGH DEALER PANEL |
EURO CP | | US$3,000 | | ENGLISH AND
QUEENSLAND | | 7-365 DAYS | | MULTICURRENCY | | A$222 | | BY TAP THROUGH DEALER PANEL |
US CP | | US$1,500 | | NEW YORK
AND
QUEENSLAND | | 1-270 DAYS | | MULTICURRENCY | | A$0 | | BY TAP THROUGH DEALER PANEL |
EURO MTN | | US$3,000 | | ENGLISH AND
QUEENSLAND | | SUBJECT TO
MARKET
REGULATIONS | | MULTICURRENCY | | A$159 | | REVERSE ENQUIRY THROUGH DEALER PANEL |
US MTN | | US$500 | | NEW YORK
AND
QUEENSLAND | | 9 MONTHS TO
30 YEARS | | MULTICURRENCY | | A$0 | | REVERSE ENQUIRY THROUGH DEALER PANEL |
All funding facilities
| | |
| PERCENTAGE OUTSTANDINCS UNDER QTC’S FUNDING FACILITIES, AS AT 30 JUNE 2007 | | QTC’s funding facilities are supplemented with public issues and private placements. |
| |
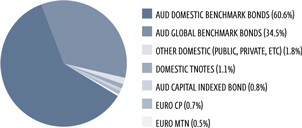 | | [Appendix B lists the various distribution groups for QTC’s funding facilities at 30 June 2007. Additional information on QTC’s funding facilities and outstanding debts is available on QTC’s website at www.qtc.qld.gov.au and on request from QTC’s Financial Markets Team (see inside back cover for contact details).] |
24 QUEENSLAND TREASURY CORPORATION
Borrowing program
QTC releases its borrowing requirements annually in June to provide a funding estimate for the following year, following the announcement of the Queensland Government budget. A half-year review and an update of its borrowing requirements are provided in January.
QTC’s indicative borrowing program 2007-08
BORROWING DETAILS
| | | | | | |
| | | 2007-08
A$M | | | 2006-07
A$M | |
REFINANCING OF MATURING DEBT | | | | | | |
A$ BENCHMARK BONDS | | 3,173 | | | 0 | |
A$ NON-BENCHMARK BONDS | | 97 | | | 90 | |
MEDIUM-TERM NOTES | | 52 | | | 281 | |
COMMERCIAL PAPER1 | | 613 | | | 109 | |
TOTAL MATURING DEBT | | 3,935 | | | 480 | |
ADJUSTMENTS | | | | | | |
FORWARD FUNDING OF SEP 2007 BENCHMARK BOND MATURITY | | (1,500 | ) | | 1,500 | |
PRINCIPAL REPAYMENTS FROM QTC CUSTOMERS | | (600 | ) | | (600 | ) |
TOTAL REFINANCING | | 1,835 | | | 1,380 | |
NEW BORROWING | | | | | | |
CAPITAL WORKS | | 8,972 | | | 5,200 | |
FORWARD FUNDING OF CUSTOMER BORROWINGS | | (3,219 | ) | | (1,000 | ) |
TOTAL NEW BORROWING | | 5,753 | | | 4,200 | |
TOTAL BORROWING PROGRAM2 | | 7,588 | | | 5,580 | |
The 2007-08 borrowing estimate of $7,588 million is expected to be funded as follows:
FUNDING SOURCE
| | | | | | | | | |
| | | ACTUAL RAISINGS 2006-07 A$M | | | EXPECTED RAISINGS 2007-08 |
| | | | RANGE % | | LOW A$M | | HIGH A$M |
TERM RAISINGS | | | | | | | | | |
A$ BENCHMARK BONDS3 | | 5,331 | | | 60-70 | | 4,550 | | 5,310 |
MULTICURRENCY LOANS AND MTNS | | (24 | ) | | 5-15 | | 380 | | 1,140 |
COMMERCIAL PAPER RAISINGS: | | | | | | | | | |
TNOTES, ECP, USCP | | 602 | | | 20-30 | | 1,520 | | 2,280 |
TOTAL RAISINGS4 | | 5,909 | | | | | | | |
| 1. | Estimated Commercial Paper outstanding as at 30 June 2007. |
| 2. | Funding activity may vary depending upon actual customer requirements, the States fiscal position and financial market conditions. |
| 3. | Includes A$ domestic and global benchmark bonds, capital indexed bonds and other term issuance. |
| 4. | Includes $480 million raised for refinancings. |
QTC anticipates that approximately 65% of the 2007-08 borrowing program ($5.0 million) will be funded through the issuance of A$ denominated domestic and global benchmark bonds, with the balance funded through commercial paper and medium-term note issuance.
2006-2007 ANNUAL REPORT 25

The composition of our Board equips QTC with diverse corporate, financial, commercial, economic and legal skills. The Board guides our commitment to achieving high standards of corporate governance, accountability, compliance and financial and ethical behaviour, which is critical for maintaining our strong market reputation and the confidence of our customers and stakeholders.
At 30 June 2007, the term of the Board expired and appointments to the Board for new terms, from 1 July 2007, were made. At this time, Sir Leo Hielscher AC, Gillian Brown, David Coe, Marian Micalizzi, Bill Shields and Shauna Tomkins were reappointed, Gerard Bradley retired from the Board, and Tim Spencer was appointed.
SIR LEO HIELSCHER AC
BCOMM, D UNIV GRIFFITH (HON),AAUQ, AASA, FAIM, FCPA, FFTP(HON)
CHAIRMAN
APPOINTED 1991. TENURE 30 JUNE 2010.
BOARD COMMITTEES
CHAIRMAN, HUMAN RESOURCES COMMITTEE MEMBER, RISK MANAGEMENT COMMITTEE
Sir Leo Hielscher has over fifty years’ experience in the areas of Government, the banking and finance industry, domestic and global financial markets, superannuation industry and as an independent company director. He was the Under Treasurer of Queensland for 14 years (1974-1988) before his appointment as Chairman of the Queensland Treasury Corporation (Advisory Board) in 1988. In 1991, the Advisory Board became the Queensland Treasury Corporation Board and Sir Leo was appointed as its inaugural Chairman. Sir Leo is also Chairman of Austsafe Ltd, Independent Superannuation Preservation Fund, and the Queensland Government Health Reform Advisory Panel, and a Director of the American Australian Association Ltd. As a company director, Sir Leo has considerable experience at board level and has been associated with a number of public and private sector boards. Sir Leo was awarded an Eisenhower Fellowship in 1973, a Knight Bachelor in 1987, an Honorary Doctorate of Griffith University in 1993, and a Companion in the Order of Australia (AC) in the General Division in 2004. He was honoured as a Queensland Great by the Queensland Government in 2007.
TIM SPENCER
BSC (ECON) (HONS)
DEPUTY CHAIRMAN
APPOINTED JULY 2007. TENURE 30 JUNE 2011.
BOARD COMMITTEES
MEMBER, RISK MANAGEMENT COMMITTEE
MEMBER, ACCOUNTS AND AUDIT COMMITTEE
MEMBER, HUMAN RESOURCES COMMITTEE
Tim Spencer is the Deputy Under Treasurer of the Queensland Treasury Department, a position he has held since 2001. In this role, he has worked extensively with Queensland’s government owned corporations on various commercial and major infrastructure projects including full retail contestability for gas and electricity, the sale of the State’s retail energy assets, and new institutional arrangements for urban water supply transaction. Mr Spencer has previously held other senior management and executive positions in the public sector in Queensland, South Australia and the Australian Capital Territory, where his responsibilities have spanned economic policy research and development, establishment of market arrangements and the long-term leases of electricity assets, restructuring of government owned electricity businesses, investment and borrowing activities, and implementation of National Competition Policy. He is also a Director of Queensland Motorways Ltd.
GILLIAN BROWN
LLB (HONS), CRAD DIP APPLIED FINANCE AND INVESTMENT, SIA
APPOINTED JULY 2004. TENURE 30 JUNE 2011.
BOARD COMMITTEES
CHAIRMAN, RISK MANAGEMENT COMMITTEE
Gillian Brown has more than 18 years’ experience as a specialist finance lawyer and has gained extensive corporate, financing and major project experience. She is national Chairman of Minter Ellison Lawyers and a partner of the firm in Queensland (admitted as partner 1994), heading the finance practice. Ms Brown’s principal areas of practice include corporate finance, investment and financial services, financial markets, project/infrastructure finance, and property finance. Ms Brown has advised government bodies on a number of project and transactional arrangements and has an indepth knowledge of the mechanics of government and its objectives. Ms Brown is also a Director of Dalrymple Bay Coal Terminal Holdings Pty Ltd, and a committee member of the Law Council of Australia.
26 QUEENSLAND TREASURY CORPORATION

DAVID COE
BA(HONS), LLB
APPOINTED JULY 2004. TENURE 30 JUNE 2011.
BOARD COMMITTEES
MEMBER, RISK MANAGEMENT COMMITTEE
David Coe is Executive Chairman of Allco Finance Group Limited, an Australian company that provides sophisticated financing services in both the domestic and international markets. Mr Coe is a former partner of law firm Mallesons Stephen Jacques where he specialised in international financing and leasing, before leaving the law to pursue commercial business interests. He has a diverse blend of specialist legal, corporate and finance knowledge, and extensive experience as a company director of a number of public and private companies. Mr Coe is also chairman (and co-founder) of Sports and Entertainment Ltd, Allco Equity Partners and the MCA (Museum of Contemporary Art in Sydney), a director of Rubicon Holdings (Aust) Pty Limited and the RAMS Home Loans Group, a board member of the National Gallery of Australia Foundation, and the Sydney Children’s Hospital Foundation.
MARIAN MICALIZZI
BBUS, FCA, SIA (ASSOCIATE)
APPOINTED JULY 2000. TENURE 30 JUNE 2010.
BOARD COMMITTEES
MEMBER, ACCOUNTS AND AUDIT COMMITTEE
MEMBER, RISK MANAGEMENT COMMITTEE
Marian Micalizzi is a chartered accountant with more than 20 years’ experience, a company director and a consultant in both the public and private sector. Ms Micalizzi is a former partner of PricewaterhouseCoopers (until 2000) having been admitted as a partner of the predecessor firm in 1986. Ms Micalizzi brings considerable expertise and knowledge of specialist corporate financial and advisory services, financial institutions’ regulation and prudential supervision, and valuation related assessments. She is also a director of Queensland Investment Corporation, Opera Queensland, Australian Reinsurance Pool Corporation; a member of Corporations and Markets Advisory Committee, The Takeovers Panel, the Independent Investment Committee of Queensland Development Fund, the Queensland Government’s Service Delivery and Performance Commission, and the Sunsuper Audit Committee, and a Councillor of the Australian Institute of Company Directors (QldDiv.).
BILL SHIELDS
B ECON (HONS), M EC
APPOINTED JULY 2004. TENURE 30 JUNE 2011.
BOARD COMMITTEES
CHAIRMAN, ACCOUNTS AND AUDIT COMMITTEE
MEMBER, RISK MANAGEMENT COMMITTEE
Mr Shields has considerable experience in the banking and finance industry as well as government policy advice, specialising in economics. His career responsibilities included economic and financial market research in Australia and overseas, and providing analytical and strategic advice on the Australian financial system and monetary policy, Australia’s exchange rate arrangements and international financial developments. Mr Shields was previously Chief Economist and Executive Director, Macquarie Bank Limited (1987-2001). In addition to Macquarie Bank, he has held positions with the Reserve Bank of Australia (1983-1985), the International Monetary Fund (1973-75 and 1977-83) and the Commonwealth Treasury. Mr Shields is a Visiting Professor of Macquarie Graduate School of Management, Macquarie University; a Director of (and Chair, Audit and Compliance Committee) M-co International Limited; and Chairman of the Australian Pacific Economic Cooperation Committee.
SHAUNA TOMKINS
BSC, MBA
APPOINTED JULY 2000. TENURE 30 JUNE 2010.
BOARD COMMITTEES
MEMBER, RISK MANAGEMENT COMMITTEE
MEMBER, HUMAN RESOURCES COMMITTEE
Shauna Tomkins is a principal of Promontory Financial Group Australasia, who works internationally in the development and implementation of regulatory frameworks for prudential supervision and corporate regulation of deposit taking, funds management, insurance and lending institutions. Ms Tomkins has a thorough understanding of Australia’s financial system, risk management analysis, prudential supervision and corporate and structured finance. She also has a strong background in long-term policy and strategic management and planning, and has an indepth understanding of Government objectives and processes. Ms Tomkins is also a member of the Advisory Committee to Queensland’s Motor Accident Insurance Commission.
2006-2007 ANNUAL REPORT 27
QTC Board (continued)
Corporate governance
QTC was established by the Queensland Treasury Corporation Act 1988 (QTC Act), as a Corporation Sole (ie, a corporation that consists solely of a nominated office holder). The Under Treasurer of Queensland is QTC’s nominated office holder. QTC is accountable to the Treasurer of Queensland, through the Under Treasurer.
QTC has delegated its powers to the Queensland Treasury Corporation Capital Markets Board (the Board). QTC and the Board have agreed the terms and administrative arrangements that govern the exercise or performance of those powers and the reports by the Board to QTC.
Board composition
The Board comprises seven directors who are appointed by the Governor-in-Council, pursuant to section 10(2) of the QTC Act, with consideration given to each person’s qualifications, experience, skills, strategic ability, and commitment to contribute to QTC’s performance and achievement of its corporate objectives.
QTC’s Chairman is a non-executive director and the Board is entirely constituted of non-executive directors.
Board responsibilities
The Board operates in accordance with its charter, which sets out its commitment to various corporate governance principles and standards, the roles and responsibilities of the Board and its members, and the conduct of meetings. Within this scope, the roles and functions of the Board include:
| • | | overseeing QTC’s operations, including its control and accountability systems |
| • | | developing and monitoring QTC’s strategic and corporate plans, operational policy and yearly budget |
| • | | monitoring and measuring financial and operational performance |
| • | | monitoring and measuring organisational and staff performance |
| • | | monitoring key risks and risk management processes, and |
| • | | ensuring that QTC’s compliance is appropriate for an organisation of its type. |
Board committees
The Board has established three committees, each with its own terms of reference, to assist it to oversee and control various QTC activities. The committees and their key responsibilities are:
| • | | Accounts and Audit Committee responsibilities: |
| | • | | compliance with laws, regulations and QTC’s own policies and procedures in relation to key financial and operational controls and processes, and |
| • | | Risk Management Committee responsibilities: |
| | • | | the adequacy and implementation of QTC’s enterprise-wide risk management policy, framework and plans for the management of QTC’s significant corporate risks |
| | • | | QTC’s organisation-wide risk profile and exposure to significant risks, and |
| | • | | the adequacy of risk management policies in relation to QTC’s significant risks. |
| • | | Human Resources Committee responsibilities: |
| | • | | the appropriateness of any new or amended human resources policy |
| | • | | the framework for, and review of, employee remuneration and performance, and |
| | • | | employment terms and conditions. |
28 QUEENSLAND TREASURY CORPORATION
Attendance at Board meetings
The following table details the Board Directors’ attendance at Board and committee meetings:
| | | | | | | | |
| | | BOARD
MEETINGS | | RISK
MANAGEMENT
COMMITTEE | | ACCOUNTS
& AUDIT
COMMITTEE | | HUMAN
RESOURCES
COMMITTEE |
MEETINGS HELD | | 11 | | 10 | | 5 | | 5 |
SIR LEO HIELSCHER | | 11 | | 10 | | — | | 5 |
GERARD BRADLEY | | 11 | | 9 | | 5 | | 3 |
GILLIAN BROWN | | 11 | | 10 | | — | | — |
DAVID COE | | 7 | | 6 | | — | | — |
MARIAN MICALIZZI | | 11 | | 10 | | 5 | | — |
BILL SHIELDS | | 11 | | 10 | | 5 | | — |
SHAUNA TOMKINS | | 10 | | 9 | | — | | 4 |
Commitment to corporate governance
The QTC Board and organisational management team endorse and are committed to achieving high standards of corporate governance, accountability, compliance and ethical behaviour. The Board guides this commitment, which is critical for maintaining QTC’s strong market reputation, as well as the ability to achieve success as Queensland’s corporate treasury services provider.
QTC benchmarks its corporate governance practices, so far as they are relevant and appropriate to QTC, against the Australian Stock Exchange Corporate Governance Council Principles of Good Corporate Governance and Best Practice Recommendations (which are not mandatory for QTC), and the Australian Standard 8000/2003-Good Governance Principles. QTC’s corporate governance practices are continually reviewed and updated, as part of a rolling system of appraisal, to reflect industry guidelines and standards.
QTC also maintains a commitment to a continuous disclosure regime with its key stakeholders, a code of conduct that applies to all staff and includes procedures about disclosing conflicts of interest and a compliance program that drives a compliance culture consistent with QTC’s approved mandate and legal and ethical obligations.
Auditors
In accordance with the provisions of the Financial Administration and Audit Act 1977, the Queensland Audit Office is the external auditor for QTC. The Queensland Audit Office has the responsibility for providing Queensland’s Parliament with assurances as to the adequacy of QTC’s discharge of its financial and administrative obligations.
KPMG is QTC’s current internal auditor.
Ethical standards
QTC’s corporate governance policies and practices ensure that QTC acts ethically, within appropriate law, policy and convention, and addresses the systems and processes necessary for the proper direction and management of QTC’s business and affairs.
QTC is committed to observing high standards of integrity and fair dealing in the conduct of its business and to acting with due care, diligence and skill. QTC’s compliance policy requires that QTC and all employees comply with the letter and the spirit of all relevant laws and regulations, industry standards, relevant government policies, and QTC’s own policies and procedures.
Further information
The information in this Annual Report is only a summary of QTC’s corporate governance practices. More detailed compliance disclosures are contained in Appendix C and more comprehensive information is available on QTC’s website at www.qtc.qld.gov.au.
2006-2007 ANNUAL REPORT 29
Corporate report
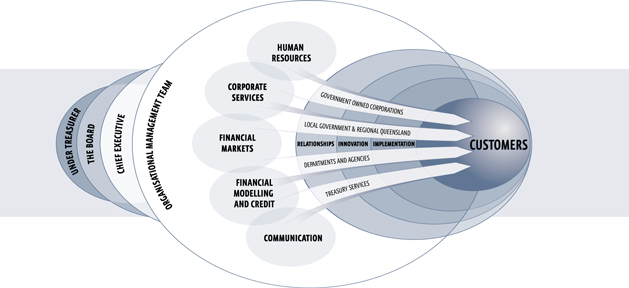
QTC is structured to reflect our overarching value-delivering strategy of customer loyalty, recognising that we achieve our corporate goals through the efforts of our teams.
Our teams work in an integrated and collaborative way to implement the three core processes of the customer loyalty operating model—developing and maintaining relationships, designing and developing customer-specific solutions and delivering tailored solutions that meet our customers’ needs.
The diagram on page 31 demonstrates that, through these processes and supporting teams, our customer teams work directly with customers through our advisory services, as well as our secondment program, to optimise outcomes and appropriately manage risk for the benefit of their organisation and for the State.
People
QTC’s people, and their ability to use their skills and expertise to benefit our customers’ businesses, are one of QTC’s greatest strengths. In the face of a tightening labour market and robust demand for our services, it is critical that QTC attracts and retains the right people to achieve our corporate goals.
In recent years, a number of initiatives have been introduced to improve our retention rate, and these are beginning to yield demonstrable results. These initiatives include:
| • | | a more transparent remuneration system and improved communication with employees about QTC’s remuneration structure |
| • | | a review of the way performance is recognised and rewarded, and |
| • | | a stronger focus on making work enjoyable and fulfilling for employees. |
Both the individual performance and development, and team reward systems have been streamlined, with two annual planning periods that enable corporate plan objectives to cascade down to both team and individual plans.
A strong focus on learning, development and leadership has helped reinforce QTC’s positive and constructive corporate culture. To date, 43 employees have taken part in a tailored development program that was introduced in October 2006.
Cooperation and collaboration between teams and individual team members during the year was a major factor in keeping QTC’s operations running smoothly, despite the challenging combination of heavy demand for QTC’s advisory services and the secondments of a large number of senior personnel. Our ongoing focus of building cross-skilling in core operational roles not only supports individual career development goals, but offsets the impact of employee turnover, leave and secondments.
QTC’s establishment number for permanent employees rose from 152 to 170 during the financial year. Our people demonstrated their professionalism in their willingness to accept and support a wide range of contractors, share skills and information across teams, and take on additional responsibilities when team members were on secondments.
To ensure that we are able to continue to meet our customers’ needs and enhance their businesses, attraction and retention of the right employees will remain a priority. We have undertaken significant work aimed at better targeting potential employees, improving interviewing techniques, improving the employee development programs, and addressing issues arising out of the employee survey.
Similarly we are focused on finding people with strong transactional experience, and an ability to identify new approaches to project delivery and transfer these skills to others. Through our culture of innovation, performance, knowledge-sharing and teamwork, we will continue to strive to deliver the best outcomes for Queensland.
30 QUEENSLAND TREASURY CORPORATION
Risk management
QTC manages risk within an enterprise-wide risk management framework. During the year under review our risk management and reporting processes did not identify any significant issues or deficiencies in our operating procedures.
QTC has completed a review of the enterprise-wide risk management framework. The review concluded that QTC has a sound and mature enterprise-wide risk management framework that is, on the whole, achieving its objective of providing assurance that QTC’s risks are being adequately and appropriately managed. Various recommendations were approved and are now being implemented to further enhance QTC’s achievement of this objective.
The Crisis Management Plan and Emergency Response Procedures were updated during the year with improvements made in both content and structure. In November, QTC held its second crisis scenario-test and introduced a new crisis management toolkit. The outcome was a significant improvement to our previous scenario-test with our Crisis Response Team now having a greater understanding of the procedures to follow during a crisis.
QTC’s audit and compliance processes ensure that our business processes are appropriate and effective. Under our compliance program, based on Australian Standard 3806, compliance is an integral part of our operating procedures, and is the responsibility of all employees. Despite the secondment of a number of senior staff during the year, no issues of significant non-compliance were identified in internal or external audits during the year.
Operational risks associated with the processing and administration of financial markets and customer transactions (loans, investments and leases) were managed prudently during the year. QTC managed 95,756 transactions during the year, with only 43 errors attributable to our organisation. The cost of settlement, leasing and cash flow management errors was $31,345, compared to $47,177 for 2005-06.
The dollar value of transactions increased by $15 billion to $864 billion. Critical system availability was 99.99%, with the total downtime for any critical system being 23 minutes.
Information management
The management of the financial risk associated with our customers’ debt and investments is our core business. The Onlending and Investment Administration project is QTC’s most significant information technology business initiative since the development of the Loan Registry System in the early 1990s.
The project has required significant time and commitment from employees across the organisation, in addition to their existing workloads. It is critical that the transition to a web-enabled environment is managed effectively, and that software applications are purchased rather than developed in-house where possible, to limit the staff time devoted to the project, particularly in the light of the heavy drain placed on QTC’s resources by our secondment program.
2006-2007 ANNUAL REPORT 31
Economic and Fiscal report
Queensland’s economic outlook
ECONOMIC GROWTH
| • | | The Queensland economy is forecast to grow by 5% in 2007-08 and again exceed national growth. Investment by the business and public sector combined is forecast to reach 25% of gross state product, compared with 15% five years ago, boosting the productive capacity of the economy. |
| • | | However, a slight rebalancing in overall economic growth is anticipated, reflecting some easing in investment growth, albeit from very high rates, and a forecast strengthening in exports growth. |
• | | Households are anticipated to return as the principal driver of domestic demand in 2007-08. Consumer spending is forecast to strengthen to 4 3/4%, reflecting strong growth in employment and wages, as well as a pick-up in housing investment, while dwelling investment is forecast to strengthen, driven by ongoing growth in renovation activity as well as a turnaround in new home construction activity. |
CONTRIBUTIONS TO GROWTH IN QUEENSLAND’S GROSS STATE PRODUCT

Notes: Contributions for 2006-07 represent estimated actuals while contributions for 2007-08 represent forecasts.
Source: Queensland Treasury
TRADE SECTOR
• | | The performance of the trade sector is forecast to improve further in 2007-08, with net exports anticipated to detract only 1% from growth. Export growth is forecast to strengthen to a seven-year high of 3 3/4%, with a rebound in rural and base metal exports forecast to complement continued growth in coal exports due to strong global demand. |
• | | Imports growth is forecast to edge higher to 5 1/2% in 2007-08, with an anticipated strengthening in growth in imports by the household sector more than offsetting more moderate growth in imports of machinery and equipment. |
INFLATION
• | | Inflation is forecast to ease to 2 3/4% in 2007-08, following an assumed return to normal seasonal conditions, which should dampen food price inflation next year, while a pick-up in labour productivity growth is expected to restrain growth in production costs. |
EMPLOYMENT
| • | | Reflecting some moderation in growth in overall domestic activity, employment growth is forecast to return to the long-run average rate of 3% in 2007-08, representing the creation of a further 60,000 jobs next financial year. |
2006-07 ECONOMIC HIGHLIGHTS
• | | Growth in the Queensland economy is estimated to strengthen to an above average rate of 5 1/2% in 2006-07, driven by strong domestic demand and a recovery in exports. |
• | | This will represent a growth rate more than double the 2 1/2% estimated nationally, and the eleventh successive year that Queensland’s economic growth has exceeded national growth. |
| • | | Investment is expected to be the main driver of growth in domestic demand in 2006-07. Business investment is estimated to rise 18% and be broad based across the trade, property and service sectors, while public investment in water, transport and energy infrastructure is also expected to grow strongly. |
• | | Employment growth is estimated to strengthen to an above-average rate of 4 3/4% in 2006-07, representing the creation of more than 90,000 jobs over the year. |
• | | Despite the labour force participation rate rising to an estimated new high of 67 1/4%, employment growth is still expected to exceed labour force growth in 2006-07, resulting in the State’s year-average unemployment rate falling to an estimated 33 year low of 4%. |
2006-2007 ANNUAL REPORT 33
Economic and Fiscal report (continued)
KEY ECONOMIC VARIABLES 2006-07
Notes: All figures represent estimated actuals.
Source: Queensland Treasury and Commonwealth Treasury
Queensland’s fiscal environment
2007-08 BUDGETED RESULT
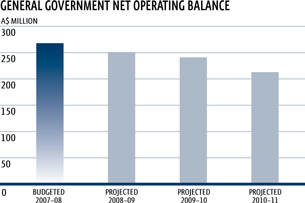
| • | | On an accrual basis, the Queensland State Budget provided for a General Government net operating surplus of $245 million in 2007-08. The General Government forward estimates project continuing surpluses over the State Budget forecast horizon, consistent with the fiscal principles outlined in the Charter of Social and Fiscal Responsibility. |
Source: 2007-08 Queensland Government Budget Papers
| • | | The 2007-08 Budget also provides for a cash deficit of $892 million in the General Government sector on a Government Finance Statistics (GFS) basis. |
2006-07 ESTIMATED ACTUAL RESULT
| • | | The Estimated Actual General Government net operating result, on a GFS basis for 2006-07, is a $2.393 billion surplus. |
| • | | The estimated 2006-07 surplus reflects the continuing strength of the economy flowing through to taxation and related revenues and investment returns above the long- term assumed rate of return. |
KEY FINANCIAL AGGREGATES (GFS BASIS)
| | | | | | | | | | | | | | |
| | | 2006-07 EST. ACTUAL A$M | | 2007-08
BUDGET A$M | | | 2008-09
PROJECTED A$M | | | 2009-10
PROJECTED A$M | | | 2010-2011
PROJECTED A$M | |
GENERAL GOVERNMENT SECTOR | | | | | | | | | | | | | | |
REVENUE | | 32,557 | | 32,551 | | | 33,307 | | | 34,605 | | | 35,979 | |
EXPENSES | | 30,164 | | 32,282 | | | 33,056 | | | 34,364 | | | 35,766 | |
NET OPE RATING BALANCE | | 2,393 | | 268 | | | 251 | | | 241 | | | 213 | |
CASH SURPLUS /(DEFICIT) | | 1,722 | | (892 | ) | | (2,248 | ) | | (2,298 | ) | | (2,045 | ) |
CAPITAL PURCHASES | | 4,137 | | 5,463 | | | 5,839 | | | 5,899 | | | 5,947 | |
NET WORTH | | 114,466 | | 119,799 | | | 123,302 | | | 127,072 | | | 130,941 | |
Source: 2007-08 Queensland Government Budget Papers
34 QUEENSLAND TREASURY CORPORATION
| • | | Investment market volatility impacts more on the Queensland Budget than it does for other states. This is in part due to differences in the way Queensland’s public sector superannuation arrangements are structured, with investment returns impacting directly on the operating result as an increase or decrease in revenue associated with the investment of financial assets held to meet future liabilities. If Queensland’s superannuation arrangements were structured on the same basis as that which generally applies in other states, the General Government sector underlying operating result for 2006-07 would be a surplus of $1.307 billion. |
BALANCE SHEET
| • | | Queensland continues to maintain a strong balance sheet compared with the other states. At 30 June 2008, Queensland’s estimated net debt in the General Government sector is negative, implying a strong net asset position. Queensland’s negative net debt of $5,931 per capita (net financial assets) compares to the average net debt of $517 per capita (net financial liabilities) in the other states. |
FORECAST NET DEBT PER CAPITA AS AT 30 JUNE 2008

Source: 2007-08 Queensland Government Budget Papers
| • | | The State’s net financial asset position remains extremely sound. Based on current projections, the General Government sector will continue to meet the commitment in the Government’s Charter to ensure that financial assets cover all accruing and expected future liabilities in all years through to 30 June 2011. |
| • | | Queensland has consistently pursued sound long-term fiscal policies such as the full funding of employee superannuation entitlements. The strong balance sheet and high levels of liquidity in the General Government sector clearly demonstrate the success of these policies. |
RATIO OF FINANCIAL ASSETS TO LIABILITIES EXCLUDING INVESTMENTS IN PUBLIC TRADING ENTERPRISES AS AT 30 JUNE 2008
GENERAL GOVERNMENT SECTOR
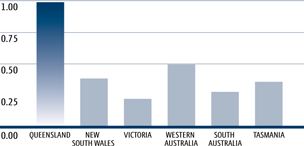
COMPETITIVE TAX ENVIRONMENT
| • | | One of the Queensland Government’s key fiscal objectives is to maintain a competitive tax environment while raising sufficient revenue to meet the infrastructure and government service delivery needs of the people of Queensland. |
| • | | In 2007-08, state tax collections per capita in Queensland are expected to be $2,226, which compares to an estimated average state tax collection of $2,357 for the other states and territories. Queensland’s per capita taxation for 2007-08 is 5.6% lower than the average tax per capita of the other states. |
TAXATION REVENUE PER CAPITA, 2007-08
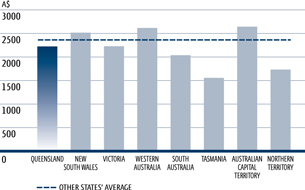
Source: 2007-08 Queensland Government Budget Papers
2006-2007 ANNUAL REPORT 35
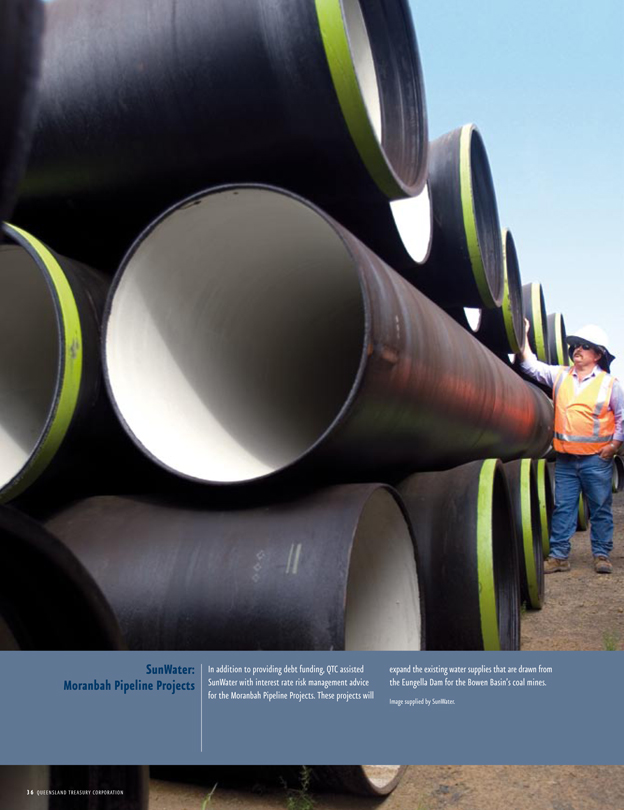
Financial Statements
For the year ended 30 June 2007
| | |
CONTENTS | | PAGE |
Income Statement | | 38 |
Balance Sheet | | 39 |
Statement of Changes in Equity | | 40 |
Cash Flow Statement | | 41 |
Notes to and Forming Part of the Financial Statements | | 42 |
Certificate of the Queensland Treasury Corporation | | 70 |
Independent Auditor’s Report | | 71 |
2006-2007 ANNUAL REPORT 37
Income Statement
for the year ended 30 June 2007
| | | | | | | | |
| | | NOTE | | 30 JUNE 2007
$000 | | | 30 JUNE 2006
$000 | |
Income | | | | | | | | |
| | | |
REVENUE | | | | | | | | |
Interest income | | 3 | | 1 520 137 | | | 1 220 884 | |
Fees - management | | 4 | | 24 820 | | | 22 698 | |
- professional | | | | 252 | | | 217 | |
- other | | | | 402 | | | 231 | |
Amortisation of cross border lease deferred income | | | | 8 709 | | | 8 763 | |
Other revenue | | | | 7 | | | 1 | |
| | | |
GAINS | | | | | | | | |
Gain on sale of property, plant and equipment | | | | 14 | | | — | |
| | | | | | | | |
TOTAL INCOME | | | | 1 554 341 | | | 1 252 794 | |
| | | | | | | | |
| | | |
Expenses | | | | | | | | |
| | | |
Interest expense | | 3 | | 1 461 764 | | | 1 160 268 | |
Administration expenses | | 5 | | 32 958 | | | 30 249 | |
Provisions – cooperative housing societies | | 11 | | 25 | | | (6 | ) |
Loss on sale of property, plant and equipment | | | | — | | | 58 | |
| | | | | | | | |
TOTAL EXPENSES | | | | 1 494 747 | | | 1 190 569 | |
| | | | | | | | |
Share of profit/(loss) from investments accounted for using the equity method | | 28 | | (5 | ) | | 85 | |
| | | | | | | | |
OPERATING SURPLUS BEFORE PAYMENT IN LIEU OF INCOME TAX | | | | 59 589 | | | 62 310 | |
| | | | | | | | |
Payment in lieu of income tax | | 6 | | 13 740 | | | 12 741 | |
| | | | | | | | |
OPERATING SURPLUS AFTER PAYMENT IN LIEU OF INCOME TAX | | | | 45 849 | | | 49 569 | |
| | | | | | | | |
The accompanying notes form part of these financial statements.
38 QUEENSLAND TREASURY CORPORATION
Balance Sheet
as at 30 June 2007
| | | | | | |
| | | NOTE | | 30 JUNE 2007 $000 | | 30 JUNE 2006 $000 |
| | | |
| | | |
Assets | | | | | | |
| | | |
Cash assets | | | | 99 | | 124 |
Receivables | | 7 | | 2 493 | | 2 278 |
Prepayments | | | | 376 | | 283 |
Financial assets at fair value through profit or loss | | 8 | | 16 200 405 | | 13 557 724 |
Derivative financial assets | | 9 | | 112 851 | | 66 747 |
Onlendings | | 10 | | 24 268 854 | | 19 831 582 |
Property, plant and equipment | | 12 | | 25 485 | | 31 259 |
Investments accounted for using the equity method | | 28 | | 180 | | 185 |
Intangible assets | | 13 | | 491 | | 310 |
Deferred income tax asset | | 6 | | 1 084 | | 1 686 |
| | | | | | |
TOTAL ASSETS | | | | 40 612 318 | | 33 492 178 |
| | | | | | |
| | | |
Liabilities | | | | | | |
| | | |
Payables | | 14 | | 180 578 | | 198 105 |
Tax liabilities | | 6 | | 13 485 | | 13 509 |
Derivative financial liabilities | | 15 | | 271 954 | | 104 158 |
Financial liabilities at fair value through profit or loss | | 16 | | 39 772 952 | | 32 848 906 |
| | | | | | |
TOTAL LIABILITIES | | | | 40 238 969 | | 33 164 678 |
| | | | | | |
NET ASSETS | | | | 373 349 | | 327 500 |
| | | | | | |
| | | |
Equity | | | | | | |
| | | |
Reserves | | 17 | | 83 711 | | 74 403 |
Retained surplus | | | | 289 638 | | 253 097 |
| | | | | | |
TOTAL EQUITY | | | | 373 349 | | 327 500 |
| | | | | | |
The accompanying notes form part of these financial statements.
2006-2007 ANNUAL REPORT 39
Statement of Changes in Equity
for the year ended 30 June 2007
| | | | | | | | | | | | | |
| | | NOTE | | GENERAL RESERVE $000 | | CREDIT RISK RESERVE $000 | | BASIS RISK RESERVE $000 | | RETAINED SURPLUS $000 | | | TOTAL EQUITY $000 |
| | | | | | |
| | | | | | |
Balance at 1 July 2005 | | | | 39 082 | | 16 824 | | 13 000 | | 209 025 | | | 277 931 |
Operating surplus from continuing operations | | | | — | | — | | — | | 49 569 | | | 49 569 |
Transfer from /(to) retained surplus | | 17 | | — | | 4 497 | | 1000 | | (5 497 | ) | | — |
| | | | | | | | | | | | | |
BALANCE AT 30 JUNE 2006 | | | | 39 082 | | 21 321 | | 14 000 | | 253 097 | | | 327 500 |
| | | | | | | | | | | | | |
Balance at 1 July 2006 | | | | 39 082 | | 21321 | | 14 000 | | 253 097 | | | 327 500 |
Operating surplus from continuing operations | | | | — | | — | | — | | 45 849 | | | 45 849 |
Transfer from /(to) retained surplus | | 17 | | — | | 6 808 | | 2 500 | | (9 308 | ) | | — |
| | | | | | | | | | | | | |
BALANCE AT 30 JUNE 2007 | | | | 39 082 | | 28 129 | | 16 500 | | 289 638 | | | 373 349 |
| | | | | | | | | | | | | |
The accompanying notes form part of these financial statements.
40 QUEENSLAND TREASURY CORPORATION
Cash Flow Statement
for the year ended 30 June 2007
| | | | | | | | |
| | | NOTE | | 30 JUNE 2007 $000 | | | 30 JUNE 2006 $000 | |
| | | |
Cash Flows from Operating Activities | | | | | | | | |
Interest received from onlendings | | | | 821 797 | | | 702 757 | |
Interest received from investments | | | | 929 686 | | | 689 842 | |
Interest received from operating leases | | | | 6 913 | | | 7 882 | |
Fees received - management | | | | 24 892 | | | 22 745 | |
Fees received - professional | | | | 29 | | | 330 | |
Fees received - other | | | | 386 | | | 232 | |
(Payments)/receipts for Cross Border Lease arrangements | | | | (515 | ) | | 2 | |
GST paid to suppliers | | | | (2 838 | ) | | (591 | ) |
GST refunds from ATO | | | | 2 706 | | | 520 | |
GST paid to ATO | | | | (1 583 | ) | | (2 101 | ) |
GST received from customers | | | | 3 878 | | | 1 937 | |
Interest paid on interest-bearing liabilities | | | | (1 895 786 | ) | | (1 483 226 | ) |
Interest paid on deposits | | | | (317 171 | ) | | (301 747 | ) |
Administration expenses paid | | | | (23 459 | ) | | (22 619 | ) |
Payment in lieu of income tax | | | | (13 163 | ) | | (11 577 | ) |
| | | | | | | | |
NET CASH PROVIDED BY/(USED IN) OPERATING ACTIVITIES | | 18 | | (464 228 | ) | | (395 614 | ) |
| | | | | | | | |
Cash Flows from Investing Activities | | | | | | | | |
Proceeds from sale of investments | | | | 70 634 600 | | | 66 103 745 | |
Payments for investments | | | | (73 398 550 | ) | | (68 402 894 | ) |
Net onlendings | | | | (4 490 472 | ) | | (1 056 423 | ) |
Payments for property, plant and equipment | | | | (1 049 | ) | | (247 | ) |
Payments for intangibles | | | | (392 | ) | | (351 | ) |
Investment in Local Government Infrastructure Services Pty Ltd | | | | — | | | (100 | ) |
Proceeds from sale of property, plant and equipment | | | | 681 | | | 1 027 | |
| | | | | | | | |
NET CASH PROVIDED BY/(USED IN) INVESTING ACTIVITIES | | | | (7 255 182 | ) | | (3 355 243 | ) |
| | | | | | | | |
Cash Flows from Financing Activities | | | | | | | | |
Proceeds from interest-bearing liabilities | | | | 17 193 811 | | | 10 748 626 | |
Repayment of interest-bearing liabilities | | | | (11497 590 | ) | | (7 091 711 | ) |
Net deposits | | | | 2 023 164 | | | 94 010 | |
| | | | | | | | |
NET CASH PROVIDED BY/(USED IN) FINANCING ACTIVITIES | | | | 7 719 385 | | | 3 750 925 | |
| | | | | | | | |
NET (DECREASE)/ INCREASE IN CASH HELD | | | | (25 | ) | | 68 | |
Cash at 1 July | | | | 124 | | | 56 | |
| | | | | | | | |
CASH AT 30 JUNE | | | | 99 | | | 124 | |
| | | | | | | | |
The accompanying notes form part of these financial statements.
2006-2007 ANNUAL REPORT 41
Notes to and Forming Part of the Financial Statements
for the year ended 30 June 2007
| | |
Contents | | |
| |
NOTE | | PAGE |
1. General Information | | 43 |
2. Summary of Significant Accounting Policies | | 43 |
3. Interest Income and Interest Expense | | 47 |
4. Management Fees | | 49 |
5. Administration Expenses | | 49 |
6. Payment in Lieu of Income Tax | | 50 |
7. Receivables | | 50 |
8. Financial Assets at Fair Value through Profit or Loss | | 51 |
9. Derivative Financial Assets | | 51 |
10. Onlendings | | 51 |
11. Impairment of Co-operative Housing Society Loans | | 52 |
12. Property, Plant and Equipment | | 53 |
13. Intangible Assets | | 53 |
14. Payables | | 53 |
15. Derivative Financial Liabilities | | 54 |
16. Financial Liabilities at Fair Value through Profit or Loss | | 54 |
17. Reserves | | 56 |
18. Notes to the Cash Flow Statement | | 57 |
19. Financial Risk Management | | 58 |
20. Concentrations of Borrowings and Deposits | | 62 |
21. Contingent Liabilities | | 63 |
22. Operating Leases | | 64 |
23. Forward Starting Fixed Rate Loan Commitments | | 64 |
24. Stock Lending | | 65 |
25. Segment Information | | 65 |
26. Funding Facilities | | 65 |
27. Related Party Transactions | | 65 |
28. Investments Accounted for using the Equity Method | | 66 |
29. Investments in Companies | | 67 |
30. Remuneration of Officers | | 68 |
31. Other Director and Executive Disclosures | | 69 |
32. Dividends | | 69 |
33. Events Subsequent To Balance Date | | 69 |
42 QUEENSLAND TREASURY CORPORATION
1. General Information
Queensland Treasury Corporation (QTC) is constituted under the Queensland Treasury Corporation Act 1988 (the “Act”), with the Under Treasurer designated as the Corporation Sole under section 5 (2) of the Act.
QTC is the State’s central financing authority and corporate treasury services provider, with responsibility for providing debt funding, liability management, cash management and financial risk management advice to public sector customers. These services are undertaken on a cost recovery basis with QTC lending at an interest rate based on its cost of funds and with the benefits/costs of liability and asset management being passed on to its customers being Queensland public sector entities.
The majority of QTC’s profits are generated as a result of interest earned from the investment of QTC’s equity.
QTC ensures that in undertaking its activities it has adequate capital to manage its risks.
2. Summary of Significant Accounting Policies
(A) BASIS OF PREPARATION
These general purpose financial statements for the year ended 30 June 2007 have been prepared in accordance with the requirements of the Financial Management Standard 1997 issued pursuant to the Financial Administration and Audit Act 1977, Australian Accounting Standards, other authoritative pronouncements of the Australian Accounting Standards Board and Urgent Issues Group Interpretations.
The financial report complies with Australian equivalents to International Financial Reporting Standards (AIFRS).
EARLY ADOPTION Of STANDARDS
QTC elected to apply the following pronouncements to the annual reporting period beginning 1 July 2006:
| • | | AASB 7: Financial Instruments – Disclosures |
| • | | Revised AASB132: Financial Instruments – Presentation |
No adjustments to any of the financial statements were required for the above pronouncements, however, certain disclosures are no longer required and have therefore been omitted. Other accounting standards and interpretations issued but not mandatory for the 30 June 2007 reporting period have not been adopted early. Application of these standards is not expected to significantly impact on the financial statements in subsequent reporting periods.
HISTORICAL COST CONVENTION
The financial statements have been prepared using the historical cost convention and do not take into account changing money values or current valuations of non current assets unless otherwise indicated.
CLASSIFICATION OF ASSETS AND LIABILITIES
Assets and liabilities are disclosed by nature and in an order that generally reflects their relative liquidity.
(B) INVESTMENT IN JOINT VENTURE ENTITY
QTC’s investment in Local Government Infrastructure Services Pty Ltd is accounted for using the equity method in the financial statements. Under the equity method, the share of the profits or losses of the joint venture is recognised in the Income Statement, and the share of movements in reserves is recognised in reserves in the Balance Sheet. Investments in joint venture entities are carried at the equity accounted amount.
(C) INVESTMENTS IN OTHER COMPANIES
Investments in other companies are accounted for at cost (refer note 29). The principal activity of Queensland Treasury Holdings Pty Ltd (QTH) is to act as a corporate vehicle through which the Queensland Government invests in assets of strategic importance to the State.
Queensland Treasury holds a 60% beneficial interest in QTH. The remaining 40% is held by QTC for and on behalf of the Under Treasurer as Corporation Sole of QTC.
QTC does not have significant influence over the financial and operating policies of QTH and therefore does not apply the equity method of accounting to the investment.
(D) FOREIGN CURRENCY
Foreign currency transactions are initially translated into Australian dollars at the rate of exchange applying at the date of the transaction. At balance date, amounts payable to and by QTC in foreign currencies have been valued using current exchange rates after taking into account interest rates and accrued interest.
Exchange gains/losses are brought to account in the Income Statement.
(E) CASH
Cash assets include only those funds held at bank and do not include money market deposits.
(F) FINANCIAL ASSETS AND FINANCIAL LIABILITIES
RECOGNITION AND DERECOGNITION
Financial assets and financial liabilities are recognised in the Balance Sheet when QTC becomes party to the contractual provisions of the financial instrument.
A financial asset is derecognised when the contractual rights to the cash flows from the financial assets expire or are transferred and no longer controlled by QTC.
A financial liability is removed from the Balance Sheet when the obligation specified in the contract is discharged, cancelled or expires.
2006-2007 ANNUAL REPORT 43
Notes to and Forming Part of the Financial Statements
for the year ended 30 June 2007 (continued)
2. Summary of Significant Accounting Policies (continued)
(F) FINANCIAL ASSETS AND FINANCIAL LIABILITIES (CONTINUED)
MEASUREMENT
Financial assets and liabilities at fair value through profit or loss are measured at fair value by reference to quoted market prices when available. If quoted market prices are not available, then fair values are estimated on the basis of pricing models, or other recognised valuation techniques.
Fair value is the amount for which an asset could be exchanged, or liability settled between knowledgeable, willing parties in an arm’s length transaction.
QTC uses mid market rates as a basis for establishing fair values of quoted financial instruments with offsetting risk positions. In general, the risk characteristics of funds borrowed together with the financial derivatives used to manage interest rate and foreign currency risks closely match those of funds onlent. In all other cases, the bid-offer spread is applied where material.
CLASSIFICATION
Management classifies its financial instruments on initial recognition into the following categories:
| • | | Derivative financial instruments |
| • | | Financial assets at fair value through profit or loss, and |
| • | | Financial liabilities at fair value through profit or loss. |
QTC’s accounting policies for significant financial assets and financial liabilities are listed below.
ONLENDINGS
Onlendings, with the exception of loans to co-operative housing societies, are included in the Balance Sheet at their redemption value which is representative of market value. Loans to co-operative housing societies are based on the balance of each housing society’s loans to its members adjusted where necessary for a specific provision for impairment (refer note 2 (R)).
DERIVATIVE MANUAL INSTRUMENTS
QTC uses derivative financial instruments to hedge its exposure to interest rate, foreign currency and credit risks as part of asset and liability management activities. In addition they may be used, to deliver long term floating rate or long term fixed rate exposure. In accordance with its treasury policy, QTC does not hold or issue derivative financial instruments for speculative purposes.
All derivatives are carried as assets when fair value is positive and as liabilities when fair value is negative.
FINANCIAL ASSETS AT FAIR VALUE THROUGH PROFIT OR LOSS
Financial assets at fair value through profit or loss consist of all other investments including money market deposits, discount securities, semi-government bonds and floating rate notes. Unrealised gains and losses are brought to account in the Income Statement.
FINANCIAL LIABILITIES AT FAIR VALUE THROUGH PROFIT OR LOSS
Financial liabilities at fair value through profit or loss include interest-bearing liabilities and deposits. Unrealised gains and losses are brought to account in the Income Statement.
INTEREST-BEARING LIABILITIES
Interest-bearing liabilities mainly consist of Australian and overseas bonds. Australian bonds include QTC’s domestic, capital indexed and public bonds. Overseas bonds include global bonds and Eurobonds. Global bonds are Australian dollar denominated bonds issued overseas.
DEPOSITS
Deposits are accepted to either the Working Capital Facility (11AM Fund) or the Cash Fund for portfolio management. Income derived from the investment of these deposits accrues to depositors daily. The amount shown in the Balance Sheet represents the market value of deposits held at balance date.
Securities which are sold under agreements to repurchase at an agreed price remain as an investment whilst the obligation to repurchase is disclosed as a deposit.
(G) SETTLEMENT DATE ACCOUNTING
Purchases and sales of financial assets and liabilities at fair value through profit or loss are recognised on settlement date. QTC accounts for any change in the fair value of the asset to be received during the period between the trade date and settlement date in the same way as it accounts for the acquired asset.
(H) LEASE ARRANGEMENTS
Leases in which a significant portion of the risks and rewards of ownership are retained by the less or are classified as operating leases (note 22). Operating leases, in which QTC is the lessee, are expensed on a straight-line basis over the term of the lease.
(I) INTEREST INCOME AND INTEREST EXPENSE
The recognition of investment income and borrowing costs includes net realised gains/losses from the sale of investments (interest income) and the preredemption of borrowings (interest expense) together with the net unrealised gains/losses arising from holding investments and certain onlendings (interest income) and net unrealised gains/losses from borrowings (interest expense). These unrealised gains/losses are a result of revaluing to market daily.
The majority of onlendings are provided to customers on a pooled basis. Interest costs are allocated to customers based on the daily movement in the market value of the pool.
44 QUEENSLAND TREASURY CORPORATION
2. Summary of Significant Accounting Policies (continued)
(J) FEE INCOME
Management and professional fee income represents income earned from the management of QTC’s onlendings and deposits and is recognised on an accrual basis when the service has been provided. Asset and liability management fee income integral to the yield of an originated financial instrument is recognised proportionately over the period the product is provided.
(K) PROFITS/LOSSES
Unless otherwise determined by the Governor in Council, the Queensland Treasury Corporation Act 1988 requires that all profits shall accrue to the benefit of Consolidated Fund and all losses shall be the responsibility of Consolidated Fund.
(L) CROSS BORDER LEASES - INCOME RECOGNITION
The portion of the cross border lease income received which is regarded as an advisory fee for the transaction is recognised on receipt. The balance of income received is deferred and amortised over the term of each lease.
(M) LEASE INCOME
Lease income from operating leases where QTC is the lessor is recognised as income on a straight line basis over the lease term.
(N) PROPERTY, PLANT AND EQUIPMENT
Property, plant and equipment are included at cost from the date of acquisition. Items of property, plant and equipment with a cost or other value equal to or in excess of the following thresholds are recognised for financial reporting purposes in the year of acquisition:
| | | |
ASSET CLASS | | THRESHOLD |
Information technology equipment | | $ | 5,000 |
Furniture and fittings and office equipment | | $ | 5,000 |
Plant and machinery | | $ | 5,000 |
Items with a lesser value are expensed in the year of acquisition.
Depreciation is calculated on a straight line basis over the estimated useful l ife of the assets. Depreciation rates for each class of asset are as follows:
| | | |
ASSET CLASS | | DEPRECIATION RATE | |
Information technology equipment | | 6 -40 | % |
Furniture, fittings and office equipment | | 8-33 | % |
Plant and machinery | | 10 | % |
The assets’ residual values, useful lives and depreciation methods are reviewed and adjusted, if appropriate, at each financial year end.
DERECOGNITION
An item of property, plant and equipment is derecognised upon disposal or when no further future economic benefits are expected from its use or subsequent disposal. Any gain or loss arising on derecognition of the asset (calculated as the difference between the net disposal proceeds and the carrying amount of the asset) is included in the Income Statement in the year the asset is derecognised.
IMPAIRMENT
The carrying amounts of QTC’s assets are reviewed at each balance sheet date to determine whether there is any indication of impairment. If any such indication exists, the asset’s recoverable amount is estimated. An assessment of impairment has been made and no adjustment was required.
(O) INTANGIBLE ASSETS
SOFTWARE
Acquired computer software licences are capitalised on the basis of the costs incurred to acquire and bring to use the specific software. These costs are amortised over their estimated useful lives between two to five years.
Costs associated with the development of computer software for projects exceedinga threshold of $100,000 are recognised as intangible assets if the product is technically and commercially feasible and it is likely to generate future economic benefits exceeding costs beyond one year. The expenditure capitalised comprises all directly attributable costs including some labour costs. All other costs associated with the development of software are expensed as incurred.
Computer software development costs recognised as assets are amortised on a straight-line basis over the period of expected benefit which varies from five to seven years.
(P) PAYMENT IN LIEU OF INCOME TAX
QTC is exempt from the payment of income tax under section 50-25 of the Income Tax Assessment Act 1997 (as amended).
QTC makes a payment in lieu of income tax to the Queensland Government’s Consolidated Fund. The calculation of the income tax liability is based on the income of certain activities controlled by QTC.
In calculating the payment in lieu of income tax expense, tax effect accounting principles are adopted for income received and expenses paid in relation to the management and administration of customers’ borrowings and deposits as well as for advisory services and structured finance transactions. For all other QTC operations on which a payment in lieu of income tax is made, tax effect accounting principles are not applied.
QTC’s controlled and jointly controlled entities are defined as State and Territory bodies under section 24AO of the Income Tax Assessment Act 1936 and as a consequence are exempt from Commonwealth tax under section 24AM of this Act.
Deferred income tax is provided in full, using the liability method, on all temporary differences arising between the tax bases of assets and liabilities and their carrying amounts in the financial statements.
Deferred income tax liabilities are recognised for all taxable temporary differences arisingfrom prepayments of expenditure of QTC. Deferred income tax assets are recognised for deductible temporary differences arising from accruals of expenditure, employee benefits and depreciation charged on property, plant and equipment.
Deferred tax assets are recognised where it is probable that future taxable income will be available against which the temporary differences can be utilised.
2006-2007 ANNUAL REPORT 45
Notes to and Forming Part of the Financial Statements
for the year ended 30 June 2007 (continued)
2. Summary of Significant Accounting Policies (continued)
(Q) EMPLOYEE BENEFITS
WAGES, SALARIES, RECREATION LEAVE, LONG SERVICE LEAVE AND SICK LEAVE
Wages, salaries, annual and long service leave due but unpaid at reporting date are recognised in other creditors at the remuneration rates expected to apply at the time of settlement and include related on-costs such as payroll tax, workers compensation premiums and employer superannuation contributions.
For unpaid entitlements expected to be paid within 12 months, the liabilities are recognised at their undiscounted values. For those entitlements not expected to be paid within 12 months, the liabilities are recognised at their present value, calculated using Commonwealth Government bond yields of similar maturity.
Prior history indicates that on average, sick leave taken each reporting period is less than the entitlement accrued. This is expected to continue in future periods. Accordingly, it is unlikely that existing accumulated entitlements will be used by employees and no liability for unused sick leave entitlements is recognised.
As sick leave is non-vesting, an expense is recognised for this leave as it is taken.
RETIREMENT BENEFITS
Contributions made by QTC to employee contributory superannuation funds (to provide benefits for employees and their dependants on retirement, disability or death) are charged to the Income Statement. QTC is not responsible for any shortfalls.
(R) PROVISIONS FOR IMPAIRED LOANS
In recent years QTC has, at the direction of the Queensland Government, acquired loans provided to a number of co-operative housing societies at a cost equivalent to book value. At the time of acquisition, there were a number of non performing loans. Specific provisions have been made where full recovery of principal and interest is considered doubtful based on the net realisable value of the underlying security. Such loans are treated as impaired assets and categorised as non-accrual loans as set out and explained in note 11.
(S) ROUNDING
Amounts have been rounded to the nearest thousand dollars except for note 26 which is rounded to the nearest million dollars and note 30 which is in whole dollars.
(T) COMPARATIVE FIGURES
Where necessary, comparative figures have been adjusted to conform with changes in presentation in the current year.
(U) JUDGMENTS AND ASSUMPTIONS
QTC has made no judgements or assessments which may cause a material adjustment to the carrying amounts of assets and liabilities within the next reporting period.
46 QUEENSLAND TREASURY CORPORATION
3. Interest Income and Interest Expense
| | | | | | | | | | | |
| | | | | FOR THE YEAR ENDED 30 JUNE 2007 | | | | |
| | | INTEREST $000 | | NET UNREALISED GAIN/LOSS $000 | | | NET REALISED GAIN/LOSS $000 | | | TOTAL INTEREST $000 | |
| | | | |
| | | | |
INTEREST INCOME | | | | | | | | | | | |
AUSTRALIA | | | | | | | | | | | |
Money market deposits | | 59 230 | | 8 | | | — | | | 59 238 | |
Discount securities | | 487 748 | | 397 | | | (135 | ) | | 488 010 | |
Commonwealth and semi-government securities | | 117 767 | | (16 810 | ) | | (50 225 | ) | | 50 732 | |
Floating rate notes | | 175 709 | | 189 | | | 1 110 | | | 177 008 | |
Other investments | | 65 730 | | (4 980 | ) | | (91 | ) | | 60 659 | |
Forward rate agreements | | — | | (84 698 | ) | | — | | | (84 698 | ) |
Onlendings* | | 821 624 | | (53 000 | ) | | — | | | 768 624 | |
| | | | |
OVERSEAS | | | | | | | | | | | |
Credit derivatives | | 772 | | (201 | ) | | (7 | ) | | 564 | |
| | | | | | | | | | | |
| | 1 728 580 | | (159 095 | ) | | (49 348 | ) | | 1 520 137 | |
| | | | | | | | | | | |
INTEREST EXPENSE | | | | | | | | | | | |
AUSTRALIA | | | | | | | | | | | |
Deposits | | 316 578 | | 302 | | | — | | | 316 880 | |
Treasury notes | | 28 166 | | 41 | | | — | | | 28 207 | |
Bonds | | 977 446 | | (317 257 | ) | | (114 790 | ) | | 545 399 | |
Credit foncier loans | | 229 | | (776 | ) | | — | | | (547 | ) |
Interest rate swaps | | 55 557 | | 77 170 | | | — | | | 132 727 | |
Forward rate agreements | | — | | (449 | ) | | 783 | | | 334 | |
Futures | | — | | (1 089 | ) | | 20 246 | | | 19 157 | |
| | | | |
OVERSEAS | | | | | | | | | | | |
Commercial paper | | 17 020 | | (36 993 | ) | | (147 | ) | | (20 120 | ) |
Bonds | | 663 886 | | (145 957 | ) | | (138 886 | ) | | 379 043 | |
Medium-term notes | | 15 923 | | 553 | | | (495 | ) | | 15 981 | |
Forward exchange contracts | | 12 | | 7 206 | | | 33 607 | | | 40 825 | |
| | | | |
OTHER | | | | | | | | | | | |
Registration and issue costs | | 2 194 | | — | | | — | | | 2 194 | |
Commissions on futures | | 1 684 | | — | | | — | | | 1 684 | |
| | | | | | | | | | | |
| | 2 078 695 | | (417 249 | ) | | (199 682 | ) | | 1461 764 | |
| | | | | | | | | | | |
| * | The majority of onlendings are provided to customers on a pooled fund basis. Interest costs are allocated to customers based on the daily movement in the market value of the pooled fund. Except for fixed rate loans, the interest from onlendings figure includes unrealised gains and losses which reflects the amount charged to customers. |
2006-2007 ANNUAL REPORT 47
Notes to and Forming Part of the Financial Statements
for the year ended 30 June 2007 (continued)
3. Interest Income and Interest Expense (continued)
| | | | | | | | | | | |
| | | | | FOR THE YEAR ENDED 30 JUNE 2006 | | | | |
| | | INTEREST
$000 | | NET UNREALISED
GAIN/LOSS $000 | | | NET REALISED
GAIN/LOSS
$000 | | | TOTAL INTEREST
$000 | |
| INTEREST INCOME | | | | | | | | | | | |
| AUSTRALIA | | | | | | | | | | | |
Money market deposits | | 61 317 | | (8 | ) | | — | | | 61 309 | |
Discount securities | | 344 783 | | (1 374 | ) | | 126 | | | 343 535 | |
Commonwealth and semi-government securities | | 93 348 | | (42 418 | ) | | 14 607 | | | 65 537 | |
Floating rate notes | | 149 452 | | (221 | ) | | 353 | | | 149 584 | |
Other investments | | 69 054 | | (15 848 | ) | | 1 710 | | | 54 916 | |
Forward rate agreements | | — | | (27 164 | ) | | — | | | (27 164 | ) |
Onlendings* | | 648 327 | | (76 021 | ) | | — | | | 572 306 | |
| | | | |
OVERSEAS | | | | | | | | | | | |
Credit derivatives | | 559 | | 301 | | | 1 | | | 861 | |
| | | | | | | | | | | |
| | 1 366 840 | | (162 753 | ) | | 16 797 | | | 1 220 884 | |
| | | | | | | | | | | |
INTEREST EXPENSE | | | | | | | | | | | |
AUSTRALIA | | | | | | | | | | | |
Deposits | | 302 970 | | 17 | | | — | | | 302 987 | |
Treasury notes | | 23 389 | | (776 | ) | | — | | | 22 613 | |
Bonds | | 795 738 | | (398 254 | ) | | 7 012 | | | 404 496 | |
Credit foncier loans | | 350 | | (226 | ) | | — | | | 124 | |
Interest rate swaps | | 9 044 | | 101 526 | | | — | | | 110 570 | |
Forward rate agreements | | — | | 369 | | | (409 | ) | | (40 | ) |
Futures | | — | | 4 440 | | | 15 283 | | | 19 723 | |
| | | | |
OVERSEAS | | | | | | | | | | | |
Commercial paper | | 5 493 | | 4 663 | | | — | | | 10 156 | |
Bonds | | 582 494 | | (3 20 590 | ) | | 3 031 | | | 264 935 | |
Medium-term notes | | 26 559 | | (1 115 | ) | | (918 | ) | | 24 526 | |
Cross currency swaps | | 453 | | (558 | ) | | — | | | (105 | ) |
Forward exchange contracts | | 11 | | 3 254 | | | (6 320 | ) | | (3 055 | ) |
| | | | |
OTHER | | | | | | | | | | | |
Registration and issue costs | | 1 993 | | — | | | — | | | 1 993 | |
Commissions on futures | | 1 345 | | — | | | — | | | 1 345 | |
| | | | | | | | | | | |
| | 1 749 839 | | (607 250 | ) | | 17 679 | | | 1 160 268 | |
| | | | | | | | | | | |
| * | The majority of onlendings are provided to customers on a pooled fund basis. Interest costs are allocated to customers based on the daily movement in the market value of the pooled fund. Except for fixed rate loans, the interest from onlendings figure includes unrealised gains and losses which reflects the amount charged to customers. |
48 QUEENSLAND TREASURY CORPORATION
4. Management Fees
Management fees represent income earned from the management of QTC’s onlendings and deposits. A further amount of $8.060 million (2006 $7.778 million), derived from interest rate margins on certain managed funds and pools, has been included under interest income.
5. Administration Expenses
| | | | |
| | | 30 JUNE 2007
$000 | | 30 JUNE 2006
$000 |
Salaries and related costs | | 14 567 | | 12 914 |
Superannuation contributions | | 1 711 | | 1 268 |
Consultants’fees (i) | | 3 423 | | 2 643 |
Outsourced fees (ii) | | 1 135 | | 1 016 |
Depreciation on property, plant and equipment | | 6 156 | | 7 056 |
Amortisation on intangibles | | 211 | | 152 |
Computer and maintenance charges | | 1 345 | | 1 257 |
Property charges including rental | | 1 321 | | 1 274 |
External audit fees (iii) | | 295 | | 297 |
Internal audit fees | | 366 | | 300 |
Staff training and development | | 261 | | 205 |
Investor and market relations program | | 439 | | 375 |
Other administration expenses | | 1 728 | | 1 492 |
| | | | |
| | 32 958 | | 30 249 |
| | | | |
(i) CONSULTANTS’ FEES | | | | |
Legal costs professional/technical | | 1 073 | | 934 |
Information technology | | 93 | | 306 |
Contractors/secondments | | 1 459 | | 767 |
Finance/accounting | | 473 | | 229 |
Human resource management | | 61 | | 100 |
Management | | — | | 103 |
Communications | | 108 | | 104 |
Other | | 156 | | 100 |
| | | | |
| | 3 423 | | 2 643 |
| | | | |
(ii) OUTSOURCED SERVICES | | | | |
Information services | | 533 | | 585 |
Registry charges | | 123 | | 68 |
Economic services | | 126 | | 93 |
Domestic and international clearing charges | | 219 | | 173 |
Bank charges | | 84 | | 44 |
Other | | 50 | | 53 |
| | | | |
| | 1 135 | | 1 016 |
| | | | |
(iii) EXTERNAL AUDIT FEES | | | | |
The external auditors (Queensland Audit Office) do not provide any consulting services to QTC. | | | | |
2006-2007 ANNUAL REPORT 49
Notes to and Forming Part of the Financial Statements
for the year ended 30 June 2007 (continued)
6. Payment in Lieu of Income Tax
| | | | | | |
| | | 30 JUNE 2007
$000 | | | 30 JUNE 2006
$000 | |
INCOME TAX EXPENSE | | | | | | |
Current tax | | 13 485 | | | 13 162 | |
Deferred tax | | 255 | | | (421 | ) |
| | | | | | |
| | 13 740 | | | 12 741 | |
| | | | | | |
Deferred income tax expense/(revenue) included in income tax expense comprises: | | | | | | |
Decrease/(increase) in deferred tax assets | | 602 | | | (448 | ) |
(Decrease)/ increase in deferred tax liabilities | | (347 | ) | | 27 | |
| | | | | | |
| | 255 | | | (421 | ) |
| | | | | | |
NUMERICAL RECONCILIATION OF INCOME TAX EXPENSE TO PRIMA FACIE TAX PAYABLE | | | | | | |
Operating surplus from continuing operations before income tax expense | | 59 589 | | | 62 310 | |
| | | | | | |
Tax at the Australian tax rate of 30% | | 17 877 | | | 18 693 | |
Tax effect of amounts which are not deductible /(taxable) in calculating taxable income: | | | | | | |
Non-taxable pools | | (4 150 | ) | | (5 966 | ) |
Share of net profit of jointly controlled entities | | 2 | | | (26 | ) |
Other | | 11 | | | 40 | |
| | | | | | |
INCOME TAX EXPENSE | | 13 740 | | | 12 741 | |
| | | | | | |
Deferred income tax at 30 June relates to the following: | | | | | | |
| | |
DEFERRED TAX LIABILITIES | | | | | | |
Prepayments | | — | | | 347 | |
| | | | | | |
DEFERRED TAX ASSETS | | | | | | |
Accelerated depreciation for accounting purposes | | — | | | 23 | |
Accruals | | 48 | | | 750 | |
Employee benefits | | 1 036 | | | 913 | |
| | | | | | |
TAX ASSETS | | 1 084 | | | 1 686 | |
| | | | | | |
Current tax liability | | 13 485 | | | 13 162 | |
Deferred tax liability | | — | | | 347 | |
| | | | | | |
TAX LIABILITIES | | 13 485 | | | 13 509 | |
| | | | | | |
7. Receivables | | | | | | |
Operating leases | | 1 216 | | | 1 410 | |
Sundry debtors | | 1 277 | | | 820 | |
GST receivable | | — | | | 48 | |
| | | | | | |
| | 2 493 | | | 2 278 | |
| | | | | | |
50 QUEENSLAND TREASURY CORPORATION
8. Financial Assets at Fair Value through Profit or Loss
| | | | |
| | | 30 JUNE 2007
$000 | | 30 JUNE 2006
$000 |
AUSTRALIA | | | | |
Money market deposits | | 749 202 | | 1 543 324 |
Discount securities | | 9 136 761 | | 5 661 421 |
Commonwealth and semi-government securities* | | 2 429 777 | | 2 491 860 |
Floating rate notes | | 2 980 401 | | 2 775 491 |
Other investments | | 904 264 | | 1 085 628 |
| | | | |
| | 16 200 405 | | 13 557 724 |
| | | | |
The total includes investments made to manage:
| • | | deposits of $7 352.204 million (2006 $5 329.329 million) |
| • | | surpluses and reserves of $373.349 million (2006 $327.500 million) |
| • | | cross border lease deferred income of $126.925 million (2006 $136.007 million) |
The remaining investments are used to facilitate management of interest rate risk or result from QTC borrowing in advance of requirements.
| * | QTC maintains holdings of its own stocks. These holdings have been excluded from Financial Assets and Financial Liabilities at Fair Value through Profit or Loss (refer note 16). |
9. Derivative Financial Assets
| | | | |
AUSTRALIA | | | | |
Interest rate swaps | | 82 697 | | 63 915 |
Forward rate agreements | | 28 200 | | 2 126 |
| | |
OVERSEAS | | | | |
Forward exchange contracts | | 1 088 | | 116 |
Credit derivatives | | 866 | | 590 |
| | | | |
| | 112 851 | | 66 747 |
| | | | |
10. Onlendings
| | | | | | |
Government departments and agencies | | 2 994 540 | | | 1 923 668 | |
Government owned corporations | | 15 143 495 | | | 12 903 933 | |
Local government | | 2 932 106 | | | 2 719 311 | |
QTC related entities (1) | | 333 012 | | | 372 896 | |
Queensland water entities | | 770 117 | | | 198 361 | |
Statutory bodies | | 828 340 | | | 758 318 | |
Tollway companies | | 1 249 534 | | | 932 371 | |
Other bodies | | 12 914 | | | 14 379 | |
Co-operative housing society loans | | 4 951 | | | 8 475 | |
Provisions for impaired loans (note 11) | | (155 | ) | | (130 | ) |
| | | | | | |
| | 24 268 854 | | | 19 831 582 | |
| | | | | | |
| (1) | Included in the above figure is an onlending to DBCT Holdings Pty Ltd to fund the purchase and lease of operating rights to the Dalrymple Bay Coal Terminal (refer note 16 and note 29). The onlending is offset by a deposit of $333 million (2006 $373 million) held by QTC on behalf of the lessee of the terminal (refer note 16). |
2006-2007 ANNUAL REPORT 51
Notes to and Forming Part of the Financial Statements
for the year ended 30 June 2007 (continued)
11. Impairment of Co-operative Housing Society Loans
| | | | | |
| | | 30 JUNE 2007 $000 | | 30 JUNE 2006 $000 | |
MOVEMENT IN PROVISIONS | | | | | |
Balance at 1 July | | 130 | | 136 | |
Charge against profit | | 25 | | (6 | ) |
| | | | | |
BALANCE AT 30 JUNE | | 155 | | 130 | |
| | | | | |
Impaired assets consist of non-accrual loans and restructured loans in respect of co-operative housing societies.
Non-accrual loans are loans for which there is reasonable doubt about the recovery of principal and interest and therefore provisions for impairment are recognised. Restructured loans consist of loans where the original contractual terms have been modified as a concession to the borrowers and revised terms are not comparable with those for new loans of similar risk. There were no restructured loans at 30 June 2007.
Past due loans are loans where principal and or interest are at least 90 days in arrears but full recovery of principal and interest is expected.
The following table provides an analysis of QTC’s impaired assets.
| | | | |
NON-ACCRUAL LOANS | | | | |
With specific provisions | | 520 | | 579 |
Less specific provisions for impaired loans | | 155 | | 130 |
| | | | |
NET NON-ACCRUAL LOANS | | 365 | | 449 |
| | | | |
PAST DUE LOANS | | 653 | | 884 |
| | | | |
12. Property, Plant and Equipment
| | | | |
GROSS PROPERTY, PLANT AND EQUIPMENT | | 46 482 | | 49 660 |
Less accumulated depreciation | | 20 997 | | 18 401 |
| | | | |
NET PROPERTY, PLANT AND EQUIPMENT | | 25 485 | | 31 259 |
| | | | |
REPRESENTED BY: Information technology equipment | | 3 559 | | 6 134 |
Less accumulated depreciation | | 2 800 | | 4 445 |
| | | | |
| | 759 | | 1 689 |
| | | | |
Furniture, fittings and office equipment | | 27 705 | | 29 057 |
Less accumulated depreciation | | 13 970 | | 11 047 |
| | | | |
| | 13 735 | | 18 010 |
| | | | |
Plant and machinery | | 15 218 | | 14 469 |
Less accumulated depreciation | | 4 227 | | 2 909 |
| | | | |
| | 10 991 | | 11 560 |
| | | | |
| | 25 485 | | 31 259 |
| | | | |
52 QUEENSLAND TREASURY CORPORATION
12. Property, Plant and Equipment (continued)
Reconciliations of the carrying amounts for each class of property, plant and equipment are set out below:
| | | | | | | | | | | | |
DESCRIPTION | | INFORMATION
TECHNOLOGY
EQUIPMENT | | | FURNITURE,
FITTINGS
AND OFFICE
EQUIPMENT | | | PLANT AND
MACHINERY | | | TOTAL | |
| | | $000 | | | $000 | | | $000 | | | $000 | |
Carrying amount at 1 July 2005 | | 4 353 | | | 22 563 | | | 12 239 | | | 39 155 | |
Acquisitions | | 115 | | | 131 | | | 612 | | | 858 | |
Disposals | | (1 119 | ) | | (579 | ) | | — | | | (1 698 | ) |
Depreciation | | (1 660 | ) | | (4 105 | ) | | (1 291 | ) | | (7 056 | ) |
| | | | | | | | | | | | |
CARRYING AMOUNT AT 30 JUNE 2006 | | 1 689 | | | 18 010 | | | 11 560 | | | 31 259 | |
| | | | | | | | | | | | |
Carrying amount at 1 July 2006 | | 1 689 | | | 18 010 | | | 11 560 | | | 31 259 | |
Acquisitions | | 180 | | | 120 | | | 749 | | | 1 049 | |
Disposals | | (372 | ) | | (295 | ) | | — | | | (667 | ) |
Depreciation | | (738 | ) | | (4 100 | ) | | (1 318 | ) | | (6 156 | ) |
| | | | | | | | | | | | |
CARRYING AMOUNT AT 30 JUNE 2007 | | 759 | | | 13 735 | | | 10 991 | | | 25 485 | |
| | | | | | | | | | | | |
13. Intangible Assets
| | | | | | |
| | | 30 JUNE 2007
$000 | | | 30 JUNE 2006
$000 | |
SOFTWARE, AT COST | | 2 683 | | | 2 292 | |
Less accumulated amortisation | | 2 192 | | | 1 982 | |
| | | | | | |
NET INTANGIBLE ASSETS | | 491 | | | 310 | |
| | | | | | |
CARRYING AMOUNT AT 1 JULY | | 310 | | | 111 | |
Acquisitions | | 392 | | | 351 | |
Amortisation | | (211 | ) | | (152 | ) |
| | | | | | |
CARRYING AMOUNT AT 30 JUNE | | 491 | | | 310 | |
| | | | | | |
14. Payables
| | | | |
Cross border lease deferred income | | 126 925 | | 136 007 |
Whole of Government Debt Pool net position | | 41 703 | | 55 786 |
Administration expenses | | 5 401 | | 2 501 |
Employee benefits | | 3 455 | | 3 045 |
Unearned revenue | | 711 | | 492 |
Other creditors | | 269 | | 274 |
GST payable | | 2 114 | | — |
| | | | |
| | 180 578 | | 198 105 |
| | | | |
2006-2007 ANNUAL REPORT 53
Notes to and Forming Part of the Financial Statements
for the year ended 30 June 2007 (continued)
15. Derivative Financial Liabilities
| | | | |
| | | 30 JUNE 2007
$000 | | 30 JUNE 2006
$000 |
AUSTRALIA | | | | |
Interest rate swaps | | 154 861 | | 84 606 |
Forward rate agreements | | 105 699 | | 16 809 |
| | |
OVERSEAS | | | | |
Foreign exchange swaps | | 10 895 | | 2 716 |
Credit derivatives | | 499 | | 27 |
| | | | |
| | 271 954 | | 104 158 |
| | | | |
| | |
| 16. Financial Liabilities at Fair Value through Profit or Loss | | | | |
| | |
| DEPOSITS | | | | |
Government departments and agencies | | 81 590 | | 1 107 209 |
Government owned corporations | | 3 890 866 | | 1 011 146 |
Local governments | | 1 476 119 | | 1 320 131 |
Tollway companies | | 31 511 | | 14 719 |
Statutory bodies | | 761 897 | | 561 331 |
QTC related entities | | 53 152 | | 48 158 |
Other depositors(1) | | 524 596 | | 536 903 |
| | | | |
| | 6 819 731 | | 4 599 597 |
| | | | |
Stock lending | | 279 241 | | 358 459 |
Repurchase agreements | | 253 232 | | 371 273 |
| | | | |
| | 7 352 204 | | 5 329 329 |
| | | | |
(1) Includes a security deposit of $333 million (30 June 2006 $373 million) held on behalf of the lessee of the Dalrymple Bay Coal Terminal. |
| | |
| INTEREST-BEARING LIABILITIES | | | | |
| | |
| AUSTRALIA | | | | |
Treasury notes | | 374 782 | | — |
Bonds | | 20 123 591 | | 15 784 949 |
Credit foncier loans | | 1 908 | | 4 660 |
| | | | |
| | 20 500 281 | | 15 789 609 |
| | | | |
OVERSEAS | | | | |
Commercial paper(a) | | 219 400 | | 108 322 |
Bonds(b) | | 11 533 429 | | 11 150 801 |
Medium-term notes(c) | | 167 638 | | 470 845 |
| | | | |
| | 11 920 467 | | 11 729 968 |
| | | | |
| | 32 420 748 | | 27 519 577 |
| | | | |
TOTAL | | 39 772 952 | | 32 848 906 |
| | | | |
| (a) | Includes $7.665 million (2006 $ nil) of commercial paper borrowed in the Euro Australian dollar commercial paper markets. |
| (b) | Consists of global bonds which are borrowed in the United States’domestic and Euro bond markets in Australian dollars. |
| (c) | Consists of borrowings in the Euro medium-term note markets in Australian dollars. |
Derivatives used to hedge offshore borrowings results in no net exposure to any foreign currency. Details of QTC’s exposure to foreign currencies and the derivatives used to hedge this exposure are disclosed in note 19 (A)(i).
QTC borrowings are guaranteed by the Queensland Government under the Queensland Treasury Corporation Act 1988. Other debt for which QTC has assumed debt service responsibility has been guaranteed under the appropriate Act which covered each borrowing at the time the loan was raised.
54 QUEENSLAND TREASURY CORPORATION
16. Financial Liabilities at Fair Value through Profit or Loss (continued)
The difference between the carrying amount of financial liabilities and the amount contractually required to be paid at maturity to the holder of the obligation is set out in the following table.
| | | | | | | |
| | | 30 JUNE 2007 | |
| | | FAIR
VALUE
$000 | | REPAYMENT
AT MATURITY
$000 | | DIFFERENCE
$000 | |
INTEREST-BEARING LIABILITIES | | | | | | | |
AUSTRALIA | | | | | | | |
Commercial paper | | 374 782 | | 380 000 | | (5 218 | ) |
Bonds | | 20 123 591 | | 20 419 500 | | (295 909 | ) |
Credit foncier loans | | 1 908 | | 1 738 | | 170 | |
| | | | | | | |
| | 20 500 281 | | 20 801 238 | | (300 957 | ) |
| | | | | | | |
OVERSEAS | | | | | | | |
Commercial paper | | 219 400 | | 222 267 | | (2 867 | ) |
Bonds | | 11 533 429 | | 11 659 063 | | (125 634 | ) |
Medium-term notes | | 167 638 | | 158 900 | | 8 738 | |
| | | | | | | |
| | 11 920 467 | | 12 040 230 | | (119 763 | ) |
| | | | | | | |
| | 32 420 748 | | 32 841 468 | | (420 720 | ) |
| | | | | | | |
| |
| | | 30 JUNE 2006 | |
| | | FAIR
VALUE
$000 | | REPAYMENT
AT MATURITY
$000 | | DIFFERENCE
$000 | |
INTEREST-BEARING LIABILITIES | | | | | | | |
AUSTRALIA | | | | | | | |
Bonds | | 15 784 949 | | 15 618 983 | | 165 966 | |
Credit foncier loans | | 4 660 | | 3 815 | | 845 | |
| | | | | | | |
| | 15 789609 | | 15 622 798 | | 166 811 | |
| | | | | | | |
OVERSEAS | | | | | | | |
Commercial paper | | 108 322 | | 108 785 | | (463 | ) |
Bonds | | 11 150 801 | | 10 954 996 | | 195 805 | |
Medium-term notes | | 470 845 | | 458 859 | | 11 986 | |
| | | | | | | |
| | 11 729 968 | | 11 522 640 | | 207 328 | |
| | | | | | | |
| | 27 519 577 | | 27 145 438 | | 374 139 | |
| | | | | | | |
2006-2007 ANNUAL REPORT 55
Notes to and Forming Part of the Financial Statements
for the year ended 30 June 2007 (continued)
17. Reserves
| | | | |
| | | 30 JUNE 2007
$000 | | 30 JUNE 2006
$000 |
GENERAL RESERVE | | | | |
Balance at 1 July | | 39 082 | | 39 082 |
| | | | |
BALANCE AT 30 JUNE | | 39 082 | | 39 082 |
| | | | |
CREDIT RISK RESERVE(1) | | | | |
BALANCE AT 1 JULY | | 21 321 | | 16 824 |
Transfer from retained surplus | | 6 808 | | 4 497 |
| | | | |
BALANCE AT 30 JUNE | | 28 129 | | 21 321 |
| | | | |
BASIS RISK RESERVE(2) | | | | |
Balance at 1 july | | 14 000 | | 13 000 |
Transfer from retained surplus | | 2 500 | | 1 000 |
| | | | |
BALANCE AT 30 JUNE | | 16 500 | | 14 000 |
| | | | |
TOTAL | | 83 711 | | 74 403 |
| | | | |
| (1) | QTC’s Cash Fund is capital guaranteed .To reduce the impact of a credit failure on its retained earnings, QTC sets aside a certain portion of its fees earned from the Cash Fund to the Credit Risk Reserve together with interest accumulated on the reserves. The Reserve will be utilised if a credit event results in there being a shortfall between the guaranteed capital and the investments of the fund. |
| (2) | The Basis Risk Reserve has been created to provide for losses that may occur as a result of basis risk where QTC has borrowed in excess of its loans to customers. The excess borrowings are needed to enable QTC to manage its customer debt portfolios and liquidity, and are hedged through the purchase of highly liquid assets. Gains/losses may occur due to interest yields on the asset hedges not moving in exactly the same manner as the interest yields on borrowings. Basis risk has been measured using the value at risk methodology. QTC is confident at the 99% level, that the accumulated losses as a result of basis risk on surplus fixed rate funding over a 10 business day period, will be no greater than the value of the reserve for surplus fixed rate funding. Further at 99% confidence, the accumulated loss as a result of basis risk on surplus floating rate funding over a 20 business day period, will be no greater than the value of the reserve for surplus floating rate funding. |
The remaining reserves are maintained for general purposes.
56 QUEENSLAND TREASURY CORPORATION
18. Notes to the Cash Flow Statement
| | | | | | |
| | | 30 JUNE 2007
$000 | | | 30 JUNE 2006
$000 | |
(A) RECONCILIATION OF OPERATING SURPLUS AFTER PAYMENT IN LIEU OF INCOME TAX TO NET CASH OUTFLOW FROM OPERATING ACTIVITIES | | | | | | |
OPERATING SURPLUS AFTER PAYMENT IN LIEU OF INCOME TAX | | 45 849 | | | 49 569 | |
| | |
NON-CASH FLOWS IN OPERATING SURPLUS | | | | | | |
interest-bearing liabilities - net unrealised gain | | (417 535 | ) | | (611 703 | ) |
Interest-bearing liabilities - net unrealised exchange loss/(gain) | | 36 951 | | | (4 302 | ) |
Onlendings net unrealised loss | | 53 381 | | | 128 487 | |
Financial assets at fair value through profit or loss - net unrealised loss | | 85 296 | | | 84 586 | |
Financial assets at fair value through profit or loss - net unrealised exchange gain | | (49 | ) | | (13 | ) |
Deposits-net unrealised gain | | (286 | ) | | (23 | ) |
Depreciation of property, plant and equipment | | 6 155 | | | 7 056 | |
Net (gain) / loss on sale of property, plant and equipment | | (14 | ) | | 58 | |
Amortisation of intangibles | | 211 | | | 152 | |
Doubtful debts expense co-operative housing societies | | 25 | | | (6 | ) |
Share of loss/ (profit) of investments accounted for using the equity method | | 5 | | | (85 | ) |
| | |
CHANGES IN ASSETS AND LIABILITIES | | | | | | |
Decrease/ (increase) in financial assets at fair value through profit or loss - net accrued interest | | 47 744 | | | (55 474 | ) |
Decrease in financial assets at fair value through profit or loss - net discount/ premium | | 51 741 | | | 20 031 | |
Decrease/(increase) in deferred tax asset | | 602 | | | (448 | ) |
(Increase)/decrease in onlendings-net accrued interest | | (205 | ) | | 1 980 | |
(Increase) in receivables | | (215 | ) | | (65 | ) |
(Increase) in prepayments | | (93 | ) | | (12 | ) |
Increase in interest-bearing liabilities - net accrued interest | | 54 230 | | | 61 477 | |
(Decrease) in interest-bearing liabilities-net discount/premium | | (410 466 | ) | | (85 415 | ) |
(Decrease) / increase in deposits net accrued interest | | (4 | ) | | 1 222 | |
(Decrease)/increase in payables | | (17 527 | ) | | 5 702 | |
(Decrease)/ increase in deferred tax liability | | (347 | ) | | 27 | |
Increase in income tax equivalent payable | | 323 | | | 1 585 | |
| | | | | | |
NET CASH (OUTFLOW)/ INFLOW FROM OPERATING ACTIVITIES | | (464 228 | ) | | (395 614 | ) |
| | | | | | |
(B) CASH FLOWS PRESENTED ON A NET BASIS
Cash flows arising from the following activities are presented on a net basis in the Cash Flow Statement:
| • | | loan advances to and redemptions from customers |
| • | | receipt and withdrawal of customer deposits, |
| • | | money market and other deposits. |
2006-2007 ANNUAL REPORT 57
Notes to and Forming Part of the Financial Statements
for the year ended 30 June 2007 (continued)
19. Financial Risk Management
QTC’s activities expose it to a variety of financial risks; market risk (including currency risk, interest rate risk and price risk), credit risk and liquidity risk. QTC’s overall financial risk management program focuses on managing the volatility of financial markets and seeks to minimise potential adverse effects on the financial performance of QTC and its customers. QTC uses derivative financial instruments such as foreign exchange contracts, interest rate swaps and futures contracts to manage certain risk exposures.
All portfolio management activities are conducted within Board approved policy. The Board approves written policies for overall risk management, as well as specific areas such as mitigating foreign exchange, interest rate and credit risks, the use of derivative financial instruments and investing excess liquidity.
Robust systems are in place for managing risk, and compliance with risk policies is monitored closely. The financial risk management process, including daily measuring and monitoring of market risk exposure as well as credit reviews of counterparties and total credit exposure, is performed by teams separate from the teams transacting and is subject to review by the Risk Management Team (comprising management representatives) and the Risk Management Committee. The Risk Management Committee was established during 2002 and comprises the entire QTC Board. Members of QTC’s Risk Management Team are invited to attend Risk Management Committee meetings as required.
(A) MARKET RISK
QTC uses a Board approved value-at-risk (VaR) framework to manage the market risk incurred by QTC as part of its funding activities. The historical simulation approach is used to calculate VaR, at a 99% confidence level, using 18 months of market data. QTC is currently investigating supplementary risk measures such as scenario analysis and sensitivity limits.
(i) FOREIGN EXCHANGE RISK
QTC has facilities that allow for borrowing in foreign currencies. All foreign currency borrowings are either hedged to Australian dollars to ensure no currency risk or utilised to invest in a foreign currency financial asset, effectively eliminating any foreign currency exposure.
QTC enters into both forward exchange contracts and cross currency swaps to manage the exposure of foreign currency borrowings and offshore investments to fluctuations in exchange rates.
The following table summarises the hedging effect that cross currency swaps and forward exchange contracts have had on face value offshore borrowings and investments stated in Australian dollars.
| | | | | | | | | | | | | | | | | | | |
| | | BORROWINGS | | | OFFSHORE
INVESTMENTS | | FORWARD EXCHANGE
CONTRACTS | | NET EXPOSURE |
| | | 2007 $000 | | | 2006 $000 | | | 2007 $000 | | 2006 $000 | | 2007 $000 | | | 2006 $000 | | 2007 $000 | | 2006 $000 |
USD | | (140 033 | ) | | (108 785 | ) | | 2 643 | | 2 411 | | 137 390 | | | 106 374 | | — | | — |
HKD | | (32 369 | ) | | — | | | — | | — | | 32 369 | | | — | | — | | — |
SGD | | (19 962 | ) | | — | | | — | | — | | 19 962 | | | — | | — | | — |
EUR | | (22 152 | ) | | — | | | — | | — | | 22 152 | | | — | | — | | — |
AUD | | (11 810 213 | ) | | (11 553 855 | ) | | — | | — | | (180 872 | ) | | 114 075 | | 11 991 085 | | 11 439 780 |
58 QUEENSLAND TREASURY CORPORATION
| 19. | Financial Risk Management (continued) |
(A) MARKET RISK (CONTINUED)
(ii) INTEREST RATE RISK
As the State’s corporate treasury, QTC undertakes portfolio management activities on behalf of customers and raises funding in advance of requirements. QTC borrows in advance of requirements to ensure Queensland public sector entities have ready access to funding when required and also to reduce the risk associated with refinancing maturing loans. These activities expose QTC to interest rate risk which is managed within the value-at-risk framework.
QTC’s customer portfolios are managed based on a duration benchmark. Duration is a direct measure of the interest rate sensitivity of a financial instrument and quantifies the change in value of a financial instrument due to interest rate movements. To manage the risk of non-parallel yield curve movements, QTC allocates portfolio cash flows to a series of time periods and calculates the duration for each of these time periods against the benchmark duration for each of these periods.
QTC enters into interest rate swaps, forward rate agreements and futures contracts to assist in the management of interest rate risk.
In most instances, interest rate swaps are utilised to change the interest rate profiles of medium to long term fixed rate borrowings to floating rate borrowings at rates that are lower than those available to QTC if short term borrowings were utilised. This also results in a source of medium to long term floating rate funding. At times, floating to fixed swaps are undertaken to generate a fixed rate term funding profile. Under interest rate swaps, QTC agrees with other parties to exchange at specified intervals the difference between fixed rate and floating rate interest amounts calculated by reference to an agreed notional principal amount.
Forward rate agreements are used by QTC to lock-in a guaranteed return on known cash flows as and when they fall due or to manage the duration of a particular pool or fund.
Futures contracts are used primarily for the same purpose as forward rate agreements. These contracts have limited credit risk as organised exchanges are the counterparties.
At 30 June 2007, if interest rates had changed by -/+1 % from the year end rates applicable to QTC’s financial assets and financial liabilities with all other variables held constant, post tax profit and equity for the year would have been $3.747 million higher/lower (2006: $1.936 million higher/lower). In general, the risk characteristics of funds borrowed together with the financial derivatives used to manage interest rate and foreign currency risks closely match those of funds onlent so that the change in profit/equity is mainly as a result of an increase/decrease in the fair value of QTC’s capital.
2006-2007 ANNUAL REPORT 59
Notes to and Forming Part of the Financial Statements
for the year ended 30 June 2007 (continued)
19. Financial Risk Management (continued)
(A) MARKET RISK (CONTINUED)
(iii) SUMMARISED SENSITIVITY ANALYSIS
The table below summarises the sensitivity of QTC’s financial assets and liabilities to interest rate and foreign exchange risk.
| | | | | | | | | | | | | | | | | | | | | | | | | | |
| | | CARRYING AMOUNT | | INTEREST RATE RISK | | | FOREIGN EXCHANGE RISK | |
30 JUNE 2007 | | $000 | | -1% PROFIT $000 | | | -1% EQUITY $000 | | | +1% PROFIT $000 | | | +1%
EQUITY
$000 | | | -10%
PROFIT
$000 | | | -10%
EQUITY
$000 | | | +10%
PROFIT
$000 | | | +10%
EQUITY
$000 | |
FINANCIAL ASSETS | | | | | | | | | | | | | | | | | | | | | | | | | | |
Money Market Deposits | | 749 202 | | 20 | | | 20 | | | (20 | ) | | (20 | ) | | — | | | — | | | — | | | — | |
Discount securities | | 9 136 761 | | 10 787 | | | 10 787 | | | (10 787 | ) | | (10 787 | ) | | — | | | — | | | — | | | — | |
Commonwealth and State securities | | 2 429 777 | | 89 549 | | | 89 549 | | | (89 549 | ) | | (89 549 | ) | | — | | | — | | | — | | | — | |
Onlendings | | 24 269 009 | | 787 637 | | | 787 637 | | | (787 637 | ) | | (787 637 | ) | | — | | | — | | | — | | | — | |
Floating rate notes | | 2 980 401 | | 3 310 | | | 3 310 | | | (3 310 | ) | | (3 310 | ) | | — | | | — | | | — | | | — | |
Other investments | | 904 264 | | 12 675 | | | 12 675 | | | (12 675 | ) | | (12 675 | ) | | 1 380 | | | 1 380 | | | (1 380 | ) | | (1 380 | ) |
Derivatives | | 112 851 | | 12 968 | | | 12 968 | | | (12 968 | ) | | (12 968 | ) | | (4 110 | ) | | (4 110 | ) | | 4 110 | | | 4 110 | |
| | | | | | | | | | | | | | | | | | | | | | | | | | |
| | 40 582 265 | | 916 946 | | | 916 946 | | | (916 946 | ) | | (916 946 | ) | | (2 730 | ) | | (2 730 | ) | | 2 730 | | | 2 730 | |
| | | | | | | | | | | | | | | | | | | | | | | | | | |
FINANCIAL LIABILITIES | | | | | | | | | | | | | | | | | | | | | | | | | | |
Deposits | | 7 352 204 | | (10 479 | ) | | (10 479 | ) | | 10 479 | | | 10 479 | | | (1 380 | ) | | (1 380 | ) | | 1 380 | | | 1 380 | |
Interest-bearing liabilities | | 32 420 748 | | (1 213 511 | ) | | (1 213 511 | ) | | 1 213 511 | | | 1 213 511 | | | (15 072 | ) | | (15 072 | ) | | 15 072 | | | 15 072 | |
Derivatives | | 271 954 | | 310 791 | | | 310 791 | | | (310 791 | ) | | (310 791 | ) | | 19 182 | | | 19 182 | | | (19 182 | ) | | (19 182 | ) |
| | | | | | | | | | | | | | | | | | | | | | | | | | |
| | 40 044 906 | | (913 199 | ) | | (913 199 | ) | | 913 199 | | | 913 199 | | | 2 730 | | | 2 730 | | | (2 730 | ) | | (2 730 | ) |
| | | | | | | | | | | | | | | | | | | | | | | | | | |
INCREASE/(DECREASE) | | | | 3 747 | | | 3 747 | | | (3 747 | ) | | (3 747 | ) | | — | | | — | | | — | | | — | |
| | | | | | | | | | | | | | | | | | | | | | | | | | |
| | | |
| | | CARRYING AMOUNT | | INTEREST RATE RISK | | | FOREIGN EXCHANGE RISK | |
30 JUNE 2006 | | $000 | | -1%
PROFIT
$000 | | | -1%
EQUITY
$000 | | | +1%
PROFIT
$000 | | | +1%
EQUITY
$000 | | | -10%
PROFIT
$000 | | | -10%
EQUITY
$000 | | | +10%
PROFIT
$000 | | | +10%
EQUITY
$000 | |
FINANCIAL ASSETS | | | | | | | | | | | | | | | | | | | | | | | | | | |
Money Market Deposits | | 1 543 324 | | 84 | | | 84 | | | (84 | ) | | (84 | ) | | — | | | — | | | — | | | — | |
Discount securities | | 5 661421 | | 5 327 | | | 5 327 | | | (5 327 | ) | | (5 327 | ) | | | | | | | | | | | | |
Commonwealth and State securities | | 2 491860 | | 125 993 | | | 125 993 | | | (125 993 | ) | | (125 993 | ) | | — | | | — | | | — | | | — | |
Onlendings | | 19 831 582 | | 698 593 | | | 698 593 | | | (698 593 | ) | | (698 593 | ) | | | | | | | | | | | | |
Floating rate notes | | 2 775 491 | | 2 863 | | | 2 863 | | | (2 863 | ) | | (2 863 | ) | | — | | | — | | | — | | | — | |
Other investments | | 1 085 628 | | 19 909 | | | 19 909 | | | (19 909 | ) | | (19 909 | ) | | 2 747 | | | 2 747 | | | (2 747 | ) | | (2 747 | ) |
Derivatives | | 66 747 | | 80 466 | | | 80 466 | | | (80 466 | ) | | (80 466 | ) | | | | | | | | | | | | |
| | | | | | | | | | | | | | | | | | | | | | | | | | |
| | 33 456 053 | | 933 235 | | | 933 235 | | | (933 235 | ) | | (933 235 | ) | | 2 747 | | | 2 747 | | | (2 747 | ) | | (2 747 | ) |
| | | | | | | | | | | | | | | | | | | | | | | | | | |
FINANCIAL LIABILITIES | | | | | | | | | | | | | | | | | | | | | | | | | | |
Deposits | | 5 329 329 | | (5 644 | ) | | (5 644 | ) | | 5 644 | | | 5 644 | | | (2 747 | ) | | (2 747 | ) | | 2 747 | | | 2 747 | |
Interest-bearing liabilities | | 27 519 577 | | (1 093
617 |
) | | (1 093
617 |
) | | 1 093 617 | | | 1 093 617 | | | (9 847 | ) | | (9 847 | ) | | 9 847 | | | 9 847 | |
Derivatives | | 104 158 | | 167 962 | | | 167 962 | | | (167 962 | ) | | (167 962 | ) | | 9 847 | | | 9 847 | | | (9 847 | ) | | (9 847 | ) |
| | | | | | | | | | | | | | | | | | | | | | | | | | |
| | 32 953 064 | | (931 299 | ) | | (931 299 | ) | | 931 299 | | | 931 299 | | | (2 747 | ) | | (2 747 | ) | | 2 747 | | | 2 747 | |
| | | | | | | | | | | | | | | | | | | | | | | | | | |
INCREASE/(DECREASE) | | | | 1 936 | | | 1 936 | | | (1 936 | ) | | (1 936 | ) | | — | | | — | | | — | | | — | |
| | | | | | | | | | | | | | | | | | | | | | | | | | |
60 QUEENSLAND TREASURY CORPORATION
19. Financial Risk Management (continued)
(B) LIQUIDITY RISK
QTC maintains its domestic and global benchmark bonds as its core medium and long-term funding facilities and its euro-commercial paper facility and domestic treasury note facility as its core short-term funding facilities. QTC’s short-term investment facilities are structured to ensure maximum flexibility, ease of use and liquidity. QTC has an extensive range of funding facilities in place to prevent the possibility of not being able to settle a transaction on the due date (refer note 26).
In addition, QTC borrows in advance of requirements:
| • | | to reduce the risk of refinancing maturing loans, and |
| • | | to ensure Queensland public sector entities have ready access to funding when required. |
QTC also maintains sufficient liquidity to manage the duration of its debt portfolios.
The following table sets out the liquidity risk of financial liabilities held by QTC. With the exception of deposits, the maturity analysis has been calculated based on cash flows relating to the repayment of the principal (face value) amount outstanding at balance date and contractual terms. Deposits on account of the Cash Fund and Working Capital Facility (11AM Fund) are repayable at call whilst deposits held as security for stock lending and repurchase agreements are repayable when the security is lodged with QTC.
| | | | | | | | | | | | |
| | | MATURITY PERIOD AT 30 JUNE 2007 |
| | | AT CALL | | 0 TO 3
MONTHS | | 3 TO 12
MONTHS | | 1 TO 5
YEARS | | OVER 5
YEARS | | TOTAL |
| | | $000 | | $000 | | $000 | �� | $000 | | $000 | | $000 |
LIABILITIES | | | | | | | | | | | | |
Deposits | | 7 098 784 | | 252 611 | | — | | — | | — | | 7 351 395 |
Interest-bearing liabilities | | — | | 3 378 158 | | 395 871 | | 16 203 079 | | 12 864 360 | | 32 841 468 |
| | | | | | | | | | | | |
TOTAL MONETARY LIABILITIES | | 7 098 784 | | 3 630 769 | | 395 871 | | 16 203 079 | | 12 864 360 | | 40 192 863 |
| | | | | | | | | | | | |
| |
| | | MATURITY PERIOD AT 30 JUNE 2006 |
| | | AT CALL | | 0 TO 3
MONTHS | | 3 TO 12
MONTHS | | 1 TO 5
YEARS | | OVER 5
YEARS | | TOTAL |
| | | $000 | | $000 | | $000 | | $000 | | $000 | | $000 |
LIABILITIES | | | | | | | | | | | | |
Deposits | | 4 969 782 | | 357 404 | | — | | — | | — | | 5 327 186 |
Interest-bearing liabilities | | — | | 192 710 | | 485 151 | | 17 905 604 | | 8 561 973 | | 27 145 438 |
| | | | | | | | | | | | |
TOTAL MONETARY LIABILITIES | | 4 969 782 | | 550 114 | | 485 151 | | 17 905 604 | | 8 561 973 | | 32 472 624 |
| | | | | | | | | | | | |
2006-2007 ANNUAL REPORT 61
Notes to and Forming Part of the Financial Statements
for the year ended 30 June 2007 (continued)
19. Financial Risk Management (continued)
(C) CREDIT RISK
QTC is exposed to credit risk. Credit risk is constantly assessed, measured and managed in strict accordance with QTC’s Credit risk policies. Exposure to credit risk is managed through regular analysis of the ability of borrowers, potential borrowers, and financial market counterparties with respect to derivative instruments to meet interest and capital repayment obligations and by changing lending limits where appropriate.
Whilst QTC’s capital is not subject to regulatory oversight, QTC utilises a capital adequacy approach based on Basel II: International Convergence of Capital Measurements and Capital Standards to calculate and advise the Board of the amount of capital required to cover its credit risk.
Credit exposure is QTC’s estimate of its potential loss at balance date in relation to investments and derivative contracts in the event of non-performance by all counterparties. The credit exposure is calculated utilising the value-at-risk methodology which takes into account the current market value, duration, term to maturity and interest rate and/or exchange rate volatility. The following table represents QTC’s exposure to credit risk at 30 June:
| | | | |
| | | CREDIT EXPOSURE |
| | | 30 JUNE 2007
$000 | | 30 JUNE 2006
$000 |
Financial assets at fair value through profit or loss | | 21 004 539 | | 17 524 948 |
| | |
DERIVATIVES | | | | |
| | |
Interest rate swaps | | 454 733 | | 393 598 |
Forward rate agreements | | — | | 2 337 |
Forward exchange contracts | | 15 052 | | 5 034 |
Credit derivatives | | 367 352 | | 269 860 |
QTC has a significant concentration of credit risk within the finance and investment industry. This is unavoidable given the size of QTC’s investment portfolio and the requirement to invest with counterparties rated A- or better and to invest in highly liquid securities.
Counterparties for onlendings with the exception of very small exposures to Suncorp-Metway Ltd, co-operative housing societies and primary producer co-operatives are principally Queensland Government sector entities and in some cases an explicit Government guarantee exists. There is a specific Queensland Government guarantee in place for the Suncorp-Metway Limited loans. As a consequence, these exposures are not included in QTC’s total credit exposure.
QTC adopts a conservative approach to the management of credit risk with a strong bias to high quality counterparties. QTC maintains a ratings based approach in determining maximum credit exposures to counterparties. The country of domicile, the size of the balance sheet of the counterparty and the size of its fund raising programs are also taken into account when determining limits.
Counterparty exposure by rating for all investments and derivative contracts is listed below.
| | | | |
| | | CREDIT EXPOSURE |
RATING | | 30 JUNE 2007
% | | 30 JUNE 2006
% |
AAA | | 39 | | 40 |
AA+ | | 8 | | 8 |
AA | | 34 | | 6 |
AA- | | 10 | | 36 |
A+ | | 6 | | 7 |
A | | 3 | | 3 |
A- | | 0 | | 0 |
20. Concentrations of Borrowings and Deposits
There are no material concentrations of borrowings as these funds are raised from diversified sources through various facilities disclosed under funding facilities in note 26. Managed fund depositors are principally Queensland Government sector entities. These deposits are invested in either QTC’s Cash Fund or Working Capital Facility (11AM Fund) which have a large core of liquid investments. Deposits for Stock Lending and Repurchase Agreements are invested in the Working Capital Facility (11AM Fund) which can be liquidated daily at no cost.
62 QUEENSLAND TREASURY CORPORATION
21. Contingent Liabilities
The following contingent liabilities existed at balance date:
| • | | A total of $1 186 million (2006 $666 million) of Queensland Treasury Corporation inscribed stock was lent to various financial institutions. QTC lends stock on the basis that there is a simultaneous commitment by the other party to return the stock on an agreed date. These loans are made to support the liquidity of QTC bonds in the financial markets and form part of QTC’s total exposure to these financial institutions. Historically, the likelihood of a loss being incurred through default by a counterparty has been remote (refer note 24). |
| • | | With regard to certain cross border lease transactions, QTC has assumed responsibility for a significant portion of the transaction risk. If certain events occur, QTC could be liable to make additional payments under the transactions. However external advice and history to date indicate the likelihood of these events occurring is remote. In addition, QTC has provided certain guarantees and indemnities to various participants in the cross border lease transactions. Expert external advisors consider, that unless exceptional and extreme circumstances arise, QTC will not be required to make a significant payment under these guarantees and indemnities. |
| • | | To facilitate the merger of the former State owned financial institutions, Suncorp and QIDC with Metway Bank Ltd, QTC provided guarantees relating to certain obligations of the Queensland Government and Suncorp General Insurance Ltd. These guarantees are supported by counter indemnities from the Treasurer on behalf of the State of Queensland. |
| • | | QTC has provided guarantees relating to the trading activities of Ergon Energy and CS Energy, Queensland Government owned corporations, or their subsidiaries, in the National Electricity Market to the value of $204.1 million (2006 $173.4 million) which are supported by counter indemnities from these Queensland Government owned corporations. |
| • | | QTC has provided guarantees to the value of $88 million (2006 $123.4million) to support the commercial activities of various Queensland public sector entities. In each case, a counter indemnity has been obtained by QTC from the appropriate public sector entity. |
| • | | To provide support in relation to the sale by Tarong Energy Corporation Ltd of a 50% share in the Tarong North Power Station, QTC provided a guarantee of certain payment obligations of Tarong Energy Corporation Ltd under the transaction together with providing an irrevocable put option for 50% of the power station exercisable by the option holder under certain circumstances. This guarantee and put option are supported by an indemnity from Tarong Energy Corporation Ltd and an indemnity from the Treasurer for and on behalf of the State of Queensland. |
2006-2007 ANNUAL REPORT 63
Notes to and Forming Part of the Financial Statements
for the year ended 30 June 2007 (continued)
22. Operating Leases
QTC AS LESSEE
QTC has entered into a commercial lease for the tenancy of 61 Mary Street, Brisbane for an initial term of ten years from 1 January 2003 to 31 December 2012, with an option to renew the lease after that date. Lease payments are increased to reflect market rentals.
QTC has entered into various motor vehicle lease agreements expiring within one to three years.
The future minimum rentals payable under non-cancellable operating leases are as follows:
| | | | |
| | | 30 JUNE 2007
$000 | | 30 JUNE 2006
$000 |
PAYABLE | | | | |
Not longer than 1 year | | 1 134 | | 1 060 |
Longer than 1 year but not longer than 5 years | | 4 135 | | 3 776 |
Longer than 5 years | | 507 | | 1 407 |
| | | | |
| | 5 776 | | 6 243 |
| | | | |
|
QTC AS LESSOR |
|
| QTC has entered into operating leases as lessor under a whole of government lease facility which include information technology equipment, yellow goods and furniture and fittings. |
|
These non-cancellable leases have remaining terms of between 1 and 12 years. |
|
Future minimum rentals receivable under non-cancellable operating leases as at 30 June are as follows: |
| | |
RECEIVABLE | | | | |
| | |
Not longer than 1 year | | 6 698 | | 7 303 |
Longer than 1 year but not longer than 5 years | | 13 177 | | 17 915 |
Longer than 5 years | | 307 | | 364 |
| | | | |
| | 20 182 | | 25 582 |
| | | | |
|
| 23. Forward Starting Fixed Rate Loan Commitments |
|
| QTC has entered into fixed rate loan agreements with certain customers to lock in interest rates on all or part of future borrowing requirements. QTC’s future borrowing commitments and the period in which funds are to be onlent are as follows. |
| | |
Not longer than 1 year | | 1 697 845 | | 891 798 |
Longer than 1 year but not longer than 5 years | | 1 902 527 | | 1 053 434 |
| | | | |
| | 3 600 372 | | 1 945 232 |
| | | | |
64 QUEENSLAND TREASURY CORPORATION
24. Stock Lending
In support of an active trading and pricing market for QTC stock, QTC lends stock to various financial institutions. QTC’s stock lending policy ensures that all such transactions are covered by appropriate credit arrangements, credit limits, cash securities or the lodgement of collateral securities.
Stock lent which forms part of QTC’s exposure to a financial institution is reported as a contingent liability (refer note 21). In situations where the financial institution does not have an approved exposure or the limit of the exposure has been reached, the financial institution must either pledge stock which has a market value 10% greater than QTC stock, or deposit cash equivalent to the market value of QTC stock lent.
At 30 June 2007, there was no stock lent (2006 nil) in return for pledged stock whilst $284 million (2006 $352 million) of QTC stock was lent with cash held as security. Cash held was $278.004 million (2006 $358.459 million).
25. Segment Information
QTC operates predominantly in the finance and investment industry through liability and fund management activities. Liability management activities relate to the borrowing of funds principally to finance the capital works programs of the State and the management of these borrowings so as to achieve the lowest cost to borrowers. The fund management activities of QTC relate to the investment of the short-term surpluses of these bodies in order to achieve the highest possible return for a given level of risk.
QTC operates in Queensland, Australia.
26. Funding Facilities
| | | | | | | | | |
FACILITY | | LIMIT | | FACEVALUE
ON ISSUE
2007 $M | | FACE VALUE
ON ISSUE
2006 $M |
Domestic Treasury Note | | | UNLIMITED | | A$ | 380 | | | — |
Domestic A$ Bond | | | UNLIMITED | | A$ | 20 468 | | A$ | 15 793 |
Global A$ Bond | | A$ | 15 000M | | A$ | 11 659 | | A$ | 11 095 |
Multicurrency US Commercial Paper | | US$ | 1 500M | | | — | | US$ | 70 |
Multicurrency Euro Commercial Paper | | US$ | 3 000M | | US$ | 189 | | US$ | 11 |
Multicurrency Euro Medium-Term Note | | US$ | 3 000M | | US$ | 135 | | US$ | 459 |
Multicurrency US Medium-Term Note | | US$ | 500M | | | — | | | — |
27. Related Party Transactions
(A) ULTIMATE CONTROLLING ENTITY
The immediate controlling entity and ultimate controlling entity during the year was the Under Treasurer of Queensland as the Corporation Sole of QTC.
(B) DIRECTORS AND SPECIFIED EXECUTIVES
Disclosures relating to directors and specified executives are set out in note 31.
2006-2007 ANNUAL REPORT 65
Notes to and Forming Part of the Financial Statements
for the year ended 30 June 2007 (continued)
28. Investments Accounted for using the Equity Method
| | | | | | | | | | | | | | |
ENTITY | | PRINCIPAL ACTIVITIES | | ORDINARY SHARE
OWNERSHIP INTEREST | | | INVESTMENT
CARRYING AMOUNT | |
| | | 2007 | | | 2006 | | | 2007 | | | 2006 | |
Local Government Infrastructure Services Pty Ltd | | Provides assistance to Queensland local governments in relation to infrastructure procurement | | 50 | % | | 50 | % | | 50 | % | | 50 | % |
RESULTS OF JOINT VENTURE ENTITY
Summarised financial information of jointly controlled entity:
| | | | | |
| | | 30 JUNE 2007
$000 | | | 30 JUNE 2006
$000 |
INCOME STATEMENT | | | | | |
Revenues | | 28 472 | | | 547 |
Expenses | | 28 485 | | | 374 |
| | | | | |
Profit before income tax expense | | (13 | ) | | 173 |
Income tax expense | | — | | | — |
| | | | | |
NET (LOSS) / PROFIT | | (13 | ) | | 173 |
| | | | | |
BALANCE SHEET | | | | | |
Current assets | | 41 545 | | | 33 004 |
Non-current assets | | — | | | — |
| | | | | |
TOTAL ASSETS | | 41 545 | | | 33 004 |
| | | | | |
Current liabilities | | 32 635 | | | 8 892 |
Non-current liabilities | | 8 550 | | | 23 739 |
| | | | | |
TOTAL LIABILITIES | | 41 185 | | | 32 631 |
| | | | | |
NET ASSETS | | 360 | | | 373 |
| | | | | |
| QTC’s share of the joint venture entity’s result and retained profits, including movements in the carrying amount of the investment consists of: | | | | | |
| | |
SHARE OF POST-ACQUISITION RETAINED PROFITS | | | | | |
Share of retained profits at 1 July | | 85 | | | — |
Share of net result | | (5 | ) | | 85 |
| | | | | |
SHARE OF RETAINED PROFITS AT 30 JUNE | | 80 | | | 85 |
| | | | | |
MOVEMENTS IN CARRYING AMOUNT OF INVESTMENT | | | | | |
Carrying amount at 1 July | | 185 | | | — |
Investments acquired during the year | | — | | | 100 |
Share of net result | | (5 | ) | | 85 |
| | | | | |
CARRYING AMOUNT AT 30 JUNE | | 180 | | | 185 |
| | | | | |
66 QUEENSLAND TREASURY CORPORATION
29. Investments in Companies
Investments in the following companies are held at cost:
| | | | | | | | | | |
NAME | | PRINCIPAL ACTIVITIES | | BENEFICIAL
INTEREST
2007 % | | VOTING
RIGHTS
2007 % | | BENEFICIAL
INTEREST
2006 % | | VOTING
RIGHTS
2006 % |
Queensland Treasury Holdings Pty Ltd^ | | Holding company for a number of subsidiaries and investments | | 40 | | 24 | | 40 | | 24 |
Queensland Lottery Corporation Pty Ltd* | | Holds the lottery licence and trademarks on behalf of the State of Queensland | | 40 | | 24 | | – | | – |
DBCT Holdings Pty Ltd* | | Owns and leases bulk coal port facilities in North Queensland | | 20 | | 12 | | 20 | | 12 |
South East Queensland | | Owns and operates bulk water storage facility | | 8 | | 4.8 | | 8 | | 4.8 |
Water Corporation Limited* | | in South East Queensland | | | | | | | | |
City North Infrastructure Pty Ltd* | | Manages the procurement of the Airport Link and Northern Busway Project (registered 22 December 2006) | | 10 | | 6 | | — | | — |
Sunshine Locos Pty Ltd# | | Dormant | | 100 | | 100 | | 100 | | 100 |
| ^ | QTH holds an interest in Queensland Motorways Limited (2 of a total 147 960 shares), (2006 Nil) |
| * | Beneficial interest and voting rights in the company are held indirectly through QTC’s holdings in Queensland Treasury Holdings Pty Ltd. |
| # | While a controlled entity of QTC, Sunshine Locos Pty Ltd has not been consolidated into these statements due to its immaterial and dormant status. |
2006-2007 ANNUAL REPORT 67
Notes to and Forming Part of the Financial Statements
for the year ended 30 June 2007 (continued)
30. Remuneration of Officers
(A) REMUNERATION OF BOARD AND COMMITTEE MEMBERS
Details of the nature and amount of each major element of the remuneration of the Board Members are as follows:
| | | | | | | | | | | | |
| | | SALARY & FEES | | OTHER BENEFITS | | TOTAL |
| | | 2007 $ | | 2006 $ | | 2007 $ | | 2006 $ | | 2007 $ | | 2006 $ |
Sir Leo Hielscher | | 90 751 | | 88 106 | | 11 850 | | 9 480 | | 102 601 | | 97 586 |
Gerard Bradley* | | 40 366 | | 36 048 | | — | | — | | 40 366 | | 36 048 |
Marian Micalizzi | | 37 108 | | 36 027 | | — | | — | | 37 108 | | 36 027 |
Shauna Tomkins | | 35 717 | | 34 676 | | — | | — | | 35 717 | | 34 676 |
Bill Shields | | 35 625 | | 31 813 | | — | | — | | 35 625 | | 31 813 |
Gillian Brown | | 30 962 | | 30 060 | | — | | — | | 30 962 | | 30 060 |
David Coe | | 30 962 | | 30 060 | | — | | — | | 30 962 | | 30 060 |
| * | Remuneration is paid to Queensland Treasury and remitted to the Consolidated Fund. |
Other benefits include reimbursement of telephone expenses and the provision of a car park. The Chairman also has access to an office and secretarial support. At 30 June 2007, the term of the QTC Board expired. The Governor-in-Council reappointed the QTC Board Members with new terms commencing 1 July 2007, with one change to the Board’s composition. Tim Spencer, the Deputy Under Treasurer, has replaced Gerard Bradley as the Deputy Chairman effective 1 July 2007.
(B) REMUNERATION OF EXECUTIVE OFFICERS
Executive Officers are those officers who are members of the Organisation Management Team involved in the strategic direction, general management or control of the business at an organisational level.
Details of the nature and amount of each major element of the remuneration of the Executive Officers are as follows:
| | | | | | | | | | | | |
| | | SALARY & FEES | | OTHER BENEFITS | | TOTAL |
| | | 2007 $ | | 2006 $ | | 2007 $ | | 2006 $ | | 2007 $ | | 2006 $ |
Chief Executive | | 488 582 | | 467 125 | | 11 853 | | 12 007 | | 500 435 | | 479 132 |
General Manager – Financial Markets | | 329 608 | | 315 120 | | 9 700 | | 4 505 | | 339 308 | | 319 625 |
General Manager | | 251 454 | | 240 380 | | 9 547 | | 7 663 | | 261 001 | | 248 043 |
General Manager | | 248 642 | | 237 350 | | 9 720 | | 8 299 | | 258 362 | | 245 649 |
General Manager | | 204 479 | | 194 930 | | 8 574 | | 7 096 | | 213 053 | | 202 026 |
Executive Officers’ salary and fees include salary, superannuation and salary sacrificed benefits but exclude any at-risk performance payments for which they may be eligible and changes in annual leave entitlements. Other benefits include reimbursement of telephone expenses and motor vehicle costs.
68 QUEENSLAND TREASURY CORPORATION
30. Remuneration of Officers (continued)
(C) AGGREGATE AT-RISK PERFORMANCE INCENTIVE REMUNERATION
| | | | |
| | | YEAR OF ASSESSMENT |
| | | 30 JUNE 2007
$ | | 30 JUNE 2006
$ |
Aggregate at-risk performance incentive paid or payable | | 2 943 677 | | 1 626 450 |
Aggregate remuneration of employees to whom a performance incentive is payable | | 15 784 098 | | 12 657 610 |
Number of employees to whom a performance incentive is payable | | 144 | | 122 |
31. Other Director and Executive Disclosures
TRANSACTIONS
Directors and executives held directorships with the following entities with which QTC conducted commercial transactions during the year. These transactions included the provision of investment, advisory, banking and company secretarial services and were in the normal course of business and on commercial terms and conditions.
DIRECTORS
| • | | Queensland Health of which Sir Leo Hielscher is Chairman of the Queensland Health Reform Advisory Panel |
| • | | Local Government Reform Commission of which Sir Leo Hielscher was a Commissioner |
| • | | Queensland Treasury of which Gerard Bradley is Under Treasurer |
| • | | QSuper of which Gerard Bradley is Chairman of the Board of Trustees |
| • | | Queensland Investment Corporation of which Marian Micalizzi is a Director |
| • | | Allco Finance Group Limited of which David Coe is Executive Chairman |
| • | | Minter Ellison of which Gillian Brown is Chairman and a Partner |
| • | | DBCT Holdings Pty Ltd of which Gillian Brown is a Director |
| • | | Queensland Treasury Holdings Pty Ltd (QTH), an entity in which QTC has an investment interest, of which Gerard Bradley is a Director |
| • | | Queensland Water Infrastructure Pty Ltd, of which Gerard Bradley is a Director |
| • | | Water Infrastructure Project Board, of which Gerard Bradley is a Member |
EXECUTIVES
| • | | QTH, of which Stephen Rochester, QTC’s Chief Executive, and Neil Castles, General Manager Credit and Procurement Risk, are Directors |
| • | | Sunshine Locos Pty Ltd, a controlled entity of QTC, of which Stephen Rochester is a Director |
| • | | Sun Retail Pty Ltd to which Stephen Rochester was seconded (from QTC) as Chief Executive until the sale of Sun Retail Pty Ltd was concluded in February 2007 |
| • | | Local Government Infrastructure Services Pty Ltd (50% owned by QTC) of which Stephen Rochester is a Director and Neil Castles is the alternate Director |
| • | | Queensland Lottery Corporation Pty Ltd of which Neil Castles is the Company Secretary |
| • | | Islanders Board of Industry and Service of which Neil Castles is a Director |
32. Dividends
QTC is required to pay dividends to the Queensland Government as the Treasurer shall determine from time to time. At 30 June 2007, no dividend (2006: nil) has been provided for in the accounts of QTC.
33. Events Subsequent To Balance Date
There are no matters or circumstances which have arisen since the end of the financial year that have significantly affected or may significantly affect the operations of QTC, the results of those operations or the state of affairs of QTC in future years.
2006-2007 ANNUAL REPORT 69
Certificate of the Queensland Treasury Corporation
The foregoing general purpose financial statements have been prepared pursuant to the provisions of the Financial Administration and Audit Act 1977 and other prescribed requirements.
We certify that in our opinion:
| | (i) | the prescribed requirements for establishing and keeping the accounts have been complied with in all material respects, and |
| | (ii) | the foregoing annual financial statements have been drawn up so as to present a true and fair view, in accordance with prescribed accounting standards, of the transactions of the Queensland Treasury Corporation for the period 1 July 2006 to 30 June 2007 and of the financial position as at the close of that year. |
| | |
 | | |
| G P Bradley | | SR Rochester |
| Queensland Treasury Corporation | | Chief Executive |
| |
| Brisbane | | |
| 14 September 2007 | | |
70 QUEENSLAND TREASURY CORPORATION
Independent Auditor’s Report
to Queensland Treasury Corporation
Matters Relating to the Electronic
Presentation of the Audited Financial Report
The audit report relates to the financial report of Queensland Treasury Corporation for the financial year ended 30 June 2007 included on Queensland Treasury Corporation’s web site. The corporation sole is responsible for the integrity of the Queensland Treasury Corporation’s web site. We have not been engaged to report on the integrity of the Queensland Treasury Corporation’s web site. The audit report refers only to the statements named below. It does not provide an opinion on any other information which may have been hyperlinked to/from these statements. If users of the financial report are concerned with the inherent risks arising from electronic data communications they are advised to refer to the hard copy of the audited financial report, available from Queensland Treasury Corporation, to confirm the information included in the audited financial report presented on this web site.
These matters also relate to the presentation of the audited financial report in other electronic media including CD Rom.
Report on the Financial Report
I have audited the accompanying financial report of Queensland Treasury Corporation which comprises the balance sheet as at 30 June 2007, and the income statement, statement of changes in equity and cash flow statement for the year ended on that date, a summary of significant accounting policies, other explanatory notes and certificates given by the Under Treasurer – Queensland Treasury as the Corporation Sole and Chief Executive.
THE CORPORATION SOLE’S RESPONSIBILITY FOR THE FINANCIAL REPORT
The Corporation Sole is responsible for the preparation and fair presentation of the financial report in accordance with prescribed accounting requirements identified in the Financial Administration and Audit Act 1977 and the Financial Management Standard 1997, including compliance with applicable Australian Accounting Standards (including the Australian Accounting Interpretations). This responsibility includes establishing and maintaining internal controls relevant to the preparation and fair presentation of the financial report that is free from material misstatement, whether due to fraud or error; selecting and applying appropriate accounting policies; and making accounting estimates that are reasonable in the circumstances.
AUDITOR’S RESPONSIBILITY
My responsibility is to express an opinion on the financial report based on the audit. The audit was conducted in accordance with Auditor-General of Queensland Auditing Standards, which incorporate the Australian Auditing Standards. These Auditing Standards require compliance with relevant ethical requirements relating to audit engagements and that the audit is planned and performed to obtain reasonable assurance whether the financial report is free from material misstatement.
An audit involves performing procedures to obtain audit evidence about the amounts and disclosures in the financial report. The procedures selected depend on the auditor’s judgement, including the assessment of risks of material misstatement in the financial report, whether due to fraud or error. In making those risk assessments, the auditor considers internal control relevant to the entity’s preparation and fair presentation of the financial report in order to design audit procedures that are appropriate in the circumstances, but not for the purpose of expressing an opinion on the effectiveness of the entity’s internal control, other than in expressing an opinion on compliance with prescribed requirements. An audit also includes evaluating the appropriateness of accounting policies and the reasonableness of accounting estimates made by the Corporation, as well as evaluating the overall presentation of the financial report including any mandatory financial reporting requirements as approved by the Treasurer for application in Queensland.
I believe that the audit evidence obtained is sufficient and appropriate to provide a basis for my audit opinion.
INDEPENDENCE
The Financial Administration and Audit Act 1977 promotes the independence of the Auditor-General and QAO authorised auditors. The Auditor-General is the auditor of all Queensland public sector entities and can only be removed by Parliament.
The Auditor-General may conduct an audit in any way considered appropriate and is not subject to direction by any person about the way in which audit powers are to be exercised. The Auditor-General has for the purposes of conducting an audit, access to all documents and property and can report to Parliament matters which in the Auditor-General’s opinion are significant.
AUDITOR’S OPINION
In accordance with s.46G of the Financial Administration and Audit Act 1977 –
| (a) | I have received all the information and explanations which I have required; and |
| | (i) | the prescribed requirements in respect of the establishment and keeping of accounts have been complied with in all material respects; and |
| | (ii) | the financial report has been drawn up so as to present a true and fair view, in accordance with the prescribed accounting standards of the transactions of the Queensland Treasury Corporation for the financial year 1 July 2006 to 30 June 2007 and of the financial position as at the end of that year. |
| | |
 | |  |
G G Poole FCPA Auditor-General of Queensland | | Queensland Audit Office Brisbane |
2006-2007 ANNUAL REPORT 71
Appendix A: Loans to customers
| | | | | | | | |
LOANS TO CUSTOMERS | | TOTAL DEBT OUTSTANDING (MARKET VALUE) 30 JUNE 2006 A$000 | | TOTAL DEBT OUTSTANDING (MARKET VALUE) 30 JUNE 2007 A$000 | | AVERAGE EXPECTED TERM (YRS)* 30 JUNE 2006 | | AVERAGE EXPECTED TERM (YRS)* 30 JUNE 2007 |
| BODIES WITHIN THE PUBLIC ACCOUNTS | | | | | | | | |
Arts Queensland | | 9,543 | | 13,997 | | N/A | | N /A |
CITEC | | 4,930 | | 2,051 | | N/A | | N /A |
Corptech | | 354 | | — | | 0.96 | | — |
Department of Communities | | 69 | | — | | 0.96 | | — |
Department of Education, Training and the Arts | | 94,960 | | 74,240 | | 5.47 | | 4.79 |
Department of Emergency Services | | 4,591 | | 3,379 | | 3.84 | | 3.13 |
Department of Justice and Attorney General | | 94,010 | | 86,330 | | N/A | | 4.96 |
Department of Local Government Planning Sport and Recreation | | — | | 3,683 | | — | | N /A |
Department of Main Roads | | 862,694 | | 986,575 | | 9.41 | | N /A |
Department of Public Works – Administrative Services | | 207,604 | | 151,363 | | N/A | | 5.43 |
Department of Public Works – GoPrint | | 2,251 | | 2,189 | | N/A | | N /A |
Department of Public Works – Q-Fleet | | 274,870 | | 286,135 | | N/A | | N /A |
Department of State Development | | 158,916 | | 147,073 | | 8.34 | | 7.35 |
Department of the Premier and Cabinet | | 28,727 | | 27,294 | | N/A | | N /A |
Forestry Plantations Queensland | | 79,094 | | 76,503 | | N/A | | 5.32 |
Monte Carlo Caravan Park Pty Ltd | | 655 | | 493 | | 3.75 | | 2.75 |
Queensland Ambulance Service | | 3,191 | | 2,205 | | 3.04 | | 2.04 |
Queensland Audit Office | | 242 | | 50 | | 1.21 | | 0.21 |
Queensland Fire and Rescue Authority | | 4,879 | | 4,228 | | 7.74 | | 7.22 |
Queensland Health | | 26,953 | | 86,325 | | N/A | | N /A |
Queensland Transport | | 64,996 | | 61,722 | | 7.19 | | 6.84 |
Queensland Treasury | | — | | 972,166 | | — | | N /A |
Sales and Distribution Services | | 139 | | 6,539 | | 0.43 | | N /A |
TOTAL | | 1,923,668 | | 2,994,540 | | | | |
| | | | |
| COOPERATIVE HOUSING SOCIETIES | | | | | | | | |
Cooperative Housing Societies | | 8,475 | | 4,951 | | N/A | | N /A |
TOTAL | | 8,475 | | 4,951 | | | | |
| | | | |
| GOVERNMENT OWNED CORPORATIONS | | | | | | | | |
Cairns Port Authority | | 109,365 | | 104,827 | | N/A | | N /A |
Central Queensland Port Authority | | 204,966 | | 341,009 | | N/A | | N /A |
CS Energy Ltd | | 586,107 | | 1,080,621 | | N/A | | N /A |
ENERGEX Limited | | 2,564,875 | | 3,183,355 | | N/A | | N /A |
Ergon Energy Corporation Limited | | 2,143,440 | | 2,479,336 | | N/A | | N /A |
Eungella Water Pipeline Pty Ltd | | 2,980 | | 34,369 | | N/A | | N /A |
Gateway Investments Corporation Pty Ltd | | 304,222 | | 314,711 | | N/A | | N /A |
Port of Brisbane Corporation | | 274,226 | | 283,026 | | N/A | | N /A |
Ports Corporation of Queensland | | — | | 107,786 | | — | | N /A |
Queensland Electricity Transmission Corporation Ltd (Powerlink) | | 1,642,072 | | 1,953,763 | | N/A | | N /A |
Queensland Rail | | 4,587,232 | | 4,550,007 | | N/A | | N /A |
Stanwell Corporation Limited | | 117,759 | | 113,834 | | N/A | | N /A |
SunWater | | 87,891 | | 231,458 | | N/A | | N /A |
Tarong Energy Corporation Limited | | 265,488 | | 354,539 | | 9.93 | | 25.49 |
Townsville Port Authority | | 13,309 | | 10,854 | | 5.03 | | 4.03 |
TOTAL | | 12,903,933 | | 15,143,495 | | | | |
A1 QUEENSLAND TREASURY CORPORATION
| | | | | | | | |
LOANS TO CUSTOMERS | | TOTAL DEBT OUTSTANDING (MARKET VALUE) 30 JUNE 2006 A$ 000 | | TOTAL DEBT OUTSTANDING (MARKET VALUE) 30 JUNE 2007 A$000 | | AVERAGE EXPECTED TERM (YRS)* 30 JUNE 2006 | | AVERAGE EXPECTED TERM (YRS)* 30 JUNE 2007 |
LOCAL GOVERNMENTS | | | | | | | | |
Aramac Shire Council | | 38 | | 30 | | 4.41 | | 3.42 |
Atherton Shire Council | | 1,031 | | 746 | | 4.33 | | 3.75 |
Balonne Shire Council | | 3,481 | | 3,008 | | 10.07 | | 9.42 |
Banana Shire Council | | 2,144 | | 1,614 | | 5.87 | | 5.51 |
Barcaldine Shire Council | | 739 | | 1,947 | | 8.54 | | 15.79 |
Barcoo Shire Council | | 647 | | 314 | | 3.08 | | 3.35 |
Bauhinia Shire Council | | 310 | | 281 | | 11.63 | | 10.59 |
Beaudesert Shire Council | | 13,851 | | 11,821 | | 8.47 | | 7.88 |
Blackall Shire Council | | 1,147 | | 972 | | 8.36 | | 7.68 |
Boonah Shire Council | | 3,426 | | 3,887 | | 15.75 | | 13.02 |
Bowen Shire Council | | 8,563 | | 6,756 | | 5.56 | | 4.89 |
Brisbane City Council | | 938,448 | | 866,765 | | 13.96 | | 13.96 |
Bulloo Shire Council | | 478 | | 1,923 | | 2.11 | | 8.59 |
Bundaberg City Council | | 14,747 | | 19,544 | | 3.83 | | 5.93 |
Bungil Shire Council | | 2,304 | | 2,472 | | 7.18 | | 8.12 |
Burdekin Shire Council | | 11,889 | | 11,304 | | 6.23 | | 6.17 |
Burnett Shire Council | | 15,777 | | 12,632 | | 12.31 | | 13.08 |
Caboolture Shire Council | | 19,117 | | 16,401 | | 7.47 | | 6.72 |
Cairns City Council | | 71,921 | | 61,495 | | 5.96 | | 7.23 |
Calliope Shire Council | | 3,995 | | 9,843 | | 12.71 | | 16.84 |
Caloundra City Council | | 95,396 | | 98,393 | | 11.82 | | 11.39 |
Caloundra/Maroochy Water Supply Board | | 32,468 | | 32,567 | | 17.51 | | 16.81 |
Cambooya Shire Council | | 131 | | 70 | | 2.19 | | 1.30 |
Cardwell Shire Council | | 10,863 | | 8,779 | | 12.89 | | 13.65 |
Carpentaria Shire Council | | 1,730 | | 2,210 | | 10.48 | | 7.86 |
Cherbourg Aboriginal Council | | 383 | | 238 | | 2.53 | | 1.52 |
Chinchilla Shire Council | | 2,628 | | 2,407 | | 12.86 | | 11.86 |
Clifton Shire Council | | 230 | | 208 | | 12.24 | | 11.28 |
Cloncurry Shire Council | | 4,078 | | 2,875 | | 4.60 | | 4.34 |
Cook Shire Council | | 3,736 | | 3,454 | | 18.08 | | 17.02 |
Cooloola Shire Council | | 5,440 | | 4,543 | | 6.96 | | 6.20 |
Crow’s Nest Shire Council | | 3,528 | | 5,982 | | 7.65 | | 11.49 |
Dalby Town Council | | — | | 1,460 | | — | | 14.89 |
Dalby Wambo Library Board | | 24 | | 19 | | 3.99 | | 3.00 |
Dalby Wambo Salesyard Board | | 231 | | 215 | | 17.36 | | 16.42 |
Dalrymple Shire Council | | 1,077 | | 899 | | 6.81 | | 6.00 |
Diamantina Shire Council | | 1,194 | | 1,085 | | 12.03 | | 11.09 |
Douglas Shire Council | | 6,245 | | 4,329 | | 2.21 | | 2.86 |
Duaringa Shire Council | | 1,300 | | 1,056 | | 5.11 | | 4.13 |
Eacham Shire Council | | 1,704 | | 1,930 | | 9.07 | | 8.79 |
Emerald Shire Council | | 2,538 | | 11,700 | | 7.95 | | 16.03 |
Emerald/Peak Downs Saleyards Board | | 191 | | 166 | | 7.05 | | 6.06 |
Esk Shire Council | | 3,586 | | 2,601 | | 4.57 | | 4.01 |
Etheridge Shire Council | | 546 | | 503 | | 14.40 | | 13.46 |
Fitzroy Shire Council | | 2,649 | | 1,711 | | 7.76 | | 9.43 |
2006-2007 ANNUAL REPORT A 2
Appendix A: Loans to customers (continued)
| | | | | | | | |
LOANS TO CUSTOMERS | | TOTAL DEBT OUTSTANDING (MARKET VALUE) 30 JUNE 2006 A$000 | | TOTAL DEBT OUTSTANDING (MARKET VALUE) 30 JUNE 2007 A$000 | | AVERAGE EXPECTED TERM (YRS)* 30 JUNE 2006 | | AVERAGE EXPECTED TERM (YRS)* 30 JUNE 2007 |
Gatton Shire Council | | 4,000 | | 3,172 | | 6.14 | | 5.54 |
Gayndah Shire Council | | 363 | | 261 | | 6.99 | | 7.44 |
Gladstone Calliope Aerodrome Board | | 698 | | 504 | | 3.55 | | 2.61 |
Gladstone City Council | | 18,544 | | 19,869 | | 9.97 | | 11.77 |
Gold Coast City Council | | 404,014 | | 628,871 | | 9.19 | | N /A |
Goondiwindi Town Council | | 1,985 | | 1,372 | | 4.24 | | 3.73 |
Herberton Shire Council | | 127 | | 62 | | 1.89 | | 0.89 |
Hervey Bay City Council | | 57,053 | | 72,653 | | 14.26 | | 13.83 |
Hopevale Aboriginal Council | | — | | 874 | | — | | 19.97 |
Inglewood Shire Council | | 95 | | 77 | | 5.56 | | 4.71 |
Ipswich City Council | | 97,409 | | 92,012 | | N/A | | N /A |
Isis Shire Council | | 9,056 | | 8,855 | | 17.87 | | 17.12 |
Jericho Shire Council | | 105 | | 29 | | 1.32 | | 0.32 |
Johnstone Shire Council | | 13,561 | | 13,370 | | 8.04 | | N /A |
Jondaryan Shire Council | | 6,377 | | 5,619 | | 14.50 | | 14.21 |
Kilcoy Shire Council | | 487 | | 872 | | 11.92 | | 15.83 |
Kingaroy Shire Council | | 5,364 | | 5,734 | | 13.70 | | 12.60 |
Kolan Shire Council | | 1,359 | | 1,545 | | 9.91 | | 11.32 |
Laidley Shire Council | | 4,839 | | 4,995 | | 11.44 | | 12.96 |
Livingstone Shire Council | | 28,703 | | 30,858 | | 12.90 | | 12.33 |
Logan City Council | | 85,068 | | 75,539 | | 8.57 | | 9.65 |
Longreach Shire Council | | 1,510 | | 1,287 | | 15.55 | | 15.98 |
Mackay City Council | | 56,813 | | 55,238 | | 12.77 | | 12.66 |
Mareeba Shire Council | | 9,008 | | 7,256 | | 7.44 | | 7.02 |
Maroochy Shire Council | | 150,546 | | 141,953 | | 5.71 | | 5.02 |
Maryborough City Council | | 16,409 | | 14,775 | | 13.62 | | 12.95 |
McKinlay Shire Council | | 667 | | 604 | | 11.02 | | 10.11 |
Mirani Shire Council | | 3,076 | | 2,692 | | 12.47 | | 12.04 |
Miriam Vale Shire Council | | 3,542 | | 3,039 | | 12.42 | | 12.28 |
Monto Shire Council | | 1,056 | | 895 | | 11.41 | | 11.25 |
Mount Morgan Shire Council | | 715 | | 1,248 | | 14.65 | | 16.75 |
Mount Isa City Council | | 3,851 | | 2,943 | | 3.95 | | 2.95 |
Mundubbera Shire Council | | 25 | | 500 | | 0.52 | | 9.92 |
Murgon Shire Council | | 59 | | 28 | | 1.83 | | 0.82 |
Murweh Shire Council | | 2,728 | | 2,491 | | 12.80 | | 11.84 |
Nanango Shire Council | | 1,387 | | 1,278 | | 15.67 | | 14.82 |
Noosa Shire Council | | 41,170 | | 49,750 | | 11.00 | | 11.35 |
Paroo Shire Council | | 2,717 | | 2,453 | | 17.90 | | 17.63 |
Pine Rivers Shire Council | | 65,861 | | 60,947 | | 5.80 | | 6.97 |
Pittsworth Shire Council | | 802 | | 976 | | 19.88 | | N /A |
Redcliffe City Council | | 14,449 | | 16,801 | | 6.25 | | 6.56 |
Redland Shire Council | | 121,320 | | 129,369 | | 9.96 | | 10.77 |
Richmond Shire Council | | 13 | | 14 | | 2.81 | | 1.84 |
Rockhampton City Council | | 48,662 | | 51,301 | | 11.50 | | 11.27 |
Rockhampton District Saleyards Board | | 1,964 | | 1,781 | | 15.79 | | 15.16 |
Roma Town Council | | 3,147 | | 8,290 | | 9.15 | | 14.95 |
Roma-Bungil Showgrounds & Saleyards Board | | 405 | | 334 | | 5.33 | | 4.33 |
Rosalie Shire Council | | 6,308 | | 5,732 | | 15.93 | | 15.30 |
A 3 QUEENSLAND TREASURY CORPORATION
| | | | | | | | |
LOANS TO CUSTOMERS | | TOTAL DEBT OUTSTANDING (MARKET VALUE) 30 JUNE 2006 A$000 | | TOTAL DEBT OUTSTANDING (MARKET VALUE) 30 JUNE 2007 A$000 | | AVERAGE EXPECTED TERM (YRS)* 30 JUNE 2006 | | AVERAGE EXPECTED TERM (YRS)* 30 JUNE 2007 |
Sarina Shire Council | | 6,826 | | 5,390 | | 4.39 | | 3.40 |
Seisa Island Council | | 553 | | 451 | | 5.06 | | 4.06 |
Stanthorpe Shire Council | | 1,680 | | 2,939 | | 12.96 | | 17.13 |
Tiaro Shire Council | | 206 | | 1,390 | | 5.24 | | 18.39 |
Toowoomba City Council | | 67,550 | | 66,826 | | 14.22 | | 13.89 |
Torres Shire Council | | 2,272 | | 2,043 | | 9.81 | | 8.83 |
Townsville City Council | | 10,744 | | 64,370 | | 7.47 | | 15.75 |
Warwick Shire Council | | 7,029 | | 11,226 | | 14.05 | | 13.43 |
Whitsunday Shire Council | | 24,585 | | 19,392 | | 7.04 | | 12.36 |
Winton Shire Council | | 2,525 | | 2,190 | | 16.91 | | 17.26 |
Wondai Shire Council | | 1,976 | | 1,616 | | 7.94 | | 7.51 |
TOTAL | | 2,719,311 | | 2,932,106 | | | | |
| | | | |
STATUTORY BODIES | | | | | | | | |
DRAINAGE BOARDS | | | | | | | | |
East Deeral Drainage Board | | 34 | | 26 | | 4.01 | | 3.02 |
Eugun Bore Water Authority | | 280 | | 239 | | 6.45 | | 5.44 |
Matthews Road Drainage Board | | 41 | | 14 | | 9.18 | | 2.57 |
GRAMMAR SCHOOLS | | | | | | | | |
Brisbane Girls’ Grammar School | | 26,652 | | 23,808 | | 12.78 | | 12.18 |
Brisbane Grammar School | | 11,434 | | 10,526 | | 5.30 | | 4.27 |
Ipswich Girls Grammar School | | 1,544 | | 1,385 | | 9.47 | | 8.48 |
Ipswich Grammar School | | 3,901 | | 3,422 | | 7.68 | | 6.69 |
Rockhampton Girls Grammar School | | 4,096 | | 4,020 | | 16.93 | | 19.47 |
Rockhampton Grammar School | | 4,215 | | 3,657 | | 10.39 | | 9.80 |
Toowoomba Grammar School | | 1,774 | | 1,284 | | 3.68 | | 2.67 |
Townsville Grammar School | | 11,705 | | 10,562 | | 13.41 | | 12.71 |
RIVER IMPROVEMENT TRUSTS | | | | | | | | |
Pioneer River Improvement Trust | | 634 | | 551 | | 7.23 | | 6.25 |
UNIVERSITIES | | | | | | | | |
Griffith University | | 82,449 | | 71,356 | | 7.99 | | 7.13 |
James Cook University | | 18,556 | | 25,391 | | 14.97 | | 15.62 |
Sunshine Coast University | | 28,891 | | 26,175 | | 14.51 | | 13.75 |
WATER BOARDS | | | | | | | | |
Avondale Water Board | | 662 | | 605 | | 7.32 | | 6.72 |
Fernlee Water Authority | | — | | 75 | | — | | 14.10 |
Gladstone Area Water Board | | 113,180 | | 106,784 | | N/A | | N /A |
Glamorgan Vale Water Board | | 127 | | 106 | | 8.67 | | 8.18 |
Grevillea Water Board | | 6 | | — | | 0.98 | | — |
Kelsey Creek Water Board | | 1,656 | | 1,474 | | 8.87 | | 7.87 |
Merlwood Water Board | | 62 | | 30 | | 1.82 | | 0.81 |
North Burdekin Water Board | | 647 | | 349 | | 2.07 | | 1.07 |
Pioneer Valley Water Board | | 4,914 | | 4,348 | | 8.50 | | 7.53 |
Riversdale Murray Valley Water Management Board | | 1,002 | | 910 | | 11.47 | | 10.45 |
Six Mile Creek Water Board | | 64 | | 45 | | 3.11 | | 2.10 |
2006-2007 ANNUAL REPORT A 4
Appendix A: Loans to customers (continued)
| | | | | | | | |
LOANS TO CUSTOMERS | | TOTAL DEBT
OUTSTANDING
(MARKET VALUE) 30 JUNE 2006 A$000 | | TOTAL DEBT
OUTSTANDING
(MARKET VALUE)
30 JUNE 2007 A$000 | | AVERAGE
EXPECTED
TERM (YRS)*
30 JUNE 2006 | | AVERAGE
EXPECTED
TERM (YRS)*
30 JUNE 2007 |
WATER SUPPLY BOARDS | | | | | | | | |
Bollon South Water Authority | | 873 | | 803 | | 13.47 | | 12.47 |
Bollon West Water Authority | | 235 | | 981 | | 14.69 | | 14.18 |
Ingie Water Authority | | 450 | | 453 | | 14.47 | | 13.57 |
Townsville Thuringowa Water Supply Board | | 84,549 | | 112,103 | | 15.83 | | 16.10 |
OTHER STATUTORY BODIES | | | | | | | | |
Agricultural Colleges | | 3,949 | | 2,704 | | 3.41 | | 2.61 |
Island Coordinating Council | | 752 | | 671 | | 14.00 | | 13.42 |
Major Sports Facilities Authority | | 304,103 | | 369,290 | | N/A | | N /A |
Mt Gravatt Showgrounds Trust | | 58 | | 43 | | 3.68 | | 2.68 |
National Trust of Queensland | | — | | 906 | | — | | N /A |
Queensland Art Gallery | | 35 | | — | | 0.34 | | — |
Queensland Rural Adjustments Authority | | 5,764 | | 4,777 | | 5.55 | | 4.53 |
Queensland Studies Authority | | 3,900 | | 1,961 | | 9.44 | | 3.87 |
South Bank Corporation | | 34,718 | | 36,235 | | N/A | | N /A |
State Library of Queensland | | 404 | | 272 | | 2.91 | | 1.91 |
TOTAL | | 758,318 | | 828,340 | | | | |
| | | | |
QUEENSLAND WATER ENTITIES | | | | | | | | |
SEQ Water Facility | | 198,361 | | 191,957 | | N/A | | N /A |
QLD Water Infrastructure Pty Ltd | | — | | 294,308 | | — | | N /A |
Western Corridor Recycled Water Pty Ltd | | — | | 283,852 | | — | | N /A |
TOTAL | | 198,361 | | 770,117 | | | | |
| | | | |
SUNCORP-METWAY LIMITED | | | | | | | | |
Suncorp Metway Facility | | 3,199 | | 2,804 | | 8.55 | | 8.14 |
TOTAL | | 3,199 | | 2,804 | | | | |
| | | | |
TOLLWAY COMPANY | | | | | | | | |
Queensland Motorways Limited | | 932,371 | | 1,249,534 | | N/A | | N /A |
TOTAL | | 932,371 | | 1,249,534 | | | | |
| | | | |
QTC RELATED ENTITIES | | | | | | | | |
DBCT Holdings Pty Ltd | | 372,896 | | 333,012 | | N/A | | N /A |
TOTAL | | 372,896 | | 333,012 | | | | |
| | | | |
OTHER BODIES | | | | | | | | |
Agricultural Cooperative Societies | | 402 | | — | | 1.00 | | — |
Aviation Australia Pty Ltd | | 3,004 | | 2,725 | | N/A | | 13.46 |
Department of Education and the Arts – State Schools | | 255 | | 149 | | 2.57 | | 1.81 |
Parents and Citizens Associations | | 7,520 | | 7,236 | | 6.41 | | 6.25 |
TOTAL | | 11,180 | | 10,110 | | | | |
| | | | |
GRAND TOTAL | | 19,831,712 | | 24,269,009 | | | | |
Total Debt Outstanding includes Fixed Rate Loans, Operating Leases and Debenture Assets held by QTC (previously recorded as Investments).
The balance of customers’ offset deposits held in various pools is offset against customers’ debt outstanding.
Unsettled Operating Leases are not included.
| | |
*Average Expected Term | | - only includes standard principal and interest accounts - ignores temporary funding and debt offset facility, and - is not applicable for any non-standard principal and interest accounts. |
A 5 QUEENSLAND TREASURY CORPORATION
Appendix B: Partners in Financial Markets
30 June 2007
Actual dealer entities may vary depending on the facility and location of the dealer.
| | |
| DOMESTICAND GLOBAL A $ BOND FACILITY DISTRIBUTION GROUP | | |
| |
AUSTRALIA AND NEW ZEALAND BANKING GROUP LTD | | TELEPHONE |
| |
Domestic (Australia) | | +61 2 9226 6706 |
Global (London) | | +44 207 378 2378 |
| |
ABN AMRO BANK NV | | TELEPHONE |
| |
Domestic (Australia) | | +61 2 8259 2200 |
Global (London) | | +44 207 678 3887 |
| |
CITIGROUP GLOBAL MARKETS AUSTRALIA LTD | | TELEPHONE |
| |
Domestic (Australia) | | +61 2 8225 6046 |
Global (London) | | +44 207 986 9070 |
| |
COMMONWEALTH BANK OF AUSTRALIA | | TELEPHONE |
| |
Domestic (Australia) | | +61 2 9235 0122 |
Global (London) | | +44 207 329 6444 |
| |
DEUTSCHE CAPITAL MARKETS AUSTRALIA1 | | TELEPHONE |
| |
Domestic (Australia) | | +61 2 9258 1444 |
Global (London) | | +44 207 547 1931 |
| |
MACQUARIE BANK LTD | | TELEPHONE |
| |
Domestic (Australia) | | +61 2 8232 3333 |
Global (London) | | +44 207 065 2100 |
| |
NATIONAL AUSTRALIA BANK LTD | | TELEPHONE |
| |
Domestic (Australia) | | +61 2 9295 1166 |
Global (London) | | +44 207 710 2916 |
| |
ROYAL BANK OF CANADA | | TELEPHONE |
| |
Domestic (Australia) | | +61 2 9033 3222 |
Global (London) | | +44 207 029 7056 |
| |
TORONTO DOMINION BANK | | TELEPHONE |
| |
Domestic (Australia) | | +61 2 9619 8866 |
Global (London) | | +44 207 653 4000 |
| |
UBS AG2 | | TELEPHONE |
| |
Domestic (Australia) | | +61 2 9324 2222 |
Global (London) | | +44 207 567 4750 |
| |
WESTPAC BANKING CORPORATION | | TELEPHONE |
| |
Domestic (Australia) | | +61 2 8204 2740 |
Global (London) | | +44 207 621 7620 |
| |
QTC TREASURY NOTE FACILITY DEALER PANEL | | |
| |
PANEL MEMBERS | | TELEPHONE |
| |
Australia and New Zealand Banking Group Ltd | | +61 7 3228 3034 |
Commonwealth Bank of Australia Ltd (Sydney) | | +61 2 9221 4099 |
Deutsche Bank AG (Sydney) | | +61 2 9258 1444 |
Macquarie Bank Ltd (Sydney) | | +61 2 8232 3333 |
National Australia Bank Ltd (Sydney) | | +61 2 9295 1133 |
Westpac Banking Corporation Ltd (Sydney) | | +61 2 9283 4133 |
| |
MULTICURRENCY US COMMERCIAL PAPER FACILITY DEALER PANEL | | |
| |
PANEL MEMBERS | | TELEPHONE |
| |
Citigroup Global Markets Inc (New York) | | +1 212 723 6252 |
Credit Suisse (New York) | | +1 212 325 3358 |
Deutsche Bank Securities (New York) | | +1 212 250 7179 |
| |
MULTICURRENCY EURO COMMERCIAL PAPER FACILITY DEALER PANEL | | |
| |
PANEL MEMBERS | | TELEPHONE |
| |
Barclays Bank Plc (London) | | +44 207 623 2323 |
Citigroup International Plc (Hong Kong)3 | | +852 2501 2690 |
Deutsche Bank AG (London) | | +65 6 883 0808 |
National Australia Bank Limited (Hong Kong & London) | | +852 2526 5891 |
RBC Capital Markets (Hong Kong & London) | | +44 207 653 4000 |
UBS Ltd (London) | | +44 207 567 2477 |
| |
MULTICURRENCY EURO MEDIUM-TERM NOTE FACILITY DEALER PANEL4 | | |
| |
PANEL MEMBERS | | TELEPHONE |
| |
Includes all Domestic and Global A$ Bond Facility | | |
Distribution Group5, and | | |
Nomura International Plc (London) | | +44 207 521 2000 |
| |
MULTICURRENCY US MEDIUM-TERM NOTE FACILITY DEALER PANEL6 | | |
| |
PANEL MEMBERS | | TELEPHONE |
| |
ABN AMRO Incorporated (London) | | +44 207 588 4079 |
Citigroup (New York) | | +1 212 723 6175 |
Deutsche Bank Securities Inc (New York)7 | | +1 212 469 7500 |
RBC Capital Markets (New York) | | +1 212 858 7380 |
1 | Lead Manager – United States |
4 | Reverse inquiry also permitted |
5 | Lead Arranger – UBS Ltd (London) |
6 | Reverse inquiry also permitted |
2006-2007 ANNUAL REPORT B 1
Appendix B: Partners in Financial Markets
30 June 2007 (continued)
| | | | | | |
ISSUING AND PAYING AGENTS FOR QTC | | | | | | |
| | | CONTACT | | TELEPHONE | | FACSIMILE |
AUD TREASURY NOTES | | | | | | |
Austraclear Services Ltd Sydney | | Help Desk | | 1300 362 257 | | +61 2 9256 0456 |
| | | |
AUD DOMESTIC BONDS | | | | | | |
Computershare Investor Services Ltd | | Markings /Transfers | | +61 3 9415 5000 (EXT 5672) | | +61 3 9473 2594 |
| | | |
AUD GLOBAL BONDS | | | | | | |
Deutsche Bank Trust Company Americas | | Client Services | | +1 615 835 2729 | | +1 615 835 2728 |
| | | | +1 615 835 2727 | | +1 615 835 2730 |
| | | |
EURO COMMERCIAL PAPER | | | | | | |
Deutsche Bank AG, London | | Client Services | | +44 207 547 7608 | | +44 207 547 0580 |
| | | | +44 207 547 3665 | | |
| | | |
USD COMMERCIAL PAPER | | | | | | |
Deutsche Bank Trust Company Americas | | Client Services | | +1 908 608 3153 | | +1 732 578 4635 |
| | | |
EURO MEDIUM-TERM NOTES | | | | | | |
Deutsche Bank AG, London | | Client Services | | +44 207 547 7608 | | +44 207 547 0580 |
| | | | +44 207 547 3665 | | |
| | | |
USD MEDIUM-TERM NOTES | | | | | | |
Deutsche Bank Trust Company Americas | | Client Services | | +1 908 608 3153 | | +1 732 578 4635 |
B 2 QUEENSLAND TREASURY CORPORATION
Appendix C: Statutory Disclosure Statements
Overseas travel
QTC raises some of its capital requirements in offshore financial markets. From time to time, these markets are visited by Board directors and officers to transact business on behalf of QTC. All overseas travel is undertaken in accordance with the Overseas Travel Guidelines endorsed by Queensland Cabinet.
In the year under review, international travel included:
| | | | | | |
OFFICER | | COUNTRY/S VISITED | | PERIOD | | PURPOSE OF VISIT |
| Portfolio Manager, Financial Markets | | Japan, China, Germany, United Kingdom, United States of America | | 30 August– 10 September 2006 | | Participated in Deutsche Bank’s Annual International Investor Mission, which involved meetings with offshore central banks, policy authorities and leading international financial market figures, providing opportunities to develop a greater understanding and awareness of major factors (political, economic, credit and market) affecting investment fundamentals and world financial markets. |
| | | |
| Deputy Premier and Treasurer, Deputy Premier’s Senior Policy Advisor, Under Treasurer, Chairman, Chief Executive, General Manager, Financial Markets | | China, Japan, United Kingdom, Germany, Switzerland, United States of America | | 17–30 October 2006 | | Conducted QTC’s Global A$ Fixed Interest Distribution Group and Institutional Investor Relations Roadshow Program, involving meetings with QTC’s A$ Global Distribution Group and prime financial institutions, to promote Queensland’s fiscal and economic management and strengths, and QTC’s A$ Global Bonds and other funding facilities. |
| | | |
| Senior Portfolio Manager | | Japan | | 8–11 November 2006 | | Participated in Daiwa Securities SMBC Co Capital Markets Seminar which included representation from all of Australia’s semi-government authorities, and sovereign bond issuers from both Australia and other jurisdictions. |
| | | |
| Senior Portfolio Manager, Financial Markets and Portfolio Manager, Financial Markets | | Hong Kong, Singapore | | 11–17 February 2007 | | Conducted the annual performance and activities review of QTC’s Euro Commercial Paper Dealer Panel, to evaluate the banks’ performance and management of QTC’s Euro Commercial Paper Facility. |
| | | |
| General Manager, Financial Markets and Portfolio Manager, Financial Markets | | Japan, United Kingdom, United States of America | | 17–26 February 2007 | | Conducted the annual performance and activities review of QTC’s (offshore) Global Fixed Interest Distribution Group to evaluate the banks’ performance, strengths and their commitment and support for QTC’s A$ Global Bonds and other funding facilities. |
| | | |
| Chief Financial Officer | | New Zealand | | 21–23 March 2007 | | Attended the annual Australian State, and New Zealand, Central Financing Authorities’ Chief Financial Officers’ Conference to discuss general accounting issues, treasury management systems, strategic initiatives, business continuity management and performance benchmarking. |
| | | |
| Portfolio Manager | | Japan | | 15–22 April 2007 | | Participated in the Nomura Central Bankers Seminar involving presentations by senior Japanese government officials and Nomura market economists and analysts, on the current state of the Japanese economy and financial markets. |
| | | |
| Chairman, Chief Executive | | United States of America | | 3–9 May 2007 | | Hosted a QTC Institutional Investor presentation with the Queensland Premier, and conducted meetings with various financial institutions that are either current or potential investors in QTC’s Bond and Securities programs. |
| | | |
| Deputy Premier and Treasurer, Deputy Premier’s Senior Policy Advisor, Under Treasurer, Chairman, Chief Executive, General Manager, Financial Markets | | Hong Kong, Japan, United Kingdom, Switzerland, France, Poland, United States of America | | 17–30 June 2007 | | Conducted QTC’s Global A$ Fixed Interest Distribution Group and Institutional Investor Relations Roadshow Program, involving meetings with QTC’s A$ Global Distribution Group and prime financial institutions, to promote Queensland’s fiscal and economic management and strengths, and QTC’s A$ Global Bonds and other funding facilities. |
2006-2007 ANNUAL REPORT C 1
Appendix C: Statutory Disclosure Statements (continued)
Public Sector Ethics Act Implementation Statement
QTC provides the following information pursuant to obligations under section 23 of the Public Sector Ethics Act 1994 (Qld) to report on action taken to comply with certain sections of the Act.
QTC employees are required to comply with QTC’s Code of Conduct for employees (which sets out the ethics principles and obligations under the Public Sector Ethics Act) as well the Code of Conduct established by the Australian Financial Markets Association, of which QTC is a member. Both codes are available electronically to employees through QTC’s in-house information management system. Copies of these codes can be inspected by contacting QTC’s Human Resources Team (see inside back cover for contact details).
Training is provided for new employees on ethical obligations as part of QTC’s induction process. QTC has recently provided training for staff about the importance of an ethical culture.
Public Records Act Implementation Statement
During the year, QTC also progressed compliance with the provisions of the Public Records Act 2002 and the implementation of Information Standard
40: Recordkeeping. The focus for QTC has been on the management of its hard copy records (since QTC has an existing electronic in-house information management system). QTC expects to complete the project (with respect to hard copy records) by the end of 2007 and anticipates achieving additional business benefit, through the efficient and effective management of corporate records.
Whistleblowers Protection Act 1994
Section 30(1) of the Whistleblowers Protection Act 1994 requires QTC to disclose, in its Annual Report, statistical information for the report period in respect of each type of information received about the number of disclosures received and the number of disclosures substantially verified.
During the year under review, QTC has not received, nor had to substantially verify, any disclosures.
C 2 QUEENSLAND TREASURY CORPORATION
Corporate Directory
Queensland Treasury Corporation
LEVEL 14, 61 MARY STREET, BRISBANE QUEENSLAND AUSTRALIA
GPO BOX 1096, BRISBANE QUEENSLAND AUSTRALIA 4001
TELEPHONE: +61 7 3842 4600
FACSIMILE: +61 7 3221 4122
INTERNET: www.qtc.qld.gov.au
Queensland Treasury Corporation’s annual and half-yearly reports are available on QTC’s website: www.qtc.qld.gov.au. If you would like a report posted to you, please call 61 7 3842 4600. If you would like to comment on our Annual Report, please visit our website and complete the feedback form, which can be downloaded from the home page.
| | |
| EXECUTIVE | | |
| |
| TELEPHONE: +61 7 3842 4611 | | FACSIMILE: +61 7 3210 0262 |
| |
| TEAMS | | |
| |
FINANCIAL MARKETS TELEPHONE: +61 7 3842 4789 | | FACSIMILE: +61 7 3221 2410 |
| |
MARKET SUPPORT (SETTLEMENTS) TELEPHONE: +61 7 3842 4644 | | FACSIMILE: +61 7 3221 2486 |
| |
STOCK REGISTRY SERVICES (COMPUTER SHARE) TELEPHONE: 1800 777 166 | | FACSIMILE: +61 3 9473 2531 |
| |
GOVERNMENT DEPARTMENTS AND AGENCIES TELEPHONE: +61 7 3842 4715 | | FACSIMILE: +61 7 3211 3629 |
| |
GOVERNMENT OWNED CORPORATIONS TELEPHONE: +61 7 3842 4715 | | FACSIMILE: +61 7 3211 3629 |
| |
TREASURY SERVICES TELEPHONE: +61 7 3842 4715 | | FACSIMILE: +61 7 3211 3629 |
| |
LOCAL GOVERNMENT AND REGIONAL QUEENSLAND TELEPHONE: +61 7 3842 4715 | | FACSIMILE: +61 7 3842 4958 |
| |
LG INFRASTRUCTURE SERVICES TELEPHONE: +61 7 3842 4700 | | |
| |
CUSTOMER SUPPORT (TRANSACTIONS) TELEPHONE: +61 7 3842 4650 | | FACSIMILE: +61 7 3221 2486 |
| |
LEASING TELEPHONE: +61 7 3842 4648 | | FACSIMILE: +61 7 3842 4927 |
| |
CORPORATE SERVICES TELEPHONE: +61 7 3842 4872 | | FACSIMILE: +61 7 3221 4122 |
| |
CORPORATE ACCOUNTING TELEPHONE: +61 7 3842 4630 | | FACSIMILE: +61 7 3221 4122 |
| |
LEGAL AND COMPLIANCE TELEPHONE: +61 7 3842 4739 | | FACSIMILE: +61 7 3236 9031 |
| |
INFORMATION TECHNOLOGY TELEPHONE: +61 7 3842 4641 | | FACSIMILE: +61 7 3210 1198 |
| |
HUMAN RESOURCES TELEPHONE: +61 7 3842 4612 | | FACSIMILE: +61 7 3210 2358 |
| |
CORPORATE COMMUNICATION TELEPHONE: +61 7 3842 4685 | | FACSIMILE: +61 7 3211 3629 |