EXHIBIT (c)(vi)
Report Entitled “Queensland’s 2007-08 Mid Year Fiscal and Economic Review.”
1

[LOGO]
STATE BUDGET
2007-08
MID YEAR FISCAL AND ECONOMIC REVIEW
3
BACKGROUND
The Mid Year Fiscal and Economic Review (MYFER) is required under the Government’s Charter of Social and Fiscal Responsibility and the Australian Loan Council’s Uniform Presentation Framework.
The MYFER provides an update of the fiscal and economic outlook for Queensland. The fiscal data is prepared on a Government Finance Statistics basis and includes revised operating statements, balance sheets and cash flow statements for the General Government, Public Non-financial Corporations and Non-financial Public sectors.
The MYFER presents revised fiscal estimates for the current Budget year and the three following years. These revised estimates take into account fiscal and economic developments since the preparation of the 2007-08 Budget.
The MYFER also includes a revised estimate of the Loan Council Allocation.
ECONOMIC CONDITIONS AND OUTLOOK
The outlook for the Queensland economy in 2007-08 is slightly stronger than forecast at Budget time. Overall growth of 5 1/4% is now anticipated, compared with an initial forecast of 5%. Private and public sector investment is forecast to continue to rise, while export growth is expected to strengthen further. However, household spending is anticipated to return as the main driver of growth, reflecting ongoing strong growth in employment and wages and renewed momentum in housing activity. Queensland economic growth is expected to exceed that nationally for the twelfth successive year, with Australian Treasury forecasting 4 1/4% nationally for 2007-08 which was revised up by a half of a percentage point in the Mid Year Economic and Fiscal Outlook.
Economic growth1
(annual % change, CVM)
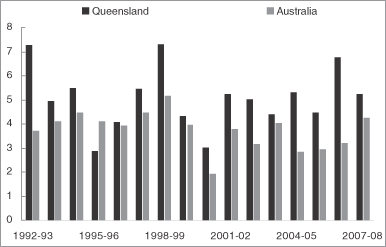
| Sources: | OESR Queensland State Accounts and ABS 5204.0 |
4
The resident population in Queensland is now forecast to grow by 2 1/4% in 2007-08, compared with a Budget forecast of 2%. Queensland’s interstate migration had been easing from a peak reached during the housing boom in 2003, where lower house prices in Brisbane relative to Sydney had encouraged interstate migrants north. However, interstate and overseas migration have begun to rise again in recent quarters.
Major Queensland Economic Parameters1
| | | | | | |
| | | Outcome
2006-07 | | Budget
Forecast
2007-08 | | MYFER
Forecast
2007-08 |
| | | % | | % | | % |
Gross state product2 | | 6.8 | | 5 | | 5 1/4 |
Employment | | 4.6 | | 3 | | 3 |
Unemployment rate (year average) | | 4.0 | | 4 | | 4 |
Inflation | | 3.3 | | 2 3/4 | | 2 3/4 |
Labour price index | | 4.5 | | 4 1/4 | | 4 1/4 |
Population | | 2.2 | | 2 | | 2 1/4 |
Notes:
| 1. | Figures not quoted as a fraction are an actual outcome |
| 2. | Chain volume measure, 2004-05 reference year |
| Sources: | OESR Queensland State Accounts; ABS 3101.0, 6202.0, 6345.0 and 6401.0 |
Other changes in conditions since Budget time are likely to be largely offsetting in terms of their impact on economic growth. In particular, stronger business investment growth is likely to be offset by higher than expected growth in imports in 2007-08.
Business investment in 2007-08 is anticipated to grow at a slightly faster rate than the 8 3/4% forecast at Budget time. A significant amount of work yet to be done and growth in corporate profits are expected to more than offset any adverse impact from a slight rise in borrowing costs since the August fall-out in the US sub-prime mortgage crisis. The value of non-residential and engineering construction work yet to be done reached another high in June quarter 2007. The latest Access Economics Investment Monitor also showed the value of known projects under construction or planned in Queensland rose $10 billion, to reach $121.9 billion in September quarter 2007, with Queensland recording the highest value of non-mining projects of any state.
Offsetting this, imports growth is expected to be higher than the 5 1/2% forecast in the Budget. This partly reflects the upgraded investment outlook, given most machinery and equipment is imported. Further, the recent appreciation in the A$ is expected to drive faster growth in imports of consumer durables and capital goods. While the A$ was forecast to depreciate slightly at Budget time, a widening interest rate differential has seen the A$ rise from US82c in May, to around US88c by mid December 2007.
At the time of the State Budget, key external risks to the economic outlook related to global economic growth, commodity prices and the exchange rate, while interest rates and seasonal conditions represented key domestic influences. Some of these risks have dissipated since Budget time. For instance, weather conditions in the first half of 2007-08 have proven more favourable than in previous years, which should see the assumed rebound in agricultural production and exports eventuate in coming years.
Risks that have become heightened since Budget time reflect interest rate settings and the US sub-prime mortgage crisis. Official interest rates in Australia were assumed to be unchanged at Budget time, but have since been raised in August and November 2007, as underlying inflation reached the top end of the RBA’s 2-3% target band. Any further rise in interest rates may impact on household related spending in the second half of 2007-08. Similarly, if the housing-led slowdown in US economic growth translates into a broader slowdown in the world economy, overall exports may be affected. However, to date, downgrades to US forecasts have been largely offset by an upgraded outlook for emerging Asia (India and China), such that overall growth in Queensland’s major trading partners is unlikely to slow considerably in 2008.
5
FISCAL OUTLOOK
General Government Sector
Key Financial Aggregates
| | | | | | | | | | | | | | | |
| | | 2007-08
Budget | | | 2007-08
Revised | | | 2008-09
Projection | | | 2009-10
Projection | | | 2010-11
Projection | |
| | | $ million | | | $ million | | | $ million | | | $ million | | | $ million | |
Revenue | | 32,551 | | | 33,342 | | | 34,205 | | | 35,550 | | | 37,345 | |
Expenses | | 32,282 | | | 33,129 | | | 34,049 | | | 35,377 | | | 37,137 | |
Net operating balance | | 268 | | | 213 | | | 156 | | | 172 | | | 208 | |
Cash surplus/(deficit) | | (892 | ) | | (2,481 | ) | | (1,983 | ) | | (1,857 | ) | | (1,831 | ) |
Capital purchases | | 5,463 | | | 5,888 | | | 5,927 | | | 5,920 | | | 5,958 | |
Net borrowing | | 3,569 | | | 4,427 | | | 3,940 | | | 3,498 | | | 3,576 | |
Net worth | | 119,799 | | | 124,642 | | | 129,608 | | | 133,512 | | | 137,659 | |
Operating Balance
The General Government sector is expecting to record operating surpluses in 2007-08 and the forward estimate years. A revised operating balance of $213 million is expected for 2007-08. This is $55 million lower than the $268 million anticipated at the time of the Budget. This is largely being driven by actuarial adjustments to superannuation and increased community service obligation payments for electricity rather than spending on new policy initiatives.
The 2007-08 estimated surplus is based on a 7.5% investment return on long-term financial assets held to meet future liabilities such as superannuation. Equity markets have shown substantial volatility this financial year, with returns currently below the long-run average. The return assumption is not changed mid year given the high level of uncertainty attached to estimating full financial year outcomes. This remains a key fiscal risk given the practice of including the returns in the General Government sector, which is under review.
The forecast surpluses for the outyears are expected to moderate across the forward estimates. The increase in expenditure relative to 2007-08 primarily relates to increases in wages, the implementation of service enhancements across key service delivery agencies and recurrent expenditure in support of the State’s capital program.
Taxation revenue is forecast to continue to grow over the forward estimates, moderated by the phased abolition of a number of state taxes including 50% of mortgage duty from 1 January 2008.
Expenses in 2007-08 are expected to be $847 million higher than the Budget estimate. This primarily reflects:
| | • | | actuarial revisions to superannuation and long service leave estimates |
| | • | | increased community service obligation payments, in particular to Ergon, to meet the impact of the increased cost of supplying electricity to regional Queensland at the uniform price tariffs |
| | • | | funding for service delivery improvements including for elective surgery and patient demand; for an increased number of apprenticeship and trades training places; for Disability Services Queensland to meet the increased demand for services in emergency and crisis situations; and for the Queensland Housing Affordability Strategy. |
These increases are partially offset by reduced capital transfers given an earlier than expected payment from the Australian Government in relation to the Western Corridor Recycled Water project. This payment was receipted and expended in 2006-07.
6
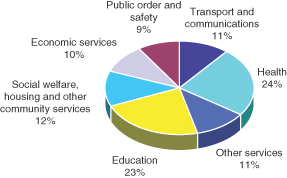
General Government expenditure is focused on the delivery of core services to the community. As shown in the following chart, Education and Health account for the largest share of expenses.
Revenues in 2007-08 are expected to be $791 million higher than the Budget estimate. This is primarily due to:
| | • | | upward revisions to taxation estimates, particularly payroll tax and transfer duty, due to the continuing strength of the economy and the property market, partially offset by a decline in royalty revenue, in particular coal royalties |
| | • | | an increased GST pool with Queensland’s share benefiting from the stronger than expected population growth, noting that it is expected that Queensland will become a net donor state when relativities are updated in early 2008 |
| | • | | higher than expected sales of goods and services. |
7
Taxation and Royalty Revenue1
| | | | |
| | | 2007-08
Budget | | 2007-08
Revised |
| | | $ million | | $ million |
Payroll Tax | | 2,411 | | 2,486 |
| | |
Duties | | | | |
Transfer | | 2,842 | | 3,200 |
Vehicle Registration | | 385 | | 395 |
Insurance2 | | 393 | | 378 |
Mortgages | | 300 | | 340 |
Other Duties3 | | 14 | | 14 |
Total Duties | | 3,935 | | 4,327 |
| | |
Gambling Taxes and Levies4 | | | | |
Gaming Machine Tax and Levies5 | | 548 | | 557 |
Lotteries Taxes | | 208 | | 208 |
Wagering Taxes | | 37 | | 34 |
Casino Taxes and Levies | | 61 | | 58 |
Keno Tax | | 15 | | 15 |
Total Gambling Taxes and Levies | | 868 | | 872 |
| | |
Other Taxes | | | | |
Land Tax | | 622 | | 625 |
Motor Vehicle Registration | | 900 | | 926 |
Fire Levy | | 264 | | 264 |
Community Ambulance Cover | | 128 | | 128 |
Guarantee Fees | | 83 | | 77 |
Other Taxes | | 61 | | 61 |
| | |
Total Taxation | | 9,272 | | 9,765 |
| | |
Royalties | | | | |
Coal | | 1,020 | | 884 |
Other Royalties and Land Rents | | 416 | | 389 |
Total Royalties | | 1,436 | | 1,273 |
Notes:
| 1. | Numbers may not add due to rounding |
| 2. | Includes accident insurance premiums |
| 3. | Includes life insurance premiums |
| 4. | Includes community benefit levies |
| 5. | Includes the Health Services Levy |
8
Cash Surplus/(Deficit)
A cash deficit of $2.481 billion is expected in 2007-08, a $1.589 billion increase in the deficit since Budget. This revised position reflects the smaller than projected operating surpluses, a reallocation of cash from “other receipts” to “payments for investments for policy purposes” as a result of a technical adjustment relating to the sale of the Government’s retail energy businesses and Allgas and increased capital spending (see following discussion on Capital Purchases and Borrowing).
Through the Queensland Future Growth Fund, the Government has cash invested with the Queensland Treasury Corporation which has been quarantined for use on nominated projects.
Capital Purchases and Borrowing
Purchases of non-financial assets (i.e. capital expenditure) are expected to rise to $5.888 billion in 2007-08, $425 million higher than was anticipated at the time of the 2007-08 Budget. Increased capital expenditure is mostly in the areas of education, transport and roads, health, police and corrective services.
Over the period 2007-08 to 2010-11, purchases of non-financial assets in the General Government sector of $23.693 billion are planned. This is $545 million higher than anticipated at the time of the 2007-08 Budget.
Borrowing for capital purposes is consistent with the Government’s fiscal principles. Net borrowings of $4.427 billion are expected in 2007-08, an increase of $858 million over the 2007-08 Budget estimate. This increase is primarily due to a change in timing of borrowings from 2006-07 to 2007-08 and increased capital spending.
Despite the increase in capital expenditure over 2007-08 and the forward estimates, borrowing over this period is expected to be $617 million lower than anticipated at the time of the 2007-08 Budget as a result of stronger than anticipated cash flows. Interest expense on these borrowings is expected to remain around the same levels predicted at the time of the 2007-08 Budget. Interest expense as a proportion of General Government revenue remains modest at 1.2% in 2007-08 rising moderately to 3% by 2010-11.
Gross borrowings of $6.536 billion are expected by the end of 2007-08, $175 million less than anticipated at Budget time due primarily to the lower than expected borrowings in 2006-07.
Net Worth
Net worth is projected to increase from the 2006-07 actual by $6.811 billion to $124.642 billion at 30 June 2008. This is $4.843 billion higher than anticipated at the time of the 2007-08 Budget. This increase in net worth reflects the flow through of final 2006-07 balance sheet outcomes particularly in relation to the revaluation of land and other fixed assets.
Net Debt
Net debt is the most common measure used to judge the overall strength of a jurisdiction’s fiscal position. High levels of net debt impose a call on future revenue flows to service that debt and can limit government flexibility to adjust outlays.
In 2007-08, net debt is forecast to improve from negative $24.709 billion anticipated at Budget time to negative $25.226 billion.
Queensland’s negative net debt of $5,980 per capita in 2007-08 compares to the average net debt of $495 per capita of the other states.
9
Meeting the Government’s Fiscal Commitments
The Government is again expecting to meet all of its fiscal commitments under the Charter of Social and Fiscal Responsibility:
Achievement of Fiscal Principles of the Queensland Government—2007-08
| | | | |
| |
Principle | | Achievement | | Indicator |
Competitive tax environment | | | | |
| The Government will ensure that State taxes and charges remain competitive with the other states and territories in order to maintain a competitive tax environment for business development and jobs growth. | | ü | | Taxation revenue per capita: Qld $2,315, average of other states and territories $2,3601 |
| | |
Affordable service provision | | | | |
| The Government will ensure that its level of service provision is sustainable by maintaining an overall General Government operating surplus, as measured in Government Finance Statistics terms. | | ü | | GFS operating surplus of $213 million |
| | |
Sustainable borrowings for capital investment | | | | |
| Borrowings or other financial arrangements will only be undertaken for capital investments and only where these can be serviced within the operating surplus, consistent with maintaining a AAA credit rating. | | ü | | GG total purchases of non-financial assets: $5.888 billion GG net borrowings: $4.427 billion AAA credit rating confirmed by Moody’s and Standard & Poor’s (highest rating available) |
| | |
Prudent management of financial risk | | | | |
| The Government will ensure that the State’s financial assets cover all accruing and expected future liabilities of the General Government sector. | | ü | | GG net financial worth: $24.009 billion |
| | |
Building the State’s net worth | | | | |
| The Government will maintain and seek to increase Total State net worth. | | ü | | GG net worth expected to increase by $6.811 billion during 2007-08 |
| 1. | 2007-08 data. Queensland: Mid Year Fiscal and Economic Review, all other jurisdictions: State Budgets, population estimates are consistent with the Australian Government’s Mid Year Economic and Fiscal Outlook, 2007-08. It is expected that a number of other jurisdictions will also upwardly revise their taxation estimates in their mid year review processes. This would result in a widening of the gap between Queensland’s taxation per capita and the national average. |
Public Non-Financial Corporations Sector
The Public Non-financial Corporations (PNFC) sector is projected to have a GFS net operating surplus of $319 million in 2007-08, a marginal decrease ($41 million) from the Budget estimate.
Capital spending in the PNFC sector has been revised upwards in 2007-08 and the outyears. Capital spending over this period is expected to total $30.303 billion, $5.807 billion more than was anticipated at the time of the 2007-08 Budget. This increase largely reflects the timing of cash payments for capital works, additional rail expenditure by Queensland Rail (including to support coal exports) and finalisation of scope and cost estimates for key south east Queensland drought response projects.
10
Net borrowing in this sector is expected to increase to $5.173 billion in 2007-08, $740 million more than anticipated at the time of the 2007-08 Budget. This increase primarily reflects the higher than expected capital spend in 2007-08. Net borrowing across 2007-08 and the outyears is expected to be $4.639 billion more than was anticipated at Budget time.
A cash deficit of $7.562 billion is expected in 2007-08, with the deficit $1.344 billion higher than anticipated at Budget time and is reflective of the increased forecast capital spend.
The net worth of the sector is expected to increase over the 2006-07 actual by $2.079 billion to $22.727 billion, but is $689 million less than forecast at the time of the 2007-08 Budget. This reduction is reflective of the reduced 2006-07 net worth position which was impacted by the accounting treatment of electricity hedge positions associated with the high wholesale electricity prices experienced towards the end of the 2006-07 financial year.
Gross borrowings projected for the end of 2007-08 are only marginally more ($76 million) than anticipated at the time of the 2007-08 Budget.
11
General Government Sector Operating Statement1
| | | | | | | | | | | | | | | | | |
| | | | | 2007-08
Budget2 | | | 2007-08
Revised | | | 2008-09
Projection | | | 2009-10
Projection | | | 2010-11
Projection | |
| | | | | $ million | | | $ million | | | $ million | | | $ million | | | $ million | |
| | GFS Revenue | | | | | | | | | | | | | | | |
| | Taxation revenue | | 9,272 | | | 9,765 | | | 10,587 | | | 11,301 | | | 12,155 | |
| | Current grants and subsidies | | 13,726 | | | 14,067 | | | 14,209 | | | 14,662 | | | 15,217 | |
| | Capital grants | | 1,428 | | | 1,003 | | | 1,121 | | | 898 | | | 913 | |
| | Sales of goods and services | | 3,005 | | | 3,214 | | | 3,276 | | | 3,314 | | | 3,424 | |
| | Interest income | | 2,190 | | | 2,236 | | | 2,354 | | | 2,458 | | | 2,570 | |
| | Other | | 2,931 | | | 3,056 | | | 2,658 | | | 2,917 | | | 3,067 | |
| | Total Revenue | | 32,551 | | | 33,342 | | | 34,205 | | | 35,550 | | | 37,345 | |
| | | | | | |
Less | | GFSExpenses | | | | | | | | | | | | | | | |
| | Gross operating expenses | | | | | | | | | | | | | | | |
| | Employee expenses | | 14,271 | | | 14,452 | | | 15,585 | | | 16,533 | | | 17,377 | |
| | Other operating expenses | | 6,200 | | | 6,611 | | | 6,387 | | | 6,358 | | | 6,559 | |
| | Depreciation | | 2,015 | | | 2,064 | | | 2,321 | | | 2,367 | | | 2,533 | |
| | Superannuation interest expense | | 969 | | | 1,180 | | | 1,245 | | | 1,310 | | | 1,371 | |
| | Other interest expense | | 390 | | | 402 | | | 650 | | | 928 | | | 1,106 | |
| | Current transfers | | 6,761 | | | 7,084 | | | 7,073 | | | 7,133 | | | 7,447 | |
| | Capital transfers | | 1,676 | | | 1,337 | | | 789 | | | 749 | | | 743 | |
| | Total Expenses | | 32,282 | | | 33,129 | | | 34,049 | | | 35,377 | | | 37,137 | |
| | | | | | |
Equals | | GFS net operating balance | | 268 | | | 213 | | | 156 | | | 172 | | | 208 | |
| | | | | | |
Less | | Net acquisition of non-financial assets | | | | | | | | | | | | | | | |
| | Purchases of non-financial assets | | 5,463 | | | 5,888 | | | 5,927 | | | 5,920 | | | 5,958 | |
| | Sales of non-financial assets | | (331 | ) | | (345 | ) | | (315 | ) | | (254 | ) | | (311 | ) |
| | Less Depreciation | | 2,015 | | | 2,064 | | | 2,321 | | | 2,367 | | | 2,533 | |
| | Plus Change in inventories | | 62 | | | 76 | | | 76 | | | 42 | | | (8 | ) |
| | Plus Other movements in non-financial assets | | (134 | ) | | (42 | ) | | 15 | | | 15 | | | 15 | |
| | Equals Total net acquisition of non-financial assets | | 3,045 | | | 3,513 | | | 3,383 | | | 3,355 | | | 3,121 | |
| | | | | | |
Equals | | GFS Net lending / (borrowing) (Fiscal Balance) | | (2,777 | ) | | (3,300 | ) | | (3,227 | ) | | (3,183 | ) | | (2,913 | ) |
Note:
| 1. | Numbers may not add due to rounding |
| 2. | Numbers have been restated where subsequent changes in classification have occurred |
12
Public Non-financial Corporations Sector Operating Statement1
| | | | | | | | | | | | | | | | | |
| | | | | 2007-08
Budget | | | 2007-08
Revised | | | 2008-09
Projection | | | 2009-10
Projection | | | 2010-11
Projection | |
| | | | | $ million | | | $ million | | | $ million | | | $ million | | | $ million | |
| | GFS Revenue | | | | | | | | | | | | | | | |
| | Current grants and subsidies | | 1,699 | | | 1,983 | | | 1,769 | | | 1,775 | | | 1,897 | |
| | Capital grants | | 417 | | | 421 | | | 11 | | | — | | | — | |
| | Sales of goods and services | | 6,570 | | | 7,098 | | | 8,073 | | | 8,678 | | | 9,440 | |
| | Interest income | | 78 | | | 112 | | | 92 | | | 100 | | | 109 | |
| | Other | | 428 | | | 356 | | | 315 | | | 374 | | | 330 | |
| | Total Revenue | | 9,192 | | | 9,970 | | | 10,259 | | | 10,927 | | | 11,776 | |
| | | | | | |
Less | | GFS Expenses | | | | | | | | | | | | | | | |
| | Gross operating expenses | | | | | | | | | | | | | | | |
| | Employee expenses | | 2,199 | | | 2,296 | | | 2,439 | | | 2,594 | | | 2,748 | |
| | Other operating expenses | | 2,559 | | | 2,968 | | | 3,135 | | | 3,192 | | | 3,182 | |
| | Depreciation | | 1,726 | | | 1,707 | | | 1,940 | | | 2,163 | | | 2,326 | |
| | Other interest expense | | 1,240 | | | 1,378 | | | 1,749 | | | 2,002 | | | 2,081 | |
| | Other property expenses | | 1,084 | | | 1,246 | | | 928 | | | 989 | | | 1,372 | |
| | Current transfers | | 12 | | | 13 | | | 2 | | | 2 | | | 2 | |
| | Capital transfers | | 12 | | | 43 | | | — | | | — | | | — | |
| | Total Expenses | | 8,832 | | | 9,651 | | | 10,194 | | | 10,943 | | | 11,710 | |
| | | | | | |
Equals | | GFS net operating balance | | 360 | | | 319 | | | 65 | | | (16 | ) | | 66 | |
| | | | | | |
Less | | Net acquisition of non-financial assets | | | | | | | | | | | | | | | |
| | Purchases of non-financial assets | | 7,919 | | | 9,923 | | | 8,425 | | | 6,603 | | | 5,352 | |
| | Sales of non-financial assets | | (84 | ) | | (26 | ) | | (30 | ) | | (21 | ) | | (37 | ) |
| | Less Depreciation | | 1,726 | | | 1,707 | | | 1,940 | | | 2,163 | | | 2,326 | |
| | Plus Change in inventories | | 29 | | | 141 | | | 108 | | | 18 | | | 15 | |
| | Plus Other movements in non-financial assets | | (12 | ) | | (43 | ) | | — | | | — | | | — | |
| | Equals Total net acquisition of non-financial assets | | 6,126 | | | 8,287 | | | 6,562 | | | 4,437 | | | 3,004 | |
| | | | | | |
Equals | | GFS Net lending / (borrowing) (Fiscal Balance) | | (5,767 | ) | | (7,968 | ) | | (6,496 | ) | | (4,452 | ) | | (2,938 | ) |
Note:
| 1. | Numbers may not add due to rounding |
13
Non-financial Public Sector Operating Statement1
| | | | | | | | | | | | | | | | | |
| | | | | 2007-08
Budget2 | | | 2007-08
Revised | | | 2008-09
Projection | | | 2009-10
Projection | | | 2010-11
Projection | |
| | | | | $ million | | | $ million | | | $ million | | | $ million | | | $ million | |
| | GFS Revenue | | | | | | | | | | | | | | | |
| | Taxation revenue | | 9,126 | | | 9,598 | | | 10,399 | | | 11,095 | | | 11,933 | |
| | Current grants and subsidies | | 13,742 | | | 14,079 | | | 14,211 | | | 14,675 | | | 15,229 | |
| | Capital grants | | 1,422 | | | 1,406 | | | 1,119 | | | 895 | | | 911 | |
| | Sales of goods and services | | 9,401 | | | 10,141 | | | 11,179 | | | 11,832 | | | 12,708 | |
| | Interest income | | 2,267 | | | 2,348 | | | 2,445 | | | 2,558 | | | 2,679 | |
| | Other | | 2,272 | | | 2,164 | | | 2,042 | | | 2,300 | | | 2,023 | |
| | Total Revenue | | 38,230 | | | 39,737 | | | 41,396 | | | 43,355 | | | 45,483 | |
| | | | | | |
Less | | GFS Expenses | | | | | | | | | | | | | | | |
| | Gross operating expenses | | | | | | | | | | | | | | | |
| | Employee expenses | | 16,471 | | | 16,748 | | | 18,024 | | | 19,127 | | | 20,124 | |
| | Other operating expenses | | 8,436 | | | 9,239 | | | 9,161 | | | 9,182 | | | 9,362 | |
| | Depreciation | | 3,741 | | | 3,771 | | | 4,261 | | | 4,530 | | | 4,859 | |
| | Superannuation interest expense | | 969 | | | 1,180 | | | 1,245 | | | 1,310 | | | 1,371 | |
| | Other interest expense | | 1,630 | | | 1,779 | | | 2,399 | | | 2,930 | | | 3,187 | |
| | Current transfers | | 5,087 | | | 5,124 | | | 5,306 | | | 5,380 | | | 5,571 | |
| | Capital transfers | | 1,267 | | | 1,364 | | | 779 | | | 739 | | | 733 | |
| | Total Expenses | | 37,602 | | | 39,205 | | | 41,174 | | | 43,198 | | | 45,209 | |
| | | | | | |
Equals | | GFS net operating balance | | 628 | | | 532 | | | 221 | | | 157 | | | 274 | |
| | | | | | |
Less | | Net acquisition of non-financial assets | | | | | | | | | | | | | | | |
| | Purchases of non-financial assets | | 13,383 | | | 15,811 | | | 14,352 | | | 12,523 | | | 11,310 | |
| | Sales of non-financial assets | | (415 | ) | | (371 | ) | | (345 | ) | | (276 | ) | | (348 | ) |
| | Less Depreciation | | 3,741 | | | 3,771 | | | 4,261 | | | 4,530 | | | 4,859 | |
| | Plus Change in inventories | | 91 | | | 216 | | | 184 | | | 60 | | | 7 | |
| | Plus Other movements in non-financial assets | | (146 | ) | | (85 | ) | | 15 | | | 15 | | | 15 | |
| | Equals Total net acquisition of non-financial assets | | 9,172 | | | 11,800 | | | 9,944 | | | 7,792 | | | 6,126 | |
| | | | | | |
Equals | | GFS Net lending / (borrowing) (Fiscal Balance) | | (8,543 | ) | | (11,269 | ) | | (9,723 | ) | | (7,635 | ) | | (5,851 | ) |
Note:
| 1. | Numbers may not add due to rounding |
| 2. | Numbers have been restated where subsequent changes in classification have occurred |
14
General Government Sector Balance Sheet1
| | | | | | | | | | | | | | | |
| | | 2007-08
Budget2 | | | 2007-08
Revised | | | 2008-09
Projection | | | 2009-10
Projection | | | 2010-11
Projection | |
| | | $ million | | | $ million | | | $ million | | | $ million | | | $ million | |
Assets | | | | | | | | | | | | | | | |
Financial Assets | | | | | | | | | | | | | | | |
Cash and deposits | | 2,069 | | | 2,582 | | | 2,513 | | | 2,298 | | | 2,262 | |
Advances paid | | 753 | | | 776 | | | 836 | | | 894 | | | 928 | |
Investments, loans and placements | | 29,046 | | | 28,897 | | | 30,379 | | | 32,090 | | | 33,824 | |
Other non-equity assets | | 2,551 | | | 3,105 | | | 3,119 | | | 3,239 | | | 3,563 | |
Equity | | 25,438 | | | 24,495 | | | 25,990 | | | 26,872 | | | 27,802 | |
Total Financial Assets | | 59,857 | | | 59,855 | | | 62,836 | | | 65,392 | | | 68,380 | |
| | | | | |
Non-Financial Assets | | 94,726 | | | 100,634 | | | 107,745 | | | 113,869 | | | 119,814 | |
| | | | | |
Total Assets | | 154,583 | | | 160,488 | | | 170,581 | | | 179,261 | | | 188,193 | |
| | | | | |
Liabilities | | | | | | | | | | | | | | | |
Advances received | | 447 | | | 492 | | | 481 | | | 476 | | | 472 | |
Borrowing | | 6,711 | | | 6,536 | | | 10,530 | | | 14,081 | | | 17,688 | |
Superannuation liability | | 19,955 | | | 21,230 | | | 22,290 | | | 23,295 | | | 24,245 | |
Other employee entitlements and provisions | | 4,386 | | | 4,538 | | | 4,751 | | | 4,970 | | | 5,194 | |
Other non-equity liabilities | | 3,285 | | | 3,049 | | | 2,921 | | | 2,927 | | | 2,936 | |
Total Liabilities | | 34,784 | | | 35,846 | | | 40,973 | | | 45,749 | | | 50,535 | |
| | | | | |
Net Worth | | 119,799 | | | 124,642 | | | 129,608 | | | 133,512 | | | 137,659 | |
Net Financial Worth | | 25,073 | | | 24,009 | | | 21,863 | | | 19,643 | | | 17,845 | |
Net Debt | | (24,709 | ) | | (25,226 | ) | | (22,716 | ) | | (20,724 | ) | | (18,855 | ) |
Notes:
| 1. | Numbers may not add due to rounding |
| 2. | Numbers have been restated where subsequent changes in classification have occurred |
15
Public Non-financial Corporations Sector Balance Sheet1
| | | | | | | | | | | | | | | |
| | | 2007-08
Budget | | | 2007-08
Revised | | | 2008-09
Projection | | | 2009-10
Projection | | | 2010-11
Projection | |
| | | $ million | | | $ million | | | $ million | | | $ million | | | $ million | |
Assets | | | | | | | | | | | | | | | |
Financial Assets | | | | | | | | | | | | | | | |
Cash and deposits | | 1,497 | | | 1,332 | | | 1,483 | | | 1,752 | | | 1,653 | |
Advances paid | | 294 | | | 288 | | | 253 | | | 227 | | | 203 | |
Investments, loans and placements | | 1,152 | | | 312 | | | 314 | | | 318 | | | 323 | |
Other non-equity assets | | 1,271 | | | 1,853 | | | 2,026 | | | 2,163 | | | 2,583 | |
Equity | | 199 | | | 260 | | | 274 | | | 291 | | | 309 | |
Total Financial Assets | | 4,414 | | | 4,045 | | | 4,351 | | | 4,751 | | | 5,071 | |
| | | | | |
Non-Financial Assets | | 46,624 | | | 47,439 | | | 54,585 | | | 59,632 | | | 63,420 | |
| | | | | |
Total Assets | | 51,038 | | | 51,485 | | | 58,936 | | | 64,383 | | | 68,491 | |
| | | | | |
Liabilities | | | | | | | | | | | | | | | |
Deposits held | | 66 | | | 57 | | | 58 | | | 59 | | | 59 | |
Borrowing | | 24,163 | | | 24,239 | | | 30,057 | | | 34,350 | | | 37,008 | |
Superannuation liability | | — | | | — | | | 1 | | | 1 | | | 1 | |
Other employee entitlements and provisions | | 1,225 | | | 1,220 | | | 1,279 | | | 1,286 | | | 1,291 | |
Other non-equity liabilities | | 2,168 | | | 3,242 | | | 3,334 | | | 3,599 | | | 4,112 | |
Total Liabilities | | 27,622 | | | 28,758 | | | 34,728 | | | 39,294 | | | 42,471 | |
| | | | | |
Net Worth | | 23,416 | | | 22,727 | | | 24,207 | | | 25,089 | | | 26,020 | |
Net Financial Worth | | (23,208 | ) | | (24,713 | ) | | (30,378 | ) | | (34,543 | ) | | (37,400 | ) |
Net Debt | | 21,285 | | | 22,364 | | | 28,065 | | | 32,112 | | | 34,889 | |
Notes:
| 1. | Numbers may not add due to rounding |
16
Non-financial Public Sector Balance Sheet1
| | | | | | | | | | | | | | | |
| | | 2007-08
Budget2 | | | 2007-08
Revised | | | 2008-09
Projection | | | 2009-10
Projection | | | 2010-11
Projection | |
| | | $ million | | | $ million | | | $ million | | | $ million | | | $ million | |
Assets | | | | | | | | | | | | | | | |
Financial Assets | | | | | | | | | | | | | | | |
Cash and deposits | | 3,566 | | | 3,914 | | | 3,996 | | | 4,050 | | | 3,915 | |
Advances paid | | 990 | | | 1,032 | | | 1,058 | | | 1,089 | | | 1,101 | |
Investments, loans and placements | | 30,198 | | | 29,209 | | | 30,692 | | | 32,408 | | | 34,146 | |
Other non-equity assets | | 2,739 | | | 3,633 | | | 3,708 | | | 3,721 | | | 4,023 | |
Equity | | 2,255 | | | 2,250 | | | 2,278 | | | 2,295 | | | 2,314 | |
Total Financial Assets | | 39,748 | | | 40,039 | | | 41,733 | | | 43,564 | | | 45,499 | |
| | | | | |
Non-Financial Assets | | 141,316 | | | 148,038 | | | 162,295 | | | 173,466 | | | 183,199 | |
| | | | | |
Total Assets | | 181,064 | | | 188,077 | | | 204,028 | | | 217,030 | | | 228,698 | |
| | | | | |
Liabilities | | | | | | | | | | | | | | | |
Deposits held | | 66 | | | 58 | | | 58 | | | 59 | | | 60 | |
Advances received | | 448 | | | 492 | | | 481 | | | 476 | | | 472 | |
Borrowing | | 30,817 | | | 30,743 | | | 40,556 | | | 48,400 | | | 54,665 | |
Superannuation liability | | 19,955 | | | 21,231 | | | 22,290 | | | 23,295 | | | 24,246 | |
Other employee entitlements and provisions | | 5,572 | | | 5,735 | | | 5,999 | | | 6,217 | | | 6,439 | |
Other non-equity liabilities | | 4,408 | | | 4,989 | | | 4,849 | | | 4,883 | | | 4,971 | |
Total Liabilities | | 61,265 | | | 63,247 | | | 74,233 | | | 83,330 | | | 90,850 | |
| | | | | |
Net Worth | | 119,799 | | | 124,830 | | | 129,796 | | | 133,700 | | | 137,847 | |
Net Financial Worth | | (21,517 | ) | | (23,209 | ) | | (32,500 | ) | | (39,766 | ) | | (45,352 | ) |
Net Debt | | (3,424 | ) | | (2,862 | ) | | 5,348 | | | 11,388 | | | 16,034 | |
Notes:
| 1. | Numbers may not add due to rounding |
| 2. | Numbers have been restated where subsequent changes in classification have occurred |
17
General Government Sector Cash Flow Statement1
| | | | | | | | | | | | | | | |
| | | 2007-08
Budget | | | 2007-08
Revised | | | 2008-09
Projection | | | 2009-10
Projection | | | 2010-11
Projection | |
| | | $ million | | | $ million | | | $ million | | | $ million | | | $ million | |
Receipts from operating activities | | | | | | | | | | | | | | | |
Taxes received | | 9,271 | | | 9,764 | | | 10,586 | | | 11,300 | | | 12,154 | |
Grants and subsidies received | | 15,029 | | | 14,913 | | | 15,236 | | | 15,531 | | | 16,101 | |
Sales of goods and services | | 3,347 | | | 3,538 | | | 3,499 | | | 3,556 | | | 3,652 | |
Other receipts | | 6,410 | | | 5,563 | | | 5,675 | | | 6,029 | | | 6,108 | |
Total | | 34,057 | | | 33,779 | | | 34,996 | | | 36,415 | | | 38,014 | |
| | | | | |
Payments for operating activities | | | | | | | | | | | | | | | |
Payments for goods and services | | (20,448 | ) | | (21,353 | ) | | (22,417 | ) | | (23,426 | ) | | (24,526 | ) |
Grants and subsidies | | (8,141 | ) | | (8,204 | ) | | (7,774 | ) | | (7,736 | ) | | (8,042 | ) |
Interest | | (391 | ) | | (403 | ) | | (651 | ) | | (929 | ) | | (1,107 | ) |
Other payments | | (838 | ) | | (758 | ) | | (524 | ) | | (515 | ) | | (523 | ) |
Total | | (29,817 | ) | | (30,717 | ) | | (31,366 | ) | | (32,606 | ) | | (34,198 | ) |
| | | | | |
Net cash inflows from operating activities | | 4,240 | | | 3,062 | | | 3,629 | | | 3,809 | | | 3,816 | |
| | | | | |
Payments for investments in non-financial assets | | | | | | | | | | | | | | | |
Purchases of non-financial assets | | (5,463 | ) | | (5,888 | ) | | (5,927 | ) | | (5,920 | ) | | (5,958 | ) |
Sales of non-financial assets | | 331 | | | 345 | | | 315 | | | 254 | | | 311 | |
Total | | (5,132 | ) | | (5,543 | ) | | (5,612 | ) | | (5,666 | ) | | (5,648 | ) |
| | | | | |
Payments for investments in financial assets for policy purposes | | (885 | ) | | 613 | | | (603 | ) | | (212 | ) | | (115 | ) |
| | | | | |
Payments for investments in financial assets for liquidity purposes | | (1,583 | ) | | (1,000 | ) | | (1,409 | ) | | (1,638 | ) | | (1,658 | ) |
| | | | | |
Receipts from financing activities | | | | | | | | | | | | | | | |
Advances received (net) | | (14 | ) | | (14 | ) | | (15 | ) | | (7 | ) | | (8 | ) |
Borrowing (net) | | 3,569 | | | 4,427 | | | 3,940 | | | 3,498 | | | 3,576 | |
Other financing (net) | | — | | | (7 | ) | | — | | | — | | | — | |
Total | | 3,555 | | | 4,407 | | | 3,925 | | | 3,491 | | | 3,569 | |
| | | | | |
Net increase/(decrease) in cash held | | 195 | | | 1,539 | | | (69 | ) | | (216 | ) | | (36 | ) |
| | | | | |
Net cash from operating activities and investments in non-financial assets | | (892 | ) | | (2,481 | ) | | (1,983 | ) | | (1,857 | ) | | (1,831 | ) |
GFS Surplus/(deficit) | | (892 | ) | | (2,481 | ) | | (1,983 | ) | | (1,857 | ) | | (1,831 | ) |
Note:
| 1. | Numbers may not add due to rounding |
18
Public Non-financial Corporations Sector Cash Flow Statement1
| | | | | | | | | | | | | | | |
| | | 2007-08
Budget | | | 2007-08
Revised | | | 2008-09
Projection | | | 2009-10
Projection | | | 2010-11
Projection | |
| | | $ million | | | $ million | | | $ million | | | $ million | | | $ million | |
Receipts from operating activities | | | | | | | | | | | | | | | |
Grants and subsidies received | | 2,242 | | | 2,100 | | | 1,868 | | | 1,870 | | | 1,997 | |
Sales of goods and services | | 7,395 | | | 8,461 | | | 8,741 | | | 9,260 | | | 9,981 | |
Other receipts | | 1,089 | | | 983 | | | 885 | | | 1,081 | | | 983 | |
Total | | 10,726 | | | 11,544 | | | 11,494 | | | 12,211 | | | 12,962 | |
| | | | | |
Payments for operating activities | | | | | | | | | | | | | | | |
Payments for goods and services | | (5,161 | ) | | (6,197 | ) | | (5,940 | ) | | (5,994 | ) | | (6,251 | ) |
Grants and subsidies | | (32 | ) | | (12 | ) | | — | | | — | | | — | |
Interest | | (1,075 | ) | | (1,125 | ) | | (1,272 | ) | | (1,430 | ) | | (1,543 | ) |
Other payments | | (1,007 | ) | | (835 | ) | | (926 | ) | | (1,002 | ) | | (1,040 | ) |
Total | | (7,275 | ) | | (8,169 | ) | | (8,138 | ) | | (8,426 | ) | | (8,834 | ) |
| | | | | |
Net cash inflows from operating activities | | 3,451 | | | 3,374 | | | 3,357 | | | 3,785 | | | 4,128 | |
| | | | | |
Payments for investments in non-financial assets | | | | | | | | | | | | | | | |
Purchases of non-financial assets | | (7,919 | ) | | (9,923 | ) | | (8,425 | ) | | (6,603 | ) | | (5,352 | ) |
Sales of non-financial assets | | 84 | | | 26 | | | 30 | | | 21 | | | 37 | |
Total | | (7,836 | ) | | (9,897 | ) | | (8,394 | ) | | (6,582 | ) | | (5,315 | ) |
| | | | | |
Payments for investments in financial assets for policy purposes | | — | | | 1,045 | | | — | | | — | | | — | |
| | | | | |
Payments for investments in financial assets for liquidity purposes | | (11 | ) | | 34 | | | 14 | | | 22 | | | 19 | |
| | | | | |
Receipts from financing activities | | | | | | | | | | | | | | | |
Borrowing (net) | | 4,433 | | | 5,173 | | | 5,609 | | | 3,884 | | | 2,207 | |
Deposits received (net) | | (3 | ) | | 23 | | | 1 | | | 1 | | | 1 | |
Distributions paid | | (1,833 | ) | | (1,040 | ) | | (1,023 | ) | | (1,053 | ) | | (1,255 | ) |
Other financing (net) | | 860 | | | (862 | ) | | 589 | | | 212 | | | 115 | |
Total | | 3,458 | | | 3,294 | | | 5,175 | | | 3,044 | | | 1,068 | |
| | | | | |
Net increase/(decrease) in cash held | | (938 | ) | | (2,149 | ) | | 151 | | | 269 | | | (99 | ) |
| | | | | |
Net cash from operating activities and investments in non-financial assets | | (4,385 | ) | | (6,522 | ) | | (5,038 | ) | | (2,797 | ) | | (1,187 | ) |
Distributions paid | | (1,833 | ) | | (1,040 | ) | | (1,023 | ) | | (1,053 | ) | | (1,255 | ) |
GFS Surplus/(deficit) | | (6,218 | ) | | (7,562 | ) | | (6,061 | ) | | (3,850 | ) | | (2,442 | ) |
Note:
| 1. | Numbers may not add due to rounding |
19
Non-financial Public Sector Cash Flow Statement1
| | | | | | | | | | | | | | | |
| | | 2007-08
Budget | | | 2007-08
Revised | | | 2008-09
Projection | | | 2009-10
Projection | | | 2010-11
Projection | |
| | | $ million | | | $ million | | | $ million | | | $ million | | | $ million | |
Receipts from operating activities | | | | | | | | | | | | | | | |
Taxes received | | 9,125 | | | 9,597 | | | 10,398 | | | 11,094 | | | 11,932 | |
Grants and subsidies received | | 15,165 | | | 15,024 | | | 15,324 | | | 15,637 | | | 16,211 | |
Sales of goods and services | | 10,568 | | | 11,829 | | | 12,075 | | | 12,660 | | | 13,499 | |
Other receipts | | 5,670 | | | 5,505 | | | 5,535 | | | 6,053 | | | 5,833 | |
Total | | 40,528 | | | 41,955 | | | 43,332 | | | 45,444 | | | 47,475 | |
| | | | | |
Payments for operating activities | | | | | | | | | | | | | | | |
Payments for goods and services | | (25,456 | ) | | (27,404 | ) | | (28,216 | ) | | (29,287 | ) | | (30,664 | ) |
Grants and subsidies | | (6,067 | ) | | (6,226 | ) | | (5,994 | ) | | (5,971 | ) | | (6,154 | ) |
Interest | | (1,466 | ) | | (1,528 | ) | | (1,923 | ) | | (2,359 | ) | | (2,651 | ) |
Other payments | | (1,682 | ) | | (1,400 | ) | | (1,237 | ) | | (1,286 | ) | | (1,316 | ) |
Total | | (34,670 | ) | | (36,558 | ) | | (37,370 | ) | | (38,903 | ) | | (40,785 | ) |
| | | | | |
Net cash inflows from operating activities | | 5,858 | | | 5,397 | | | 5,963 | | | 6,541 | | | 6,690 | |
| | | | | |
Payments for investments in non-financial assets | | | | | | | | | | | | | | | |
Purchases of non-financial assets | | (13,383 | ) | | (15,811 | ) | | (14,352 | ) | | (12,523 | ) | | (11,310 | ) |
Sales of non-financial assets | | 415 | | | 371 | | | 345 | | | 276 | | | 348 | |
Total | | (12,968 | ) | | (15,440 | ) | | (14,006 | ) | | (12,247 | ) | | (10,962 | ) |
| | | | | |
Payments for investments in financial assets for policy purposes | | (25 | ) | | 725 | | | — | | | — | | | — | |
| | | | | |
Payments for investments in financial assets for liquidity purposes | | (1,594 | ) | | (966 | ) | | (1,395 | ) | | (1,616 | ) | | (1,639 | ) |
| | | | | |
Receipts from financing activities | | | | | | | | | | | | | | | |
Advances received (net) | | (14 | ) | | (14 | ) | | (15 | ) | | (7 | ) | | (8 | ) |
Borrowing (net) | | 8,002 | | | 9,600 | | | 9,548 | | | 7,382 | | | 5,784 | |
Deposits received (net) | | (2 | ) | | 17 | | | 1 | | | 1 | | | 1 | |
Other financing (net) | | — | | | 70 | | | (14 | ) | | — | | | — | |
Total | | 7,987 | | | 9,674 | | | 9,520 | | | 7,375 | | | 5,777 | |
| | | | | |
Net increase/(decrease) in cash held | | (742 | ) | | (610 | ) | | 82 | | | 54 | | | (135 | ) |
| | | | | |
Net cash from operating activities and investments in non-financial assets | | (7,110 | ) | | (10,043 | ) | | (8,043 | ) | | (5,706 | ) | | (4,273 | ) |
GFS Surplus/(deficit) | | (7,110 | ) | | (10,043 | ) | | (8,043 | ) | | (5,706 | ) | | (4,273 | ) |
Note:
| 1. | Numbers may not add due to rounding |
20
Loan Council Allocation
Loan Council Allocation1
| | | | | | | | | |
| | | | | 2007-08
Nomination | | 2007-08
Budget | | | 2007-08
Revised |
| | | | | $ million | | $ million | | | $ million |
| | General Government sector cash deficit/(surplus)2 | | 995 | | 892 | | | 2,481 |
| | PNFC sector cash deficit/(surplus)2 | | 4,694 | | 6,218 | | | 7,562 |
| | | | |
| | Non Financial Public Sector cash deficit/(surplus)2 | | 5,688 | | 7,110 | | | 10,043 |
| | | | |
Less | | Net cash flows from investments in financial assets for policy purposes | | — | | (25 | ) | | 725 |
| | | | |
Plus | | Memorandum Items3 | | 77 | | 77 | | | 308 |
| | | | |
| | Loan Council Allocation | | 5,765 | | 7,212 | | | 9,626 |
Notes:
| 1. | Numbers may not add due to rounding. A tolerance limit of two percent of Non-Financial Public Sector receipts applies between the Loan Council nomination and the revised allocation. The revised allocation exceeds the nomination by more than the two percent tolerance limit. |
| 2. | Figures in brackets represent surpluses |
| 3. | Memorandum items include operating leases and local government borrowings |
21